Hypothesis testing, confidence intervals, and p-values used to draw population conclusions. Evaluates statistical significance and error types within experimental and observational data.
A formal narrative reflection essay meticulously aligned with the SEYS 776 rubric to achieve "Excellent" scores. It presents synthesized insights on research methodology, the research-practice loop, personal researcher growth, and pedagogical applications in cohesive paragraphs, incorporating specific examples and meaningful course feedback.
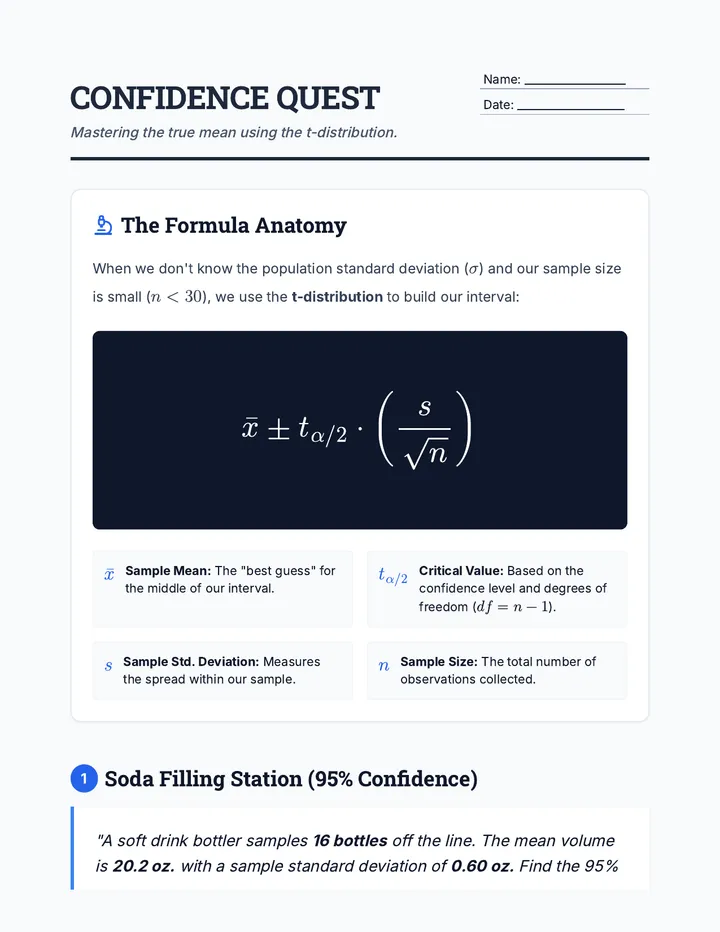
A detailed instructional handout featuring two statistics problems similar to the provided sample. It includes a formula breakdown and step-by-step walkthroughs for calculating 95% and 99% confidence intervals using the t-distribution.
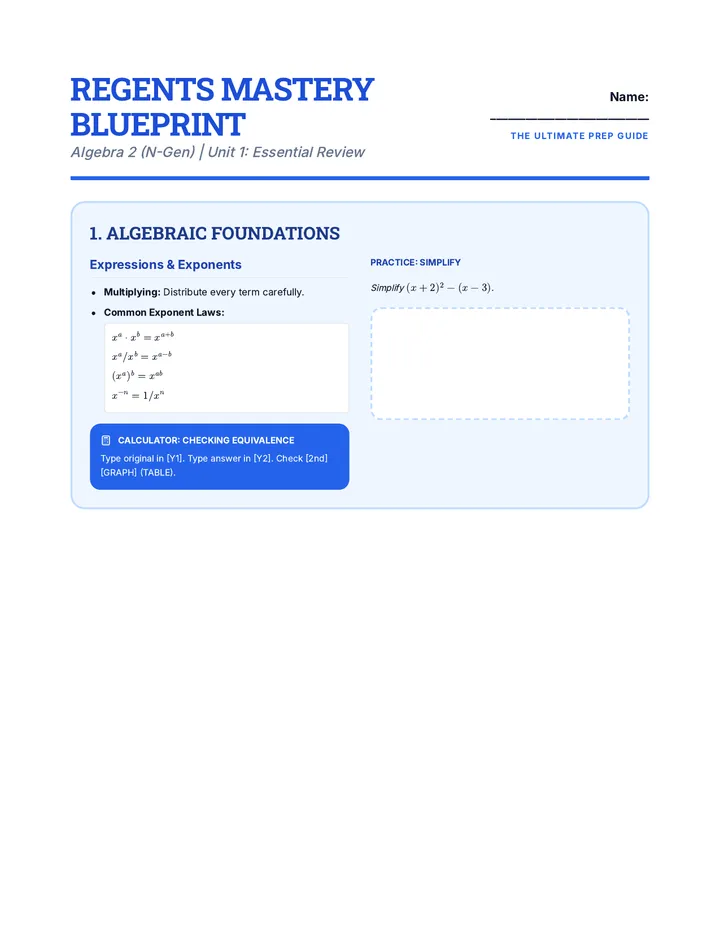
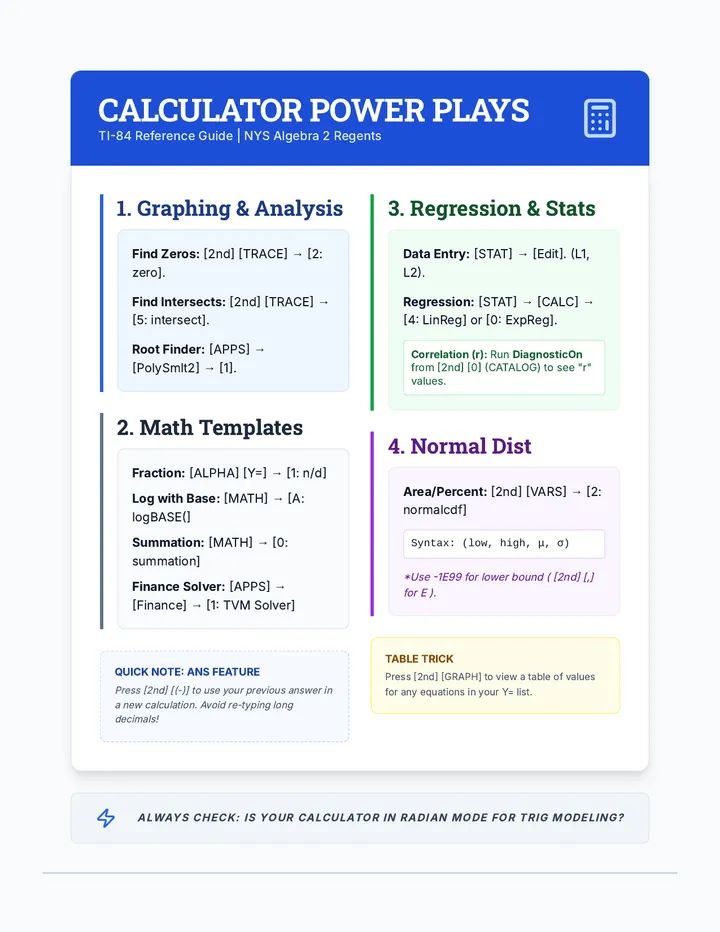
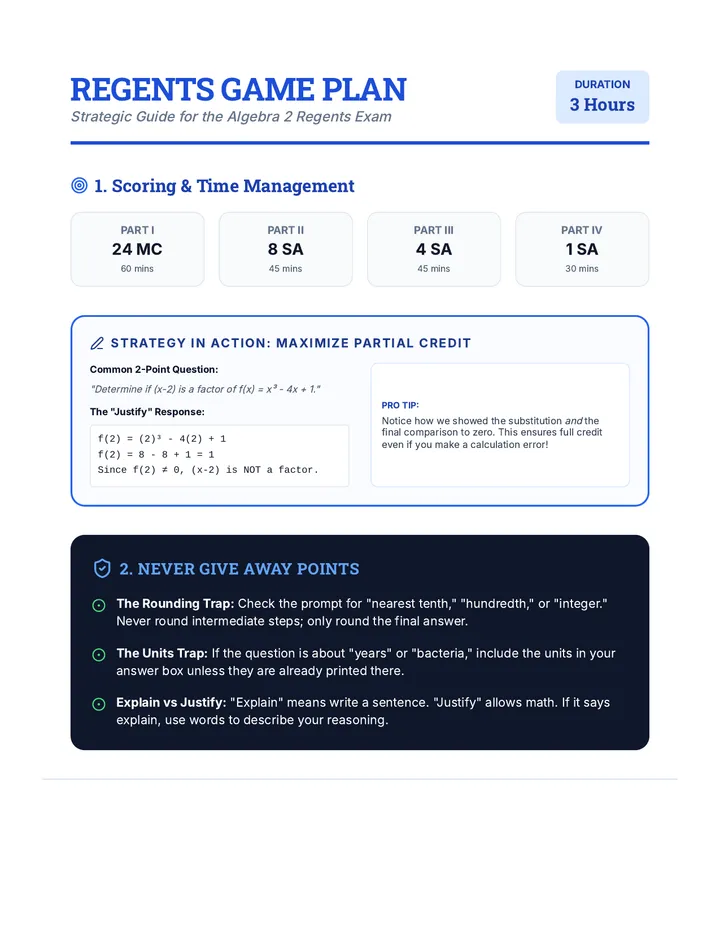
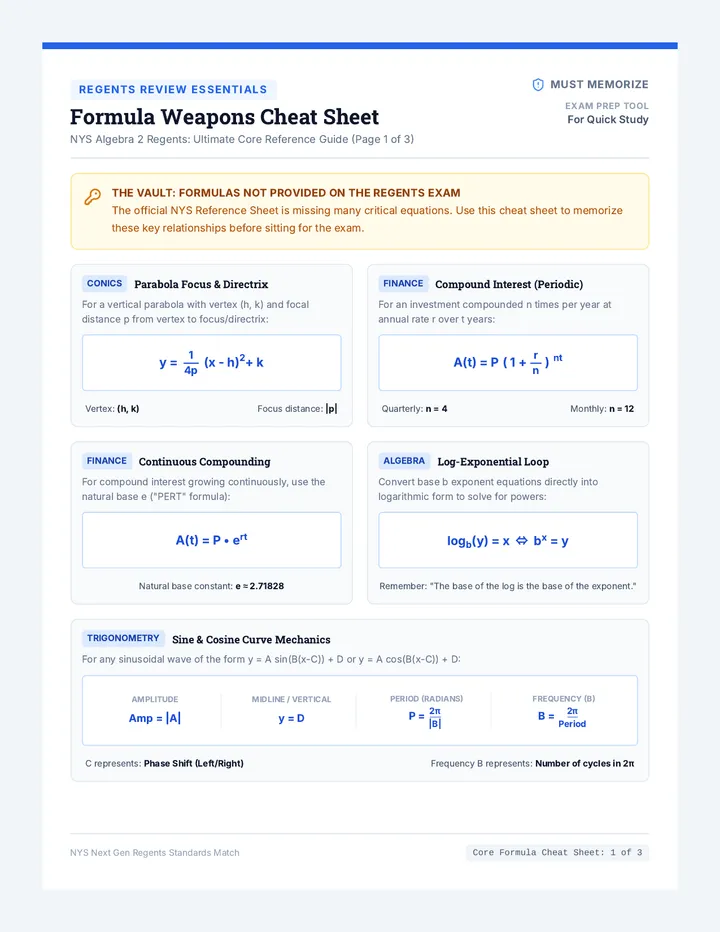
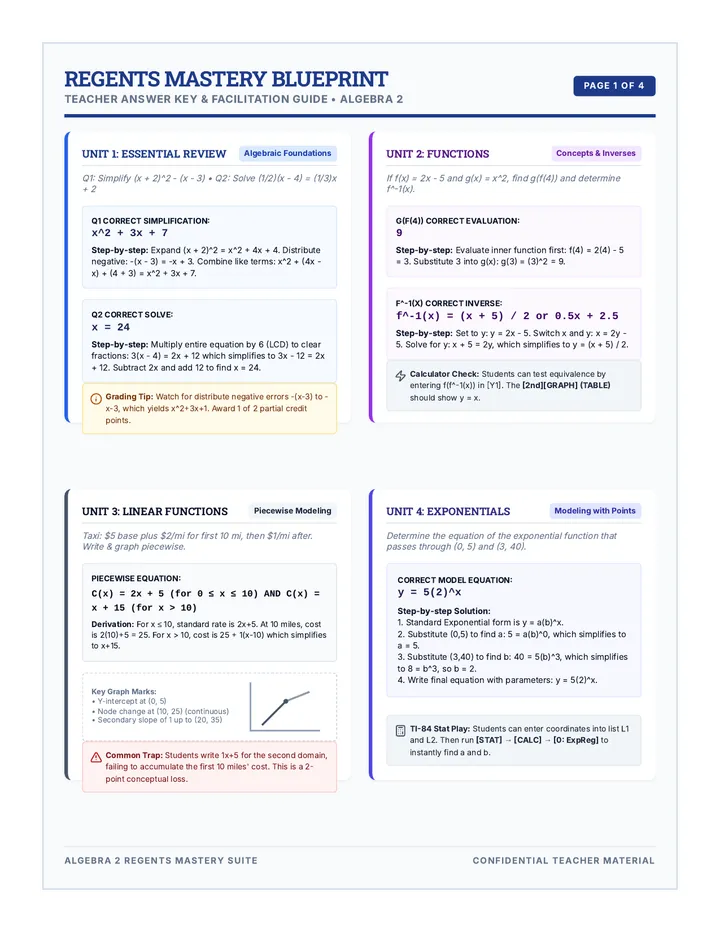
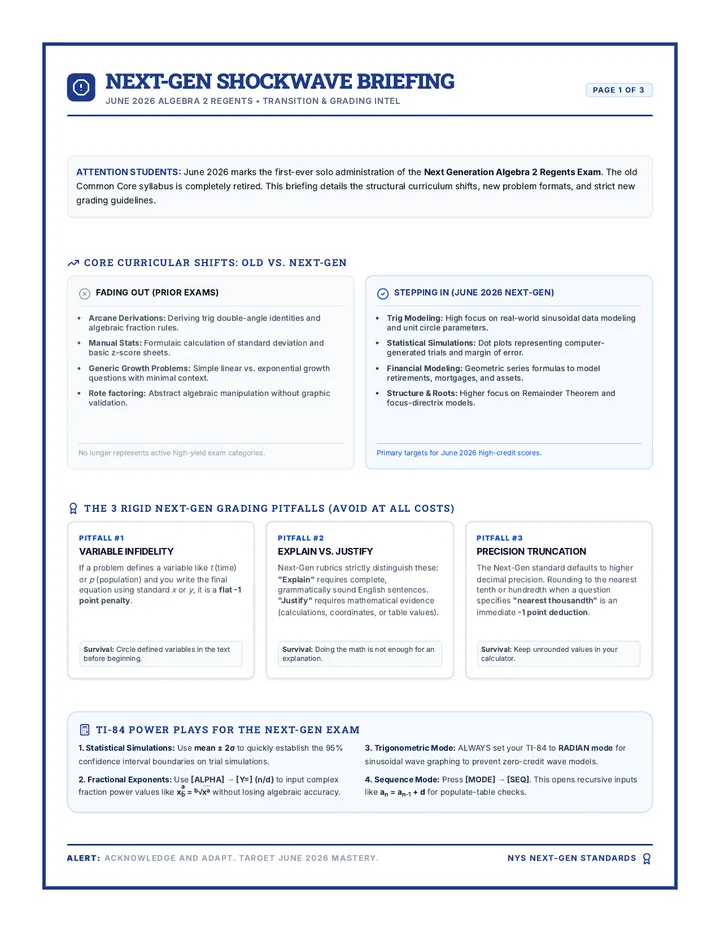
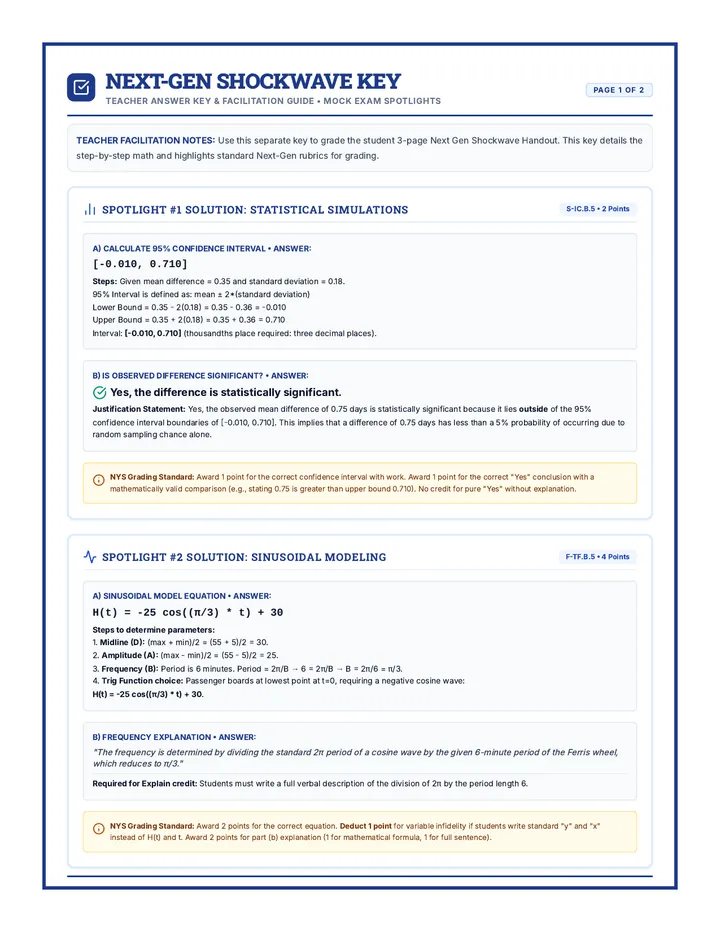
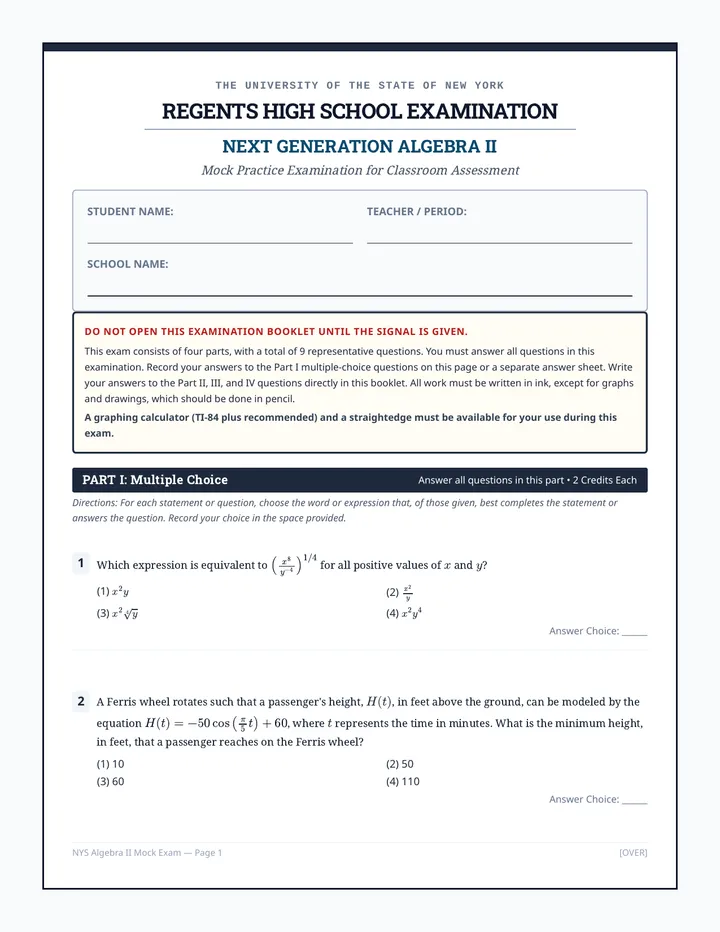
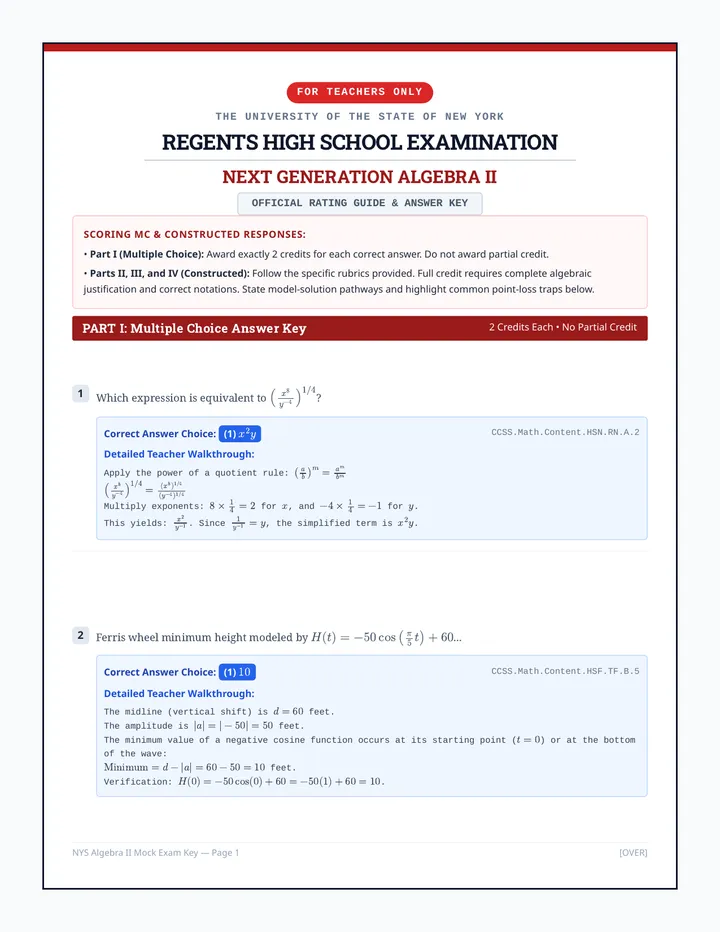
A comprehensive review suite for the New York State Mathematics Regents exams, including Algebra 1, Geometry, and Algebra 2, featuring mastery blueprints, calculator strategies, and exam-taking tips.
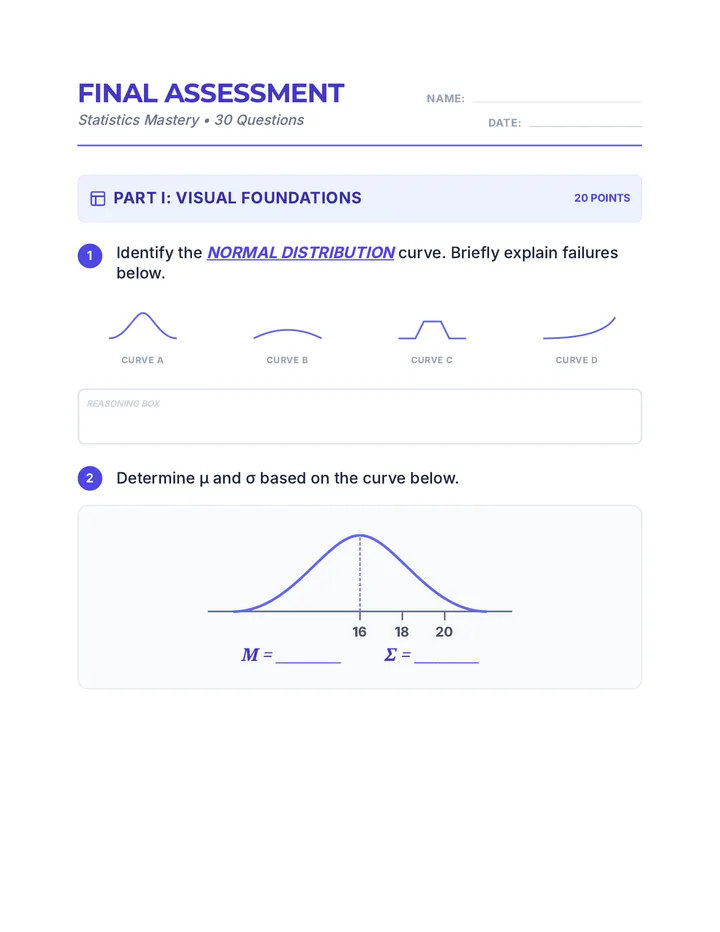
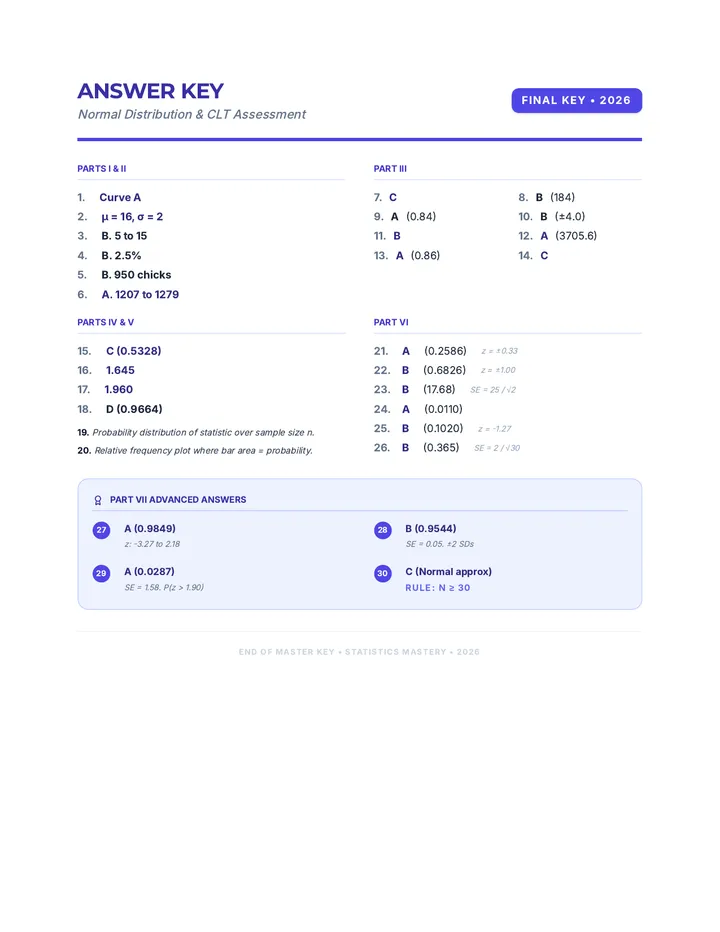
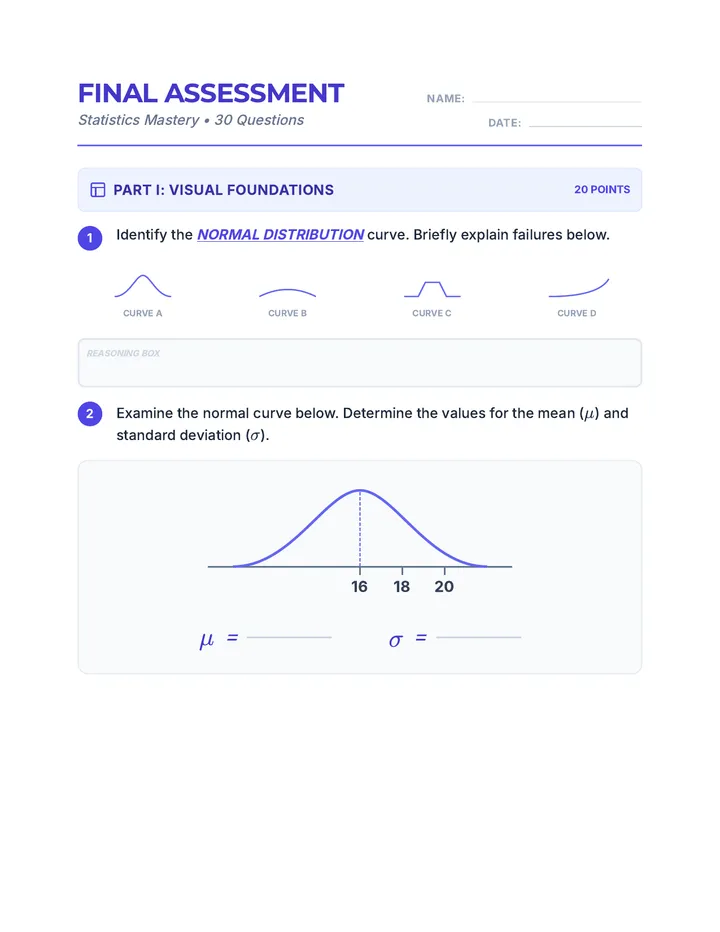
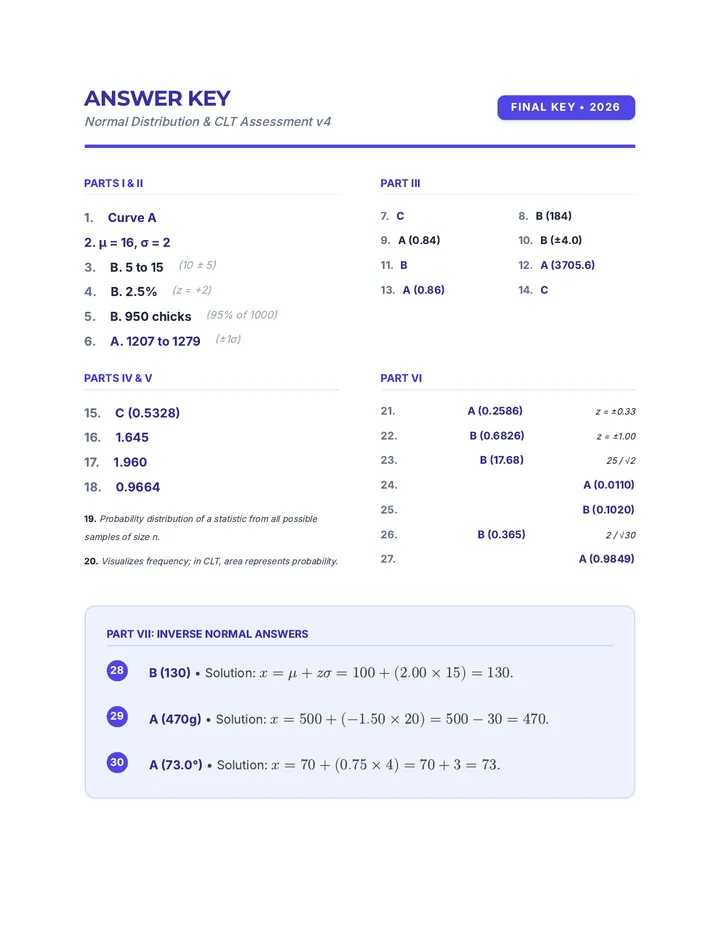
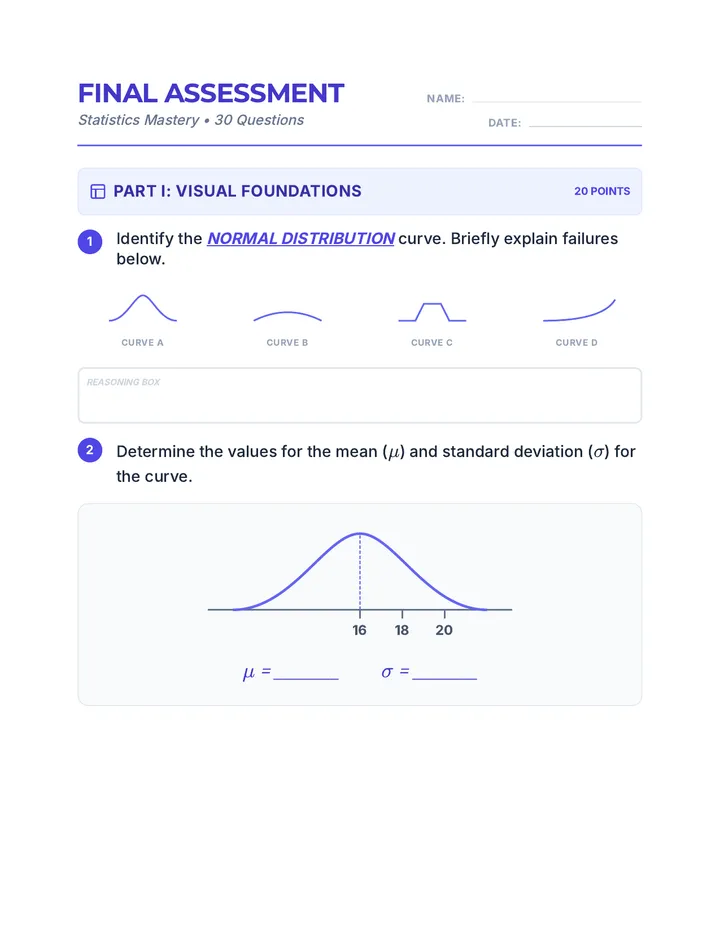
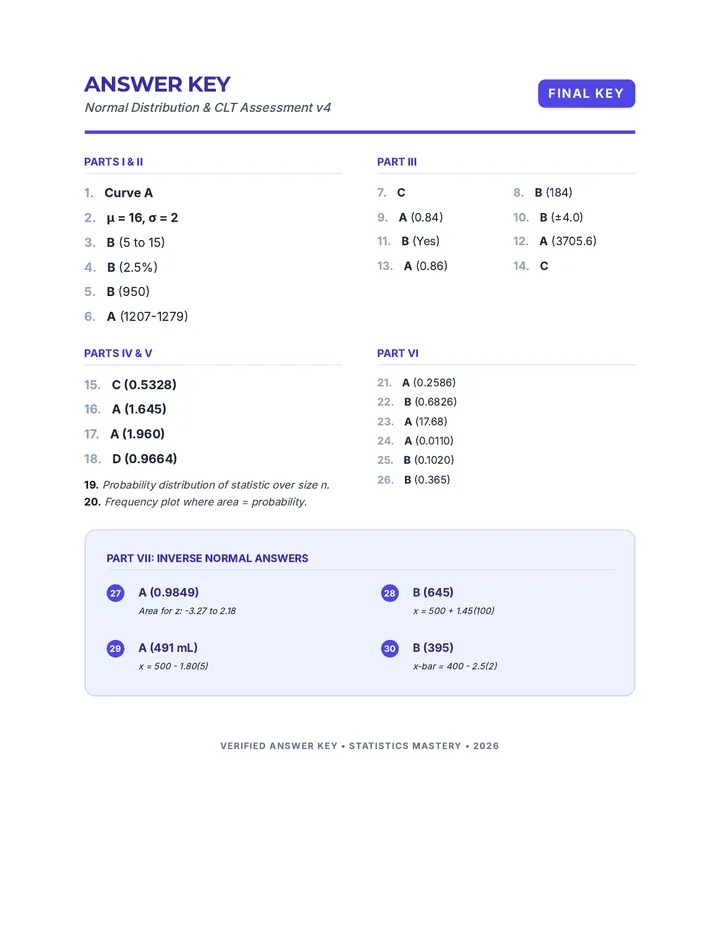
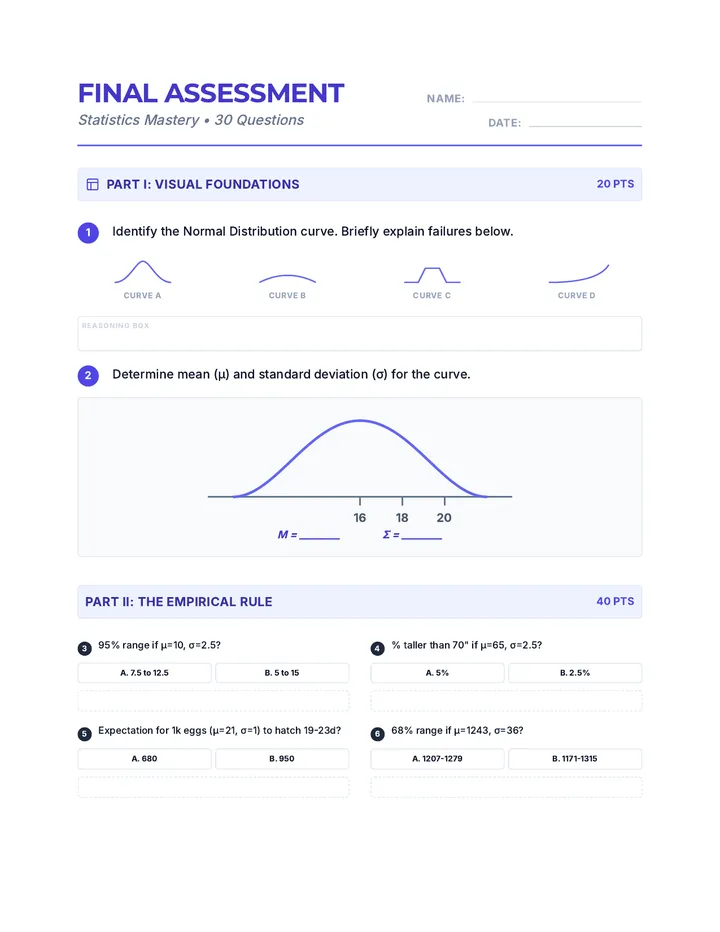
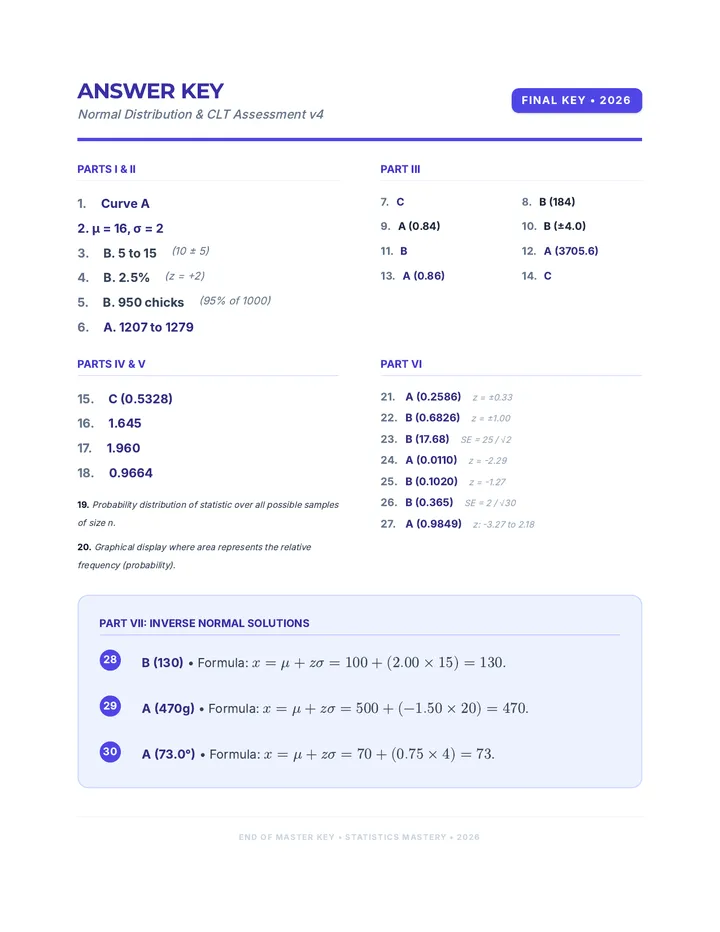
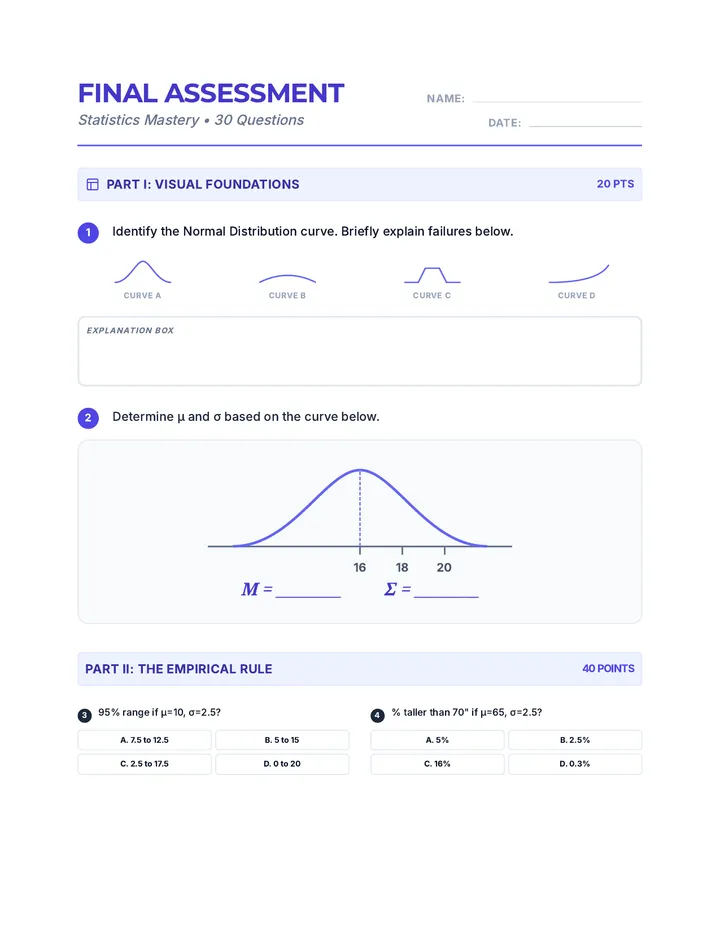
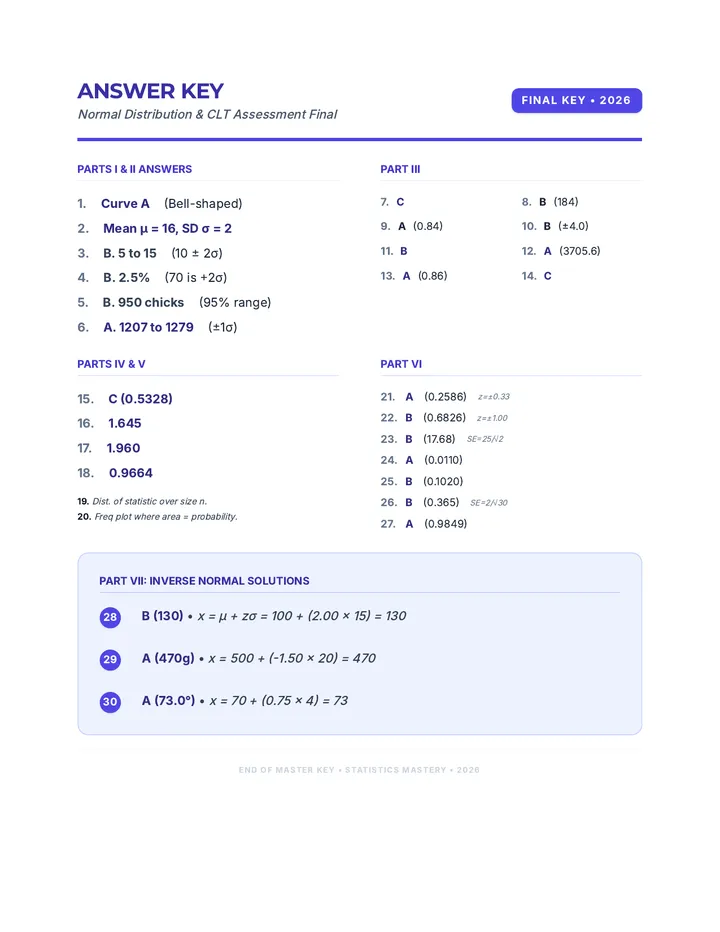
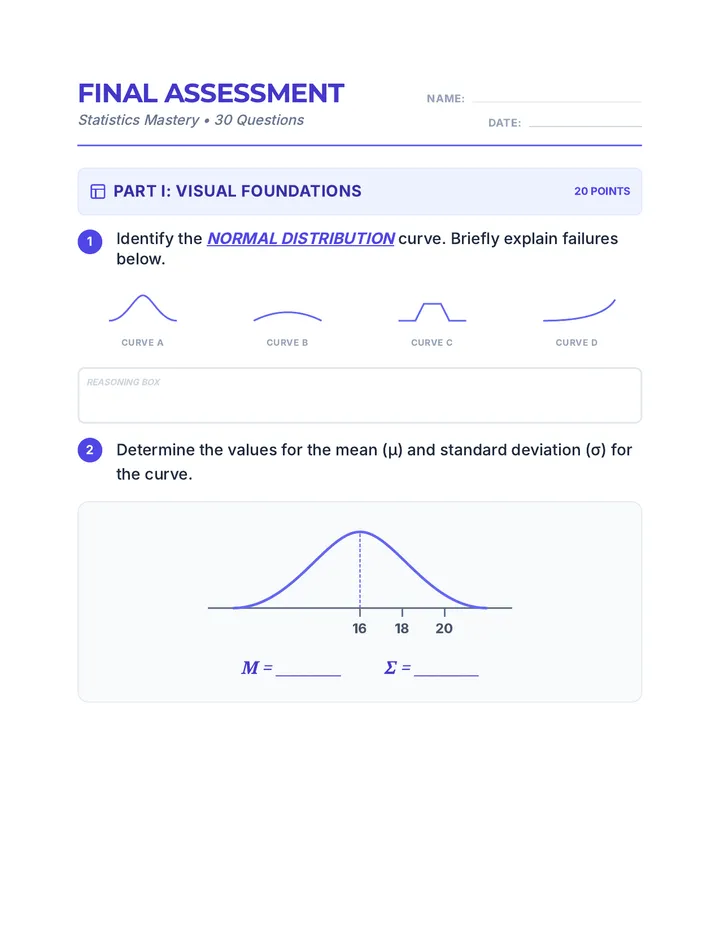
A comprehensive assessment sequence covering Normal Distributions, Z-scores, and the Central Limit Theorem.
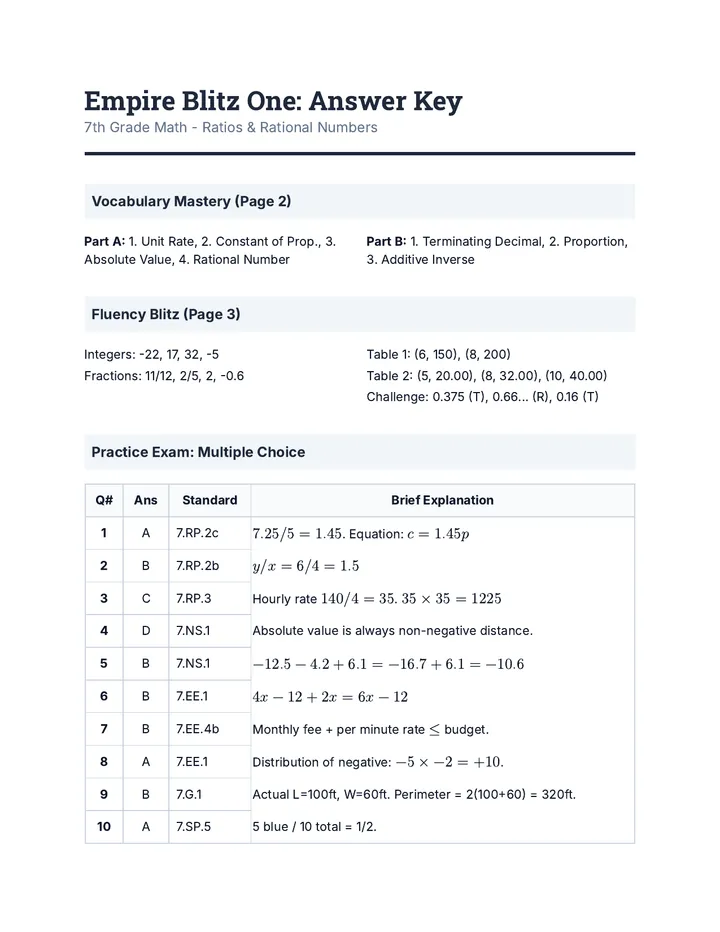
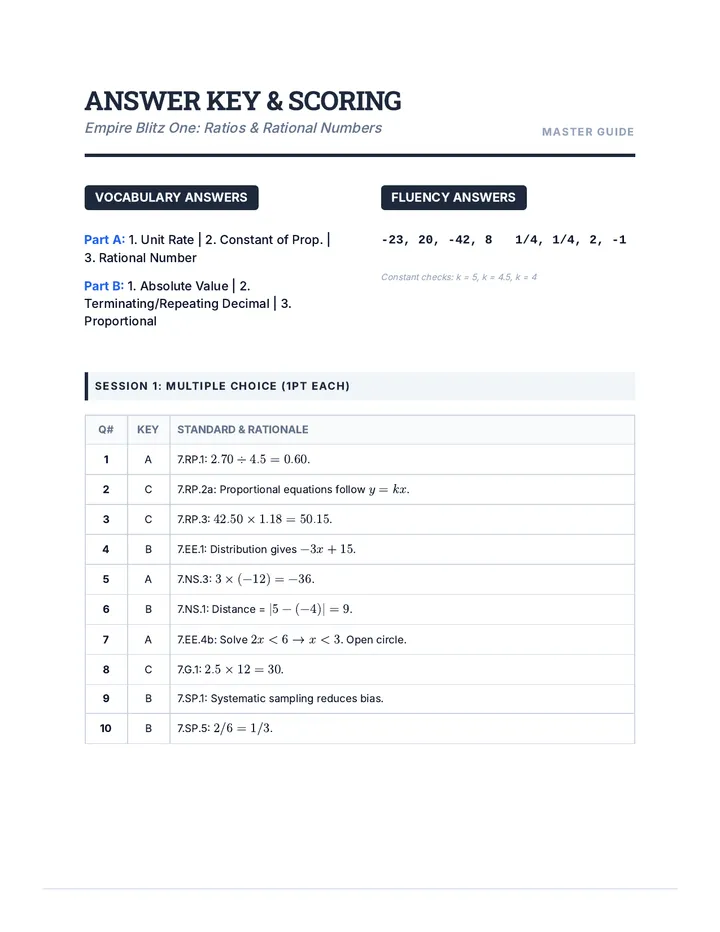
A comprehensive 3-packet New York State test prep series for 7th grade math, covering all major domains including Ratios, Number Systems, Expressions, Equations, Geometry, and Statistics. Each packet includes vocabulary, fluency, guided practice, and a 15-question mock exam.
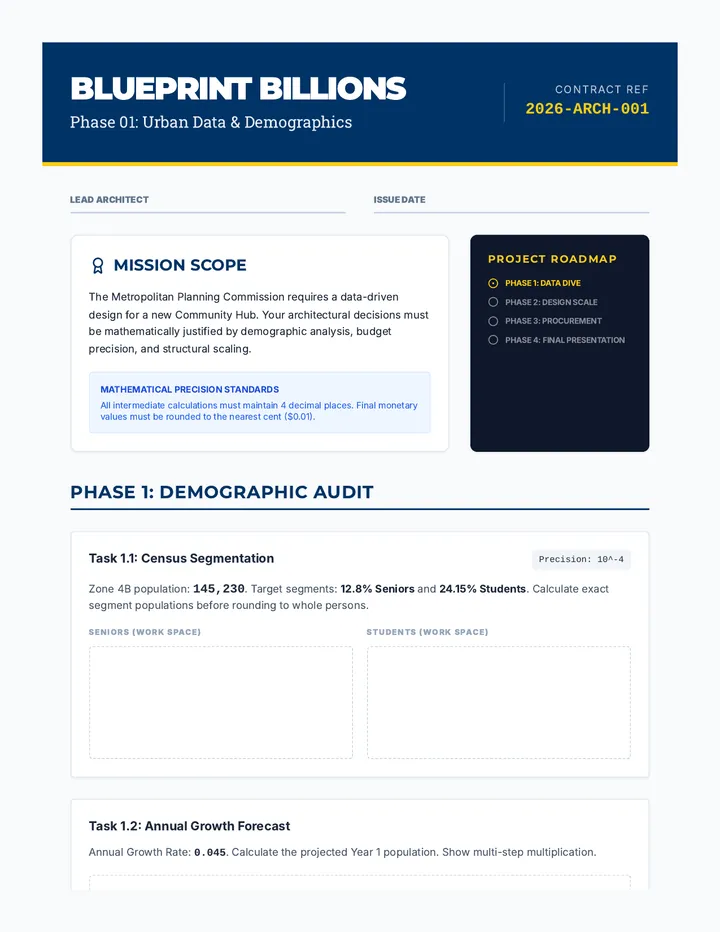
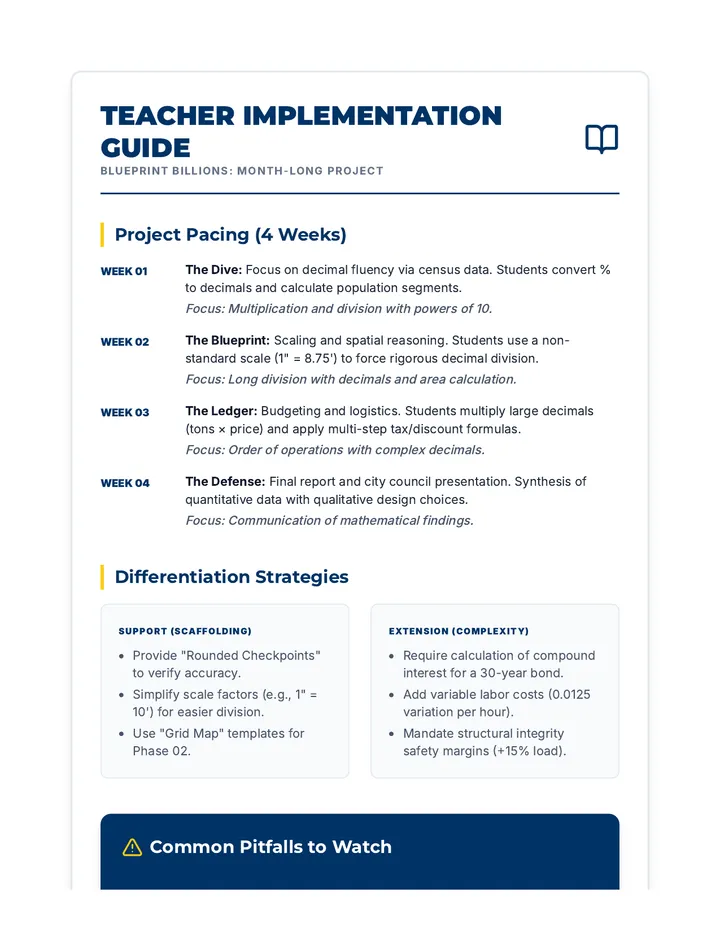
A month-long architectural design and statistical analysis project for high school students, focusing on precision decimal operations through real-world urban planning, budgeting, and data synthesis.
A 7-week math review sequence for 7th-grade students preparing for the NYS Math Assessment, covering proportional relationships, percents, algebraic expressions, inequalities, scale drawings, and statistics/probability.
Une introduction complète aux statistiques universitaires, couvrant la classification des données, les mesures descriptives, la visualisation et les fondements de la loi normale. L'approche est axée sur l'analyse de données réelles et la compréhension conceptuelle.
A targeted Tier 2 intervention sequence designed to help high school students master the fundamental concepts of statistical inference, moving from population parameters to sample statistics and back again through real-world applications.
A specialized intervention sequence focused on understanding how multiple samples provide a clearer picture of a population and how variability affects predictions. Students engage in hands-on simulations and visual data analysis to master seventh-grade sampling standards.
This sequence explores the practical application of rational exponents and power functions in biology, physics, and finance. Students will progress from evaluating existing models like Kleiber's Law and Kepler's Third Law to constructing their own mathematical models from empirical data.
A project-based unit where 12th-grade students design and execute an original statistical study comparing two populations. Students move from research design and ethical data collection to exploratory data analysis and formal inferential testing, culminating in a professional research presentation.
An advanced exploration of statistical power, error types, and effect sizes in the context of comparing two populations, teaching students to look beyond p-values to evaluate the practical importance and reliability of scientific findings.
A comprehensive 12th-grade statistics sequence focused on identifying, analyzing, and performing inference on paired data designs to reduce variability and compare population means.
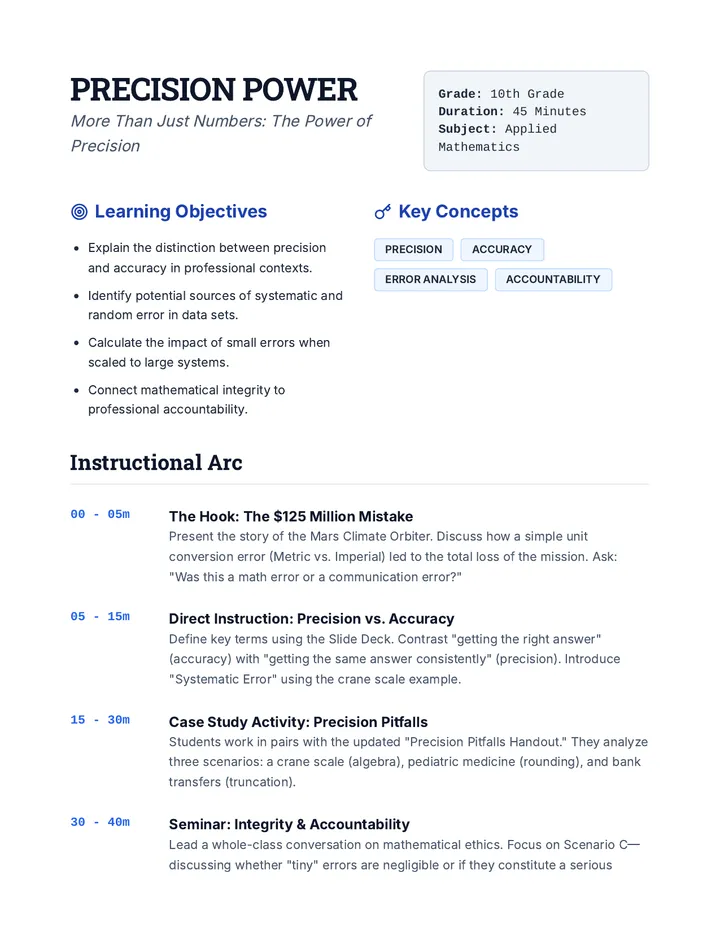
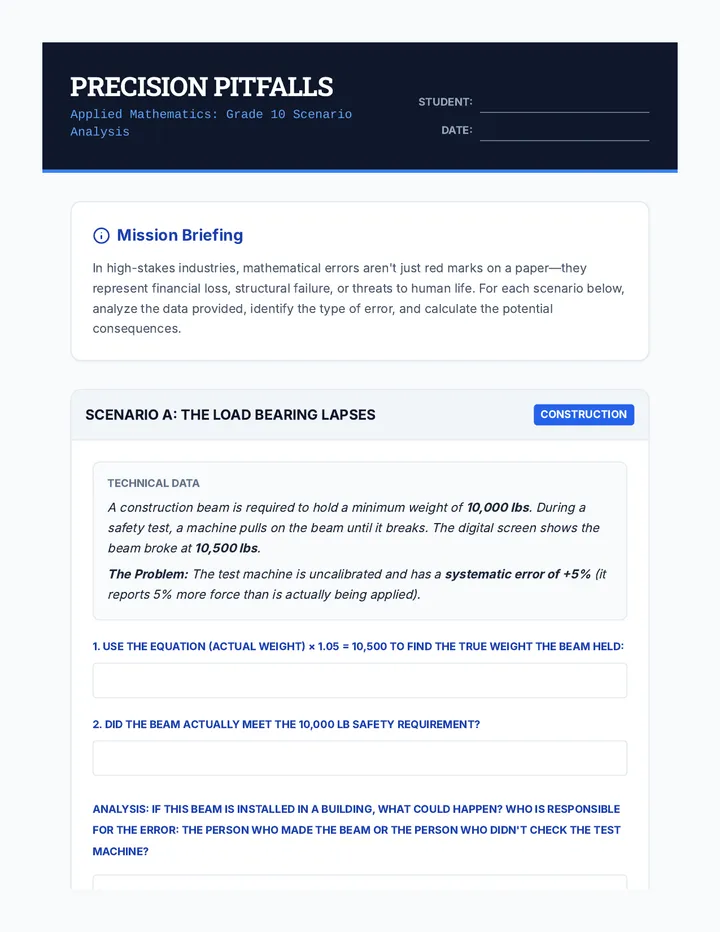
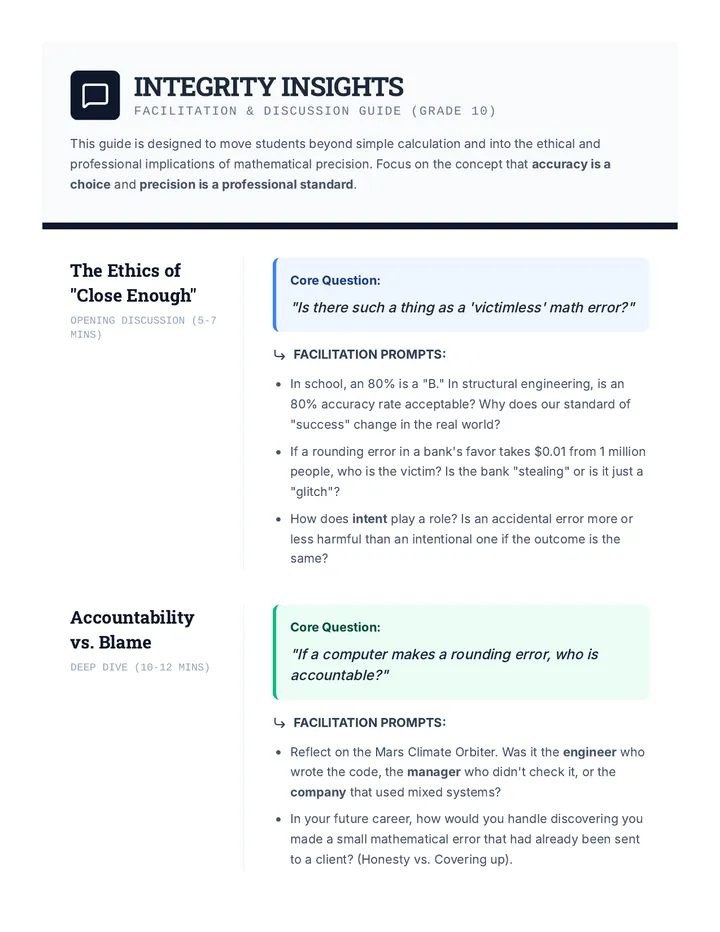
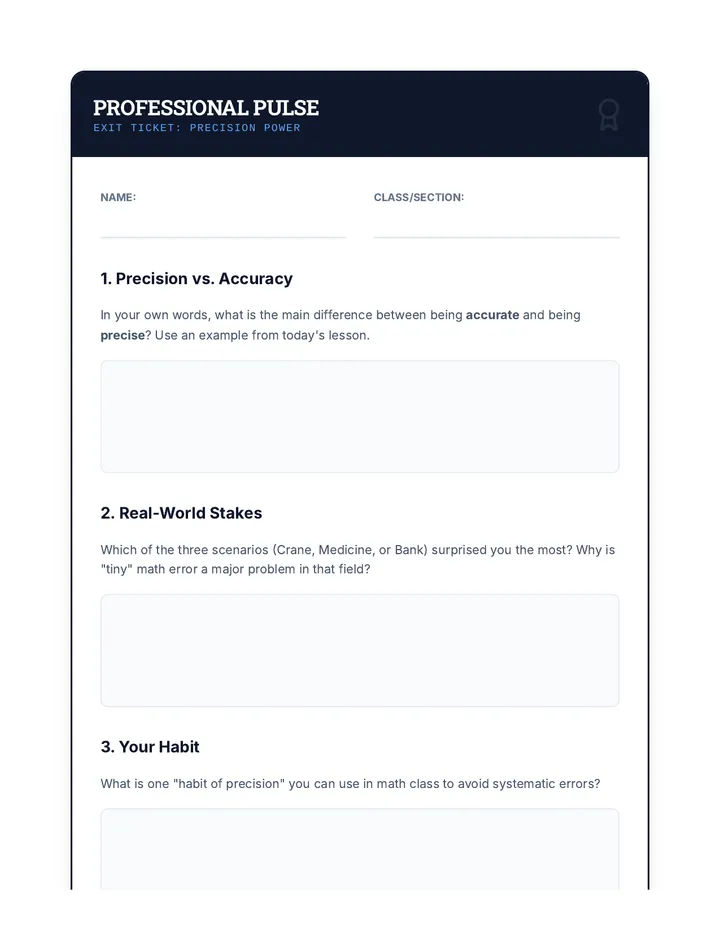
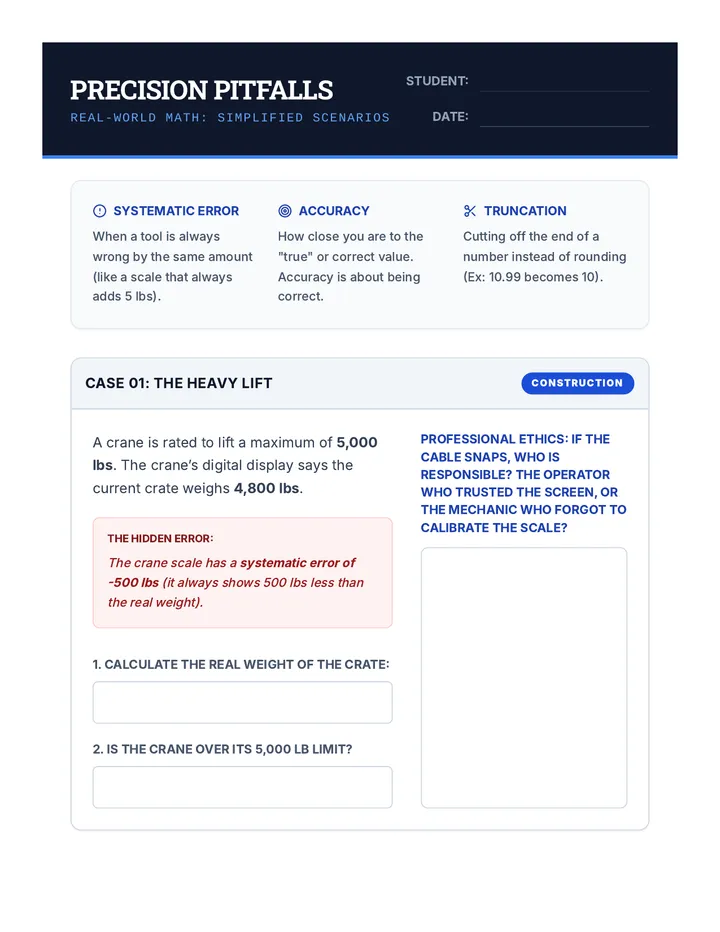
A 45-minute exploration into why mathematical precision and accuracy are critical for professional success, ethical accountability, and real-world safety. Students analyze high-stakes scenarios where small errors led to significant consequences.
This 45-minute lesson for 10th-grade students highlights the critical role of collaboration and problem-solving skills across all mathematical domains. Students will experience how diverse perspectives and teamwork lead to more effective and robust solutions, fostering a deeper appreciation for the interconnectedness of math and real-world challenges.
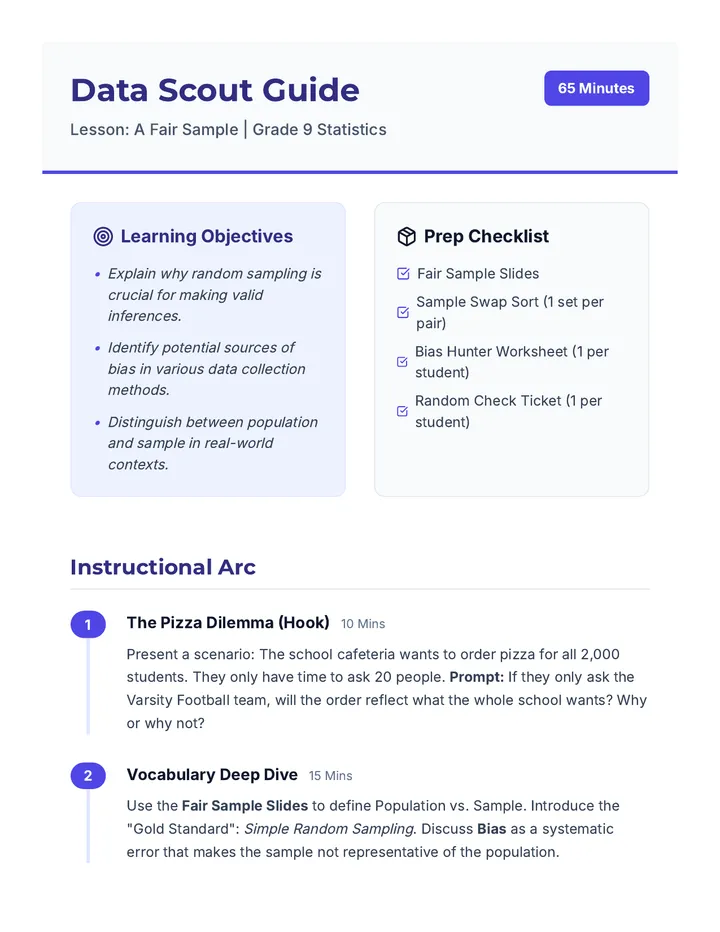
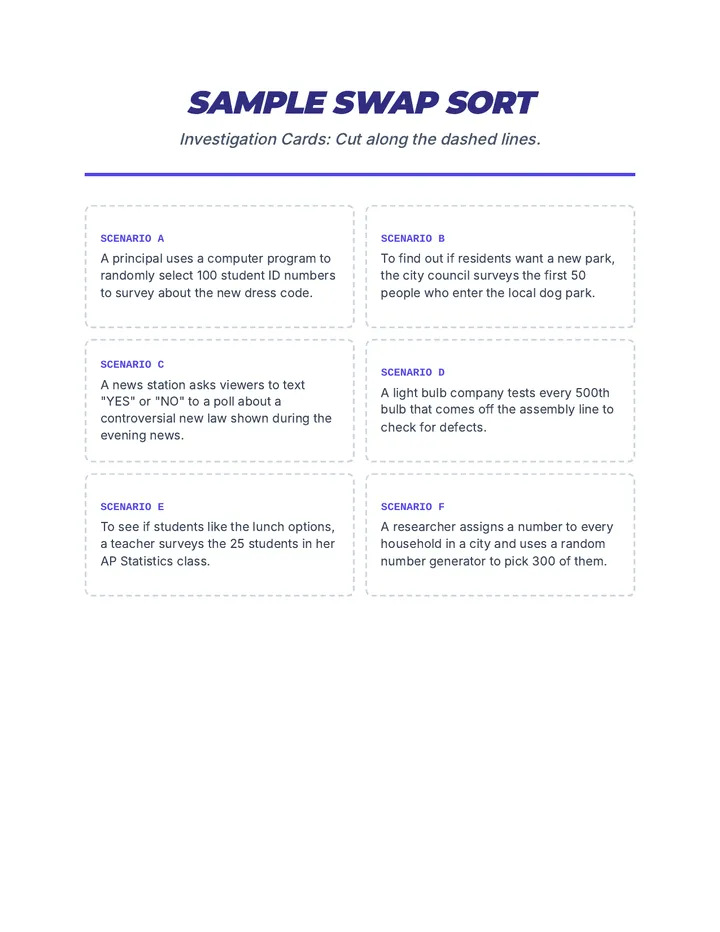
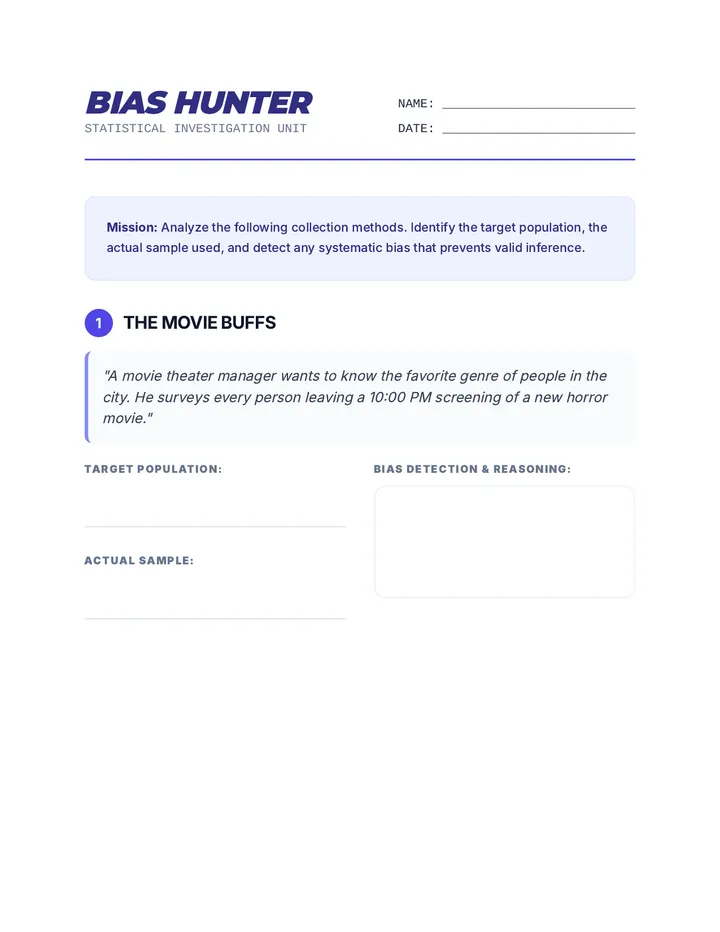
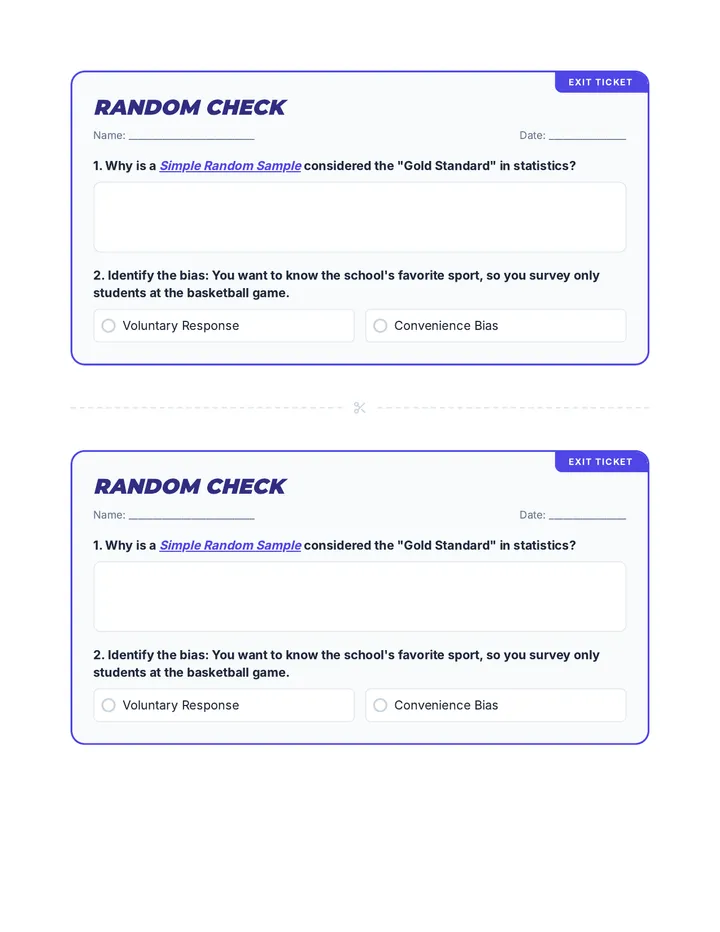
A 65-minute lesson for 9th Grade students exploring the fundamental concepts of population, sampling, and statistical bias. Students learn to distinguish between fair and biased collection methods through scenario analysis and sorting activities.
A focused practice set on calculating confidence intervals for means, finding critical values, and determining minimum sample sizes for specific margins of error.
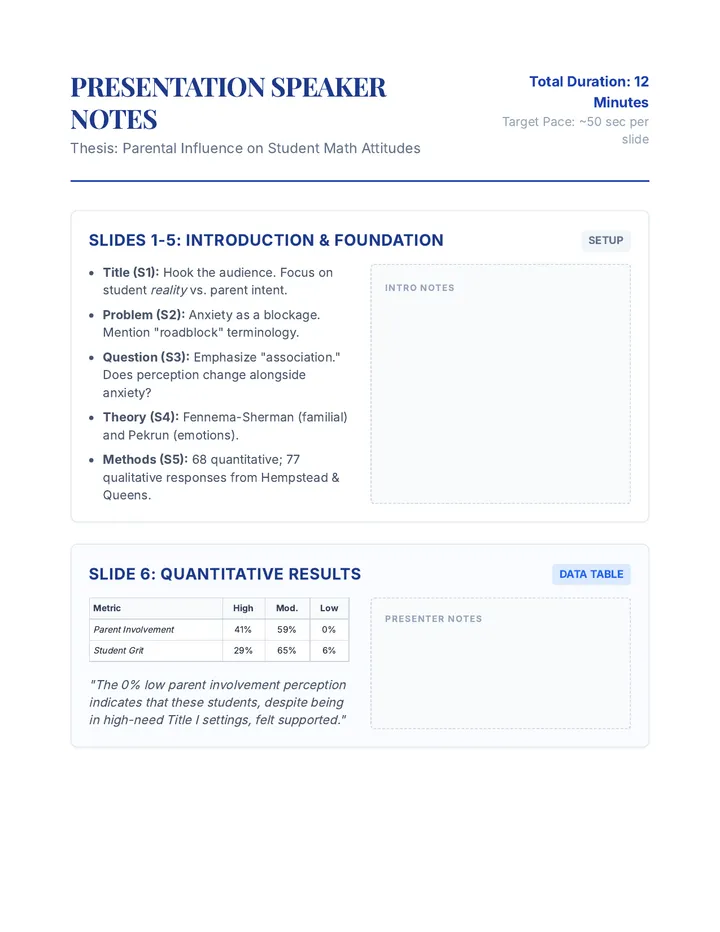
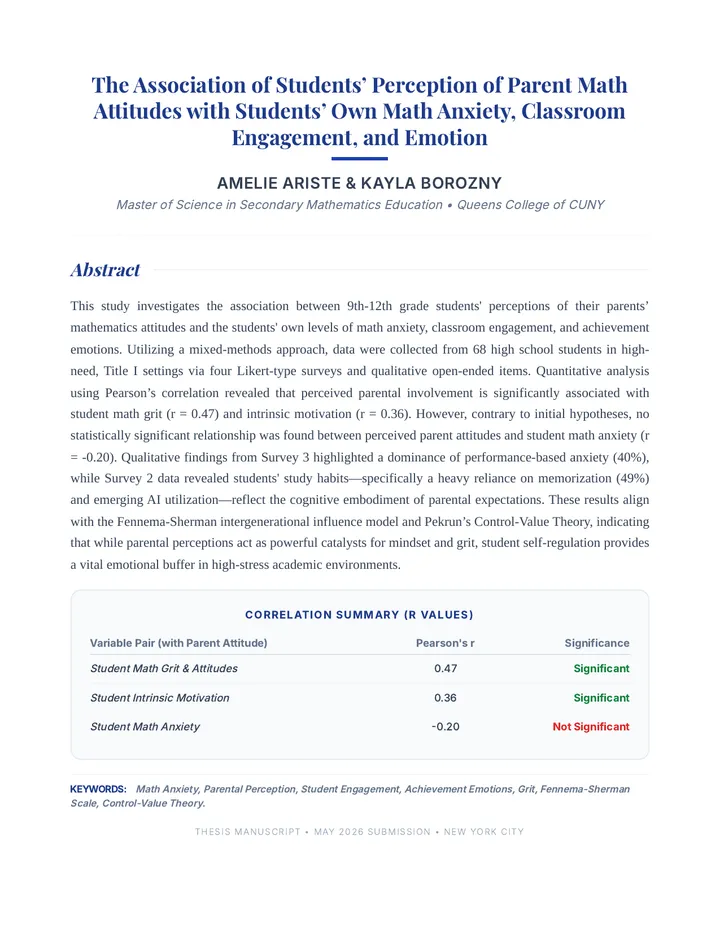
A comprehensive 12-minute presentation and speaker notes based on research investigating the link between parental attitudes and student math outcomes.
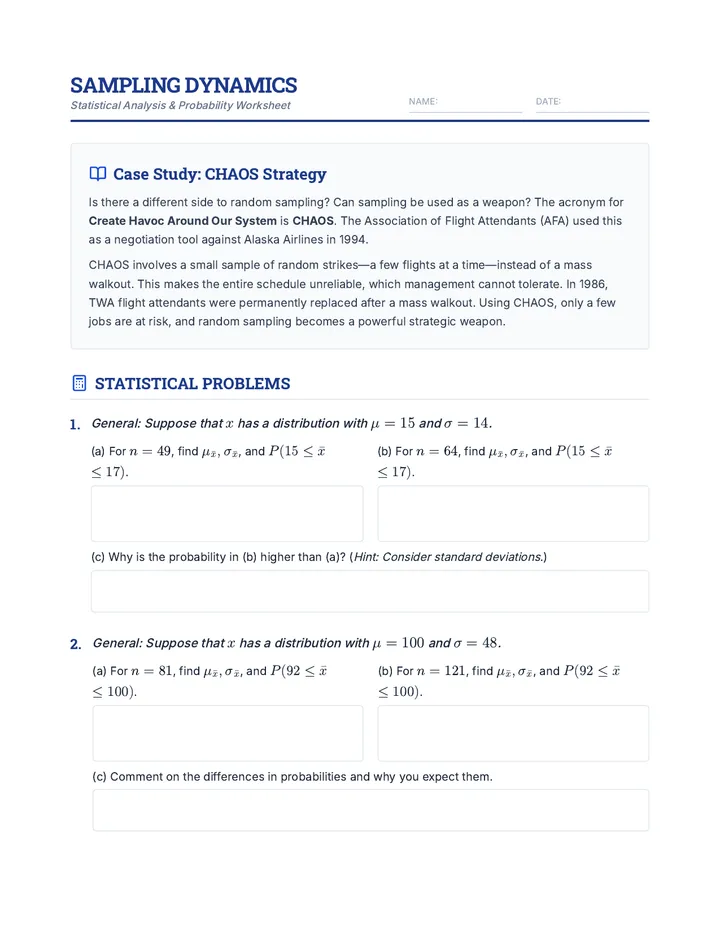
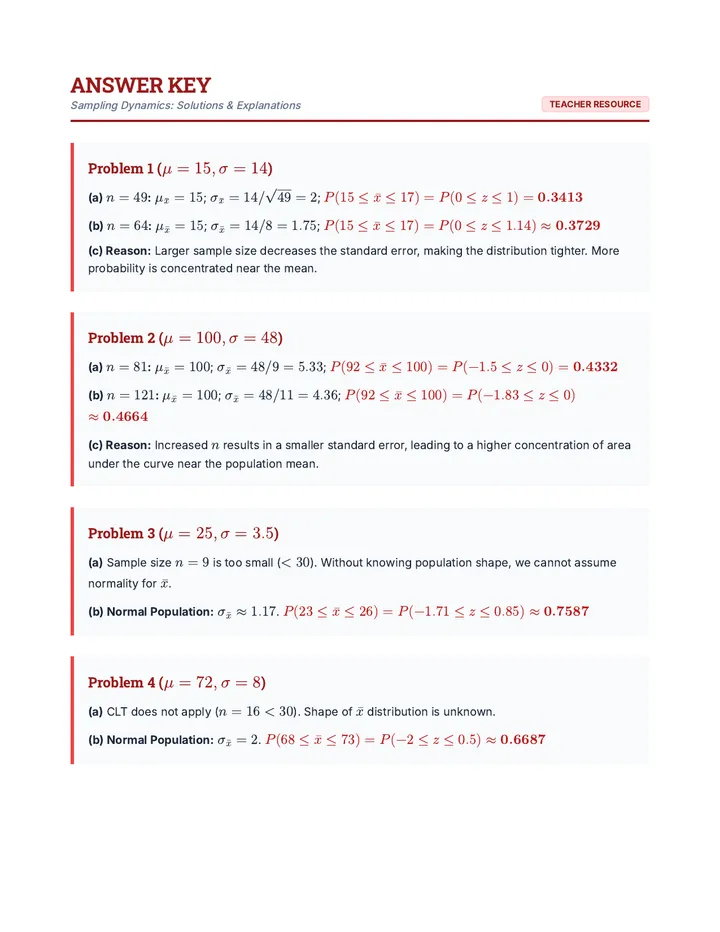
A lesson exploring sampling distributions, the Central Limit Theorem, and the real-world applications of random sampling as a strategic tool.
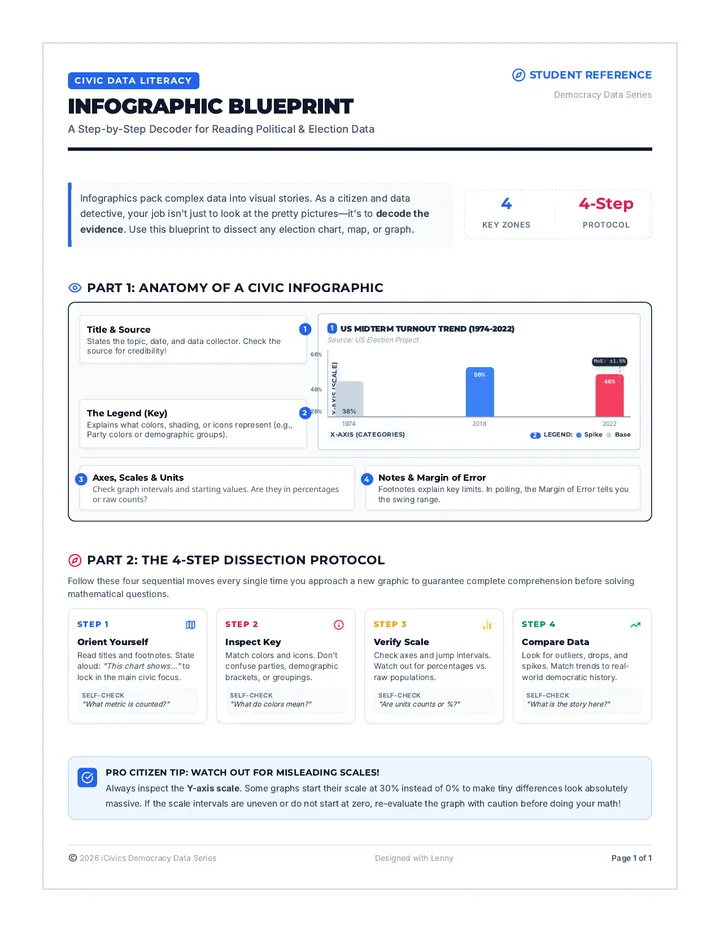
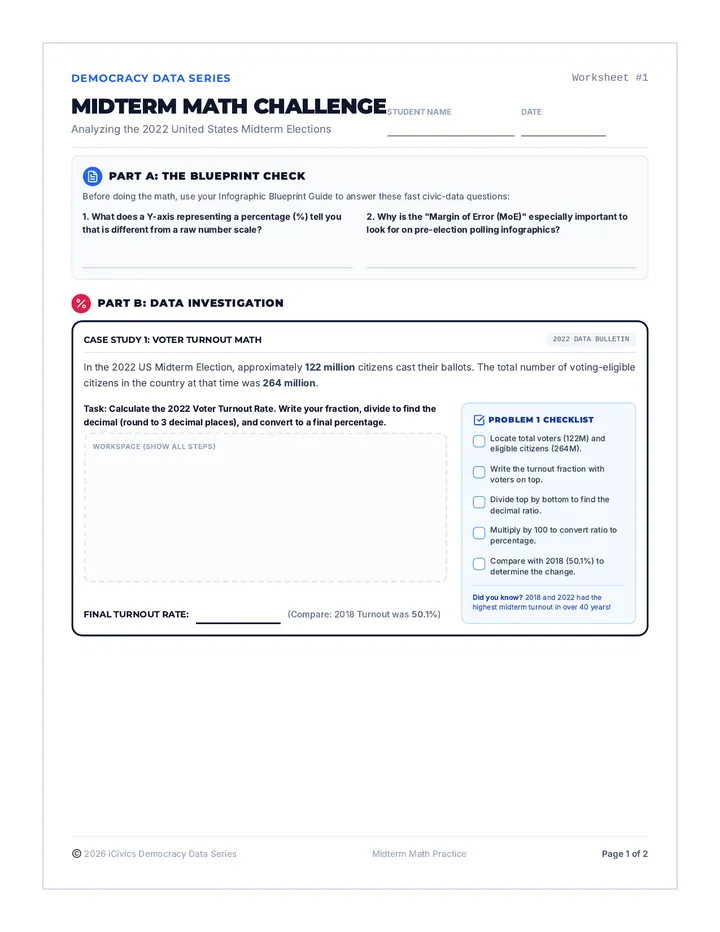
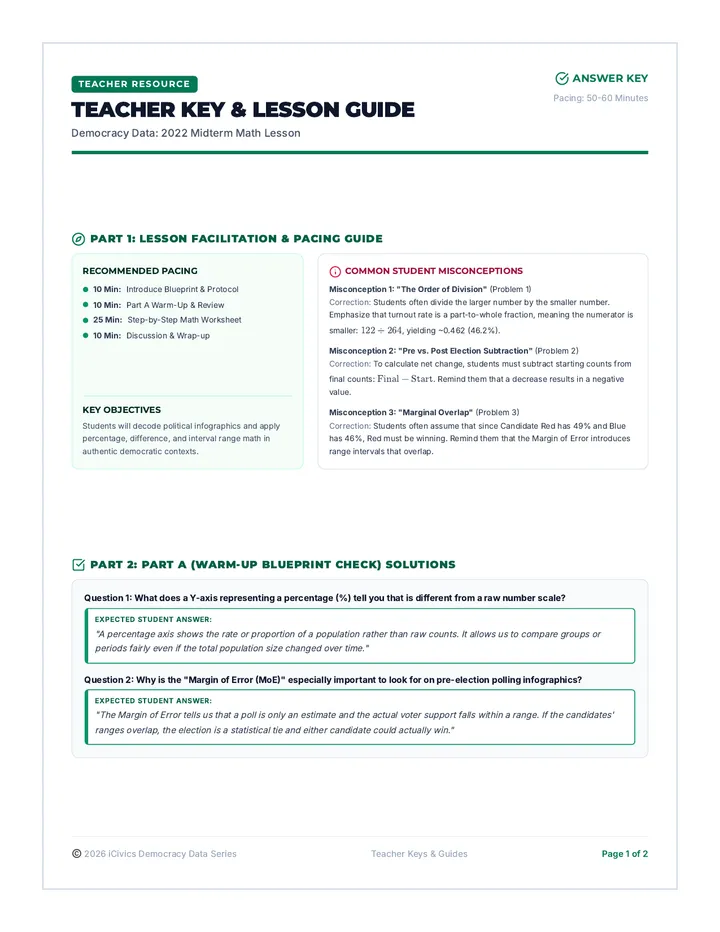
A civic-minded math lesson where students analyze real-world data from the 2022 midterm elections. Students learn to navigate complex infographics using structured reading strategies and tackle data-driven math questions with supportive step-by-step checklists.
A comprehensive summary of probability concepts tailored for the Algebra 2 Regents exam, featuring visual aids for Venn diagrams, two-way tables, and independence tests.
A comprehensive lesson focusing on constructing and interpreting confidence intervals for population means, specifically targeting how various factors like sample size and confidence level influence the margin of error.
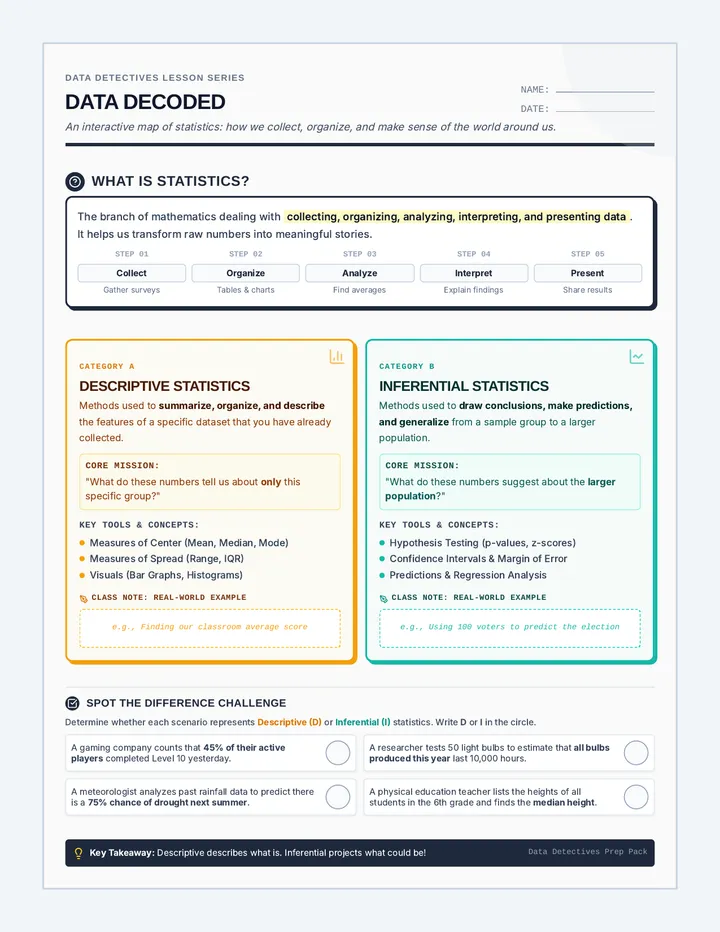
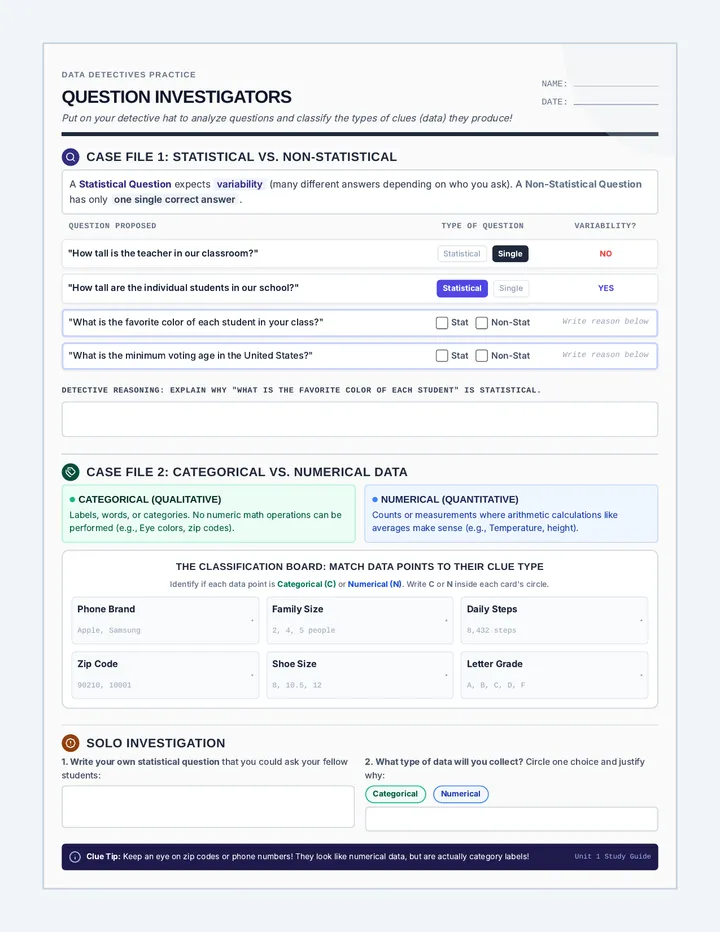
An introductory lesson to understanding what statistics is, exploring the difference between descriptive and inferential statistics, and engaging with data concepts.
A lesson focused on calculating the margin of error for population means when the population standard deviation is known. Students practice using z-scores for different confidence levels.
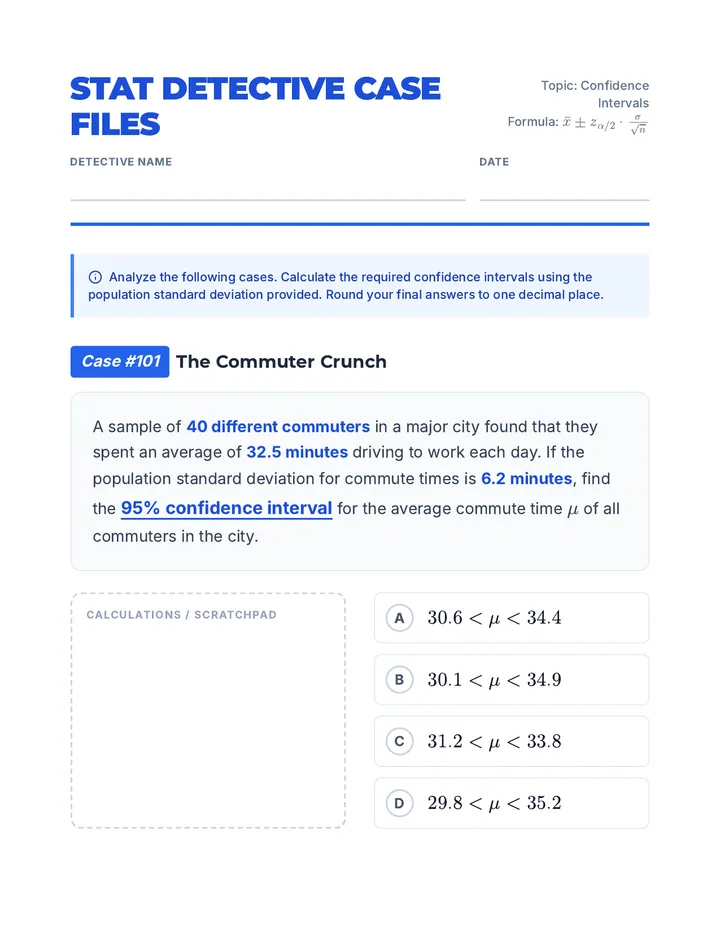
A lesson focused on calculating and interpreting confidence intervals for population means when the population standard deviation is known. Students practice identifying key statistics and applying the Z-interval formula to real-world scenarios.