An introductory lesson to understanding what statistics is, exploring the difference between descriptive and inferential statistics, and engaging with data concepts.
A master sequence containing curriculum-aligned lessons for Malaysian secondary school students. It covers Form 5 Mathematics and Form 2 English UASA revision.
A quick and engaging 15-minute warm-up for 7th-grade students to bridge the gap between vacation and the classroom by identifying real-world math applications in their own lives.
A visual presentation to guide the class through the Vacation Math Warm-Up, featuring categories, brainstorming prompts, and sharing examples.
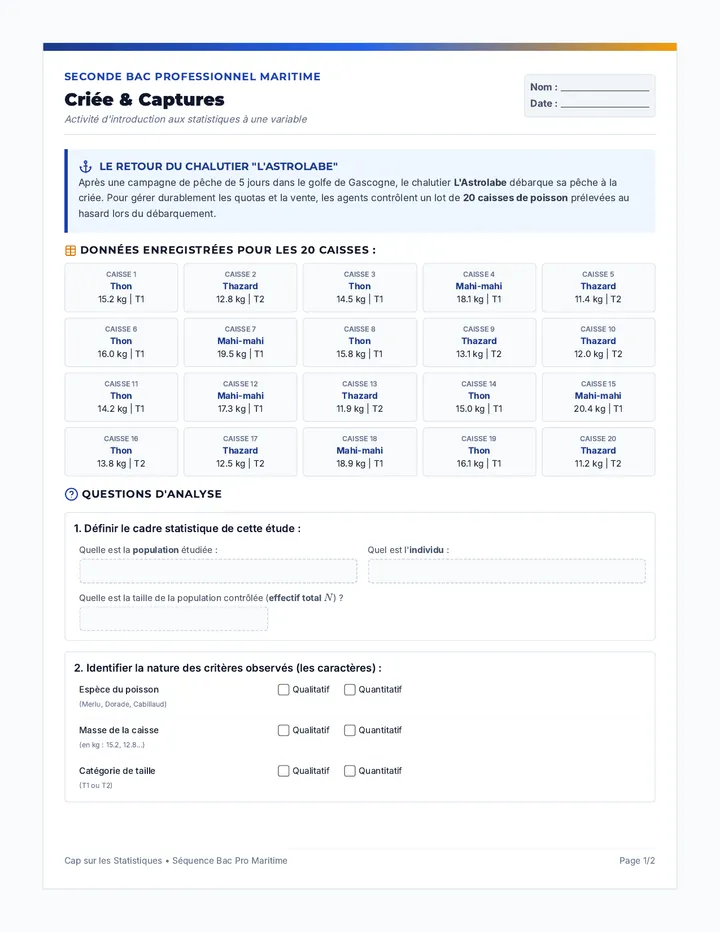
Séquence clé en main sur le module de chimie « Comment caractériser une solution ? » du programme de Seconde Bac Pro, contextualisée dans l'univers de la marine et de l'analyse des eaux.
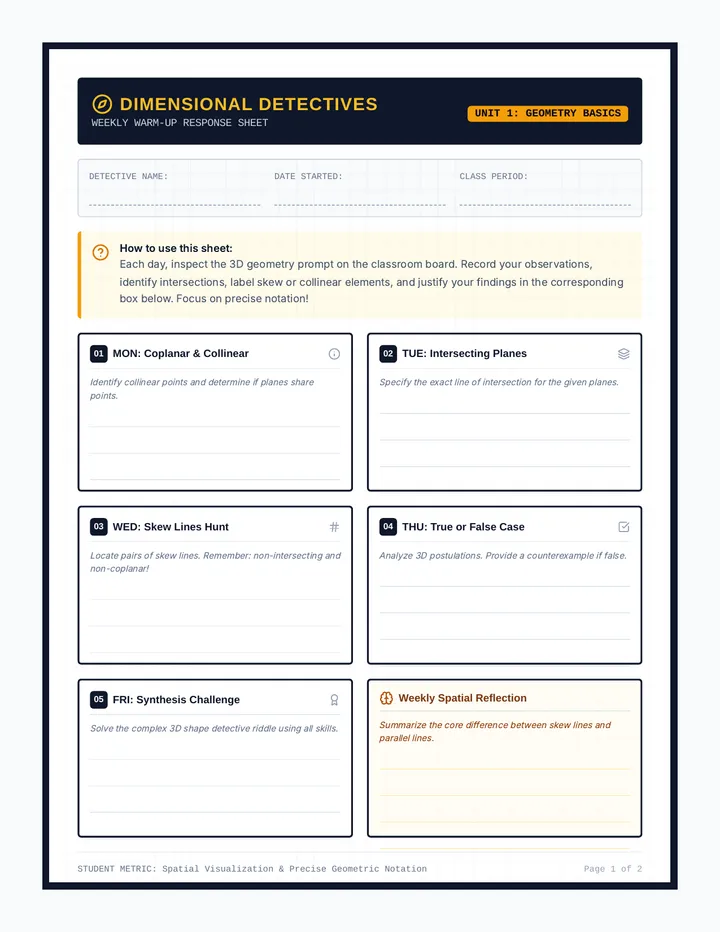
A geometry lesson focusing on visualizing 3D relationships, including intersecting planes, collinear points, coplanar lines, and skew lines in space. Includes projection-ready slide decks, task cards, and a weekly response sheet.
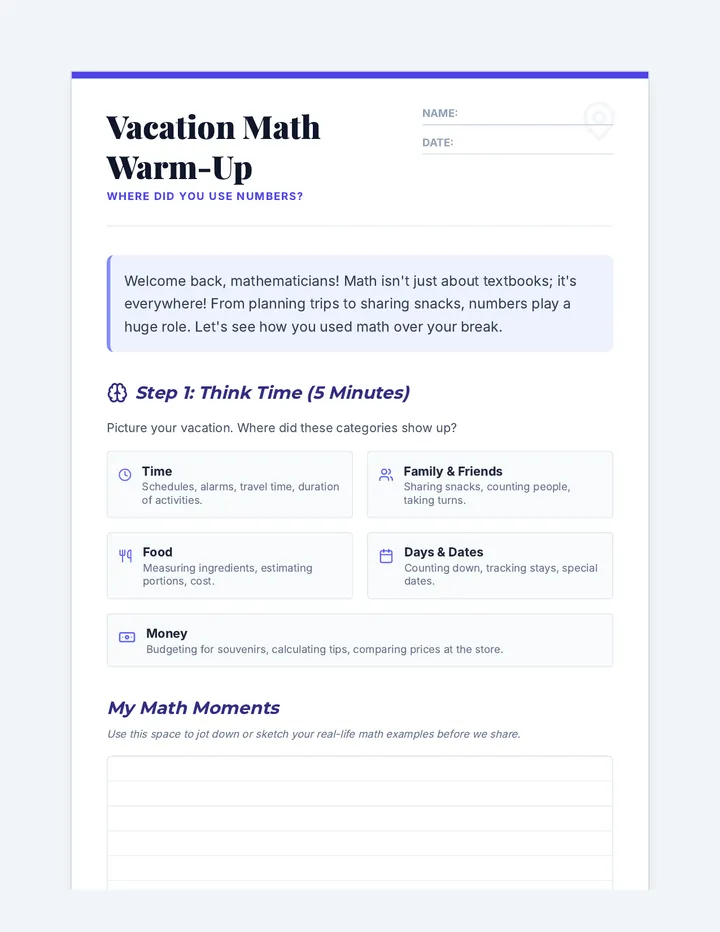
A student-facing handout designed to guide 7th graders through identifying and visualizing real-world math applications from their vacation.
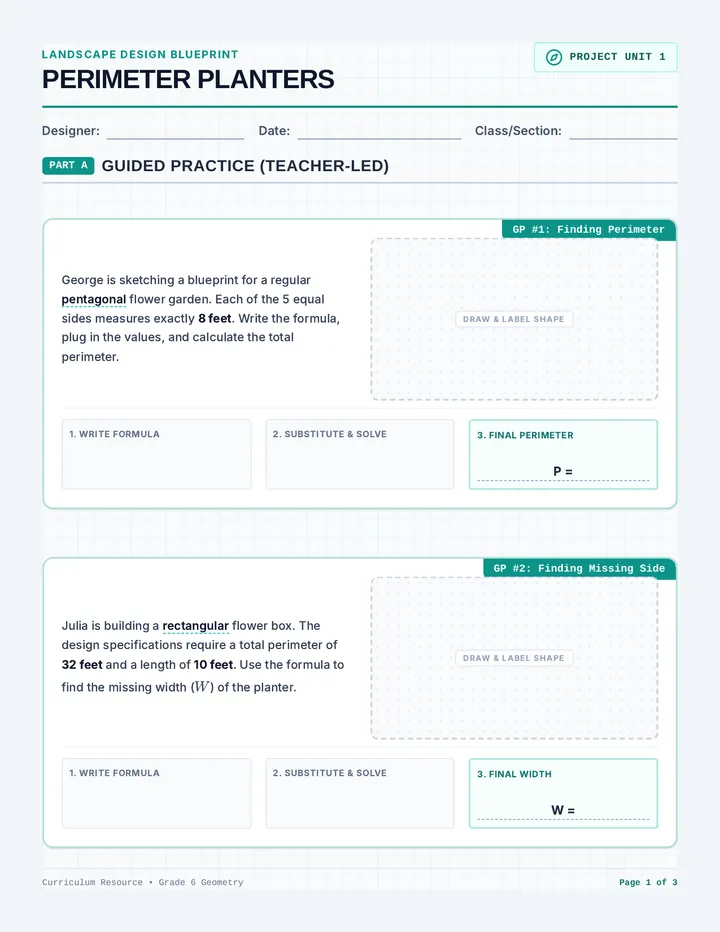
A comprehensive 6th-grade math unit that applies area and perimeter formulas to real-world garden planter designs. Students sketch architectural blueprints, calculate boundaries, determine surface coverage, and solve for missing dimensions across squares, rectangles, triangles, parallelograms, circles, and pentagons.
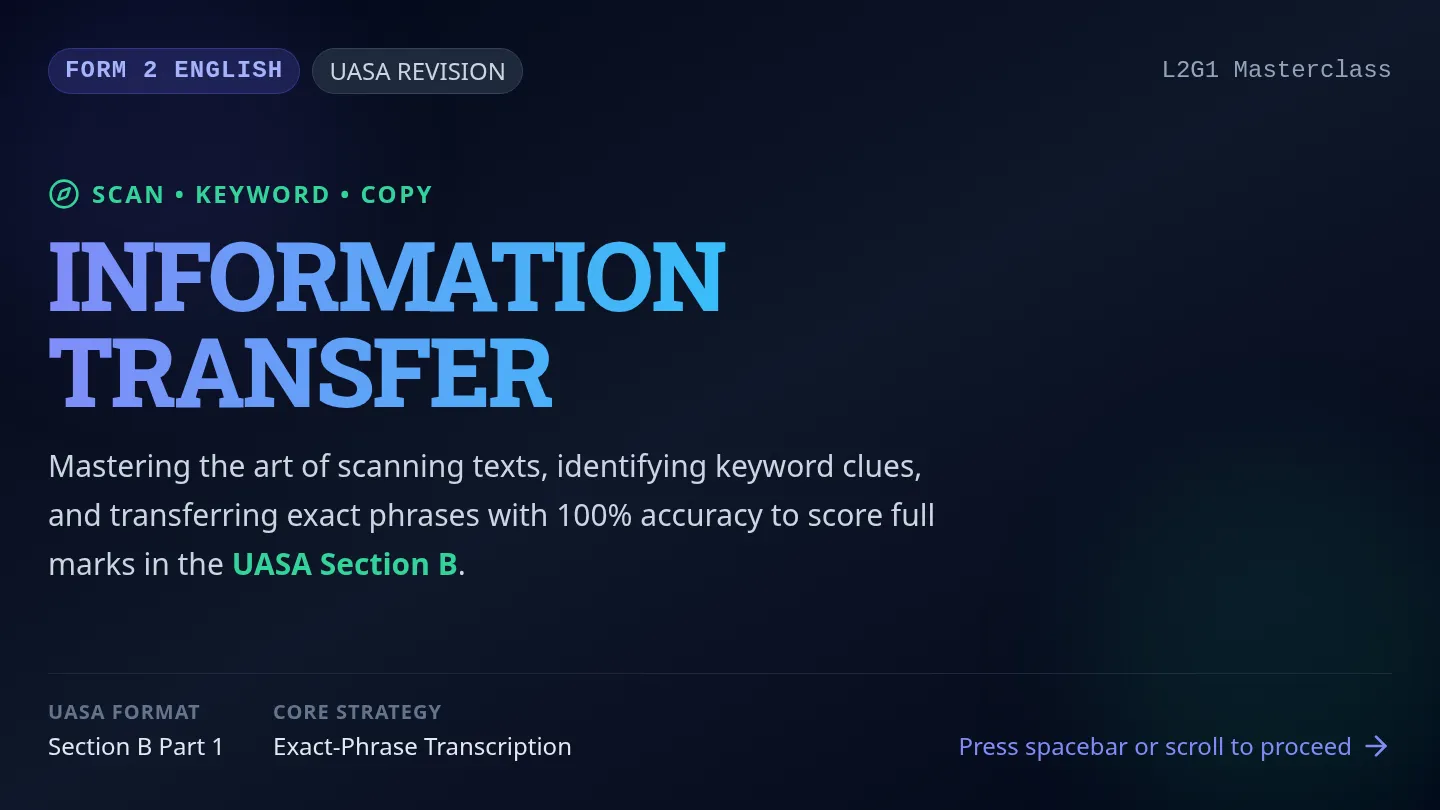
Form 2 English lesson focusing on the UASA Information Transfer format. Teaches scanning, keywording, and exact-phrase transcription strategies through real-world texts, hands-on graphic organizers, peer collaboration, and a post-lesson assessment.
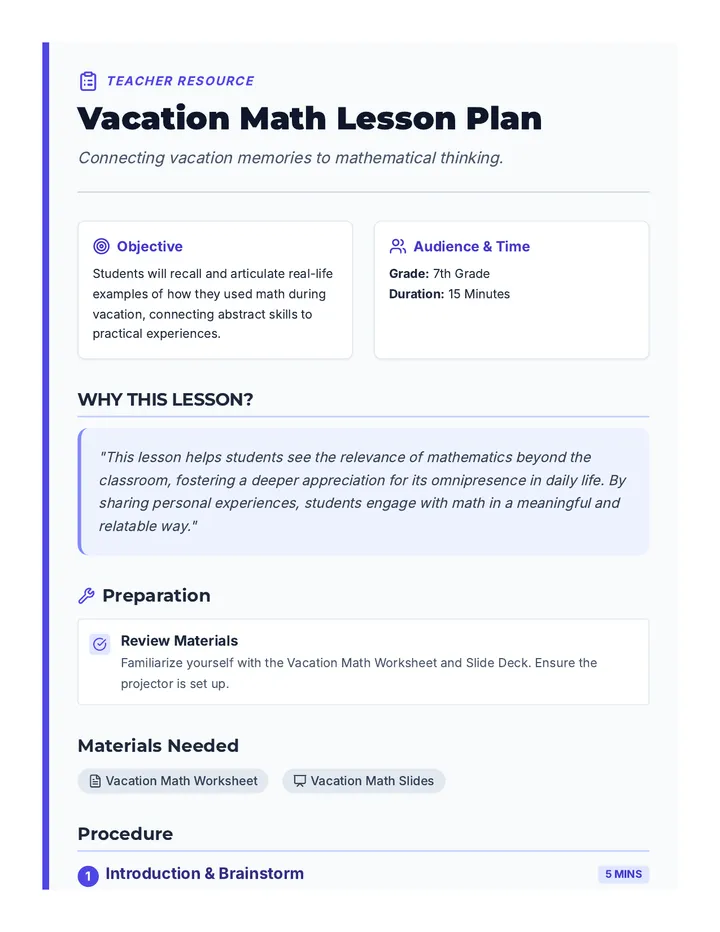
A concise lesson plan for teachers to facilitate the Vacation Math Warm-Up, including instructional steps, discussion questions, and pacing guides.
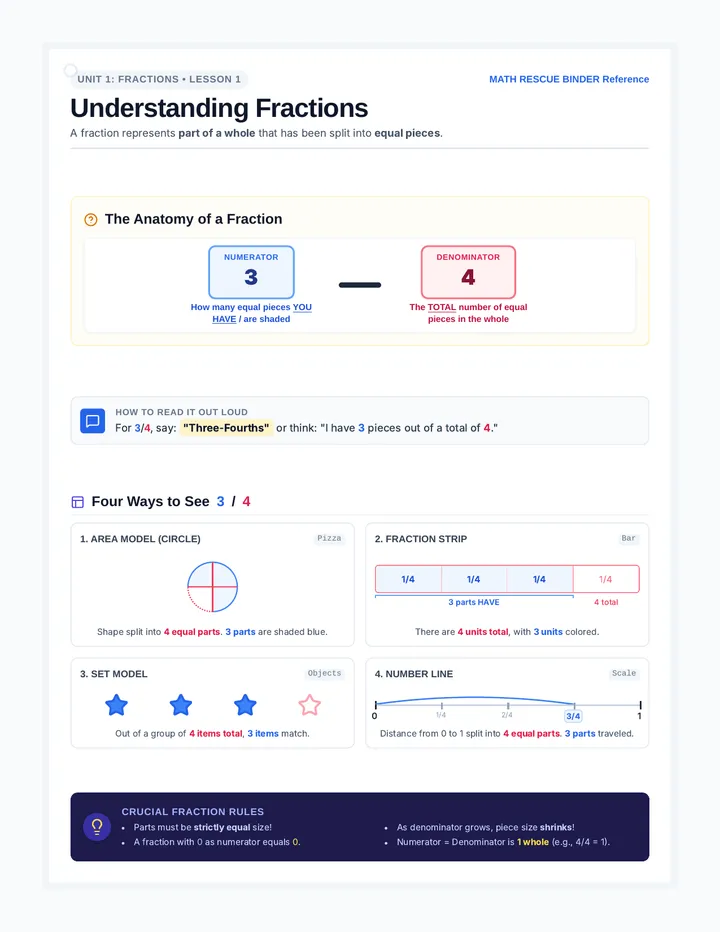
An intensive high-school math intervention binder focused on rebuilding foundational rational number operations, equivalent representations, and visual modeling for resource room or co-taught classrooms.
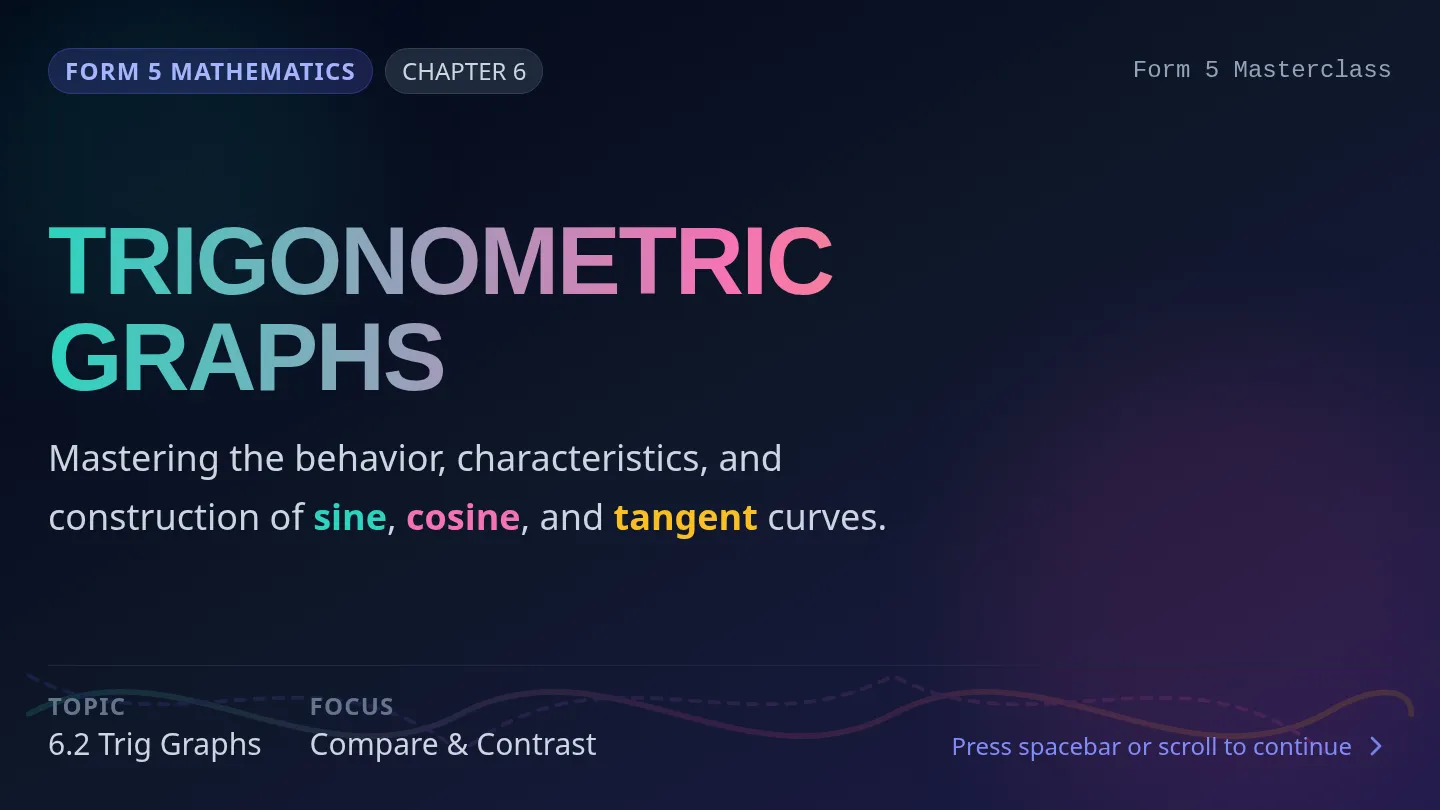
Form 5 Mathematics Lesson on trigonometric functions, covering graphing of sine, cosine, and tangent curves, exploring key features like amplitude, period, intercepts, and asymptotes. Includes assessment for learning, collaboration, and differentiated instruction.
A daily visual slide deck designed for front-of-class projection, guiding students through one-to-two high-contrast prompt slides for each day of the week, complete with beautifully scaled, large geometric 3D diagrams and strict adherence to 24px+ legibility.