Stat Steps Progression Chart
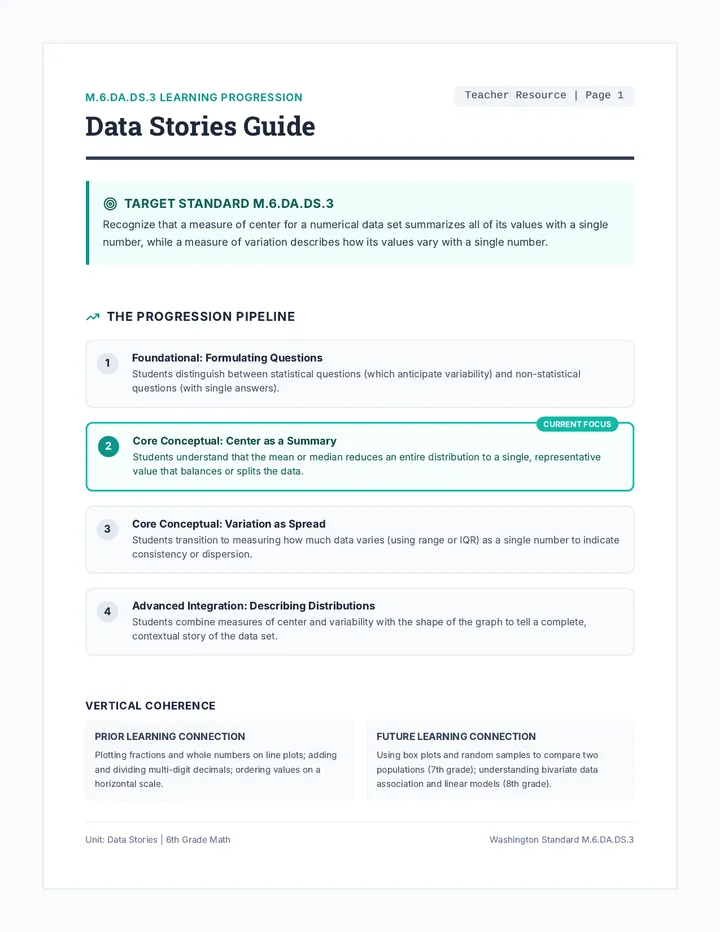
WA Standard M.6.DA.DS.3
Stat Steps Learning Progression
Summarizing numerical datasets: From graphical representation to strategic synthesis
Teacher Reference
Standard Mandate: Summarize numerical data sets in context by reporting observations, describing the attribute and units, calculating quantitative measures of center (mean, median) and variability (IQR, MAD), identifying overall distribution shapes, and strategically matching measures of center/variability to shape.
Step 01
Visual Foundations (Dot Plots & Histograms)
Least Complex
Concept: Plotting raw, individual values on a number line (Dot Plots) and grouping numerical data into equal, continuous intervals (Histograms).
⚡ Shift: From raw list to visual frequency shape. 🎯 Example: Binning continuous student heights into 2-inch intervals.
Step 02
Center Anchoring (Mean & Median)
Basic Analytics
Concept: Finding the mean (arithmetic "fair share" balance point) and the median (the exact spatial midpoint of an ordered dataset).
⚡ Shift: Summing & sorting data to find a single representative center point. 🎯 Example: Finding typical class test score.
Step 03
Structural Quarters (Five-Number Summary)
Data Structure
Concept: Splitting data into four equal-count quartiles ($Min, Q_1, Med, Q_3, Max$) and generating Box Plots to capture visual density.
⚡ Shift: Mapping data density (narrow segments = high density) across percentage milestones. 🎯 Example: Plant growth heights.
Step 04
Quantifying Variation (IQR & MAD)
Advanced Spread
Concept: Calculating Interquartile Range ($IQR = Q_3 - Q_1$) and Mean Absolute Deviation ($MAD$) to quantify dataset inconsistency.
⚡ Shift: Moving from measuring the location of data to measuring the degree of spread. 🎯 Example: Comparing forecast consistency.
Step 05
Contextual Synthesis (Strategic Matching)
Most Complex
Concept: Evaluating outlier sensitivity; selecting measures of center and variability strictly dictated by the shape of the data distribution.
⚡ Shift: Defending choice of stats based on skewness. 🎯 Example: Opting for Median over Mean due to high housing outliers.
The Strategic Selection Matrix (Peak Standard Synthesis)
Symmetric Distribution (Bell-Shaped)
Data is balanced on both sides. Outliers are absent or balanced.
Center: Mean Spread: MAD
Rationale: The mean counts every value. Since no tail pulls the center away, it represents the exact balancing point of the whole set.
Skewed Distribution (Left/Right Tail)
Data has a tail on one side, heavily pulled by extreme outliers.
Center: Median Spread: IQR
Rationale: The median is robust because it depends on ordinal position, not value. The IQR measures the middle 50% and ignores outliers.