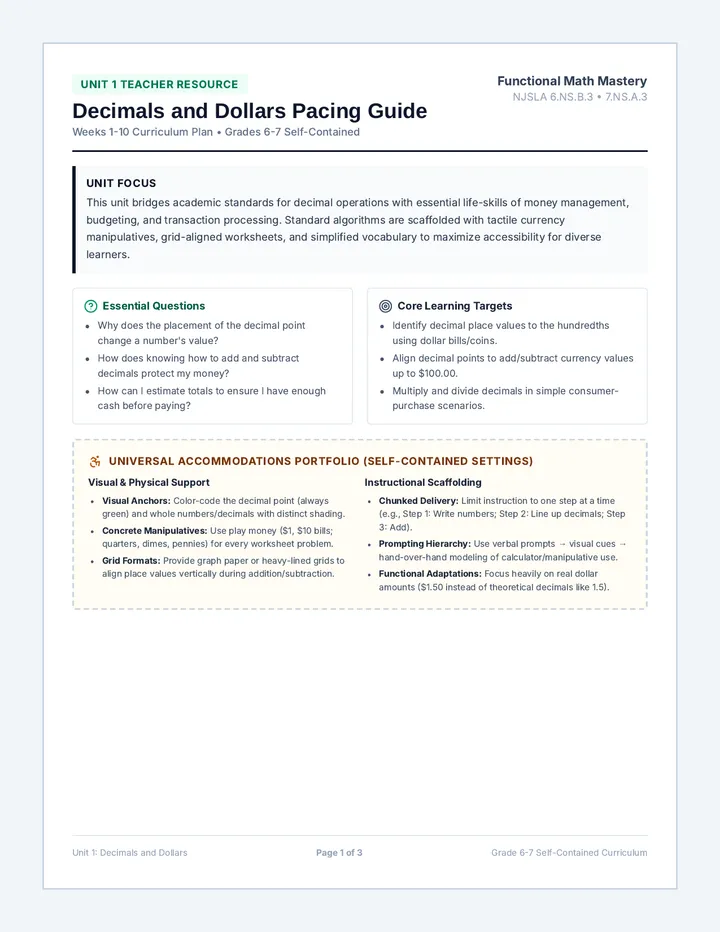
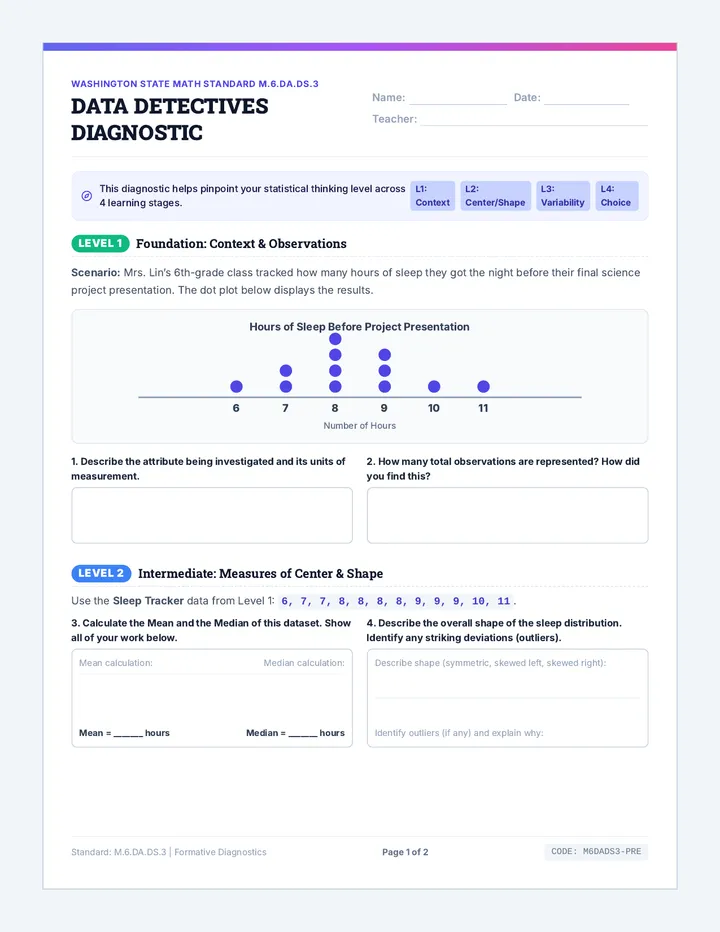
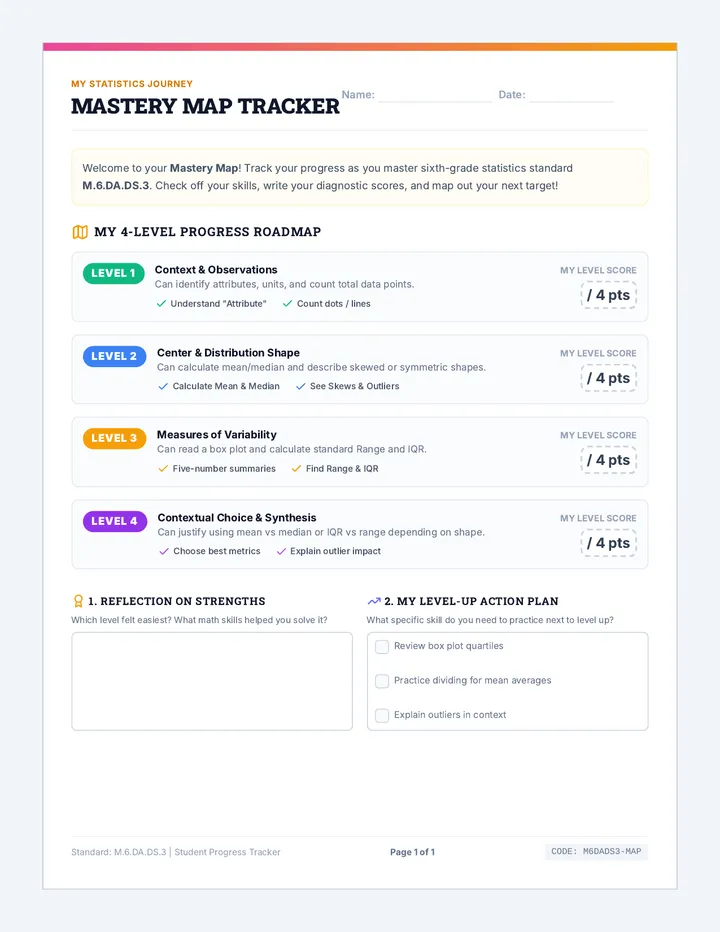
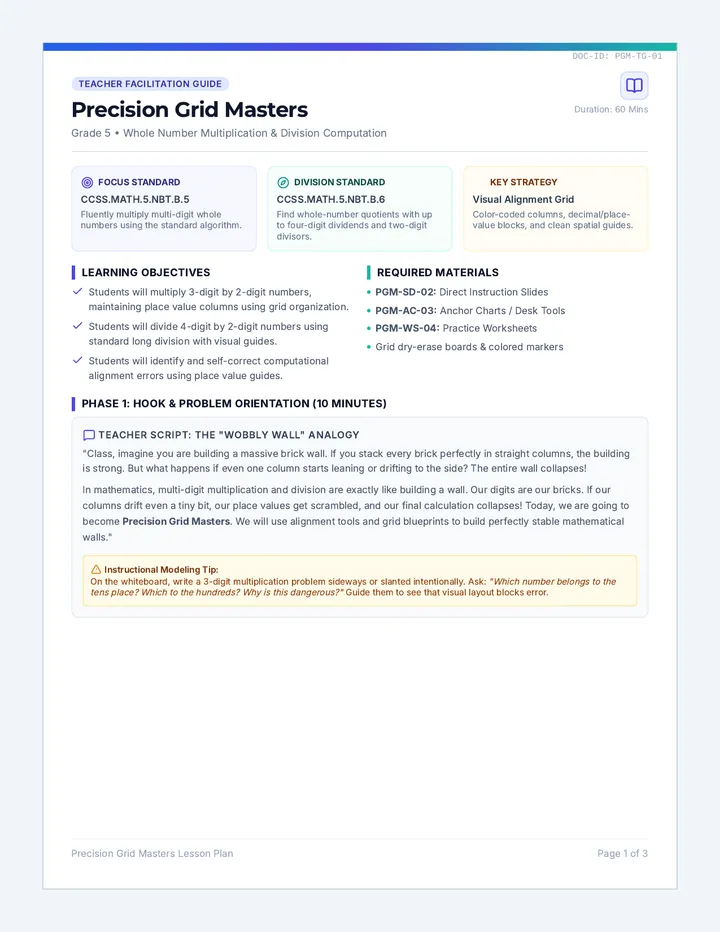
A comprehensive statistical unit designed for 6th-grade students to master Washington State standard M.6.DA.DS.3. Students explore measures of center (mean, median) and variability (range, interquartile range) through real-world distributions and context-rich data stories. This sequence guides students from conceptualizing center as a summary of data to measuring variation as a descriptor of spread.
Word Origin "Median" = Middle Like the concrete divide of a highway
1
Unsorted Shoes: 7.5, 6.0, 8.0, 5.5, 7.0
2
Sorted Shoes: 5.5, 6.0, 7.0, 7.5, 8.0
The median shoe size is 7.0 because it perfectly splits the data group in half!
Half the values are below; half are above. Physical Representative
Daily Warm-Up 3 The Giant Visitor
The Tall Outlier
Four students are playing basketball. Their heights (in inches) are:
50, 52, 53, 55
Median = 52.5 in, Mean = 52.5 in.
Suddenly, professional player Shaq (84 inches) joins the game!
Make Your Prediction:
Which measure of center changes the most?
Which measure of center stays almost same?
Hint: Does Shaq's 84-inch height affect the "fair share" sum or the ordered "middle seat" more?
Turn and talk with your team Topic: Sensitivity of Center
Unit Wrap-up The Power of Center
The Core Takeaway of M.6.DA.DS.3
"One Number to Summarize an Entire Distribution"
We don't need to read out 100 individual data points to compare two groups. By calculating one value of center (mean or median), we get a representative snapshot of the entire data story!
THE MEAN Fair share (shares the total equally)
THE MEDIAN Ordered middle (splits the group in half)
Ready for the Middle Ground Worksheet? Lesson 1 Complete
4 Part 4: The Core Data Story
Explain in your own words: Why do mathematicians use a single number (like the mean or median) instead of reading every single data point to explain a graph to someone else?
Unit: Data Stories | Lesson 1 Page 2 of 2
Common Student Misconceptions
1. Range is a Coordinates Pair
Symptom: Students state that the range is "from 2 to 10" rather than calculating the single number 8. Fix: Force subtraction: Range = Max - Min. It must be a single number.
2. Quartile Index Confusion
Symptom: Including the median in the upper/lower half calculations when finding Q1 and Q3 from odd datasets. Fix: Use highlighters to physical box the numbers below and above the true median element.
Unit: Data Stories | 6th Grade Math Washington Standard M.6.DA.DS.3
Classroom Materials
Anchor Chart Blueprint
Teacher Resource | Page 3
This anchor chart focuses on Measures of Variation. Have students sketch this visual directly in their lab books during direct instruction.
Measures of Variation
"One number that describes the spread of data values."
THE RANGE
Max - Min
The total stretch of the data from the very lowest to highest score.
Data: 2, 5, 8, 15
15 - 2 = 13 Range = 13
"The whole stretch of the yard"
THE IQR
Q3 - Q1
The stretch of the middle 50% of values, ignoring the extremes.
Sorted: 2, 5, 8, 12, 15
Q3 (12) - Q1 (5) IQR = 7
It shows where the typical core of the crowd sits!
Crucial Connection Tag:
"A small variance means a high consistency! A large variance means wild unpredictable scores."
Assessment Prep Note:
Students must distinguish statistical prompts that ask for center ("What is the typical speed?") versus prompts that ask for variance ("What is the range of speeds?"). Emphasize standard terms.
Unit: Data Stories | 6th Grade Math Washington Standard M.6.DA.DS.3
Quartiles divide data sets into four equal groups of values. Conceptual Analogy
Core Variation 2 The Middle Core
The Interquartile Range (IQR)
The IQR is the spread of the middle 50% of your data. It completely ignores extreme outliers and measures the core crowd!
The IQR measures the range of the middle half of the data. Calculated Core Variance
Daily Warm-Up 6 Center vs. Spread
Which Summary Do They Need?
Determine if the questions below require a measure of center or a measure of variation to answer.
A. "How many hours of sleep does a typical 6th grader get?"
Think: Does this search for a single middle value, or the variation of sleeps?
B. "What is the difference between the most sleep and least sleep?"
Think: Does this search for the outer boundaries and stretch of the data?
Discuss with your partner: Why is one about center and the other about spread? Topic: Analytical Standards
Unit Wrap-Up The Power of Spread
The Final Takeaway of M.6.DA.DS.3
"Center is the Representative. Spread is the Drama."
Knowing the average is never enough. By measuring the variation with a single number (range or IQR), we discover if our data is calm and consistent, or wild and erratic!
THE RANGE The full span (Max - Min)
THE IQR The core middle span (Q3 - Q1)
Ready to conquer the Great Stretch Worksheet? Lesson 2 Complete
10, 12, 14, 15, 18, 20, 22, 24
Find the middle 50% spread. Calculate the Interquartile Range (IQR) by subtracting the first quartile from the third quartile (Q3 - Q1).
Clue Hint: Find Median of lower half (Q1) and upper half (Q3) first.
5
Case 5: The Coherence Clash
Stage: Standard Analysis
Standard M.6.DA.DS.3 asks us to separate questions that analyze the representative "Middle Ground" (center) from those that analyze the "Great Stretch" (spread).
A suspect asks: "Is the crime rate consistency improving month over month?" Does this request a measure of center or variation to solve? Explain.
Clue Hint: Consistency and variety relate directly to spread.
6
Case 6: The Final Verdict
Stage: Mastery
A forensic scientist states: "Our laser measurements are incredibly consistent!"
Does this mean the scientist's data has a **low range** or a **high range**? What does that single number of variation tell you about their measurements? Write the verdict on your sheet.
Clue Hint: Higher variation equals less consistency.