Data Detectives Diagnostic
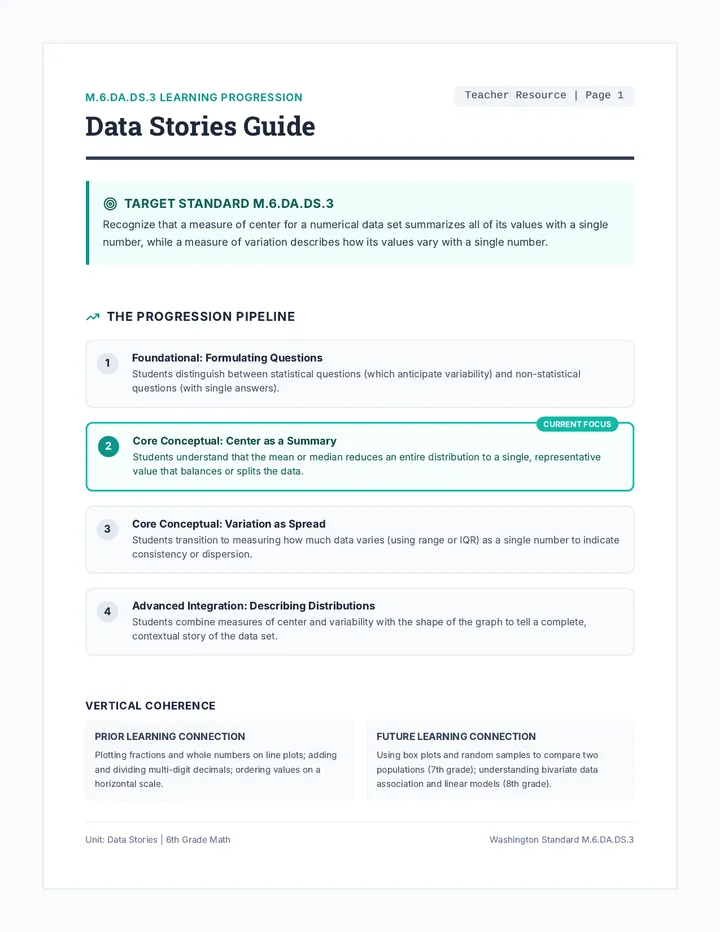
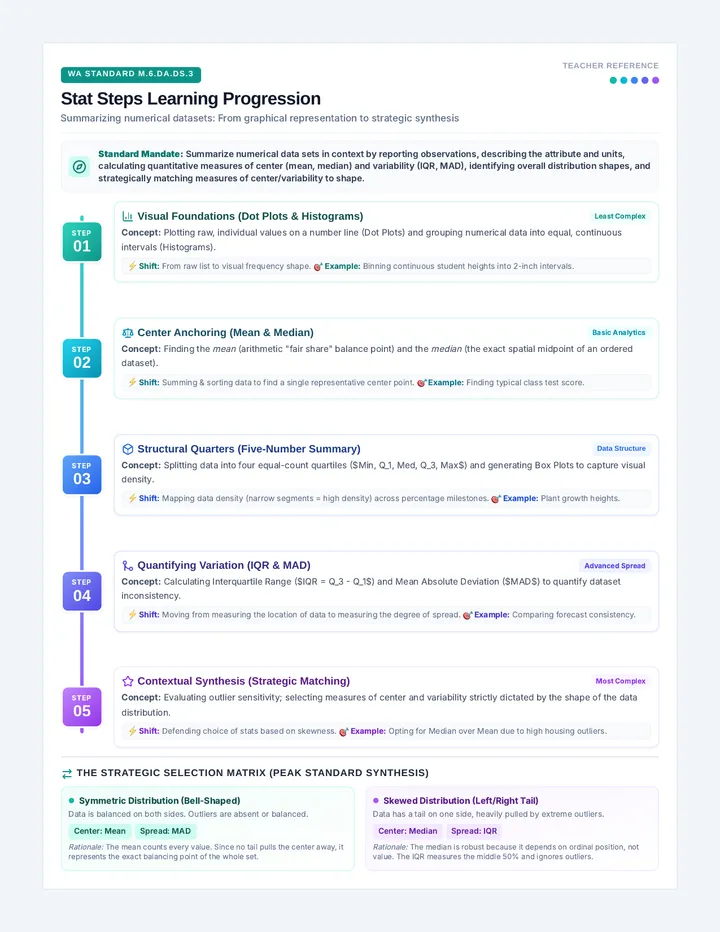
Washington State Math Standard M.6.DA.DS.3
DATA DETECTIVES DIAGNOSTIC
Name:
Date:
Teacher:
This diagnostic helps pinpoint your statistical thinking level across 4 learning stages.
L1: Context L2: Center/Shape L3: Variability L4: Choice
Level 1
Foundation: Context & Observations
Scenario: Mrs. Lin’s 6th-grade class tracked how many hours of sleep they got the night before their final science project presentation. The dot plot below displays the results.
Hours of Sleep Before Project Presentation
6 7 8 9 10 11
Number of Hours
1. Describe the attribute being investigated and its units of measurement.
2. How many total observations are represented? How did you find this?
Level 2
Intermediate: Measures of Center & Shape
Use the Sleep Tracker data from Level 1: 6, 7, 7, 8, 8, 8, 8, 9, 9, 9, 10, 11.
3. Calculate the Mean and the Median of this dataset. Show all of your work below.
Mean calculation: Median calculation:
Mean = _______ hours Median = _______ hours
4. Describe the overall shape of the sleep distribution. Identify any striking deviations (outliers).
Describe shape (symmetric, skewed left, skewed right):
Identify outliers (if any) and explain why:
Standard: M.6.DA.DS.3 | Formative Diagnostics Page 1 of 2 CODE: M6DADS3-PRE
Data Detectives Diagnostic
Student Name:
Level 3
Advanced: Measures of Variability
Scenario 2: Speedy Slice Pizza Shop tracks how long it takes to deliver orders. The box-and-whisker plot below displays delivery times, in minutes, for a random sample of deliveries.
Speedy Slice Delivery Times (Minutes)
10
18
25
35
45
10 min 15 min 20 min 25 min 30 min 35 min 40 min 45 min
5. Identify the five-number summary from the delivery box plot:
Minimum:
Lower Quartile (Q1):
Median (Q2):
Upper Quartile (Q3):
Maximum:
6. Calculate the Range and the Interquartile Range (IQR). What do they measure?
Range: IQR:
Explain what these calculations tell you about the variability of delivery times:
Level 4
Mastery: Contextual Synthesis & Choice of Measures
Imagine Speedy Slice Pizza Shop has an extremely slow outlier delivery that takes 75 minutes because the delivery driver got lost in a construction zone.
7. How does this outlier affect Mean vs. Median? Which best describes typical deliveries?
Effect on Mean vs. Median:
Best measure for typical delivery & context explanation:
8. If the shape is highly skewed, which measure of variability (IQR or Range) is better? Why?
Select standard measure of variability for skewed data:
Explain why it is less affected by outliers than the other:
Standard: M.6.DA.DS.3 | Formative Diagnostics Page 2 of 2 CODE: M6DADS3-PRE
Data Detectives Rubric
TEACHER DIAGNOSTIC COMPANION
DATA DETECTIVES RUBRIC
Standard: M.6.DA.DS.3
Use these rubric bands to group students for targeted instruction, math stations, or tier-2 interventions.
Mastery Levels & Criteria
| Level / Focus | Full Mastery (3 pts) | Partial Mastery (1.5-2 pts) | Beginning (0-1 pt) |
|---|
| L1: Context & Obs. | Correctly identifies attribute, units, and count (12) with full explanations. | Identifies some context, but has counting errors or confuses units. | Unable to explain the context; cannot count observations. |
| L2: Center & Shape | Calculates mean (8.33) and median (8) accurately; identifies skew and outlier. | Knows procedures but commits calculations or rounding errors. | Cannot define mean or median; confuses center with tall peaks. |
| L3: Variability | Identifies five-number summary values, range (35), and IQR (17) from box plot. | Quartile reading errors; confuses boundaries of the central box. | Does not understand visual box plots or range calculations. |
| L4: Synthesis | Explains outlier impact on mean vs median. Justifies measure choices based on shape. | Understands mean is pulled but cannot justify why median or IQR is more robust. | Thinks outliers affect all metrics equally; makes random tool choices. |
Page 1 Detailed Answer Key
Q1 Key (Attribute & Units): • Attribute: Amount of sleep the night before presentations. • Units: Hours.
Q2 Key (Observations): • Count: 12 observations. • Explanation: Summed the number of dots on the plot (1+2+4+3+1+1=12).
Q3 Key (Mean & Median): • Mean: Sum is 100. \(100 \div 12 \approx 8.33\) hours. • Median: Middle elements are 8 and 8. Median is 8 hours.
Q4 Key (Shape & Outliers): • Shape: Right-skewed (skewed positive). • Outliers: 11 hours stands out as an outlier or extreme gap value, with 6 hours at the lower boundary.
Standard: M.6.DA.DS.3 | Teacher Diagnostic Guide Page 1 of 2 CODE: M6DADS3-KEY
Data Detectives Rubric Diagnostic Scoring & Intervention
Page 2 Detailed Answer Key
Q5 Key (Five-Number Summary): • Min: 10 min | Q1: 18 min | 25 min | 35 min | 45 min.
Mastery Map Tracker
My Statistics Journey
MASTERY MAP TRACKER
Name:
Date:
Welcome to your Mastery Map! Track your progress as you master sixth-grade statistics standard M.6.DA.DS.3. Check off your skills, write your diagnostic scores, and map out your next target!
My 4-Level Progress Roadmap
Level 1
Context & Observations
Can identify attributes, units, and count total data points.
Understand "Attribute" Count dots / lines
My Level Score / 4 pts
Level 2
Center & Distribution Shape
Can calculate mean/median and describe skewed or symmetric shapes.
Calculate Mean & Median See Skews & Outliers
My Level Score / 4 pts
Level 3
Measures of Variability
Can read a box plot and calculate standard Range and IQR.
Five-number summaries Find Range & IQR
My Level Score / 4 pts
Level 4
Contextual Choice & Synthesis
Can justify using mean vs median or IQR vs range depending on shape.
Choose best metrics Explain outlier impact
My Level Score / 4 pts
1. Reflection on Strengths
Which level felt easiest? What math skills helped you solve it?
2. My Level-Up Action Plan
What specific skill do you need to practice next to level up?
Review box plot quartiles
Practice dividing for mean averages
Explain outliers in context
Standard: M.6.DA.DS.3 | Student Progress Tracker Page 1 of 1 CODE: M6DADS3-MAP