Lenny.com
Explore
Create
ActivitiesNewMathEnglish Language ArtsScience & EngineeringSocial StudiesGlobal LanguagesHealth & Physical EducationSpecial EducationCounseling & Life SkillsArts & CreativityESL
Lenny.com
Lenny.com
Explore
Create
ActivitiesNewMathEnglish Language ArtsScience & EngineeringSocial StudiesGlobal LanguagesHealth & Physical EducationSpecial EducationCounseling & Life SkillsArts & CreativityESL
Lenny.com
MathNumbers & CountingCounting ObjectsNumber NamesComparing NumbersNumber OperationsCounting SequenceNumbers 0-10Place Value Understanding and SystemAdd and Subtract Within 20Addition and Subtraction ConceptsAddition and Subtraction EquationsAddition and Subtraction ProblemsFoundations for MultiplicationMultiplication and Division PropertiesMultiply and Divide Within 100Multiplication and Division ProblemsFactors and MultiplesProperties of OperationsPatterns and RelationshipsGenerate and Analyze PatternsMulti-Digit ArithmeticPlace Value OperationsMulti-Digit and Decimal OperationsNumerical ExpressionsFour Operations and PatternsFour Operations Problem SolvingMeasurement & DataMeasurable AttributesMeasuring LengthsMeasure and Estimate Lengths in Standard UnitsRelate Addition and Subtraction to LengthClassifying and Counting ObjectsTime and MoneyArea Concepts and MeasurementPerimeter and Area MeasuresAngle Concepts and MeasurementTime, Volume, and MassMeasurement Unit ConversionsGeometryIdentifying ShapesShapes and AttributesShape Attributes and ReasoningShapes and CompositionClassifying 2D FiguresGeometric Figures and RelationshipsLines, Angles, and ShapesAngle, Area, and VolumeGeometric MeasurementVolume of 3D ShapesCoordinate Plane ApplicationsTransformations in the PlaneCongruence and SimilarityUnderstand congruence in terms of rigid motionsSimilarity and TransformationsProve Theorems Involving SimilarityPythagorean TheoremTrigonometry for General TrianglesMake Geometric ConstructionsProve Geometric TheoremsTheorems About CirclesFind Arc Lengths And Areas of Sectors of CirclesVolume FormulasRelationships Between Two-Dimensional and Three-Dimensional ObjectsProve Simple Geometric Theorems AlgebraicallyTranslate Between Geometric Description and Equation for Conic SectionApply Geometric Concepts in Modeling SituationsFractions & DecimalsFractions as NumbersBuilding FractionsFraction Equivalence and OrderingAdding and Subtracting FractionsMultiplying and Dividing FractionsDividing FractionsDecimal FractionsMulti-Digit Computation and FactorsAdd, Subtract, Multiply, and Divide Rational NumbersRational Number SystemIrrational Numbers and ApproximationsRatiosRatios and ProportionsProportional RelationshipsUnit RateAlgebraAlgebraic ExpressionsGenerate Equivalent ExpressionsQuantitative RelationshipsProportional Relationships and Linear EquationsEquations and InequalitiesEquation Solving and ReasoningLinear Equations and SystemsGraph Equations and InequalitiesSystems of EquationsReal-World Algebraic ProblemsQuantitative Reasoning with UnitsExpression StructureEquivalent Expression FormsRadicals and Integer ExponentsRational ExponentsRational and Irrational NumbersPolynomial OperationsPolynomial IdentitiesPolynomial Zeros and FactorsRational ExpressionsComplex Number OperationsComplex Numbers in PolynomialsComplex Numbers on PlaneStatistics & ProbabilityRepresent and Interpret DataData DistributionsStatistical VariabilityProbability ModelsCompound Event ProbabilitiesStatistical SamplingInterpret Categorical and Quantitative DataBivariate Data PatternsInterpret Linear ModelsComparing Two PopulationsRandom Processes in StatisticsIndependence and Conditional ProbabilityExpected ValuesProbability-Based Decision MakingStatistical Inference and ConclusionsFunctionsFunction Concepts and NotationDefine and Compare FunctionsInterpret Functions in ContextAnalyze Function RepresentationsModel Relationships with FunctionsIdentify Linear vs Exponential GrowthDistinguish Between Function TypesCompare Growth RatesInterpret Function ExpressionsBuild Functions from RelationshipsConstruct and Model FunctionsTransform and Combine FunctionsModel Comparison and SelectionSolve Exponential EquationsTrigonometryTrigonometric Ratios Involving Right TrianglesTrigonometric Functions and Unit CircleModel with Trigonometric FunctionsTrigonometric IdentitiesVectors & MatricesIntroduction to Vectors and MatricesVector QuantitiesVector OperationsMatrix OperationsCalculusLimits and ContinuityDerivative Concepts and NotationDerivative Rules and TechniquesApplications of DerivativesOptimization ProblemsRelated RatesCurve Sketching and AnalysisIntegration Concepts and NotationAntiderivatives and Indefinite IntegralsDefinite Integrals and AreaFundamental Theorem of CalculusIntegration TechniquesApplications of IntegrationDifferential EquationsSequences and SeriesParametric and Polar FunctionsVector-Valued Functions

Classifying and Counting Objects

Sorting by physical attributes such as color, size, and shape to organize data sets. Develops counting skills within specific categories and establishes foundations for early data analysis.

Lenny.com

Solutions

Lenny for EducatorsLenny for SchoolsLenny for Districts

Product

ExploreSign inCreateSupportAbout

Resources

Getting startedMTSS Acceleration Program

© 2026 Lenny Learning Inc.

TermsPrivacyAccessibility
LinkedInInstagramX
Lenny

Videos

How to Sort Objects by Color and Type

How to Sort Objects by Color and Type

This animated video provides a clear and accessible introduction to the mathematical concept of sorting and classification for early learners. Set in a colorful backyard with a clothesline, the video demonstrates that a single set of objects can be organized in multiple ways based on different attributes. The narrator guides viewers through identifying these attributes, specifically focusing on color and object type, to group a collection of shirts, shorts, and socks. Key themes include observation, attribute identification, logic, and set organization. The video explicitly models the thinking process required for data analysis at a foundational level: looking at a chaotic group of items, identifying common traits, and physically rearranging them into organized categories. By showing the same items sorted first by color (blue, red, yellow) and then by type (shirts, shorts, socks), it reinforces the idea that classification is flexible and depends on the specific rule being applied. This resource is an excellent tool for Pre-K and Kindergarten classrooms to introduce or reinforce sorting skills. It serves as a perfect hook for lessons on patterns, data collection, and logical reasoning. Teachers can use the video to model vocabulary such as "sort," "group," "attribute," and "type," and then transition immediately into hands-on activities where students sort physical manipulatives, classroom supplies, or even sort themselves based on observable characteristics.

MatholiaChannelMatholiaChannel

1min 12s

Ways We Use and Represent Numbers

Ways We Use and Represent Numbers

This engaging animated music video introduces early elementary students to the many ways numbers can be represented and used in daily life. Through a catchy folk-style song, the video follows a character named Suzy and a banjo-playing beaver as they demonstrate number concepts ranging from basic counting numerals to more complex representations like ten-frames, number lines, and base-10 blocks. The visual narrative moves from a classroom setting to various real-world scenarios, helping students visualize abstract mathematical concepts. The video systematically explores distinct methods of representing quantity, including written numerals, number words, fingers, tally marks, dice dots, and dominoes. It places special emphasis on grouping strategies, such as bundling tally marks by five and using ten-frames to organize visual counts. Beyond simple enumeration, the content bridges the gap to application by showing how numbers function in measuring distance on road signs, tracking time on clocks and calendars, and calculating money for purchases. For educators, this resource serves as an excellent anchor for a unit on number sense and representation. It supports visual learners by providing concrete imagery for abstract numbers and helps answer the common student question "When will I use this?" by connecting math to shopping, travel, and nature. The song's repetitive chorus and clear visual examples make it a versatile tool for introducing new topics, reviewing concepts, or facilitating choral counting activities in the classroom.

Math Songs by NUMBEROCKMath Songs by NUMBEROCK

3mins 22s

Creating Picture Graphs in the Garden

Creating Picture Graphs in the Garden

This animated math lesson introduces young learners to data handling through the creation of a simple picture graph. Set in a vibrant garden environment, the video guides students through the process of observing different animals, counting them one by one, and recording that data using a pictorial representation where one circle represents one animal. The video covers fundamental early math skills including counting objects up to 10, one-to-one correspondence, and translating counted quantities into a graphical format. It systematically demonstrates the process for four different data sets: bees, ladybugs, butterflies, and frogs, reinforcing the connection between the physical objects and their symbolic representation on the chart. Ideal for early elementary classrooms, this resource serves as an excellent introduction or review of graphing concepts. The clear visual cues, such as animals glowing as they are counted, support students who are developing counting fluency. The video concludes with open-ended analysis questions about 'most' and 'least,' encouraging critical thinking and data interpretation skills beyond simple construction.

MatholiaChannelMatholiaChannel

2mins 19s

A Guide to Identifying and Counting U.S. Coins

A Guide to Identifying and Counting U.S. Coins

This engaging animated video provides a comprehensive introduction to the six major types of United States coins: the penny, nickel, dime, quarter, half-dollar, and dollar coins. Through clear narration and distinct visual aids, the video guides viewers through the physical characteristics, monetary values, and historical figures associated with each coin. It specifically highlights how to identify coins based on color (copper, silver, gold), size, and the imagery on both the heads and tails sides, including updates to coin designs like the Union Shield penny and the Presidential dollars. The video explores key themes of financial literacy, basic arithmetic, and American history. It covers the concept of value equivalency (e.g., five pennies equal one nickel), introduces significant historical figures like Abraham Lincoln, Thomas Jefferson, and Sacagawea, and touches on civic symbols like the Statue of Liberty and the Presidential Seal. Additionally, it introduces economic concepts simply, such as the cost of manufacturing a penny versus its face value. For educators, this resource is an excellent tool for math and social studies curriculums. It supports learning objectives related to identifying currency, counting money, and understanding place value. The video's segmented structure allows teachers to pause and focus on specific coins, making it ideal for interactive lessons involving coin sorting, counting practice, or historical inquiries about the figures represented on U.S. currency.

Homeschool PopHomeschool Pop

13mins 26s

Counting Farm Animals: Tally Charts and Picture Graphs

Counting Farm Animals: Tally Charts and Picture Graphs

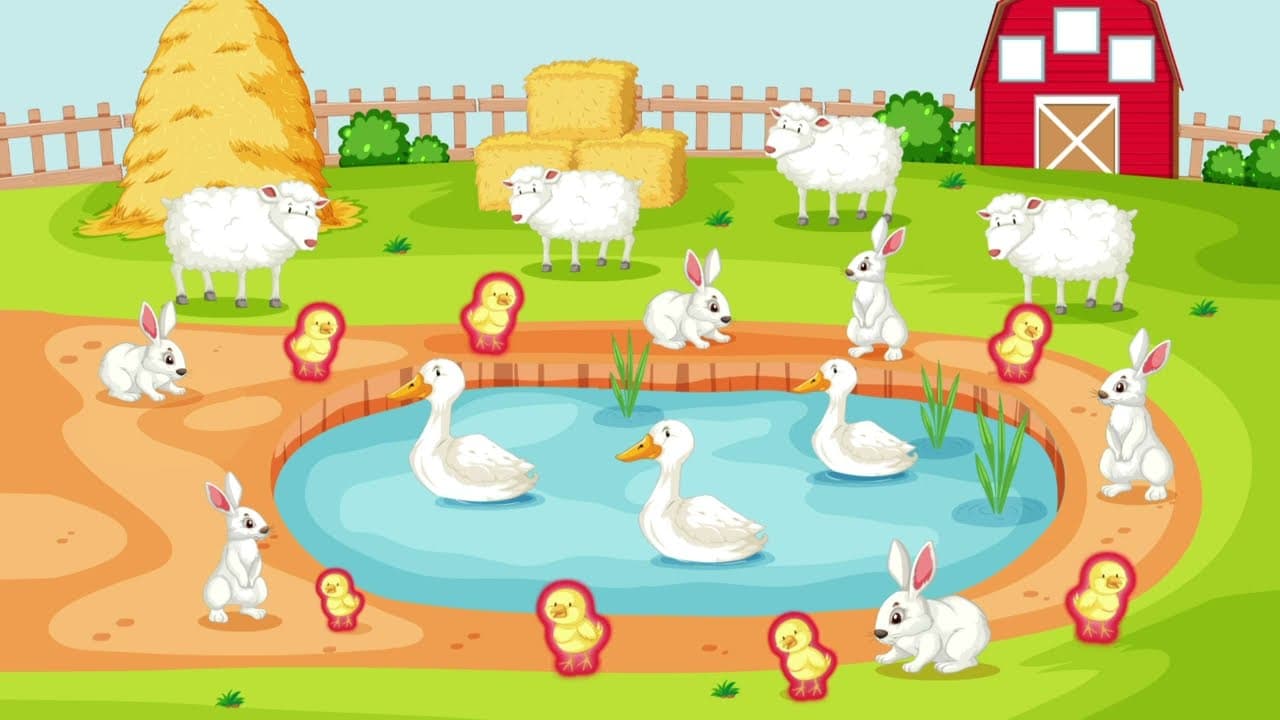
This educational video introduces young learners to basic data collection and representation through a charming farm animal theme. Students are guided through the process of identifying different animals, counting them one by one, and recording the data using two fundamental mathematical tools: tally charts and picture graphs. The video explicitly demonstrates the specific technique for drawing tally marks, highlighting how to bundle counts of five with a diagonal strike. This visual explanation helps students understand grouping strategies that make counting larger numbers efficient. The narrative then progresses to transforming this raw data into a picture graph, showing how symbols can represent quantities in an organized layout. Ideal for early elementary mathematics, this resource serves as an excellent visual model for transitioning from concrete counting to abstract representation. It provides a clear, step-by-step example of how to organize information, making it a perfect anchor for lessons on sorting, categorization, and introductory statistics.

MatholiaChannelMatholiaChannel

2mins 36s

Collecting Data and Making a Bar Chart

Collecting Data and Making a Bar Chart

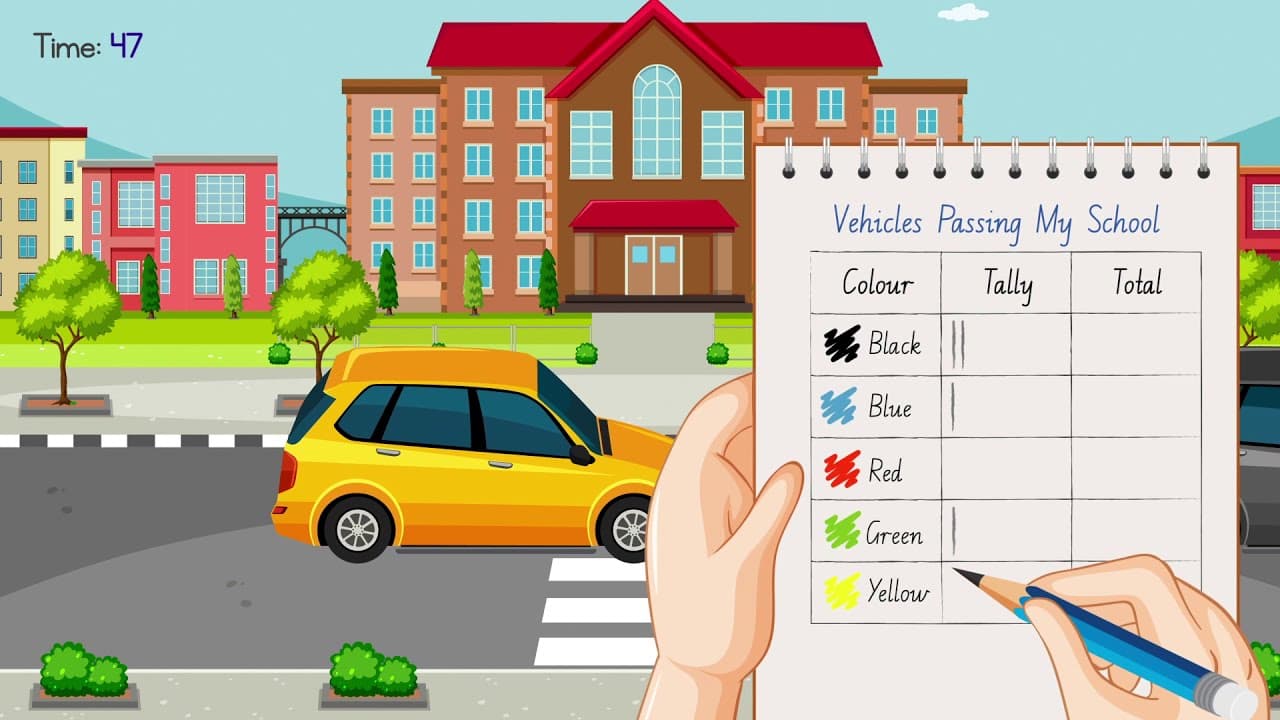
This animated math tutorial guides students through the complete process of data collection and representation, specifically focusing on tally charts and bar graphs. The video begins with a practical, real-world scenario: observing traffic outside a school for one minute to collect data. Viewers watch as vehicles pass by and corresponding tally marks are recorded in a table, demonstrating how to organize raw data in real-time.

MatholiaChannelMatholiaChannel

2mins 28s

Materials

Leaf Count Quest Worksheet

Leaf Count Quest Worksheet

A one-page early elementary math worksheet where students skip count autumn leaves by 2s to find the total, sort leaves by size and color, and write an addition problem combining small and large leaves.

A

ahatcher

Button Detective Exit Ticket

Button Detective Exit Ticket

A single-page exit ticket assessing student ability to classify and identify buttons by color, shape, and number of holes. Features visual button graphics and kid-friendly prompts for early elementary learners.

SB

Sondra Bell

Animal Sorting Crew Worksheet

Animal Sorting Crew Worksheet

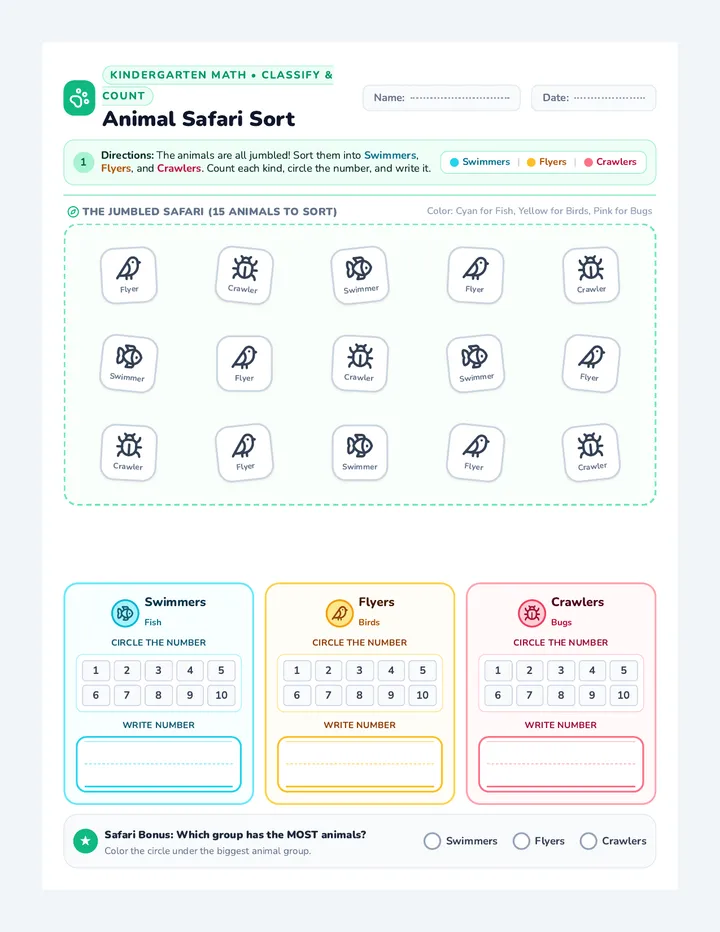
A two-page kindergarten math worksheet where students sort the original set of animals (Swimmers/Fish, Flyers/Birds, and Crawlers/Bugs) from jumbled fields, count each kind, circle the matching numeral on a 1-10 number strip, and write the number.

KH

kesha heath

Coin Dash Activity

Coin Dash Activity

A hands-on, two-page partner math activity featuring a hundreds chart game board played with real coins drawn from a drawstring bag, including tactile identification guides, coin sorting mats, and value-matching challenges.

RH

Rachel Haydon

Leaf Count Quest Worksheet

Leaf Count Quest Worksheet

A revised one-page early elementary math worksheet where students skip count 11 pairs of autumn leaves by 2s to reach 22 total leaves, sort leaves by color (red, orange, yellow with no green leaves), sort by size, and solve an addition problem.

A

ahatcher

Size Sort Anchor Chart

Size Sort Anchor Chart

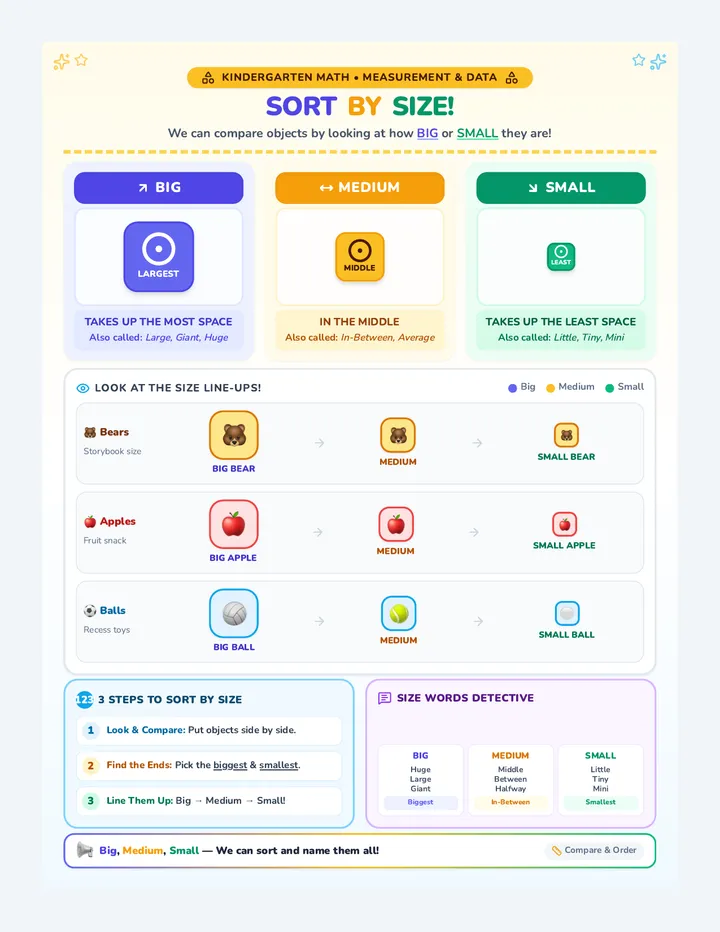
A vibrant, printable kindergarten anchor chart poster designed to teach sorting objects by size. It features visual 3-tier comparisons for big, medium, and small using familiar objects, essential comparative vocabulary, and a three-step sorting strategy.

N

nsuperville

Sequences

Number Quest Workbook

Math Quest Tutoring

A comprehensive 1st and 2nd-grade math tutoring sequence featuring heavily scaffolded worksheets and visual progress monitoring kits. Covers number sense, algebraic operations, geometry, and measurement.

JC

Jennifer Campbell

16
Club Leader Master Guide

Math Mastery Club

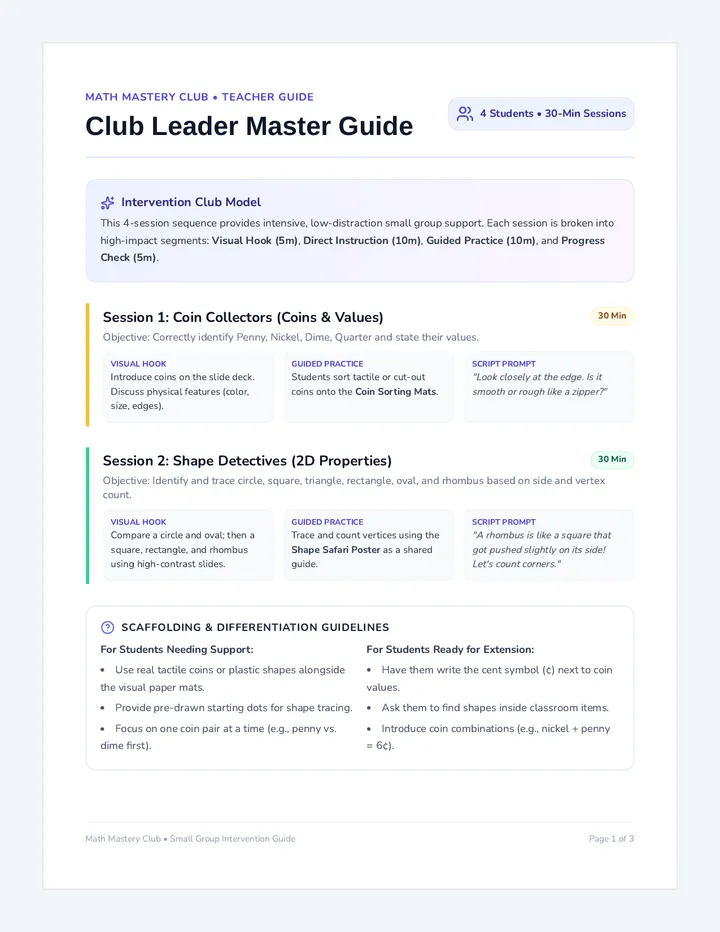
An expanded 14-session, cohesive small-group math intervention sequence for four 1st-grade students. Covers coin values (penny, nickel, dime, quarter) over 3 sessions; 2D shapes (circle, square, triangle, rectangle, oval, rhombus) over 3 sessions; and step-by-step number decomposition to make a ten for addition (3 sessions) and subtraction (3 sessions) to ensure deep student mastery.

K

kurtzm

37
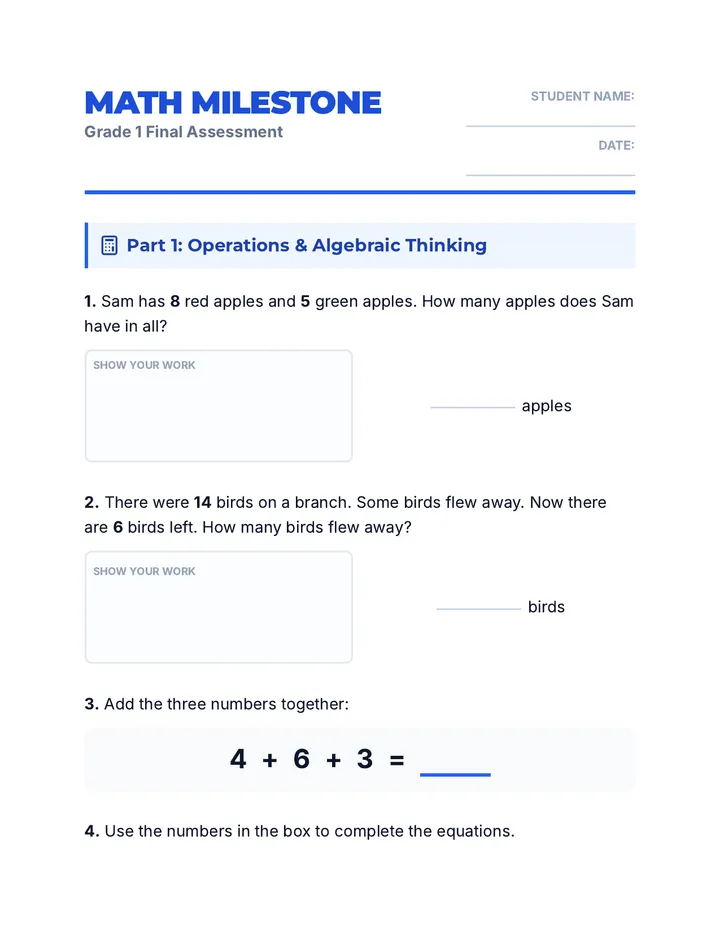
Math Milestone Student Assessment

Math Milestone Evaluation

A series of materials designed to evaluate and document first-grade students' mastery of year-long mathematical standards in preparation for second grade.

TL

Tanya Larson

23
Count the Town Slides

Museum Math Adventure

A series of interactive math lessons themed around a trip to Play Street Museum, specifically designed for preschool students with special needs to practice numbers, addition, and size comparison through imaginative play contexts.

HC

Heather Cortez

9
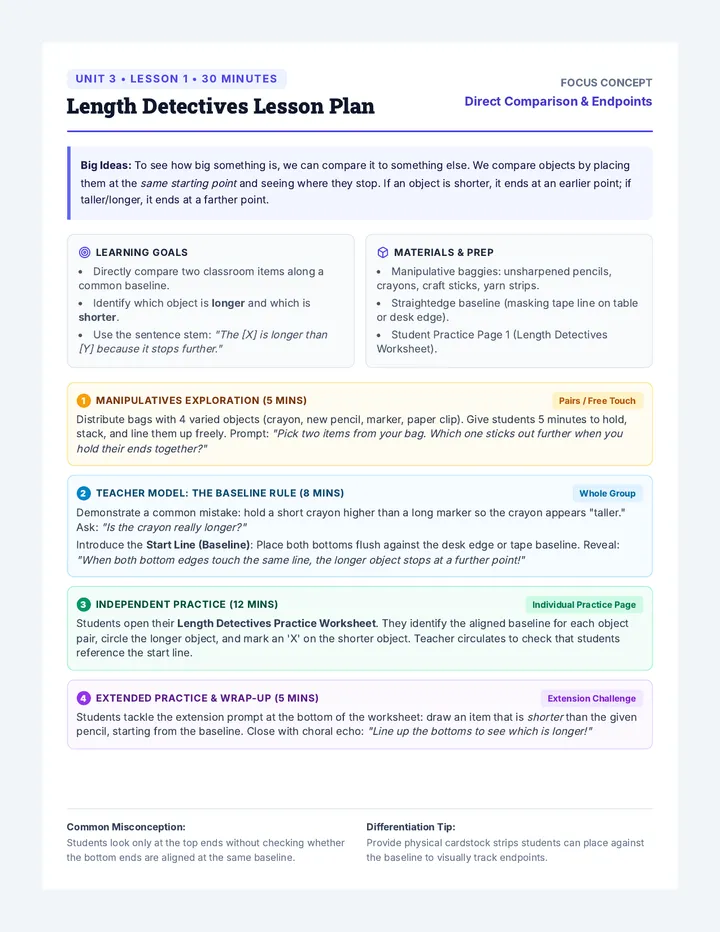
Length Detectives Lesson Plan

Measure and Count Quest

An 8-lesson kindergarten mathematics unit developing foundational concepts of direct length comparison, conservation of number, keeping track to 20, and ordering quantities. Students progress from physical alignment and sorting to abstract numerical comparison and sequence ordering.

V

victoria.lesniak

16
Mate Matcher Worksheet

Quantity Quest

A foundational Pre-K math sequence focusing on one-to-one correspondence and visual comparison of quantities. Students explore concepts of more, less, and fewer through physical pairing, tower building, voting, and balancing scales.

11

Lessons

Work Sample 2 Fruit Circle Graph

Data Detective Lab

A collection of 10 distinct data analysis work samples featuring bar and circle graphs, designed for MCAS Alt portfolio evidence. Each sample focuses on identifying key information, making comparisons, and calculating totals.

EE

Erin Esswein

10
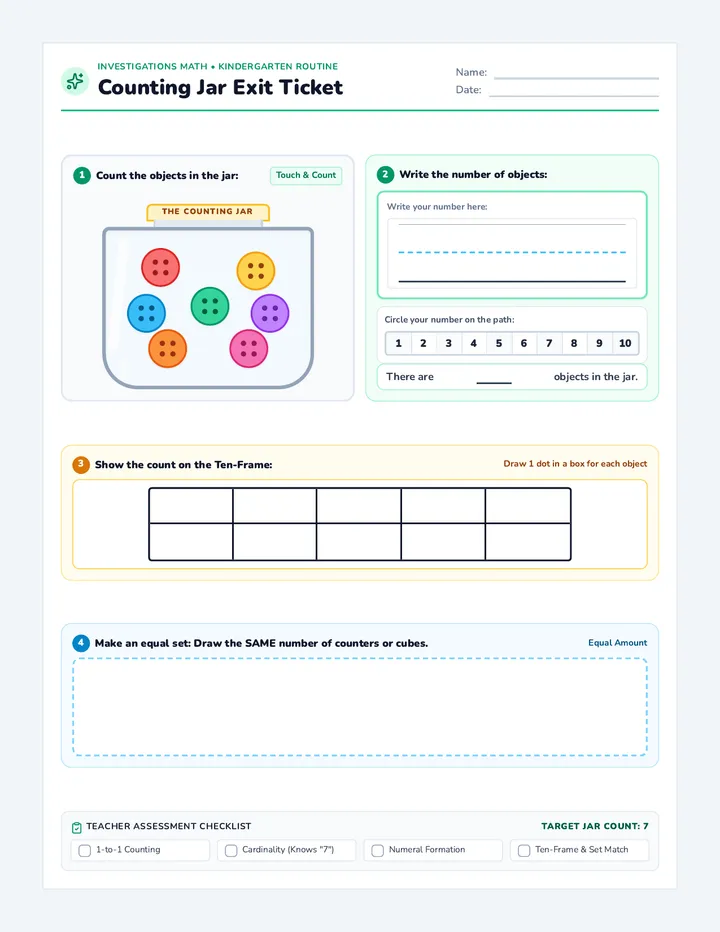
Counting Jar Exit Ticket

Number Trail Explorers

A kindergarten math lesson focused on counting routines, cardinality, and number sequence development up to 20. Students practice recording quantities, counting forwards, and identifying missing numerals in sequence.

SB

Sondra Bell

17
Bubble Lab Facilitator Guide

Bubble Math Lab

An outdoor, hands-on math and science lesson where students use bubble solution to explore measurement, geometric shapes, and counting through guided inquiry and play.

P

powellhuntr

4
Number Ninja Worksheet

Math Mastery Review Pack

A comprehensive end-of-year math review for 1st grade students, aligned with Illinois Learning Standards. The lesson covers all major domains including Operations, Base Ten, Measurement, and Geometry through minimalist, high-legibility worksheets.

C

cbradley

5
Tally Tracker Slides

Tally Tracker Lesson

A math intervention lesson for 1st and 2nd graders that teaches students how to use tally charts to organize and solve addition, subtraction, and comparison word problems within 20.

KW

Katherine Wright

3
Graphing Quest Slides

Data Detectives

A hands-on graphing lesson designed for Essential Skills students, focusing on 1:1 pictographs and bar graphs using snack, color, and pet data with heavy visual supports.

MC

Meg Cade

6