Battery Drain Lab Worksheet
Battery Drain Lab
Indiana Math 8 • Standards 8.DSP.1, 8.DSP.2, 8.DSP.3
Name: ___________________________
Date: _________________ Period: ____
Scenario: A tech club tested how long a tablet can stream video before running out of power. They recorded the streaming time (in hours) and the remaining battery percentage for 10 trials.
| Streaming Time (hr), \(x\) |
1 |
2 |
2 |
3 |
4 |
5 |
6 |
7 |
8 |
9 |
| Battery Remaining (%), \(y\) |
88 |
76 |
81 |
68 |
62 |
50 |
44 |
32 |
26 |
14 |
Part 1: Graph the Scatter Plot & Draw a Trend Line
Use a ruler for your trend line
0 1 2 3 4 5 6 7 8 9 10 0 10 20 30 40 50 60 70 80 90 100 Streaming Time (hours) Battery Remaining (%)
Part 2: Analyze the Pattern & Fit a Trend Line
1. Plot all 10 points from the table. Describe the association (positive/negative, linear/nonlinear, any outliers):
2. Draw a straight trend line that models the data. Explain how you decided where to place your line:
Battery Drain Lab — Modeling & Predictions
Name: ___________________________
Part 3: Find the Equation of Your Trend Line
Step A: Pick two points on your trend line:
Point 1: ( _____ , _____ ) Point 2: ( _____ , _____ )
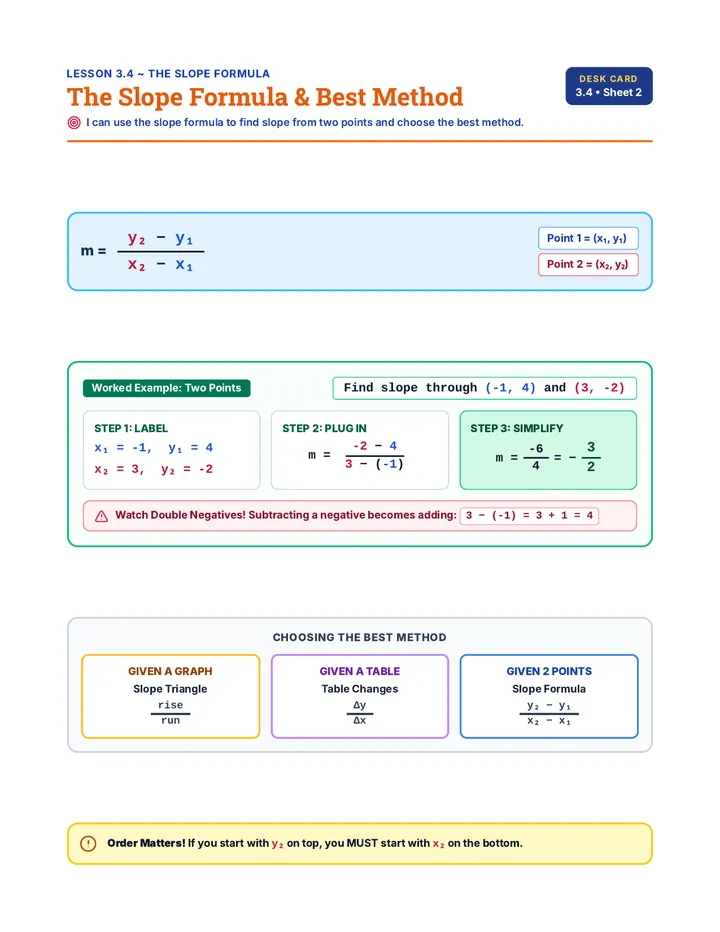
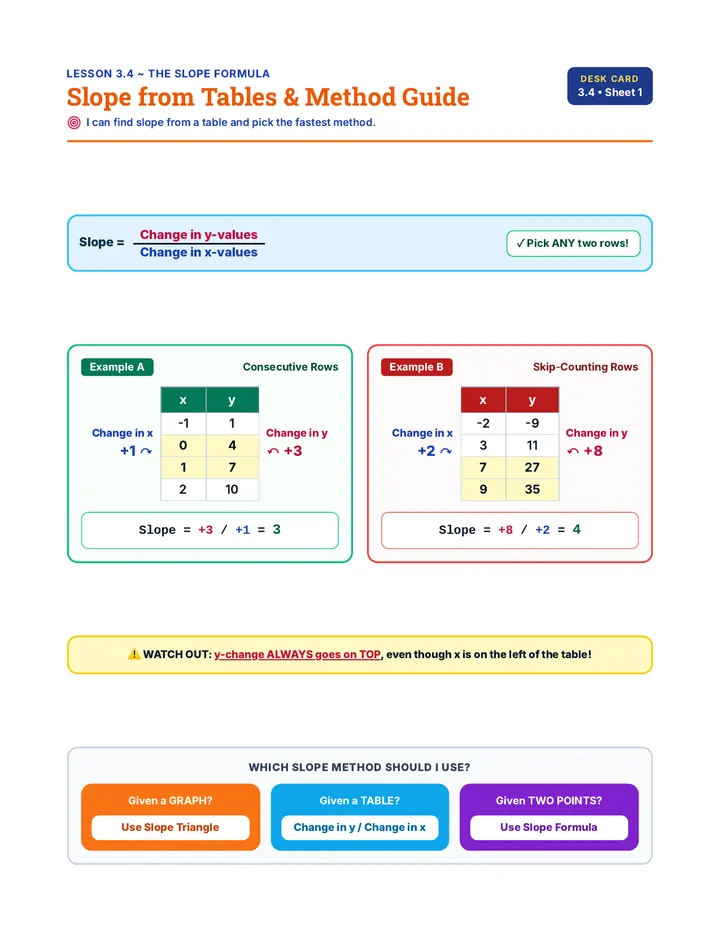
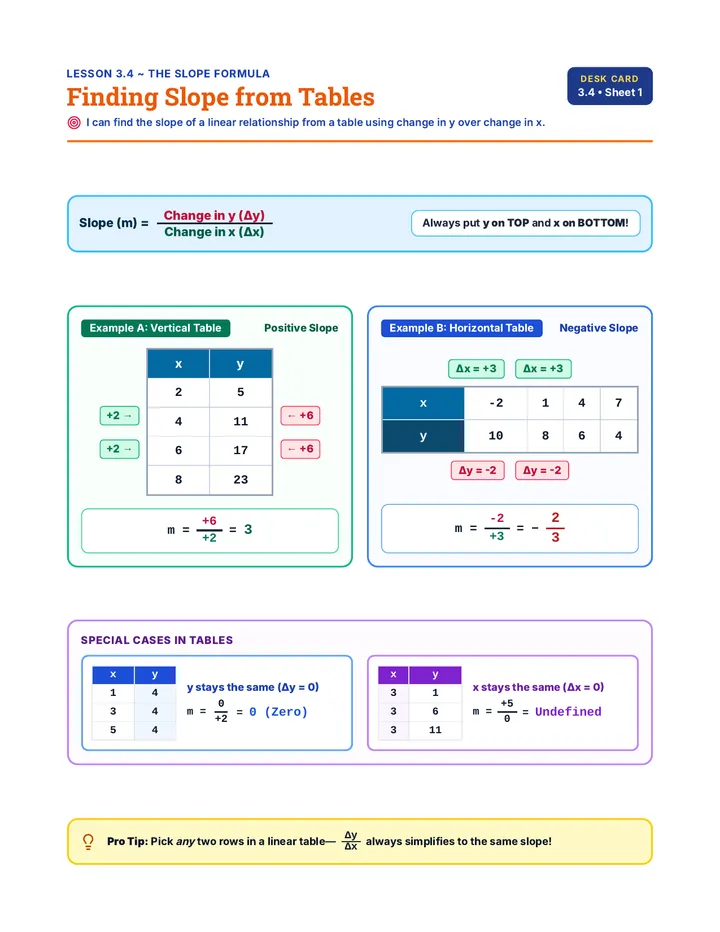
Step B: Calculate the slope using \(m = \frac{y_2 - y_1}{x_2 - x_1}\).
Step C: Find the \(y\)-intercept \(b\) using \(y = mx + b\).
Step D: Write your trend line equation in slope-intercept form: \(y =\) _________ \(x +\) _________
Part 4: Interpret the Model in Context
1. What does the slope of your trend line tell you about the tablet's battery?
2. What does the \(y\)-intercept represent in this situation?
Part 5: Make Predictions Using Your Equation
1. Predict the battery percentage remaining after 10 hours of streaming. Show your work.
2. Predict after how many hours the battery will reach 0%. Show your work.