Tables Mapping Reference Sheet Lesson 3.1 ~ Understanding Functions
Functions: Tables & Mappings
I can determine if a given set of data is a function.
Desk Card
3.1 • Sheet 1
The Golden Rule of Functions
Every Input (x) has EXACTLY ONE Output (y).
Domain (D)
All x / Inputs
Range (R)
All y / Outputs
Example A FUNCTION
Input (x)
Output (y)
2
4
4
6
6
8
8
10
2 4 6 8 4 6 8 10
D: {2, 4, 6, 8}
R: {4, 6, 8, 10}
Every input has 1 arrow going out.
Example B NOT A FUNCTION
3 5 1 3 2 4
D: {3, 5}
R: {1, 2, 3, 4}
Input 3 repeats with different outputs (1 and 3).
Example C (Tricky!) FUNCTION
5 10 15 7
D: {5, 10, 15}
R: {7}
Same output (7) is OK! Each input has only 1 arrow.
Set Notation Tip
Use curly braces { }. Write repeated numbers only once !
Inputs repeat? ✗ Check outputs!
Vertical Line Test Reference Sheet Lesson 3.1 ~ Understanding Functions
The Vertical Line Test
I can determine if a graph represents a function.
Desk Card
3.1 • Sheet 2
How to Test Any Graph
Slide your pencil straight up-and-down across the graph.
Hits 1 point
Hits 2+ points
1. U-Shape / Curve ✓ FUNCTION
Every vertical line hits only 1 point.
2. Sideways V / Circle ✗ NOT A FUNCTION
Vertical line hits 2 points (same x, two y's).
3. Slanted Line ✓ FUNCTION
Vertical line hits only 1 point everywhere.
4. Stacked Dots ✗ NOT A FUNCTION
Two dots share the same x-value (stacked).
Watch Out: Vertical vs. Horizontal Lines
Horizontal line (—): ✓ IS a function. | Vertical line (|): ✗ NOT a function.
Proportional Checks Reference Sheet Lesson 3.2 ~ Proportional Relationships
Is It Proportional? (3 Ways)
I can recognize proportional relationships in tables, graphs, and equations.
Desk Card
3.2 • Sheet 1
1. Tables
Ratio y / x is the same for every pair (x ≠ 0).
2. Graphs
Straight line AND passes through (0, 0) .
3. Equations
Form y = mx (nothing added or subtracted).
1. Checking a Table — Divide y ÷ x
✓ PROPORTIONAL y = 4x
x
y
y / x
0
0
--
1
4
4/1 = 4
2
8
8/2 = 4
3
12
12/3 = 4
All y/x values equal 4!
✗ NOT PROPORTIONAL
x
y
y / x
0
0
--
1
2
2/1 = 2
2
4
4/2 = 2
3
8
8/3 ≠ 2
y/x changes! Not constant.
2. Checking a Graph — Straight Line Through (0, 0)
✓ YES
Straight line AND hits (0, 0).
✗ NO
Misses the origin (0, 0).
3. Checking an Equation — Form y = mx
✓ YES: y = 3x | y = -2/3 x
✗ NO: y = 3x + 1
Unit Rate Graphing Reference Sheet Lesson 3.2 ~ Proportional Relationships
Unit Rate & Graphing y = mx
I can find unit rate m, write y = mx, graph, and compare relationships.
Desk Card
3.2 • Sheet 2
Skill 1: Write y = mx from a Graph m = Unit Rate = y / x
(1, 3) (3, 9) Seconds (x)
Step 1: Pick any point on the line
Point: (3, 9)
Step 2: Divide y ÷ x to find m
m = 9 ÷ 3 = 3
Step 3: Write y = mx y = 3x
Skill 2: Graph y = 5x Use x = {-2, -1, 0, 1, 2}
x
y = 5x
Point
-2
5(-2) = -10
(-2,-10)
-1
5(-1) = -5
(-1, -5)
0
5(0) = 0
(0, 0)
1
5(1) = 5
(1, 5)
2
5(2) = 10
(2, 10)
1. Plug each x into 5x.
2. Plot points & connect with a straight line.
Unit Rate: m = 5
Skill 3: Compare Unit Rates (m) Find m for BOTH, then compare!
McDonald Family
y = 1.25x
m = 1.25 mi/min
Jefferson Family
Point (4, 3) → 3/4
m = 0.75 mi/min
Compare:
1.25 > 0.75
McDonald is faster!
Slope Types Triangles Reference Sheet Lesson 3.3 ~ Slope from Graphs
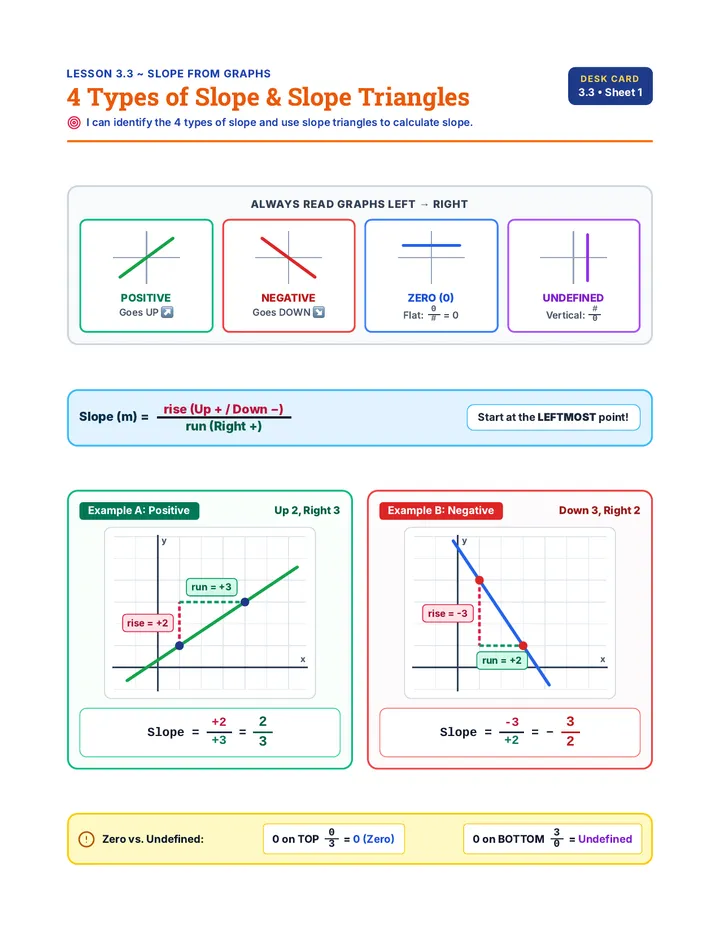
4 Types of Slope & Slope Triangles
I can identify the 4 types of slope and use slope triangles to calculate slope.
Desk Card
3.3 • Sheet 1
Always Read Graphs Left → Right
POSITIVE
Goes UP ↗
NEGATIVE
Goes DOWN ↘
ZERO (0)
Flat: 0 / # = 0
UNDEFINED
Vertical: # / 0
Slope (m) = rise (Up + / Down −) run (Right +)
Start at the LEFTMOST point!
Example A: Positive Up 2, Right 3
x y rise = +2 run = +3
Slope = +2 / +3 = 2/3
Example B: Negative Down 3, Right 2
x y rise = -3 run = +2
Slope = -3 / +2 = -3/2
Zero vs. Undefined:
0 on TOP (0/3) = 0 (Zero)
0 on BOTTOM (3/0) = Undefined
Graphing With Slope Reference Sheet Lesson 3.3 ~ Slope from Graphs
Graphing Points & Drawing Slope
I can find slope from points/tables and graph a line with a given slope.
Desk Card
3.3 • Sheet 2
Skill 1: Given Points or a Table → Find Slope Points: (0, 1) and (2, 4)
Step 1: Plot 2 points from the problem or table on the grid.
Step 2: Start at leftmost point (0, 1). Count rise (+3) and run (+2).
Slope = +3 / +2 = 3/2
x y +3 +2
Skill 2: Given a Slope → Draw a Line Example: Graph slope = 2
x y +2 +1
Step 1: Put a starting dot anywhere on a grid corner (if none is given).
Step 2: Write a whole number over 1: 2 = 2/1.
Step 3: Rise +2, Run +1. Repeat & connect!
Whole Number Slope
3 = 3/1 | -5 = -5/1
Negative Fraction Slope
-1/4 = (-1)/4 = 1/(-4)
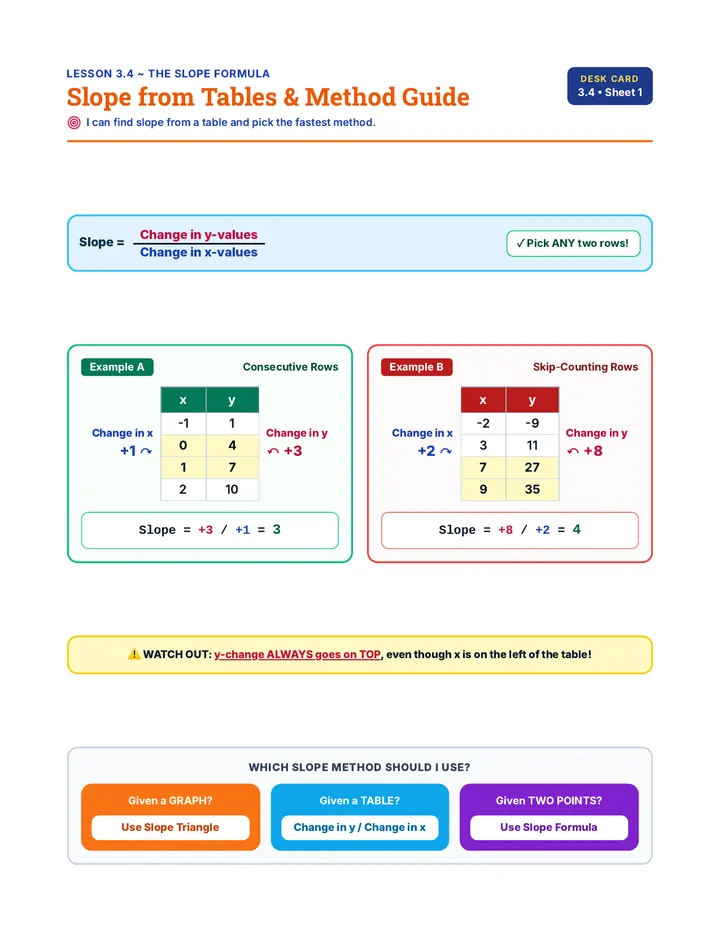
Slope From Tables Reference Sheet Lesson 3.4 ~ The Slope Formula
Slope from Tables & Method Guide
I can find slope from a table and pick the fastest method.
Desk Card
3.4 • Sheet 1
Slope = Change in y-values Change in x-values
✓ Pick ANY two rows!
Example A Consecutive Rows
Change in x
+1 ↷
Change in y
↶ +3
Slope = +3 / +1 = 3
Example B Skip-Counting Rows
Change in x
+2 ↷
Change in y
↶ +8
Slope = +8 / +2 = 4
⚠️ WATCH OUT: y-change ALWAYS goes on TOP, even though x is on the left of the table!
Which Slope Method Should I Use?
Given a GRAPH?
Use Slope Triangle
Given a TABLE?
Change in y / Change in x
Given TWO POINTS?
Use Slope Formula
Slope From Tables Reference Sheet Lesson 3.4 ~ The Slope Formula
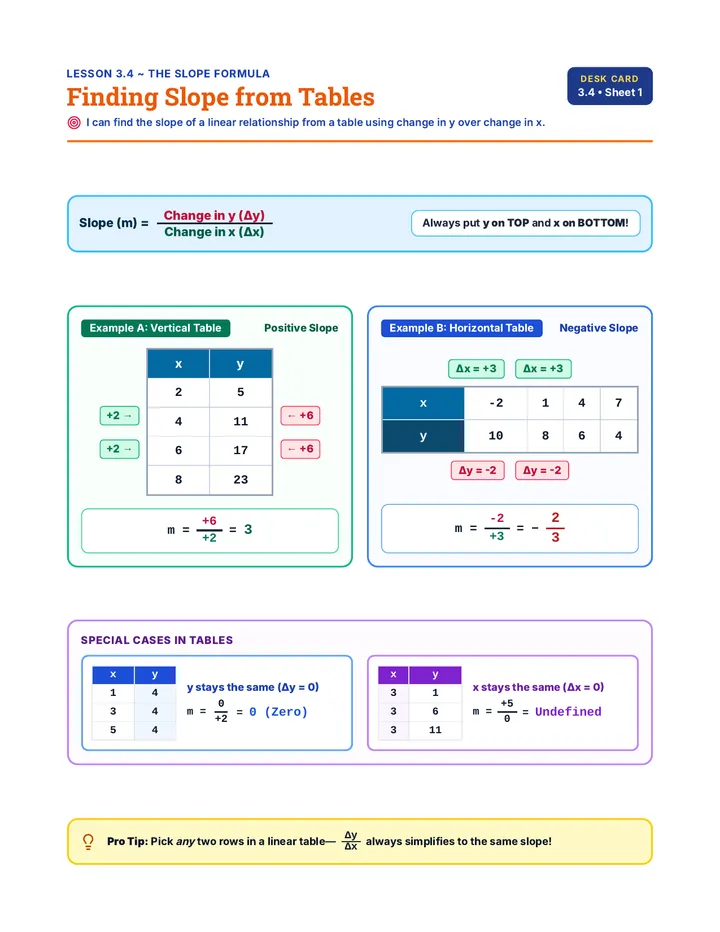
Finding Slope from Tables
I can find the slope of a linear relationship from a table using Δy / Δx.
Desk Card
3.4 • Sheet 1
Slope (m) = Change in y (Δy) Change in x (Δx)
Always put y on TOP and x on BOTTOM !
Example A: Vertical Table Positive Slope
+2 →
+2 →
← +6
← +6
m = +6 / +2 = 3
Example B: Horizontal Table Negative Slope
Δx = +3 Δx = +3
Δy = -2 Δy = -2
m = -2 / +3 = -2/3
Special Cases in Tables
y stays the same (Δy = 0)
m = 0 / +2 = 0 (Zero)
x stays the same (Δx = 0)
m = +5 / 0 = Undefined
Pro Tip: You can pick any two rows in a linear table—even if they aren't next to each other, Δy / Δx always simplifies to the same slope!
Slope Formula Reference Sheet Lesson 3.4 ~ The Slope Formula
Using the Slope Formula
I can find the slope of a line using two ordered pairs.
Desk Card
3.4 • Sheet 2
The Slope Formula
Step 1: Label your points (x₁, y₁) and (x₂, y₂).
Slope = y₂ − y₁ x₂ − x₁
Example A: Standard
x₁ y₁ (3, 2) and x₂ y₂ (8, 5)
5 − 2
→
3
→
Slope = 3/5
Example B: Subtracting Negatives!
x₁ y₁ (1, -1) and x₂ y₂ (3, -5)
-5 − (-1)
→
-5 + 1 = -4
→
Slope = -2
Example C: Undefined (0 on Bottom)
(6, -2) and (6, 4)
(4 − (-2)) / (6 − 6) = 6 / 0 = undefined
Example D: Zero Slope (0 on Top)
(5, 3) and (-2, 3)
(3 − 3) / (-2 − 5) = 0 / -7 = 0
Minus a Negative = PLUS: − (−1) = + 1 | You can’t divide by 0!
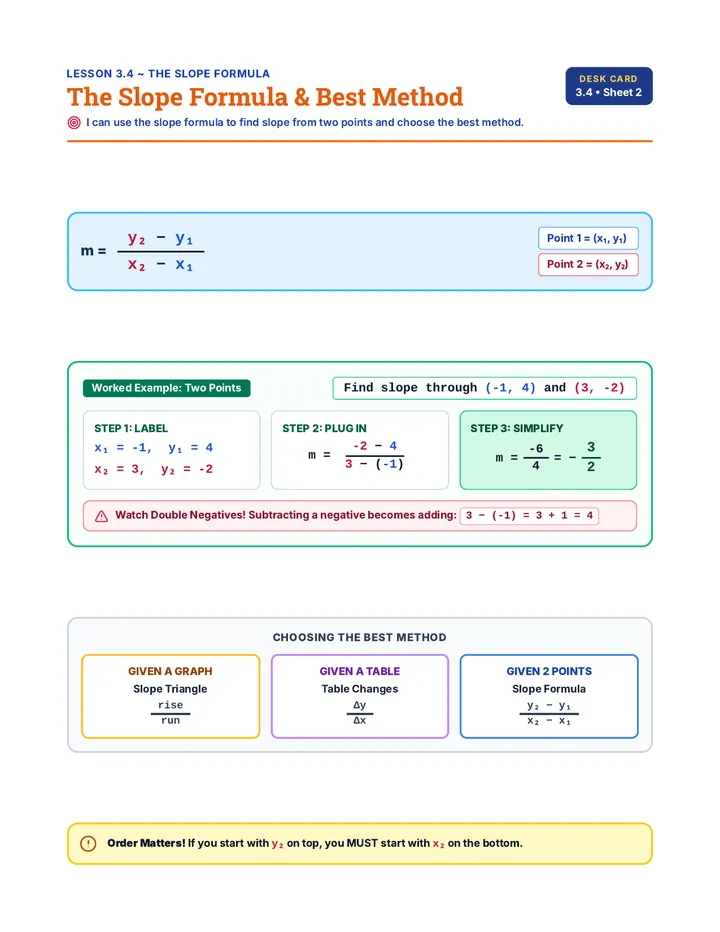
Slope Formula Reference Sheet Lesson 3.4 ~ The Slope Formula
The Slope Formula & Best Method
I can use the slope formula to find slope from two points and choose the best method.
Desk Card
3.4 • Sheet 2
m = y₂ − y₁ x₂ − x₁
Point 1 = (x₁, y₁)
Point 2 = (x₂, y₂)
Worked Example: Two Points Find slope through (-1, 4) and (3, -2)
Step 1: Label
x₁ = -1, y₁ = 4
x₂ = 3, y₂ = -2
Step 2: Plug In
m = -2 − 4 3 − (-1)
Step 3: Simplify
m = -6 / 4 = -3/2
Watch Double Negatives! Subtracting a negative becomes adding: 3 − (-1) = 3 + 1 = 4
Choosing the Best Method
Given a Graph
Slope Triangle
rise / run
Given a Table
Table Changes
Δy / Δx
Given 2 Points
Slope Formula
(y₂ − y₁) / (x₂ − x₁)
Order Matters! If you start with y₂ on top, you MUST start with x₂ on the bottom.