Scatter Plot Study Guide A
Indiana Math 8 • 8.DSP.1–8.DSP.3
Scatter Plot Study Guide — Form A
Name: ___________________________
Date: ______________
1. Vocabulary What does a gap tell you about the data on a scatter plot?
The scatter plot shows the number of hours Mateo practiced free throws each week and his free-throw percentage. Use the scatter plot for 2–4.
0 2 4 6 8 10 Practice Time (hours) 0 40 50 60 70 80 90 100 Free-Throw Percentage (%)
-
What type of relationship do you see between hours of practice and free-throw percentage?
-
Use the \(y\)-intercept and the point \((5, 70)\) from the line on the scatter plot. What is the equation of the trend line?
-
Predict Mateo's free-throw percentage when he practices for 9 hours.
Scatter Plot Study Guide — Form A
Name: ___________________________
- Describe the relationship between the data in the scatter plot.
x y
- Select all the observations that are true about the scatter plot.
Most phones had between 2 and 8 hours of screen time.
Remaining battery life was between 10% and 20% for all phones.
There is an outlier at about \((8, 85)\).
There is a positive association between screen time and remaining battery.
0 2 4 6 8 10 Daily Screen Time (hours) 0 20 40 60 80 100 Remaining Battery (%)
Scatter Plot Study Guide B
Indiana Math 8 • 8.DSP.1–8.DSP.3
Scatter Plot Study Guide — Form B
Name: ___________________________
Date: ______________
1. Vocabulary What does an outlier tell you about the data on a scatter plot?
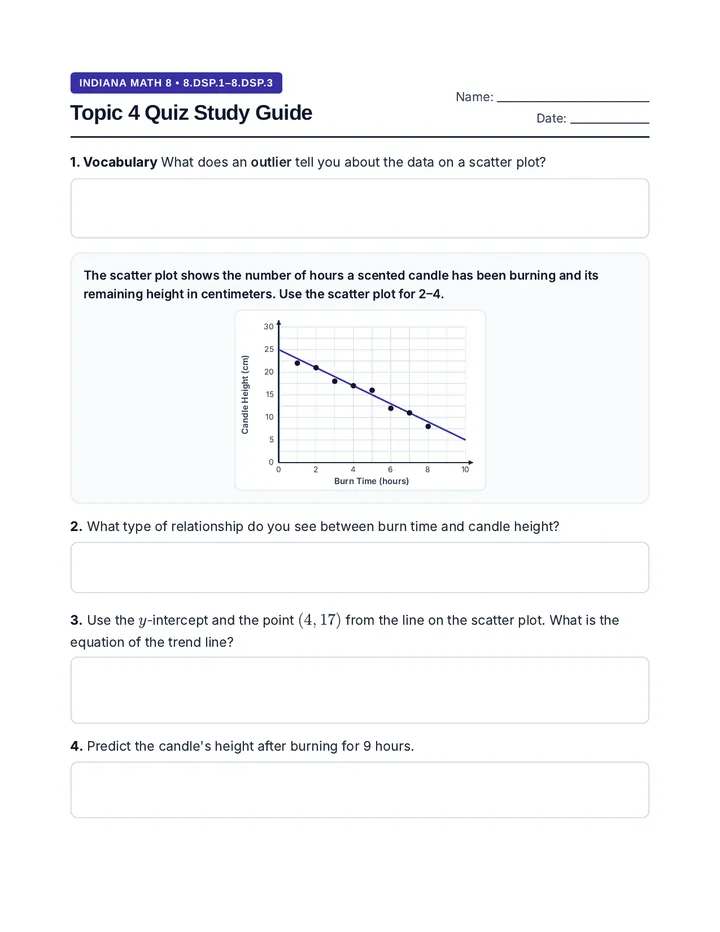
The scatter plot shows the number of hours a scented candle has been burning and its remaining height in centimeters. Use the scatter plot for 2–4.
0 2 4 6 8 10 Burn Time (hours) 0 5 10 15 20 25 30 Candle Height (cm)
-
What type of relationship do you see between burn time and candle height?
-
Use the \(y\)-intercept and the point \((4, 17)\) from the line on the scatter plot. What is the equation of the trend line?
-
Predict the candle's height after burning for 9 hours.
Scatter Plot Study Guide — Form B
Name: ___________________________
- Describe the relationship between the data in the scatter plot.
x y
- Select all the observations that are true about the scatter plot.
Most students studied between 20 and 45 minutes.
Every student scored at least 70 on the quiz.
There is an outlier at about \((45, 55)\).
There is a weak positive association between study time and quiz score.
0 10 20 30 40 50 Study Time (minutes) 0 50 60 70 80 90 100 Quiz Score
Scatter Plot Answer Key
Teacher Answer Key • Indiana Math 8
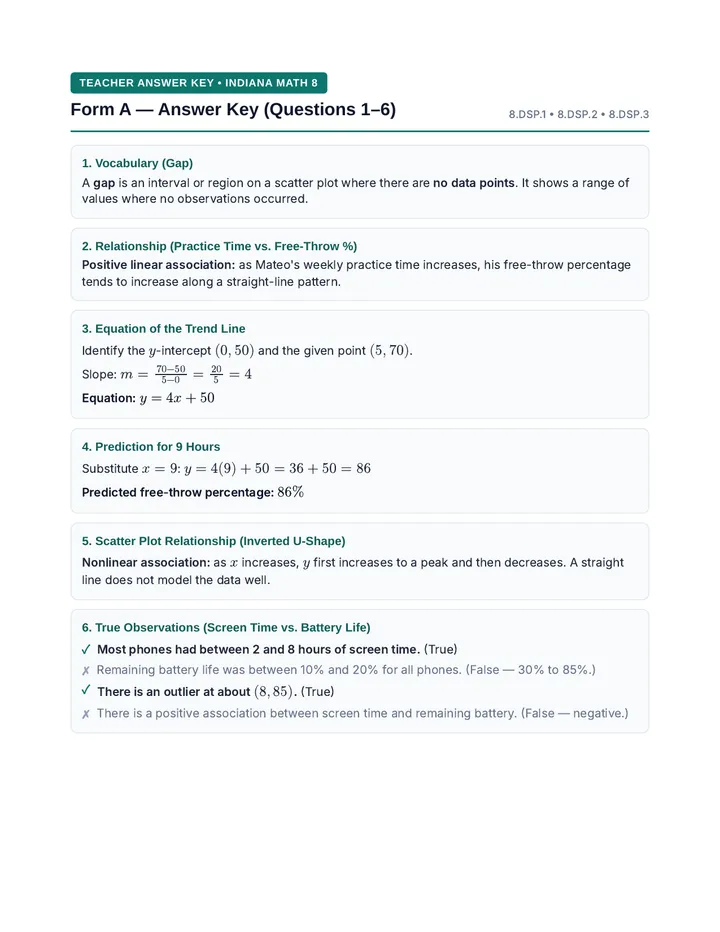
Form A — Answer Key
8.DSP.1 • 8.DSP.2 • 8.DSP.3
1. Vocabulary (Gap)
A gap is an interval or region on a scatter plot where there are no data points. It shows a range of values where no observations occurred.
2. Relationship (Practice Time vs. Free-Throw %)
Positive linear association: as Mateo's weekly practice time increases, his free-throw percentage tends to increase along a straight-line pattern.
3. Equation of the Trend Line
Identify the \(y\)-intercept \((0, 50)\) and the given point \((5, 70)\).
Slope: \(m = \frac{70 - 50}{5 - 0} = \frac{20}{5} = 4\)
Equation: \(y = 4x + 50\)
4. Prediction for 9 Hours
Substitute \(x = 9\): \(y = 4(9) + 50 = 36 + 50 = 86\)
Predicted free-throw percentage: \(86\%\)
5. Scatter Plot Relationship (Inverted U-Shape)
Nonlinear association: as \(x\) increases, \(y\) first increases to a peak and then decreases. A straight line does not model the data well.
6. True Observations (Screen Time vs. Battery Life)
- ✓ Most phones had between 2 and 8 hours of screen time. (True — all 10 data points fall from \(x = 2\) to \(x = 8\).)
- ✗ Remaining battery life was between 10% and 20% for all phones. (False — battery life ranged from 30% to 85%.)
- ✓ There is an outlier at about \((8, 85)\). (True — this point sits far above the negative trend line.)
- ✗ There is a positive association between screen time and remaining battery. (False — it is a negative association.)
Teacher Answer Key • Indiana Math 8
Form B — Answer Key
8.DSP.1 • 8.DSP.2 • 8.DSP.3
1. Vocabulary (Outlier)
An outlier is a data point that lies far away from the rest of the data or does not follow the overall pattern of the scatter plot.
2. Relationship (Burn Time vs. Candle Height)
Negative linear association: as burn time increases, the remaining height of the candle decreases along a straight-line pattern.
3. Equation of the Trend Line
Identify the \(y\)-intercept \((0, 25)\) and the given point \((4, 17)\).
Slope: \(m = \frac{17 - 25}{4 - 0} = \frac{-8}{4} = -2\)
Equation: \(y = -2x + 25\)
4. Prediction for 9 Hours
Substitute \(x = 9\): \(y = -2(9) + 25 = -18 + 25 = 7\)
Predicted candle height: \(7\text{ cm}\)
5. Scatter Plot Relationship (Random Scatter)
No association: the points are scattered randomly with no clear increasing, decreasing, or curved pattern between \(x\) and \(y\).
6. True Observations (Study Time vs. Quiz Score)
- ✓ Most students studied between 20 and 45 minutes. (True — 10 of the 11 data points are between 20 and 45 minutes.)
- ✗ Every student scored at least 70 on the quiz. (False — three students scored below 70, including 55, 62, and 65.)
- ✓ There is an outlier at about \((45, 55)\). (True — this point is far below the overall upward trend.)
- ✓ There is a weak positive association between study time and quiz score. (True — scores generally rise with study time, with moderate spread.)