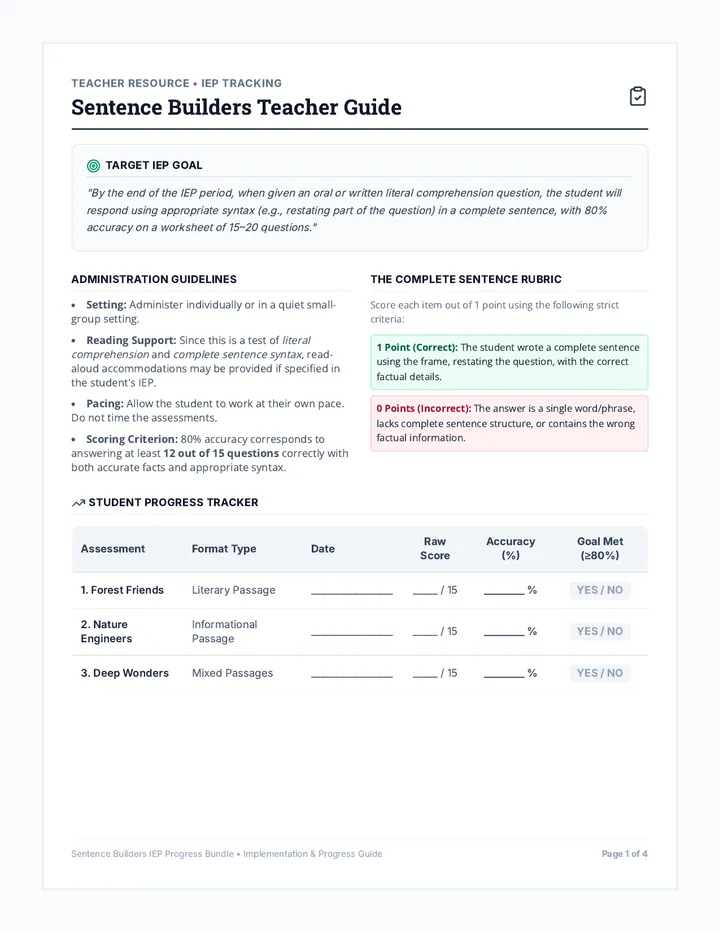
Navigator Teacher Guide
A detailed teacher guide for teaching inequalities on a number line, featuring specific IEP accommodations, step-by-step procedures, and visual memory aids for students.
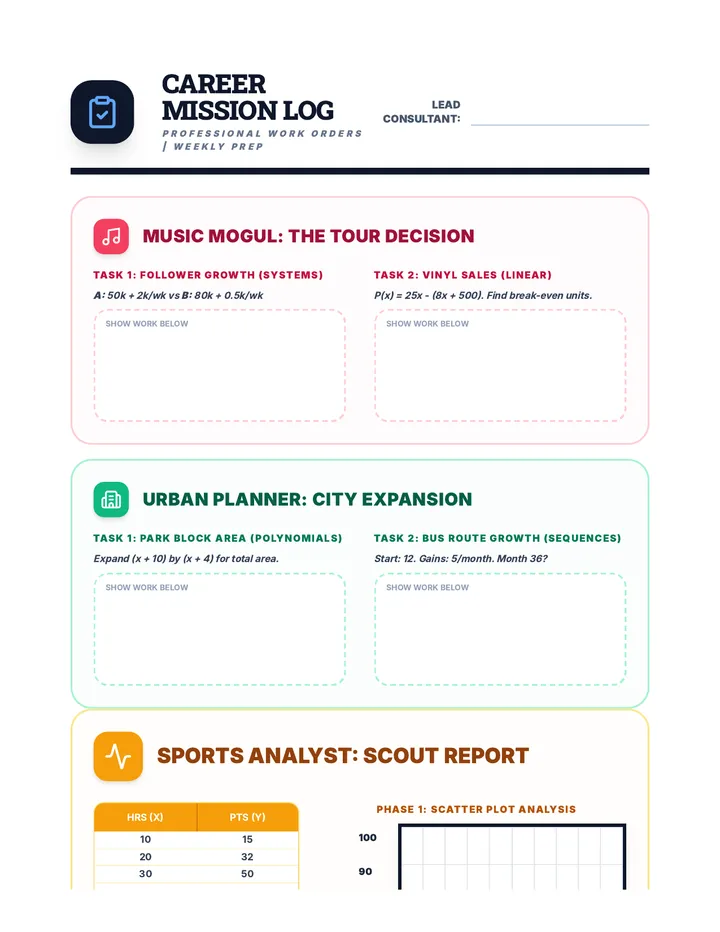
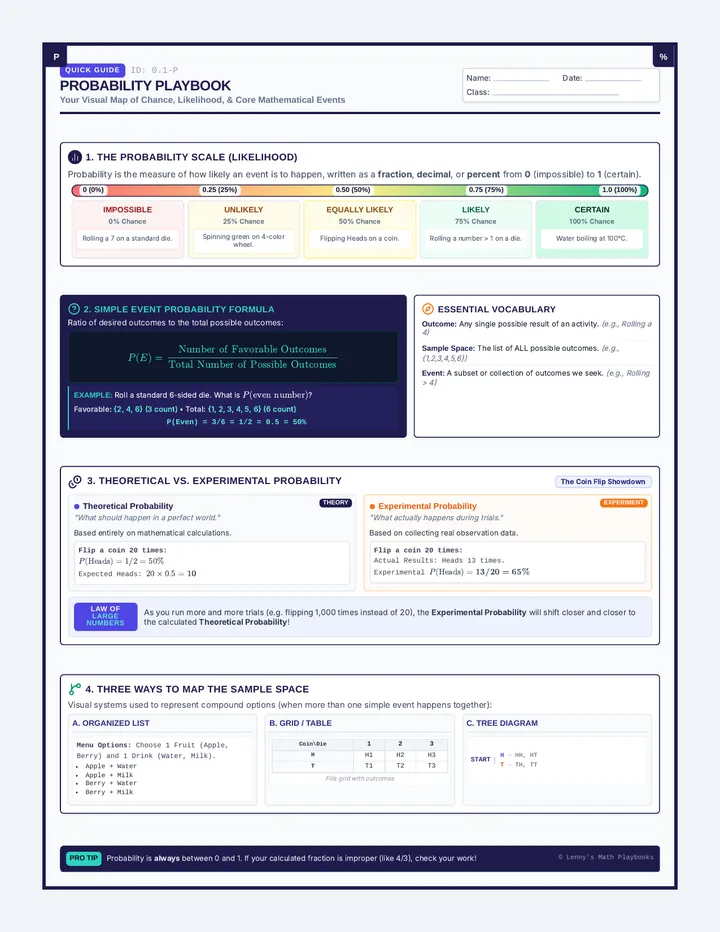
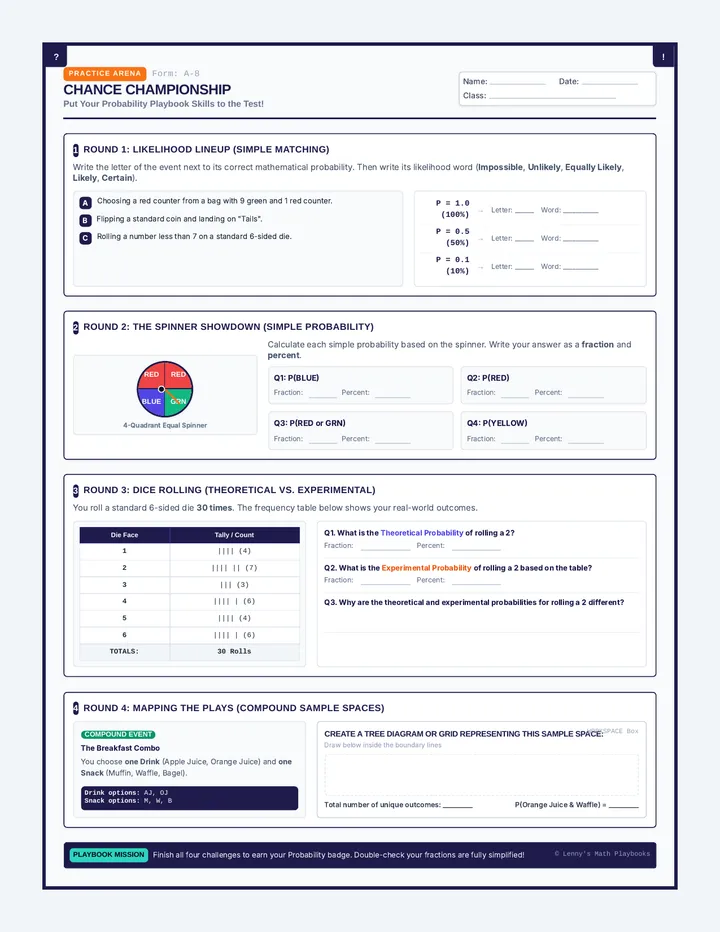
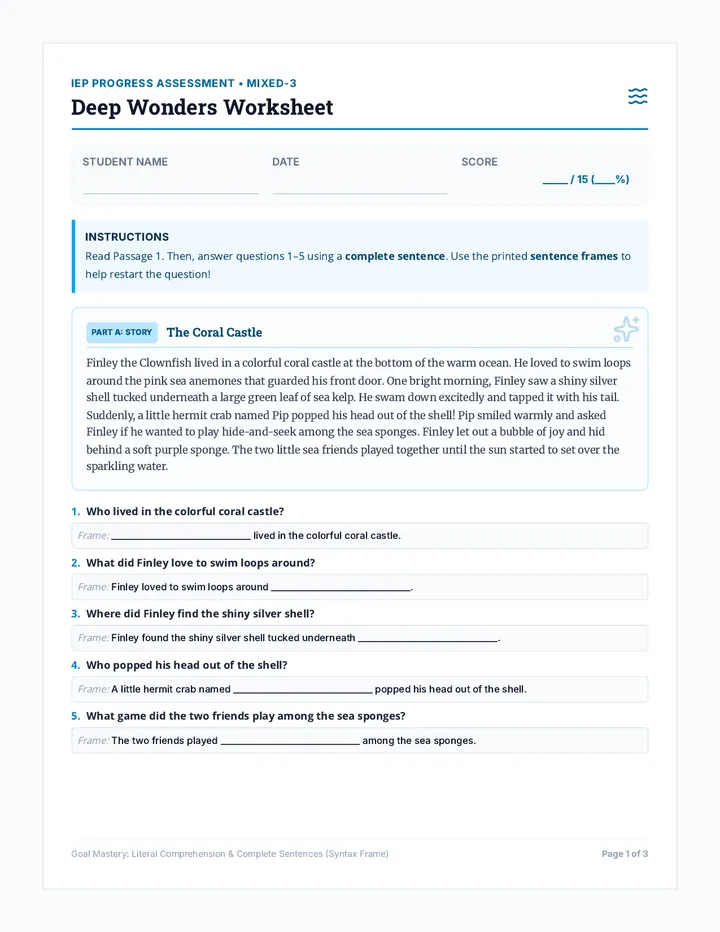
Number Line Roadmap Worksheet
A highly scaffolded practice worksheet for graphing and writing inequalities. It includes a visual anchor chart for reference, clear number lines, and step-by-step checklists to support IEP students. Now with expanded practice problems and optimized for two pages. Uses SVG for rock-solid visual alignment.
Navigator Slides
An instructional slide deck for teaching inequalities on a number line. Features high-contrast visuals, clear font sizes (24px+), and step-by-step graphing demonstrations for IEP students.
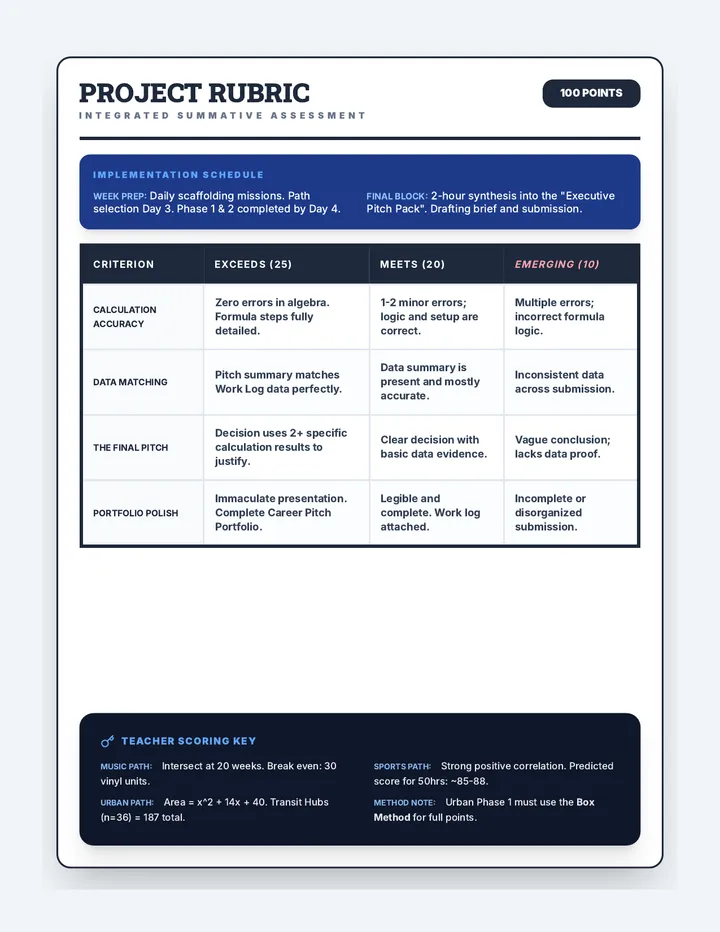
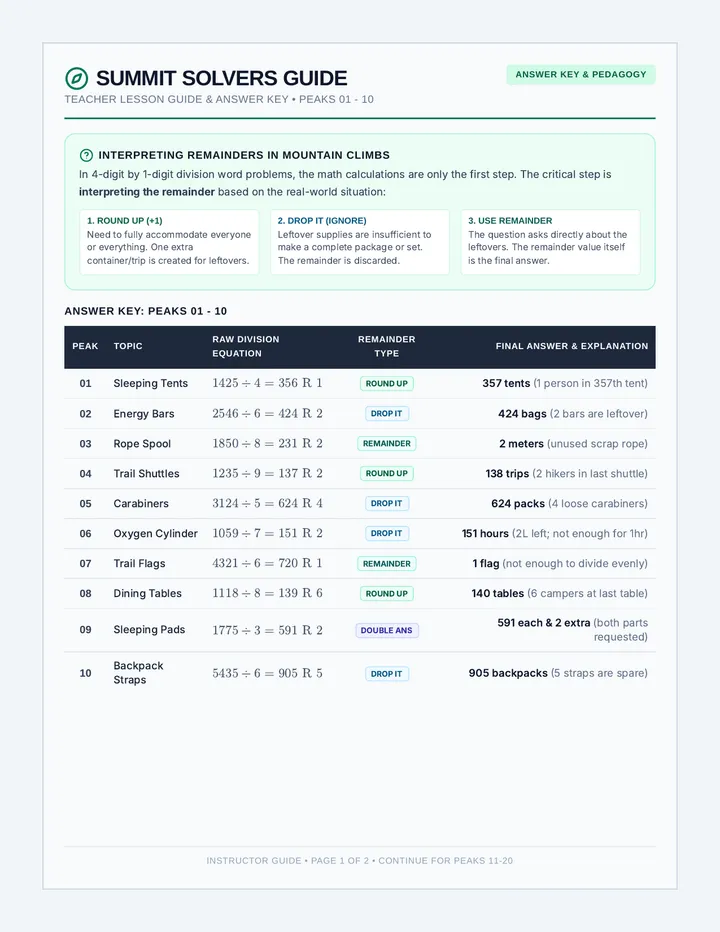
Roadmap Answer Key
The updated answer key for the Number Line Roadmap Worksheet, matching the expanded set of practice problems.