Lenny.com
Explore
Create
ActivitiesNewMathEnglish Language ArtsScience & EngineeringSocial StudiesGlobal LanguagesHealth & Physical EducationSpecial EducationCounseling & Life SkillsArts & CreativityESL
Lenny.com
Lenny.com
Explore
Create
ActivitiesNewMathEnglish Language ArtsScience & EngineeringSocial StudiesGlobal LanguagesHealth & Physical EducationSpecial EducationCounseling & Life SkillsArts & CreativityESL
Lenny.com
Lenny.com

Solutions

Lenny for EducatorsLenny for SchoolsLenny for Districts

Product

ExploreSign inCreateSupportAbout

Resources

Getting startedMTSS Acceleration Program

© 2026 Lenny Learning Inc.

TermsPrivacyAccessibility
LinkedInInstagramX
Lenny

Represent and Interpret Data

Categorical and numerical data organization using tally charts, pictographs, and bar graphs. Focuses on interpreting visual displays to solve comparison problems and summarize data sets.

MathNumbers & CountingCounting ObjectsNumber NamesComparing NumbersNumber OperationsCounting SequenceNumbers 0-10Place Value Understanding and SystemAdd and Subtract Within 20Addition and Subtraction ConceptsAddition and Subtraction EquationsAddition and Subtraction ProblemsFoundations for MultiplicationMultiplication and Division PropertiesMultiply and Divide Within 100Multiplication and Division ProblemsFactors and MultiplesProperties of OperationsPatterns and RelationshipsGenerate and Analyze PatternsMulti-Digit ArithmeticPlace Value OperationsMulti-Digit and Decimal OperationsNumerical ExpressionsFour Operations and PatternsFour Operations Problem SolvingMeasurement & DataMeasurable AttributesMeasuring LengthsMeasure and Estimate Lengths in Standard UnitsRelate Addition and Subtraction to LengthClassifying and Counting ObjectsTime and MoneyArea Concepts and MeasurementPerimeter and Area MeasuresAngle Concepts and MeasurementTime, Volume, and MassMeasurement Unit ConversionsGeometryIdentifying ShapesShapes and AttributesShape Attributes and ReasoningShapes and CompositionClassifying 2D FiguresGeometric Figures and RelationshipsLines, Angles, and ShapesAngle, Area, and VolumeGeometric MeasurementVolume of 3D ShapesCoordinate Plane ApplicationsTransformations in the PlaneCongruence and SimilarityUnderstand congruence in terms of rigid motionsSimilarity and TransformationsProve Theorems Involving SimilarityPythagorean TheoremTrigonometry for General TrianglesMake Geometric ConstructionsProve Geometric TheoremsTheorems About CirclesFind Arc Lengths And Areas of Sectors of CirclesVolume FormulasRelationships Between Two-Dimensional and Three-Dimensional ObjectsProve Simple Geometric Theorems AlgebraicallyTranslate Between Geometric Description and Equation for Conic SectionApply Geometric Concepts in Modeling SituationsFractions & DecimalsFractions as NumbersBuilding FractionsFraction Equivalence and OrderingAdding and Subtracting FractionsMultiplying and Dividing FractionsDividing FractionsDecimal FractionsMulti-Digit Computation and FactorsAdd, Subtract, Multiply, and Divide Rational NumbersRational Number SystemIrrational Numbers and ApproximationsRatiosRatios and ProportionsProportional RelationshipsUnit RateAlgebraAlgebraic ExpressionsGenerate Equivalent ExpressionsQuantitative RelationshipsProportional Relationships and Linear EquationsEquations and InequalitiesEquation Solving and ReasoningLinear Equations and SystemsGraph Equations and InequalitiesSystems of EquationsReal-World Algebraic ProblemsQuantitative Reasoning with UnitsExpression StructureEquivalent Expression FormsRadicals and Integer ExponentsRational ExponentsRational and Irrational NumbersPolynomial OperationsPolynomial IdentitiesPolynomial Zeros and FactorsRational ExpressionsComplex Number OperationsComplex Numbers in PolynomialsComplex Numbers on PlaneStatistics & ProbabilityRepresent and Interpret DataData DistributionsStatistical VariabilityProbability ModelsCompound Event ProbabilitiesStatistical SamplingInterpret Categorical and Quantitative DataBivariate Data PatternsInterpret Linear ModelsComparing Two PopulationsRandom Processes in StatisticsIndependence and Conditional ProbabilityExpected ValuesProbability-Based Decision MakingStatistical Inference and ConclusionsFunctionsFunction Concepts and NotationDefine and Compare FunctionsInterpret Functions in ContextAnalyze Function RepresentationsModel Relationships with FunctionsIdentify Linear vs Exponential GrowthDistinguish Between Function TypesCompare Growth RatesInterpret Function ExpressionsBuild Functions from RelationshipsConstruct and Model FunctionsTransform and Combine FunctionsModel Comparison and SelectionSolve Exponential EquationsTrigonometryTrigonometric Ratios Involving Right TrianglesTrigonometric Functions and Unit CircleModel with Trigonometric FunctionsTrigonometric IdentitiesVectors & MatricesIntroduction to Vectors and MatricesVector QuantitiesVector OperationsMatrix OperationsCalculusLimits and ContinuityDerivative Concepts and NotationDerivative Rules and TechniquesApplications of DerivativesOptimization ProblemsRelated RatesCurve Sketching and AnalysisIntegration Concepts and NotationAntiderivatives and Indefinite IntegralsDefinite Integrals and AreaFundamental Theorem of CalculusIntegration TechniquesApplications of IntegrationDifferential EquationsSequences and SeriesParametric and Polar FunctionsVector-Valued Functions

Videos

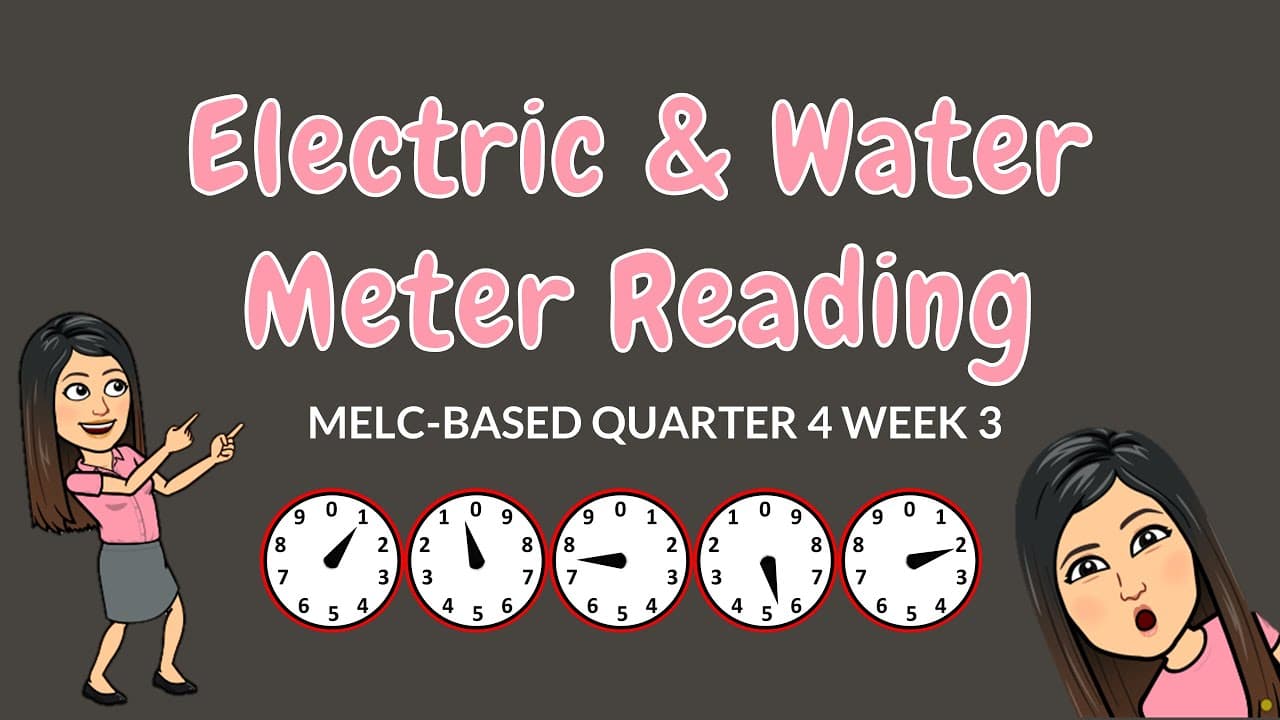
Mastering Utility Meters: Reading Dials and Calculating Costs

Mastering Utility Meters: Reading Dials and Calculating Costs

This comprehensive educational video teaches students the practical life skill of reading analog utility meters and calculating monthly consumption and costs. The lesson is divided into two main sections: first covering electric meters (measured in kilowatt-hours) and then water meters (measured in cubic meters). The narrator guides viewers through the specific rules of reading multi-dial instruments, including the crucial "right-to-left" reading method and how to handle tricky scenarios where pointers fall between numbers or land exactly on a digit. The video goes beyond simple identification by integrating core mathematical operations into real-world contexts. Viewers learn to calculate consumption by subtracting previous readings from present readings, determine total costs by multiplying consumption by unit rates, and analyze data over multiple months to find totals and averages. The content addresses common points of confusion, such as the alternating clockwise/counter-clockwise rotation of electric meter dials and the rules for verifying readings by checking neighboring dials. Teachers can use this video to demonstrate the real-world application of place value, subtraction, and decimal operations. It serves as an excellent bridge between abstract math concepts and household economics/environmental awareness. The clear visual aids and step-by-step examples make complex rules regarding dial reading accessible, helping students develop attention to detail and logical thinking skills alongside their arithmetic practice.

Sheena DoriaSheena Doria

15mins 59s

Collecting Data and Making a Bar Chart

Collecting Data and Making a Bar Chart

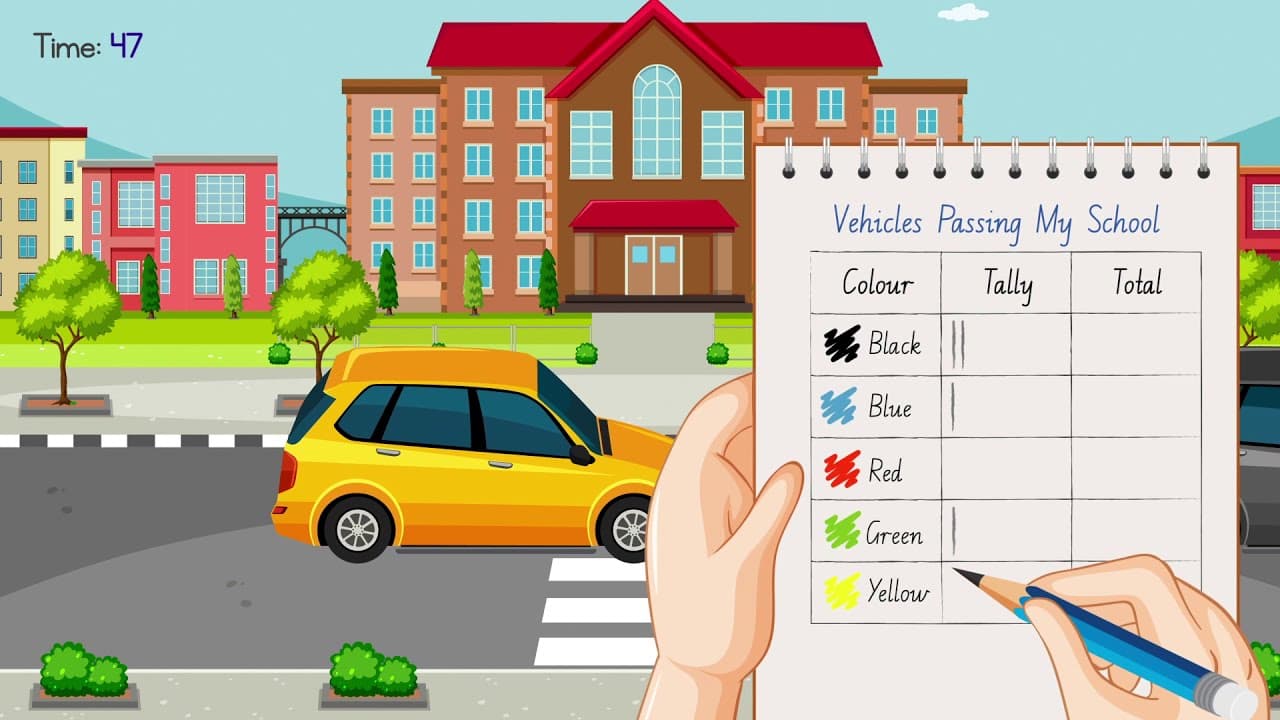
This animated math tutorial guides students through the complete process of data collection and representation, specifically focusing on tally charts and bar graphs. The video begins with a practical, real-world scenario: observing traffic outside a school for one minute to collect data. Viewers watch as vehicles pass by and corresponding tally marks are recorded in a table, demonstrating how to organize raw data in real-time.

MatholiaChannelMatholiaChannel

2mins 28s

Learning to Make a Picture Graph by Sorting and Counting

Learning to Make a Picture Graph by Sorting and Counting

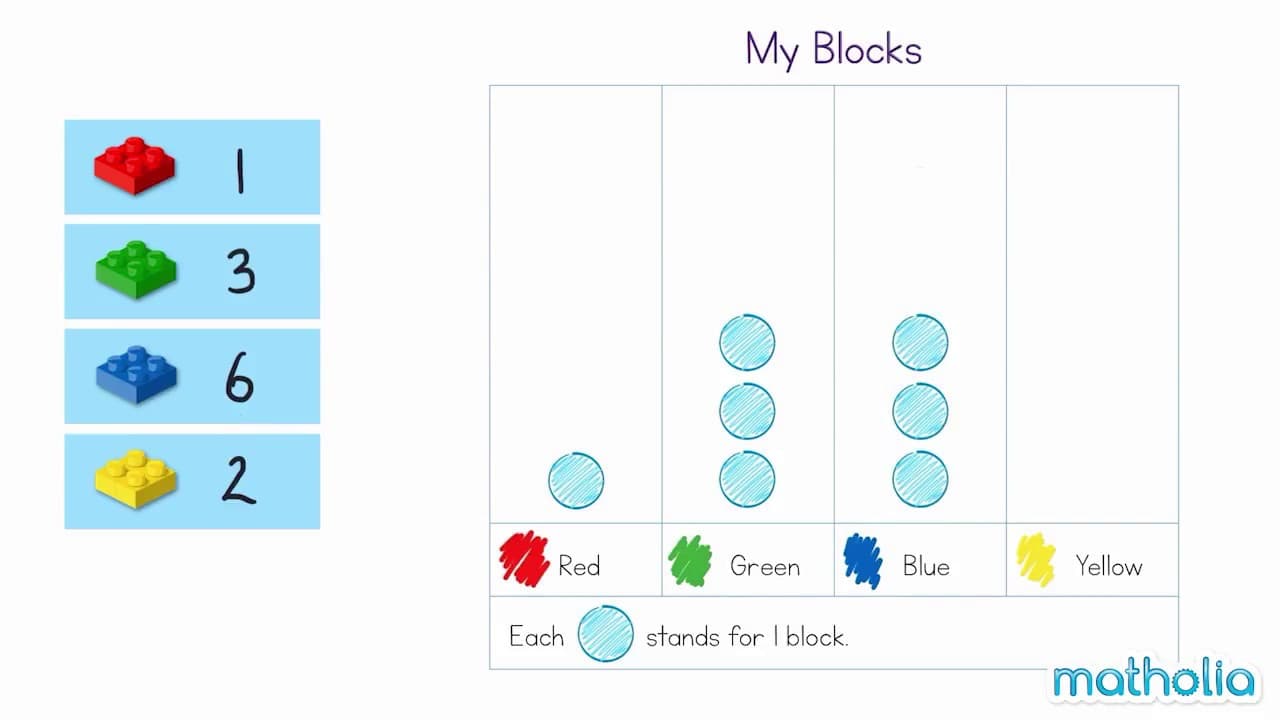
This educational video provides a clear, step-by-step demonstration of how to collect data and represent it using a picture graph. Using colorful building blocks as the primary dataset, the video guides viewers through the foundational data analysis process: first sorting a jumbled collection of items by attribute (color), then counting the quantity in each group, and finally transferring that information onto a labeled grid chart. The content explores key early math themes including classification (grouping by attributes), one-to-one correspondence, counting, and data visualization. It introduces the essential components of a graph, such as labels, columns, and a legend or key, explaining how abstract symbols (circles) can represent physical objects (blocks) in a structured format. For educators, this video serves as an excellent introduction to graphing for early elementary students. It bridges the gap between concrete manipulatives and abstract paper-based graphs. Teachers can use this video to model the graphing process before having students perform similar activities with their own classroom manipulatives, making it a valuable tool for introducing statistics and data analysis standards.
MatholiaChannelMatholiaChannel

1min 53s

Constructing Frequency Tables and Dot Plots

Constructing Frequency Tables and Dot Plots

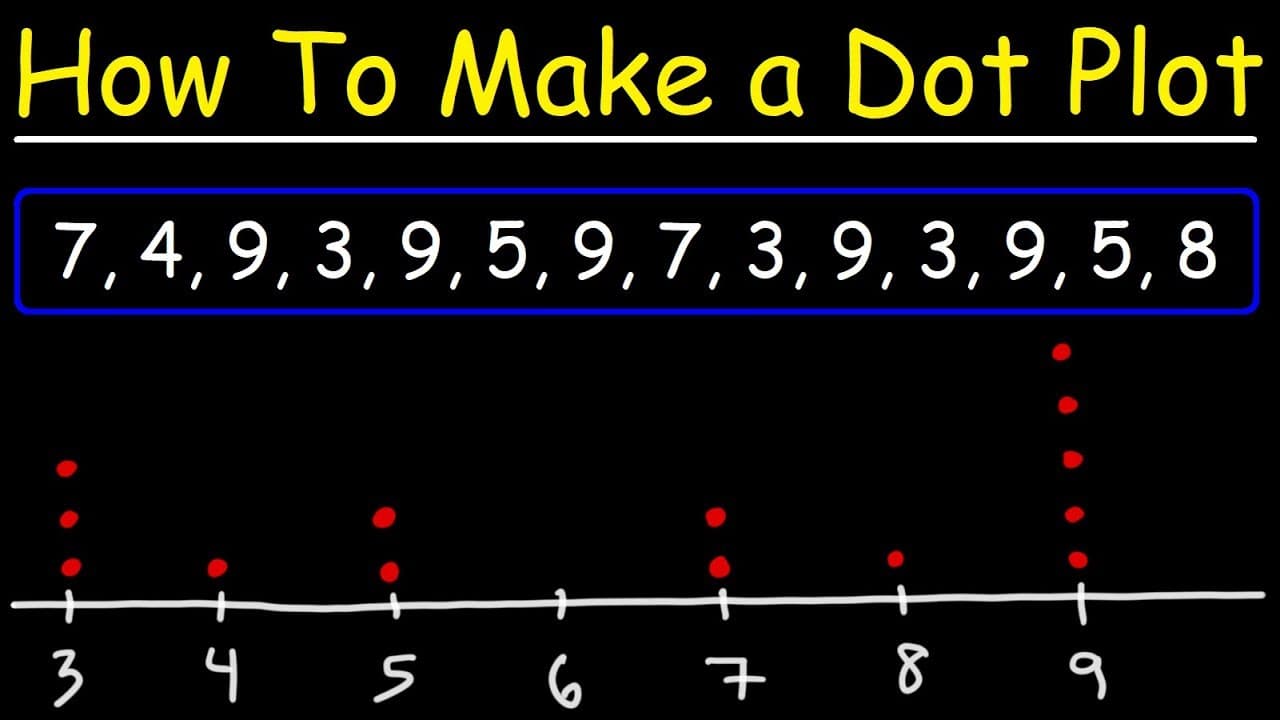
This educational video provides a clear, step-by-step tutorial on how to organize raw data into frequency tables and translate that data into dot plots. The narrator demonstrates the process using a specific set of numbers, showing how to systematically count occurrences to build a frequency table, ensuring accuracy by crossing off numbers as they are counted. The video further bridges the gap between tabular data and visual representation by constructing a dot plot on a number line based on the frequency table values. Key themes include data organization, statistical visualization, and measures of central tendency. Beyond simple construction, the video teaches students how to analyze the resulting dot plot to identify the mode (the most frequent value) and the median (the middle value). A visual method for finding the median—canceling out dots from the left and right extremes—is explicitly demonstrated, including how to handle a data set with an even number of values by averaging the two middle numbers. This resource is highly valuable for introducing or reinforcing 6th-grade statistics concepts. It models procedural fluency and organization, skills critical for avoiding errors in data analysis. Teachers can use this video to scaffold lessons on data display, moving students from messy lists of numbers to organized tables and finally to clear visual graphs that allow for easier interpretation of data trends.

The Organic Chemistry TutorThe Organic Chemistry Tutor

5mins 35s

Materials

Everyday Math Workout Packet

Everyday Math Workout Packet

A comprehensive 20-day mixed review packet aligned with first-grade Everyday Math skills. Each daily page provides structured practice in counting on, turn-around facts, number line addition and subtraction up to 20, tally marks with data charts, decomposing numbers with parts-and-total frames, and story problems up to 12.

T

Terece.Williams

Dice Dash Worksheet

Dice Dash Worksheet

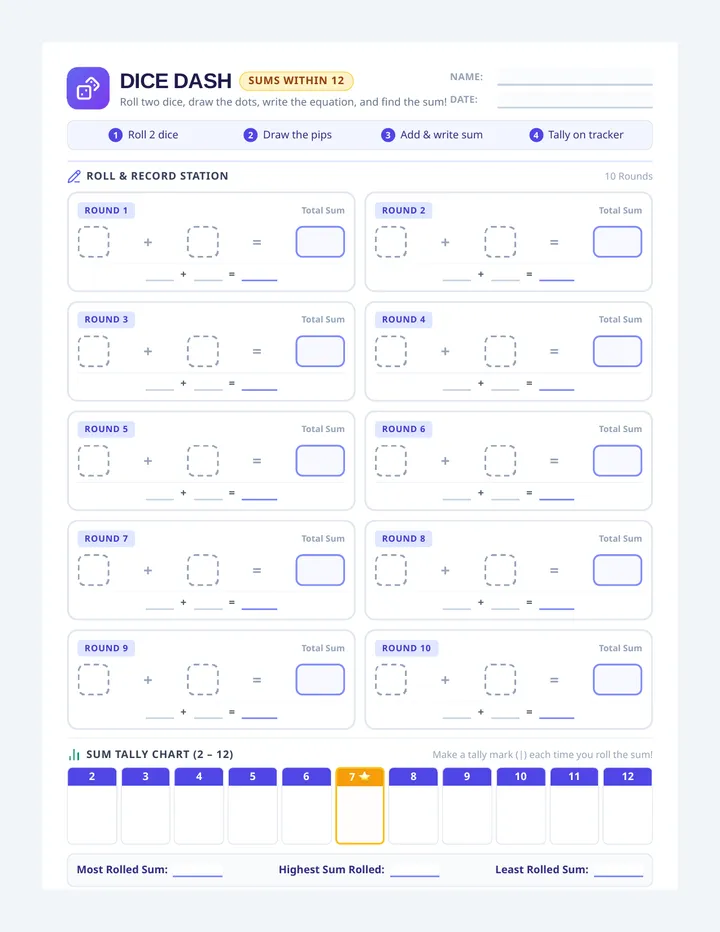
A colorful, print-ready math center worksheet for early elementary students to roll two dice, draw the pips, write addition equations, and track sums up to 12 with a built-in frequency tally chart.

AA

Addison Armstrong

Pet Graph Worksheet

Pet Graph Worksheet

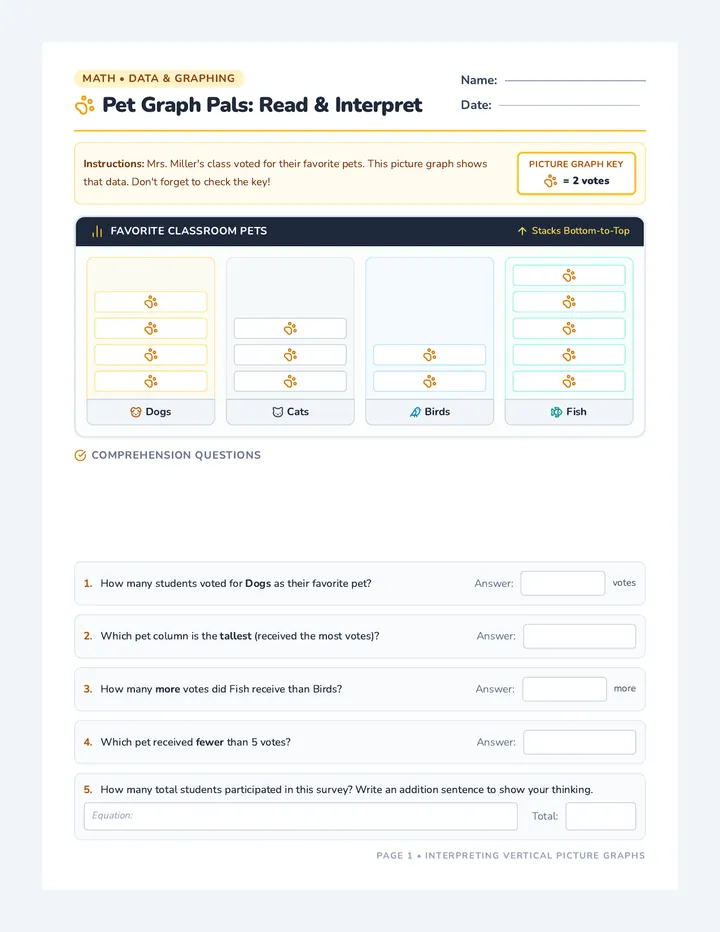
A revised two-page printable math worksheet on picture graphs with a classroom pets theme, now featuring vertical data orientation. Page 1 has students read and interpret a vertical pictograph, while Page 2 features blank vertical column grids where students draw pictograph symbols from the bottom up based on a data table.

SO

Sarah Overgaard

Weekly Math Spiral Packet

Weekly Math Spiral Packet

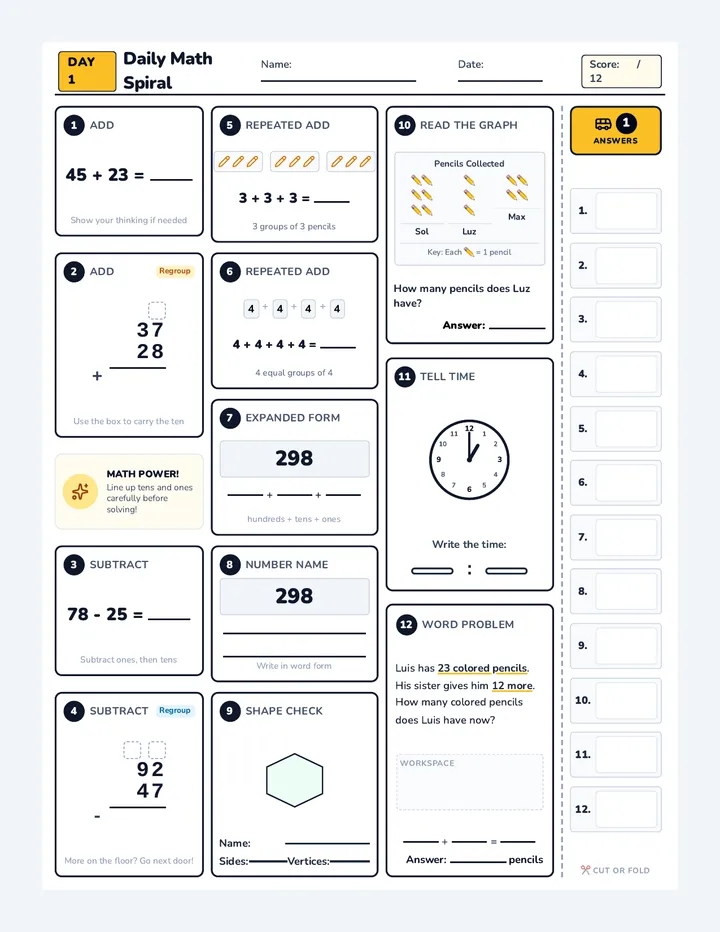
A 5-day printable weekly math spiral review packet (Monday to Friday) covering 2-digit addition and subtraction with regrouping, repeated addition, 3-digit expanded form, number names, 2D/3D geometry, graphs, analog time, and word problems, complete with a quick-grader answer strip.

DL

Damaris Lopez Valentin

Critter Count Worksheet

Critter Count Worksheet

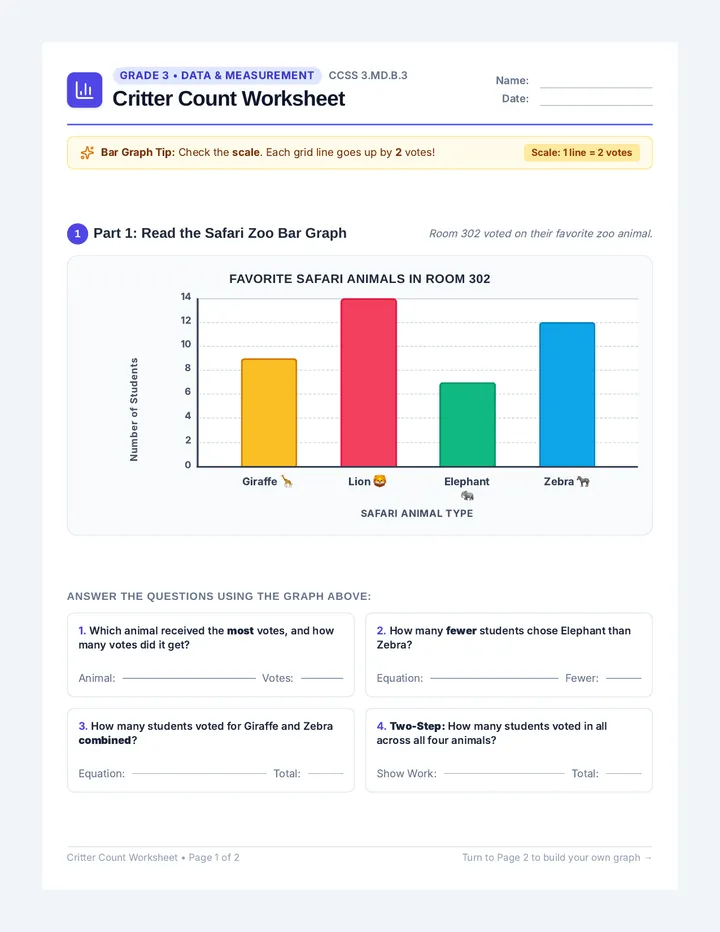
A 2-page bar graph worksheet for 3rd graders with accurately rendered scaled bar graphs (Giraffe bar updated to 9 votes, halfway between 8 and 10 on the scale of 2).

SO

Sarah Overgaard

Data Plotter Grids

Data Plotter Grids

A comprehensive set of mathematical grid templates featuring multiple 10x10 grids for base 100 exercises, a large master grid with a legend area, and multiple 1x10 strips for base 10 data graphing.

DB

Deborah Burton

Sequences

Analyzing Action Slides

Spring Sport Stats

A 2-day math sequence for 3rd grade focused on reading, analyzing, and creating bar graphs using a spring sports and activities theme. Includes interactive notebooks, crafts, and practice worksheets.

EG

Elva Garcia

7
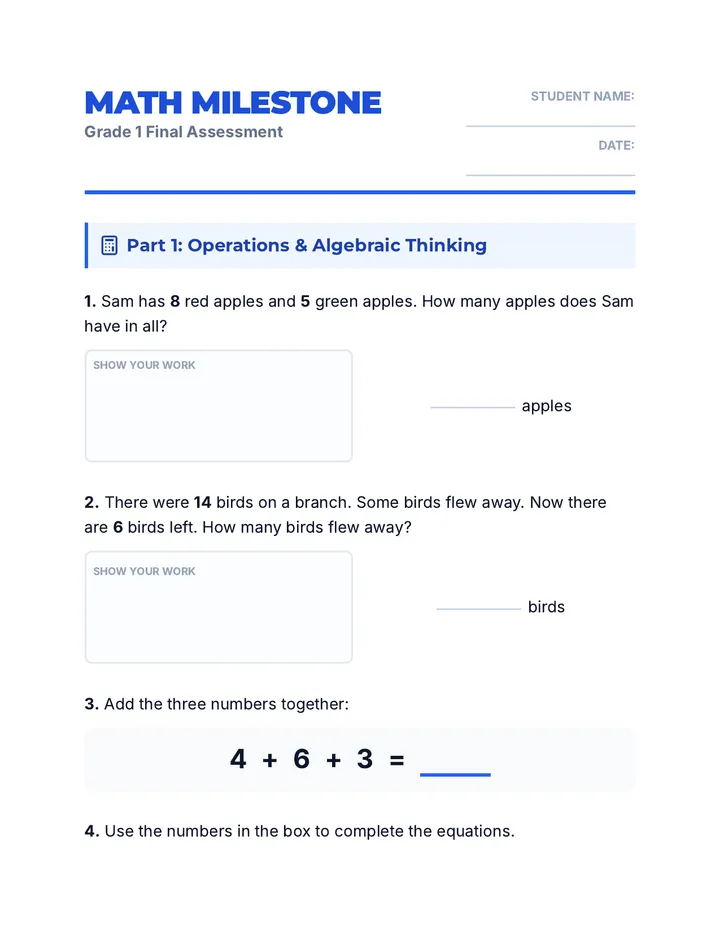
Math Milestone Student Assessment

Math Milestone Evaluation

A series of materials designed to evaluate and document first-grade students' mastery of year-long mathematical standards in preparation for second grade.

TL

Tanya Larson

23
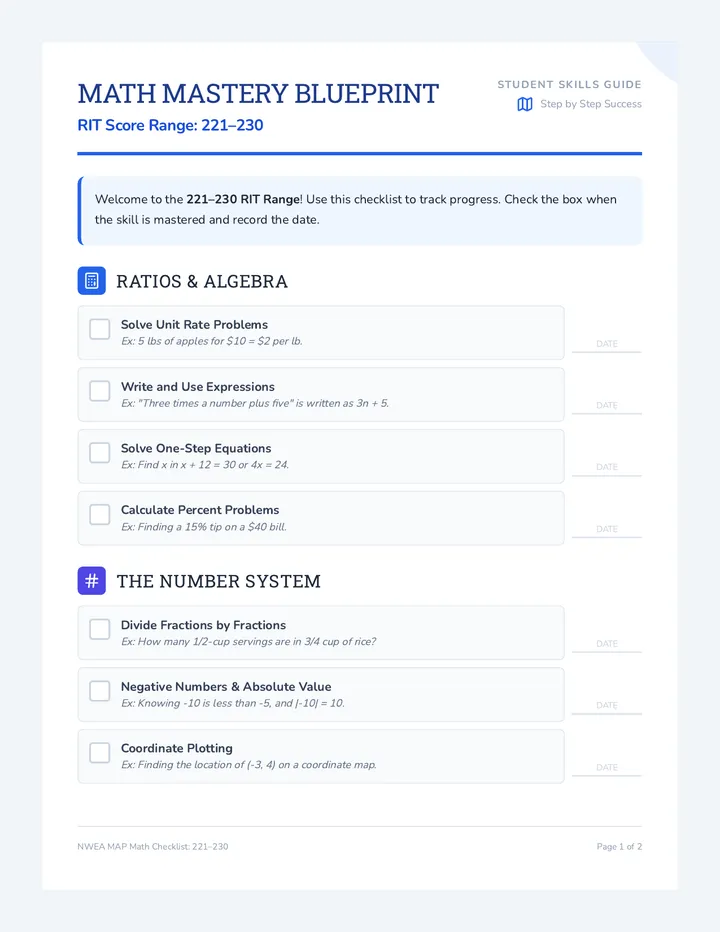
Math Mastery Blueprint Checklist

Math Mastery Progression

A comprehensive collection of RIT-aligned math mastery resources for student and teacher tracking across key mathematical development ranges.

L

llocascio

7
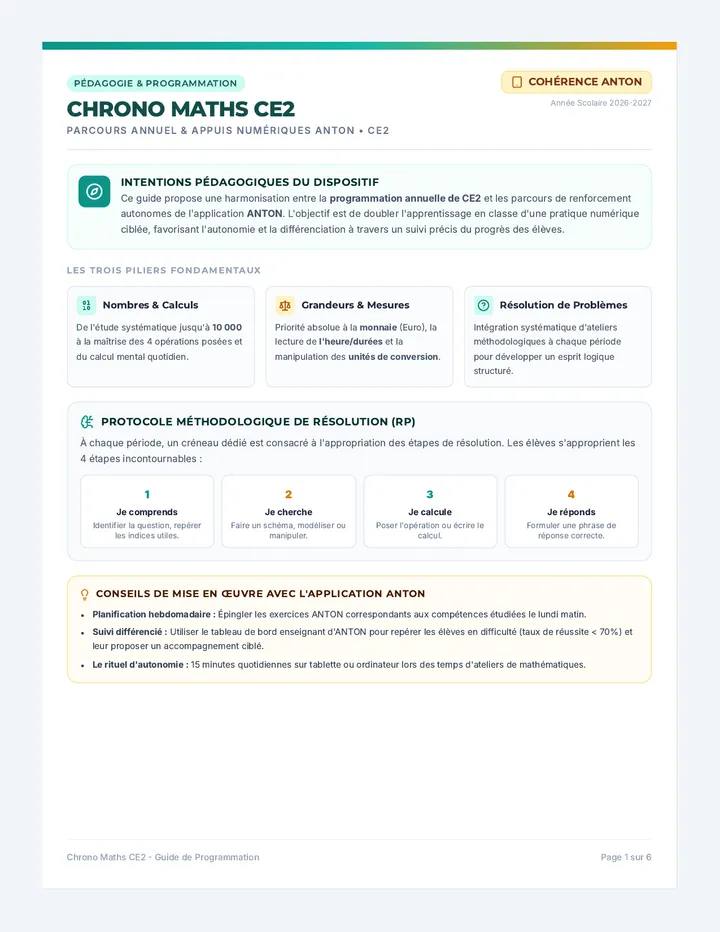
Chrono Maths Planning Guide

Chrono Maths ANTON

Ensemble complet de programmations annuelles et de carnets de suivi de mathématiques, alignés avec l'application ANTON pour le CE2 et le Cycle 3. Il structure la progression hebdomadaire des compétences clés, la résolution méthodique de problèmes, ainsi que le renforcement numérique interactif pour les élèves.

CT

Céline Tigé

6
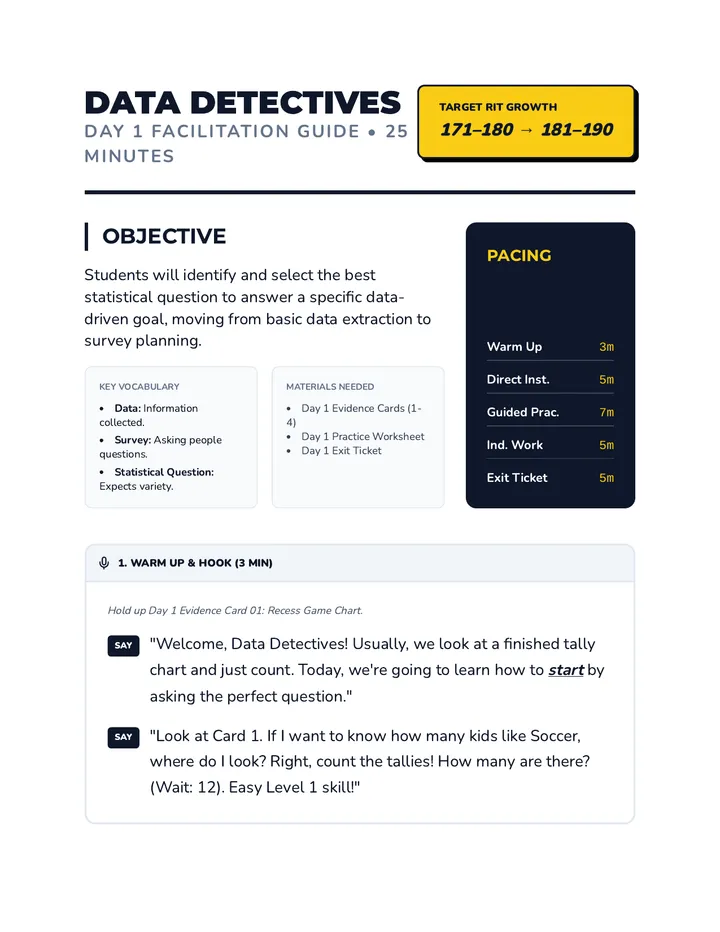
Day 1 Facilitation Guide

Data Detective Agency

A 3-day small group intervention sequence designed to move students from RIT 171-180 to 181-190 in Data Analysis. Students progress from selecting appropriate survey questions to formulating their own and evaluating the effectiveness of data collection methods.

MC

Melinda Cortez

15
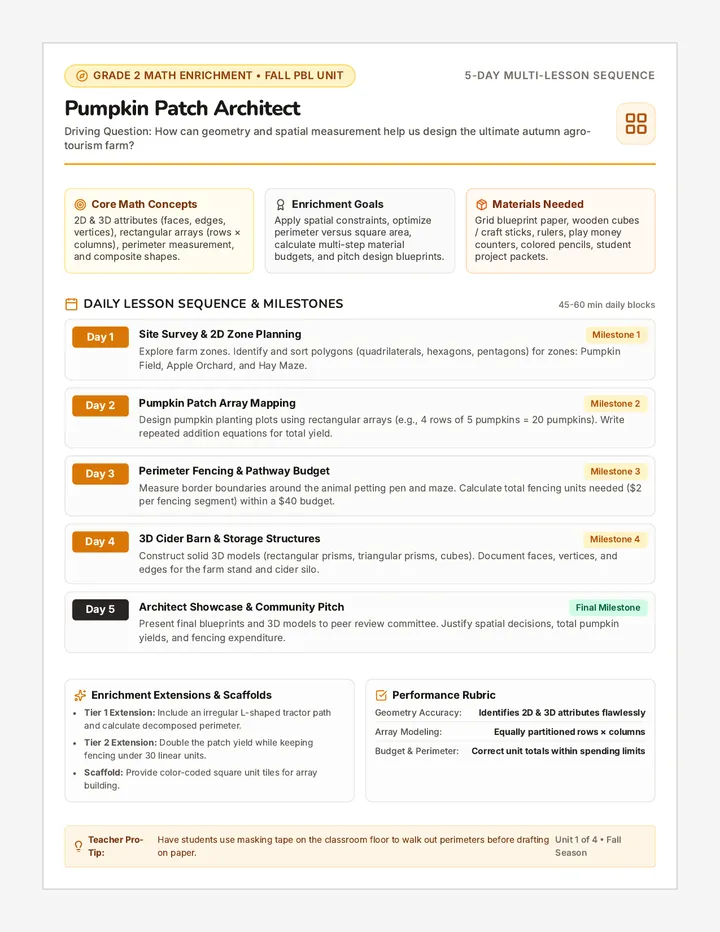
Pumpkin Patch Unit Plan

Seasonal Math Quests

A collection of four seasonal project-based learning units for Grade 2 math enrichment featuring autumn harvest and winter wonderland design missions. Students apply advanced geometry, multi-digit money math, precision measurement, and elapsed time to solve authentic real-world challenges.

K

kkipperman

8

Lessons

Precision Blueprint Slides

Measurement Blueprint

A comprehensive lesson on 3.MD.4 focusing on measuring to the nearest quarter inch and displaying that data on a line plot. Students measure their hand lengths to generate authentic data for analysis.

KB

Krista Bodkin

5
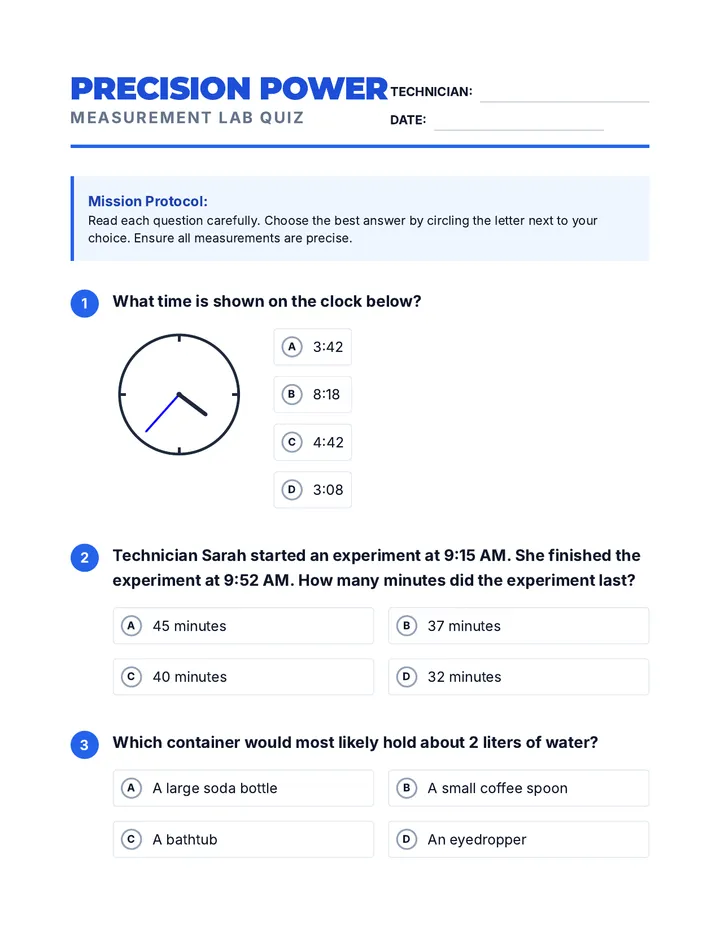
Precision Power Quiz

Measurement Mission

A comprehensive assessment lesson focusing on North Carolina 3rd grade measurement standards, including time to the minute, elapsed time, liquid volume, mass, and data representation. Students will demonstrate mastery through multiple-choice questions and multi-step word problems.

HR

Heather Reading

4
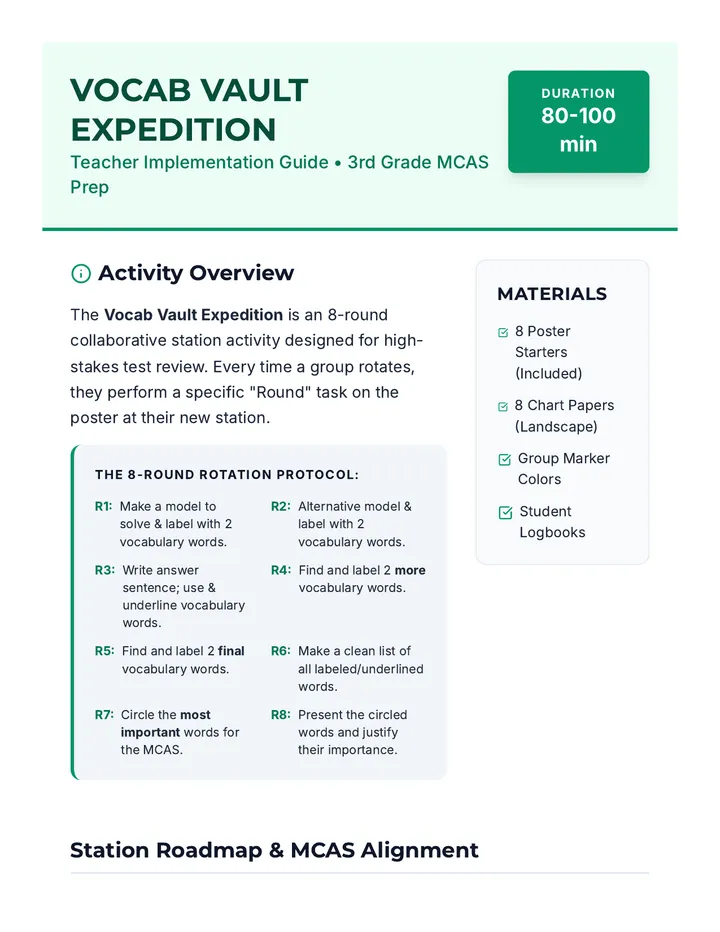
Vocab Vault Teacher Guide

Vocab Vault Expedition

A high-energy, station-based review session where students collaborate to build 'Vocabulary Posters' covering all major 3rd-grade math domains. Students rotate through 8 stations, adding new layers of mathematical reasoning and vocabulary to shared posters at each stop.

J

Jessica

4
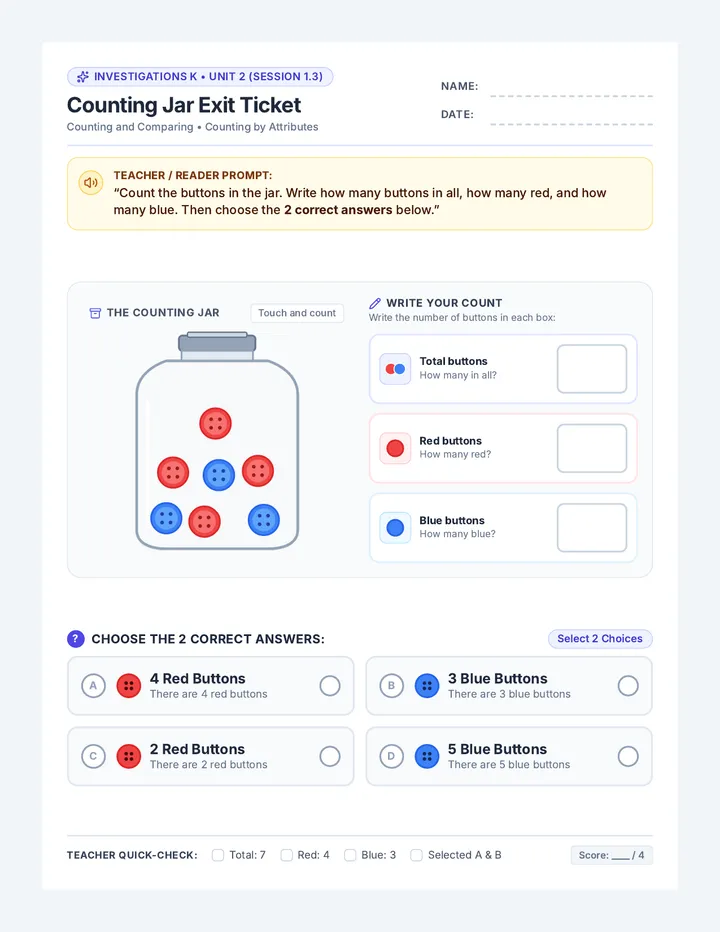
Counting Jar Exit Ticket

Counting Jars

A kindergarten Investigations math lesson where students count objects in counting jars by color attributes, record single and multi-set quantities, and identify true statements.

SB

Sondra Bell

4
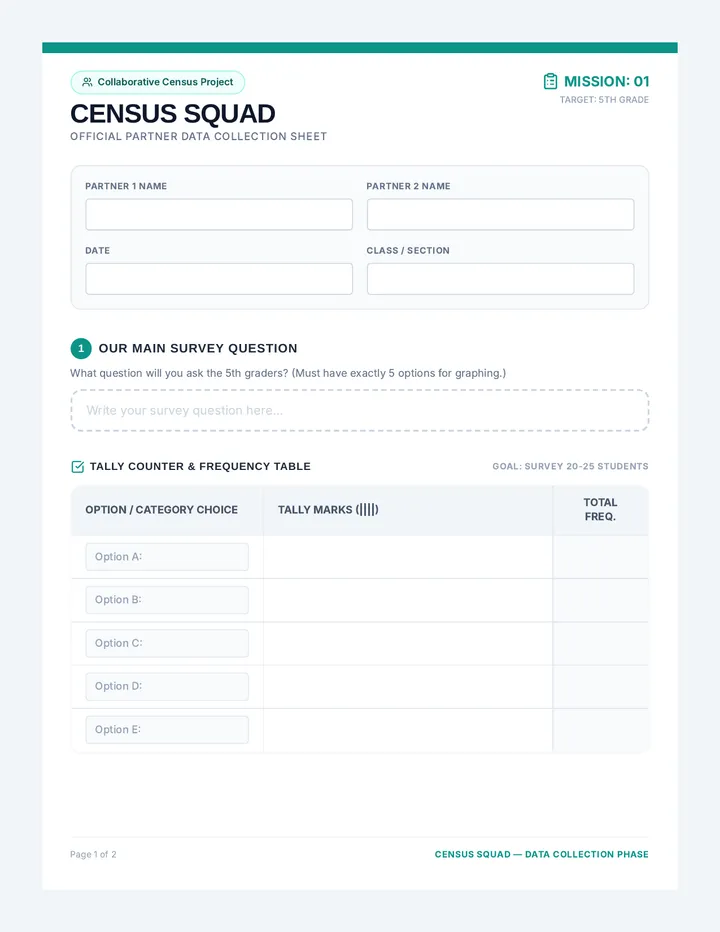
Census Squad Tally Sheet

Census Squad

A collaborative data collection and graphing project where students partner up to survey 5th graders, collect tally mark data, and design a custom poster featuring a line plot and an alternative graph style.

SM

stacy maslyn

3
Data Master Worksheet Compact

Data Master Mastery

A comprehensive lesson on data interpretation and graphing, moving from foundational skill practice to an independent data collection and design project.

DG

Danielle Garland

3