Lenny.com
Explore
Create
ActivitiesNewMathEnglish Language ArtsScience & EngineeringSocial StudiesGlobal LanguagesHealth & Physical EducationSpecial EducationCounseling & Life SkillsArts & CreativityESL
Lenny.com
Lenny.com
Explore
Create
ActivitiesNewMathEnglish Language ArtsScience & EngineeringSocial StudiesGlobal LanguagesHealth & Physical EducationSpecial EducationCounseling & Life SkillsArts & CreativityESL
Lenny.com
MathNumbers & CountingCounting ObjectsNumber NamesComparing NumbersNumber OperationsCounting SequenceNumbers 0-10Place Value Understanding and SystemAdd and Subtract Within 20Addition and Subtraction ConceptsAddition and Subtraction EquationsAddition and Subtraction ProblemsFoundations for MultiplicationMultiplication and Division PropertiesMultiply and Divide Within 100Multiplication and Division ProblemsFactors and MultiplesProperties of OperationsPatterns and RelationshipsGenerate and Analyze PatternsMulti-Digit ArithmeticPlace Value OperationsMulti-Digit and Decimal OperationsNumerical ExpressionsFour Operations and PatternsFour Operations Problem SolvingMeasurement & DataMeasurable AttributesMeasuring LengthsMeasure and Estimate Lengths in Standard UnitsRelate Addition and Subtraction to LengthClassifying and Counting ObjectsTime and MoneyArea Concepts and MeasurementPerimeter and Area MeasuresAngle Concepts and MeasurementTime, Volume, and MassMeasurement Unit ConversionsGeometryIdentifying ShapesShapes and AttributesShape Attributes and ReasoningShapes and CompositionClassifying 2D FiguresGeometric Figures and RelationshipsLines, Angles, and ShapesAngle, Area, and VolumeGeometric MeasurementVolume of 3D ShapesCoordinate Plane ApplicationsTransformations in the PlaneCongruence and SimilarityUnderstand congruence in terms of rigid motionsSimilarity and TransformationsProve Theorems Involving SimilarityPythagorean TheoremTrigonometry for General TrianglesMake Geometric ConstructionsProve Geometric TheoremsTheorems About CirclesFind Arc Lengths And Areas of Sectors of CirclesVolume FormulasRelationships Between Two-Dimensional and Three-Dimensional ObjectsProve Simple Geometric Theorems AlgebraicallyTranslate Between Geometric Description and Equation for Conic SectionApply Geometric Concepts in Modeling SituationsFractions & DecimalsFractions as NumbersBuilding FractionsFraction Equivalence and OrderingAdding and Subtracting FractionsMultiplying and Dividing FractionsDividing FractionsDecimal FractionsMulti-Digit Computation and FactorsAdd, Subtract, Multiply, and Divide Rational NumbersRational Number SystemIrrational Numbers and ApproximationsRatiosRatios and ProportionsProportional RelationshipsUnit RateAlgebraAlgebraic ExpressionsGenerate Equivalent ExpressionsQuantitative RelationshipsProportional Relationships and Linear EquationsEquations and InequalitiesEquation Solving and ReasoningLinear Equations and SystemsGraph Equations and InequalitiesSystems of EquationsReal-World Algebraic ProblemsQuantitative Reasoning with UnitsExpression StructureEquivalent Expression FormsRadicals and Integer ExponentsRational ExponentsRational and Irrational NumbersPolynomial OperationsPolynomial IdentitiesPolynomial Zeros and FactorsRational ExpressionsComplex Number OperationsComplex Numbers in PolynomialsComplex Numbers on PlaneStatistics & ProbabilityRepresent and Interpret DataData DistributionsStatistical VariabilityProbability ModelsCompound Event ProbabilitiesStatistical SamplingInterpret Categorical and Quantitative DataBivariate Data PatternsInterpret Linear ModelsComparing Two PopulationsRandom Processes in StatisticsIndependence and Conditional ProbabilityExpected ValuesProbability-Based Decision MakingStatistical Inference and ConclusionsFunctionsFunction Concepts and NotationDefine and Compare FunctionsInterpret Functions in ContextAnalyze Function RepresentationsModel Relationships with FunctionsIdentify Linear vs Exponential GrowthDistinguish Between Function TypesCompare Growth RatesInterpret Function ExpressionsBuild Functions from RelationshipsConstruct and Model FunctionsTransform and Combine FunctionsModel Comparison and SelectionSolve Exponential EquationsTrigonometryTrigonometric Ratios Involving Right TrianglesTrigonometric Functions and Unit CircleModel with Trigonometric FunctionsTrigonometric IdentitiesVectors & MatricesIntroduction to Vectors and MatricesVector QuantitiesVector OperationsMatrix OperationsCalculusLimits and ContinuityDerivative Concepts and NotationDerivative Rules and TechniquesApplications of DerivativesOptimization ProblemsRelated RatesCurve Sketching and AnalysisIntegration Concepts and NotationAntiderivatives and Indefinite IntegralsDefinite Integrals and AreaFundamental Theorem of CalculusIntegration TechniquesApplications of IntegrationDifferential EquationsSequences and SeriesParametric and Polar FunctionsVector-Valued Functions

Data Distributions

Analyzes the shape, center, and spread of numerical datasets using histograms, box plots, and dot plots. Examines measures of central tendency and variability to interpret data consistency and skewness.

Lenny.com

Solutions

Lenny for EducatorsLenny for SchoolsLenny for Districts

Product

ExploreSign inCreateSupportAbout

Resources

Getting startedMTSS Acceleration Program

© 2026 Lenny Learning Inc.

TermsPrivacyAccessibility
LinkedInInstagramX
Lenny

Videos

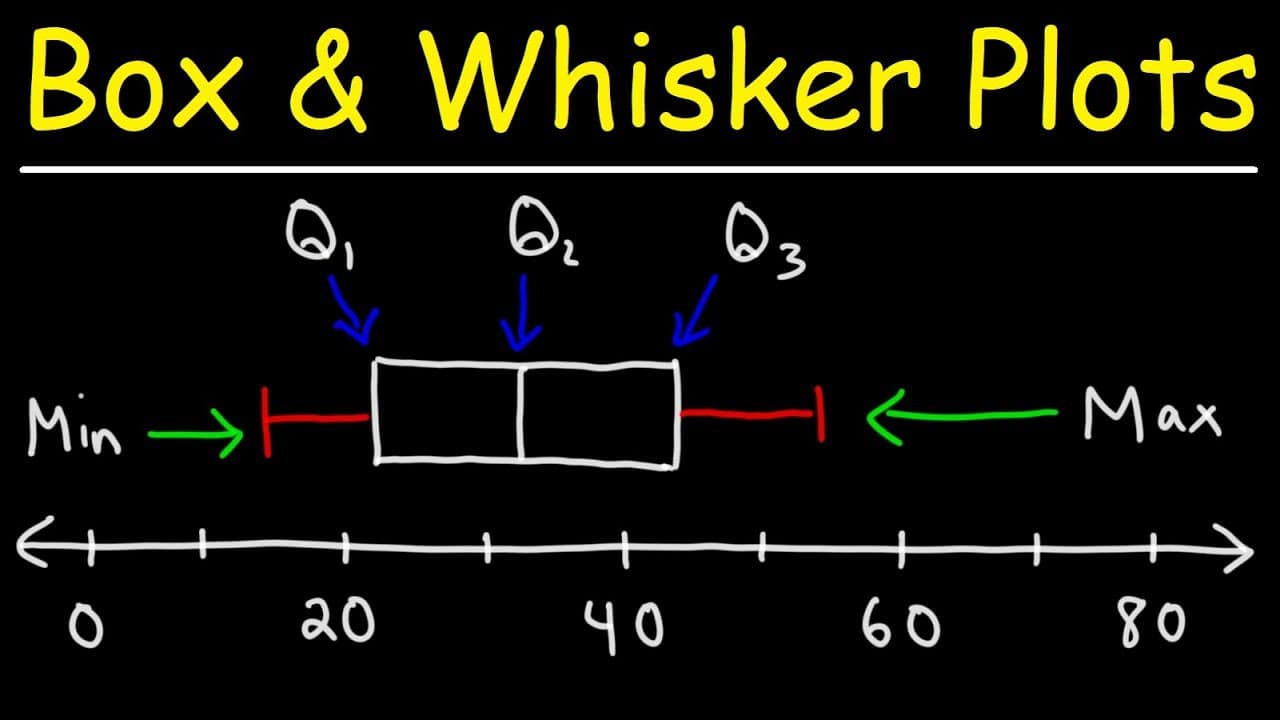
Constructing Box and Whisker Plots Step-by-Step

Constructing Box and Whisker Plots Step-by-Step

This educational video provides a comprehensive, step-by-step tutorial on how to construct box and whisker plots (also known as box plots). The narrator guides viewers through identifying the five-number summary required to draw the plot: minimum, first quartile (Q1), median (second quartile/Q2), third quartile (Q3), and maximum. The video uses clear, handwritten visualizations on a blackboard style background to demonstrate the process of organizing raw data, calculating quartiles, and mapping these points onto a number line.

The Organic Chemistry TutorThe Organic Chemistry Tutor

13mins 56s

Mastering Math with the Desmos Online Graphing Calculator

Mastering Math with the Desmos Online Graphing Calculator

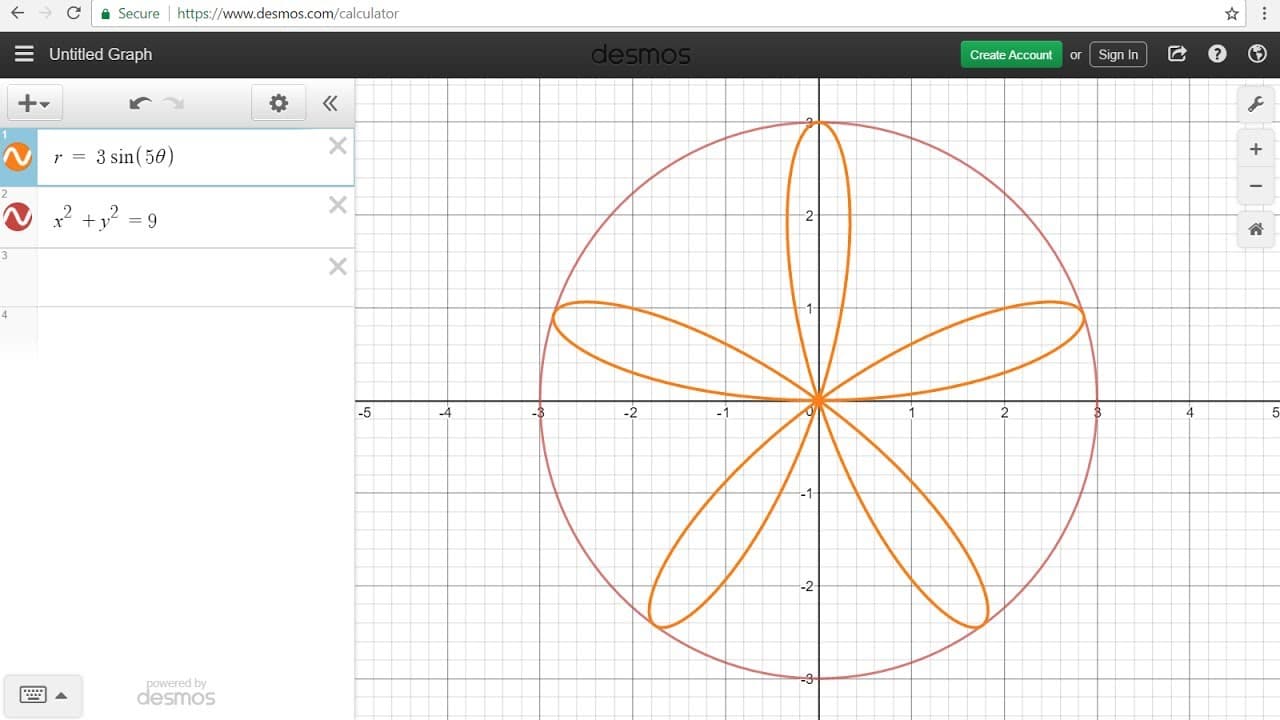
This comprehensive tutorial introduces students and educators to the Desmos online graphing calculator, a powerful and free tool for visualizing mathematics. The video begins with the basics of accessing the site and graphing simple functions like lines and parabolas, then progressively moves to more advanced topics including trigonometry, polar coordinates, and calculus operations. The narrator demonstrates not just how to plot graphs, but how to use the tool to solve equations, factor quadratics, and visualize systems of inequalities. Key mathematical themes include function families (linear, quadratic, cubic, absolute value, exponential, logarithmic), systems of equations and inequalities, trigonometry (degrees vs. radians), and statistical analysis (mean, standard deviation). The video also highlights the calculator's computational abilities, such as evaluating definite integrals, summations, and permutations, making it a versatile utility for various levels of math. For the classroom, this video serves as an excellent training resource for students transitioning from handheld calculators to computer-based tools. It allows teachers to show students how to verify their algebraic work visually, such as checking factors by looking at x-intercepts or solving systems by finding intersection points. The visual nature of the tool helps bridge the gap between abstract algebraic manipulation and concrete graphical understanding.
The Organic Chemistry TutorThe Organic Chemistry Tutor

13mins 58s

How to Calculate Quartiles, Deciles, and Percentiles

How to Calculate Quartiles, Deciles, and Percentiles

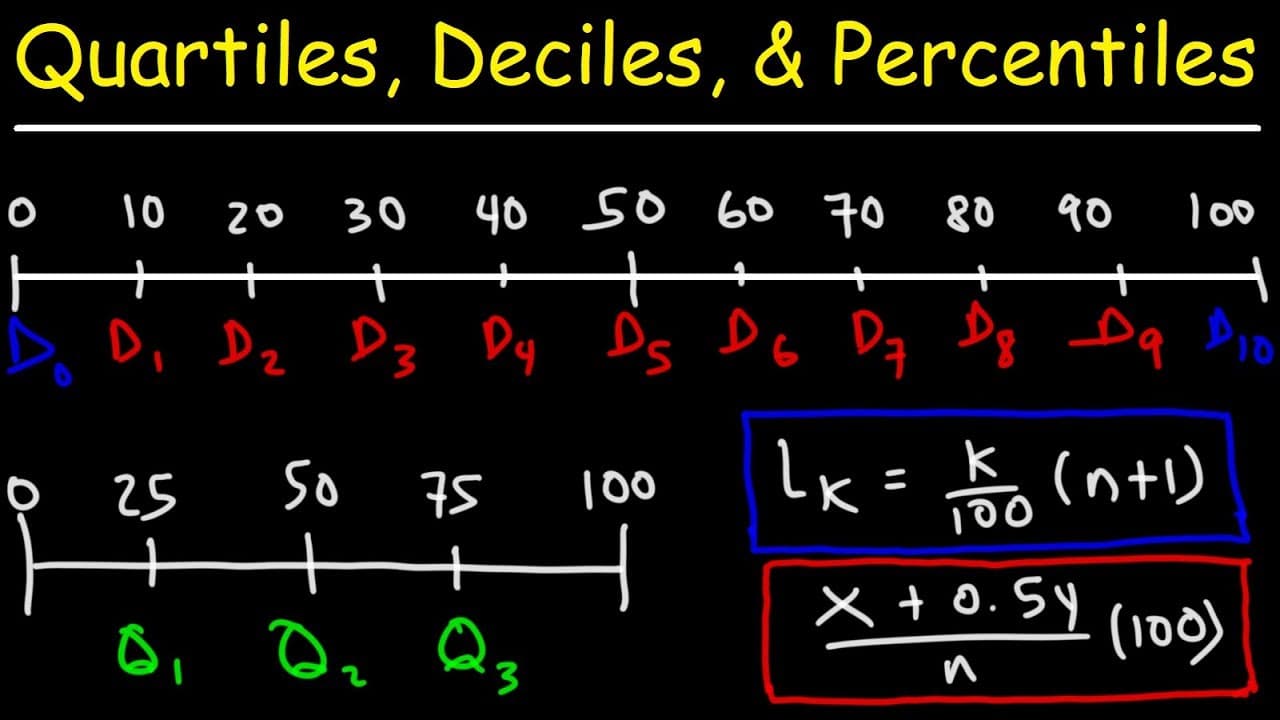
This comprehensive math tutorial provides a deep dive into statistical measures of position: quartiles, deciles, and percentiles. It begins by defining each term and visualizing their relationships on a number line, establishing a clear conceptual foundation before moving into calculations. The video demonstrates how to calculate these values for both odd and even datasets using two distinct methods: finding the median physically by eliminating outer numbers, and using the position formula $L = \frac{k}{100}(n+1)$. A significant portion of the video focuses on the nuances of calculation, specifically how to handle results when the position formula yields a decimal. It explains the process of averaging the two surrounding data points to find the precise value. Furthermore, the video introduces a formula for finding the percentile rank of a specific data point, which is useful for standardized testing contexts. Finally, it guides viewers through constructing a cumulative relative frequency table and using it to determine deciles efficiently. This resource is highly valuable for algebra and statistics classrooms. It addresses common points of confusion, such as the difference between a percentile's "position" and its "value," and how to handle data that falls between two values. Teachers can use this video to introduce new concepts, reinforce calculation methods, or provide a refresher on reading cumulative frequency tables. The step-by-step examples with varying dataset sizes make it an excellent reference for students mastering data analysis.

The Organic Chemistry TutorThe Organic Chemistry Tutor

35mins 13s

Constructing Frequency Tables and Dot Plots

Constructing Frequency Tables and Dot Plots

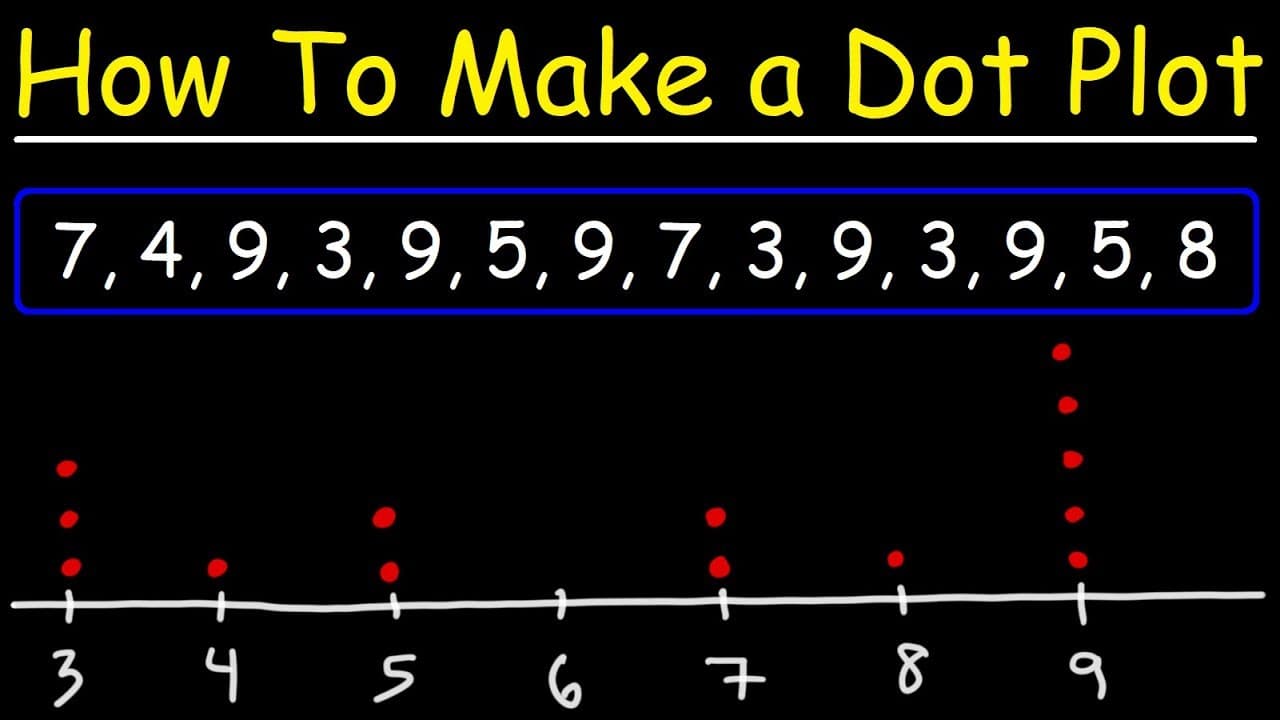
This educational video provides a clear, step-by-step tutorial on how to organize raw data into frequency tables and translate that data into dot plots. The narrator demonstrates the process using a specific set of numbers, showing how to systematically count occurrences to build a frequency table, ensuring accuracy by crossing off numbers as they are counted. The video further bridges the gap between tabular data and visual representation by constructing a dot plot on a number line based on the frequency table values. Key themes include data organization, statistical visualization, and measures of central tendency. Beyond simple construction, the video teaches students how to analyze the resulting dot plot to identify the mode (the most frequent value) and the median (the middle value). A visual method for finding the median—canceling out dots from the left and right extremes—is explicitly demonstrated, including how to handle a data set with an even number of values by averaging the two middle numbers. This resource is highly valuable for introducing or reinforcing 6th-grade statistics concepts. It models procedural fluency and organization, skills critical for avoiding errors in data analysis. Teachers can use this video to scaffold lessons on data display, moving students from messy lists of numbers to organized tables and finally to clear visual graphs that allow for easier interpretation of data trends.

The Organic Chemistry TutorThe Organic Chemistry Tutor

5mins 35s

Mastering Mean, Median, Mode, and Range

Mastering Mean, Median, Mode, and Range

This instructional video provides a clear, step-by-step guide on how to calculate the four primary statistical measures of central tendency and variability: mean, median, mode, and range. Using a digital blackboard format, the narrator walks viewers through four distinct practice problems that increase in complexity. The video covers scenarios with both odd and even numbered data sets, demonstrating specific rules for finding the median when there are two middle numbers and how to identify data sets with no mode versus a single mode. Key themes include data organization, arithmetic operations, and statistical analysis. The video emphasizes the importance of ordering numbers from least to greatest before attempting to find the median or range, a critical step often missed by students. It also distinguishes between the arithmetic mean (average) and the median (middle value), helping to clarify common points of confusion in introductory statistics. For educators, this video serves as an excellent direct instruction tool or review resource for math classrooms. It is particularly useful for scaffolding learning, as it moves from simple integer data sets to those requiring decimal answers and multi-step median calculations. The pause-and-practice format encouraged by the narrator makes it ideal for interactive classroom viewing or independent student practice/remediation.

The Organic Chemistry TutorThe Organic Chemistry Tutor

11mins 38s

Calculating and Comparing Mean, Median, and Mode

Calculating and Comparing Mean, Median, and Mode

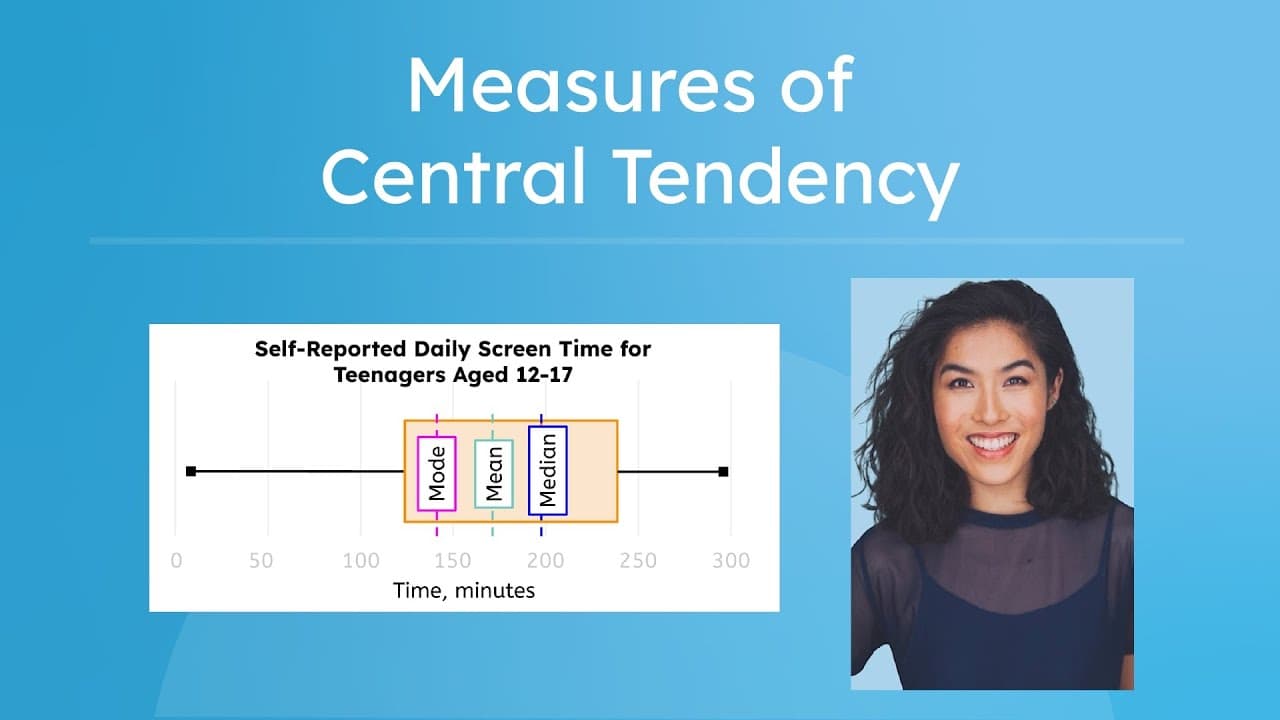
This educational video provides a comprehensive introduction to the three primary measures of central tendency: mean, median, and mode. Through clear definitions and real-world examples, it explains how statisticians and everyday people use these tools to find the "center" or typical value of a dataset. The video uses a relatable running example of tracking daily screen time to demonstrate how to calculate each measure and compares how they behave differently, particularly when outliers are present. The lesson goes beyond simple calculation by visualizing data using histograms and box-and-whisker plots. It explores complex concepts such as data distribution, quartiles, and the impact of skewed data on the mean versus the median. The video also distinguishes between numerical and categorical data, explaining why mode is unique in its application to non-numerical preferences. For educators, this resource serves as an excellent core lesson for a statistics unit in middle or high school math. It directly addresses the critical critical thinking skill of choosing the *right* measure to represent data, rather than just calculating all three blindly. The included pauses for calculation and reflection make it an interactive tool for flipped classrooms or guided whole-group instruction.

Miacademy & MiaPrep Learning ChannelMiacademy & MiaPrep Learning Channel

9mins 13s

Materials

Muscle Fatigue Activity

Muscle Fatigue Activity

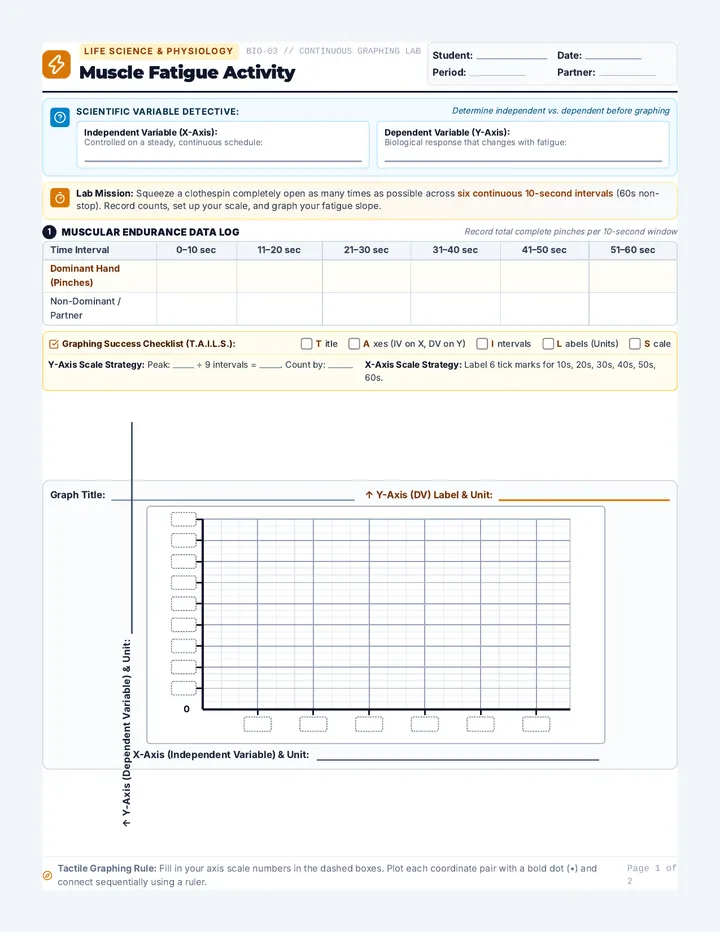
A 2-page hands-on life science printable activity where students measure clothespin pinch frequency across six 10-second intervals to map muscular fatigue, independently identify the independent and dependent variables, determine their coordinate scale, and construct a precision line graph on a full coordinate grid.

S

stewart

Data Displays Practice Worksheet

Data Displays Practice Worksheet

A comprehensive two-page student worksheet covering major statistical data displays (dot plots, bar graphs, histograms, box plots, and scatter plots). Page 1 features a display selection reference guide with construction procedures and scenario-matching diagnostics. Page 2 provides hands-on construction labs where students calculate five-number summaries, complete frequency tables, and plot histograms, box plots, and scatter plots.

F

fradunsky

Boxplots and Outliers Worksheet

Boxplots and Outliers Worksheet

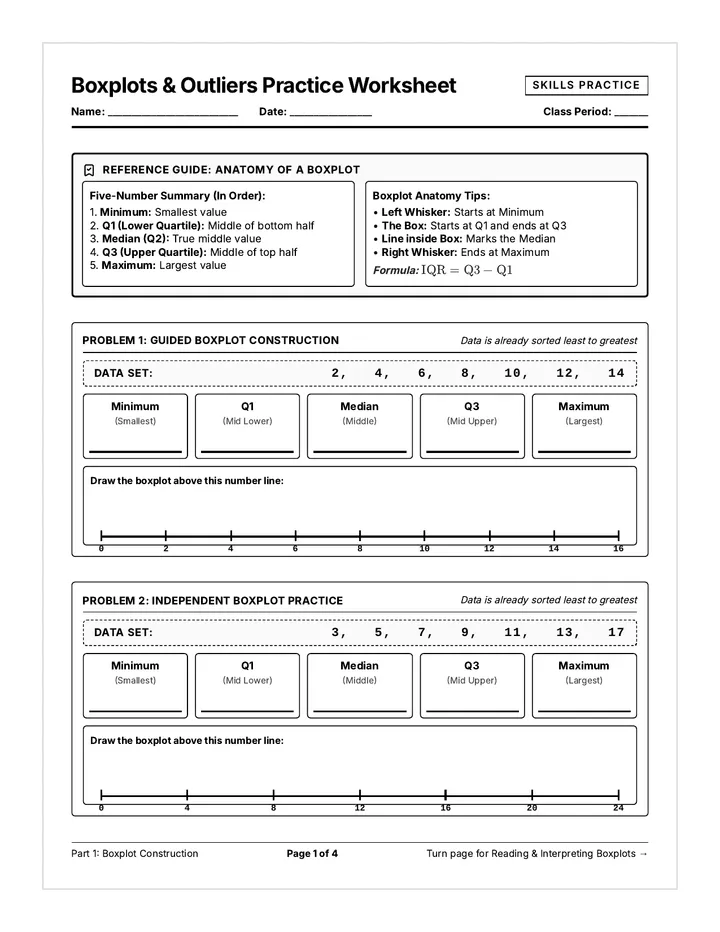
A comprehensive 4-page print-friendly practice worksheet for SPED students reviewing five-number summaries, boxplots, IQR, fence calculations, and outlier detection with additional problems, expanded handwriting space, and reference notes.

D

david.marques

Indiana Math Standards Guide

Indiana Math Standards Guide

A comprehensive 4-page reference guide and curriculum pacing tracker for 6th Grade Indiana Academic Standards in Mathematics. Features complete standard codes, official descriptions, student-friendly 'I Can' statements, and tracking checkboxes for Number Sense, Computation, Algebraic Thinking, Geometry, and Data Analysis.

RG

Richard Gist

Histogram Clues Practice Worksheet

Histogram Clues Practice Worksheet

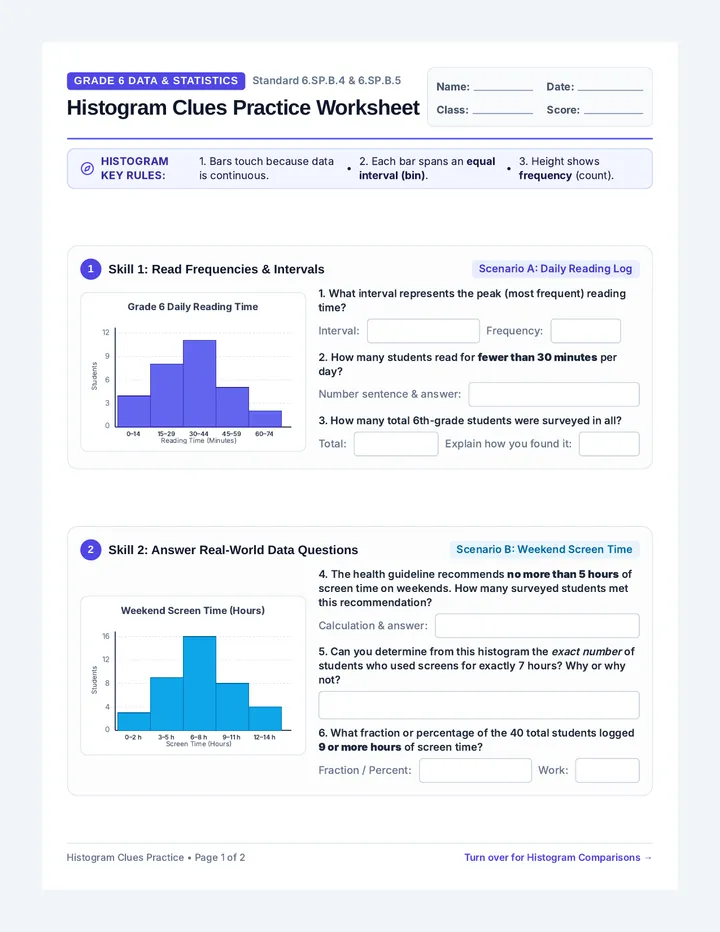
A comprehensive 2-page 6th-grade math practice worksheet focusing on interpreting histograms, reading interval frequencies, comparing distributions between two groups, and answering real-world data questions.

AW

Annalee Warrensford

Box Plot Skewness Guide

Box Plot Skewness Guide

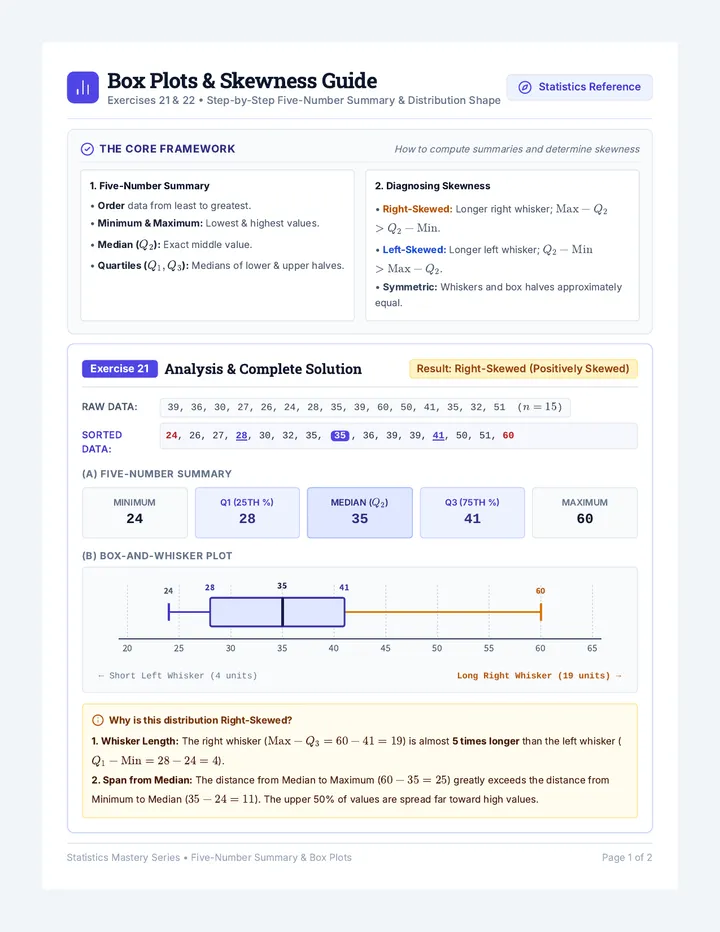
A two-page worked solution and instructional guide for Exercises 21 and 22, detailing five-number summary calculations, accurate box-and-whisker plots, and skewness determination criteria.

MR

Mahuya Roy Chowdhury

Sequences

Project Mission Slides Final

Math in Motion: The 2-Hour Summit

A high-intensity, 120-minute math simulation. Students act as lead consultants, completing a high-speed skill warmup before selecting a professional sector (Music, Urban Planning, Rocket Science, or Sports Analytics) to solve a series of complex work orders.

EL

Elsa LaLone

102
Math Blueprint Week 1 Booklet (Definitive)

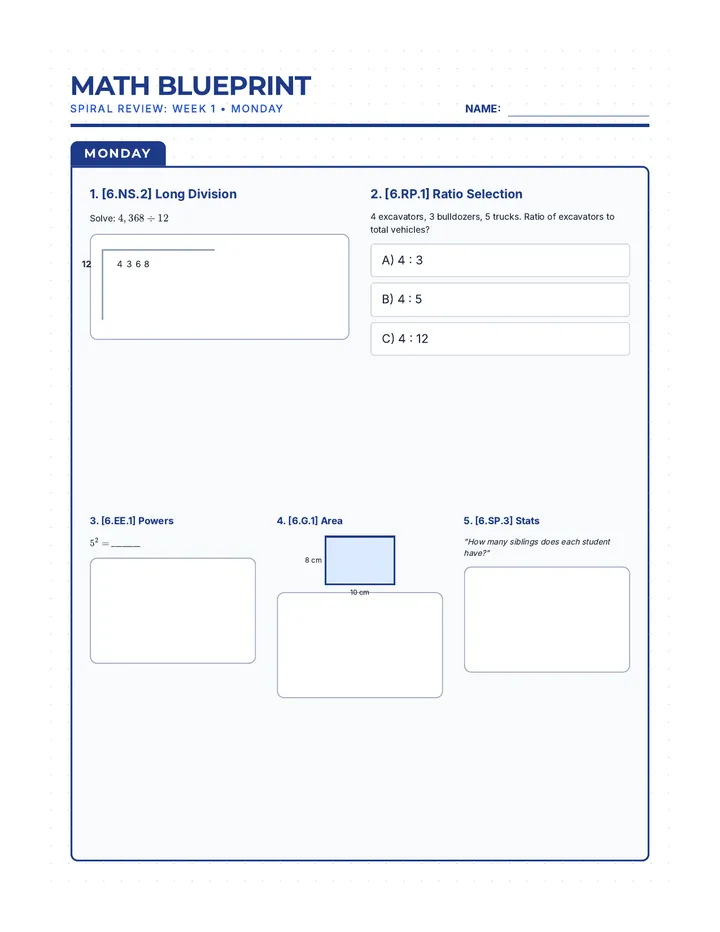
Math Blueprint Spiral

A 7-week comprehensive math review sequence designed to prepare 6th-grade students for North Carolina state testing, covering Number Systems, Ratios, Expressions, Geometry, and Statistics.

MK

Michell Kisler

27
Regents Mastery Blueprint Study Guide

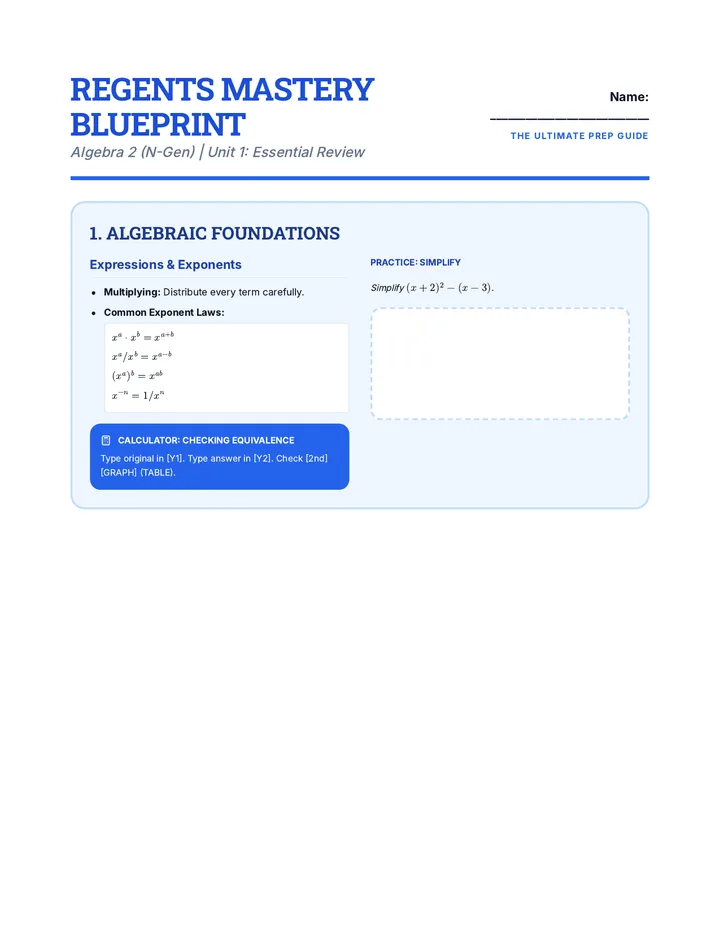
Regents Mastery Suite

A comprehensive review suite for the New York State Mathematics Regents exams, including Algebra 1, Geometry, and Algebra 2, featuring mastery blueprints, calculator strategies, and exam-taking tips.

KB

Kayla Borozny

15
Week 1 Power Sprint Worksheet

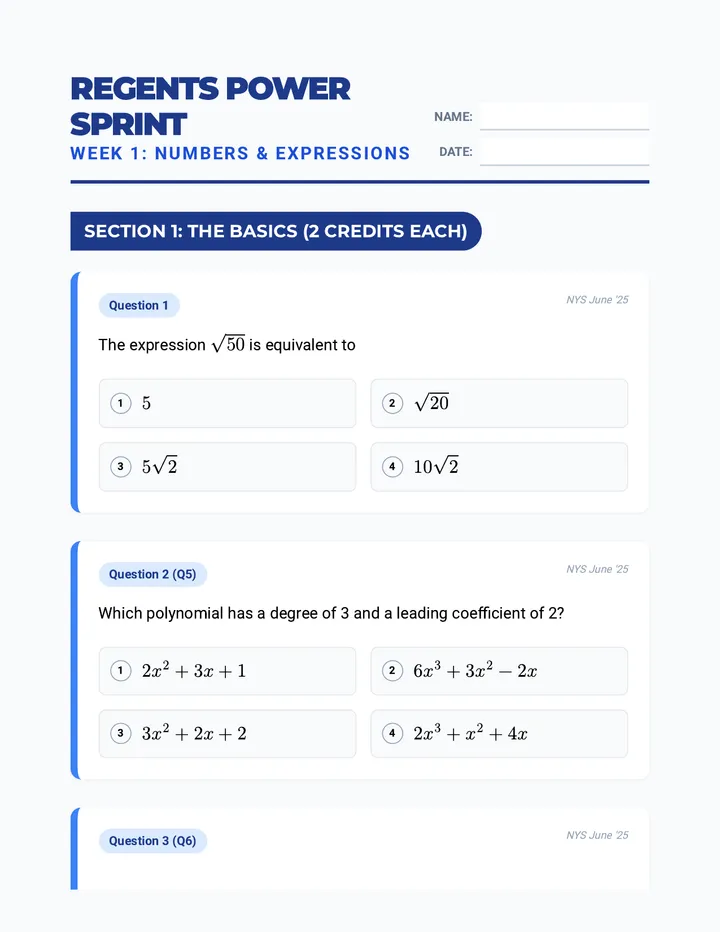
Regents Road Map

A comprehensive 10-week preparation sequence designed to get students ready for the Algebra I Regents exam by May 15th, featuring bi-weekly 30-minute practice sessions and visual anchor charts.

L

laura.clar

31
Positionnement Diagnostic Test

Cap sur les Automatismes

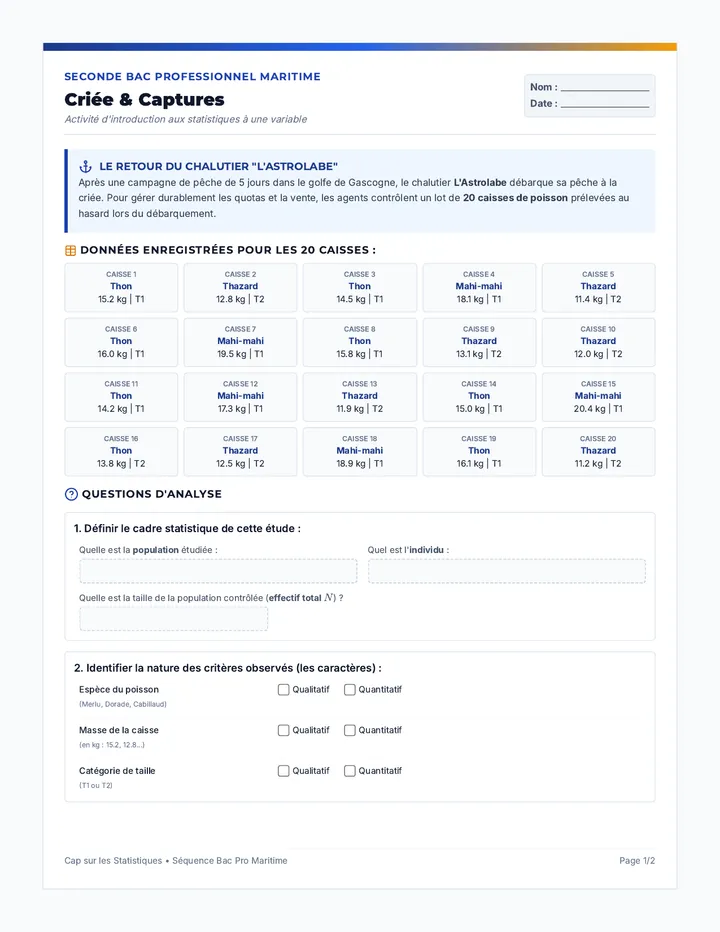
Séquence d'accueil et de consolidation des automatismes numériques (nombres, fractions, priorités opératoires) comprenant un test de positionnement et des fiches d'exercices contextualisées.

EK

Emmanuelle Klaus-Baron

7
Temple Craftsmen Slides

Middle School Math Block

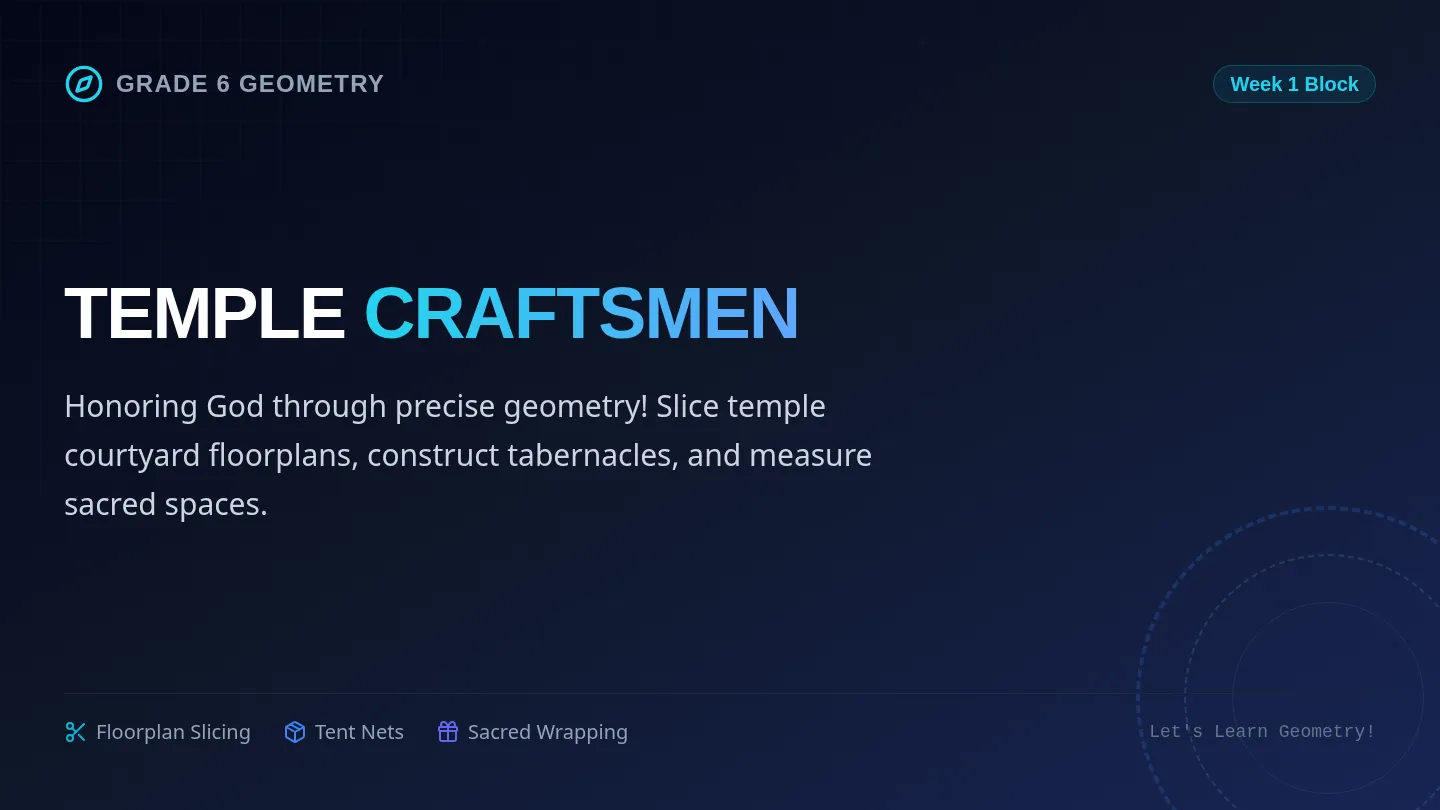
A multi-subject middle school mathematics block for Week 1, covering 6th Grade Geometry (Temple Craftsmen: polygon decomposition, nets, surface area) and 7th/8th Grade Math (Faithful Stewards: proportional relationships, linear equations, inequalities, transversals) from a Christian perspective.

JR

Jamens Ray II

59

Lessons

Census Captain Guide

The Great Sneaker Census

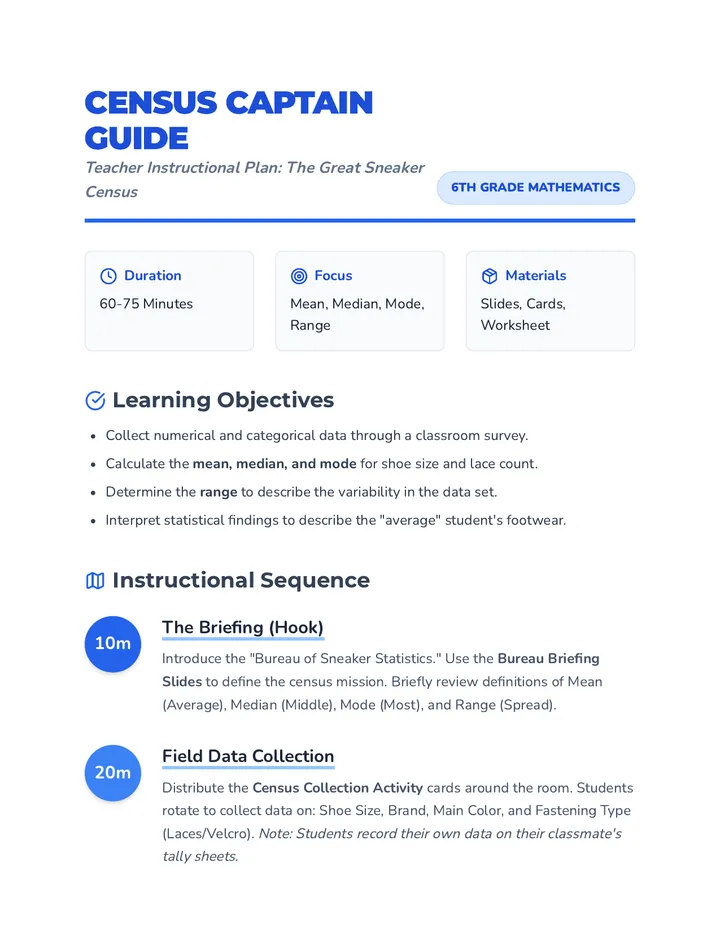
A hands-on statistics lesson where students collect and analyze footwear data from their peers to master measures of center and variability. Students act as 'Census Agents' to transform classroom trends into meaningful mathematical insights.

C

cary.stamps

5
DNB Chrono Livret de Révision

Brevet Express

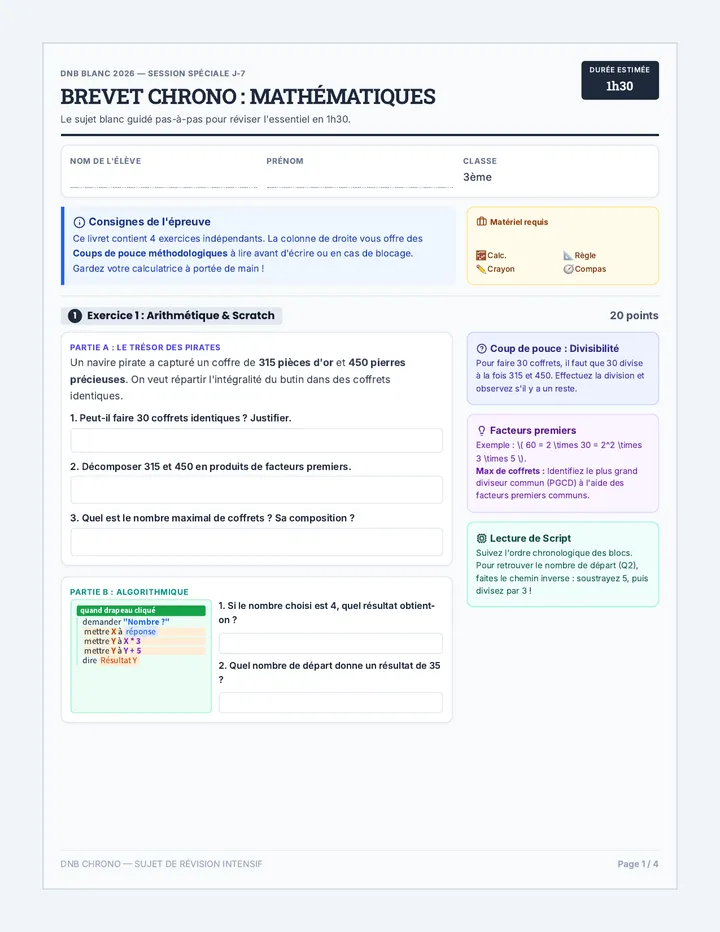
Un kit complet de révision de dernière minute pour le DNB de Mathématiques, comprenant un sujet blanc guidé pas-à-pas pour les élèves et un corrigé détaillé avec barème pour l'enseignant.

E

Enseignante

4
SAM Podcast Parent Briefing Guide

SAM Podcast PBL Launch

A comprehensive introductory lesson set for the SAM Podcast Project-Based Learning program. This lesson incorporates critical parent communication tools alongside specialized teacher lesson plans linking core academic subjects like KSSM Mathematics to real-world digital podcast applications.

AM

Arrthy Muthamilselvan

14
Data Lab Lesson Plan

Heart of the Data

A 9th-grade statistics lesson exploring mean, median, and mode, with a focus on identifying the most appropriate measure of central tendency in the presence of outliers. Students act as 'Data Detectives' to investigate real-world scenarios.

KC

Kris Coyne

6
Center Stage Slides

Data Detectives

A comprehensive lesson on measures of center (mean, median, mode) where students learn to summarize numerical data and find missing values using time, temperature, and group size data.

CS

Crysta Schwartz

8
Whisker Analysis Answer Keys

Reading the Whiskers

A 9th-grade lesson focused on interpreting and comparing multiple box plots to analyze data distributions, spread, and skewness. Students will transition from basic identification to making data-driven conclusions across various scenarios.

KC

Kris Coyne

6