Double Channel Presentation The Double Channel
Unlocking Working Memory with Dual Coding
Memory Challenge: Group A
Round 1
You have 30 seconds to memorize this list of words:
Mountain
Bicycle
Telescope
Pineapple
Compass
Umbrella
Memory Challenge: Group B
Round 2
You have 30 seconds to memorize this list:
Mountain
Bicycle
Telescope
Pineapple
Compass
Umbrella
What is Dual Coding?
The Verbal Channel
Words we read or hear. It's linear and precise, but can get crowded easily.
The Visual Channel
Images, locations, and spatial arrangements. It's fast and sticks longer.
Verbal
Visual
BETTER RETENTION
Two paths to the same memory!
The Working Memory "Bottle-Neck"
5-9 Items MAX
Your working memory can only hold about 7 pieces of information at once.
Dual Coding is a "Hack"
By using both channels, you spread the load, making it easier to hold more complex ideas without feeling overwhelmed.
Think-Pair-Share
In which school subjects do you find it hardest to remember information? Could images help?
Memory Lab Worksheet The Memory Lab
Student Experiment & Strategy Log
Name:
Date:
1
The Recall Challenge
Round 1: Words Only
Write down as many words as you can remember from the first list:
Total Score:
Round 2: Words + Images
Write down as many words/images as you can remember from the second list:
Total Score:
2
The Data Analysis
Which round was easier for you? Why do you think that is?
Think of a difficult concept you are learning in another class right now. How could you "dual-code" it?
Strategy Blueprint: Dual Coding
1. SELECT
Choose the most important text or keywords from your notes.
2. VISUALIZE
Pair each word with a simple icon, arrow, or diagram.
3. CONNECT
Draw lines to show how these verbal/visual pairs relate to each other.
Double Channel Facilitator Guide The Double Channel
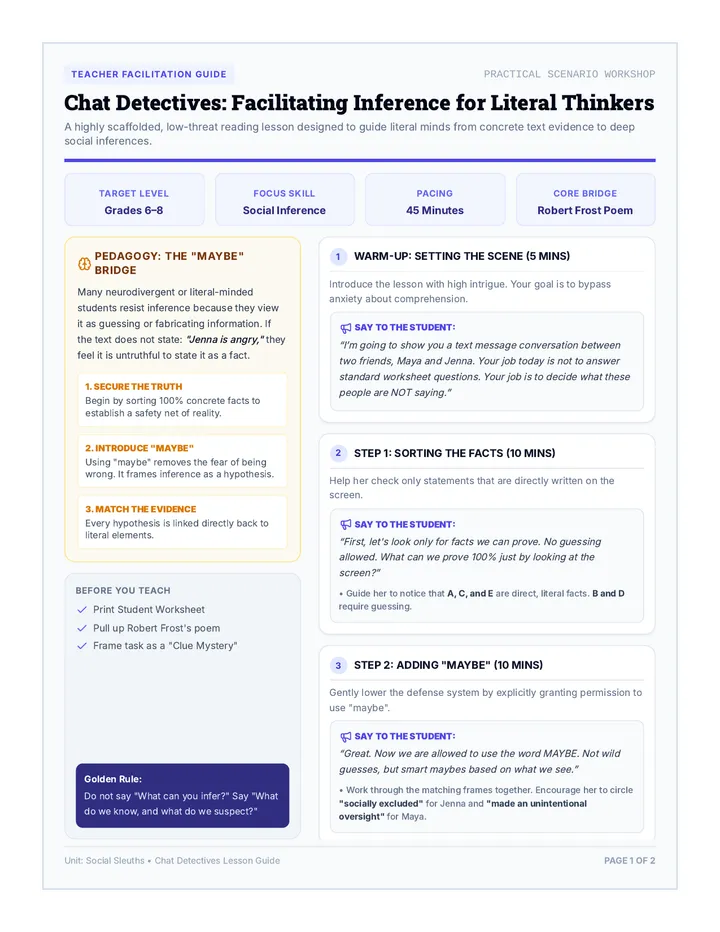
Teacher Facilitation Guide
Lesson
01
Focus
Working Memory Support via Dual Coding Theory
Grade Level
11th Grade (SPED Context)
Materials
Slide Deck, Lab Worksheet, Timers
1
The Memory Experiment (Hook)
Launch the slides. Show Group A the word-only list for exactly 30 seconds. Hide it, and have them write recalls on their worksheet. Repeat for Group B with the word-image list.
Key Insight: Most students will score significantly higher on the second round. Use this to prove the "Double Channel" works immediately.
2
Direct Instruction: The Theory
Explain the "Bottle-Neck" of working memory. Students with executive functioning challenges often feel this bottleneck more acutely.
Verbal: Temporary, linear, easy to forget if not rehearsed.
Visual: Spatial, relational, "sticks" in a different part of the brain.
Combined: Two pathways back to the same concept (backup system).
3
Discussion & Application
Facilitate a discussion about current classes. Which subjects feel "cluttered" with text? How could a simple icon or arrow help "unload" the brain?
Scaffold Suggestion
Provide a "Cheat Sheet" of common icons (arrows, brains, exclamation points) for students who feel they "can't draw."
Extension
Have students find a paragraph in their history textbook and identify 3 key terms to "Dual Code."
Misconception Check
Students often think Dual Coding means "drawing pretty pictures." Emphasize that function matters more than form . A messy arrow that shows a relationship is better than a perfect drawing that tells you nothing. This is a memory tool , not an art project .
Mapping the Mind Presentation Mapping the Mind Maze
Turning Linear Notes into Non-Linear Maps
Lesson 02
The Navigation Test
Option A: Text
"Go down Main St for 3 blocks. Turn left at the blue bakery. Walk until you see a large fountain, then head north for 200 meters. The library is behind the park."
Option B: Map
Main St
Bakery
Fountain
LIBRARY
Which one helps you see the relationships faster?
Why non-linear?
Hierarchy
See what is "Big Picture" and what is a detail.
Connection
See how two separate ideas actually link up.
Rapid Review
Scan 20 minutes of notes in 20 seconds.
Linear Reading = Cognitive Load
Your brain has to keep "re-reading" to find connections.
The Architect's Toolkit
Nodes
The "What". Concepts, key terms, or main ideas. Keep them short!
Links
The "Why". Arrows or lines showing the flow of information.
Linking Words
The "How". Small words on the lines like "leads to" or "caused by" .
Your Mission
We are going to take a dense paragraph about Urban Heat Islands and map it out. No full sentences allowed—only connections!
10 Minutes
Pencil & Paper
Text to Map Challenge PROJECT: TEXT-TO-MAP CONVERSION
Urban Planning Challenge
Decoding the "Urban Heat Island" Concept
Architect:
Date:
Step 1: The Input (Linear Text)
"Cities are often much warmer than the surrounding rural areas, a phenomenon known as the Urban Heat Island effect . This occurs because urban surfaces, like asphalt and concrete , absorb and retain heat from the sun. Furthermore, cities lack the vegetation found in nature, which usually provides shade and cools the air through a process called evapotranspiration . As a result, energy demand for air conditioning increases, which leads to higher greenhouse gas emissions , further warming the climate."
Step 2: The Blueprint (Non-Linear Map)
RULE: NO FULL SENTENCES
URBAN HEAT ISLAND
[ DRAW NODES FOR MATERIALS, CONSEQUENCES, AND SOLUTIONS. USE ARROWS TO SHOW RELATIONSHIPS. ]
Relational Check
Look at your map. Can you find one "Indirect" connection? (Example: How asphalt eventually leads to greenhouse gases).
Memory Channel
Which specific part of your map is the most memorable "visual anchor" for you? Why?
Mapping the Mind Facilitator Guide Mapping the Mind Maze
Teacher Facilitation Guide
Lesson
02
Focus
Relational Thinking & Spatial Organization
Skill
Synthesizing linear text into hierarchical maps
Duration
45-60 Minutes
1
The Navigation Hook
Use the slides to present the "Text vs Map" challenge. Ask students: "If you were in a hurry, which one would you choose?" Connect this to how our brains feel when scanning a whole page of notes before a test.
2
Modeling the Anatomy
Introduce the components: Nodes (What), Links (Why), and Linking Words (How). On the board, quickly map a non-academic example, like "The Avengers" or "Making a Sandwich."
Teacher Tip: Focus on the linking words . Students often just draw lines without saying what the relationship is. Force them to write verbs like "Causes," "Includes," or "Opposes."
3
The Text-to-Map Challenge
Hand out the worksheet. Students must map the "Urban Heat Island" paragraph. Remind them: no full sentences. If they start writing a sentence, tell them to "break it into nodes."
Differentiation Strategies
Student Need Adjustment Motor/Writing Struggle Provide pre-cut sticky notes with the key terms printed on them. Student only has to arrange them and draw the lines. Overwhelmed by Text Highlight the key terms in the paragraph before giving it to them. Provide only 3 key terms to start with. Advanced Learner Challenge them to find a solution for the heat island effect and add a new branch to the map.
Time Travels Presentation Time Travels
Visualizing Chronology and Cause-and-Effect
Lesson 03
The Comic Strip Challenge
?
?
?
?
If you saw these out of order, how would you know which one comes first? Look for the visual clues.
Spatial Encoding
Your brain treats Time like Space.
When we place events along a line, our brain uses spatial memory to remember the sequence.
"Left to Right" or "Top to Bottom" isn't just a design choice—it's a memory shortcut.
Start
Process
Result
The Visual Shorthand
The Link
Simple Connection
Possible Connection
Strong Cause/Effect
Key Moments
Crisis / Trigger
Resolution
Social Group
Conflict
Story Stream
We are going to map the events of a short story using spatial arrangement and icons instead of just a list of dates.
Pick up the "Story Stream" worksheet.
Story Stream Worksheet Story Stream Chronology
Sequential Logic Exercise
Observer:
Period:
THE NARRATIVE
"First, the drought struck the valley, causing the crops to wither and the well to dry up. Desperate, the villagers held a meeting to decide their next move. They decided to send a small group to the northern mountains to seek help from the High Elders. After three days of trekking through harsh terrain, they reached the peak. The Elders gave them ancient seeds and a new irrigation plan. The group returned, planted the seeds, and by autumn, the harvest was twice as large as before."
Visual Timeline Blueprint
Event
Cause/Effect
Stage 1
Stage 2
Stage 3
Stage 4
Stage 5
START
FINISH
Relational Reasoning
Which event on your timeline was the most critical "turning point"? How did you represent that visually to make it stand out from the others?
Time Travels Facilitator Guide Time Travels
Teacher Facilitation Guide
Lesson
03
Focus
Sequential Logic & Spatial Reasoning
Skill
Mapping cause-and-effect in narrative or history
Objective
Reduce cognitive load during complex sequencing
1
The Comic Hook
Use the slides to show the scrambled comic panels. Have students discuss what visual cues (lighting, background changes, movement) tell them the order. This activates their "Visual Channel" before moving to text.
2
Teaching "Visual Connectors"
Introduce the idea that lines aren't just lines. A thick line might mean a huge impact; a dotted line might mean a small connection. Use the "Story Stream" icons (Crisis, Resolution, etc.) to give them a visual vocabulary.
Teacher Tip: Encourage students to "stack" events that happen at the same time and "spread out" events that take a long time. This adds a layer of spatial depth to their memory.
3
The Story Stream Activity
Students read the "Drought and Seeds" paragraph and map it onto the timeline. Challenge them to use at least one unique icon for each of the five stages.
Verbal vs. Spatial Check
Ask a student to recount the story while looking at their map . Then ask another to recount it without a map . The student with the map will typically have more accurate transitions and detail recall.
Watch For
Students getting stuck on drawing. Remind them: "5 second sketch! Speed over beauty."
Key Question
"If Stage 3 never happened, would Stage 5 still be possible?" (Testing cause-effect logic).
Infographic Architect Presentation The Infographic Architect
Distilling Complexity into Visual Clarity
Lesson 04
Design for the Brain
Information Overload
Too many colors, overlapping lines, tiny text, and no clear starting point. This drains working memory.
Visual Distillation
Bold headings, limited color palette, and clear "zones" of information. This supports working memory.
The Architect's Rules
Distill
If you don't need it to understand the core idea, cut it out.
Hierarchy
The BIGGEST text should be the most important idea.
Grouping
Use color and boxes to show which things belong together.
Turning Numbers into Images
Why write "75%" when you can show it?
"The brain processes visual information 60,000 times faster than text."
Parts of a Whole
Comparisons
Change Over Time
Social Patterns
Architect Mission
You are going to take a topic from another class (Biology, History, Math) and design a one-page infographic .
Complex Info
Visual Guide
Infographic Architect Template Infographic Architect
One-Page Visual Distillation Template
Designer:
Subject:
Core Concept
What is the ONE thing someone MUST remember?
Key Data Points
The Visual Blueprint
[ Distill | Arrange | Illustrate ]
Main Header Zone
Data Viz Area
Central Visual
Anchor
Bold Hierarchy
Icons over Text
Empty White Space
2-3 Main Colors
Infographic Architect Facilitator Guide The Infographic Architect
Teacher Facilitation Guide
Lesson
04
Focus
Information Hierarchy & Visual Distillation
Skill
Distilling complex topics into essential visual components
Output
One-page study guide infographic
1
Analyzing Design
Show the "Design for the Brain" slide. Ask: "Why is the first map exhausting?" Lead them toward identifying that every detail is competing for the same amount of attention. Infographics solve this by creating a pathway for the eye.
2
The "Distillation" Workshop
Pick a complex topic (e.g., Photosynthesis). As a class, brainstorm all the details. Then, cross off everything that isn't absolutely "Core." You should be left with 3-5 main points and a few numbers.
Teacher Tip: For 11th graders, this is the hardest part. They feel like they need to write everything to get credit. Remind them that white space is a tool that allows the brain to rest and focus.
3
Building the Blueprint
Students use the template to plan and then draw. Provide colored pencils, but limit them to 3 colors total. This forces them to use color strategically (e.g., all "Problems" are red, all "Solutions" are green).
Quick-Check Rubric
Hierarchy
Is the main idea 3x larger than the details? Can I see it from across the room?
Distillation
Are there more icons/charts than full sentences? Is the text "bite-sized"?
Grouping
Are related ideas boxed together or colored the same? Is the logic clear?
Live Sketching Presentation Live Sketching
Active Listening Through Visual Notes
Lesson 05
The "Charlie Brown" Effect
TALK TALK TALK
Listening to a 45-minute lecture is one of the hardest tasks for sustained attention.
Why Sketching Works:
Keeps your hands active (prevents zoning out).
Forces you to summarize in real-time.
Creates a visual memory map of the talk.
The Sketch-Note Kit
Containers
Boxes, clouds, and bubbles to hold your ideas.
Connectors
Arrows and lines to show the "Flow" of the talk.
Icons
Simple 5-second drawings (brains, lightbulbs, clocks).
The "Listen-Distill-Draw" Loop
1. Listen
Wait for a key idea
2. Distill
Pick 3-5 words
3. Draw
Quick sketch + label
Rule: Don't try to draw EVERY sentence. Just the BIG ideas.
Simulation Start
We are going to watch a short 3-minute video. Your goal is to fill your "Field Kit" with at least 5 sketchnote elements.
READY? PEN TO PAPER.
Sketchnote Field Kit Worksheet Sketchnote Field Kit
Active Listening Tools
Listener:
Part 1: Shorthand Warmup
Draw 3 Containers
Draw 3 Connectors
Write "IMPORTANT"
[ Use Bold or Caps ]
Draw an "Idea"
Live Capture Zone
Listen | Distill | Draw
Start Center & Branch Out
Post-Game Analysis
How many times did your mind wander during the video? Did the act of drawing help you "come back" to the content faster?
Goal Met?
"I have 5 distinct visual ideas on this page."
YES
ALMOST
Live Sketching Facilitator Guide Live Sketching Skills
Teacher Facilitation Guide
Lesson
05
Focus
Active Listening & Sustained Attention
Skill
Real-time synthesis of auditory information
Tech Needed
Short Video (3-5 min) - Student choice or teacher provided
1
The Auditory Overload Talk
Discuss the "Charlie Brown" effect. Many 11th graders with working memory issues struggle during long teacher-led lectures. Explain that Sketchnoting isn't just "doodling"—it's a way to keep the brain's "Visual Channel" occupied so the "Verbal Channel" doesn't get overwhelmed.
2
Technique Warmup
Run through the three elements: Containers , Connectors , and Icons . Model them on the board. Show how a cloud can turn a boring word into an "Important Concept." Show how an arrow can link two clouds together.
Crucial Instruction: Tell students they are allowed to spell things wrong. They are allowed to draw "ugly" things. The only rule is that it has to make sense to them tomorrow.
3
Live Simulation
Play a short, information-dense video (TED-Ed or similar). Students must live-sketch the content. Walk around the room and praise those who are using arrows and boxes, even if they aren't drawing "pictures."
Debrief Question Bank
"Did you find yourself listening for specific words so you knew when to draw a box?" (This is selective attention).
"Look at your page. Where is the most important part? Why did you put it there?" (This is spatial memory).
"How would you use this in your hardest class next week?" (This is transfer of skills).