Figure Us Out Slides FIGURE US OUT
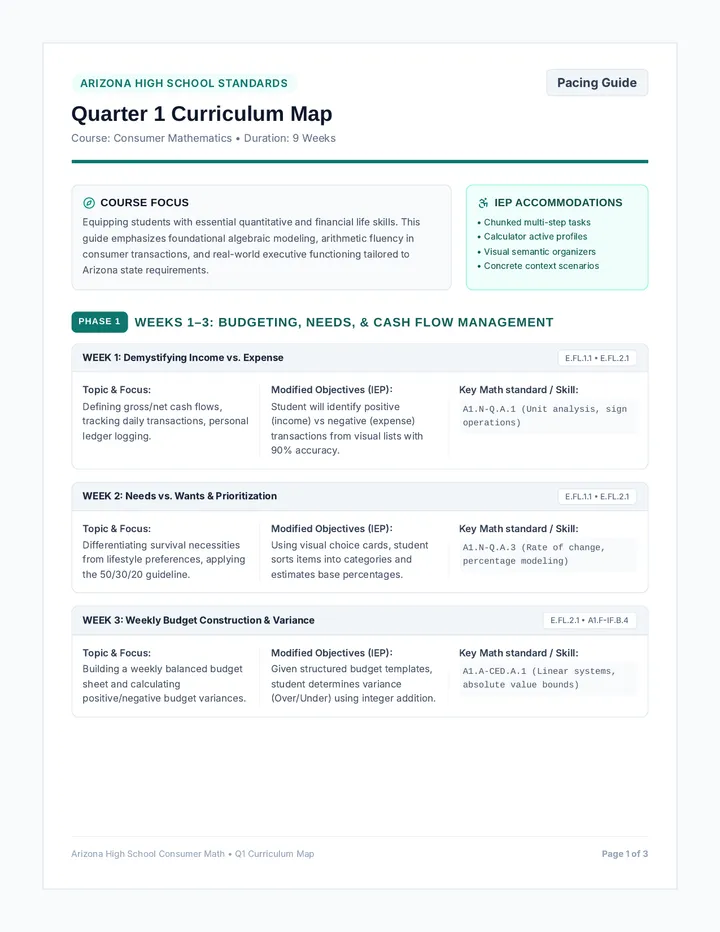
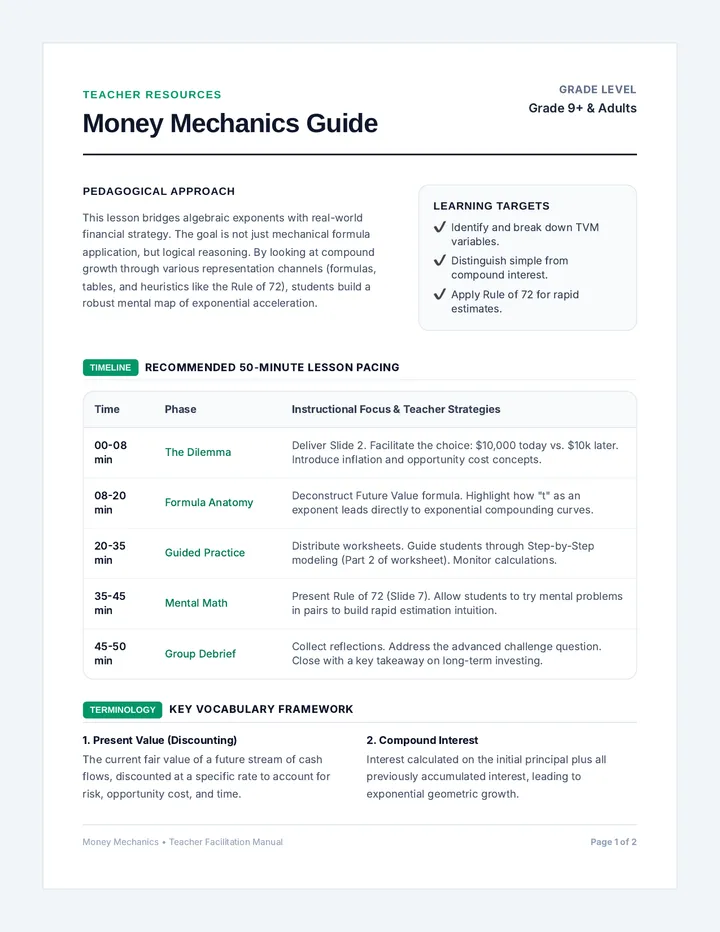
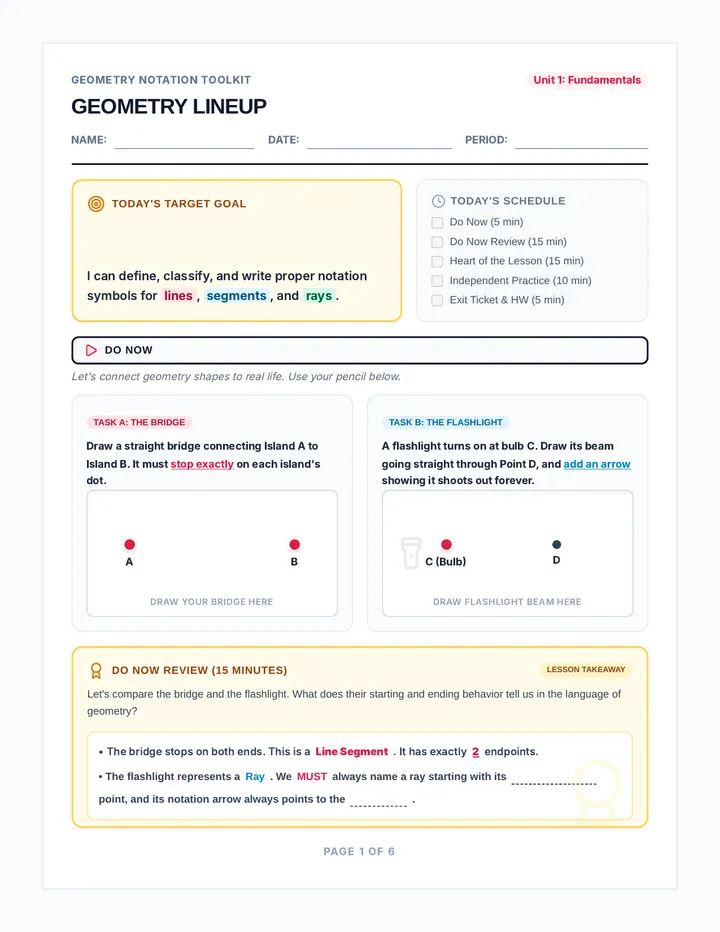
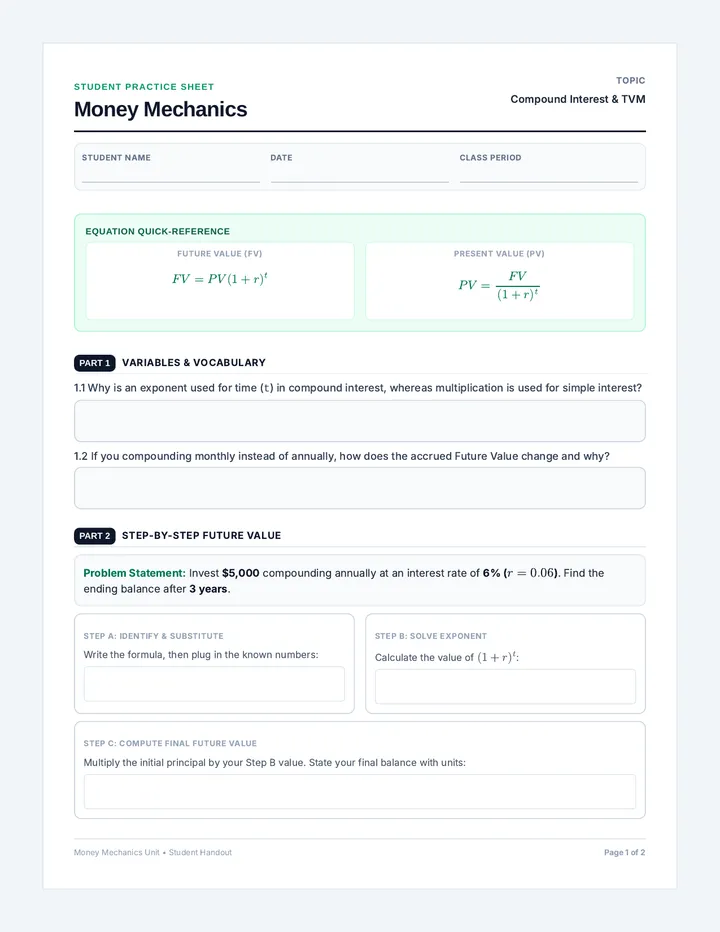
DAY 1: THE SUM OF US
FIGURE US OUT
Let's rewrite the math story. We aren't just memorizing formulas; we're analyzing our community, mapping our stories, and building together.
Subject
High School Mathematics
Challenge
Classroom Data Mapping
Let's Begin →
FIGURE US OUT
MATH MYTHS
Busting the Myths
Math anxiety is incredibly common. But most of what we think about "math people" is completely made up.
"Mistakes aren't failures—they are physical evidence of your brain growing and building new pathways."
MYTH:
"You're either a math person or you aren't."
Everyone's brain can learn high-level math with time and support.
FACT:
"Math is about depth, not speed."
The best mathematicians think deeply, slowly, and creatively.
High School Icebreaker Slide 2 of 5
FIGURE US OUT
THE MISSION
Today's Quest: The Sum of Us
1
Connect & Collect
Interview five peers. Gather data points like commute times, music volume, or creative traits.
2
Graph the Pattern
Map your peer group's data using creative coordinate graphs or custom data visualizers.
3
Find the Center
Calculate the average, notice outlier values, and explain what your graph shows about your squad.
Data & Representation Focus Slide 3 of 5
FIGURE US OUT
METRIC IDEAS
Data Ideas to Gather
You aren't restricted to boring surveys! Pick metrics that show your class's true personality.
Keep measurements fun, polite, and inclusive!
⏱️
Daily Commute
Minutes from home
🎧
Music Power
Avg. tracks per day
🌶️
Spice Tolerance
Scale of 1 to 10
👁️
Screen Time
Self-estimated hours
Get creative with your statistical metrics! Slide 4 of 5
FIGURE US OUT
GETTING STARTED
Grab Your Peer Pattern Sheet!
You have 15 minutes to meet five peers, record your stats, sketch your creative data plot, and calculate your group sum.
5 Peer Interviews
1 Custom Graph Plot
Infinite Math Potential
Get up, mingle, and make calculations! Slide 5 of 5
Peer Pattern Sheet FIGURE US OUT
Name:
Date:
Period:
Peer Pattern Sheet
Day 1 Challenge: Gather statistics, plot correlations, and map our math community.
Level 1: Statistics
PART 1
Mingle and Gather (Data Collection Table)
Interview five peers. Choose two numerical metrics to collect from each (e.g., commute minutes, hours of music, cups of water, estimated daily steps in thousands, spicy tolerance scale 1-10).
No. Peer Classmate Name Metric A: ________________ Metric B: ________________ 1 2 3 4 5
PART 2
Creative Data Plot (Scatter / Coordinate Graph)
Plot Metric A along the horizontal axis (x-axis) and Metric B along the vertical axis (y-axis). Draw appropriate scales, label axes, and plot your five points!
Y-Axis:
— Max
— 0
0 Max
X-Axis:
PART 3
Summary Statistics & Analysis
Calculate Mean
Find the mathematical average of Metric A and Metric B for your squad of five.
Metric A Mean:
Metric B Mean:
Analyze Correlation
Describe the pattern. As Metric A values increase, what generally happens to Metric B values?
FIGURE US OUT • COMMUNITY DATA ANALYSIS Page 1 of 1
Sum of Us Teacher Guide FIGURE US OUT
TEACHER-FACING MATERIAL
Sum of Us Teacher Guide
Instructional pacing, mindset talking points, and facilitation framework for Lesson 1.
Pacing & Strategy
Duration 45-60 Minutes
Group Size Whole Class / Pairs
Materials Slides & Worksheets
Key Goal Reduce Math Anxiety
Core Learning Objectives
Relational: Cultivate a low-stakes environment to introduce peers and initiate cooperative conversations.Mindset: Define math anxiety and introduce neuroplasticity (brain-growth through trial & error).Mathematical: Collect raw statistics, design appropriate axis scales, map points, and compute the arithmetic mean.
Pacing & Facilitation Blueprint
10 MIN
Mindset Intro & Mythbusting (Slides 1 & 2)
Address the elephant in the room: math anxiety. Tell students explicitly: "In this class, we care about your logic, ideas, and growth, not your processing speed." Share the concept of mental neural-pathway expansion.
20 MIN
Data Gathering Mingle (Slides 3 & 4)
Distribute the Peer Pattern Sheet . Set a strict timer. Challenge students to gather metrics. Emphasize that they must have a polite conversation with each classmate, not just hand over sheets.
15 MIN
Scale, Plot, & Calculate (Slide 5)
Guide students in choosing reasonable intervals for their x and y axes. This is often a major pain-point for high schoolers. Walk around and assist with calculating the mean (sum divided by 5).
10 MIN
Class Debrief & Synthesis
Bring the class back together. Call on a few students to share any positive correlations or unusual data patterns they discovered about their mini-communities.
Red Flags: Spotting & Addressing Math Anxiety
Symptom: Defiance / "This is babyish" Typically masks fear of failing publicly. Shift focus immediately to the physical data tracking rather than the math itself. Offer to help label their axes.
Symptom: Absolute Perfectionism Students erasing scales repeatedly to make lines exact. Prompt them: "An approximate, messy graph that tells a true story is worth more than a perfect, sterile one."
Targeted Discussion Starters
Question 1: "Did anyone find a correlation that surprised them? (e.g., commute time and spicy tolerance?)"
Question 2: "Why did we calculate the mean rather than the range? What does the mean say about your team?"
Cooperative Clues Task Cards COOPERATIVE CLUES
STATION CARDS • PART A
Instructions: Set these cards up around the classroom. At each station, teams work together to solve the puzzle and record their answers on their tracking sheet. Do not write on these cards!
STATION 1
The Handshake Formula
Imagine everyone in your group shakes hands with every other person in the group exactly once. No duplicates.
Challenge Prompts:
If there are 4 people in your group, how many handshakes happen in total?
What if your group had 5 people ?
Can you find a mathematical pattern or rule to solve this for 100 people ?
STATION 2
The Digit Duel
Arrange the digits 1, 2, 3, 4, 5, 6, and 7 into a V-shape of 7 circles (3 on the left arm, 3 on the right arm, and 1 shared vertex at the bottom) so that each arm has the same sum.
Challenge Prompts:
Find one working arrangement where each arm sums to 14 .
Find another arrangement with a different common sum.
What mathematical trick did your group use to place the numbers?
STATION 3
The Grid Lock
A magic square uses the digits 1 through 9 exactly once. The sum of each row, column, and diagonal must equal 15 .
Challenge Prompts:
Which number MUST go directly in the center square of the 3x3 grid, and why?
Solve the entire square. What are the corner numbers?
Is there more than one unique solution, or are they just rotations?
FIGURE US OUT • STATIONS HANDOUT Page 1 of 2
COOPERATIVE CLUES
STATION CARDS • PART B
Instructions: Set these cards up around the classroom. At each station, teams work together to solve the puzzle and record their answers on their tracking sheet. Do not write on these cards!
STATION 4
Visual Patterns
A design of tiles grows: Step 1 has 4 tiles (arranged as a 2x2 square). Step 2 has 7 tiles (2x3 block + 1 on top). Step 3 has 10 tiles (2x4 block + 2 on top).
Challenge Prompts:
How many tiles would be in Step 4 ?
Describe how the pattern grows in your own words (the rate of change).
Write a formula to find the number of tiles in Step N .
STATION 5