Paycheck & Profit Slides 2-Day Career Math Lesson
Paycheck & Profit Math
Demonstrate essential math skills to solve job-specific tasks, analyze business data, and calculate your take-home pay.
Work-Related Math Tasks
Business Data Graphs
Pay Stubs & Net Pay
Day 1 Warm-Up: Why Use Graphs?
Day 1
Write a 4–5 sentence response in your guided notes:
What is the purpose of using graphs? What are pie graphs, line graphs, and bar graphs?
Pie Graph
Line Graph
Bar Graph
Be ready to share one way a business might use a graph.
4-Step Word Problem Strategy
Day 1
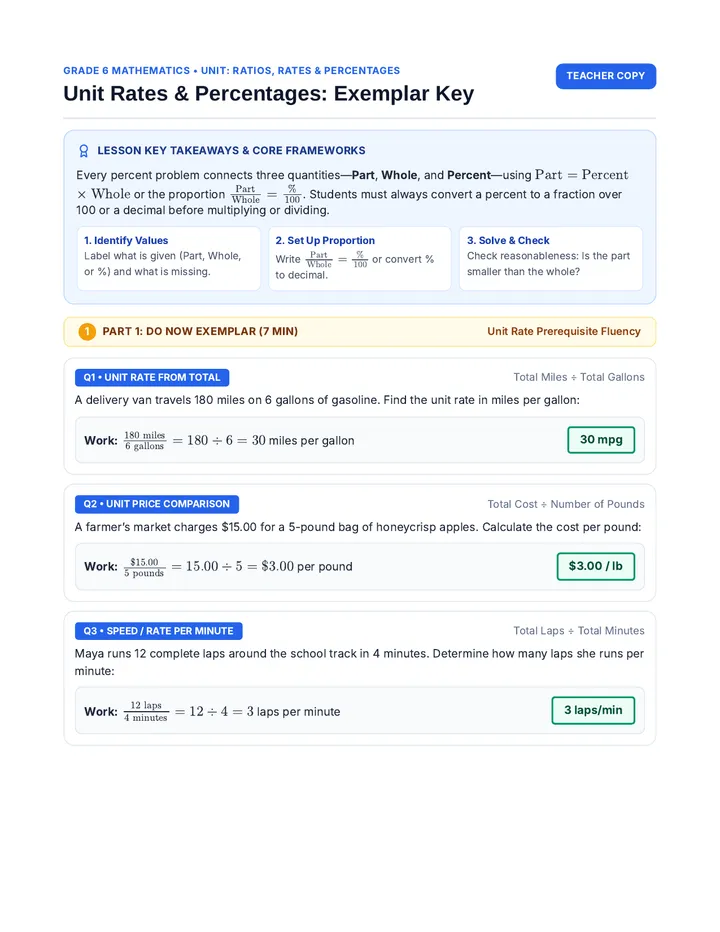
Workplace tasks often use fractions, decimals, percentages, and unit conversions stated in words.
1
Read Carefully
Determine the unknown value you need to find.
2
Identify Given Info
List the numbers given and what is needed to solve.
3
Choose the Formula
Decide the math concept or formula required.
4
Apply & Solve
Calculate carefully and check that your answer makes sense.
Example: Skateboard Sales & Profit
Worked Example
Scenario: Michelle has 520 skateboards priced at $24.25 each. She offers a 20% discount. Supplier cost is $15.00 each.
1. Discounted Price
Discount = $24.25 × 0.20 = $4.85
New Price = $24.25 − $4.85
$19.40 each
2. Sales Revenue
Units × Discounted Price
520 × $19.40
$10,088.00
3. Total Profit
Supplier Cost = 520 × $15 = $7,800
$10,088 − $7,800
$2,288.00
Your Turn: Splitting the Tip
Quick Check
You and three friends (4 people total) have a lunch bill of $93.28 . You want to leave a 25% tip and split the tip equally. How much does each person pay for the tip?
Step 1: Find Total Tip
$93.28 × 0.25 = $23.32
Step 2: Divide by 4 People
$23.32 ÷ 4 = $5.83 each
Rate Computations: Hourly Wages
Day 1
Joana owns an auto repair shop. Multiply Hourly Rate × Hours Clocked to find each worker's weekly wage.
Worker
Hourly Rate
Hours Clocked
Weekly Wage
Worker 1
$18.50
30 hrs
$555.00
Worker 2
$18.50
30 hrs
$555.00
Worker 3
$14.50
40 hrs
$580.00
Worker 4
$14.50
40 hrs
$580.00
Total Weekly Wage Bill: $555 + $555 + $580 + $580 = $2,270.00
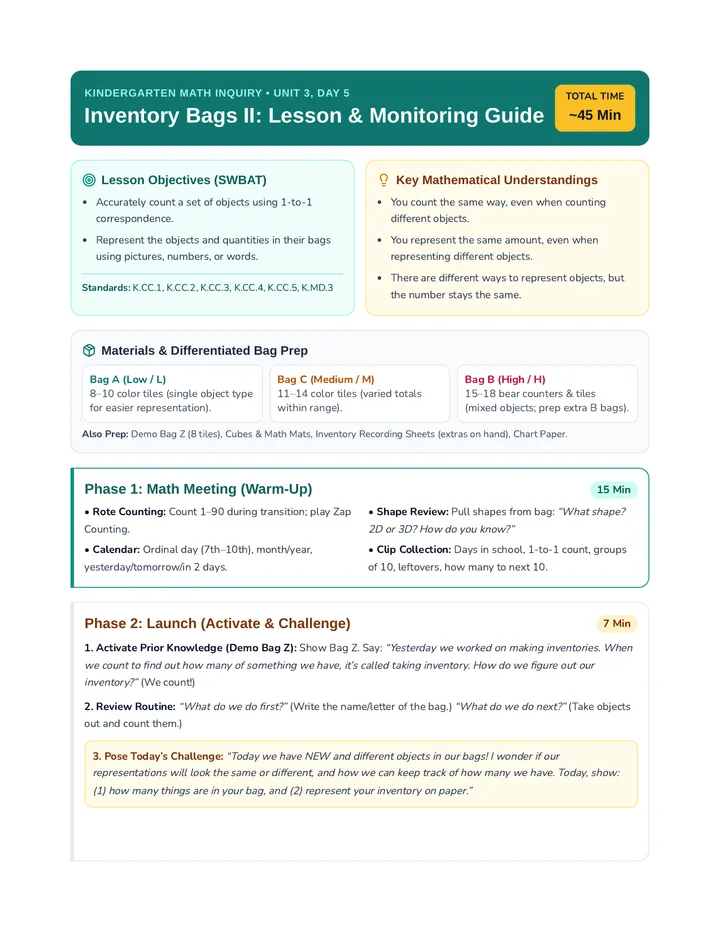
Simple vs. Compound Interest
Day 1
Interest is a percentage of a sum deposited or borrowed. The key difference is how often it is calculated.
Simple Interest
Calculated once on the starting principal (initial deposit or loan).
\(\text{Total Interest} = P \times r \times t\)
Compound Interest
Calculated multiple times on the remaining balance (principal + past interest).
\(A = P\left(1 + \frac{r}{n}\right)^{nt}\)
\(P\) = principal, \(r\) = APR decimal, \(n\) = times/year, \(t\) = years
The Credit Card "Snowball Effect"
Real-World Warning
Example: $1,000 charged on a credit card with 16% APR compounded daily (\(n = 365\)) with no payments made.
After 1 Month (\(t = \frac{1}{12}\))
$1,013.37
You owe $13.37 in interest just in month 1.
After 3 Years (\(t = 3\))
$1,615.90
$615.90 in interest alone—over half the original charge!
Best Practice: Pay off your credit card balance in full every single month to pay $0 interest.
Day 2: Math for Business Analysis
Day 2
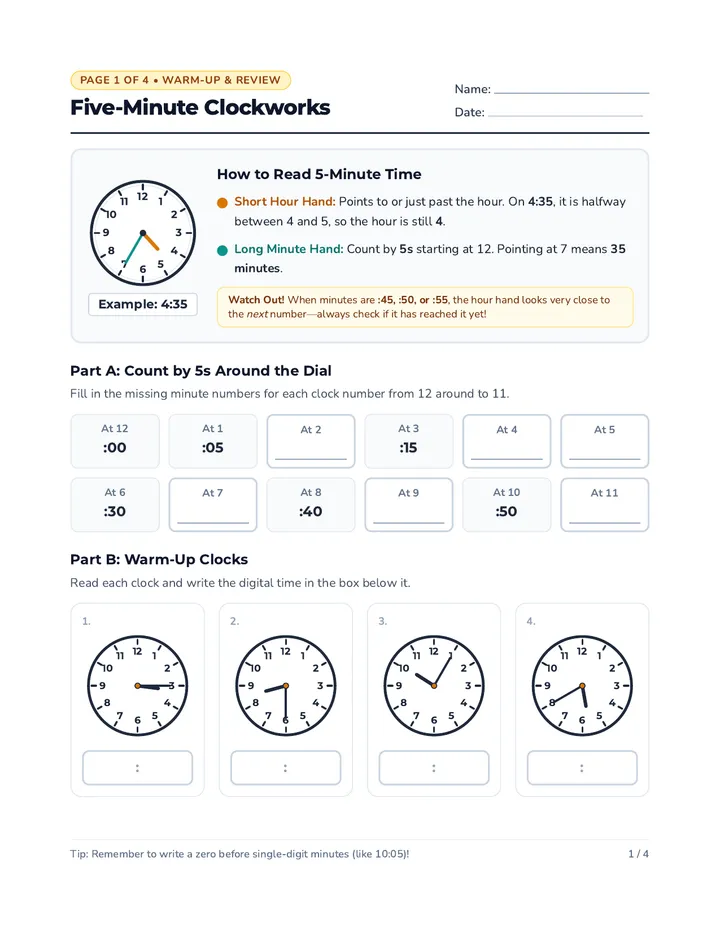
What is a Data Set?
A collection of facts commonly expressed as numerical values (like quarterly profits or unit sales).
Why Use Graphs?
Graphs organize data in a visual format so businesses can quickly spot trends, compare categories, and forecast future performance.
3 Core Business Graphs
Line Graph: Change over time
Pie Graph: Parts of a 100% whole
Bar Graph: Compare categories
Choosing the Right Graph
Day 2
Line Graph
Shows data changing over time . X-axis = time (years/months); Y-axis = numbers.
Example: Asheville, NC population growth (2010–2021).
Pie Graph
Circle = 100% of a whole . Each slice shows a proportional percentage.
Example: U.S. education levels (doctoral degree = 4%).
Bar Graph
Uses rectangular bars to compare distinct categories (X-axis = categories).
Example: Annual pet spending by household size.
Reading a Pay Stub (Earnings Statement)
Day 2
Employer Name & Address
Employee Name, ID & Pay Period
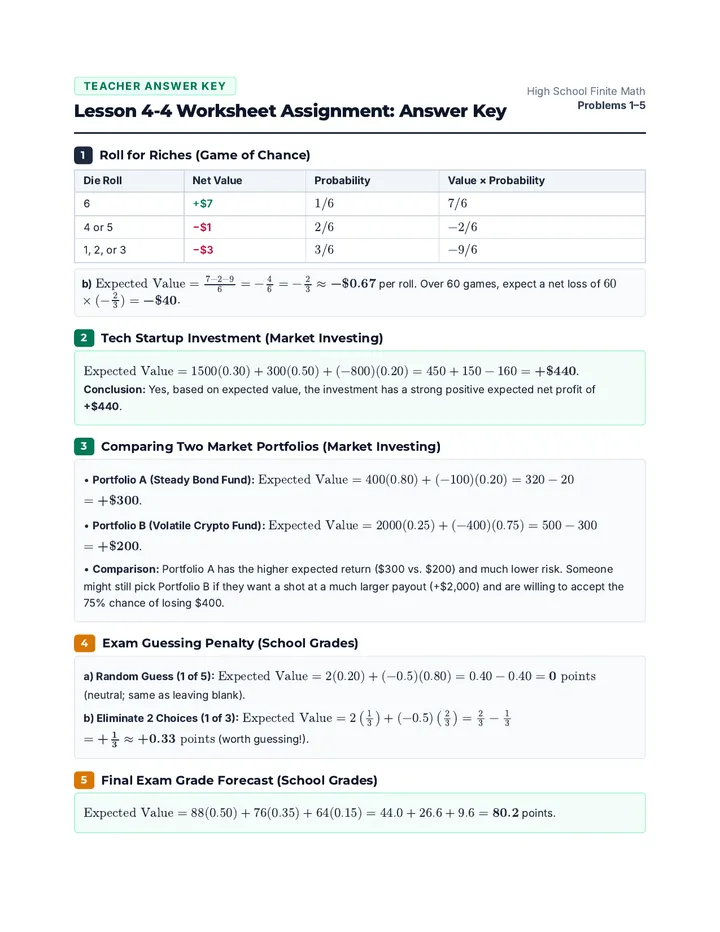
YTD = Year-to-Date Totals
Gross Earnings
Total pay earned before any taxes or deductions are taken out.
Mandatory Deductions
Social Security, Medicare, Federal Income Tax, & State Tax (if applicable).
Net Pay (Take-Home Pay): Gross Pay − Total Deductions
Calculating Net Pay in Action
Worked & Guided
Example: Jenna
$12.50/hr × 40 hours = $500.00 Gross Pay
Total Deductions = $160.00
Net Pay = $500.00 − $160.00
$340.00
Your Turn: Jessica
$15.25/hr × 50 hours = $762.50 Gross Pay
Total Deductions = $65.00
Net Pay = $762.50 − $65.00
$697.50
Lesson Summary & Key Takeaways
Workplace Math
Use the 4-step strategy for discounts, profit, hourly wages, and simple vs. compound interest.
Business Graphs
Line graphs show trends over time; bar graphs compare categories; pie graphs show parts of 100%.
Pay Stubs
Net Pay equals Gross Earnings minus mandatory and optional deductions. Watch YTD totals!
Next Up: Independent Practice Worksheet & Mastery Quiz
Paycheck & Profit Guided Notes 2-Day Guided Notes
Paycheck & Profit Math
Name: _______________________ Date: ____________
Lesson Objectives
• Apply math concepts to solve work-related tasks | • Use graphs to organize and analyze data | • Read a pay stub and calculate net pay
DAY 1 Warm-Up: Why Use Graphs?
What is the purpose of using graphs? What are pie graphs, line graphs, and bar graphs? Write 4–5 sentences.
Part 1: 4-Step Word Problem Strategy
Step 1: Read the problem carefully and determine the _________________________.
Step 2: Identify what information is _________________ and _________________.
Step 3: Decide the _____________________ or _____________________ needed.
Step 4: Apply the math and _____________________ the problem.
Example: Michelle's Skateboard Sales
Michelle has 520 skateboards originally priced at $24.25 each. She offers a 20% discount . Her supplier cost is $15.00 per skateboard.
1. Discounted Price
2. Total Sales Revenue
3. Total Profit
Quick Check (Tip Split): A lunch bill for 4 friends is $93.28 . You leave a 25% tip split equally. How much does each person pay for the tip?
Paycheck & Profit Math — Guided Notes Day 1 Continued
Part 2: Rate Computations (Hourly Wages)
Formula: Weekly Wage = _____________________ × _____________________
Example (Joana's Auto Repair Shop): Calculate each worker's weekly wage and the total weekly wage bill.
Worker
Hourly Rate
Hours Clocked
Weekly Wage
Worker 1
$18.50
30
Worker 2
$18.50
30
Worker 3
$14.50
40
Worker 4
$14.50
40
Total Weekly Wage Bill:
Quick Check (John): John earns $11.50/hr and works 35 hours/week for 4 weeks . What is his total monthly wage?
Part 3: Simple vs. Compound Interest
Interest is a percentage of a sum deposited or borrowed. Complete the comparison below:
Simple Interest
Calculated _____________ on the starting principal.
Formula: \(\text{Total Interest} = P \times r \times t\)
Compound Interest
Calculated ___________________ on the remaining balance.
Formula: \(A = P\left(1 + \frac{r}{n}\right)^{nt}\)
Variables: \(P\) = _______________ \(r\) = _______________ \(n\) = _______________ \(t\) = _______________
Credit Card Snowball Effect: $1,000 at 16% APR compounded daily (\(n = 365\)) with no payments:
1 month: Balance = __________ (Interest = __________) | 3 years: Balance = __________ (Interest = __________)
Quick Check (Freddy's Laptop): Freddy charges $1,218.99 on a credit card at 18% APR compounded daily (\(n = 365\)) for 5 years . How much interest will he pay? (\(A = \$2,997.57\))
Day 2: Business Graphs & Pay Stubs DAY 2
Part 4: Business Data & Graphs
A data set is a collection of facts expressed as _________________________. Businesses use graphs to spot trends and forecast performance.
Graph Type
Best Used For
Key Feature / Example
Line Graph
Pie Graph
Bar Graph
Part 5: Reading a Pay Stub & Calculating Net Pay
Gross Earnings: Total pay earned _________________________ deductions.
Net Pay: Take-home pay = ___________________ − ___________________.
Mandatory Deductions: Social Security, ___________________, Federal & State Income Tax.
YTD (Year-to-Date): Total earnings or deductions for the entire _________________________.
Example: Jenna
Wage: $12.50/hr × 40 hrs .$160.00 . Find Gross & Net Pay.
Your Turn: Jessica
Wage: $15.25/hr × 50 hrs .$65.00 . Find Gross & Net Pay.
Day 2 Wrap-Up: Why is it important to check both Gross Pay and Net Pay on your pay stub?
Paycheck & Profit Notes Key Teacher Answer Key
Paycheck & Profit Notes Key
Page 1 of 3
Warm-Up: Sample Answer
Graphs are pictures that show or represent data. They are used to visually express numbers, comparisons, and differences so they can be quickly read and interpreted. Pie graphs show data as slices of a circle (100%). Bar graphs use bars or columns to compare categories. Line graphs use lines to show how data changes over time.
Part 1: 4-Step Word Problem Strategy
Step 1: Read the problem carefully and determine the unknown value .
Step 2: Identify what information is given and needed .
Step 3: Decide the math concept or formula needed.
Step 4: Apply the math and solve the problem.
Example: Michelle's Skateboard Sales
1. Discounted Price
Discount = $24.25 × 0.20 = $4.85
Price = $24.25 − $4.85
= $19.40 each
2. Total Sales Revenue
Units × Price
520 × $19.40
= $10,088.00
3. Total Profit
Cost = 520 × $15 = $7,800
$10,088 − $7,800
= $2,288.00
Quick Check (Tip Split):
Total Tip = $93.28 × 0.25 = $23.32 → Per Person = $23.32 ÷ 4 = $5.83 each
Paycheck & Profit Notes Key Page 2 of 3
Part 2: Rate Computations (Hourly Wages)
Formula: Weekly Wage = Hourly Rate × Hours Clocked
Worker
Hourly Rate
Hours
Weekly Wage
Worker 1
$18.50
30
$555.00
Worker 2
$18.50
30
$555.00
Worker 3
$14.50
40
$580.00
Worker 4
$14.50
40
$580.00
Total Weekly Wage Bill:
$2,270.00
Quick Check (John): Weekly = $11.50 × 35 = $402.50 → Monthly = $402.50 × 4 = $1,610.00
Part 3: Simple vs. Compound Interest
Simple Interest
Calculated once on the starting principal.
\(\text{Total Interest} = P \times r \times t\)
Compound Interest
Calculated multiple times on remaining balance.
\(A = P\left(1 + \frac{r}{n}\right)^{nt}\)
Variables: \(P\) = principal, \(r\) = APR (decimal), \(n\) = times/year, \(t\) = years
Credit Card Snowball: 1 month: $1,013.37 (Interest: $13.37) | 3 years: $1,615.90 (Interest: $615.90)
Quick Check (Freddy's Laptop): Interest Paid = \(A - P = \$2,997.57 - \$1,218.99 =\) $1,778.58
Day 2: Business Graphs & Pay Stubs — Key Page 3 of 3
Part 4: Business Data & Graphs
A data set is a collection of facts expressed as numerical values .
Graph Type
Best Used For
Key Feature / Example
Line Graph
Showing data changing over time
X-axis = time; e.g., Asheville population 2010–2021
Pie Graph
Showing parts of a 100% whole
Proportional slices; e.g., U.S. education levels
Bar Graph
Comparing distinct categories
Rectangular bars; e.g., pet spending by household size
Part 5: Reading a Pay Stub & Calculating Net Pay
Gross Earnings: Total pay earned before deductions.
Net Pay: Gross Pay − Total Deductions .
Mandatory Deductions: Social Security, Medicare , Federal & State Tax.
YTD (Year-to-Date): Total for the entire year so far .
Example: Jenna
Gross Pay = $12.50 × 40 = $500.00
Net Pay = $500.00 − $160.00 = $340.00
Your Turn: Jessica
Gross Pay = $15.25 × 50 = $762.50
Net Pay = $762.50 − $65.00 = $697.50
Day 2 Wrap-Up Sample Answer:
Checking both ensures your hourly rate/hours were calculated correctly (Gross Pay) and that only the expected taxes and deductions were withheld to give your true take-home amount (Net Pay).
Workplace Math Practice Worksheet Independent Practice
Workplace Math Practice
Name: _______________________ Date: ____________
PART A Discounts, Revenue & Profit
1. A bike shop has 180 helmets in stock originally priced at $36.00 each. To clear inventory, the manager offers a 25% discount . The shop paid its supplier $19.00 per helmet.
a) Discounted Price
b) Total Sales Revenue (all 180)
c) Total Profit
2. Five coworkers go out for a team lunch. The bill comes to $118.40 , and they decide to leave a 20% tip split equally among all 5 people. How much does each person contribute toward the tip?
PART B Hourly Rate Computations
3. Complete the payroll table for a local coffee roastery to find each employee's weekly wage and the total weekly payroll.
Employee
Hourly Rate
Hours Worked
Weekly Wage
Barista A
$15.00
32
Barista B
$16.50
38
Shift Lead
$21.00
40
Total Weekly Payroll:
4. Marcus works as a pharmacy tech earning $19.20/hour for 36 hours per week . What is his estimated 4-week monthly gross income?
Workplace Math Practice — Page 2 Interest, Graphs & Pay Stubs
PART C Simple & Compound Interest
5. You deposit $2,000 into a simple interest account at 4.5% APR for 3 years . How much total interest do you earn?
6. Elena charges $850.00 on a credit card (18% APR, compounded daily). After 2 years with no payments, her balance is $1,218.29 . How much is just interest ?
PART D Choosing the Right Business Graph
7. Write Line Graph , Bar Graph , or Pie Graph for each business scenario:
a) Tracking monthly store revenue from January to December: ______________________
b) Showing the percentage of a company's budget spent on rent, payroll, and supplies: ______________________
c) Comparing total units sold across 5 different store locations: ______________________
PART E Pay Stub & Net Pay Calculation
8. Complete the missing values on Devon's weekly earnings statement below.
Metro Logistics LLC
Employee: Devon Brooks | Pay Period: Nov 1–Nov 7
Rate: $18.00 / hr
Hours Worked: 40
Deductions
Federal Income Tax: $72.00
Social Security & Medicare: $55.08
State Income Tax: $28.92
Total Deductions: ____________
Pay Summary
Gross Pay: __________________
Less Deductions: __________________
Net Pay: __________________
Workplace Math Mastery Quiz Mastery Assessment
Workplace Math Mastery Quiz
Name: ___________________ Date: __________ Score: ____ / 20
Part 1: Multiple Choice (2 points each). Circle the best answer for each question.
1. A store sells backpacks originally priced at $40.00 at a 15% discount. What is the discounted price of one backpack?
A) $6.00
B) $25.00
C) $34.00
D) $38.50
2. Which type of graph is best used to show how a company's monthly sales changed over the past 12 months?
A) Pie graph
B) Line graph
C) Bar graph
D) Scatter table
3. How is compound interest different from simple interest?
A) Simple interest is only used for credit cards, while compound interest is for savings.
B) Compound interest is calculated multiple times on the remaining balance, while simple interest is calculated once on the starting principal.
C) Compound interest always results in a lower total balance than simple interest.
D) Simple interest requires dividing the APR by 365 days every year.
4. On a pay stub, what does "YTD Net Pay" represent?
A) Total pay before taxes for this week
B) Total taxes withheld this pay period
C) Total take-home pay for the year so far
D) Total hourly rate multiplied by 52
5. A pie graph shows a store's sales by category: Electronics (45%), Clothing (30%), Home Goods (15%), and Accessories. What percent of sales are Accessories?
A) 5%
B) 10%
C) 15%
D) 20%
Workplace Math Mastery Quiz — Page 2 Show All Work
Part 2: Workplace Calculations (10 points total). Show your work clearly in each box.
6. (4 points) A campus bookstore buys 200 hoodies from a supplier for $22.00 each and sells all 200 hoodies at a discounted price of $31.50 each .
a) What is the total sales revenue?
b) What is the bookstore's total profit?
7. (3 points) Taylor earns $16.40 per hour working 30 hours per week . What is Taylor's total gross pay for 4 weeks ?
8. (3 points) Jordan worked 40 hours this week at $14.50 per hour . Mandatory deductions (Social Security, Medicare, federal and state taxes) total $118.40 . Calculate Jordan's Gross Pay and Net Pay .
Gross Pay
Net Pay
Check your calculations and include dollar signs ($) where appropriate. Total: 20 Points
Workplace Math Quiz Key Teacher Answer Key
Workplace Math Quiz Key
Page 1 of 2 (20 pts total)
Part 1: Multiple Choice (2 points each = 10 points)
1. Backpack 15% discount ($40.00 original price):
Correct Answer: C) $34.00 — Discount = $40.00 × 0.15 = $6.00; $40.00 − $6.00 = $34.00.
2. Best graph for monthly sales over 12 months:
Correct Answer: B) Line graph — Line graphs show how data changes over time.
3. How compound interest differs from simple interest:
Correct Answer: B) Compound interest is calculated multiple times on the remaining balance, while simple interest is calculated once on the starting principal.
4. Meaning of "YTD Net Pay" on a pay stub:
Correct Answer: C) Total take-home pay for the year so far (YTD Gross Pay − YTD Deductions).
5. Pie graph percentage for Accessories (45% + 30% + 15% = 90%):
Correct Answer: B) 10% — A full pie graph equals 100%, so 100% − 90% = 10%.
Part 1 Subtotal: 10 Points Part 2 on Page 2
Workplace Math Quiz Key — Page 2 Part 2 Solutions (10 pts)
6. (4 points: 2 pts each) Campus Bookstore Hoodies (200 units, $22.00 cost, $31.50 sale price)
a) Total Sales Revenue
200 × $31.50 = $6,300.00
b) Total Profit
Supplier Cost = 200 × $22.00 = $4,400.00
Profit = $6,300.00 − $4,400.00 = $1,900.00
7. (3 points) Taylor's 4-Week Gross Pay ($16.40/hr, 30 hrs/week)
Weekly Wage = $16.40 × 30 = $492.00
4-Week Gross Pay = $492.00 × 4 = $1,968.00
8. (3 points) Jordan's Paycheck (40 hrs at $14.50/hr, $118.40 deductions)
Gross Pay (1.5 pts)
40 × $14.50 = $580.00
Net Pay (1.5 pts)
$580.00 − $118.40 = $461.60
Scoring: Award partial credit for correct setup with minor arithmetic errors. Total: 20 Points