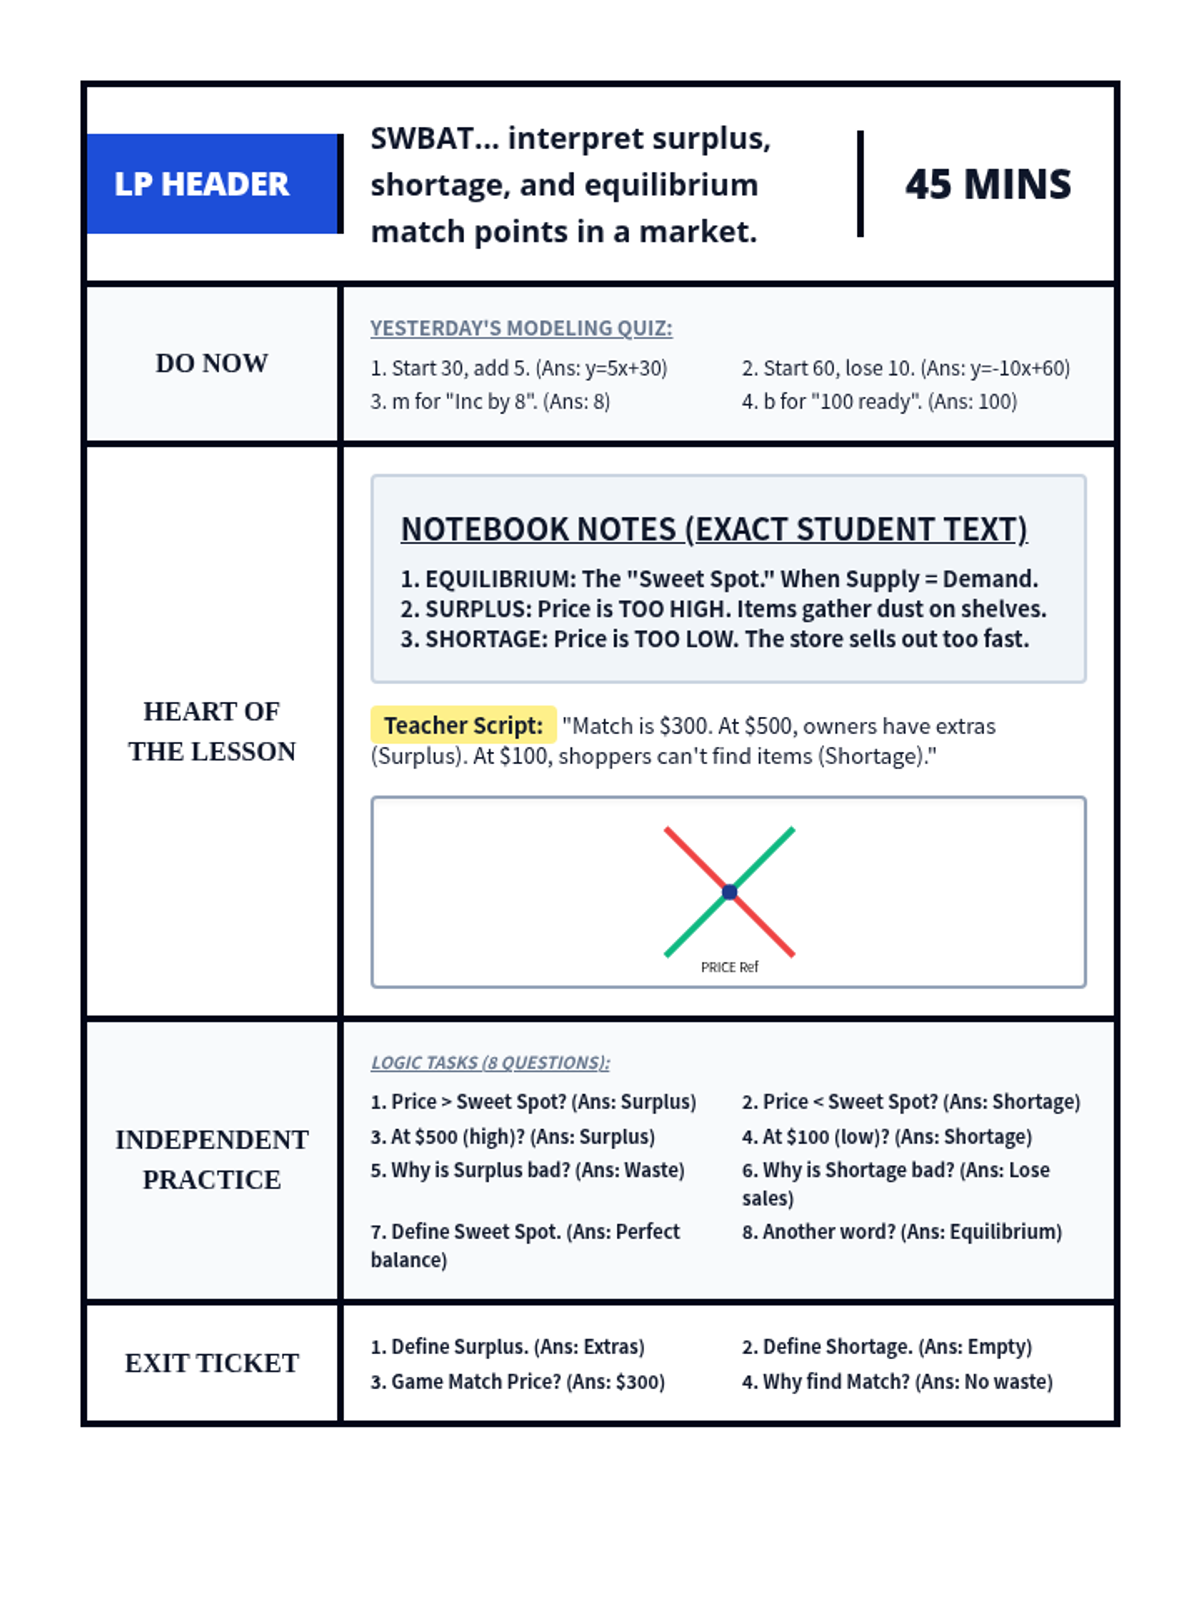
Students create and compare multiple sets of data tables for supply and demand to identify the market equilibrium price where quantities match.
A focused lesson on the Central Limit Theorem (CLT) and its application to real-world datasets. Students practice calculating Z-scores for sample means and using Z-tables to determine probabilities.
A lesson focused on fundamental statistical concepts including sampling distributions and the visual representation of data using histograms.
A concise lesson reviewing advanced statistical concepts including population parameters, sample statistics, and the behavior of sampling distributions.
A focused practice session on calculating probabilities and z-values for normal distributions, based on medical and abstract data.
A focused lesson on calculating and interpreting z-scores and normal distributions using real-world scenarios from the textbook. Students will practice converting between raw scores and z-scores and determine the "unusualness" of specific data points.
An immersive, station-based experience where students rotate through various cryptographic challenges, using letter ciphers, symbol keys, and logic puzzles to earn their 'Shadow Agent' status.
This lesson covers the fundamentals of normal distributions, including identifying bell curves, applying the empirical rule, and interpreting control charts for real-world data analysis.
Students plot two linear equations on a single coordinate plane to find the point of intersection and identify the equilibrium price and quantity visually.
A 9th grade Algebra lesson focused on translating real-world scenarios (media, sports, food) into a system of two linear equations, specifically designed for Special Education students with IEP supports.
Students interpret the meaning of the point of intersection, surplus, and shortage in the context of a real-world market.