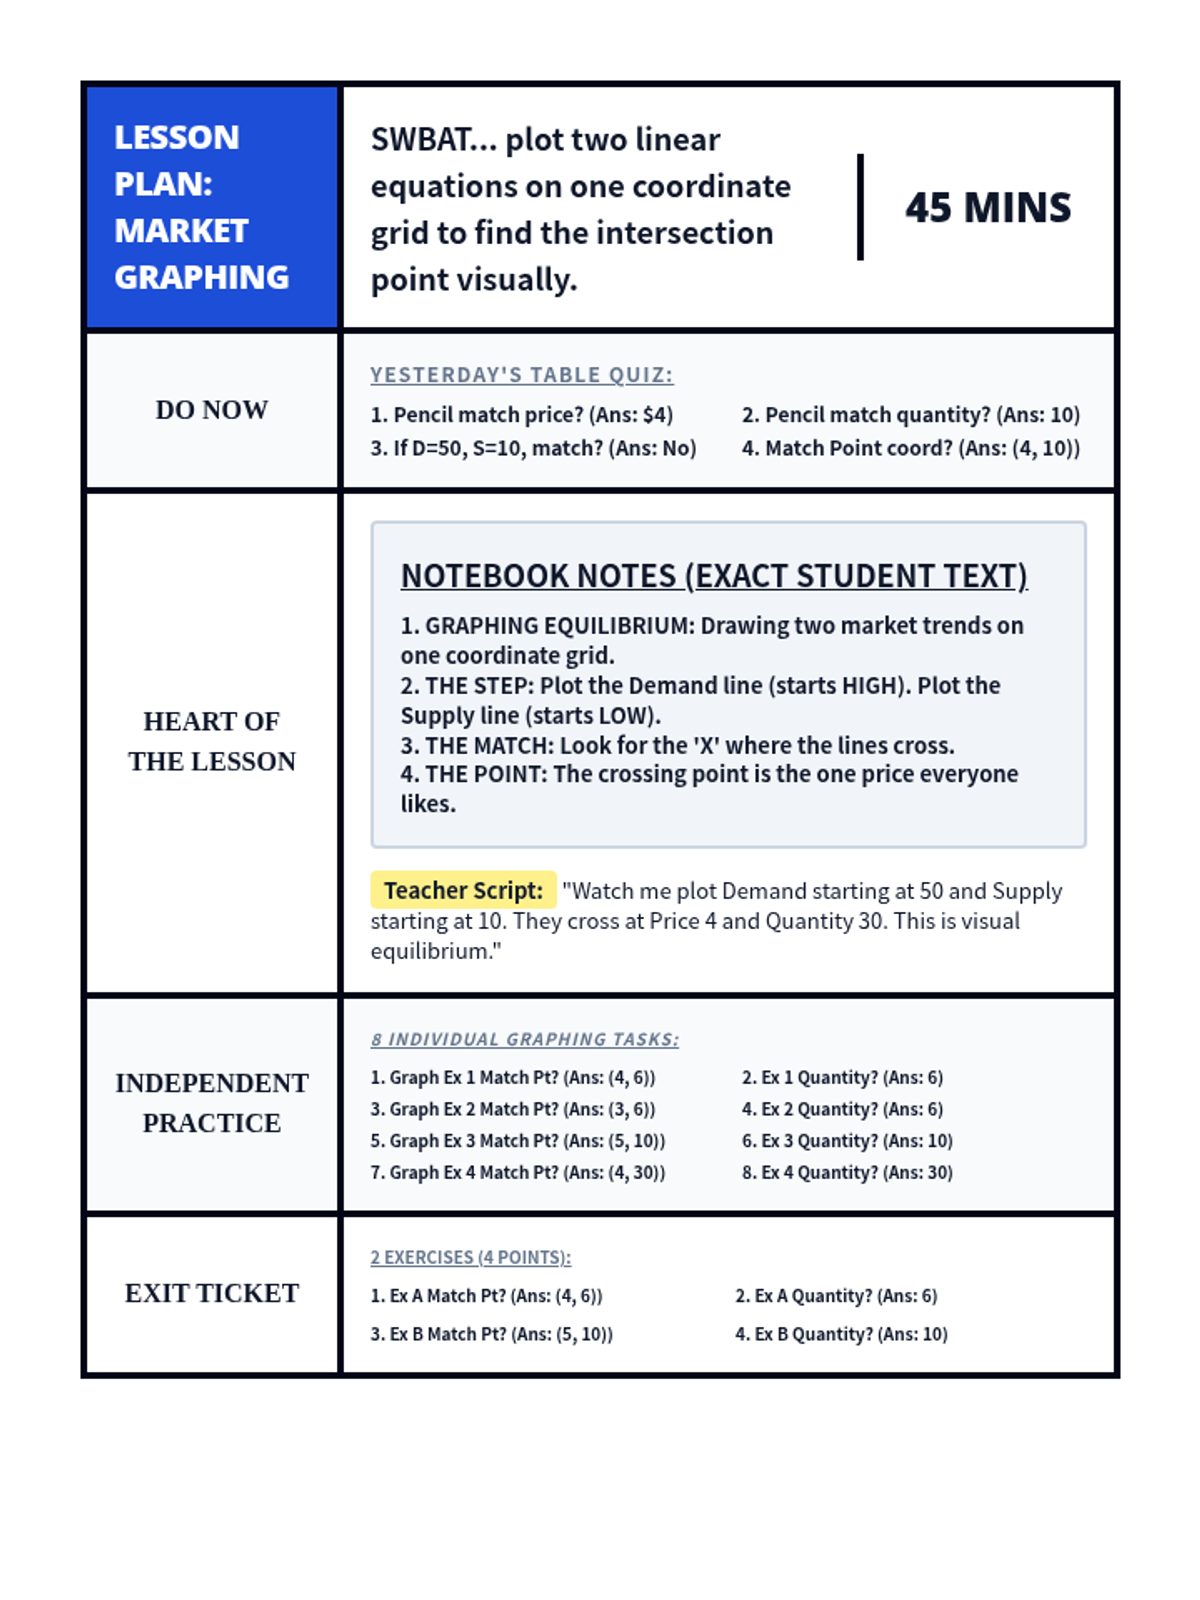
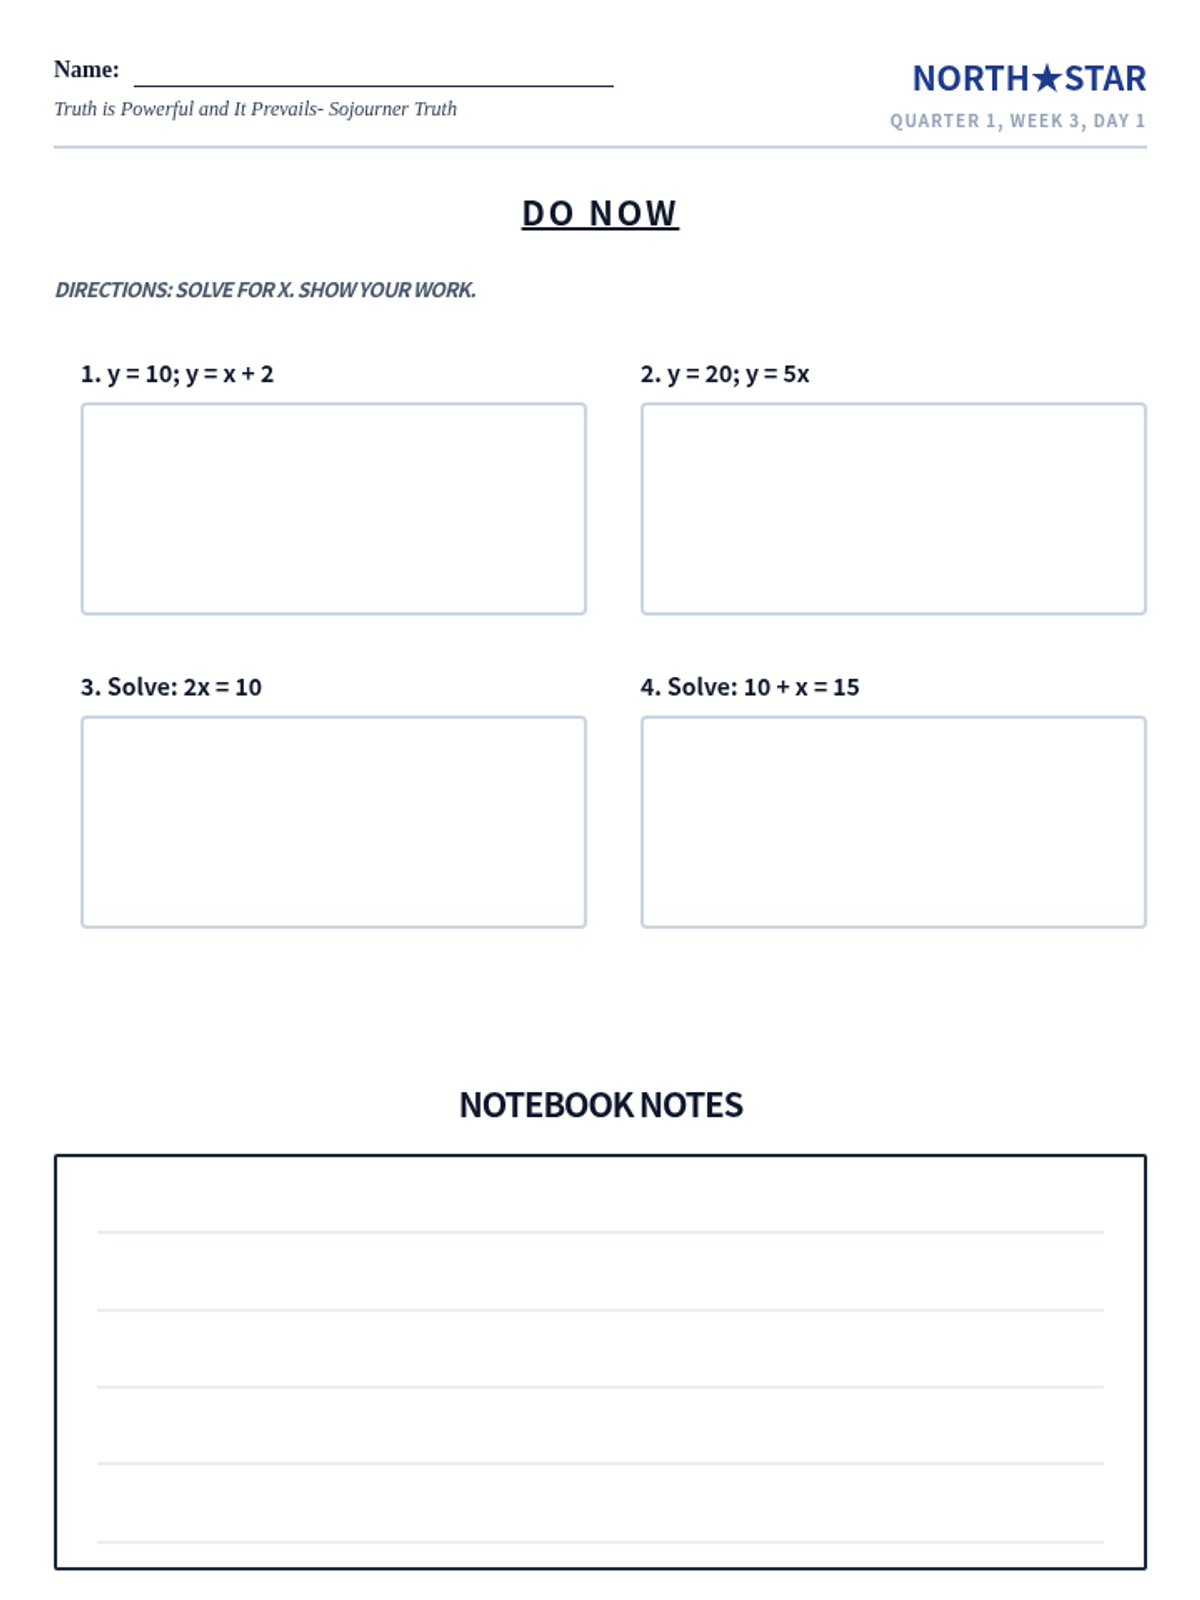
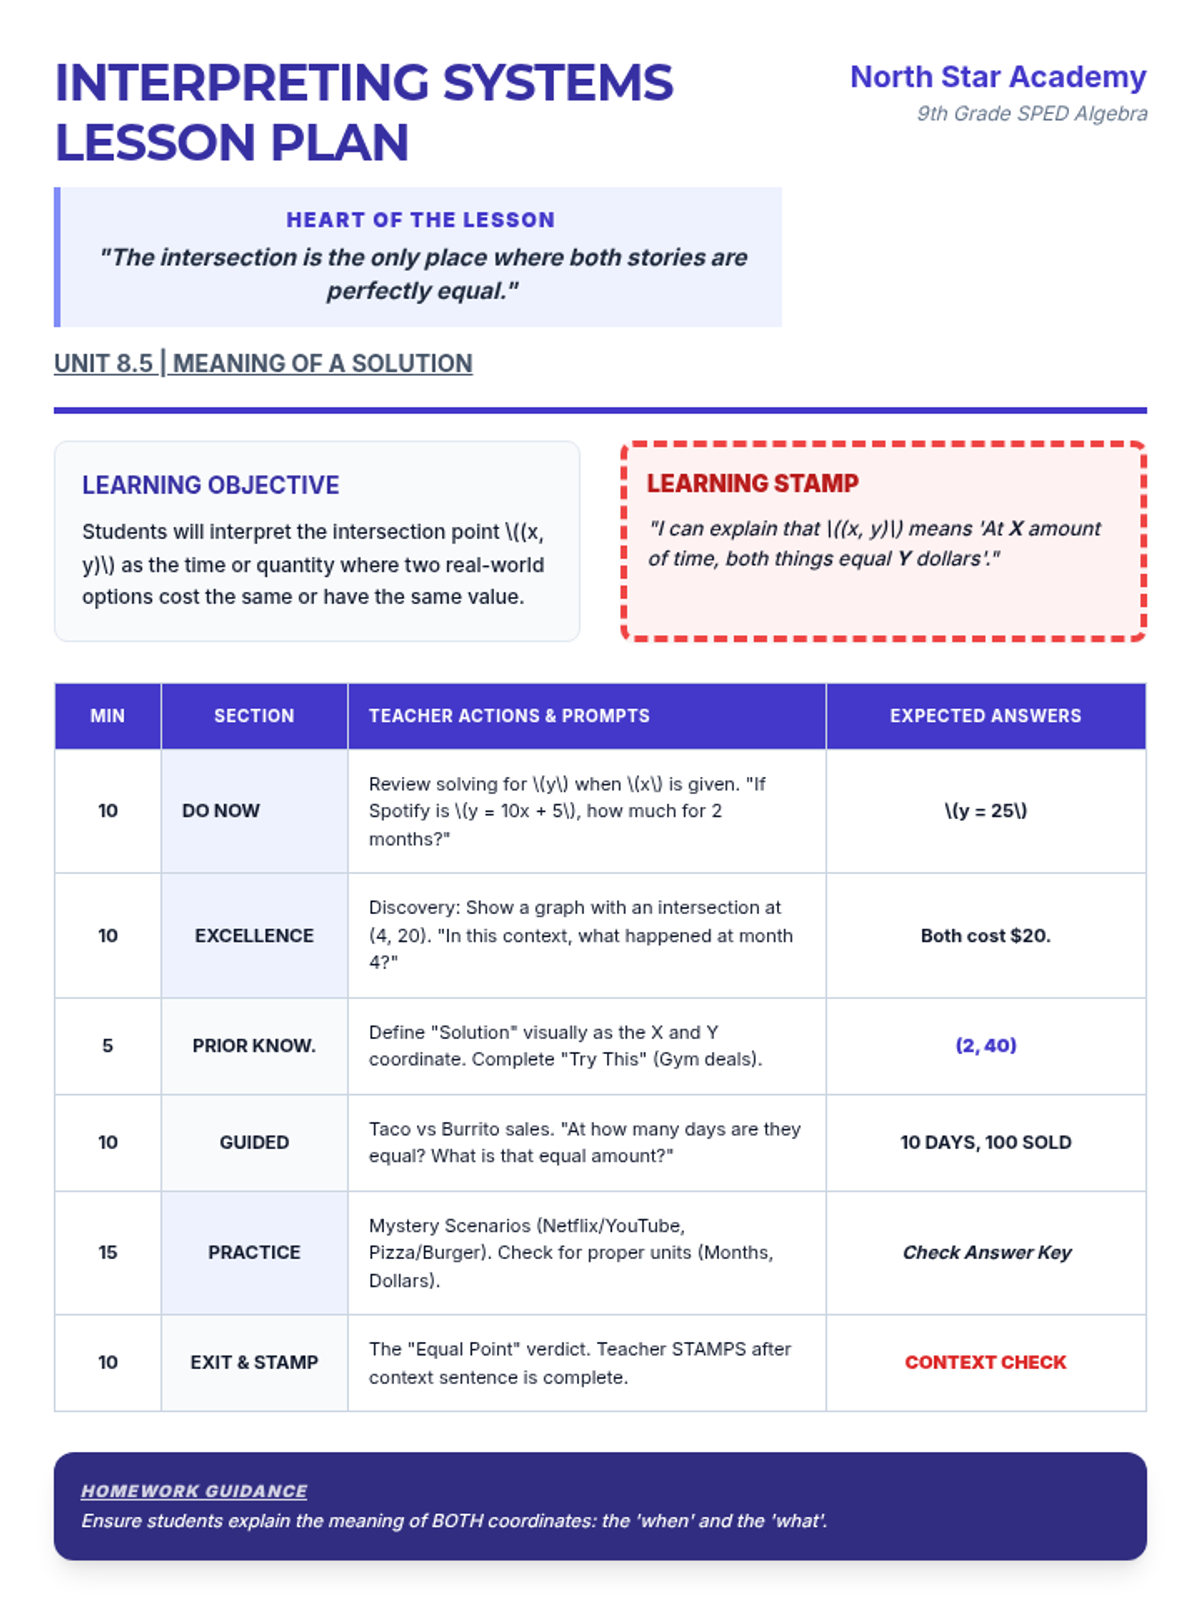
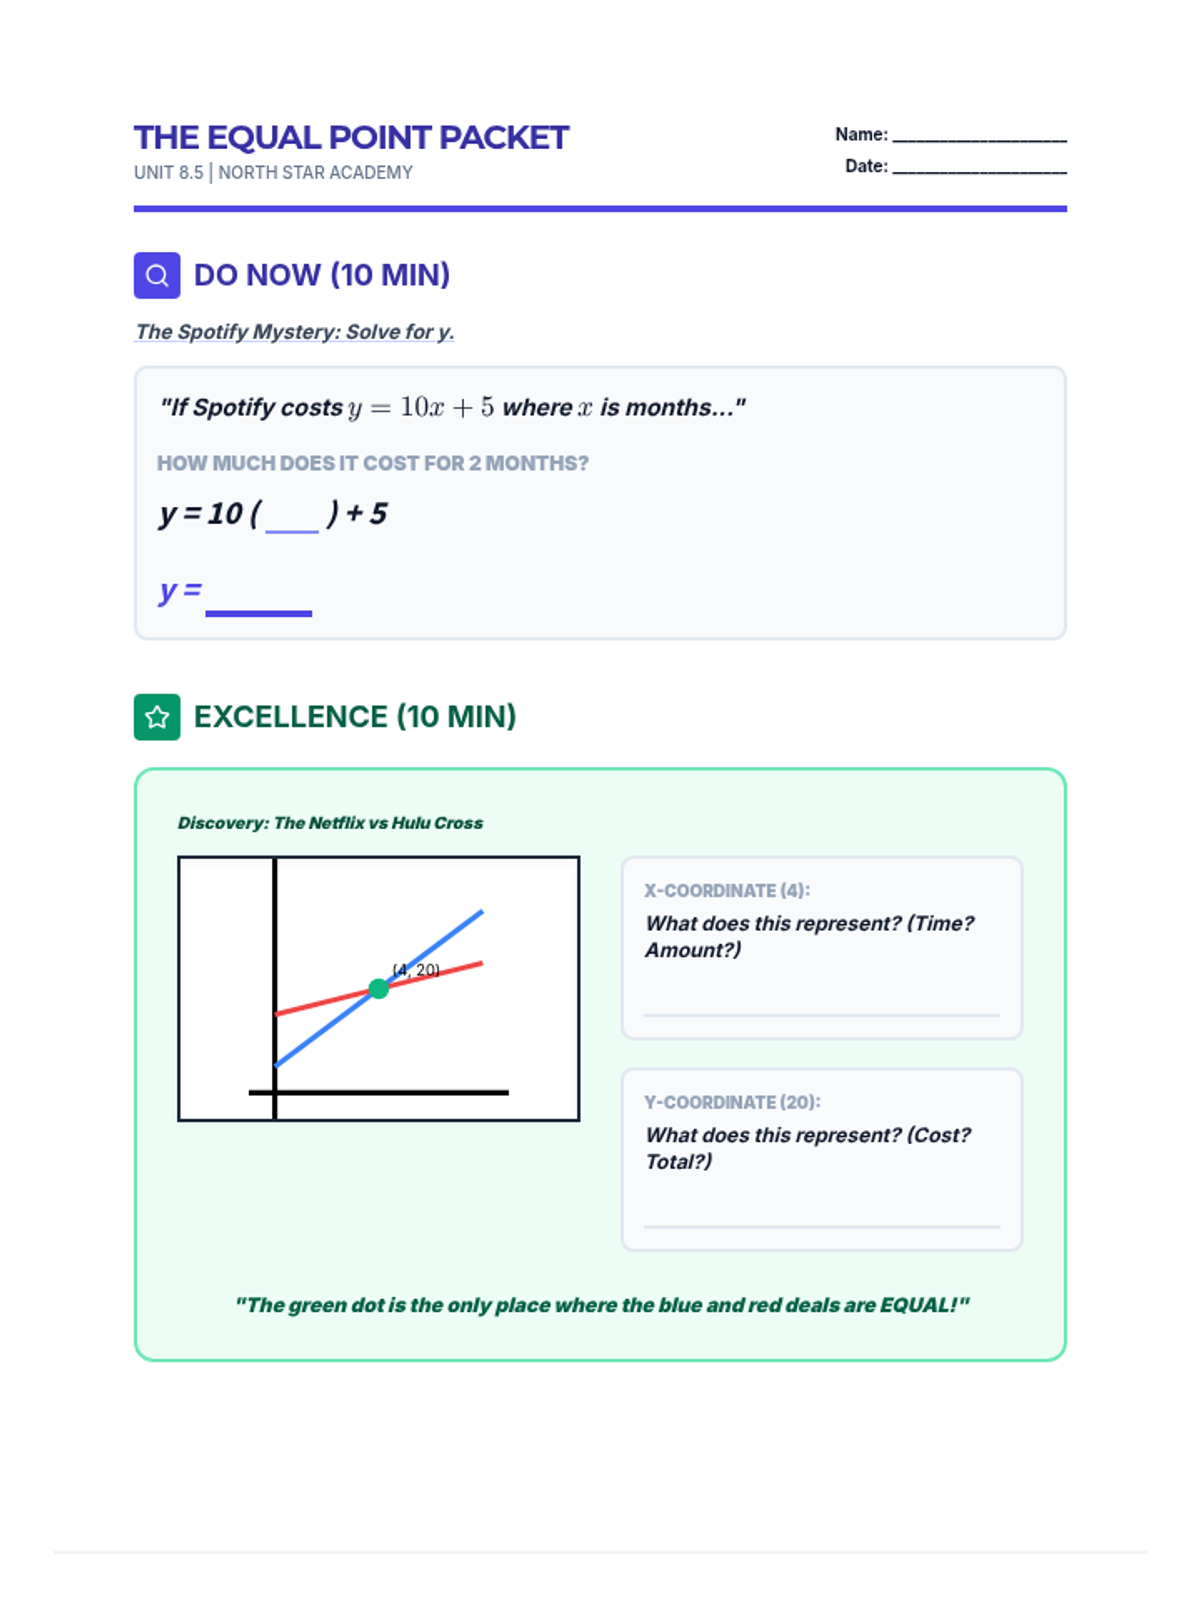
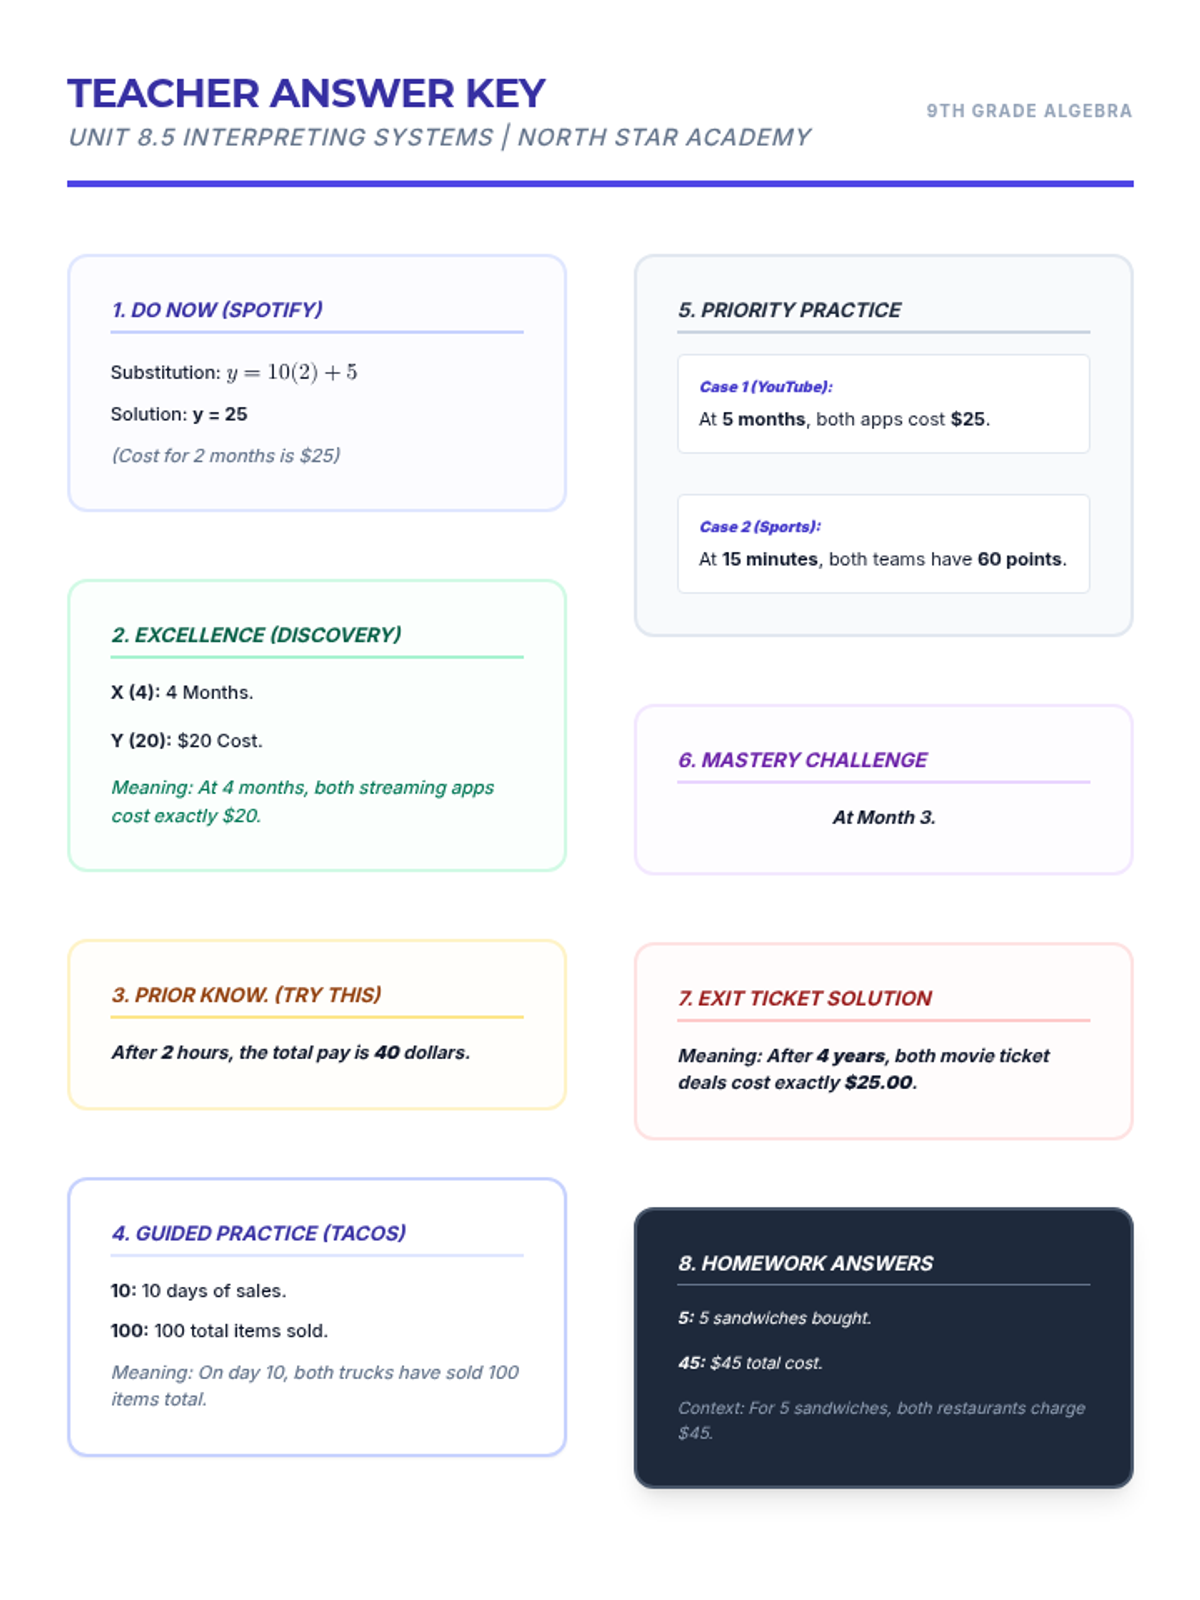
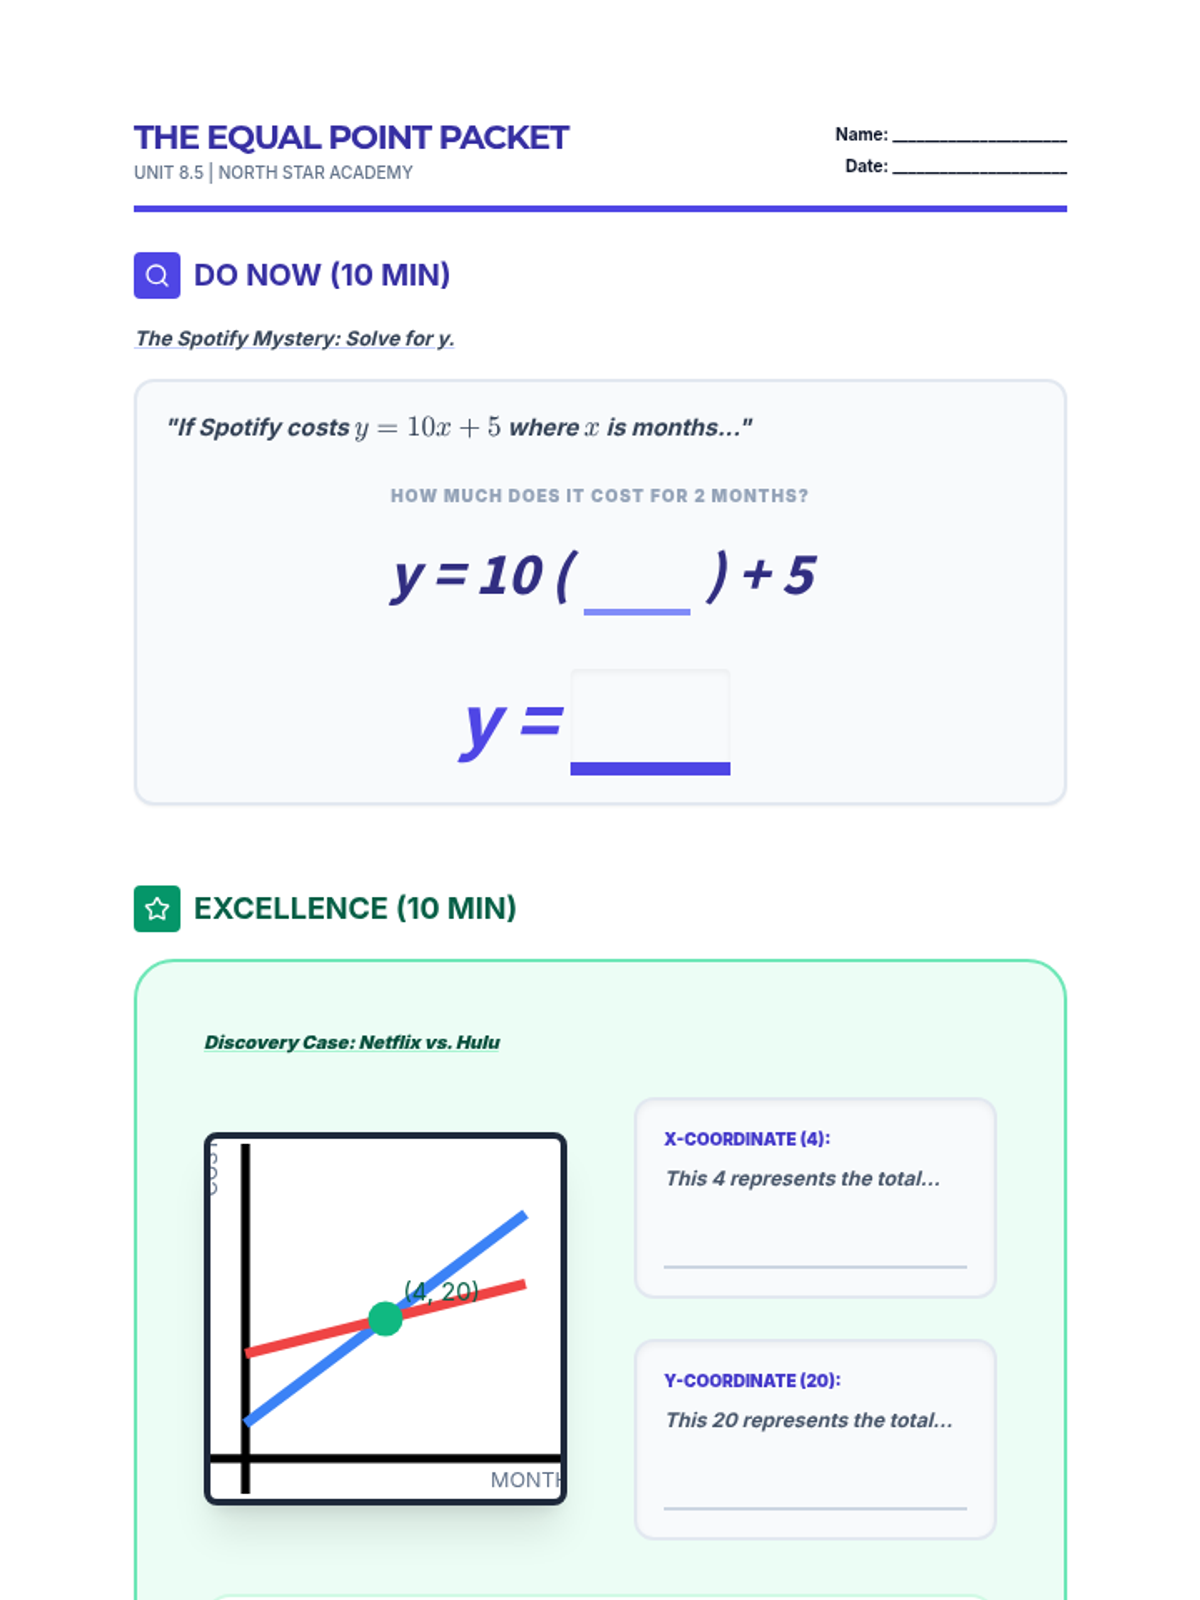
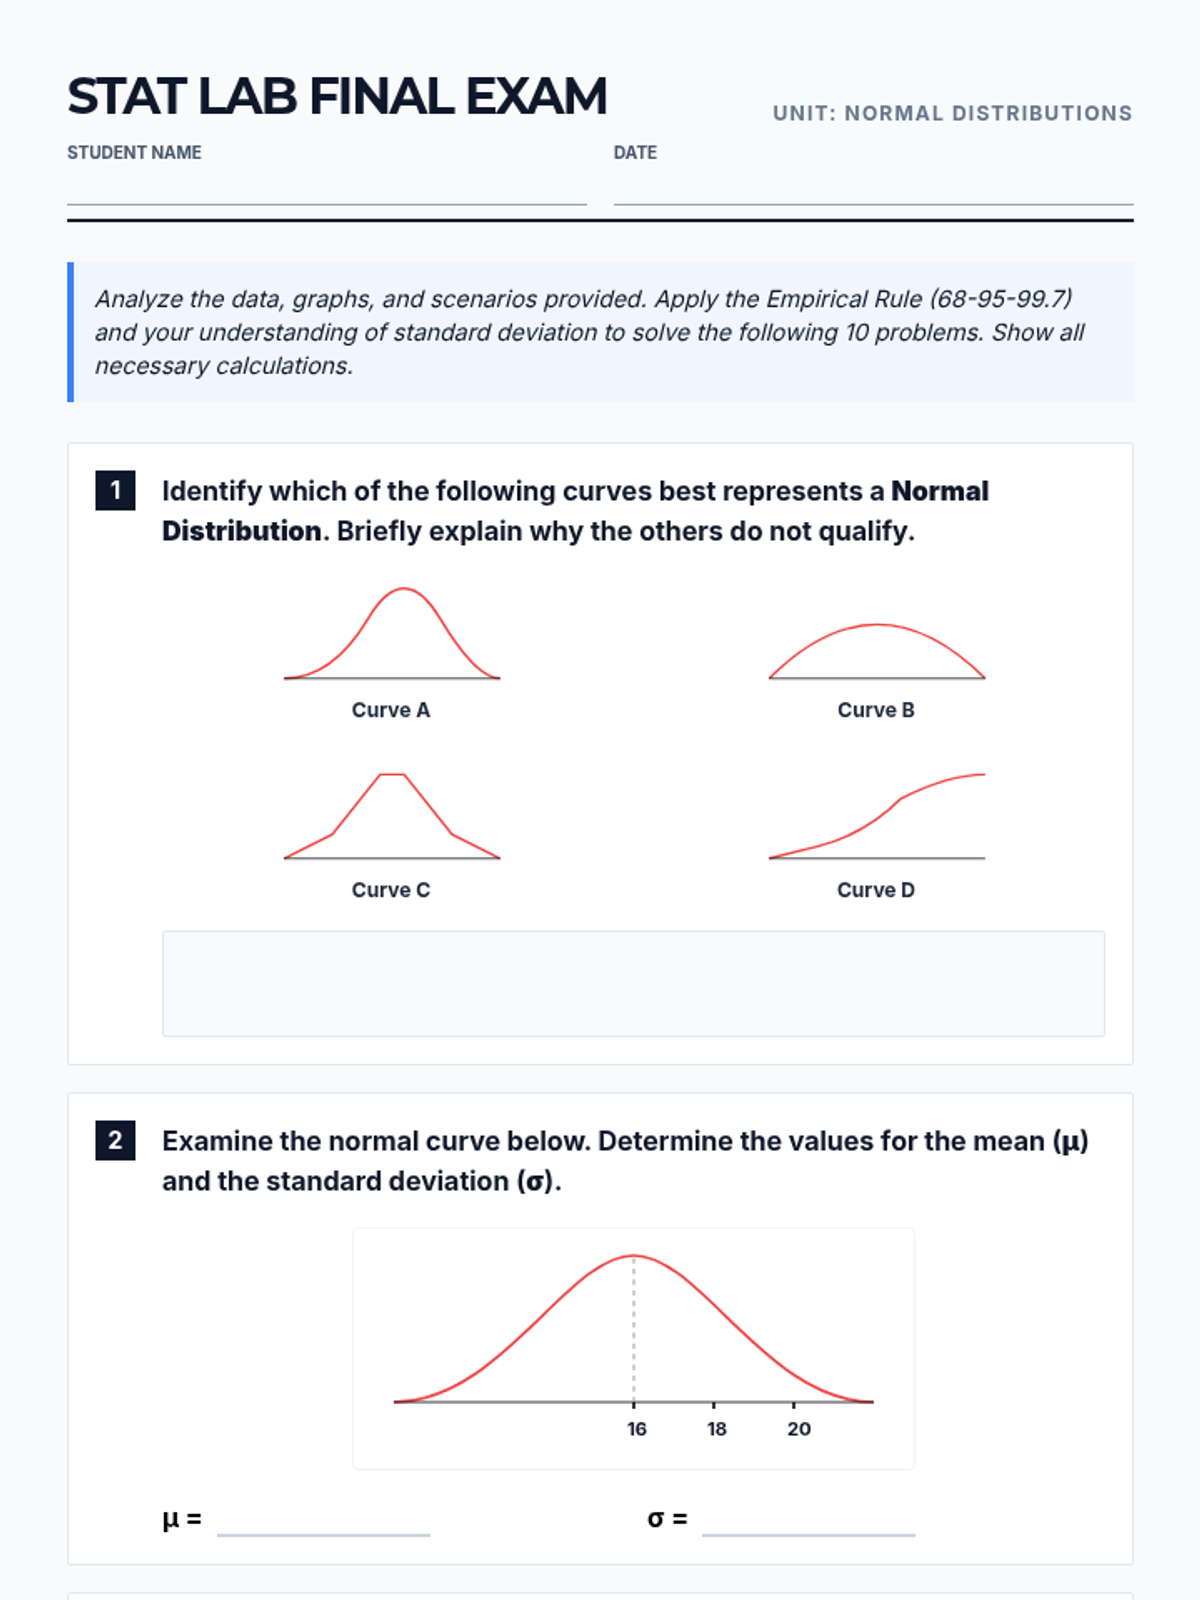
A 9th grade Algebra lesson focused on translating real-world scenarios (media, sports, food) into a system of two linear equations, specifically designed for Special Education students with IEP supports.
A lesson focused on fundamental statistical concepts including sampling distributions and the visual representation of data using histograms.
A focused practice session on calculating probabilities and z-values for normal distributions, based on medical and abstract data.
An immersive, station-based experience where students rotate through various cryptographic challenges, using letter ciphers, symbol keys, and logic puzzles to earn their 'Shadow Agent' status.
This lesson covers the fundamentals of normal distributions, including identifying bell curves, applying the empirical rule, and interpreting control charts for real-world data analysis.
Students plot two linear equations on a single coordinate plane to find the point of intersection and identify the equilibrium price and quantity visually.
Students interpret the meaning of the point of intersection, surplus, and shortage in the context of a real-world market.
Students create and compare multiple sets of data tables for supply and demand to identify the market equilibrium price where quantities match.
Students define supply and demand and learn to solve for the point of intersection algebraically by setting equations equal.
Students learn the requirements for the Price Patrol project and begin planning their grocery catalog, including selecting categories, items, and pricing strategies.
A high-energy 'Scoot' game where students solve two-step equations with fractional coefficients, using a construction-blueprint theme to build algebraic fluency.
A 9th grade Algebra lesson focused on interpreting the intersection point of a system of equations in a real-world context (media, sports, food), specifically designed for Special Education students with IEP supports.