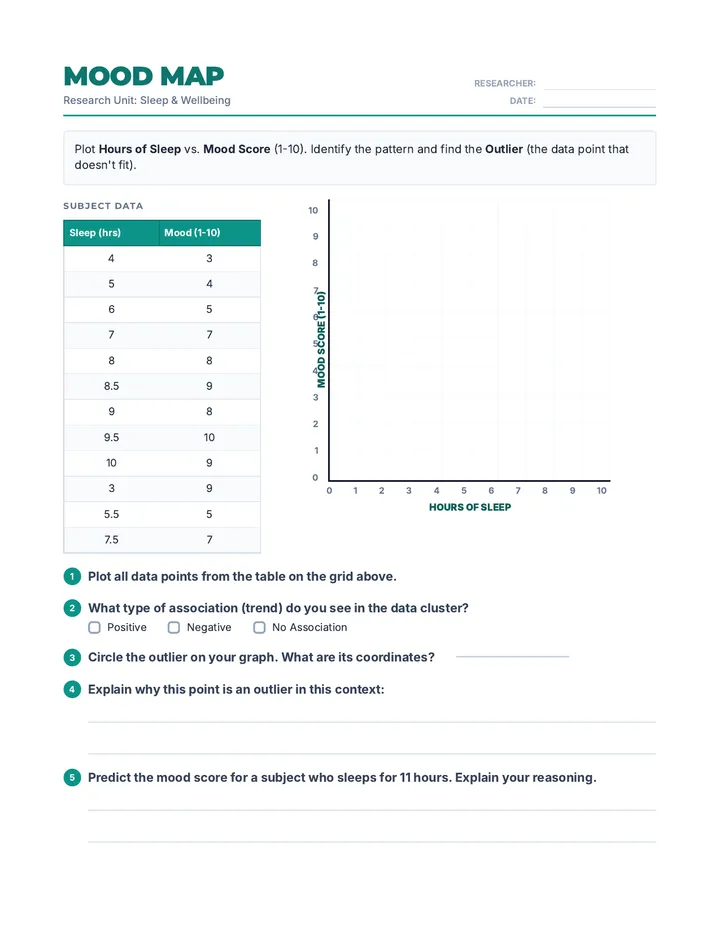
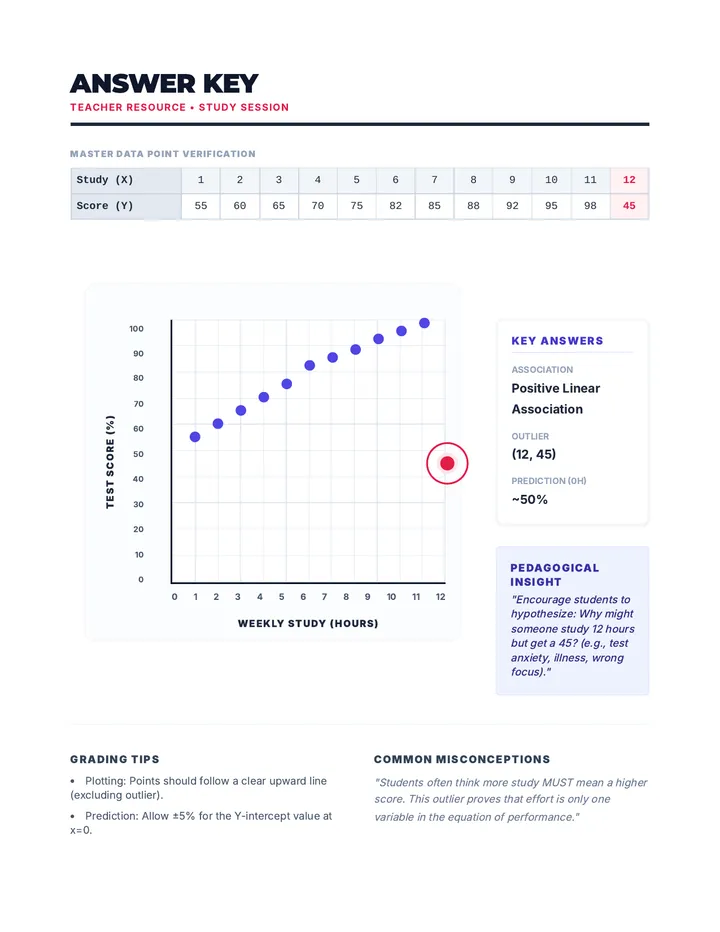
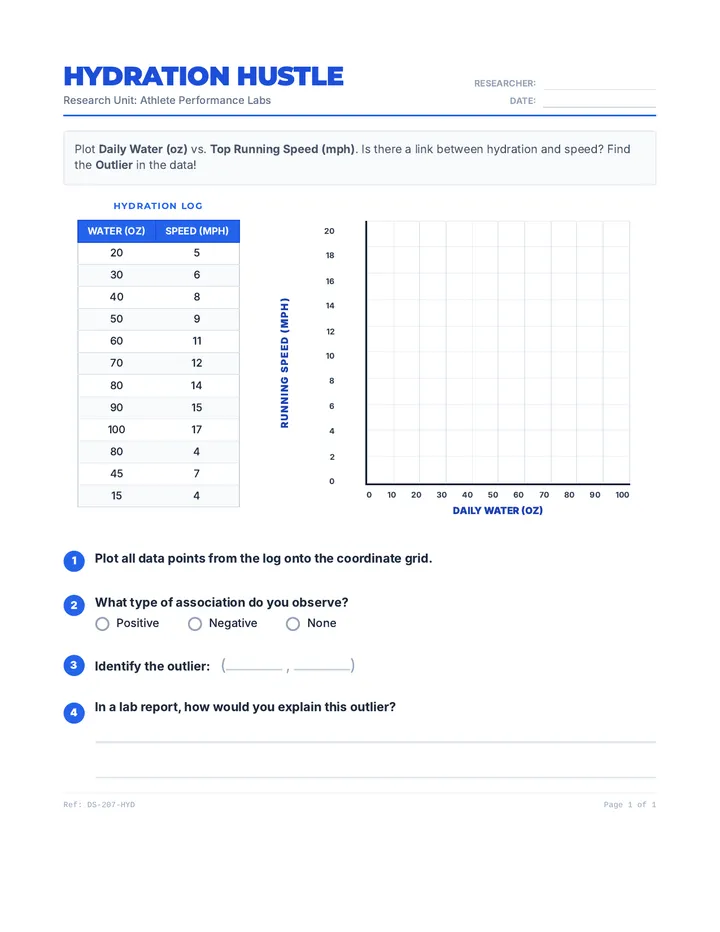
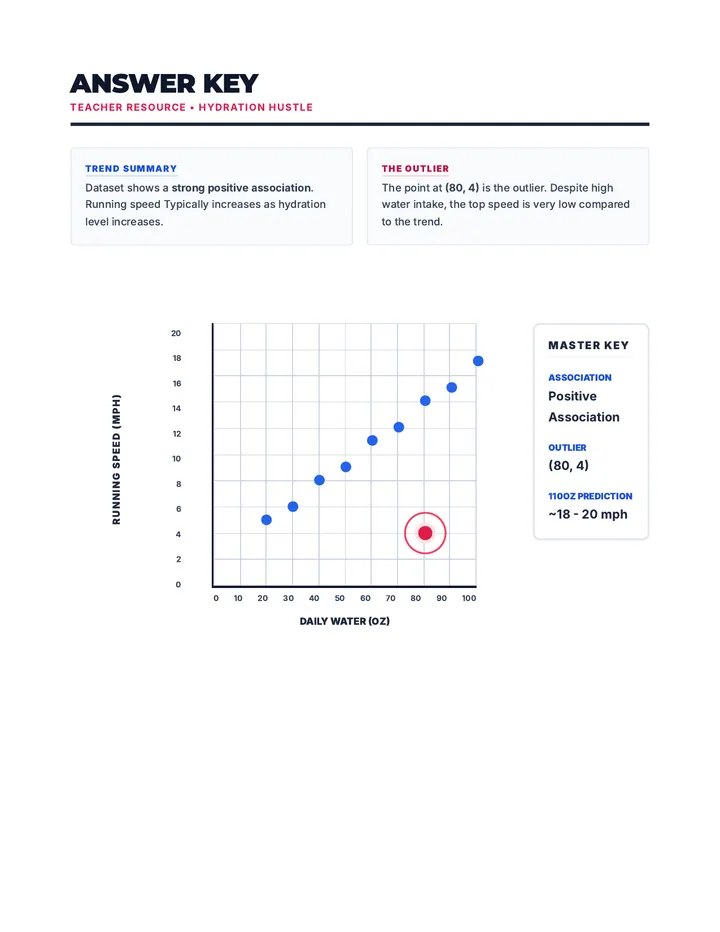
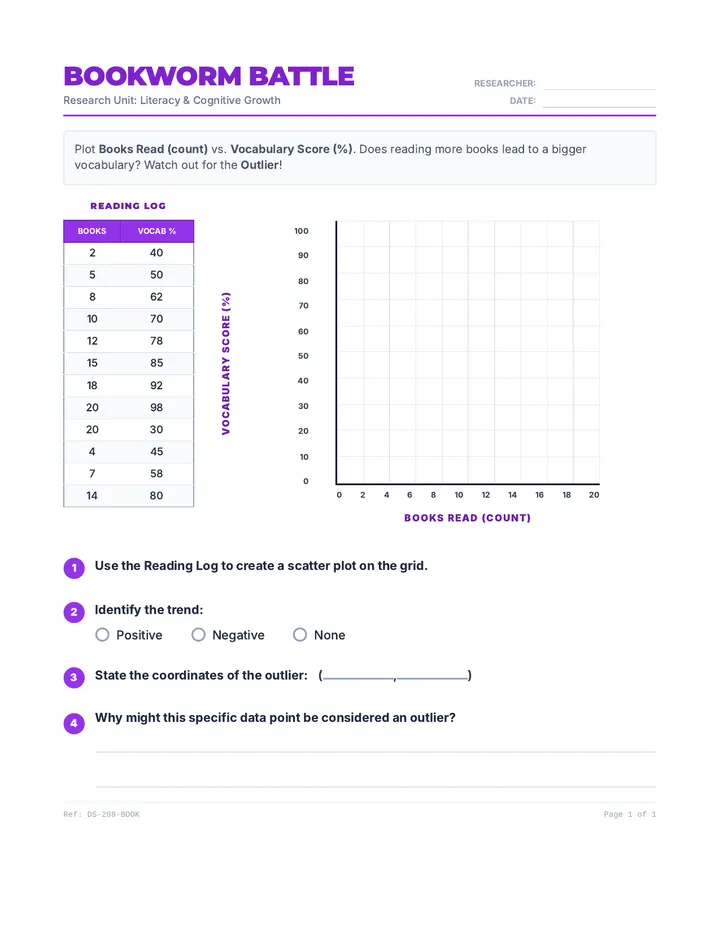
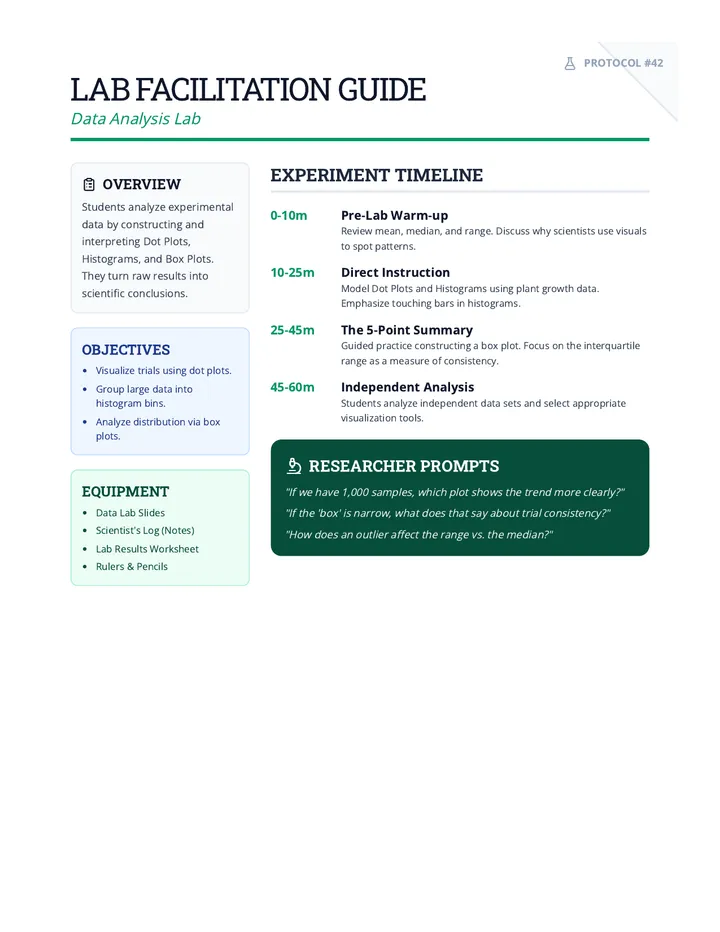
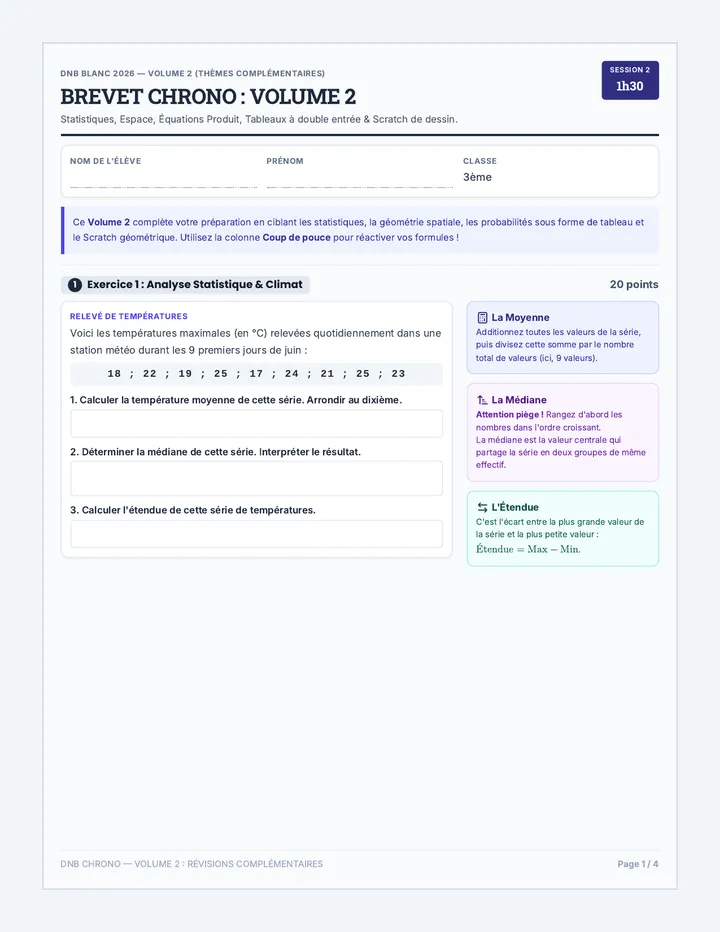
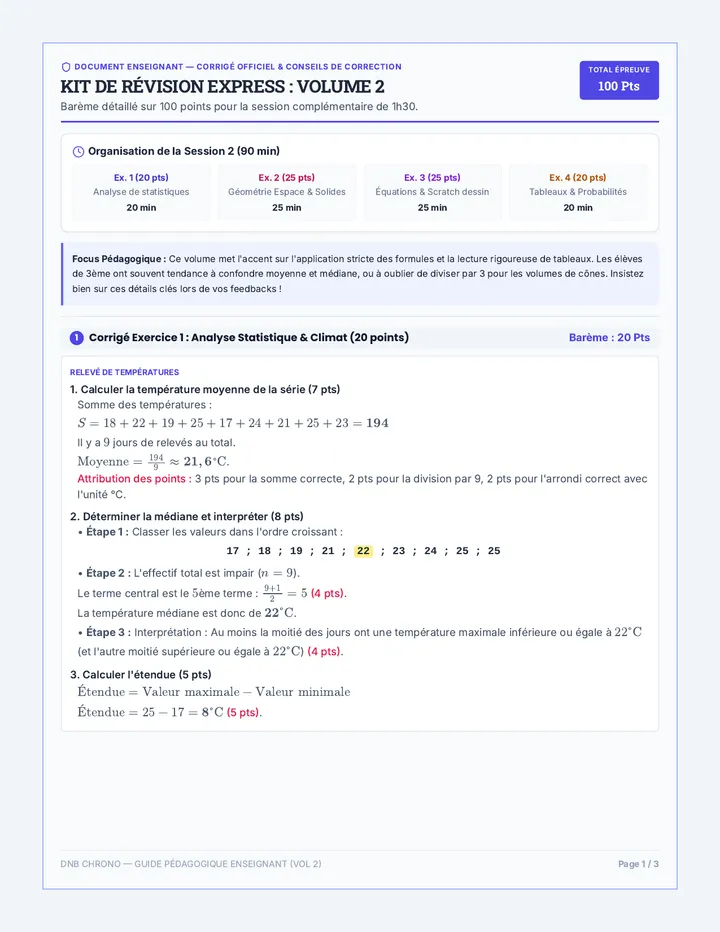
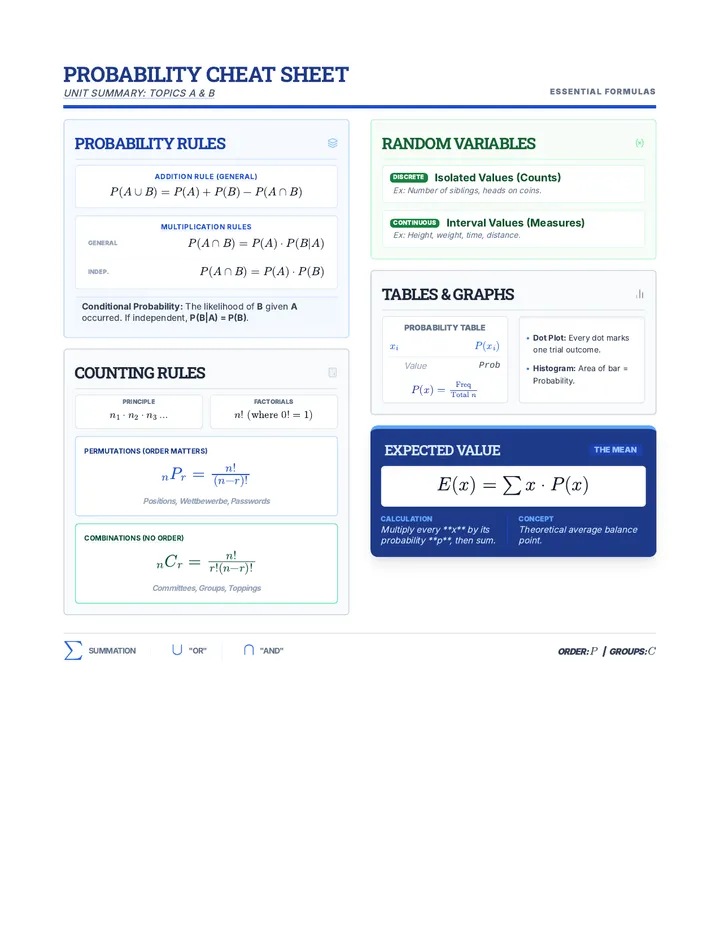
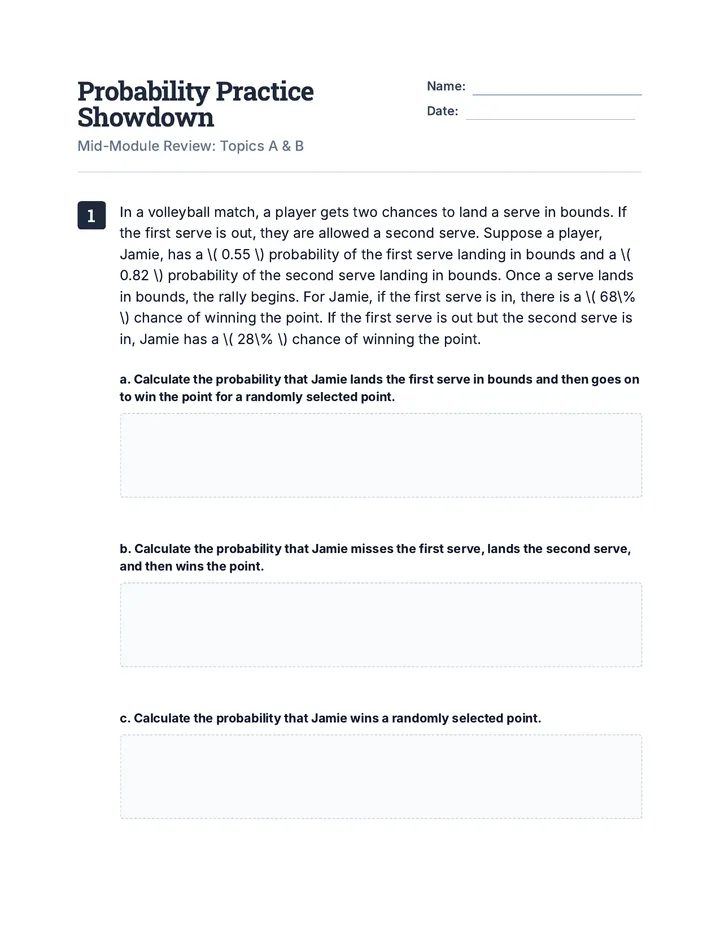
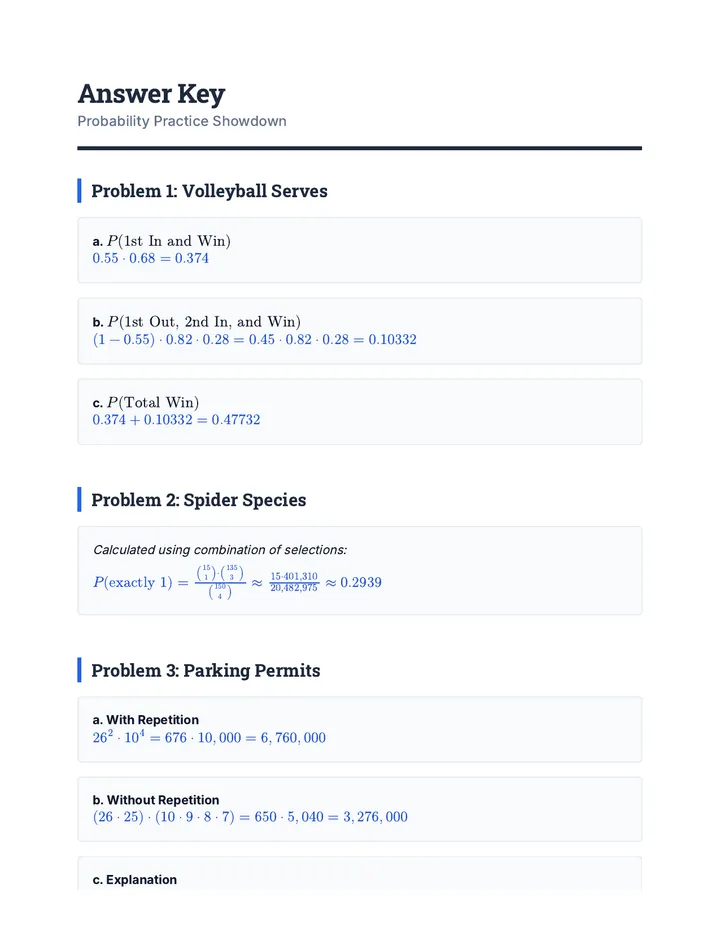
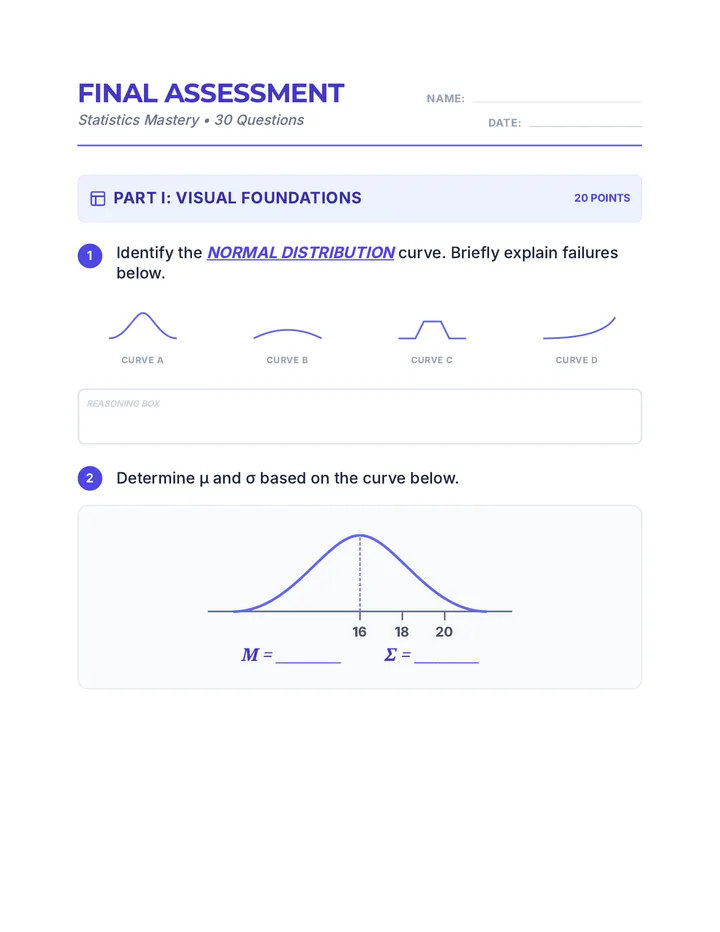
Data representation, distributions, and statistical variability using sampling and inference techniques. Integrates probability models, compound events, bivariate patterns, and linear models to guide data-driven decision making.
Une introduction complète aux statistiques universitaires, couvrant la classification des données, les mesures descriptives, la visualisation et les fondements de la loi normale. L'approche est axée sur l'analyse de données réelles et la compréhension conceptuelle.
A math sequence for 11th Grade Special Education focusing on visual representations of functions. Students learn to interpret graphs as narratives, moving from qualitative sketches to precise quantitative analysis of slope, intersections, and non-linear trends.
A 4th-grade chemistry and engineering sequence focusing on the analysis and manipulation of measurement data. Students explore metric and customary conversions, benchmark comparisons, and data accuracy through a project-based blueprint scaling challenge.
A graduate-level exploration of expected value applications in finance, covering utility theory, portfolio optimization, risk-neutral pricing, and tail risk metrics. Students transition from theoretical foundations to computational implementation using Monte Carlo methods.
A project-based unit where 12th-grade students design and execute an original statistical study comparing two populations. Students move from research design and ethical data collection to exploratory data analysis and formal inferential testing, culminating in a professional research presentation.
A comprehensive 12th-grade statistics sequence focused on identifying, analyzing, and performing inference on paired data designs to reduce variability and compare population means.
A comprehensive unit on comparing means from two independent populations. Students move from the theoretical foundations of sampling distributions to practical applications in clinical trials, mastering two-sample t-procedures, degrees of freedom, and robustness analysis.
A comprehensive 11th-grade statistics sequence focusing on the distinction between independent samples and matched pairs. Students learn to identify, analyze, and conduct inference on paired data through hands-on labs, case studies, and experimental design projects.
This sequence moves beyond binary decisions to quantify relationships using confidence intervals and effect sizes. Students explore population overlap, calculate margins of error for means and proportions, and learn to communicate statistical findings to non-technical audiences.
A comprehensive undergraduate statistics sequence on comparing two population proportions and rates. Students move from the theoretical sampling distribution to practical A/B testing, clinical risk assessment, and project-based experimental design.
A comprehensive unit for undergraduate statistics students focusing on the identification, calculation, and interpretation of paired (dependent) sample designs. Students explore why controlling for individual variation through matching increases statistical power and narrows confidence intervals.
This sequence covers the theoretical and practical application of comparing means between two independent groups. Students progress from understanding sampling distributions and standard errors to performing pooled and unpooled t-tests, constructing confidence intervals, and verifying statistical assumptions using diagnostic tools.
A graduate-level sequence exploring outlier detection, influence diagnostics, and robust regression techniques. Students will progress from identifying anomalies using leverage and Cook's Distance to implementing robust algorithms like RANSAC and M-estimators.
A graduate-level sequence focused on the theoretical derivation of OLS estimators and the rigorous diagnostic procedures required to validate bivariate linear models. Students progress from matrix algebra proofs to advanced residual analysis, transformations, and cross-validation techniques.
A project-based unit where 10th-grade students design surveys, collect categorical data, and use 2-proportion z-tests and confidence intervals to determine if meaningful differences exist between two populations. Students apply statistical rigor to real-world questions like demographic opinion gaps and school-wide trends.
A comprehensive unit for 10th-grade students on comparing two independent population means. Students move from intuitive simulation-based reasoning to formal hypothesis testing and confidence intervals, focusing on variability and statistical significance.
A graduate-level exploration of probabilistic model selection, focusing on AIC and BIC, their information-theoretic foundations, and practical application in statistical modeling.
A graduate-level project-based sequence focused on the rigorous comparison and selection of mathematical models. Students progress from strategy definition and candidate generation to statistical benchmarking and stability analysis, culminating in a professional-grade technical defense.
A case study approach to interpreting and analyzing data sets to solve multi-step comparison problems. Students move from simple reading of values to synthesizing complex data to make informed decisions.
An advanced graduate-level module on statistical sampling techniques focusing on the mathematical correction of data after collection. Topics include probability weights, non-response adjustment through raking, imputation of missing values, and computational variance estimation via Bootstrap and Jackknife methods.
A hands-on introduction to probability and chance for early elementary students using the concepts of will, won't, and might.
A comprehensive unit where students act as data scientists to model real-world environmental phenomena using trigonometric functions. They progress from visual estimation to precise algebraic modeling and technological regression to predict future environmental conditions.
A Kindergarten math sequence introducing tally marks as a method for recording data. Students progress from simple vertical marks to groups of five, culminating in real-world data collection and interpretation.
A project-based sequence where 5th-grade students act as data analysts to investigate school-wide questions, moving from question formulation to data collection, organization, visualization, and final presentation.
A game-based 5th-grade math unit that frames data interpretation as a detective challenge. Students build fluency in reading charts and graphs, identify misleading data tactics, and solve mysteries using statistical evidence.
A 4th-grade math sequence focusing on data representation and interpretation through gamified simulations. Students act as sports managers, store owners, and detectives to apply data skills in high-stakes, engaging contexts.
A 4th-grade math sequence focused on extracting and manipulating quantitative information from scaled graphs to solve one- and two-step arithmetic problems. Students progress from reading exact values to performing complex comparisons, aggregations, and critical analysis of misleading data.
A project-based sequence where 4th-grade students act as 'Data Detectives' to formulate questions, collect data, and visualize findings. Students move from understanding variability to presenting professional-grade statistical insights about their community.
A comprehensive 3rd-grade unit focused on constructing scaled bar graphs and using data to solve one- and two-step comparison problems. Students progress from identifying graph components to mastering complex data analysis.
A project-based unit where 3rd-grade students learn to collect categorical data, organize it into tally charts, and represent it using scaled pictographs. Students explore the concept of scale (1:2, 1:5, 1:10) and practice interpreting data to solve real-world problems.
This 11th-grade sequence explores conditional probability and compound events through professional lenses like medicine, law, and engineering. Students move beyond dice and cards to analyze real-world data, calculating risk, diagnostic accuracy, and system reliability to make informed decisions under uncertainty.
An undergraduate-level statistics sequence where students act as data scientists to analyze categorical data. They move from raw data cleaning to frequency tables, joint/marginal distributions, conditional probability, and formal independence testing, culminating in a data analysis capstone.
A comprehensive unit on two-way frequency tables, moving from data organization to complex probability analysis and independence testing. Students will bridge the gap between categorical counts and real-world statistical claims.
A project-based unit where 7th-grade students act as data consultants to solve school-wide problems. They learn to identify bias, design sampling plans, collect data, and present data-backed recommendations to administration.
This inquiry-based sequence introduces 6th grade students to statistical variability, starting with distinguishing question types and progressing to visualizing data on dot plots and quantifying spread using range.
A comprehensive 2nd Grade unit where students act as lead researchers, moving from formulating survey questions to conducting field data collection and finally presenting findings through polished data visualizations.
A 3rd-grade math unit that transforms students into Data Detectives. They learn to ask statistical questions, collect raw data through surveys, and organize that information using tally charts and frequency tables to solve the mystery of 'messy information'.
A project-based unit where 4th-grade students act as 'Data Detectives' to formulate questions, collect survey data, and present visual findings to make community decisions.
This sequence covers the comparison of means from two independent groups in quantitative data. Students explore the standard error of the difference, degrees of freedom complexities, hypothesis testing through clinical trials, confidence intervals, and the distinction between statistical and practical significance.
This sequence explores the distinction between independent and paired samples in statistics. Students learn to identify matched-pair designs, calculate paired differences, conduct hypothesis tests for means of differences, and understand how pairing increases statistical power by reducing variability.
This graduate-level sequence covers advanced statistical sampling techniques, focusing on the optimization of stratified, cluster, and multi-stage designs. Students learn to navigate the trade-offs between precision and cost, calculate design effects, and mitigate biases like periodicity.
This graduate-level sequence covers the theoretical foundations and practical applications of power analysis. Students will learn to determine necessary sample sizes for various statistical models, conduct sensitivity analyses, and write robust justifications for research protocols.
A rigorous graduate-level examination of probability sampling theory, focusing on the mathematical properties of estimators, the mechanics of selection bias, and the use of Monte Carlo simulations to validate sampling designs. Students explore simple random sampling, sampling frame errors, and the 'Big Data Paradox' through proofs and simulation logic.
A graduate-level sequence exploring computational resampling methods (Bootstrap, Jackknife, Permutation) to estimate the variability and uncertainty of dispersion statistics when parametric assumptions fail.
An advanced exploration of robust statistical methods for quantifying variability, focusing on the mathematical foundations of L1 vs L2 norms, breakdown points, and efficiency trade-offs in the presence of outliers.
This graduate-level sequence bridges univariate statistics and multivariate geometry, exploring how variability manifests in high-dimensional spaces through covariance matrices, generalized variance, and principal component analysis.
A project-based exploration of stochastic modeling, focusing on Queueing Theory and Monte Carlo simulations. Students design and build computational models to optimize real-world systems like traffic flow and service lines.
This 5-lesson sequence explores how sample size influences variability and the reliability of statistical inferences. Students participate in simulations to discover the law of large numbers, use Mean Absolute Deviation to quantify spread, and evaluate the validity of real-world sampling methods.
A lesson sequence focusing on compound probability, specifically analyzing events where order matters versus where it doesn't, using marble jar scenarios and tree diagrams.
A sequence for 12th-grade students focusing on selecting and using visual organizers like Venn diagrams, tree diagrams, flowcharts, and logic grids to solve complex logic and probability problems. Students move from guided practice to independent metacognitive selection of the best tool for the job.
This sequence bridges the gap between discrete mathematics and quantitative finance, focusing on the application of geometric series to asset valuation, loan amortization, and risk management. Graduate students will develop the mathematical foundations for pricing complex financial instruments and understanding market dynamics.
A graduate-level exploration of expected value through the lens of measure theory, covering Lebesgue integration, fundamental inequalities, convergence theorems, and conditional expectation using Sigma-algebras.
Students build a conceptual understanding of comparing two proportions through simulation before formalizing the math. They learn to conduct and interpret 2-sample z-tests and confidence intervals for differences in proportions in real-world contexts like marketing and public opinion.
A comprehensive unit for 11th-grade statistics focusing on the comparison of proportions between two independent populations. Students transition from simulation-based inquiry to formal z-tests and confidence intervals, culminating in a real-world sociological data analysis project.
This sequence explores conditional probability and the reliability of tests using frequency trees and area models. Students investigate 'false positives' and 'false negatives' in real-world contexts like medical testing and spam filters, ultimately debating the ethical implications of screening policies.
An 8th-grade mathematics unit focused on using probability trees to model and solve complex decision-making problems. Students progress from simple compound events to weighted averages and backward induction in real-world business and logistics scenarios.
A game-based sequence where 8th-grade students explore probability, weighted averages, and expected value to analyze fairness and long-term trends in games of chance.
A 5-lesson sequence for 7th graders exploring the relationship between theoretical probability and experimental results, culminating in Bayesian-style predictive updates and simulations. Students move from simple dice rolls to complex forecasting scenarios.
This sequence guides students through the visualization and calculation of compound probabilities using tree diagrams. Students progress from basic branching to analyzing complex real-world decisions involving dependent and independent events.
A comprehensive 7th-grade unit exploring probability through game design, where students move from understanding basic likelihood to analyzing mathematical fairness and building their own chance-based simulations.
An advanced graduate-level exploration of stochastic processes, covering discrete and continuous-time Markov chains, Poisson processes, and queueing theory. The sequence bridges theoretical rigor with computational application through simulations and real-world modeling.
An advanced graduate-level sequence exploring the mathematical foundations and computational applications of stochastic processes, from discrete-time Markov chains to Monte Carlo simulations.
A 12th-grade mathematics sequence exploring compound probability through the lens of engineering reliability. Students learn to model series and parallel systems, use complement rules for redundancy, and optimize system designs within budgetary constraints.
A rigorous, theoretical approach to compound event probabilities for 12th-grade students. This sequence covers set notation, formal definitions of independence, the general addition and multiplication rules, and the distinction between mutually exclusive and independent events.
A 12th-grade mathematics unit exploring compound probability through the lens of casino games, lotteries, and game design, focusing on the distinction between independent and dependent events.
A comprehensive 12th-grade probability unit focusing on visualizing multi-stage experiments, distinguishing between independent and dependent events, and applying formal multiplication rules to solve complex compound scenarios.
This 11th-grade sequence explores compound probability through the lens of game design and analysis. Students move from analyzing existing games of chance to engineering their own balanced systems using the multiplication rule, expected value, and area models.
A high-level probability sequence for 11th grade students focusing on translating complex word problems into symbolic notation and solving multi-stage compound events. The sequence utilizes a flipped classroom model to prioritize collaborative problem-solving and mastery of advanced concepts like the complement rule and asymmetric probability trees.
This 11th-grade statistics sequence builds a deep understanding of compound probability, from visualizing sample spaces to applying the General Multiplication Rule. Students progress through independent and dependent events, conditional probability, and complex multi-stage scenarios including the 'at least one' rule.
An inquiry-driven investigation into counter-intuitive probability. Students explore the Birthday Problem, Gambler's Fallacy, Monty Hall Problem, and Simpson's Paradox to understand why human intuition often fails in the face of compound event logic.
An undergraduate-level exploration of compound event probabilities through the lens of games of chance, focusing on combinatorics, non-replacement scenarios, and expected value.
A comprehensive module for undergraduate students focusing on visual methods for solving compound probability problems. The sequence progresses from basic tree diagrams and contingency tables to the Law of Total Probability and Bayesian reasoning in medical diagnostics, concluding with decision analysis simulations.
This sequence explores compound probability through the lens of engineering reliability. Students learn to model series and parallel systems, analyze hybrid structures, and account for dependent failures in complex risk environments.
A rigorous undergraduate sequence exploring the mathematical axioms of compound probability, focusing on set theory, independence, and conditional logic.
This mastery-based sequence focuses on the algebraic side of probability, specifically utilizing the multiplication rule for complex problems. Students progress from visual models to abstract formulas, covering independent and dependent events, 'at least one' scenarios using complements, and mixed strategy application.
This advanced sequence for undergraduate students explores the critical distinction between statistical significance and practical importance. Students move beyond p-values to master effect size measures like Cohen's d and the principles of statistical power, culminating in a critical analysis of the replication crisis and the role of rigorous study design in scientific integrity.
A technical workshop sequence for 11th-grade students focusing on cross-validation techniques, including train-test splits, MSE calculation, and K-Fold validation to assess and select robust mathematical models.
This sequence bridges the gap between theoretical probability and practical data science applications through rigorous statistical inference. Students explore sampling distributions and the Central Limit Theorem before diving into parametric and non-parametric hypothesis testing, culminating in experimental design and Bayesian fundamentals.
Students move from describing data to interpreting and modeling it. They explore correlation vs. causation, trend lines, predictive modeling, and the ethics of data bias using real-world datasets and case studies.
An advanced 12th-grade mathematics sequence focusing on model evaluation and selection. Students explore the bias-variance trade-off, information criteria (AIC/BIC), and cross-validation to select optimal predictive models.
A graduate-level sequence exploring the gradient vector as the foundational tool for modern optimization. Students move from the geometric interpretation of multivariate derivatives to the implementation of stochastic algorithms used in machine learning.
A comprehensive introduction to Time Series Analysis for 12th-grade students, focusing on random processes, autocorrelation, stationarity, and smoothing techniques. Students move from basic random walks to understanding complex dependencies in temporal data.
A 12th-grade statistics sequence exploring Poisson processes, transitioning from discrete counts to continuous time intervals and waiting times. Students will investigate arrival rates, the exponential distribution, and the unique memoryless property through inquiry and simulation.
A high-level exploration of stochastic processes, focusing on how random systems reach equilibrium. Students will master Markov chains, steady-state algebra, and real-world applications like Google's PageRank algorithm.
A comprehensive sequence for 12th-grade students on discrete-time Markov chains, covering state diagrams, transition matrices, and n-step probability calculations using matrix algebra.
A graduate-level sequence exploring continuous-time stochastic processes through the lens of computational simulation. Students transition from discrete to continuous time models, focusing on Poisson processes, CTMCs, and queuing theory with a strong emphasis on empirical validation and theoretical rigor.
A graduate-level exploration of the mathematical foundations of discrete-time Markov chains, focusing on state classification, limiting behavior, and time reversibility. This sequence emphasizes formal derivation, proofs, and the application of linear algebra to stochastic systems.
A comprehensive sequence on stochastic processes, stationarity, autocorrelation, and ergodicity, designed for undergraduate statistics and engineering students. The sequence moves from basic definitions of ensemble averages to the complex relationship between time and statistical averages.
An undergraduate-level sequence exploring Poisson processes as continuous-time counting models, covering derivations, inter-arrival times, superposition, order statistics, and non-homogeneous variations.
An undergraduate-level introduction to Discrete-Time Markov Chains, covering state classification, transition matrices, n-step probabilities, and stationary distributions. Students will apply linear algebra and probability theory to model stochastic systems and solve classic problems like Gambler's Ruin.
This graduate-level sequence bridges the gap between statistical association and causal inference. Students explore pitfalls like Simpson's Paradox and collider bias while learning to use Directed Acyclic Graphs (DAGs) and Instrumental Variables to isolate causal mechanisms in bivariate data.
A graduate-level exploration of non-linear bivariate analysis, moving from the limitations of linear correlation to rank-based methods, local regression, and information-theoretic metrics. Students develop the skills to quantify complex dependencies in biological, financial, and environmental systems where standard assumptions fail.
A project-based unit where 8th-grade students act as data scientists to investigate real-world relationships, generate digital linear models, and defend their predictions based on data reliability.
An advanced 11th-grade statistics sequence focusing on the selection, application, and ethical implications of two-population inference tests through a professional consultant simulation.
An advanced statistics sequence for 10th graders focusing on the nuance of hypothesis testing. Students move beyond calculations to explore P-values, Type I/II errors, practical significance, and effect size through real-world case studies and a culminating funding simulation.
This sequence explores probability-based decision making through the lens of financial literacy. Students apply expected value and risk assessment to evaluate insurance, extended warranties, and the mathematical trade-off between known costs and unknown risks.
A 7th-grade math sequence focusing on probability-based decision making and expected value. Students explore risk, reward, and long-term outcomes in insurance, business, and finance.
A comprehensive 12th-grade sequence exploring conditional probability through high-stakes real-world applications in medicine, forensics, and public safety. Students move from tabular data analysis to Bayesian reasoning, learning to navigate the counter-intuitive nature of false positives and the logical pitfalls of legal evidence.
This sequence explores how compound probability and risk assessment are used in professional fields like engineering, medicine, insurance, and law. Students apply the multiplication rule and conditional probability to high-stakes real-world scenarios.
A comprehensive unit for 10th-grade students on visualizing compound event probabilities. Through organized lists, tree diagrams, and area models, students build a conceptual foundation for independent and dependent events before applying their skills to complex real-world scenarios.
In this sequence, students explore how mathematical probability guides rational decision-making in uncertain situations. Learners progress from simple compound events to constructing decision trees and calculating expected values to evaluate the fairness and potential payoff of various choices.
This graduate-level sequence focuses on the quantitative side of logical fallacies, exploring how data, statistics, and visualizations are manipulated in professional and academic discourse. Students will develop advanced skills in Bayesian reasoning, data auditing, and visual literacy to identify and correct misleading arguments.
A high-level geometry sequence for 12th-grade students focusing on circular segments, composite regions, and their applications in engineering and architecture. Students progress from foundational sector calculations to complex decomposition of architectural forms.
This sequence explores the practical application of rational exponents and power functions in biology, physics, and finance. Students will progress from evaluating existing models like Kleiber's Law and Kepler's Third Law to constructing their own mathematical models from empirical data.
This sequence guides 8th-grade students through constructing scatter plots, identifying patterns of association, modeling trends with linear equations, and interpreting data in context while distinguishing correlation from causation.
A comprehensive 5-lesson unit for 8th-grade students on interpreting linear models. Students progress from drawing lines of best fit to calculating slope and y-intercept in context, culminating in writing full equations and making predictions through interpolation and extrapolation.
This 10th-grade sequence moves students from basic linear calculation to deep statistical reasoning, focusing on the reliability of linear models. Students explore correlation vs. causation, residuals, the correlation coefficient, and the significant impact of outliers to evaluate the validity of statistical arguments in the real world.
A comprehensive 5-lesson unit on evaluating the validity of linear regression models. Students move from basic residual calculation to sophisticated analysis of residual plots, correlation coefficients, outliers, and the fundamental distinction between correlation and causation.
A comprehensive sequence for 11th-grade students on interpreting linear models. Students will progress from visualizing bivariate data to calculating regression lines and rigorously interpreting slope, y-intercepts, and the reliability of predictions.
This sequence explores the statistical evaluation of linear models, covering residuals, linear regression technology, correlation coefficients, residual plots, and the distinction between correlation and causation. Students will learn to assess the reliability of models and use statistical tools to interpret data accurately.
Students act as data analysts to investigate relationships between variables in fields like sports, economics, and environmental science. The learning arc progresses from constructing scatter plots and generating lines of best fit to deeply interpreting the specific meaning of slope and y-intercept in context, concluding with a capstone project on predictive modeling.
A 5-lesson sequence where students act as data analysts to explore, construct, and interpret linear models. Students progress from basic scatter plots to making predictions and critiquing the validity of linear models in real-world contexts.
An advanced exploration of statistical power, error types, and effect sizes in the context of comparing two populations, teaching students to look beyond p-values to evaluate the practical importance and reliability of scientific findings.