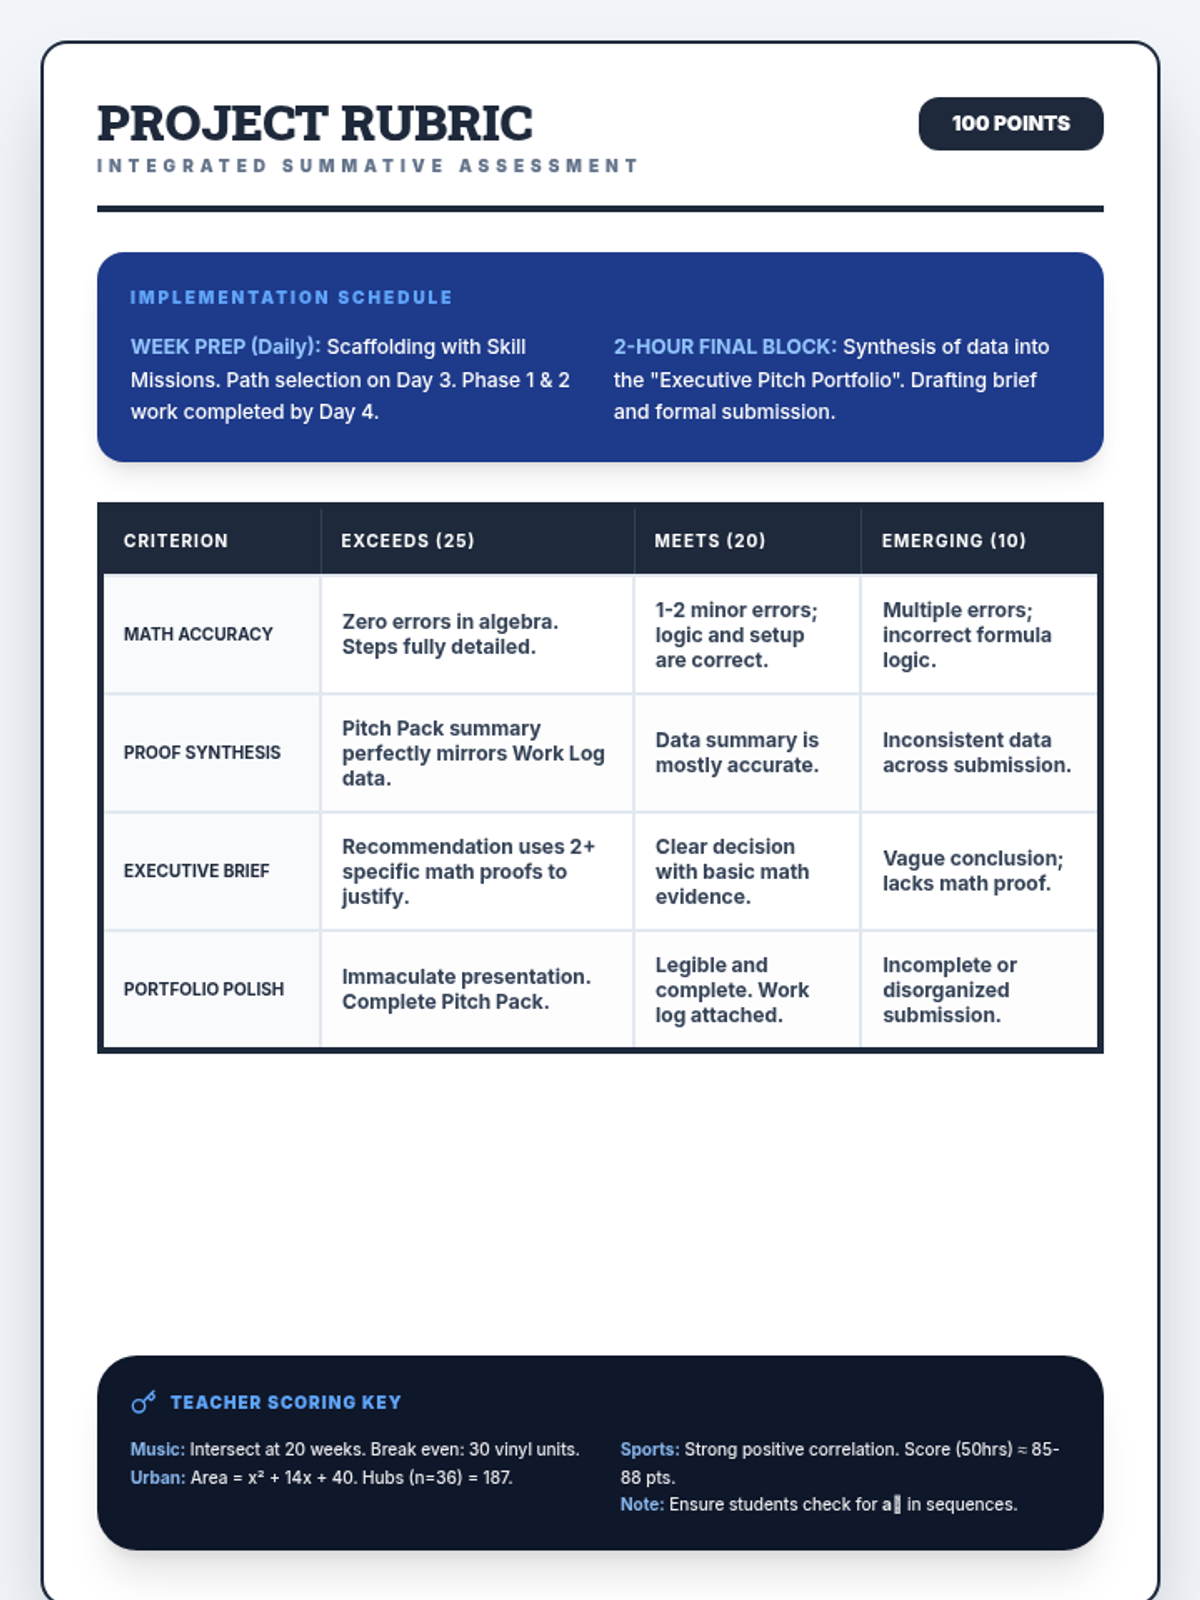
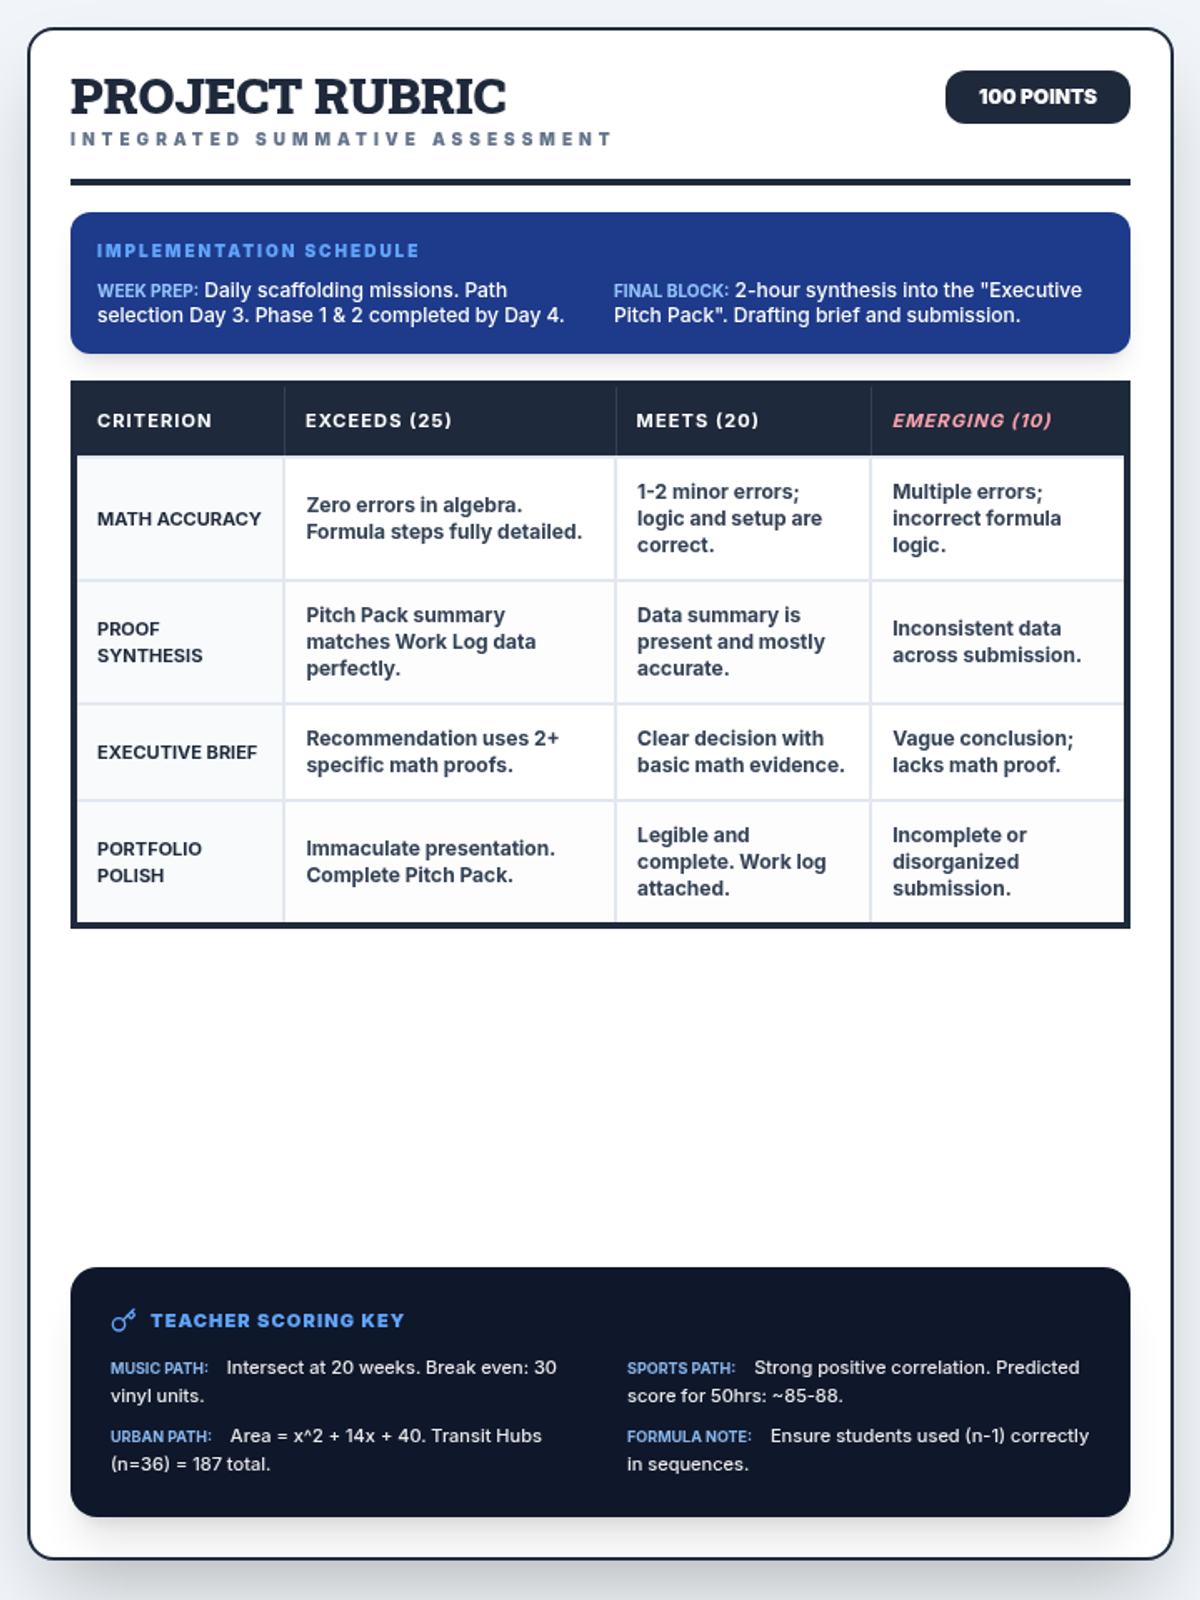
Data representation, distributions, and statistical variability using sampling and inference techniques. Integrates probability models, compound events, bivariate patterns, and linear models to guide data-driven decision making.
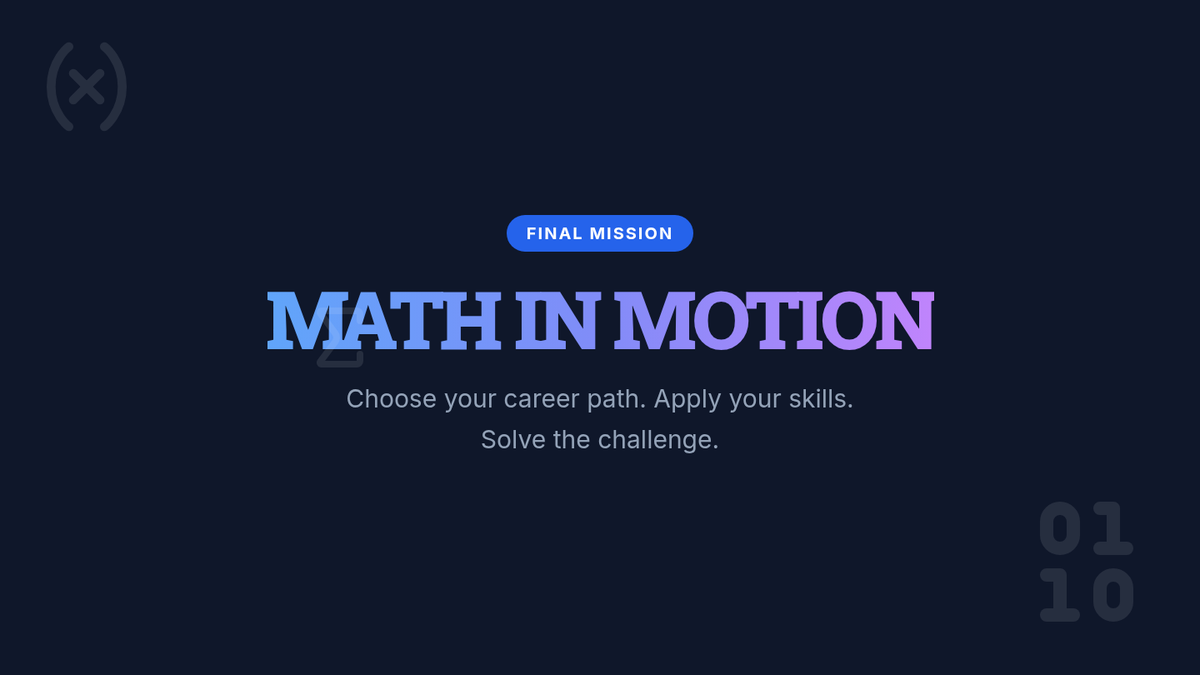
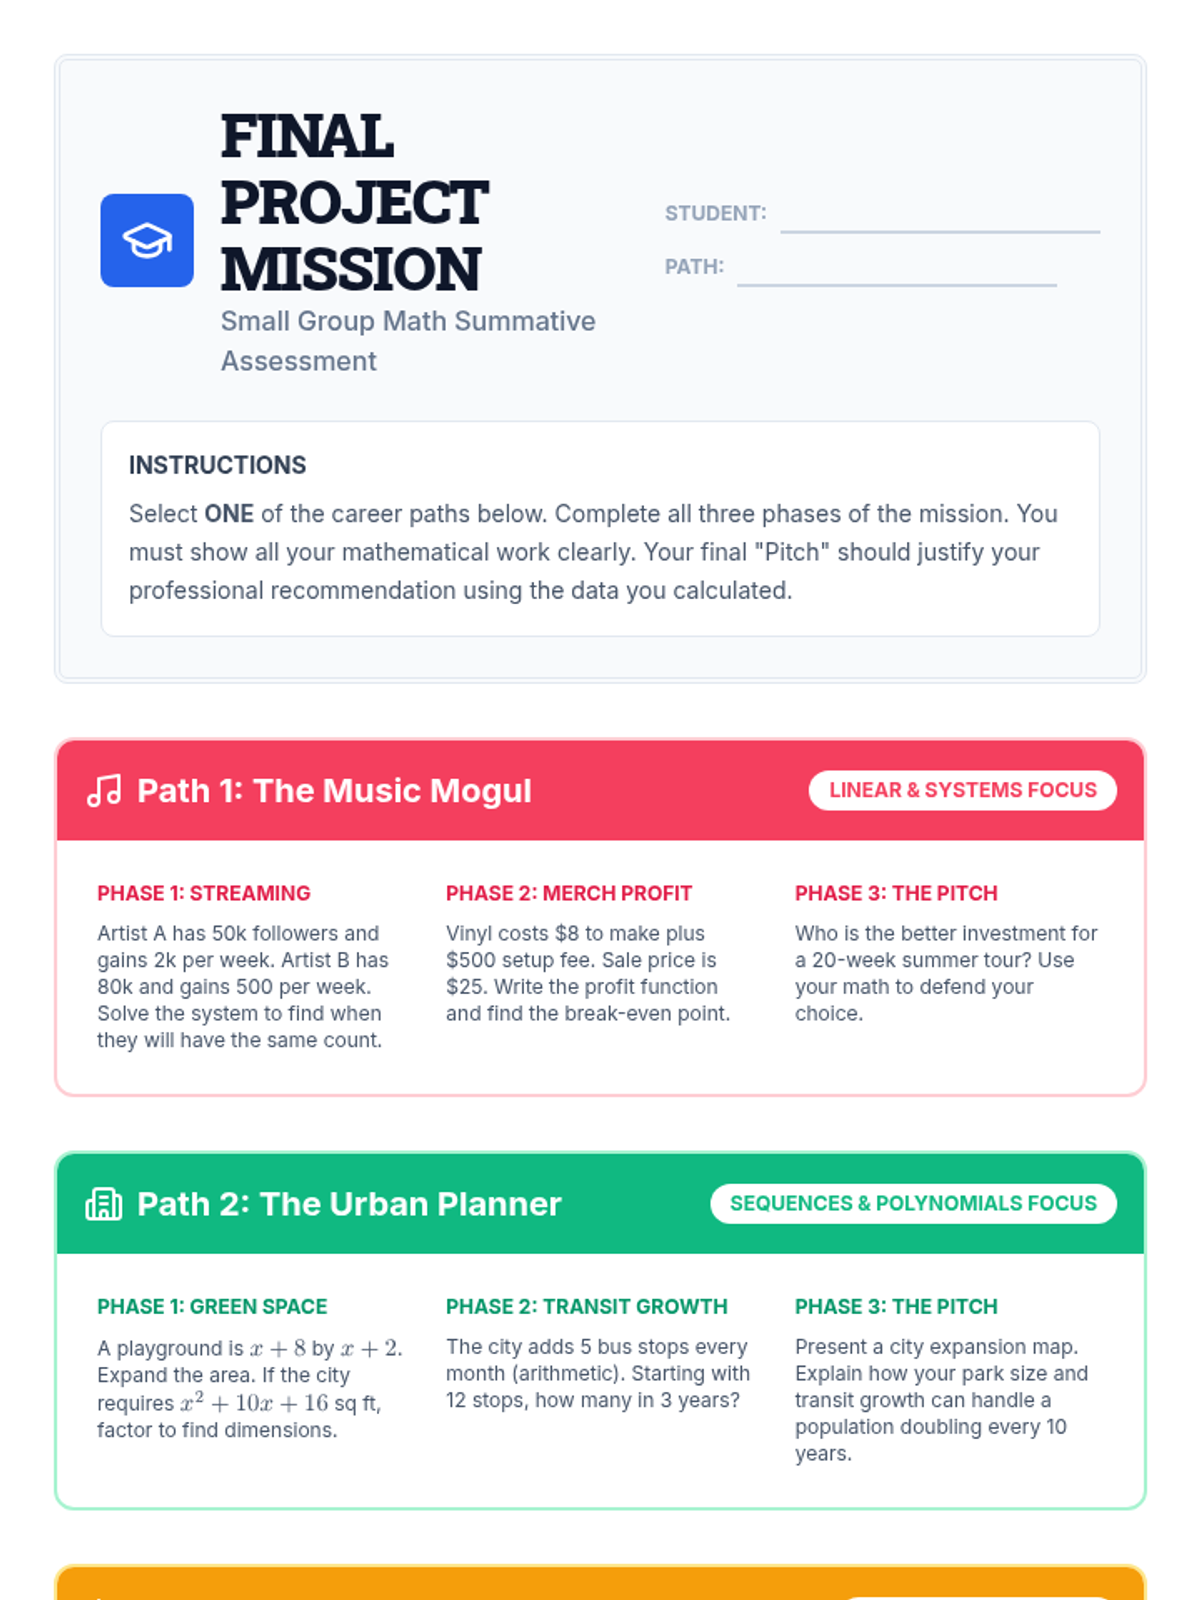
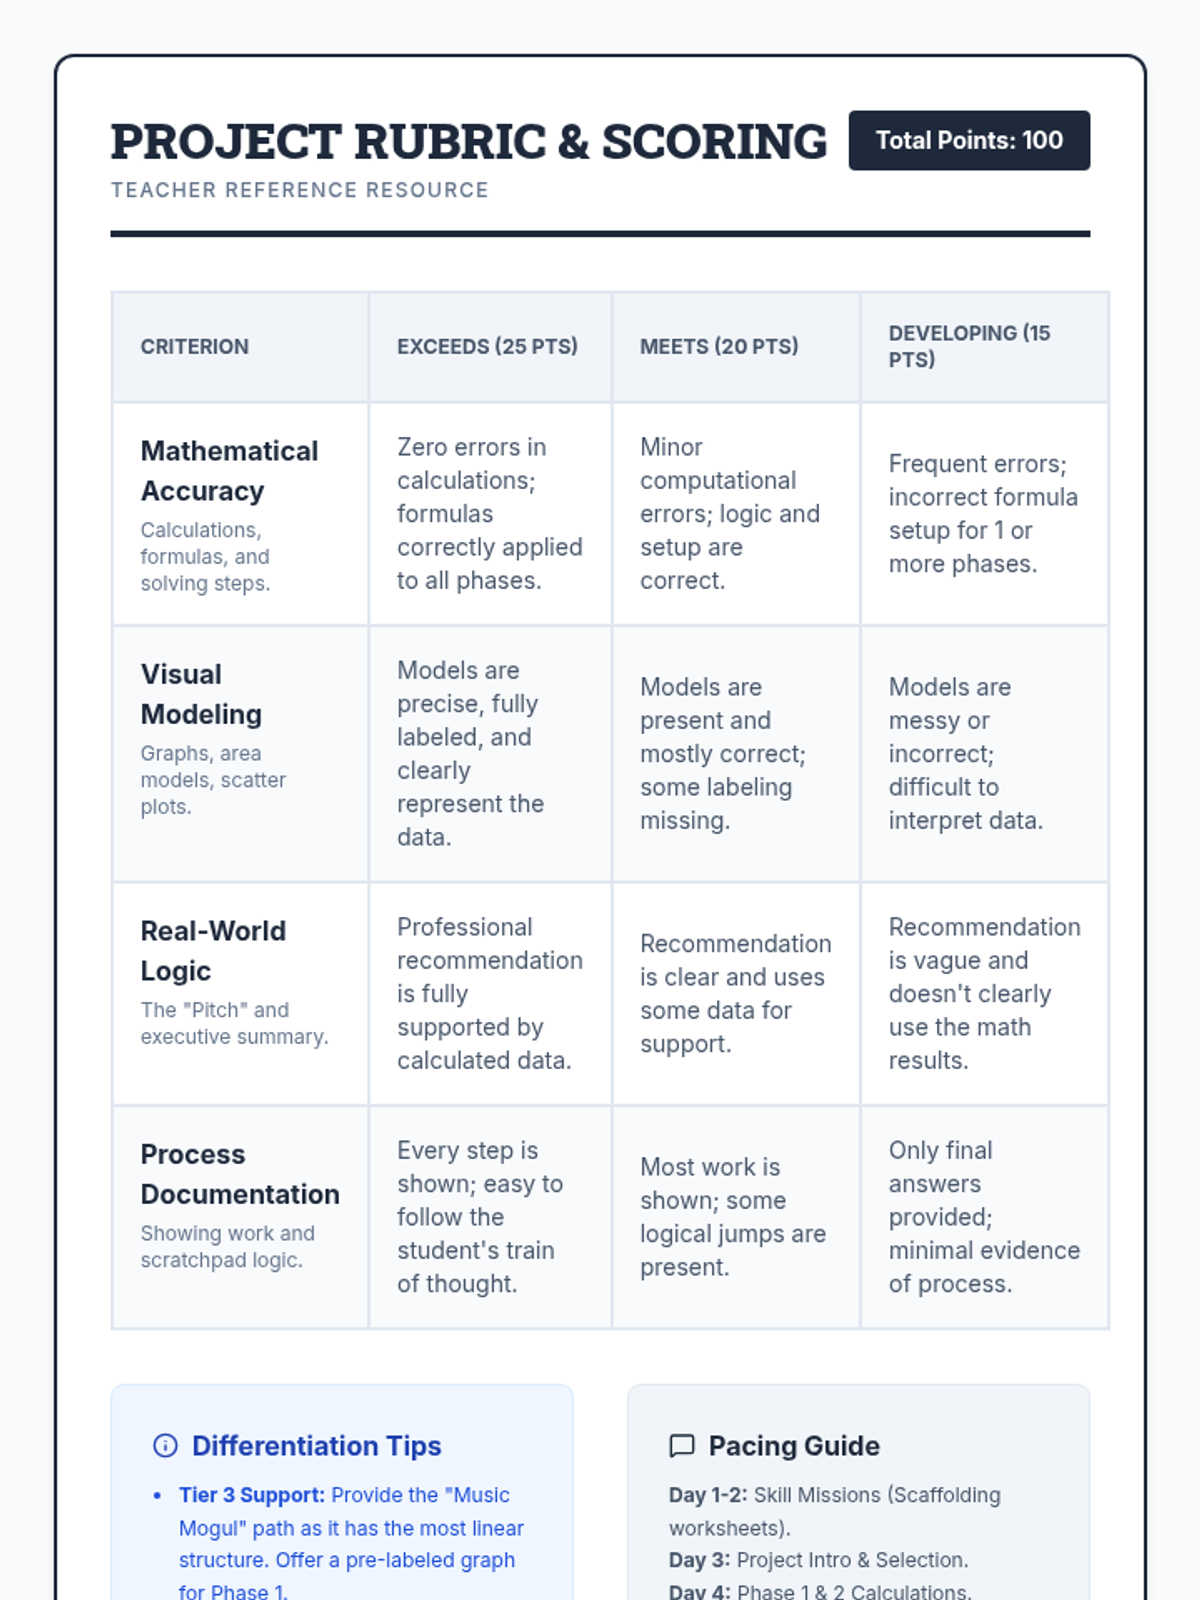
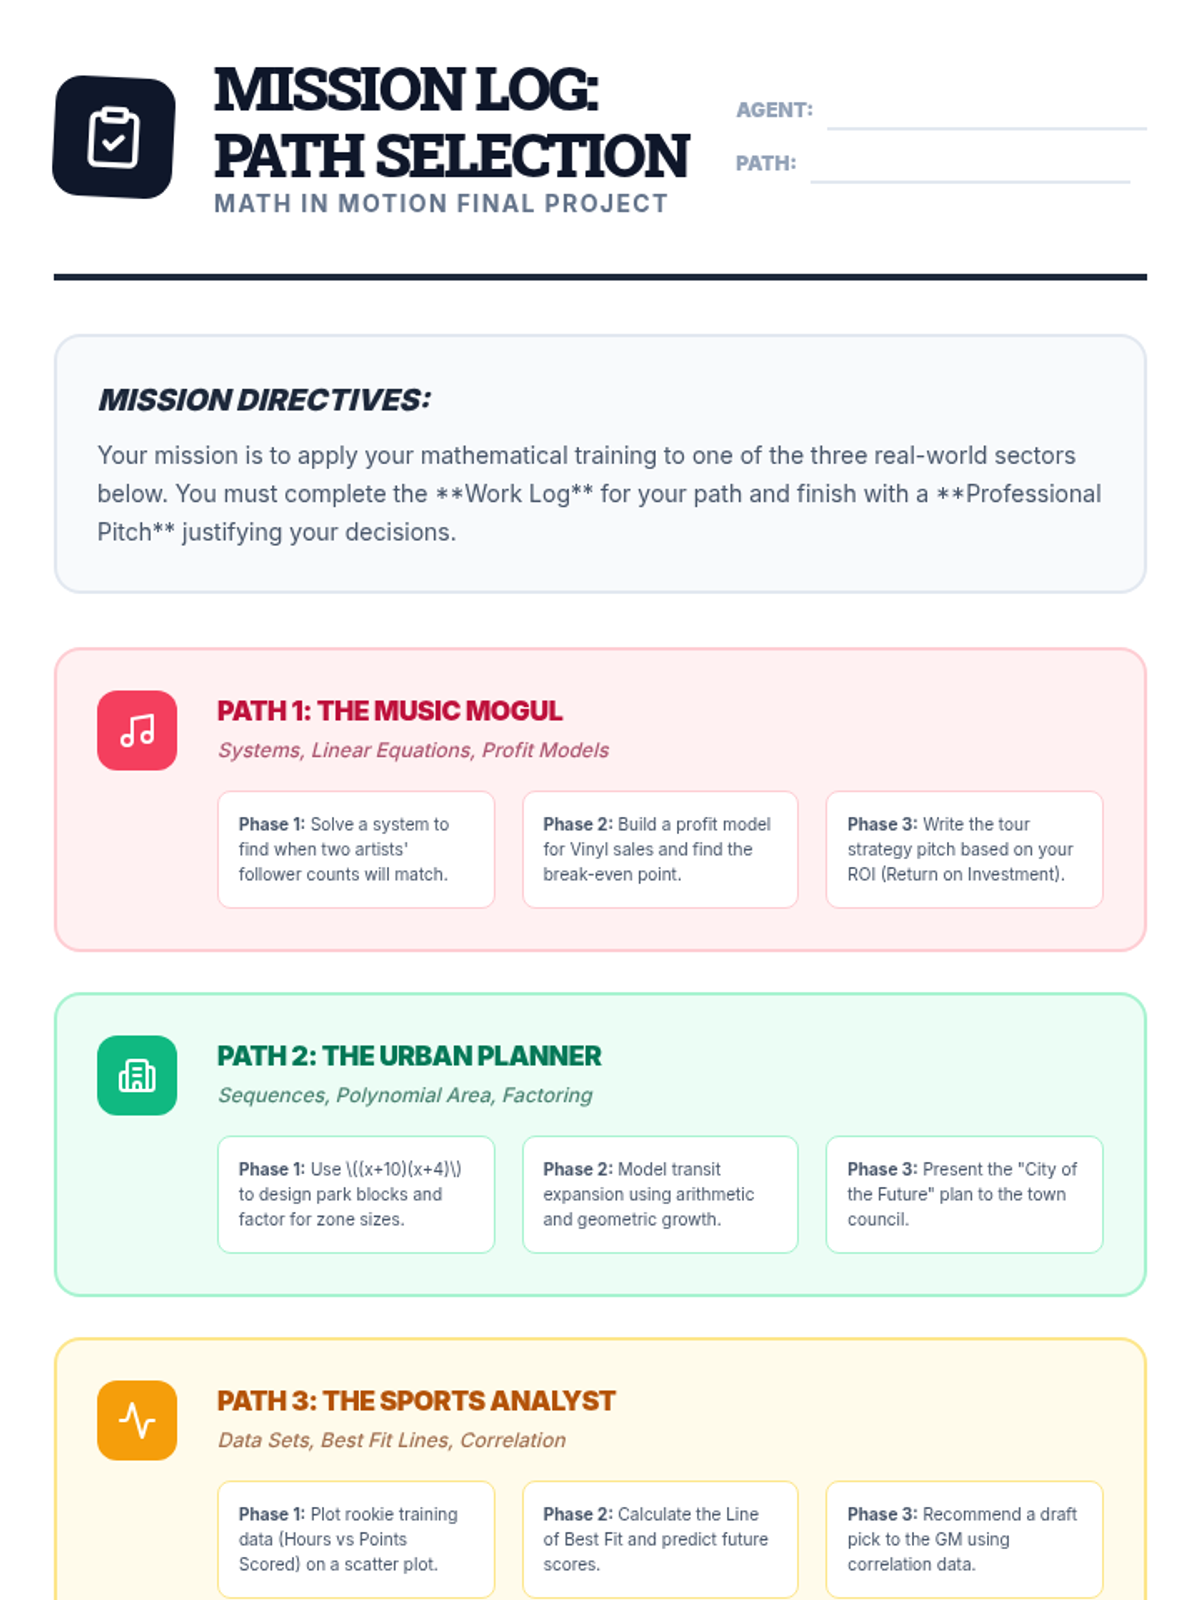
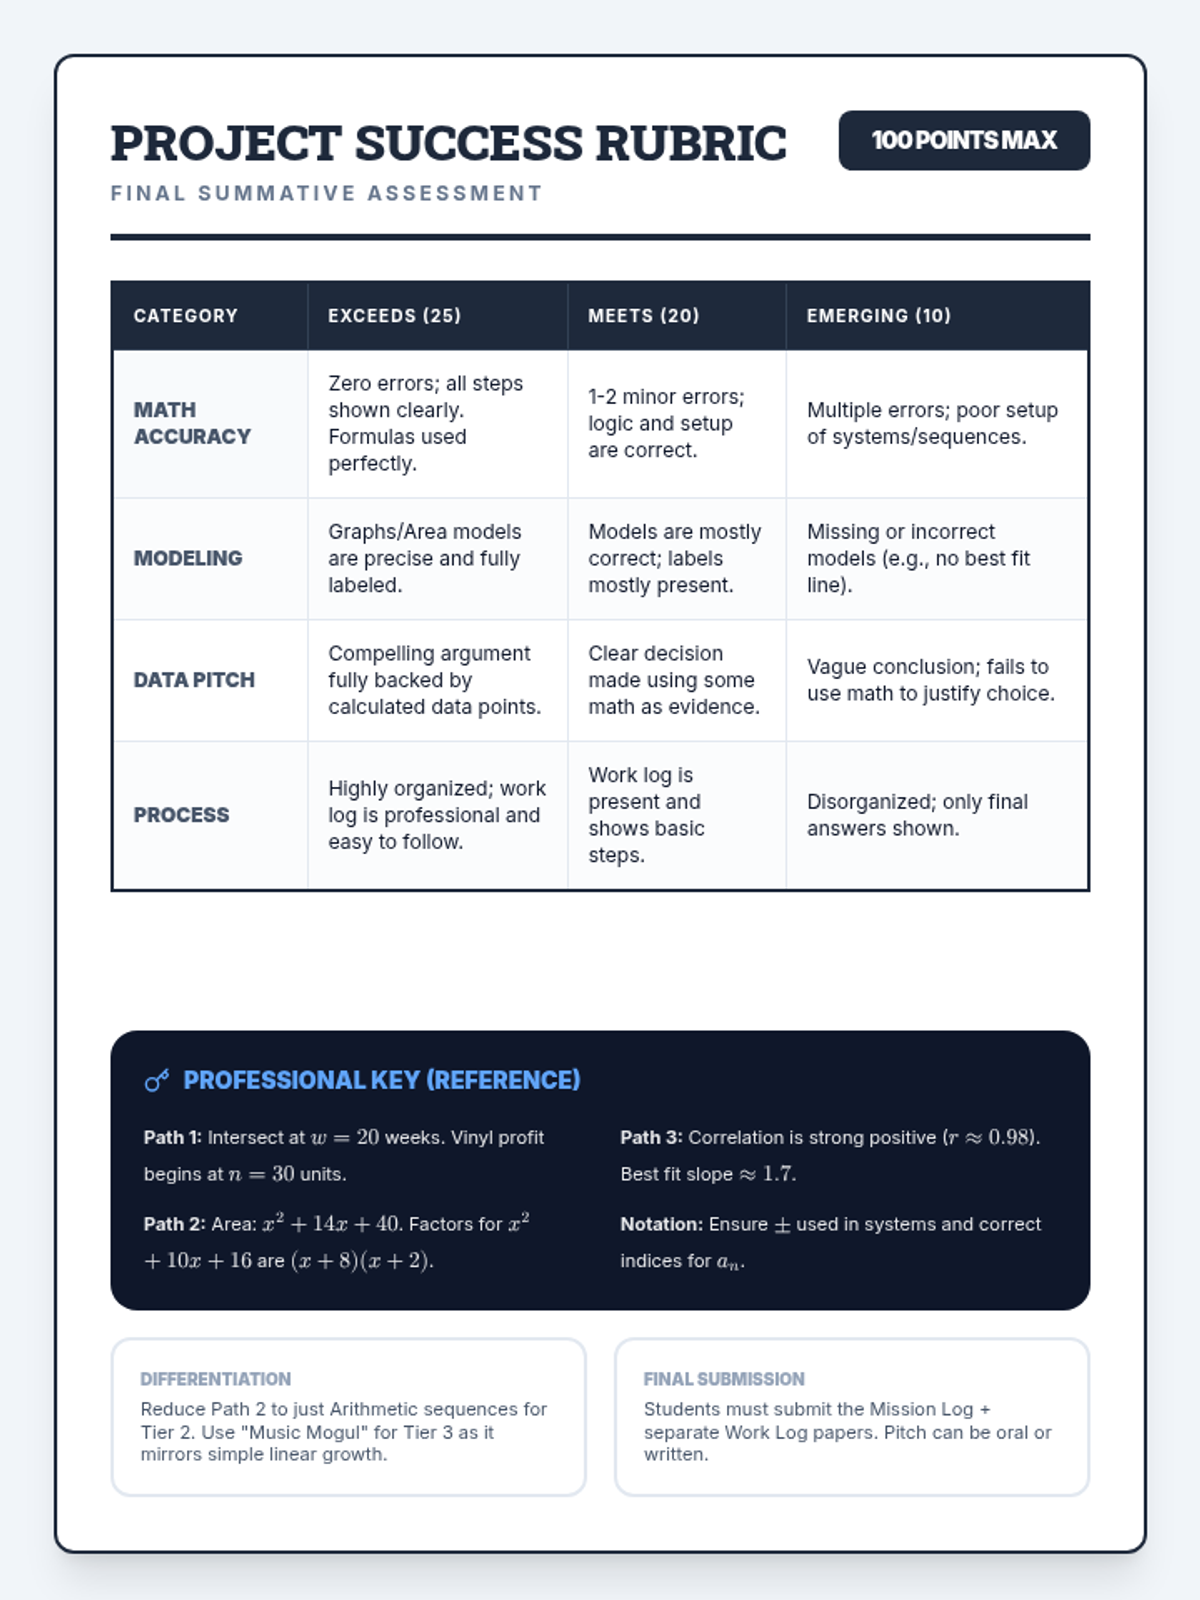
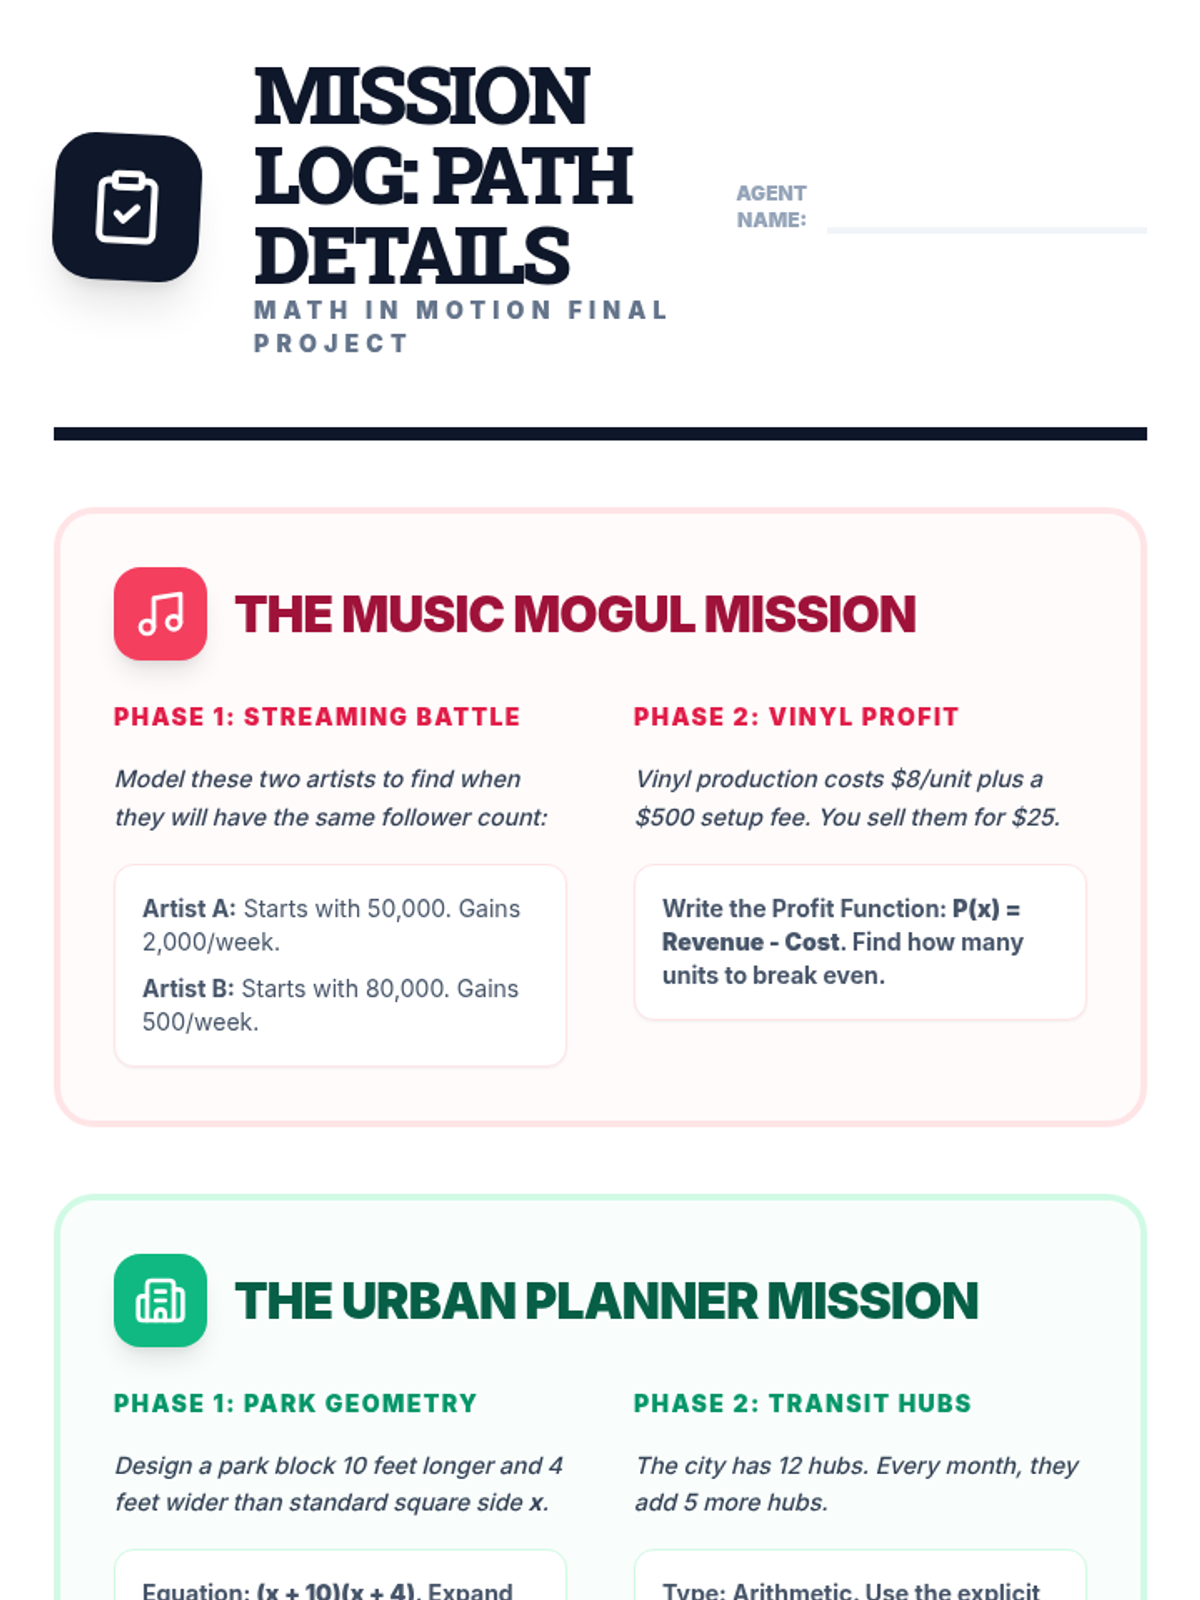
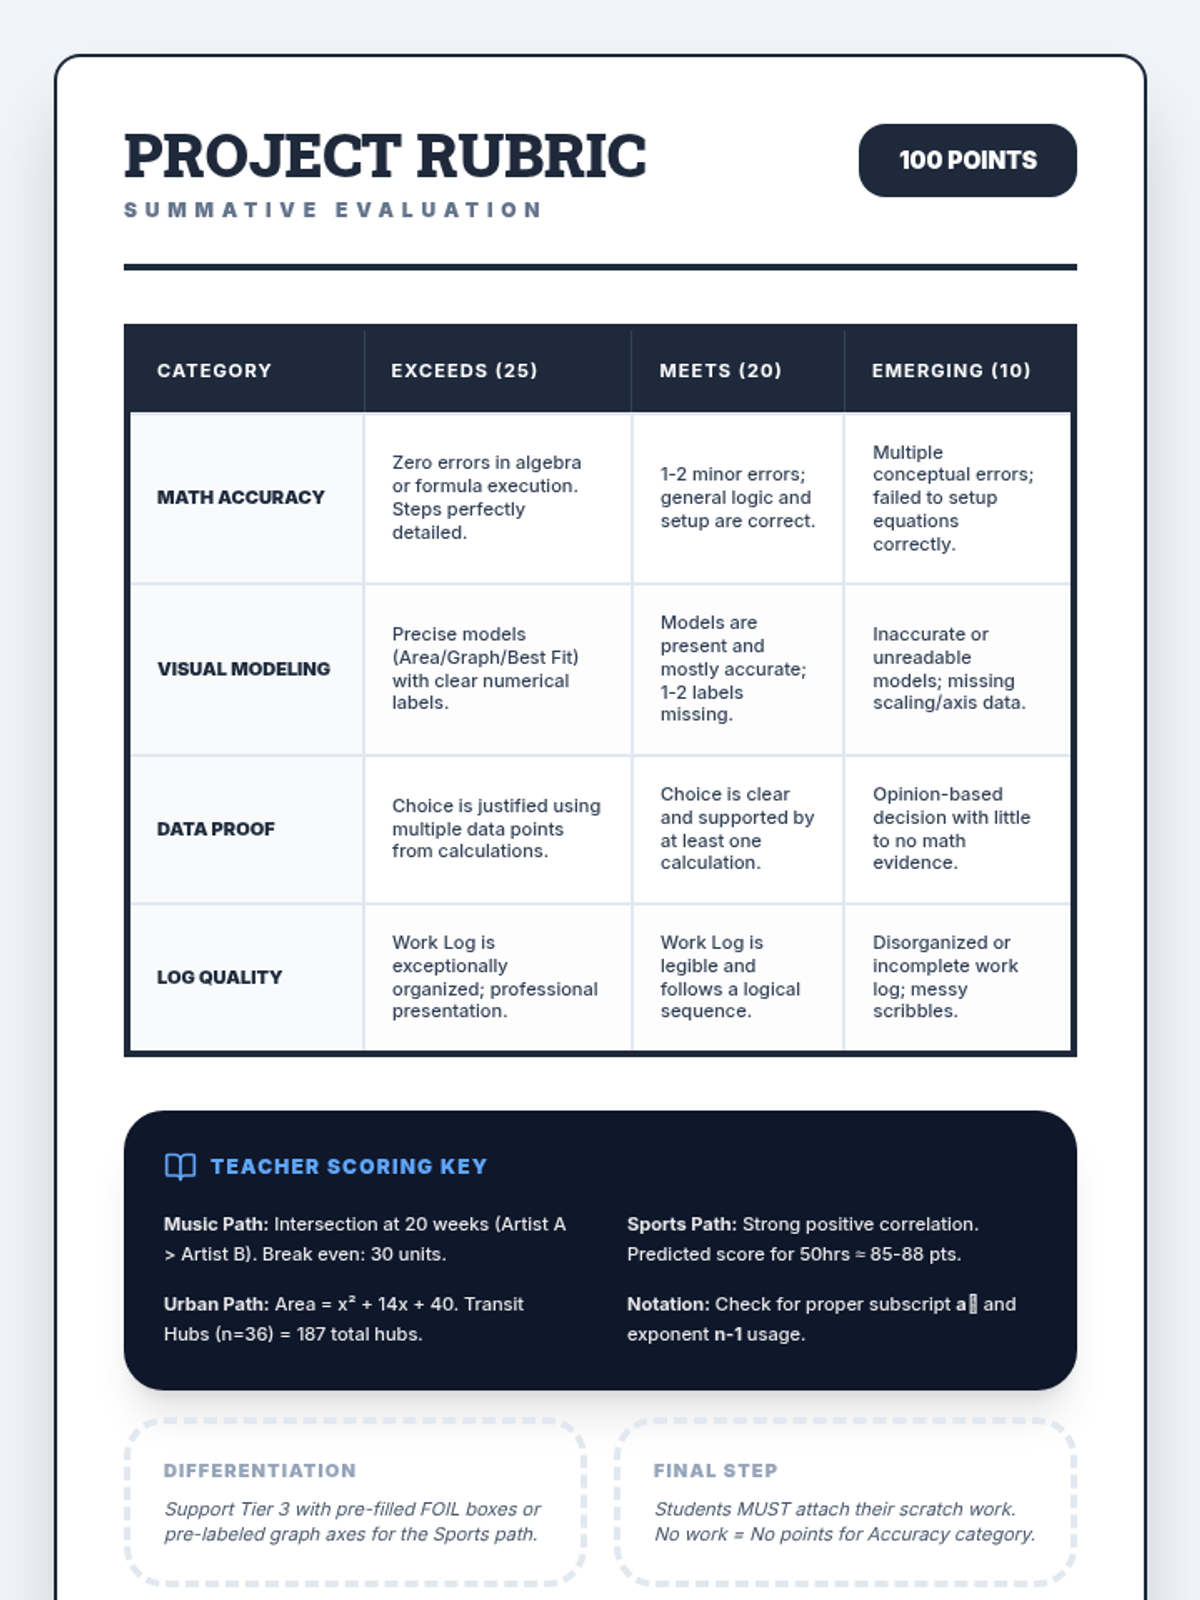
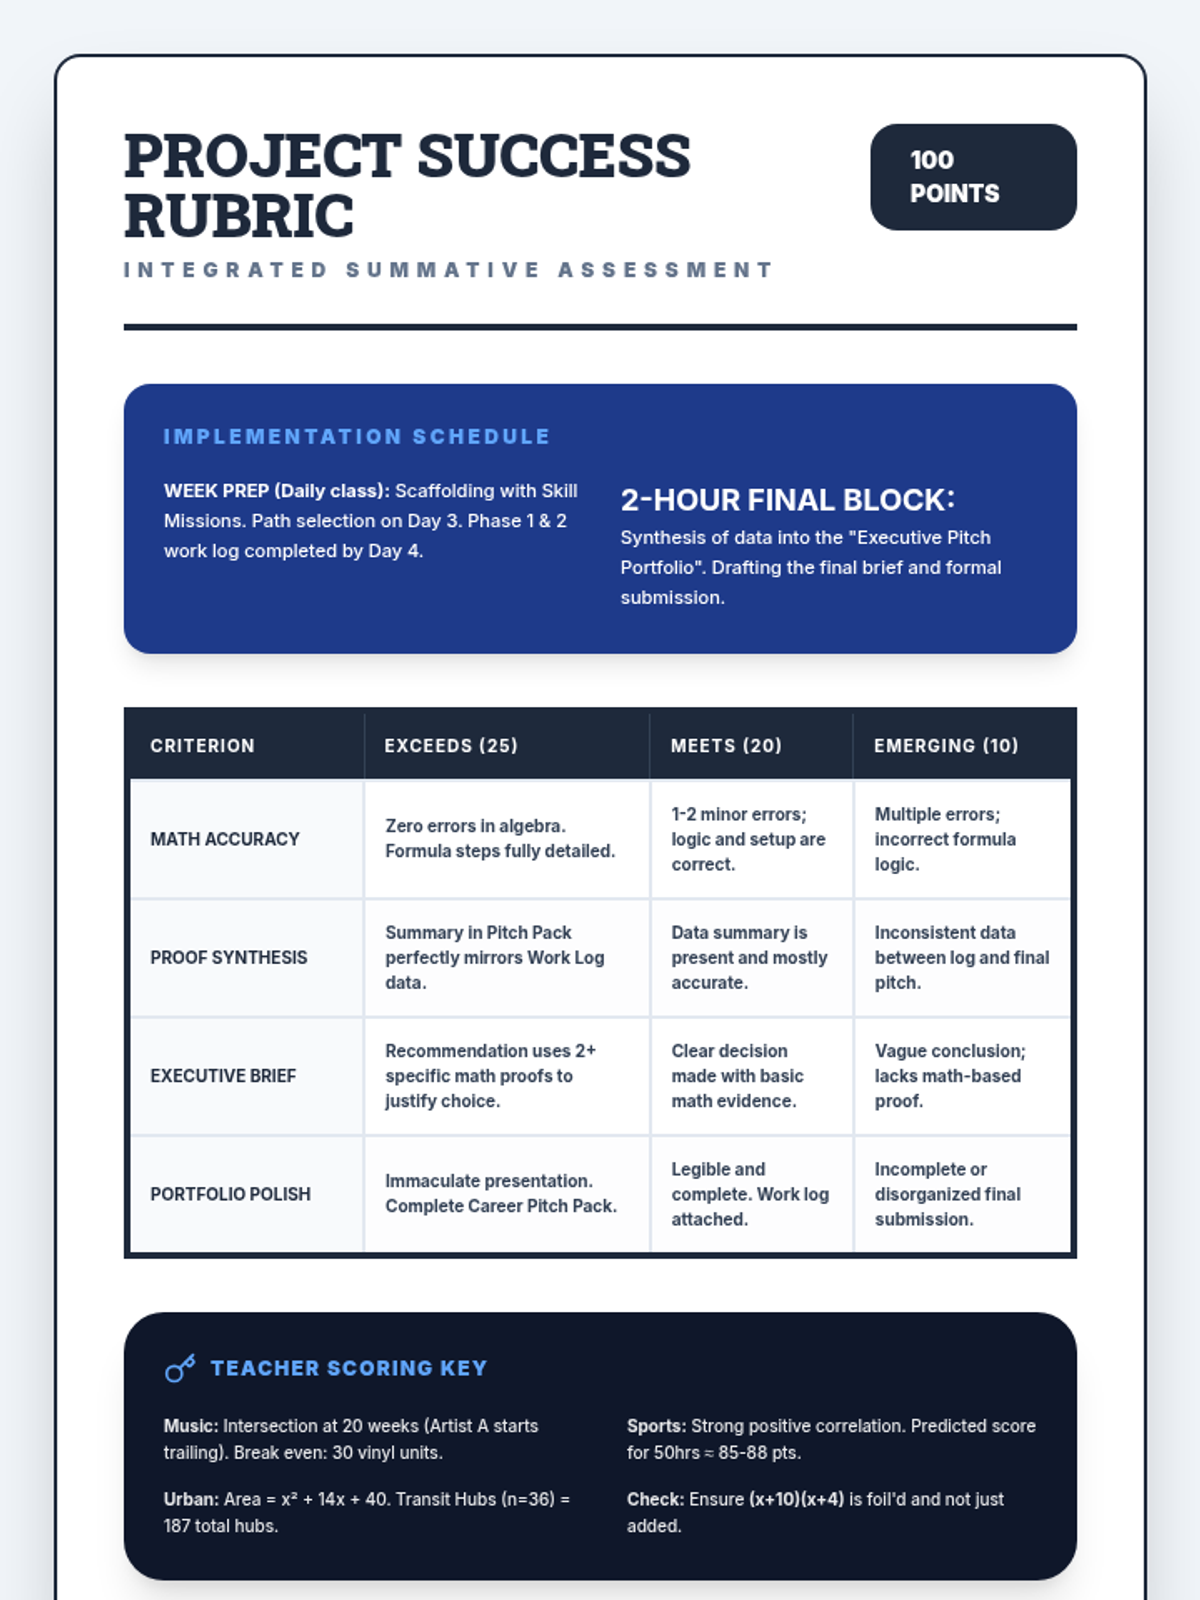
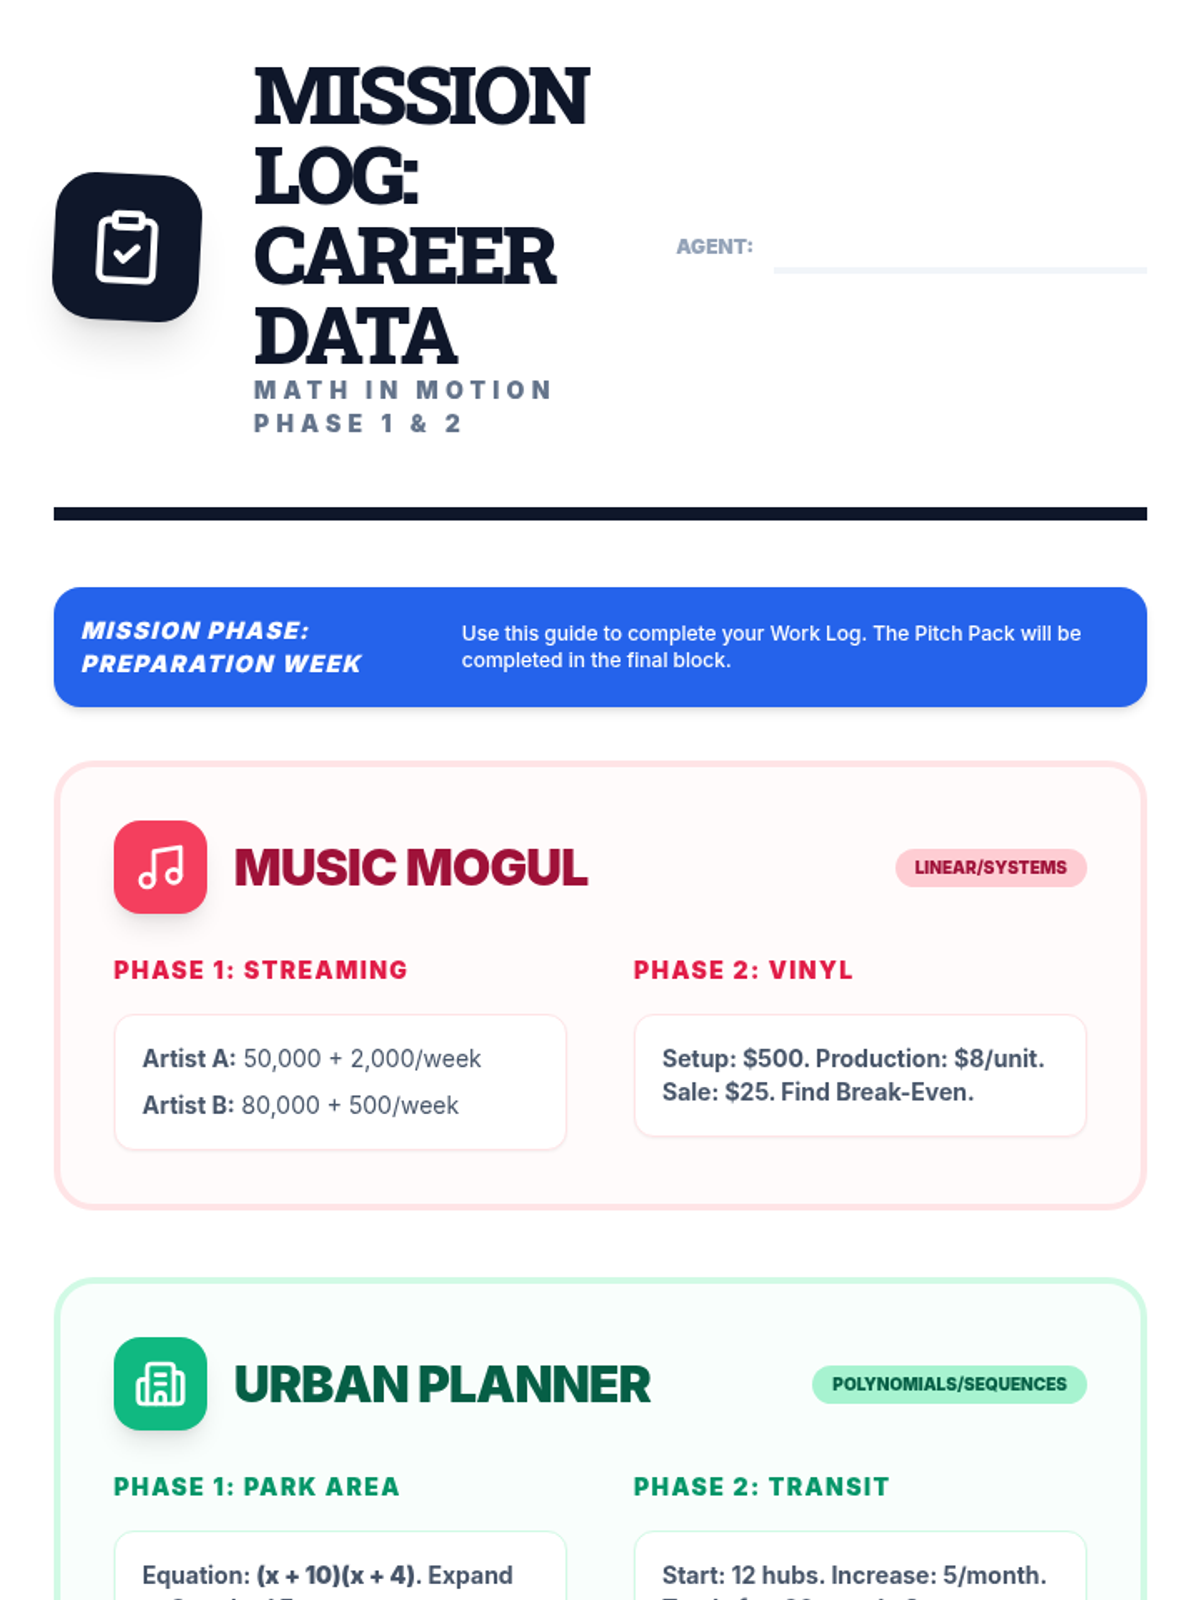
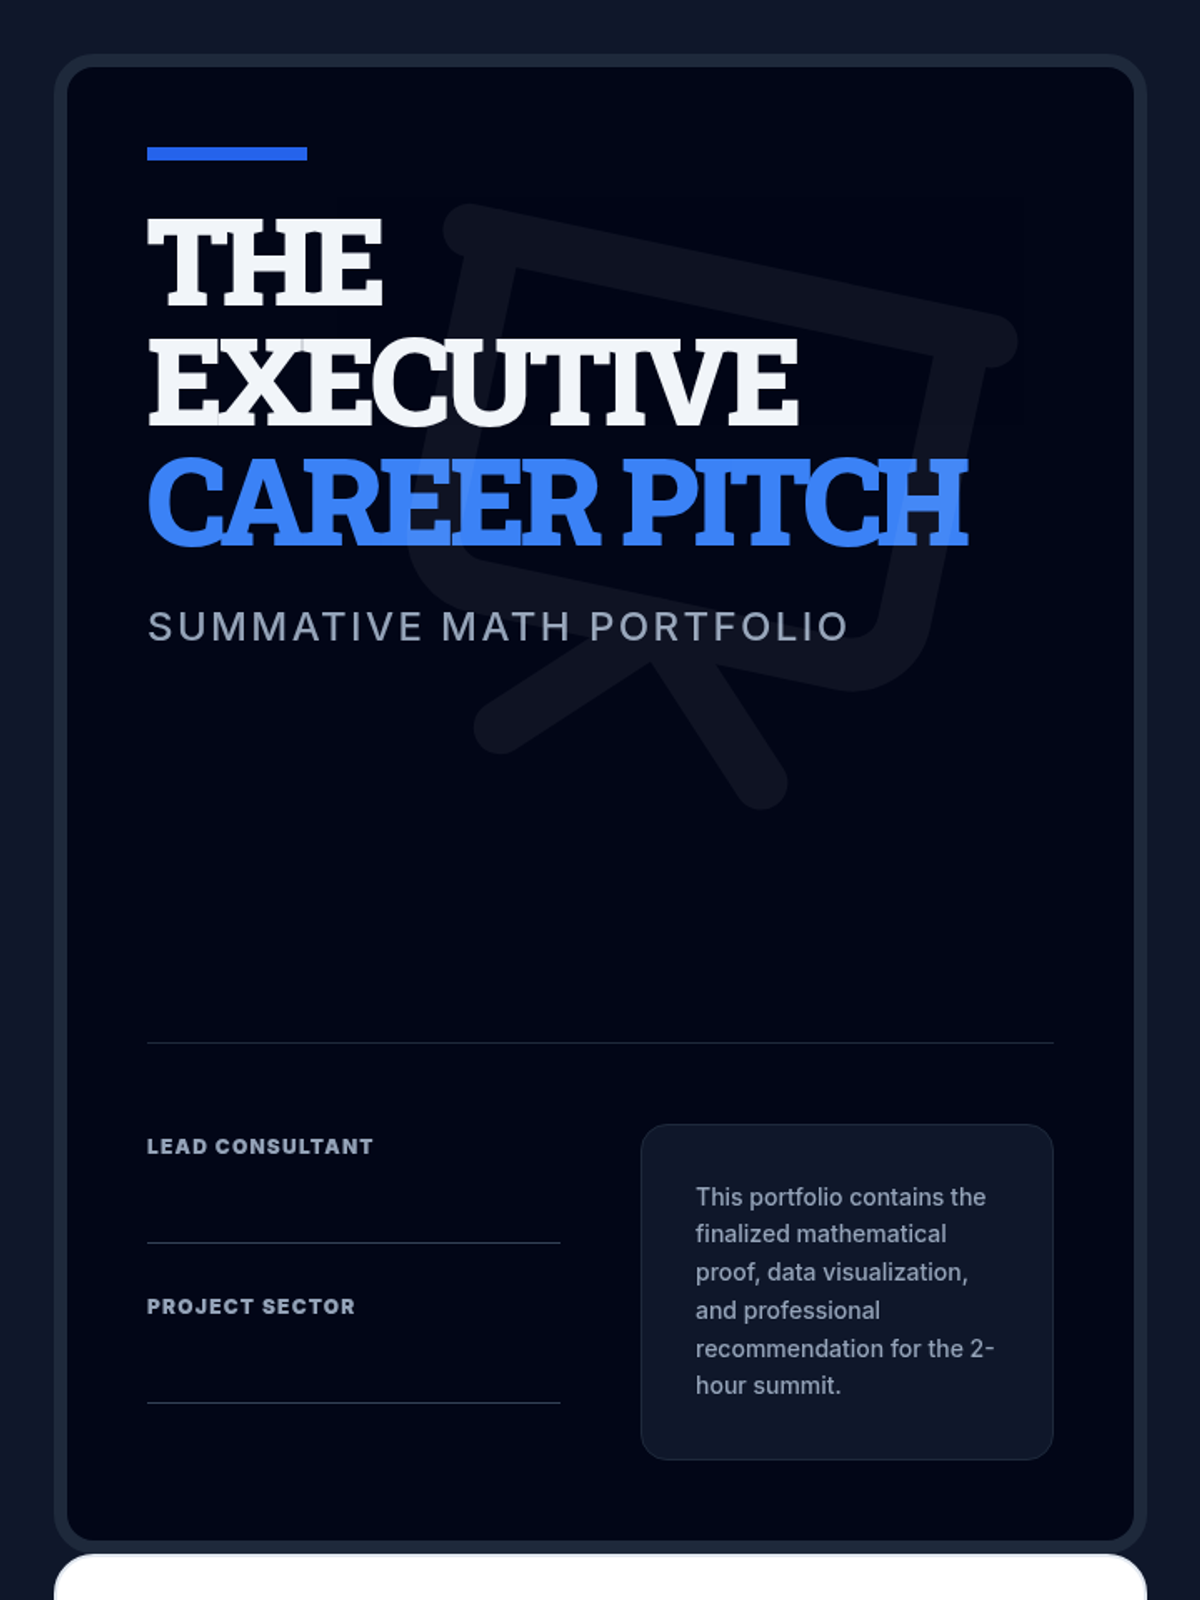
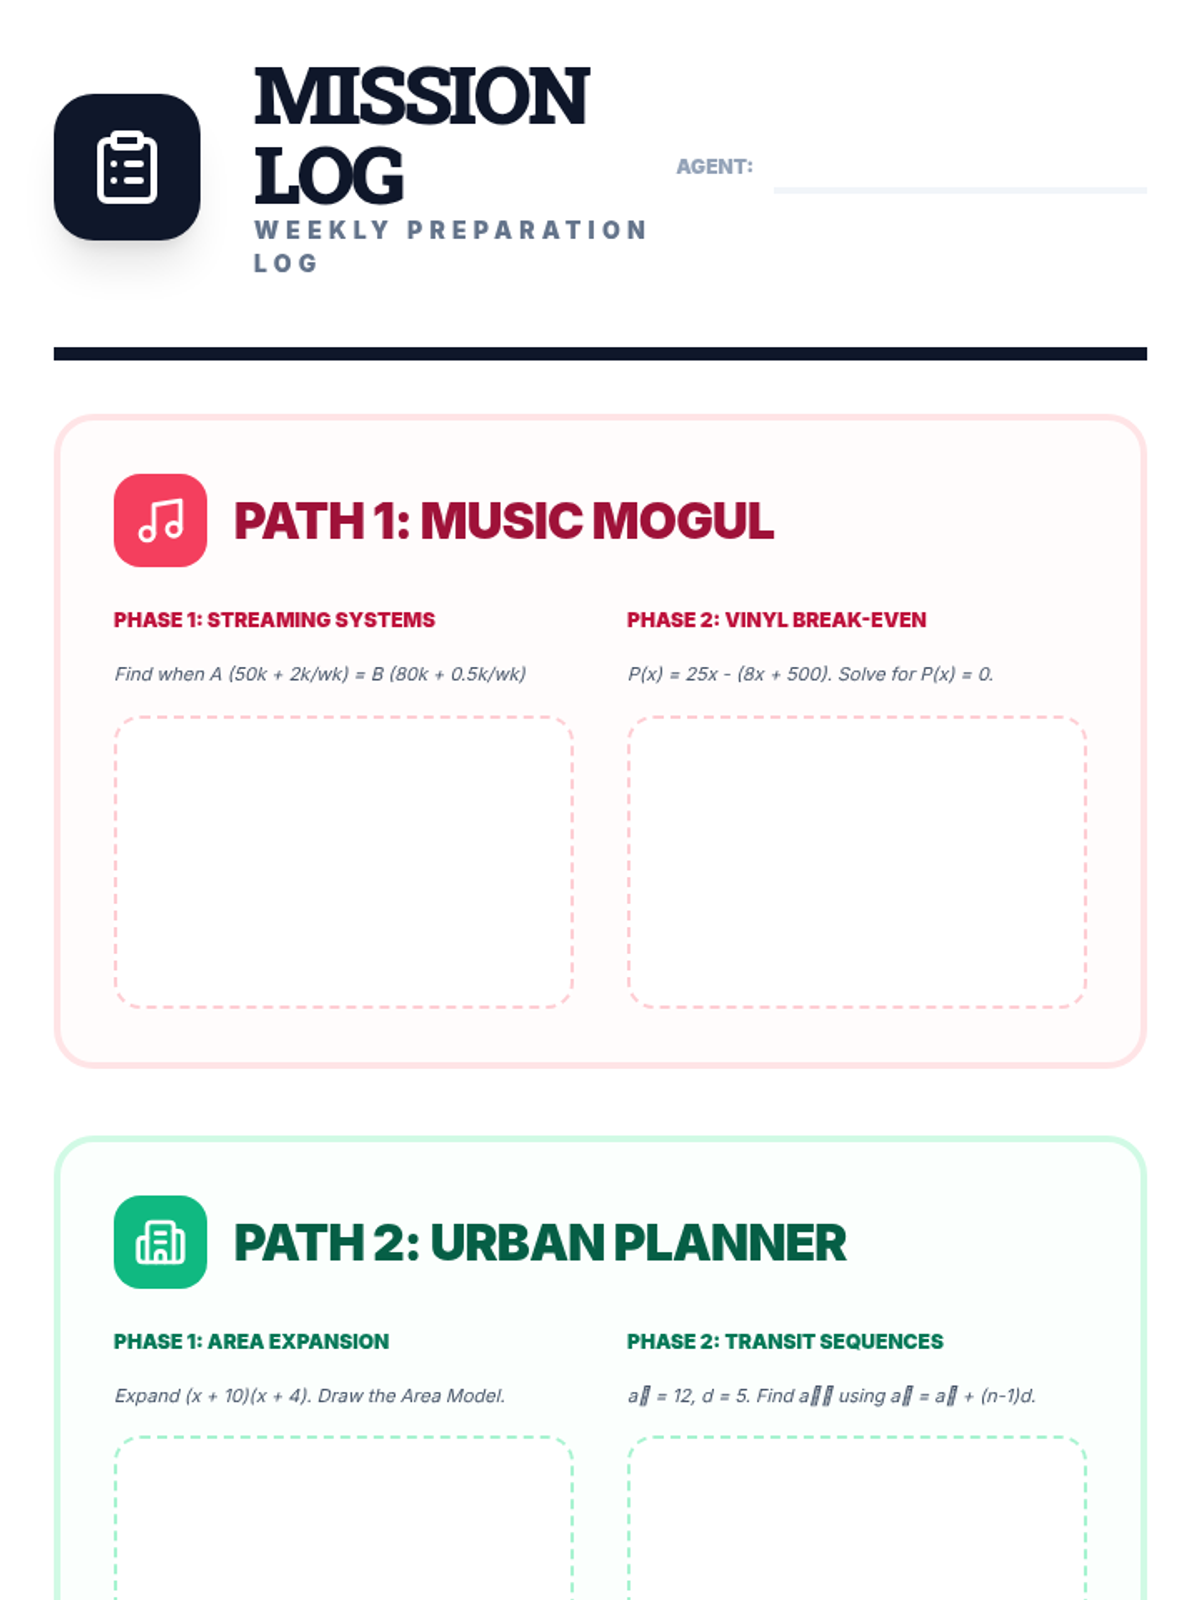
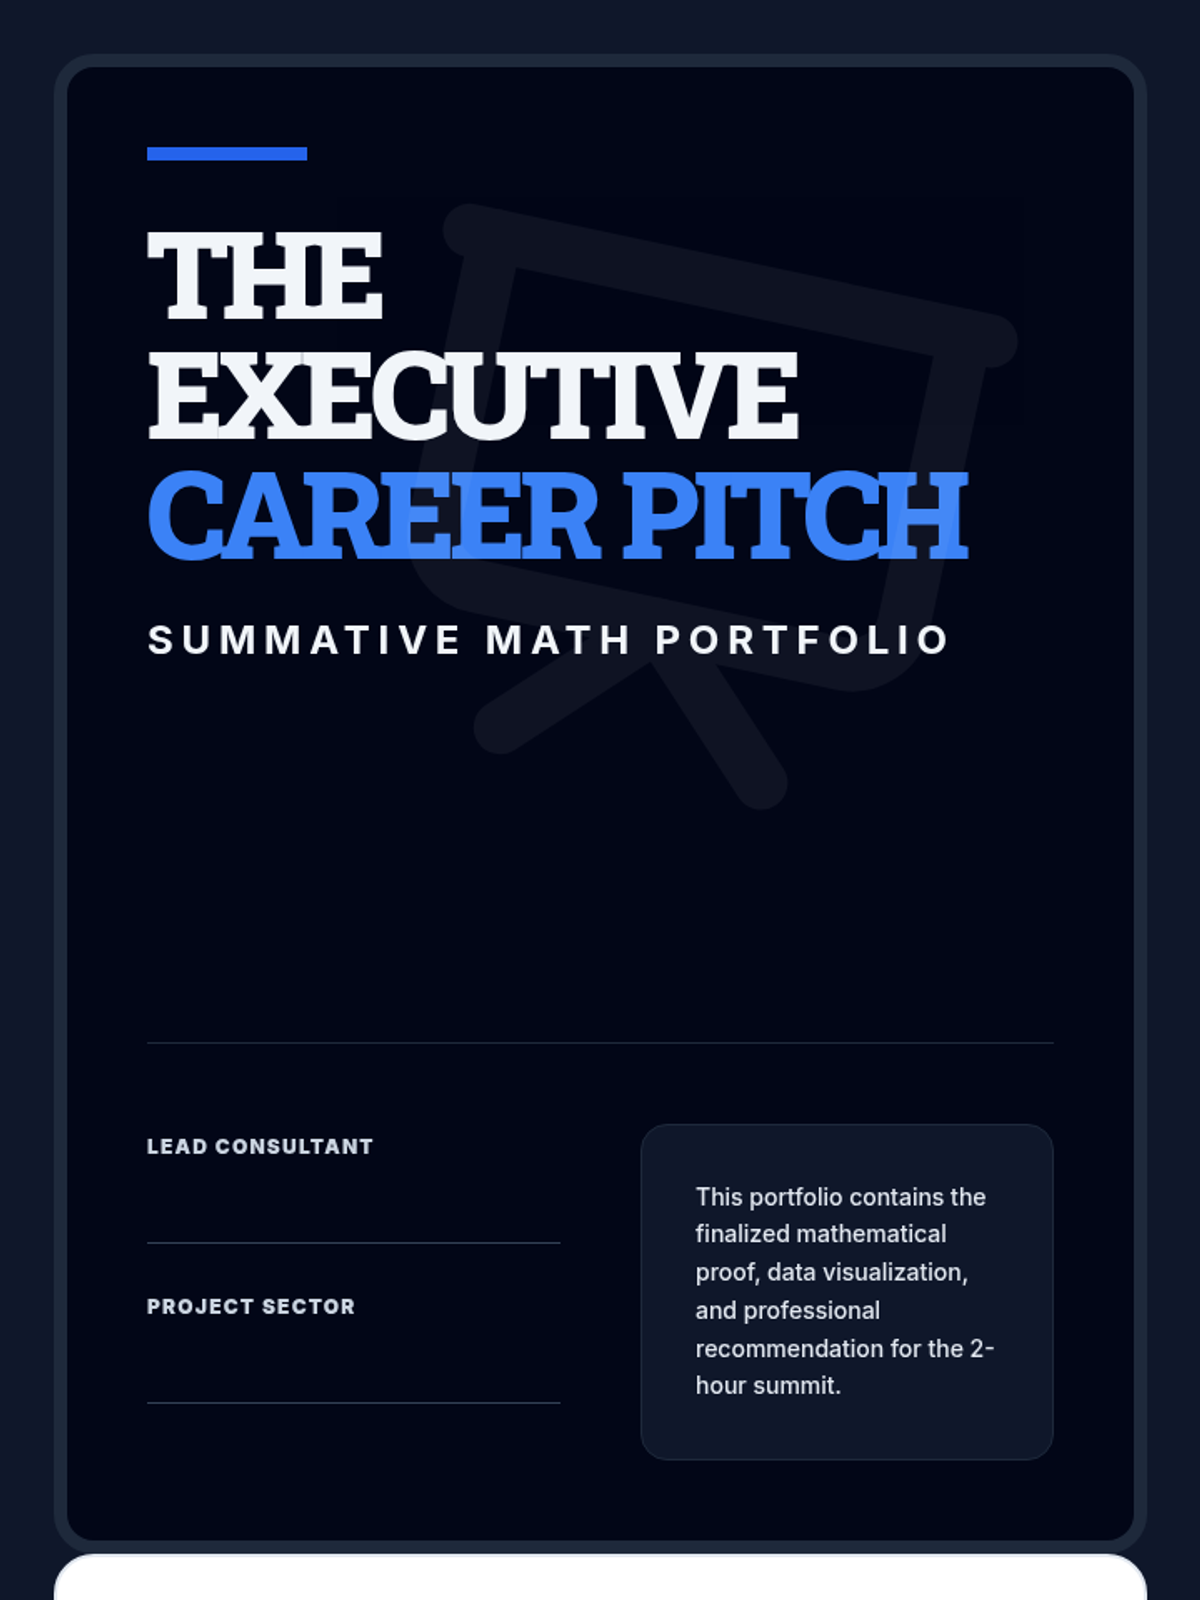
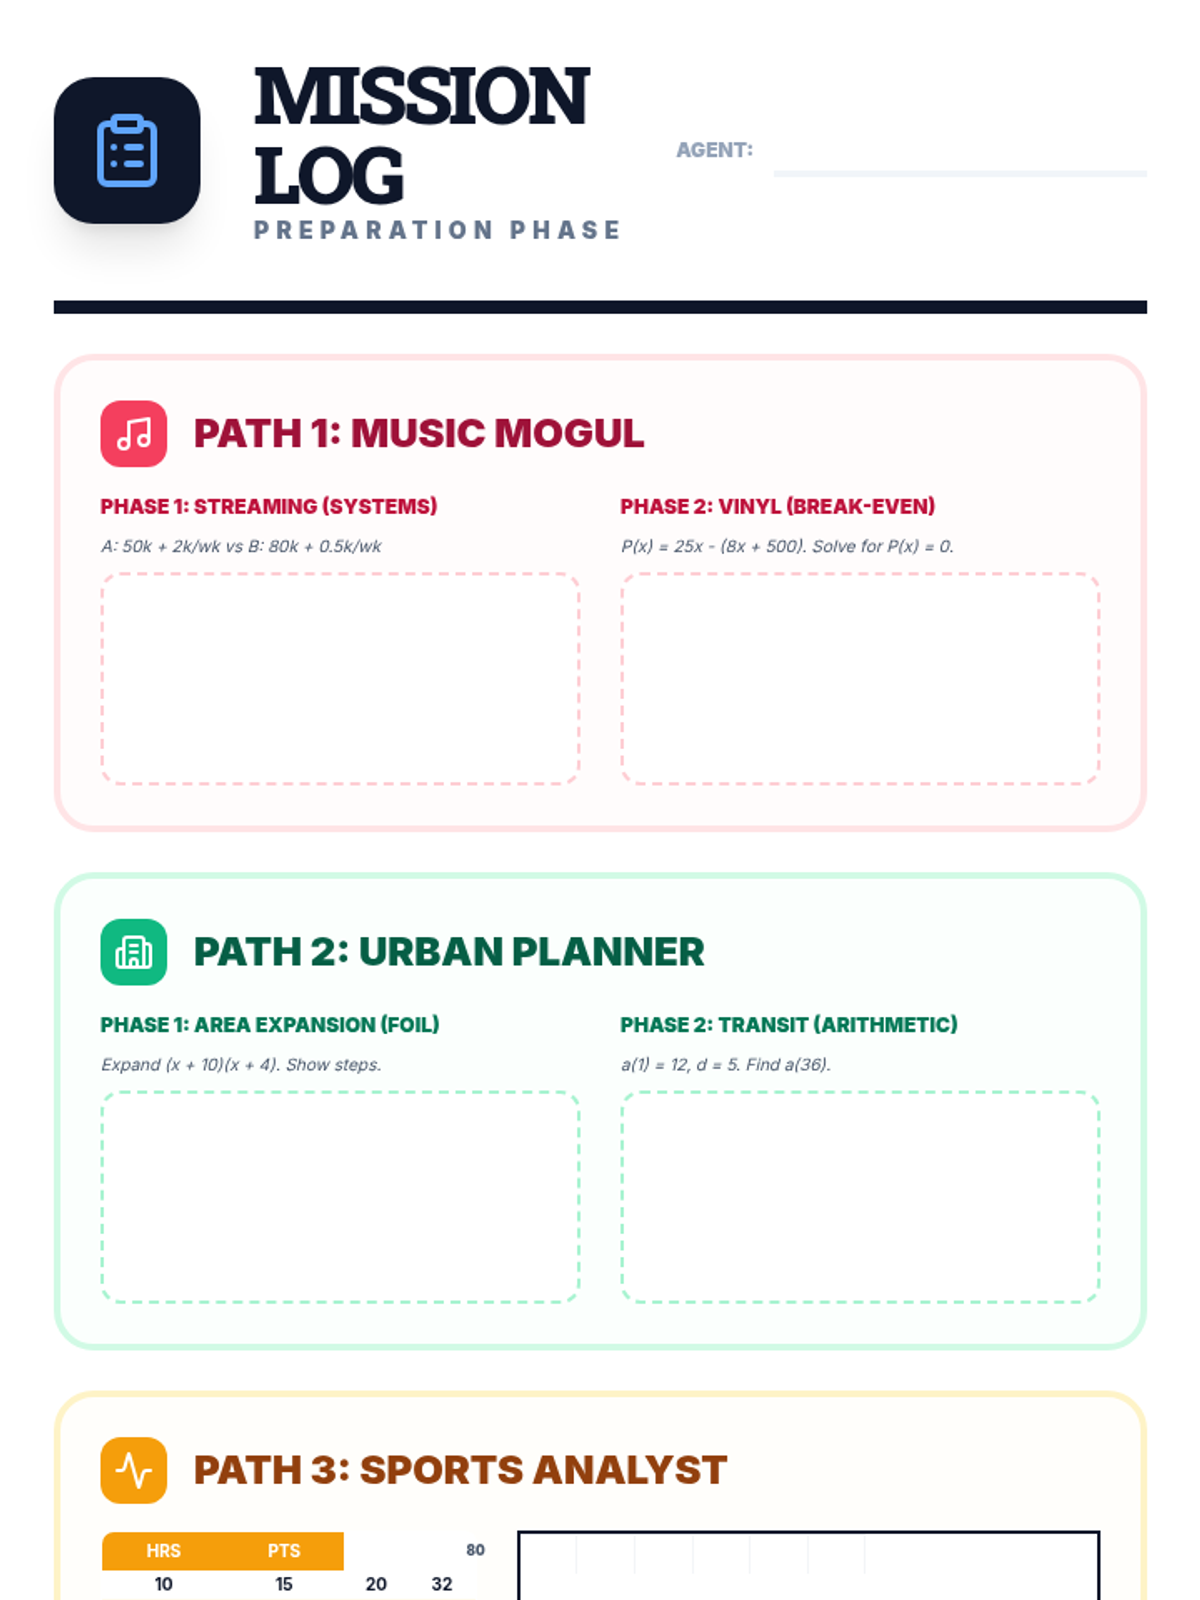
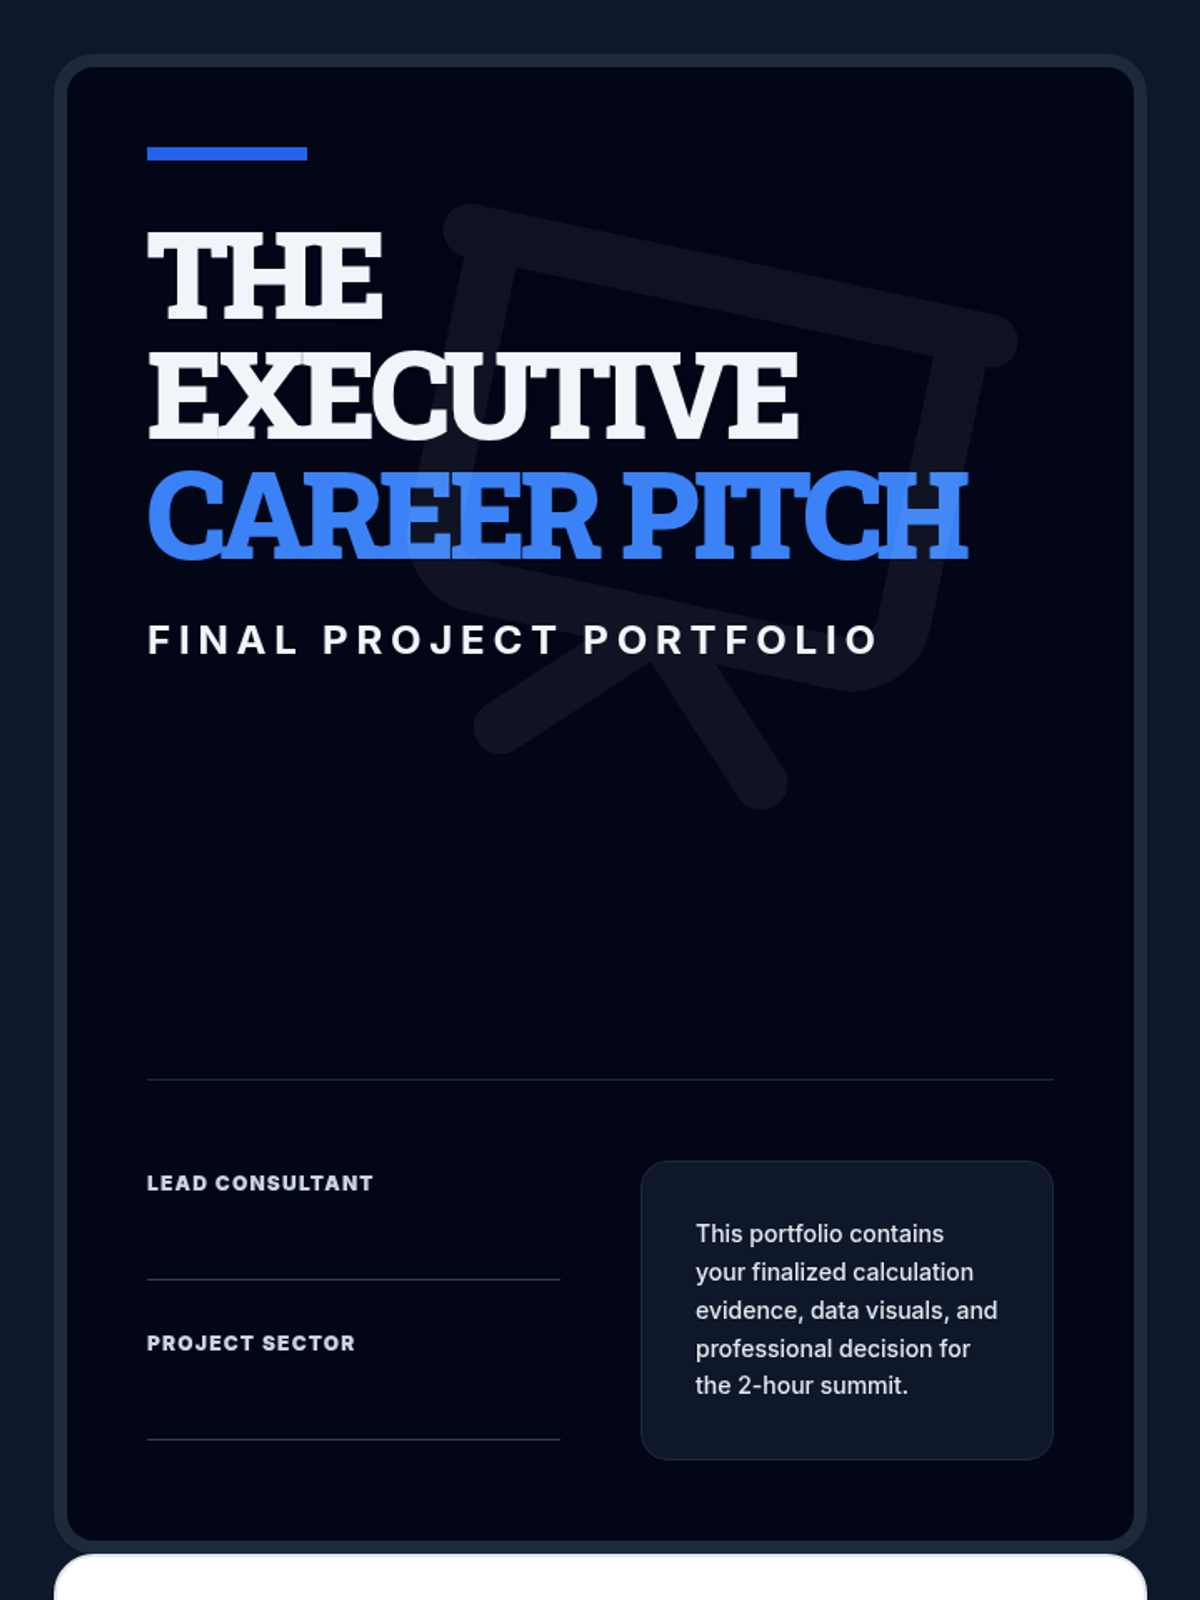
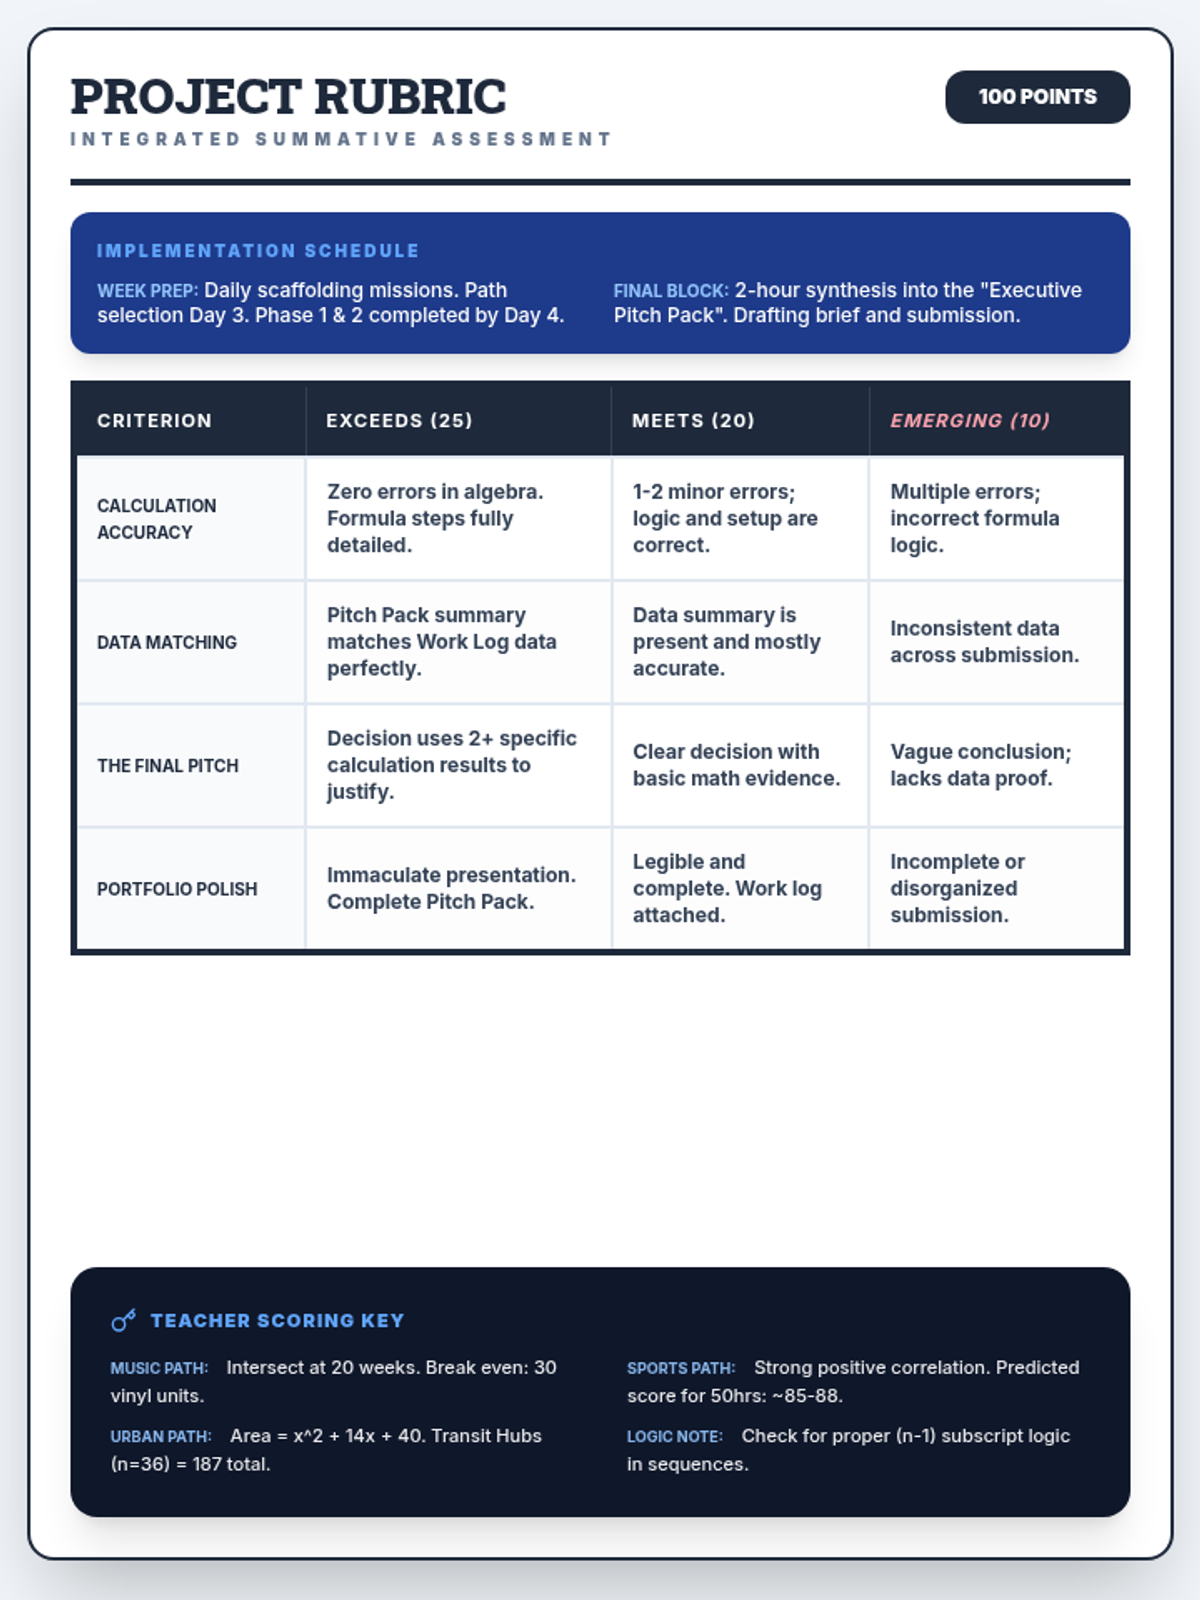
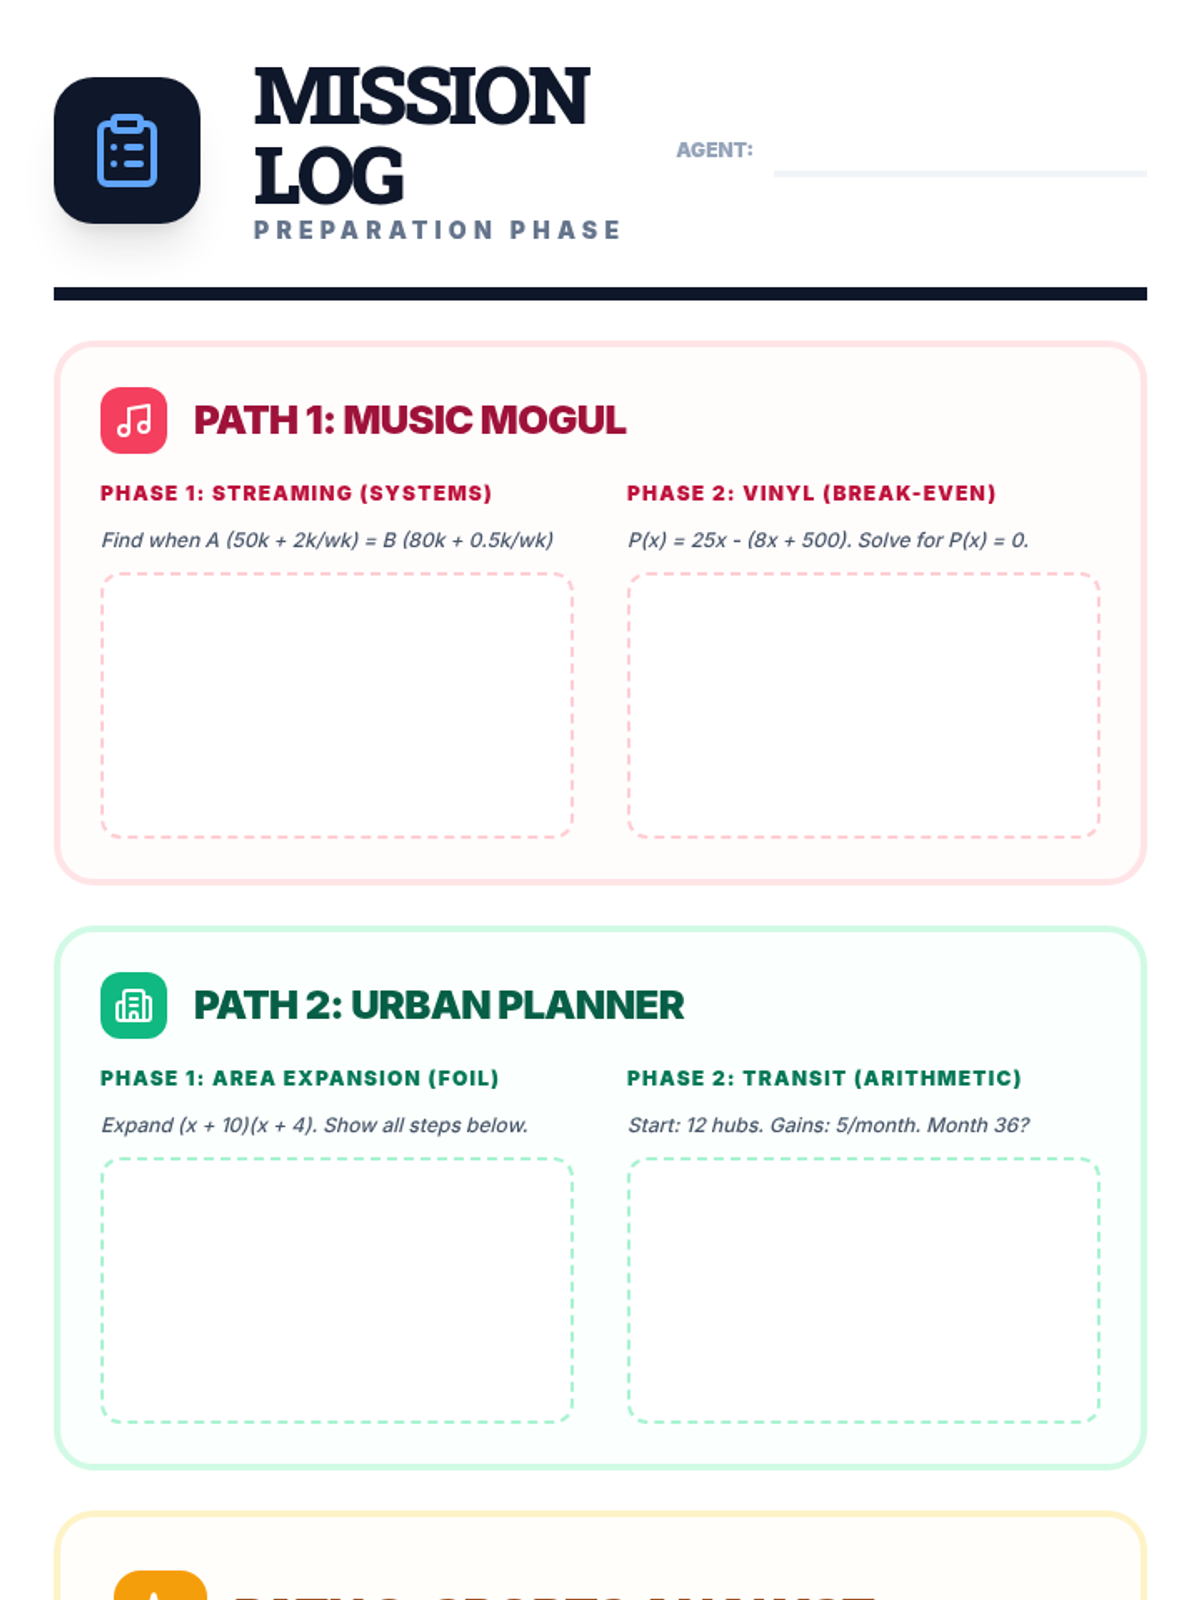
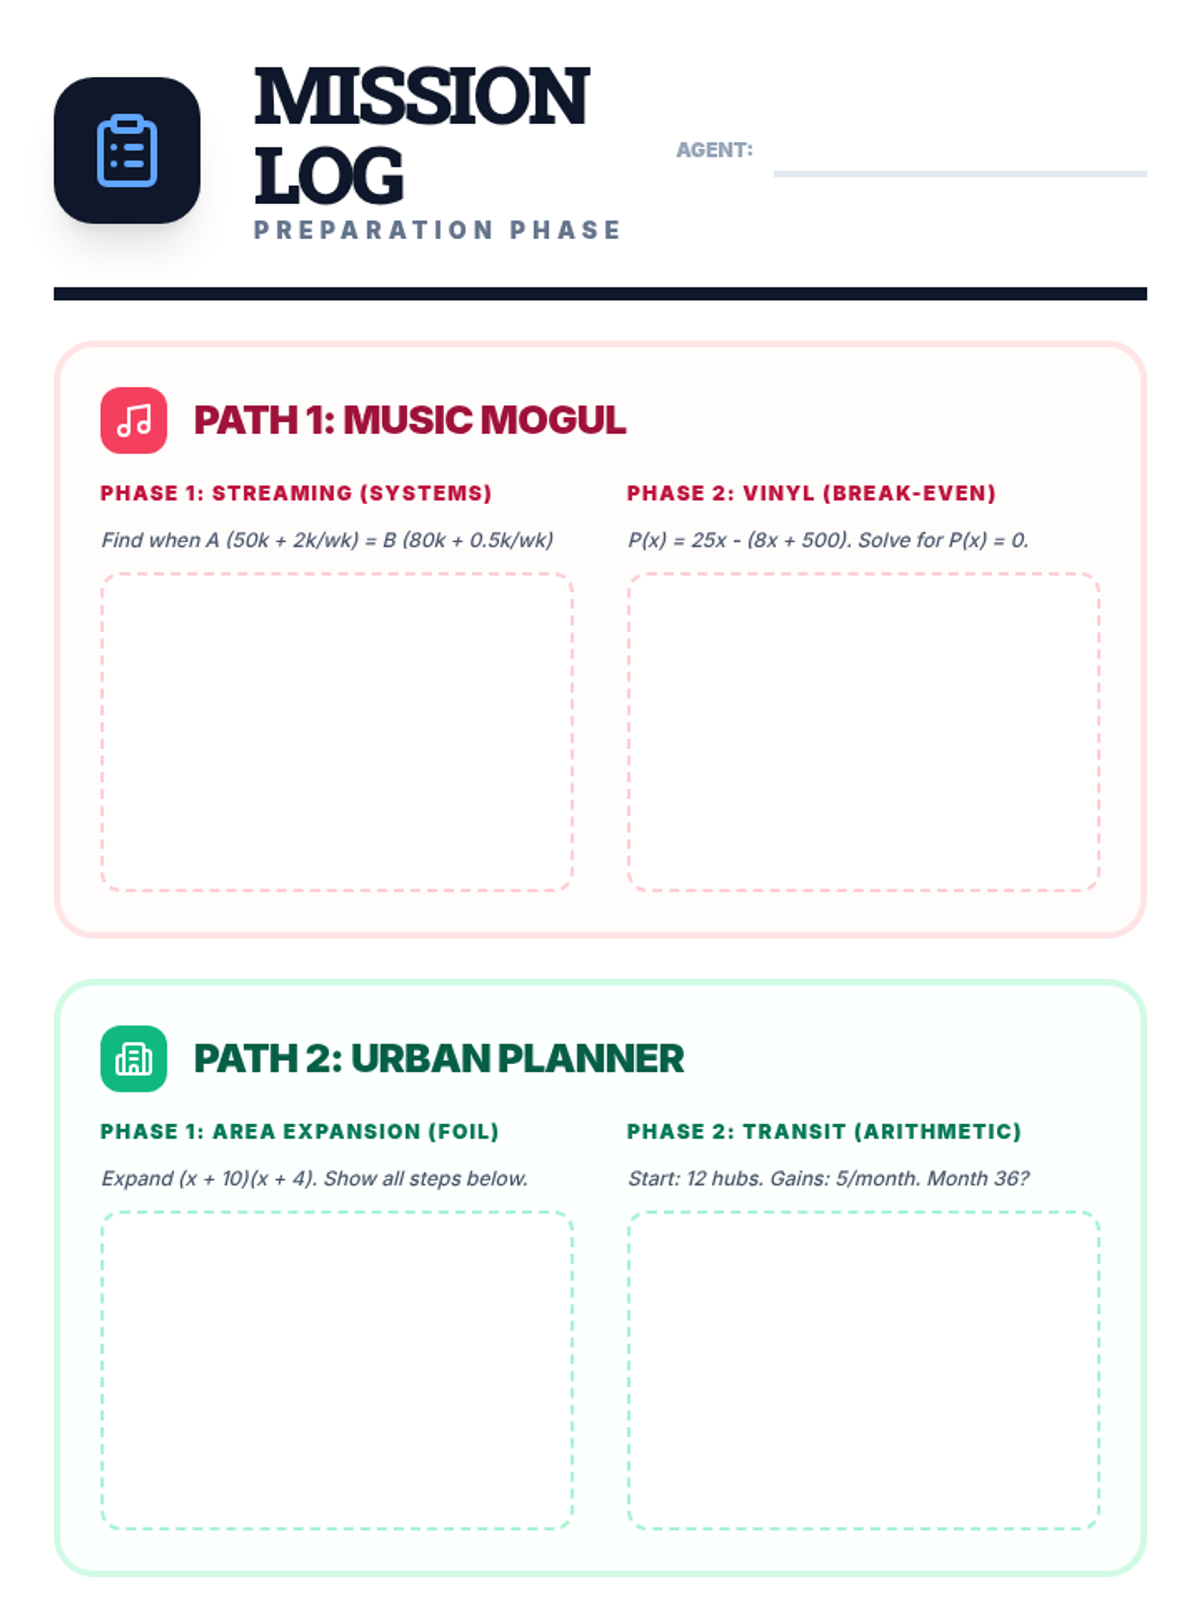
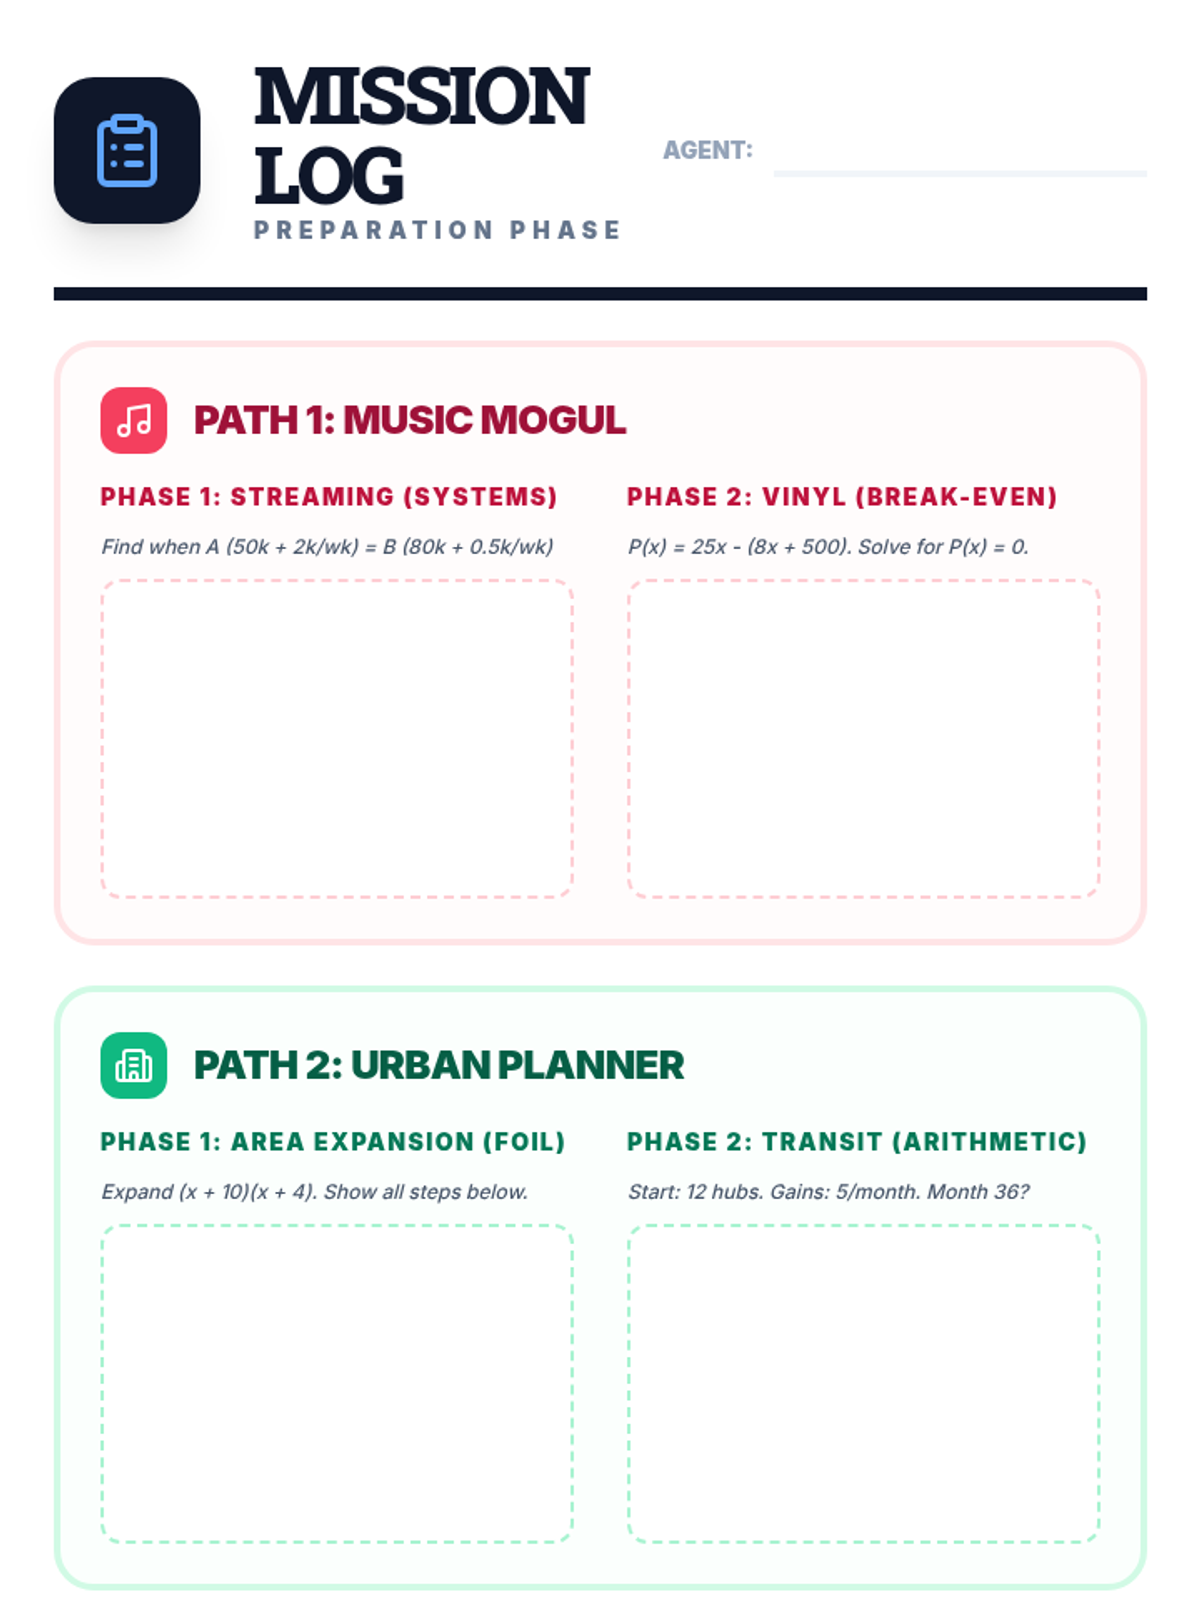
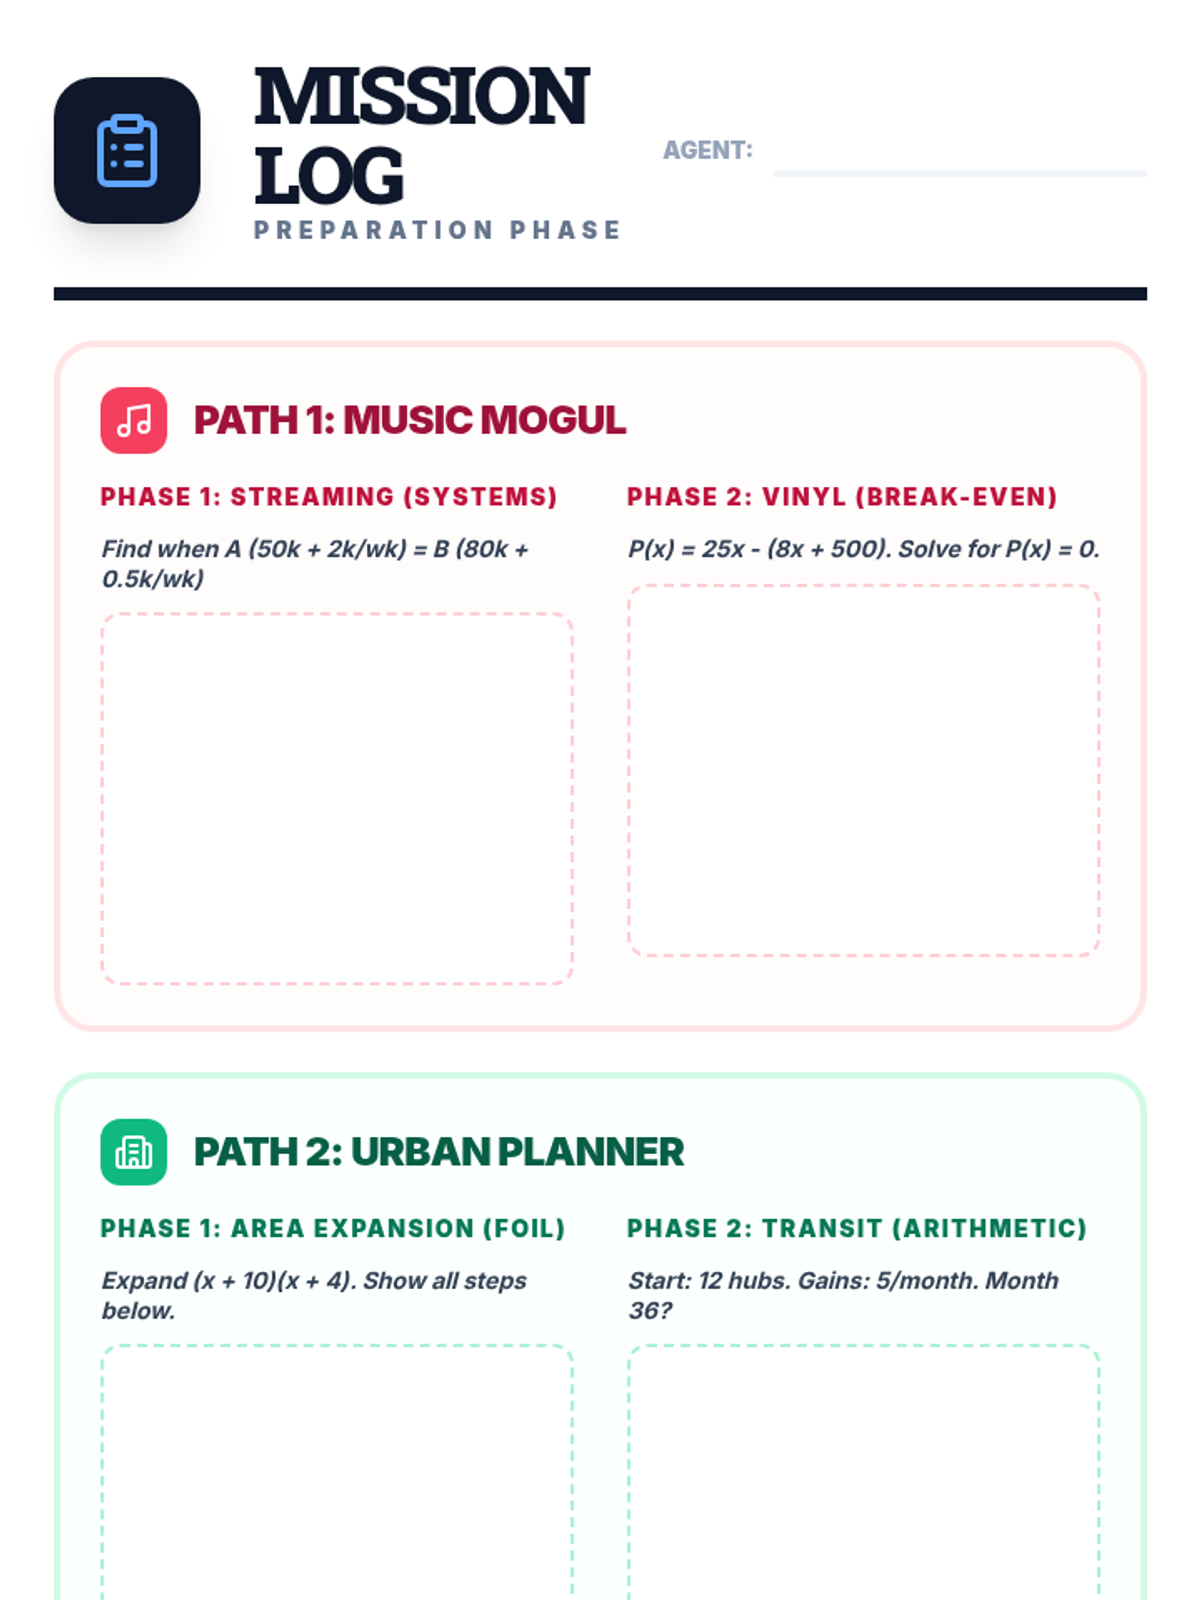
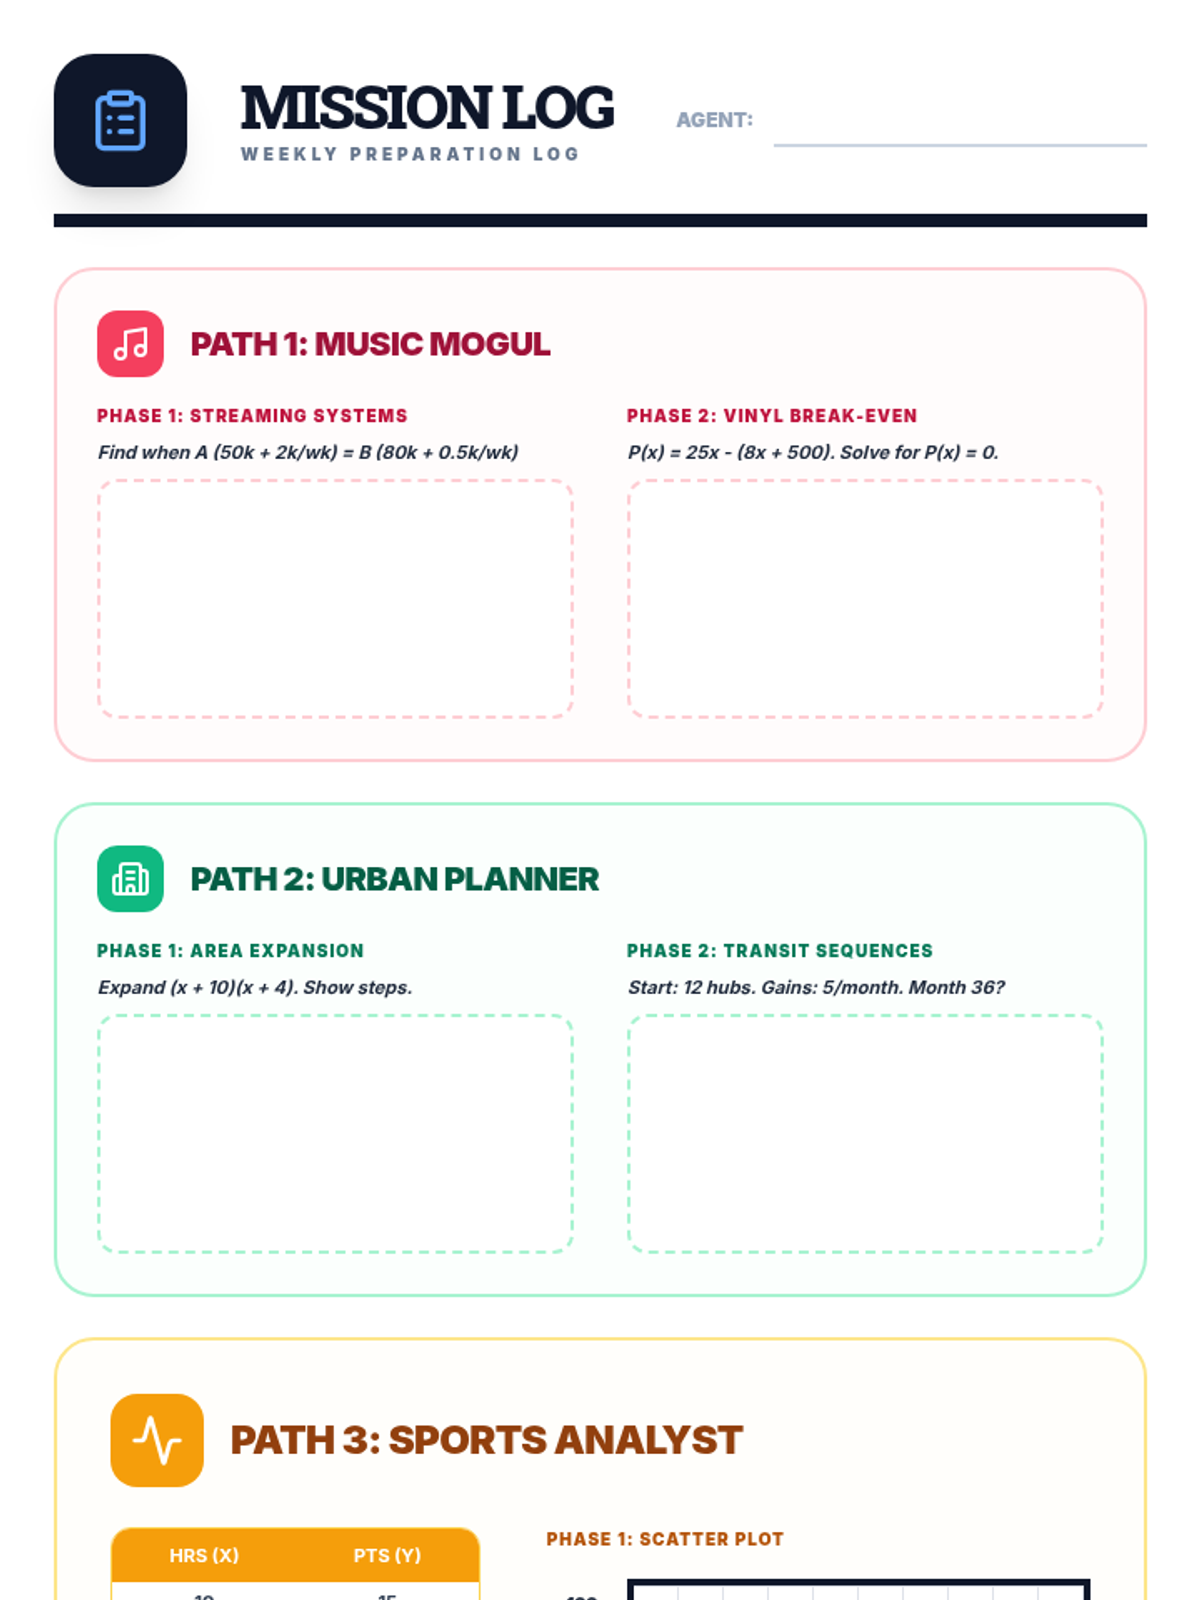
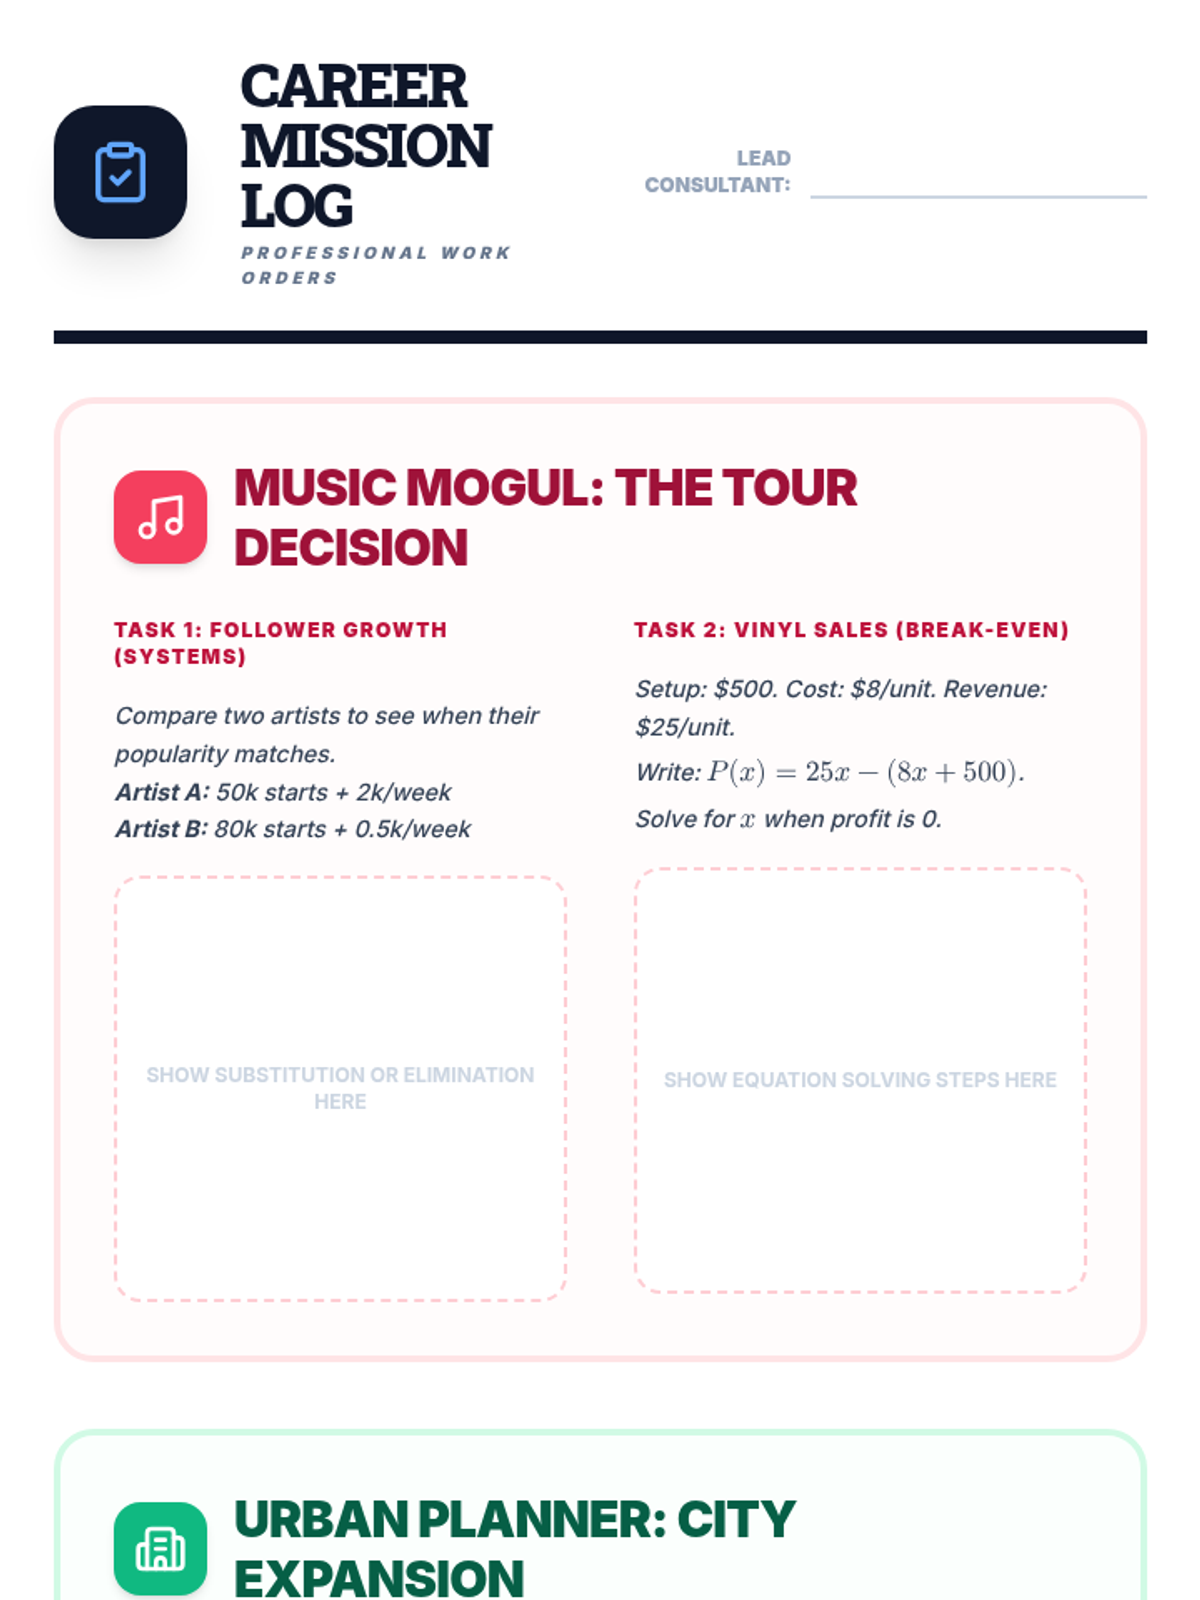
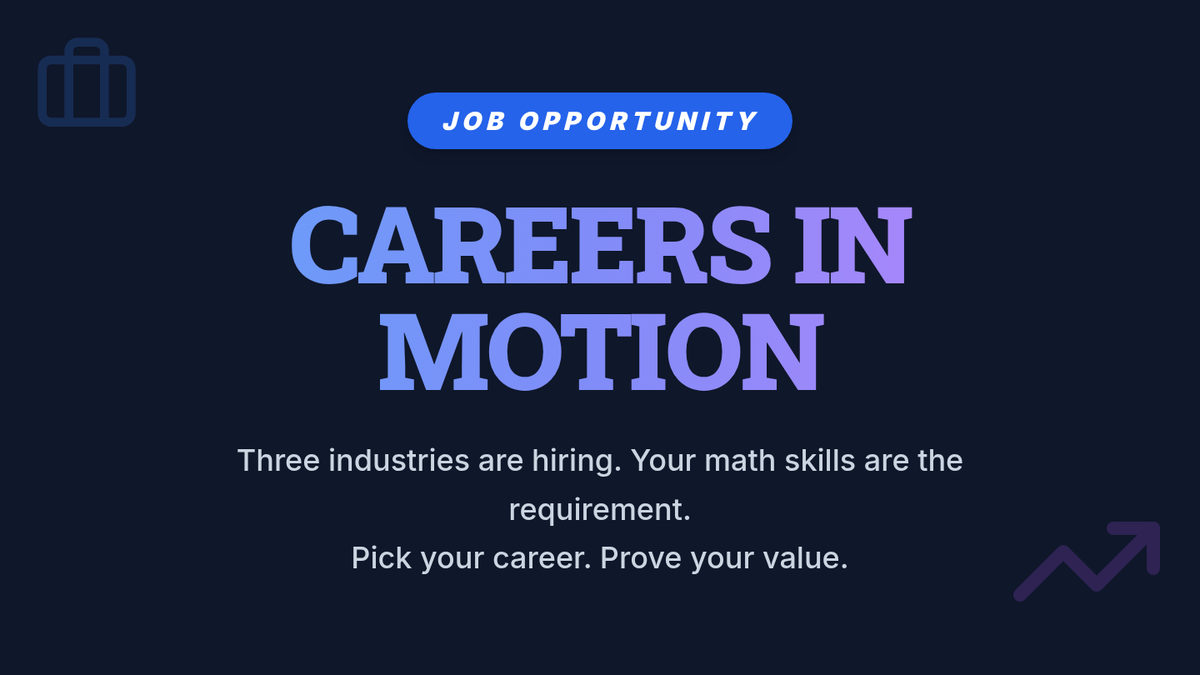
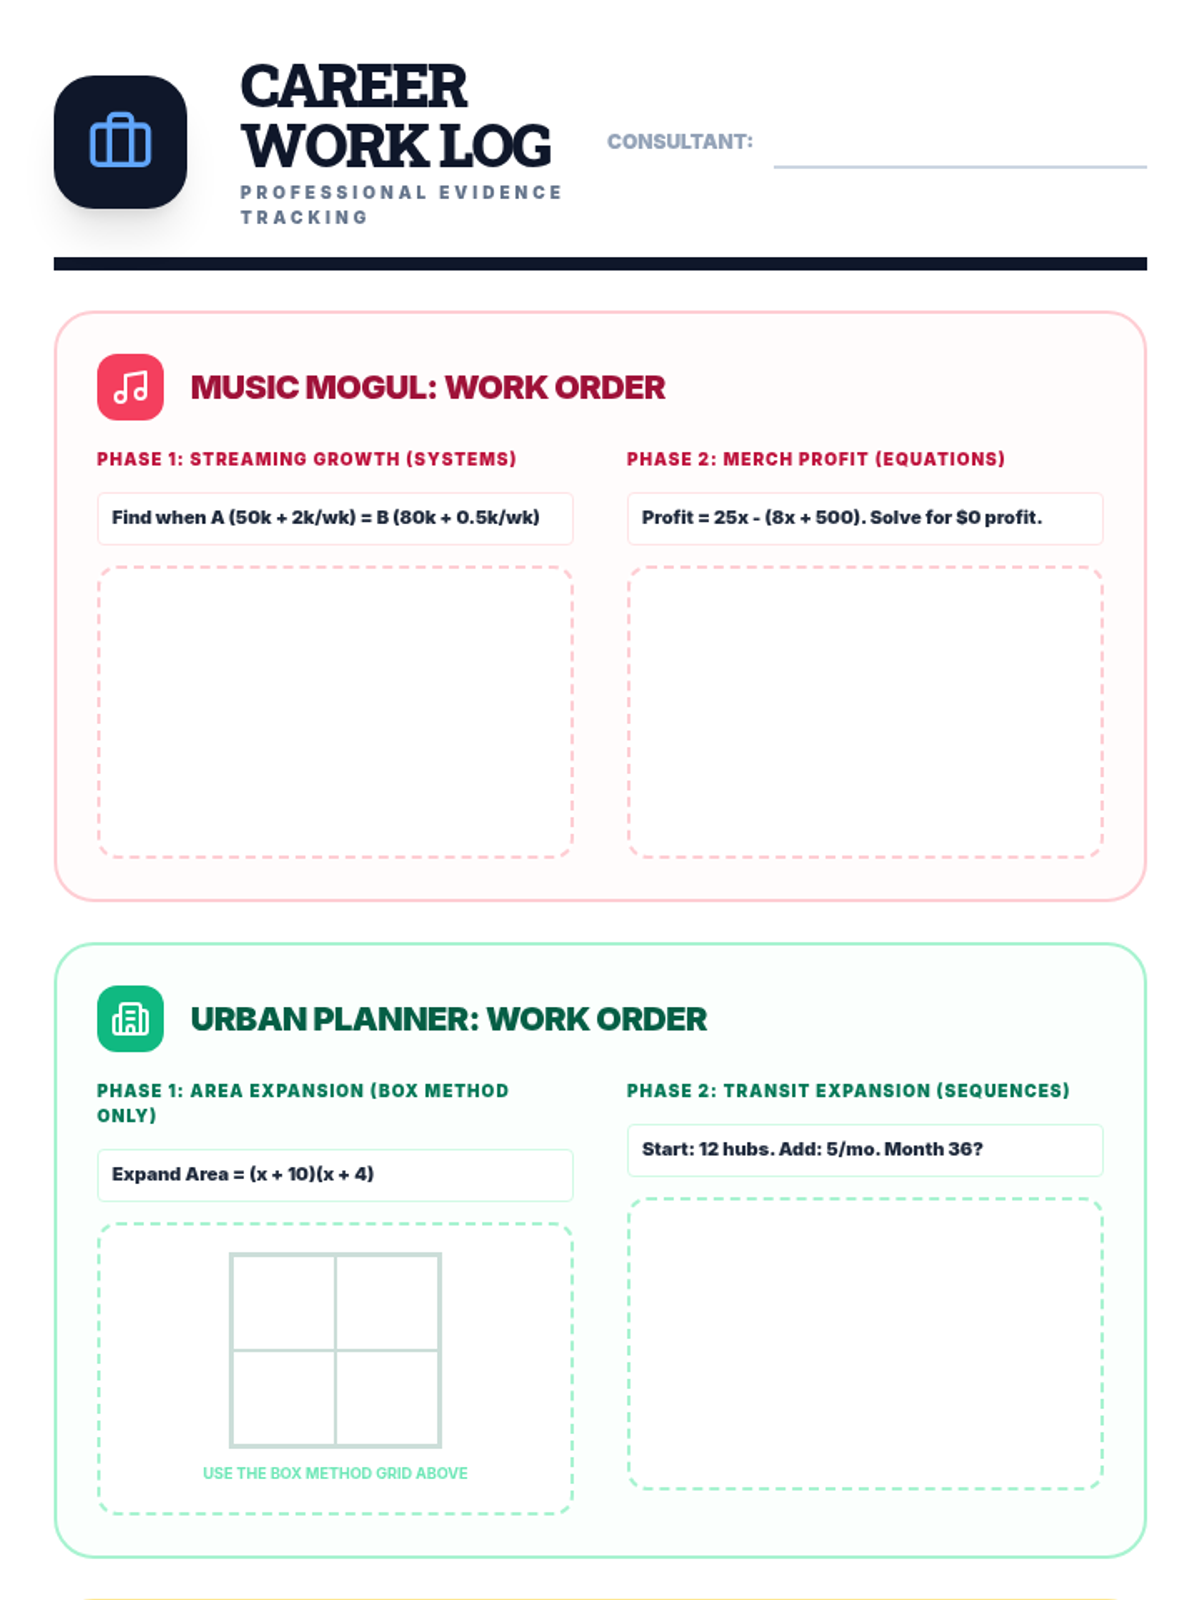
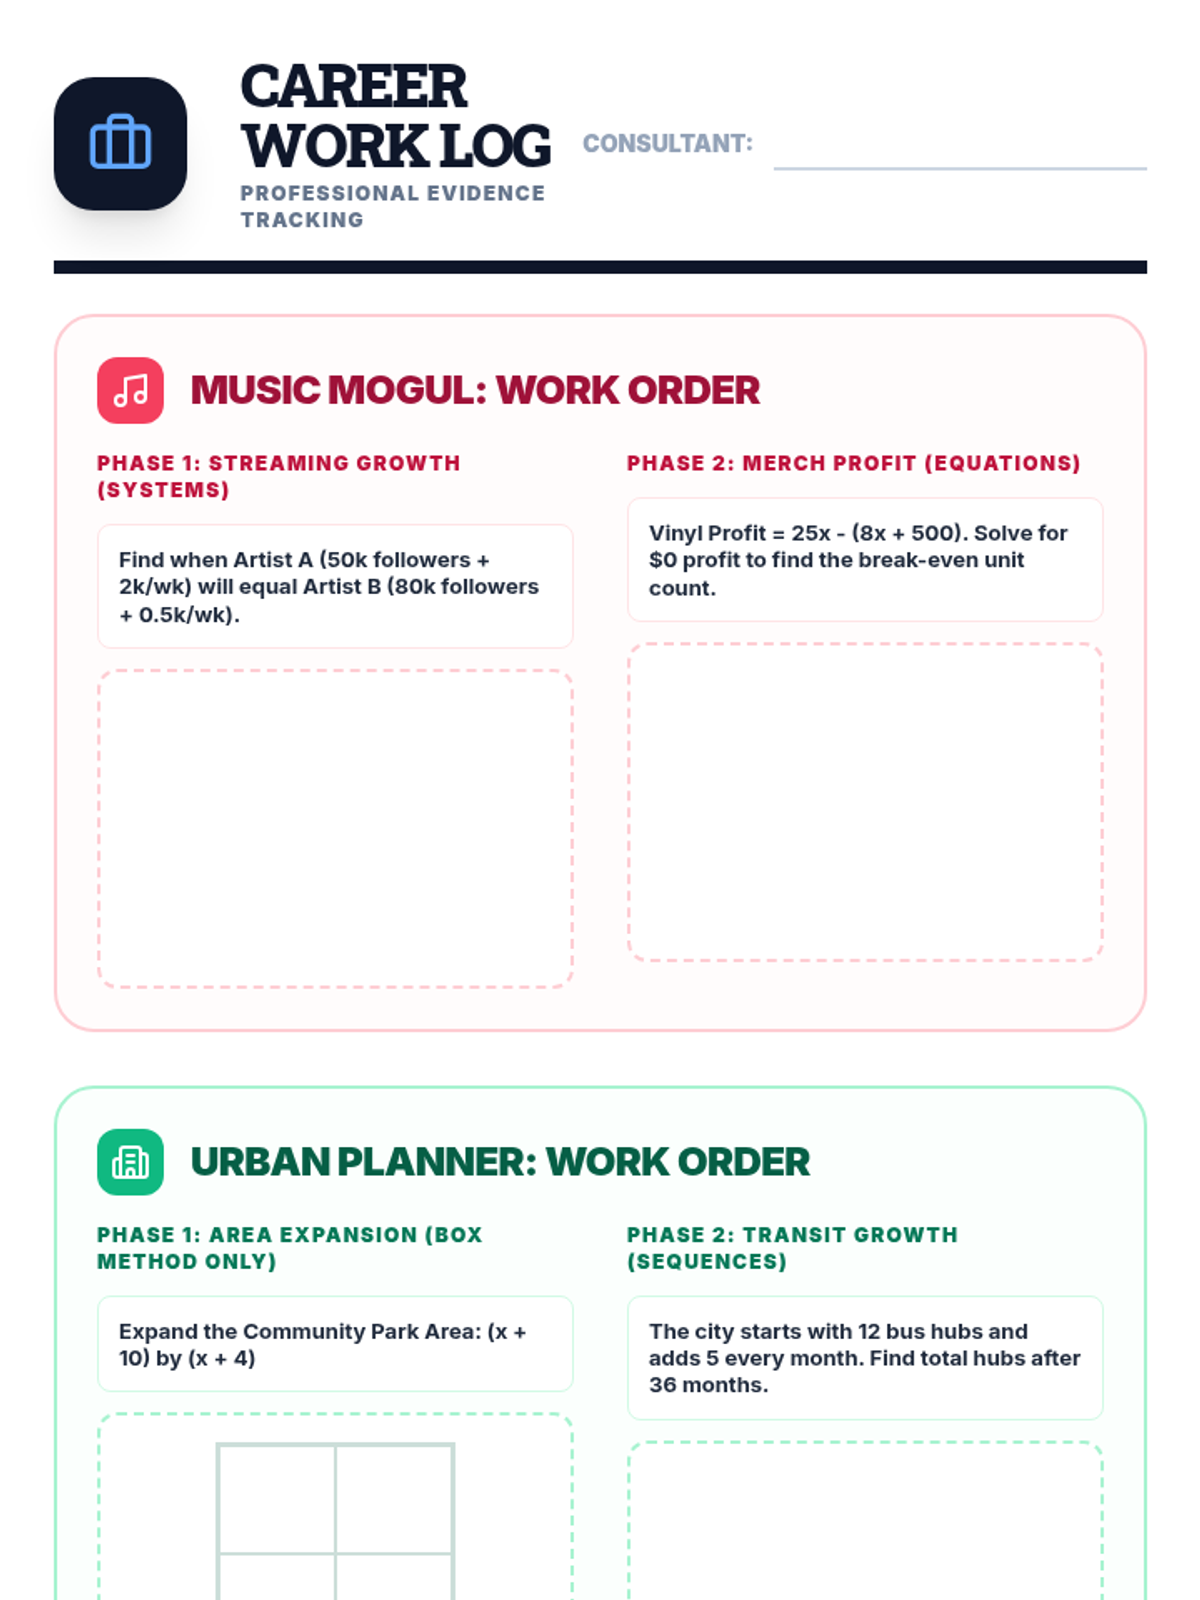
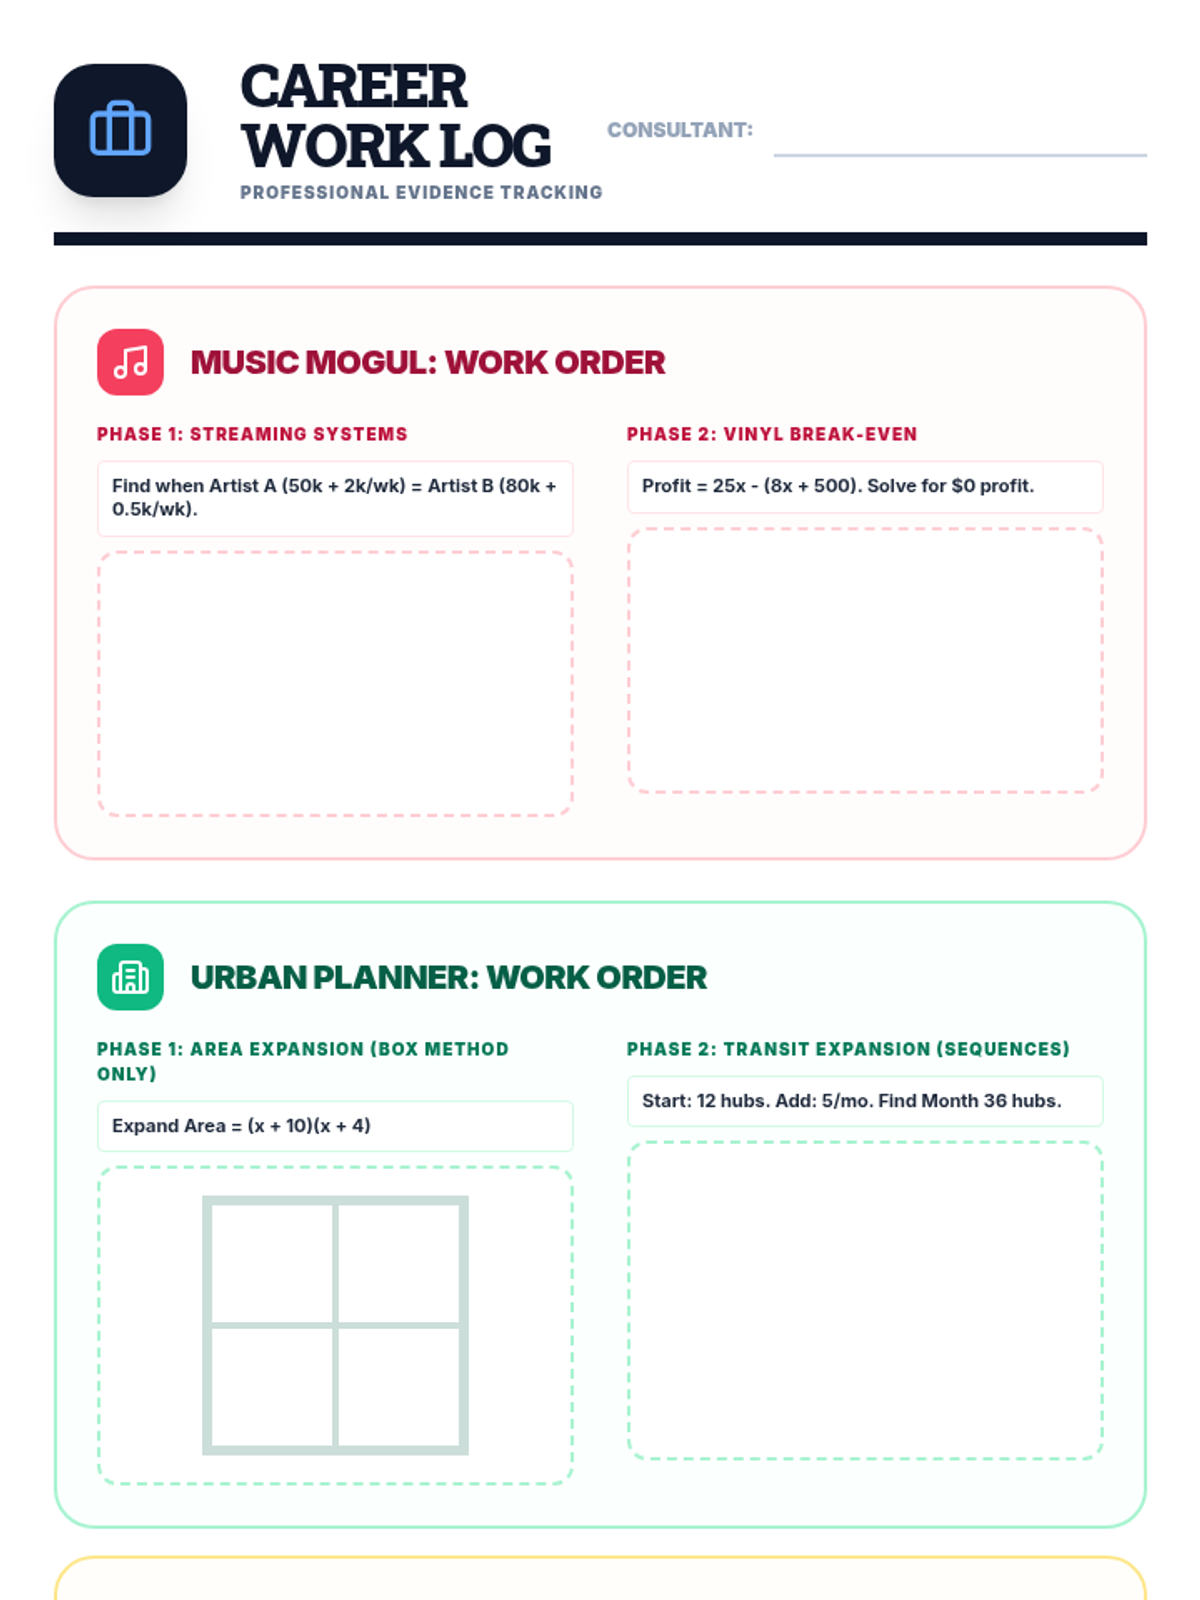
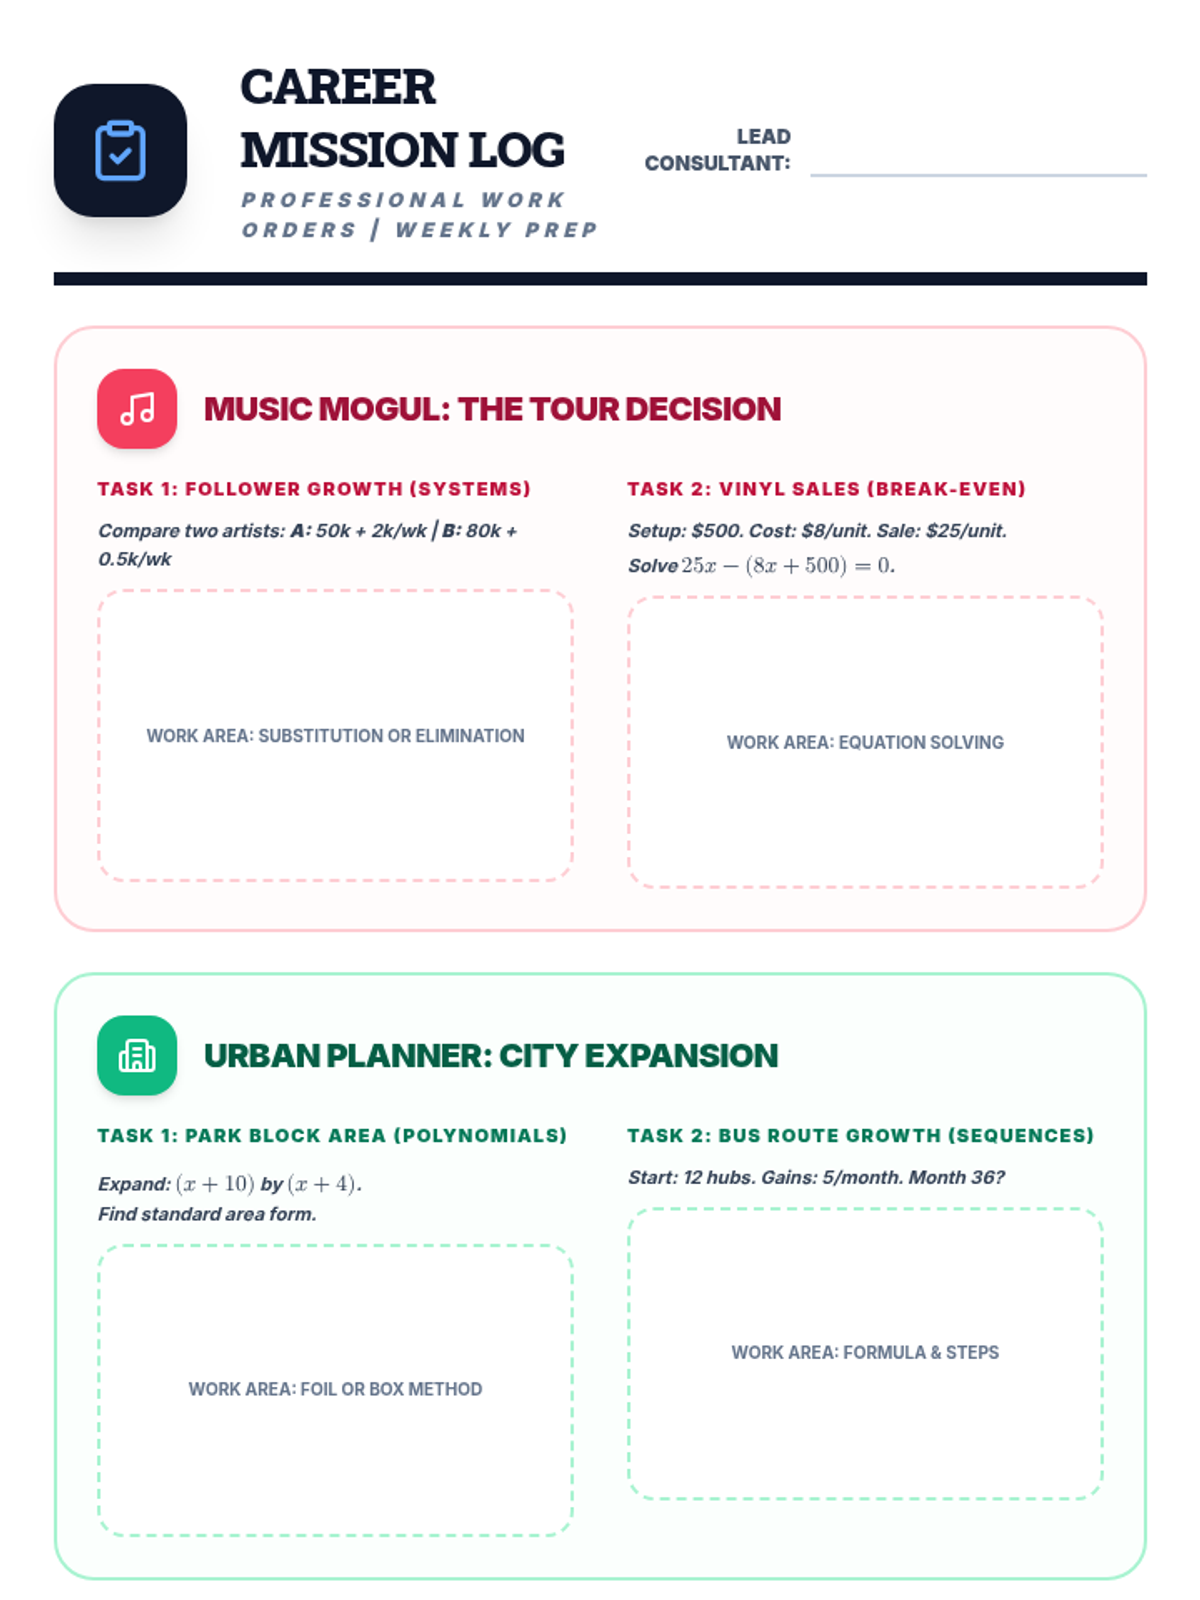
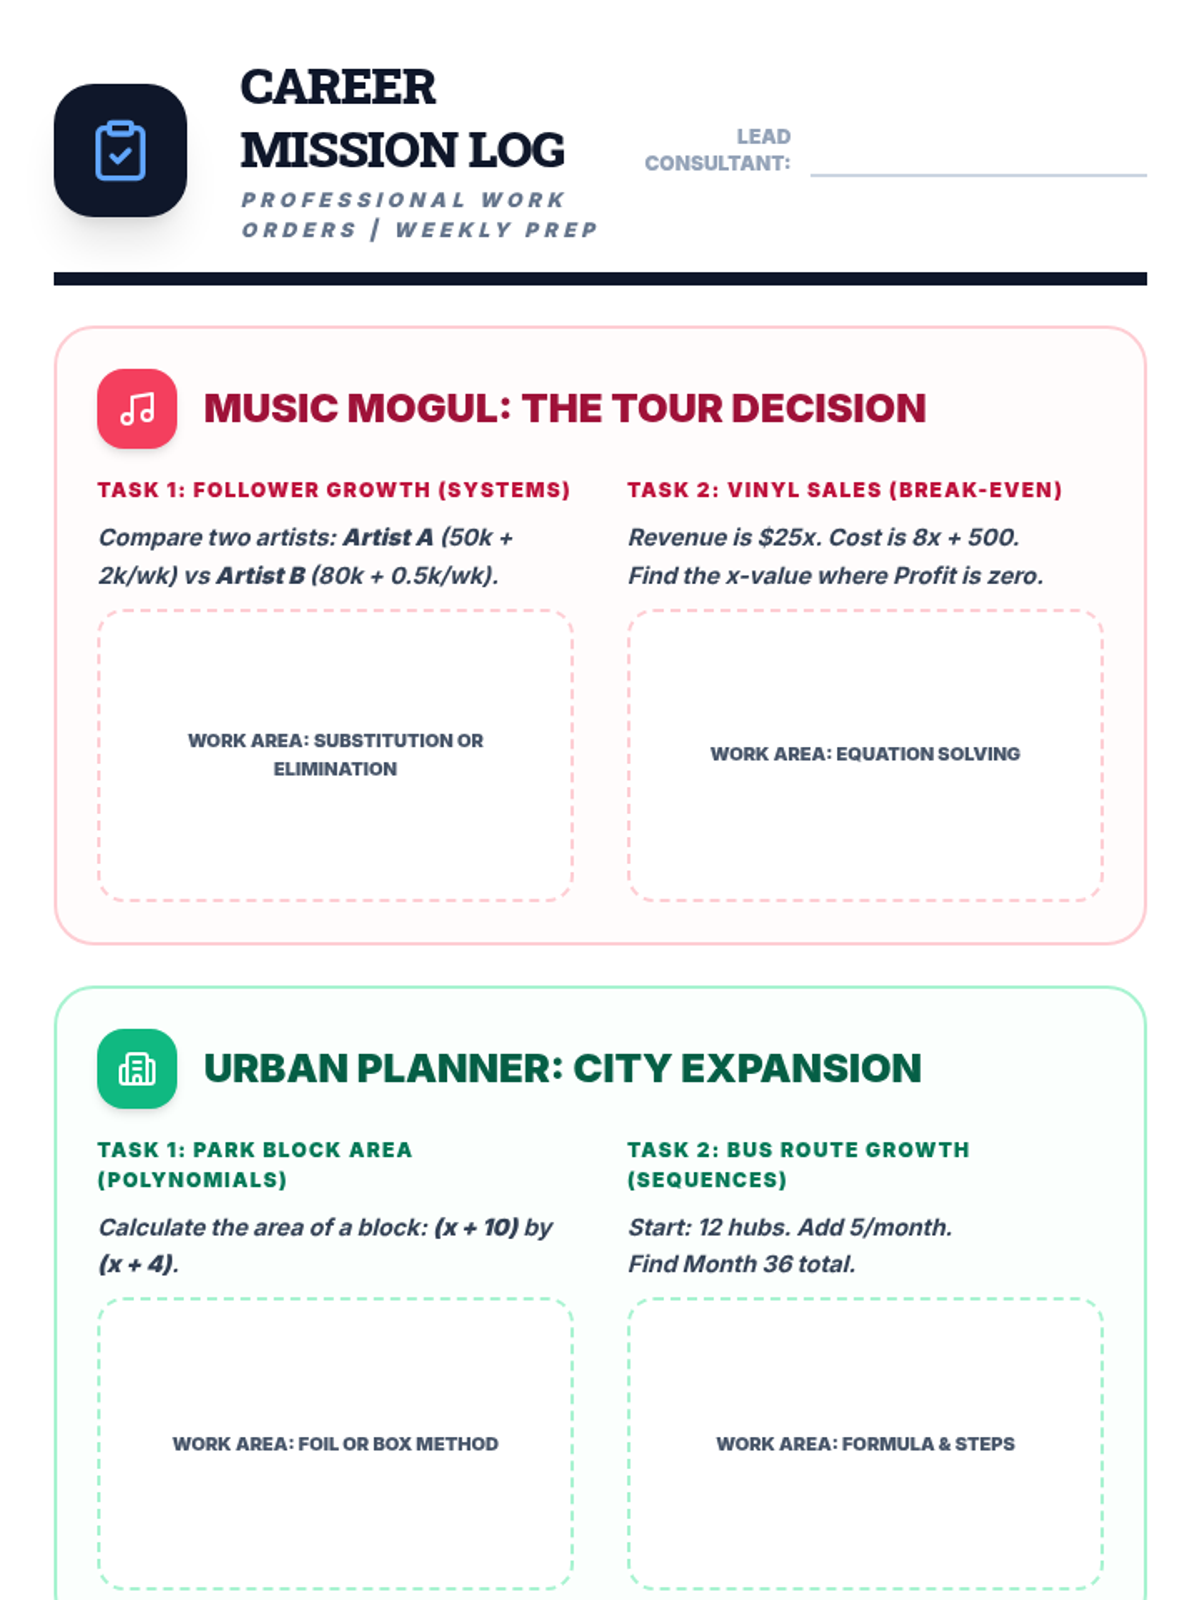
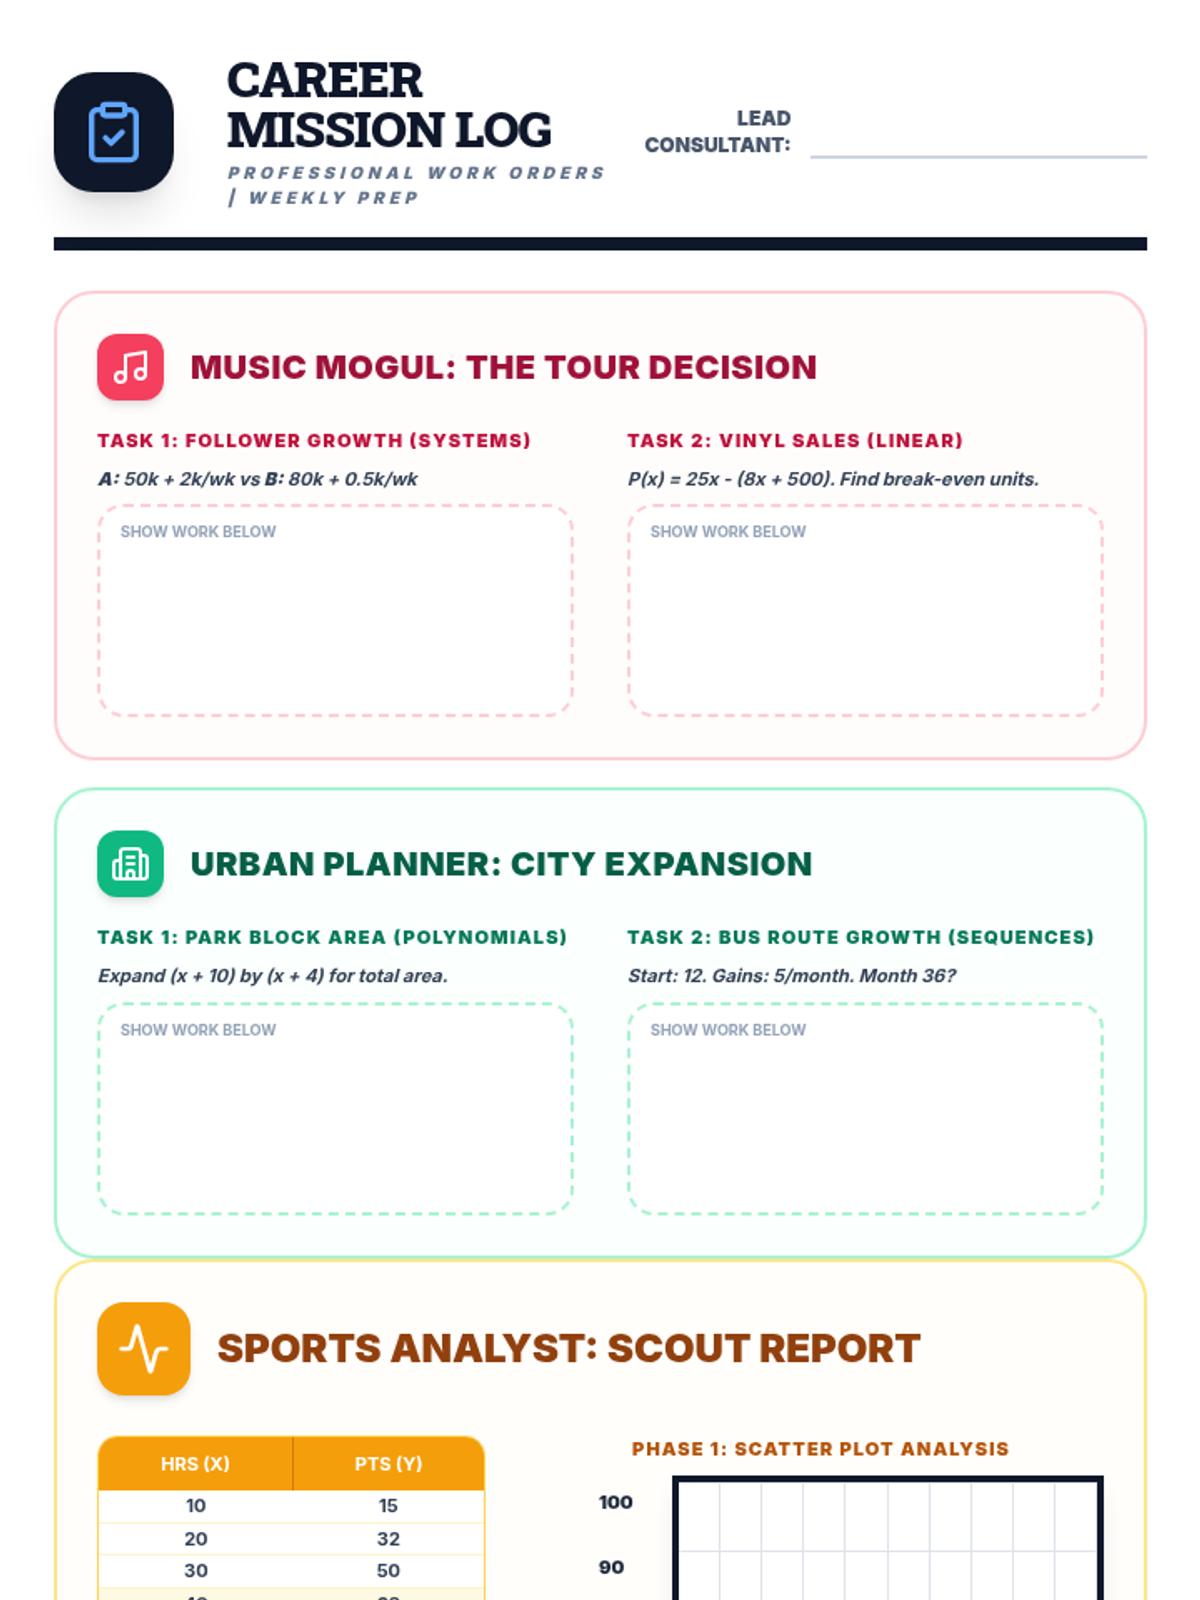
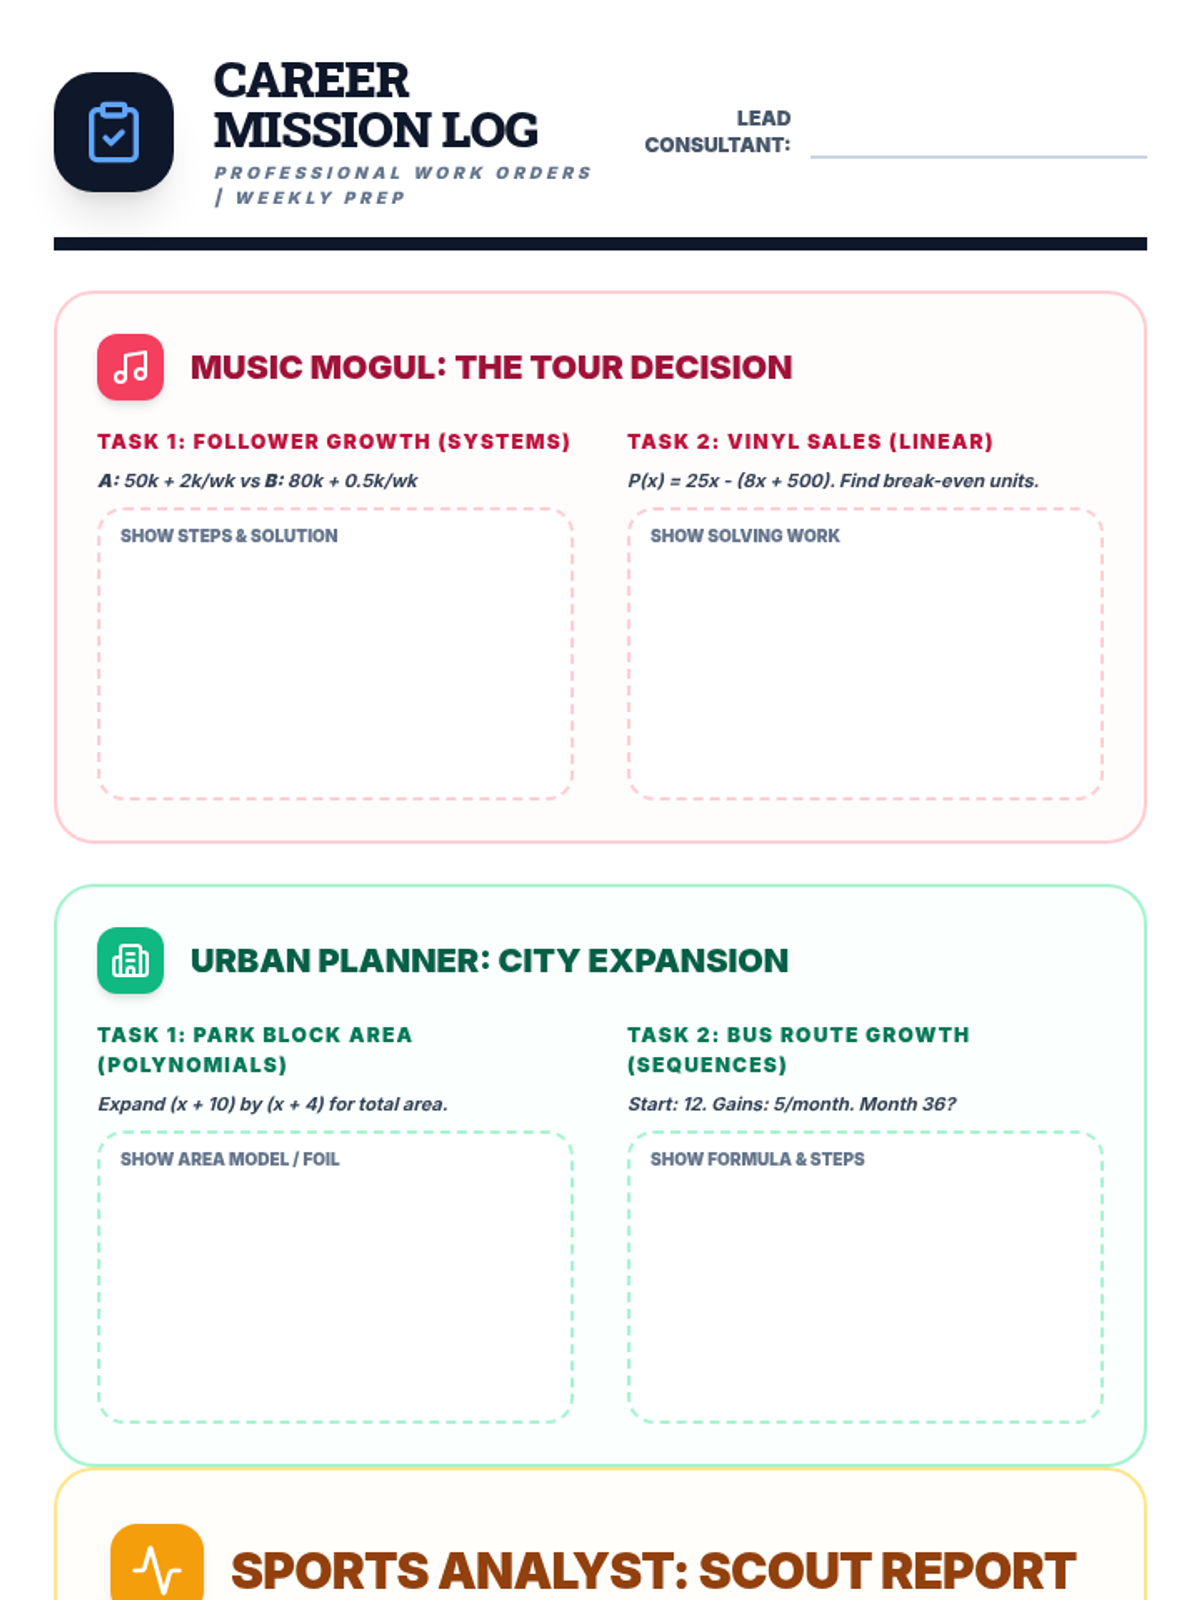
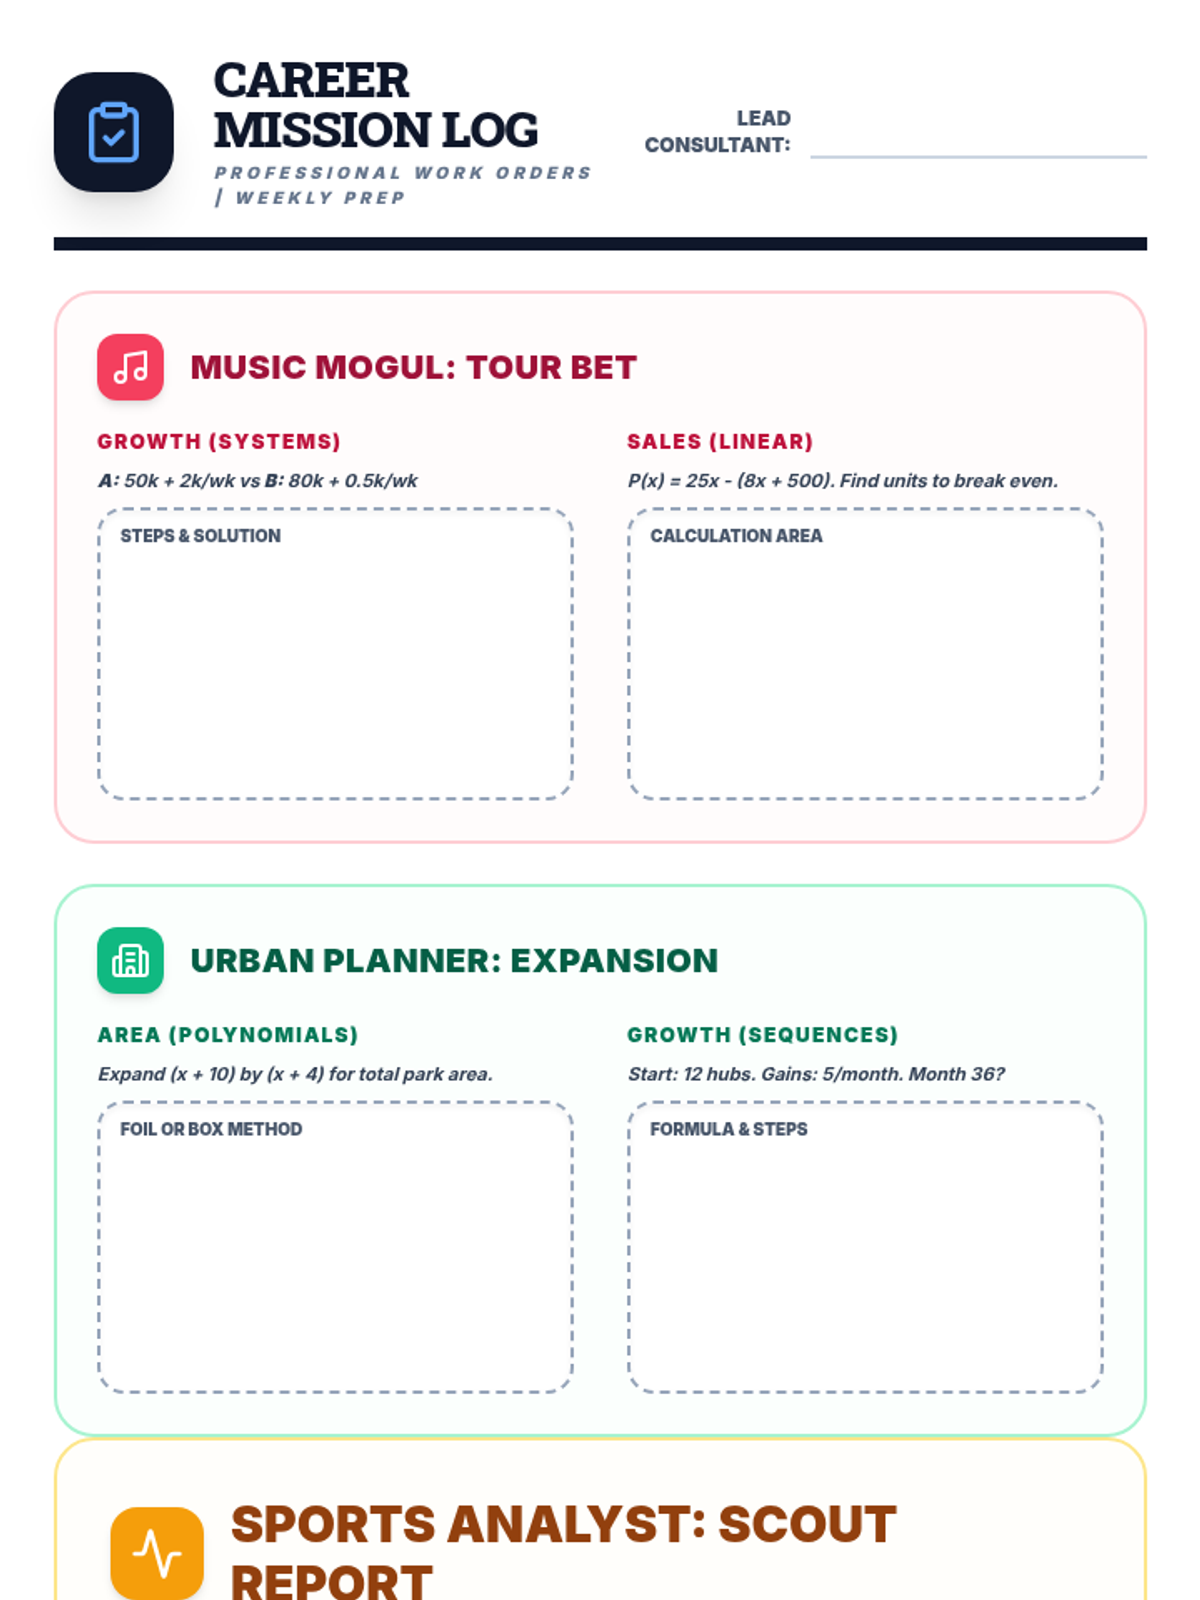
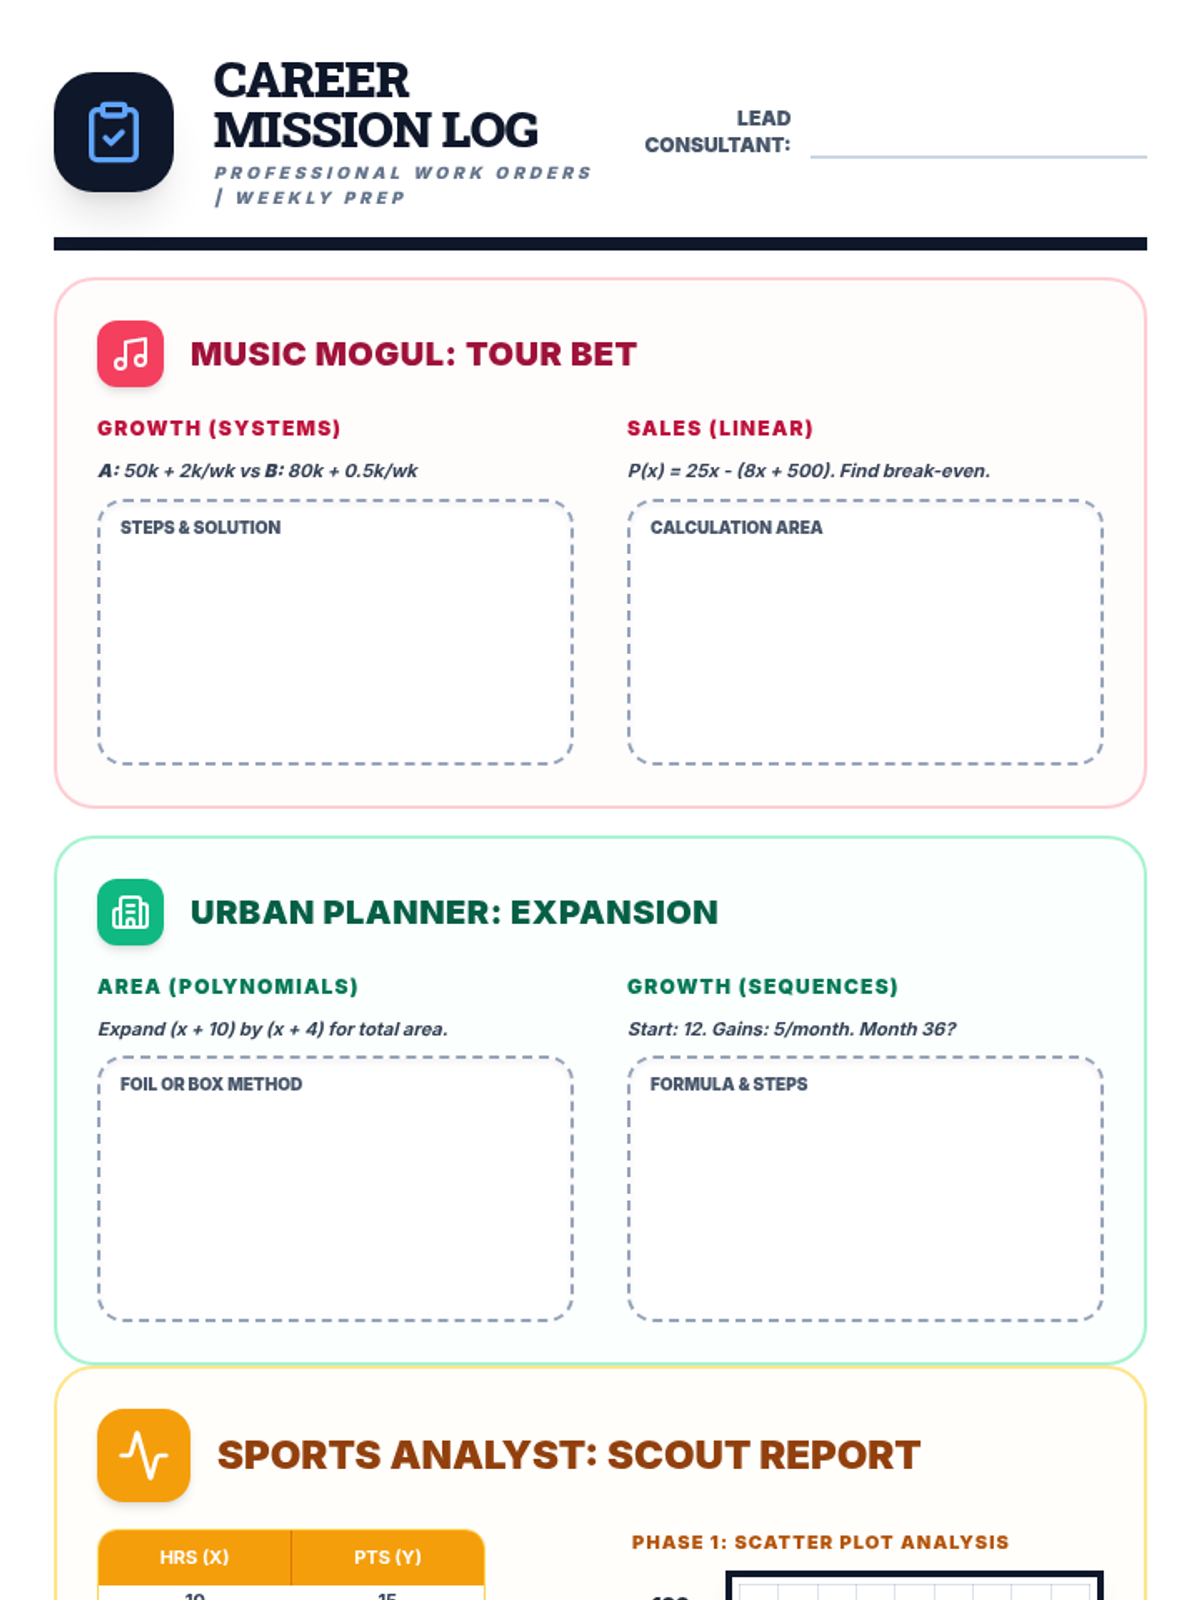
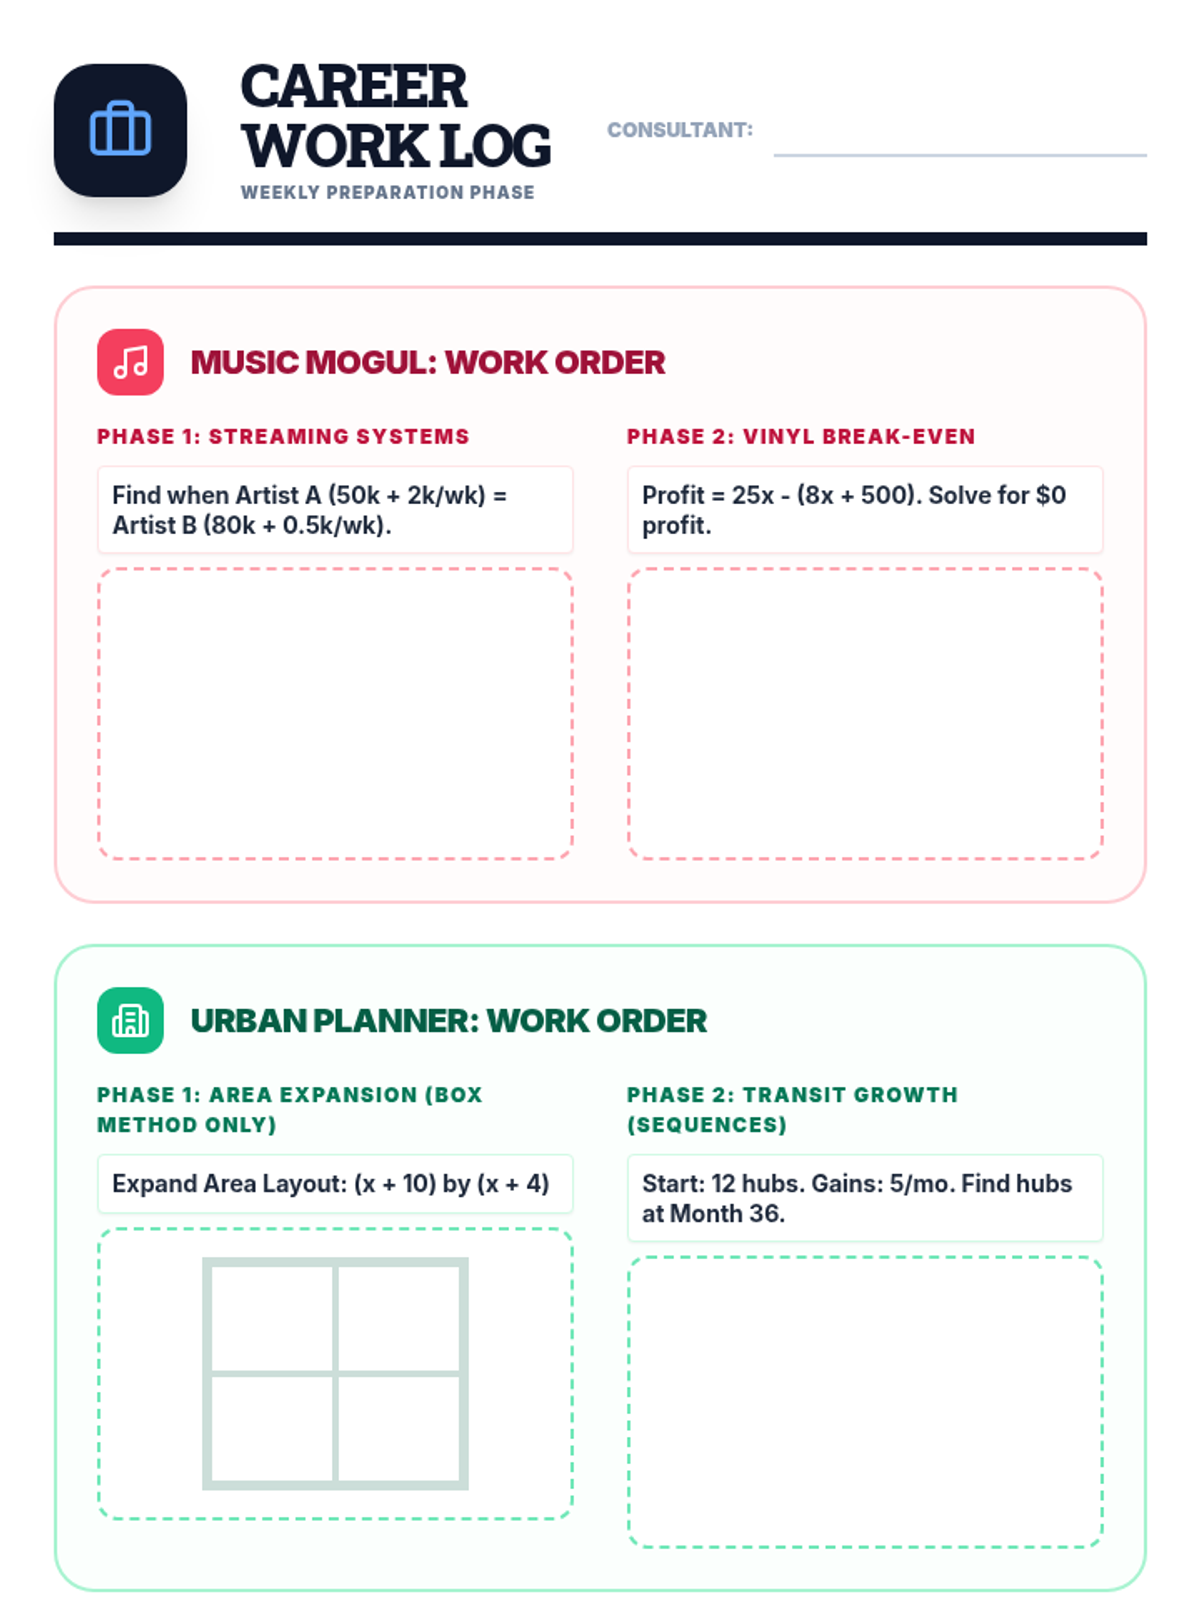
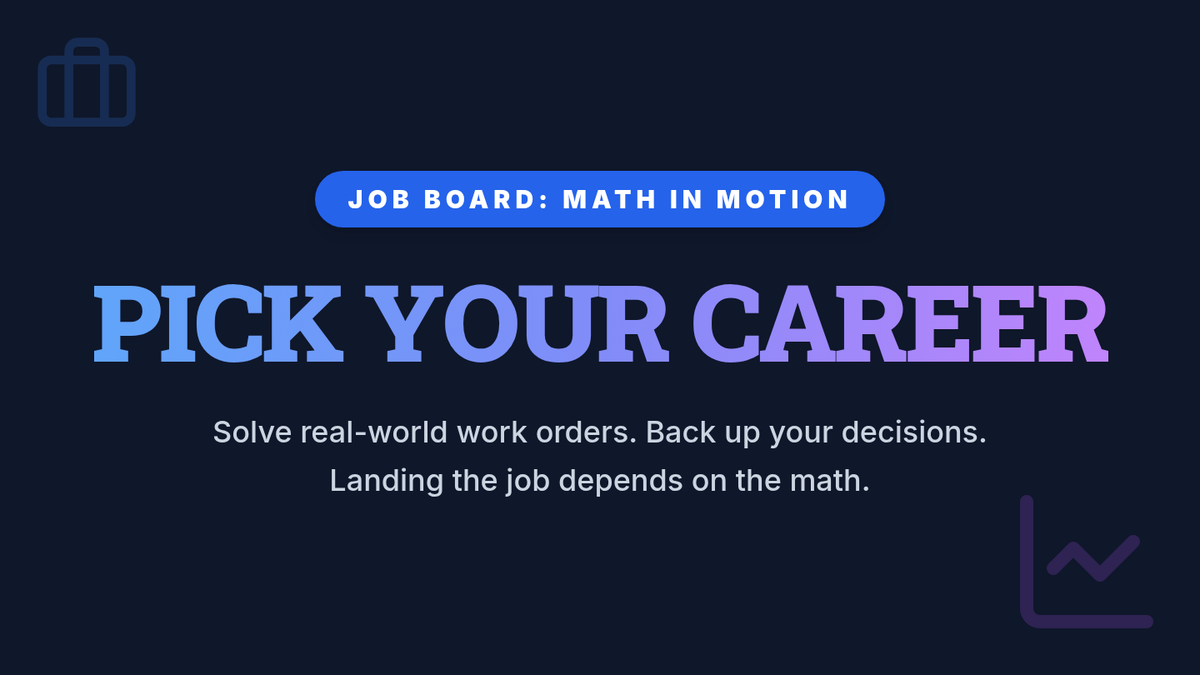
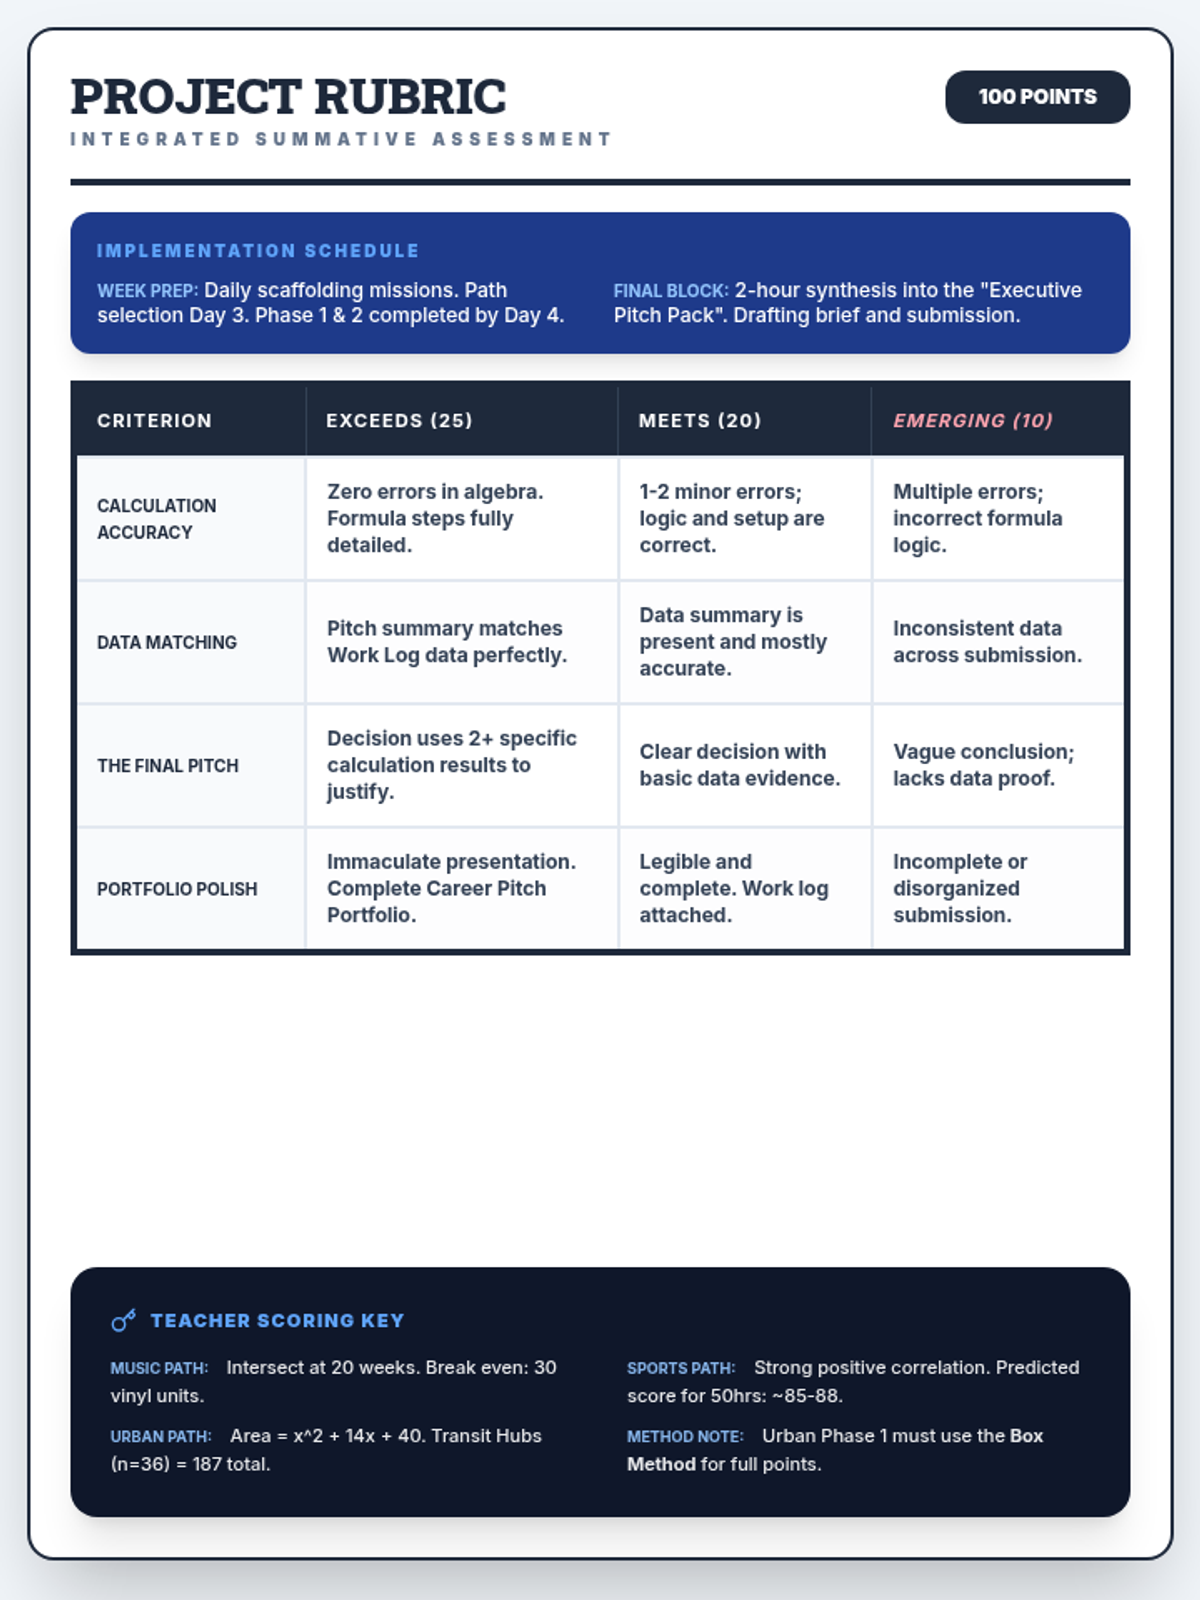
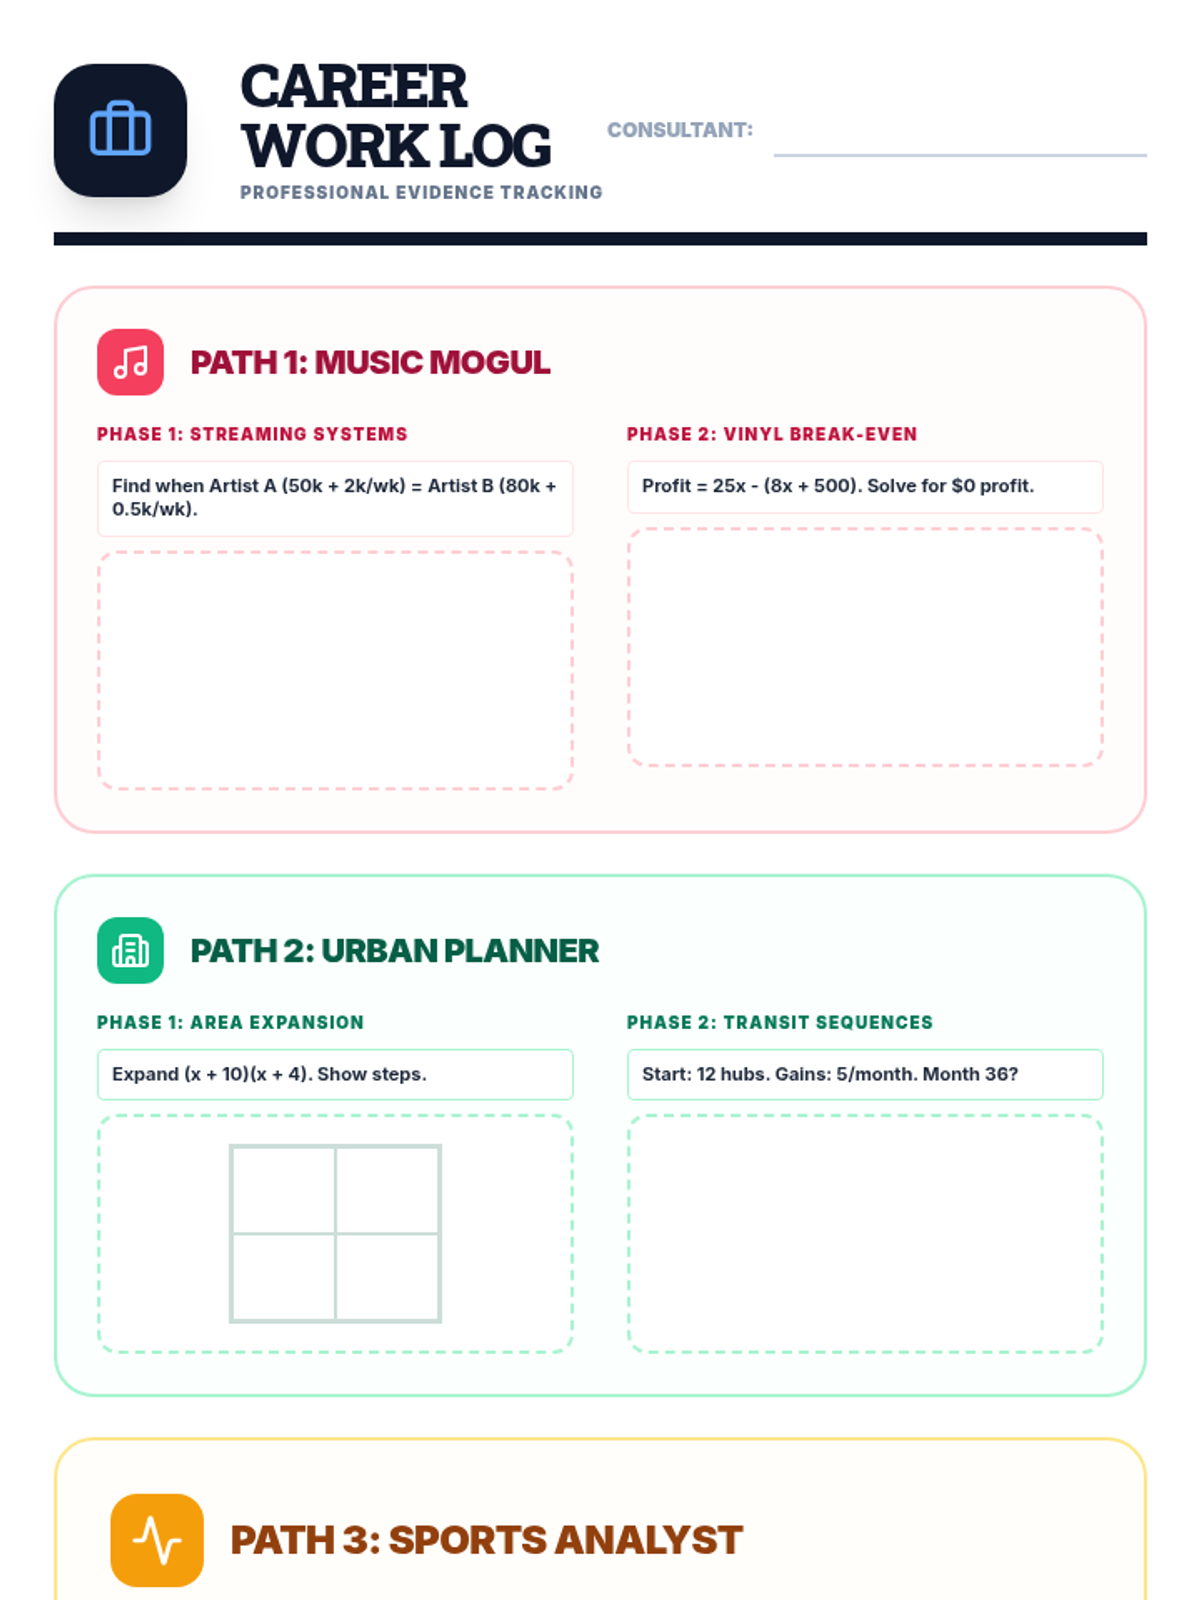
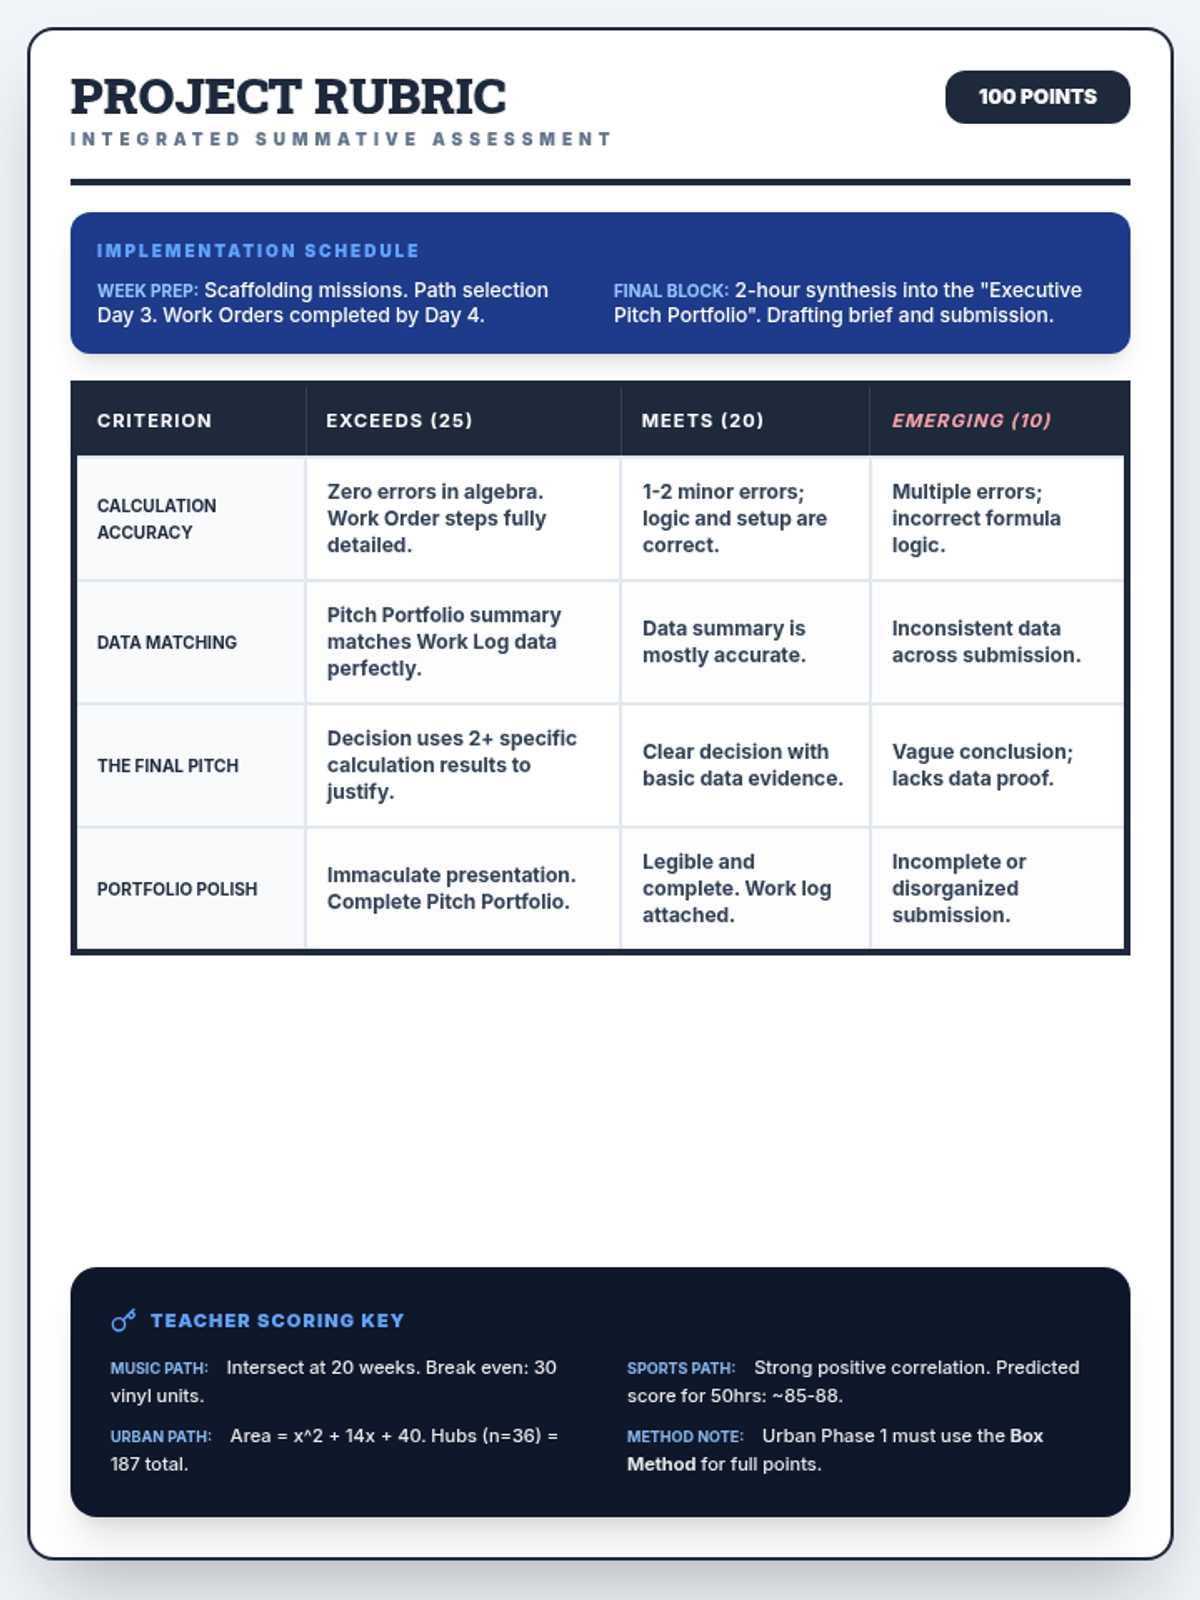
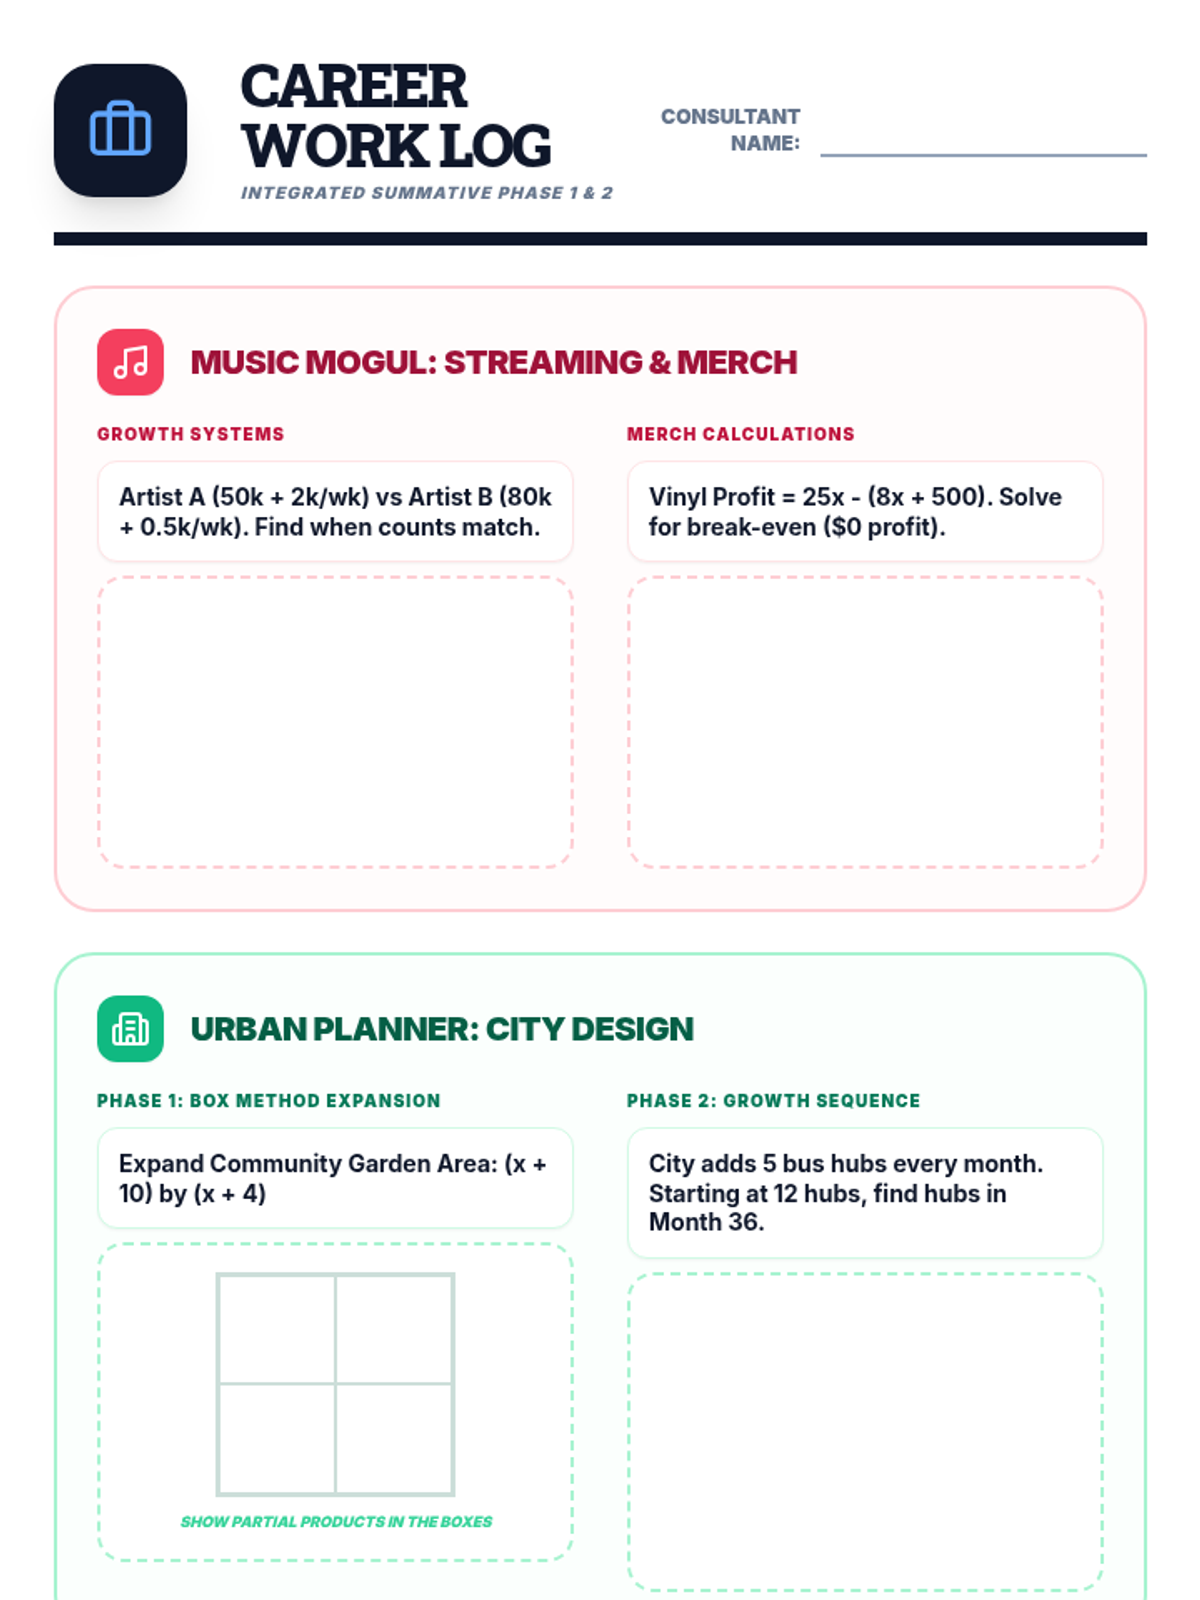
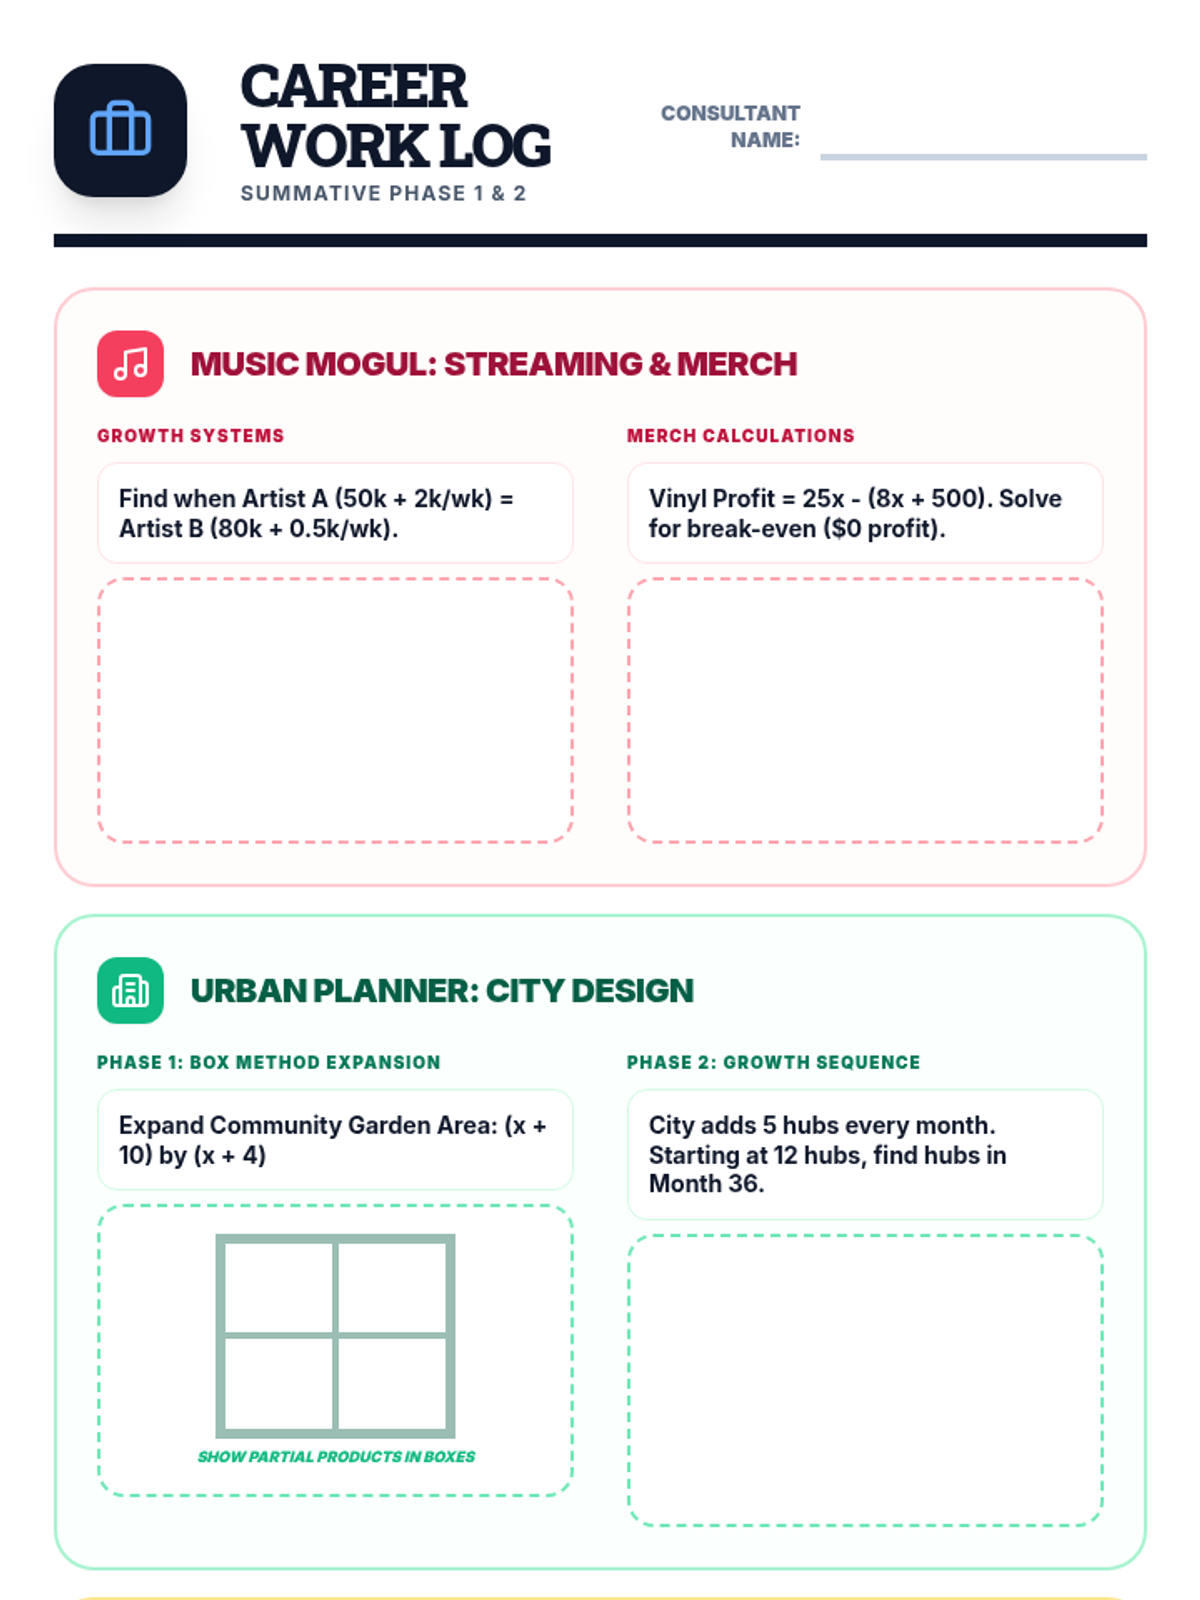
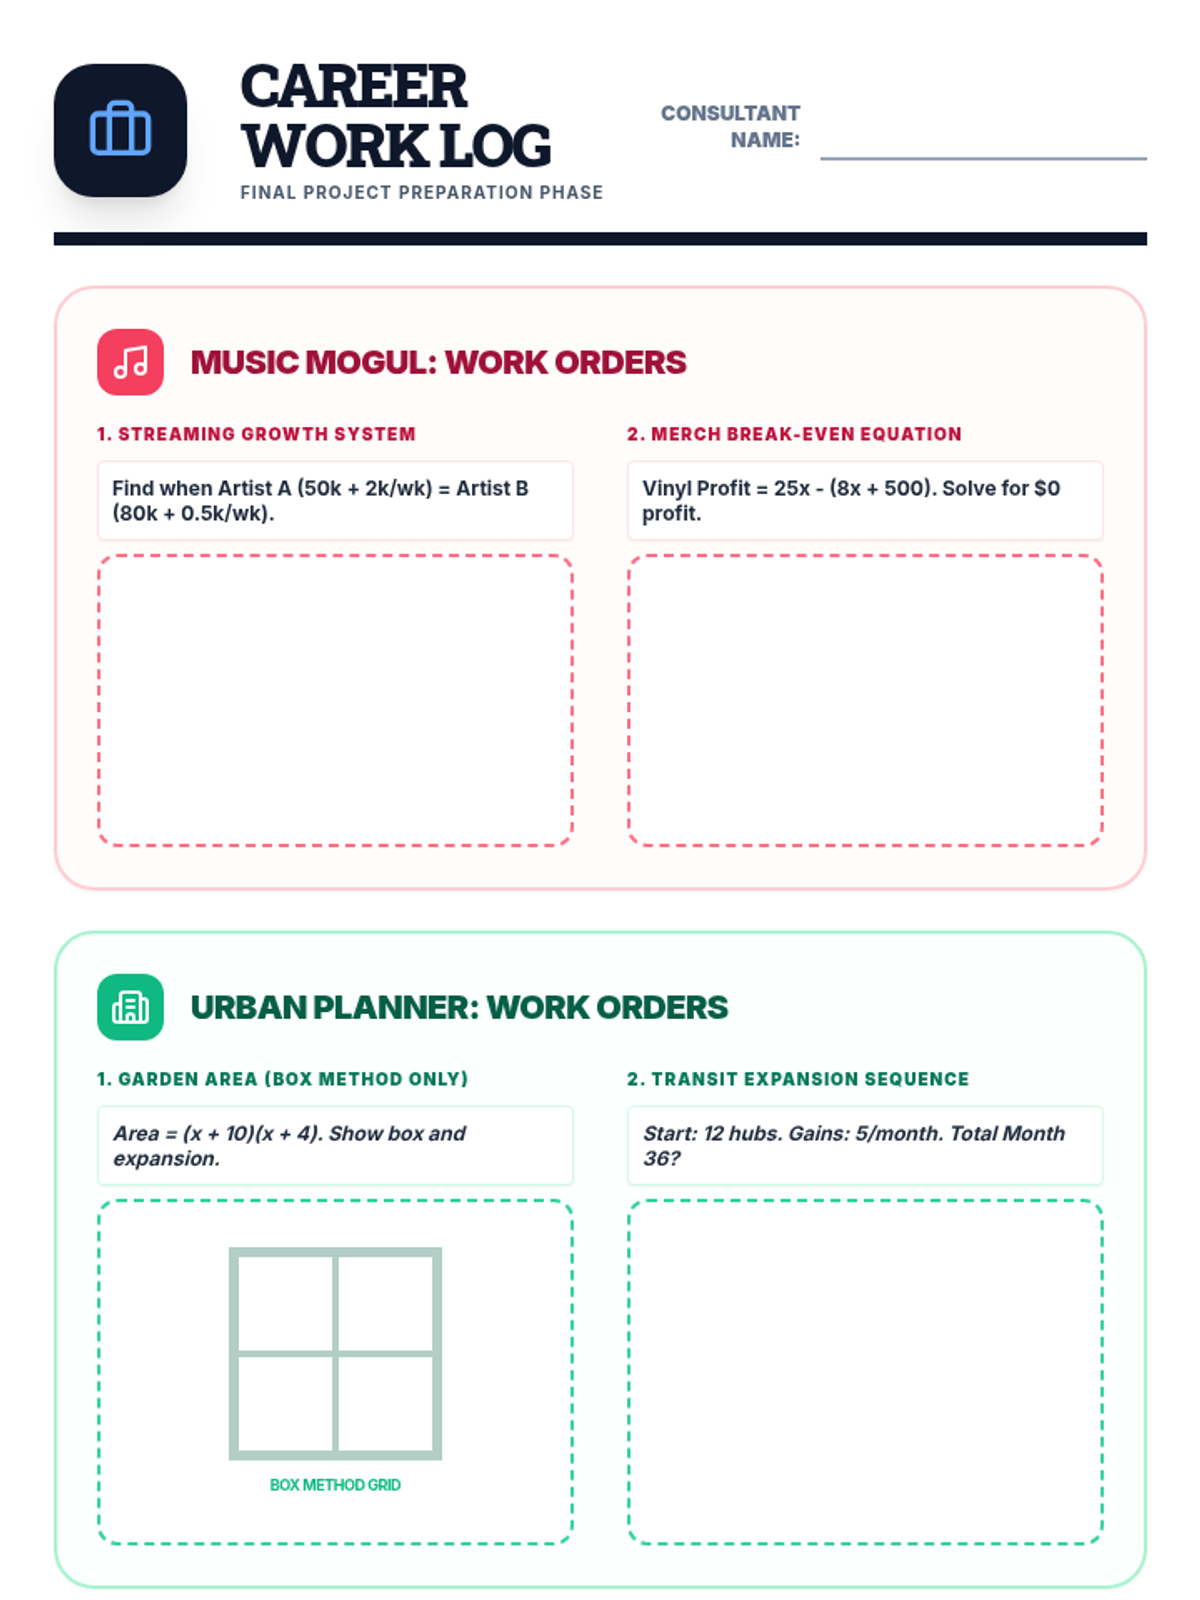
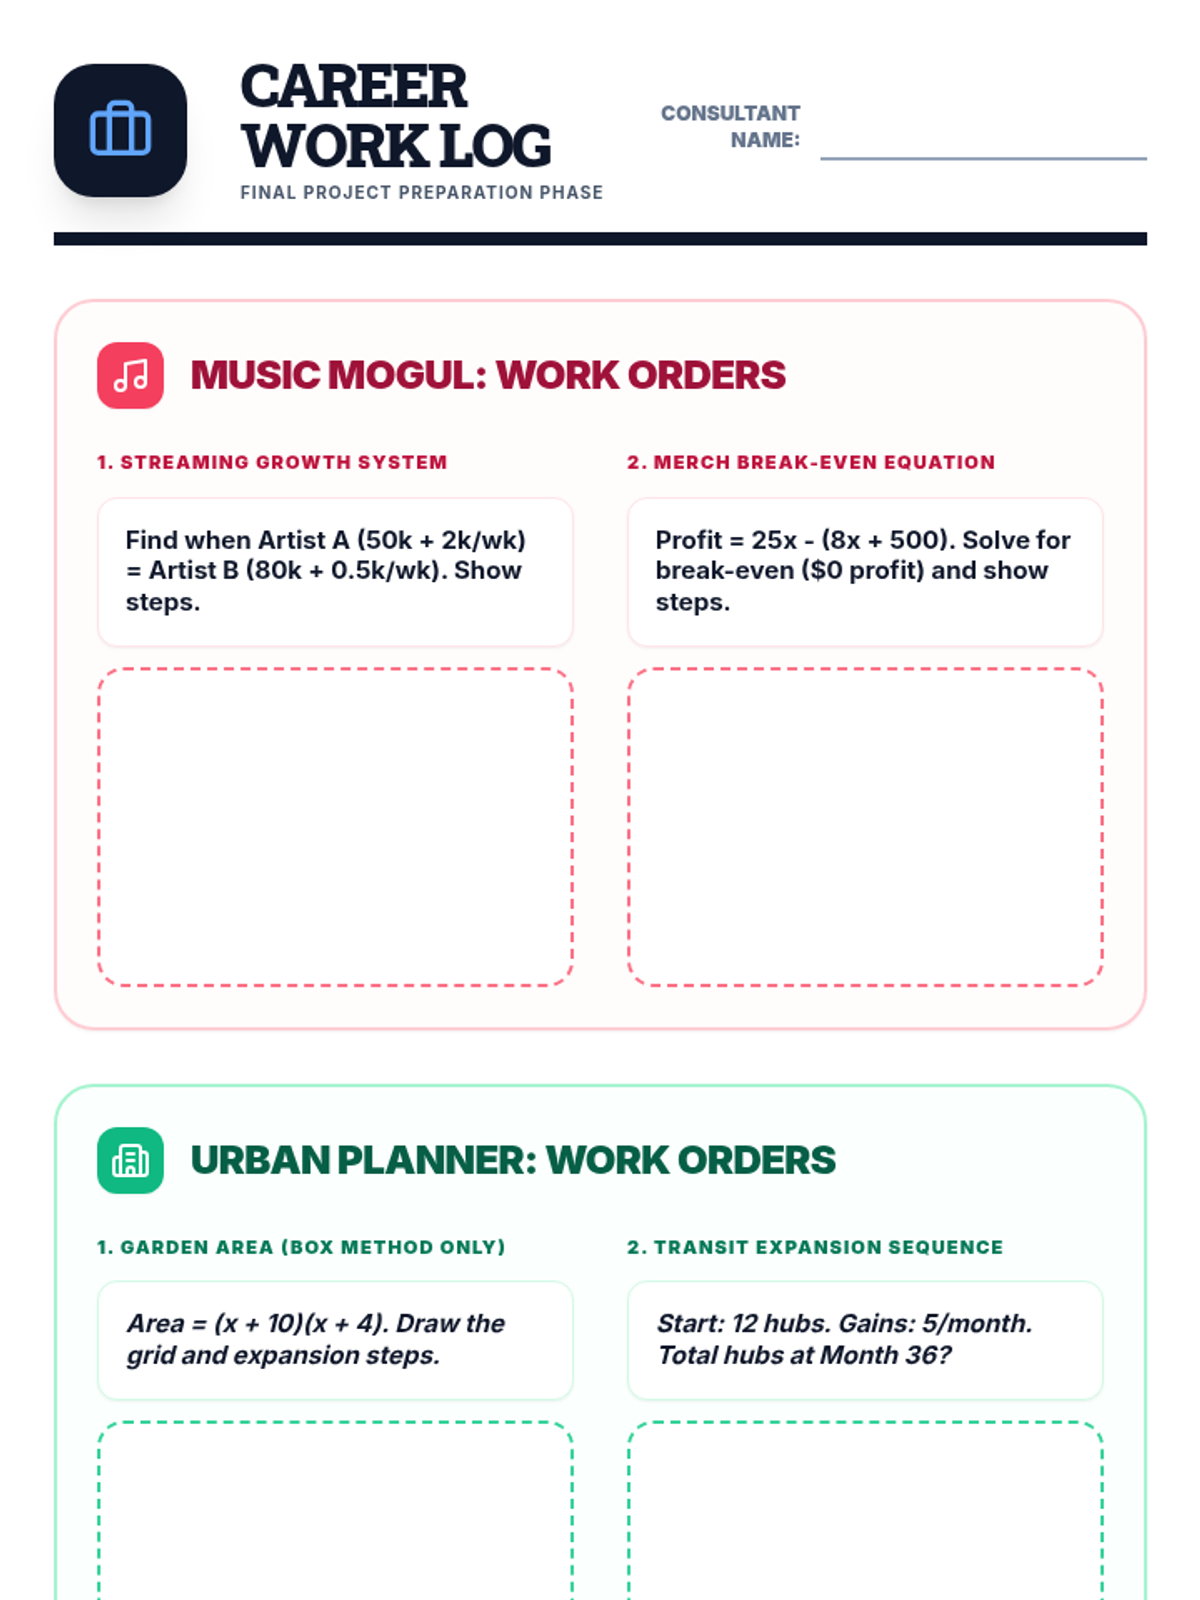
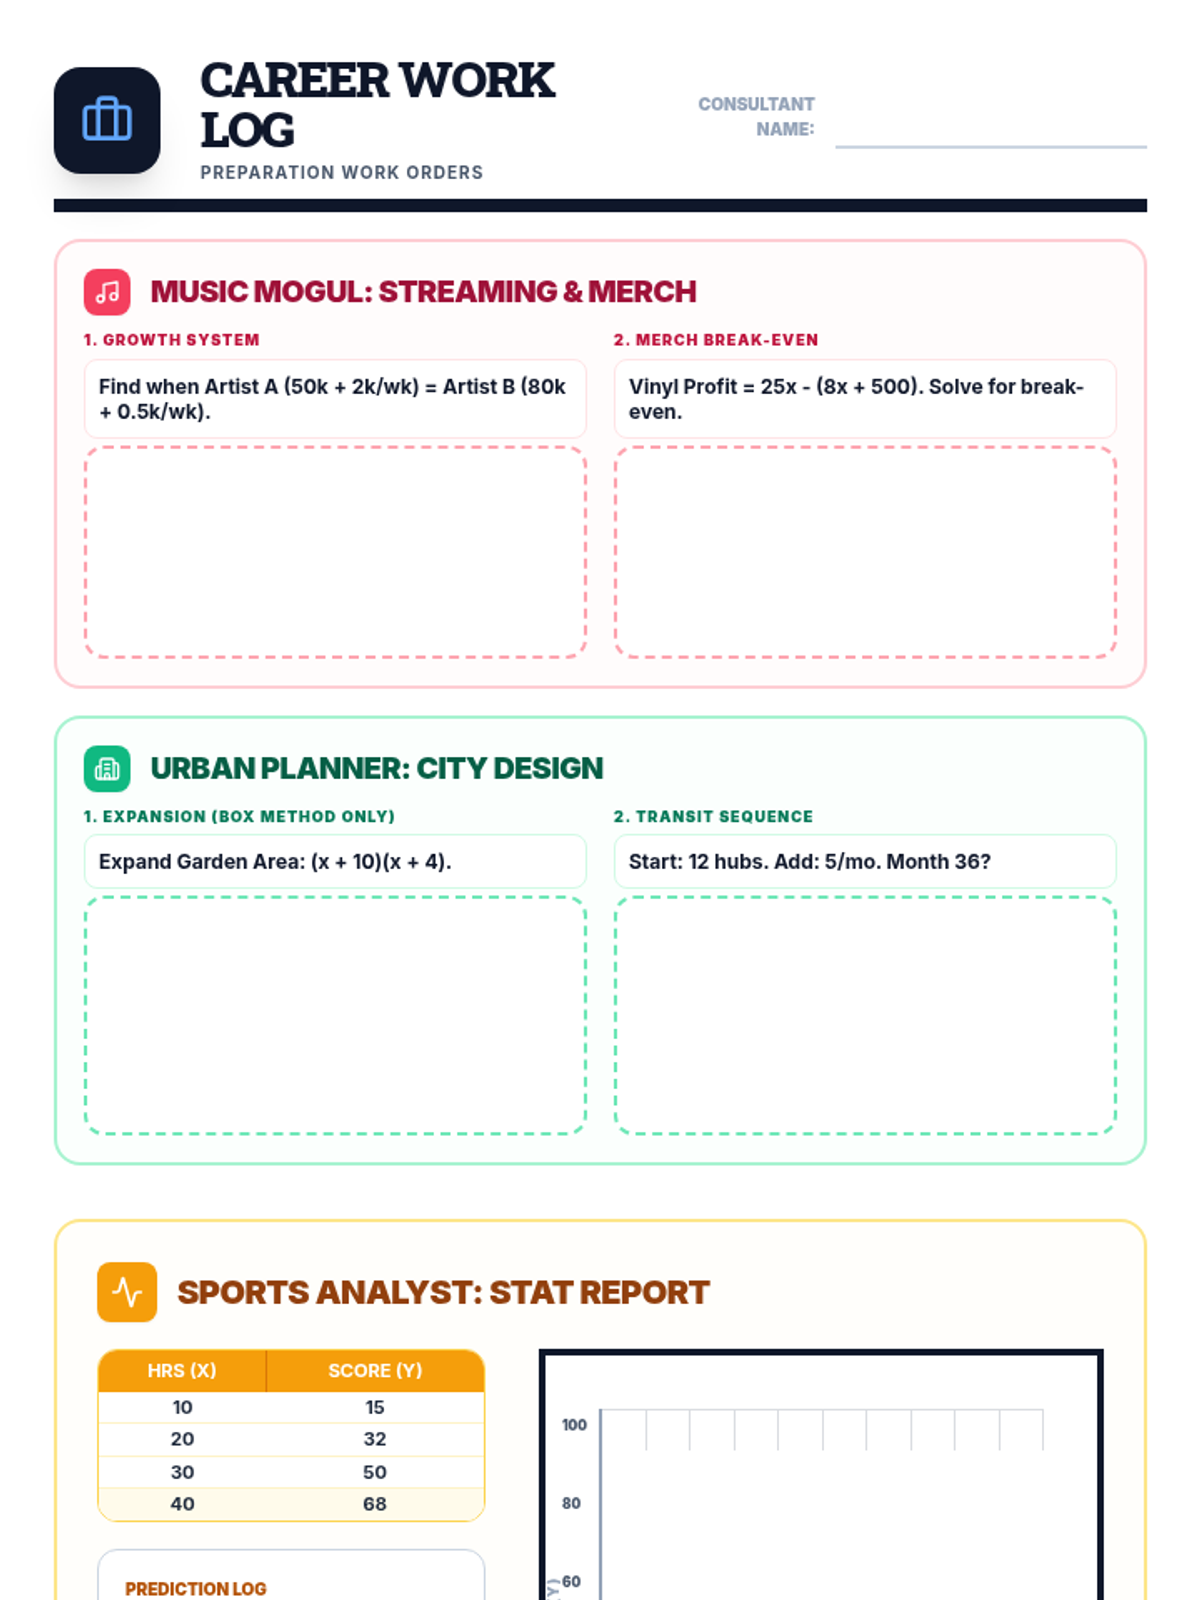
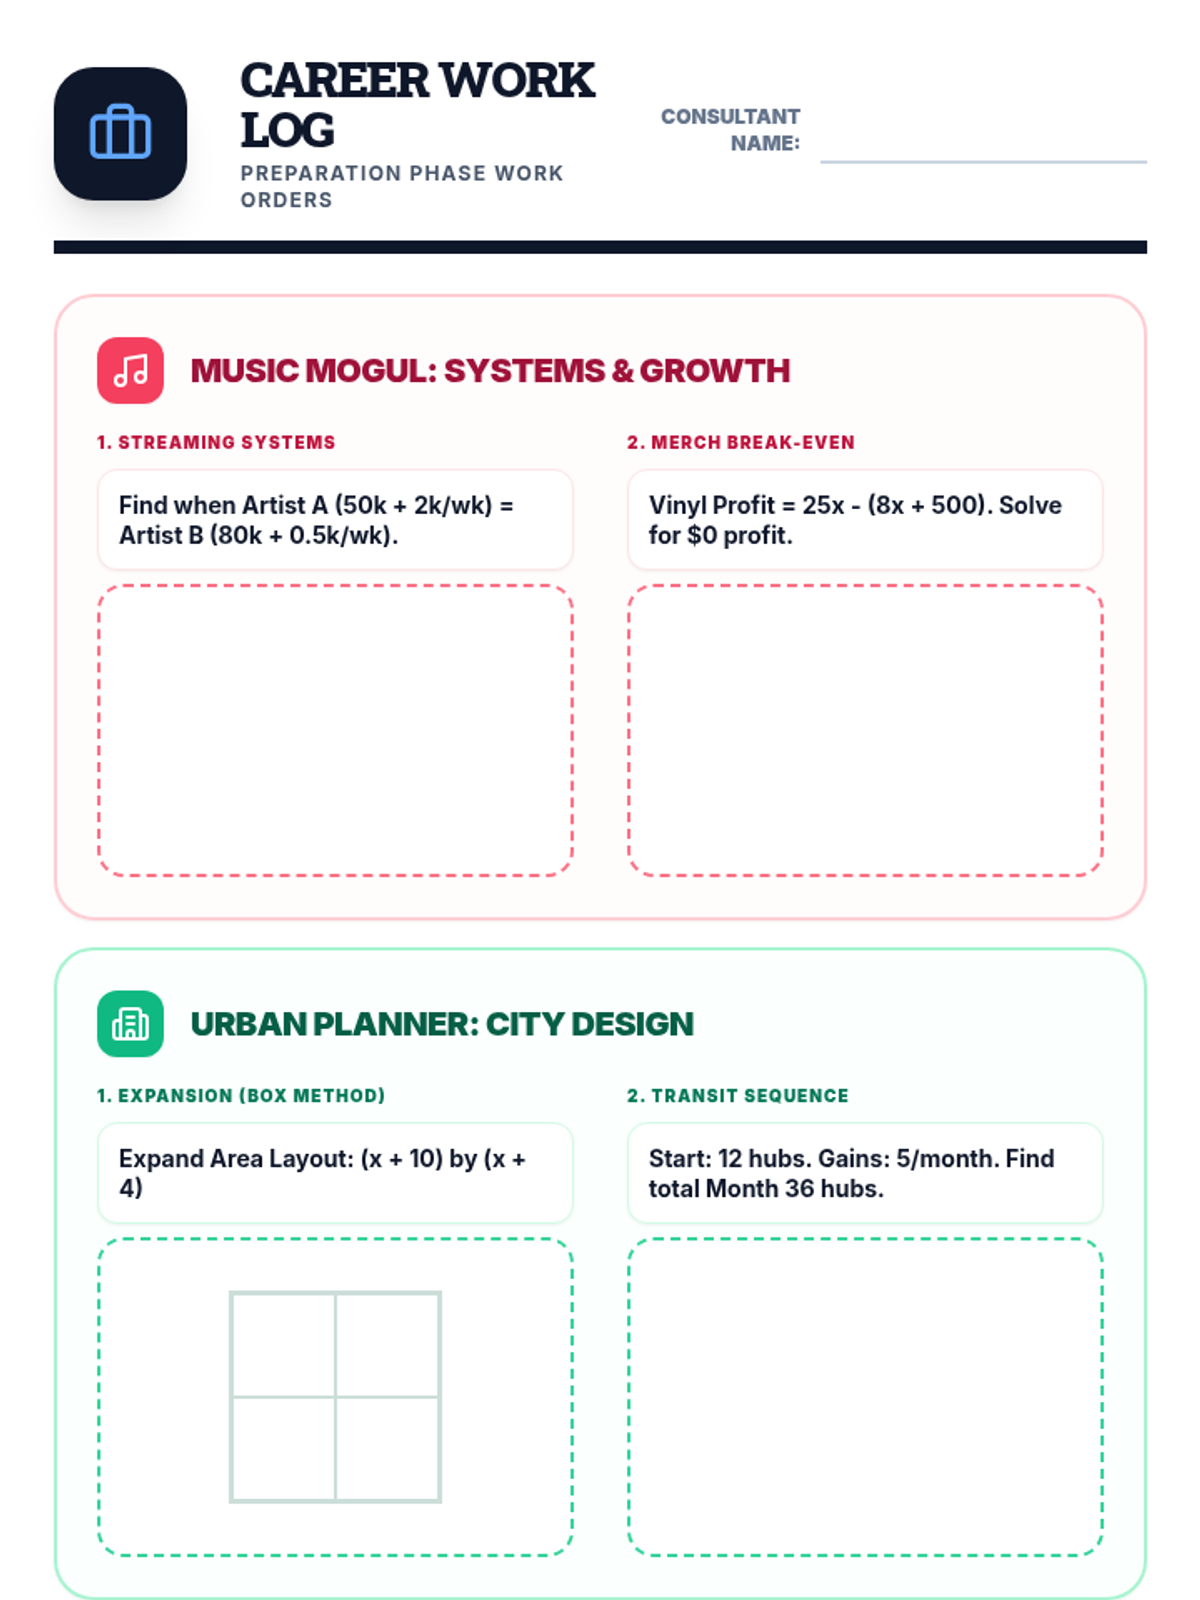
The final project phase where students select one of three real-world career paths (Music Mogul, Urban Planner, or Sports Analyst) to apply their mathematical knowledge in a summative assessment.
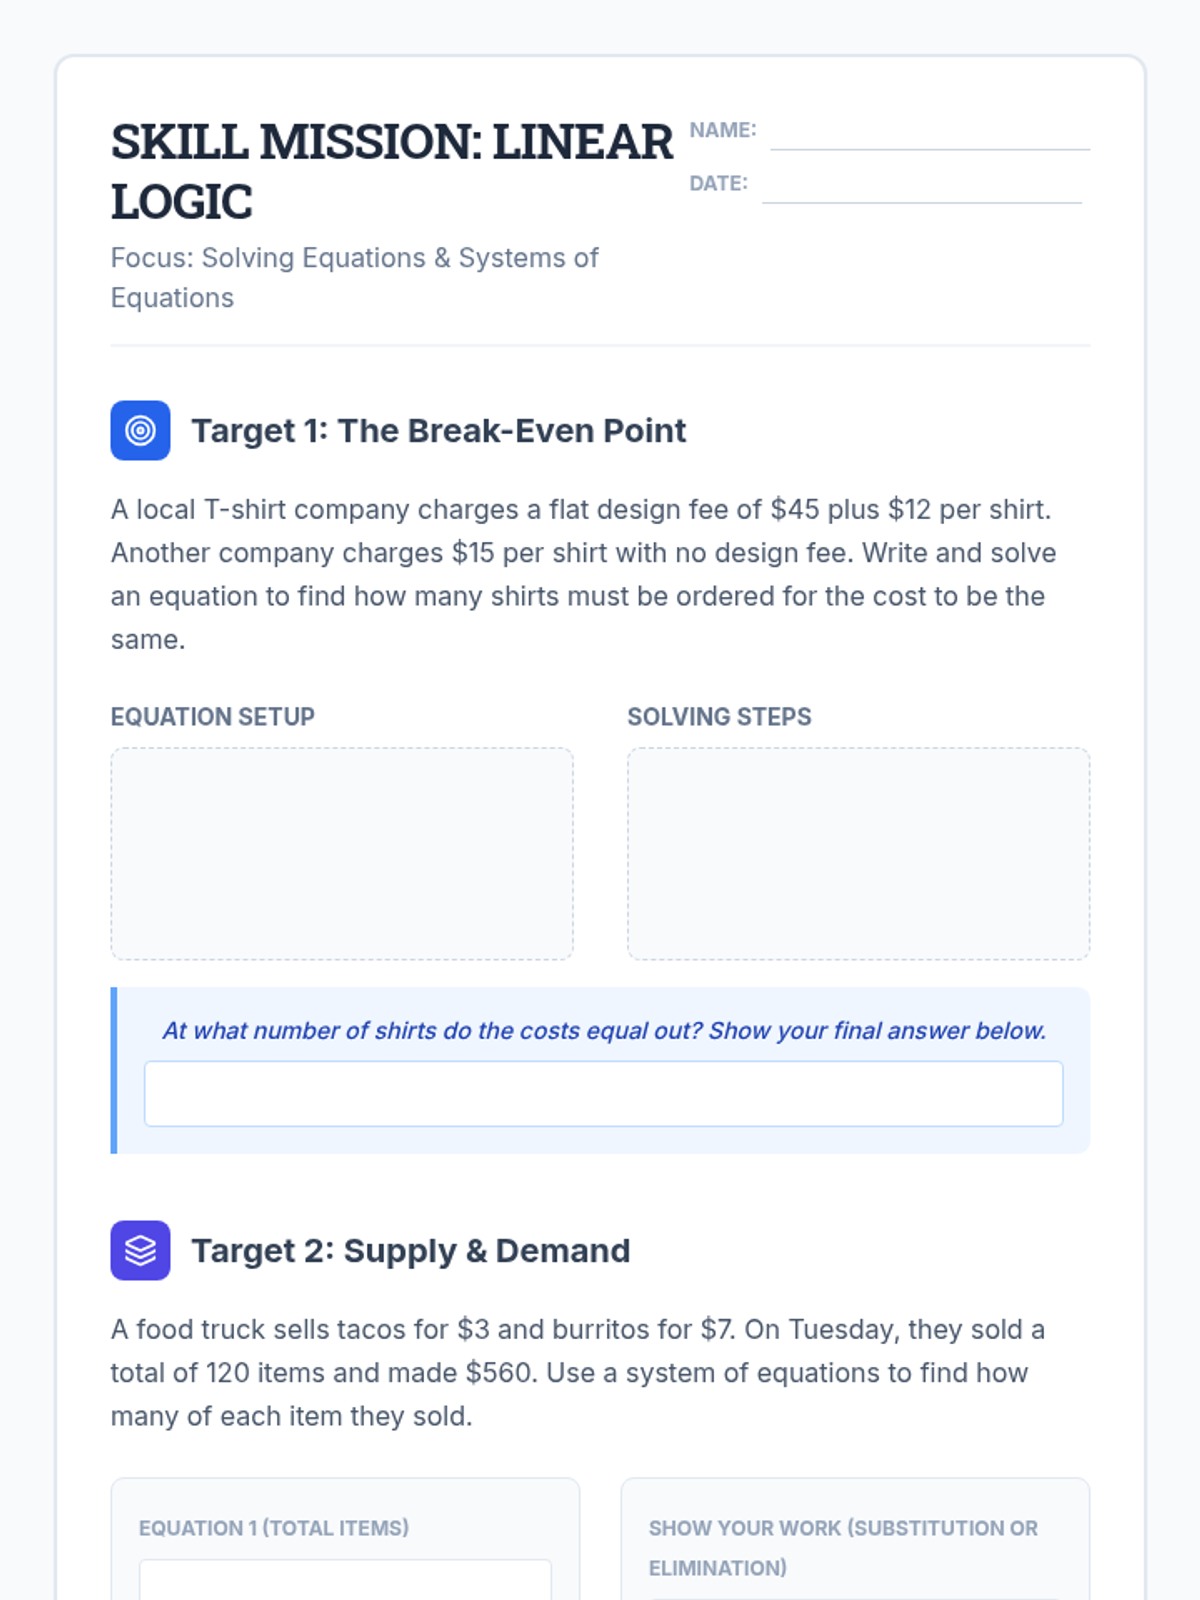
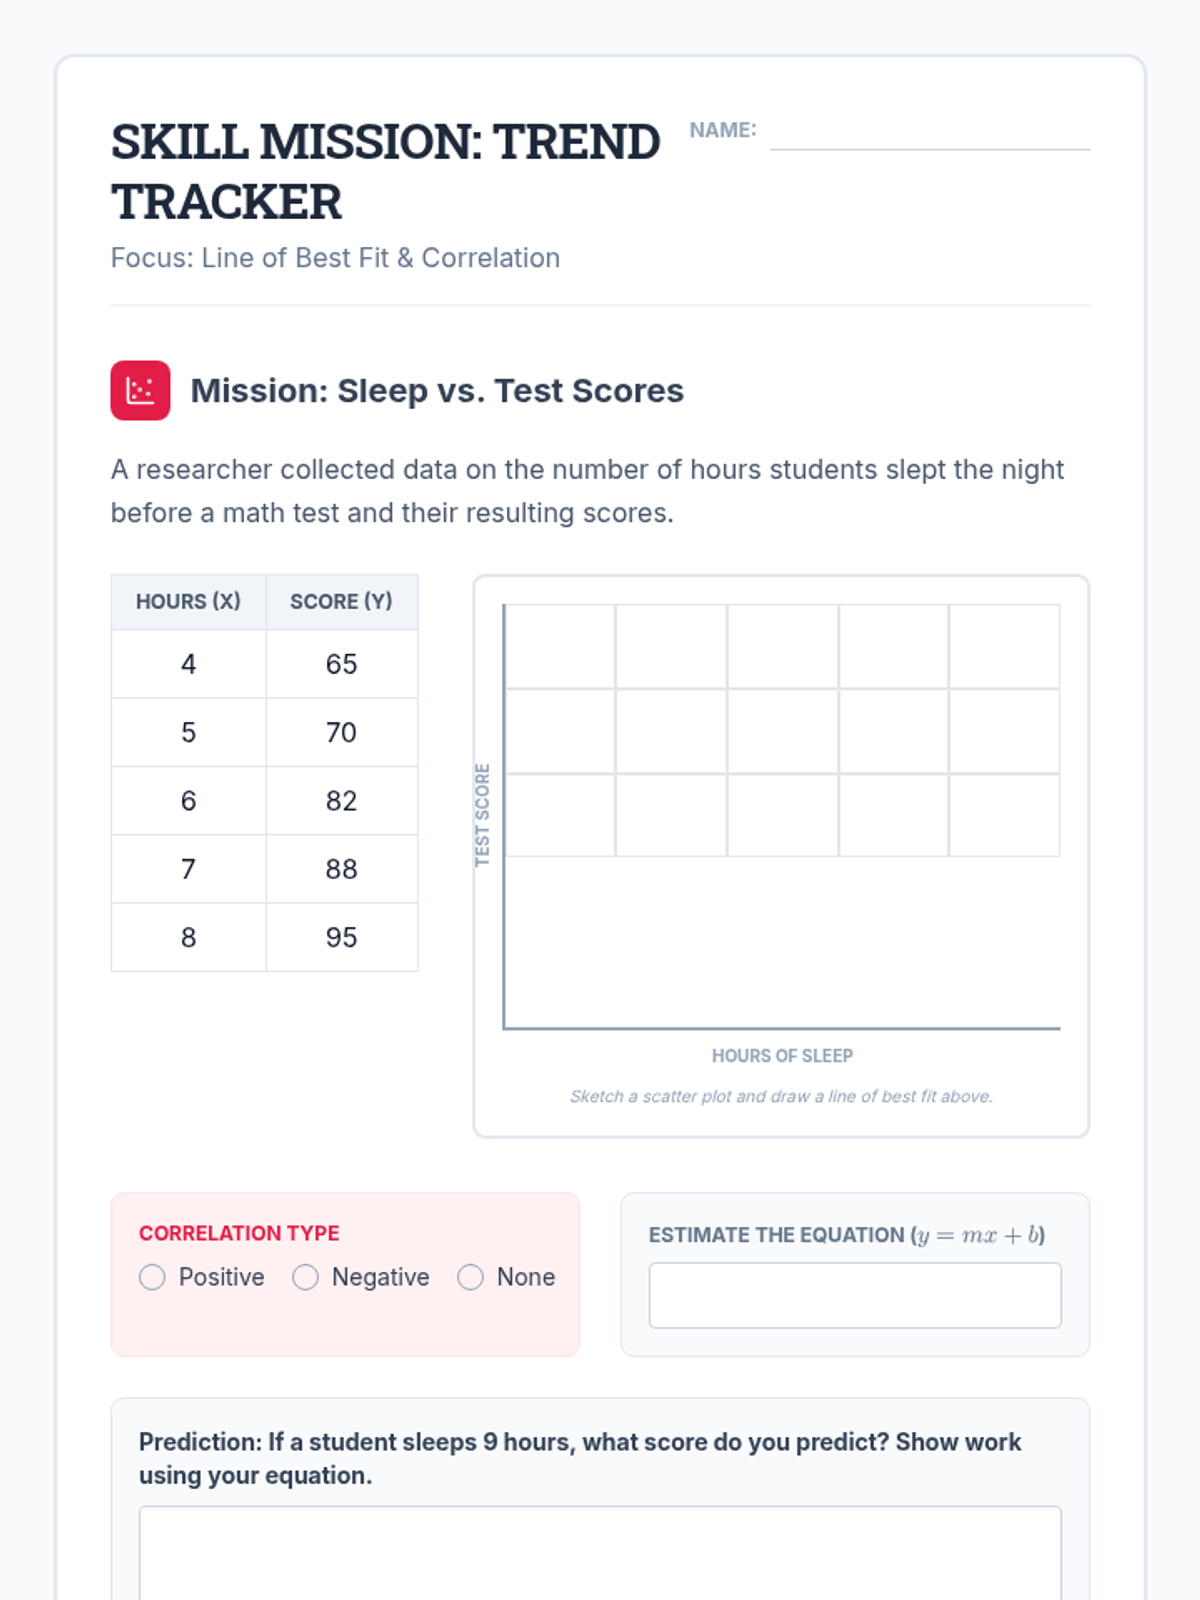
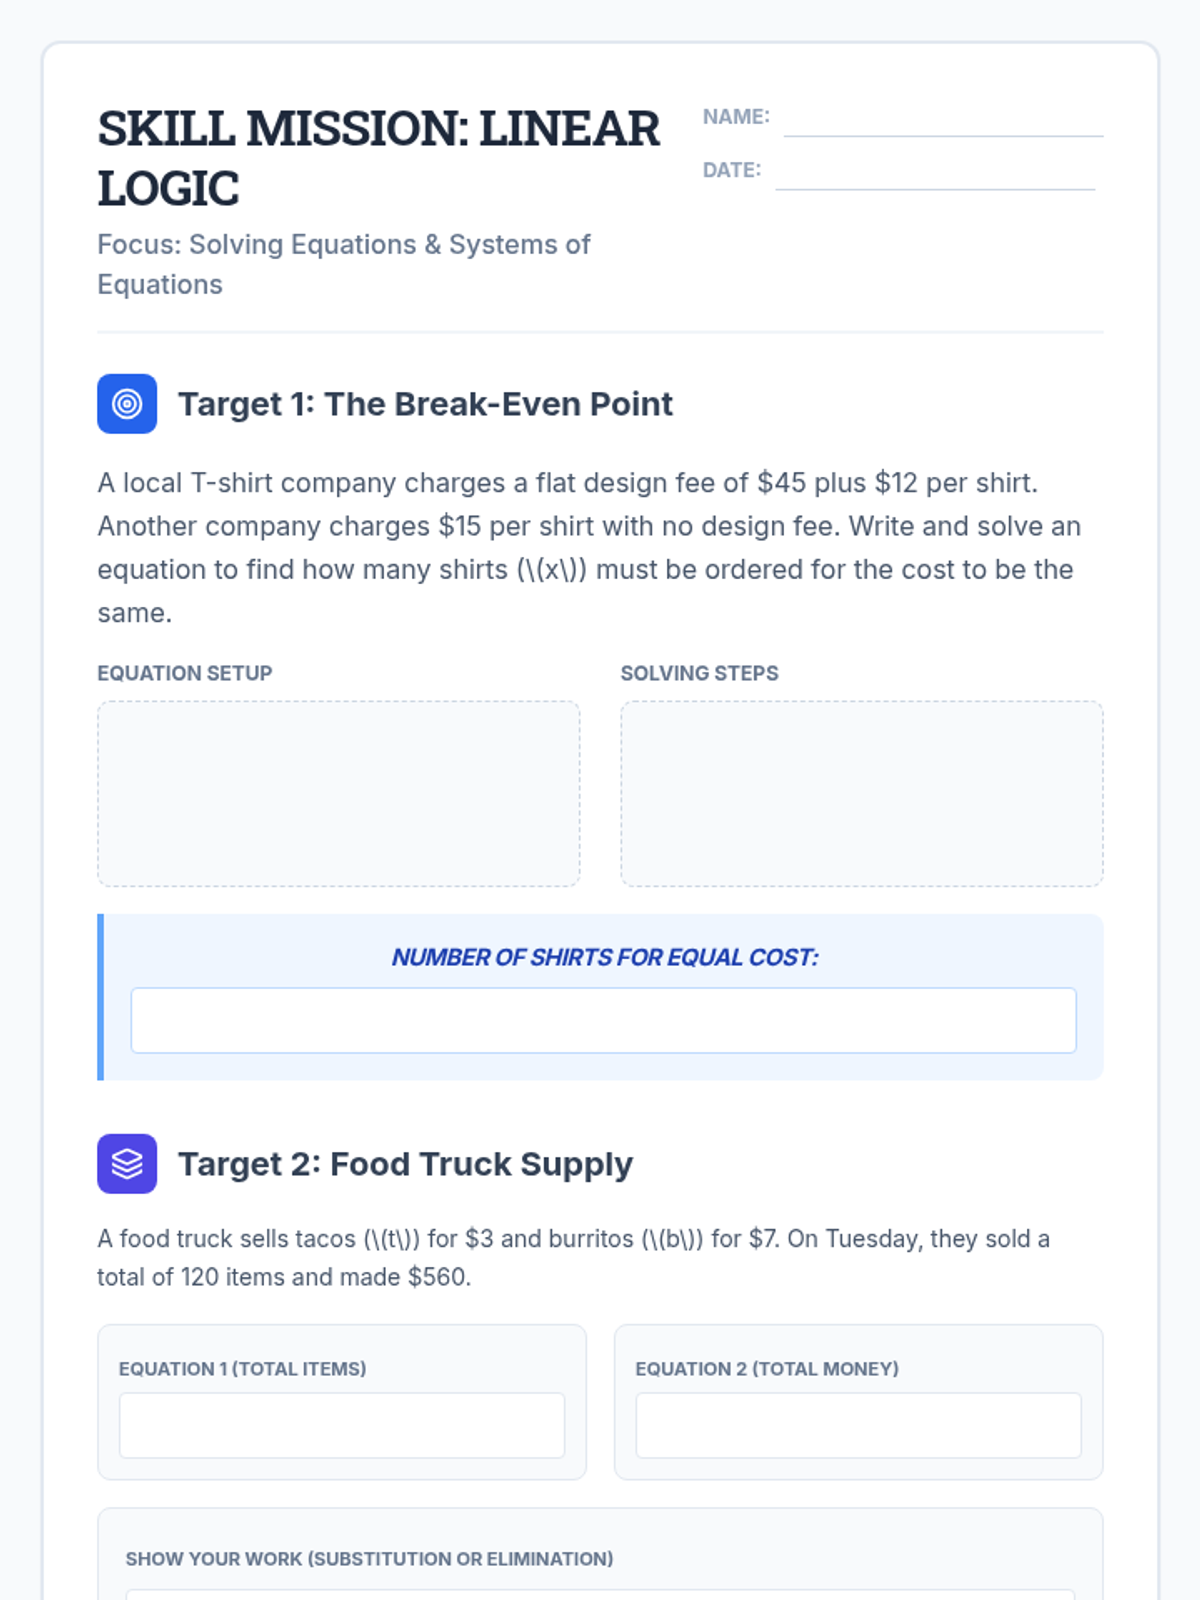
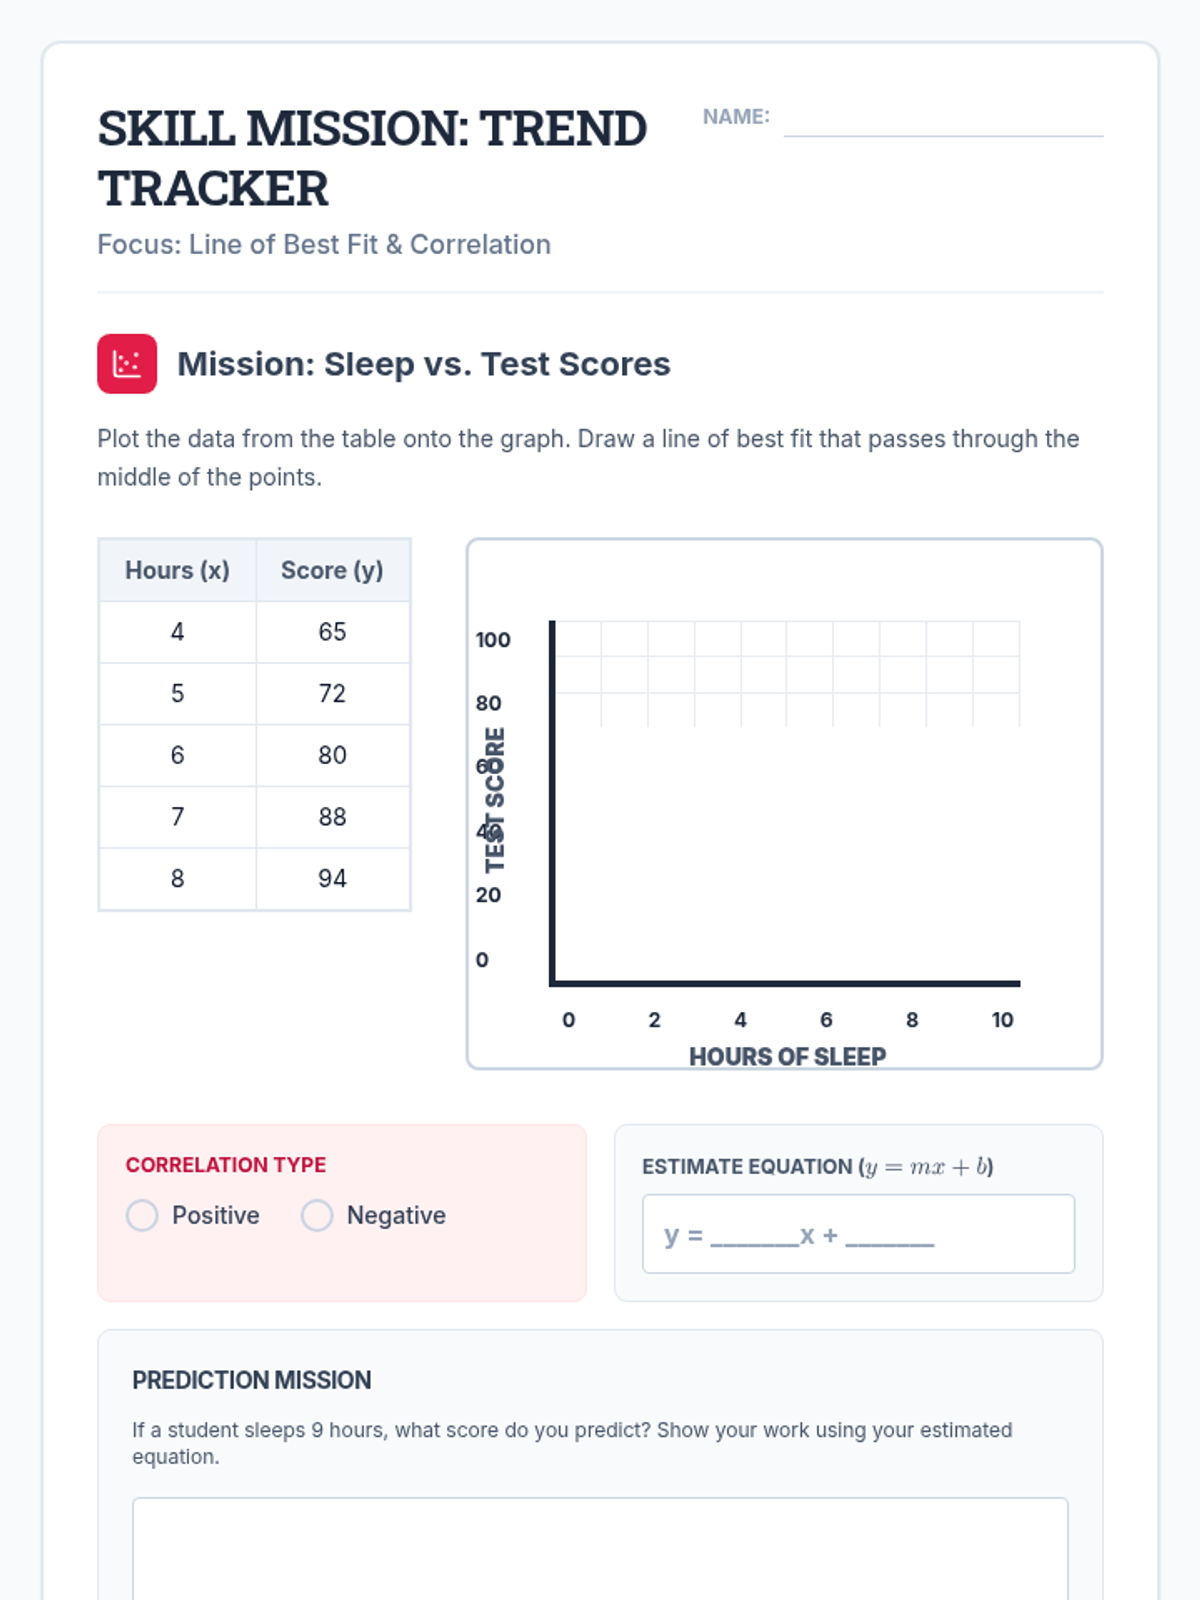
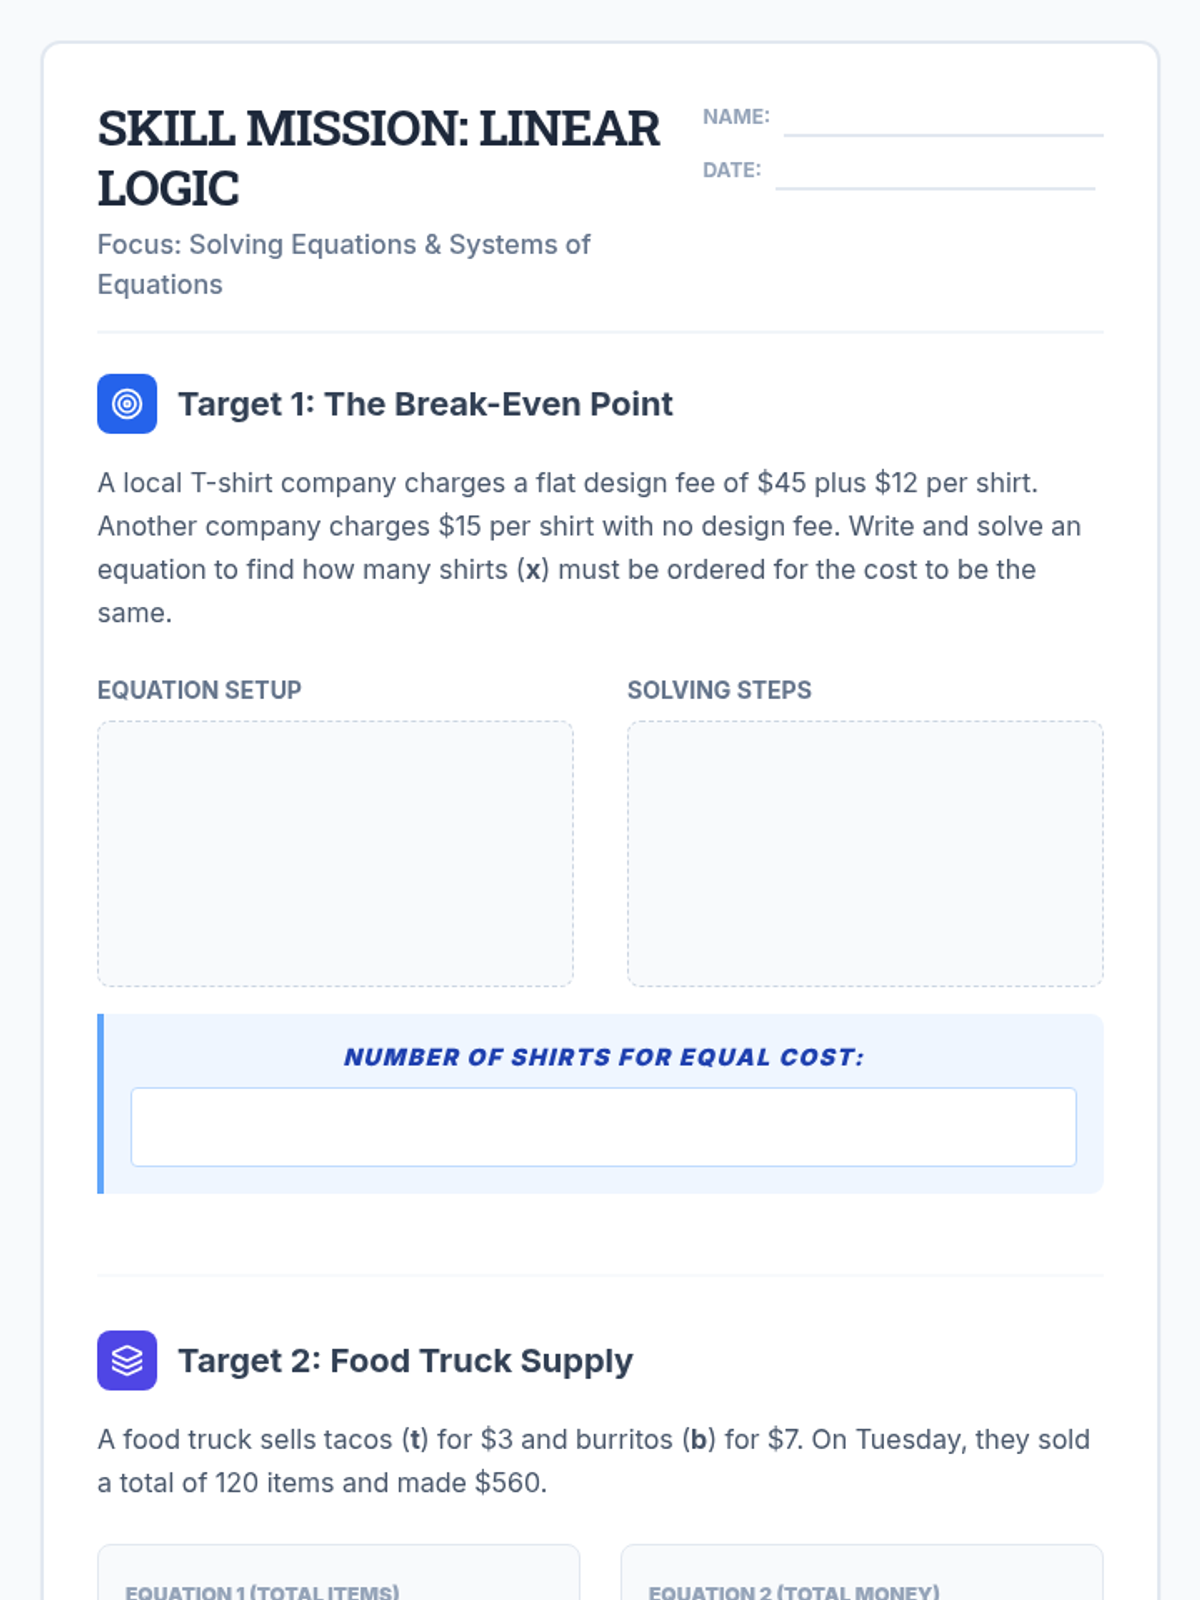
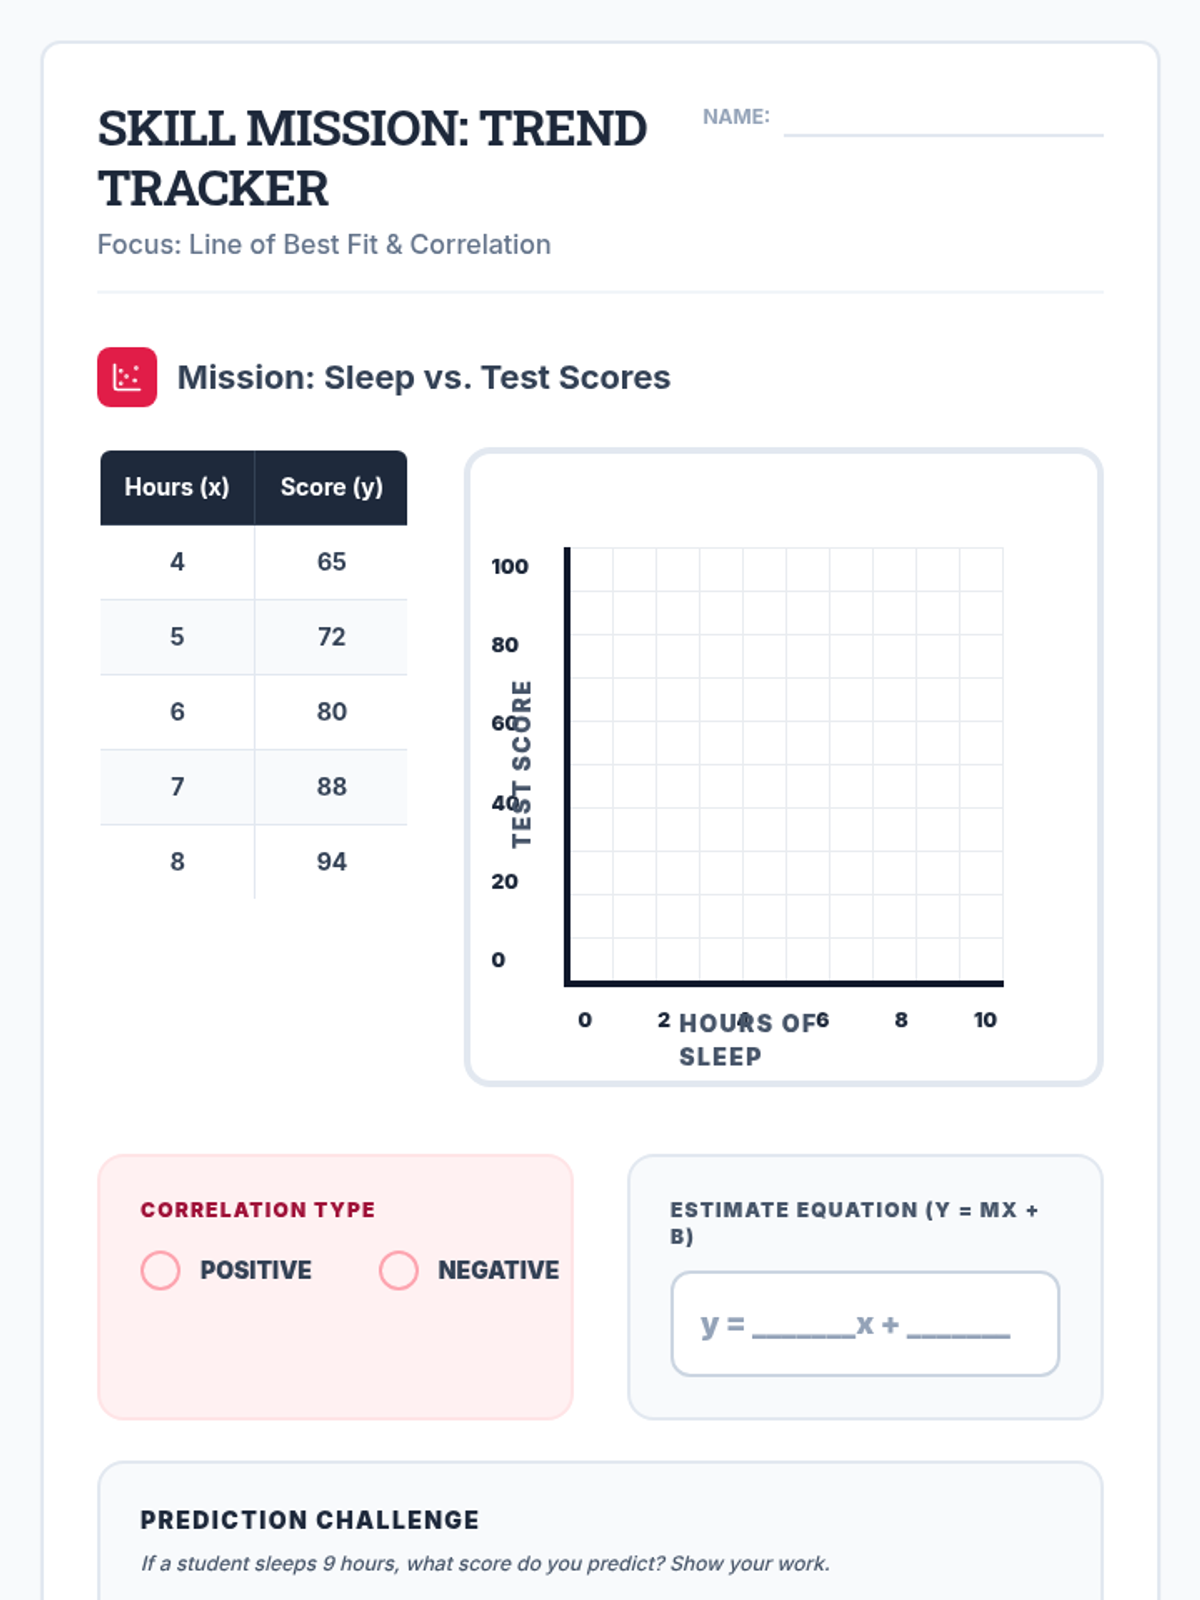
Scaffolded practice activities ('Skill Missions') that review key concepts: linear equations, systems, sequences, lines of best fit, and factoring. These activities ensure students have the foundational skills needed for their final project.
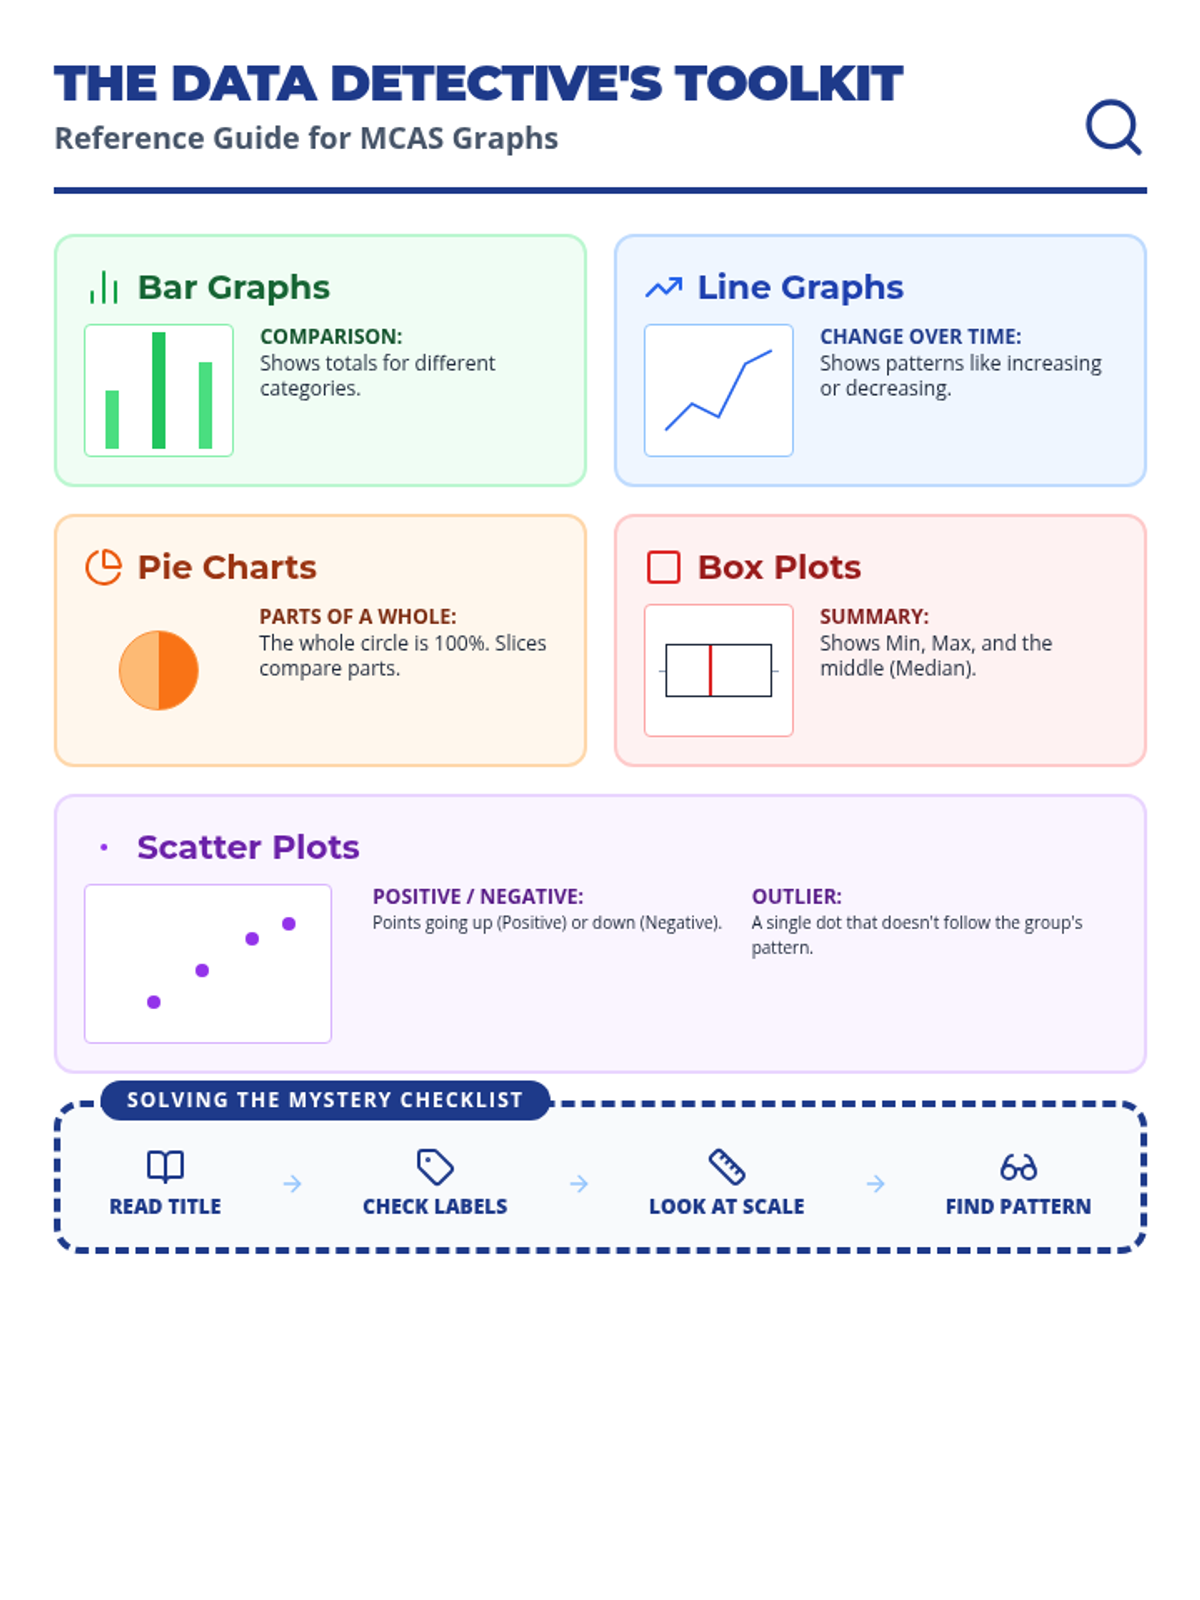
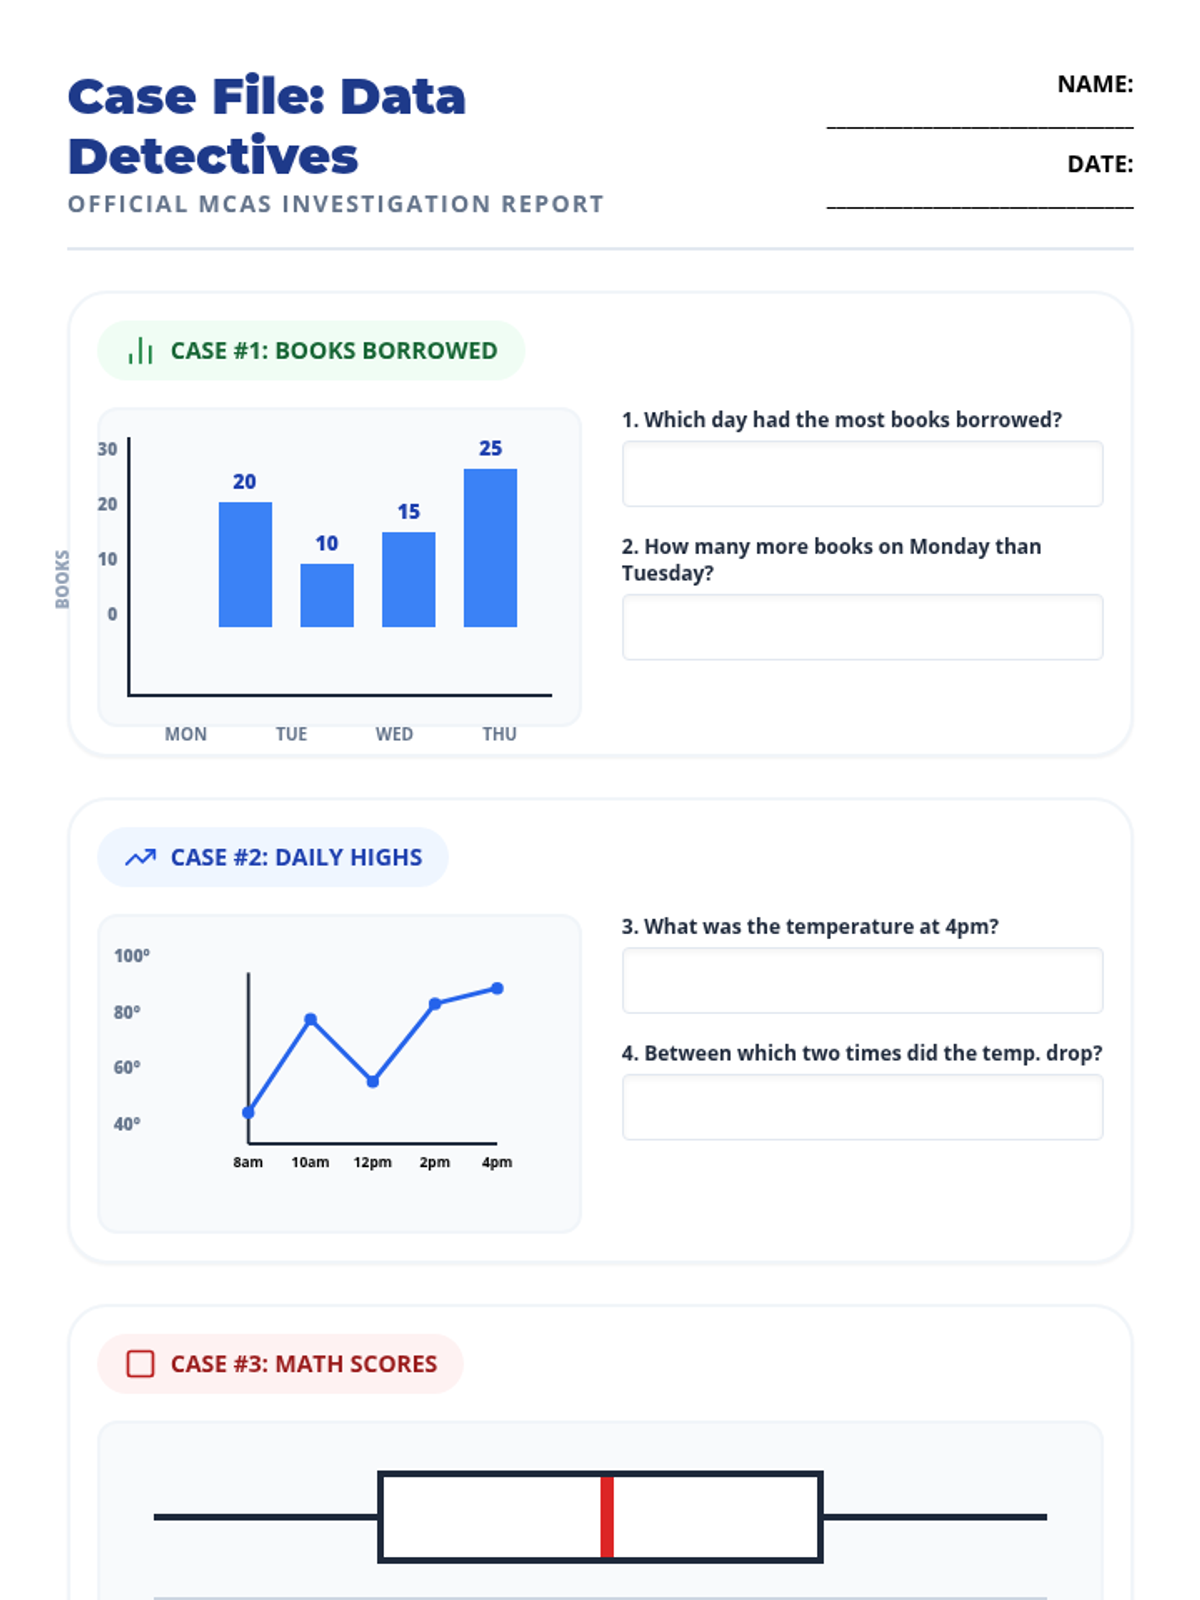
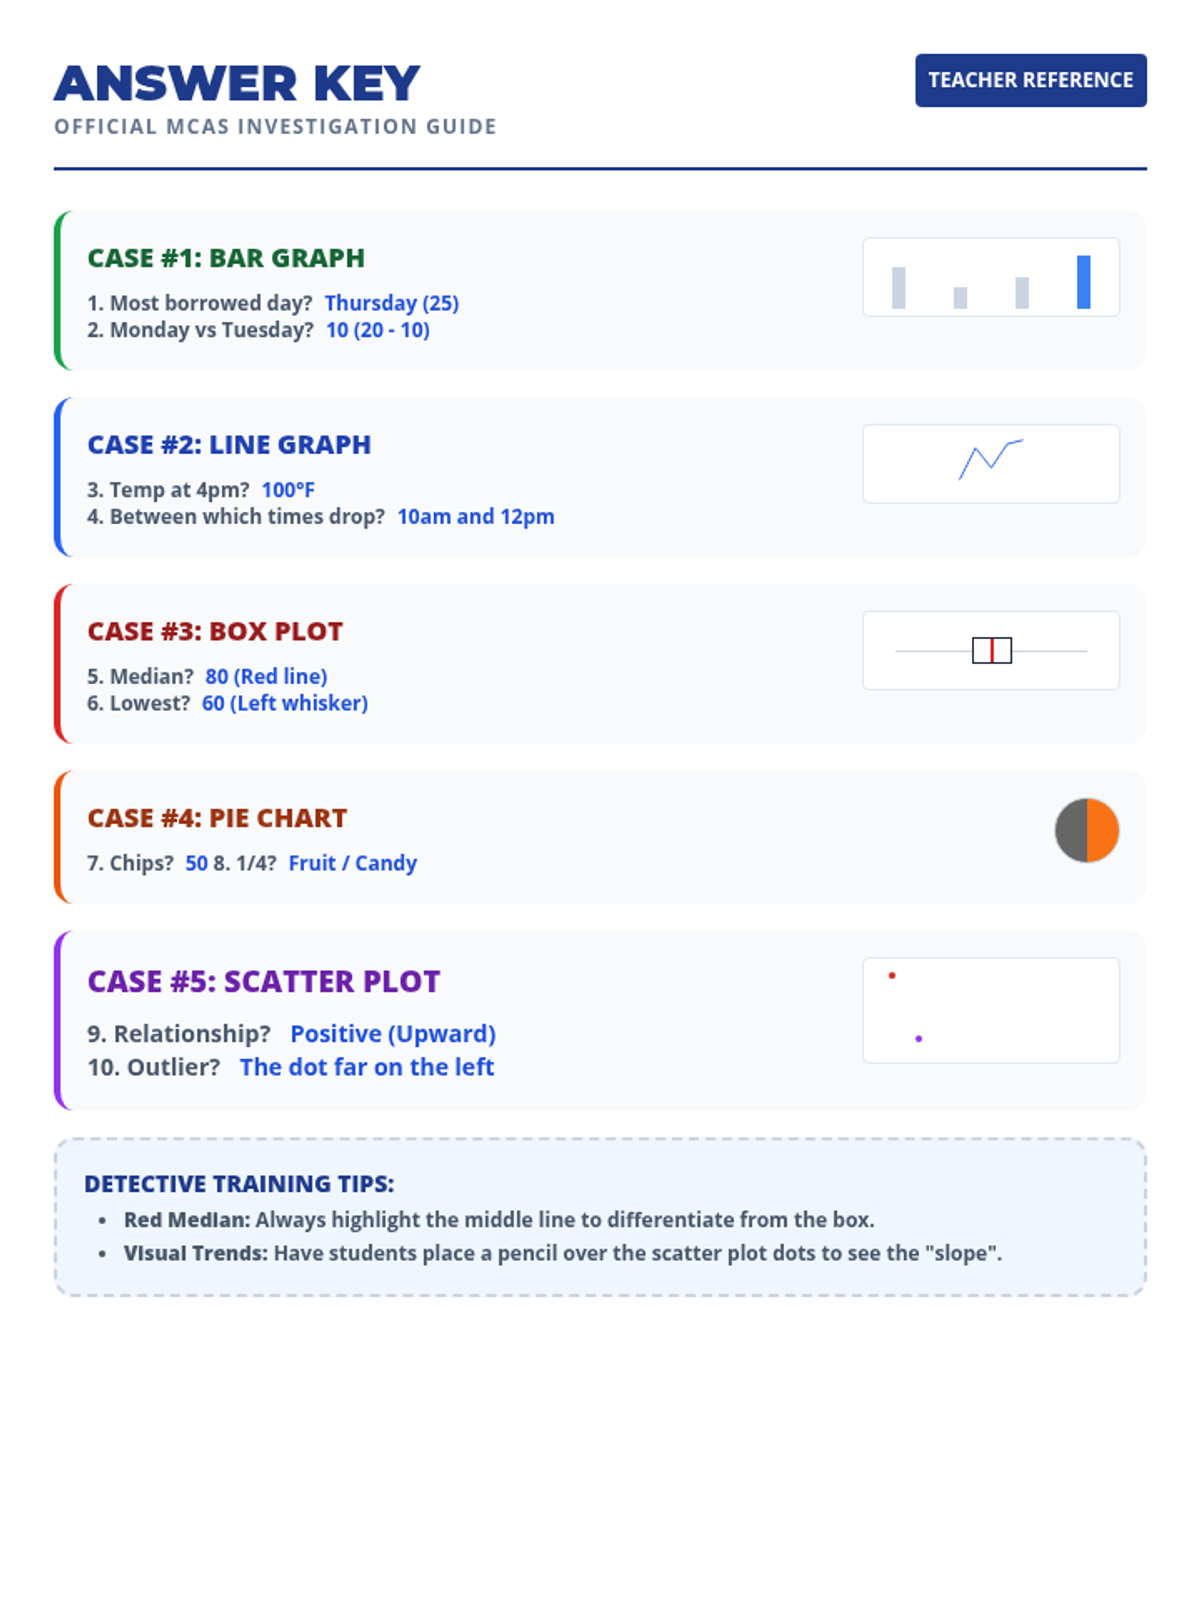
A focused lesson for 7th grade students (specifically designed for SPED support) to master interpreting data from box plots, bar graphs, pie charts, line graphs, and scatter plots in preparation for the MCAS.
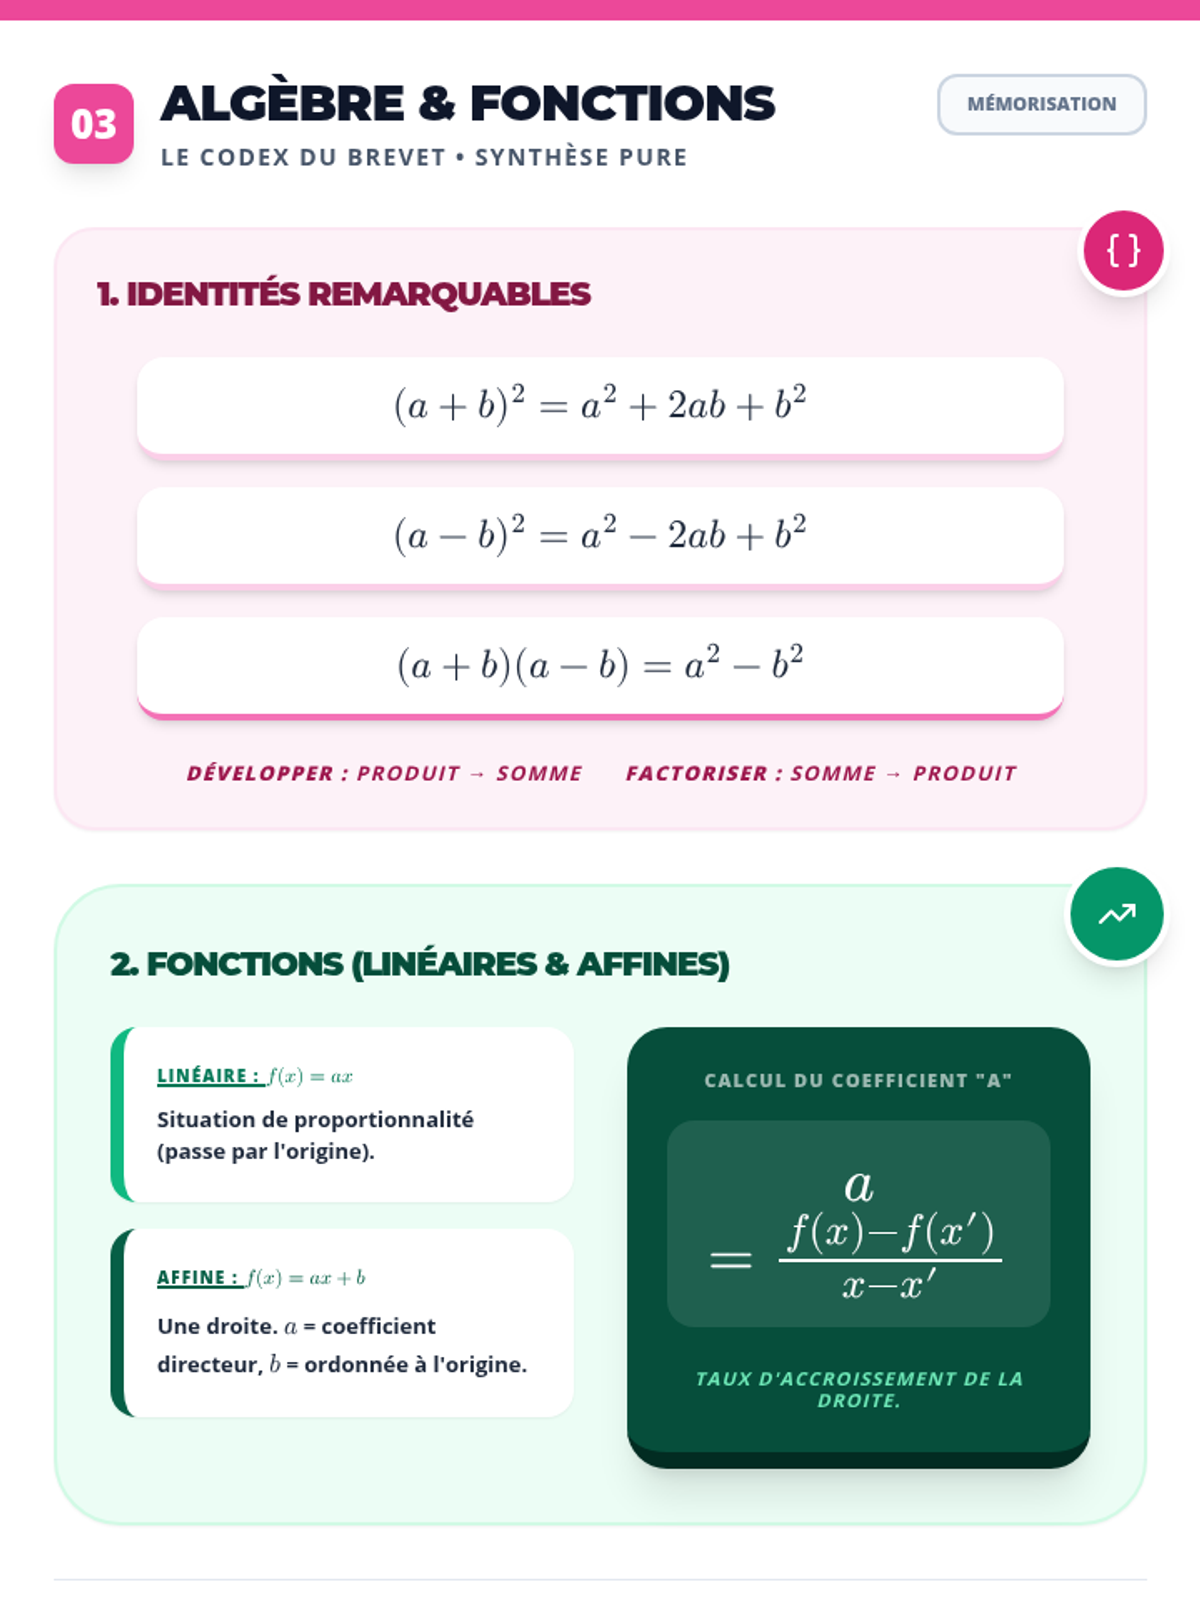
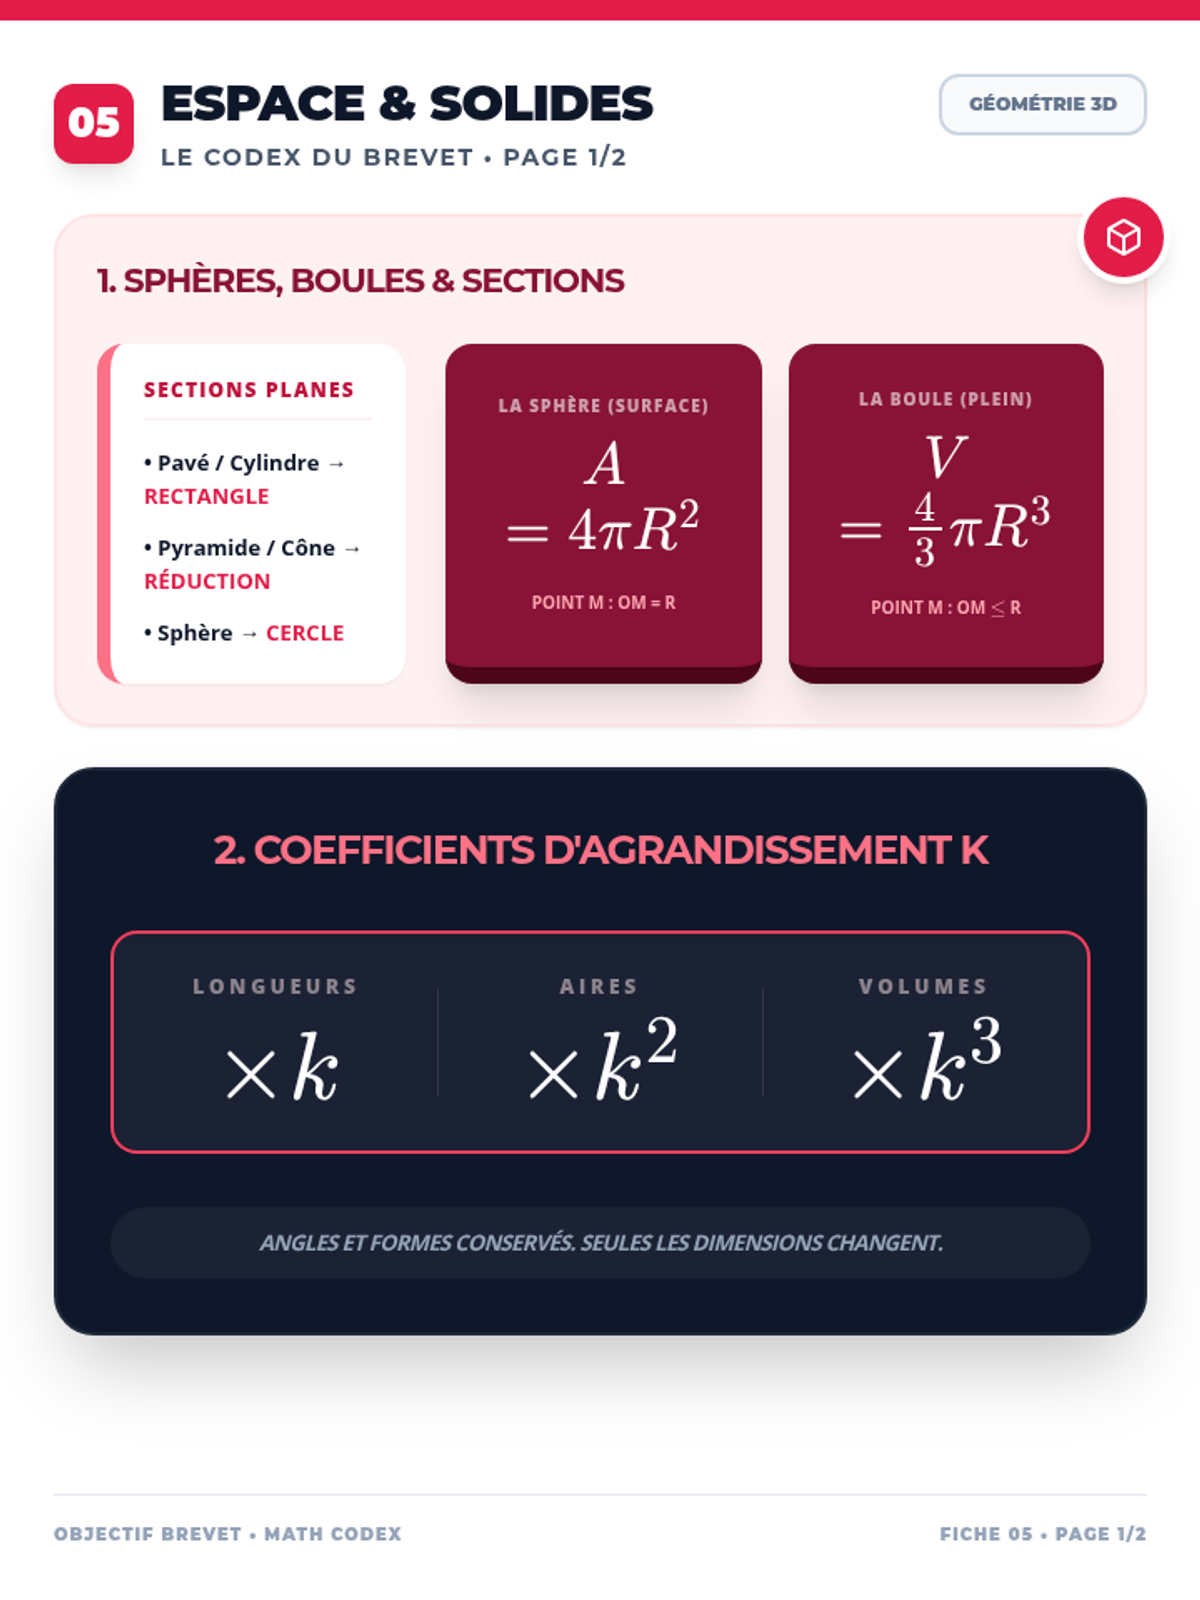
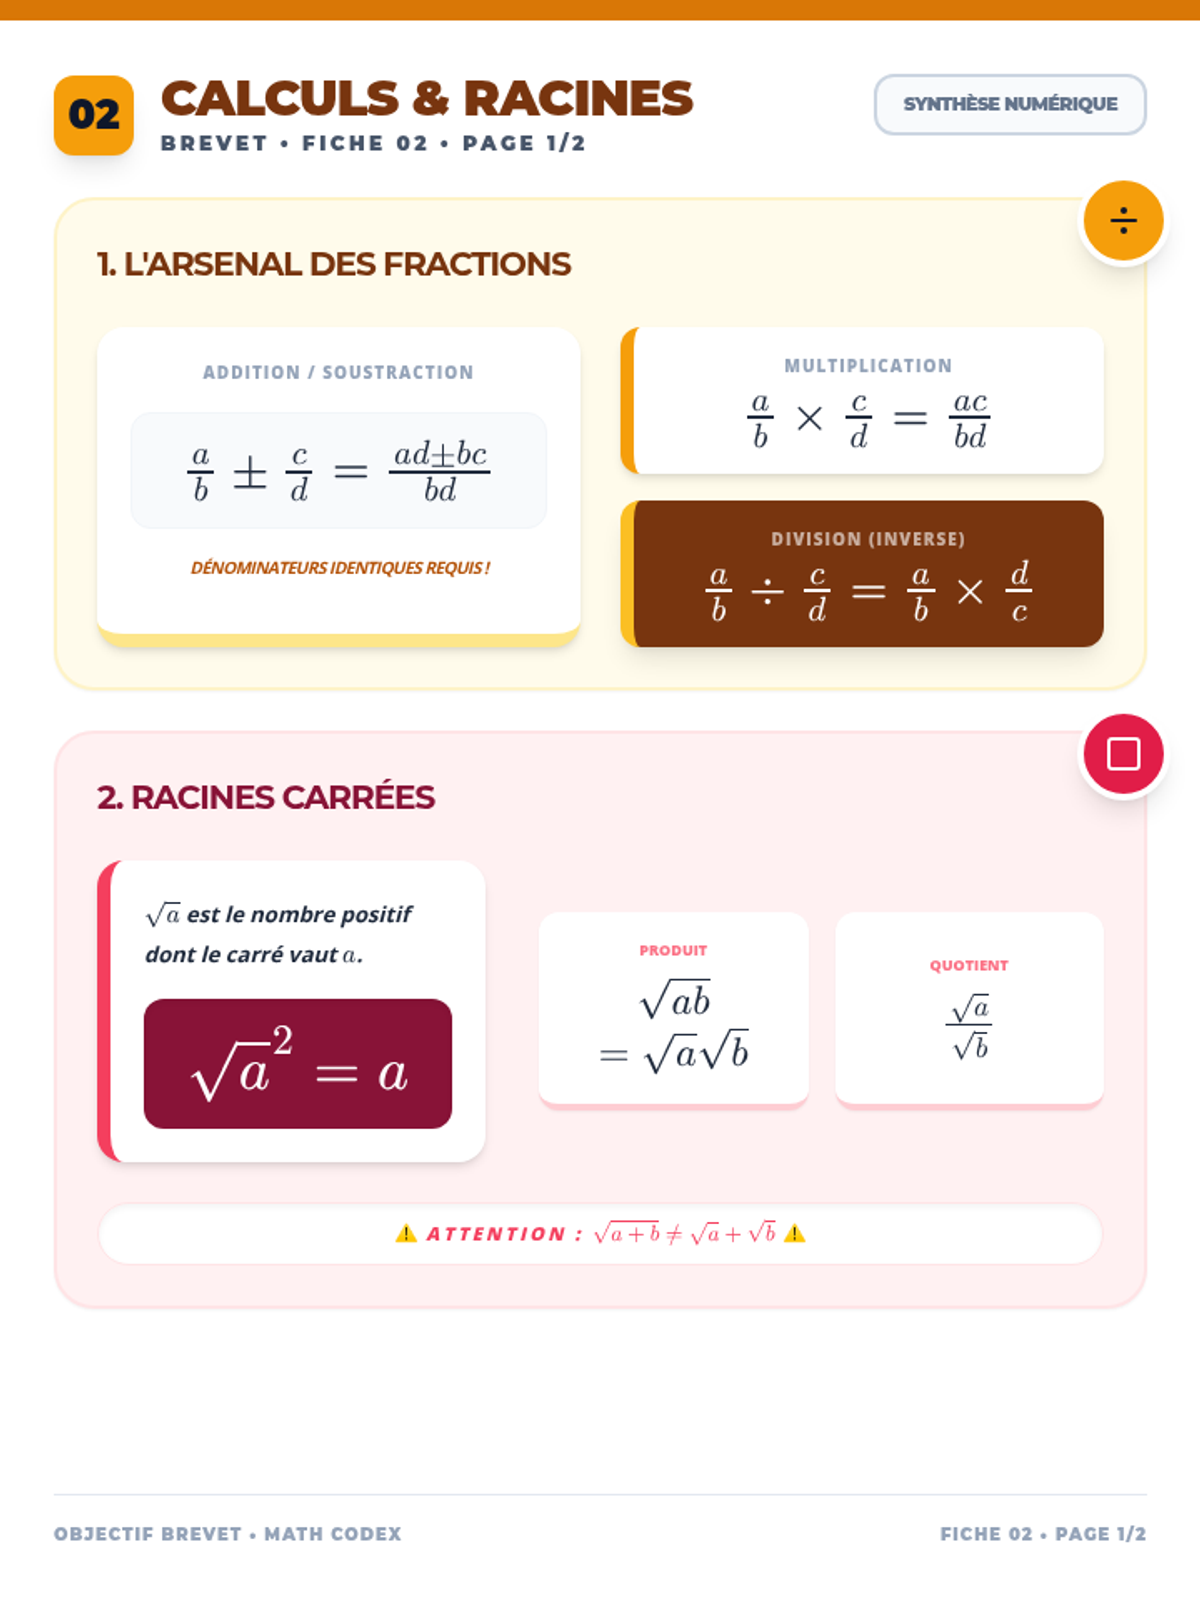
Une collection complète de fiches de révision et un diaporama dynamique pour maîtriser le programme de mathématiques de 3ème. Couvre l'arithmétique, l'algèbre, la géométrie et la trigonométrie avec des visuels clairs et modernes.
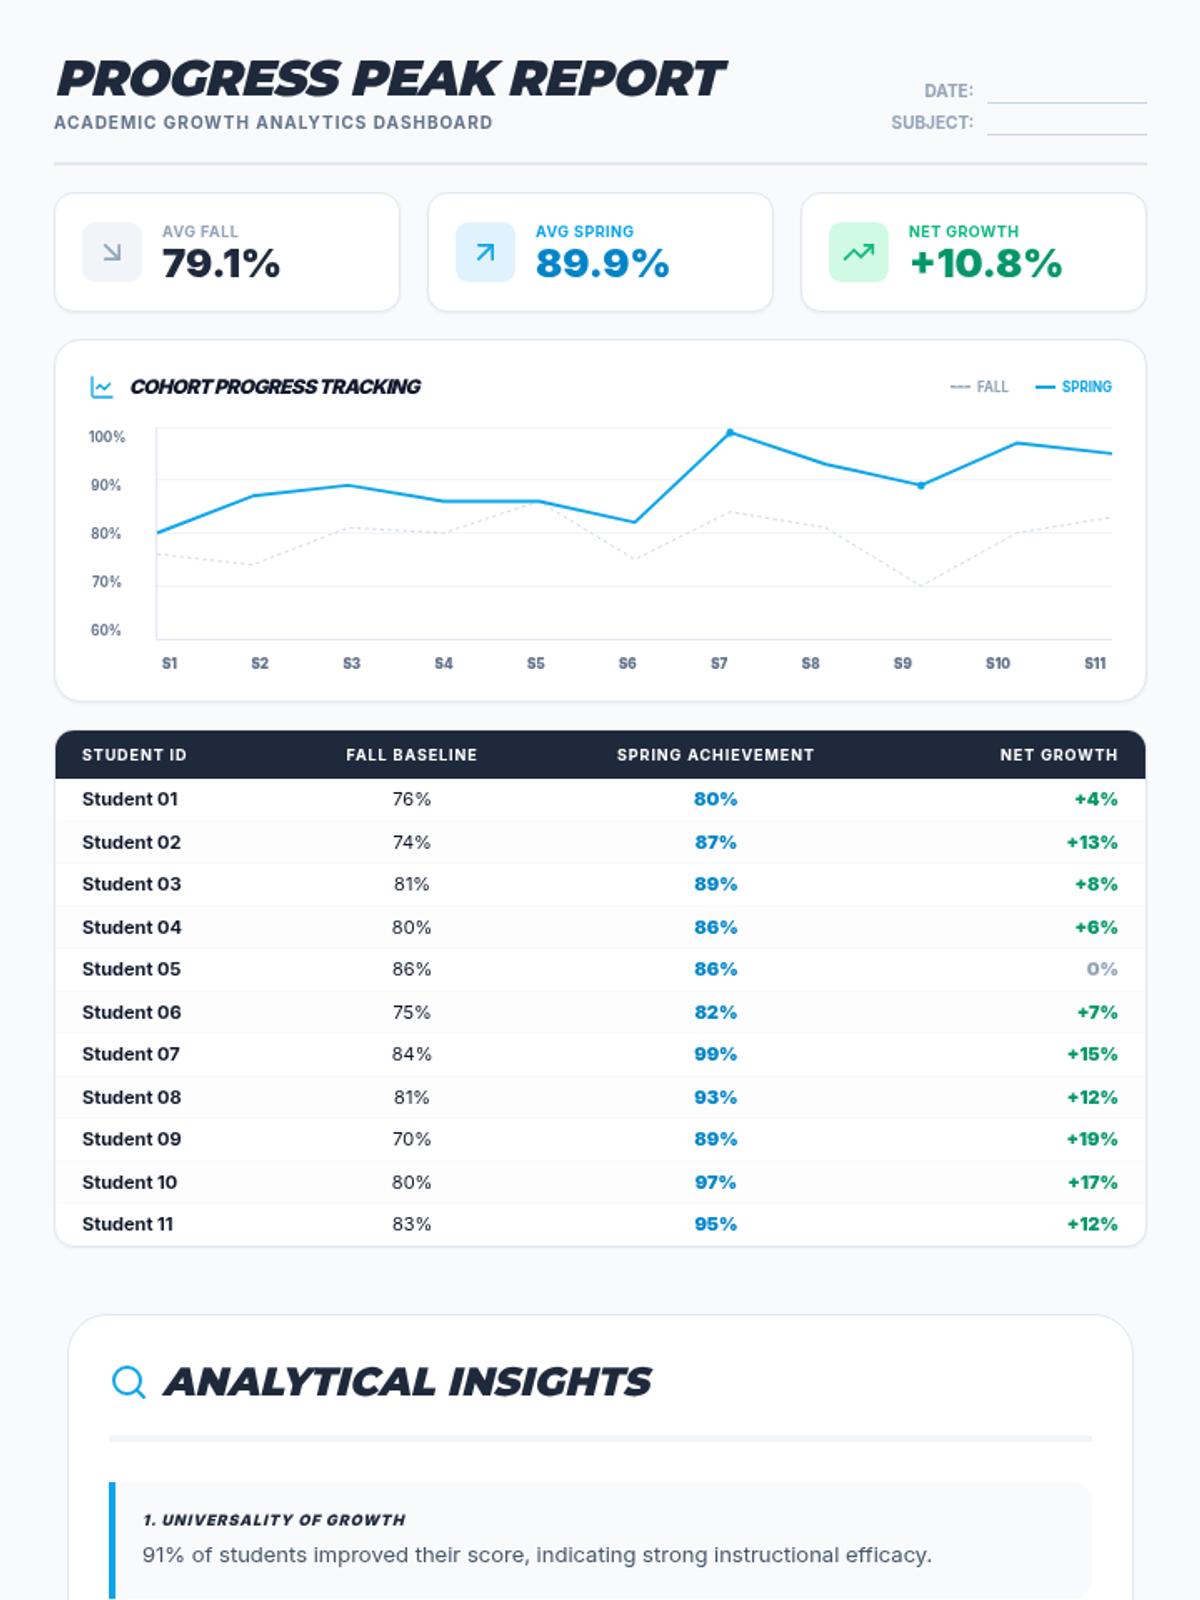
A lesson focused on visualizing academic progress data through line graphs and identifying key trends in student performance.
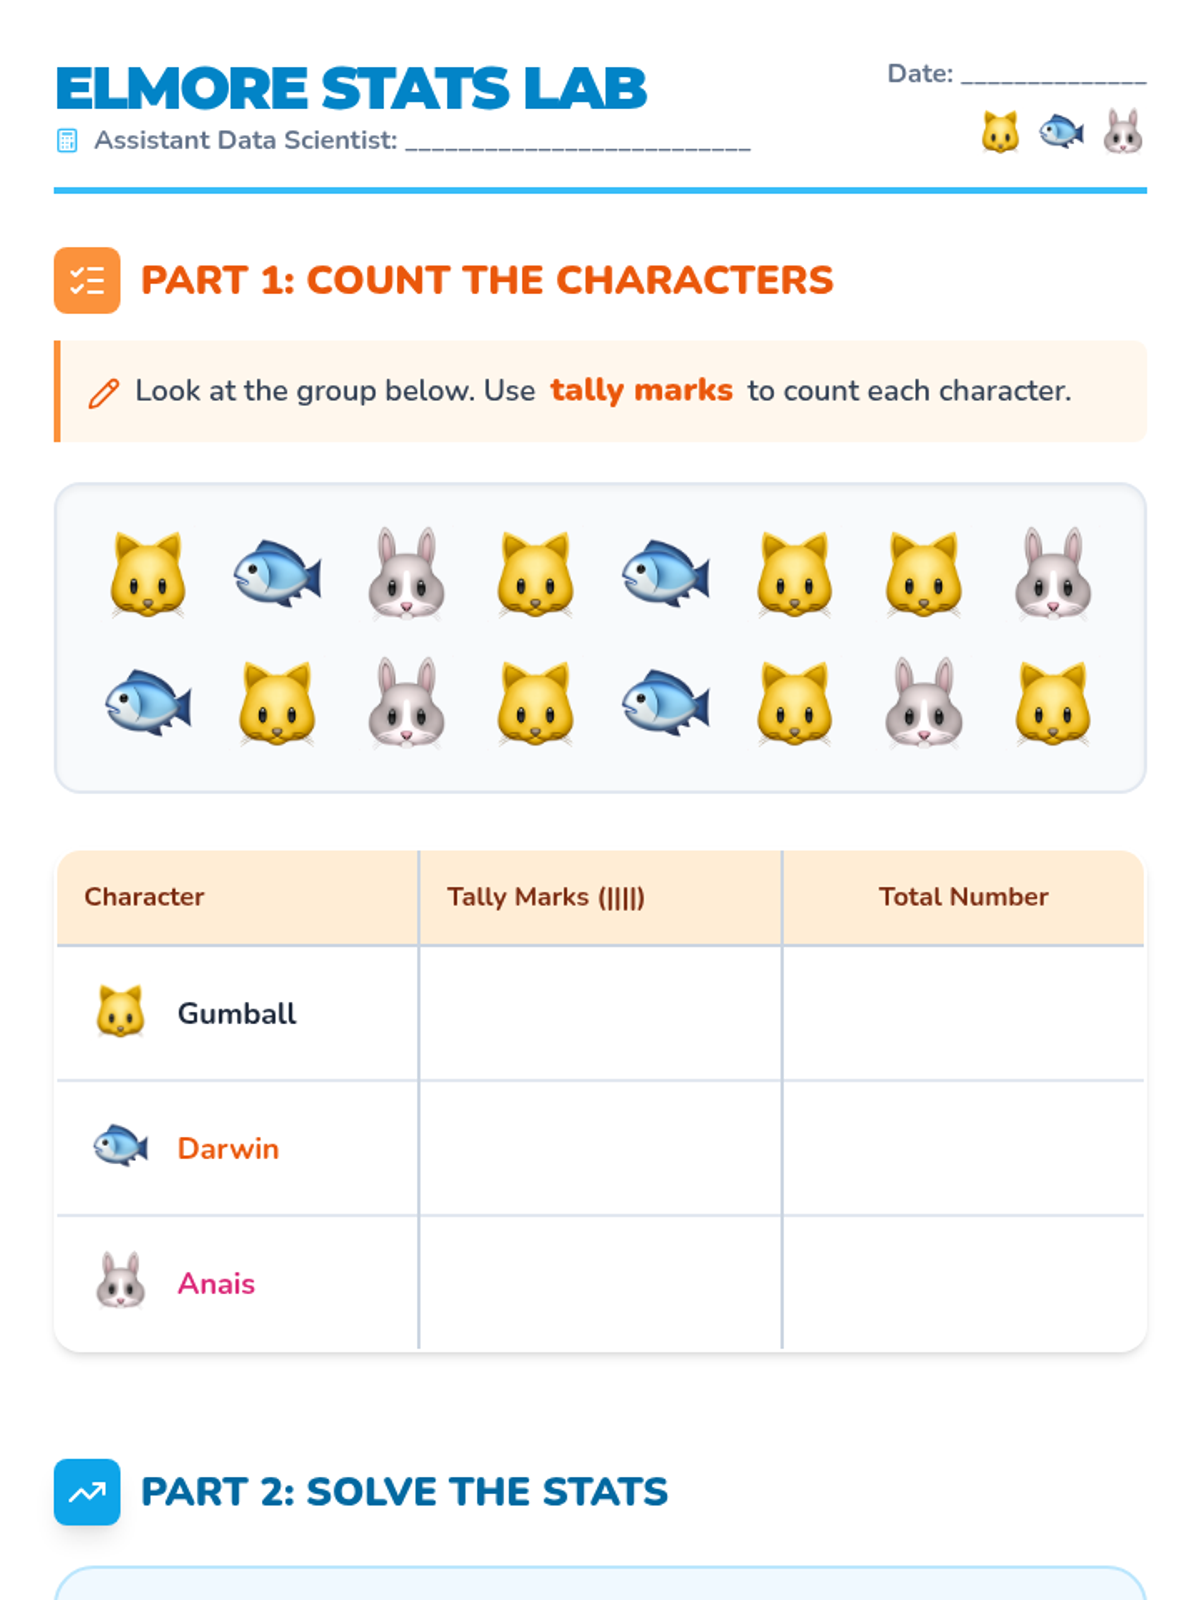
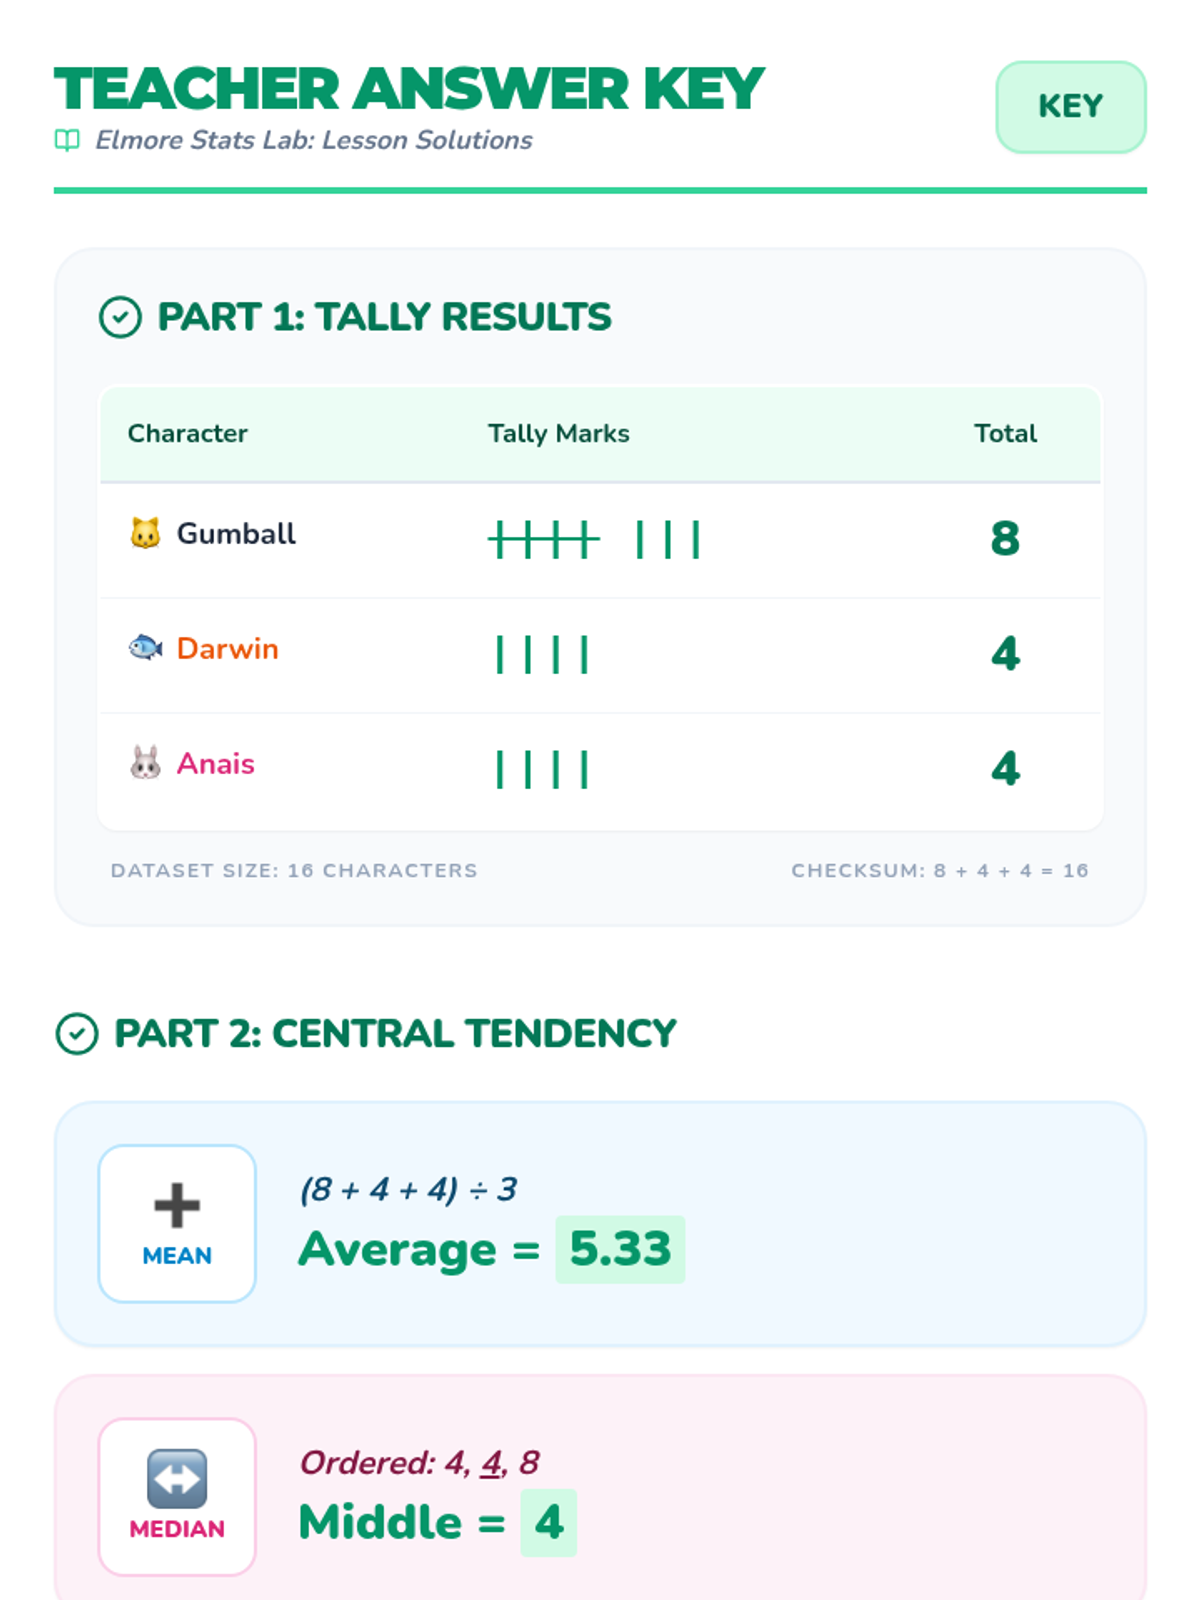
A high-interest statistics lesson themed around the world of Elmore, featuring data collection, central tendency, and probability with visual supports for diverse learners.
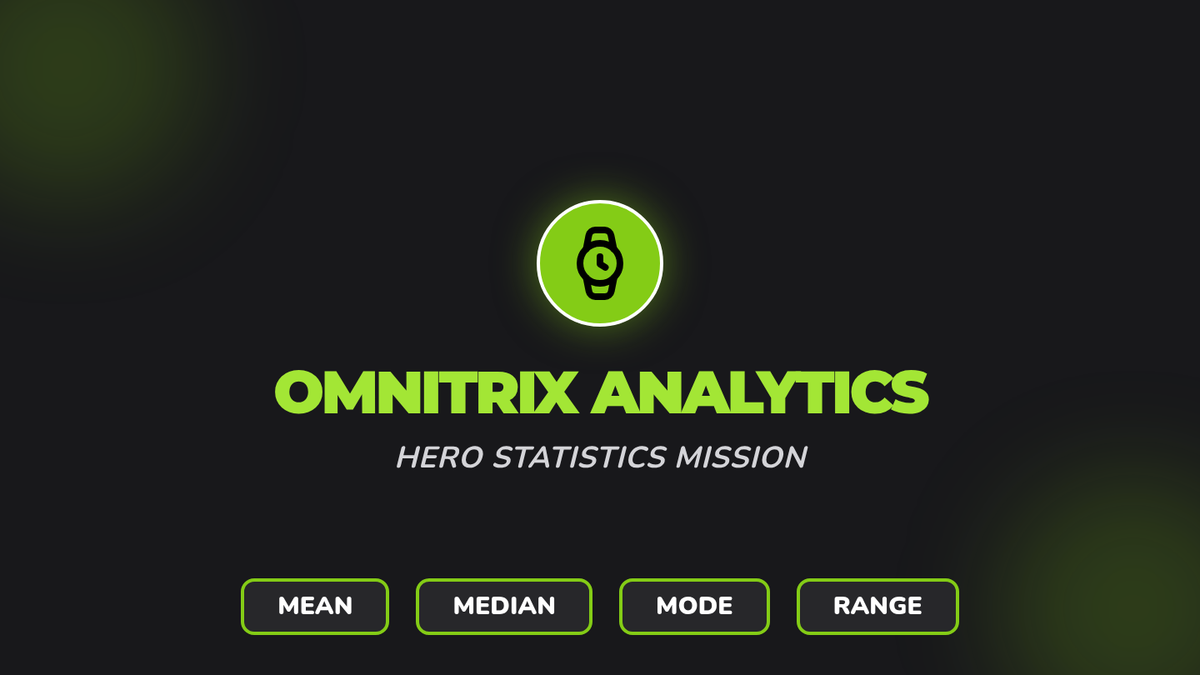
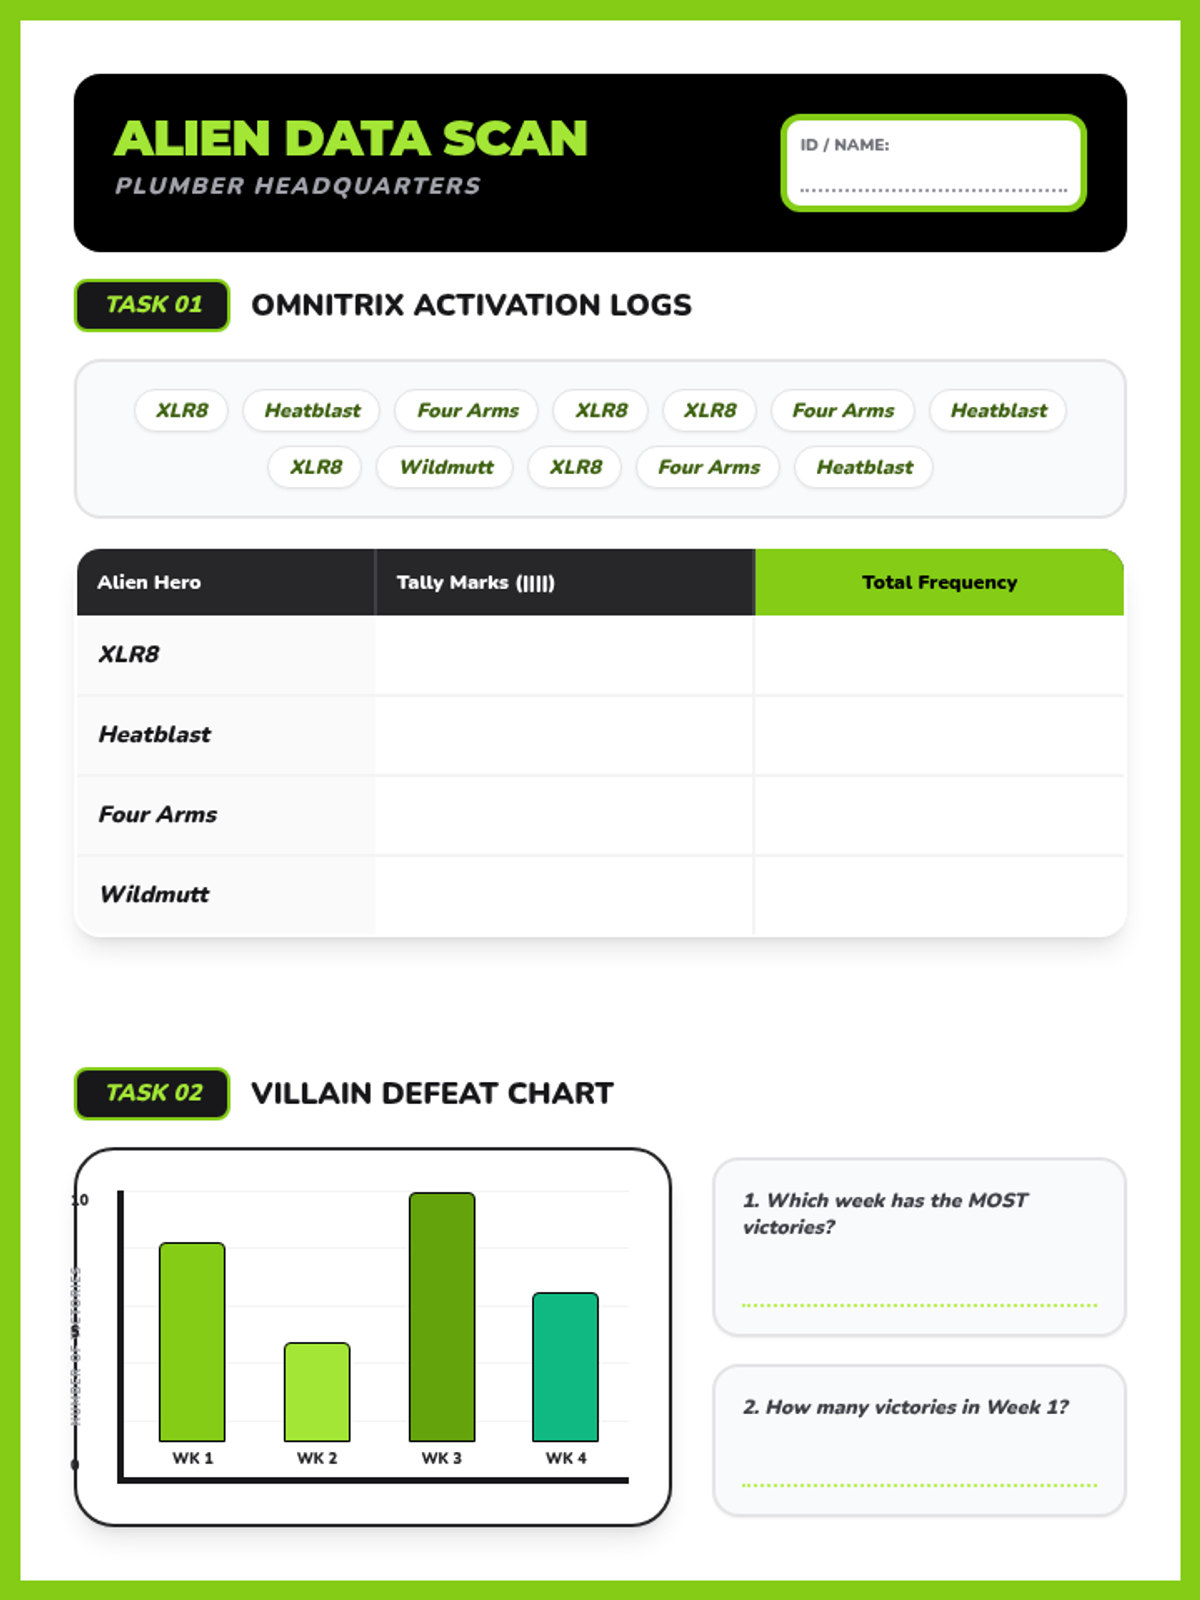
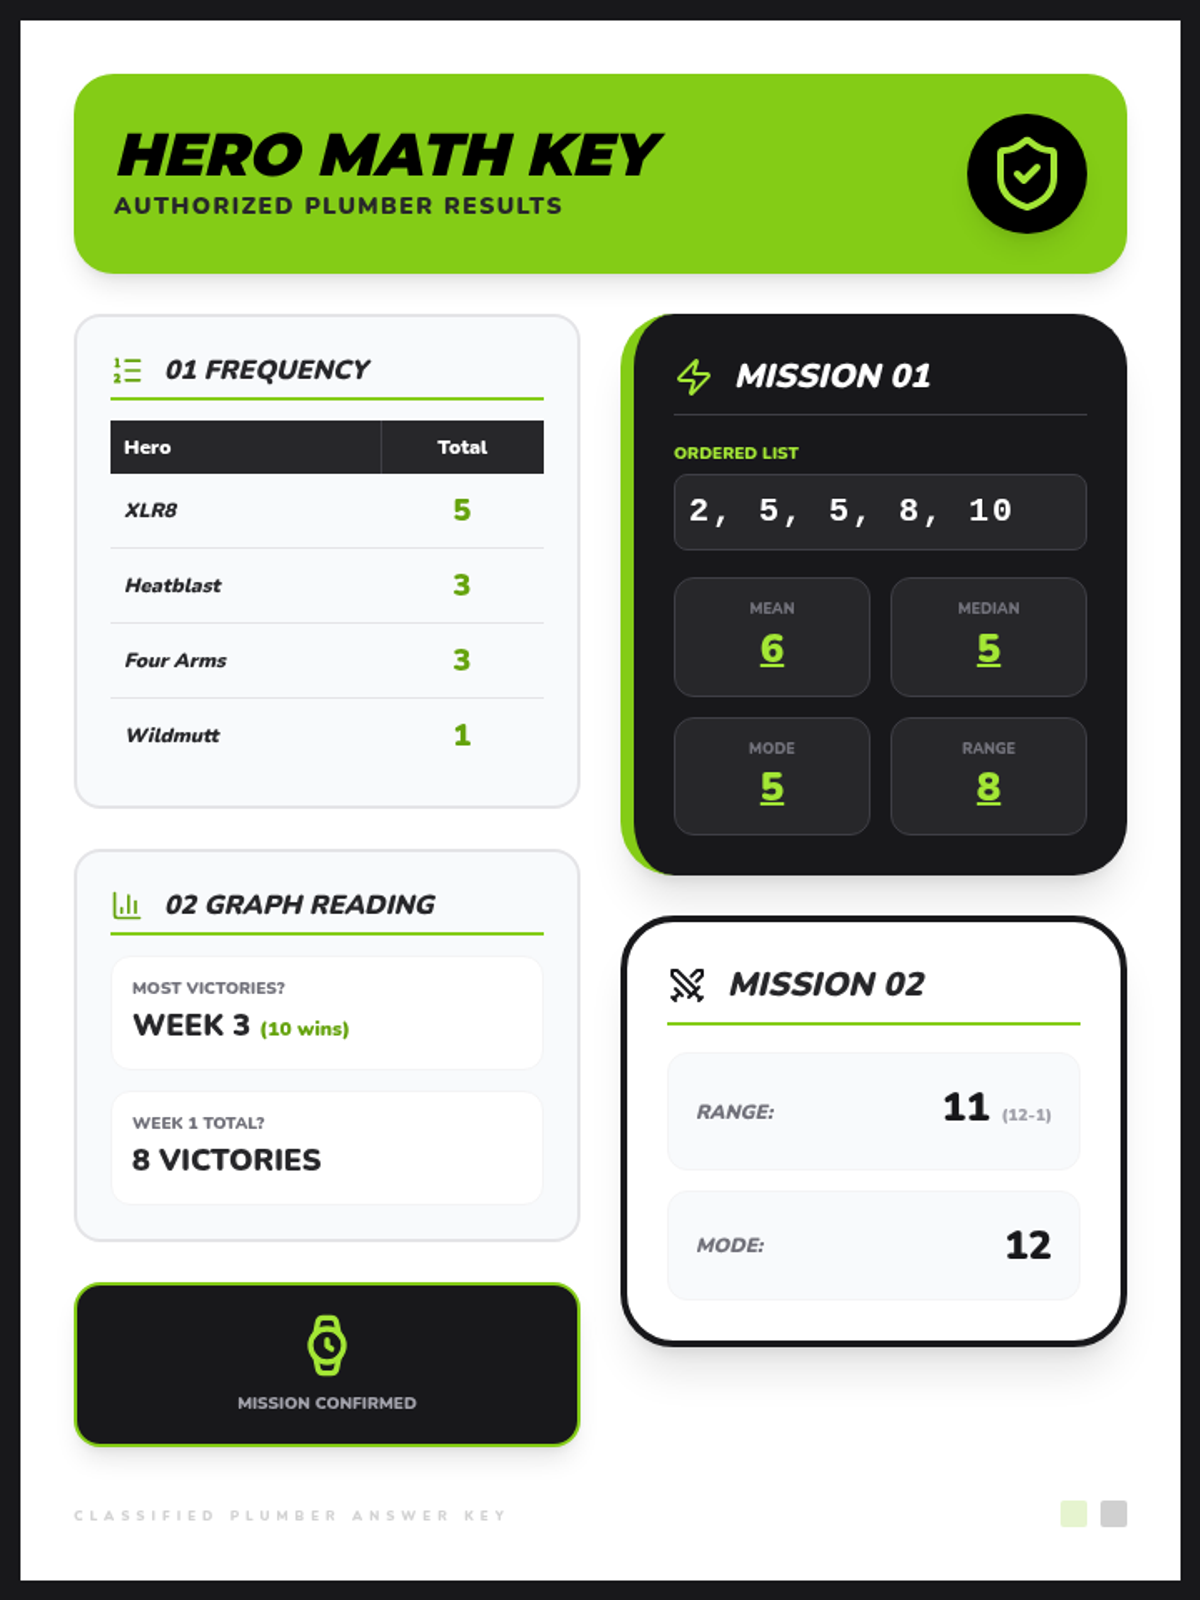
A statistics lesson themed around Ben 10, focusing on central tendency (mean, median, mode, range) and data visualization through frequency tables and bar graphs. Designed with heavy visual supports for students with diverse learning needs.
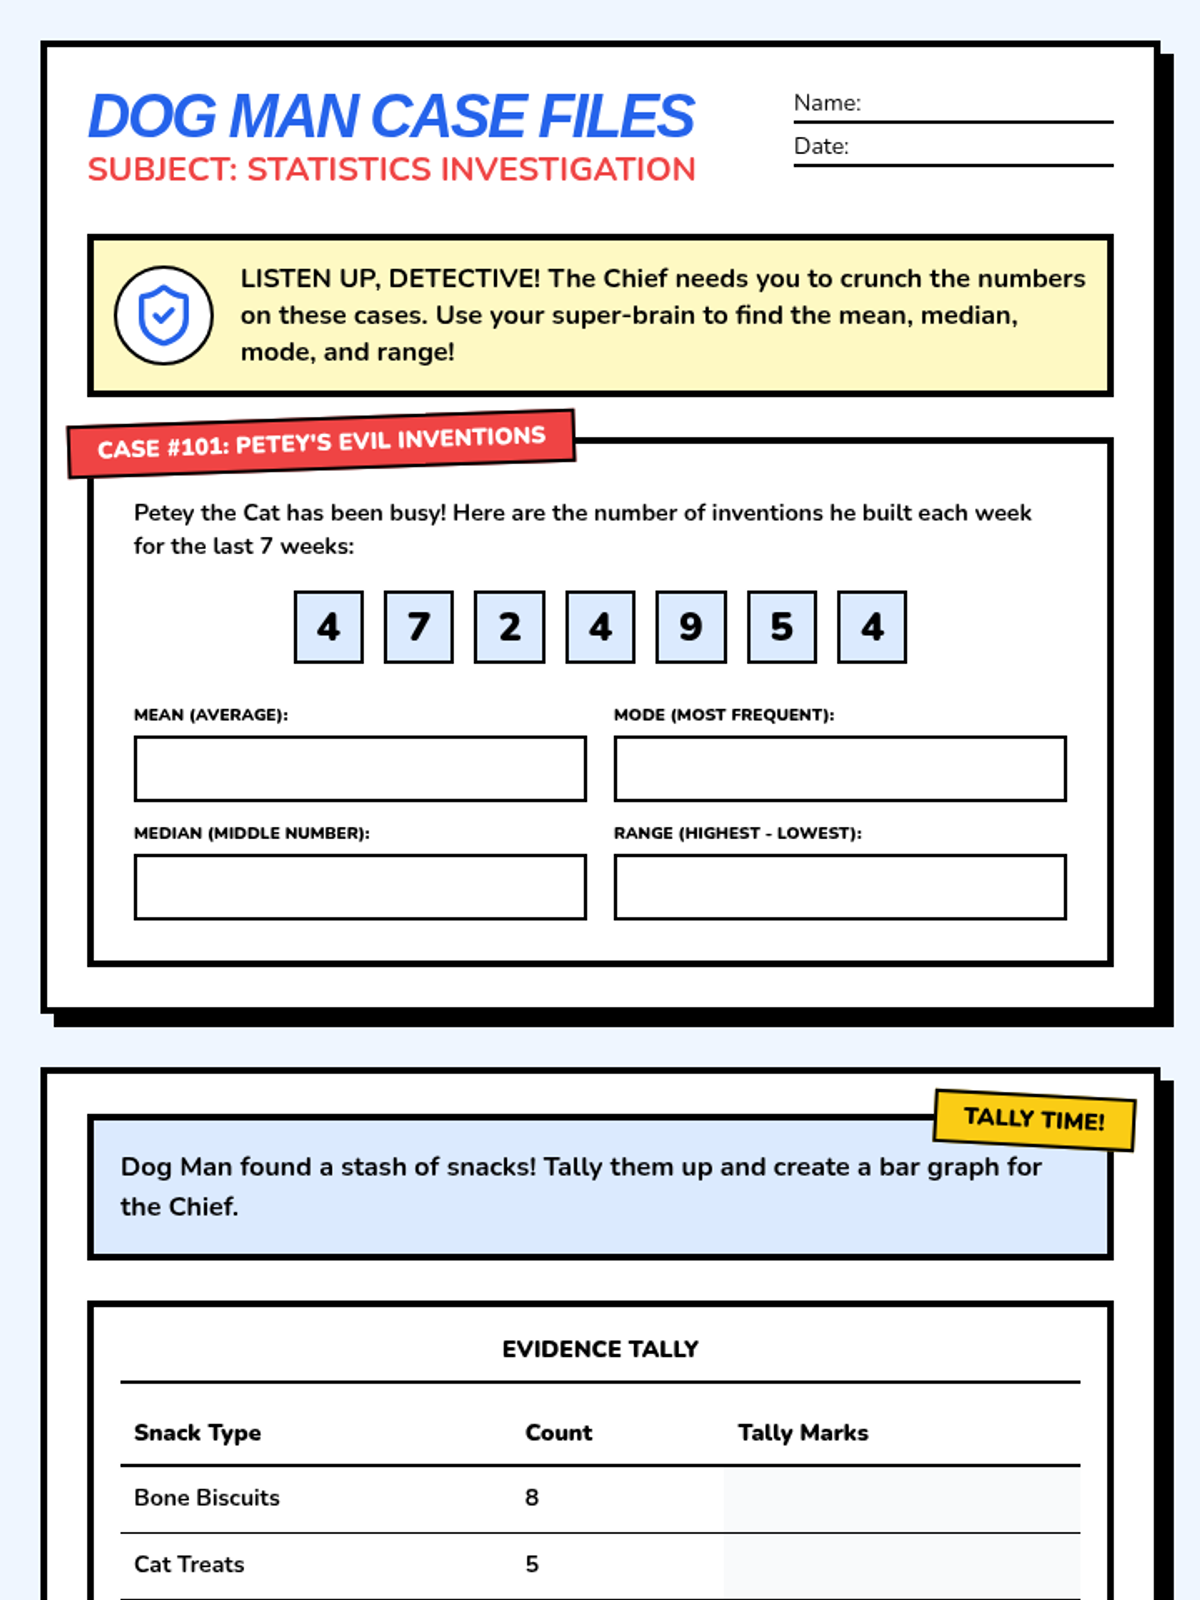
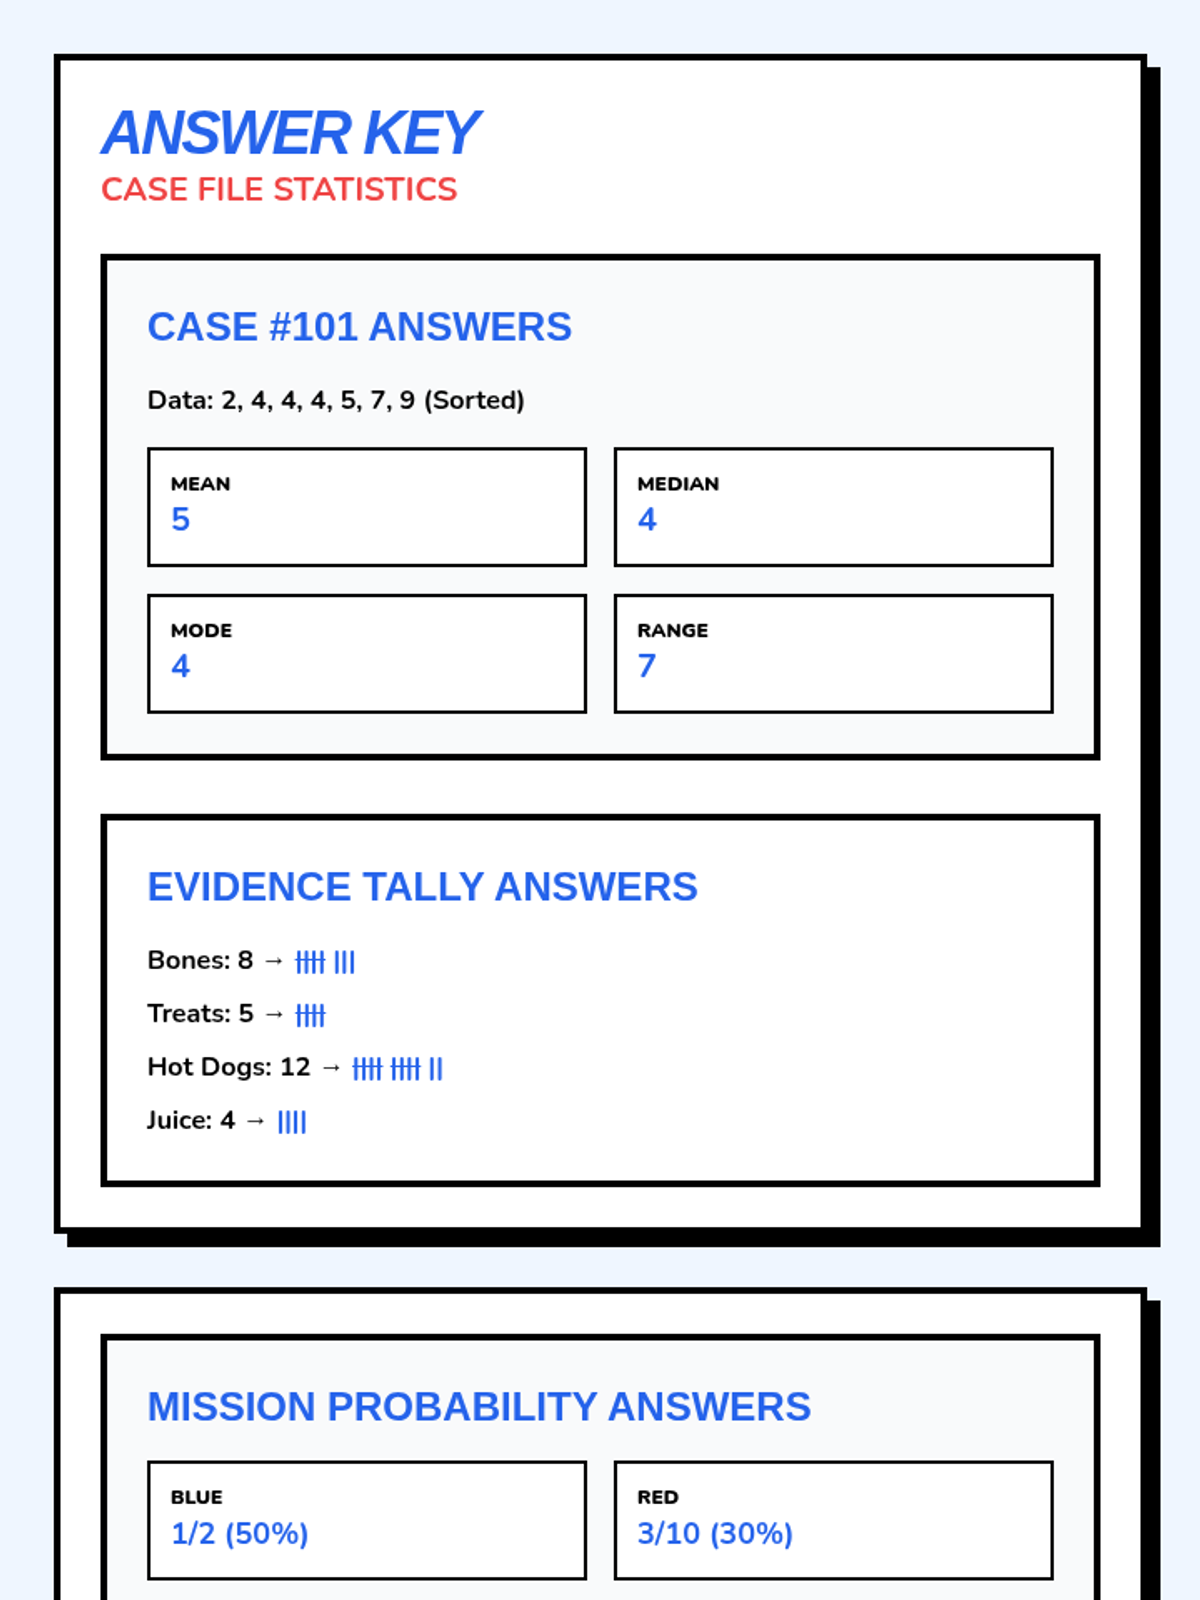
A statistics lesson themed around Dog Man, covering central tendency, data visualization, probability, and box plots using structured comic-style layouts.
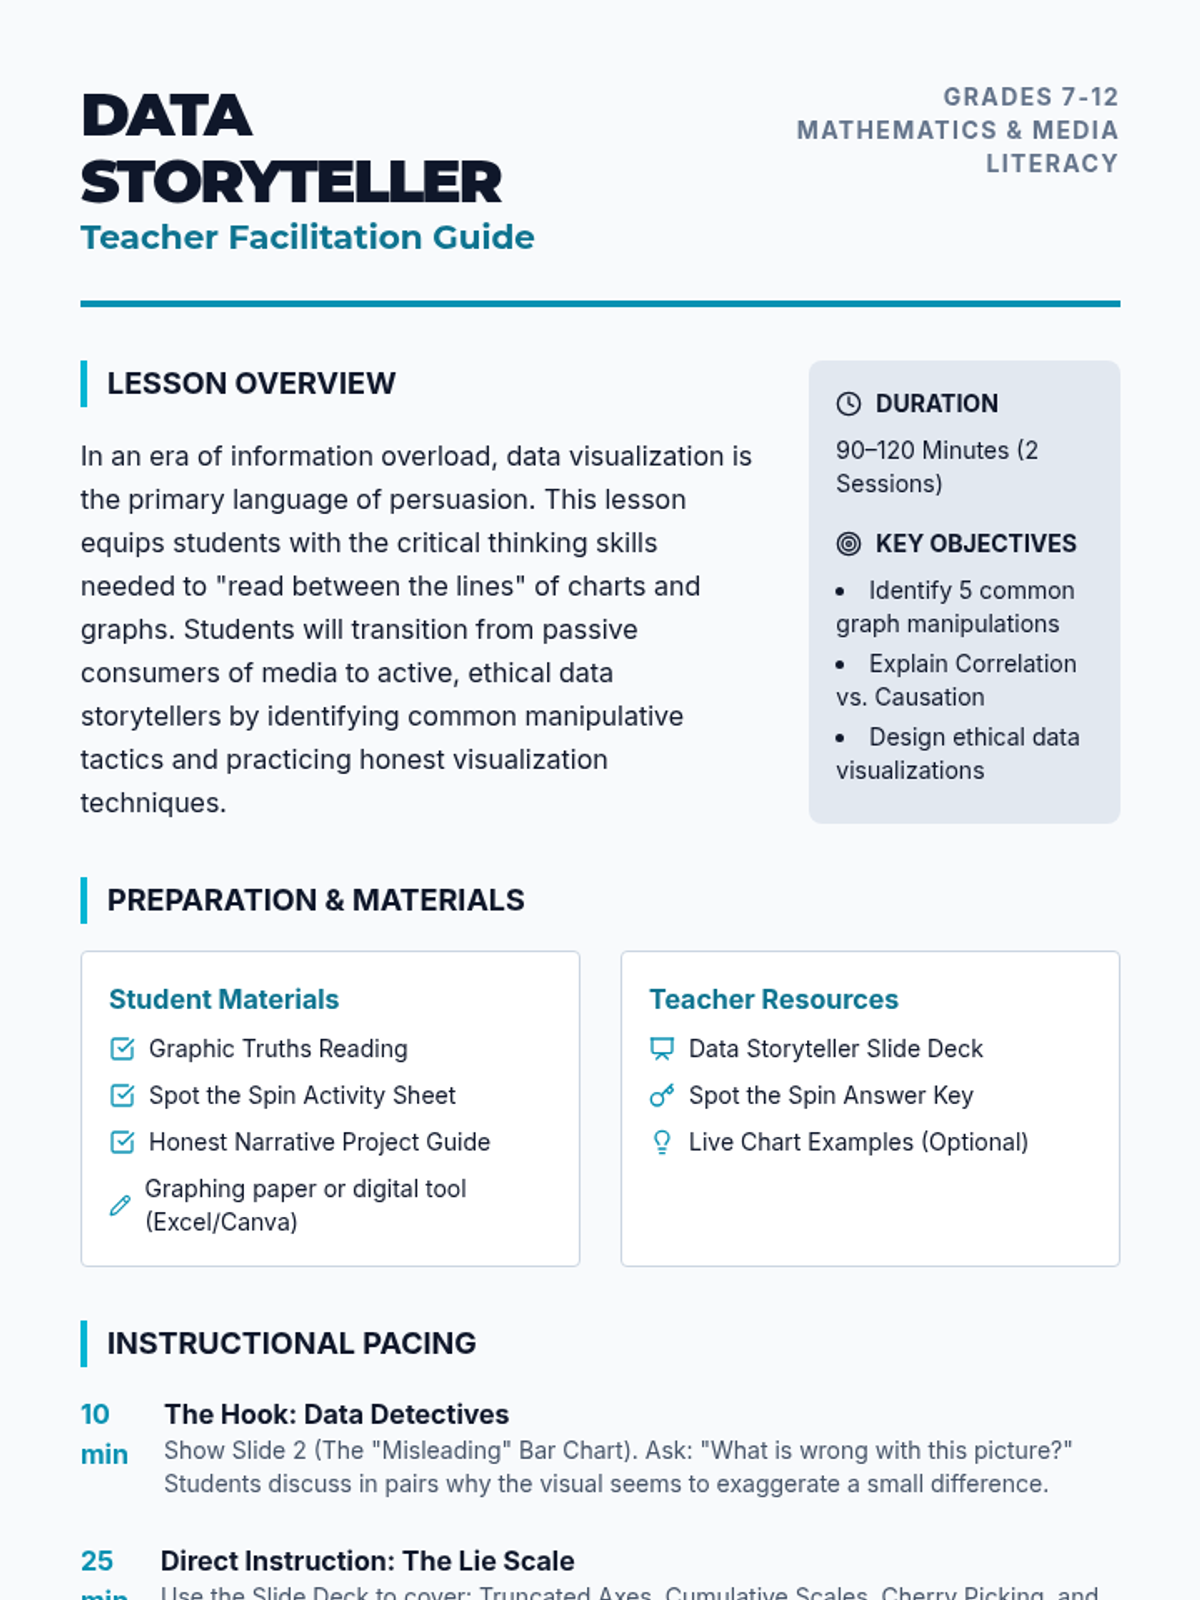
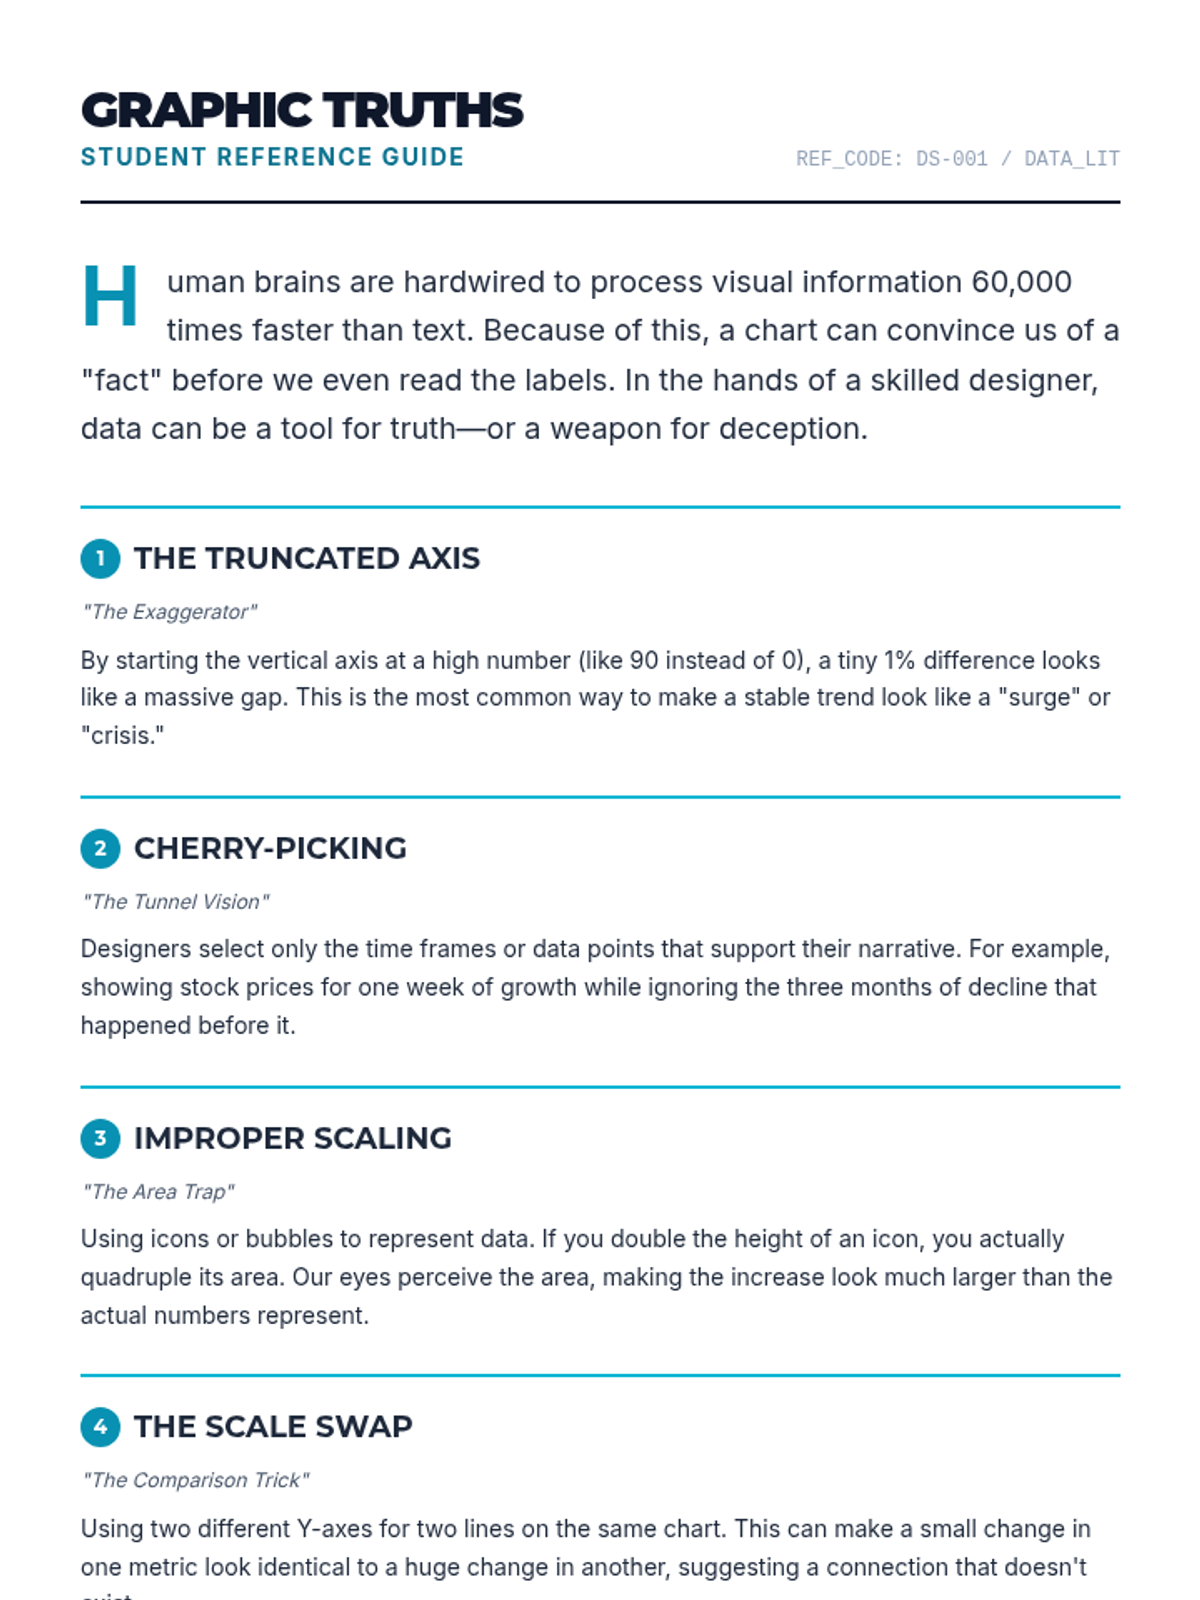
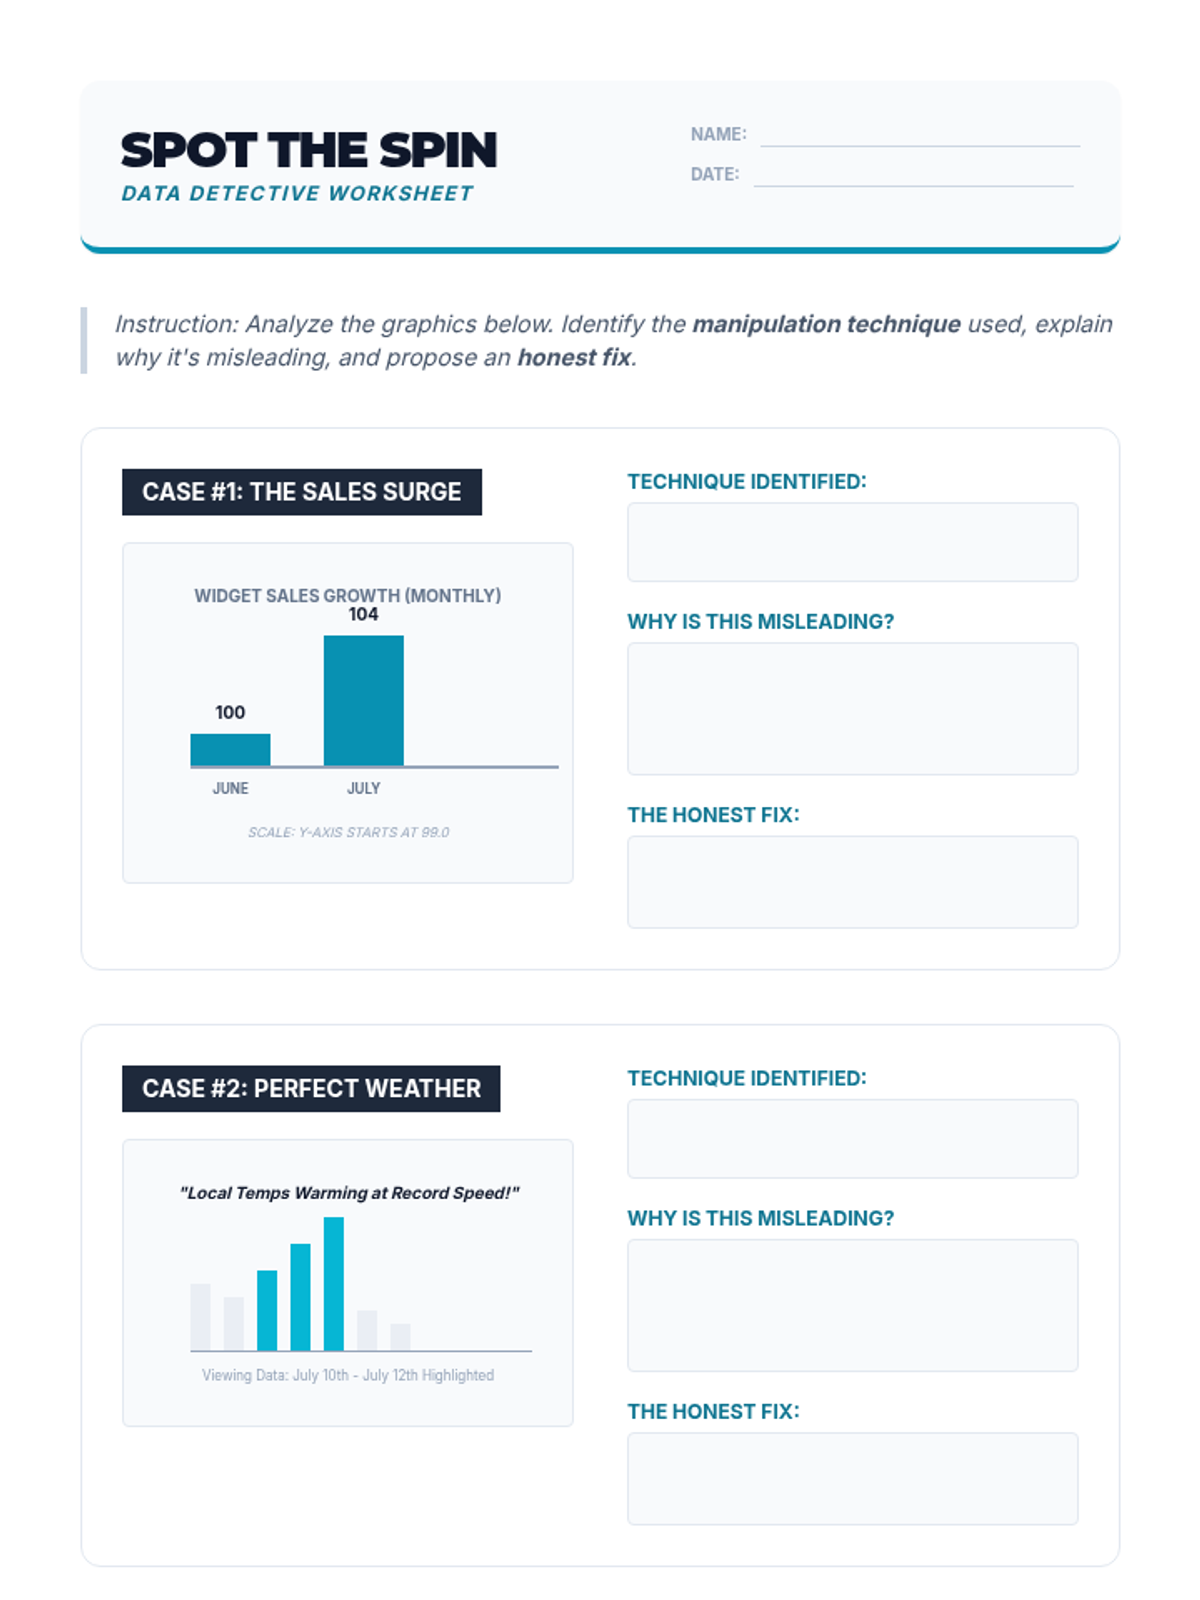
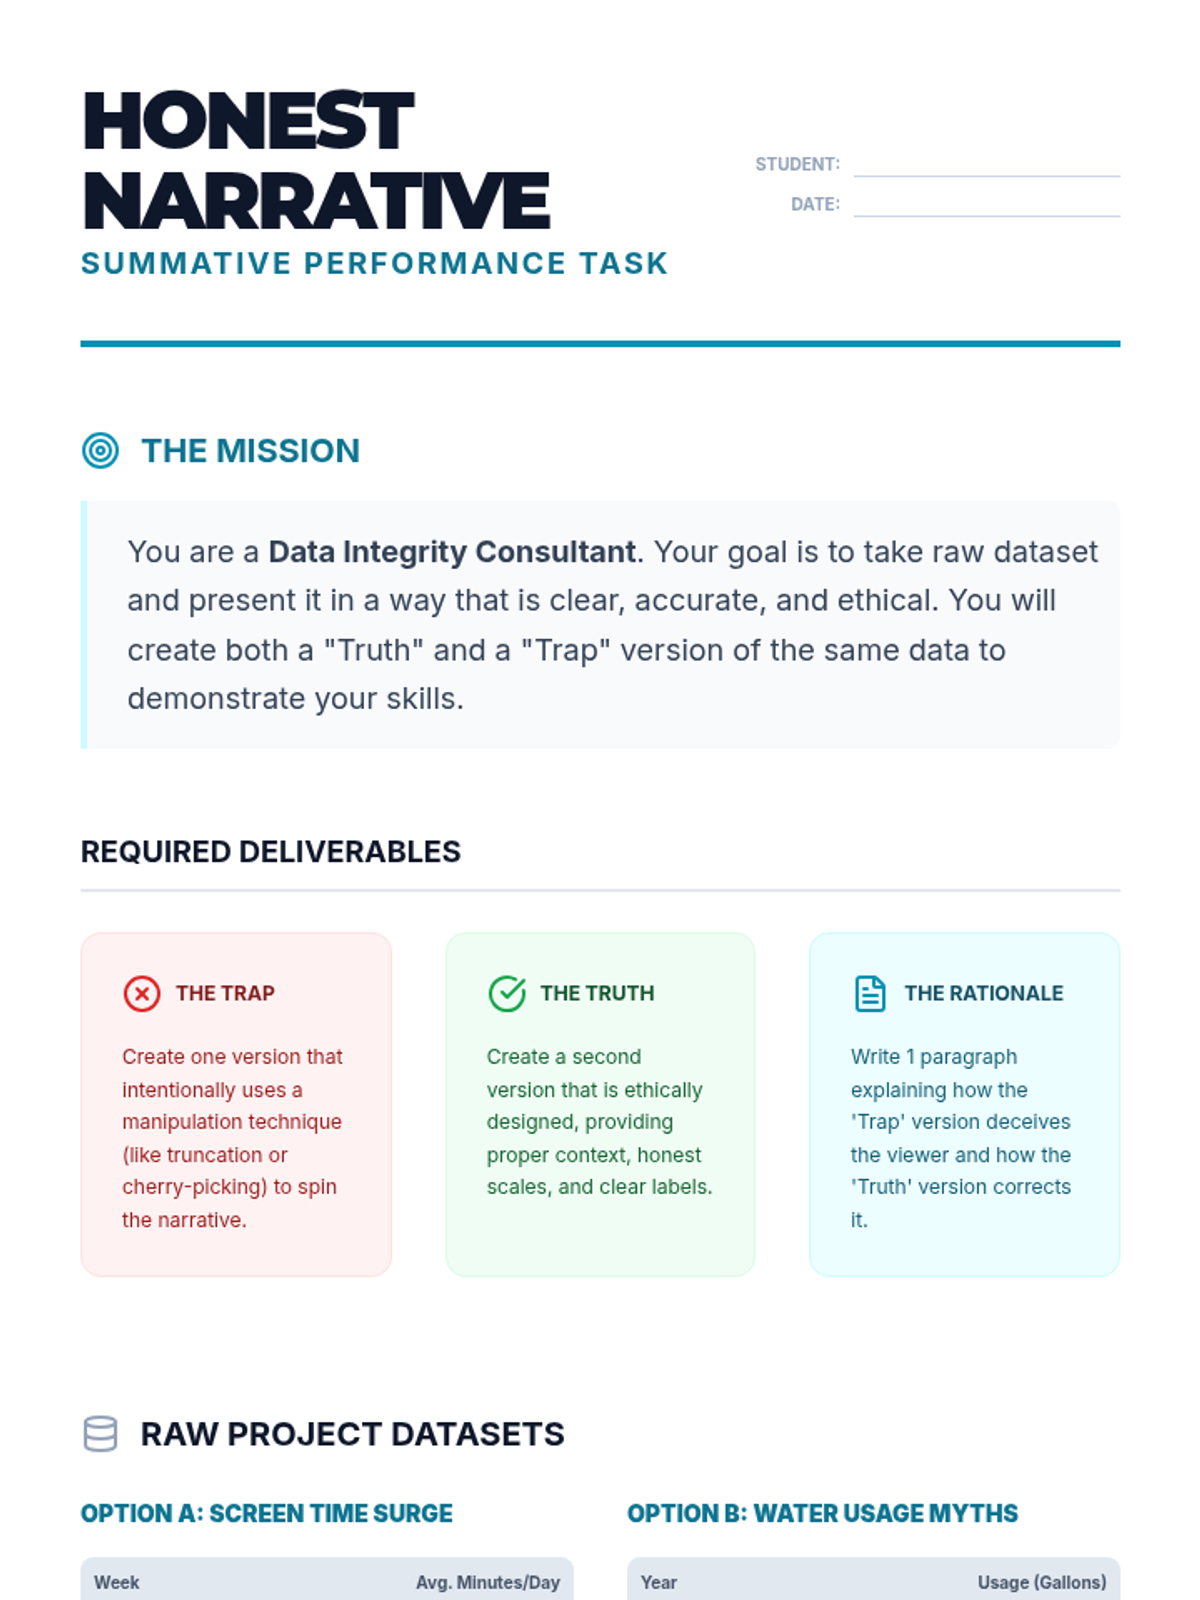
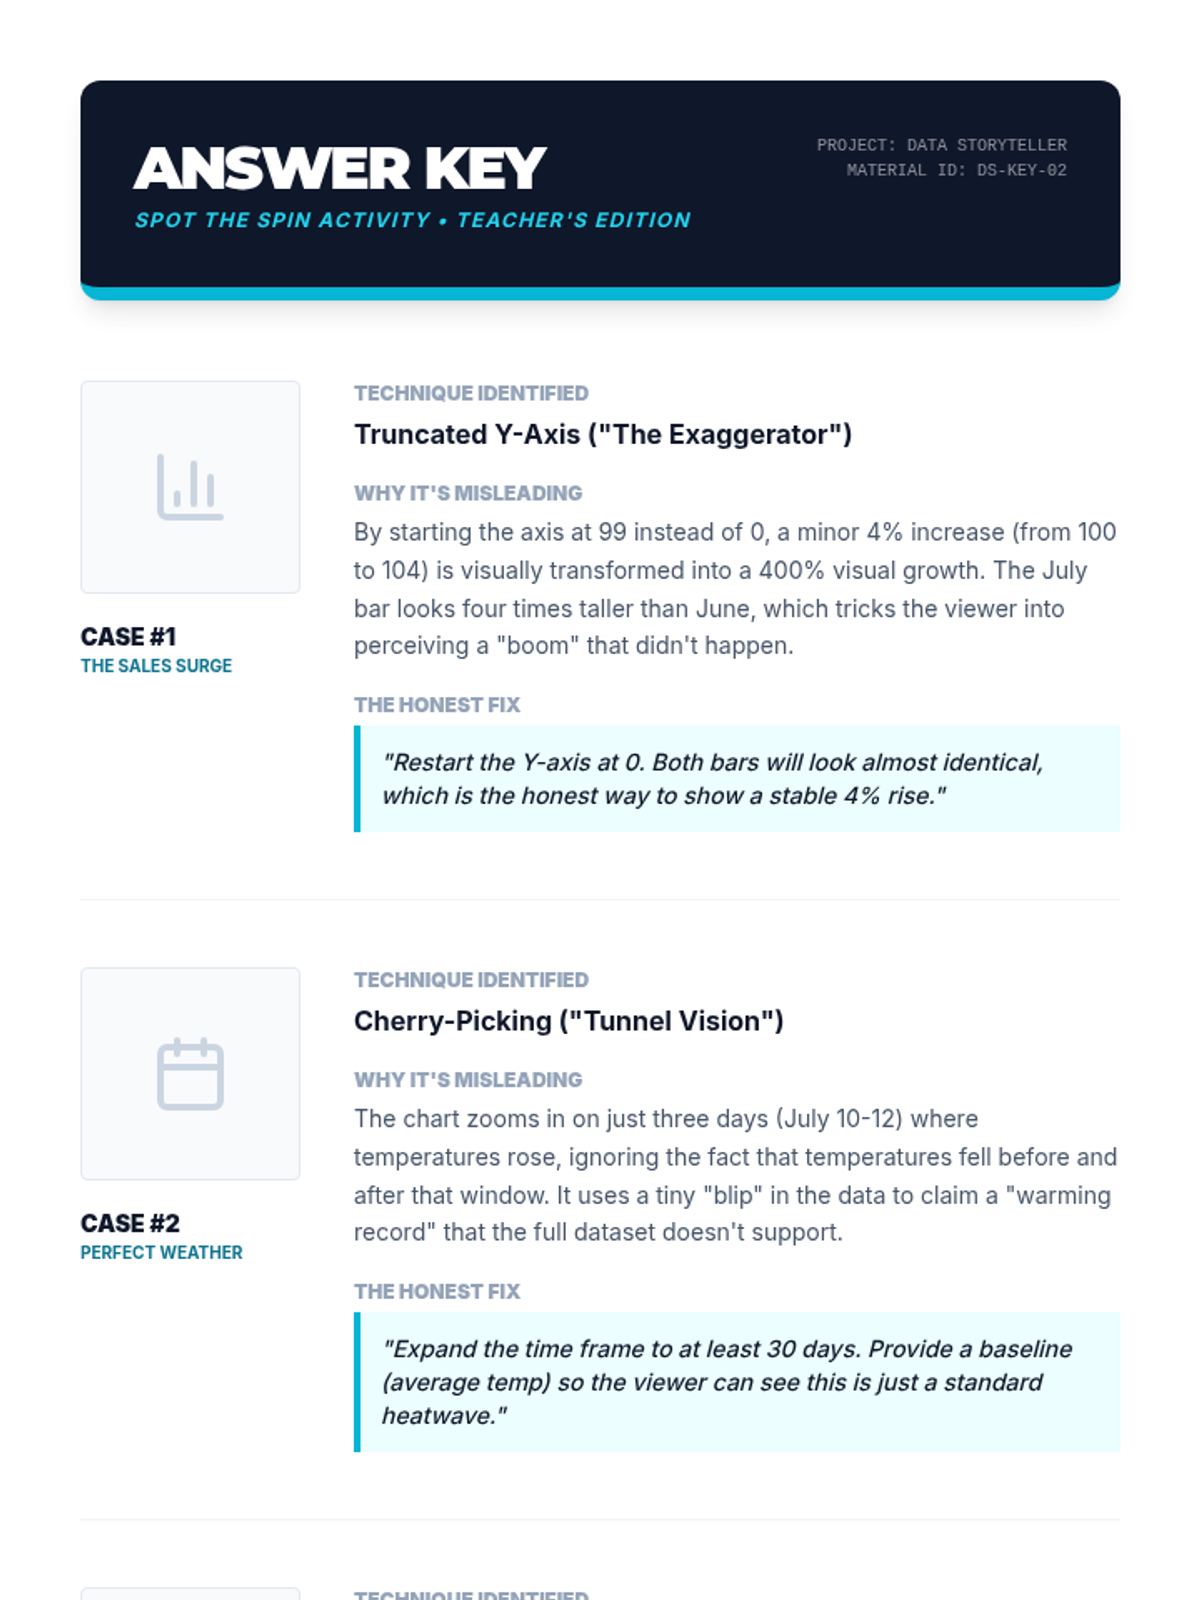
A comprehensive lesson for grades 7-12 focusing on data literacy, ethical visualization, and identifying misleading statistics in media. Students learn to decode 'chartjunk' and create their own honest data stories.
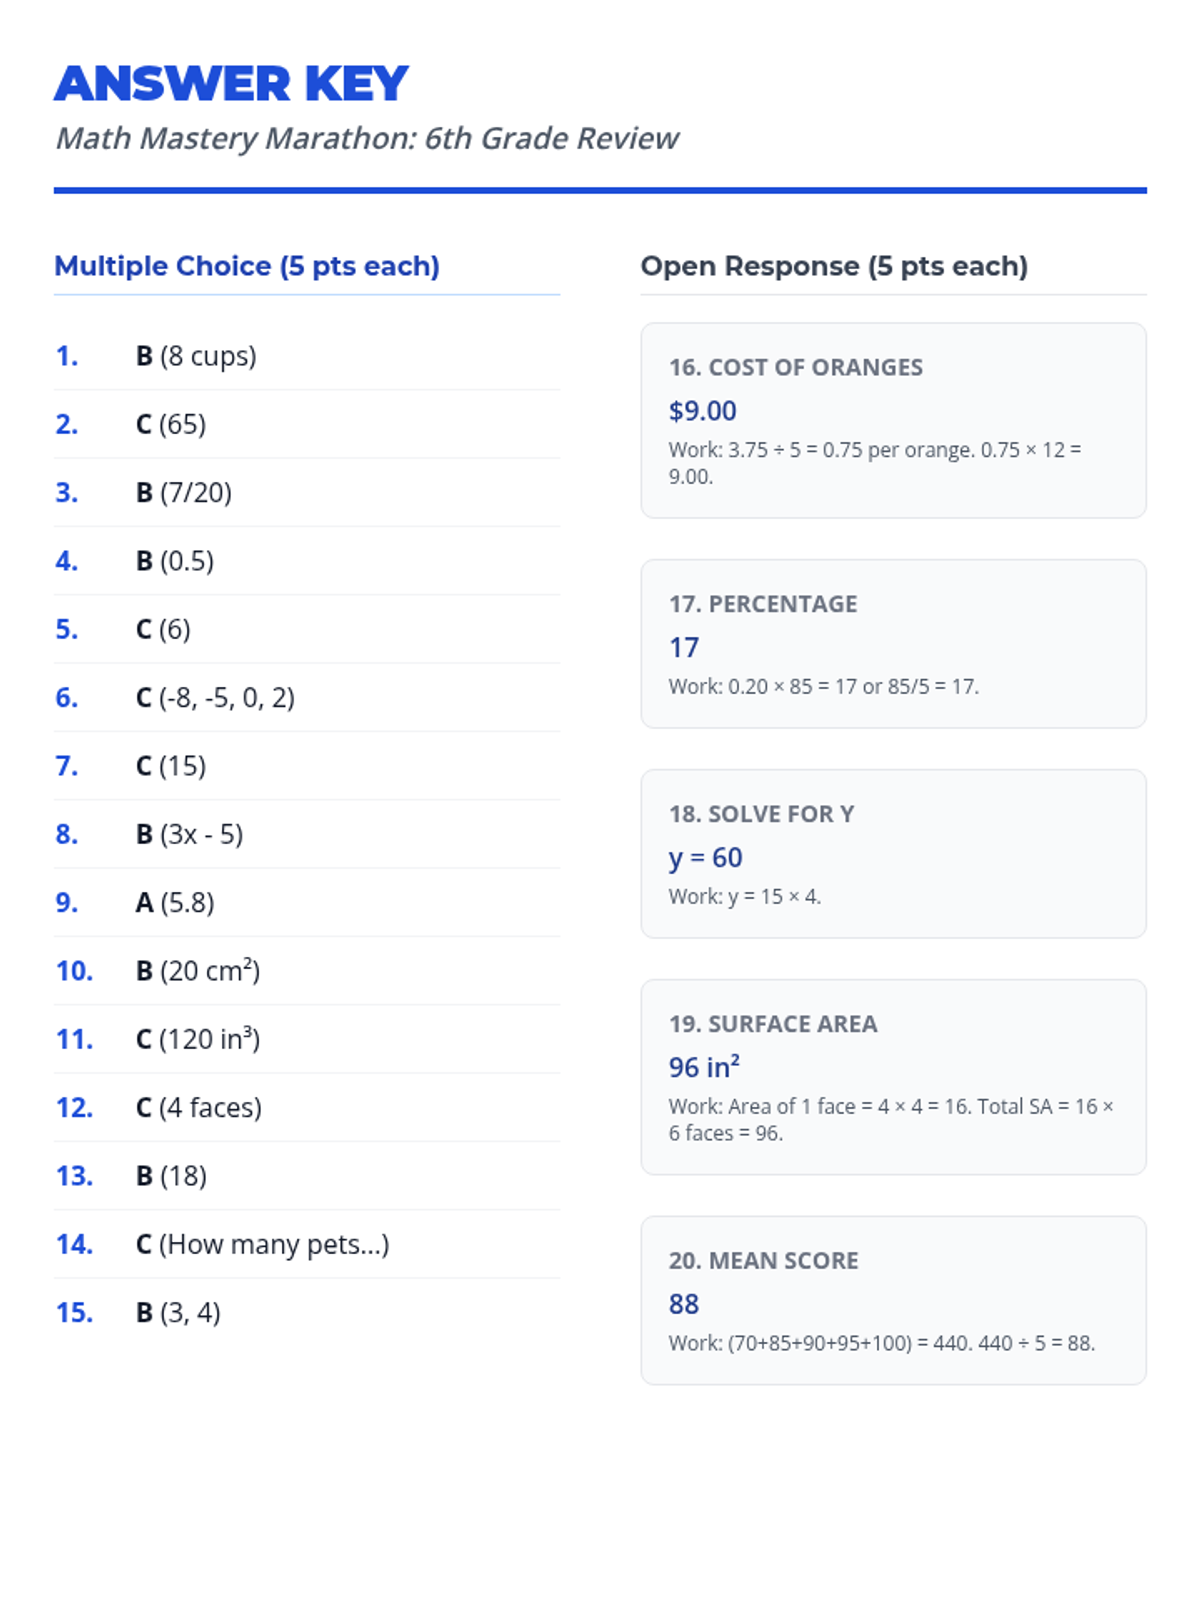
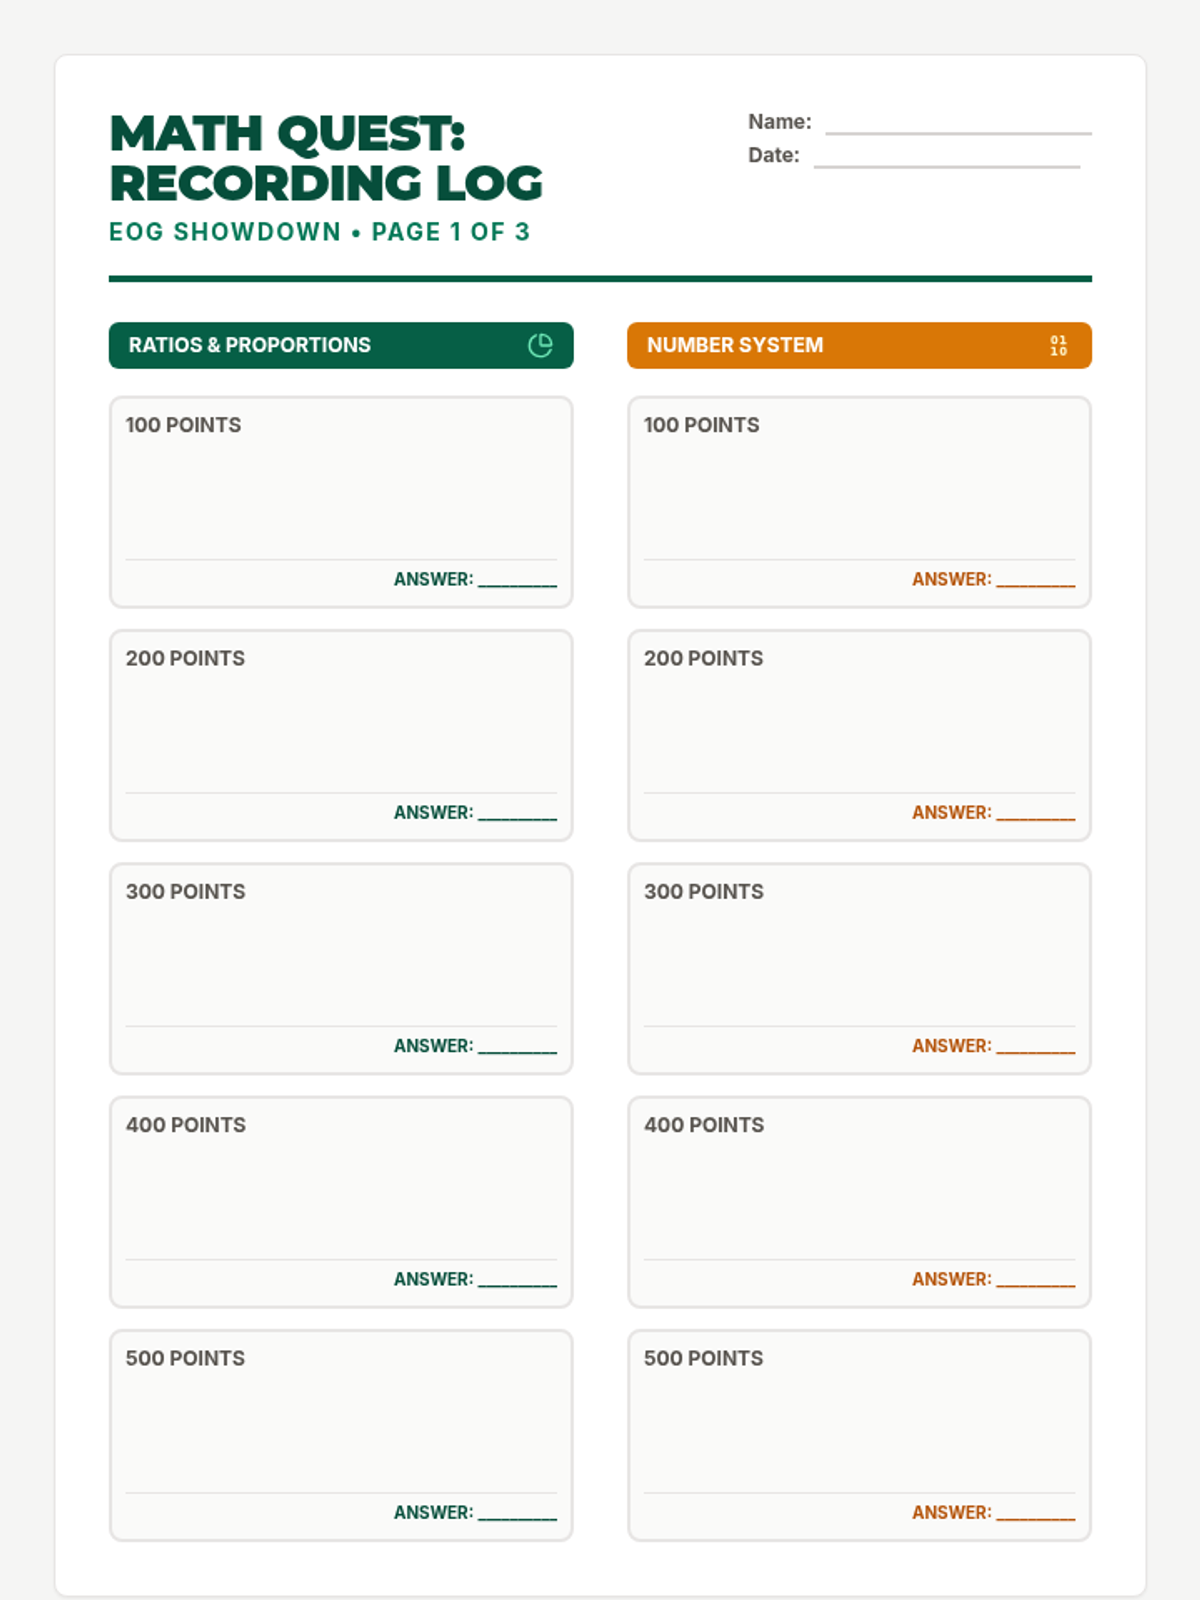
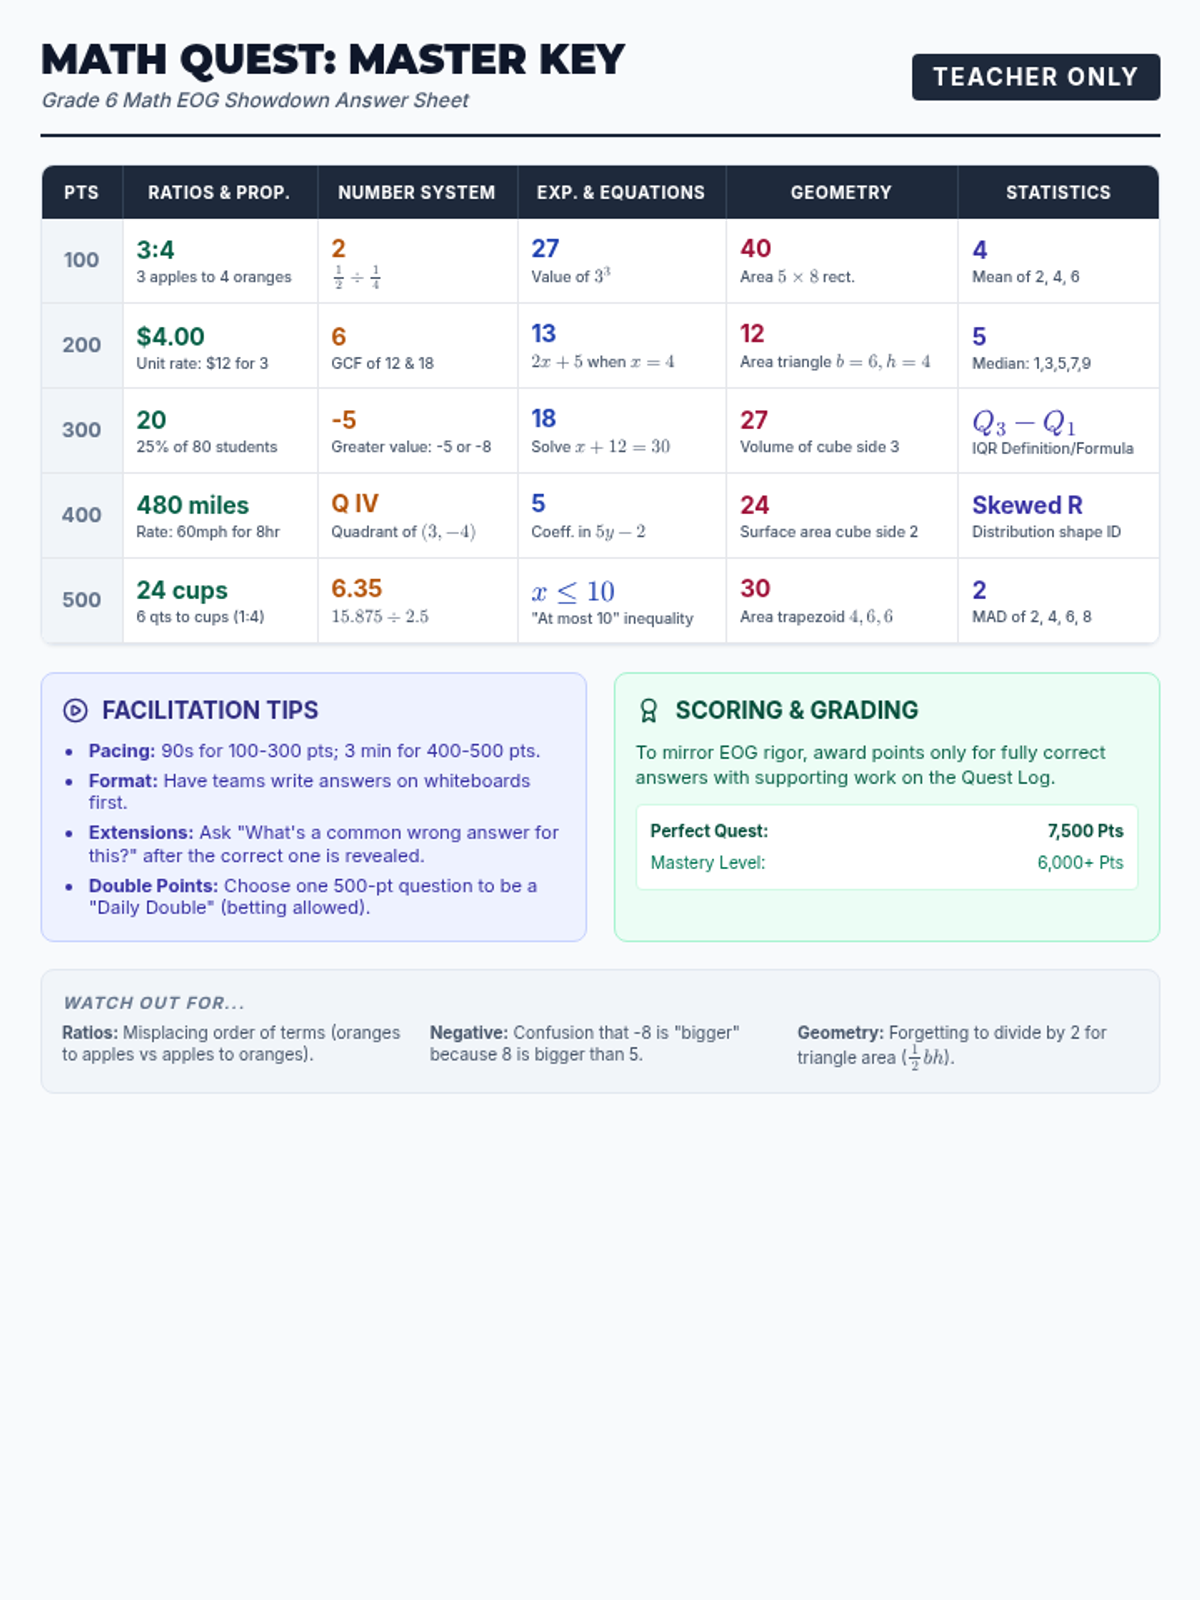
A comprehensive 6th-grade math cumulative review packet covering ratios, number systems, expressions, equations, geometry, and statistics.
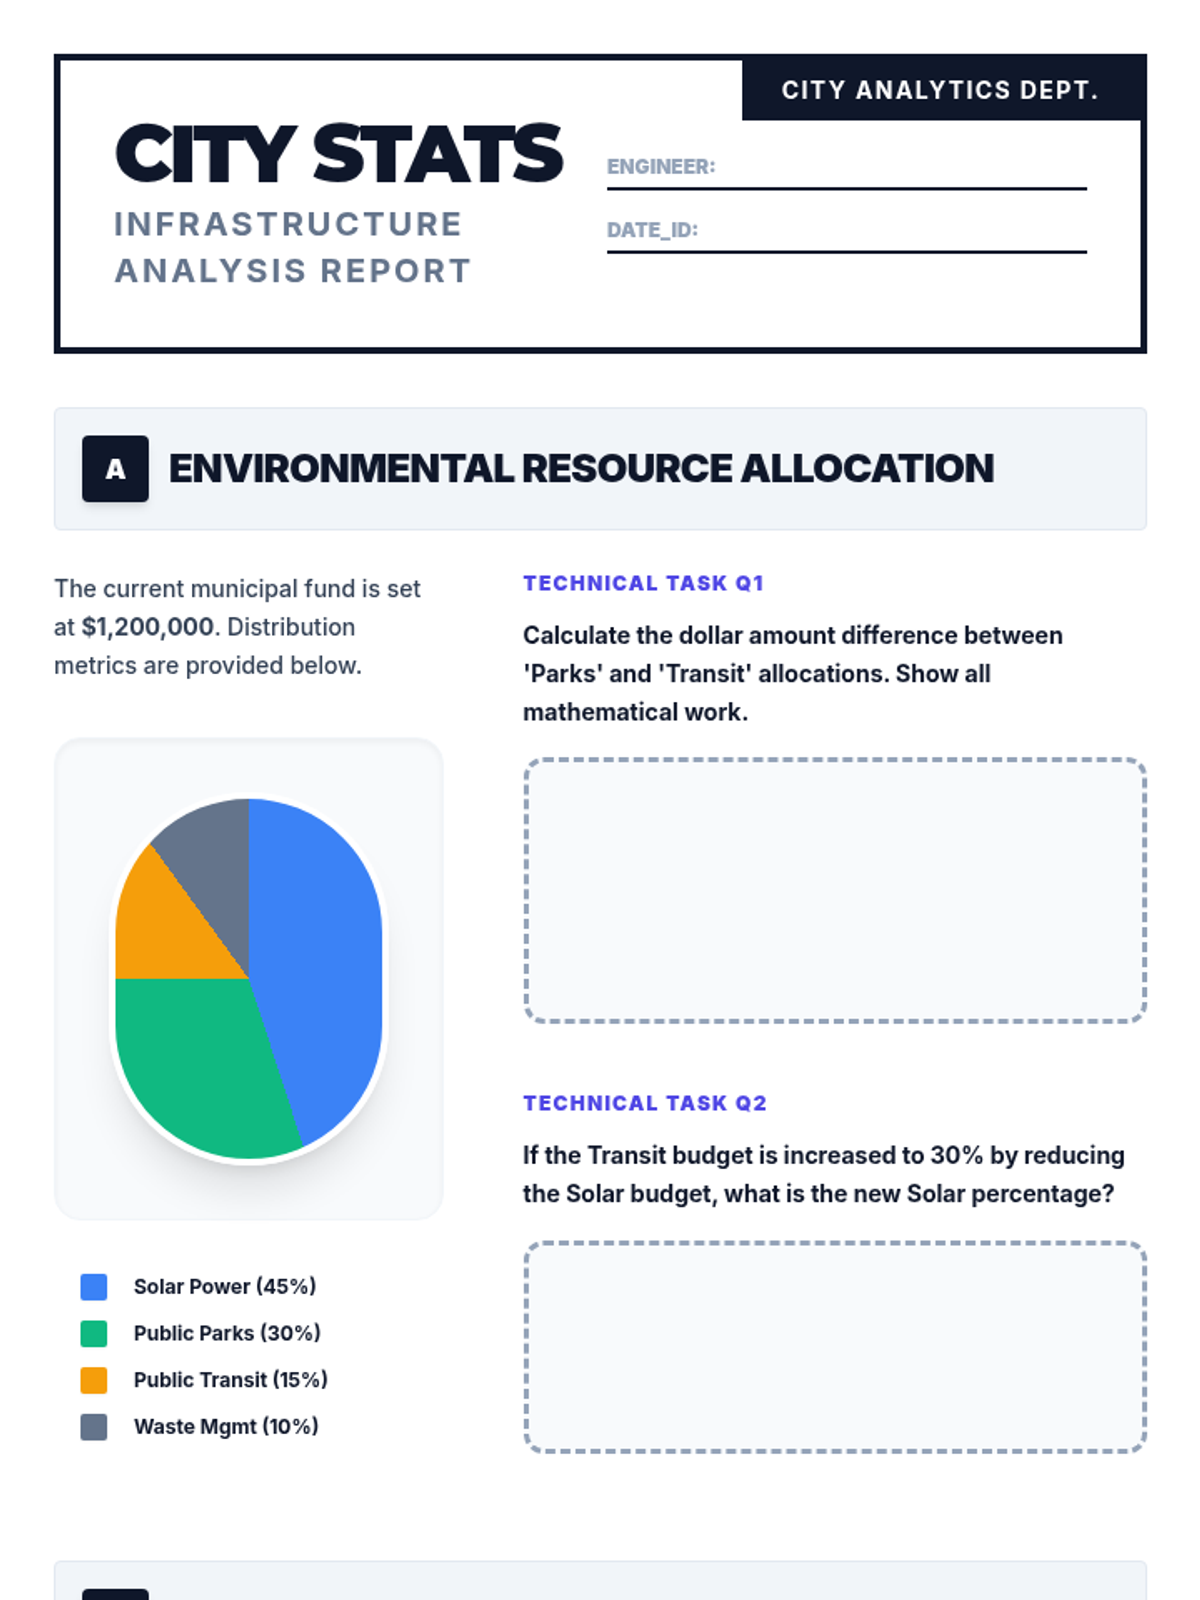
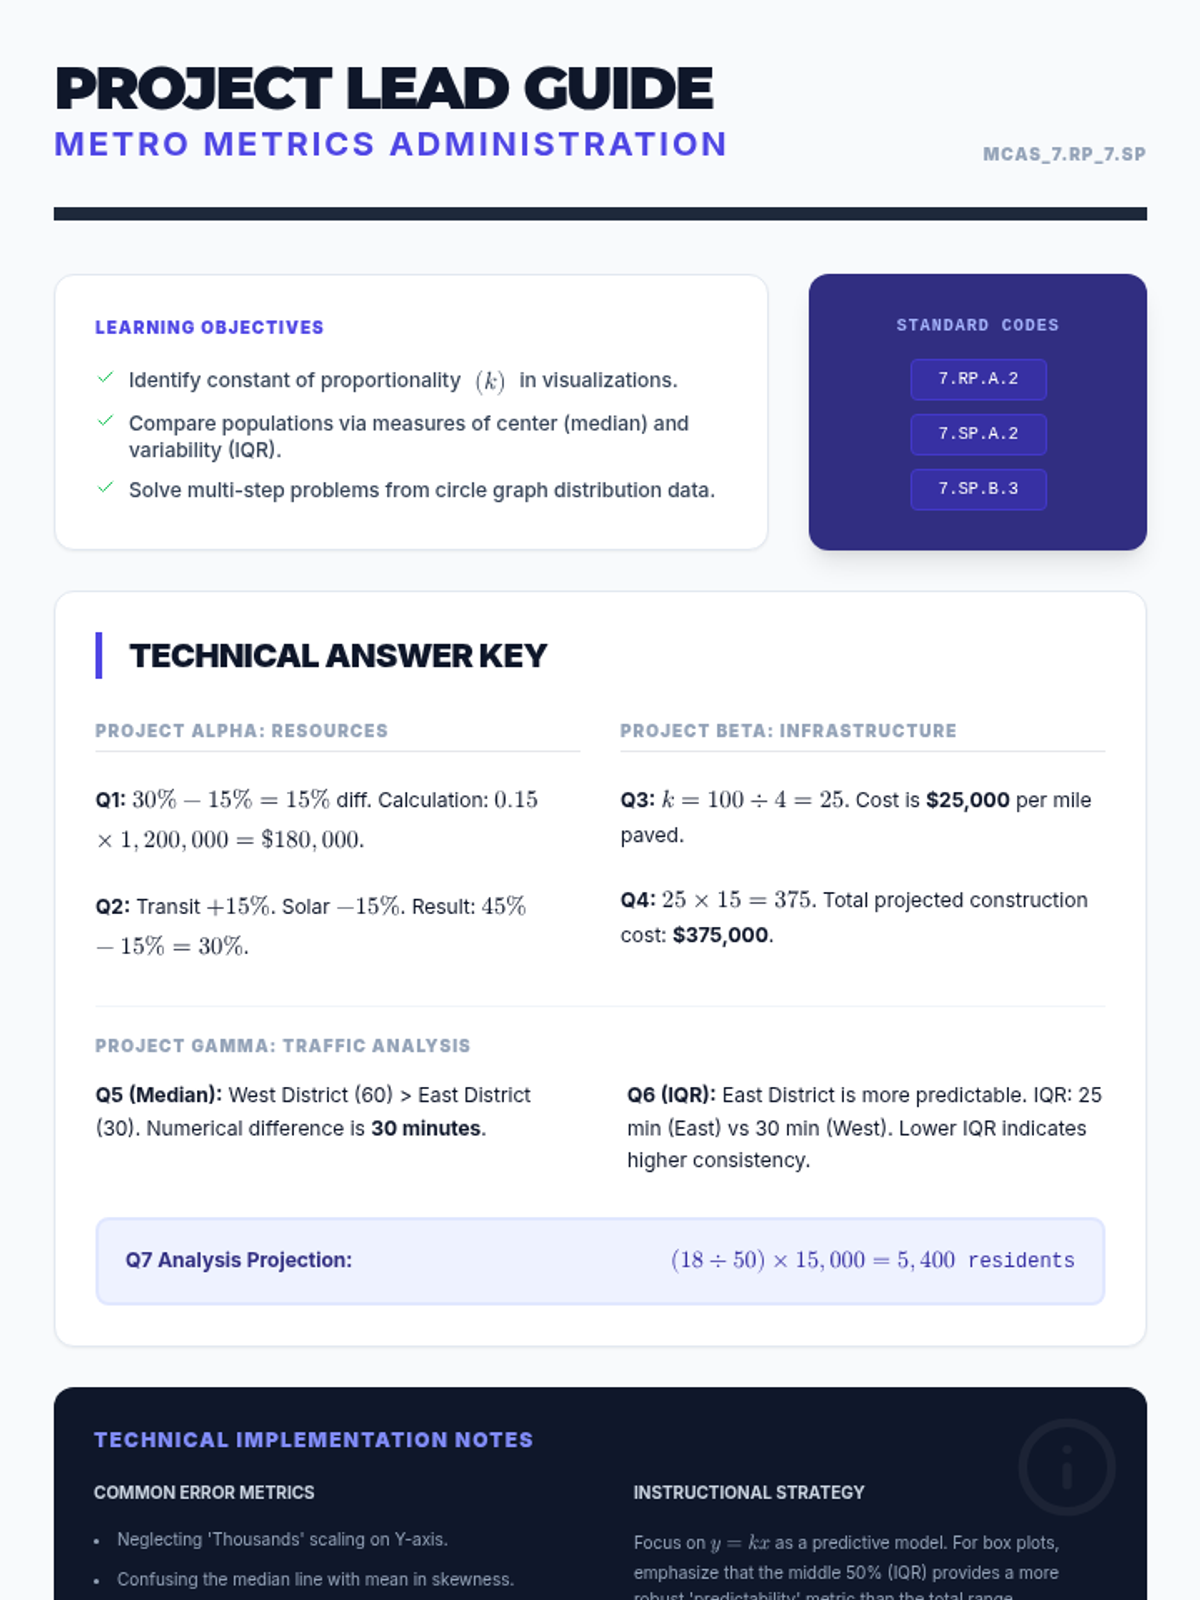
A comprehensive lesson on interpreting circle graphs, box plots, and proportional relationships within a City Engineering context, focused on 7th grade MCAS standards.
A lesson focused on measuring lengths in inches using fractions (halves and fourths) and representing that data on line plots.
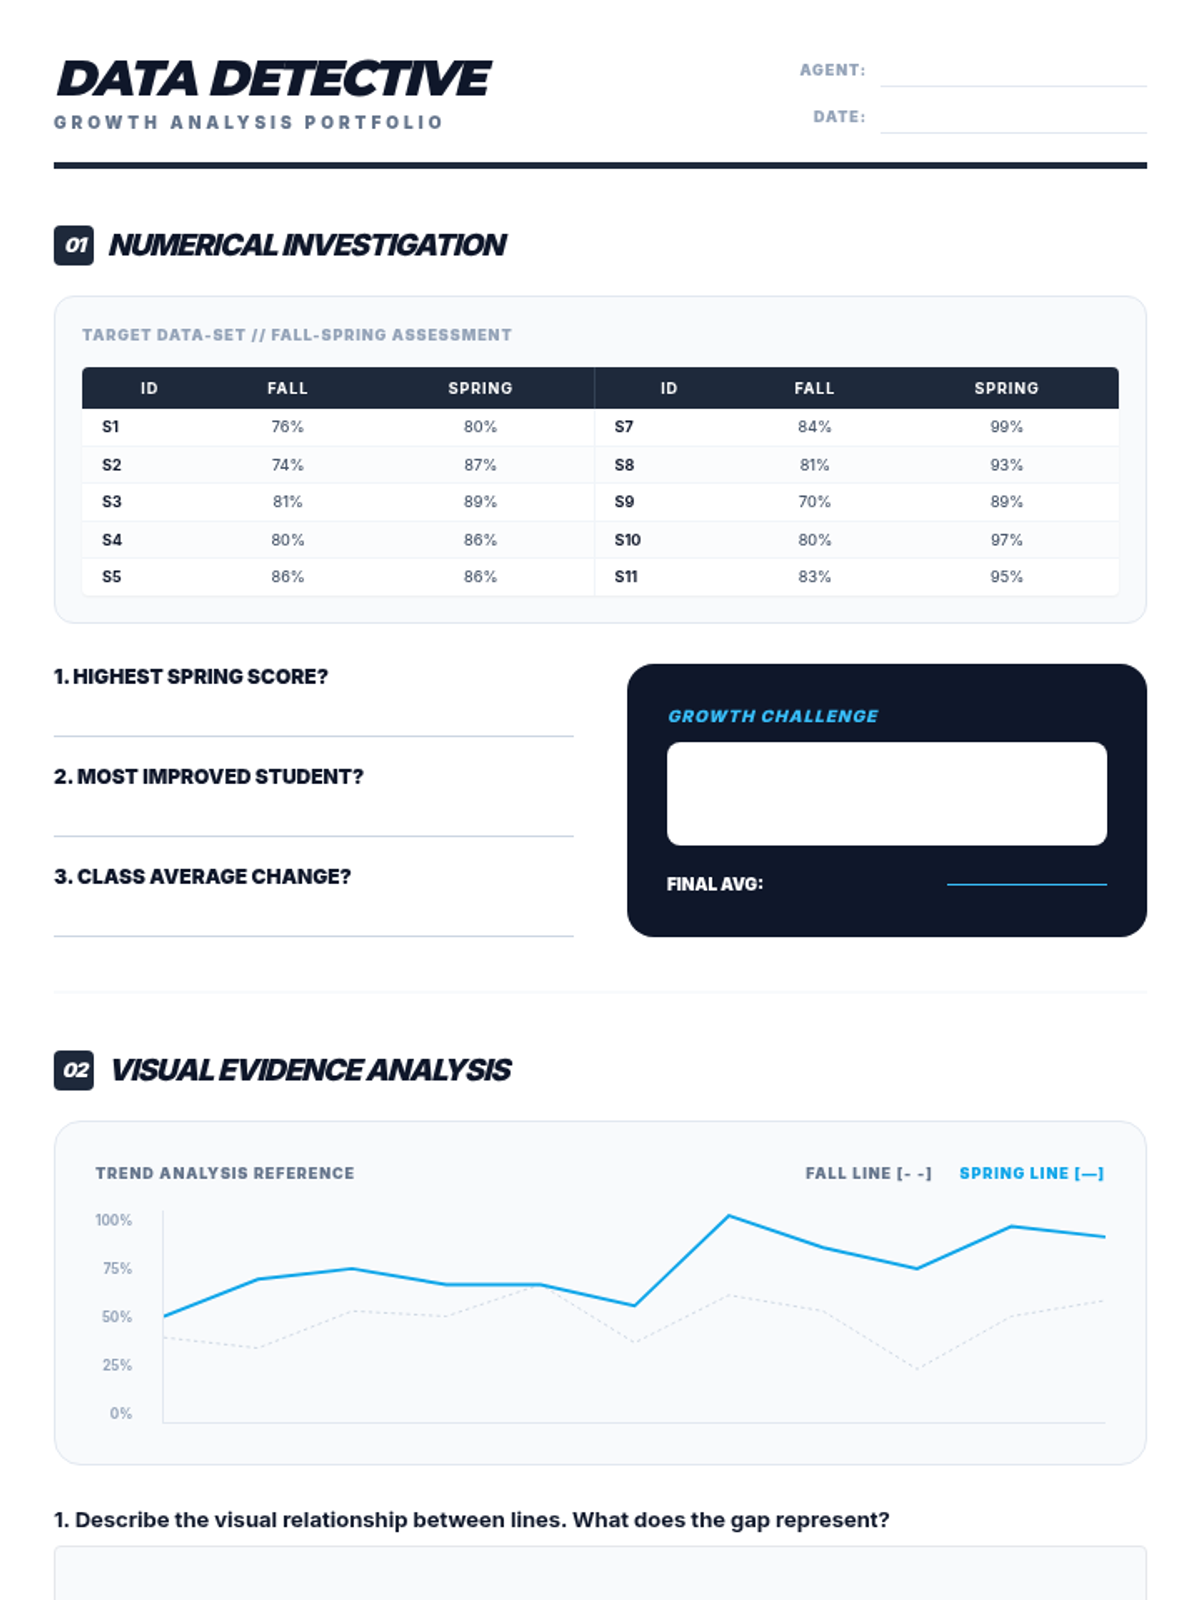
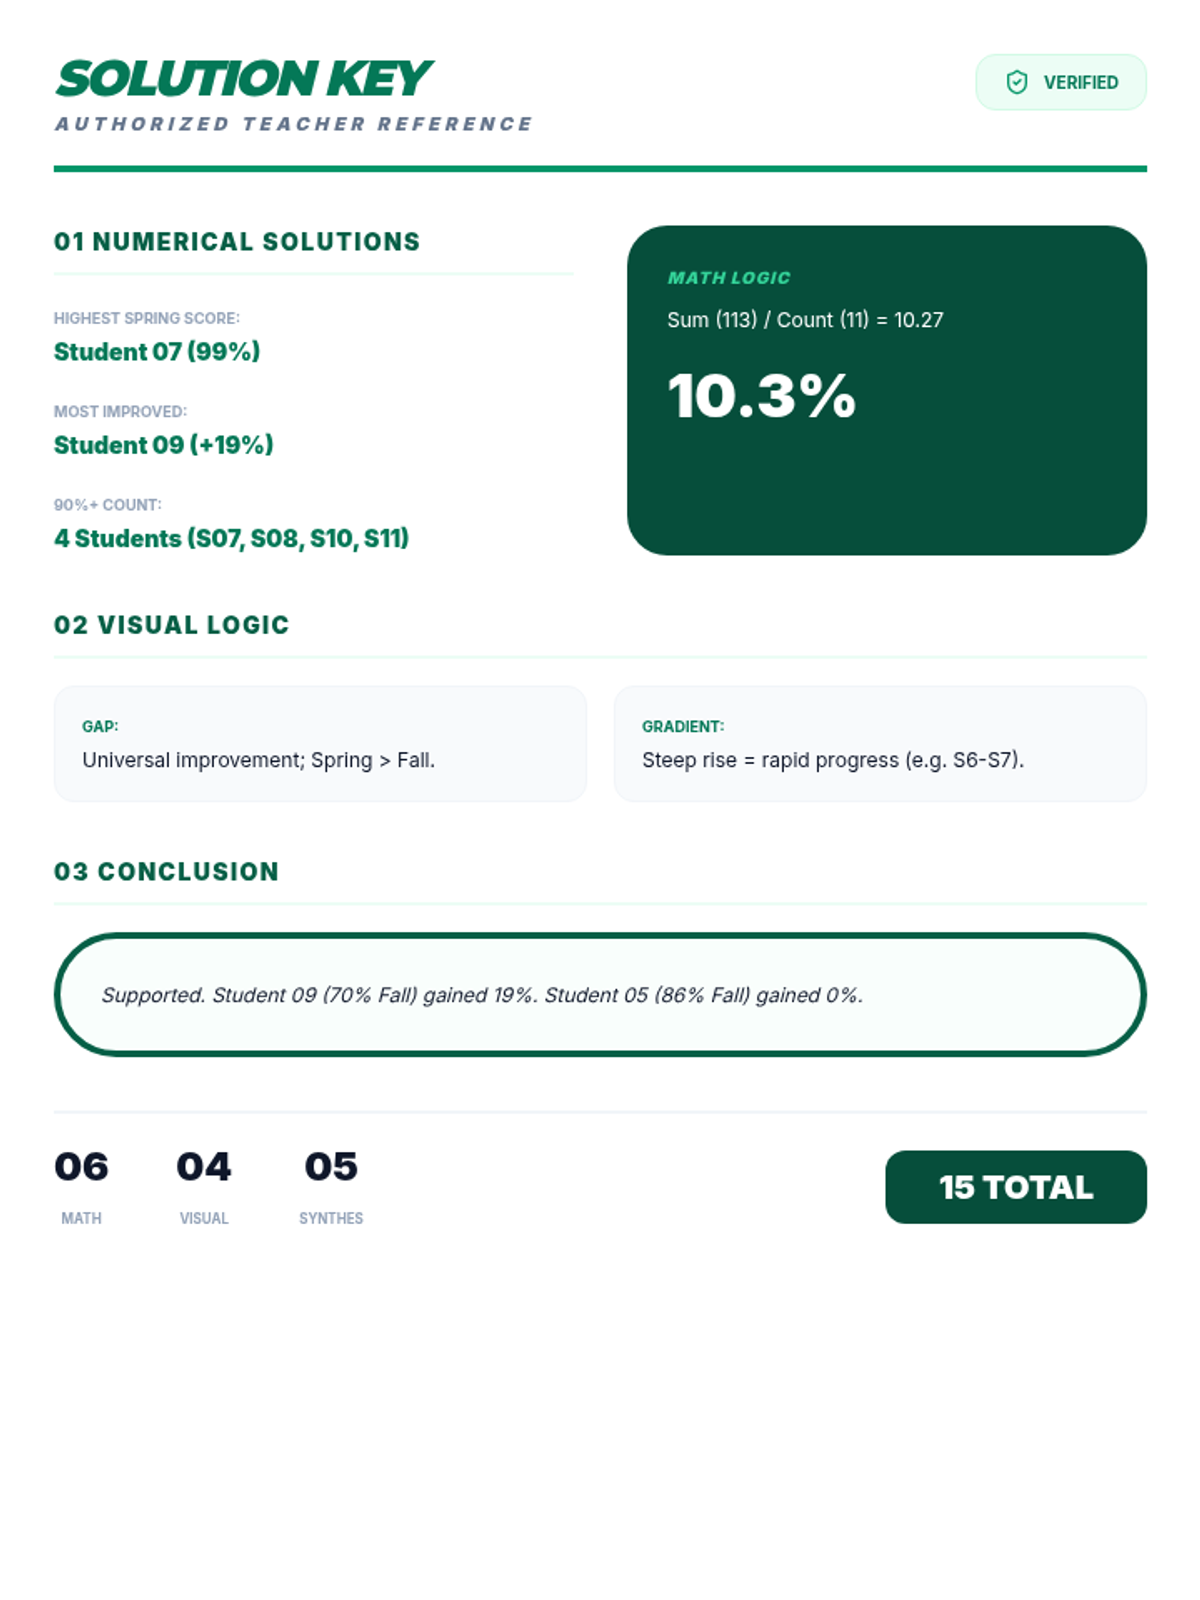
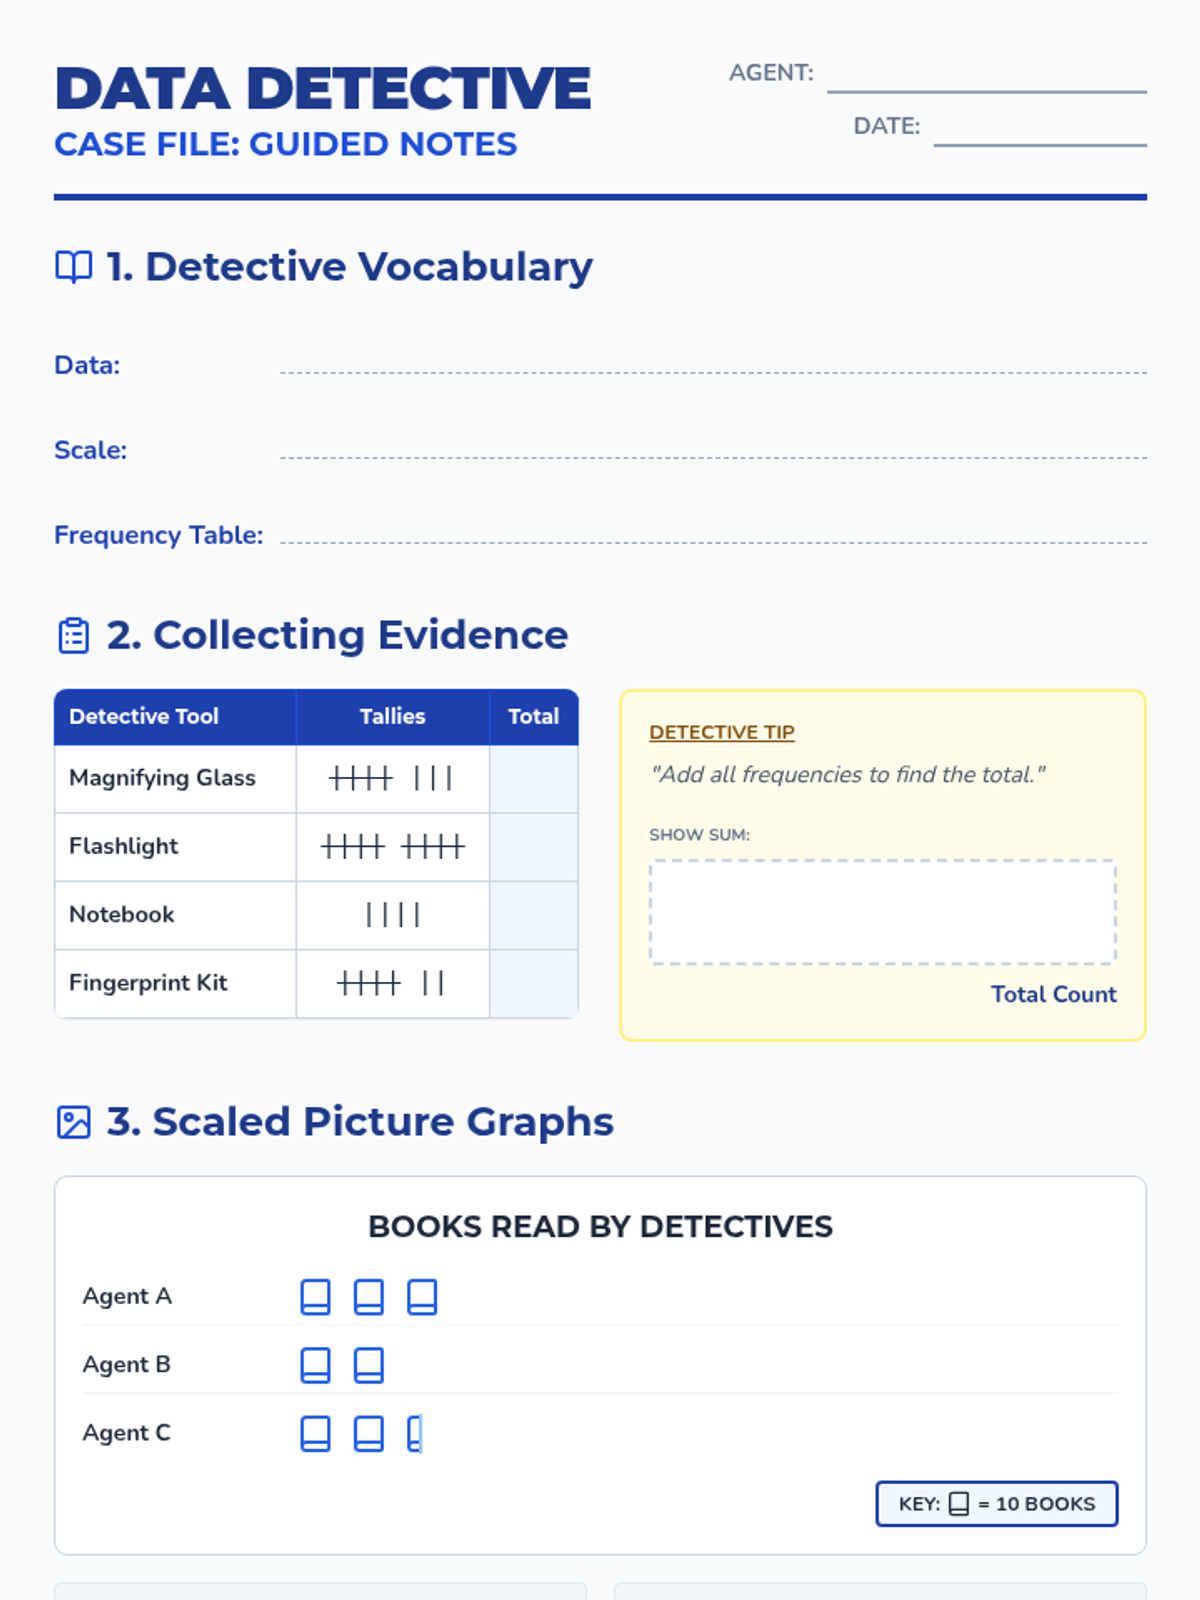
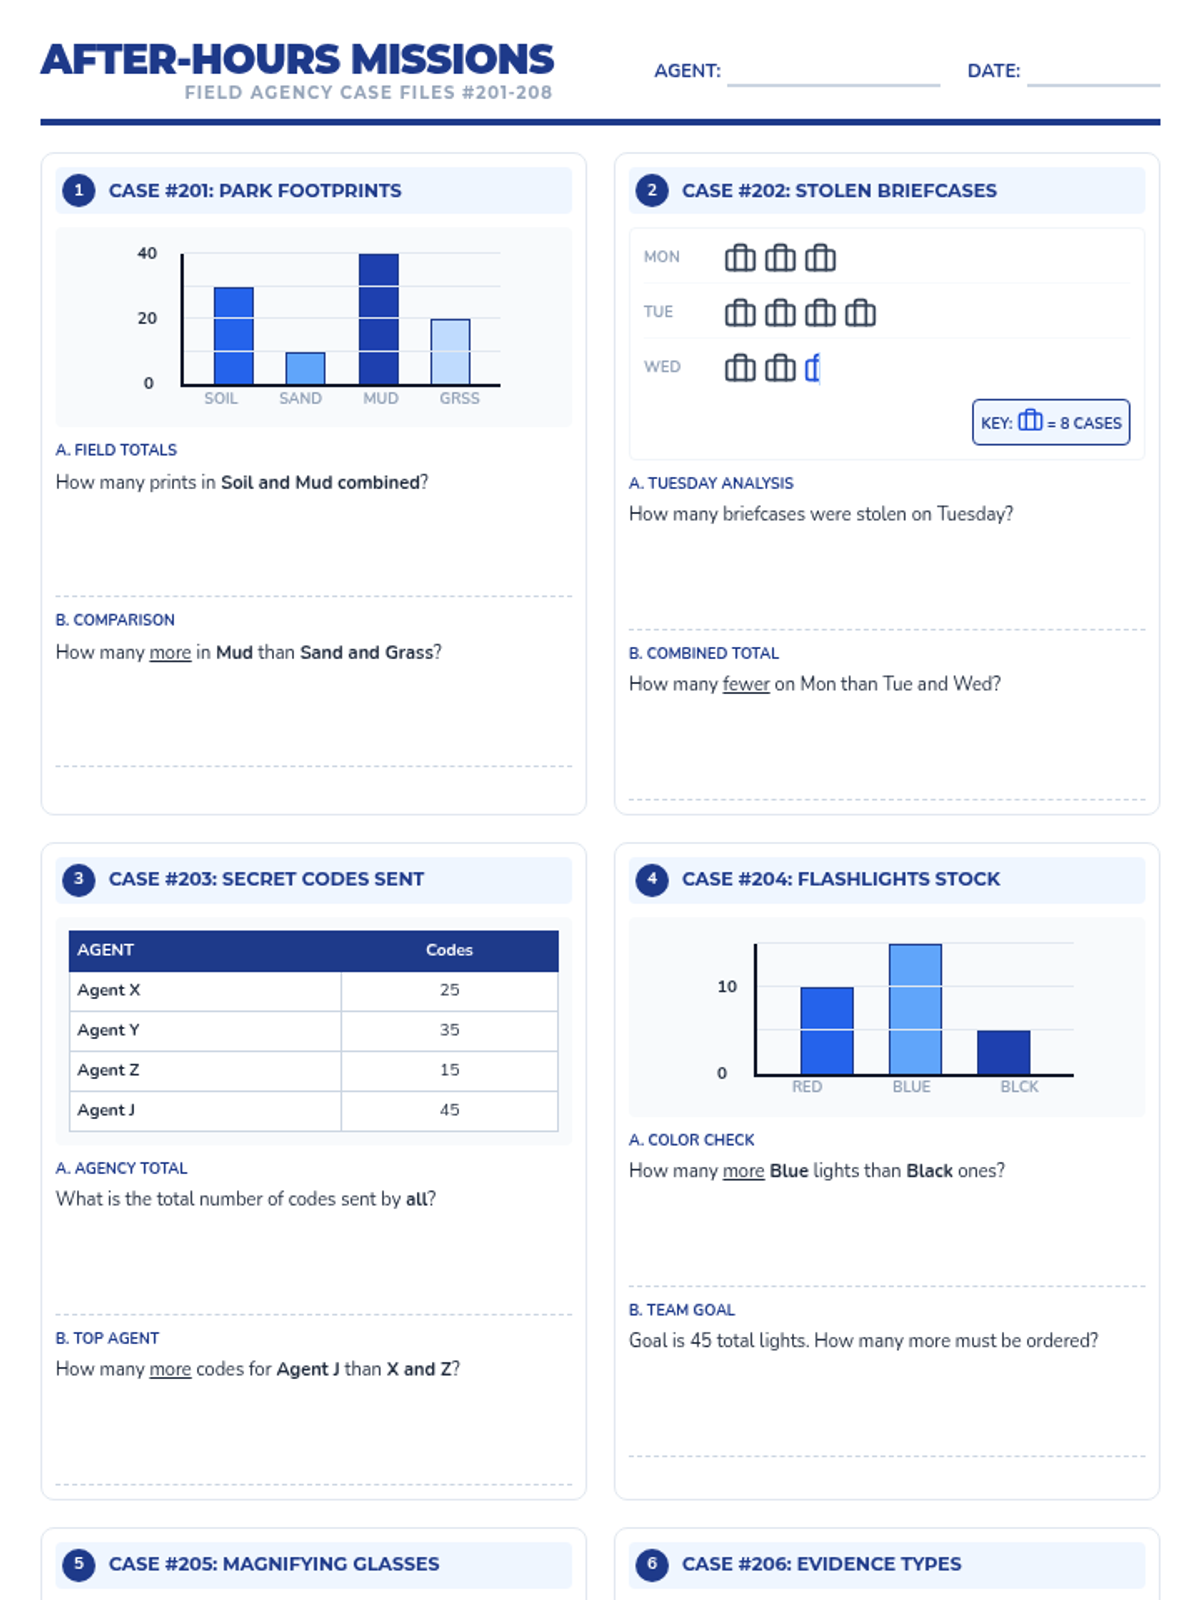
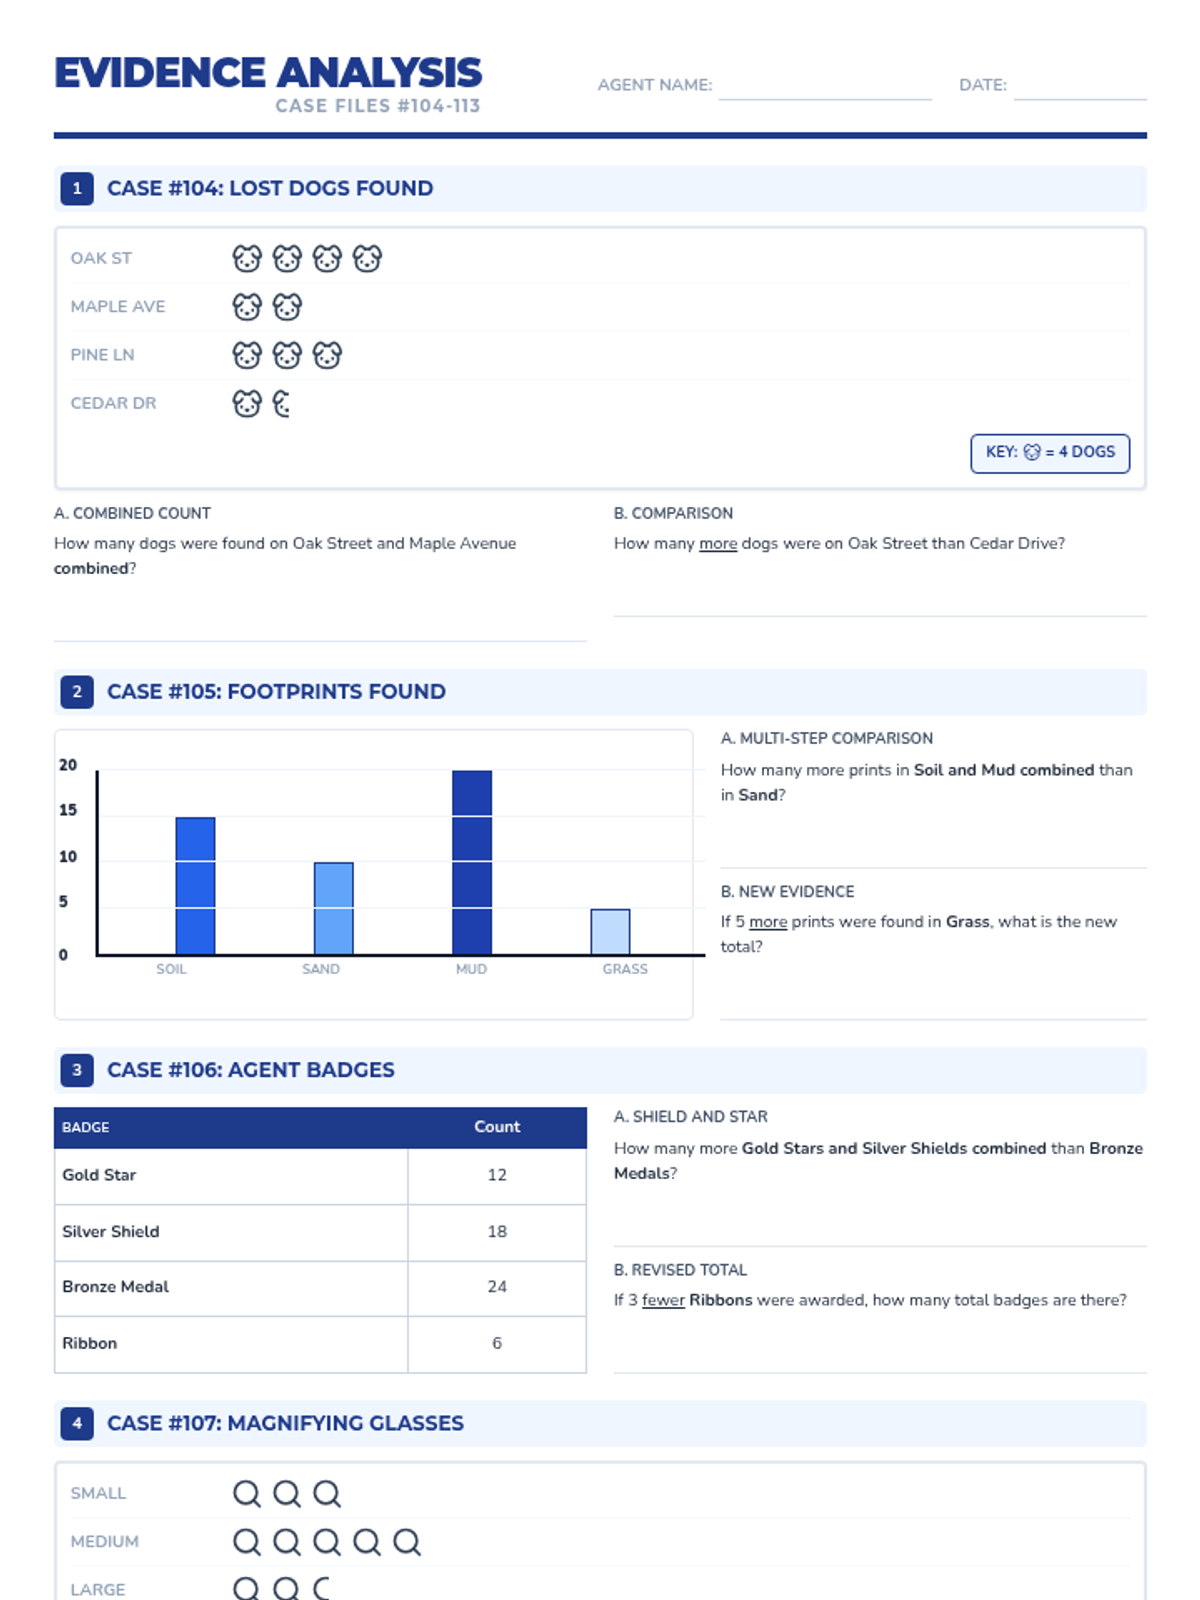
A comprehensive lesson on representing and interpreting scaled graphs, where students become 'Data Detectives' to collect, graph, and analyze information.
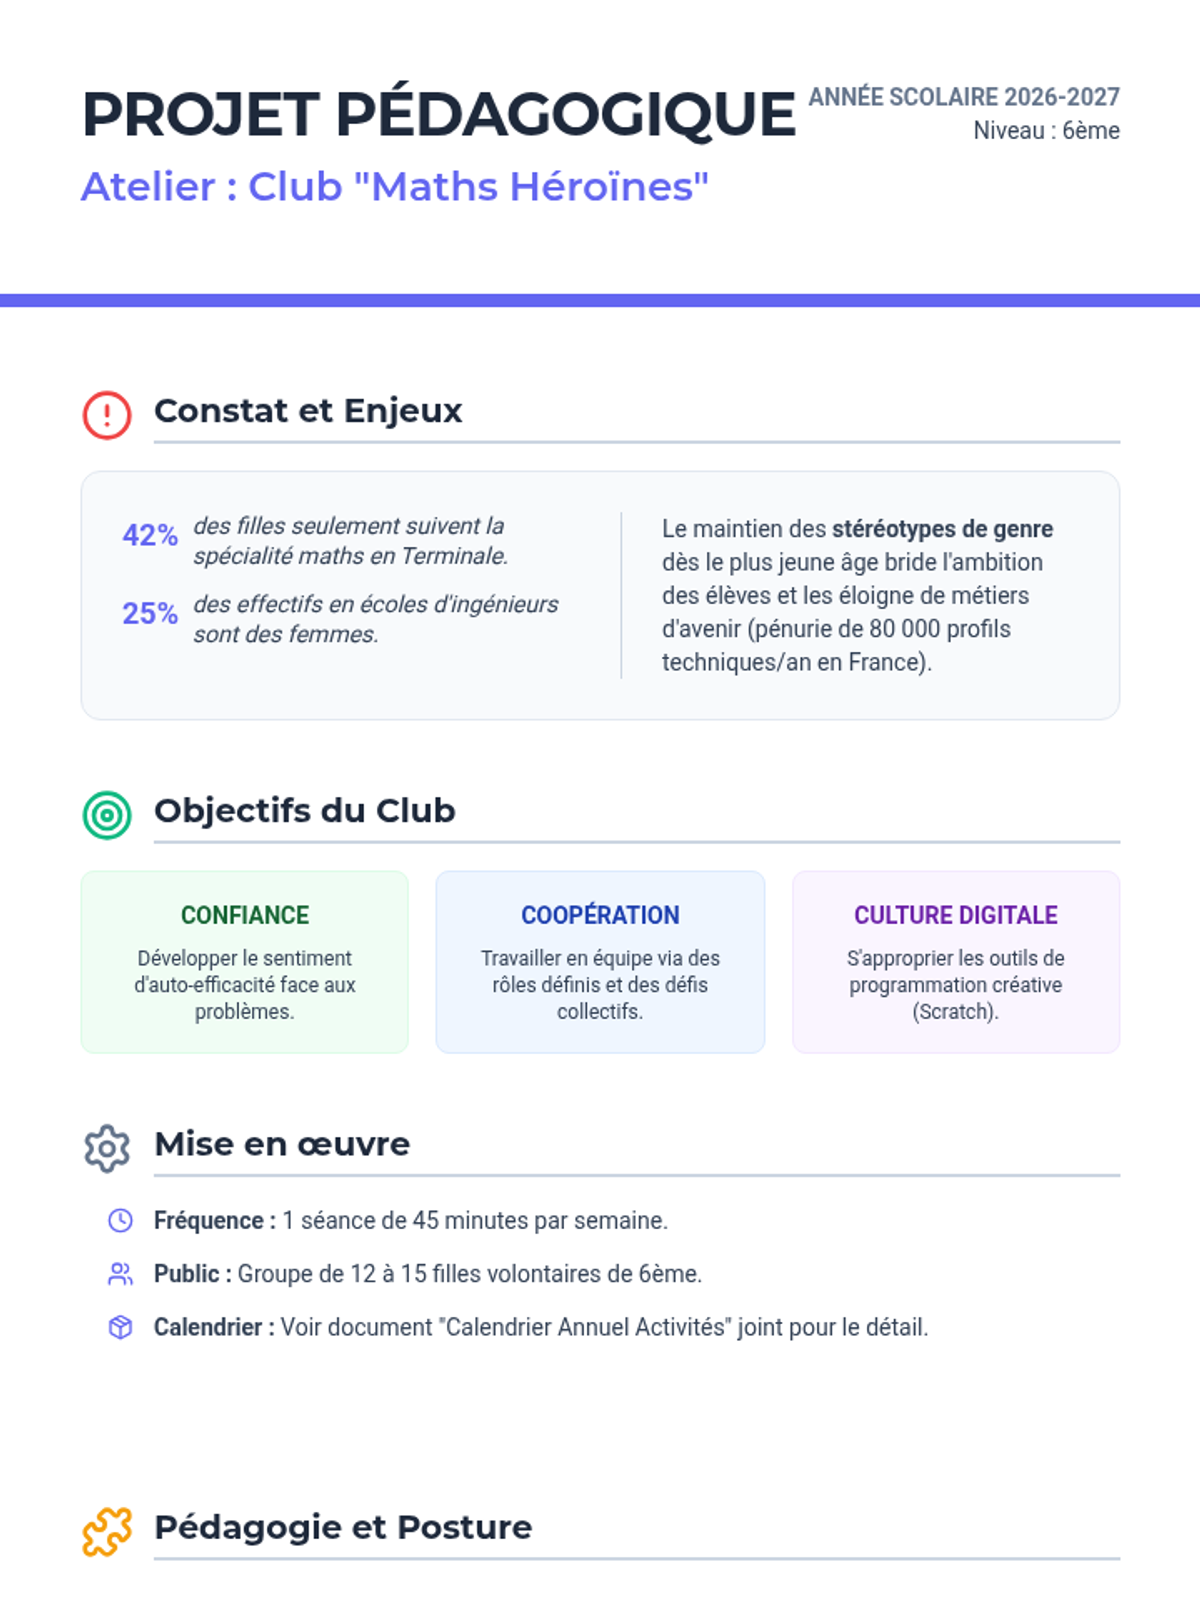
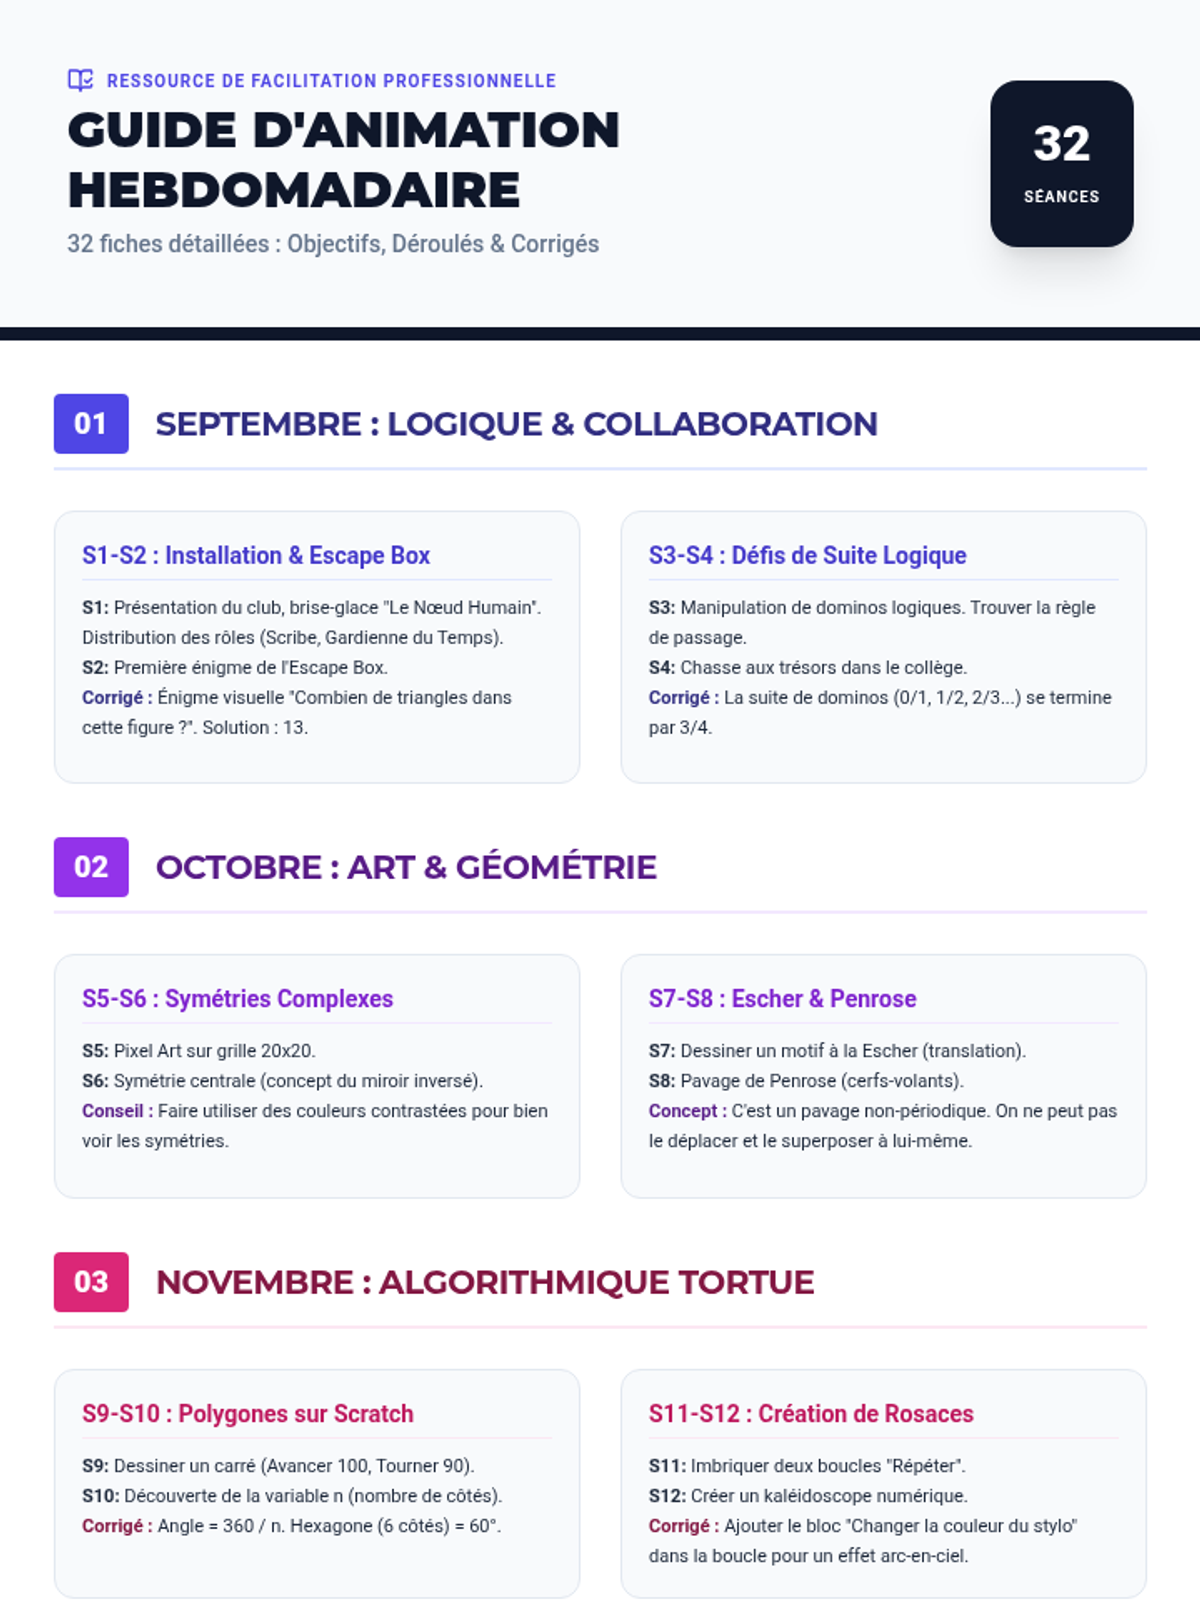
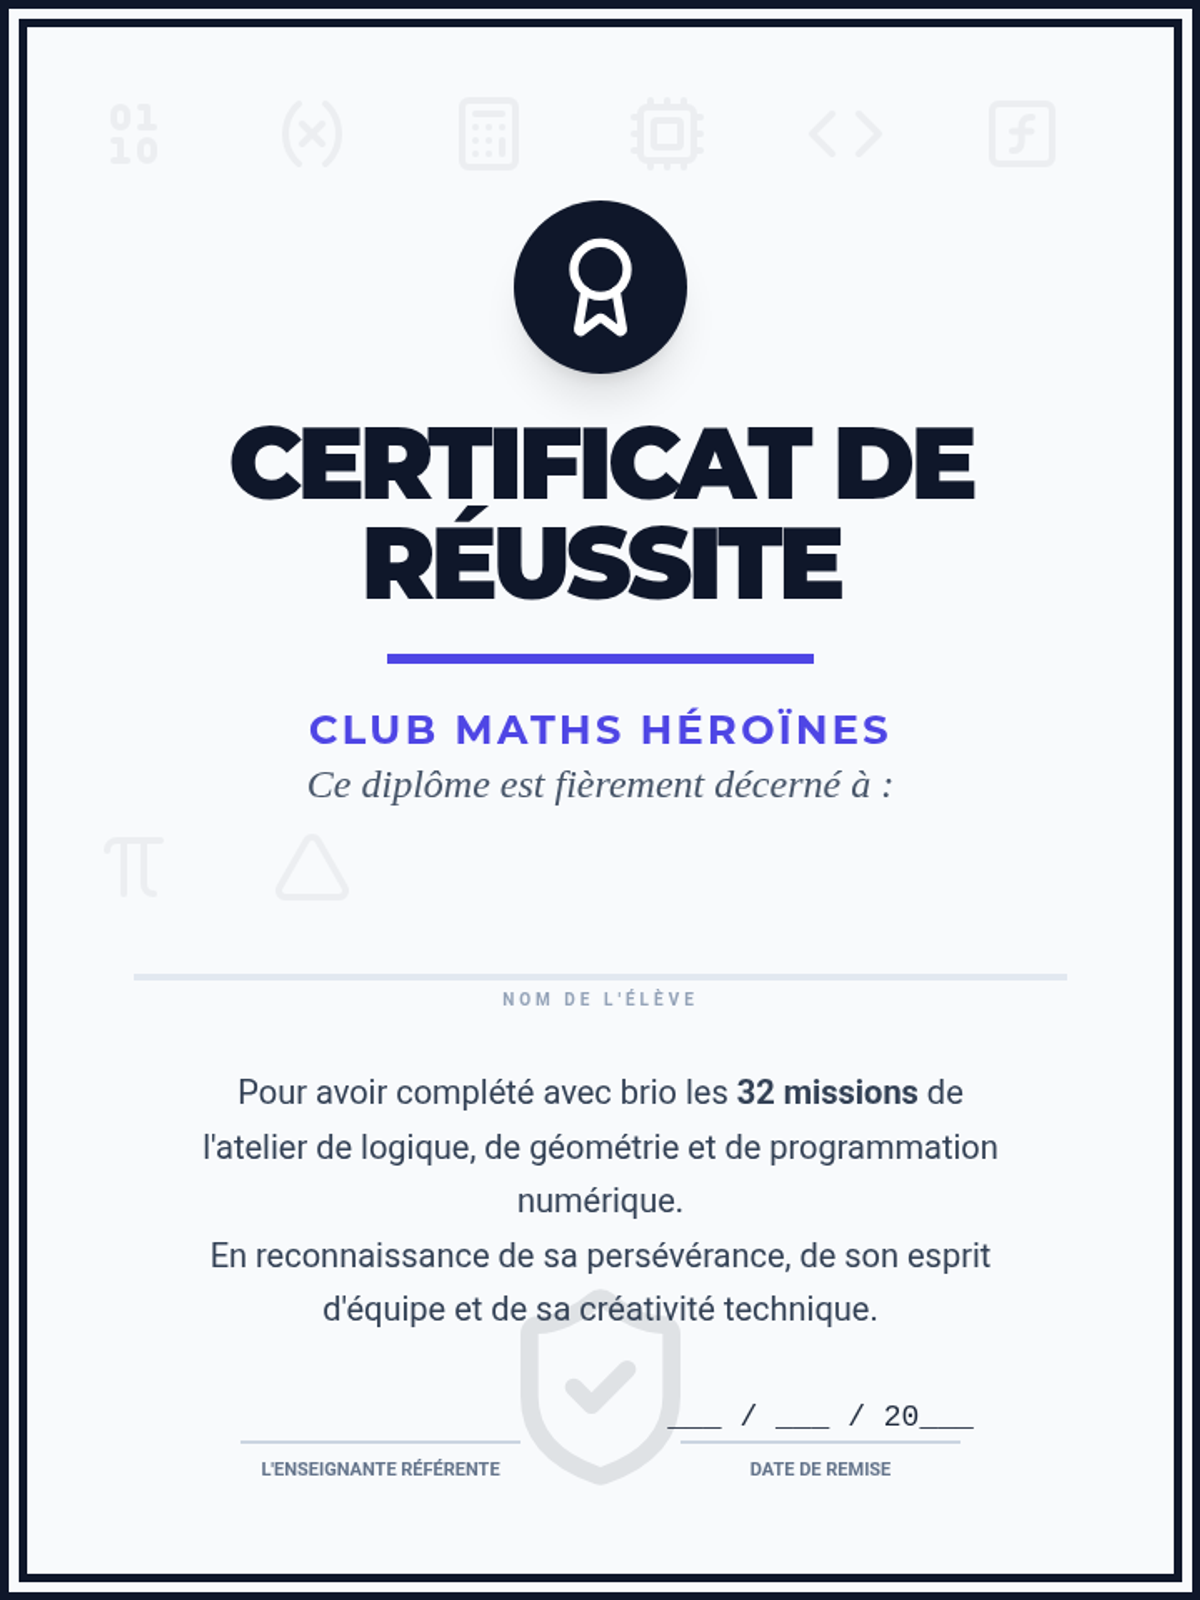
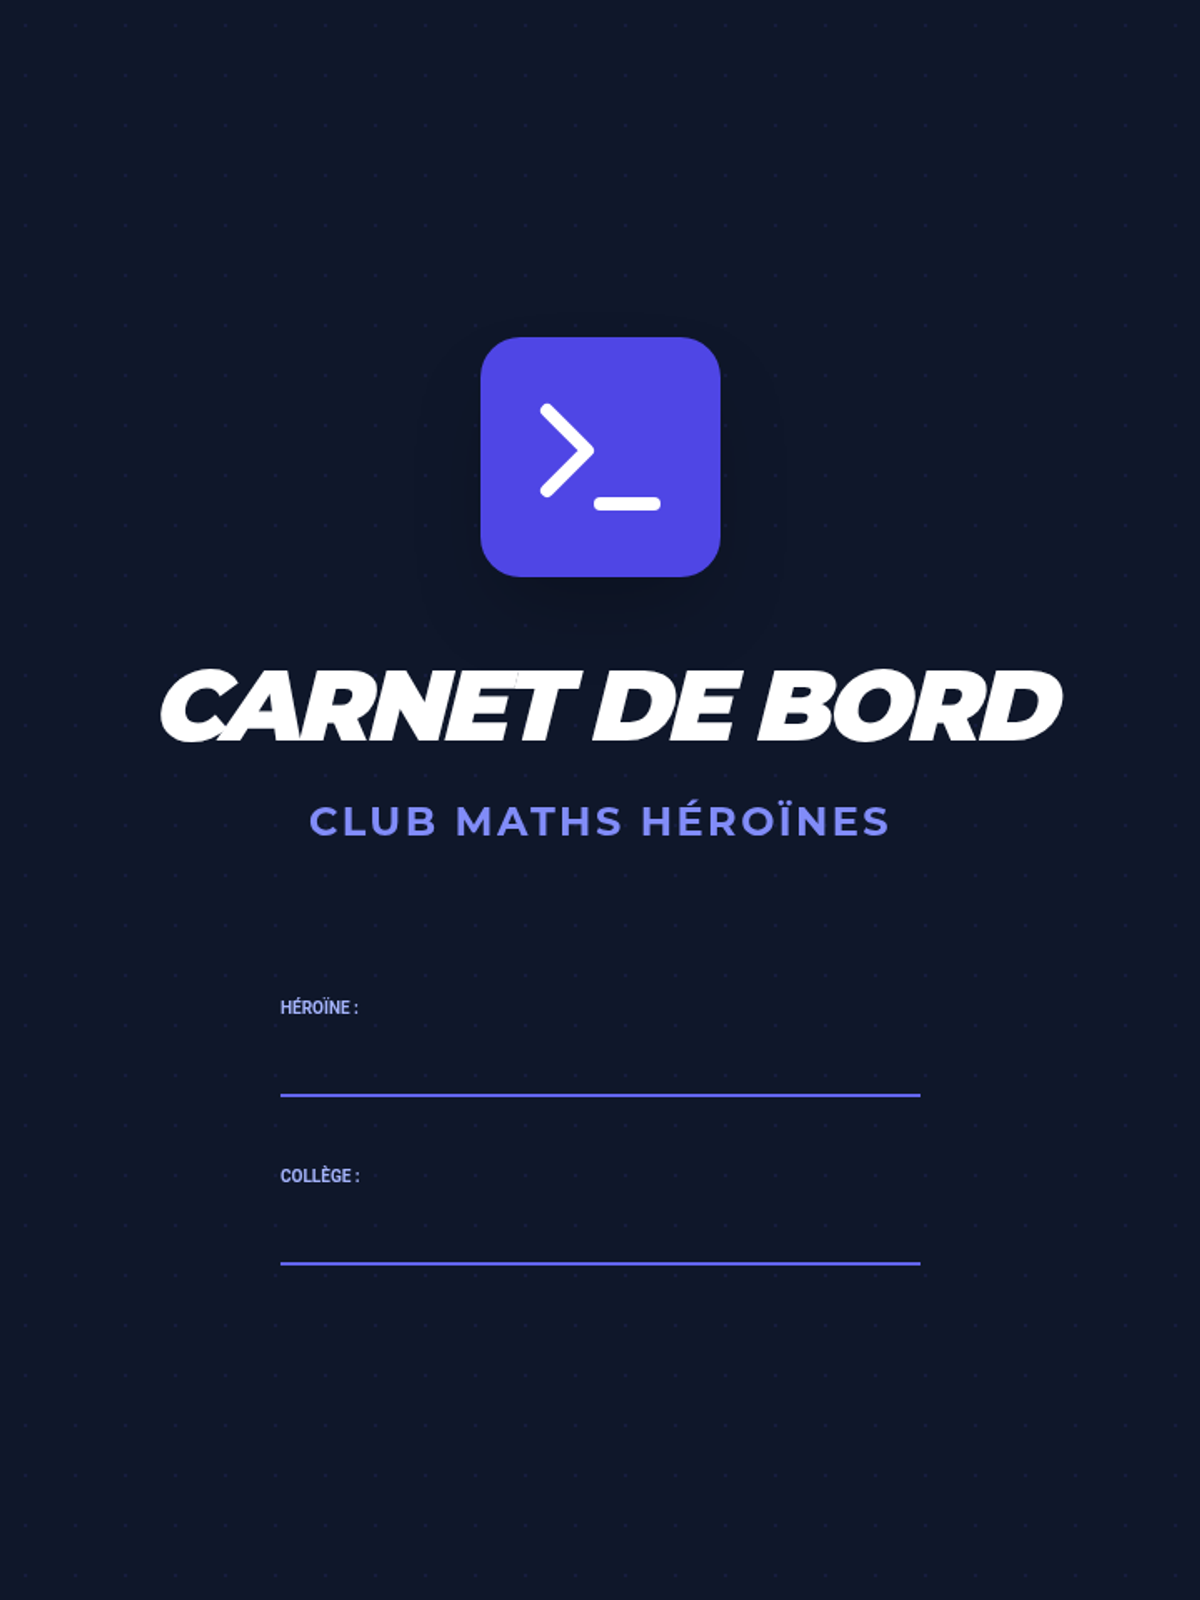
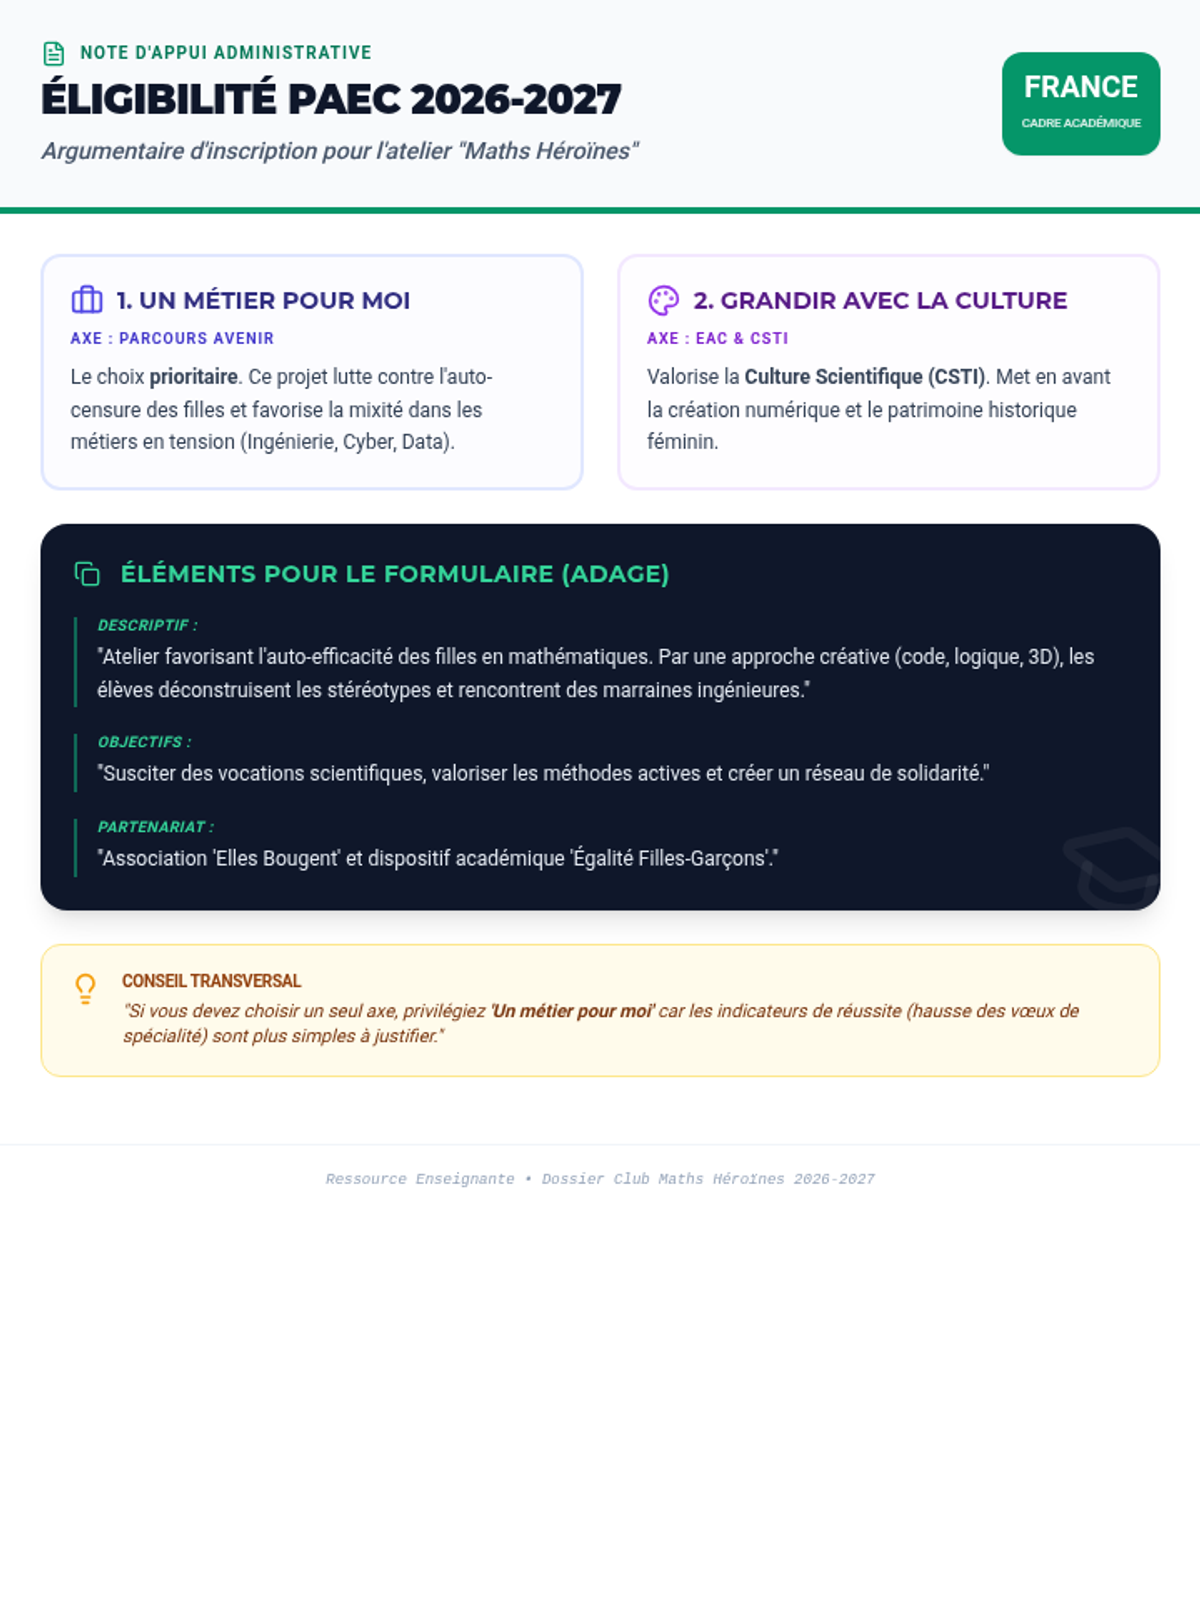
Ce module regroupe les documents administratifs et pédagogiques nécessaires à la mise en place d'un atelier hebdomadaire de 45 minutes pour promouvoir les mathématiques auprès des jeunes filles.
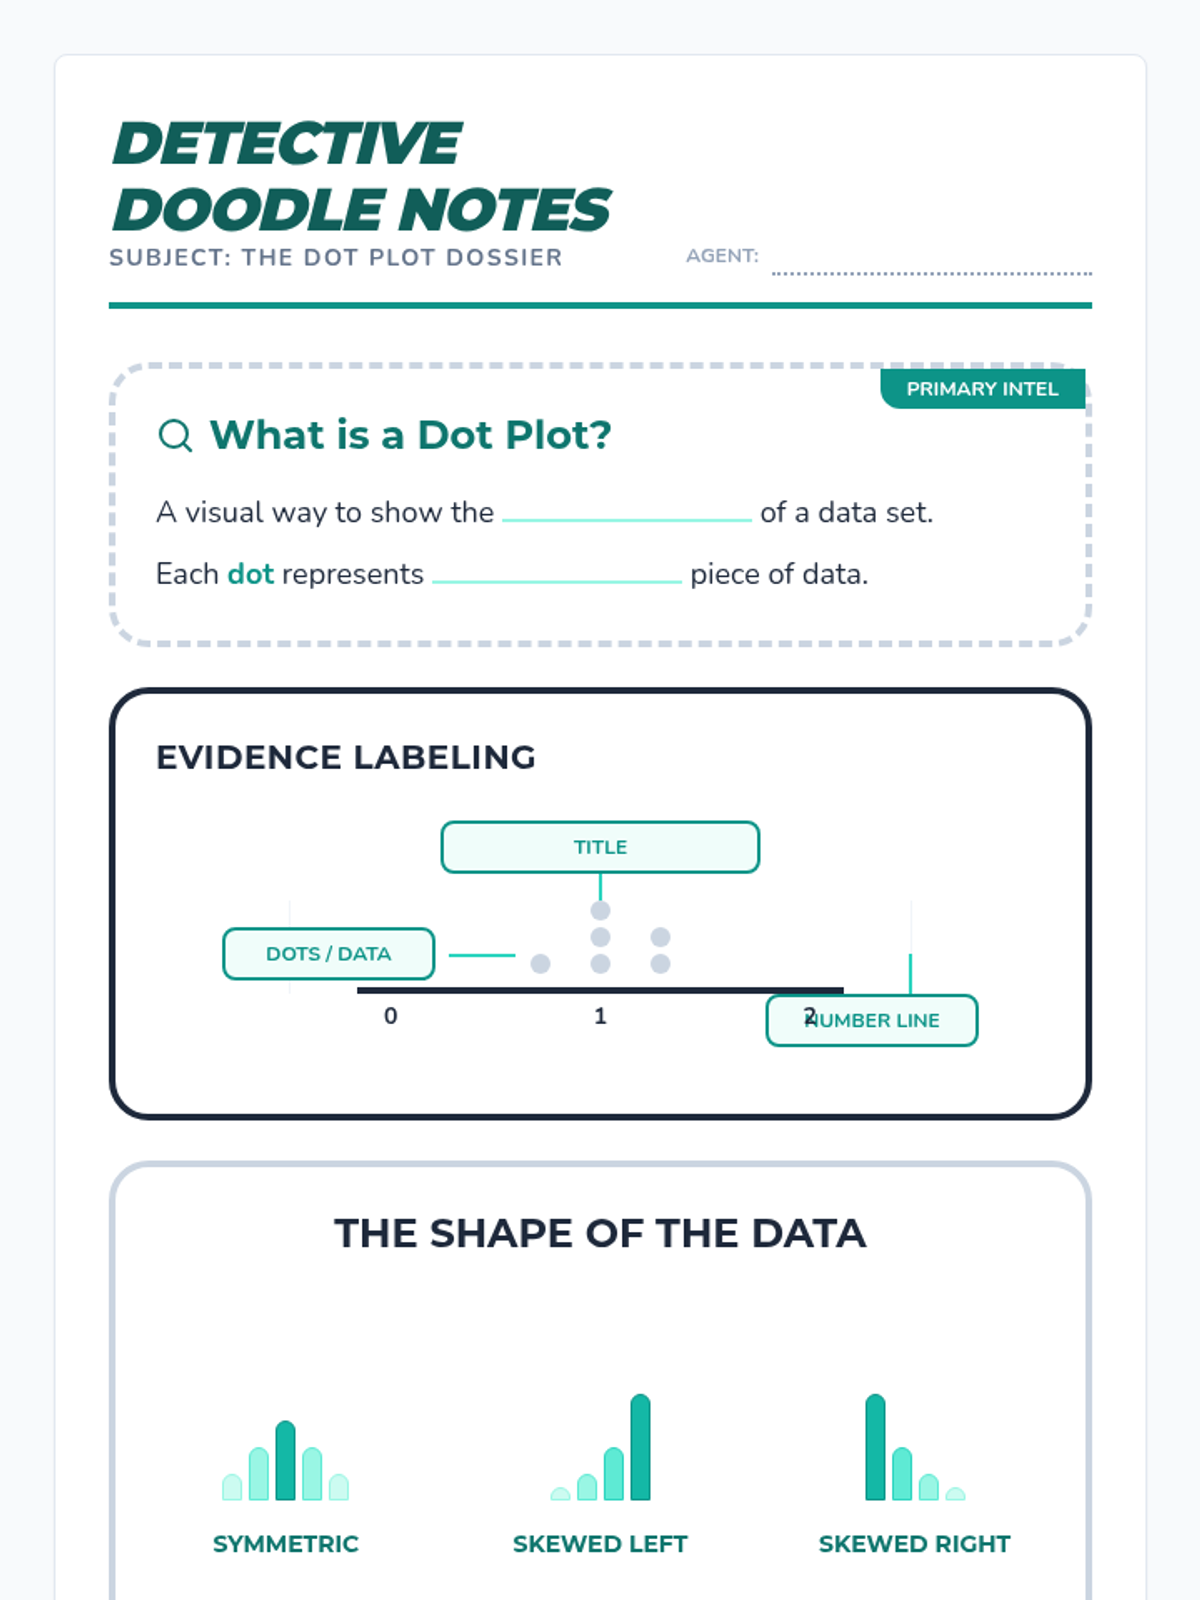
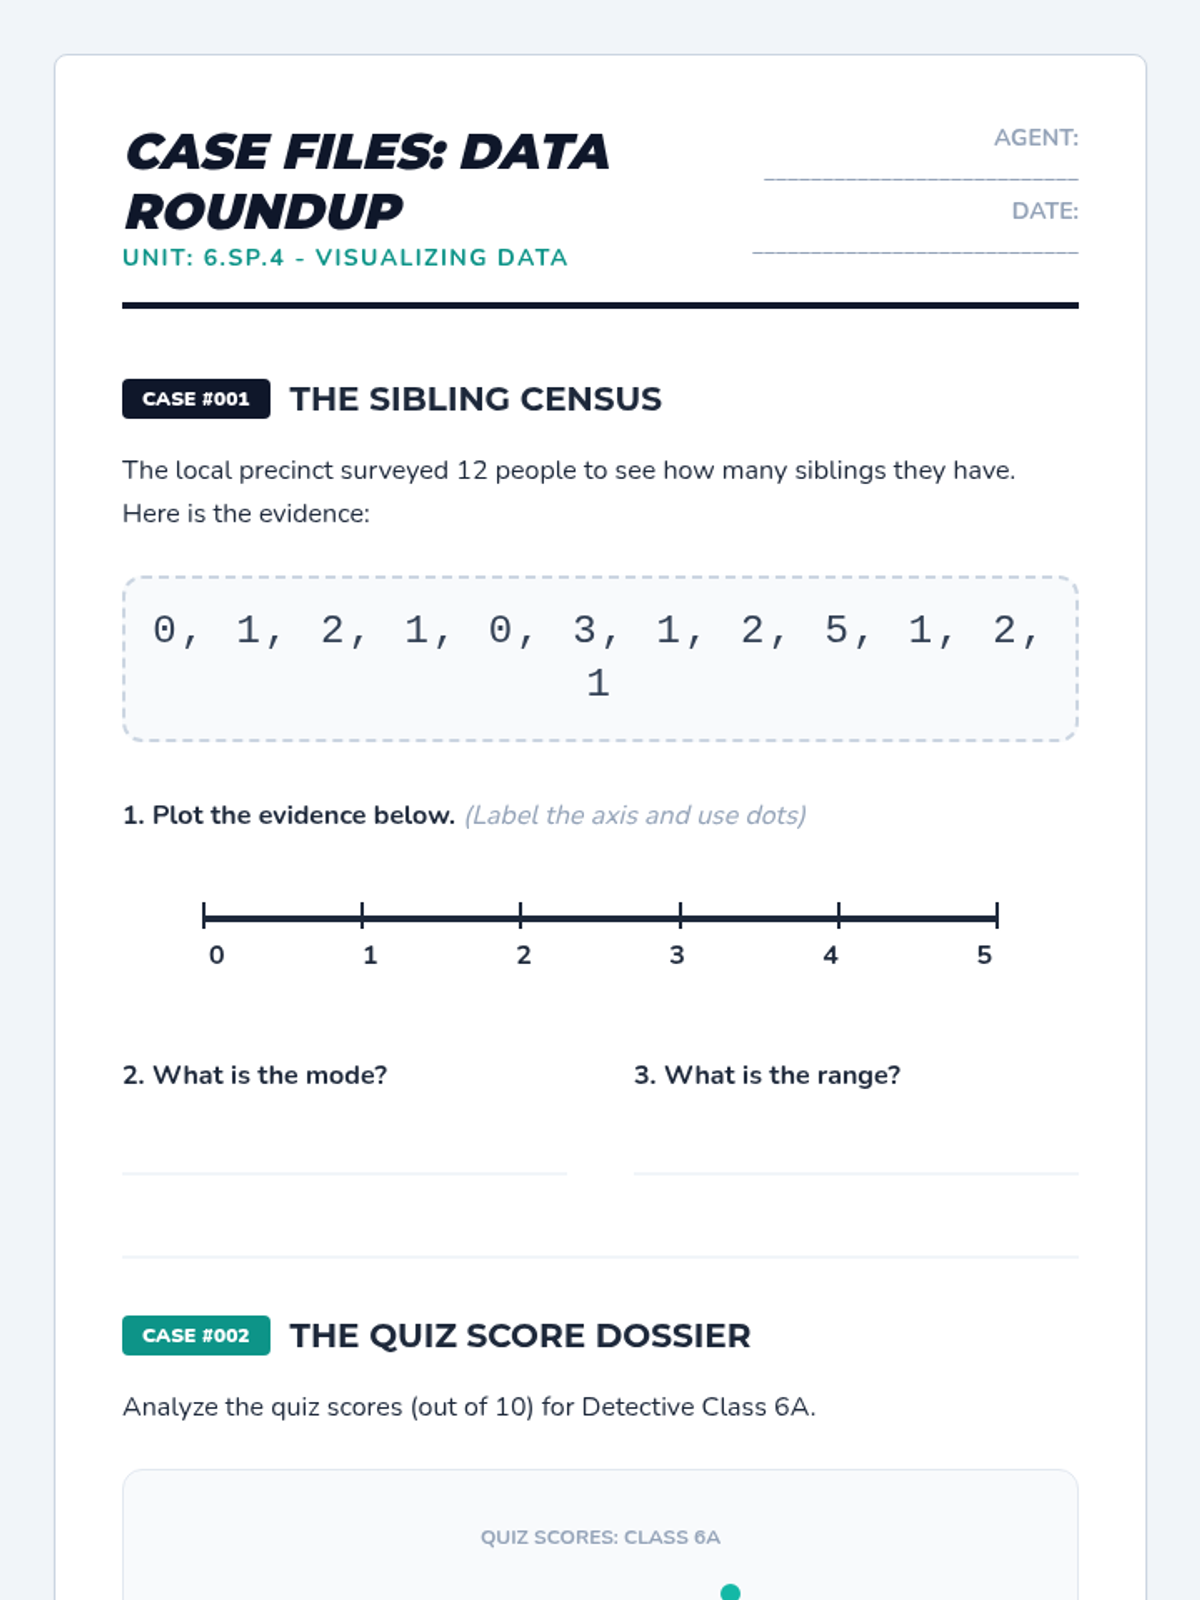
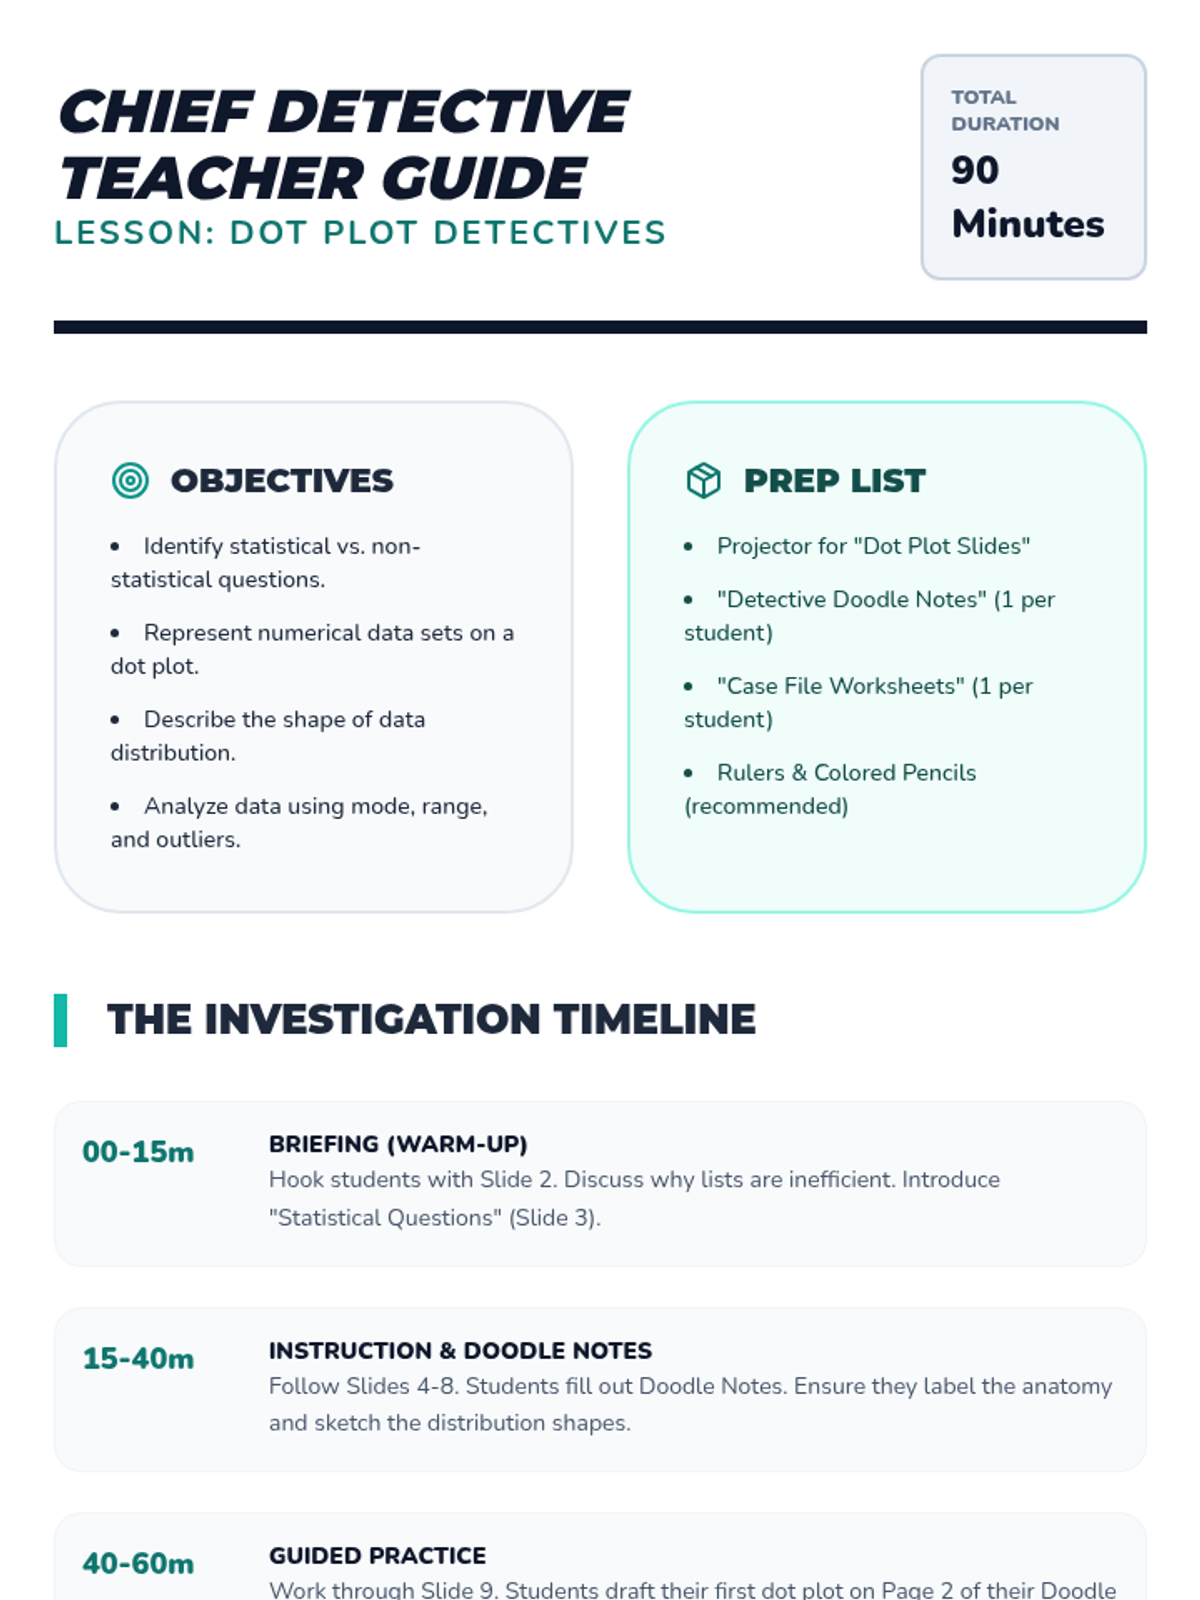
A comprehensive 90-minute lesson introducing 6th graders to dot plots, covering data collection, visual representation, and analysis of distribution shapes and central tendency.
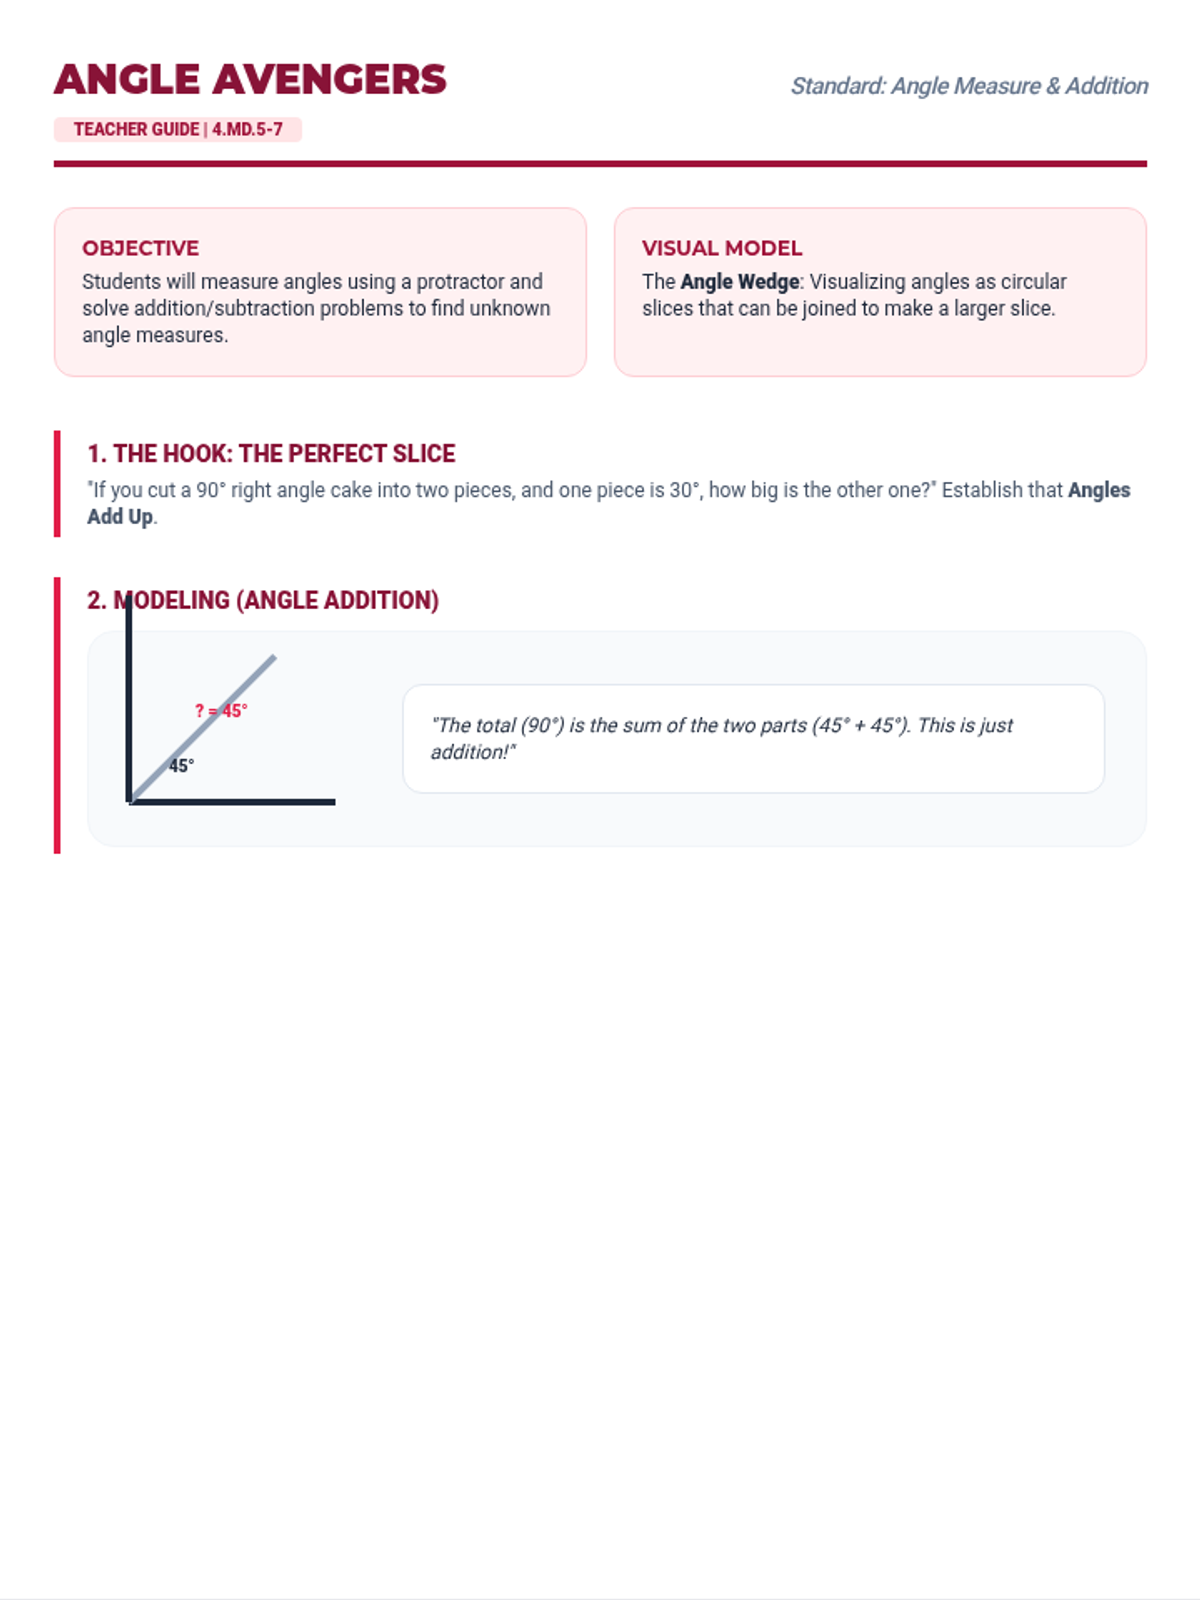
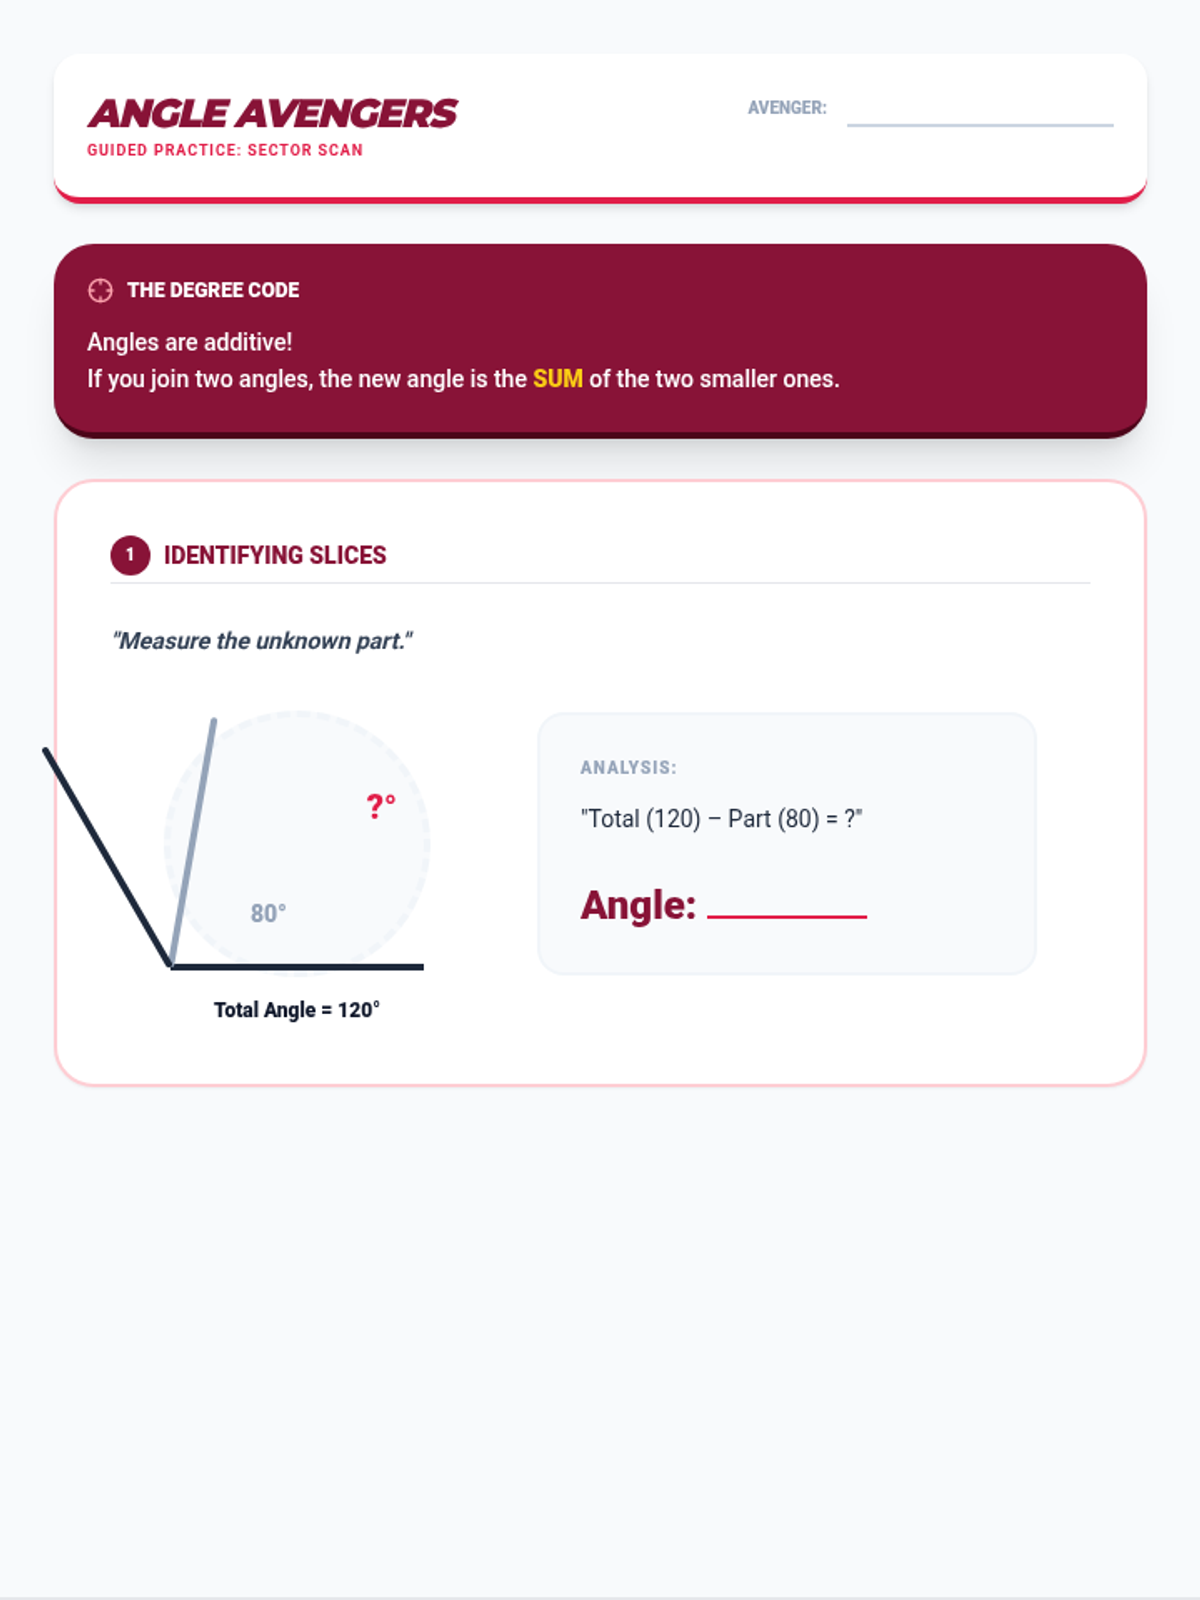
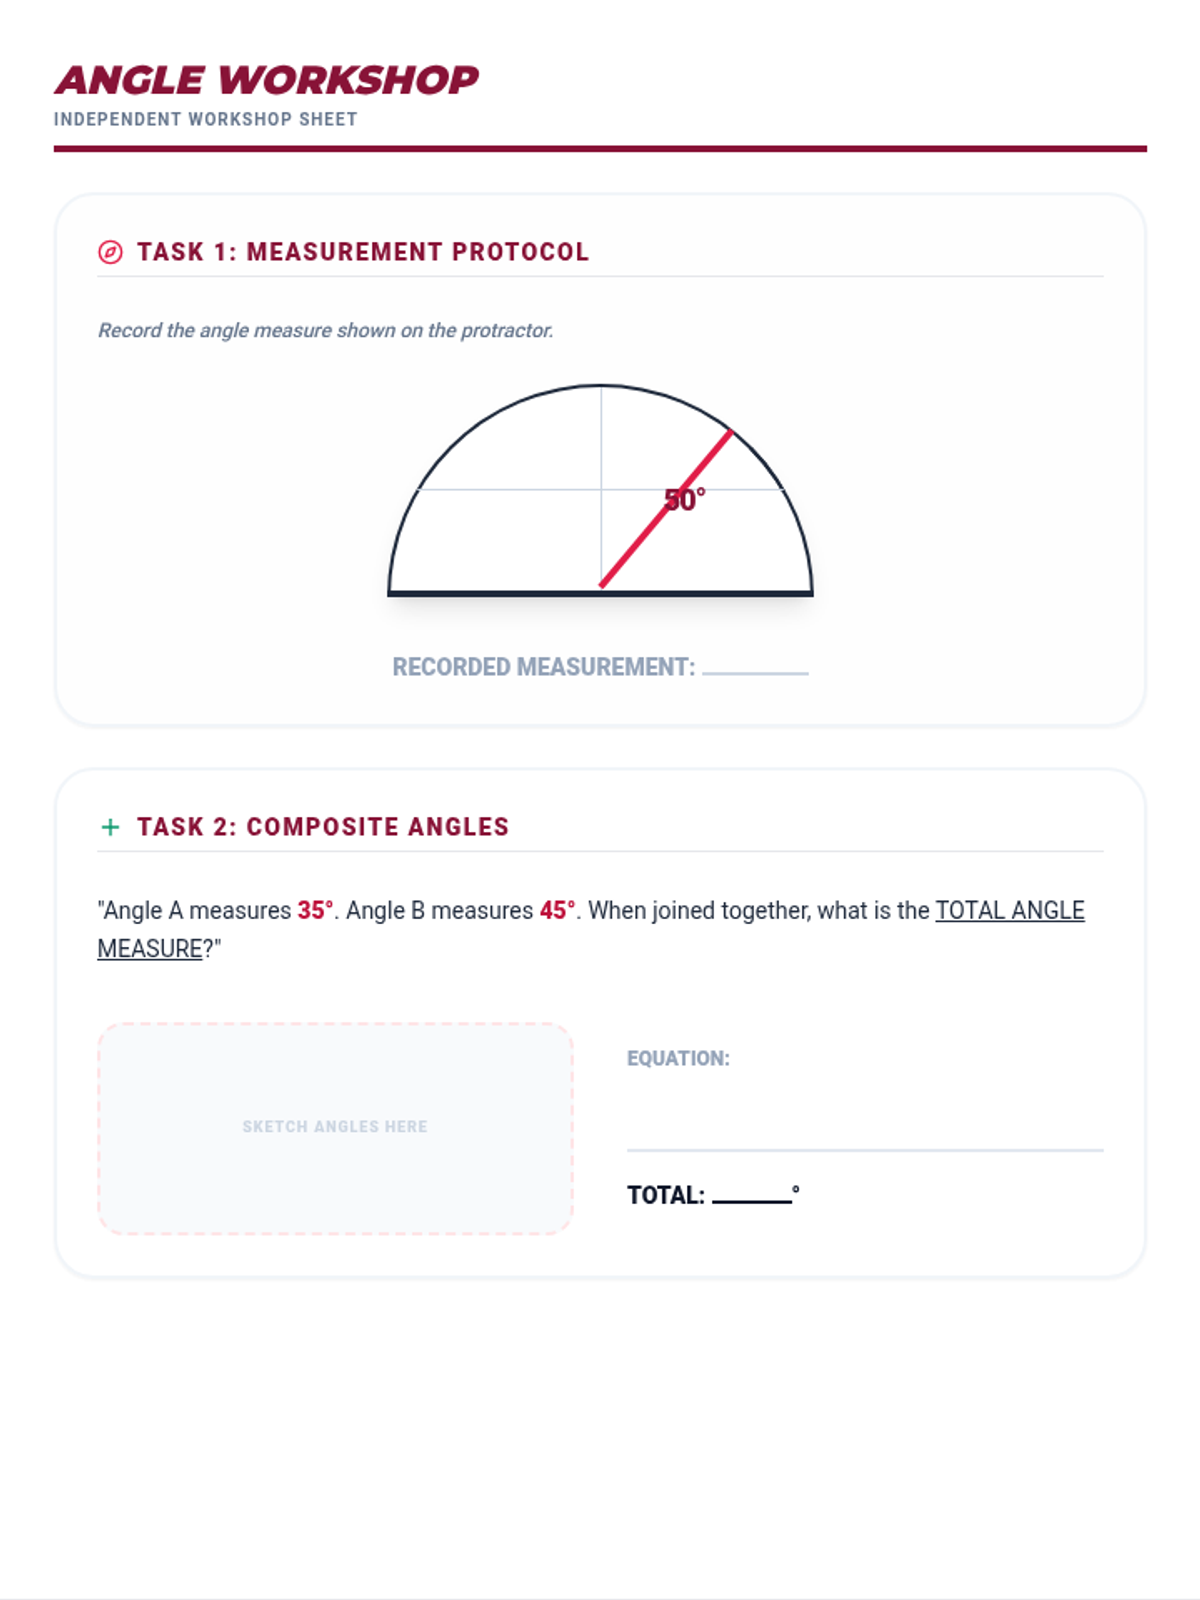
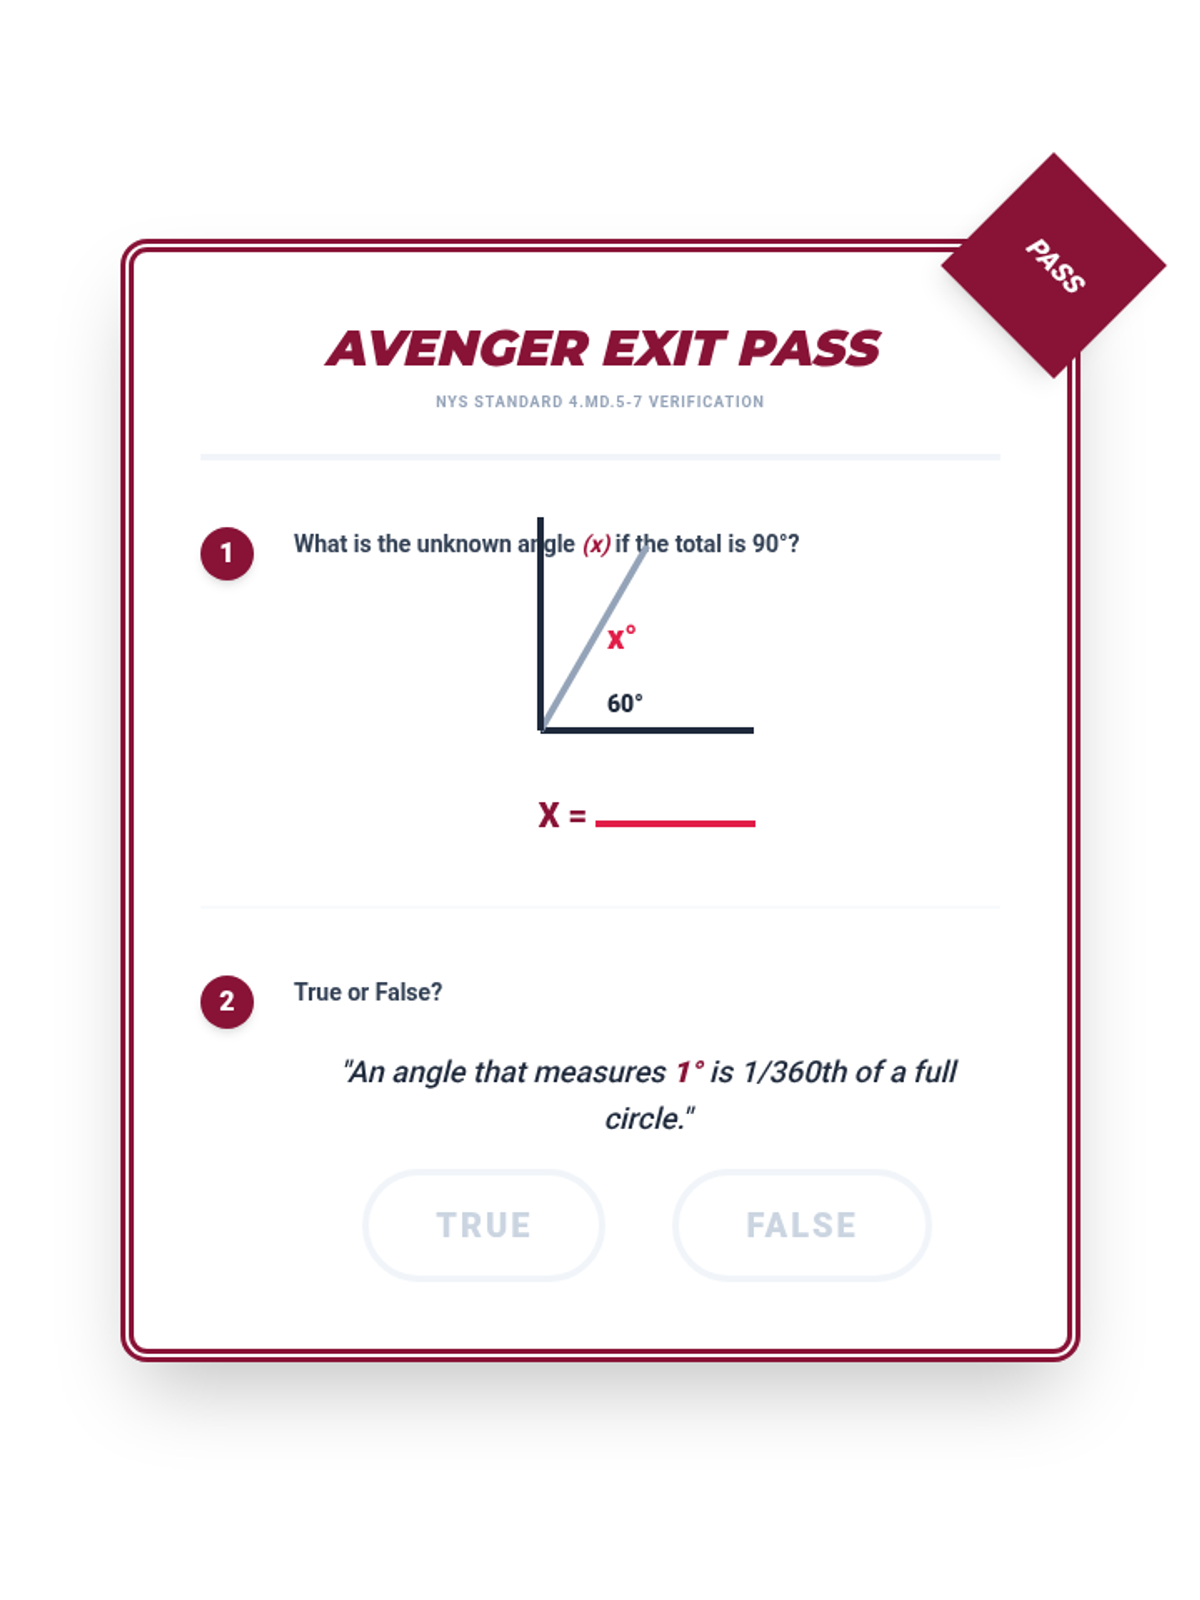
Tier 2 reteach for standards 4.MD.5, 4.MD.6, & 4.MD.7: Angle measurement with protractors and additive angle properties.
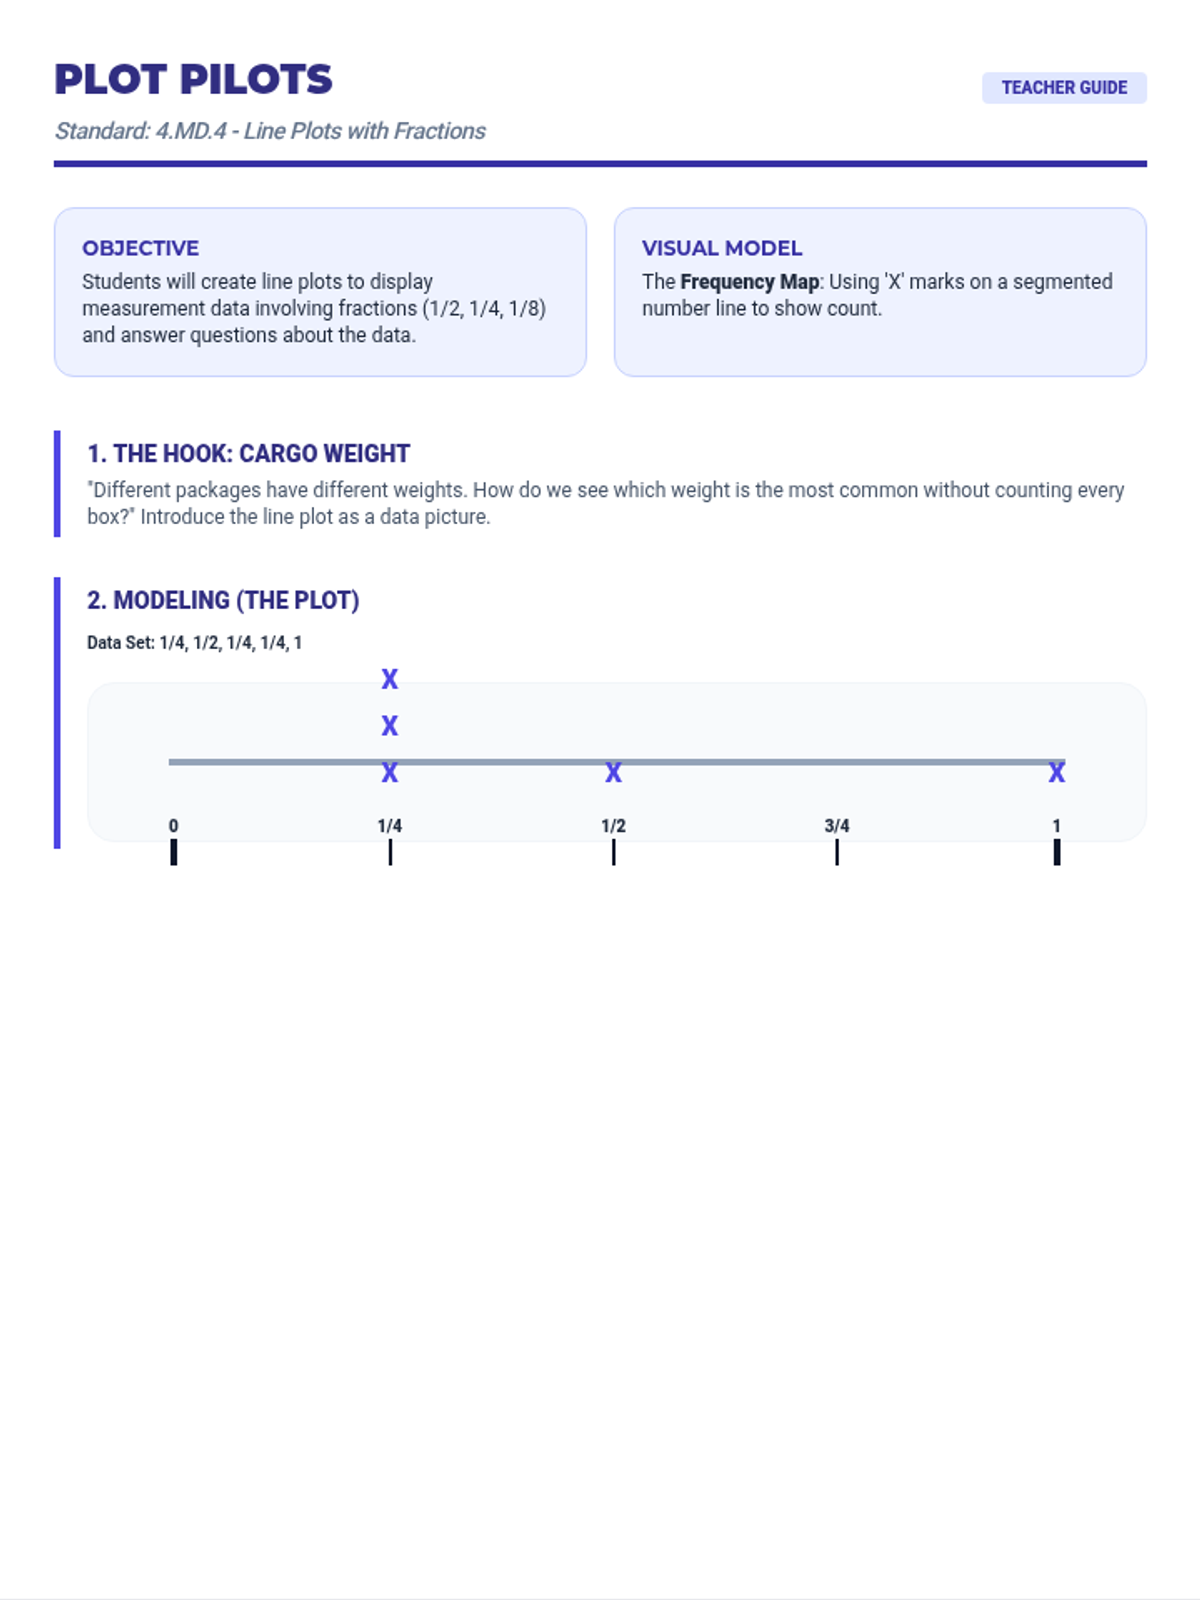
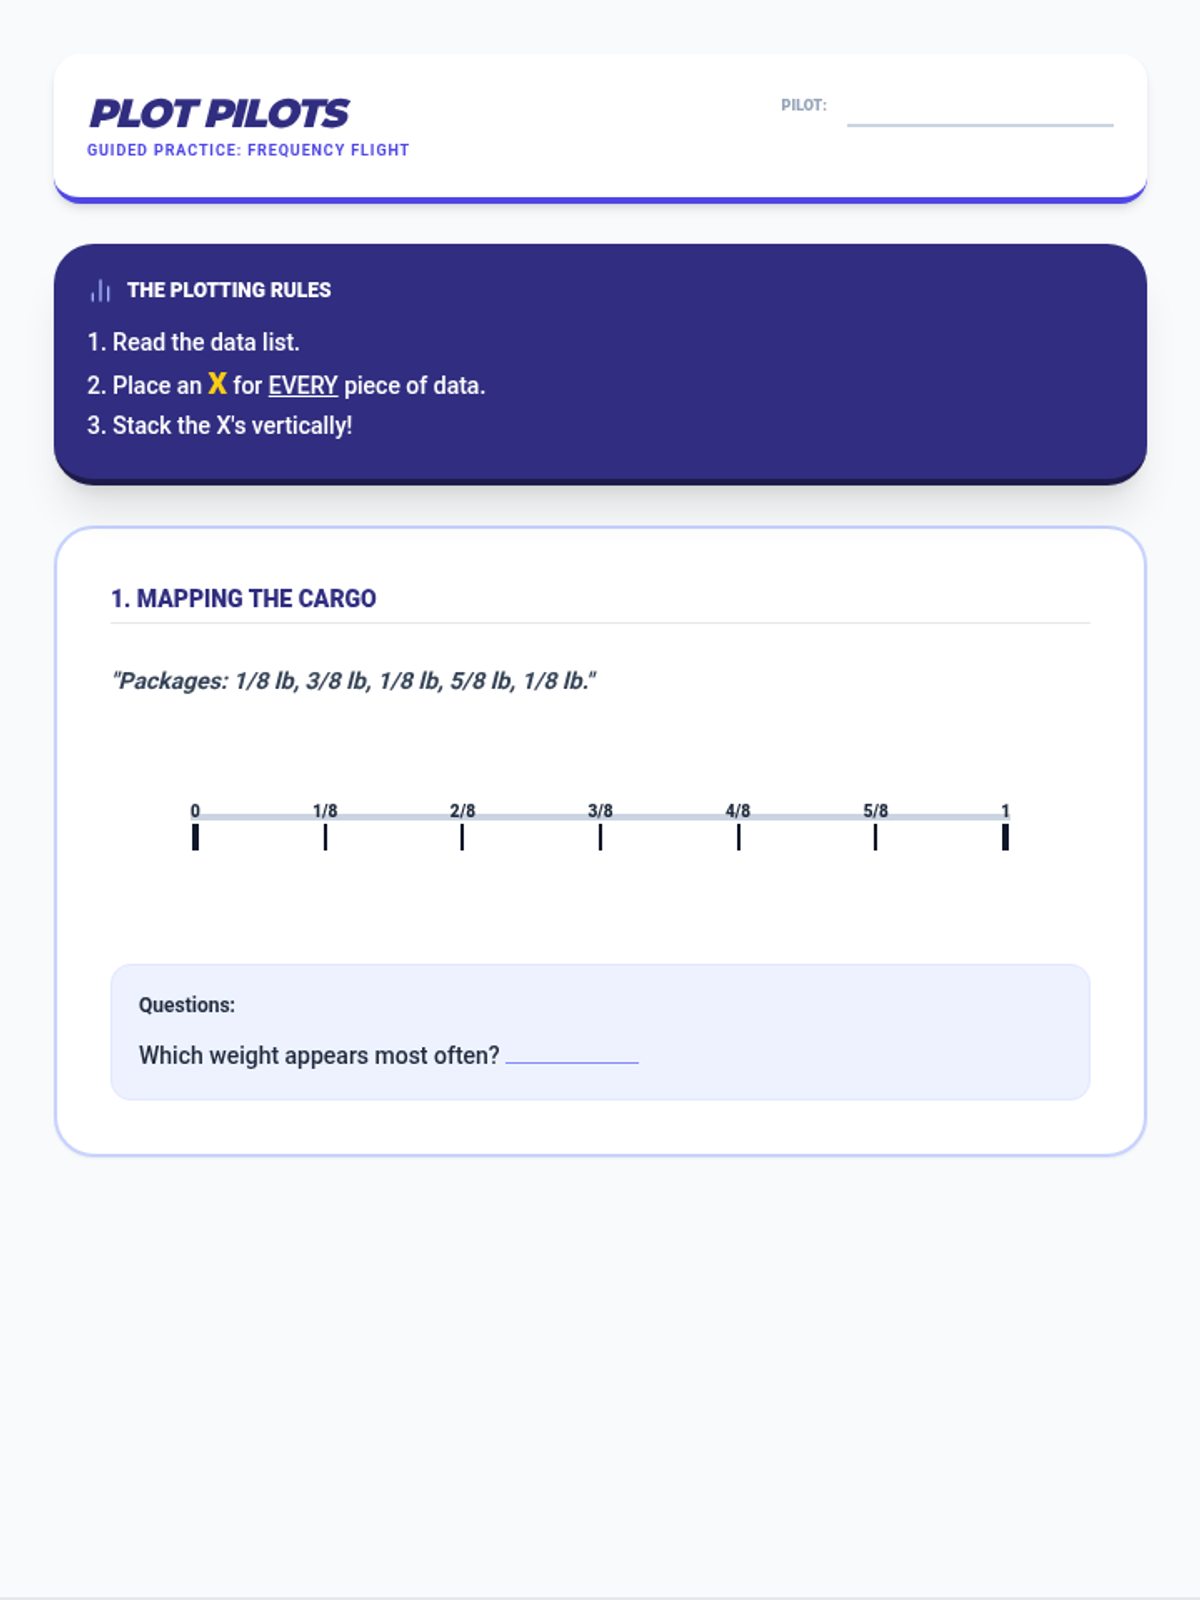
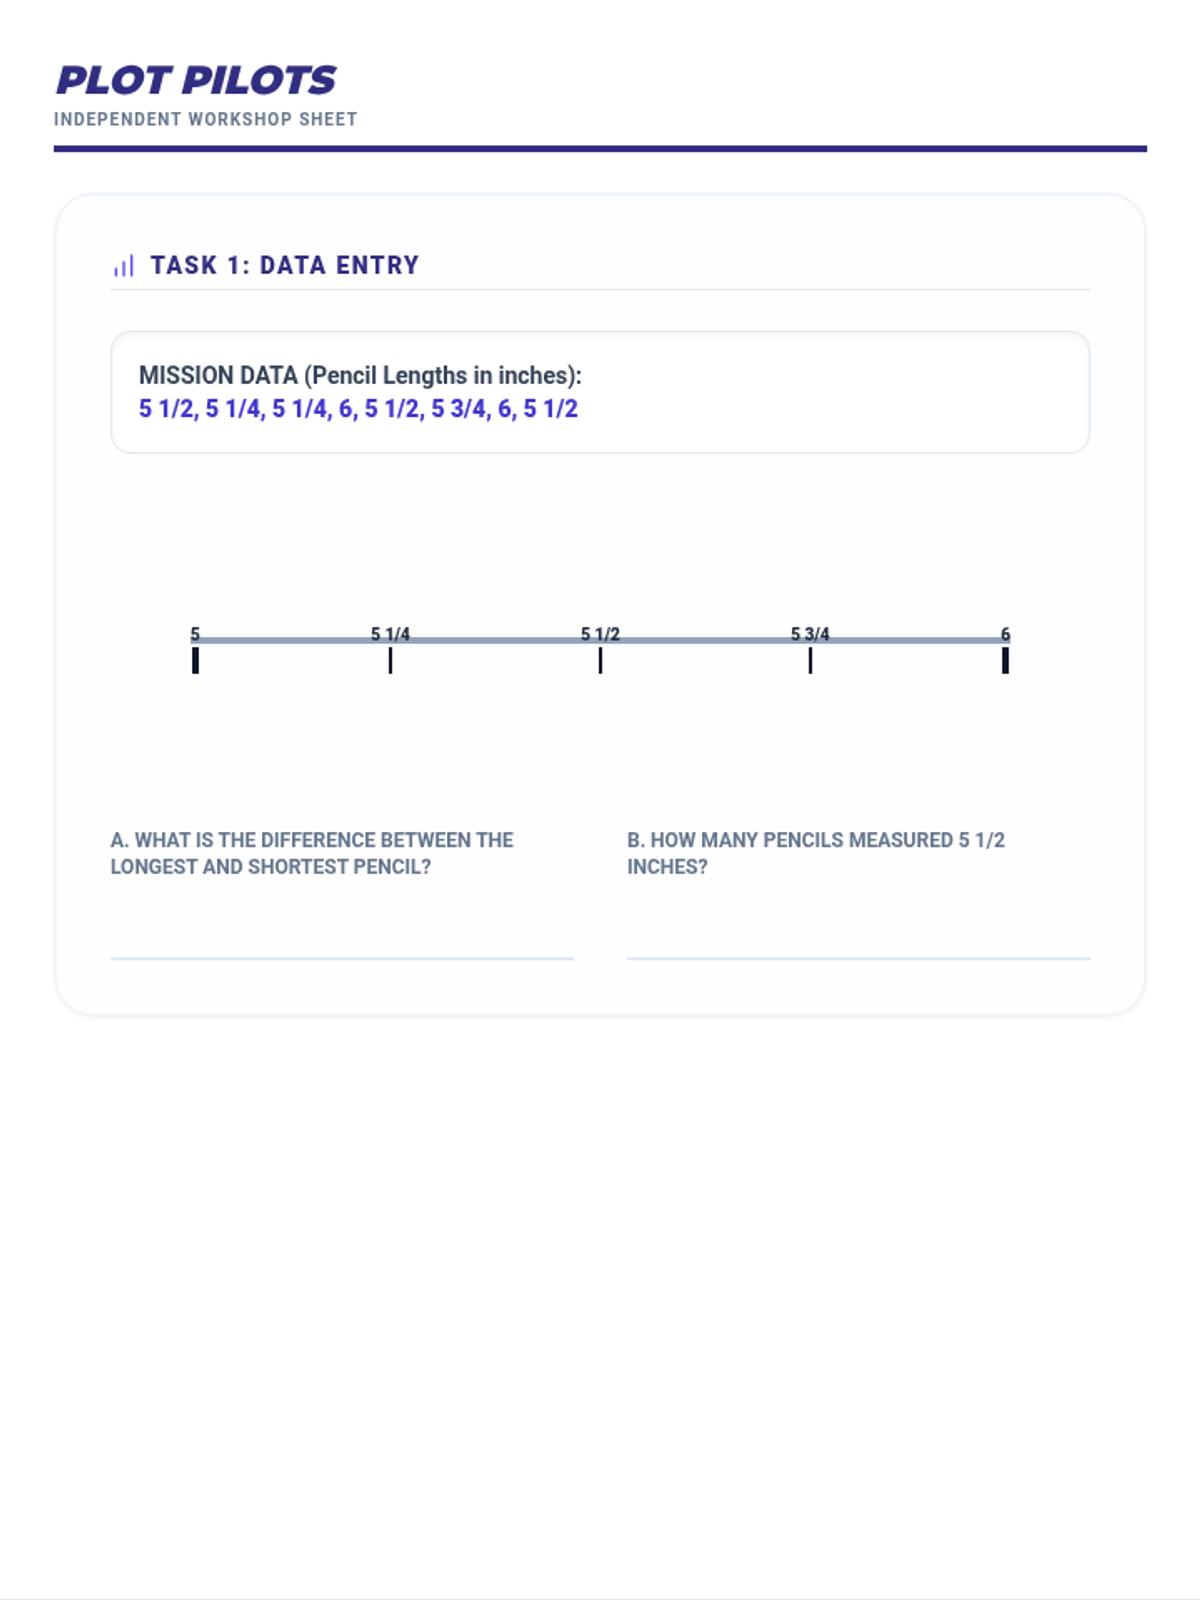
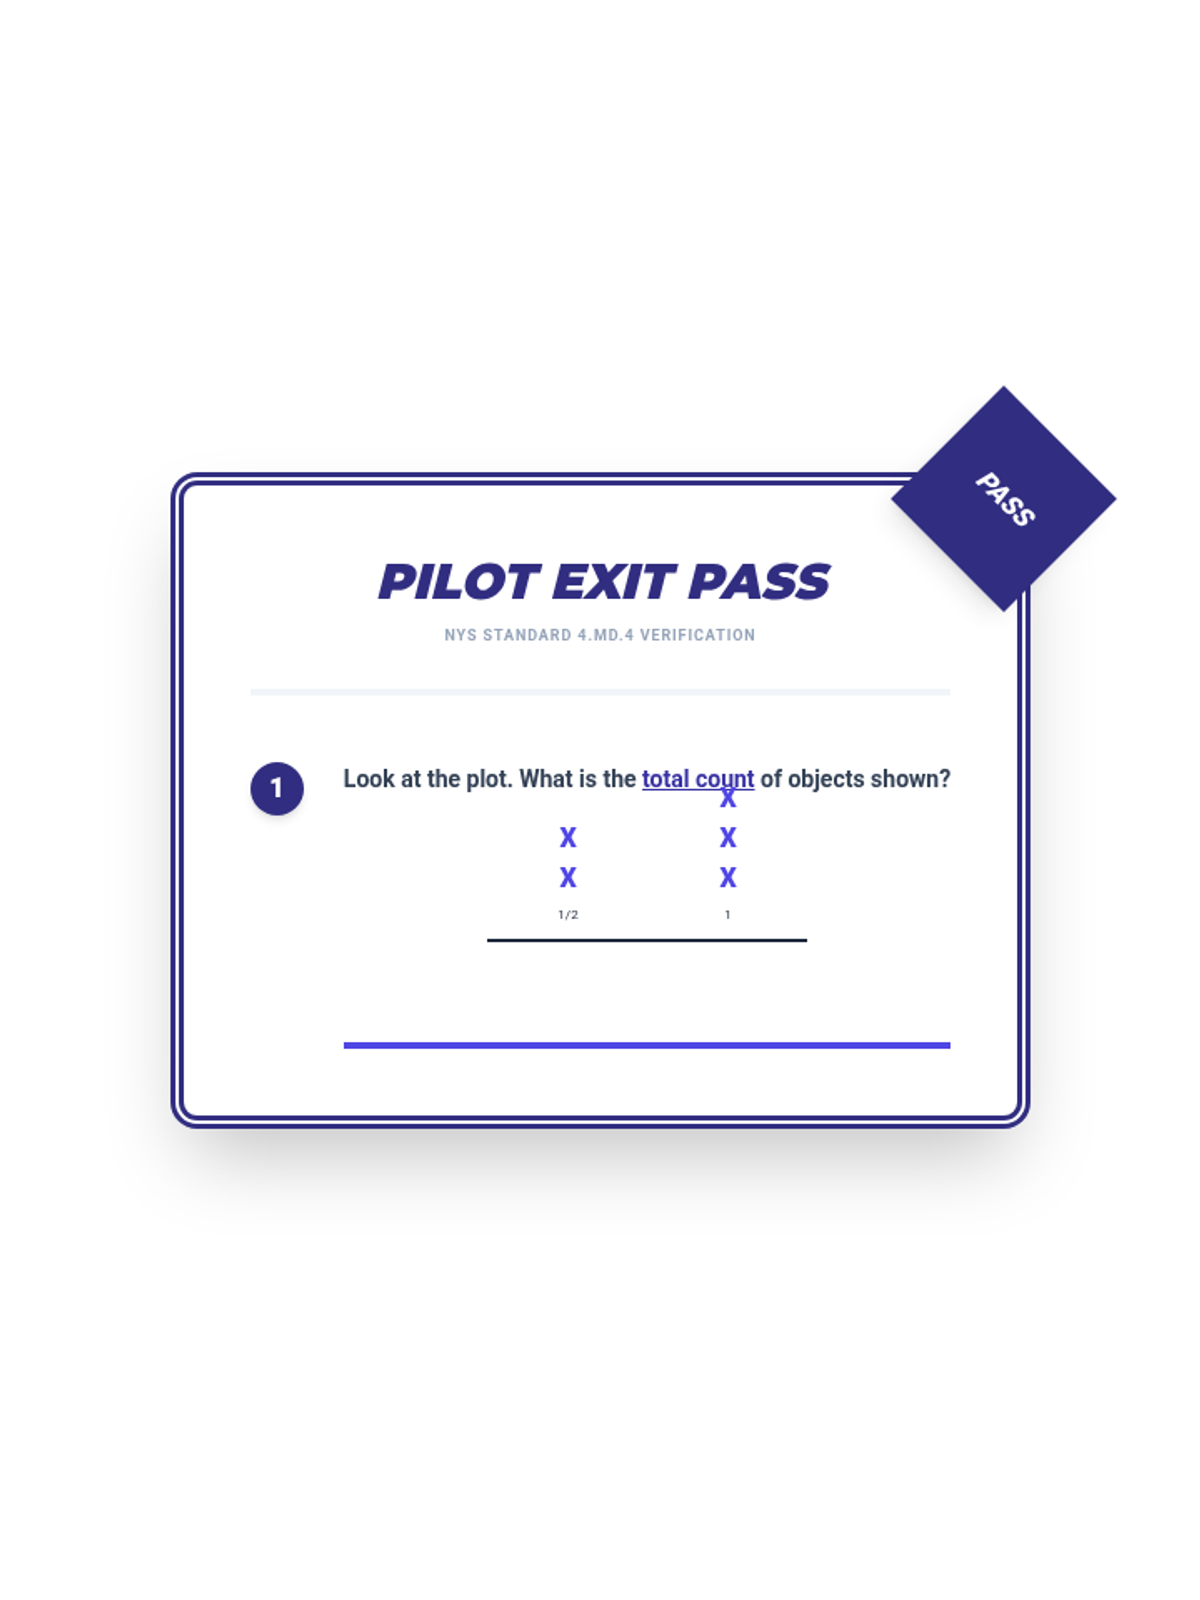
Tier 2 reteach for standard 4.MD.4: Make a line plot to display a data set of measurements in fractions of a unit.
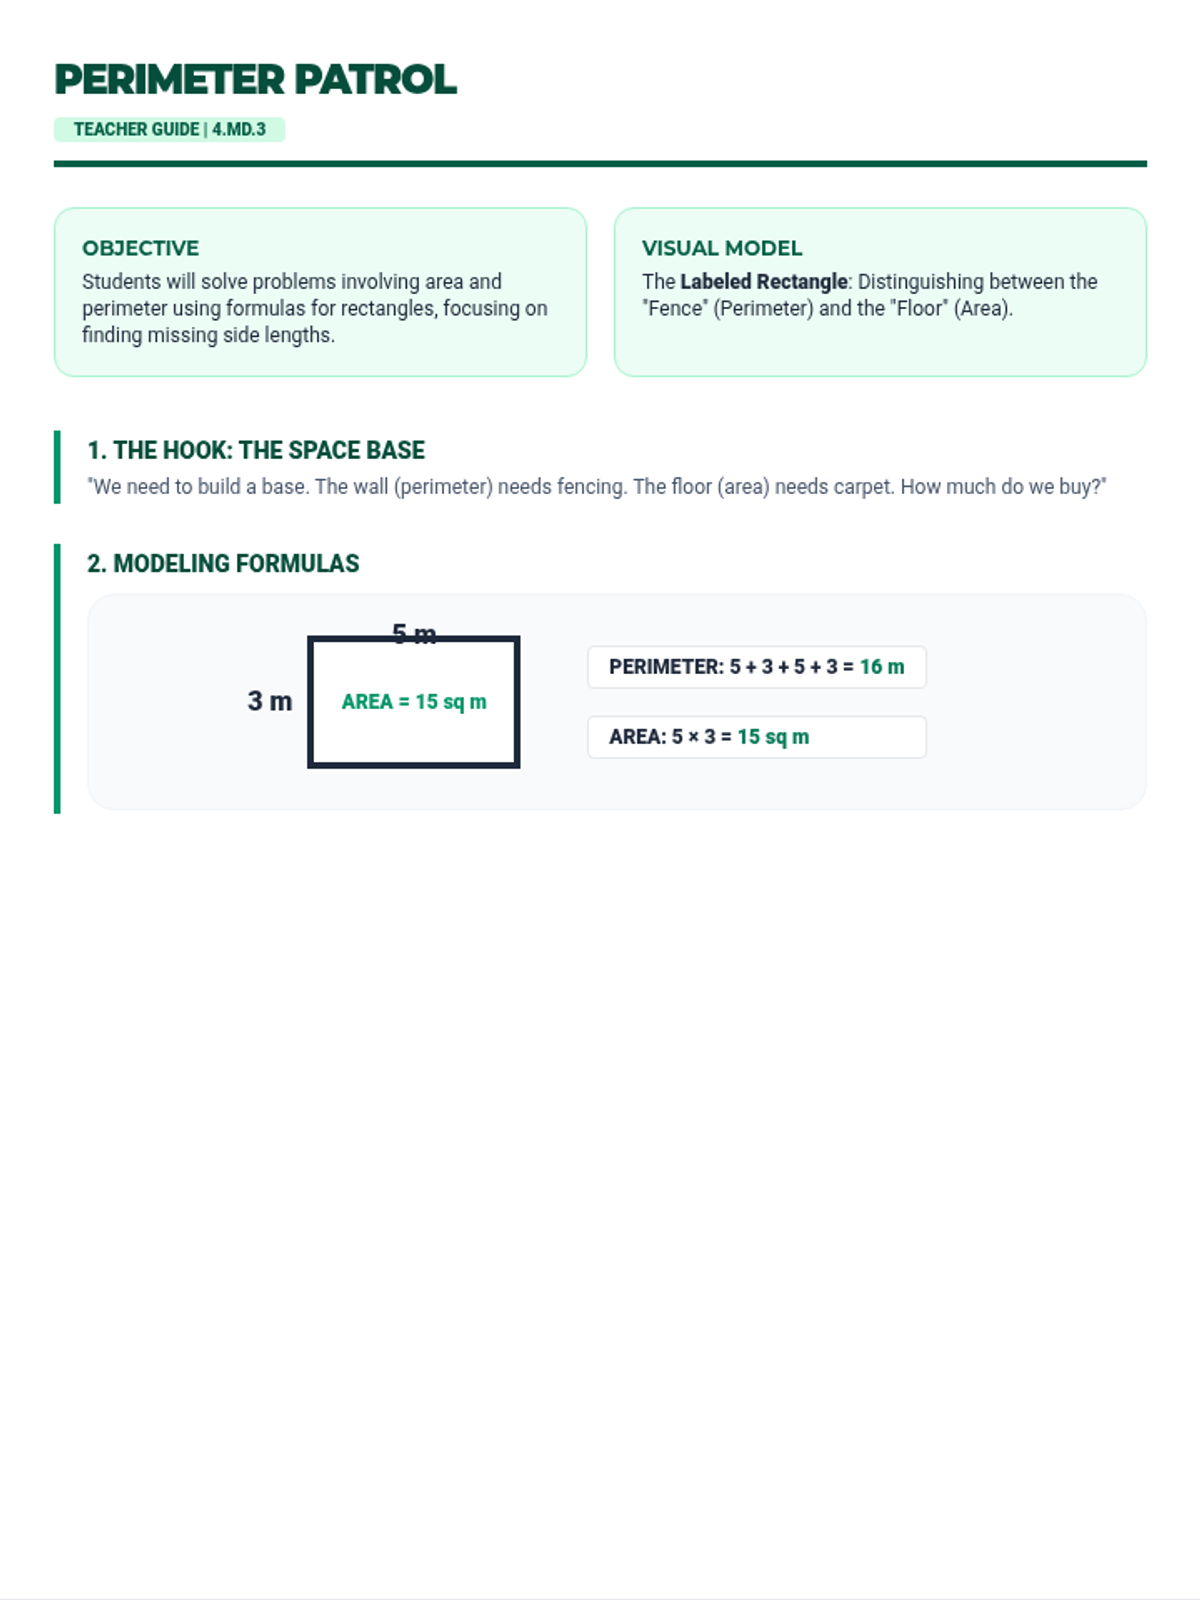
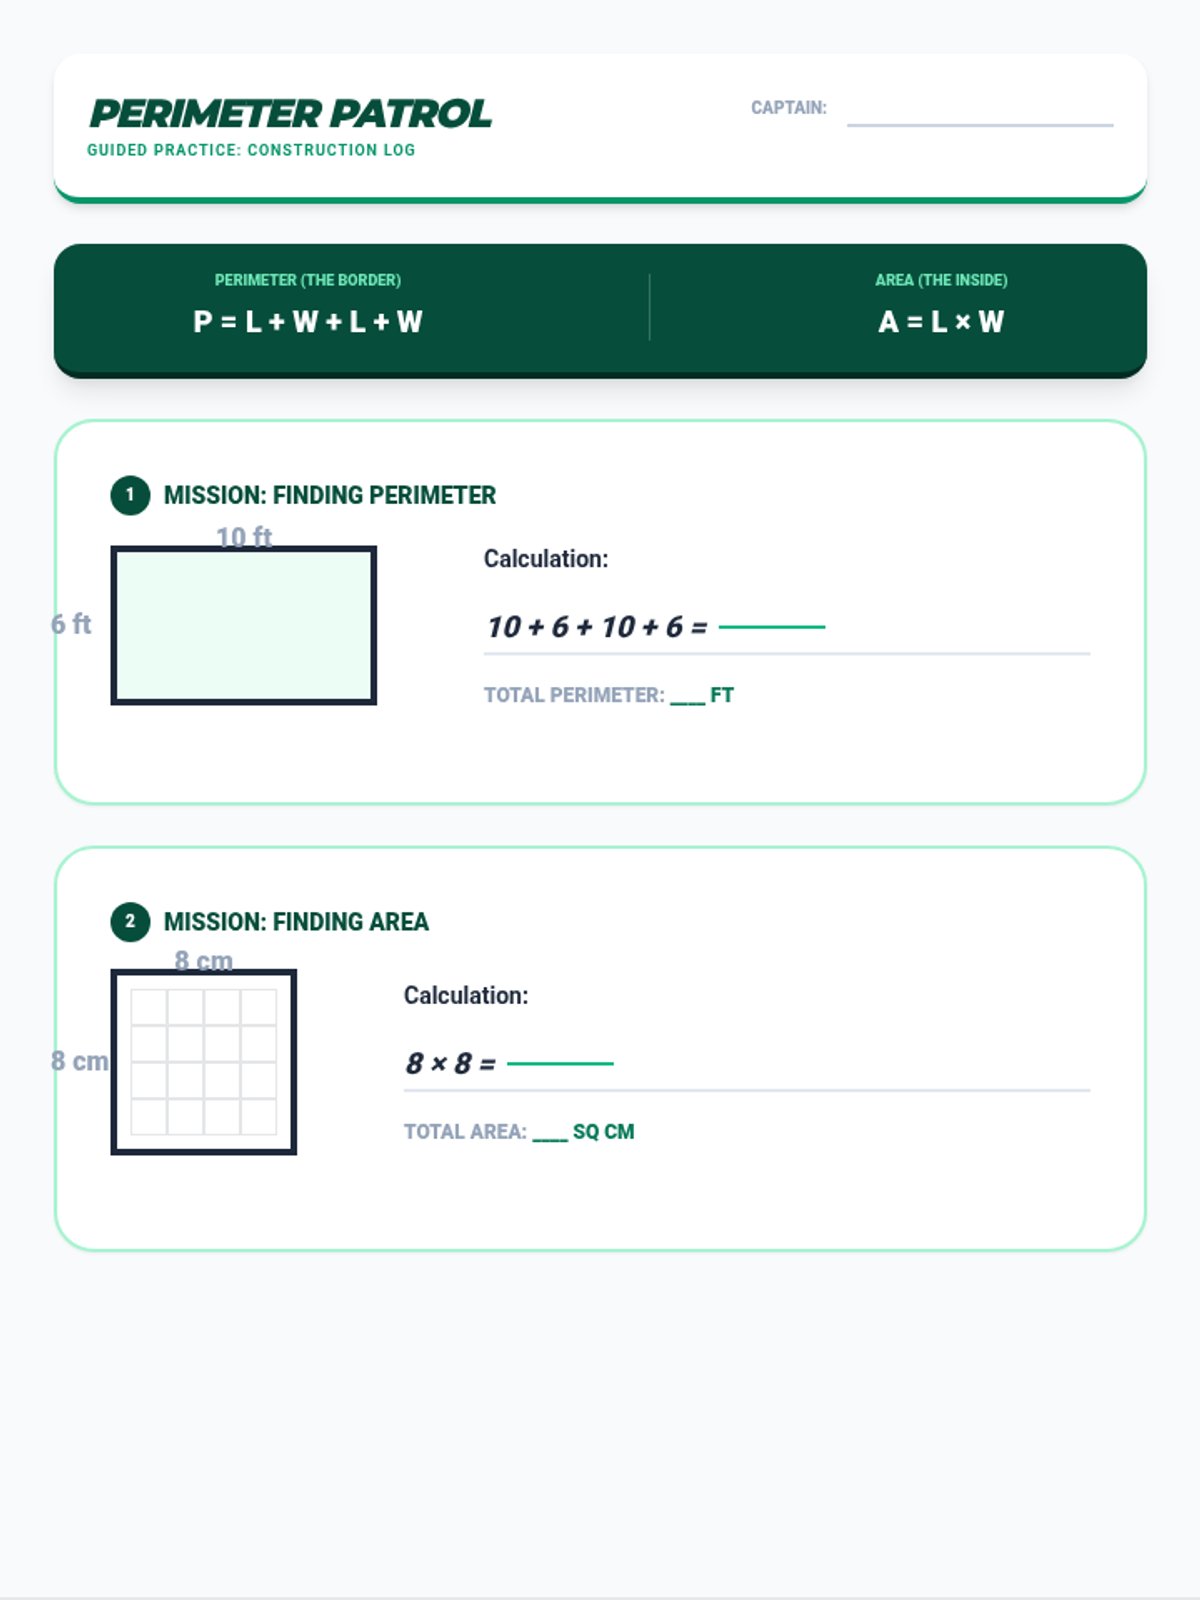
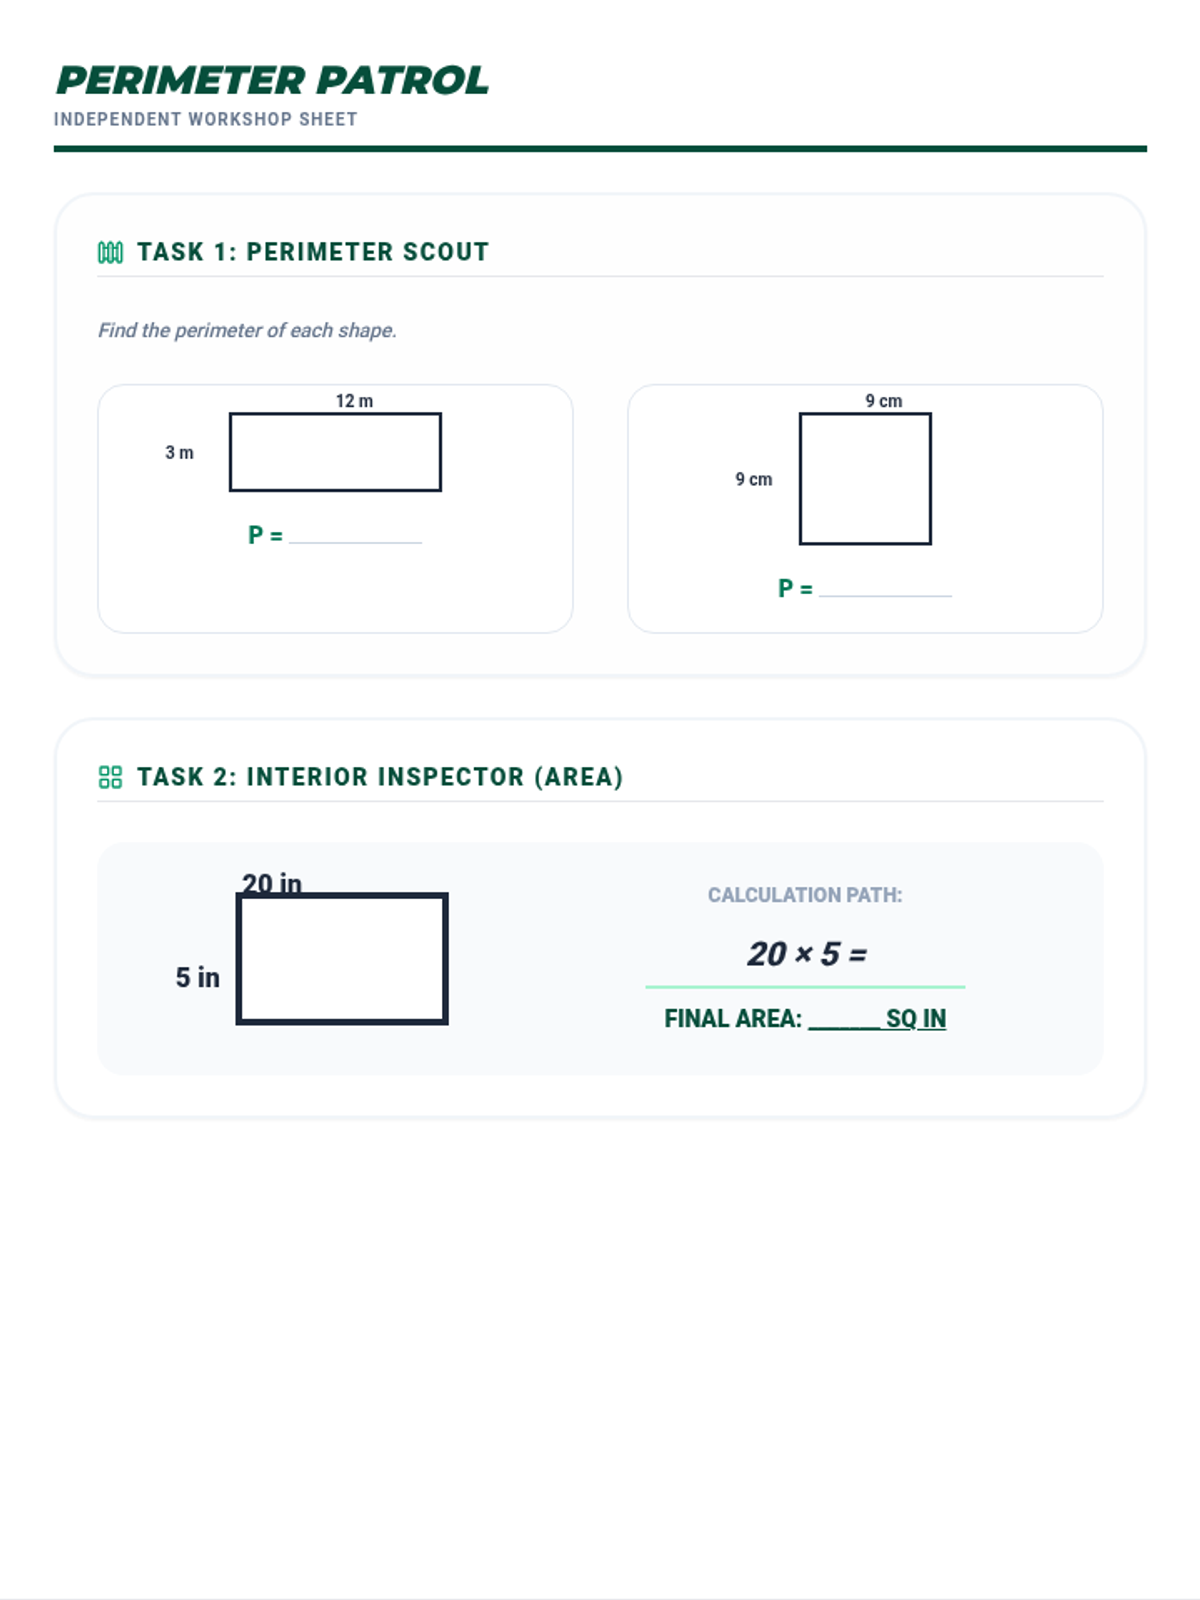
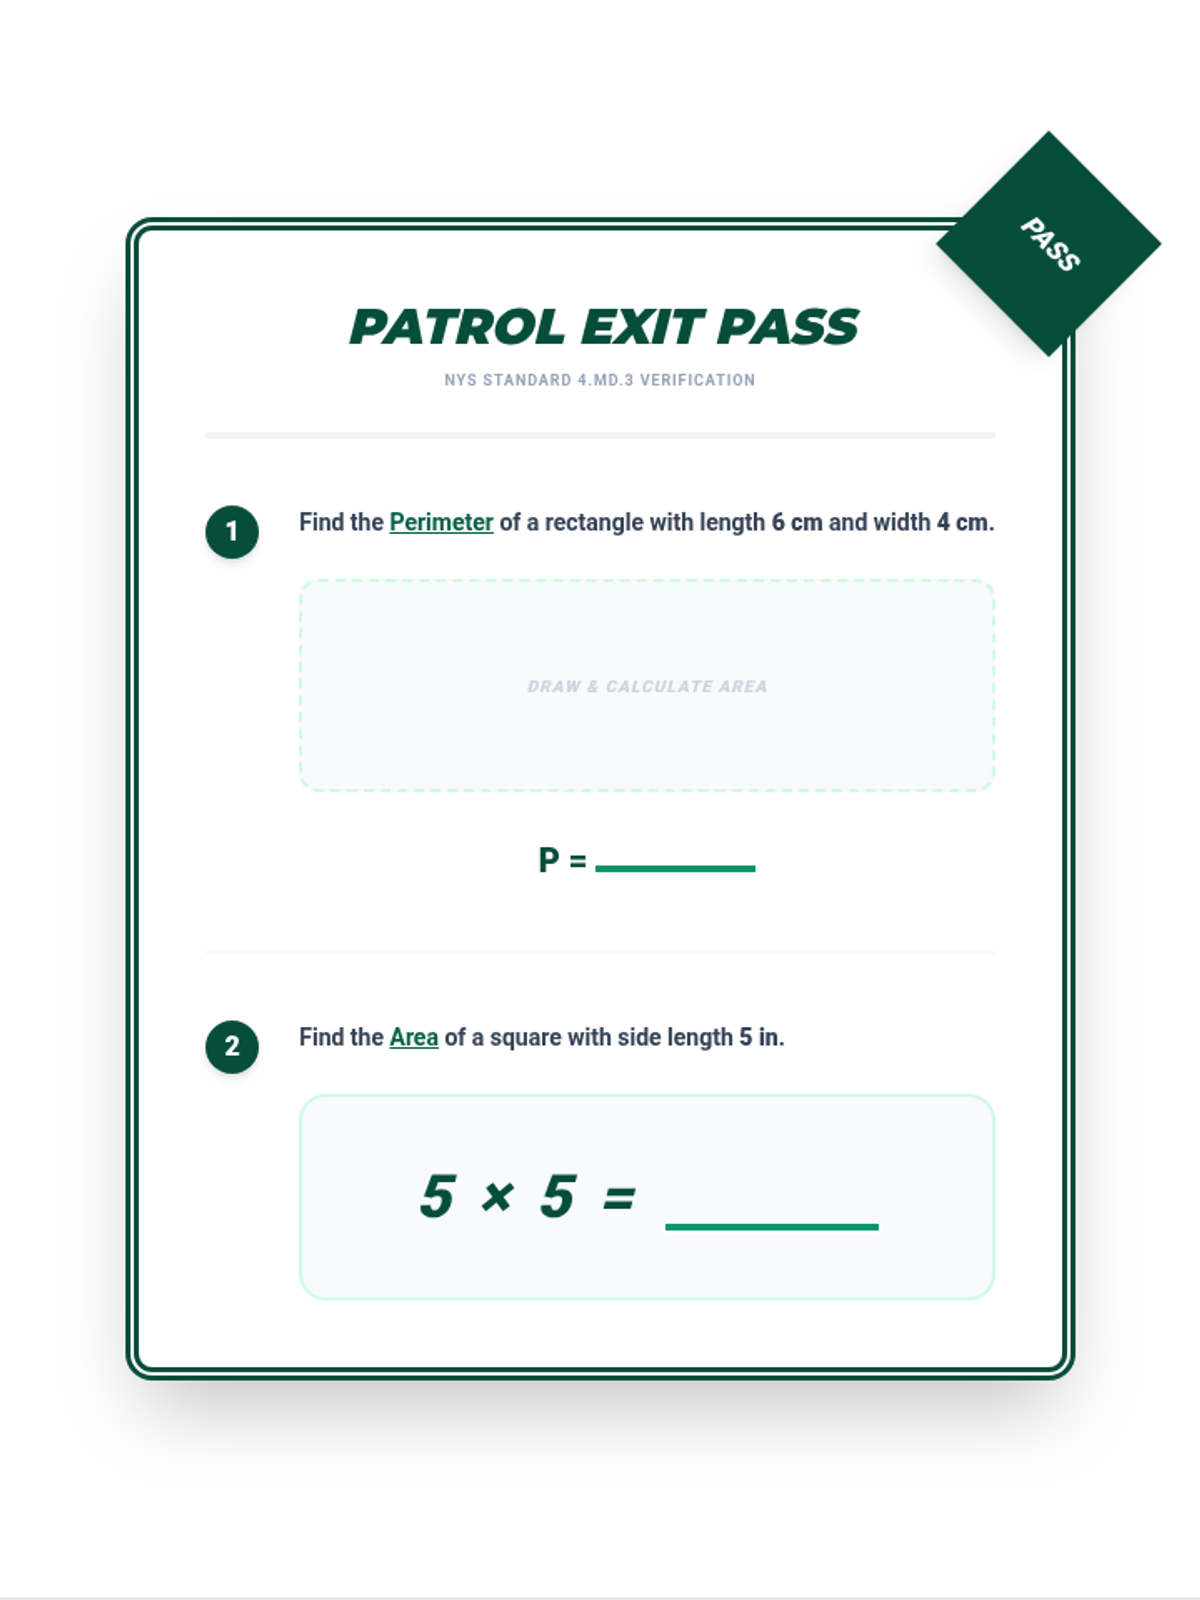
Tier 2 reteach for standard 4.MD.3: Apply the area and perimeter formulas for rectangles.
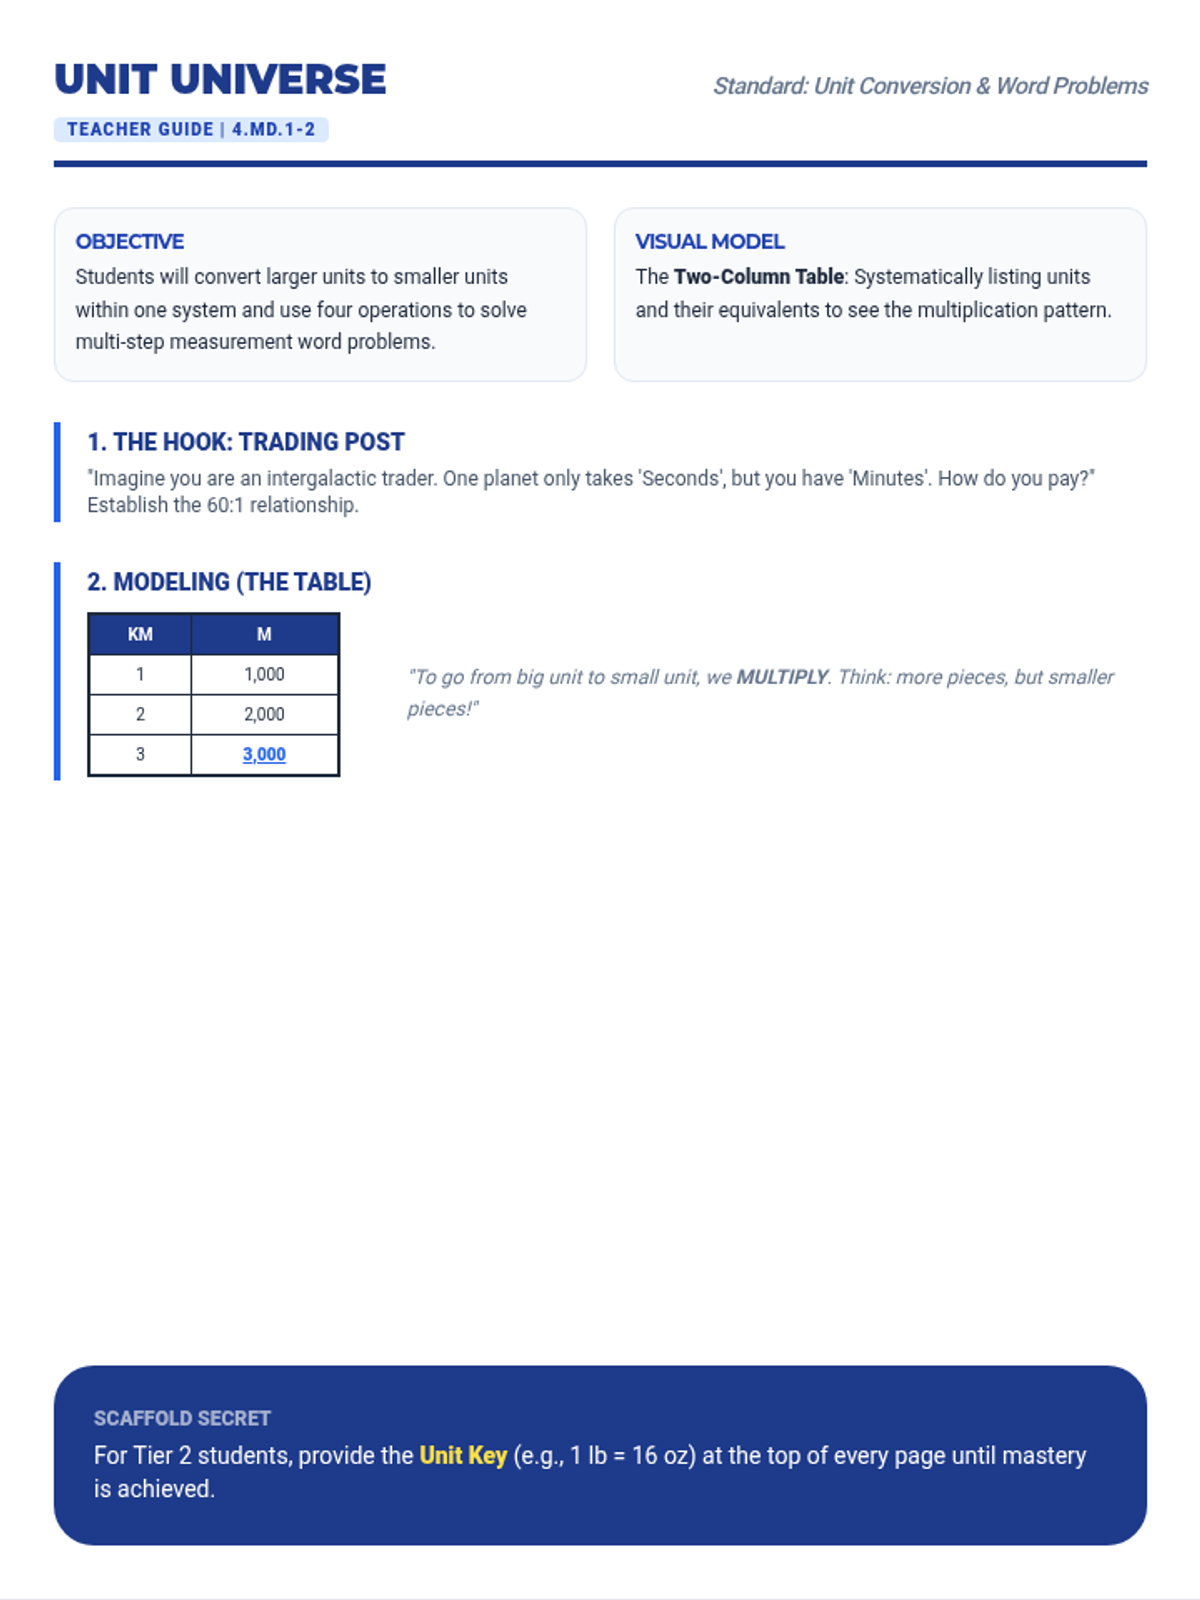
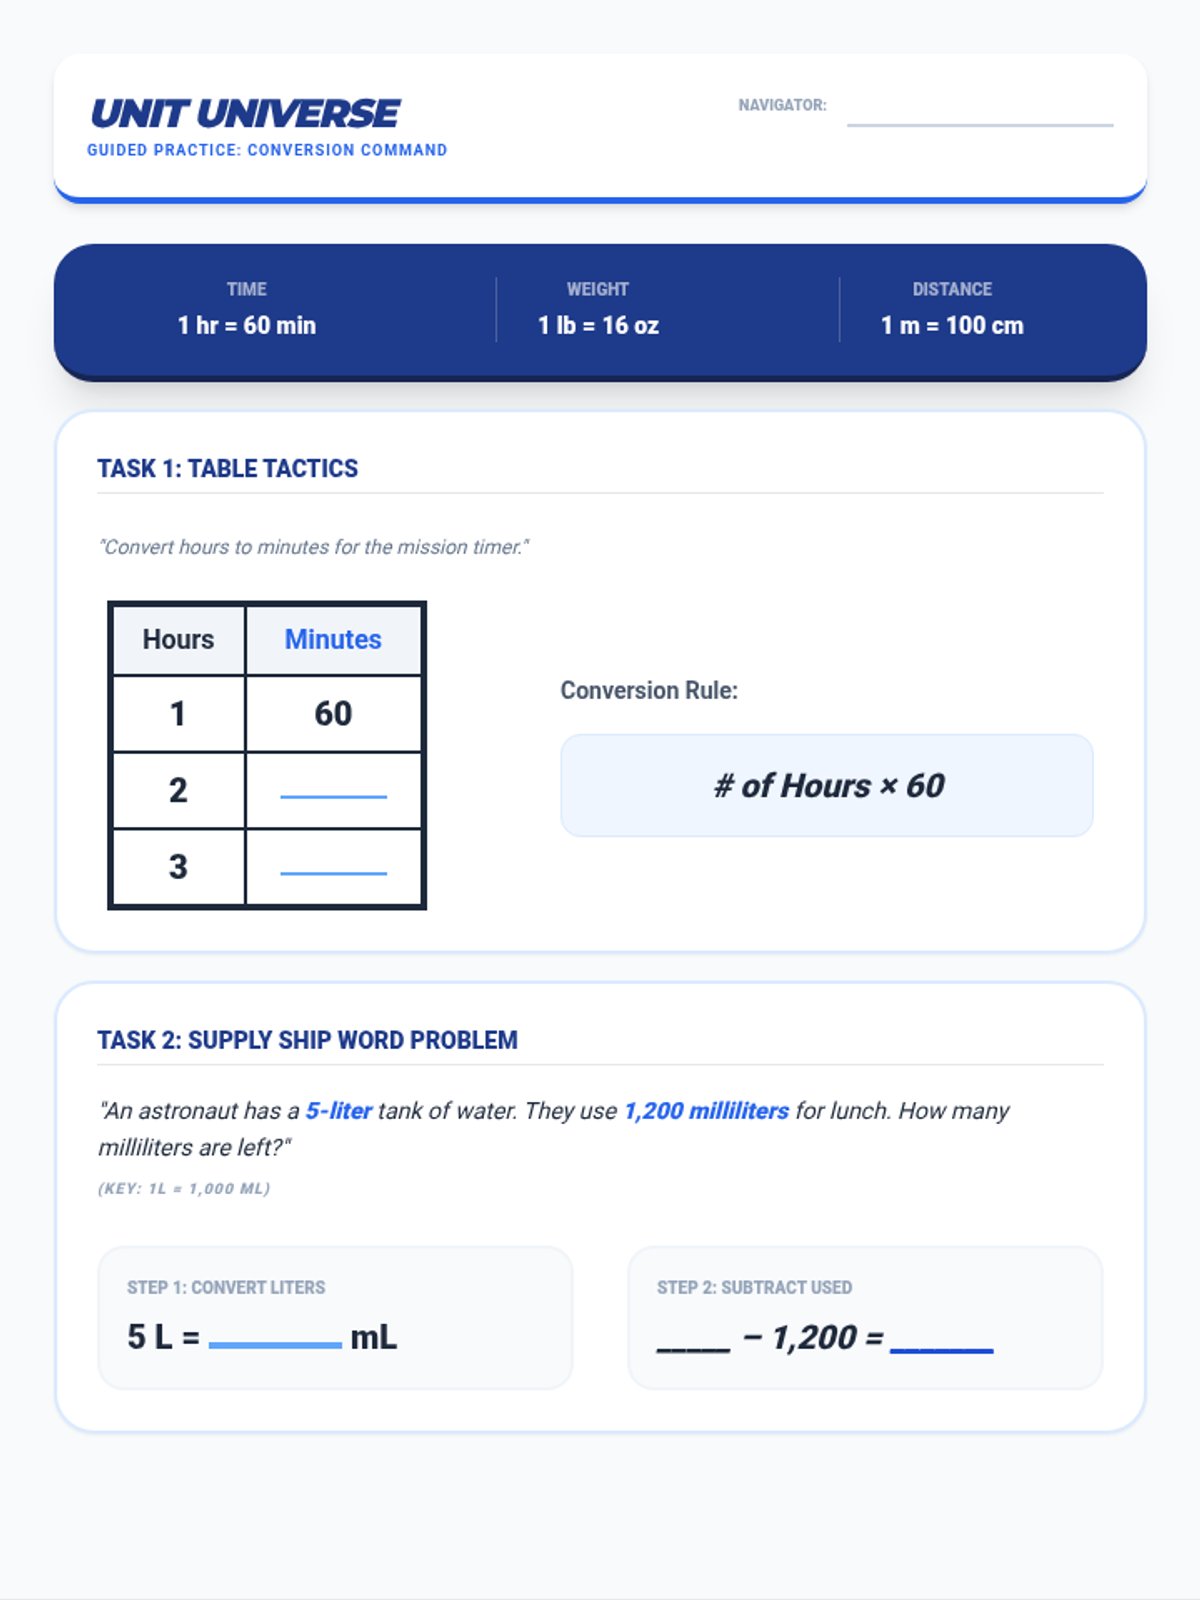
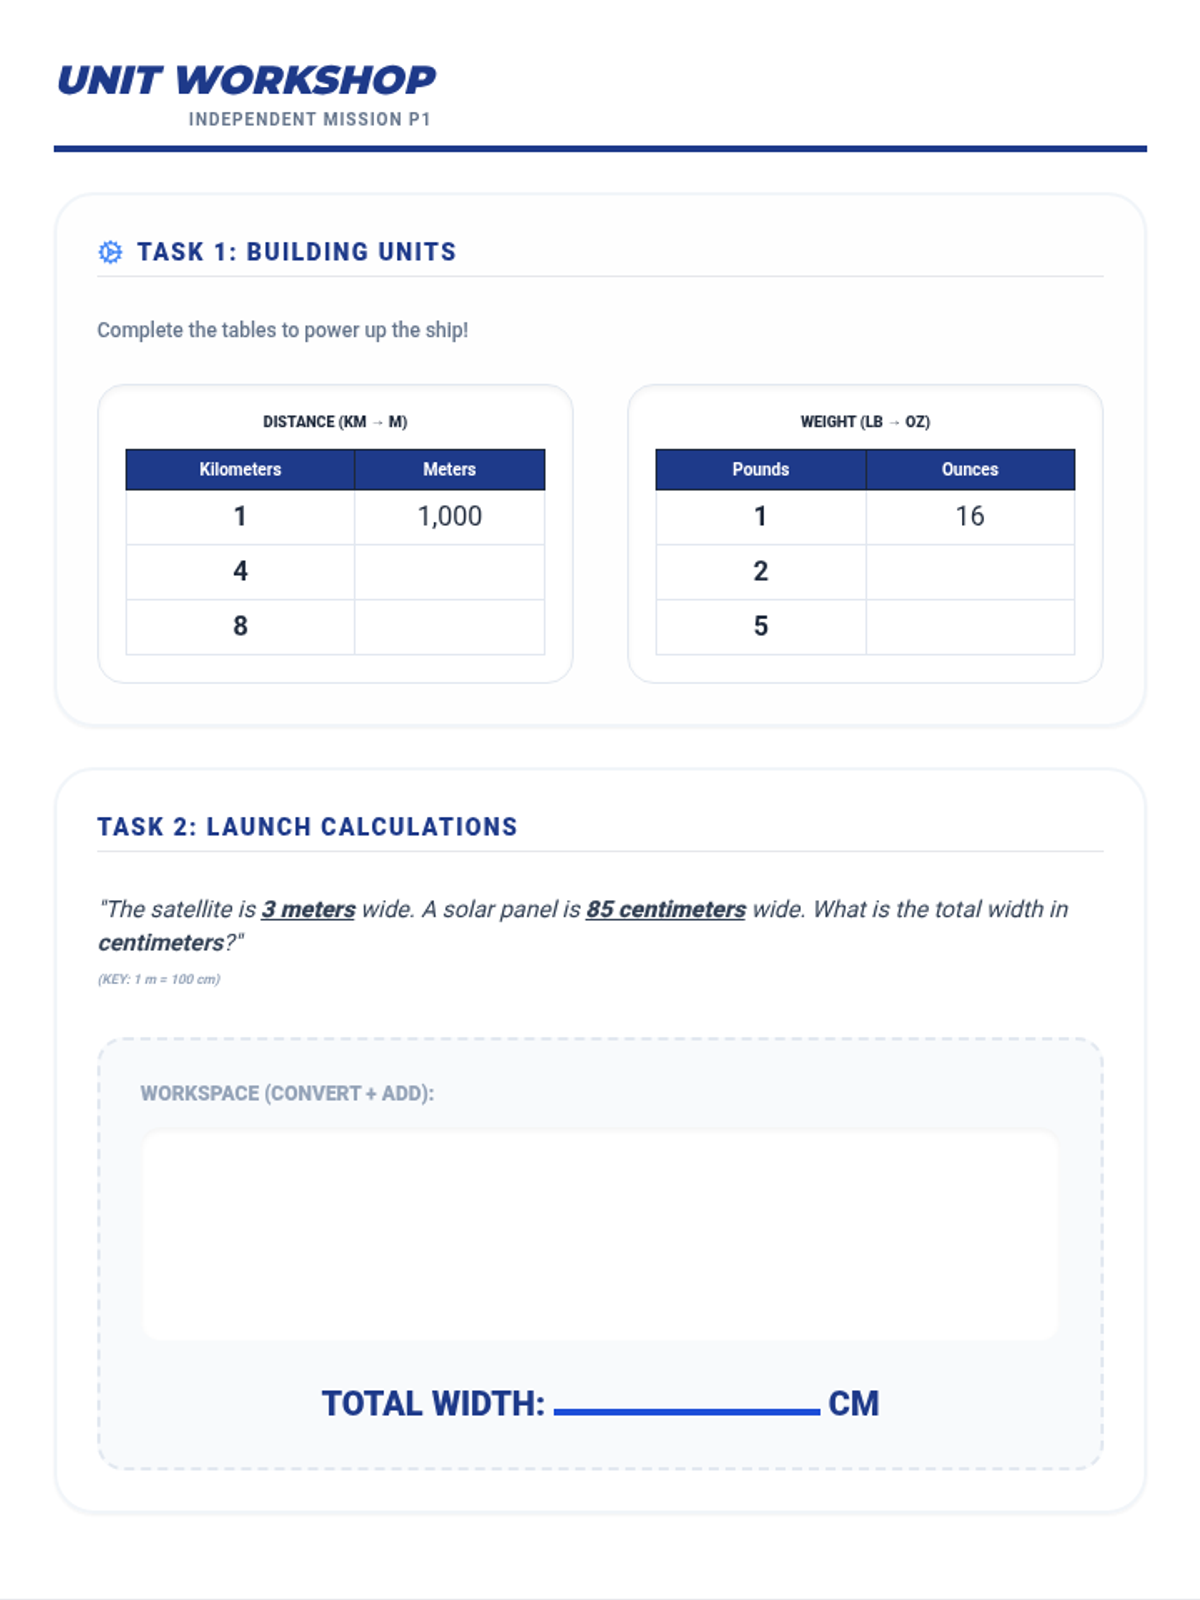
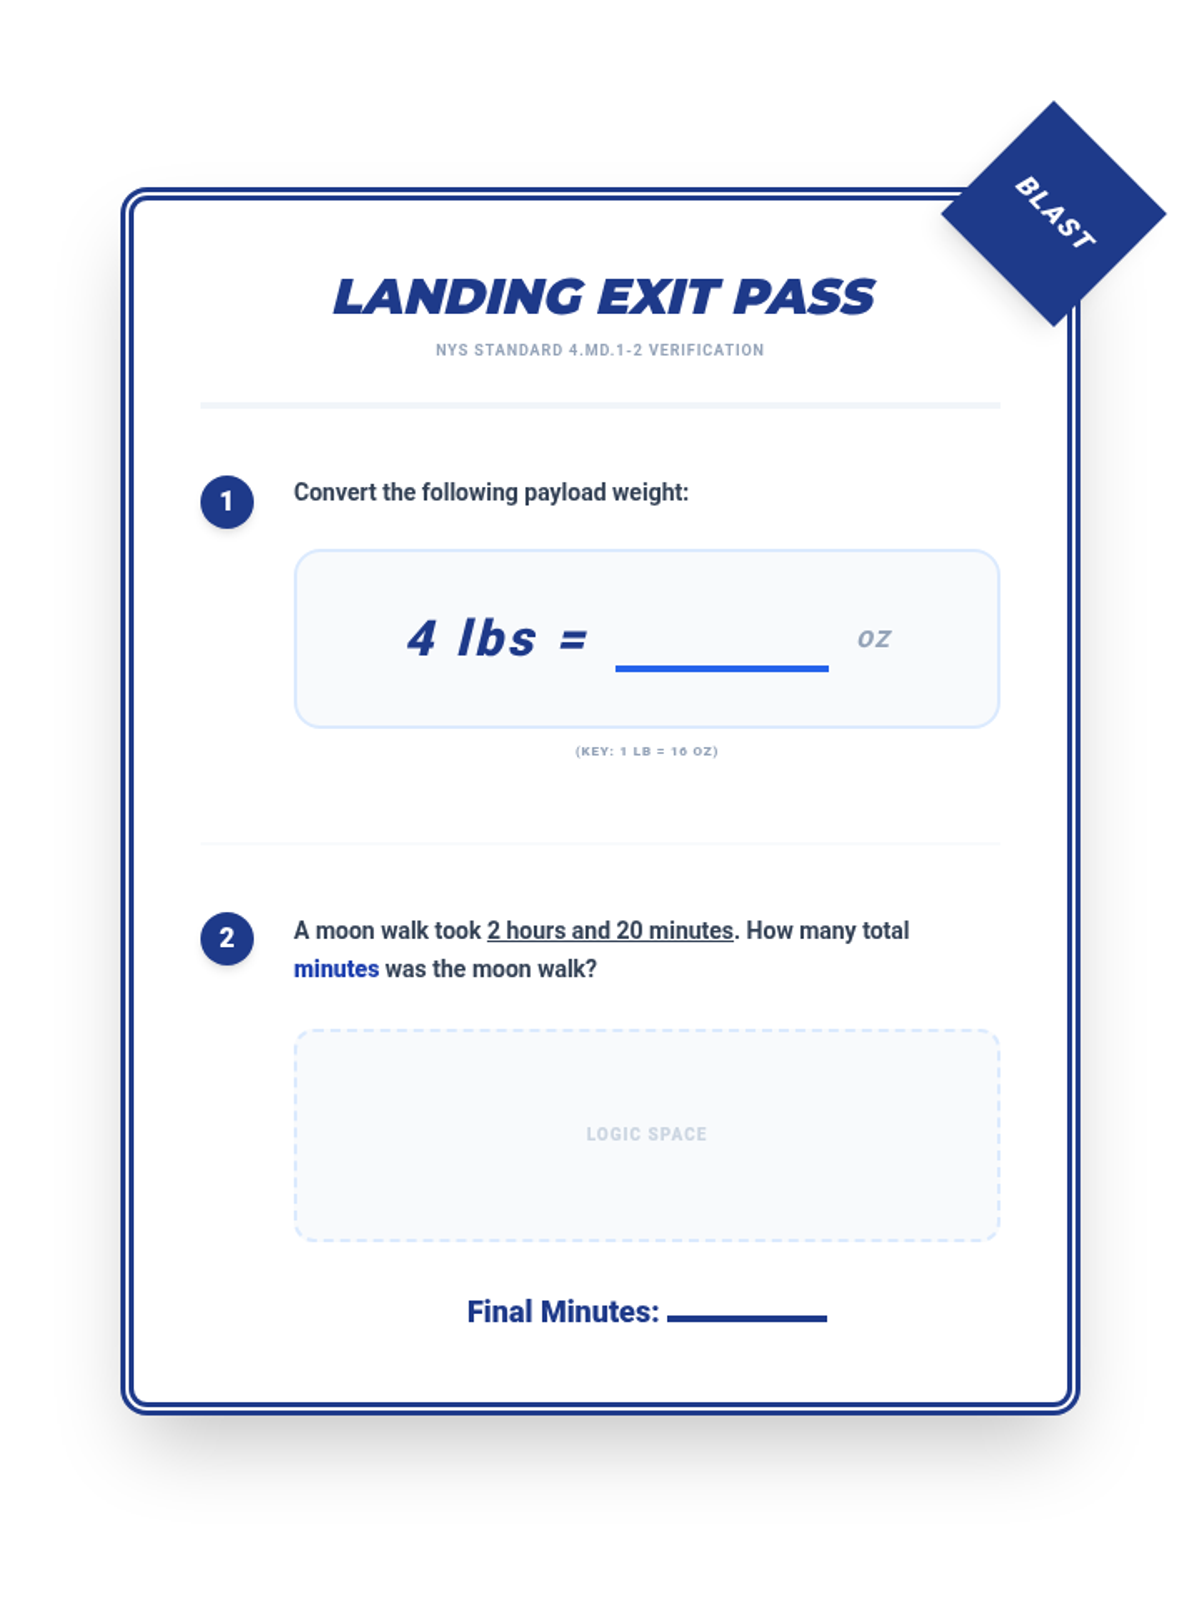
Tier 2 reteach for standards 4.MD.1 & 4.MD.2: Relative sizes of measurement units and solving word problems involving distance, time, volume, and mass.
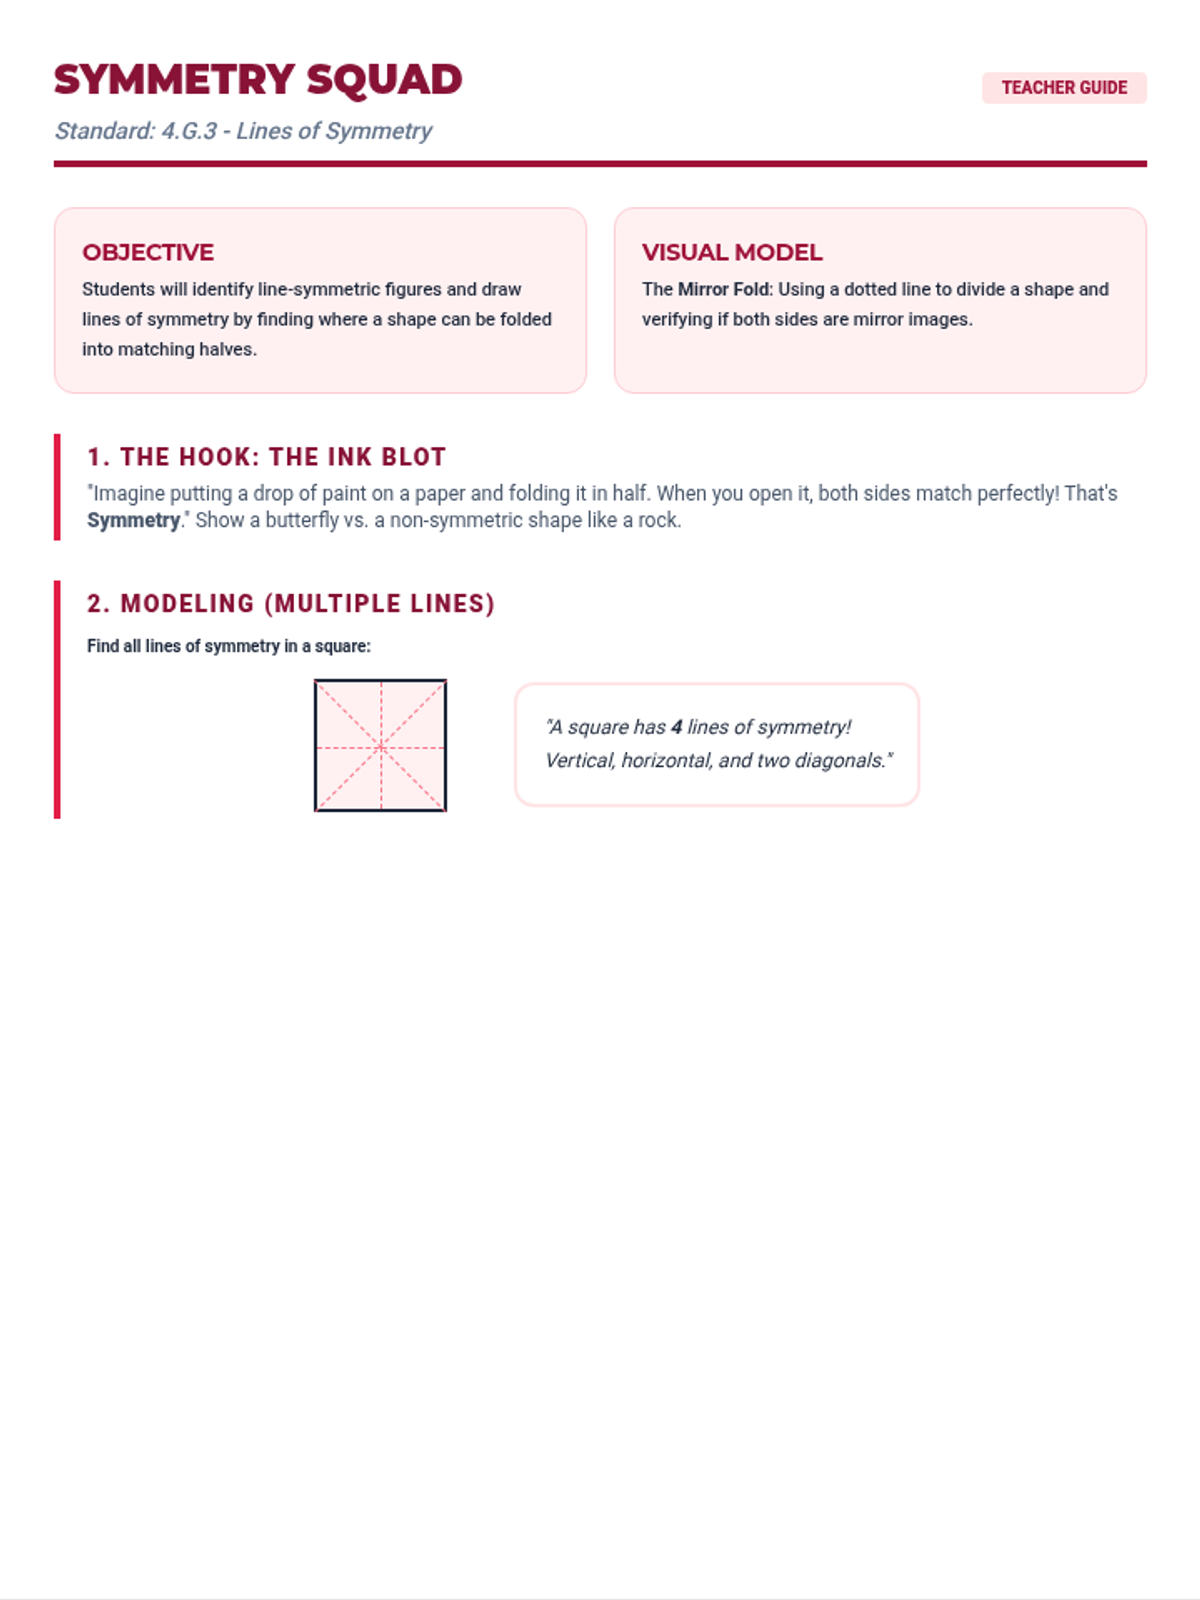
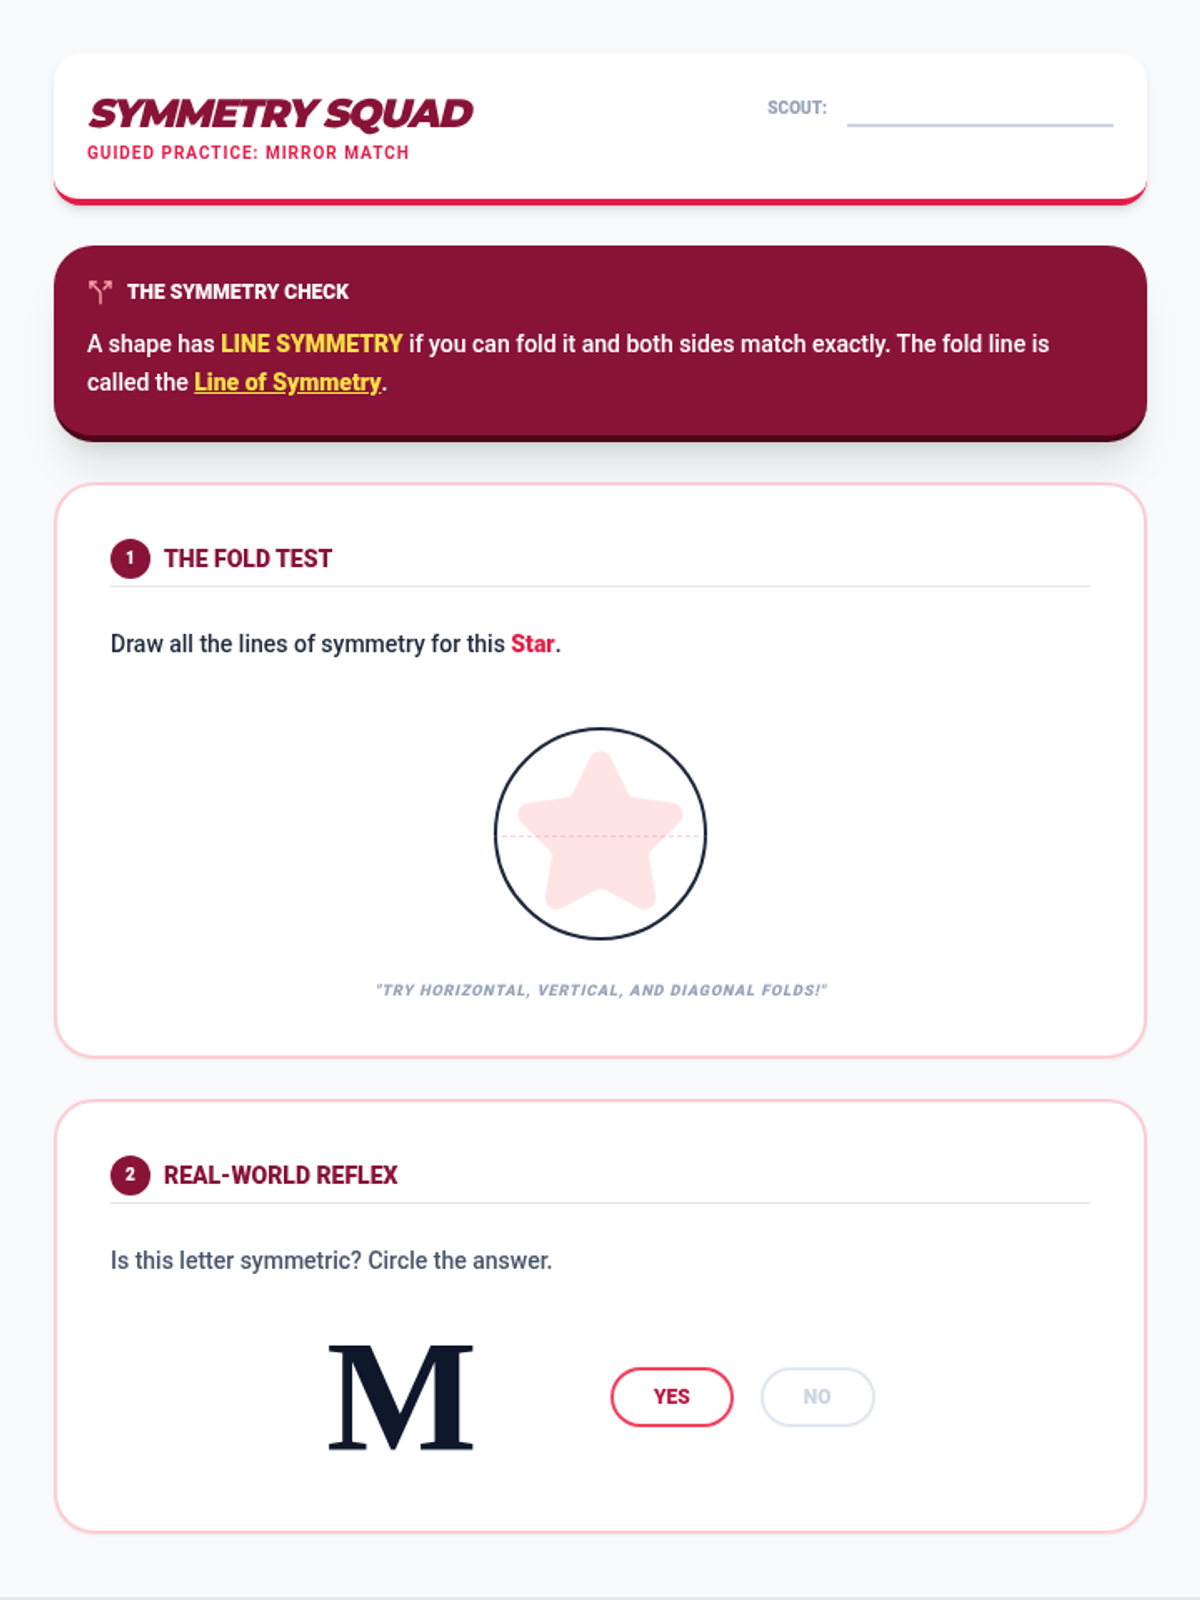
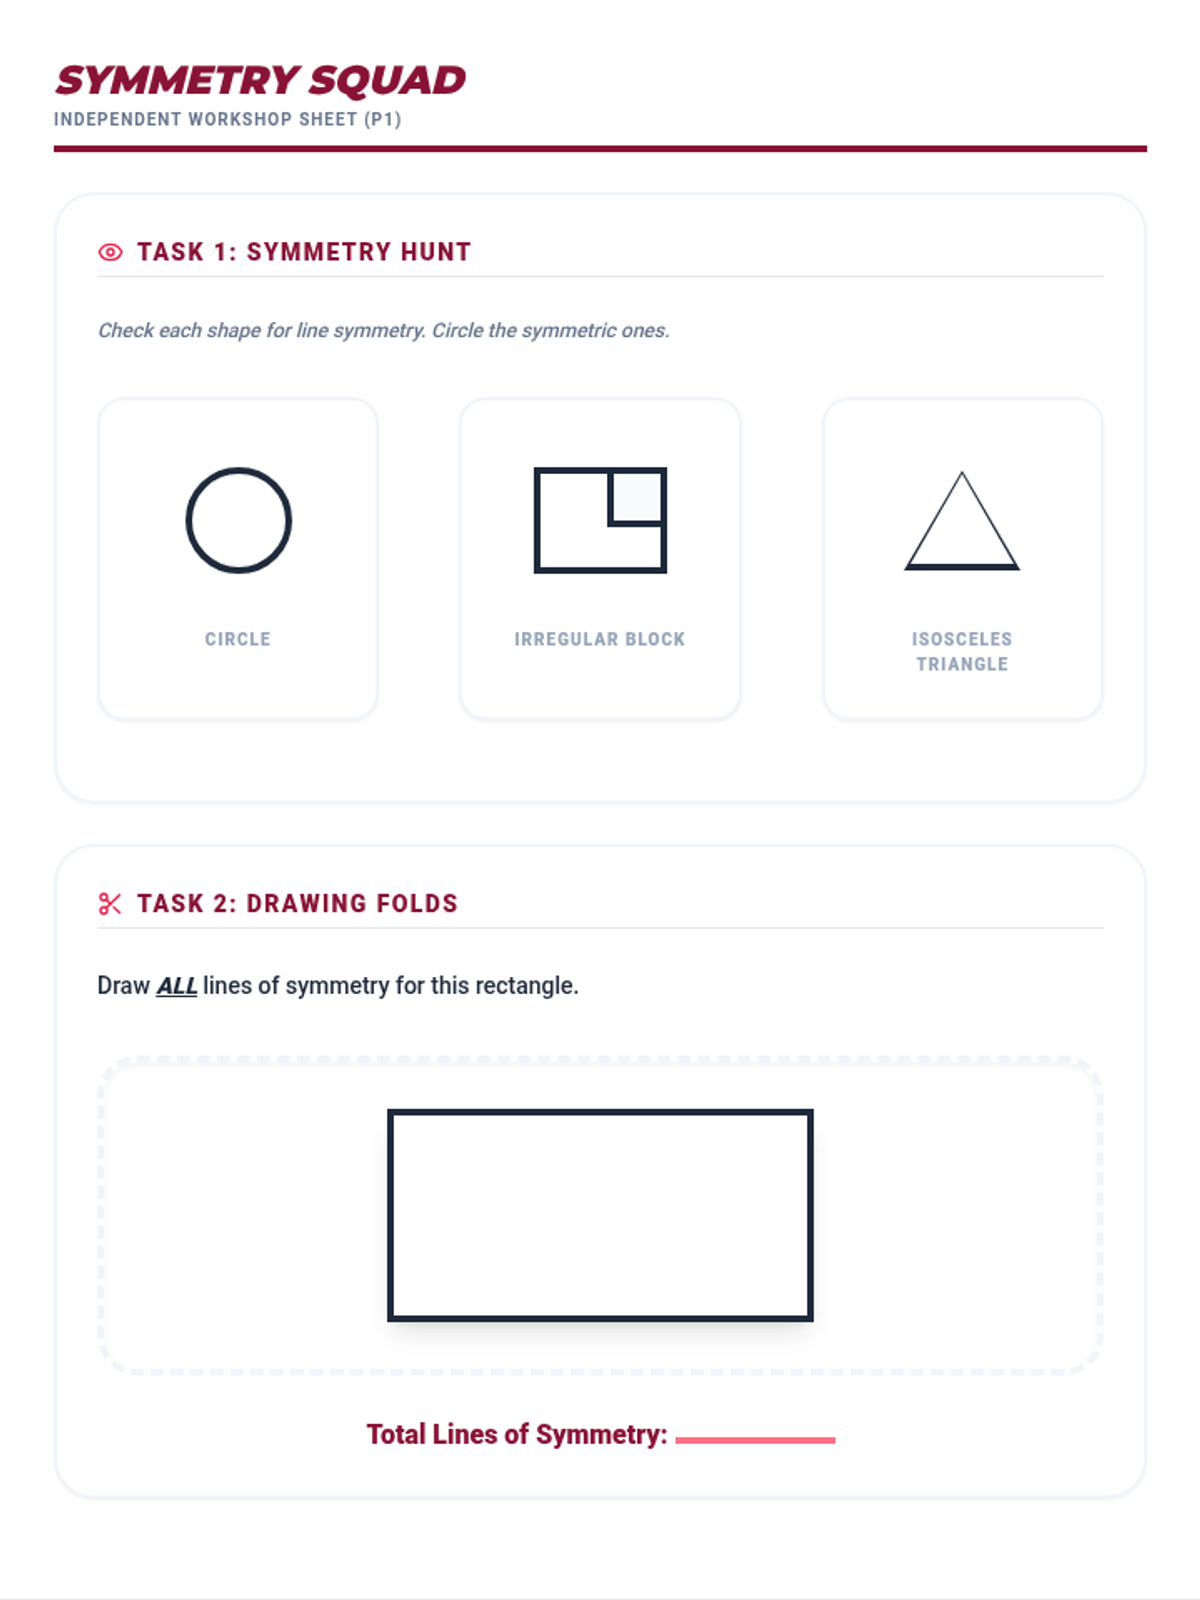
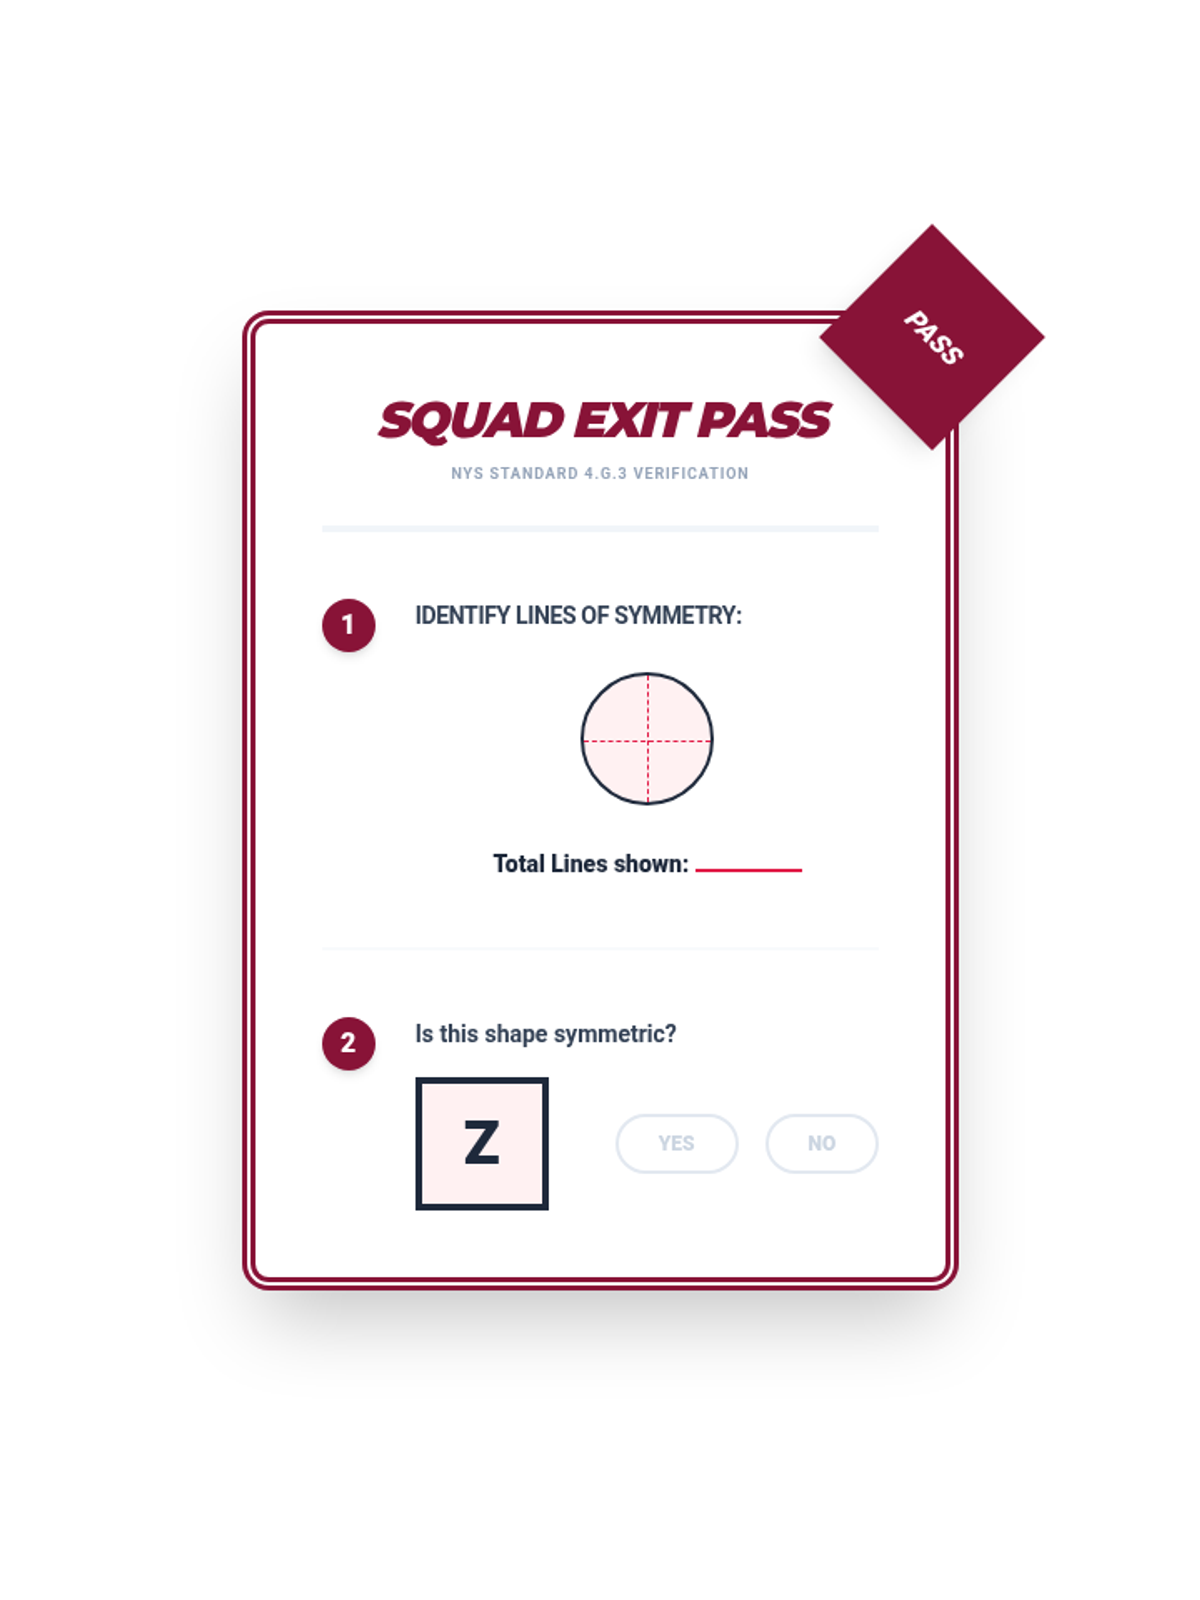
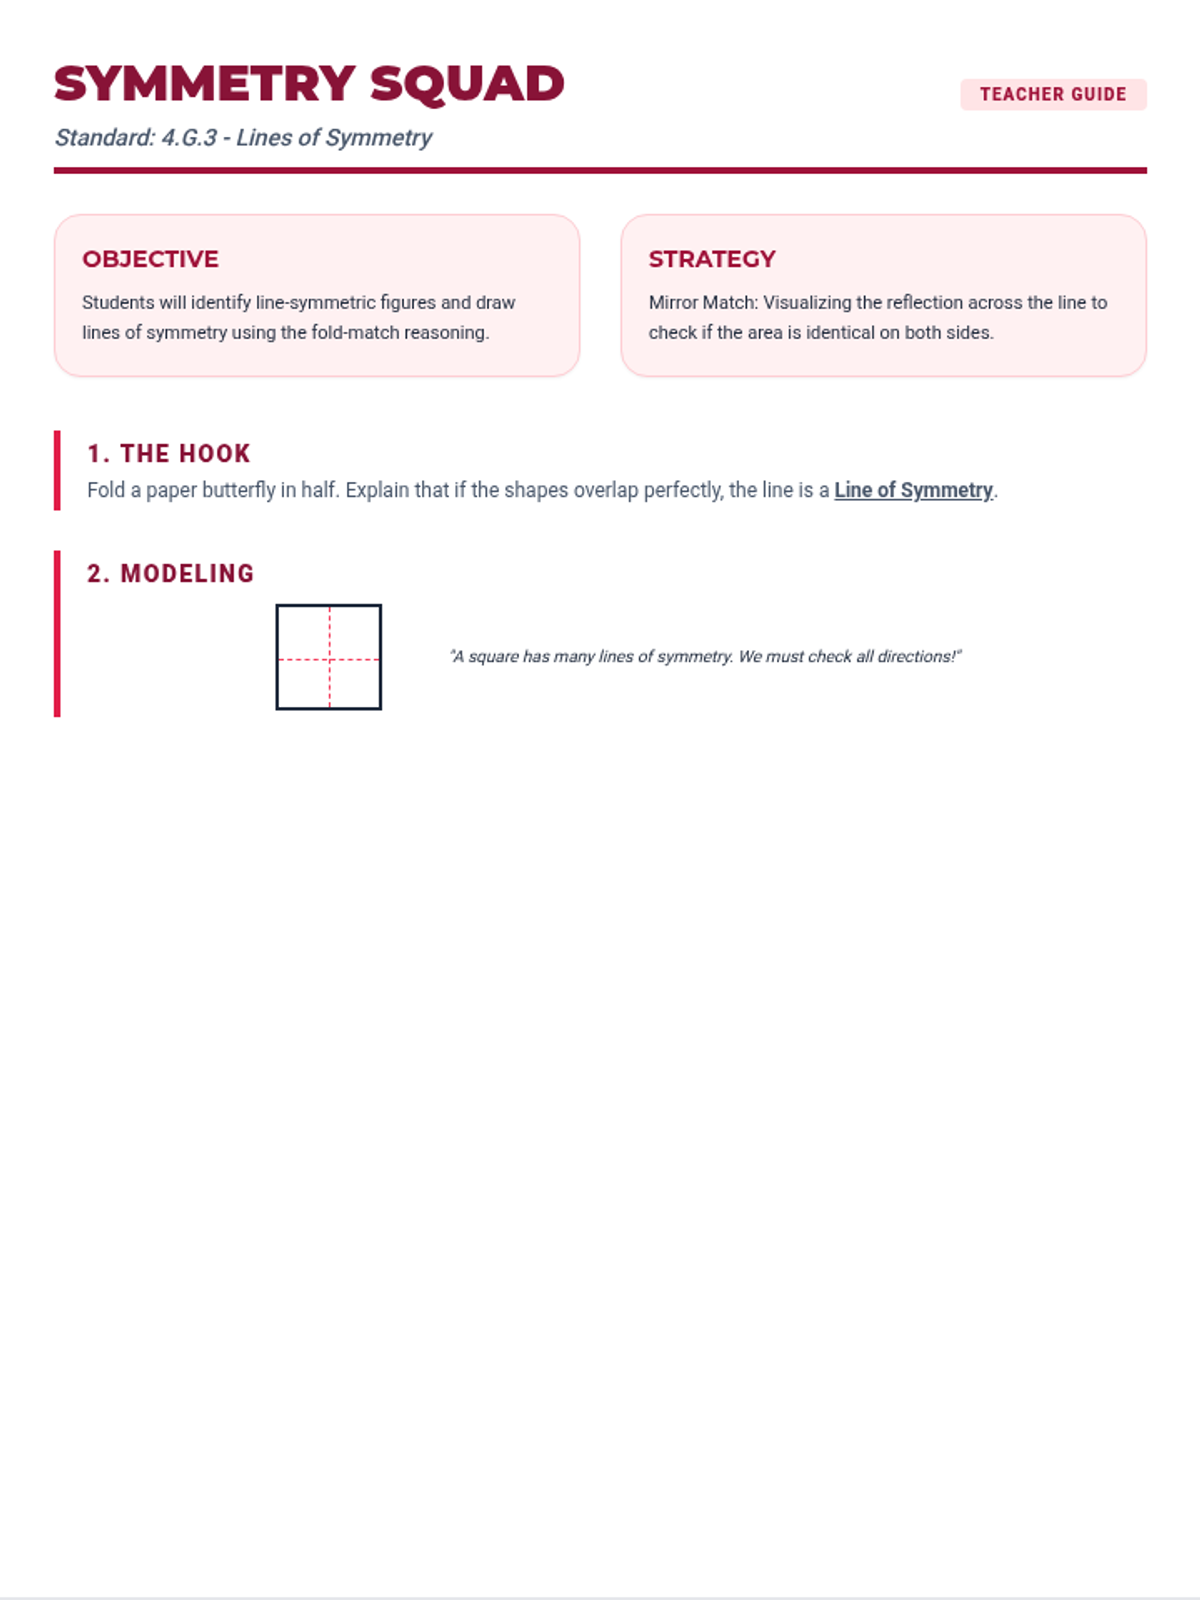
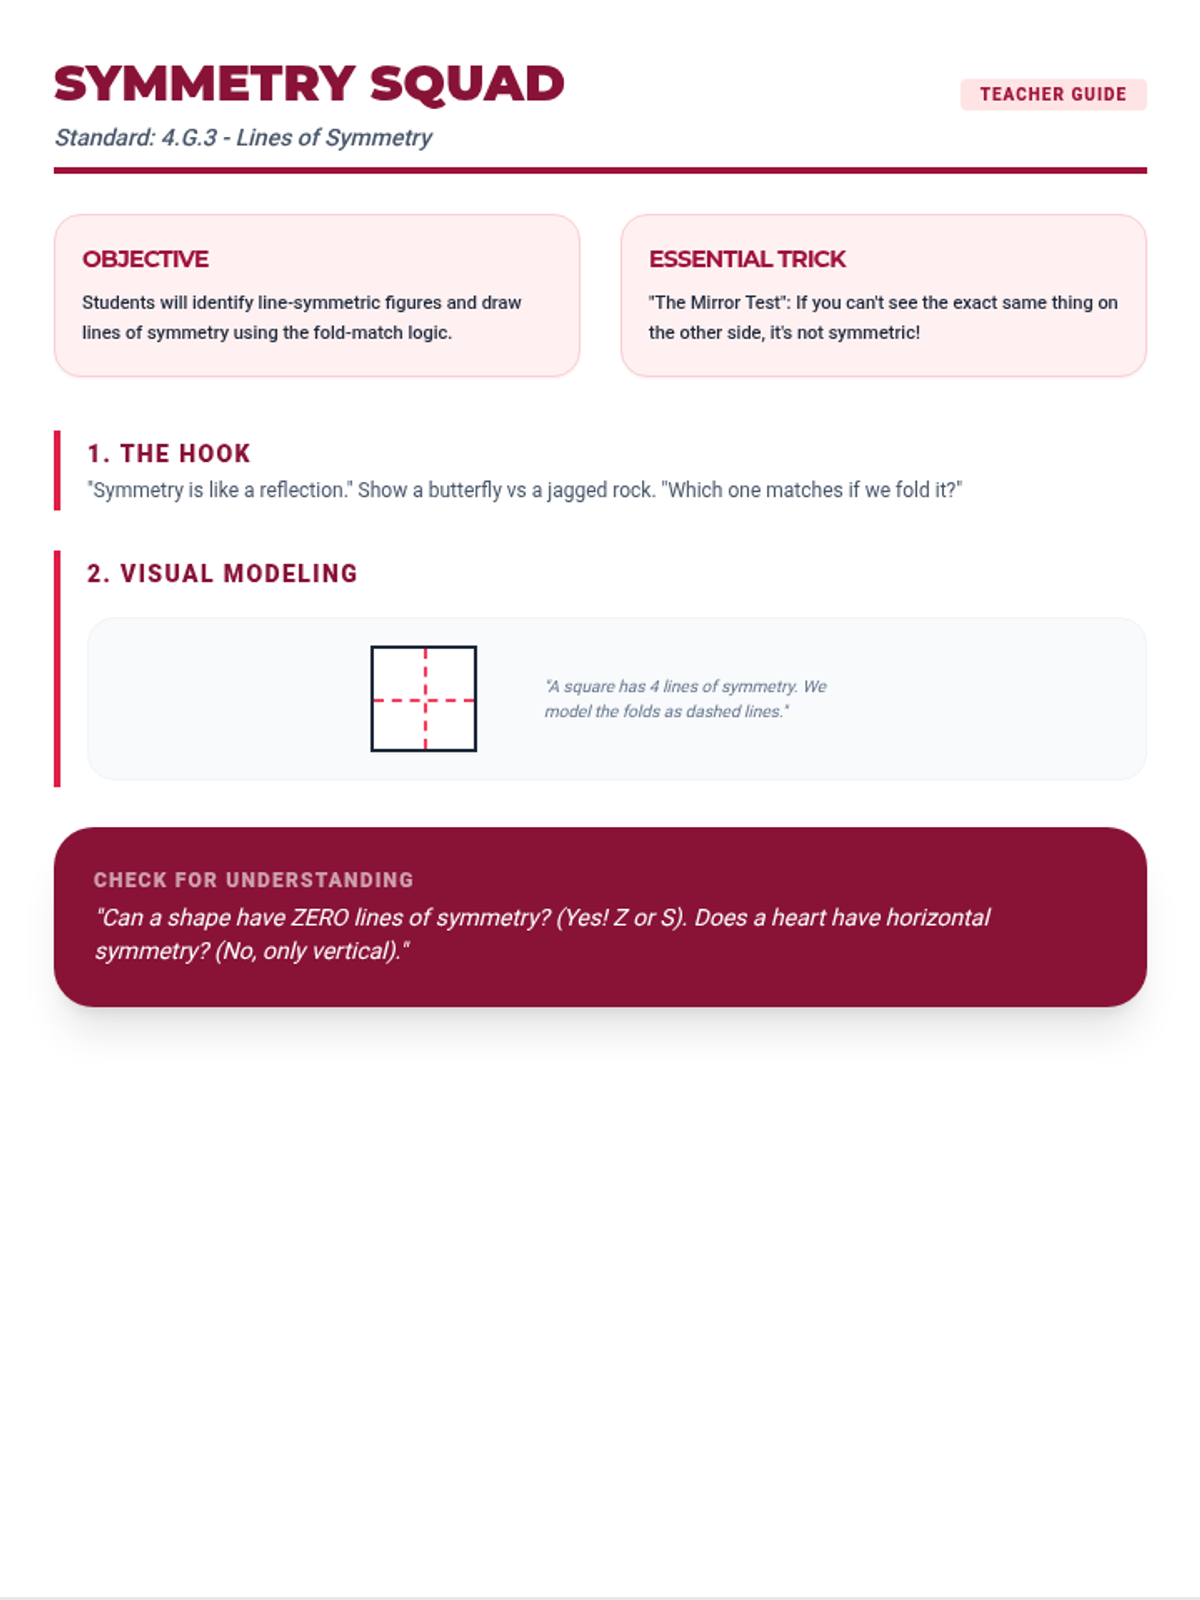
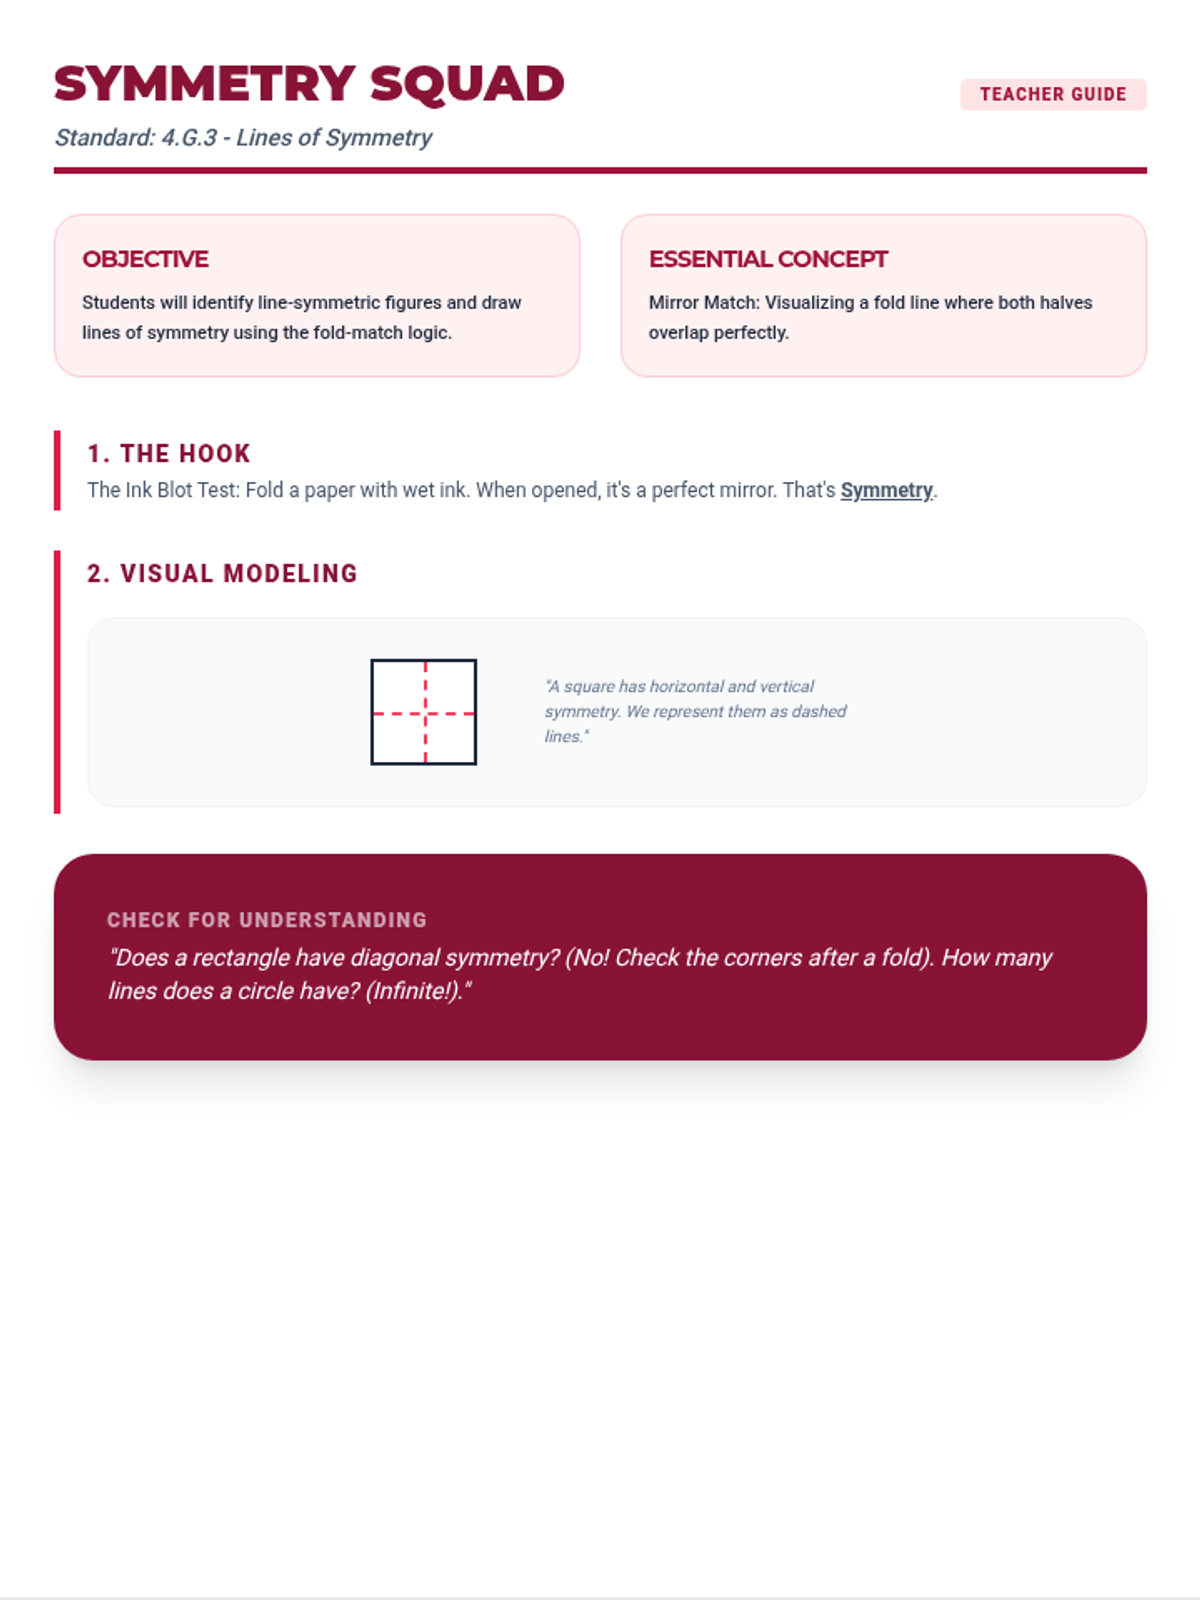
Tier 2 reteach for standard 4.G.3: Recognize a line of symmetry for a two-dimensional figure as a line across the figure such that the figure can be folded along the line into matching parts. Identify line-symmetric figures and draw lines of symmetry.
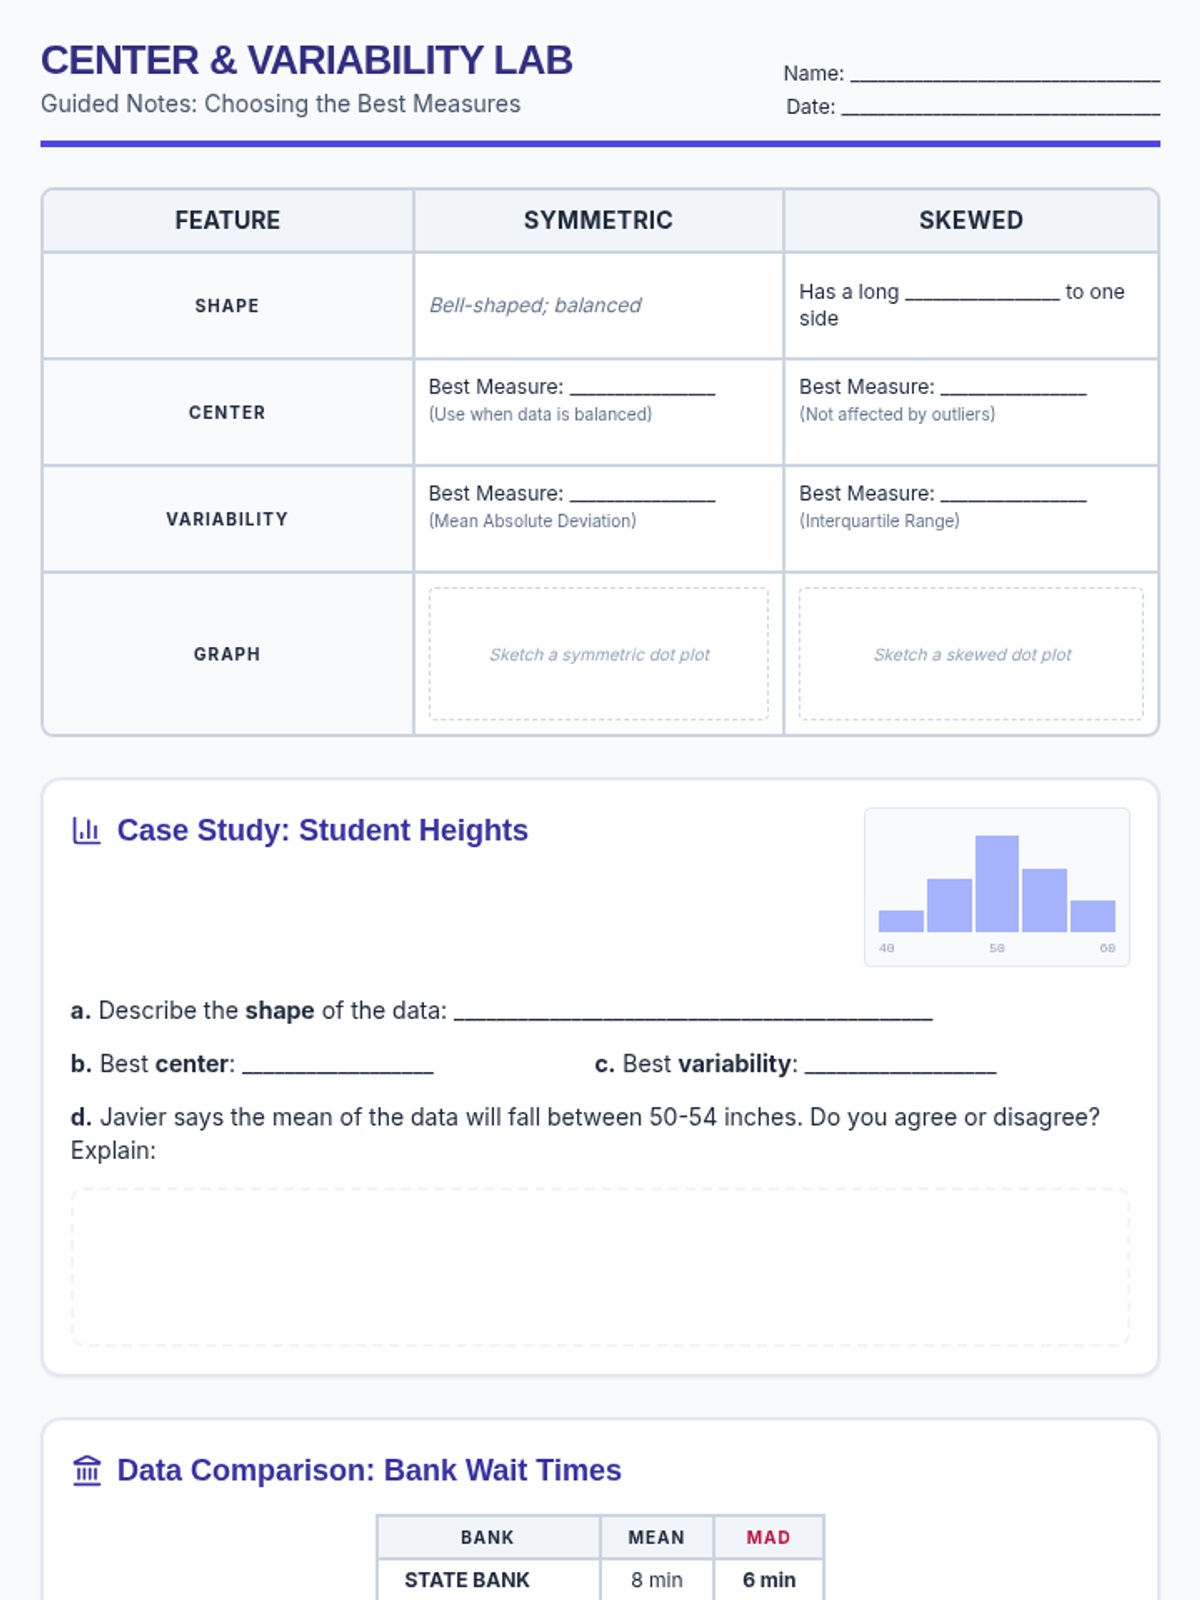
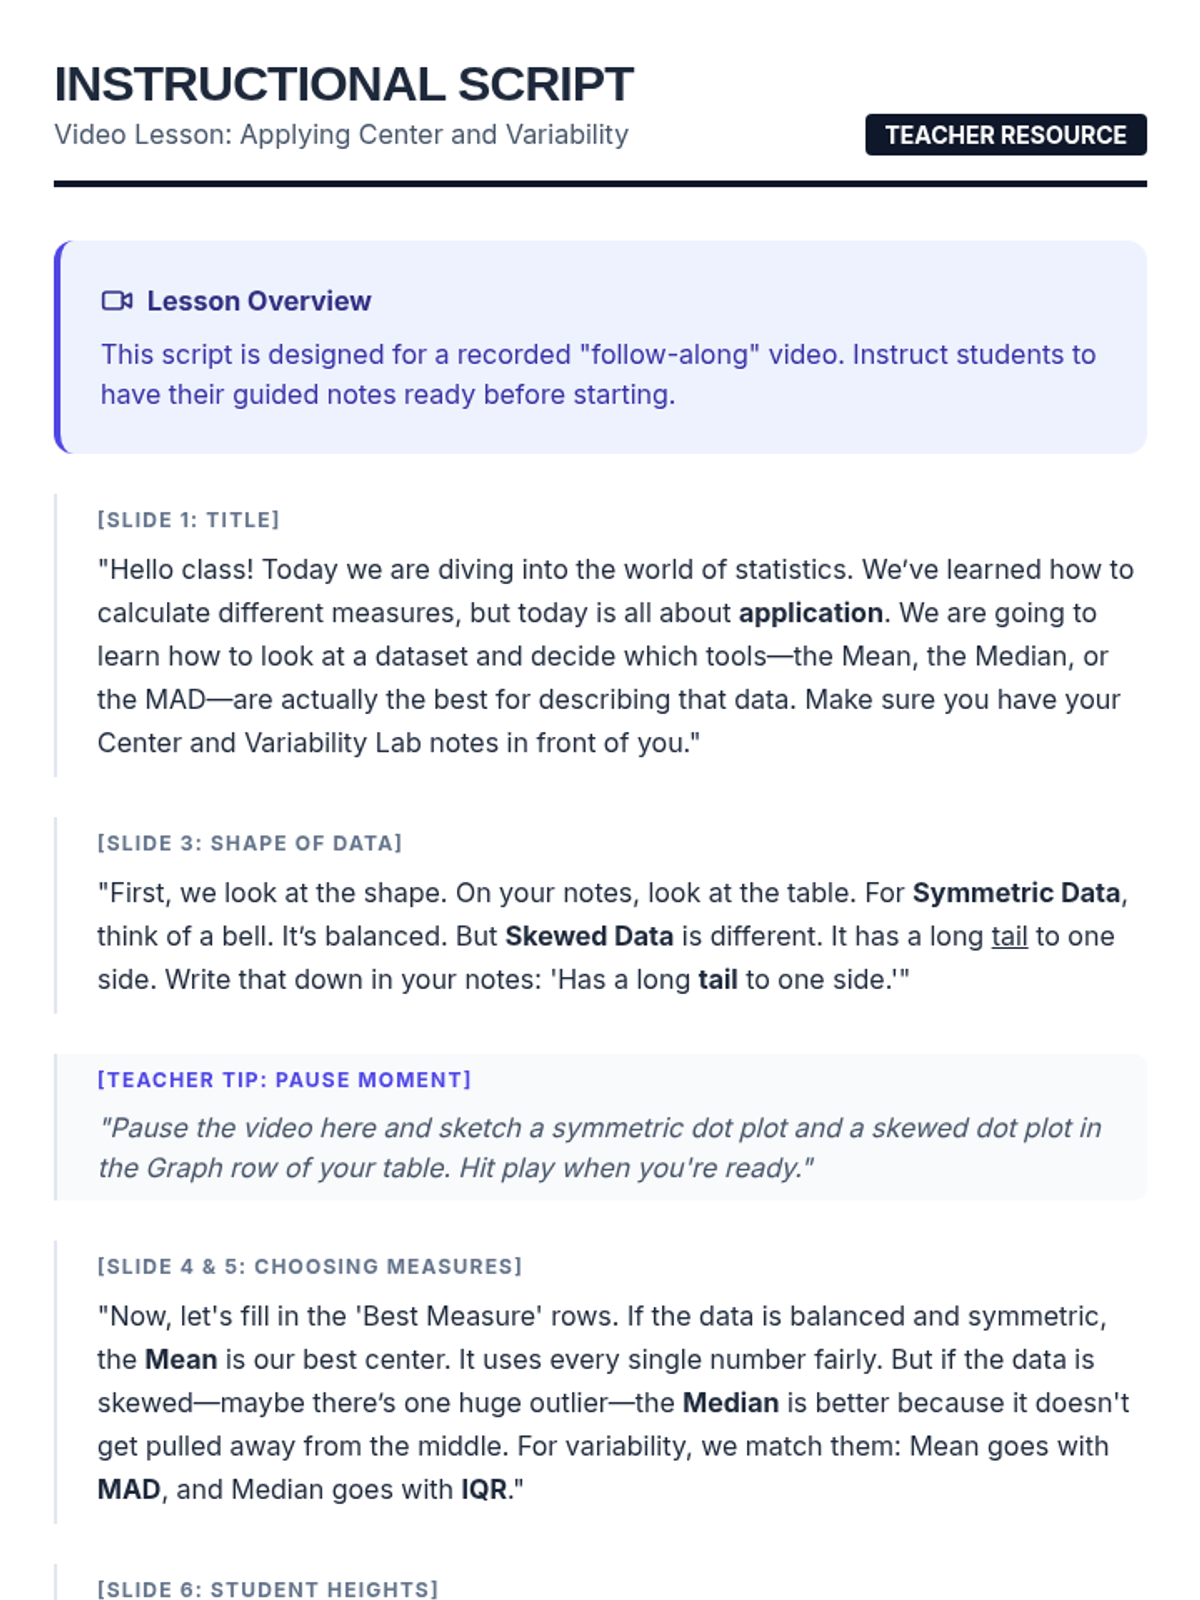
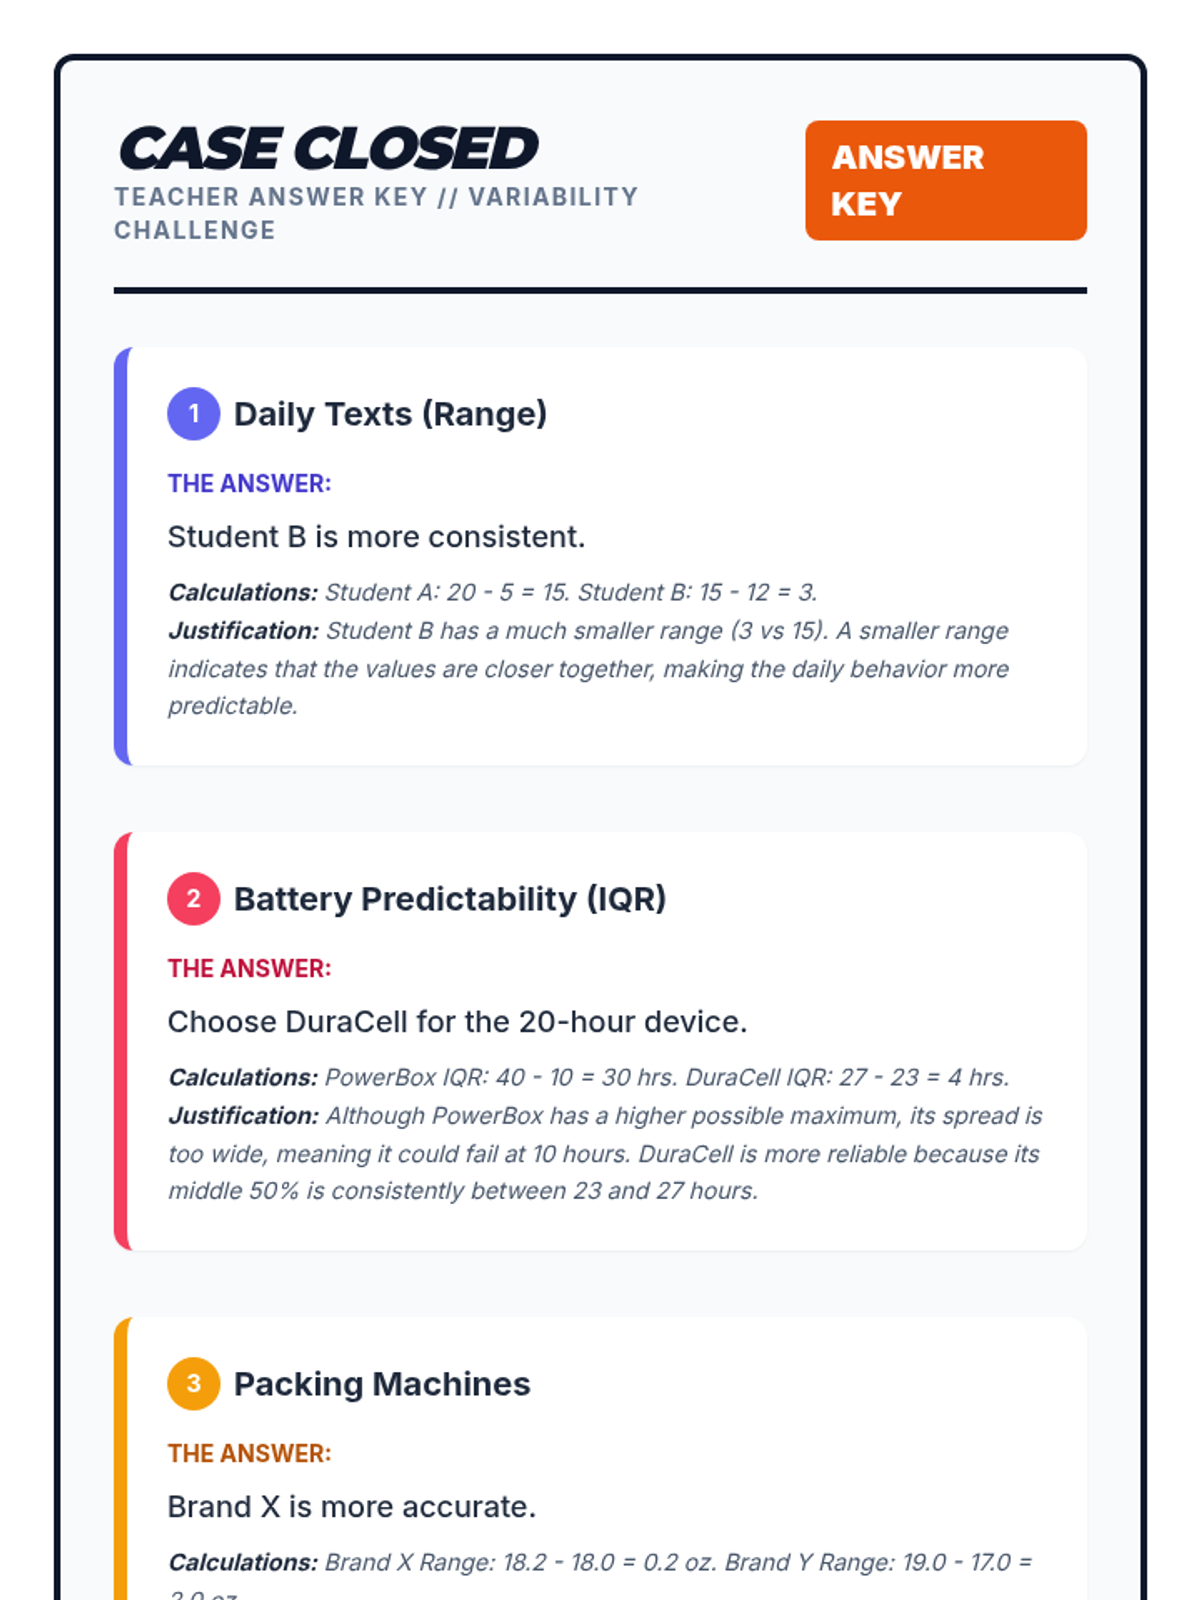
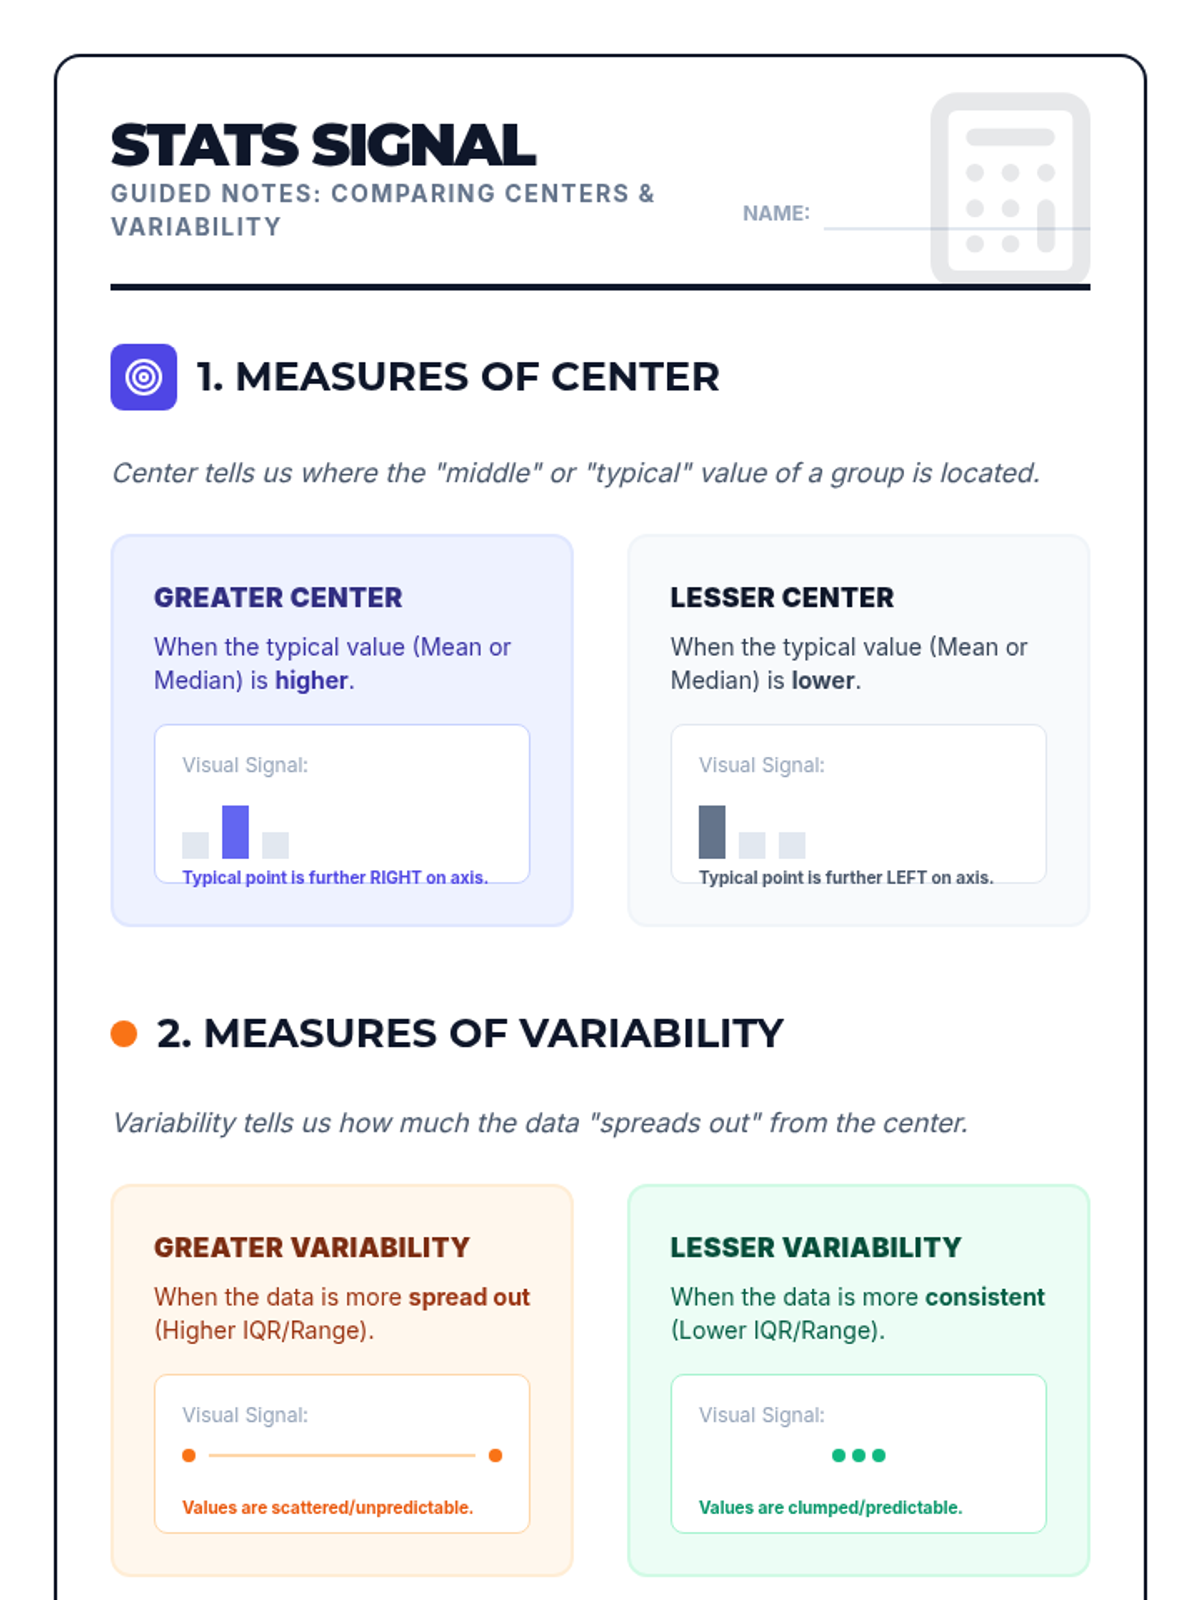
Students learn to select and apply appropriate measures of center and variability based on data distribution (symmetric vs. skewed), with real-world practice comparing wait times and student heights.
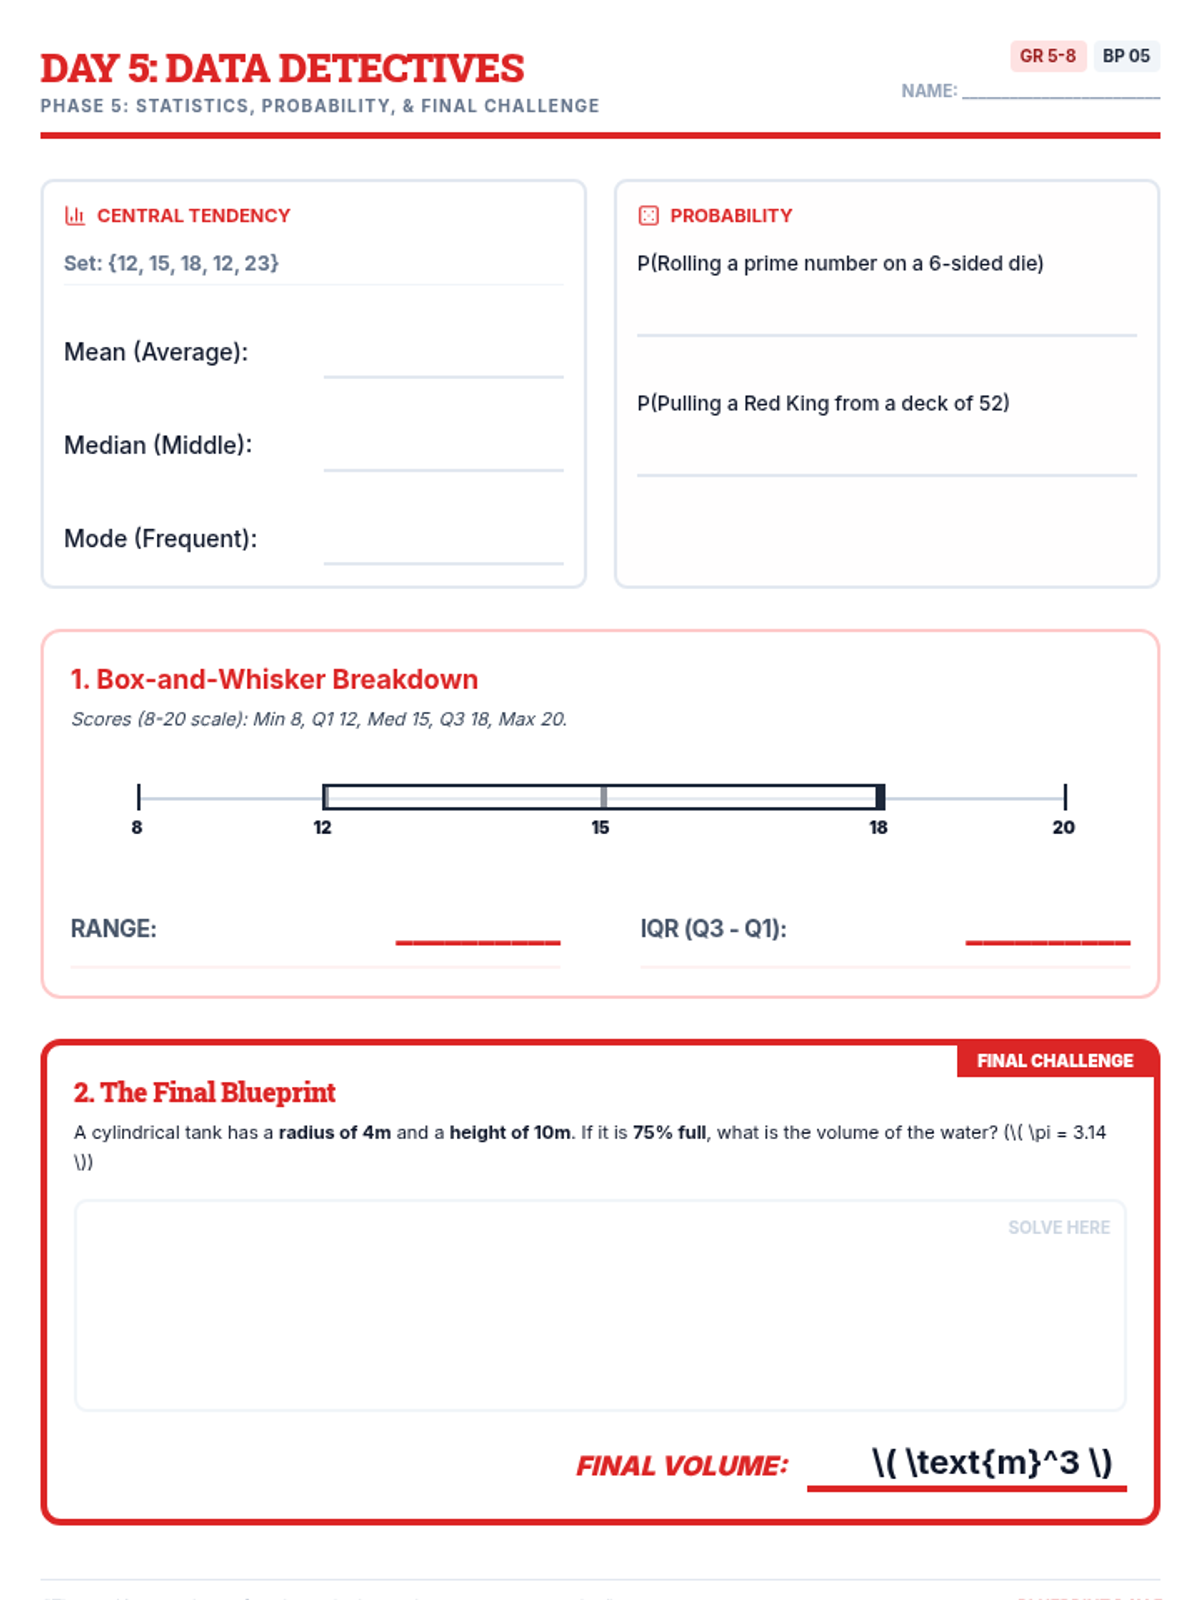
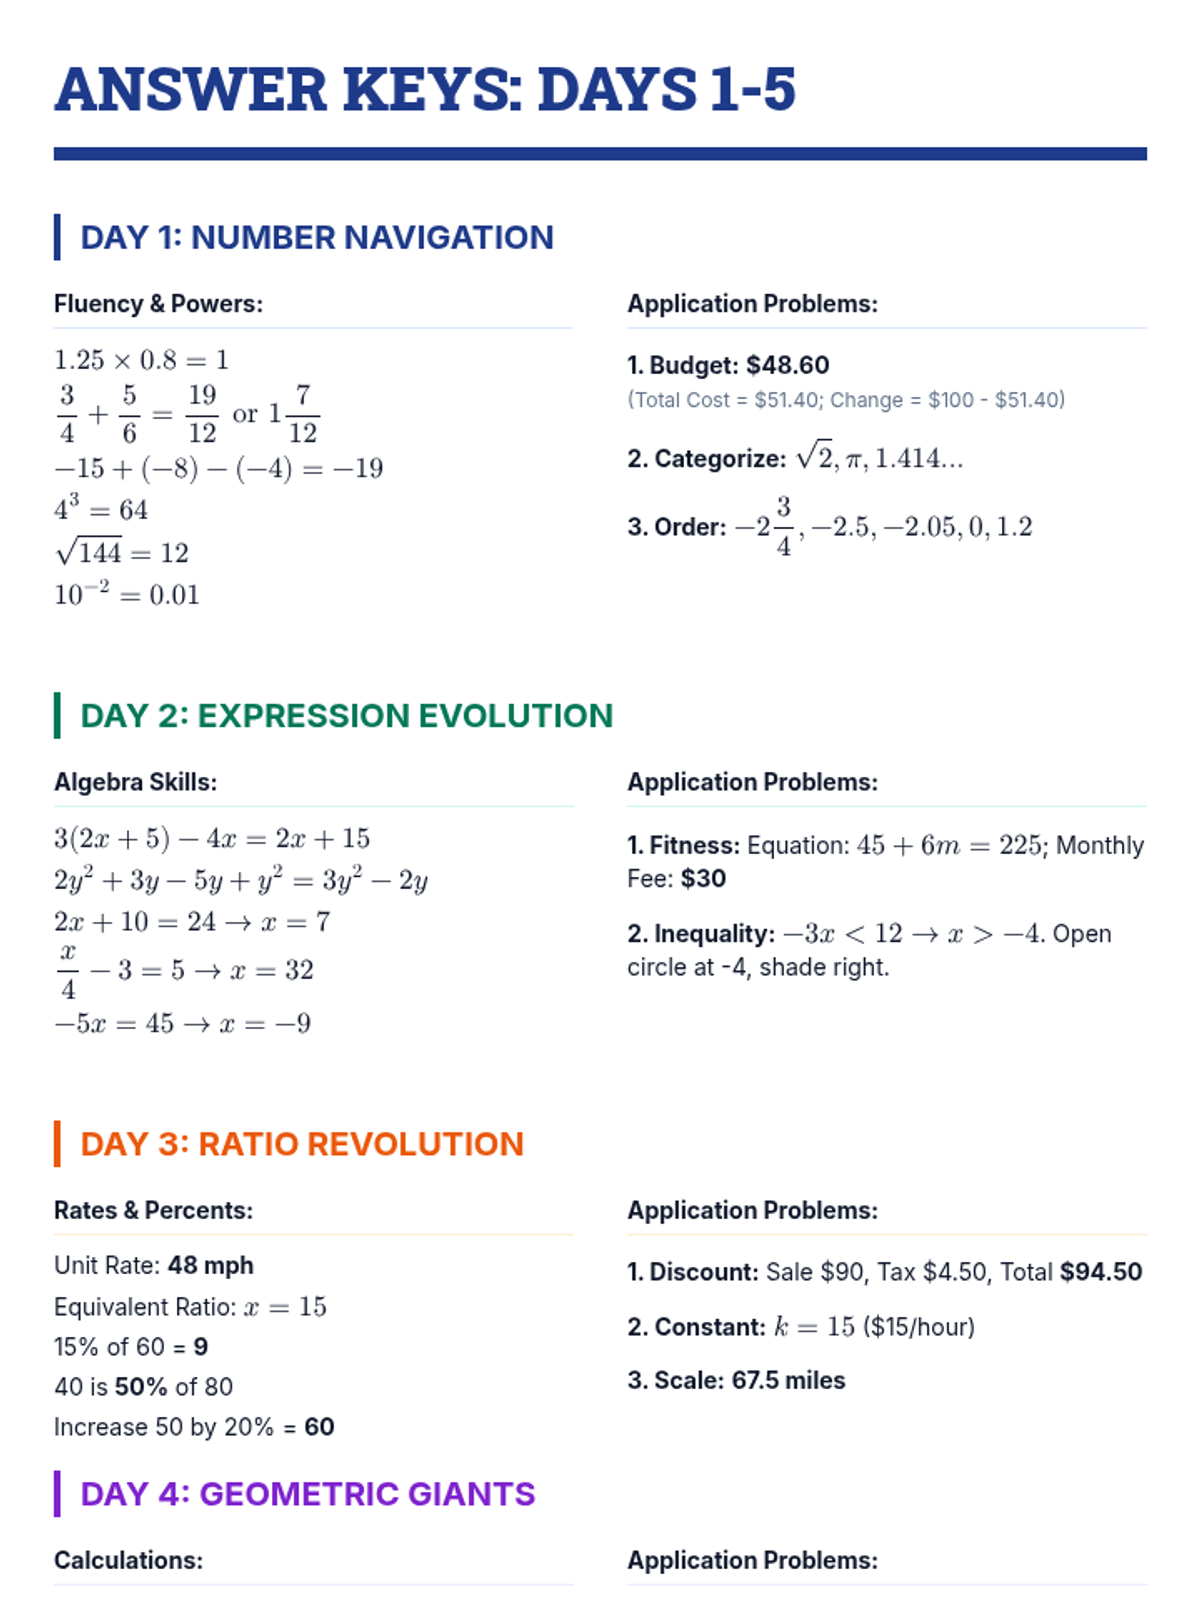
Day 5 concludes with statistics, probability, and a mixed challenge review of all concepts.
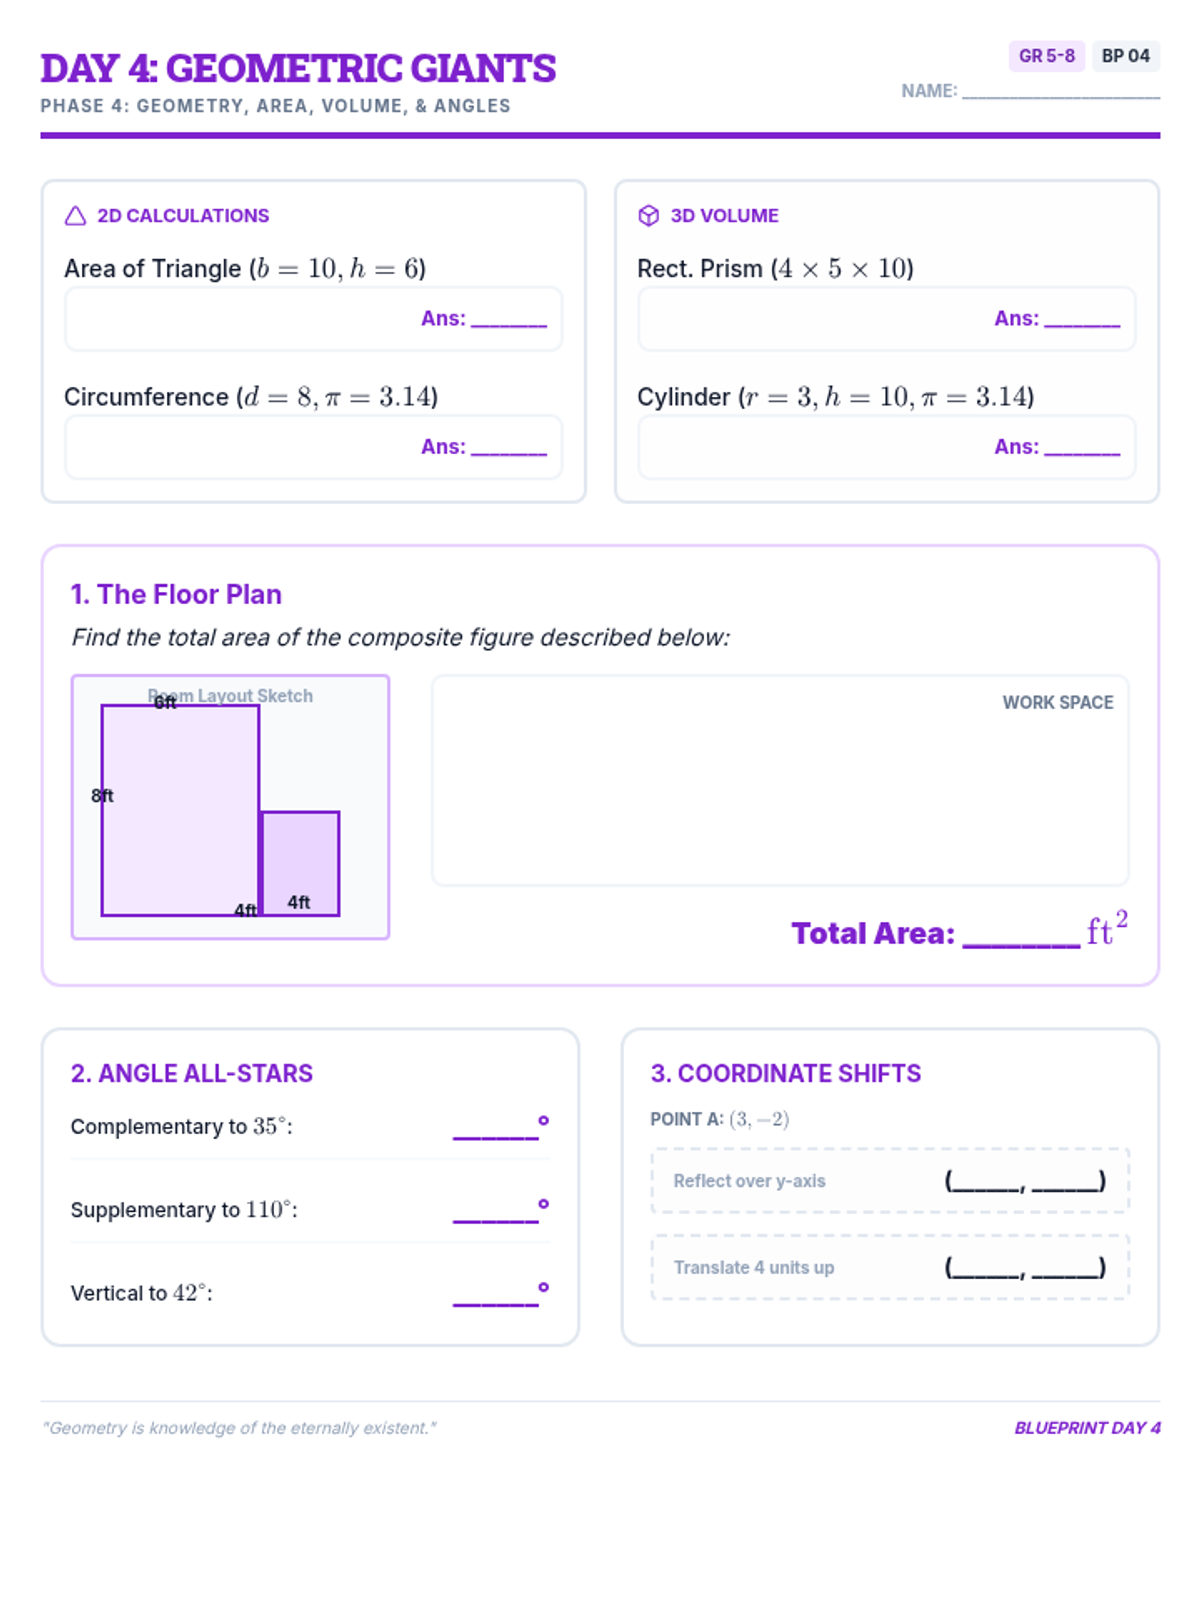
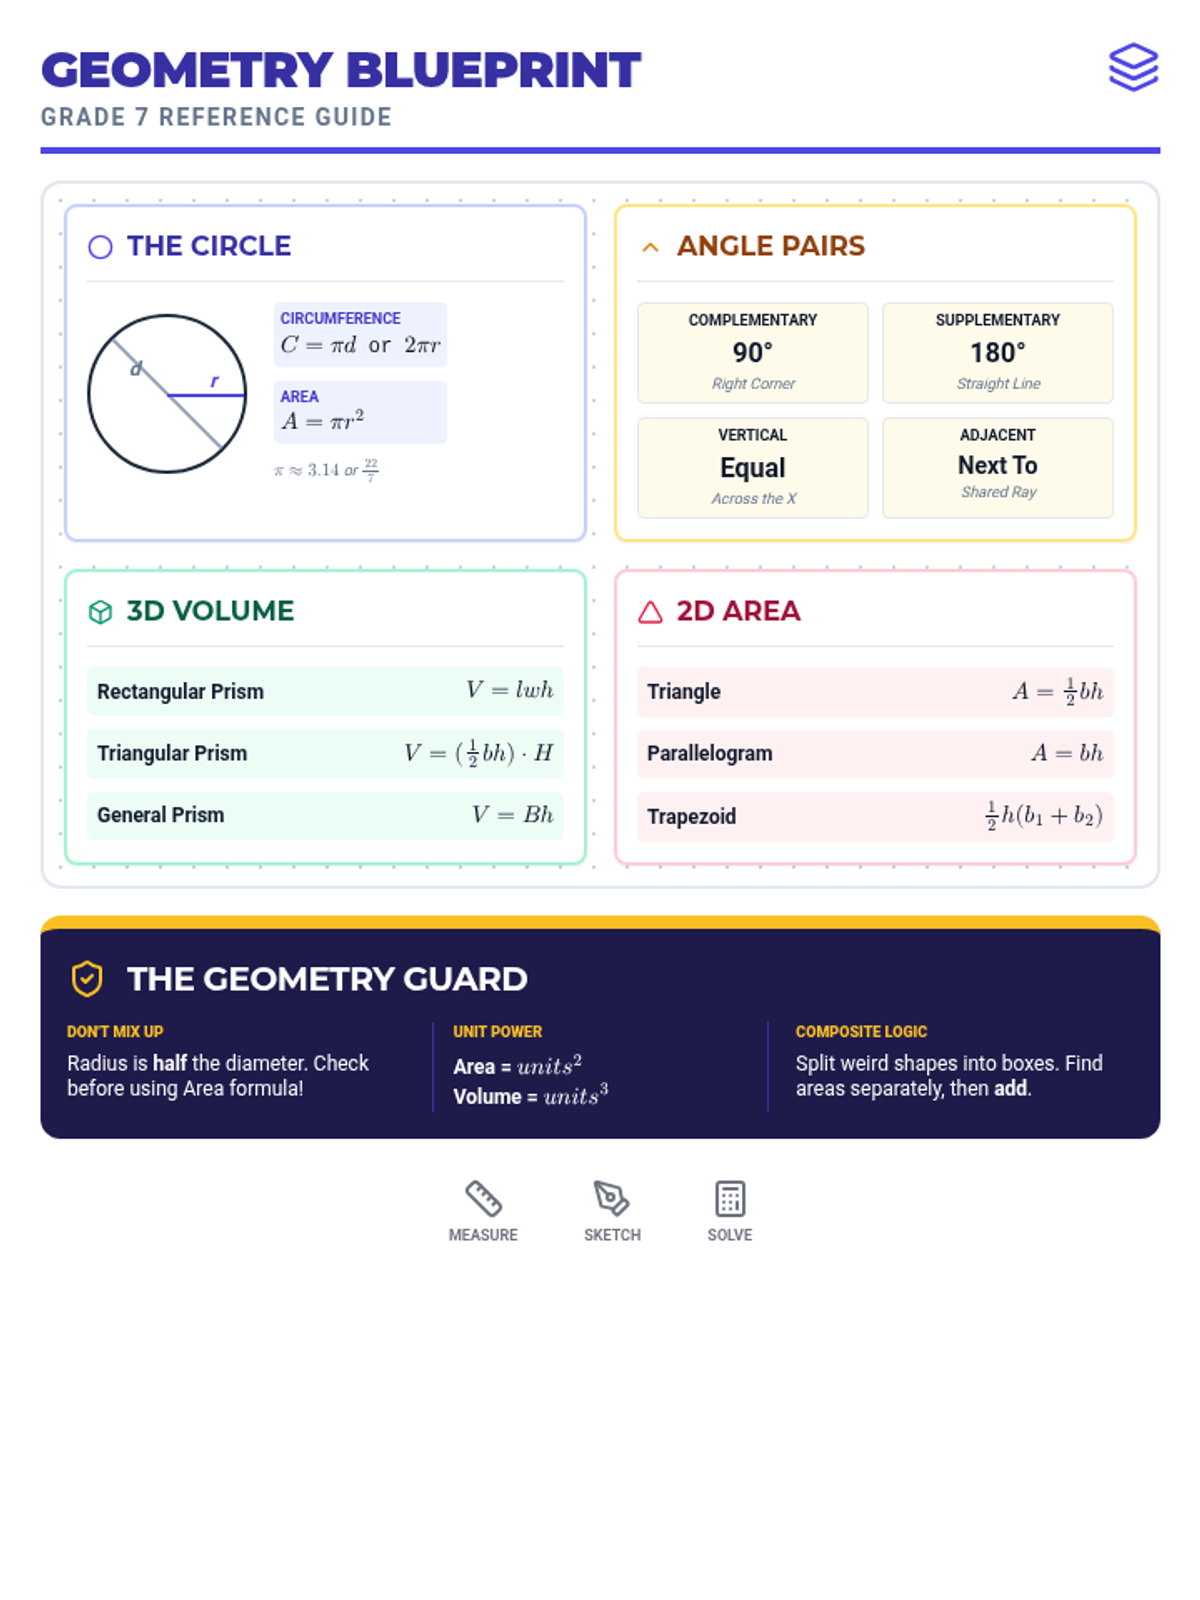
Day 4 explores geometry concepts including area, volume, and angle relationships.
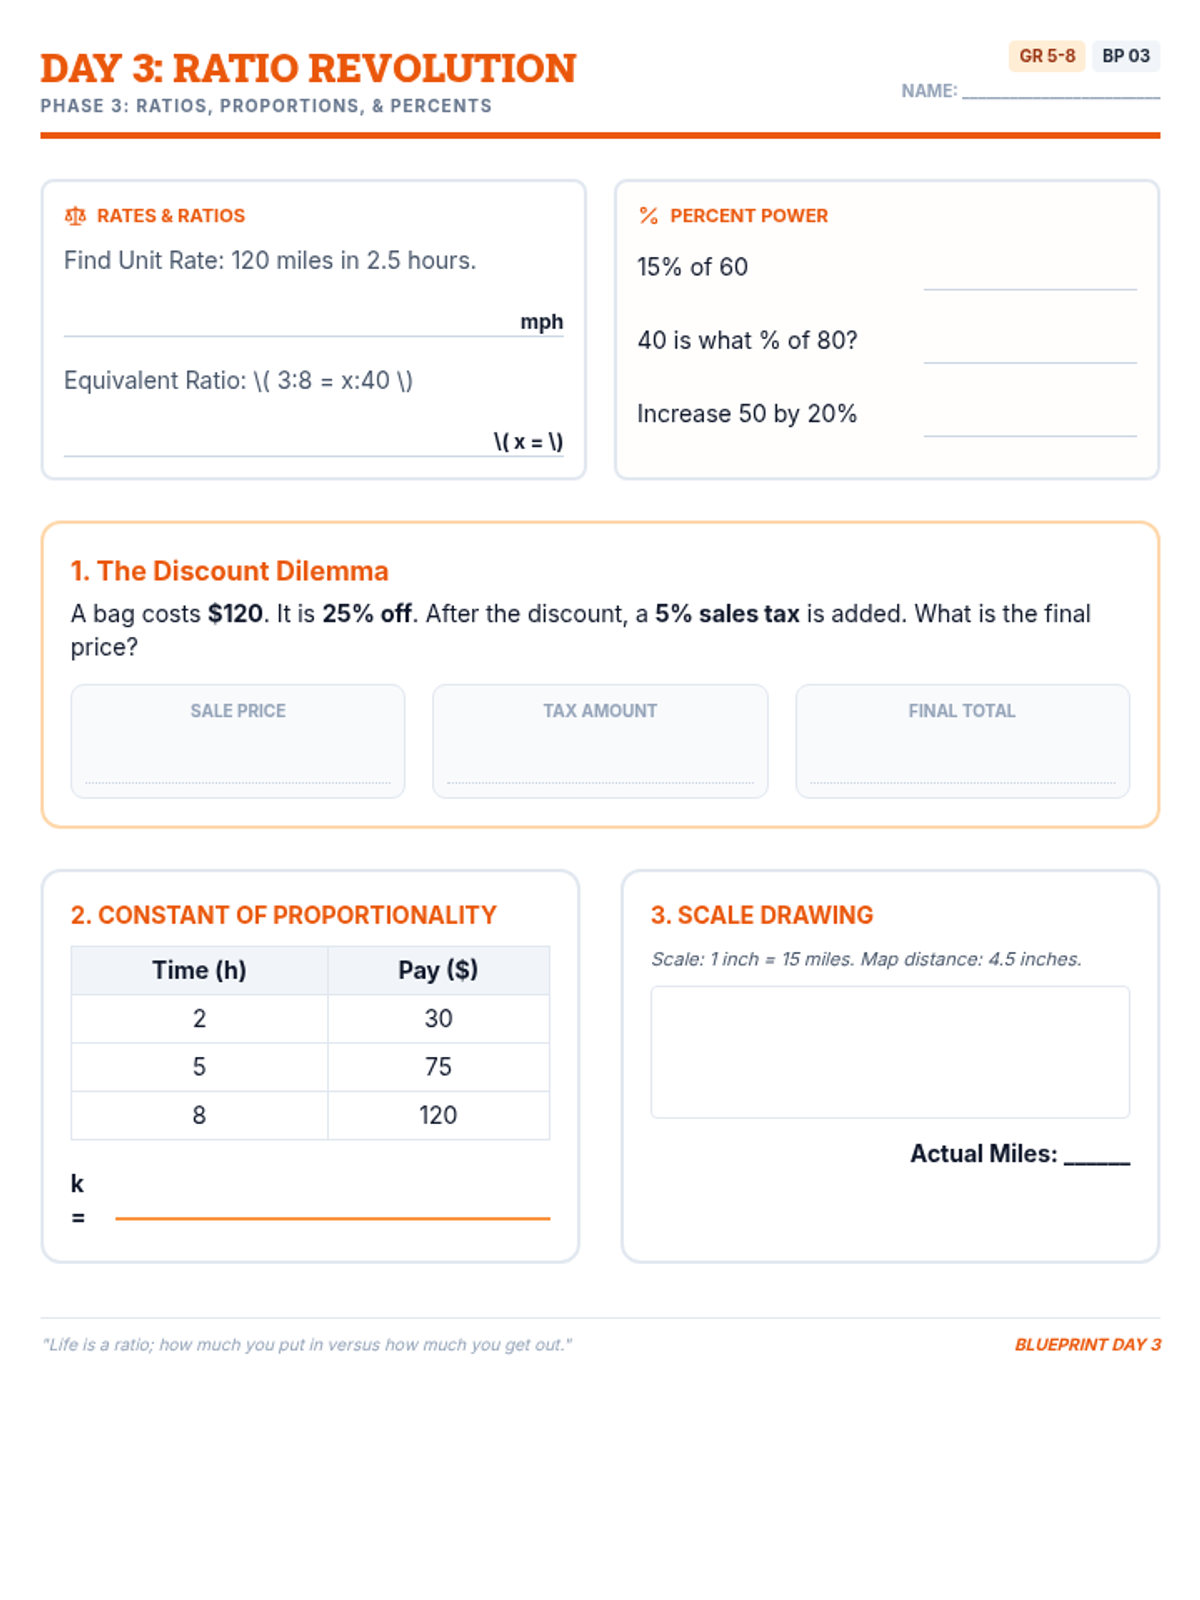
Day 3 focuses on ratios, proportions, and percentages in real-world contexts.
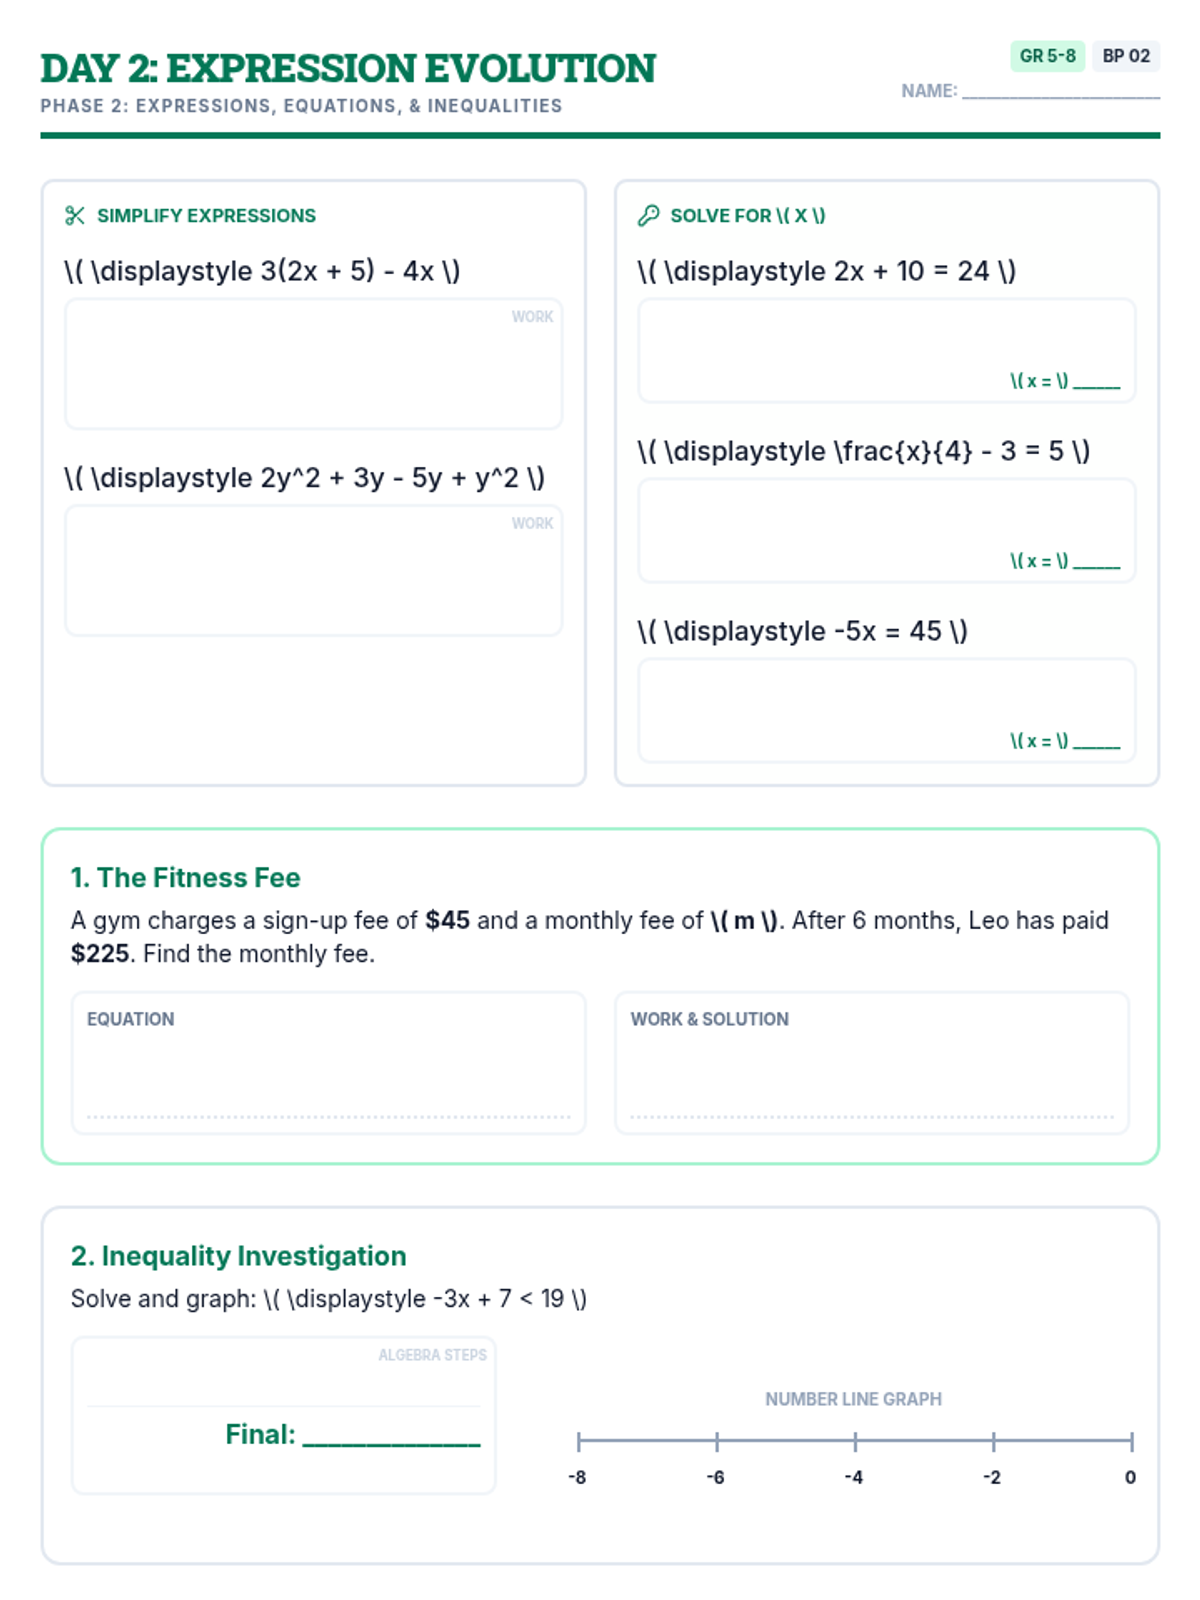
Day 2 covers expressions and equations, focusing on simplifying, solving, and translating word problems.
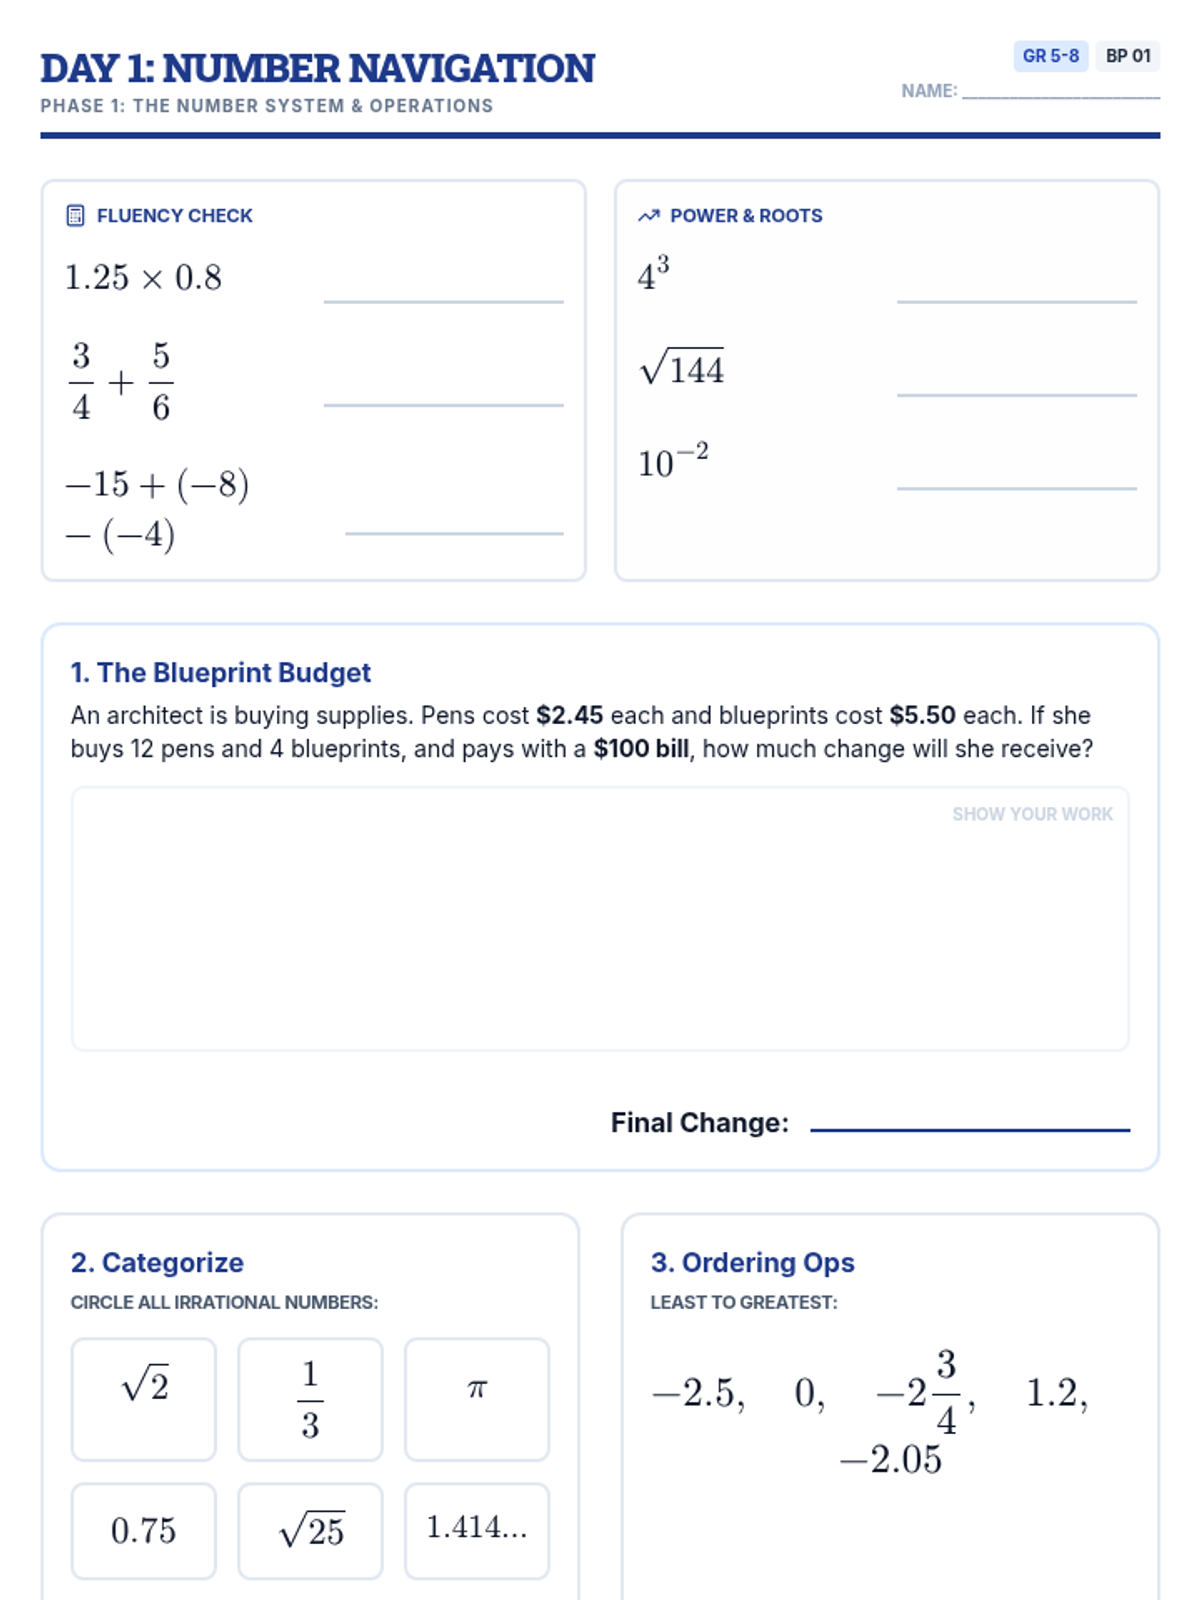
Day 1 focuses on number systems, including operations with fractions, decimals, and integers.
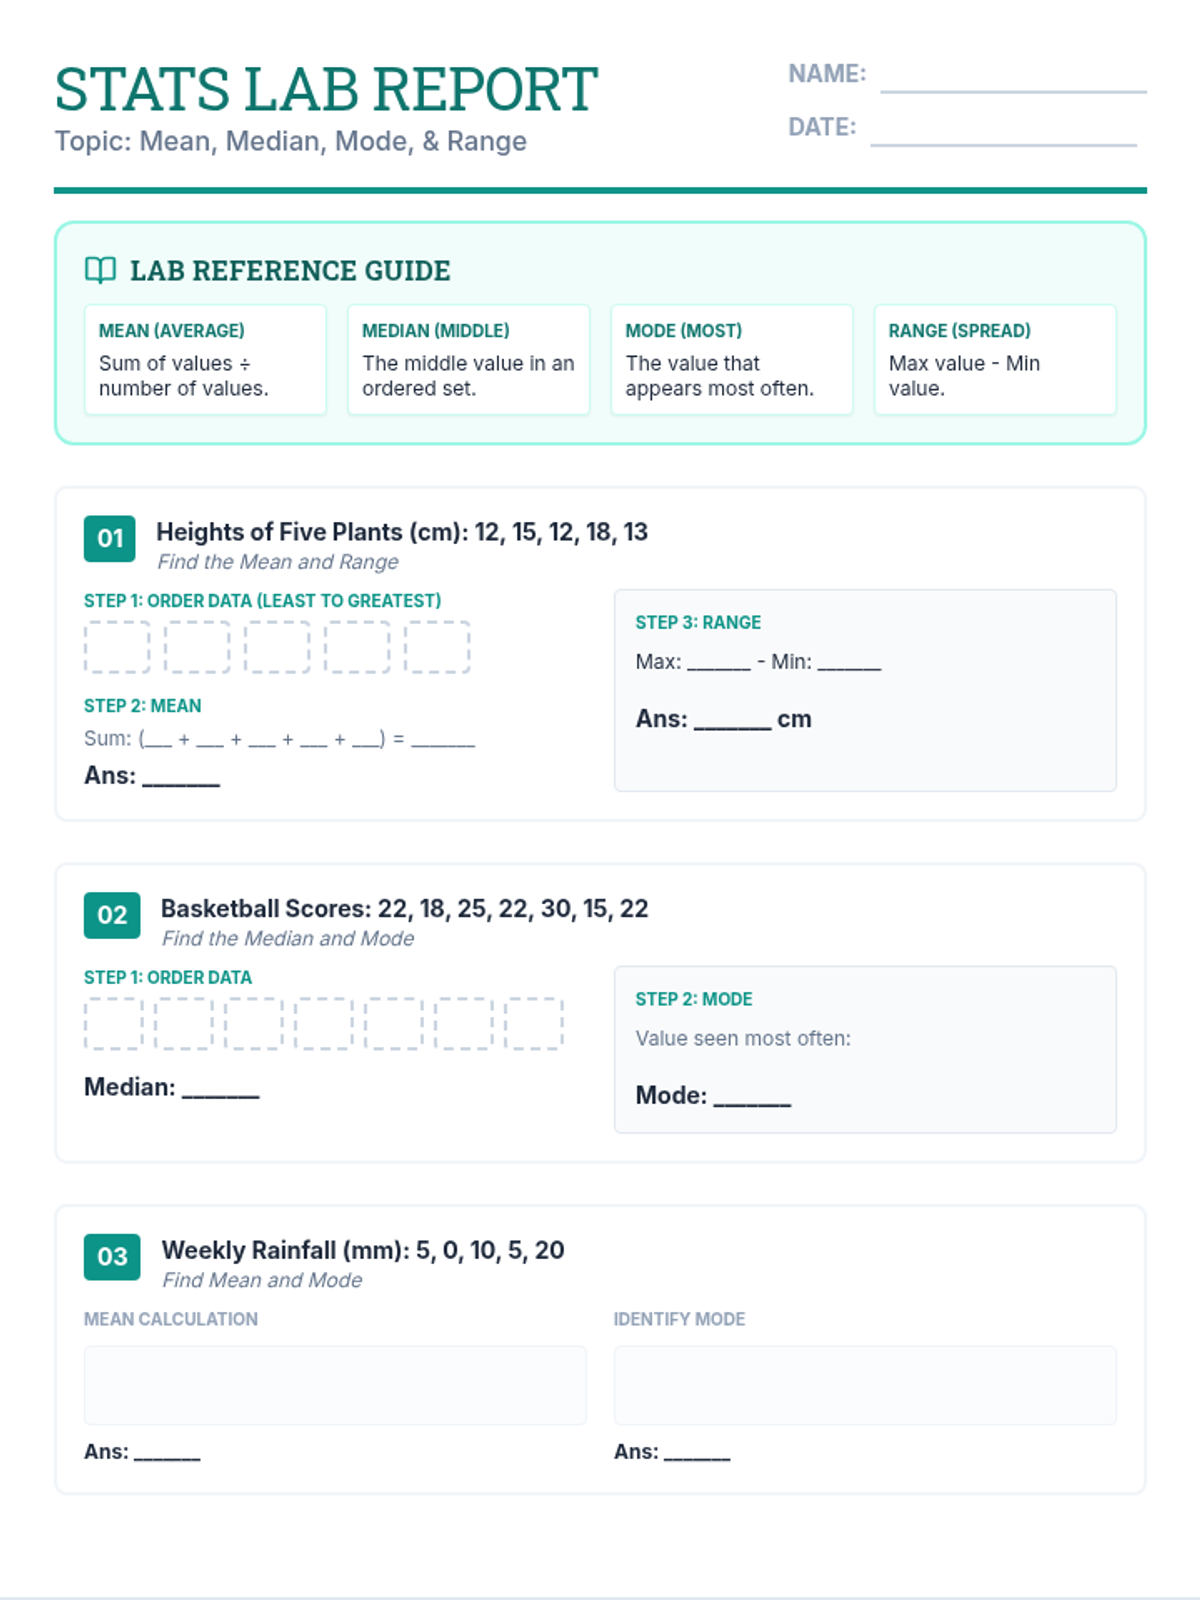
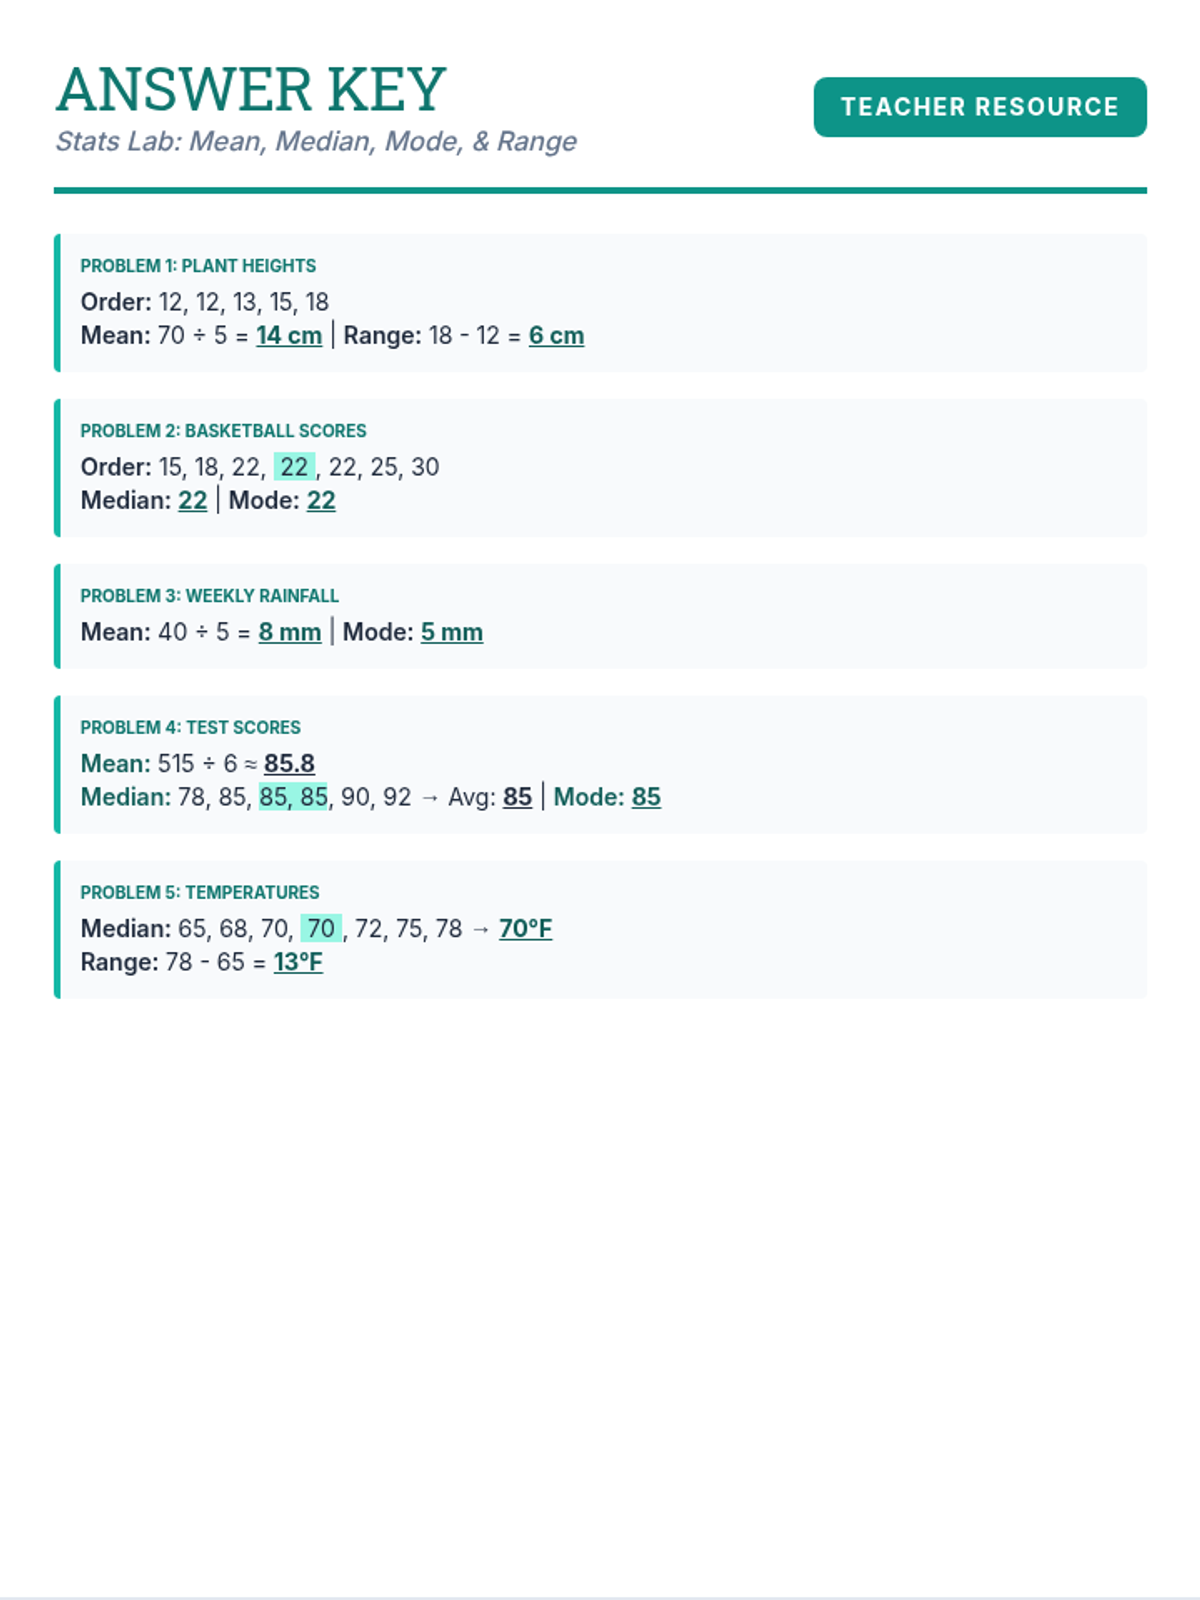
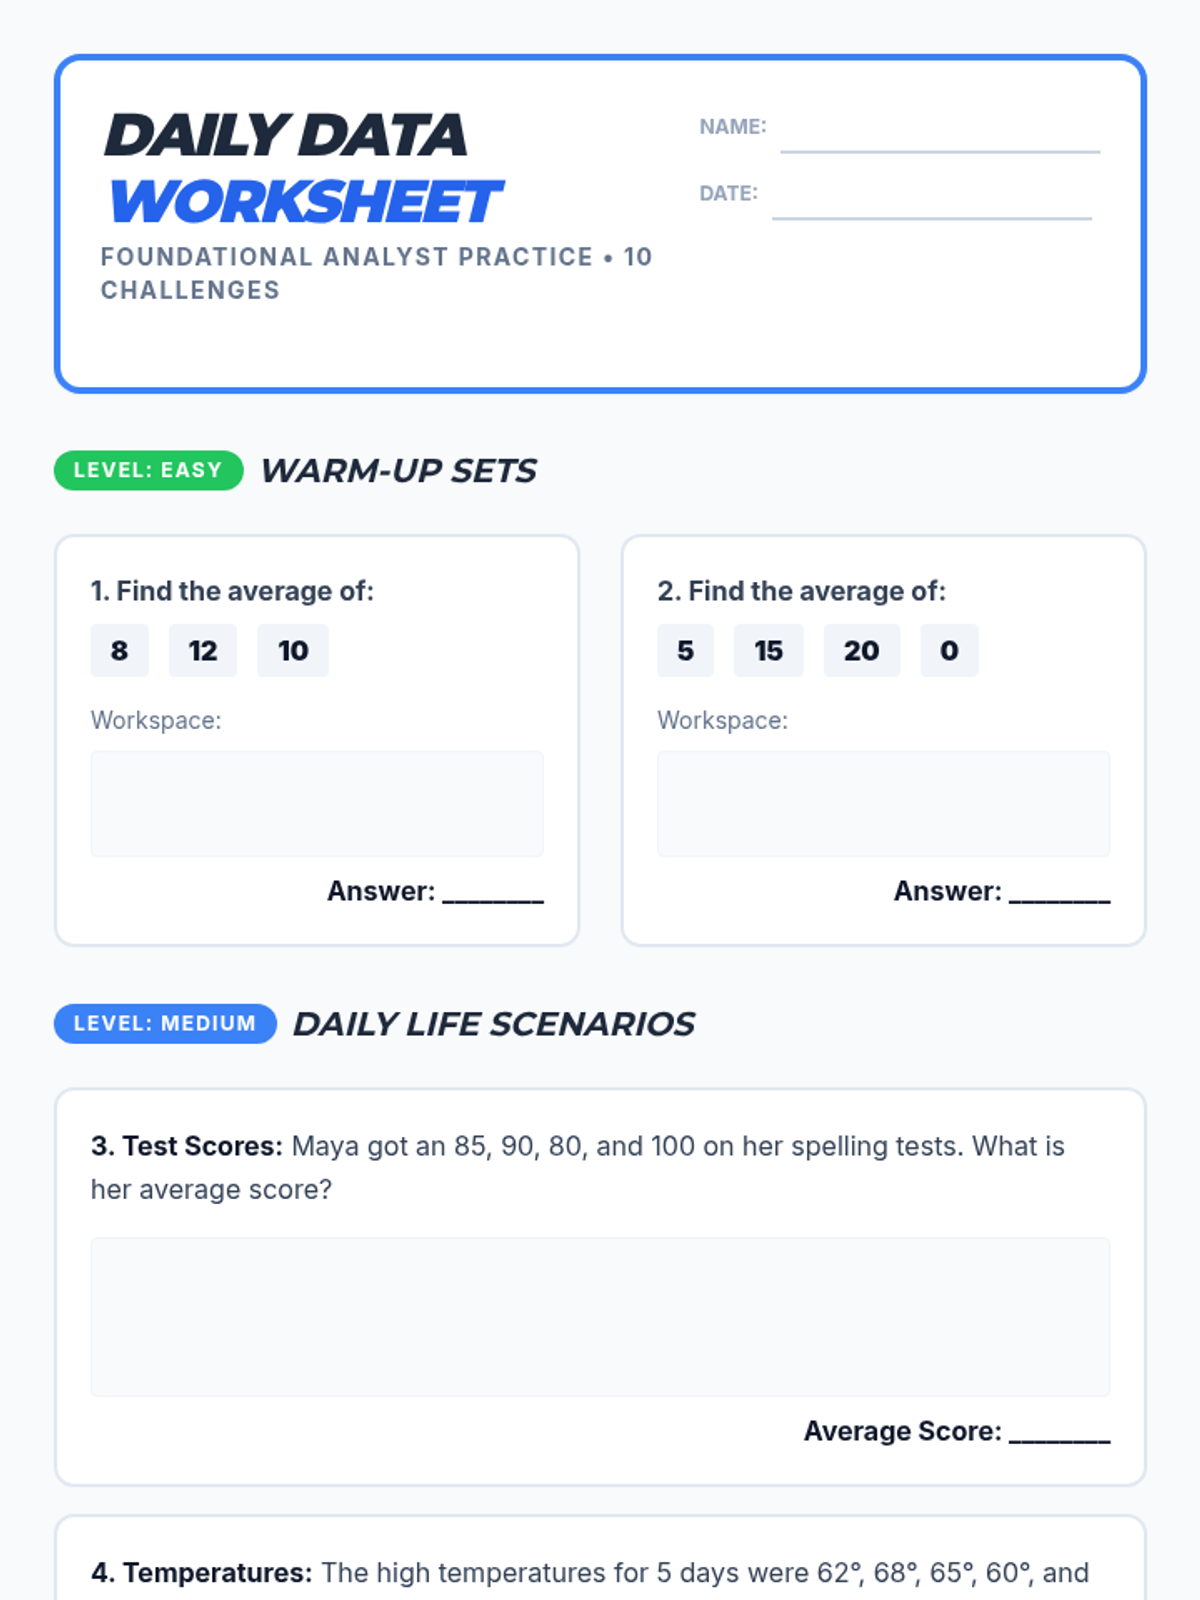
A comprehensive practice session on mean, median, mode, and range using real-world data scenarios and step-by-step scaffolding.
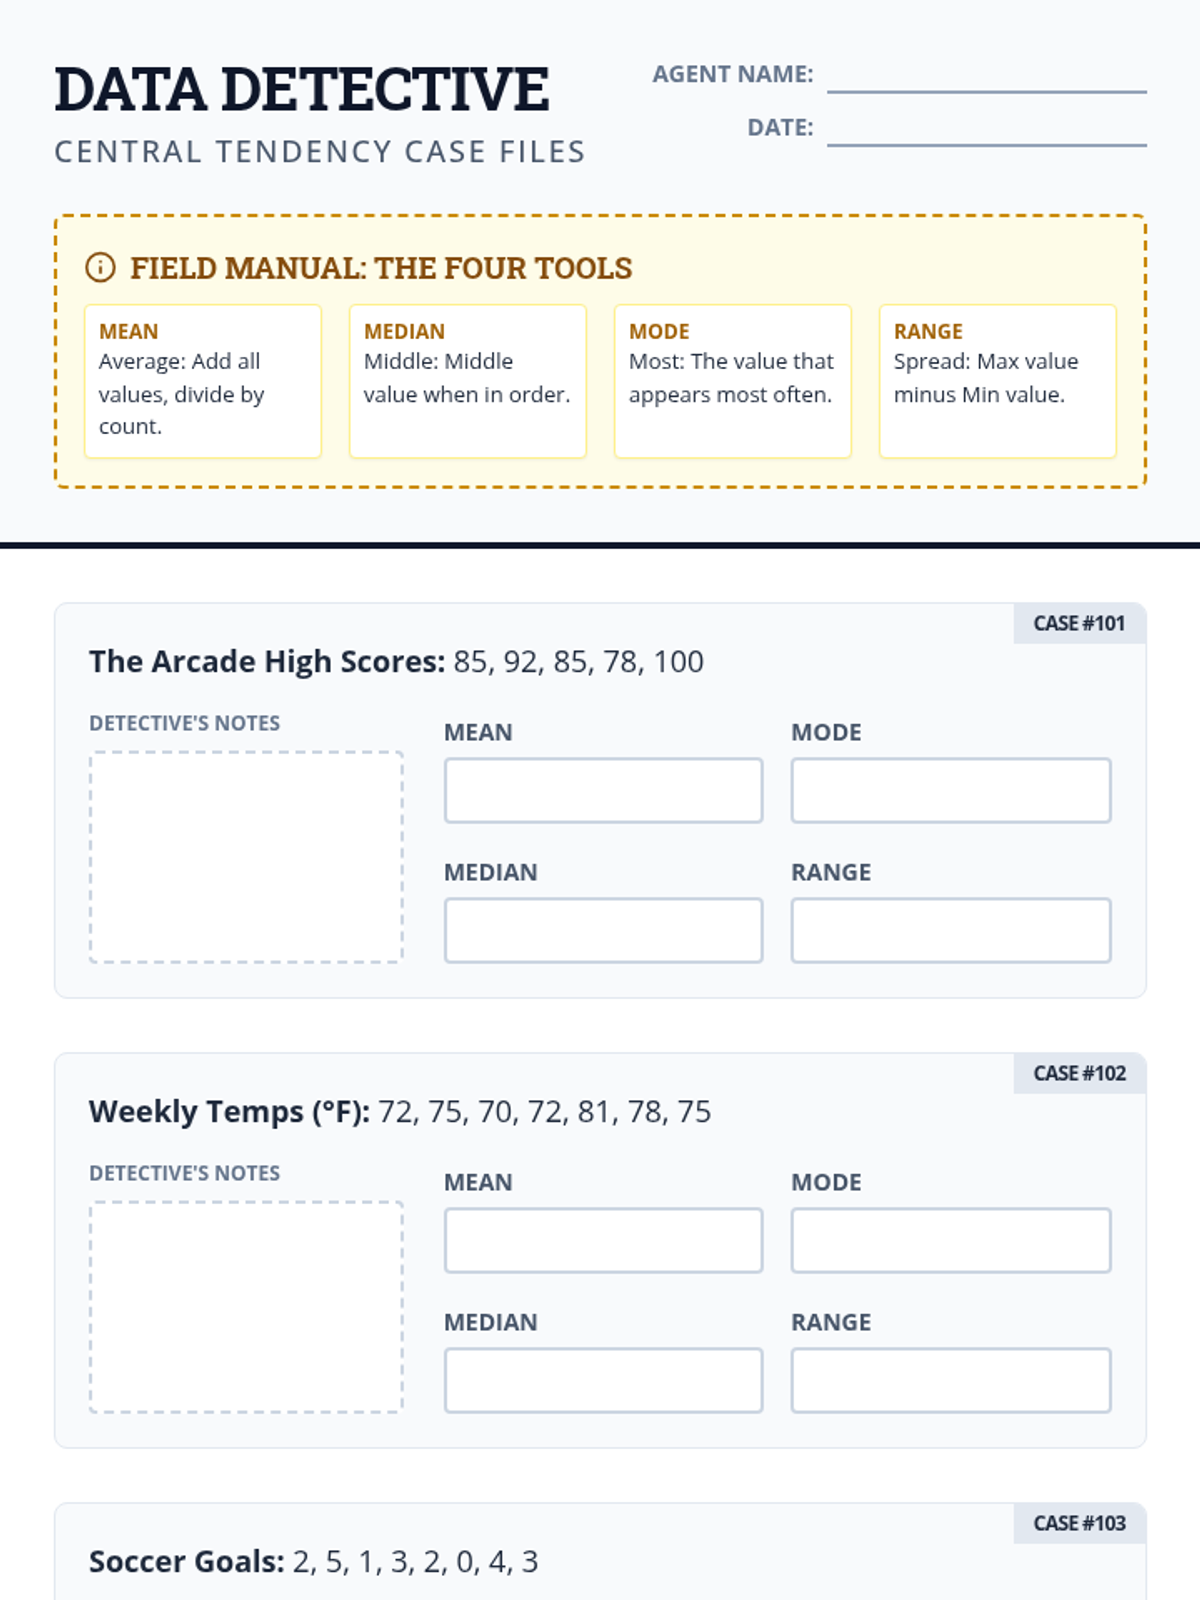
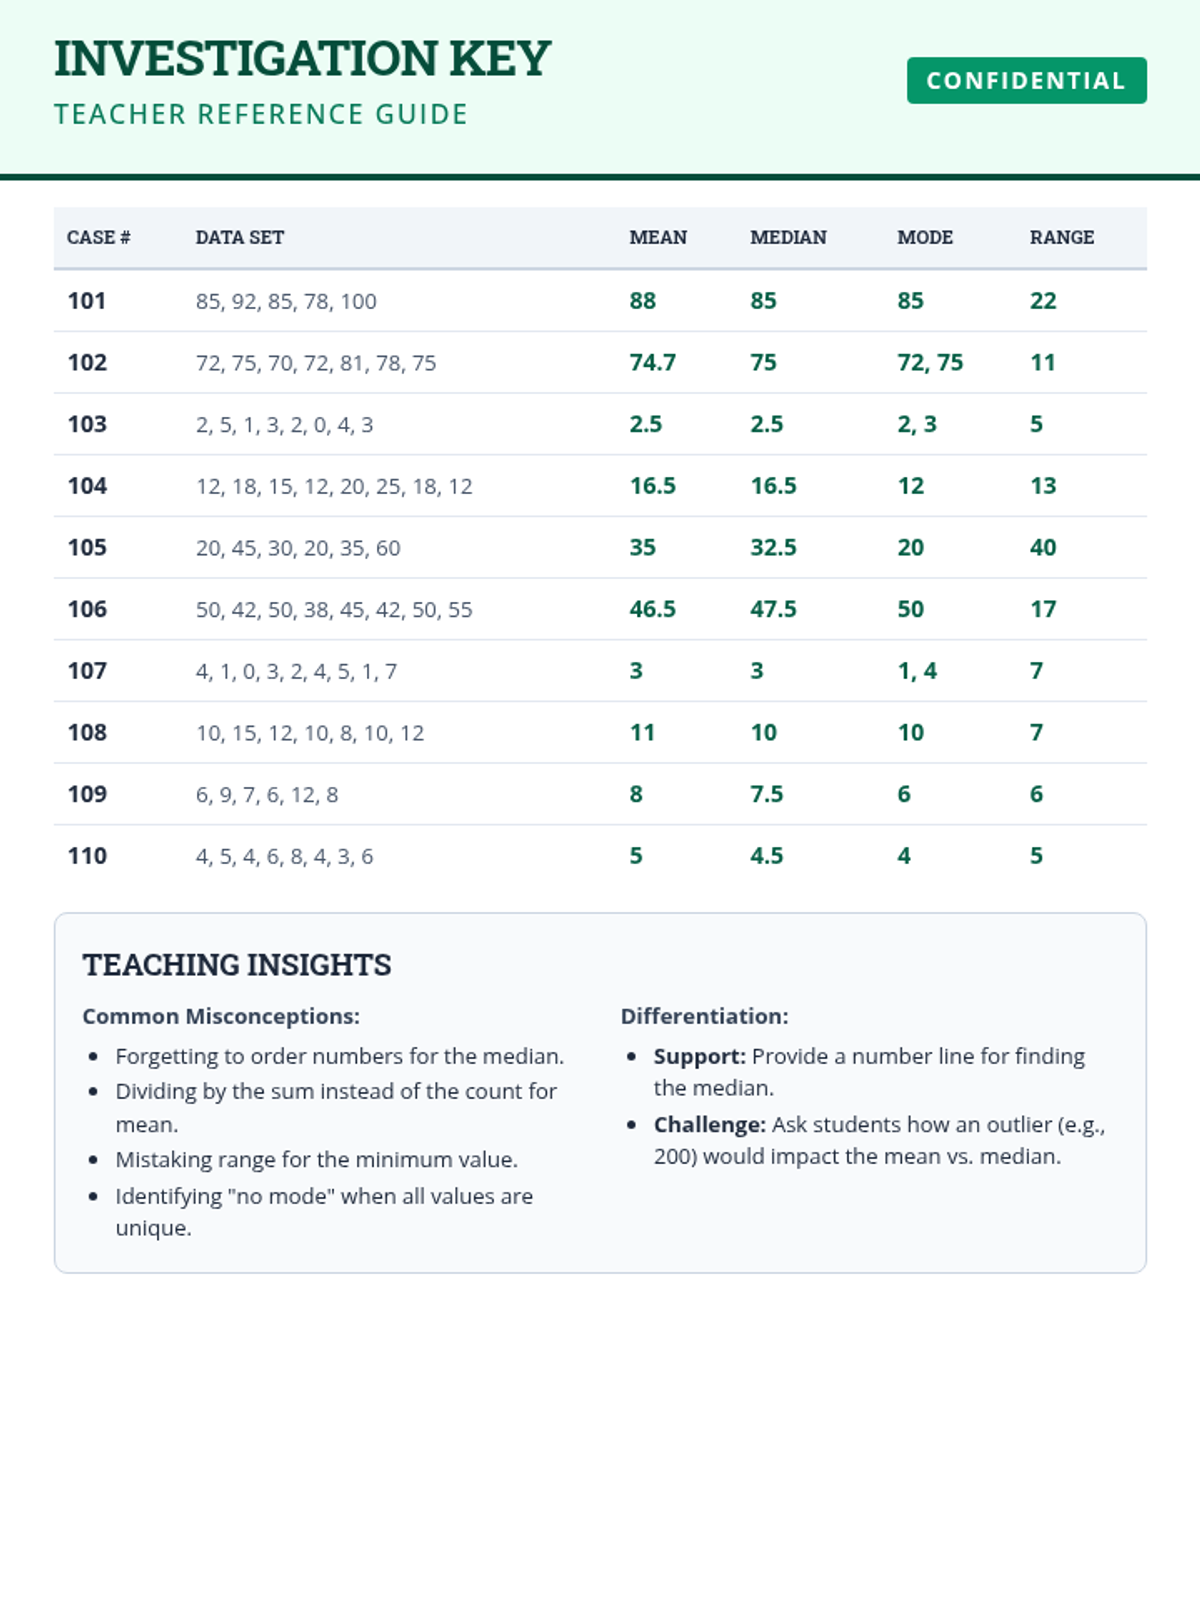
Students take on the role of data detectives to master central tendency and variation. This lesson covers calculating mean, median, mode, and range through engaging real-world scenarios.
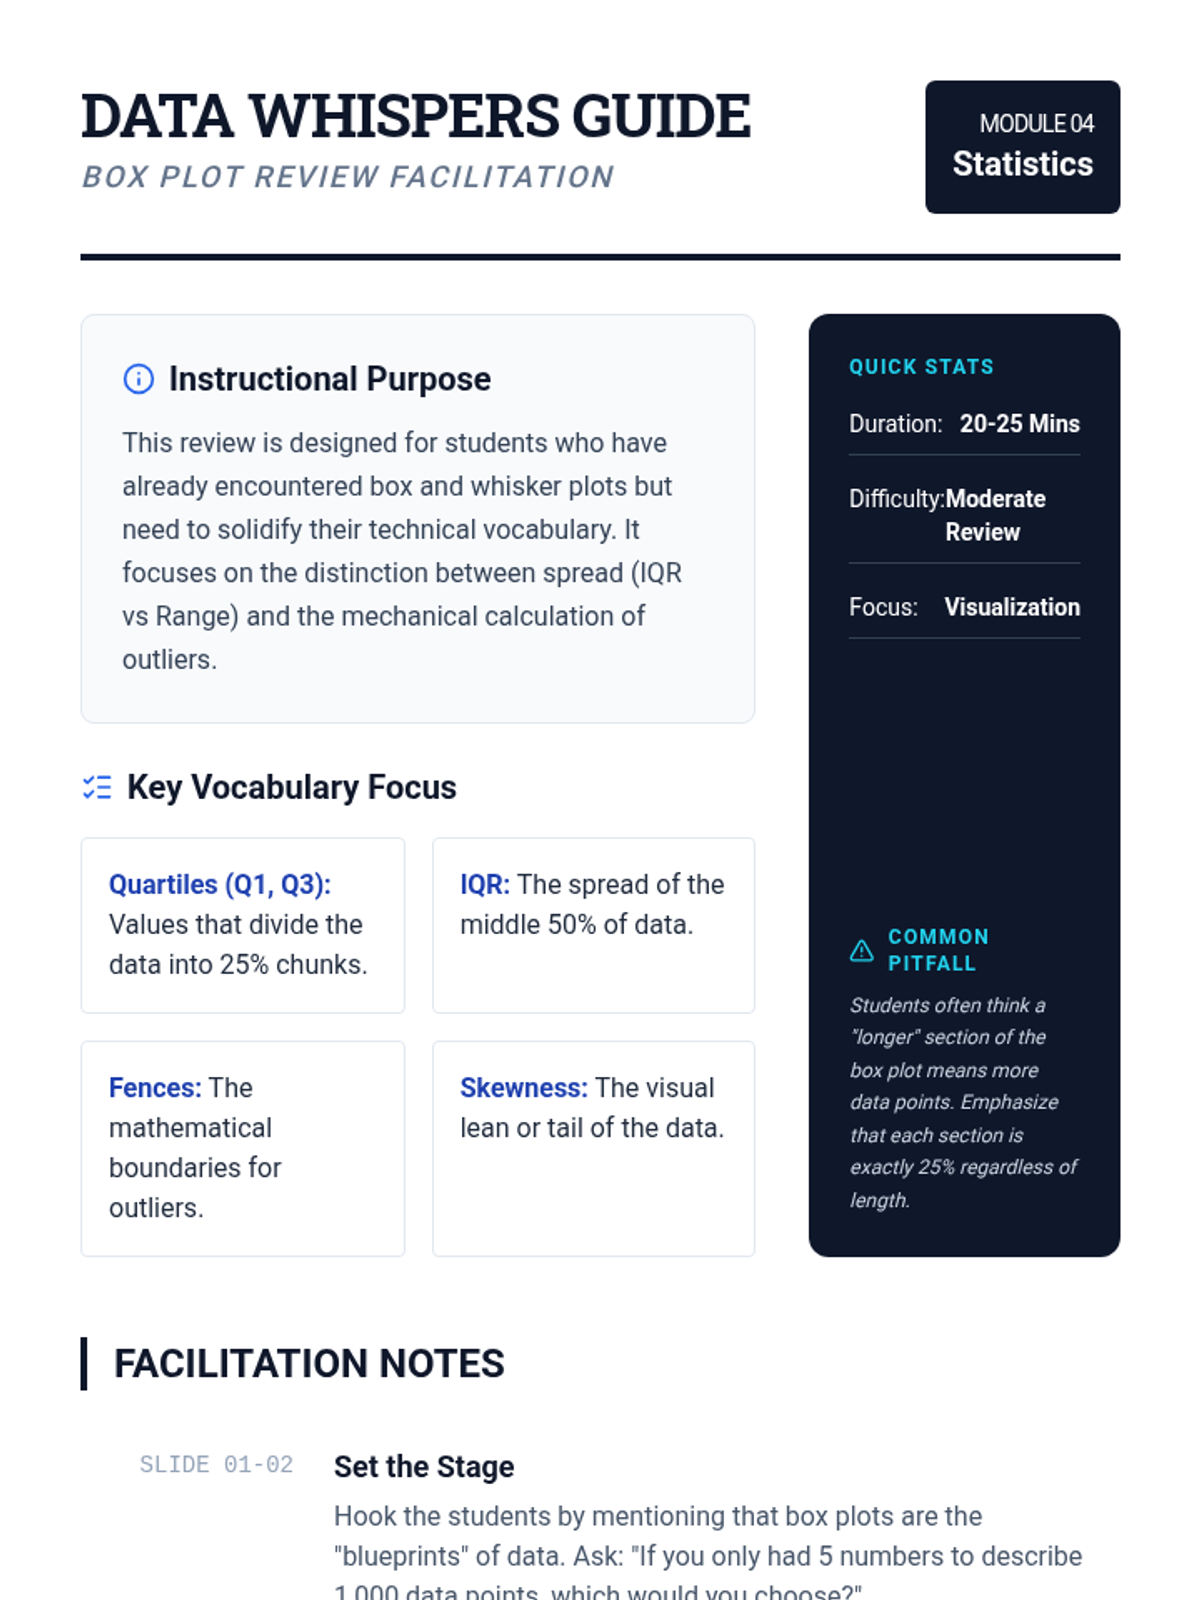
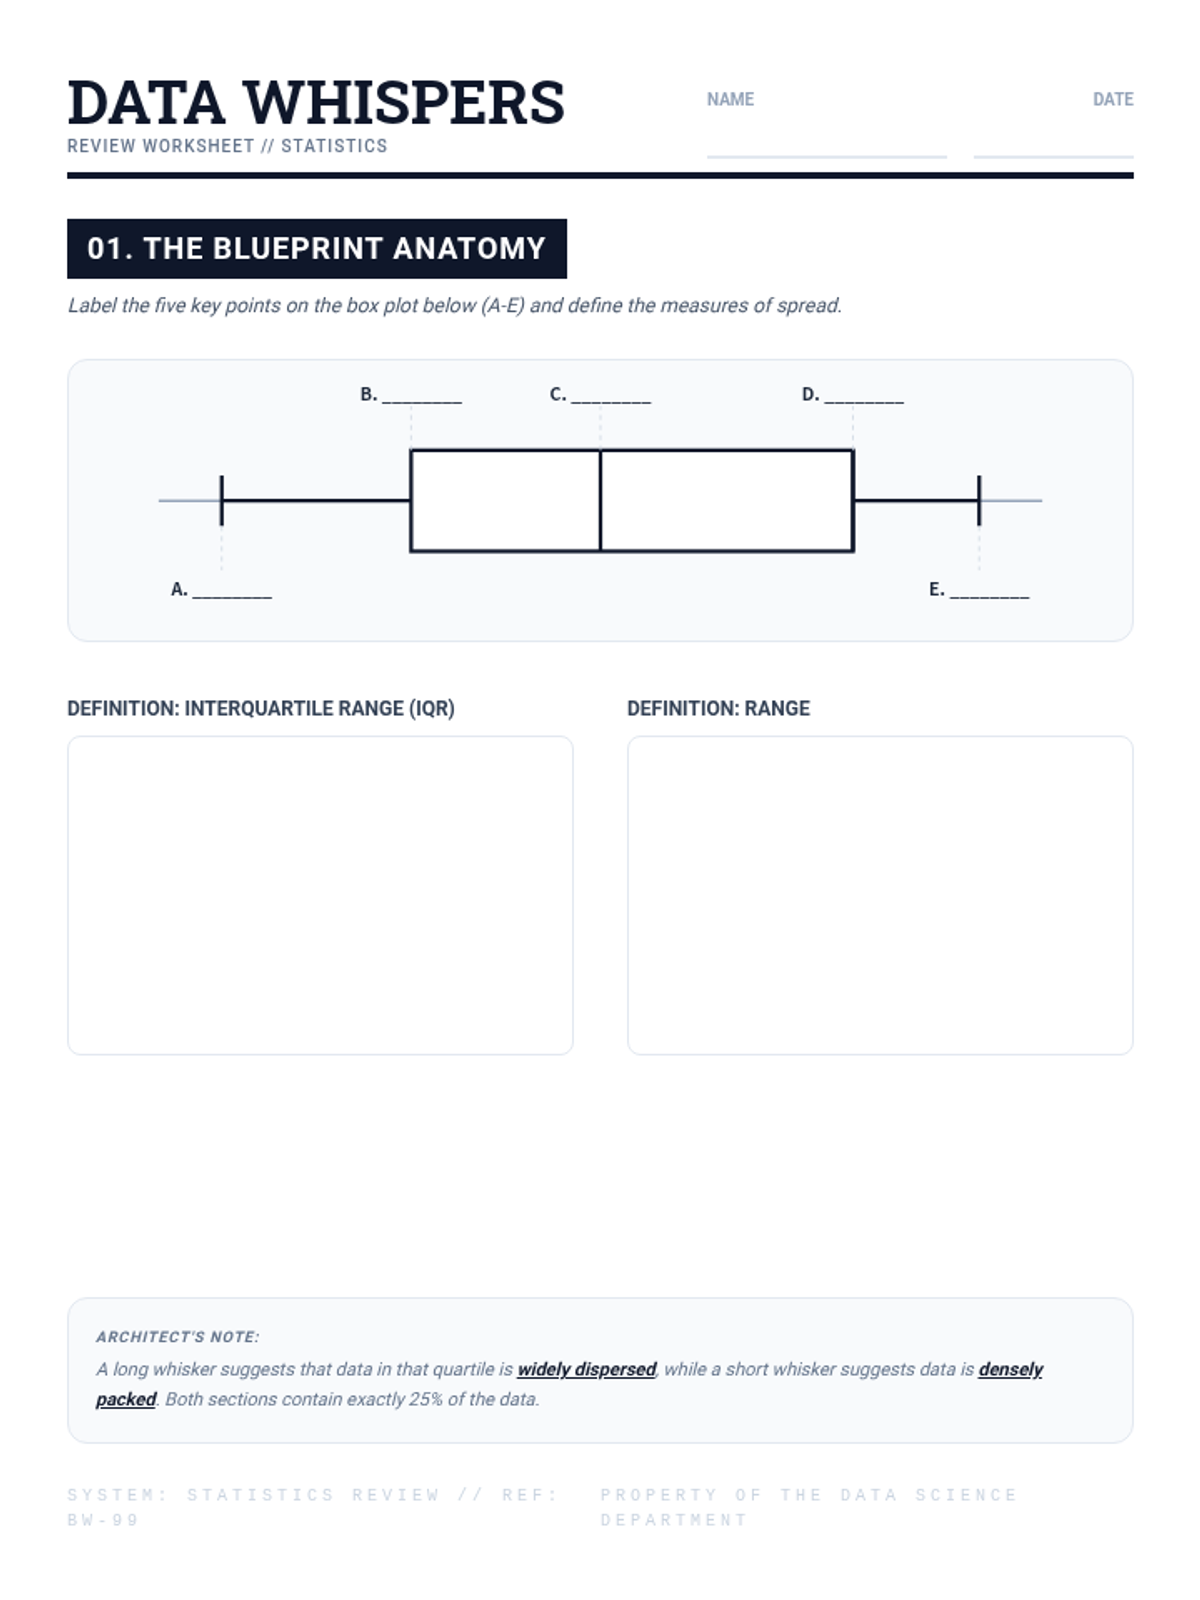
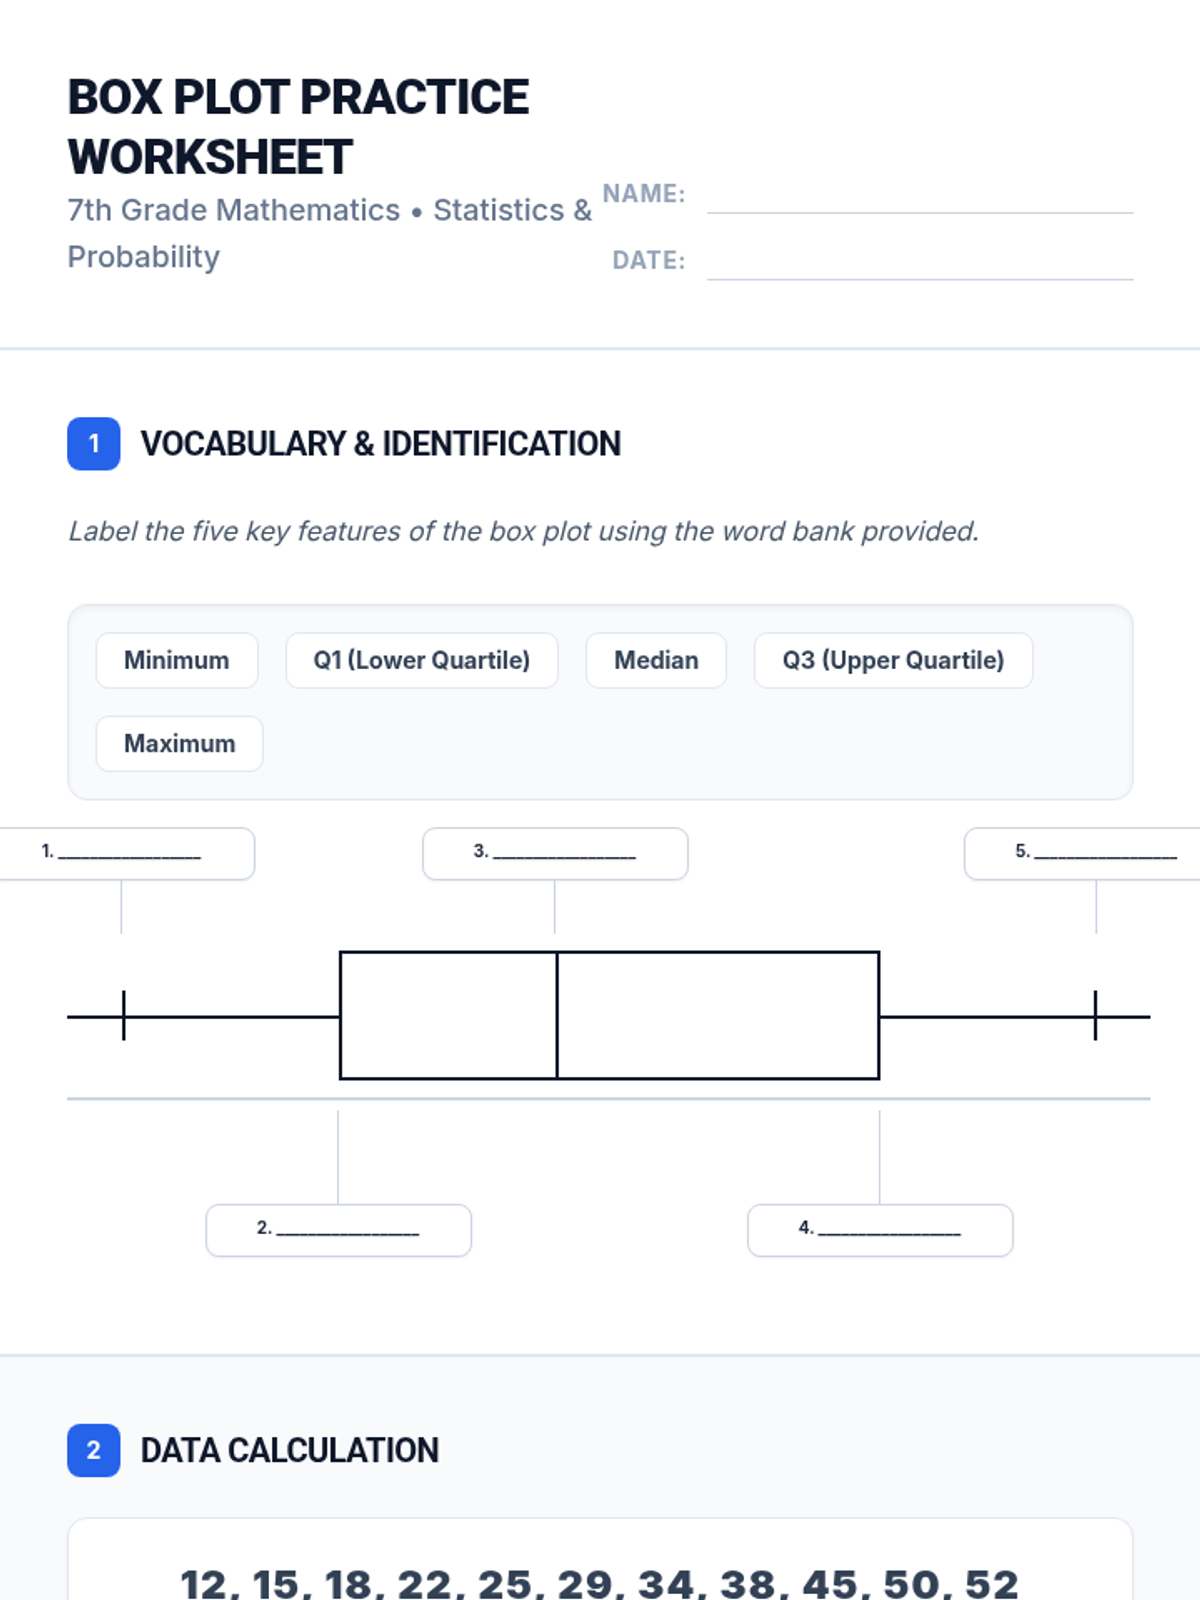
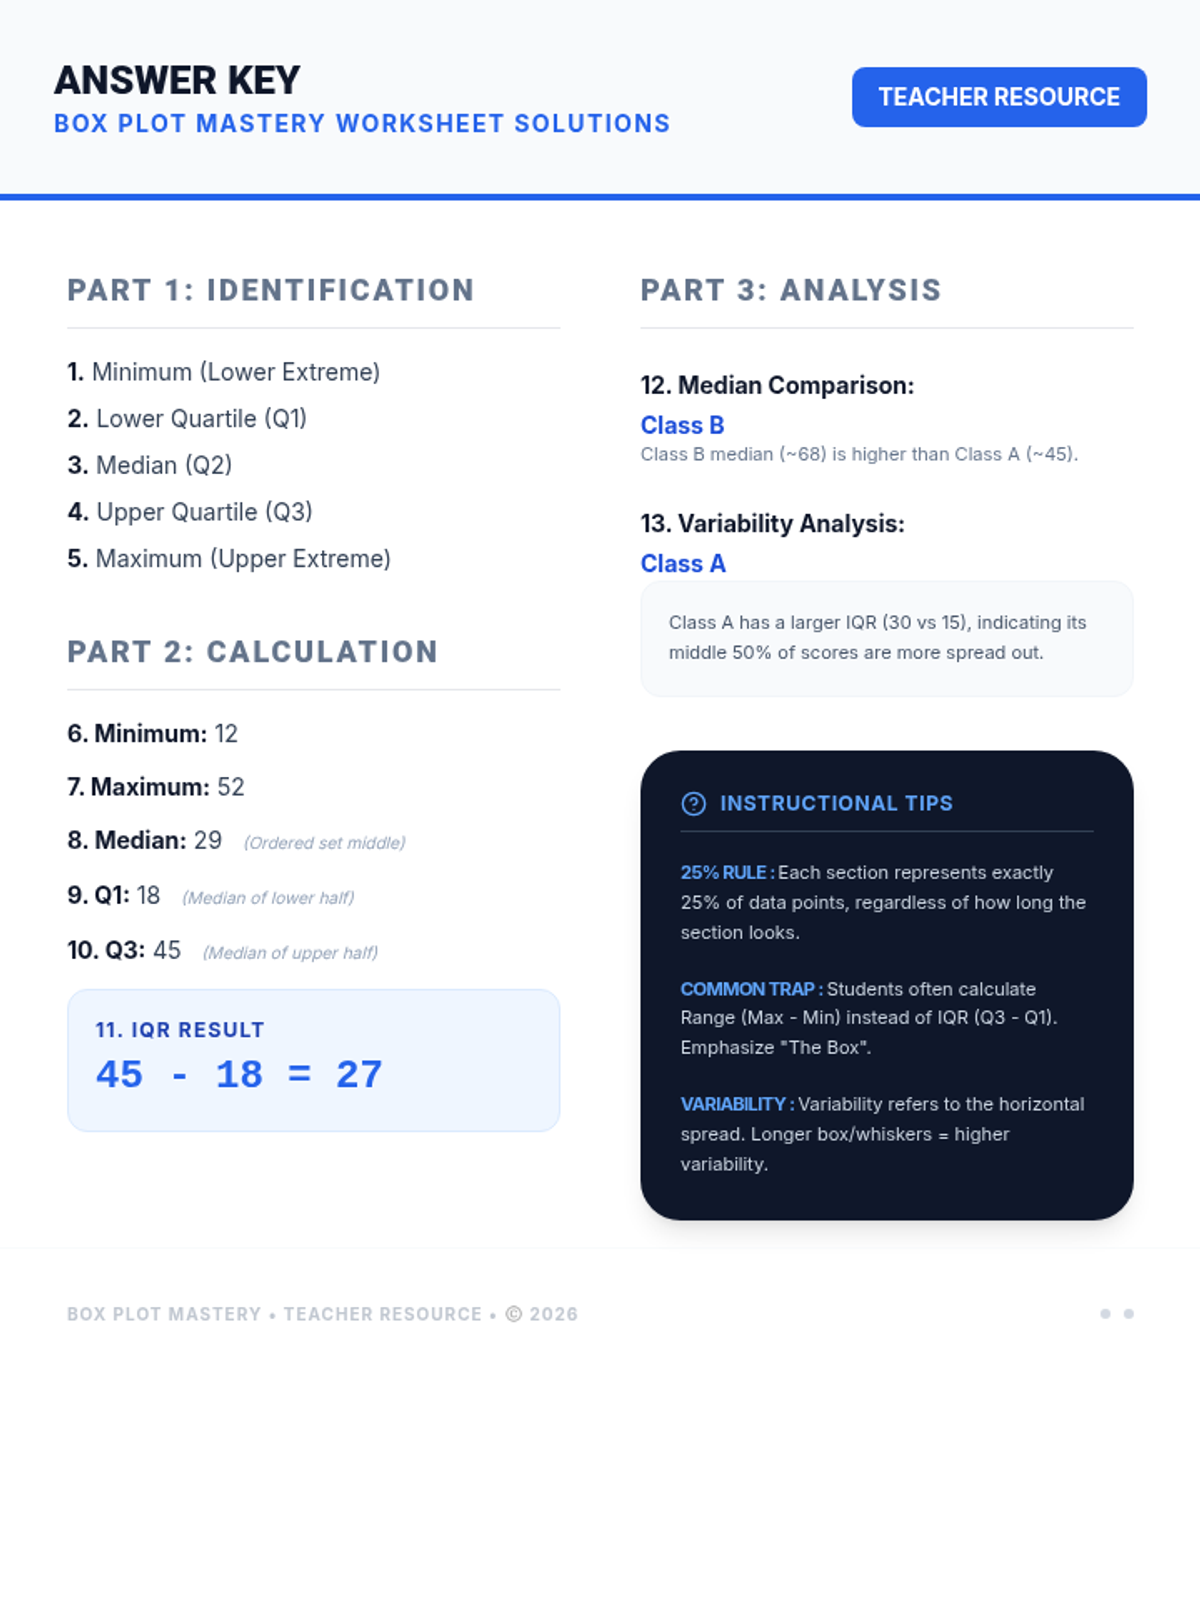
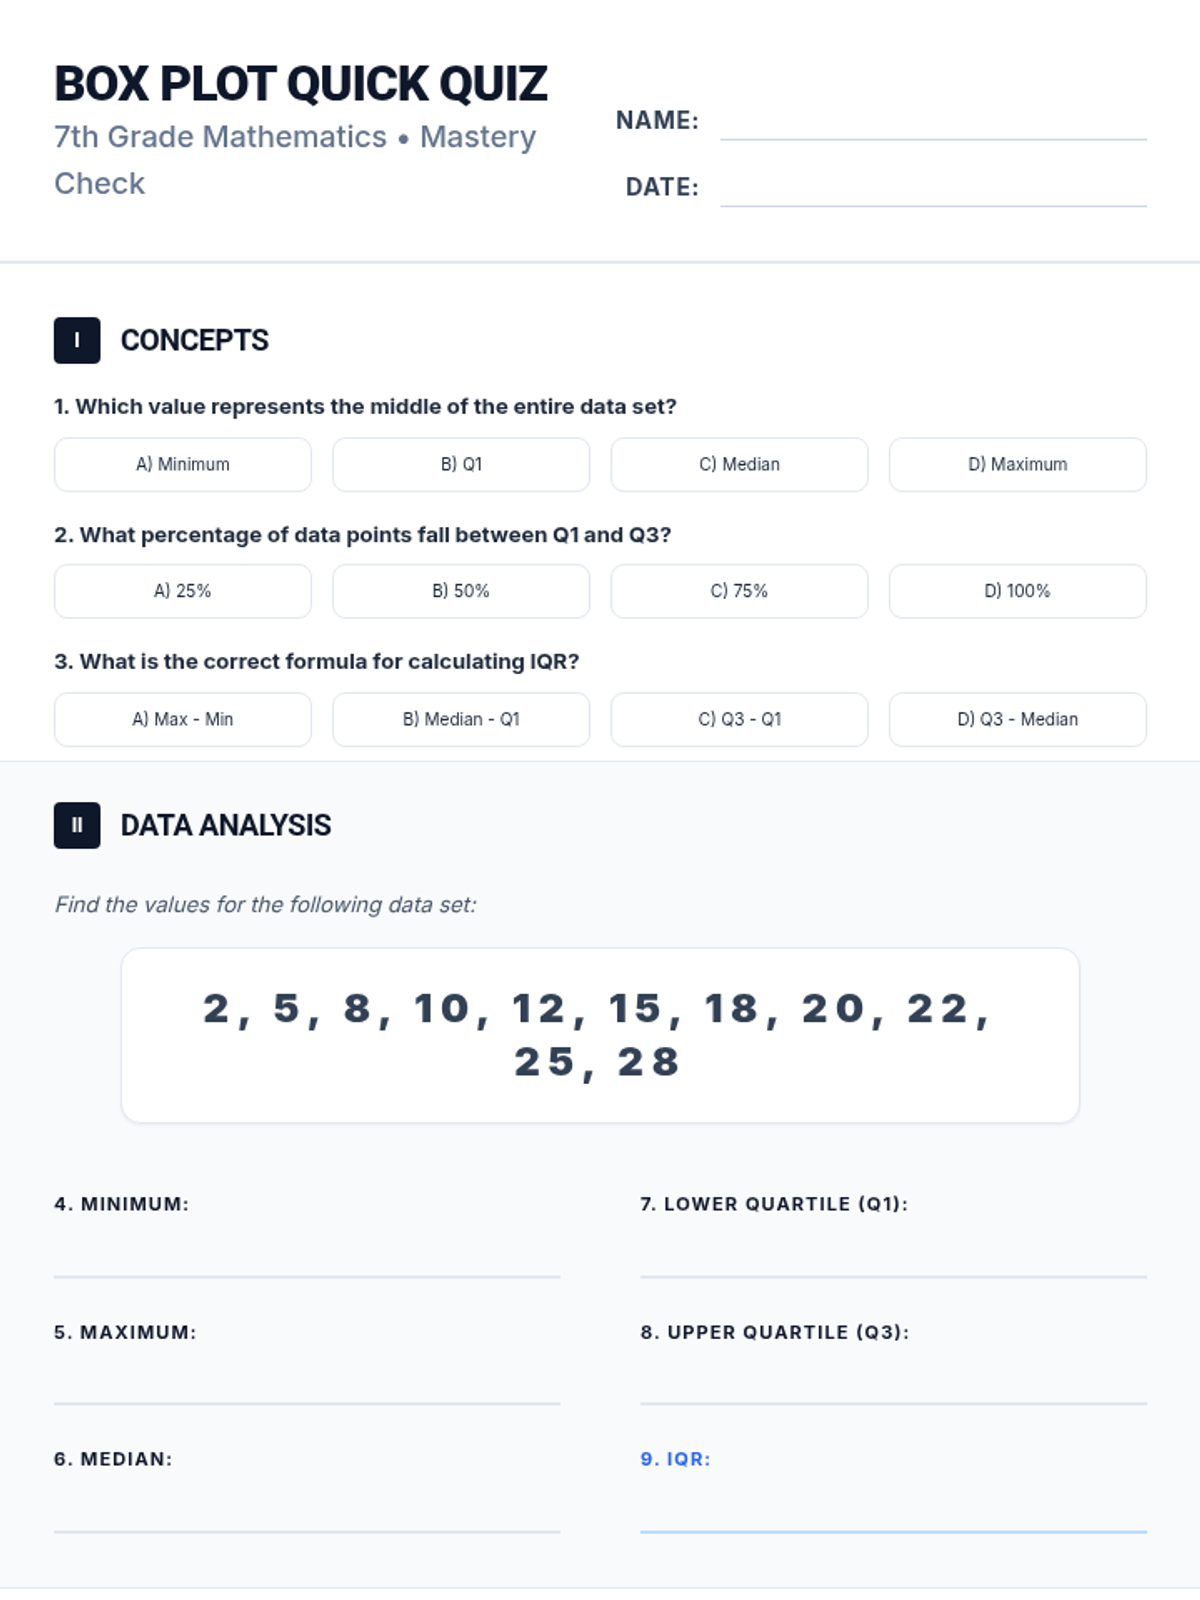
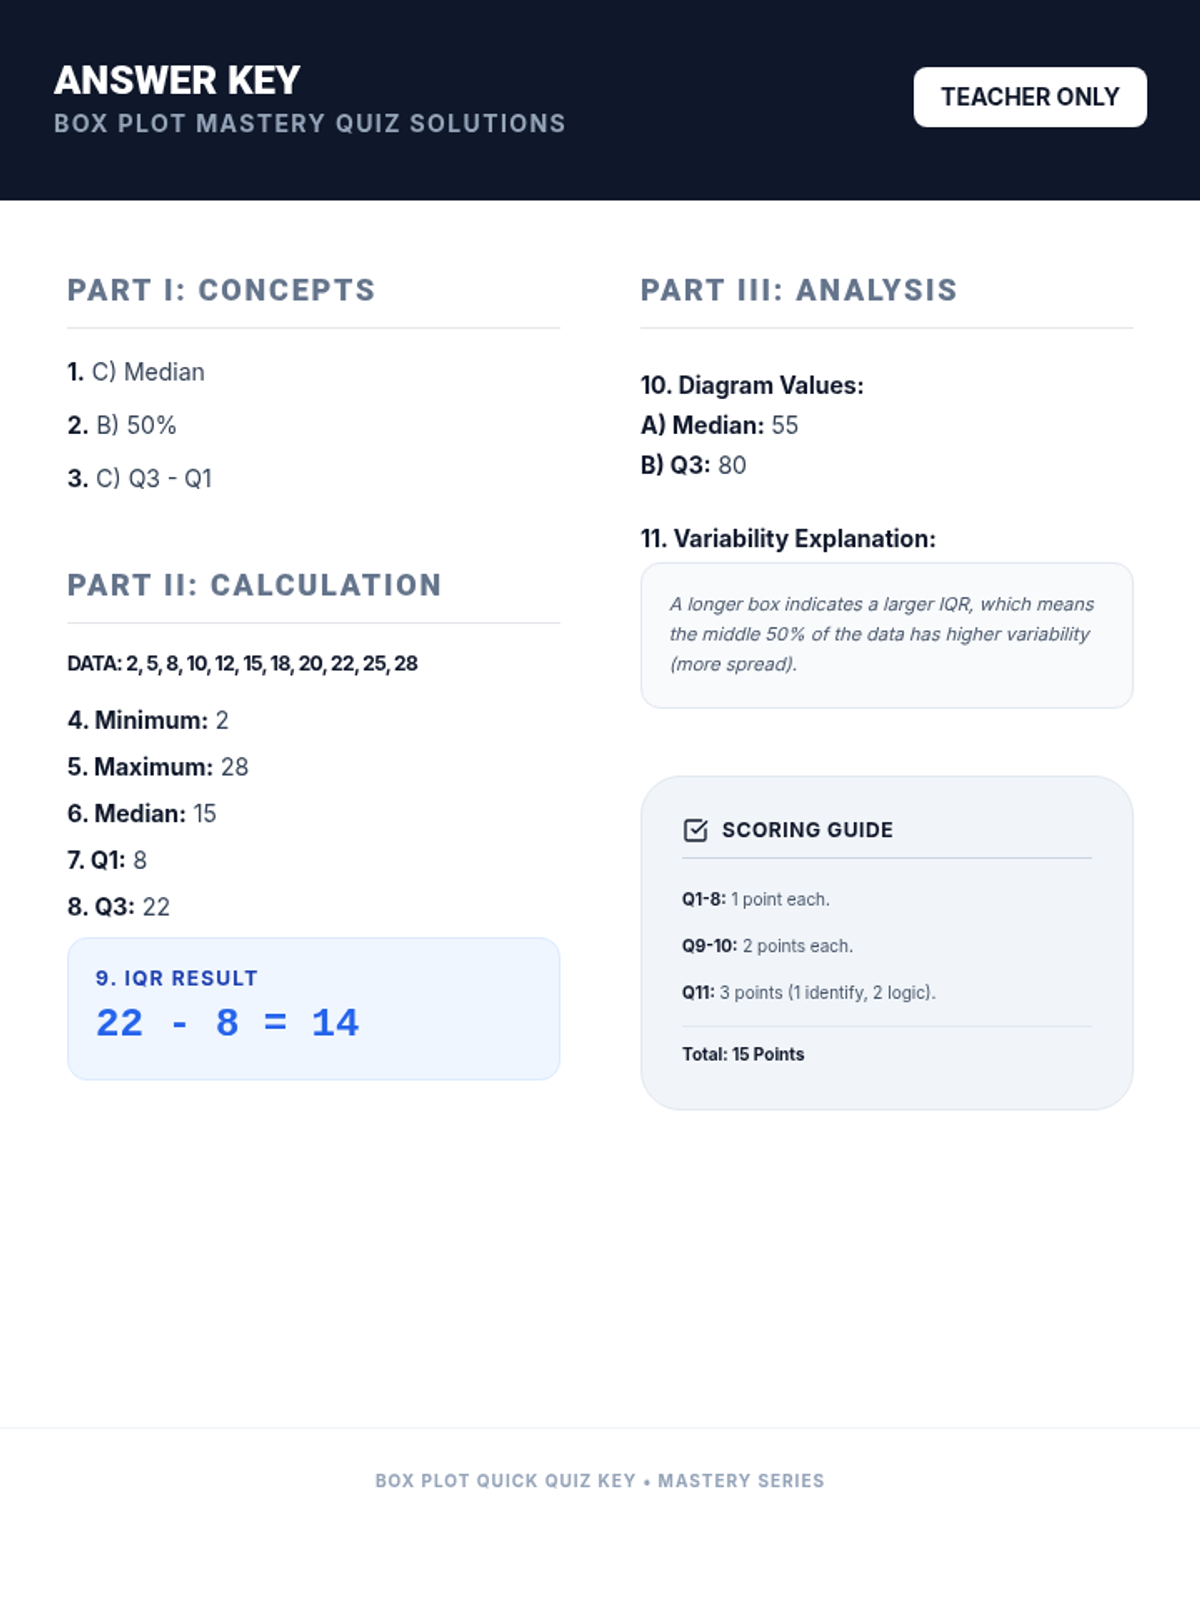
A high-energy review of Box and Whisker plots, focusing on the five-number summary, IQR, and data interpretation for students who have already been introduced to the concept.
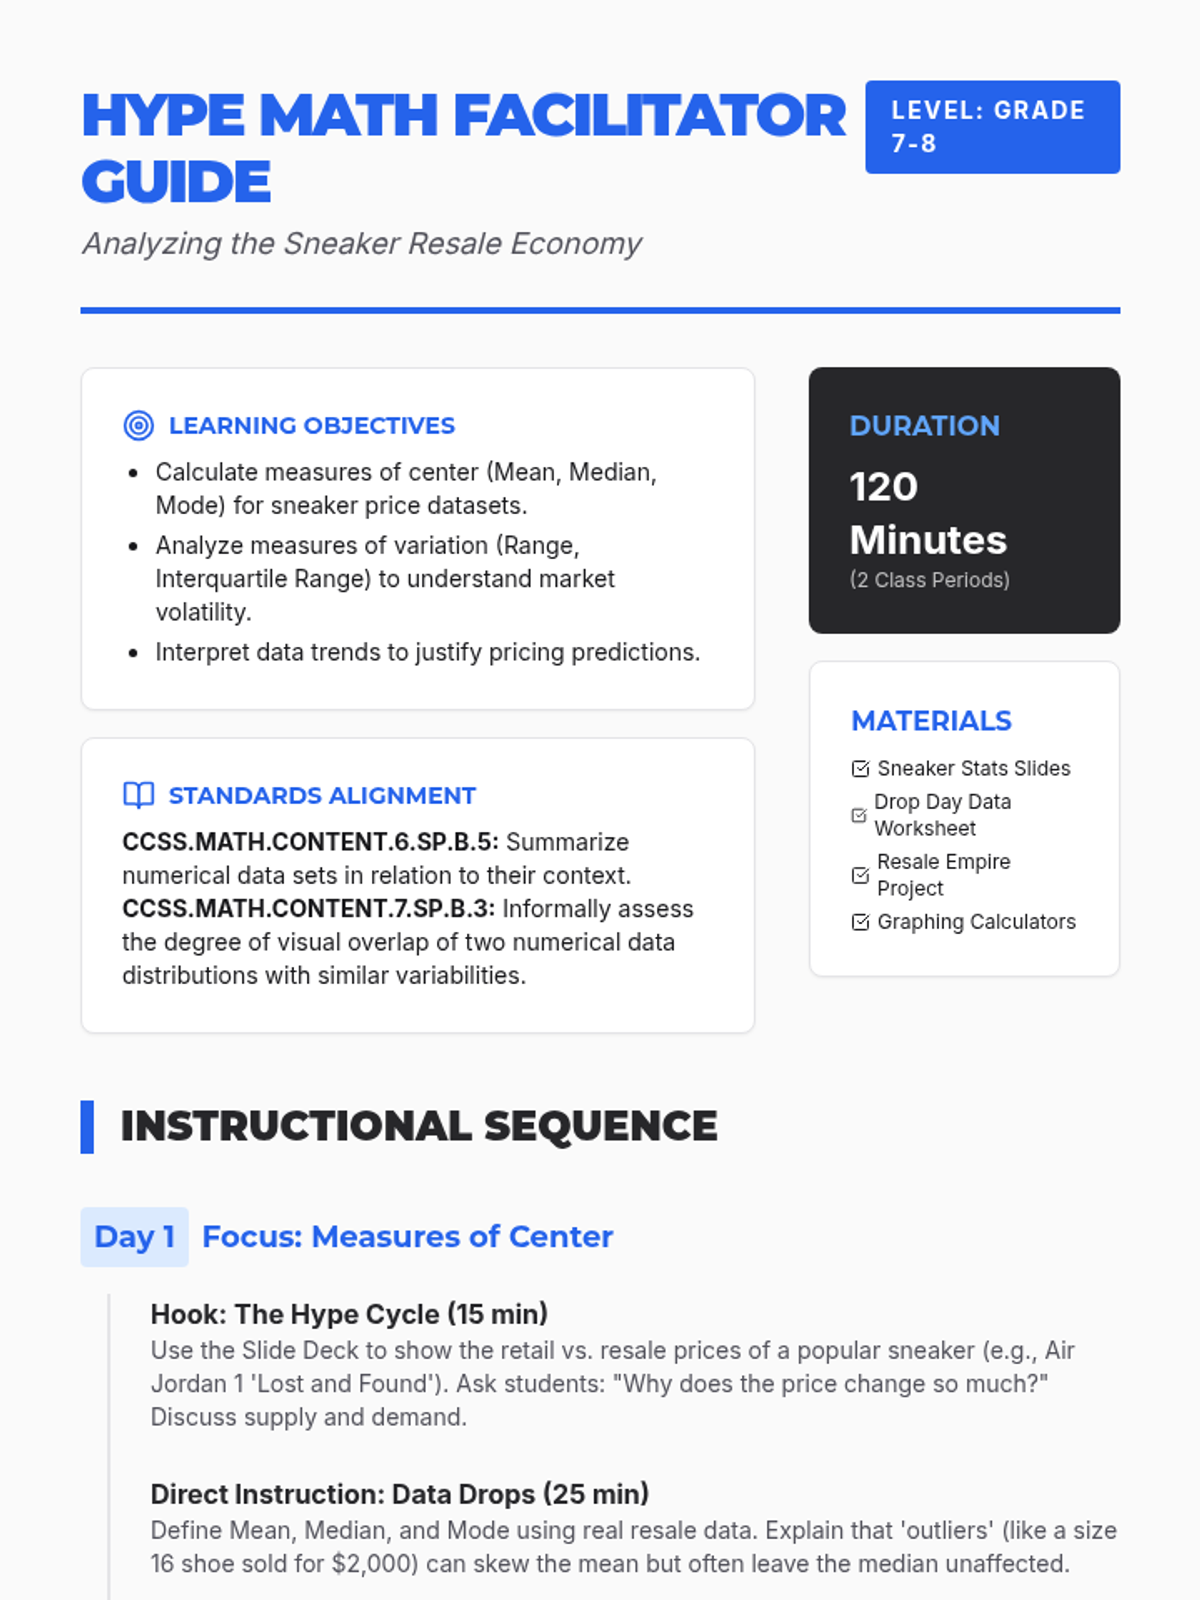
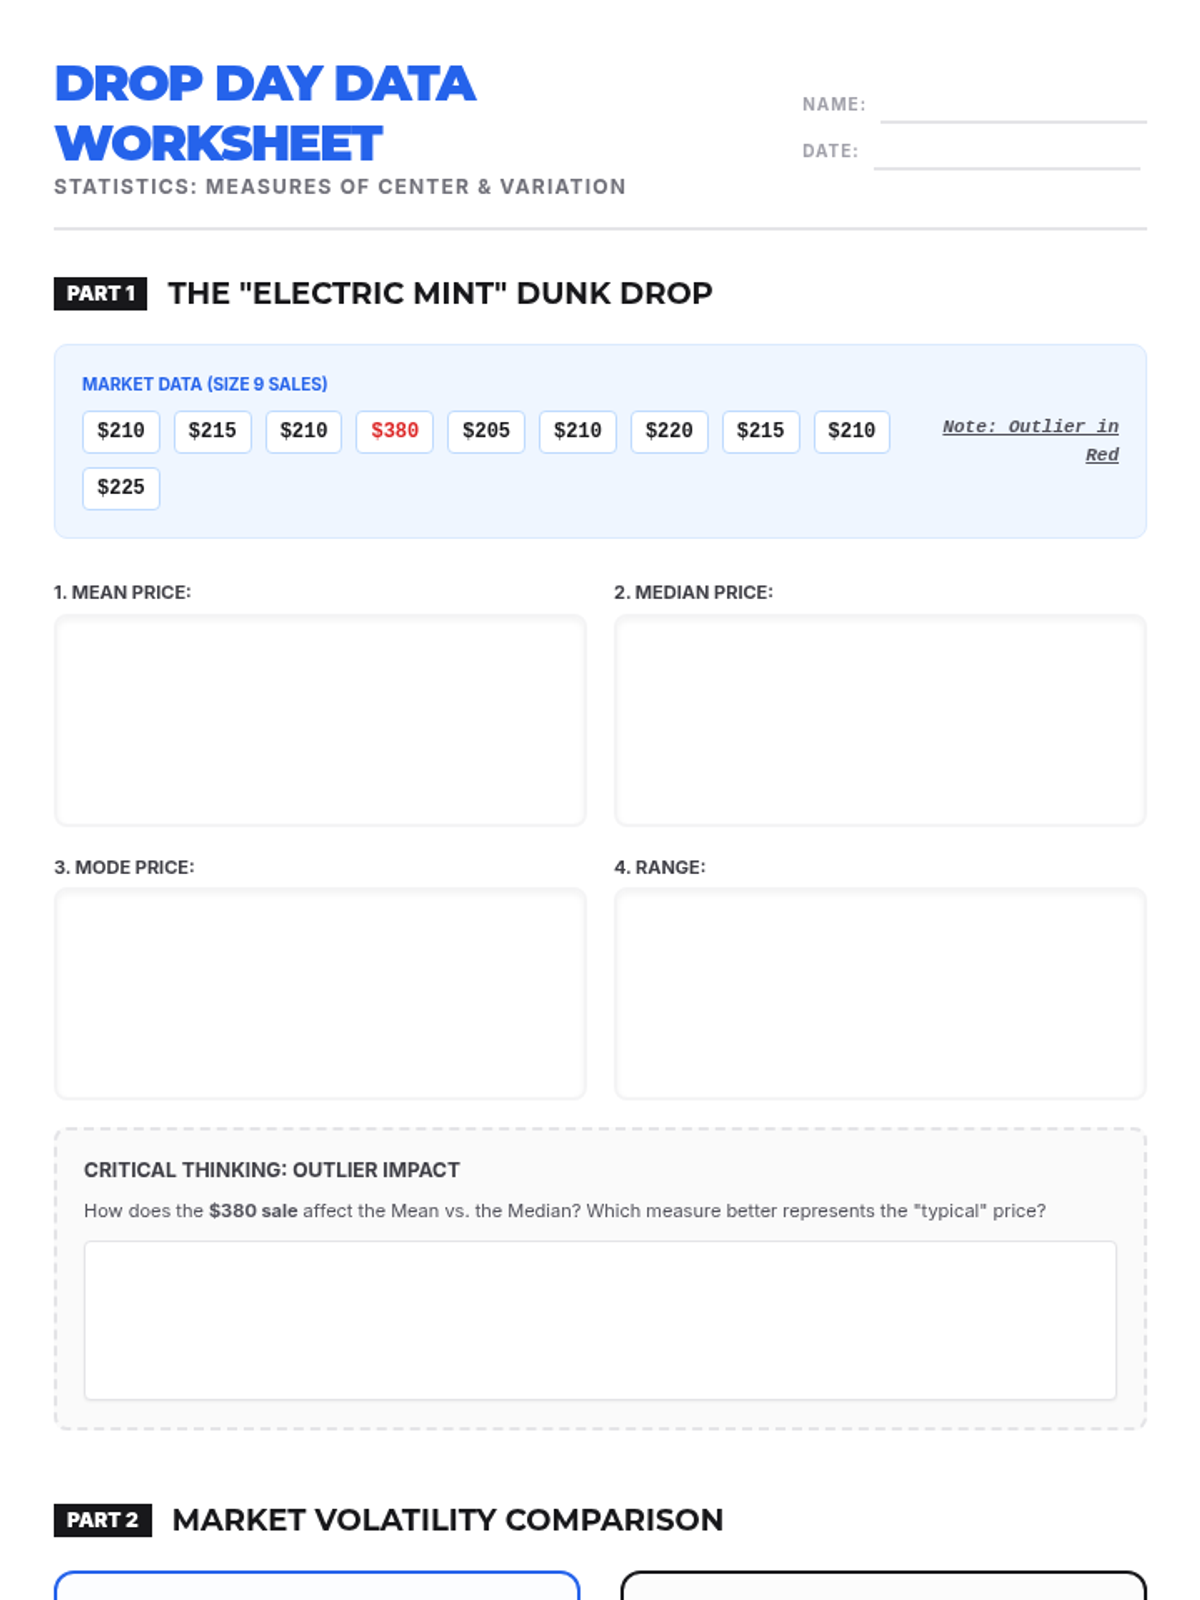
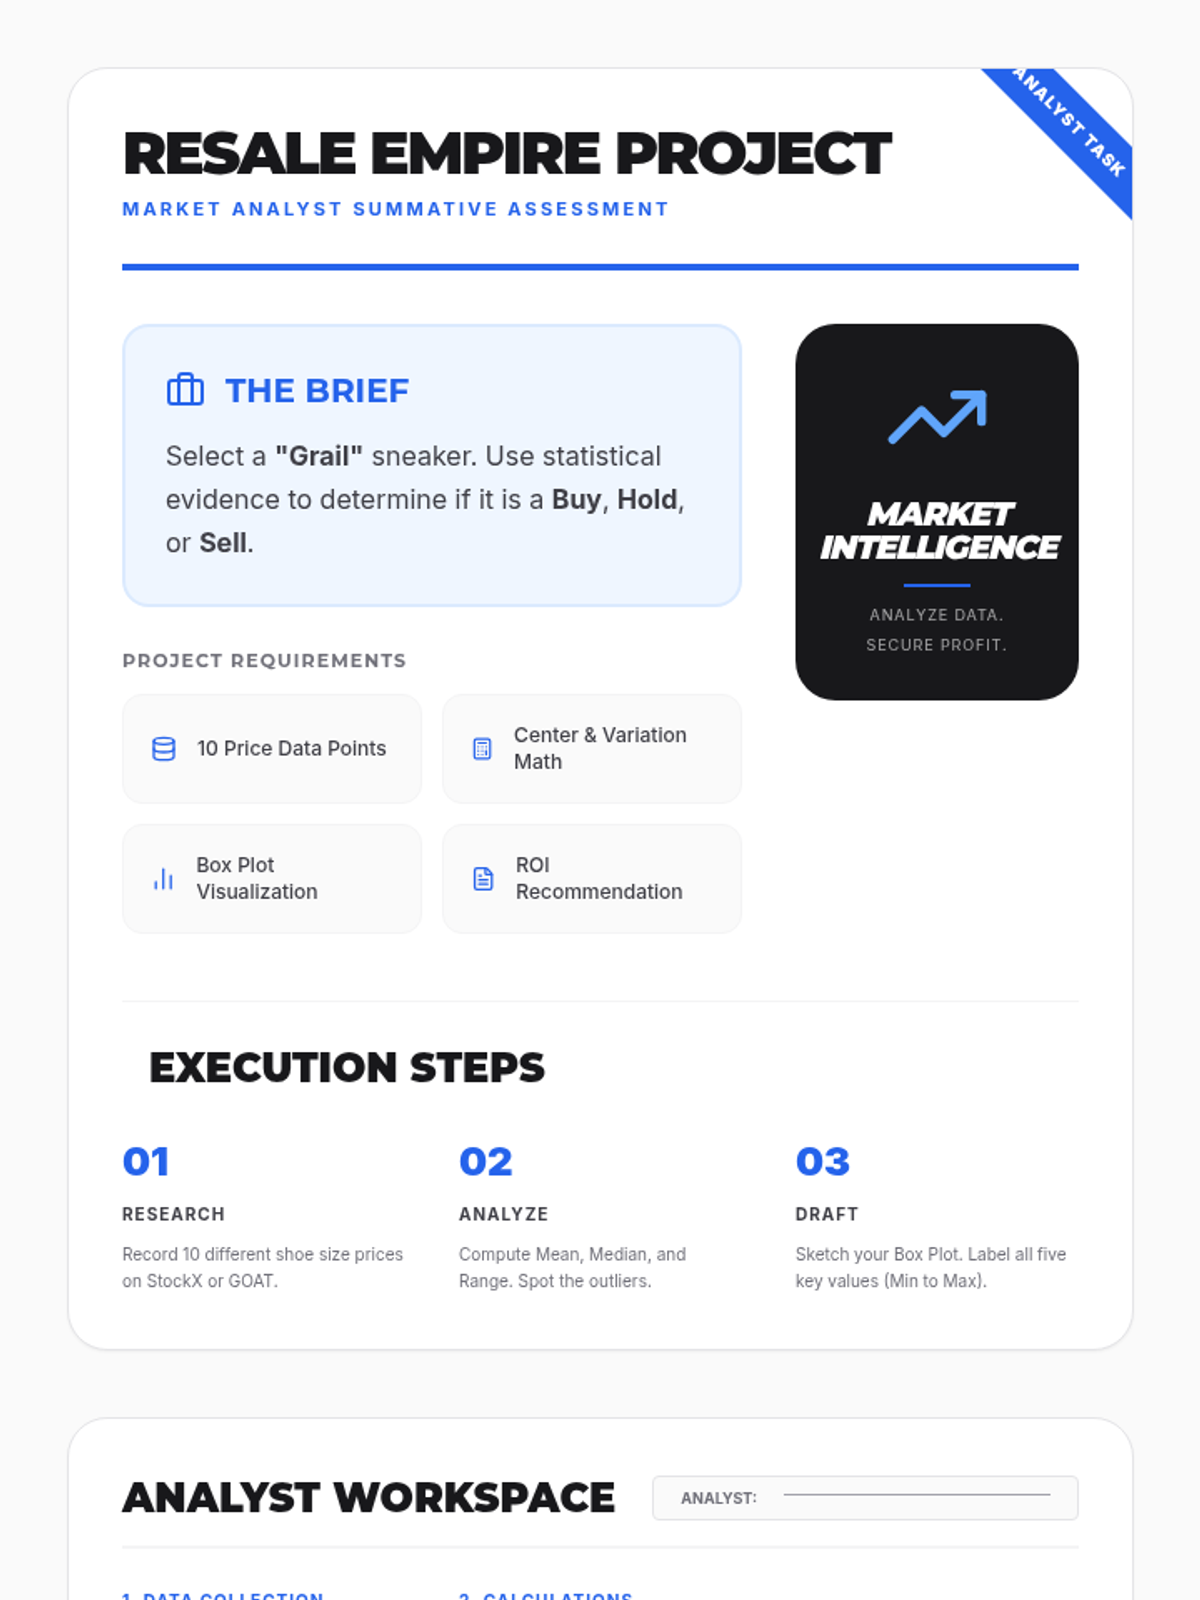
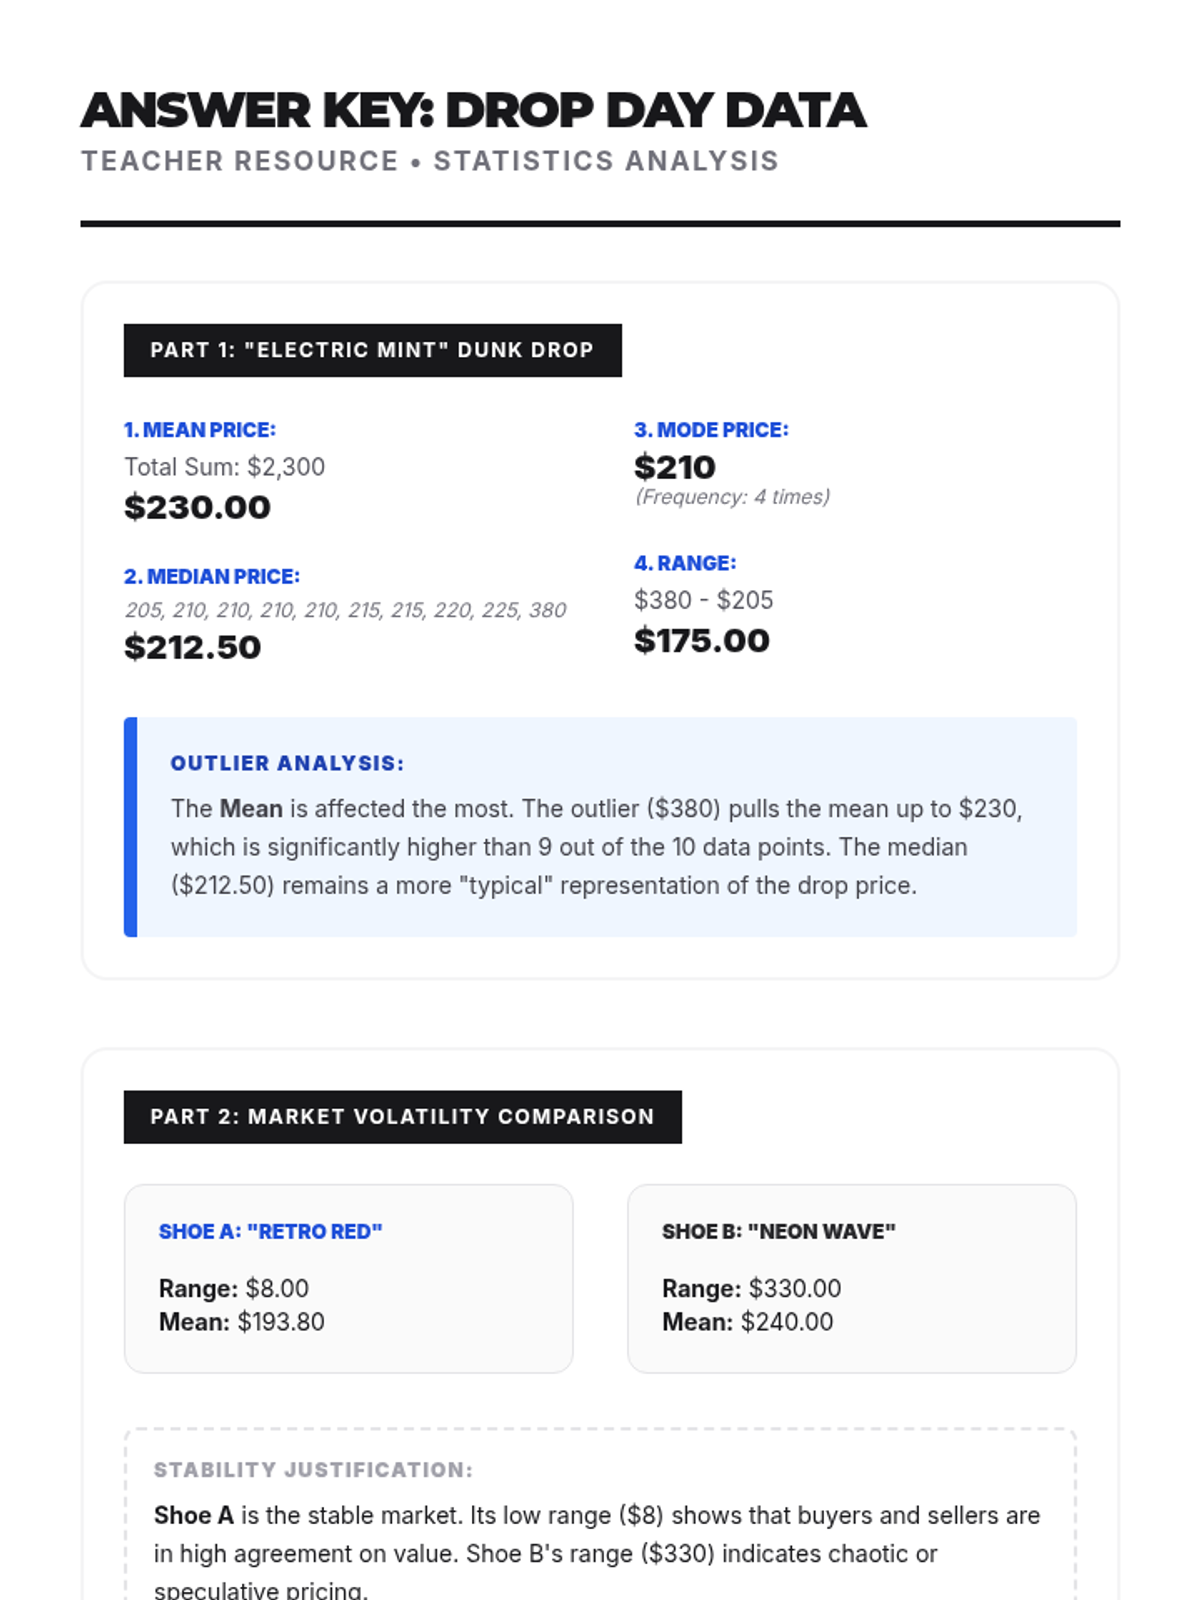
A statistics lesson for 7th-8th graders exploring measures of center and variation through the lens of the sneaker resale market. Students analyze pricing data from platforms to calculate mean, median, mode, and range to predict future market trends.
A 7th-grade math lesson focused on mastering the five-number summary and interquartile range for box-and-whisker plots, specifically designed for MCAS preparation.
A high-energy review session using a Jeopardy-style game format to cover Ratios, The Number System, Expressions & Equations, Geometry, and Statistics. Students work individually or in teams to solve rigorous EOG-aligned problems.
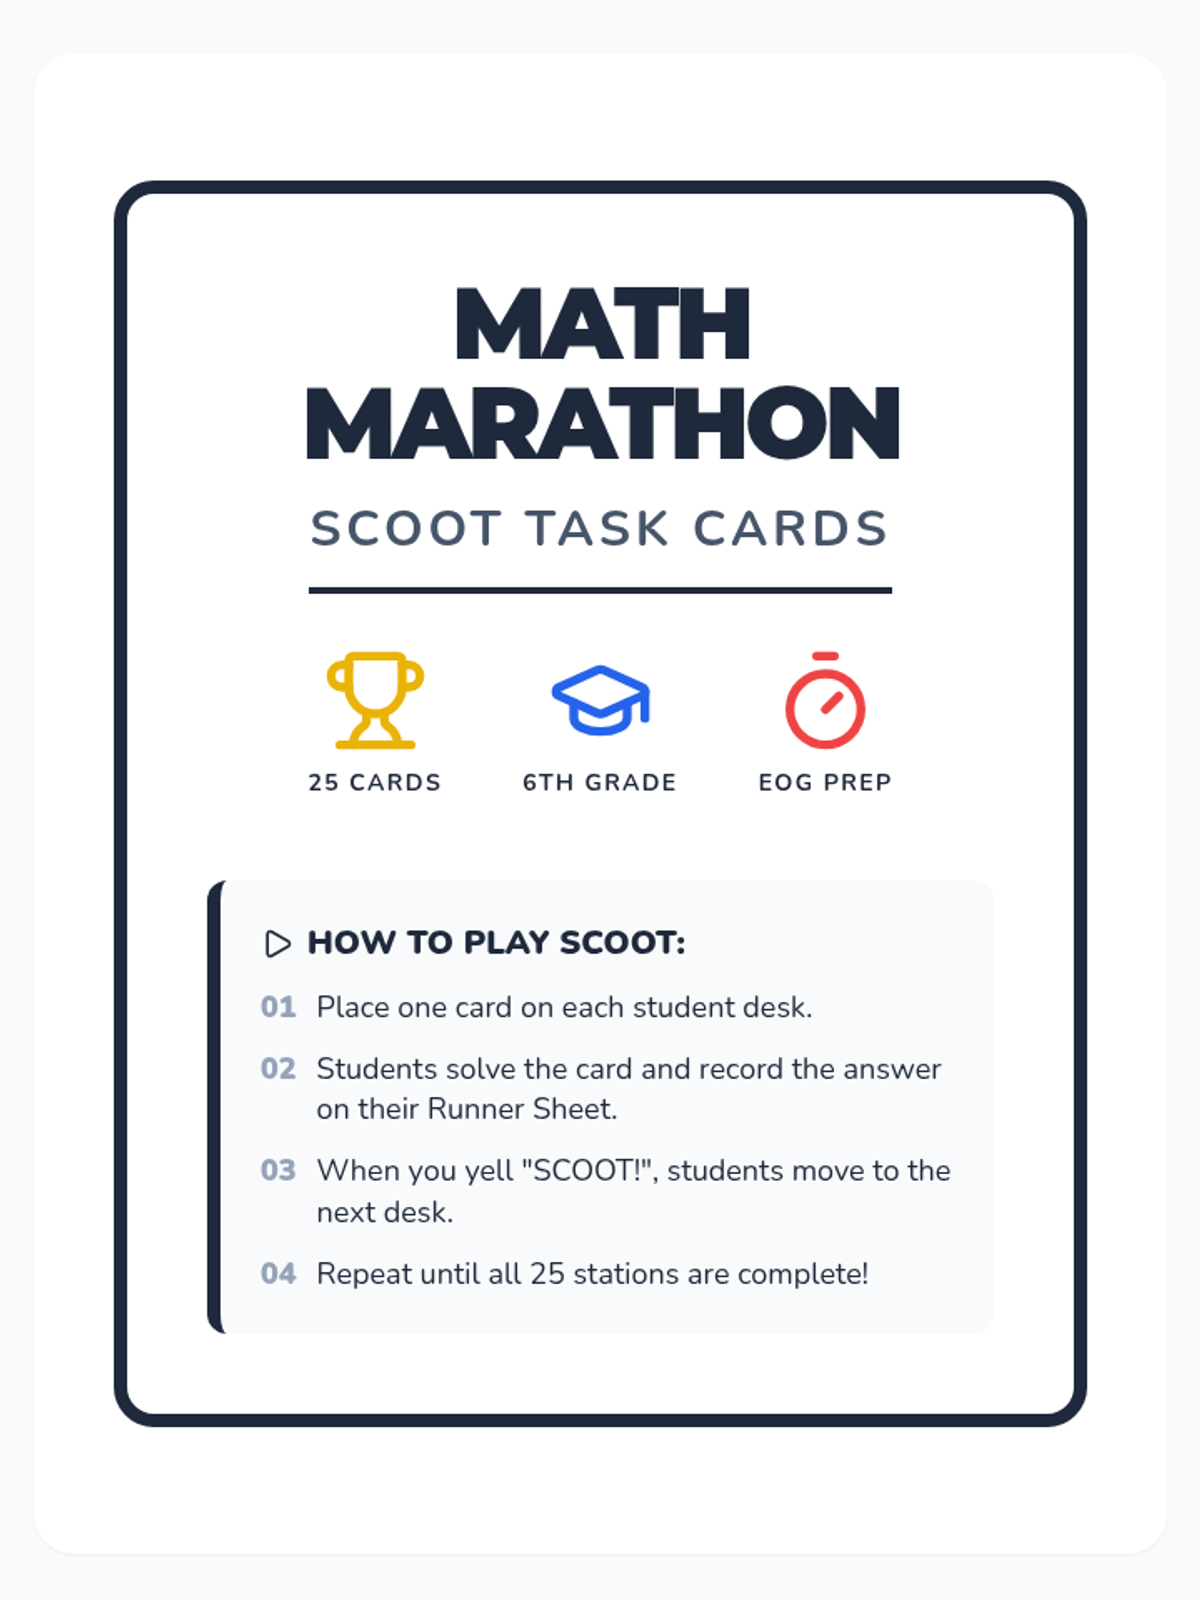
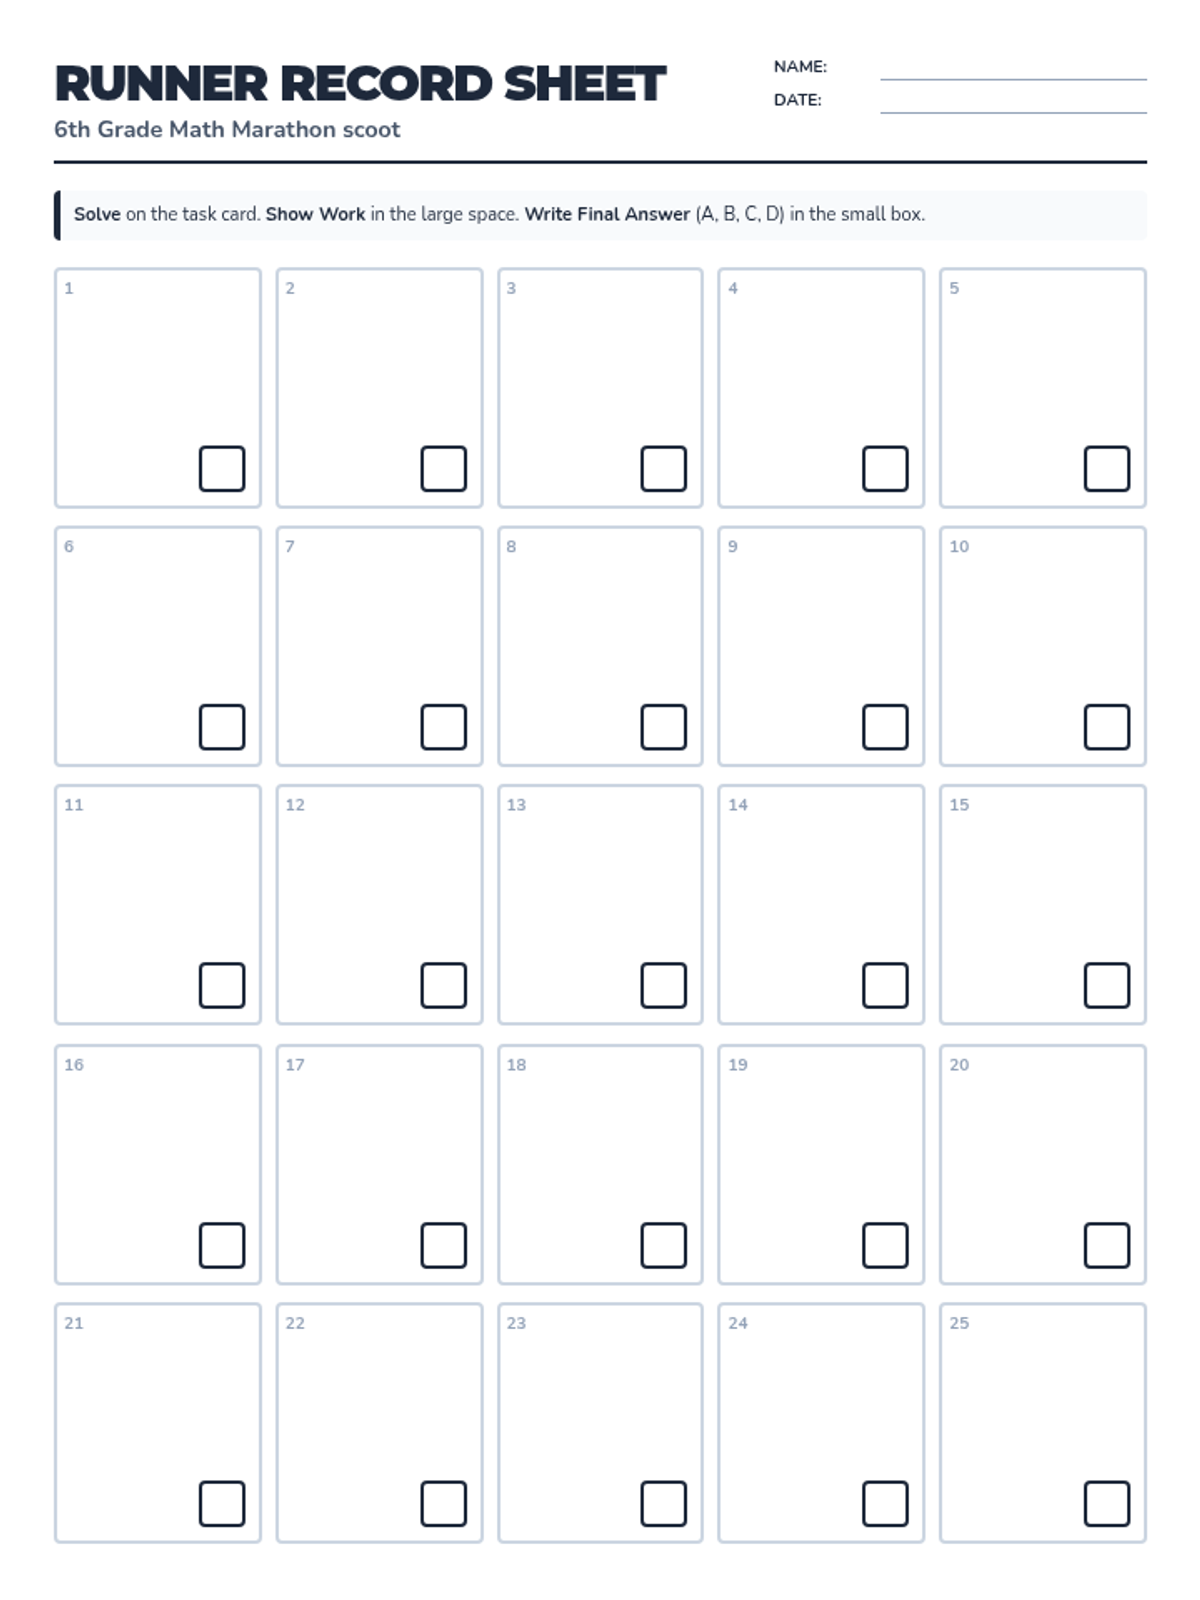
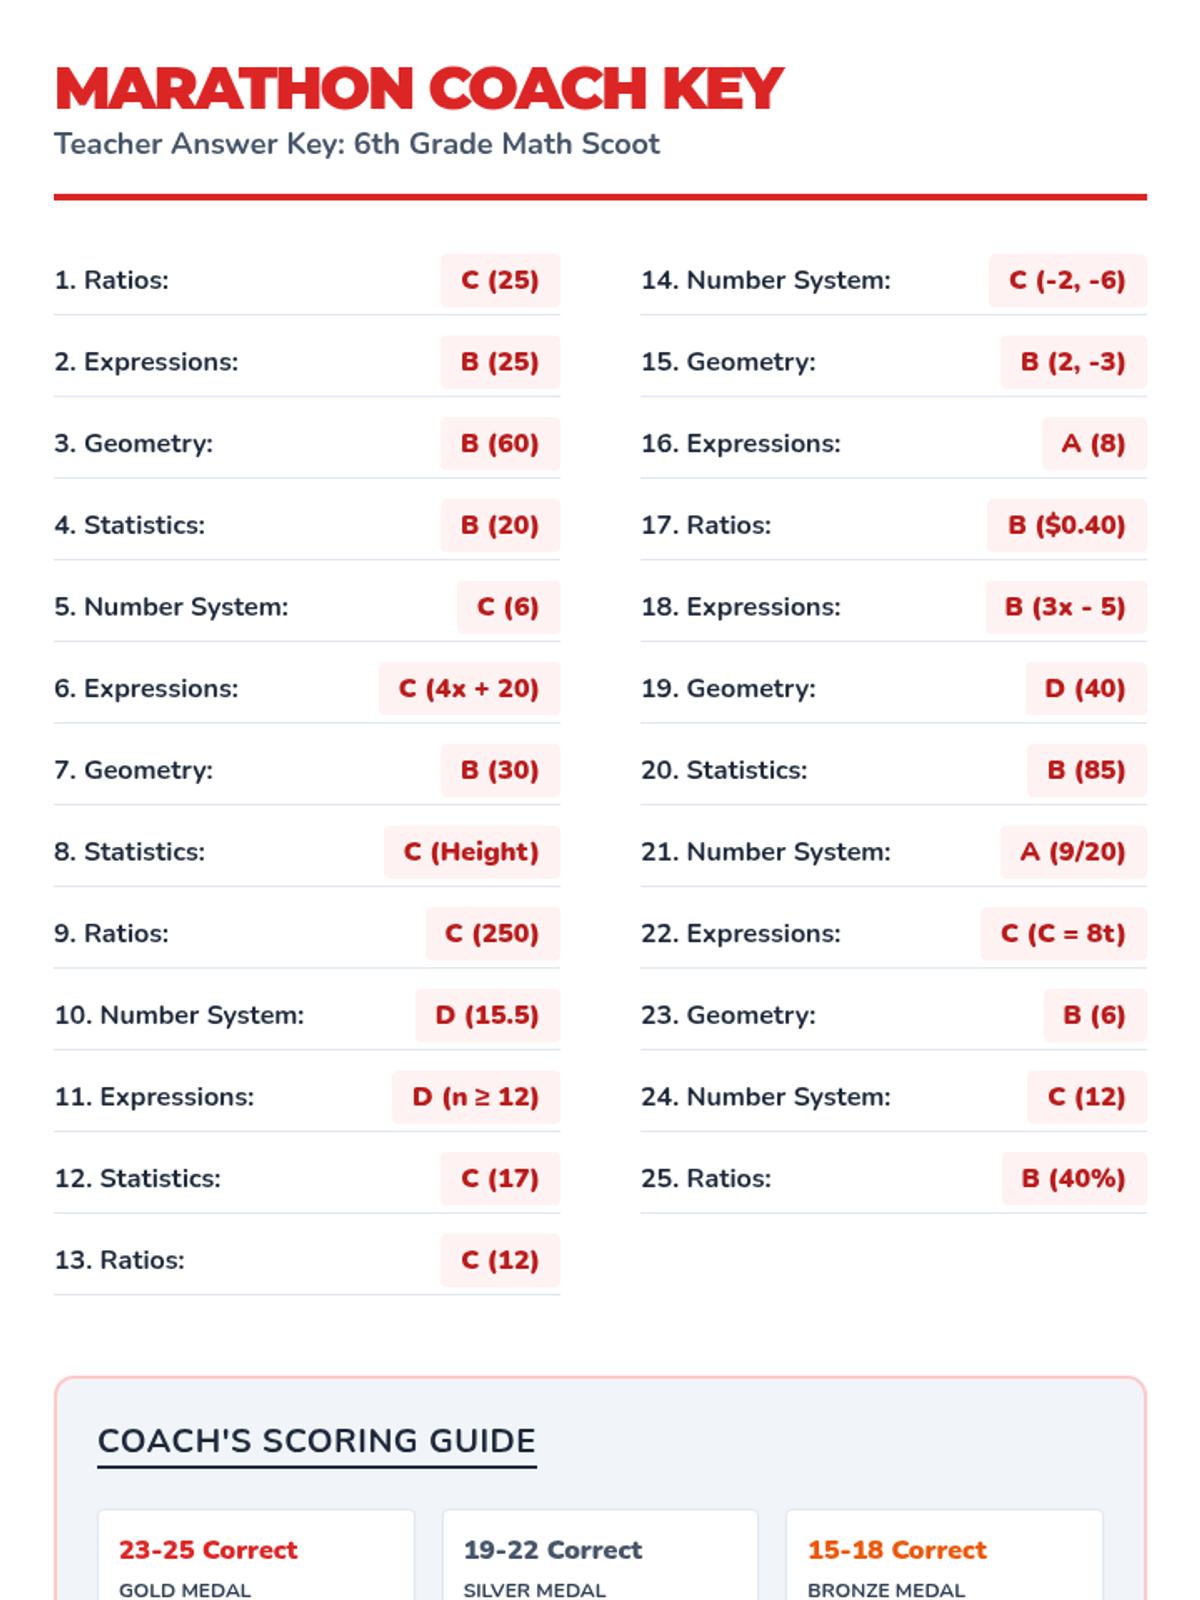
A comprehensive test prep activity using the Scoot game format, covering all 6th-grade math domains to prepare students for End of Grade (EOG) testing.
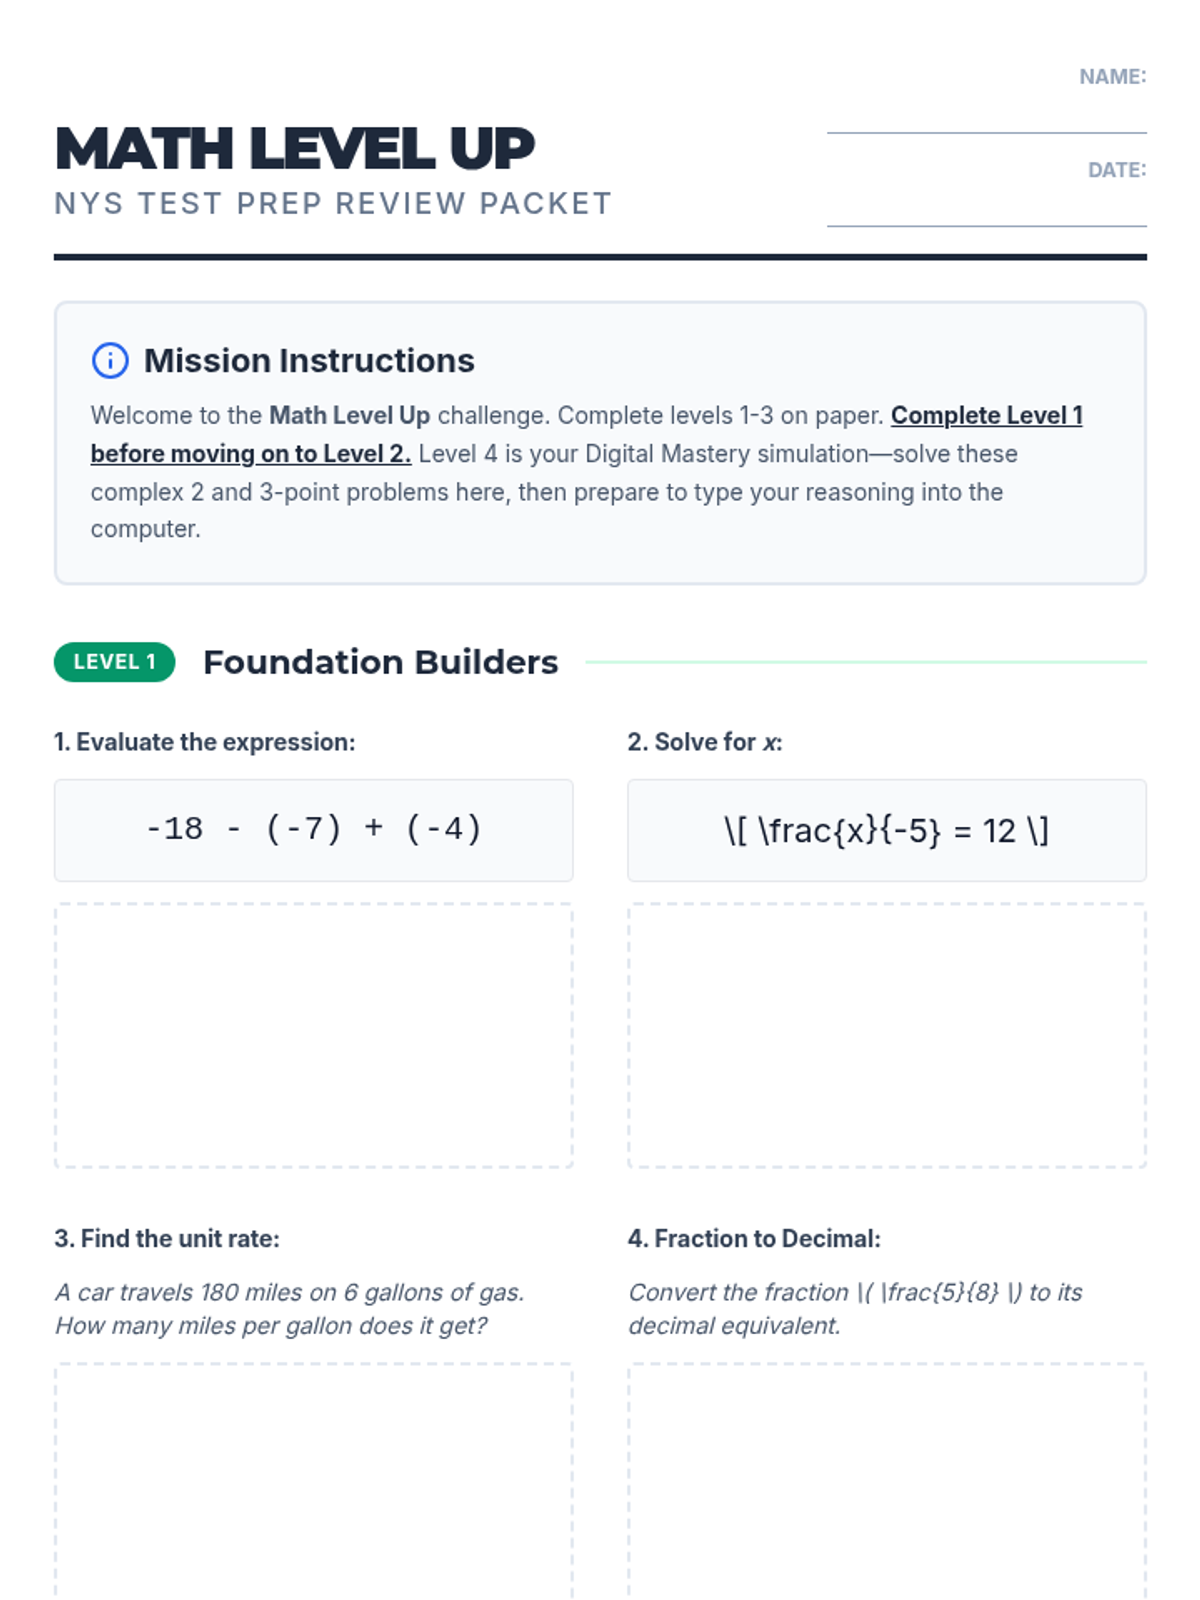
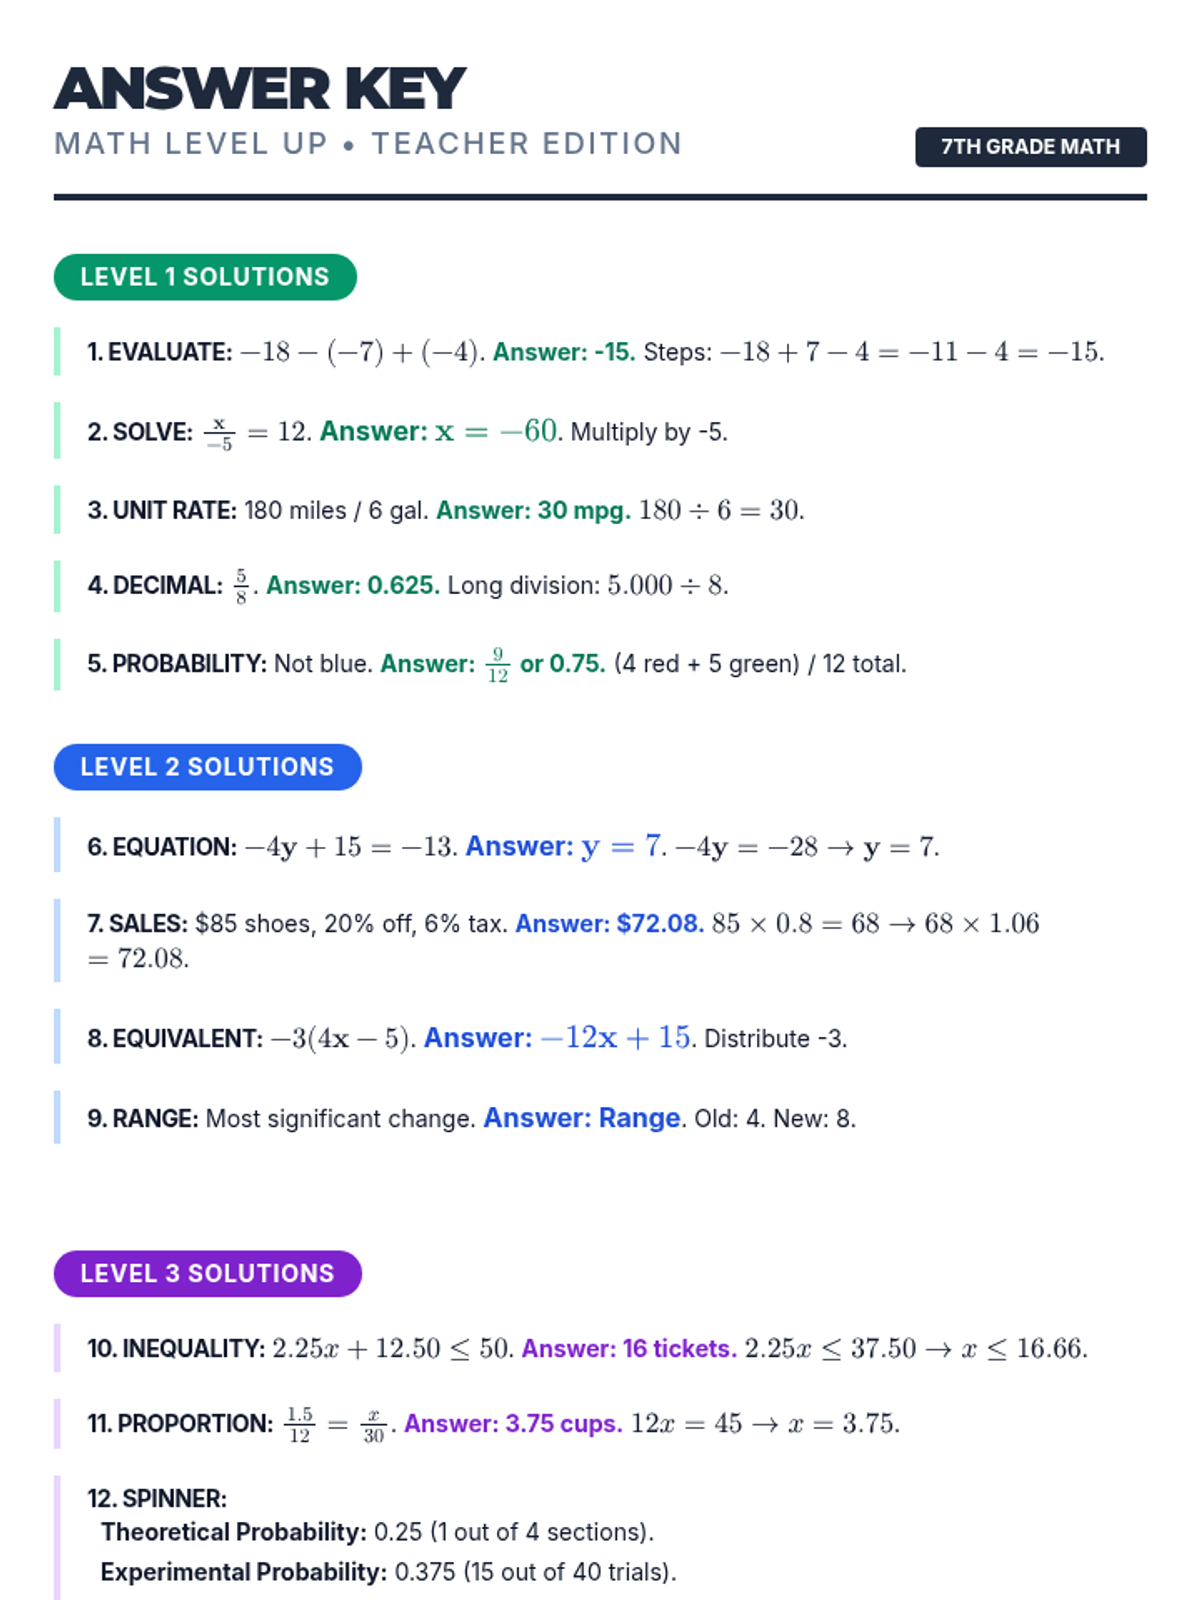
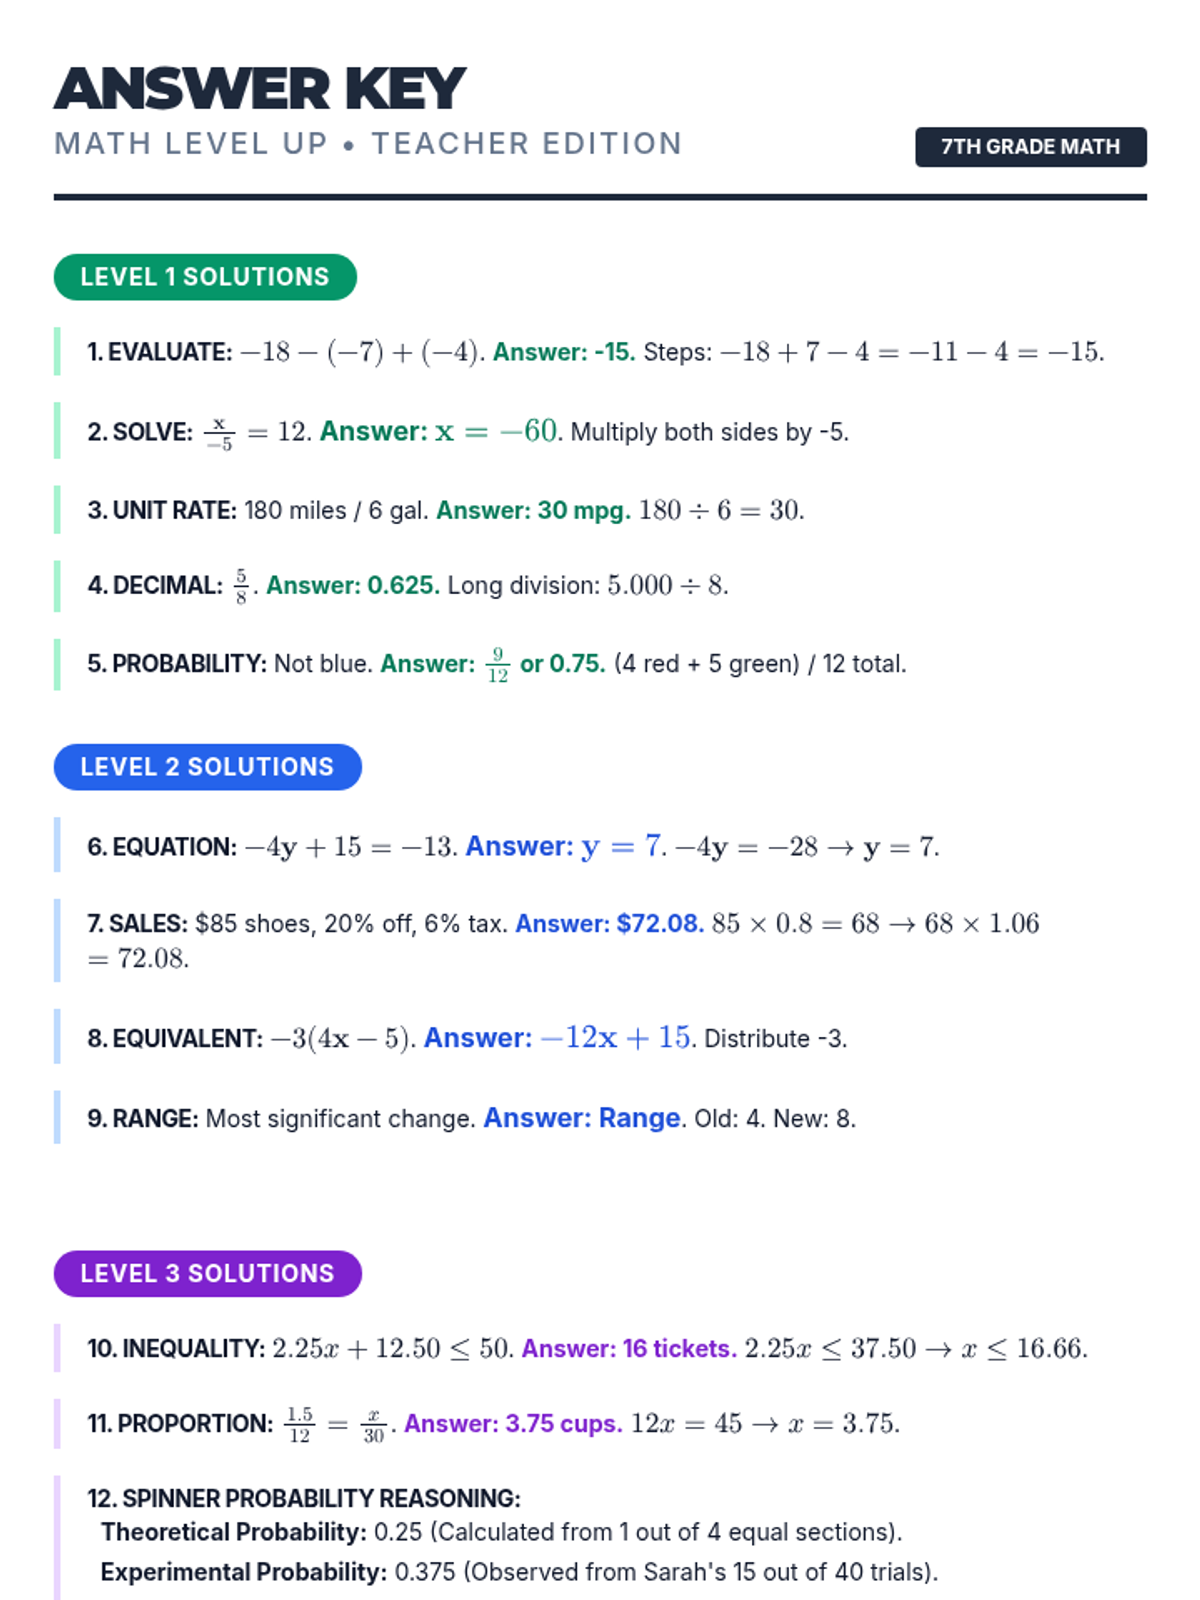
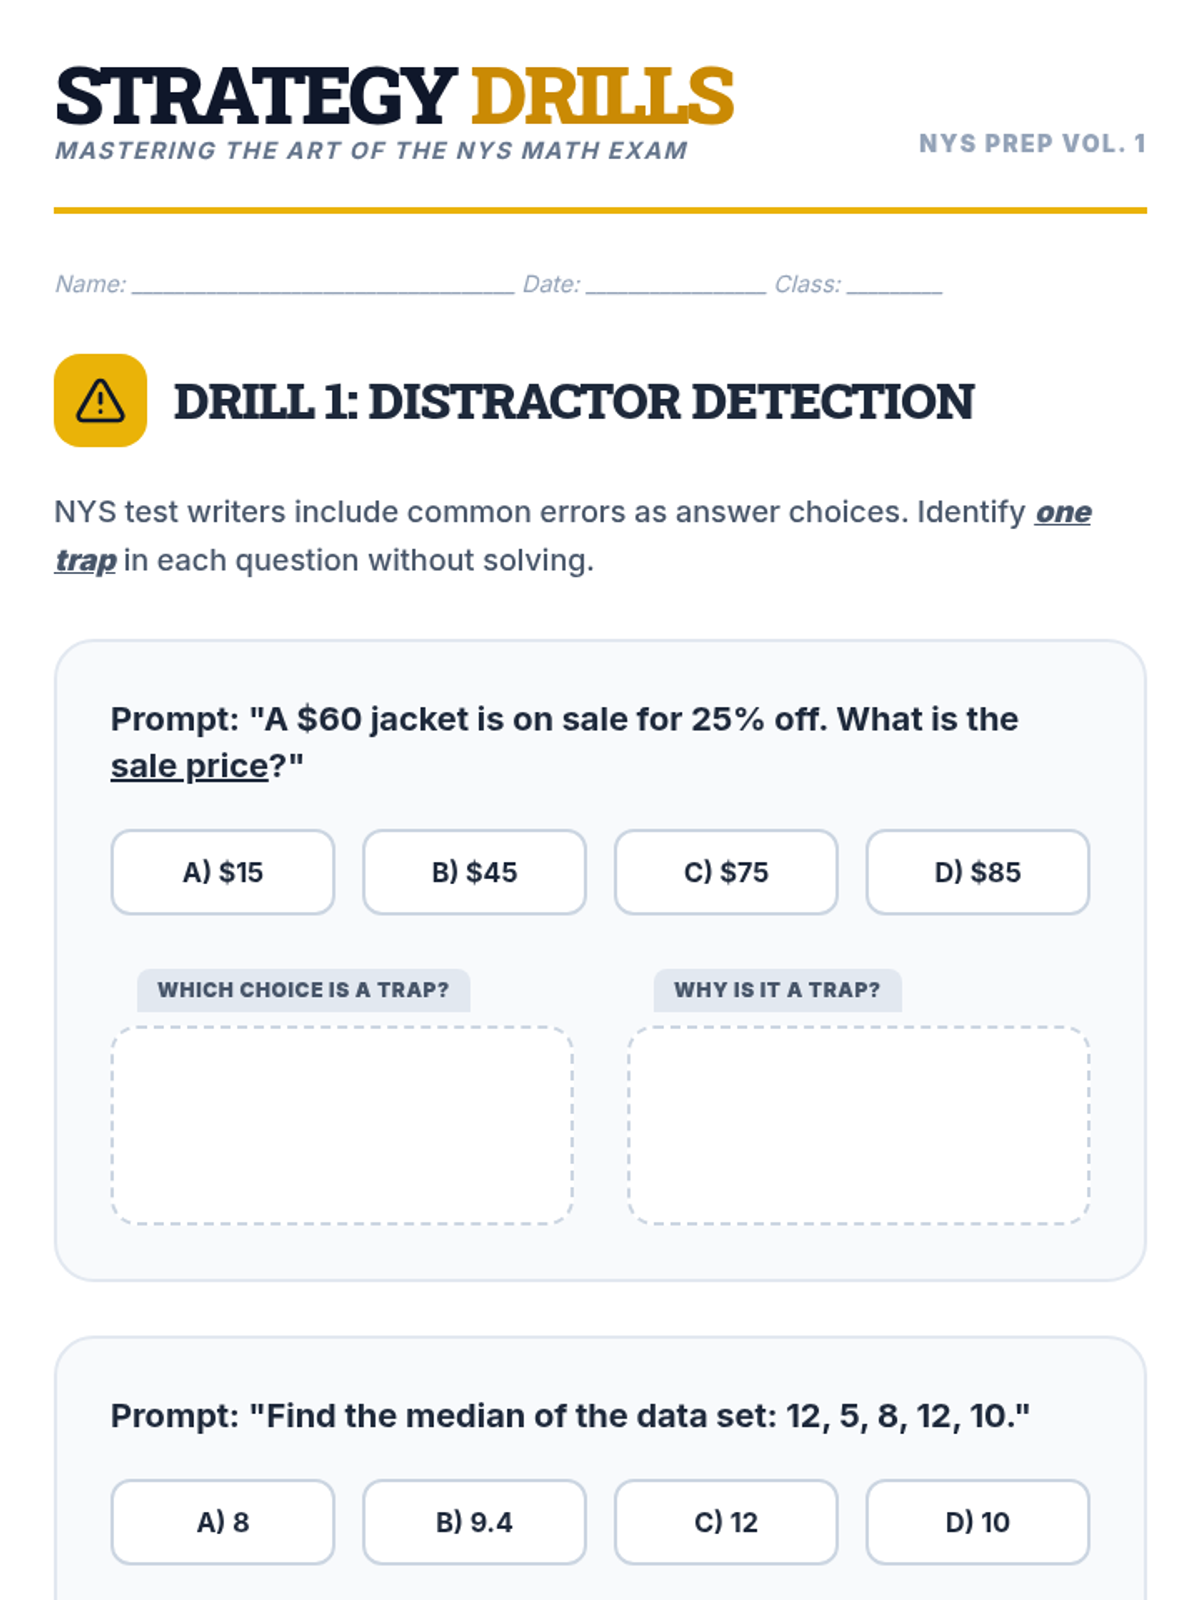
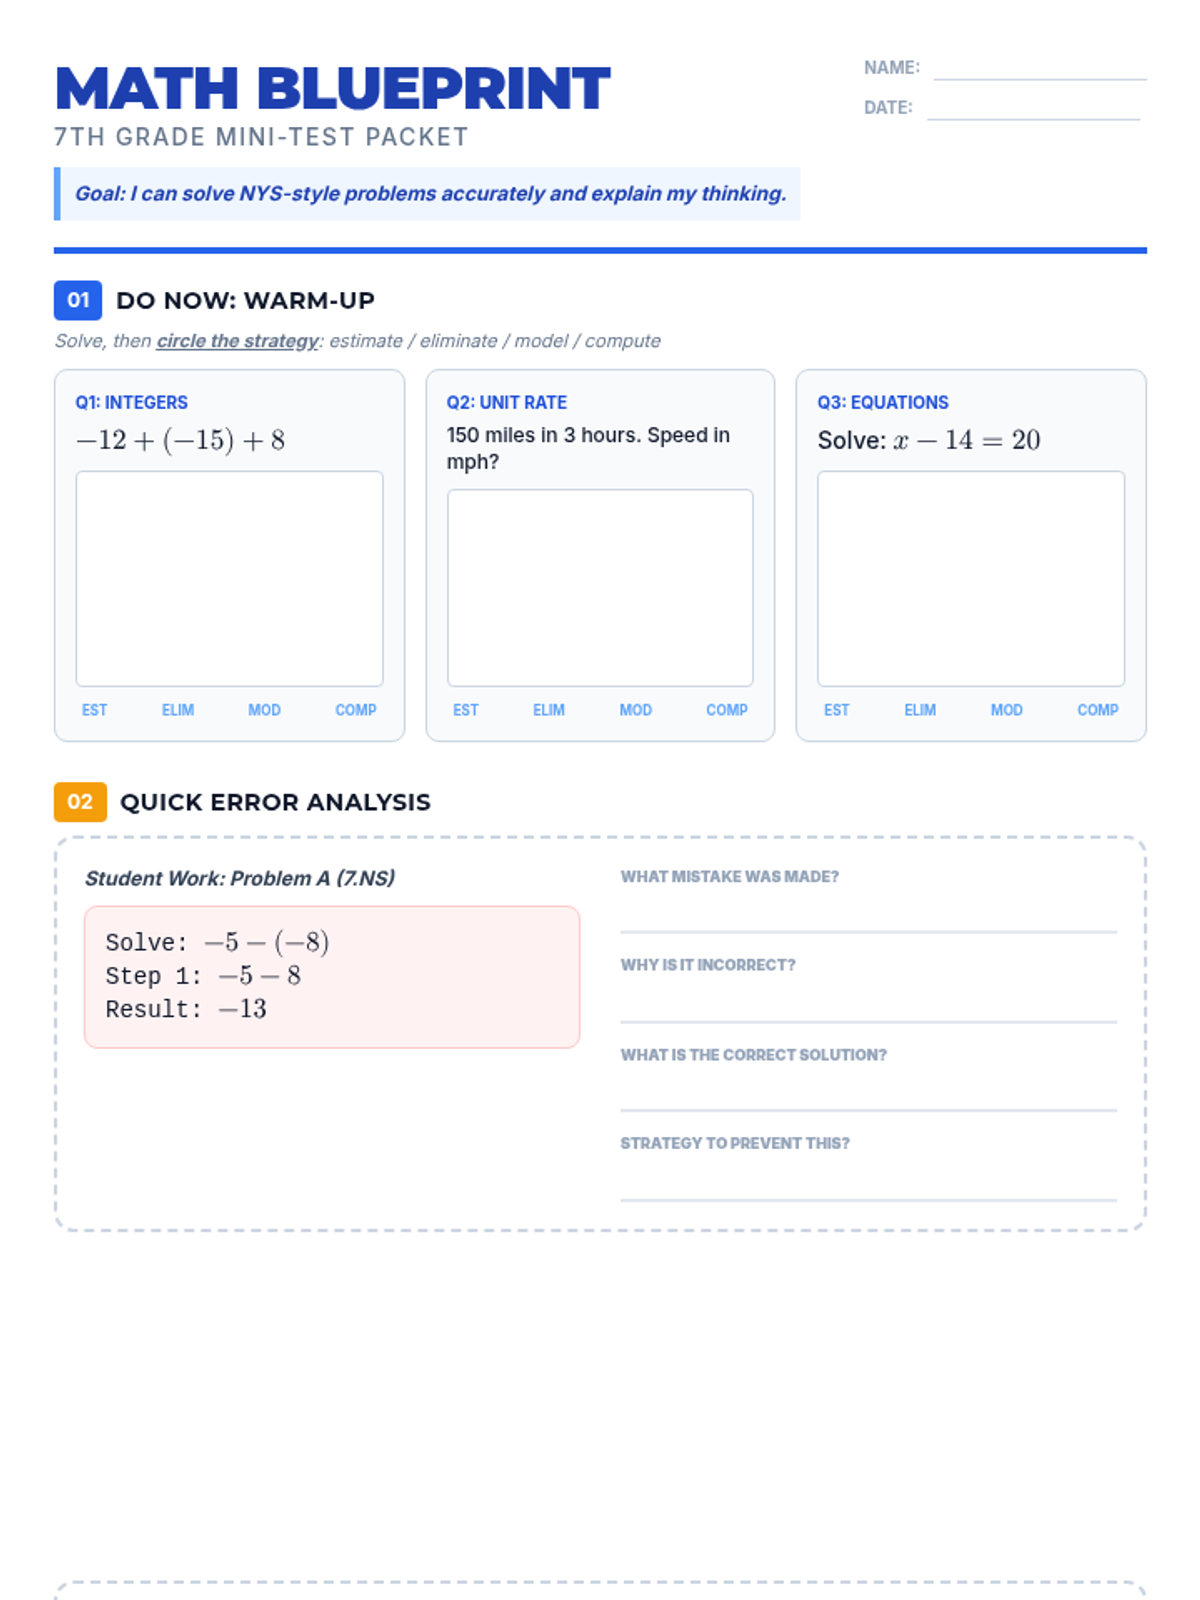
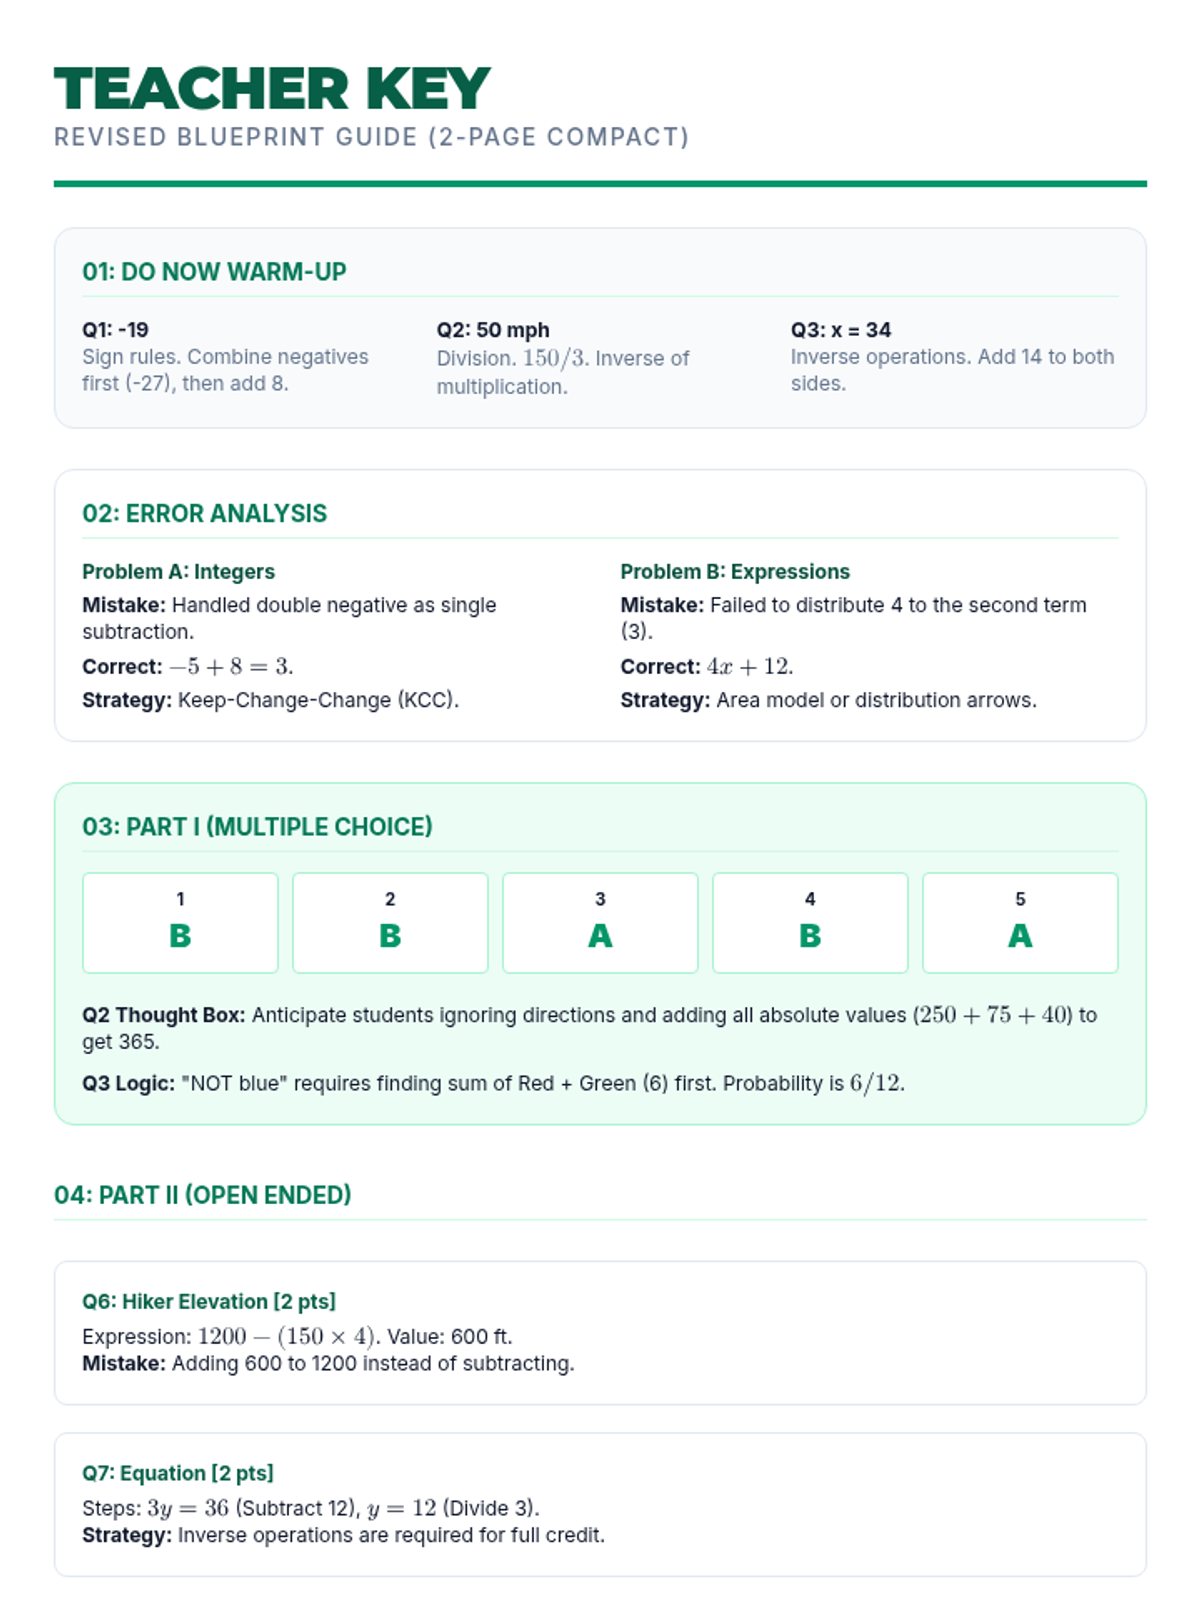
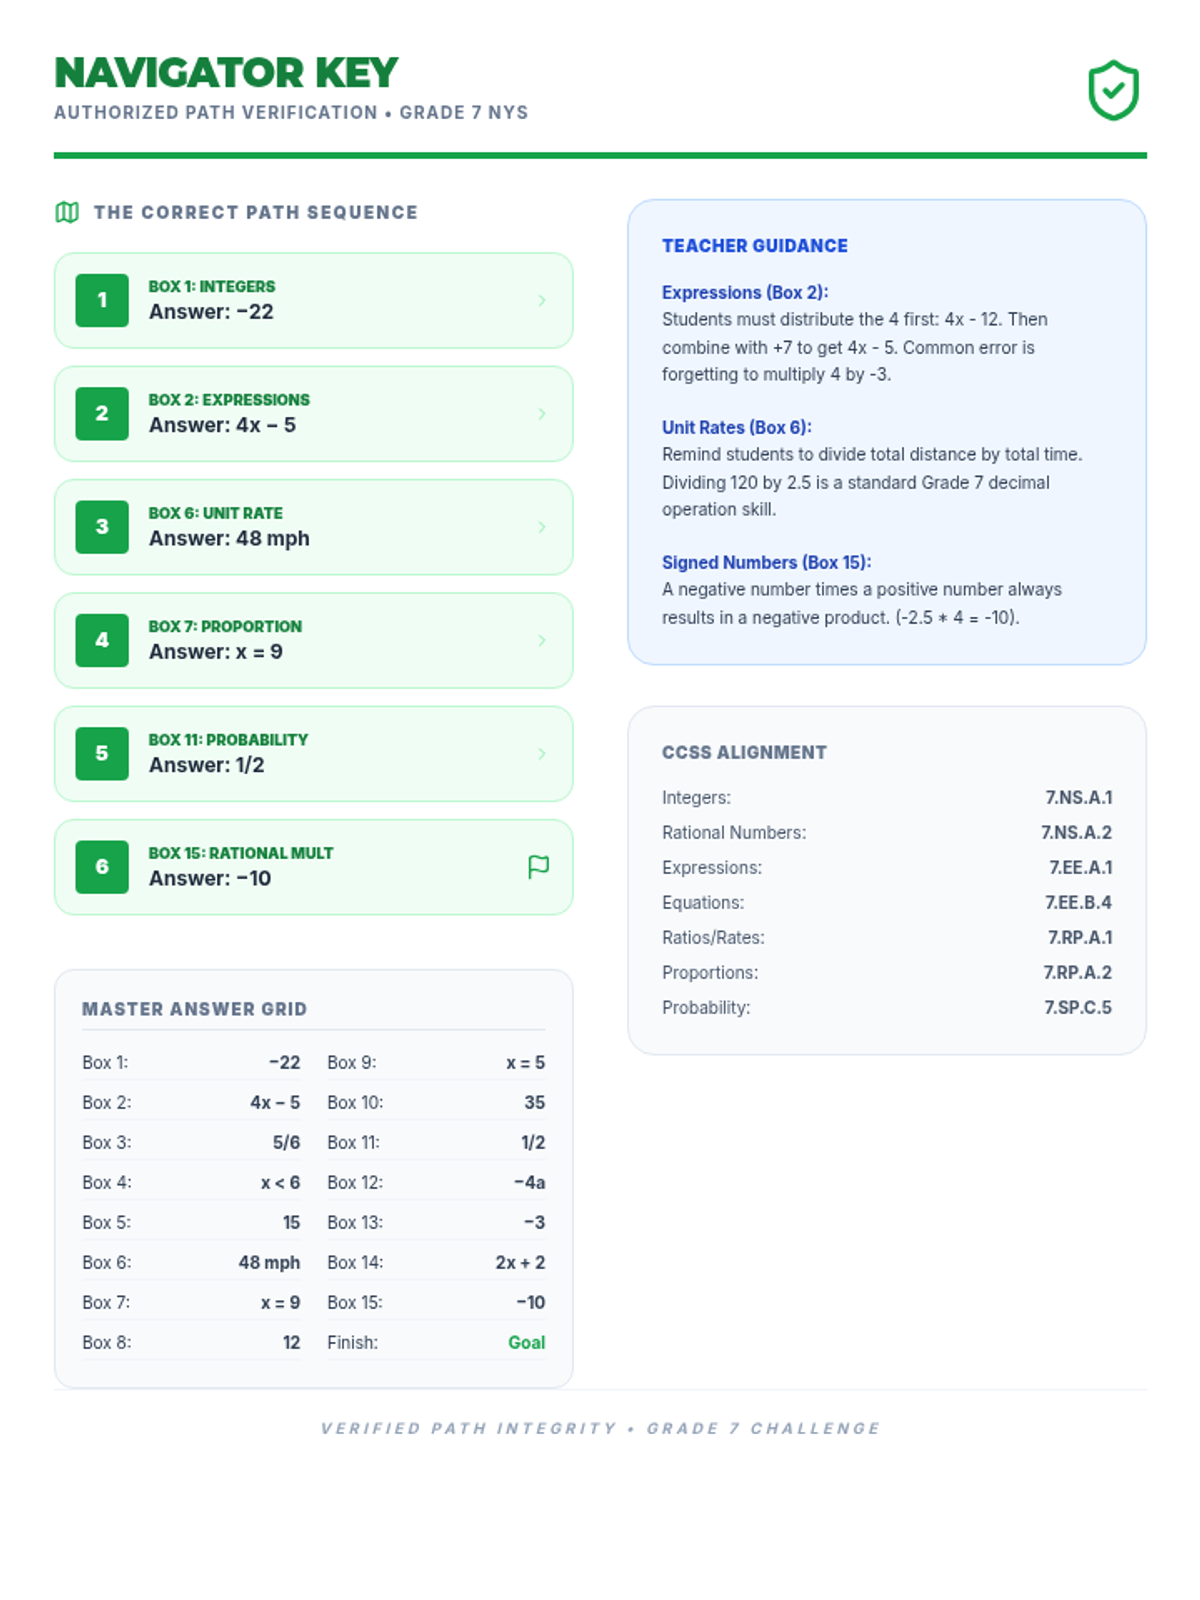
A comprehensive 7th-grade math review packet designed for NYS test prep, featuring tiered difficulty levels (Level 1-3) to build student confidence and mastery in key CCSS domains.
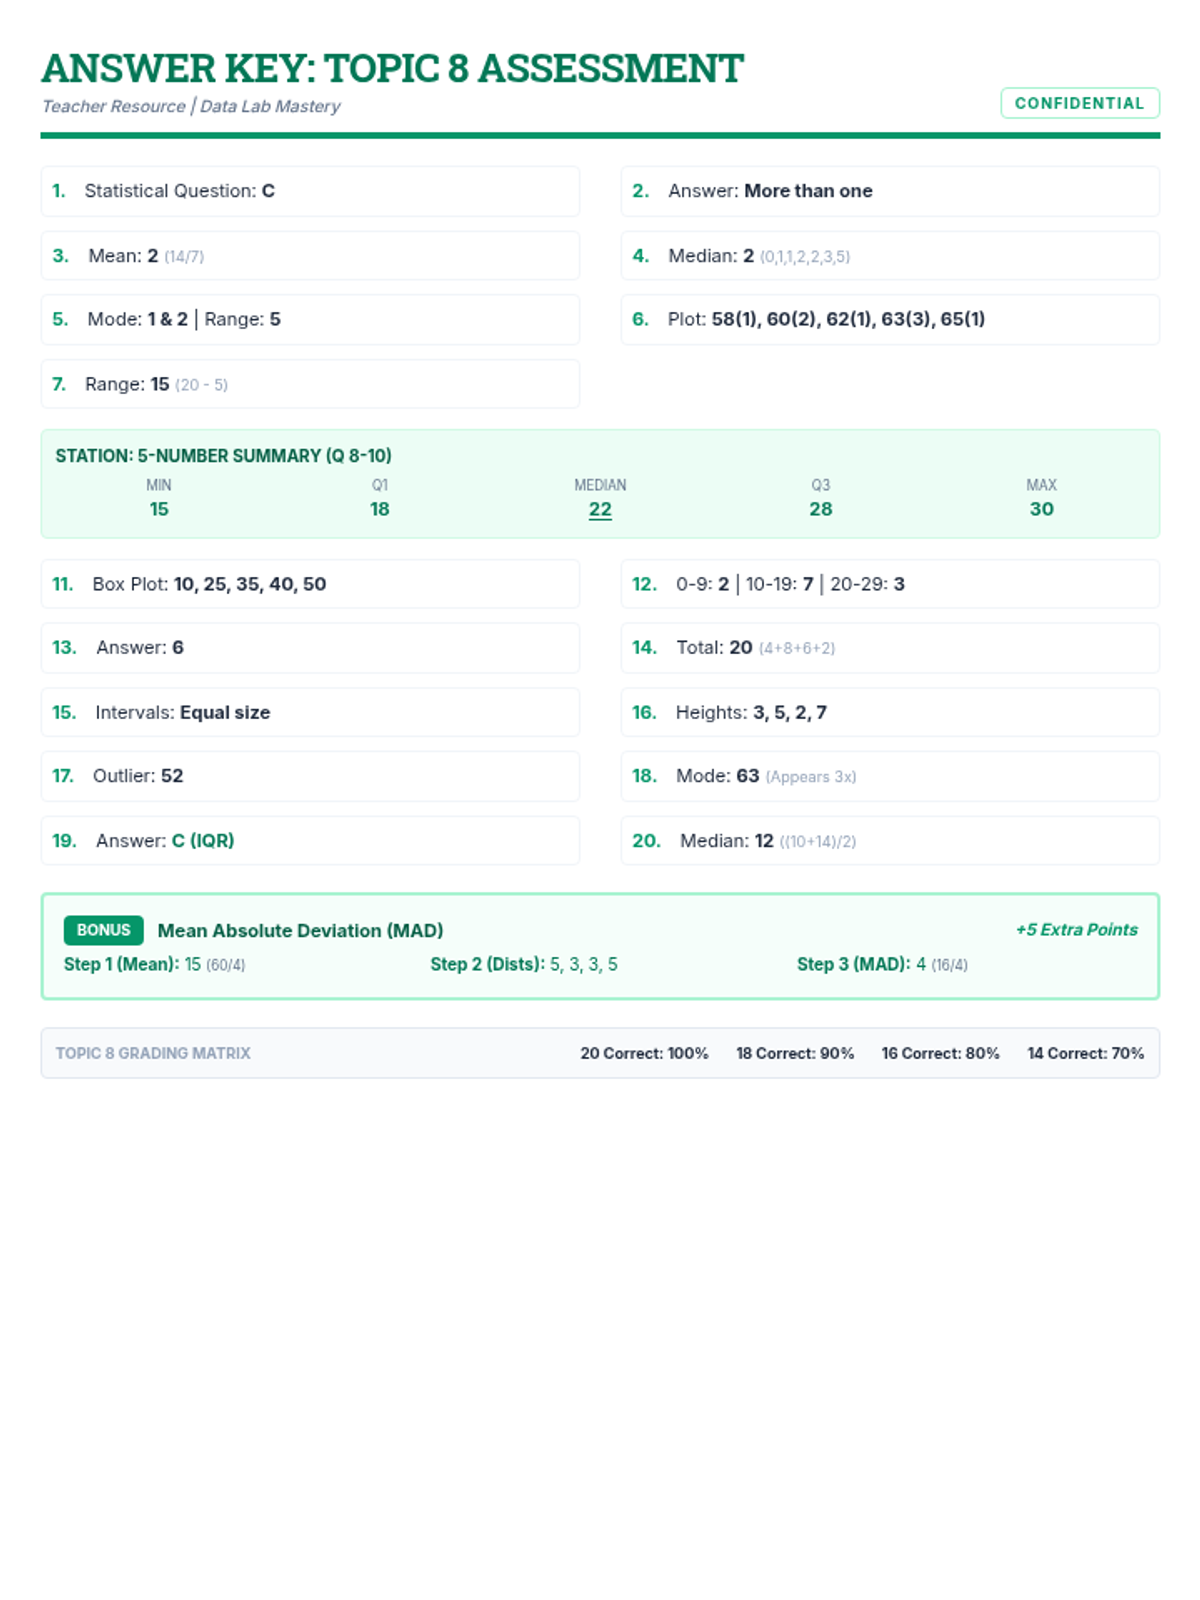
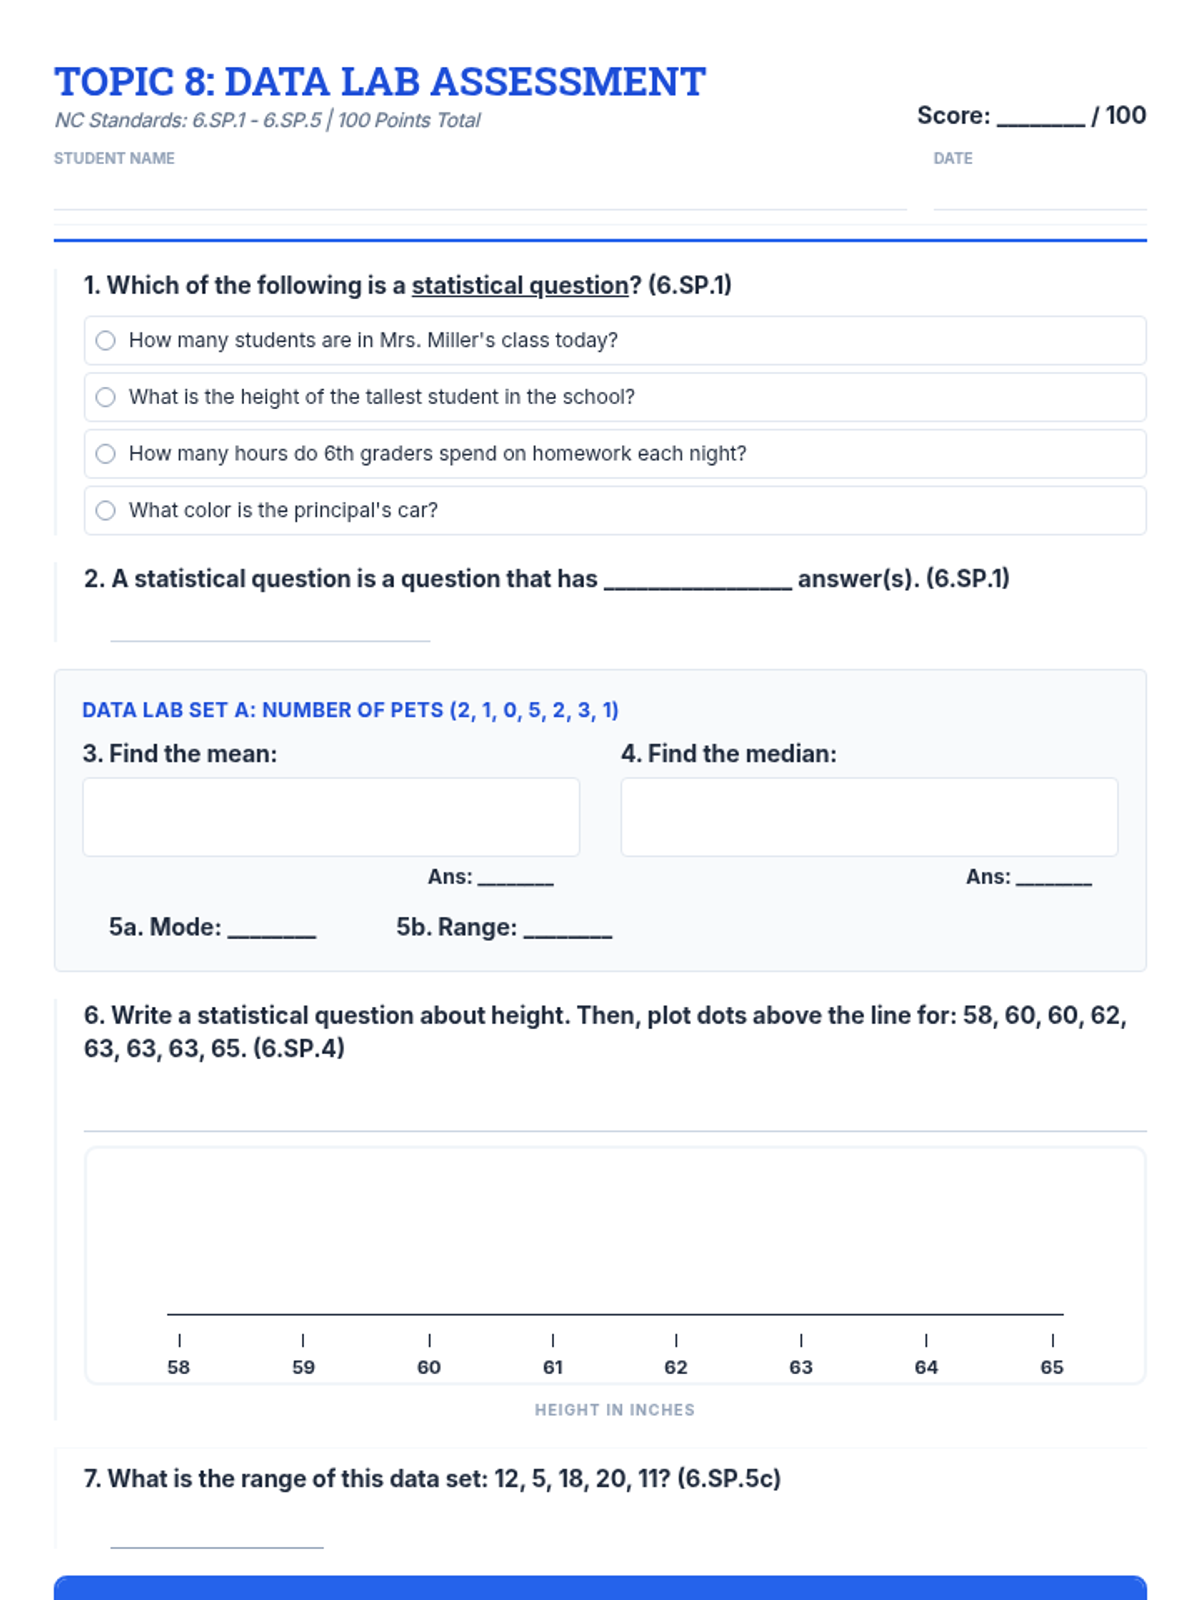
A comprehensive assessment covering 6th-grade statistics standards, including data display, measures of center and spread, and data interpretation. Students will create and analyze dot plots, histograms, and box plots while identifying statistical questions and describing distributions.
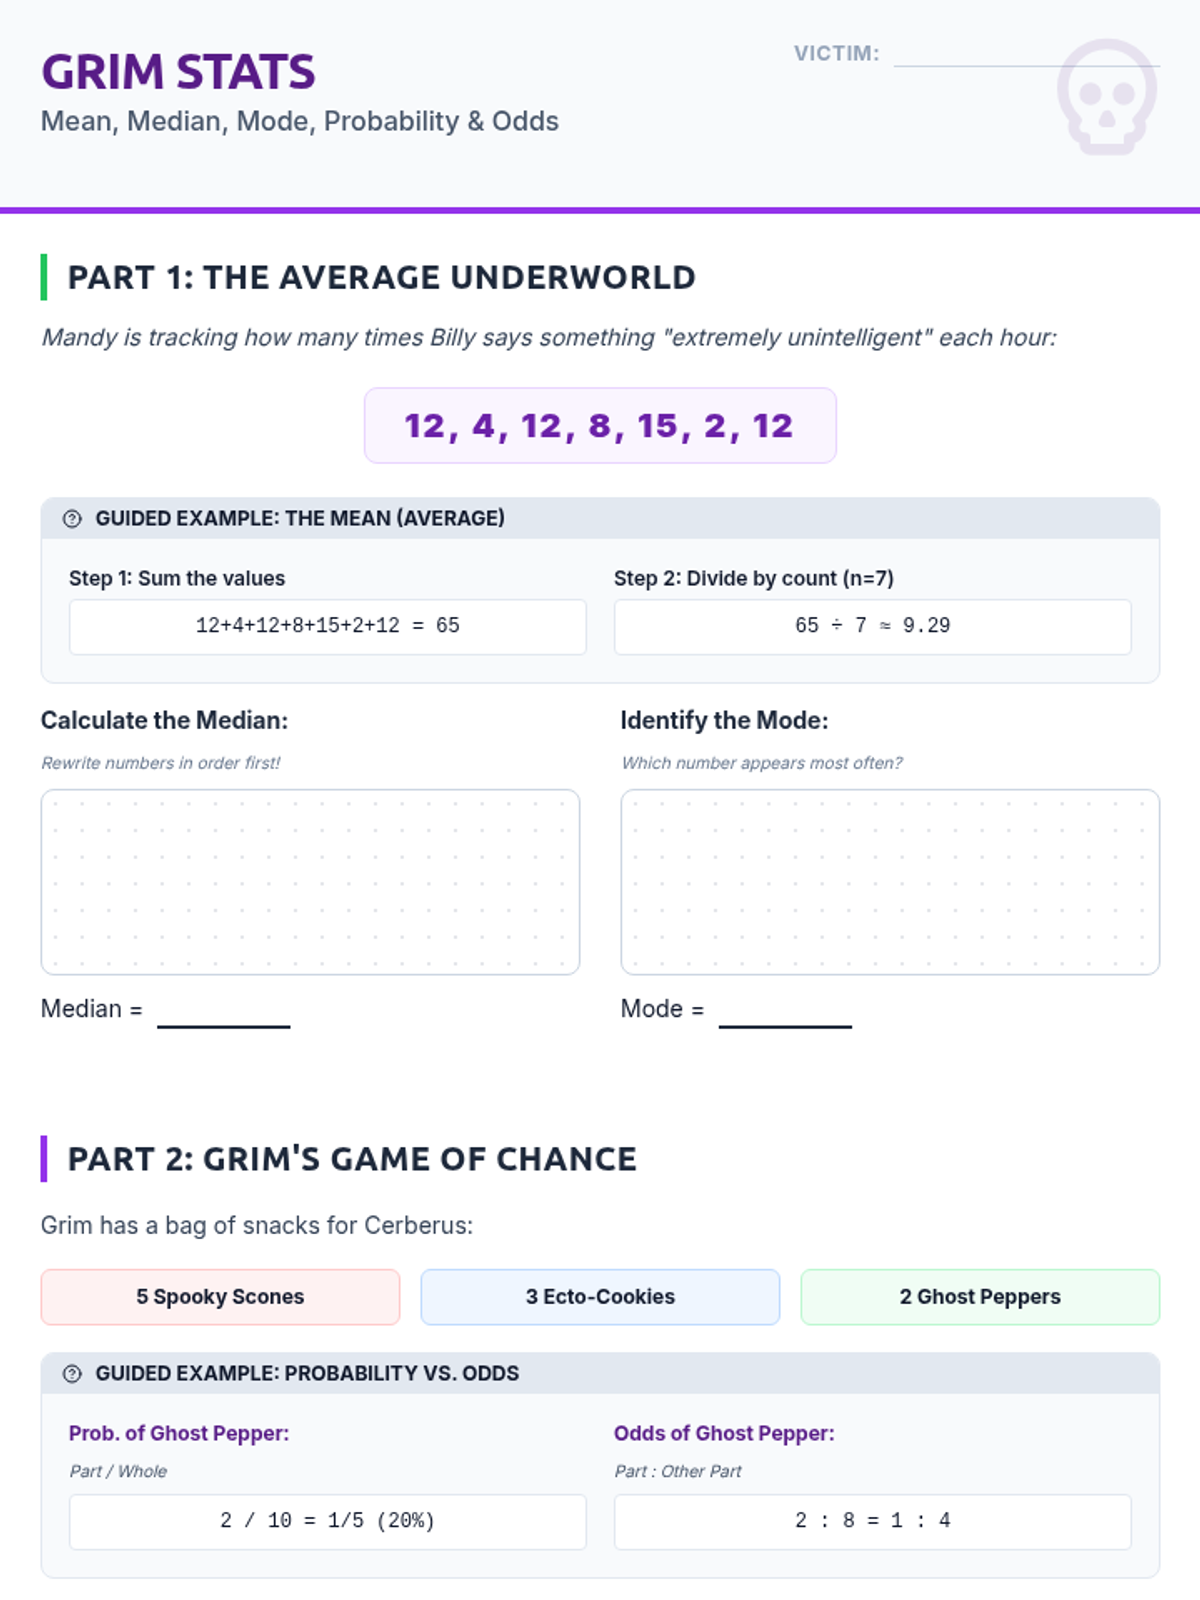
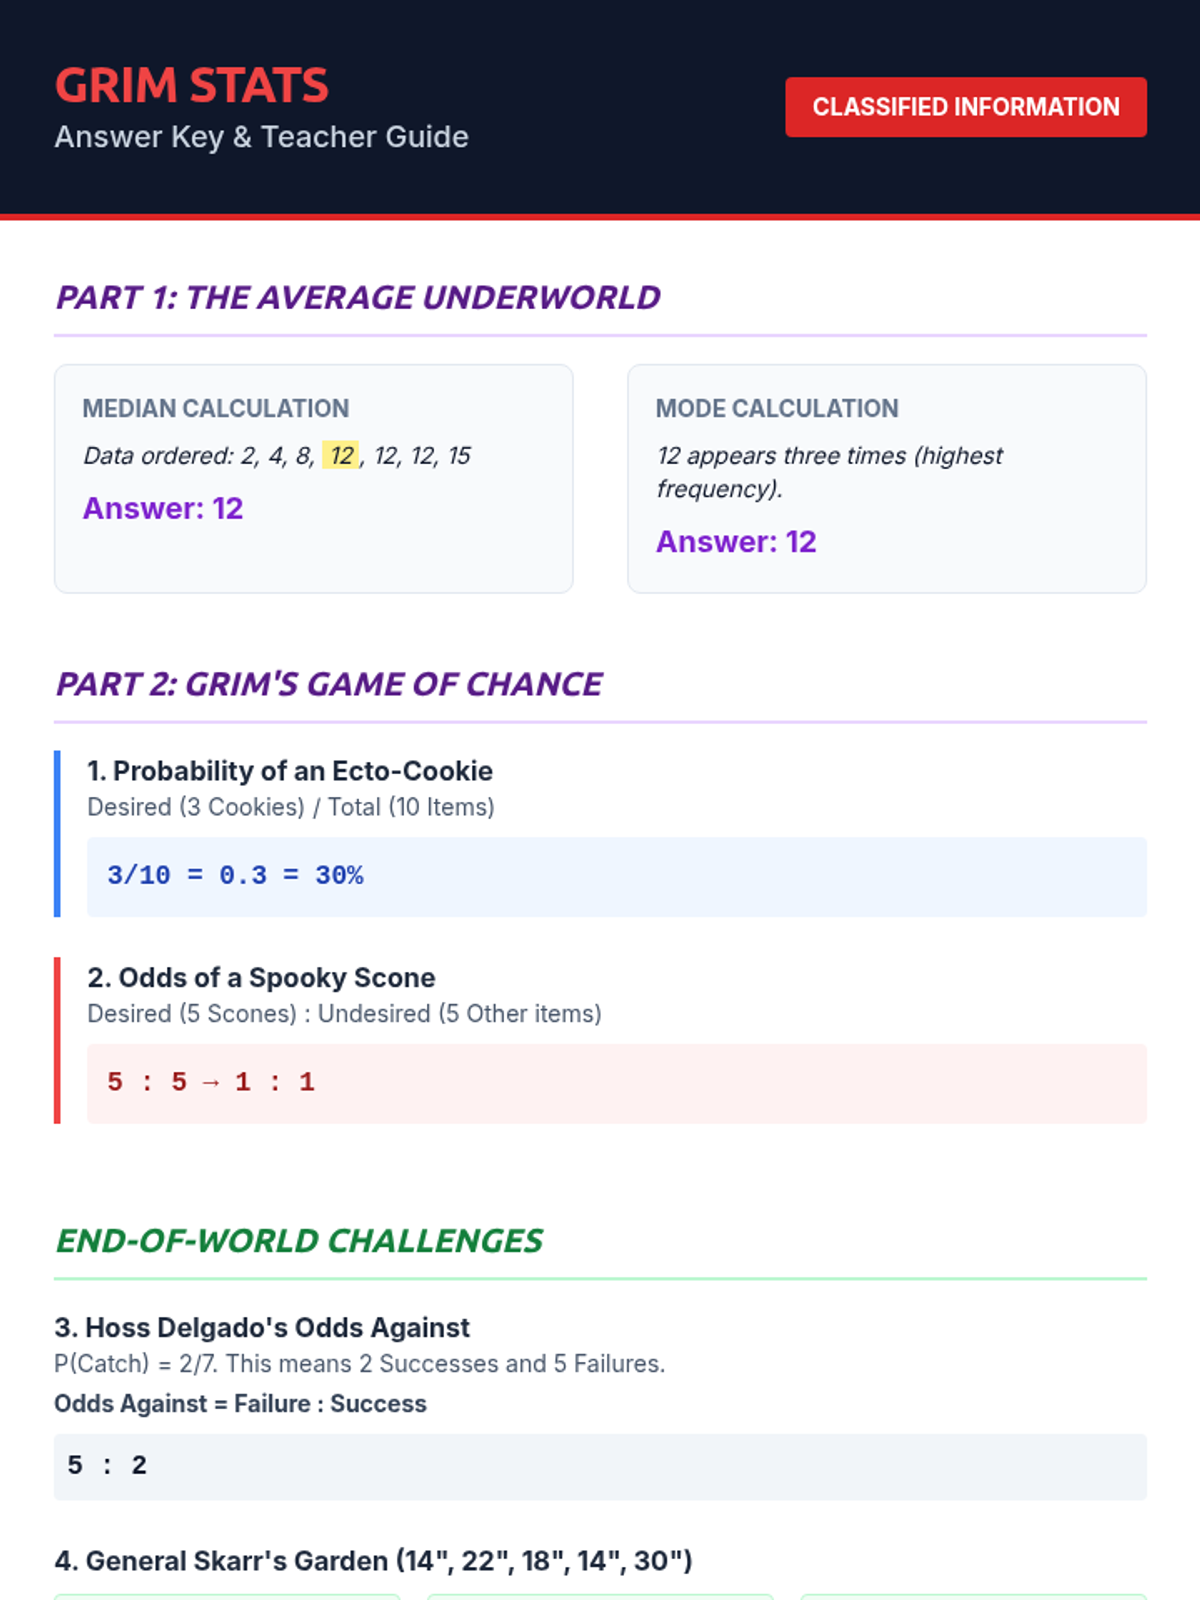
A high school statistics lesson covering mean, median, mode, probability, and odds, featuring characters and scenarios from The Grim Adventures of Billy & Mandy.
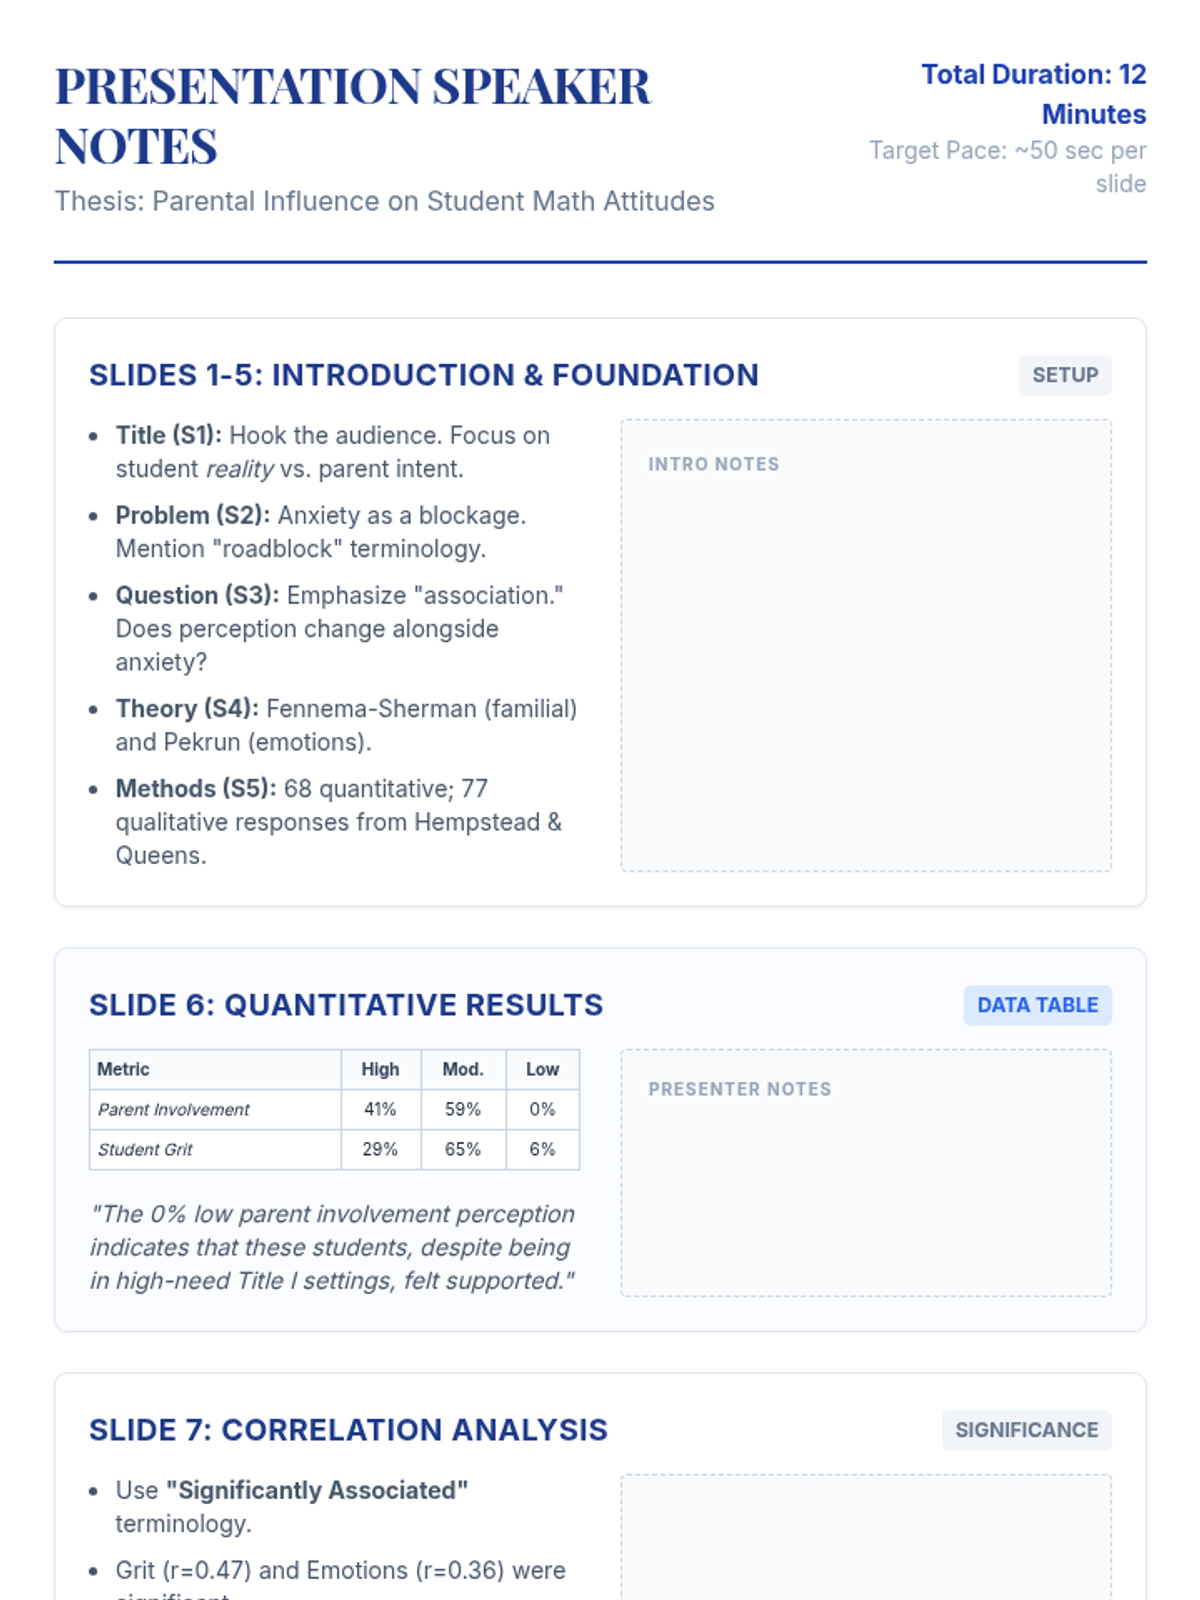
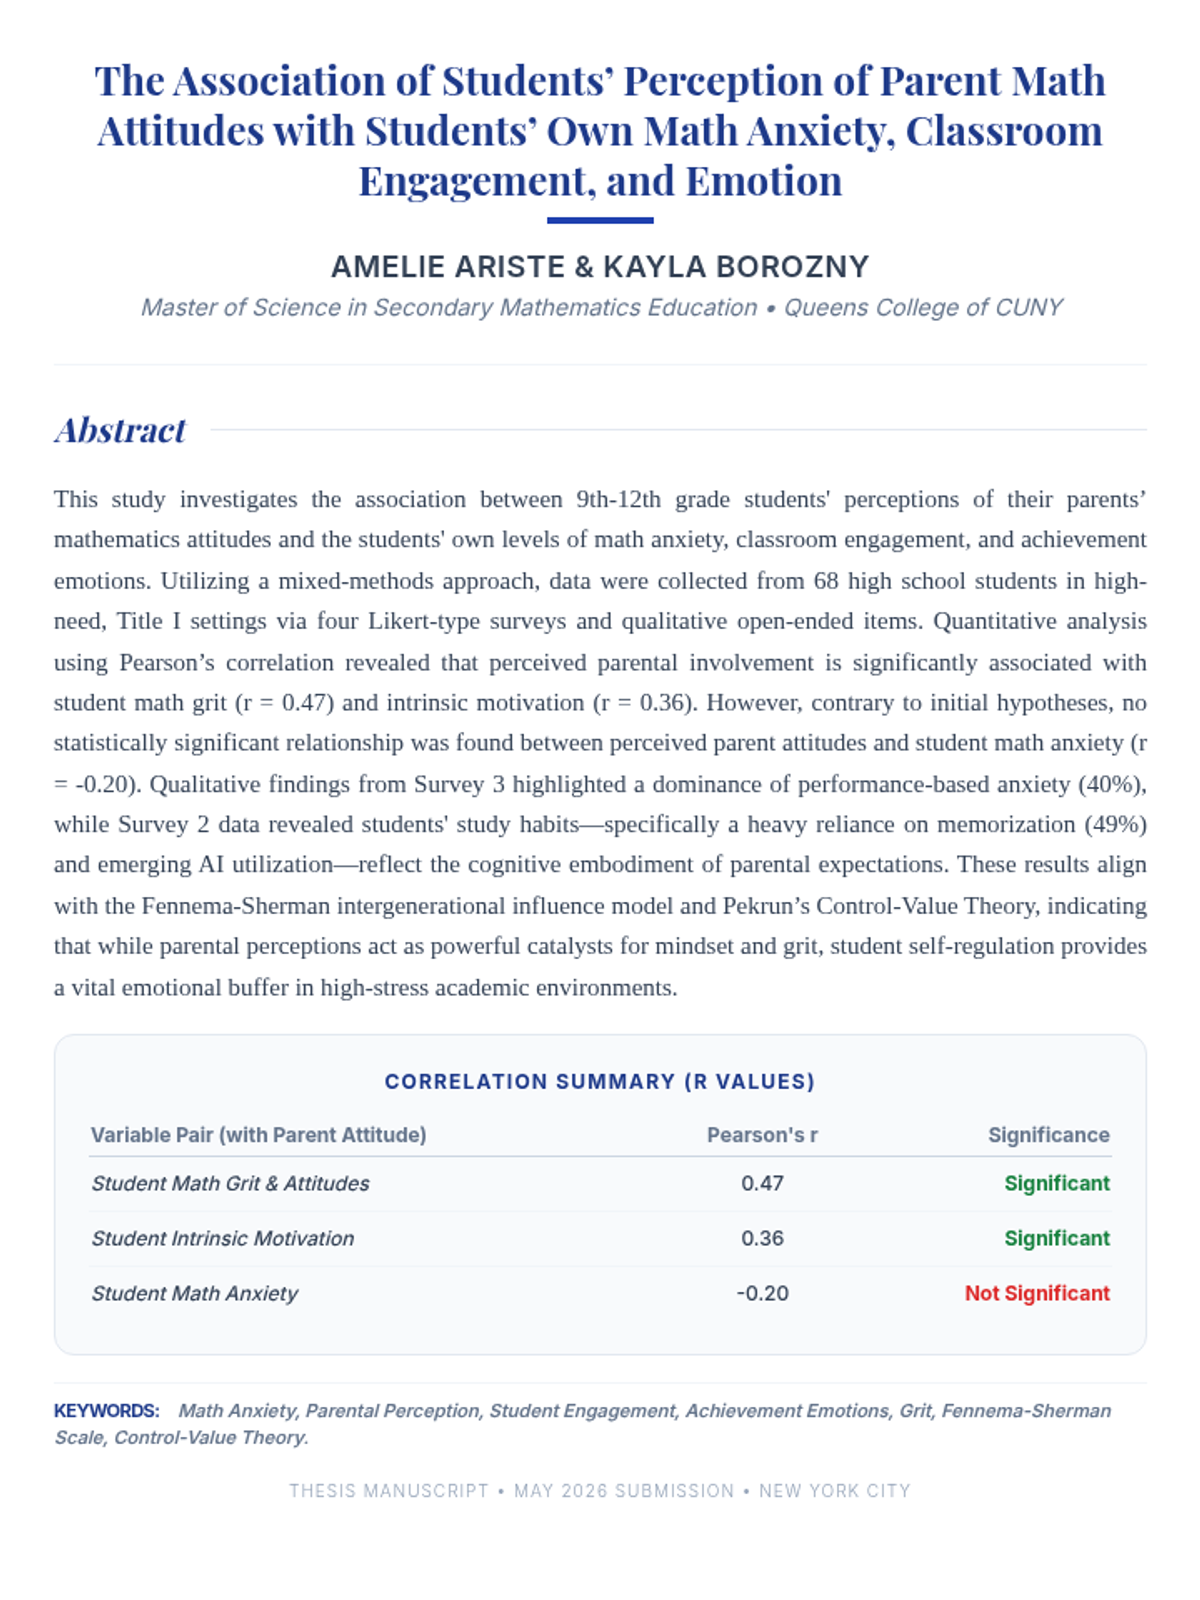
A comprehensive 12-minute presentation and speaker notes based on research investigating the link between parental attitudes and student math outcomes.
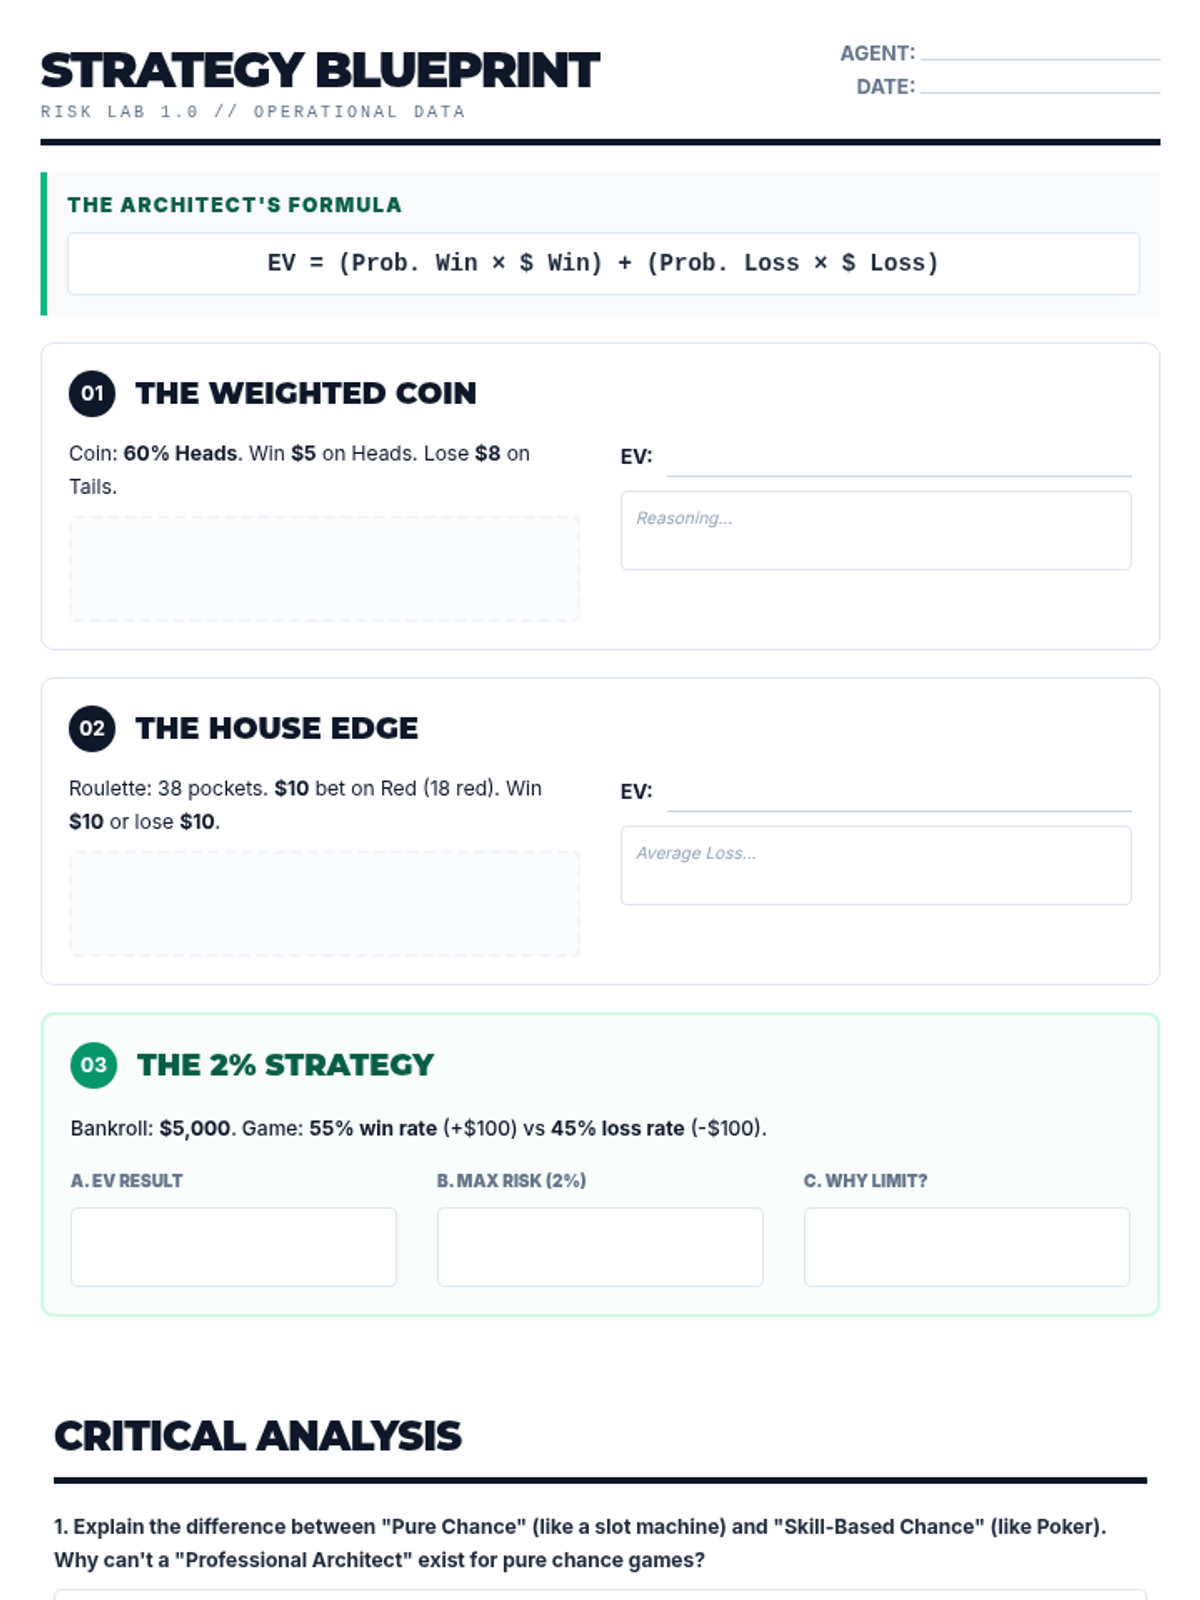
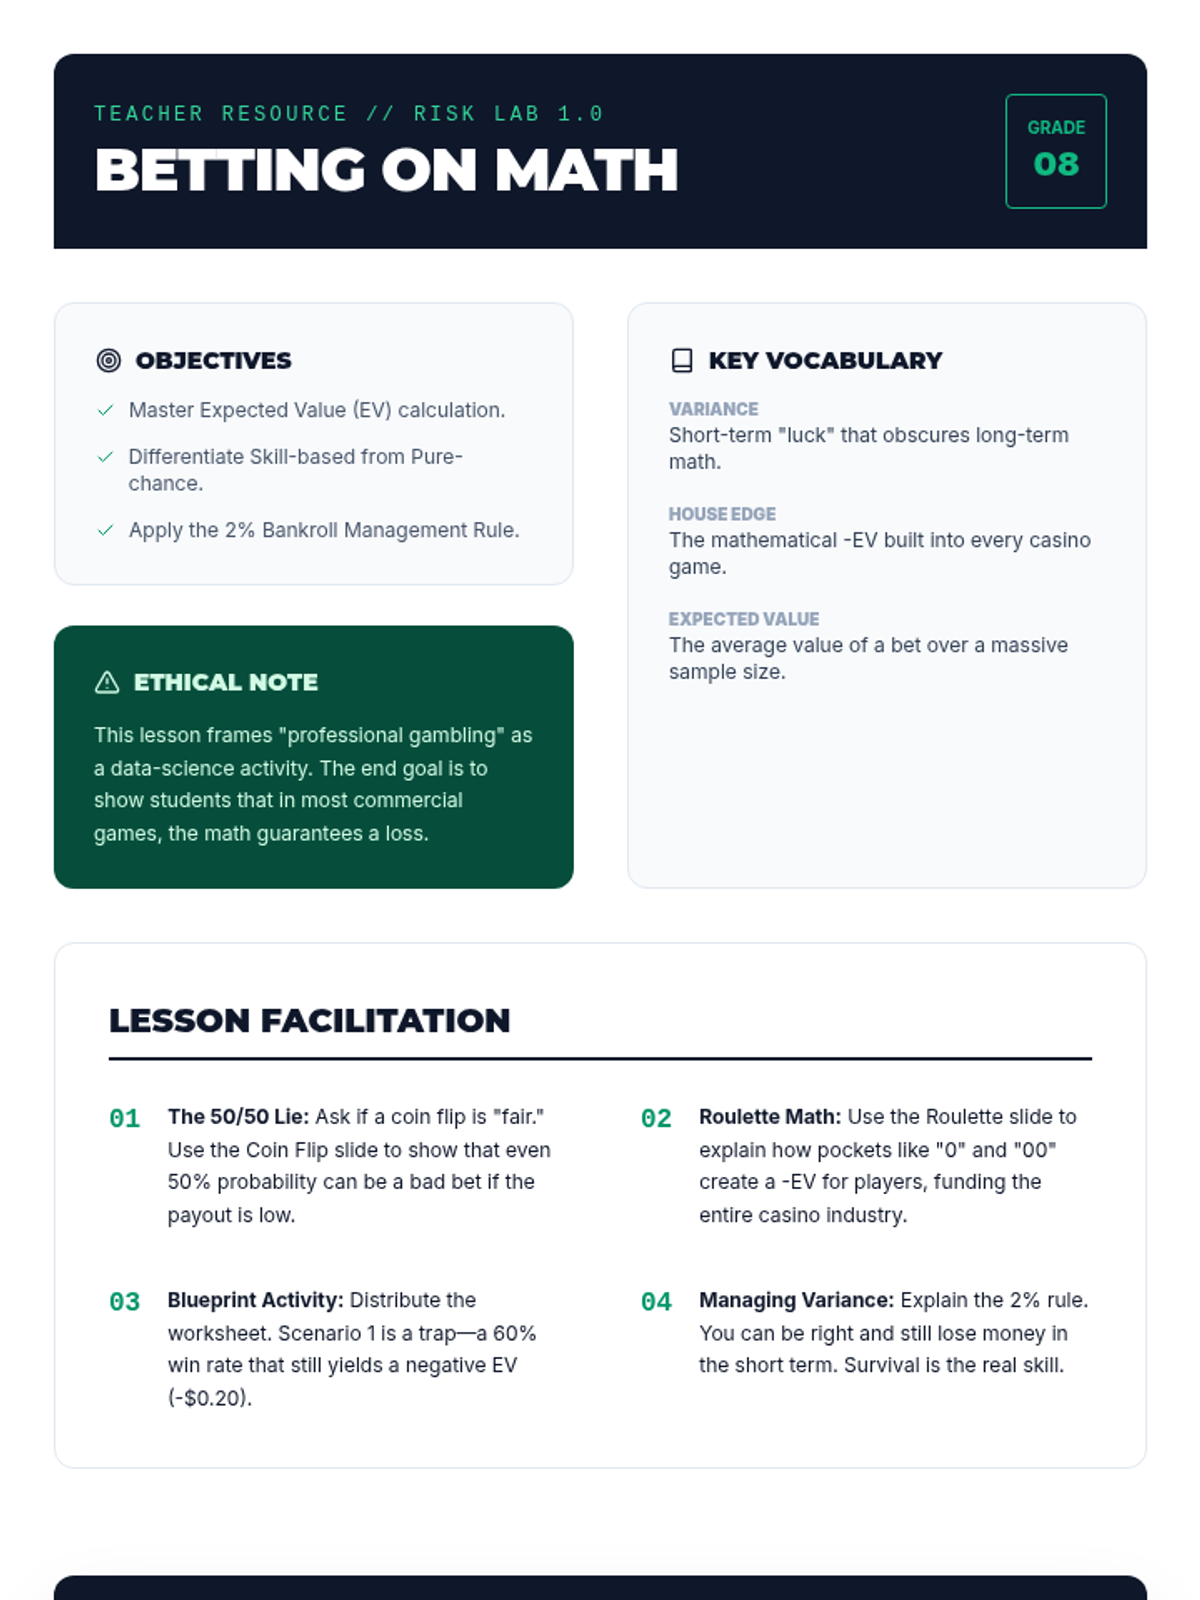
Students explore the concept of expected value and house edge to understand why certain strategies succeed while others are designed to fail.
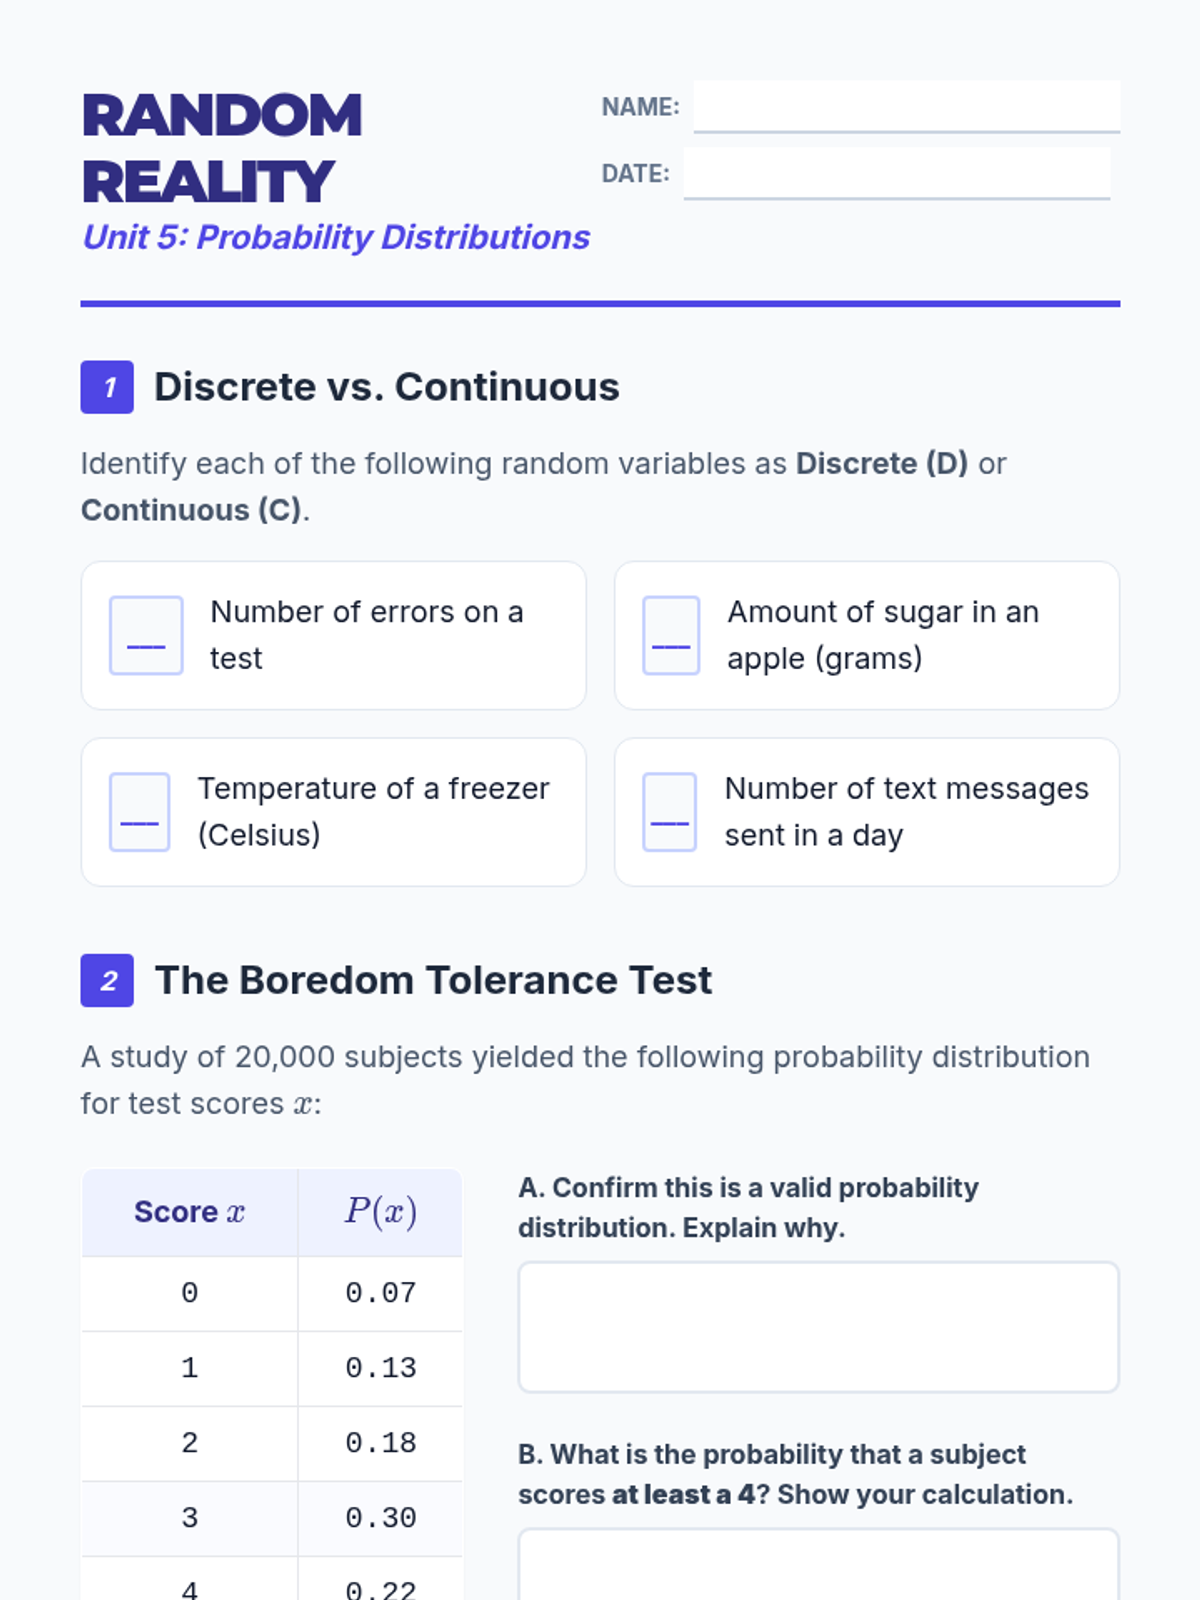
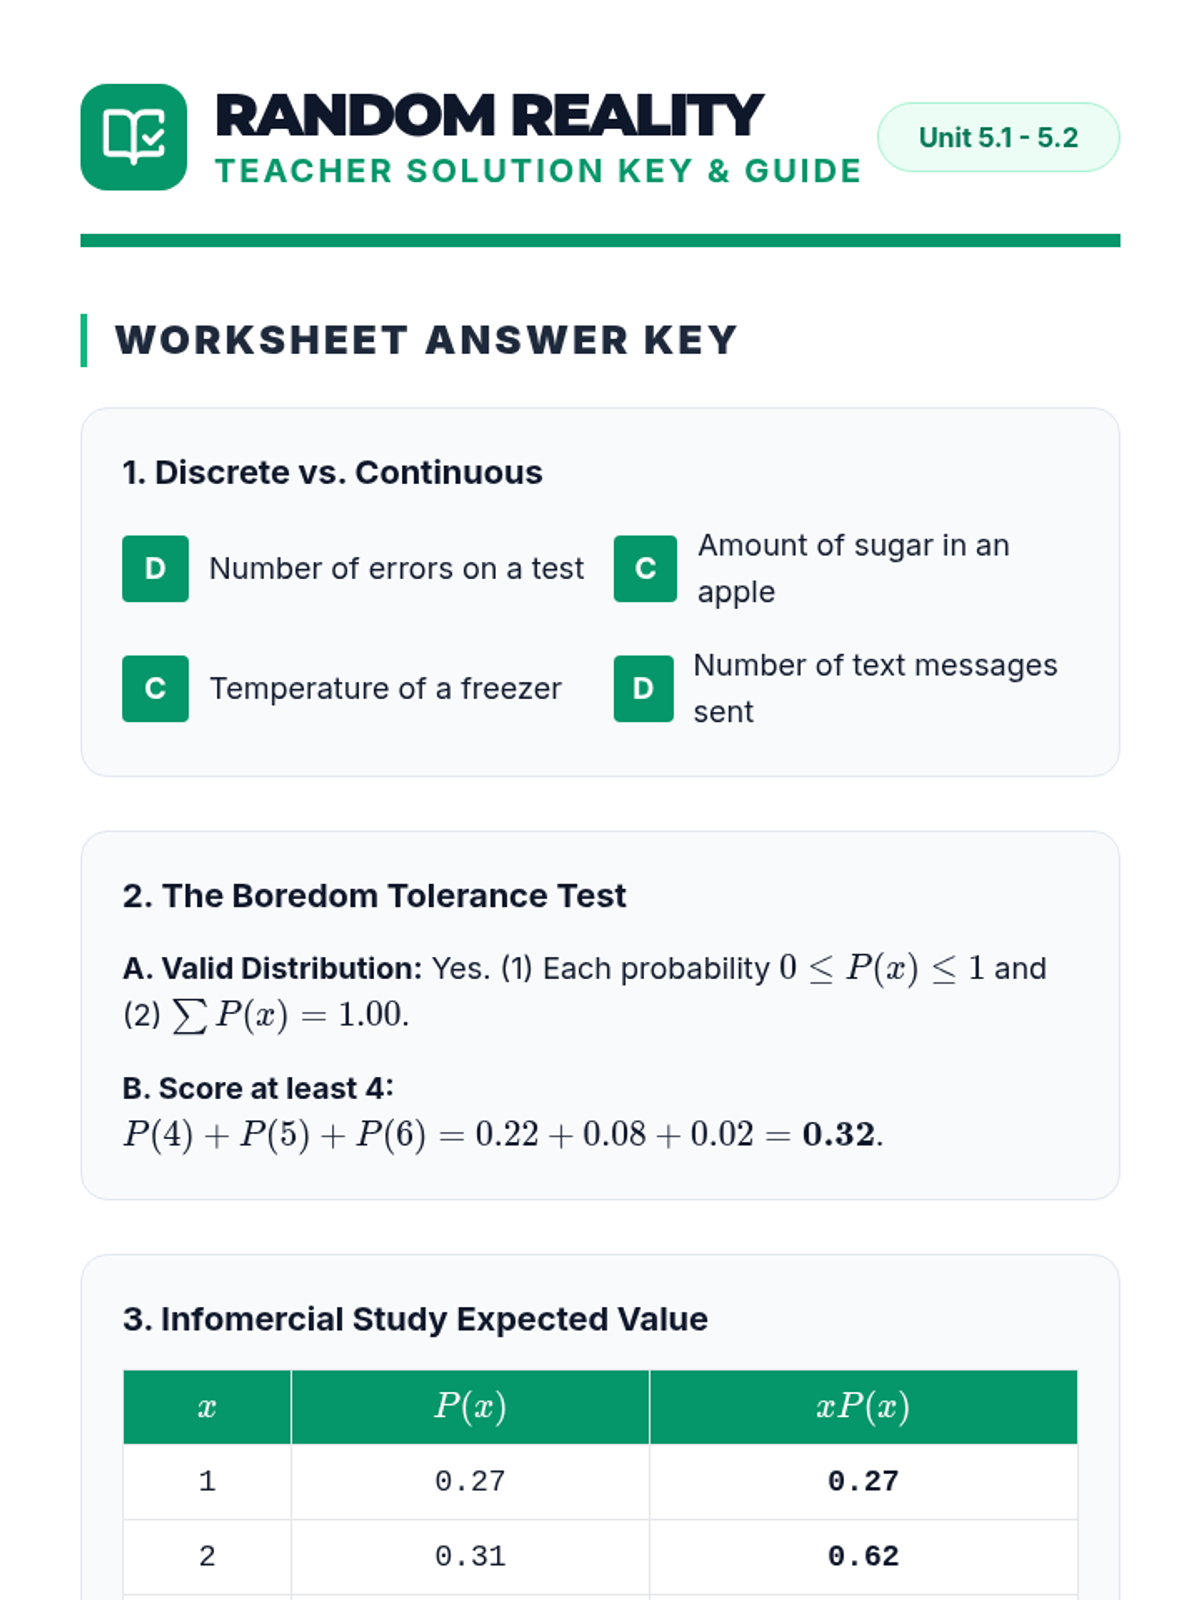
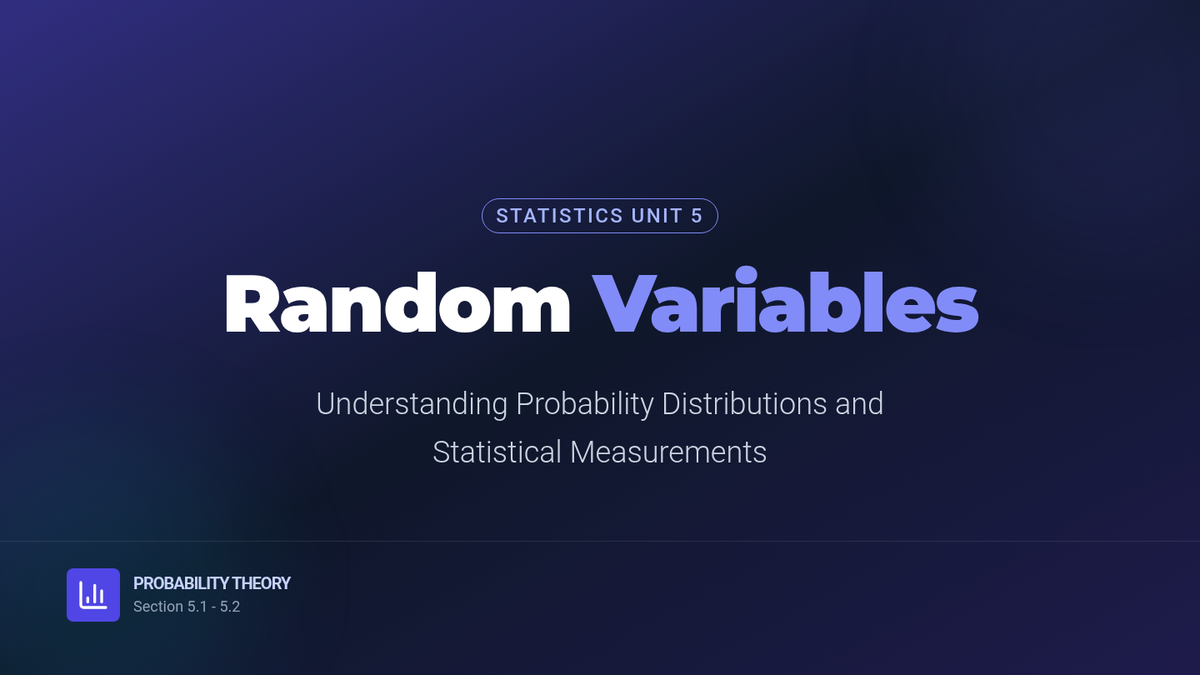
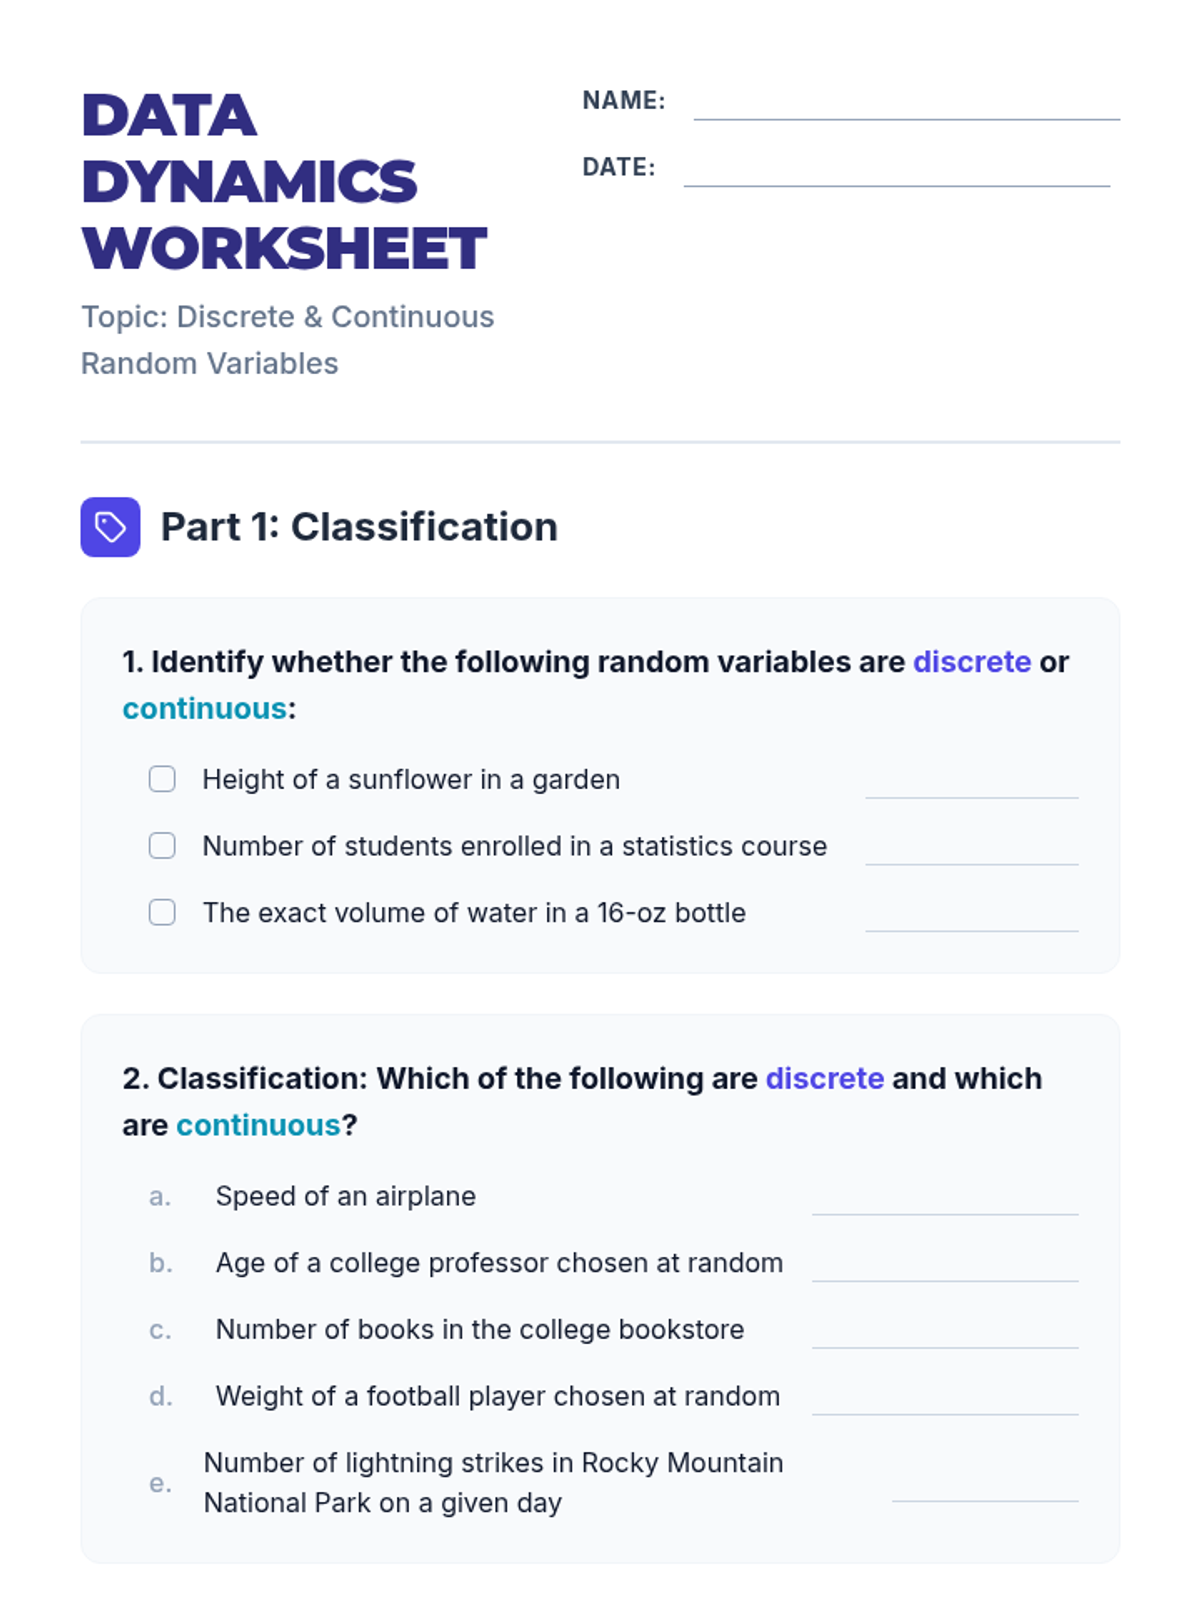
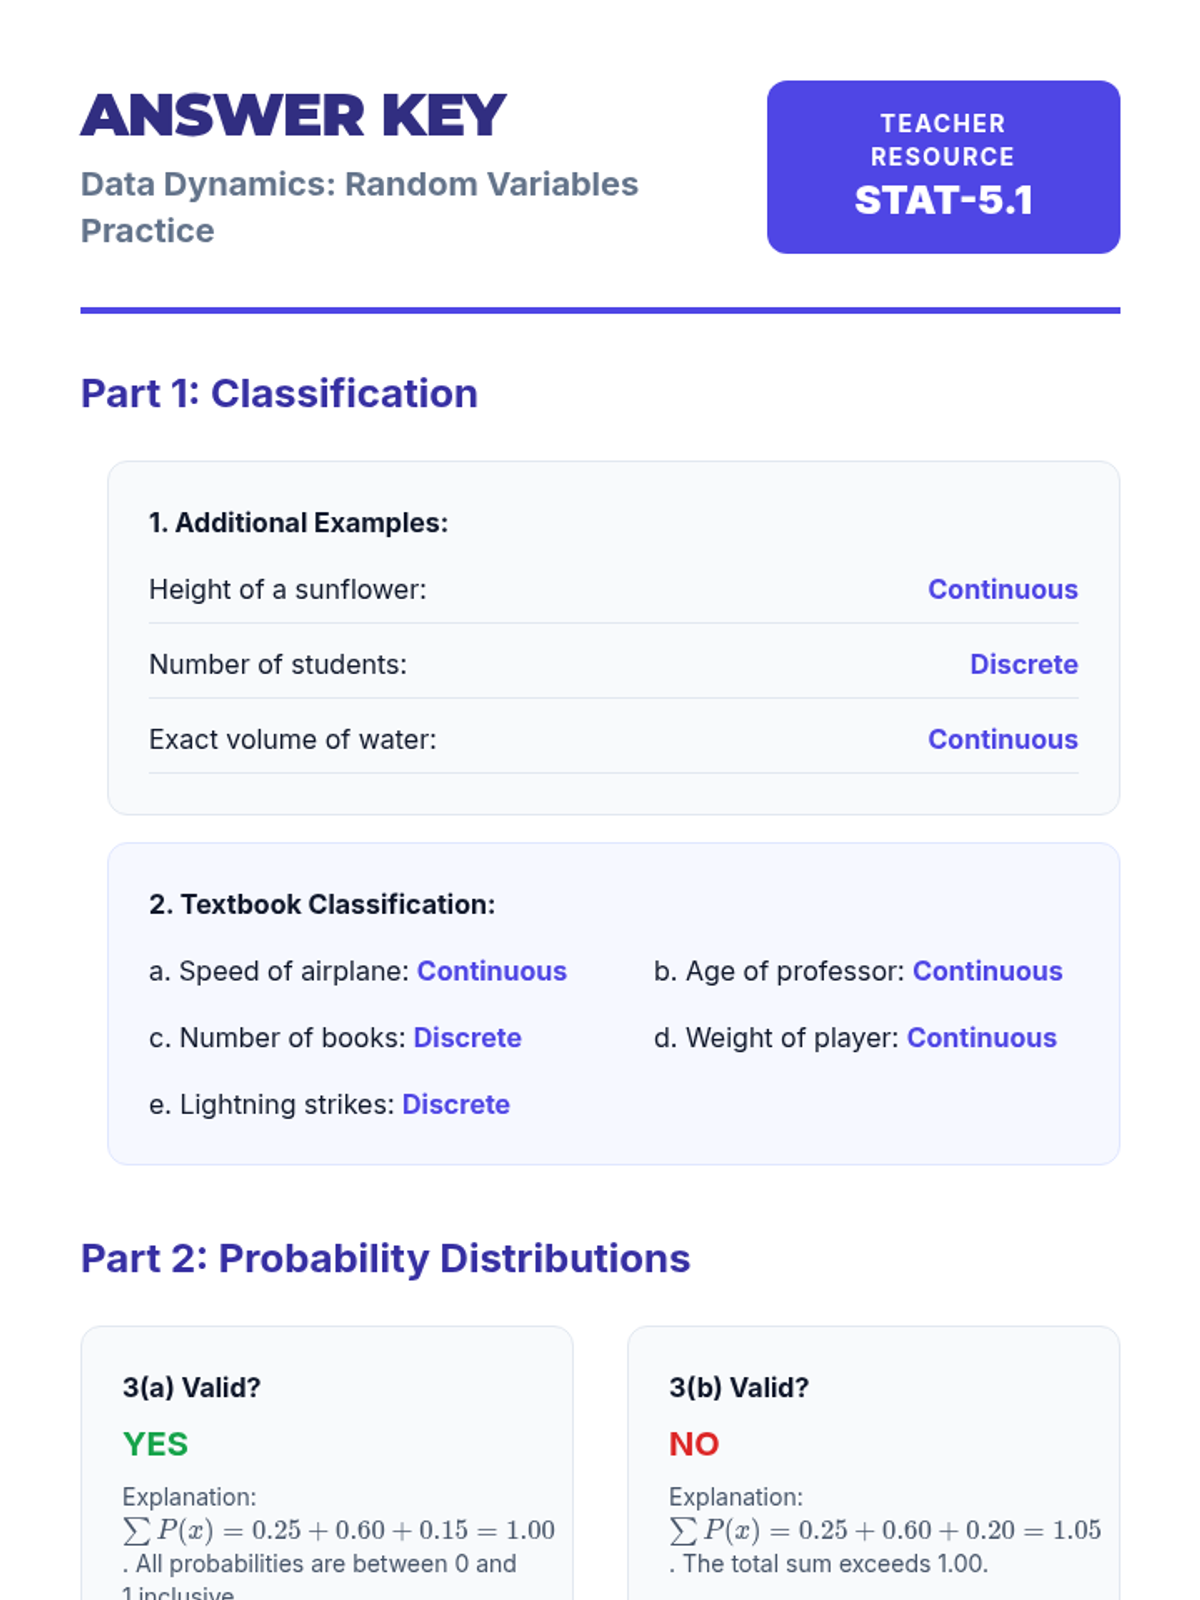
An introductory exploration of random variables, probability distributions, and statistical measurements including mean, standard deviation, and linear transformations.
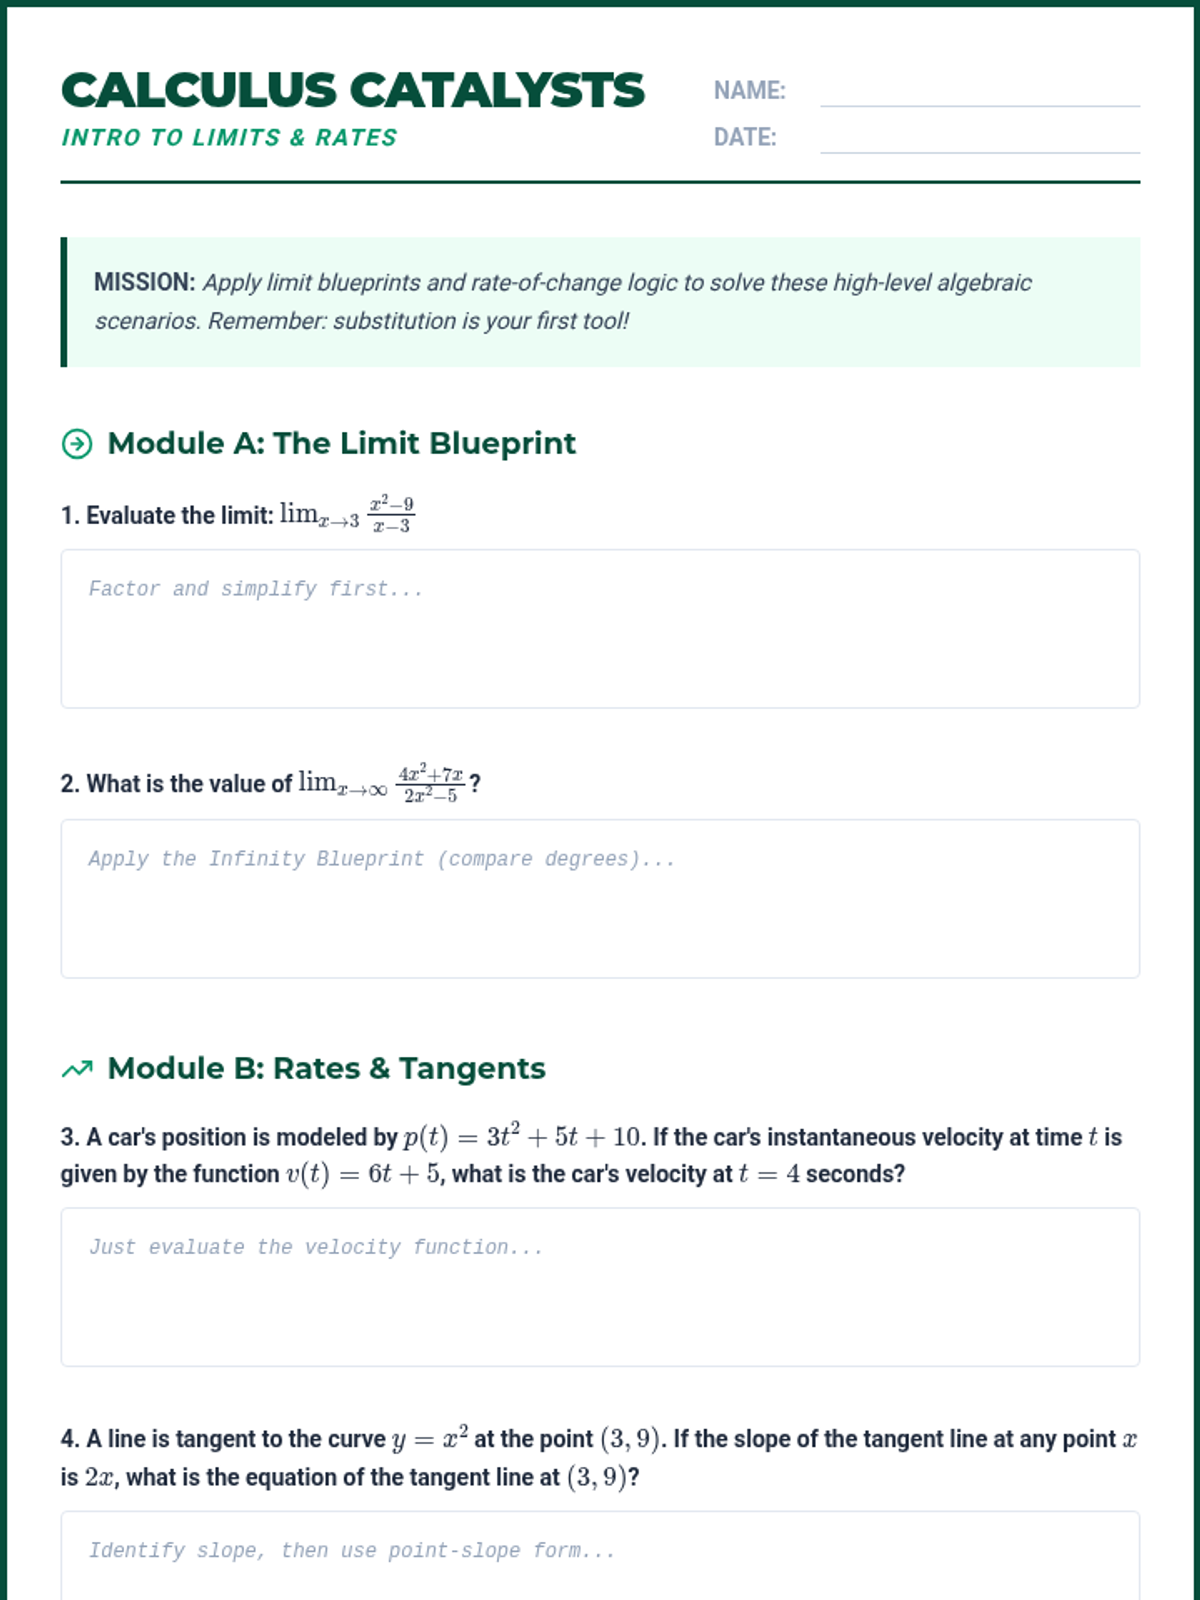
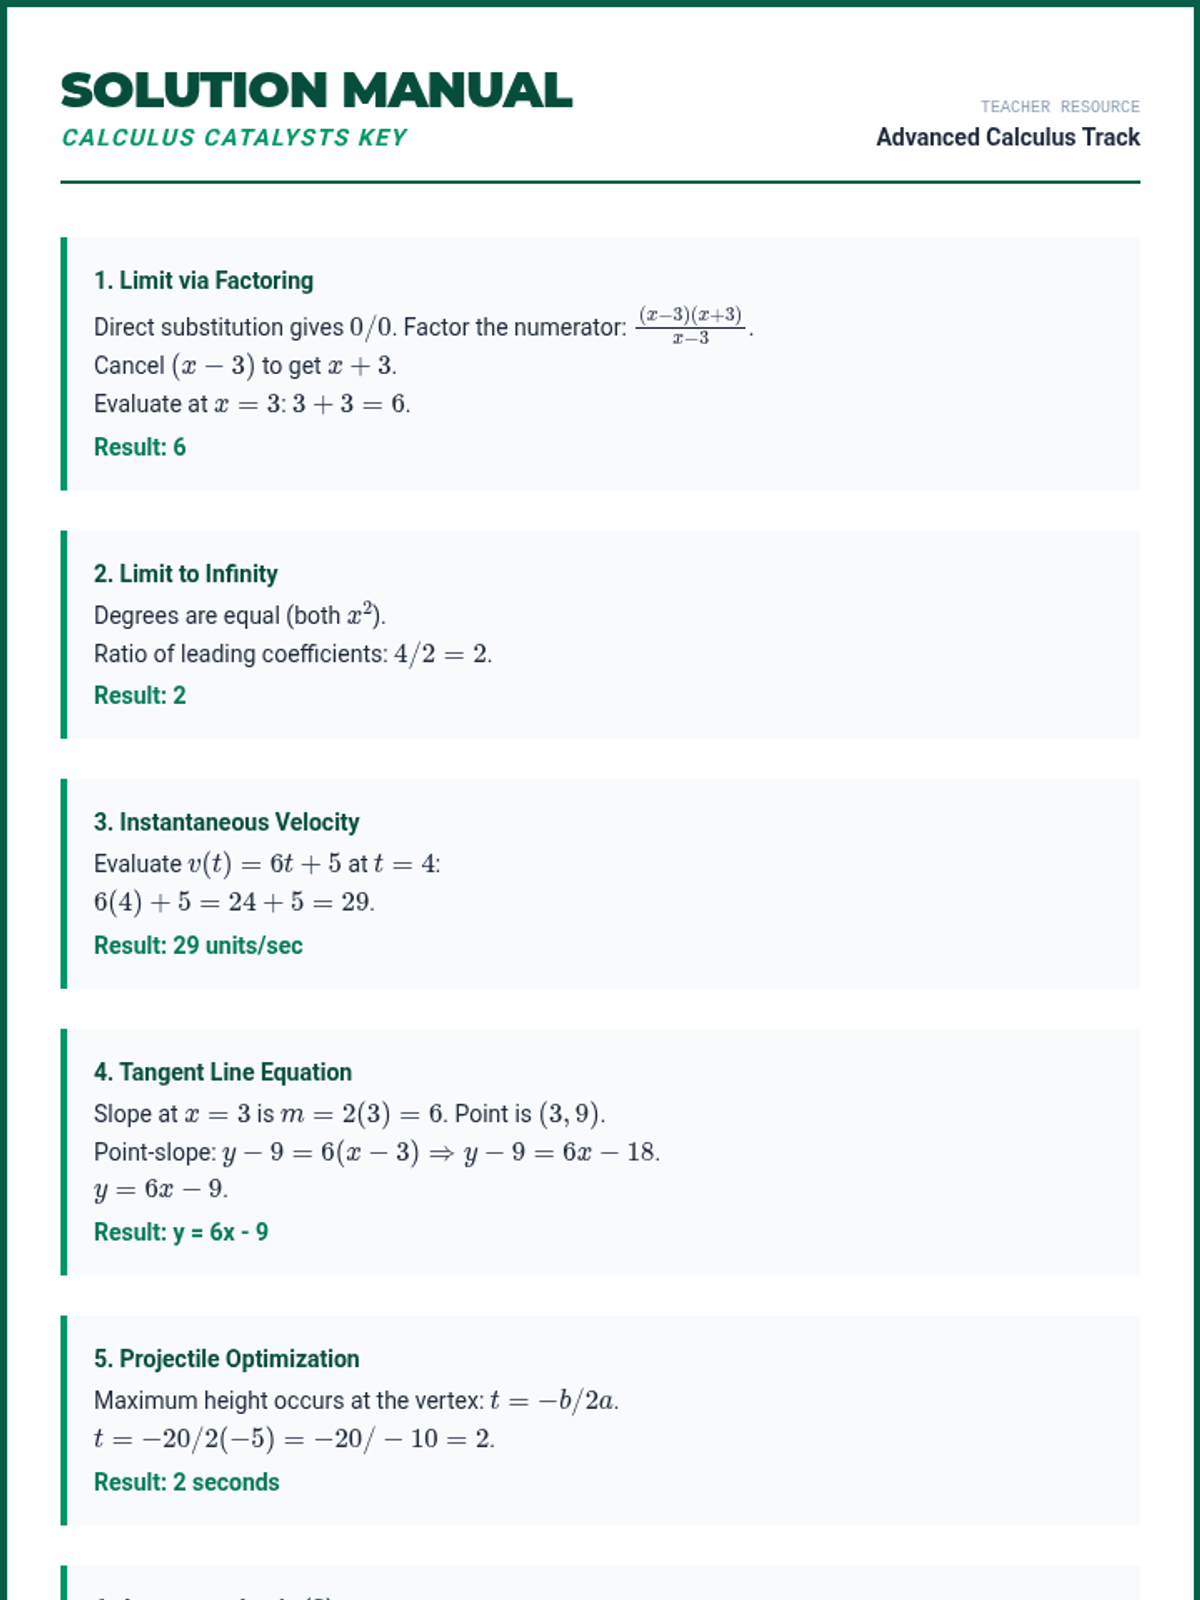
An introductory exploration of calculus-adjacent concepts tested on the ACT, focusing on limits, instantaneous rates of change, and function optimization. Students will master the Limit Blueprint and apply rate-of-change logic to complex algebraic scenarios.
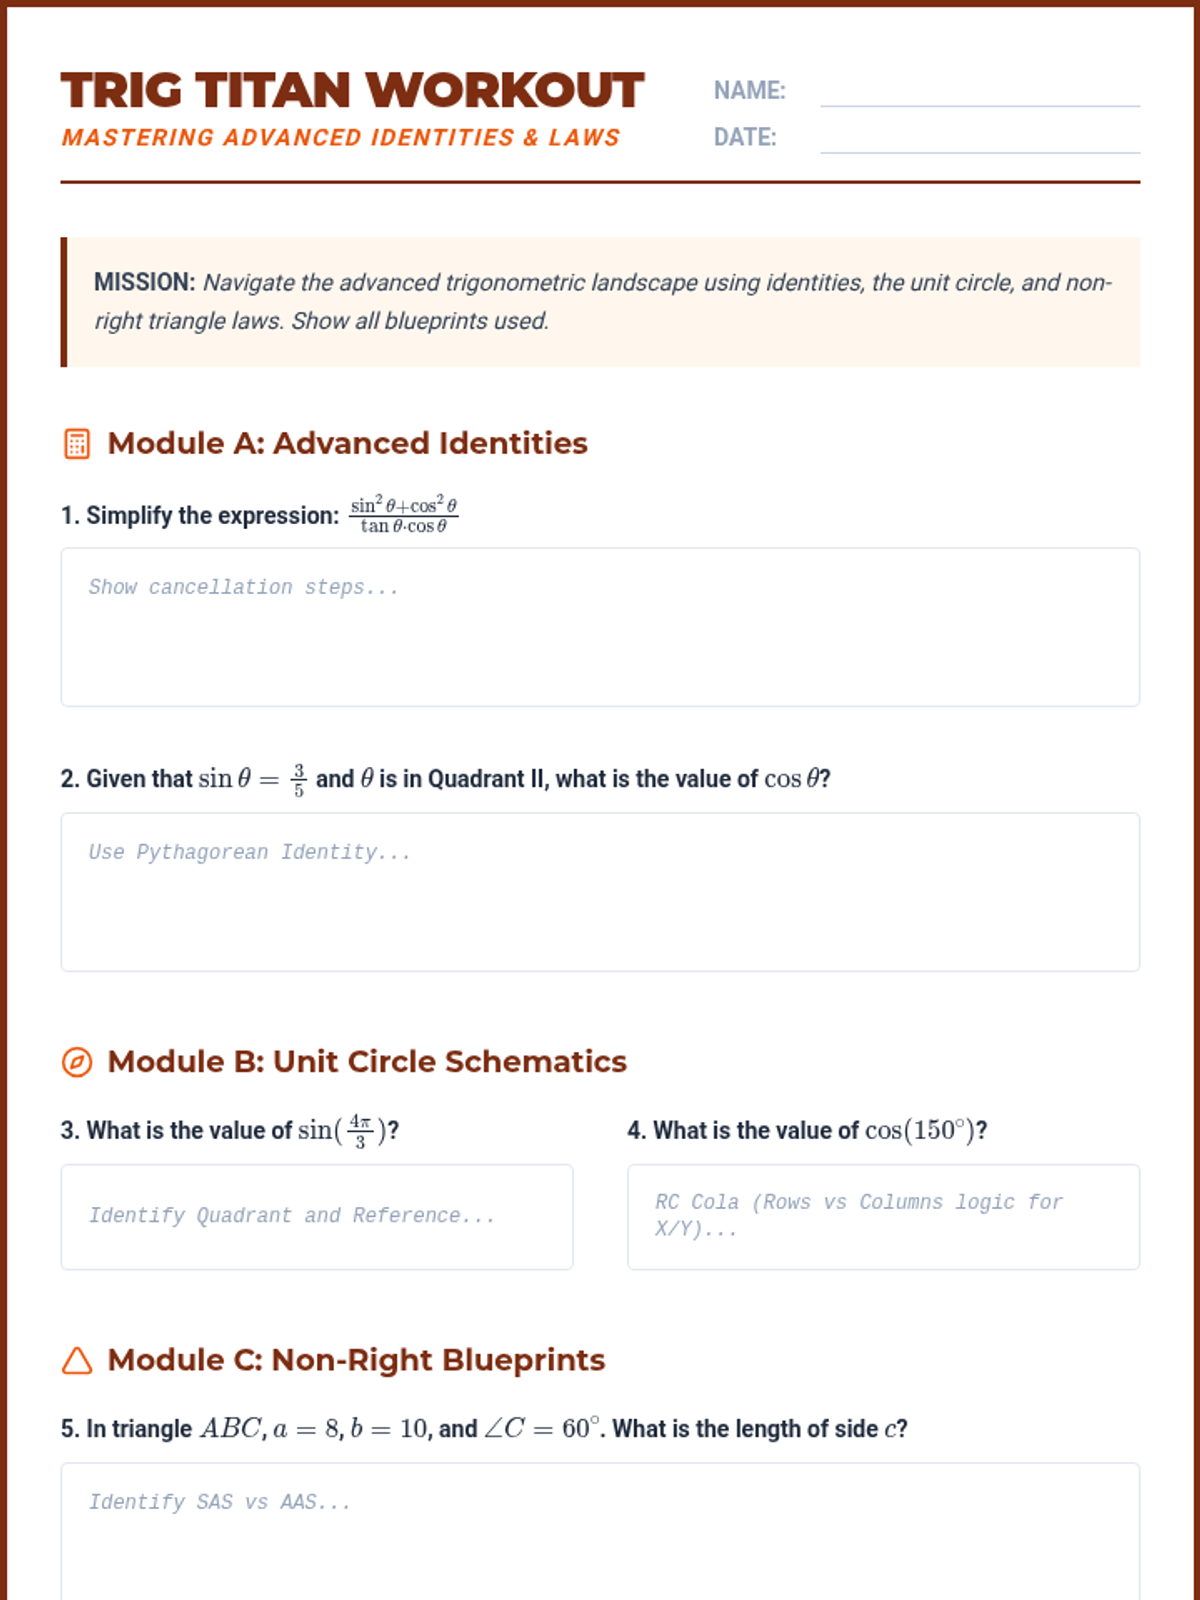
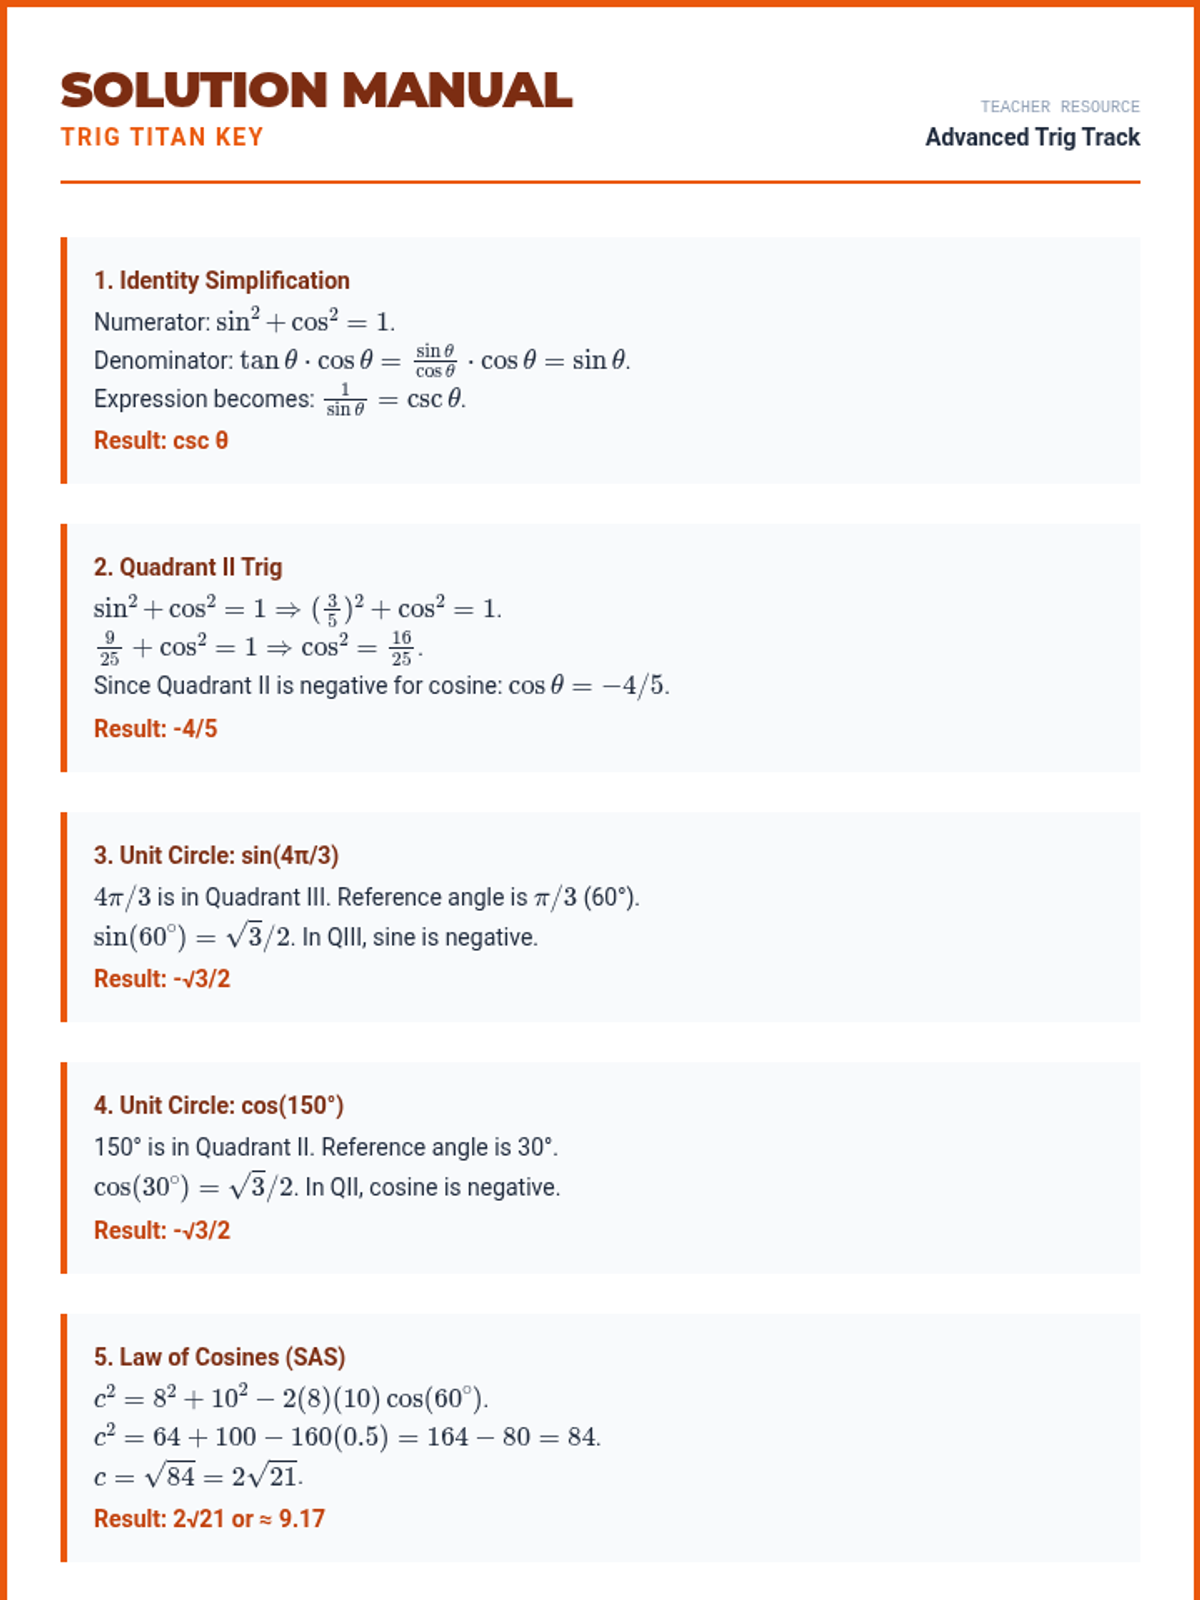
An intensive masterclass on advanced trigonometric identities, the unit circle, and non-right triangle laws. Students will master the Pythagorean identities, Law of Sines/Cosines, and the specific ACT-style unit circle coordinates required for top-tier scores.
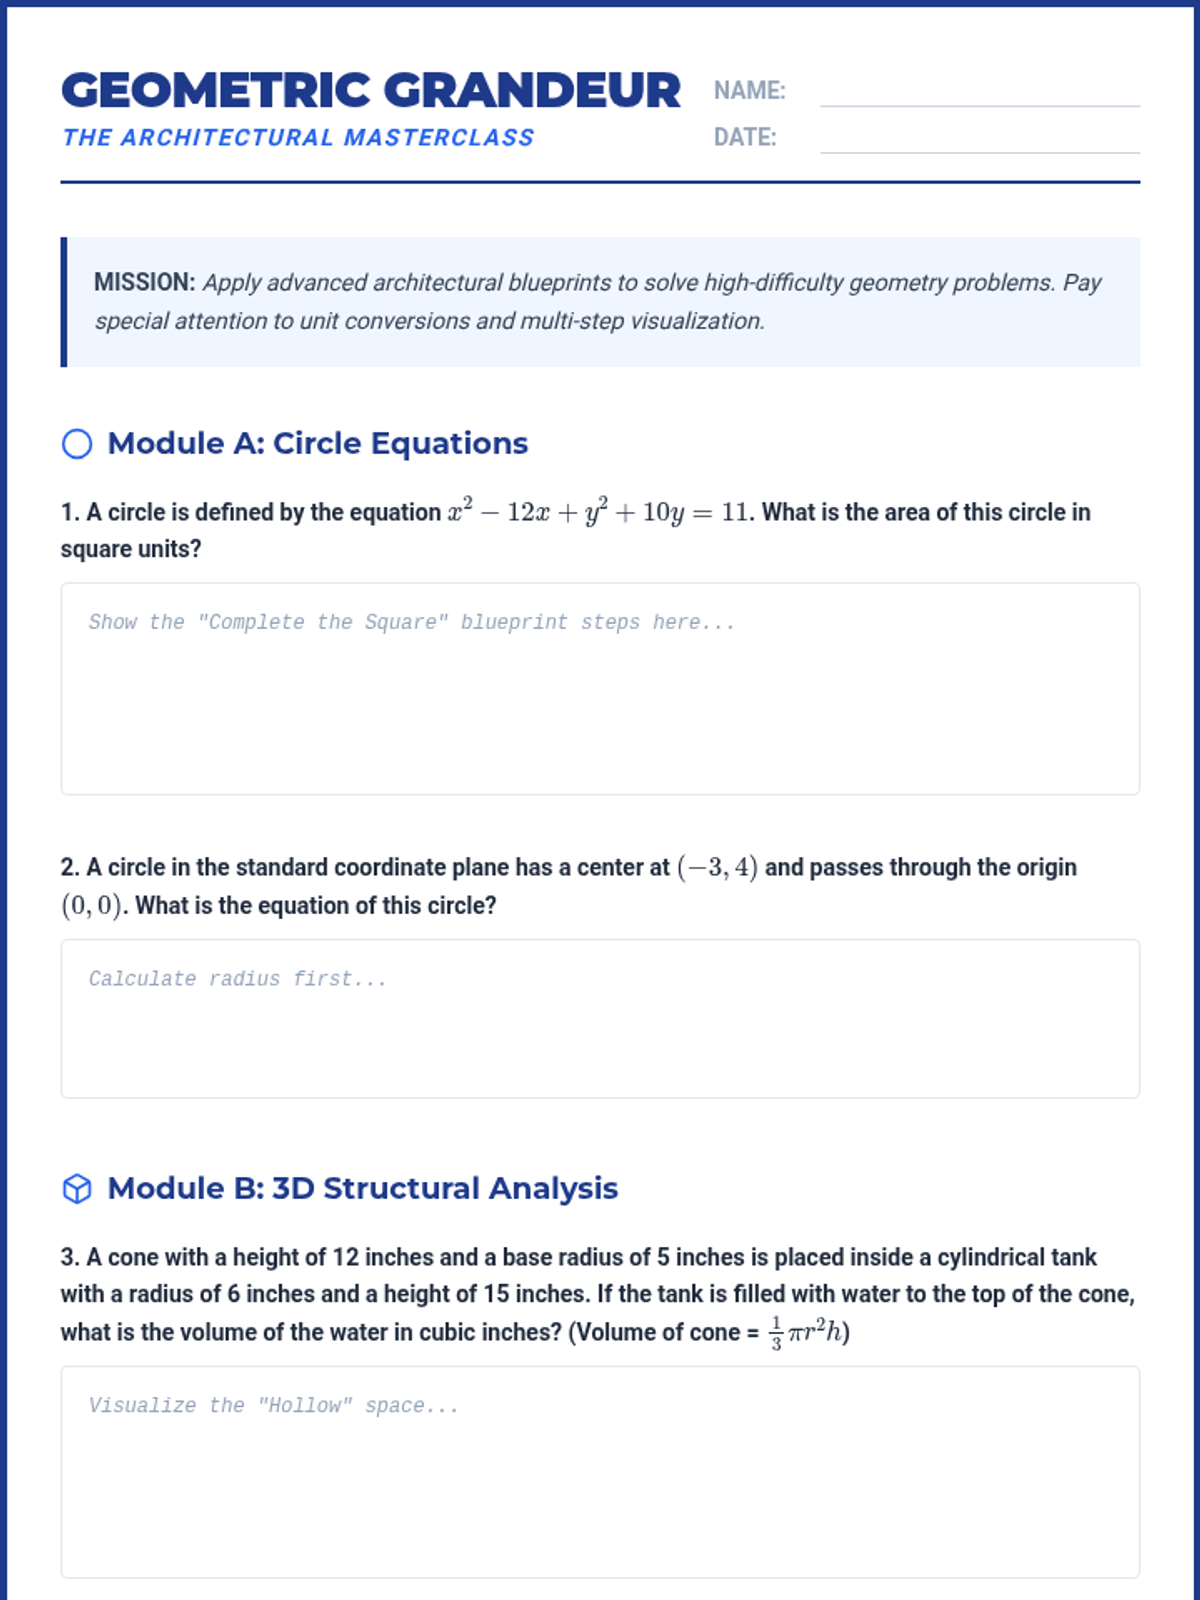
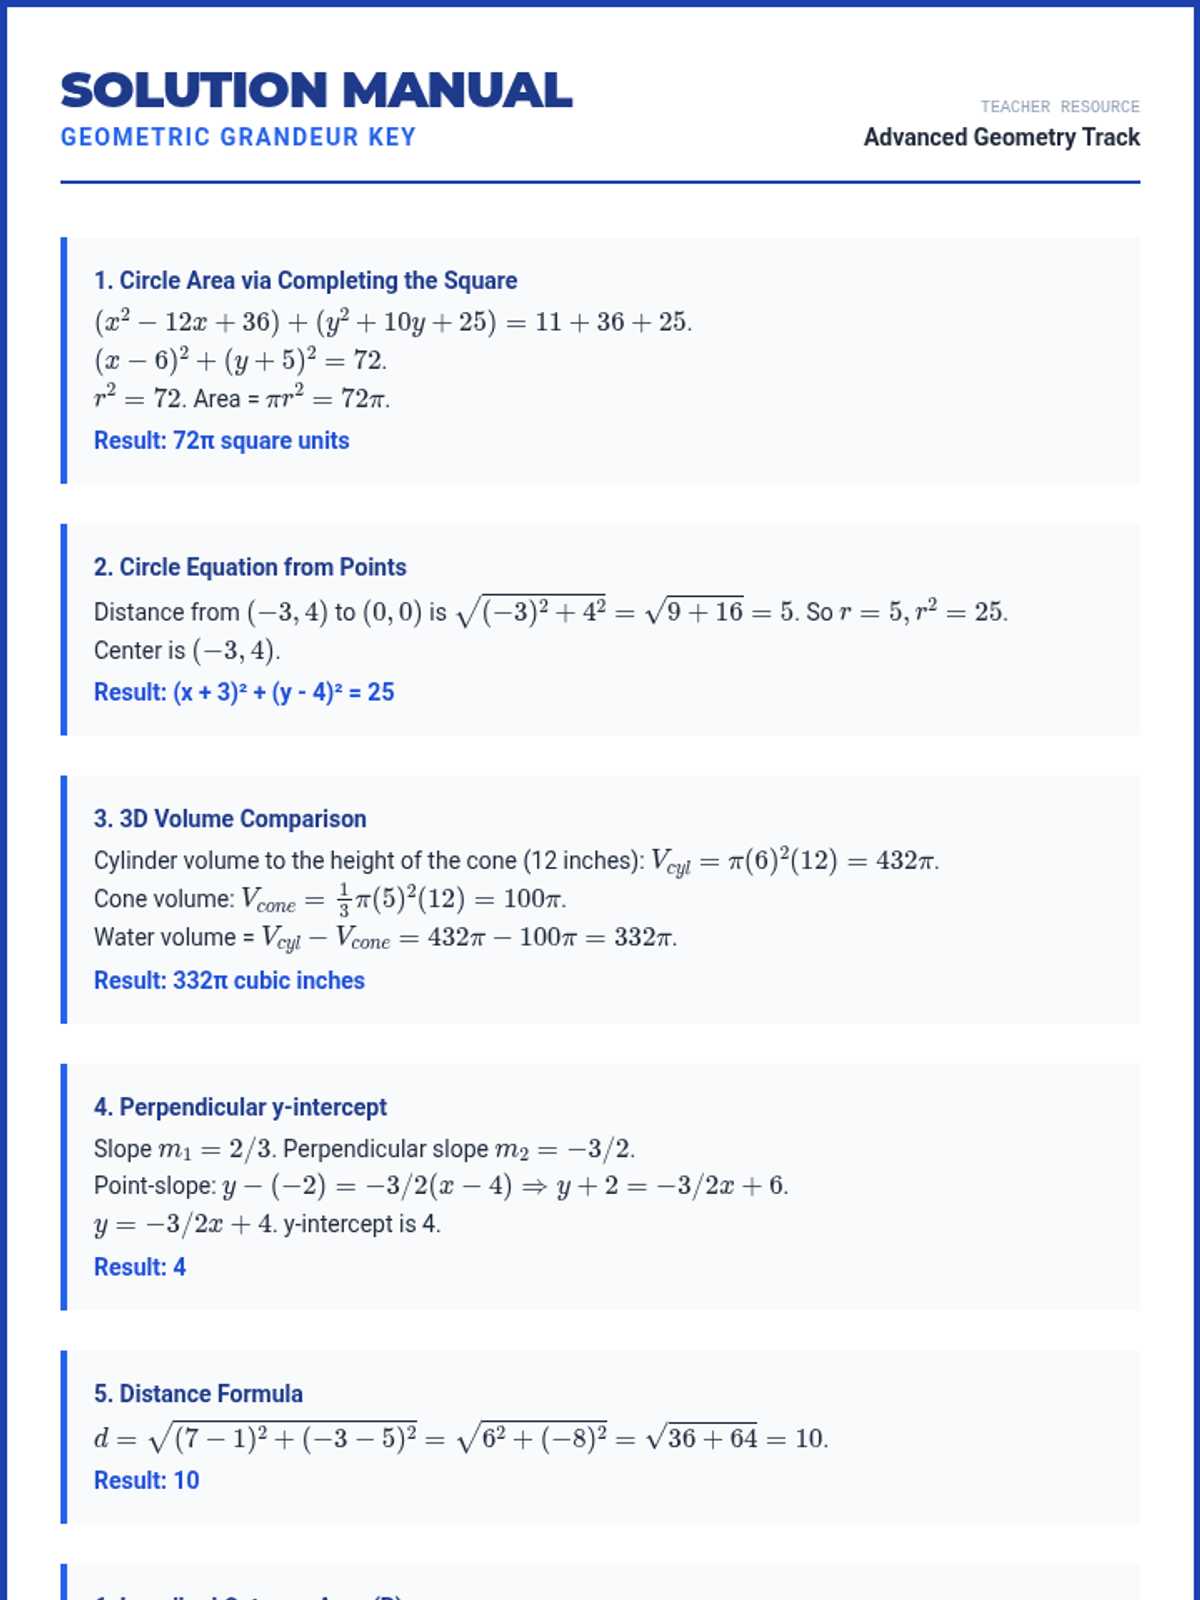
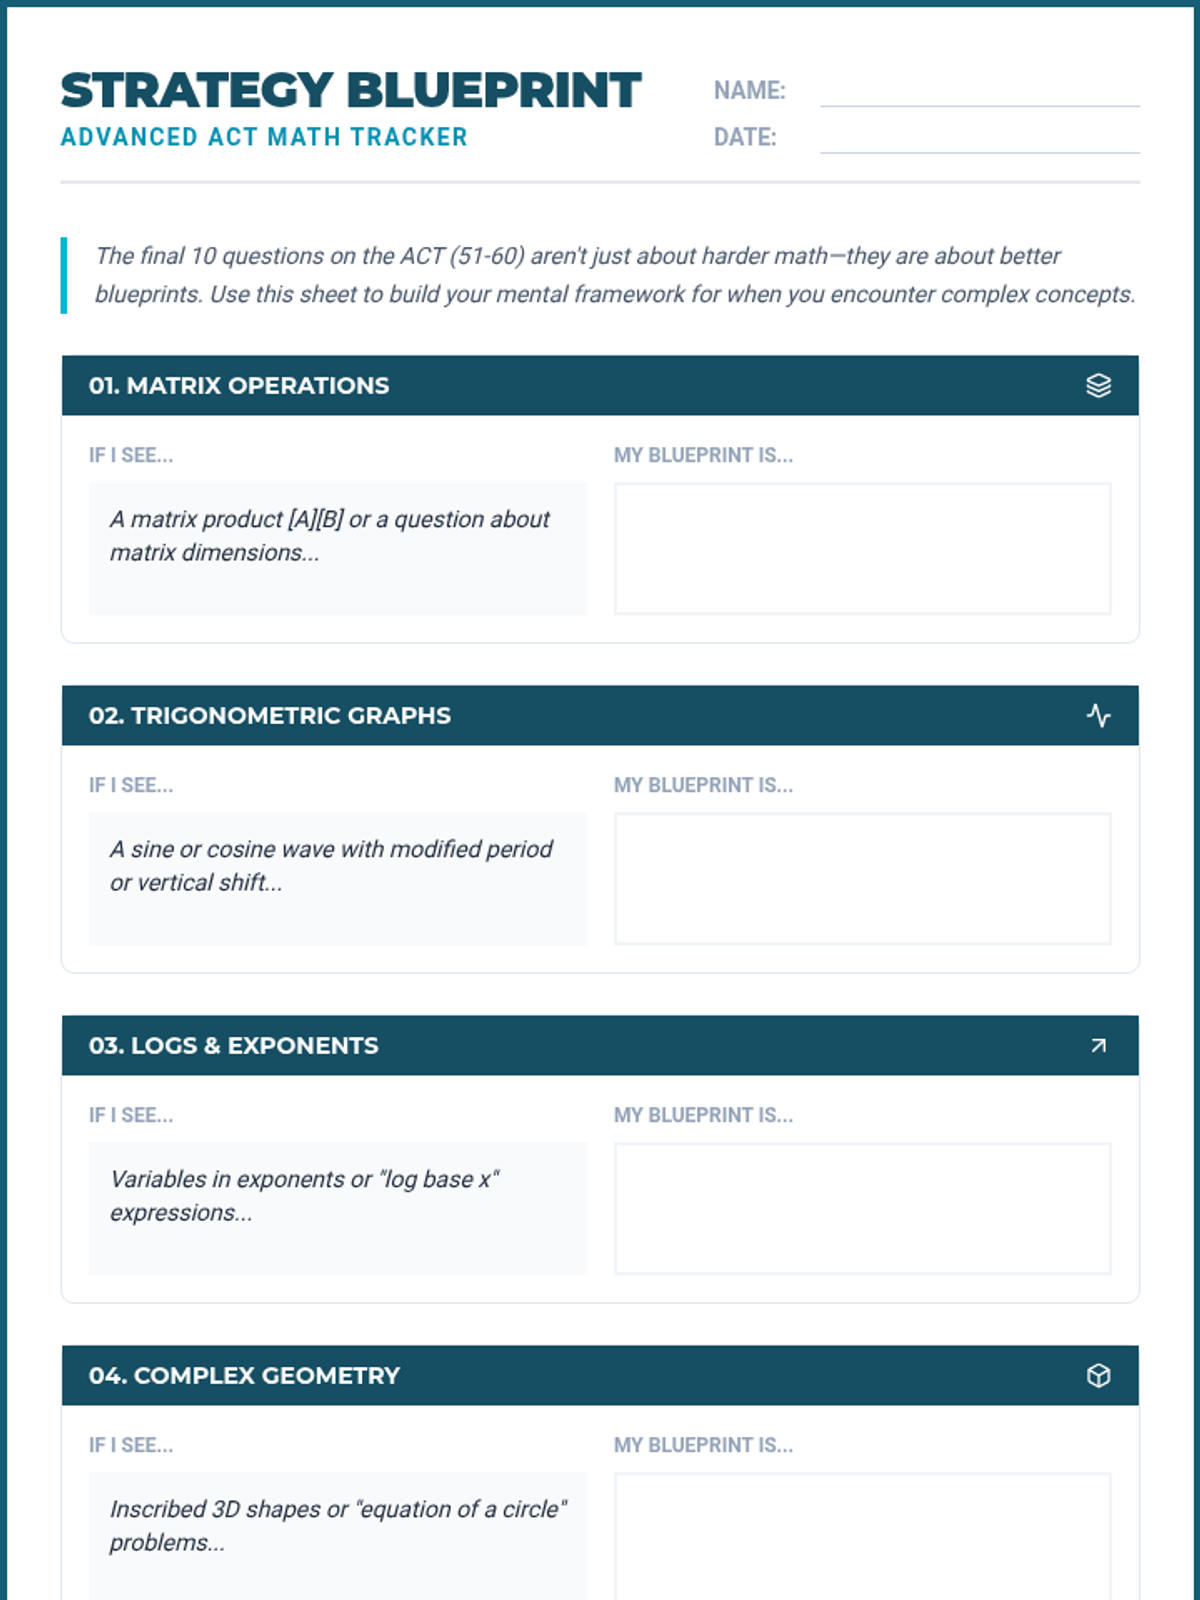
A specialized deep dive into advanced geometry concepts including circle equations, 3D volume/surface area of complex shapes, and coordinate geometry involving perpendicularity and distance. Students will master completing the square for circles and visualizing 3D cross-sections.
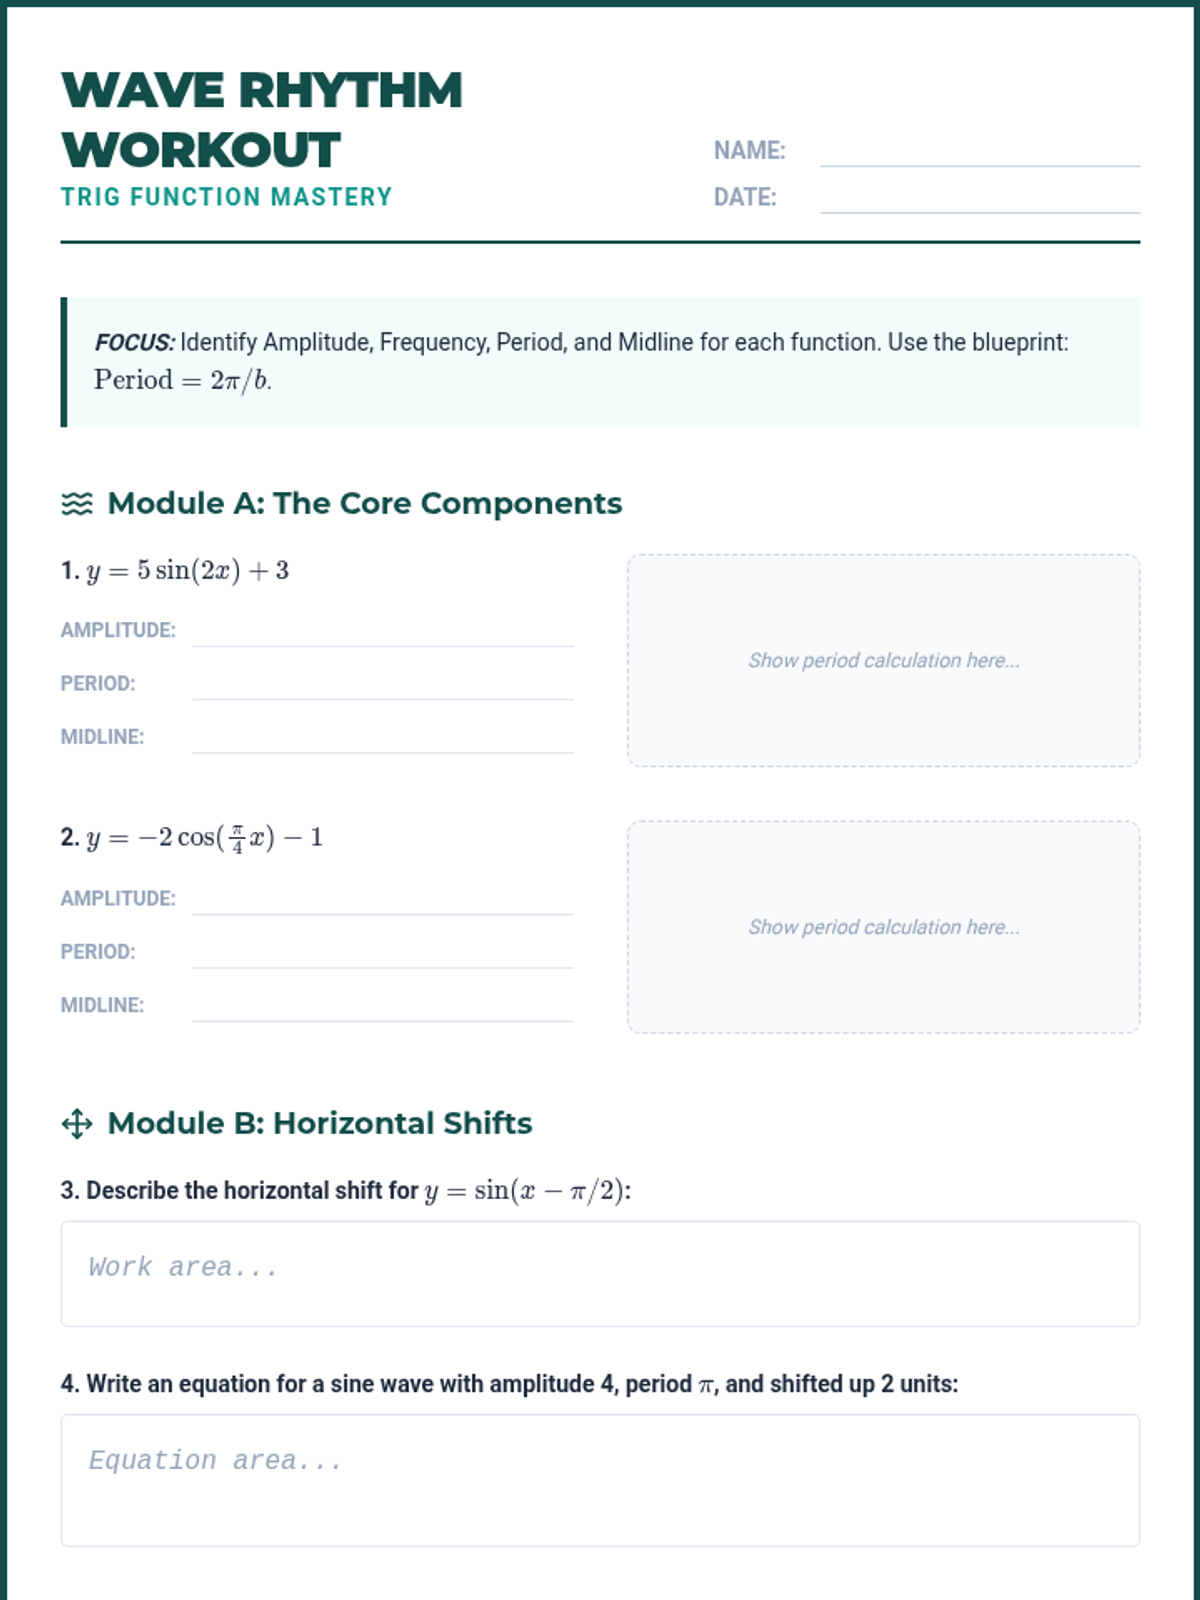
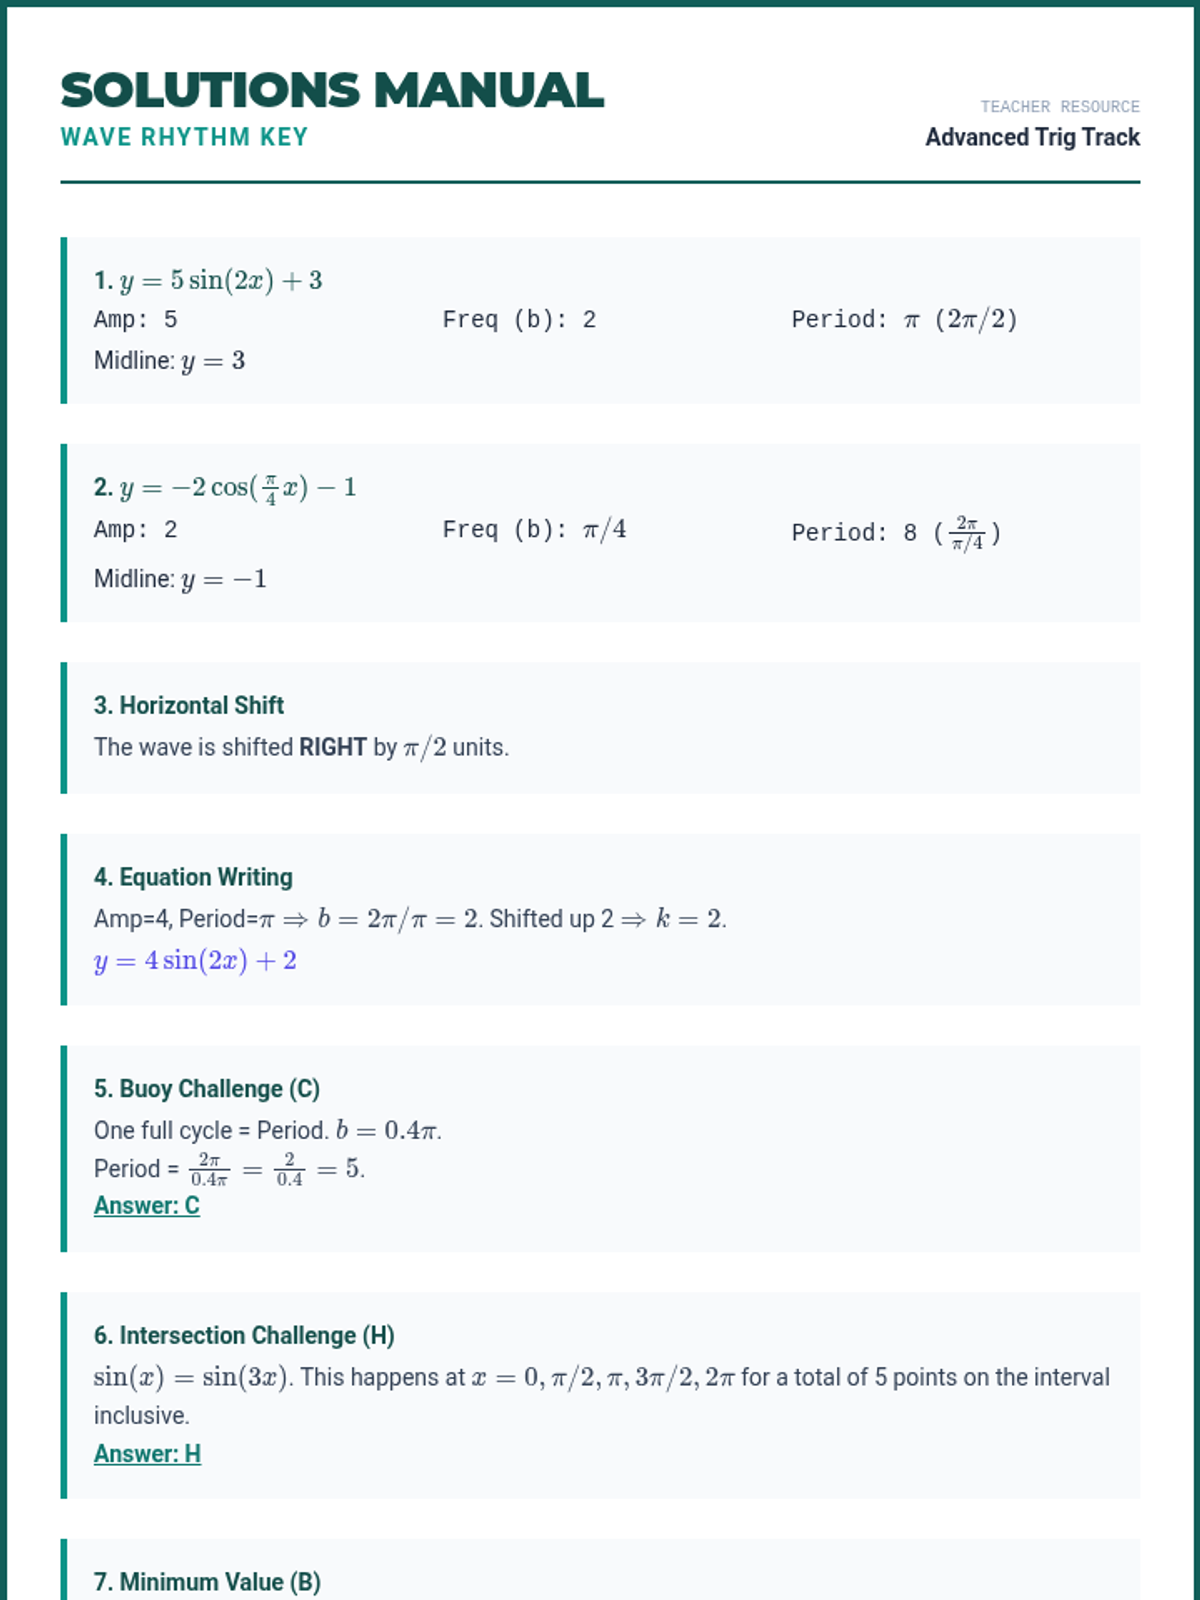
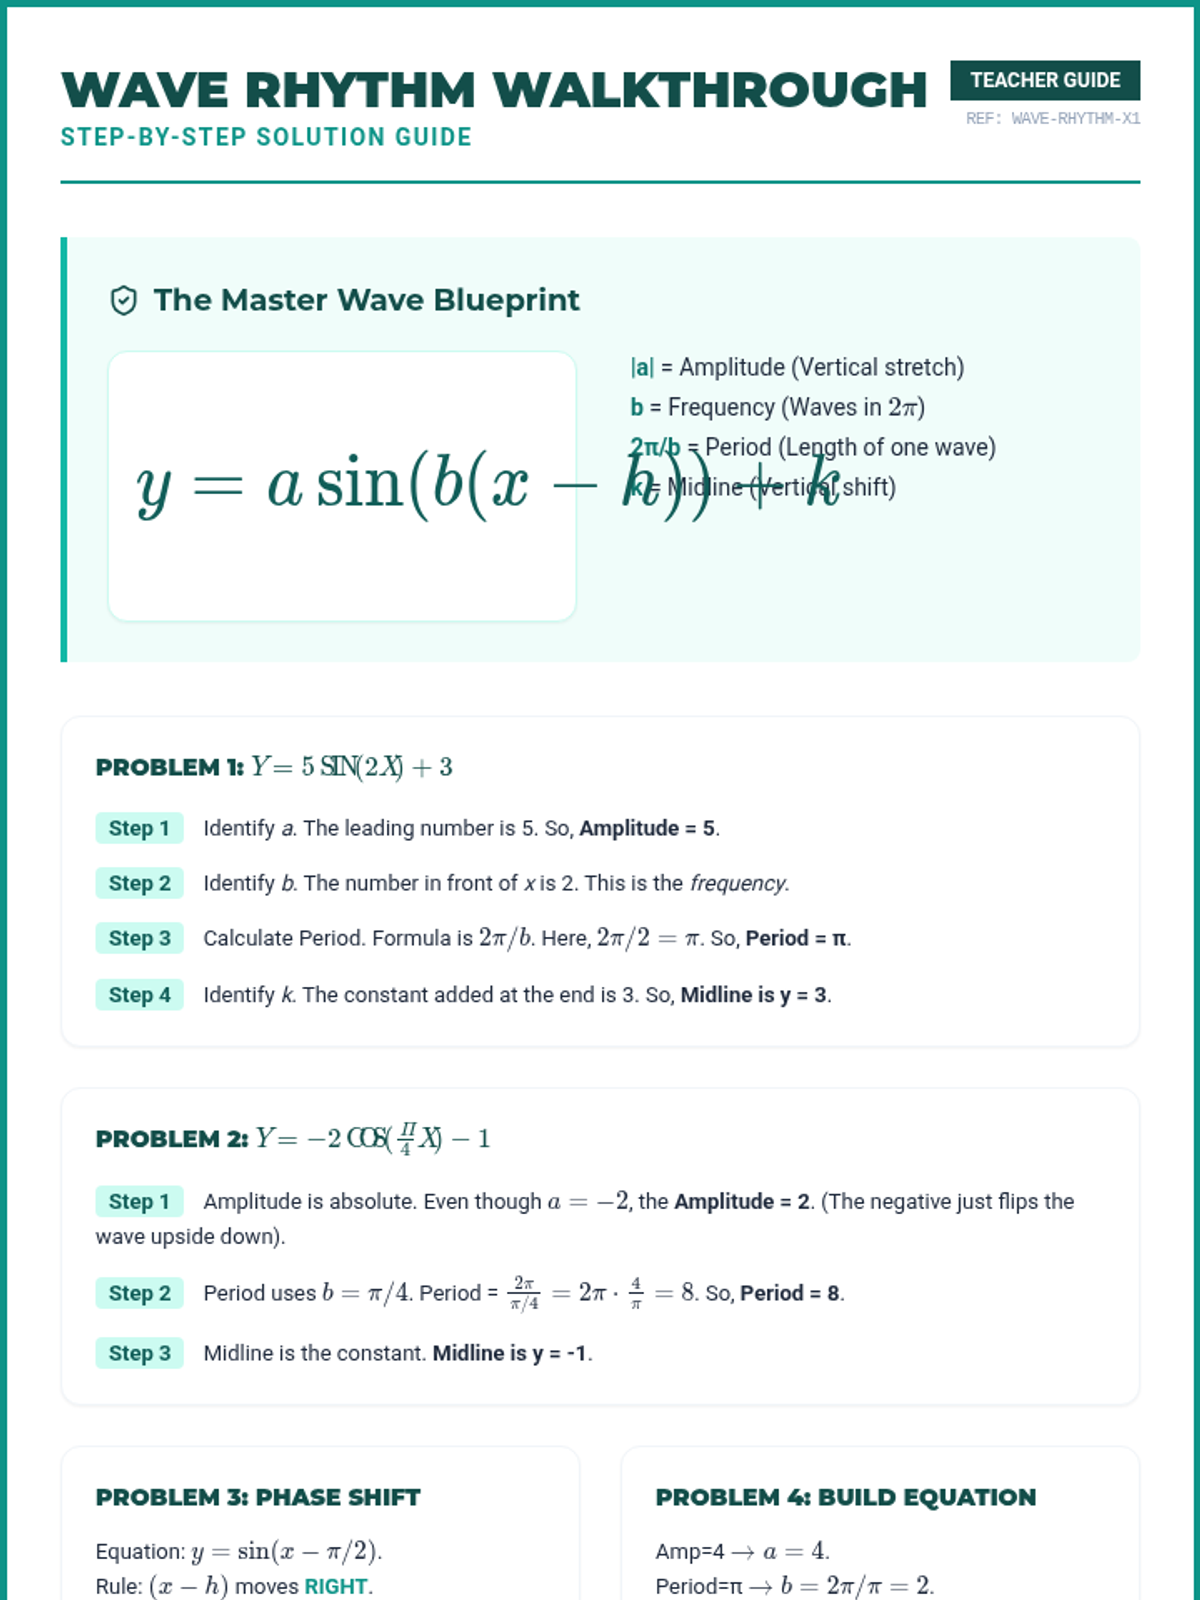
A specialized deep dive into trigonometric functions, mastering the critical distinction between period and frequency. Students will apply the 2π/b blueprint to decode sine and cosine graphs and solve high-difficulty periodic motion problems.
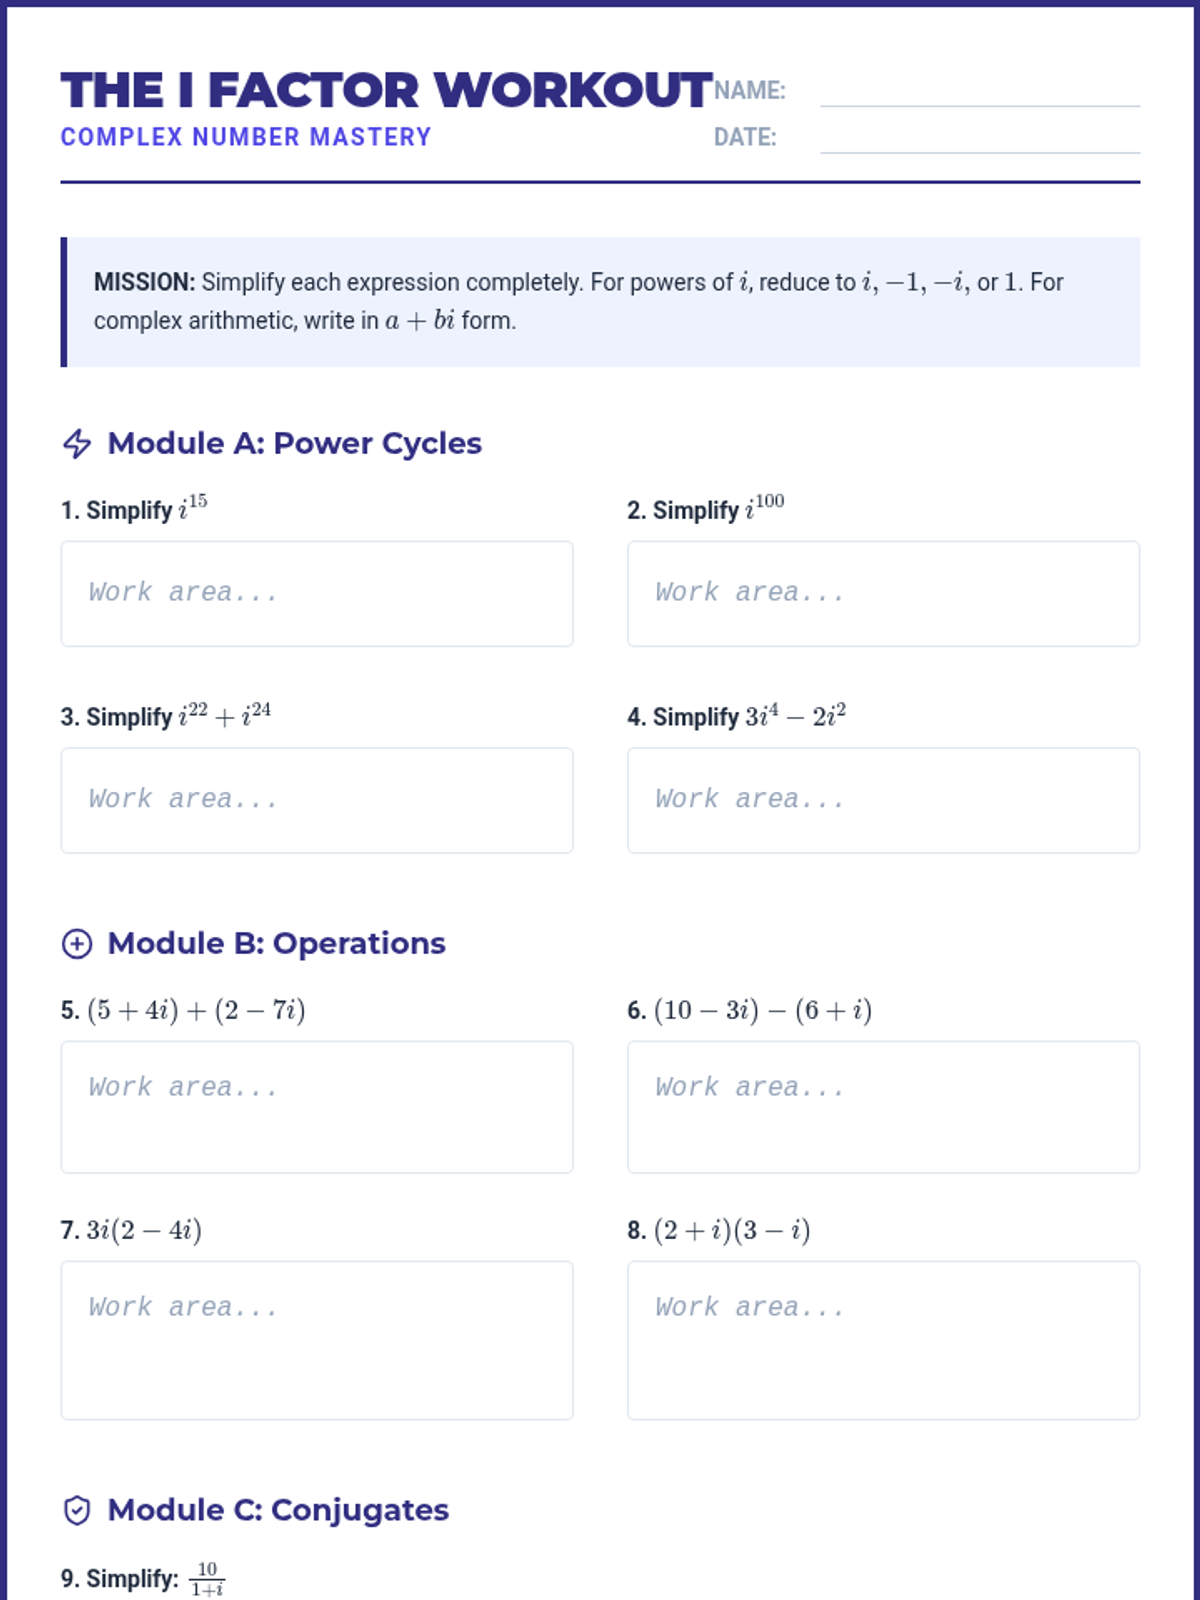
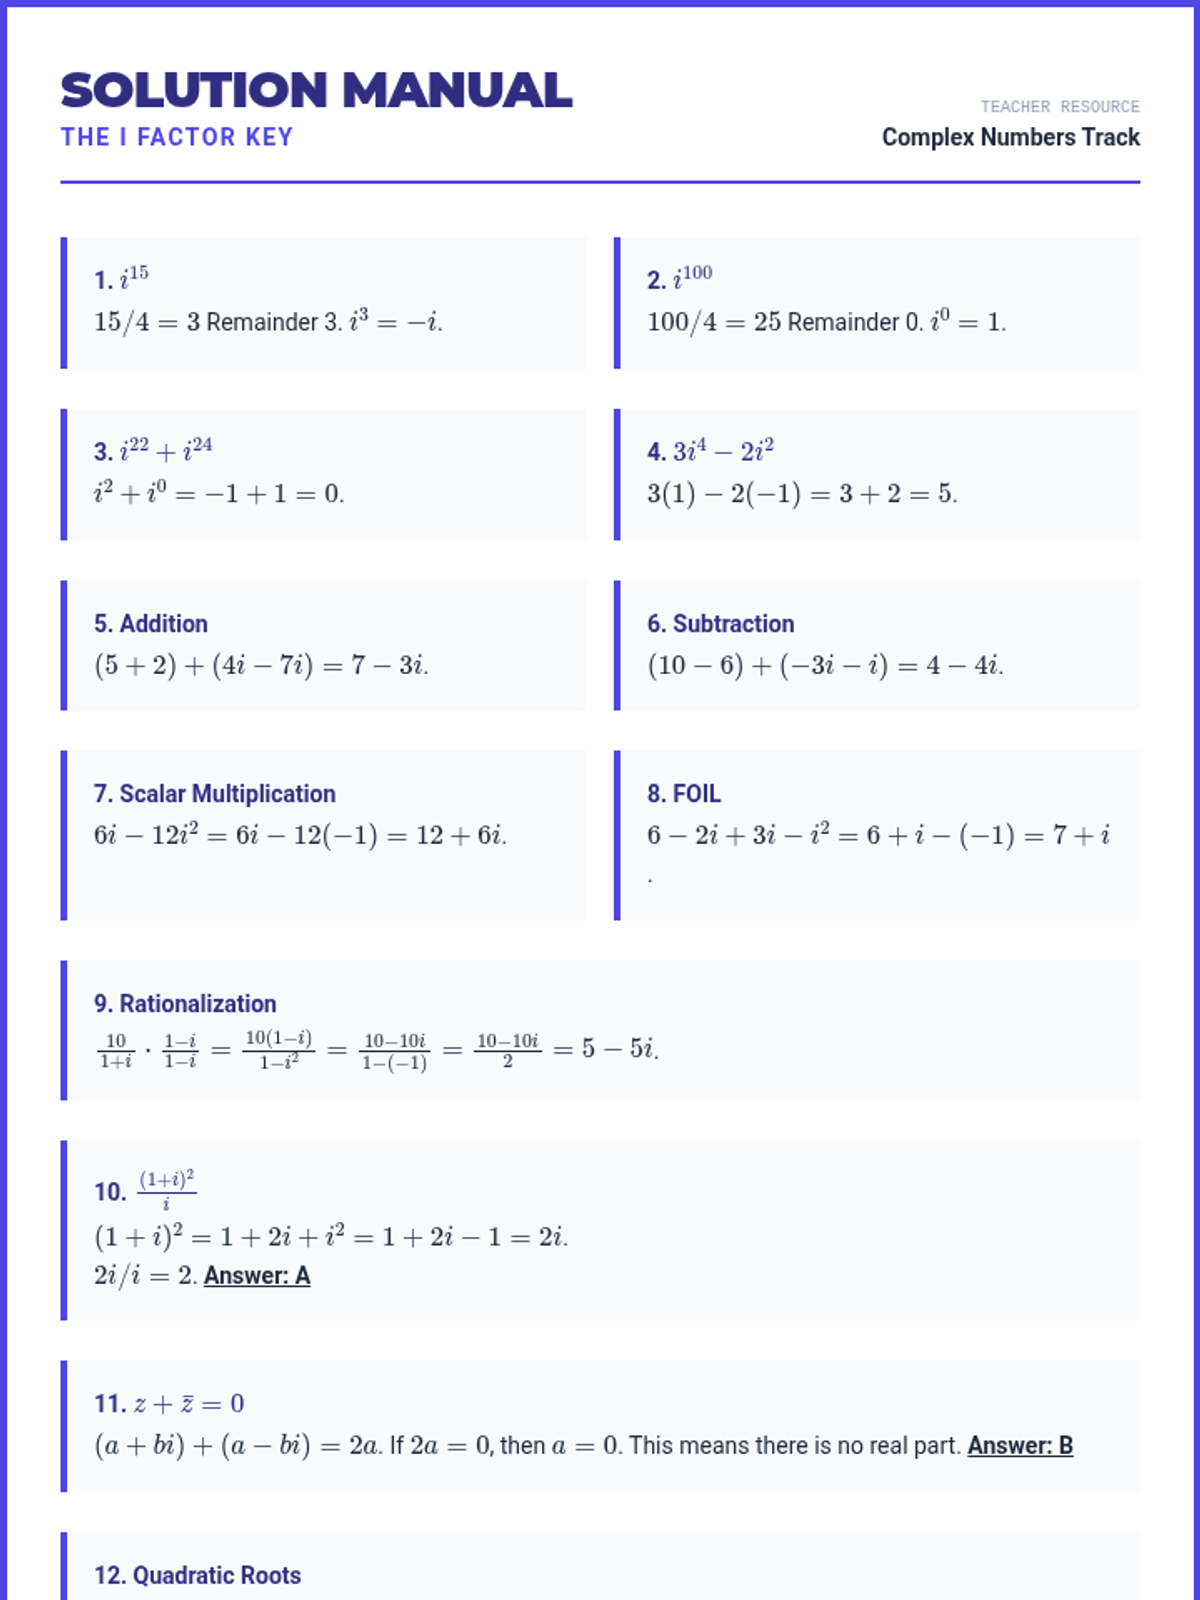
A focused deep dive into imaginary and complex numbers. Students will master powers of i, arithmetic with complex conjugates, and solving quadratic equations with complex roots—all through the lens of ACT-style 'Final Ten' questions.
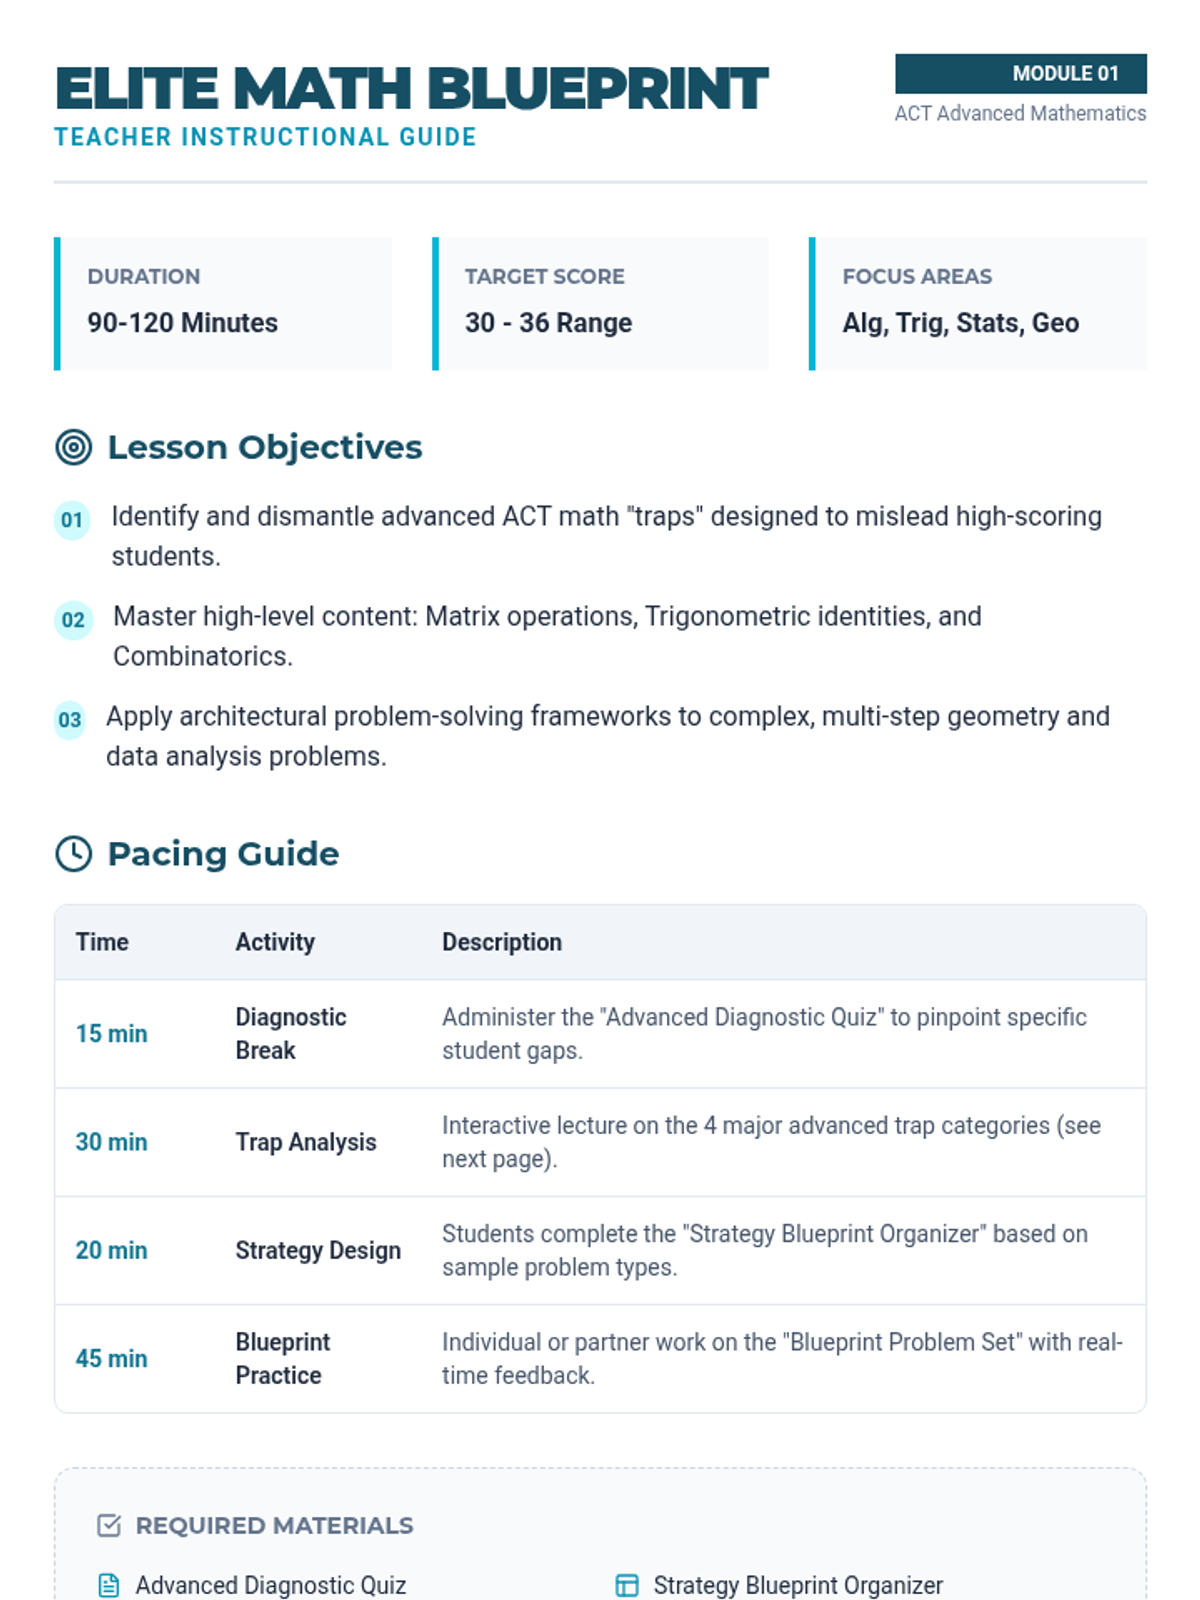
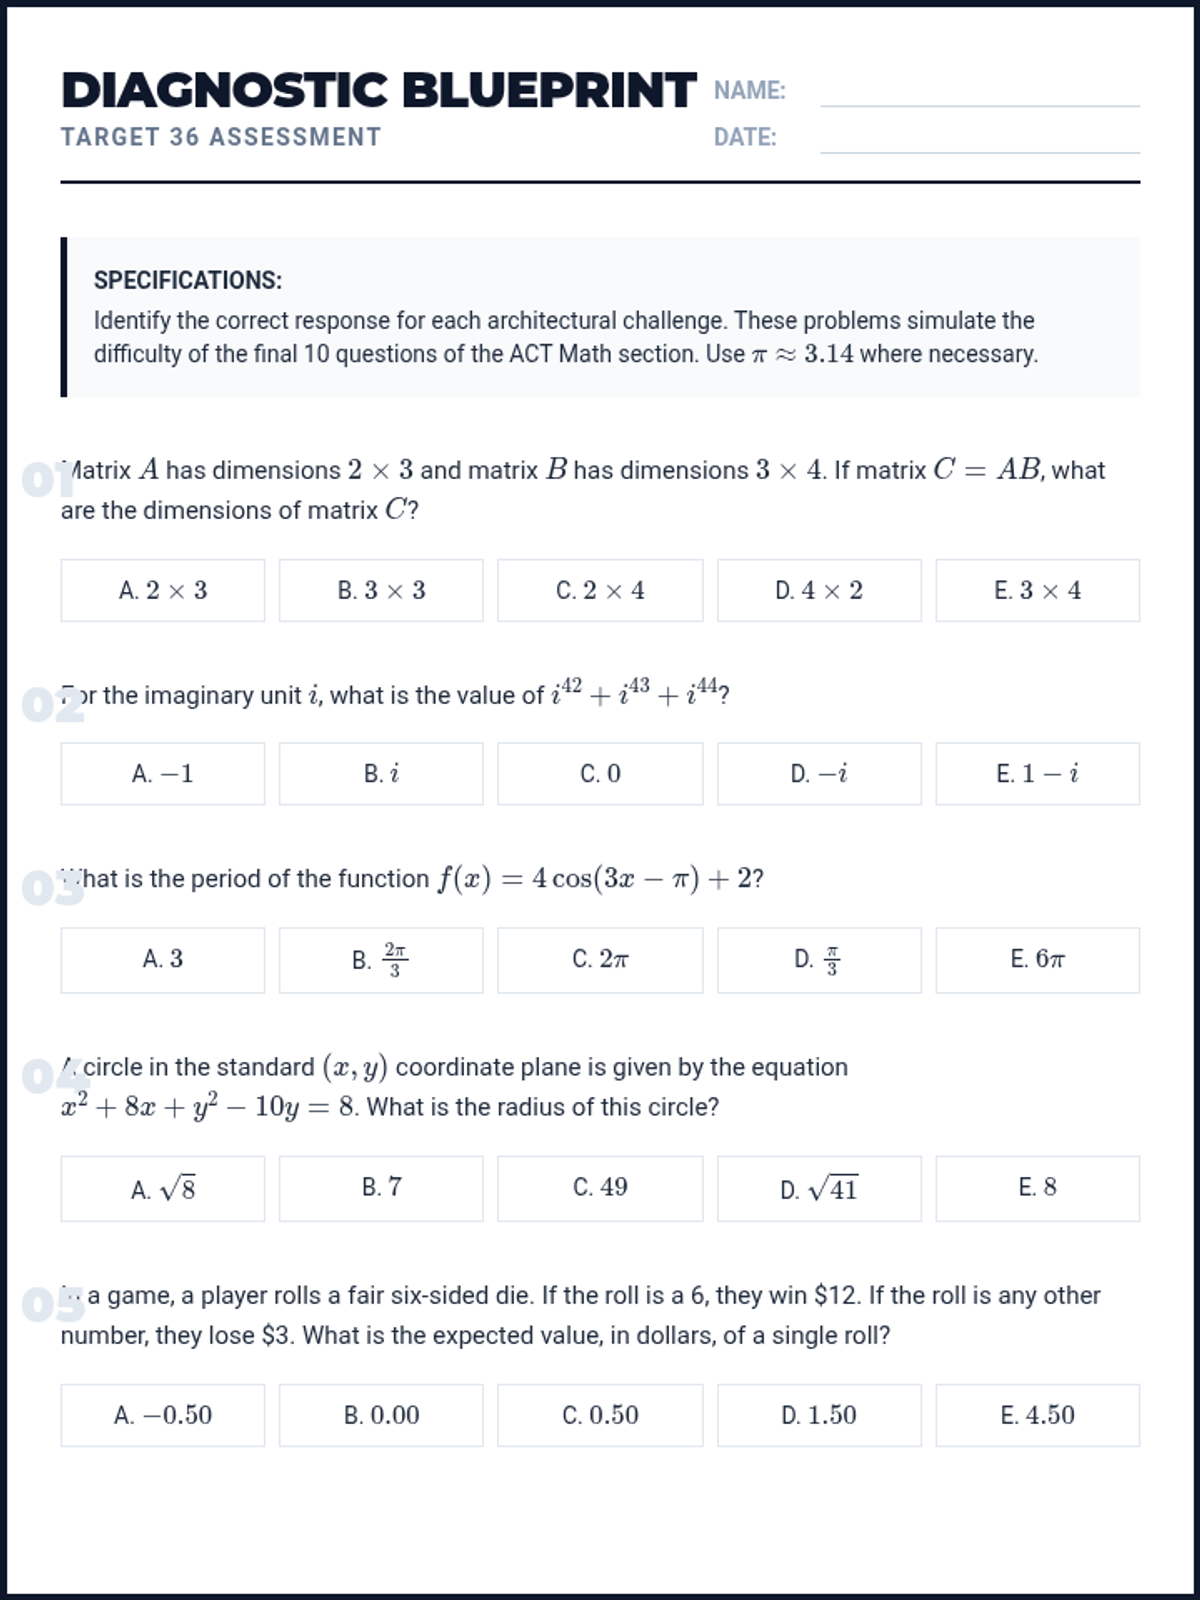
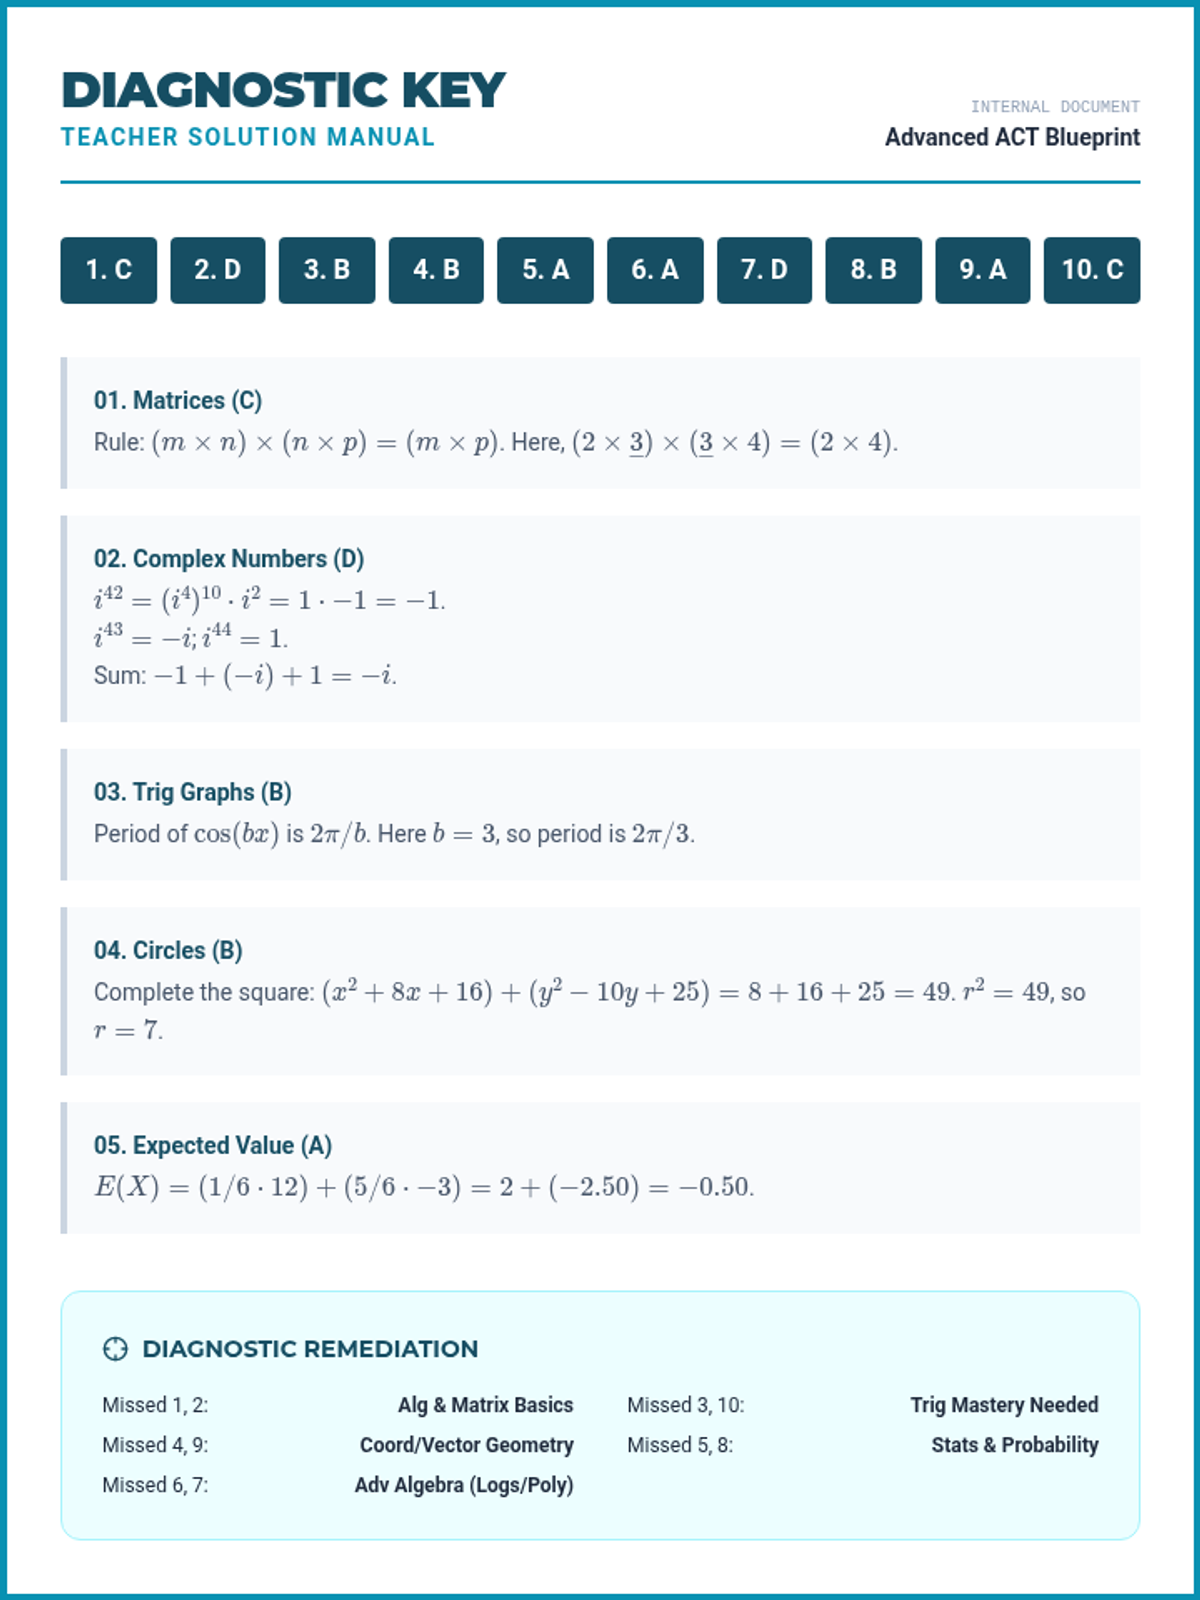
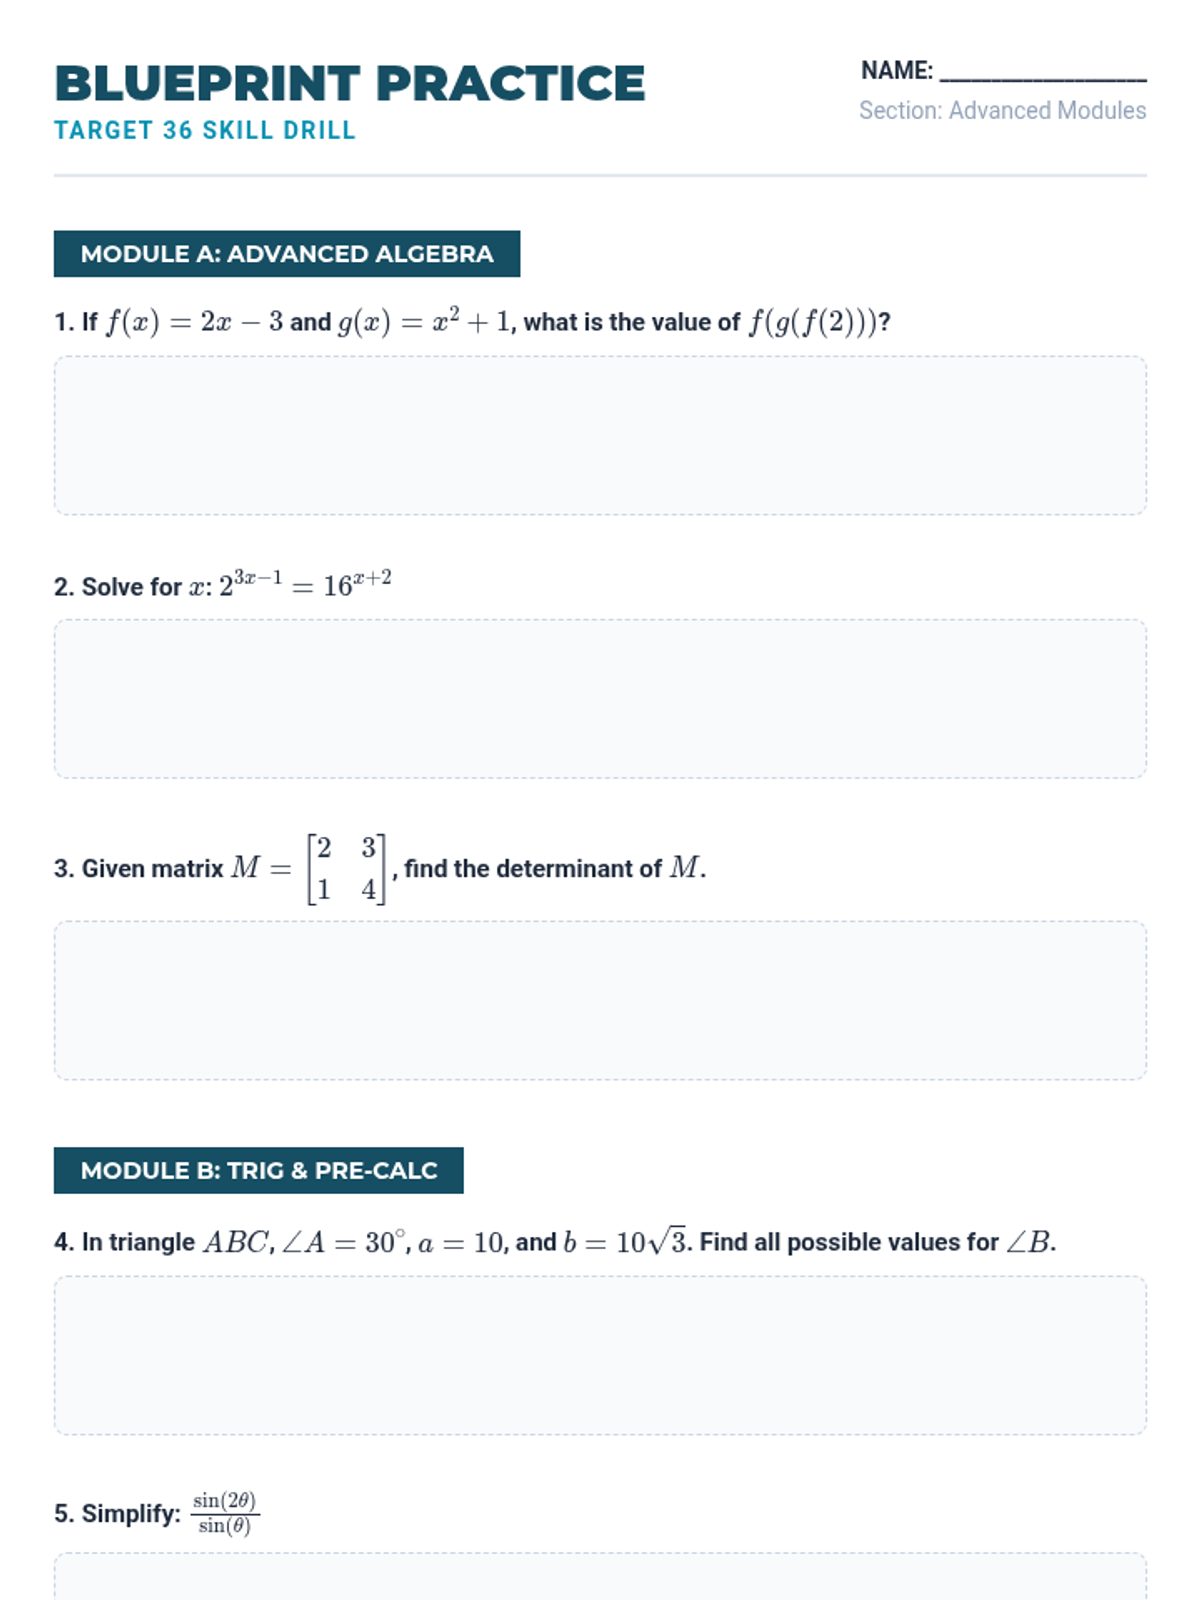
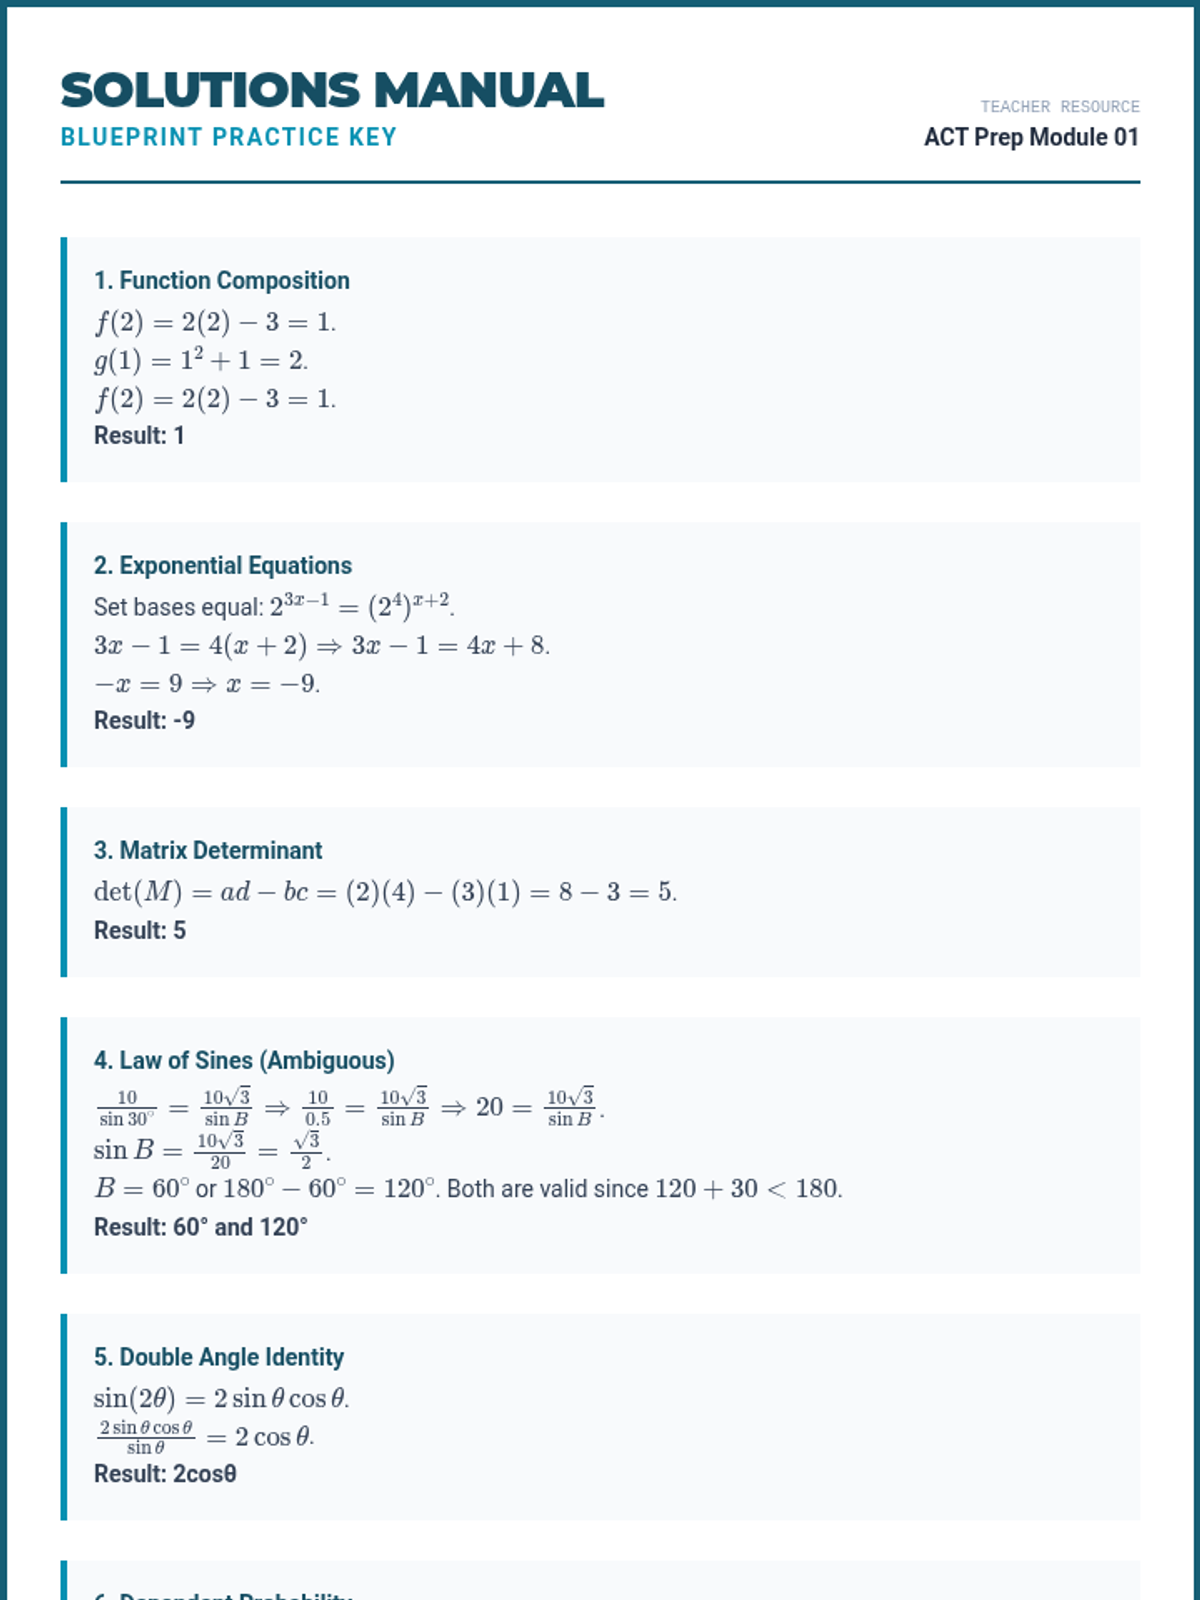
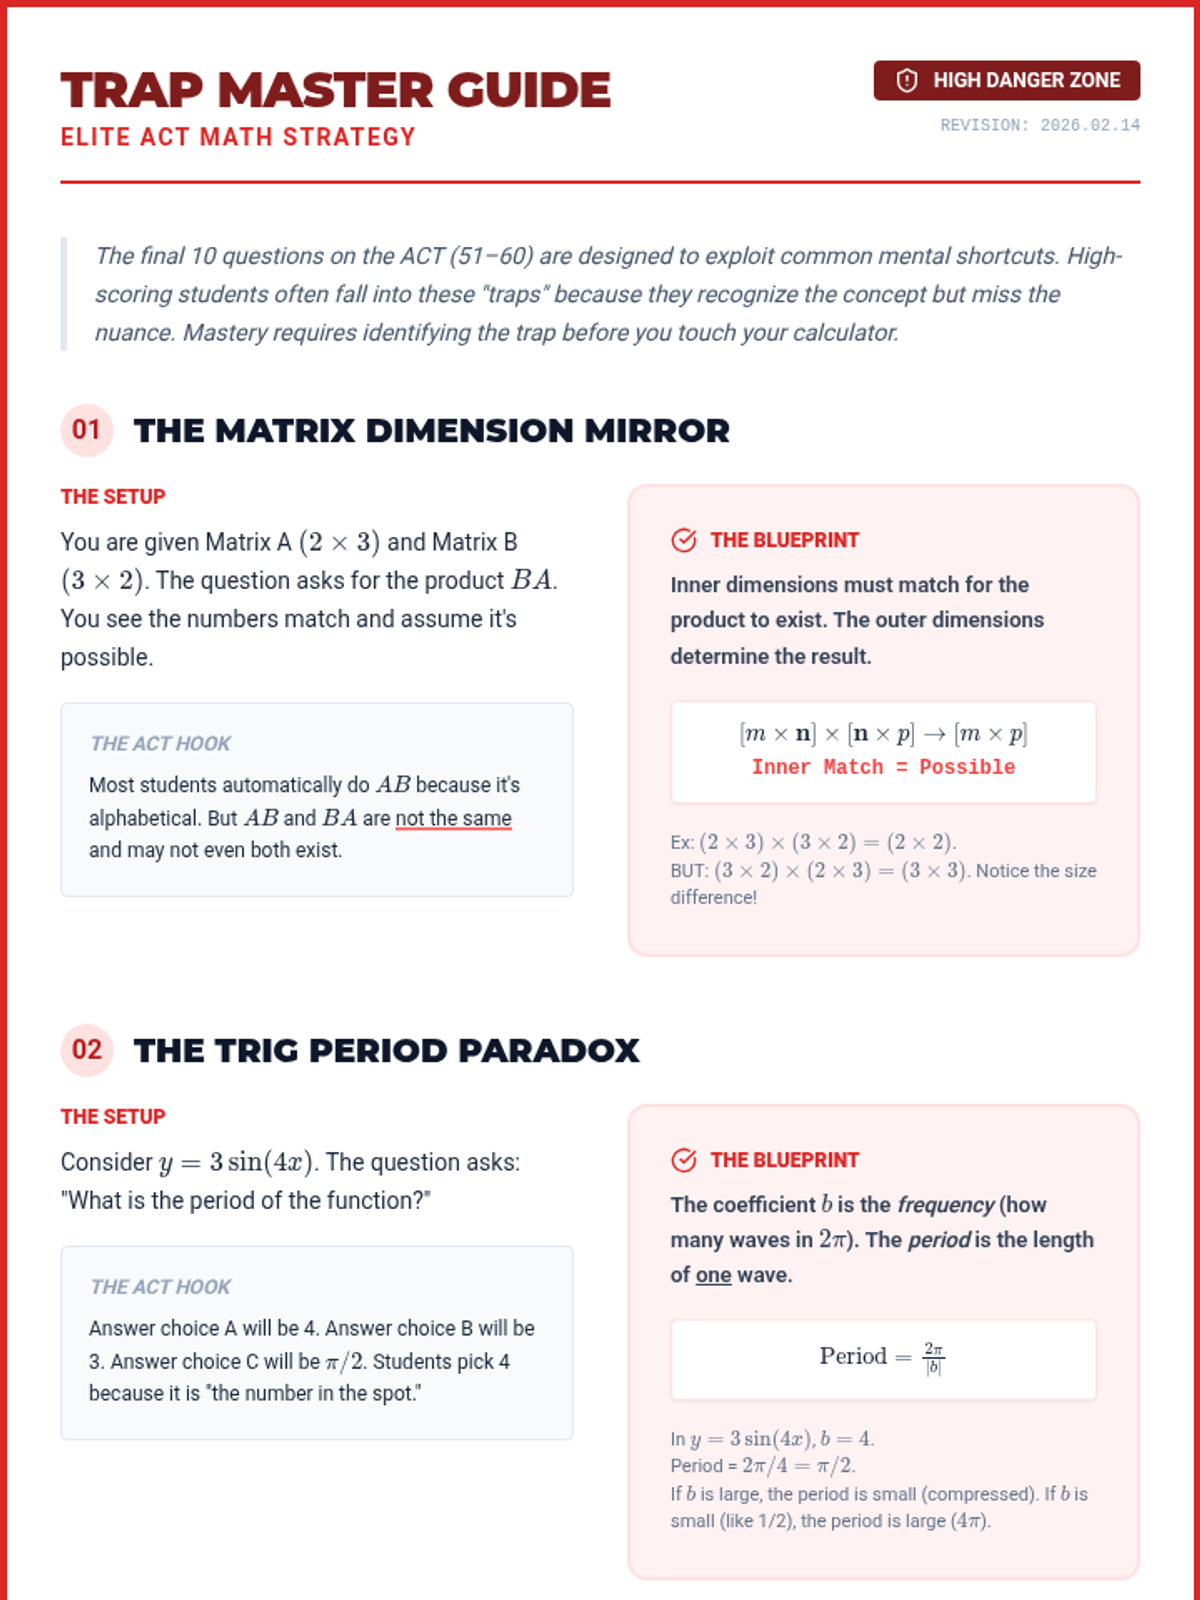
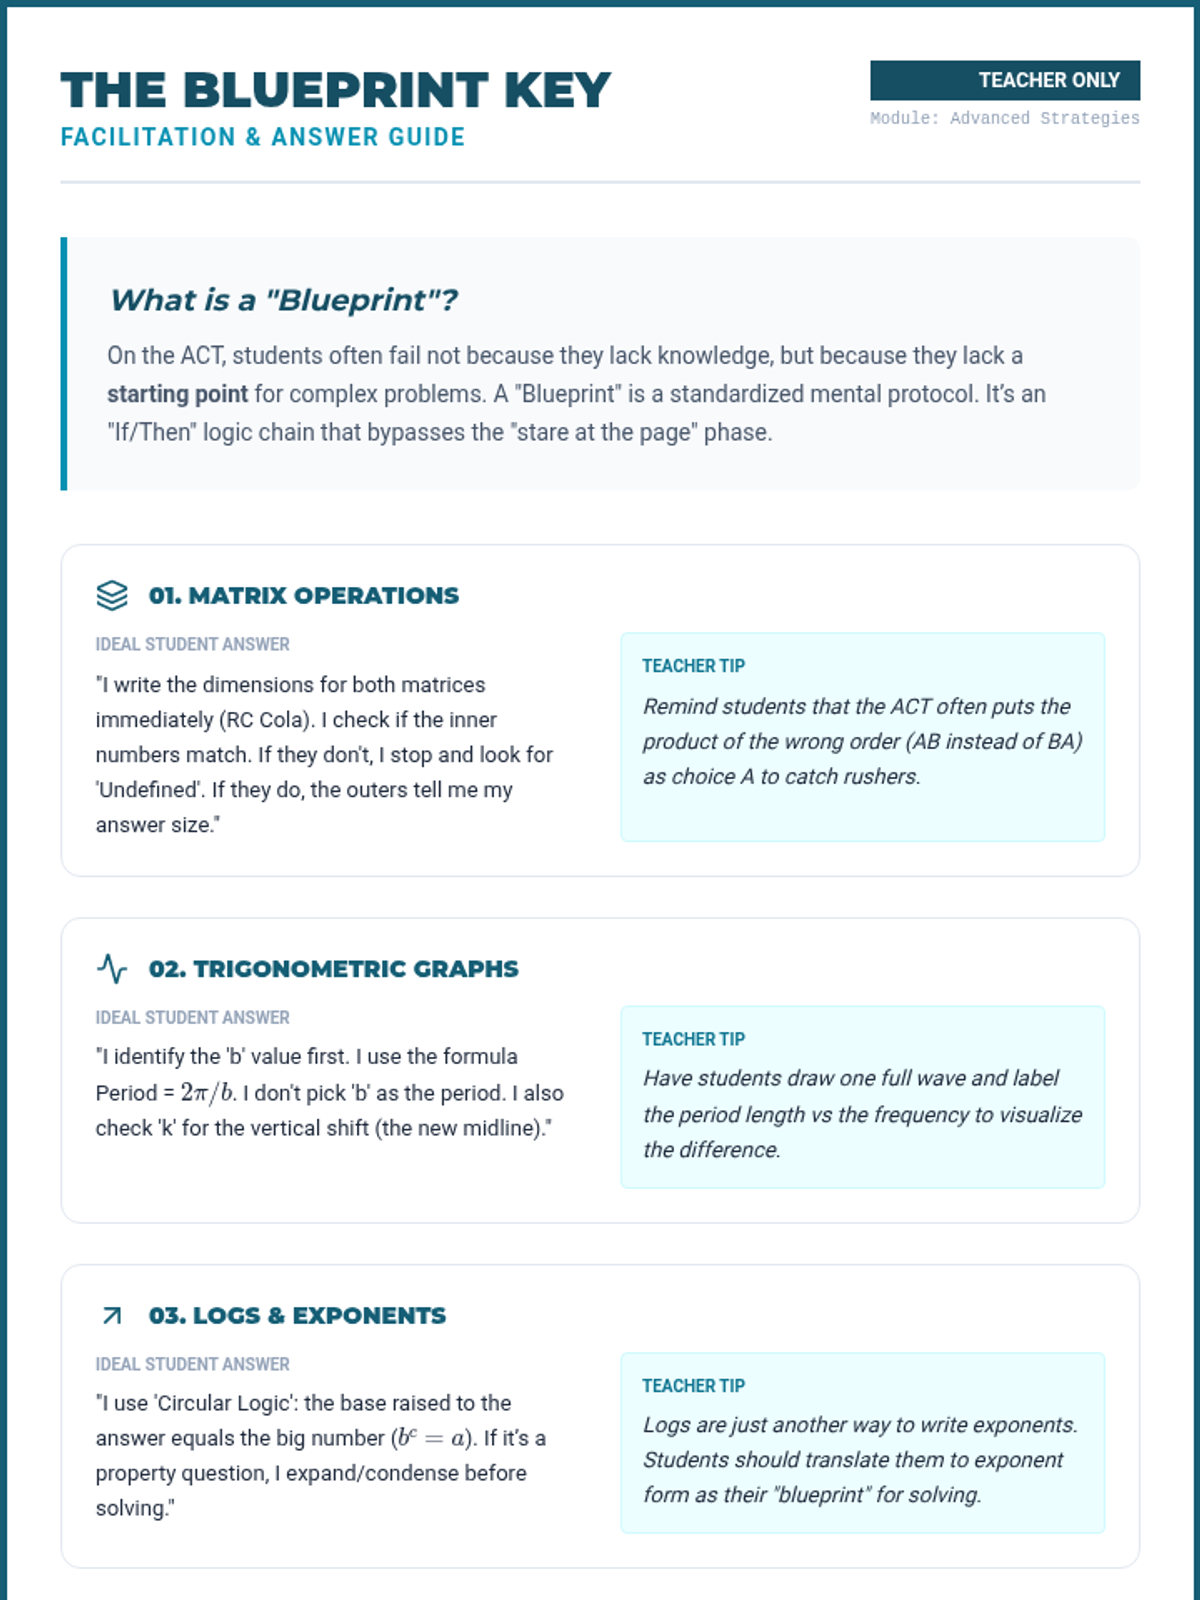
A comprehensive lesson focused on high-level ACT Math topics including matrices, complex functions, trigonometry, and advanced statistics. The lesson emphasizes identifying common 'traps' and applying architectural-style problem-solving strategies.
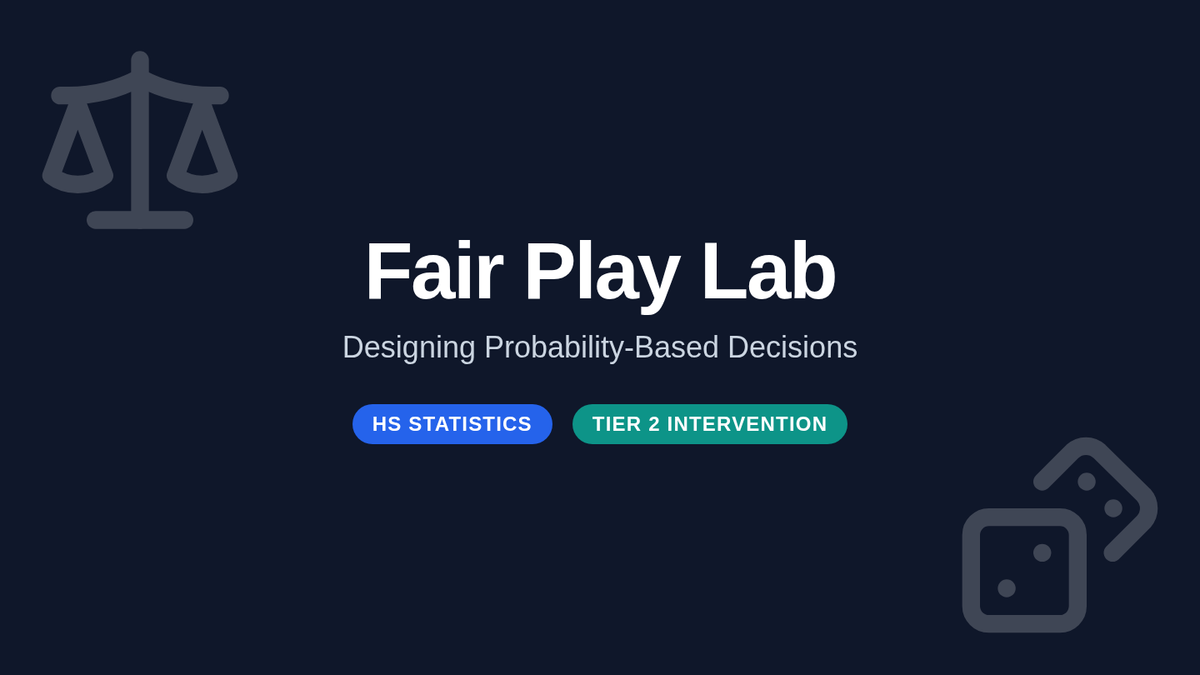
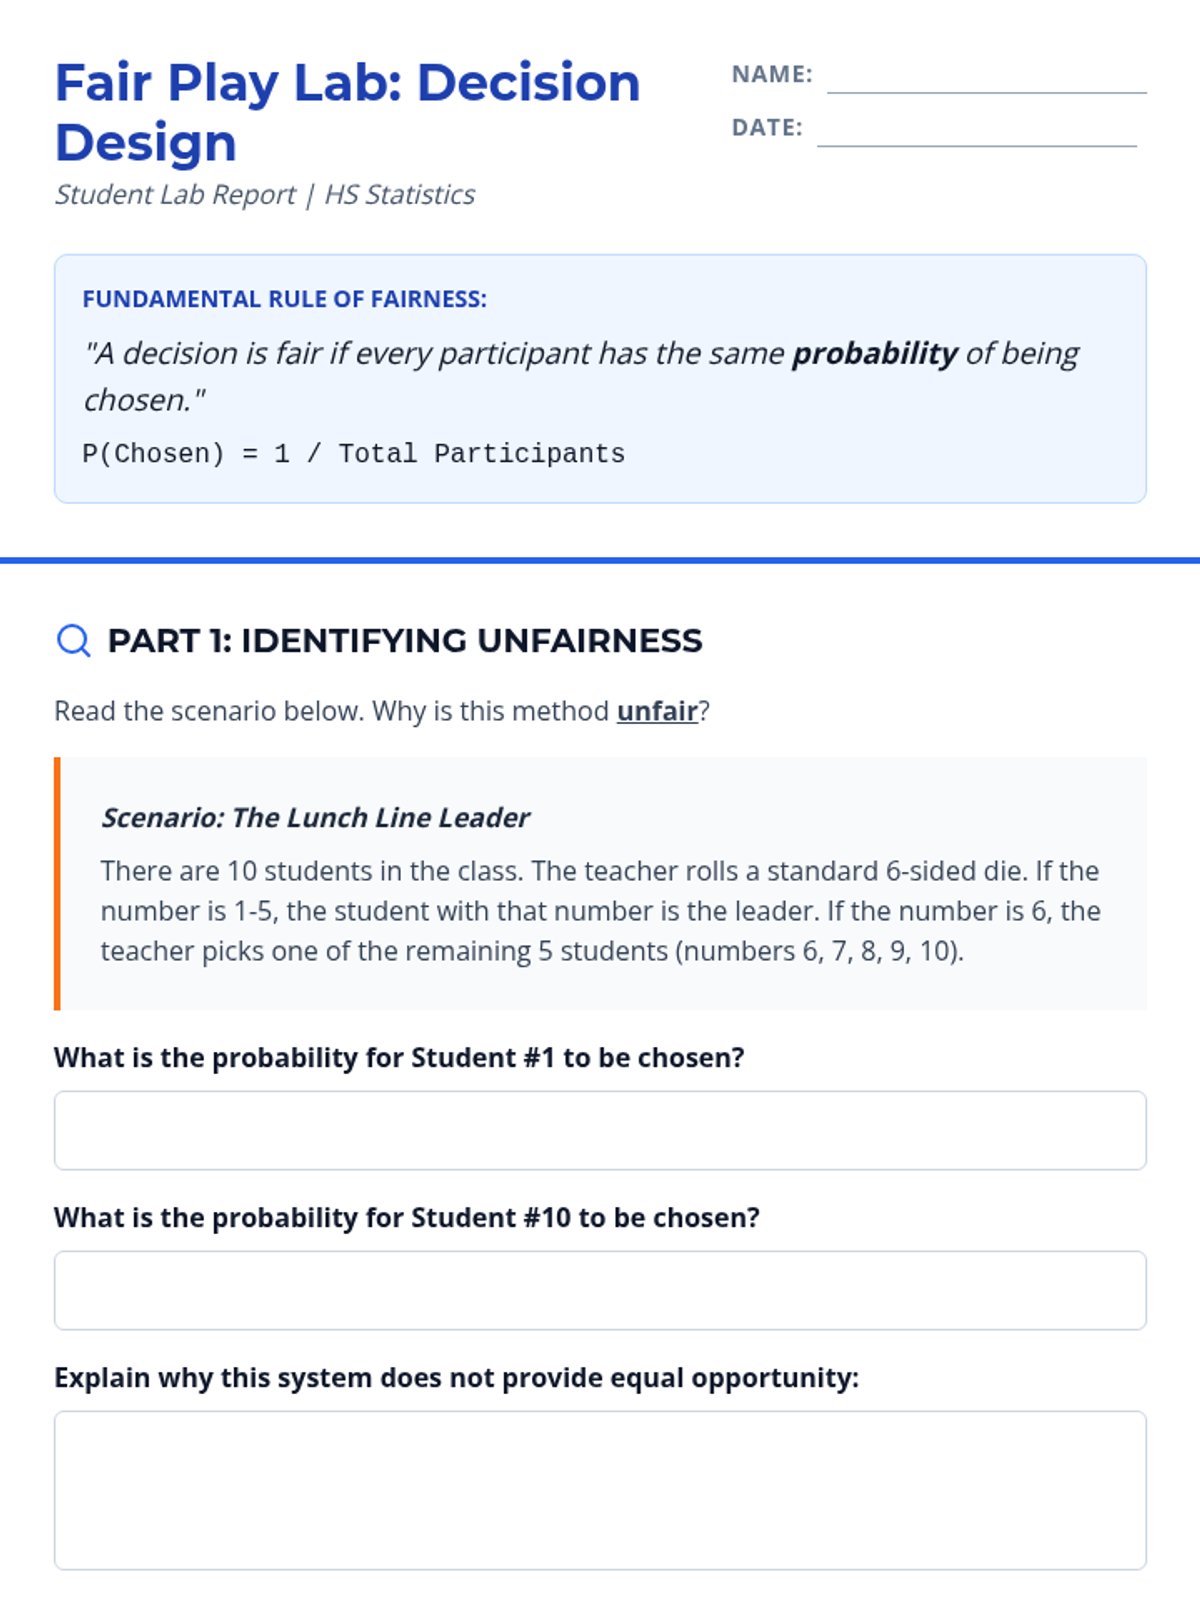
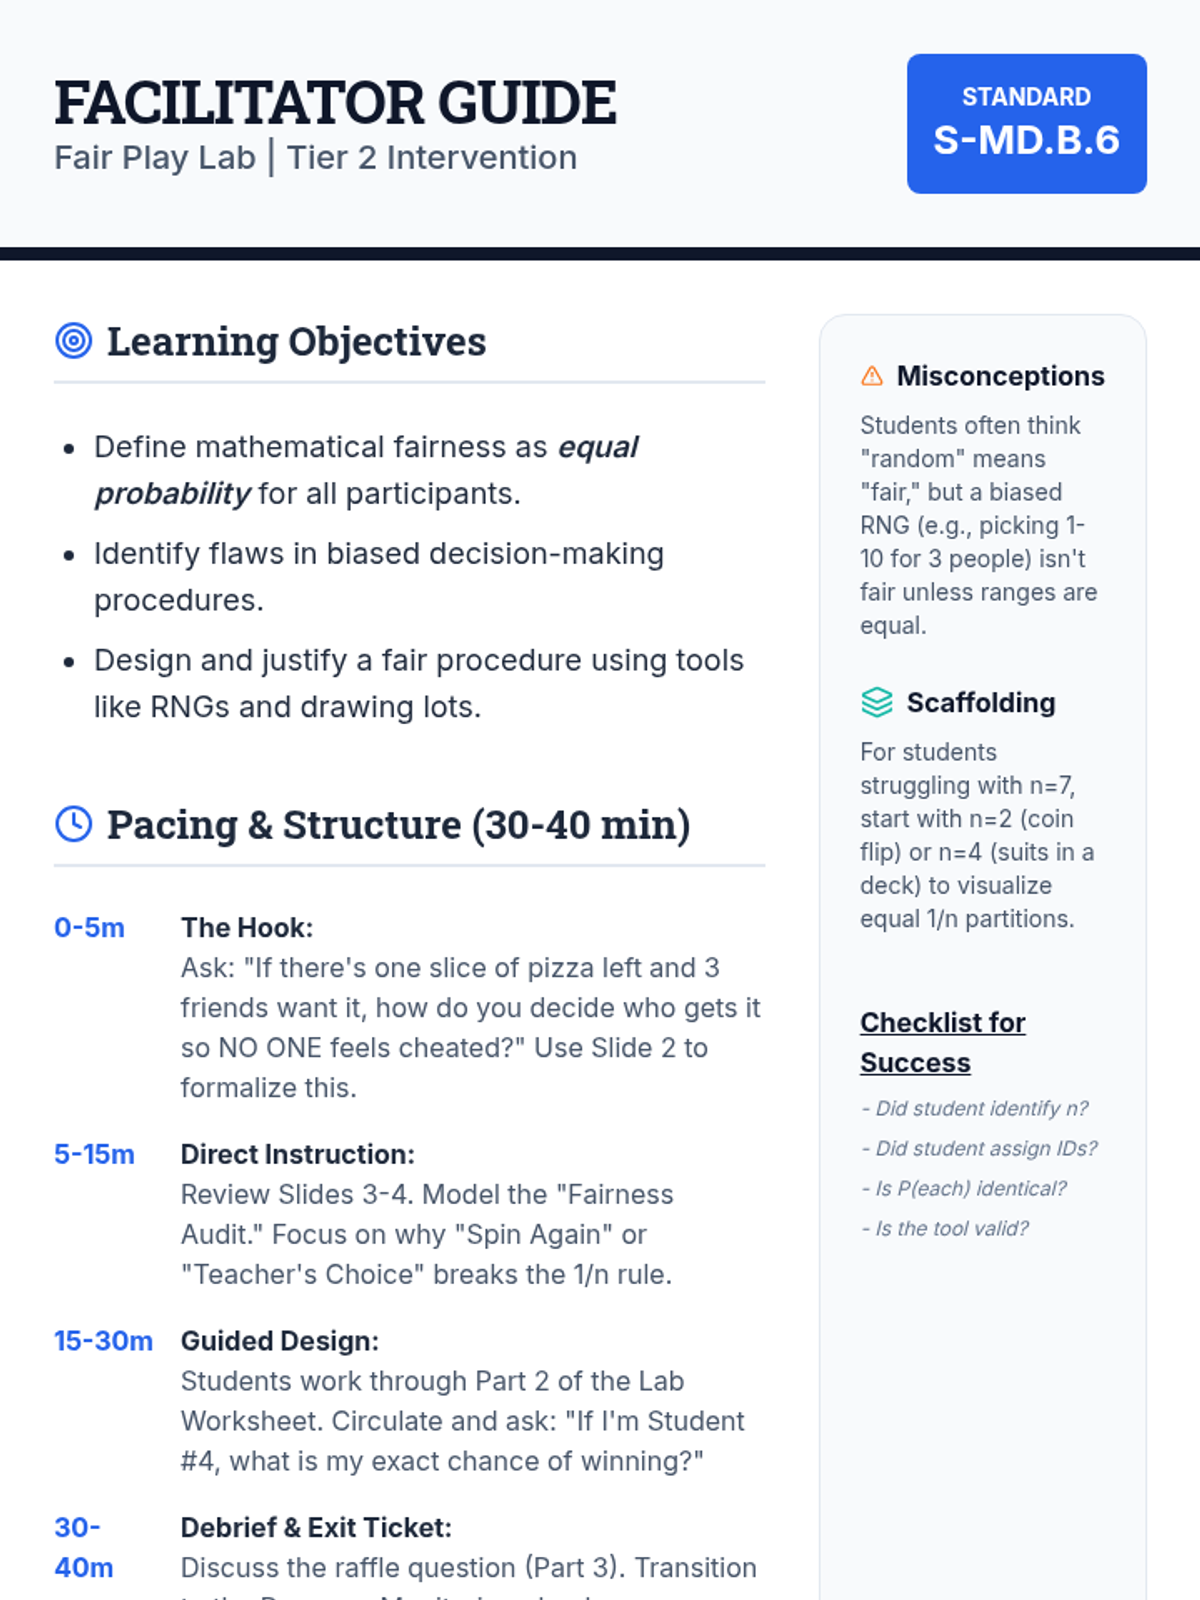
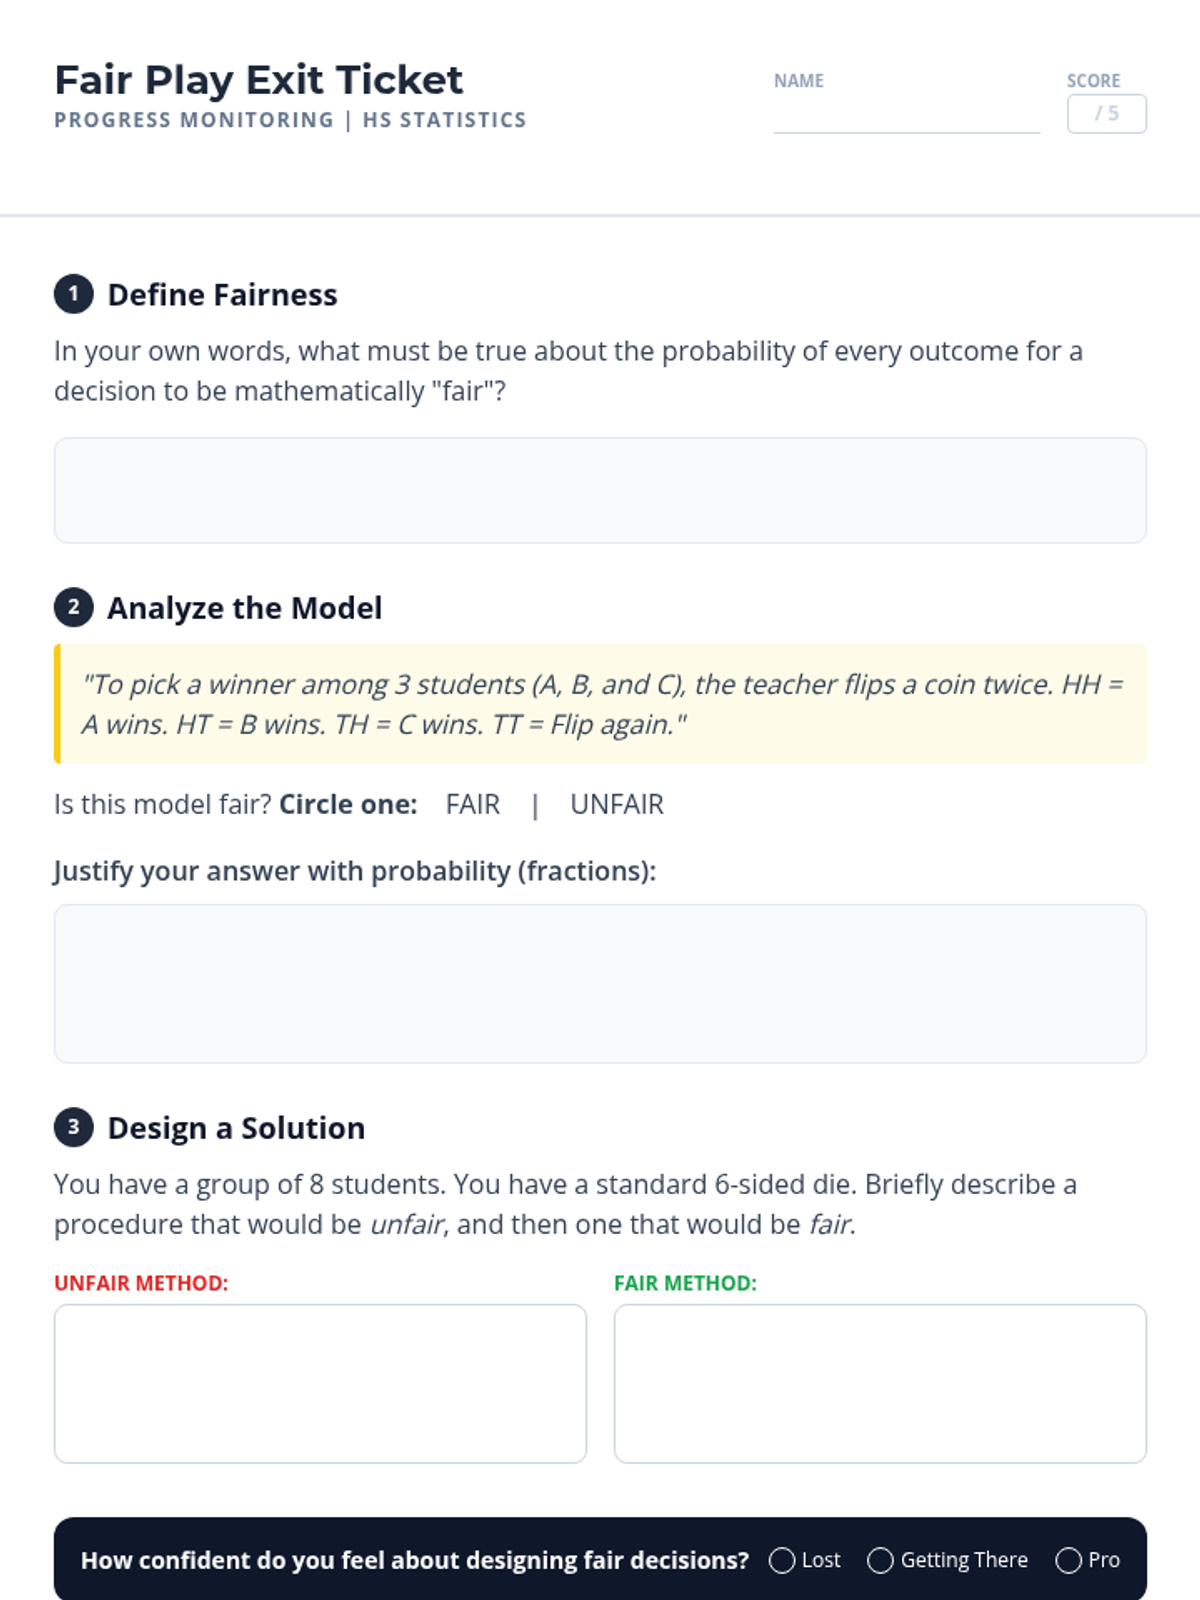
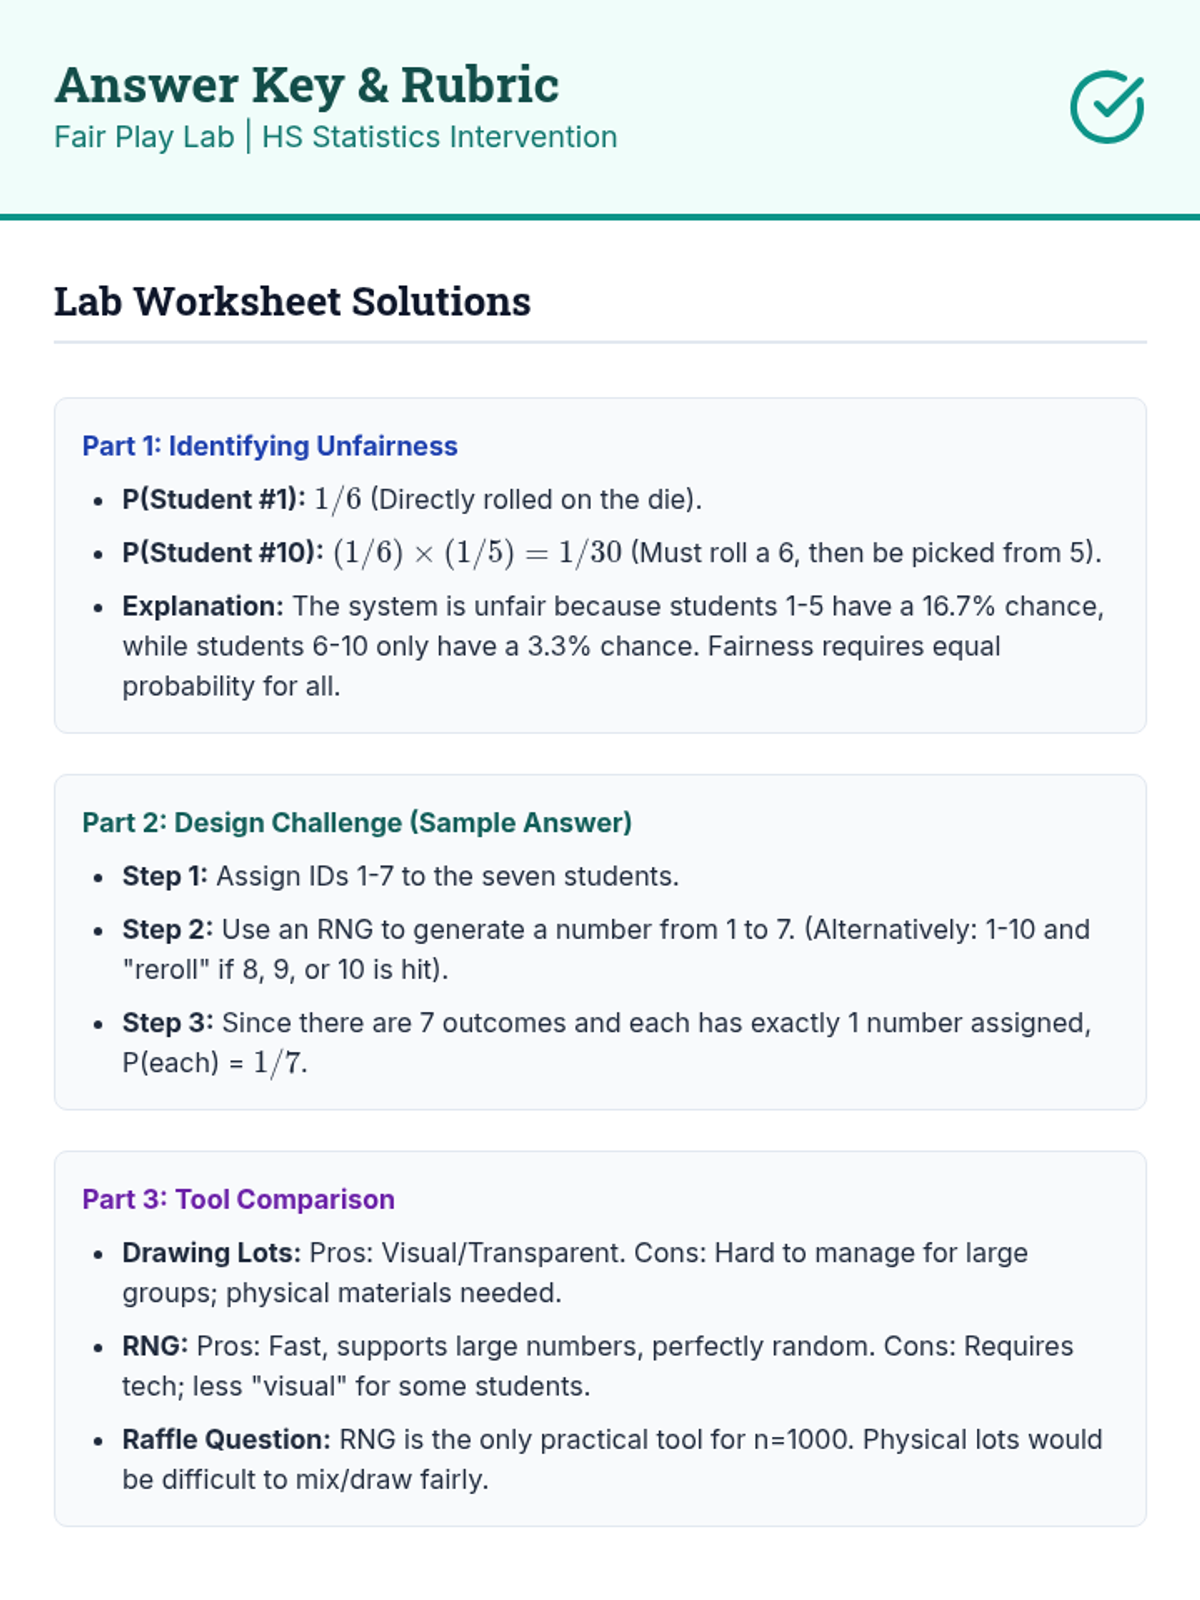
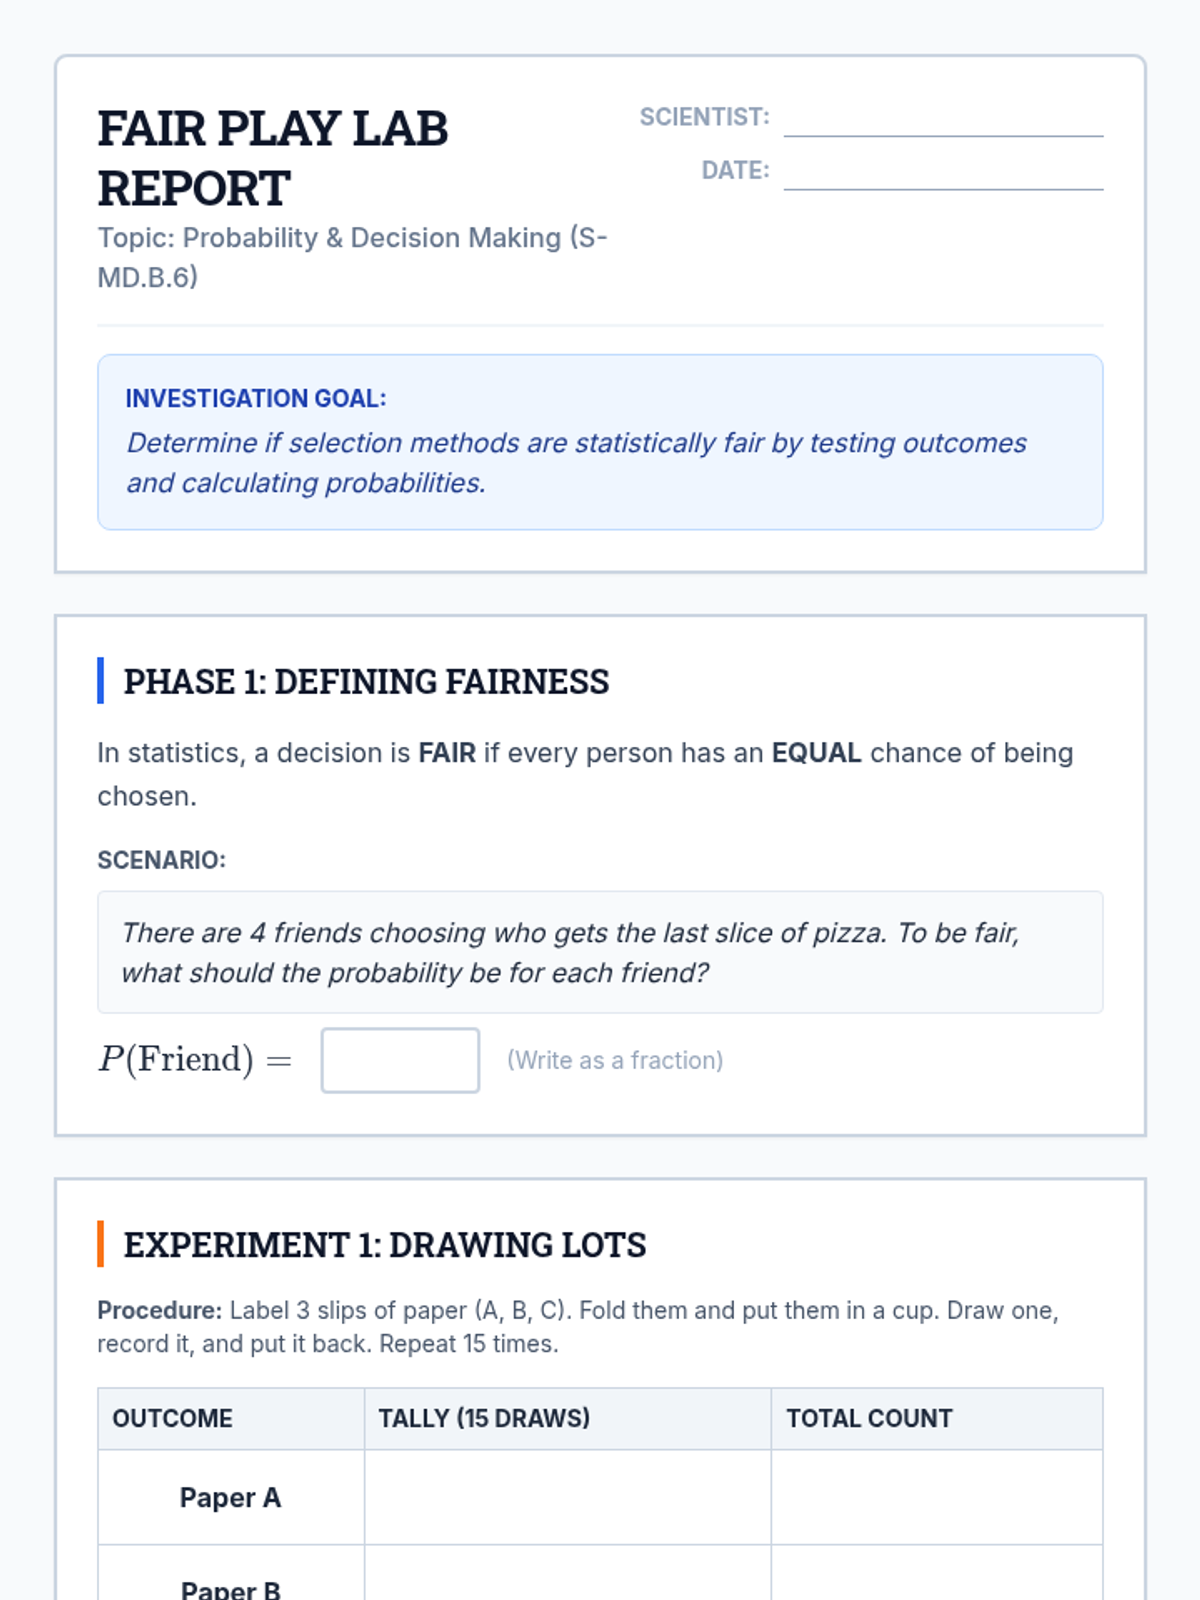
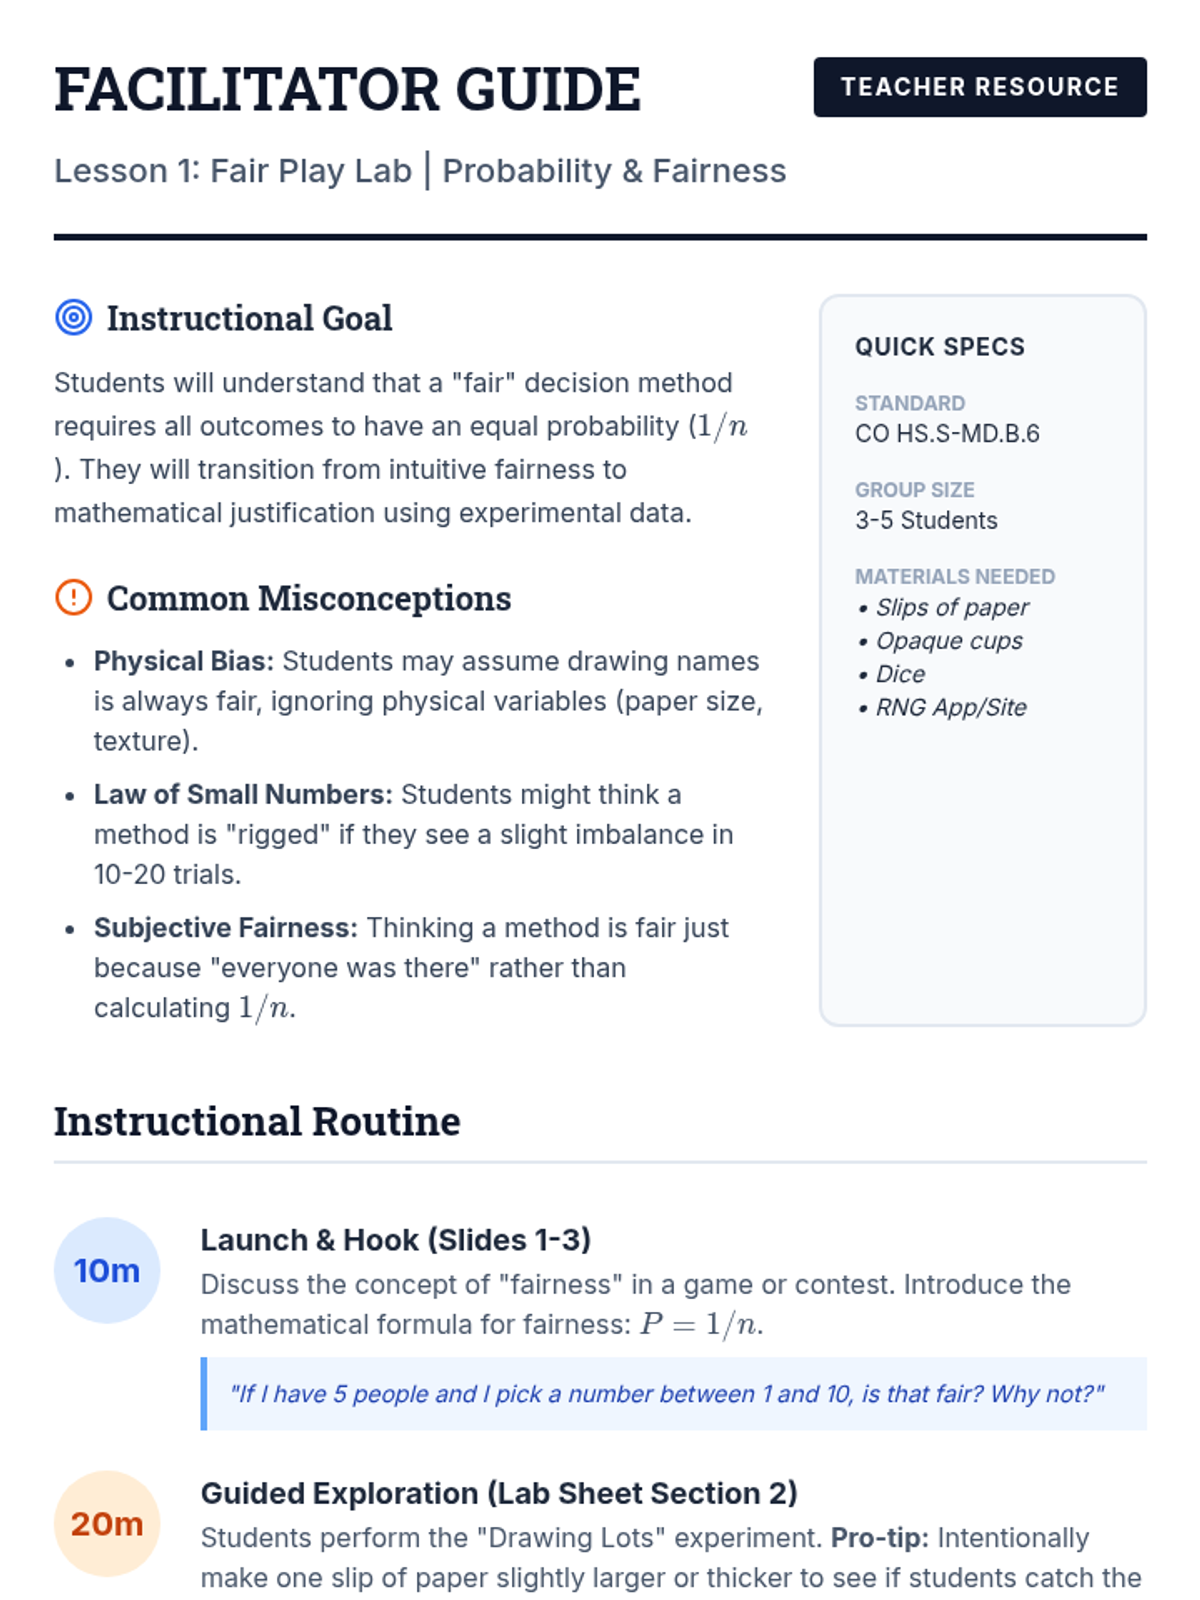
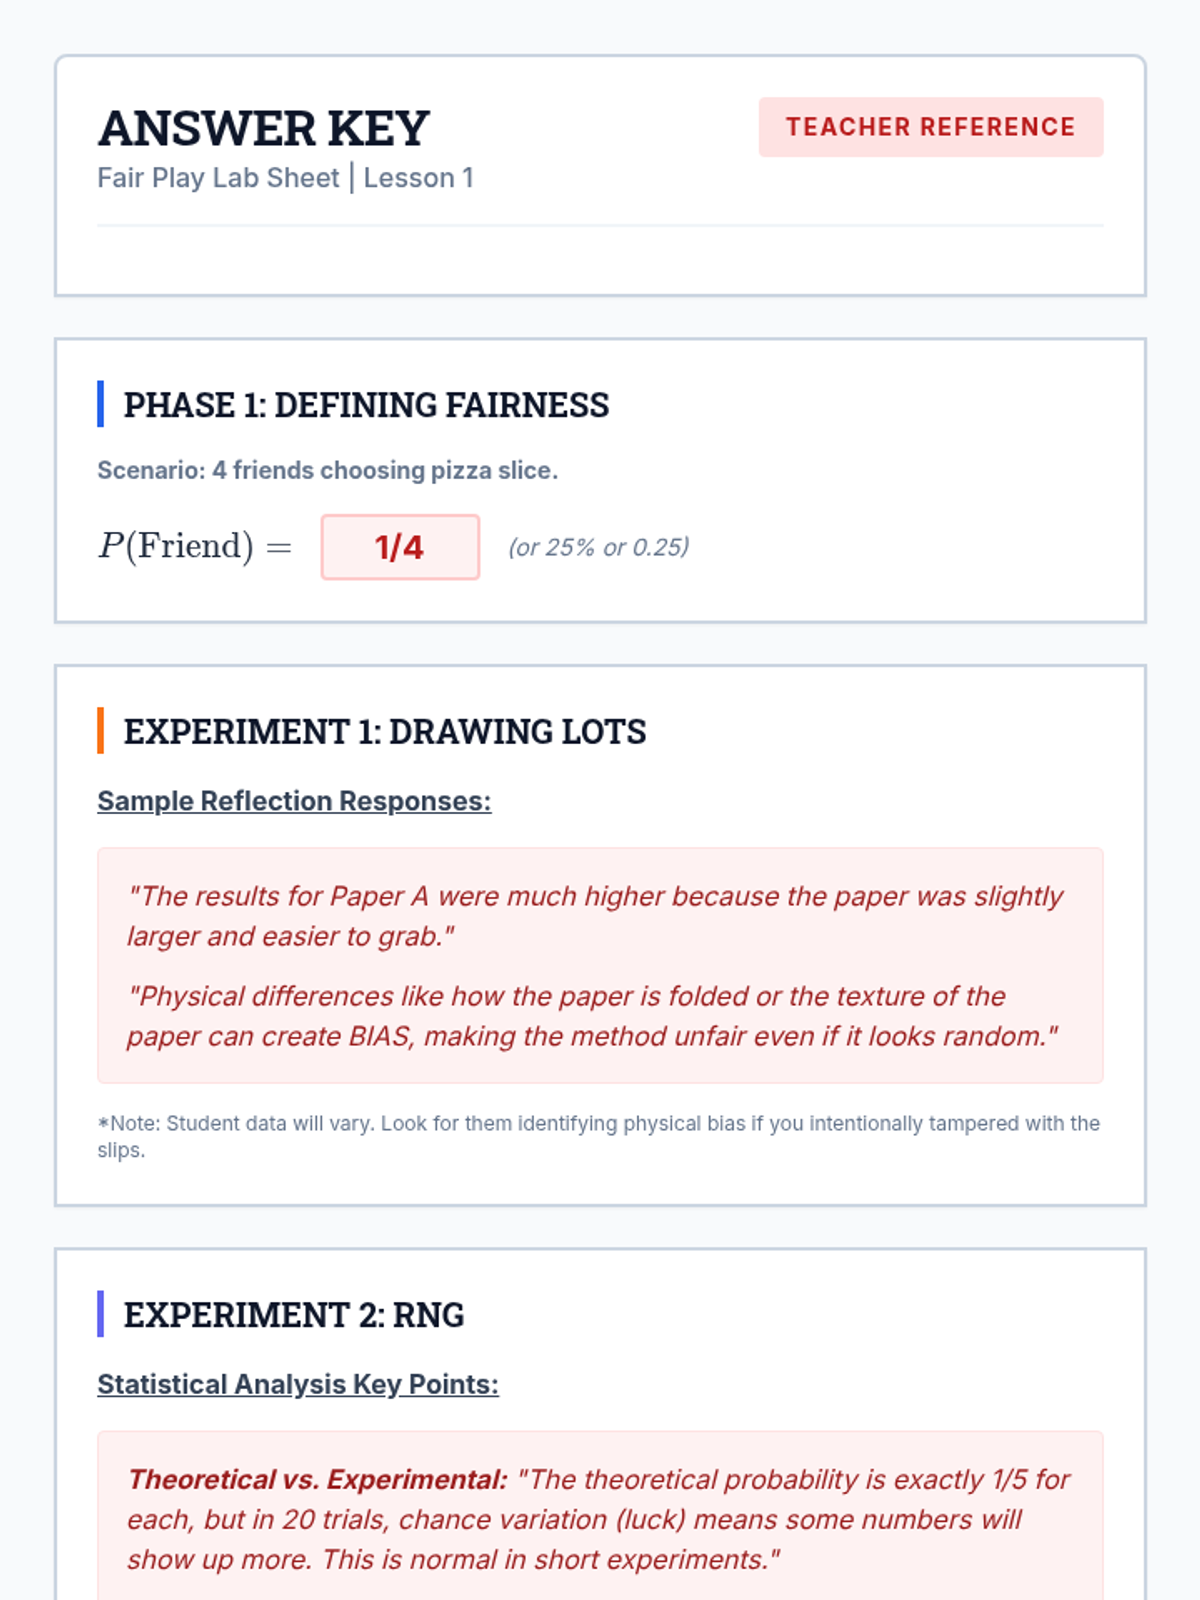
A Tier 2 intervention lesson focusing on using probability to design and evaluate fair decision-making procedures. Students learn to use tools like random number generators and drawing lots to ensure equal opportunity.
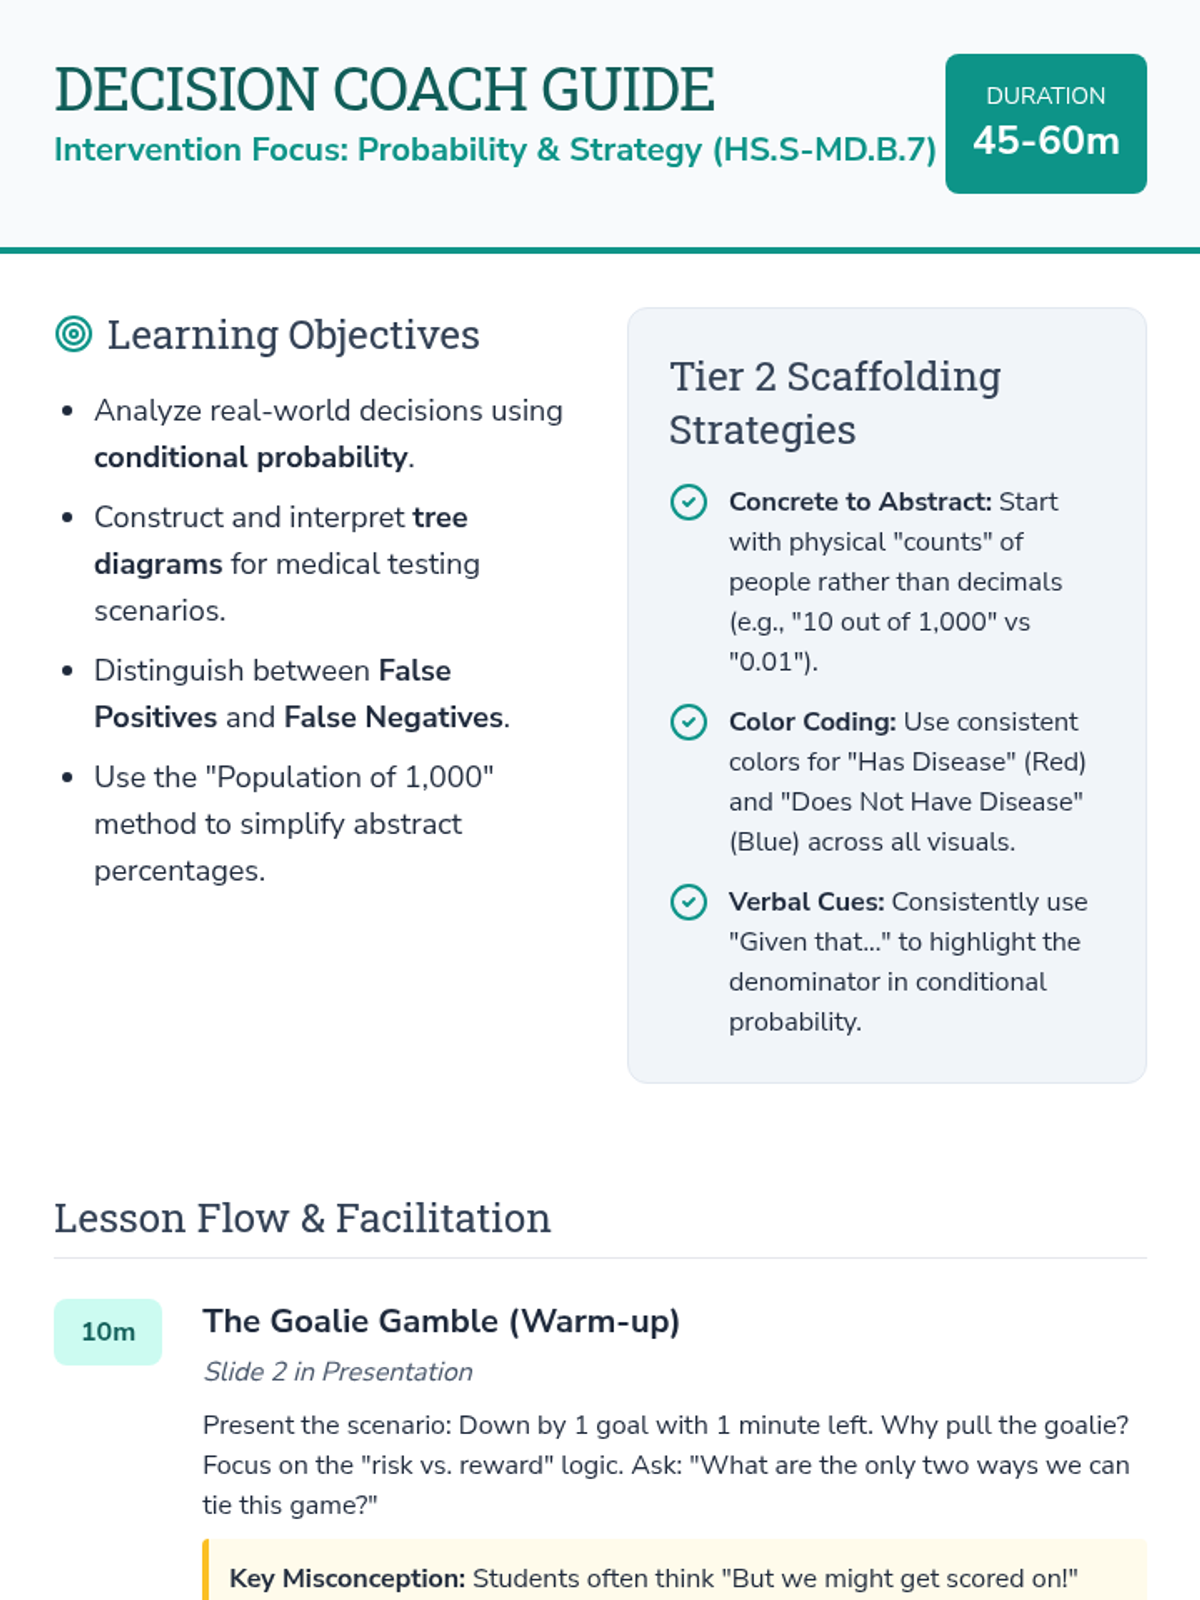
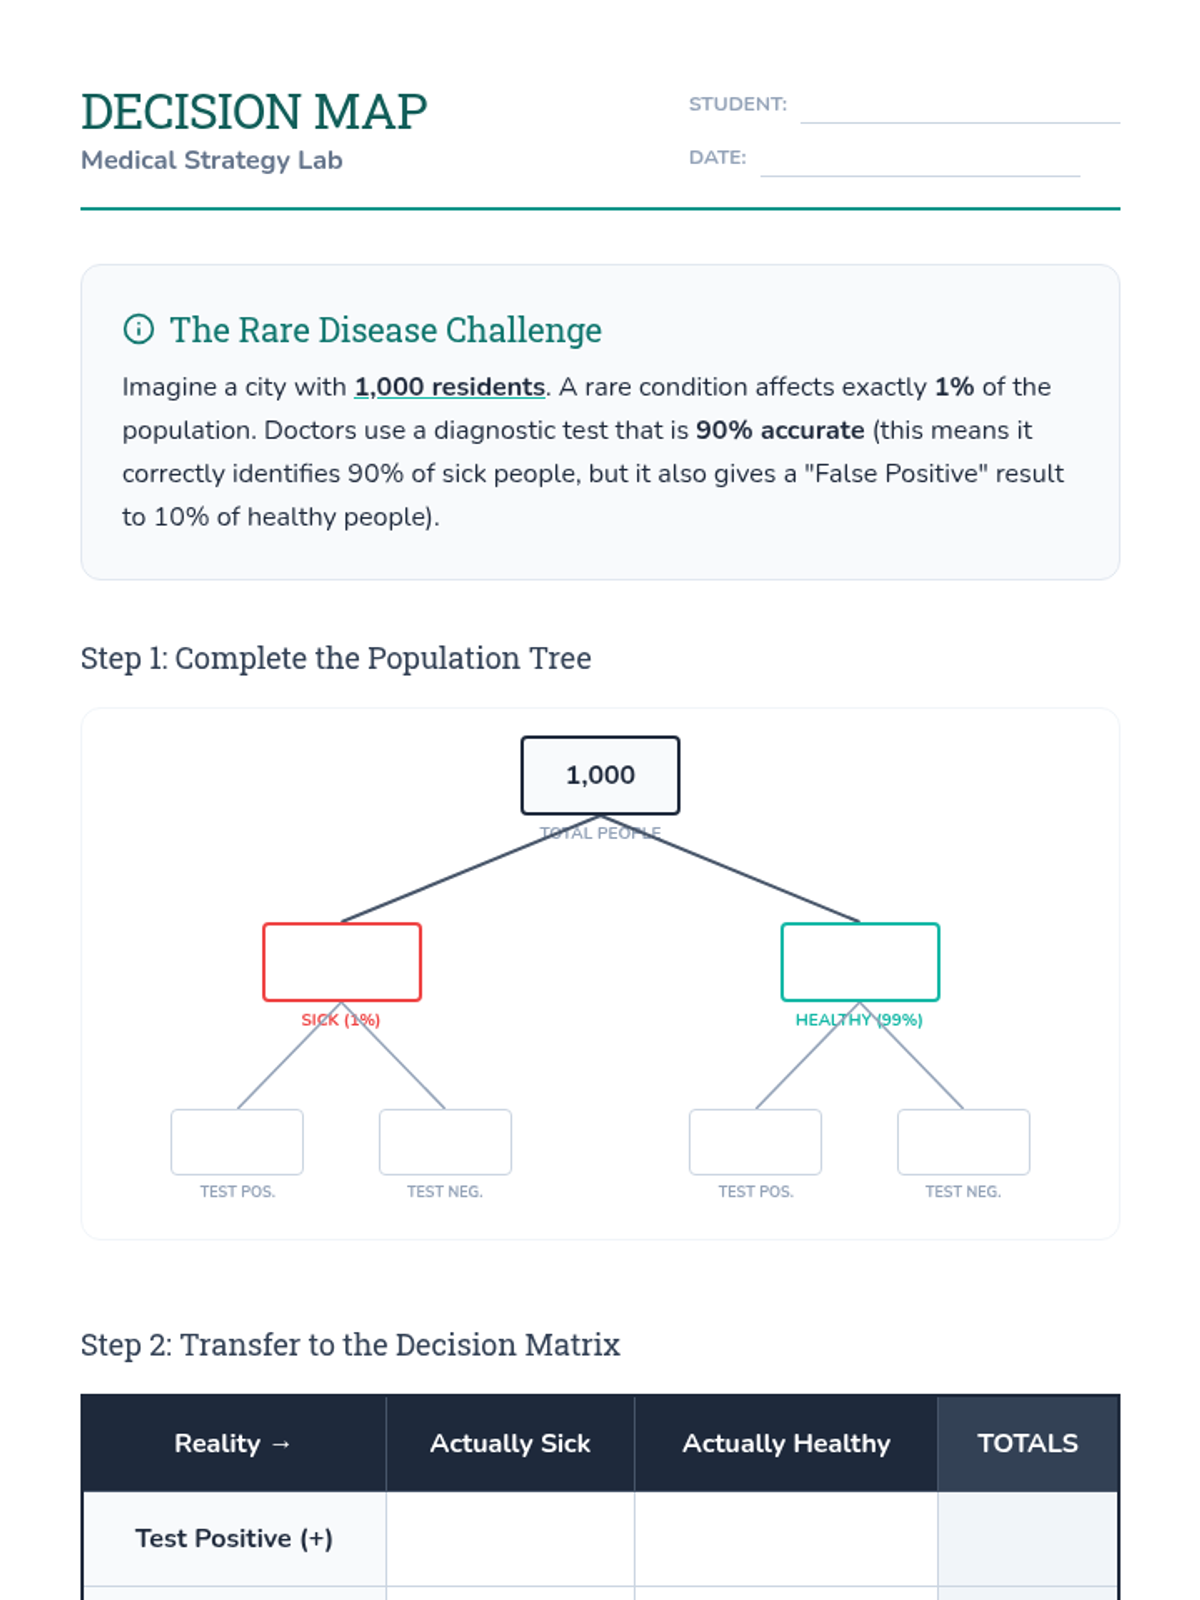
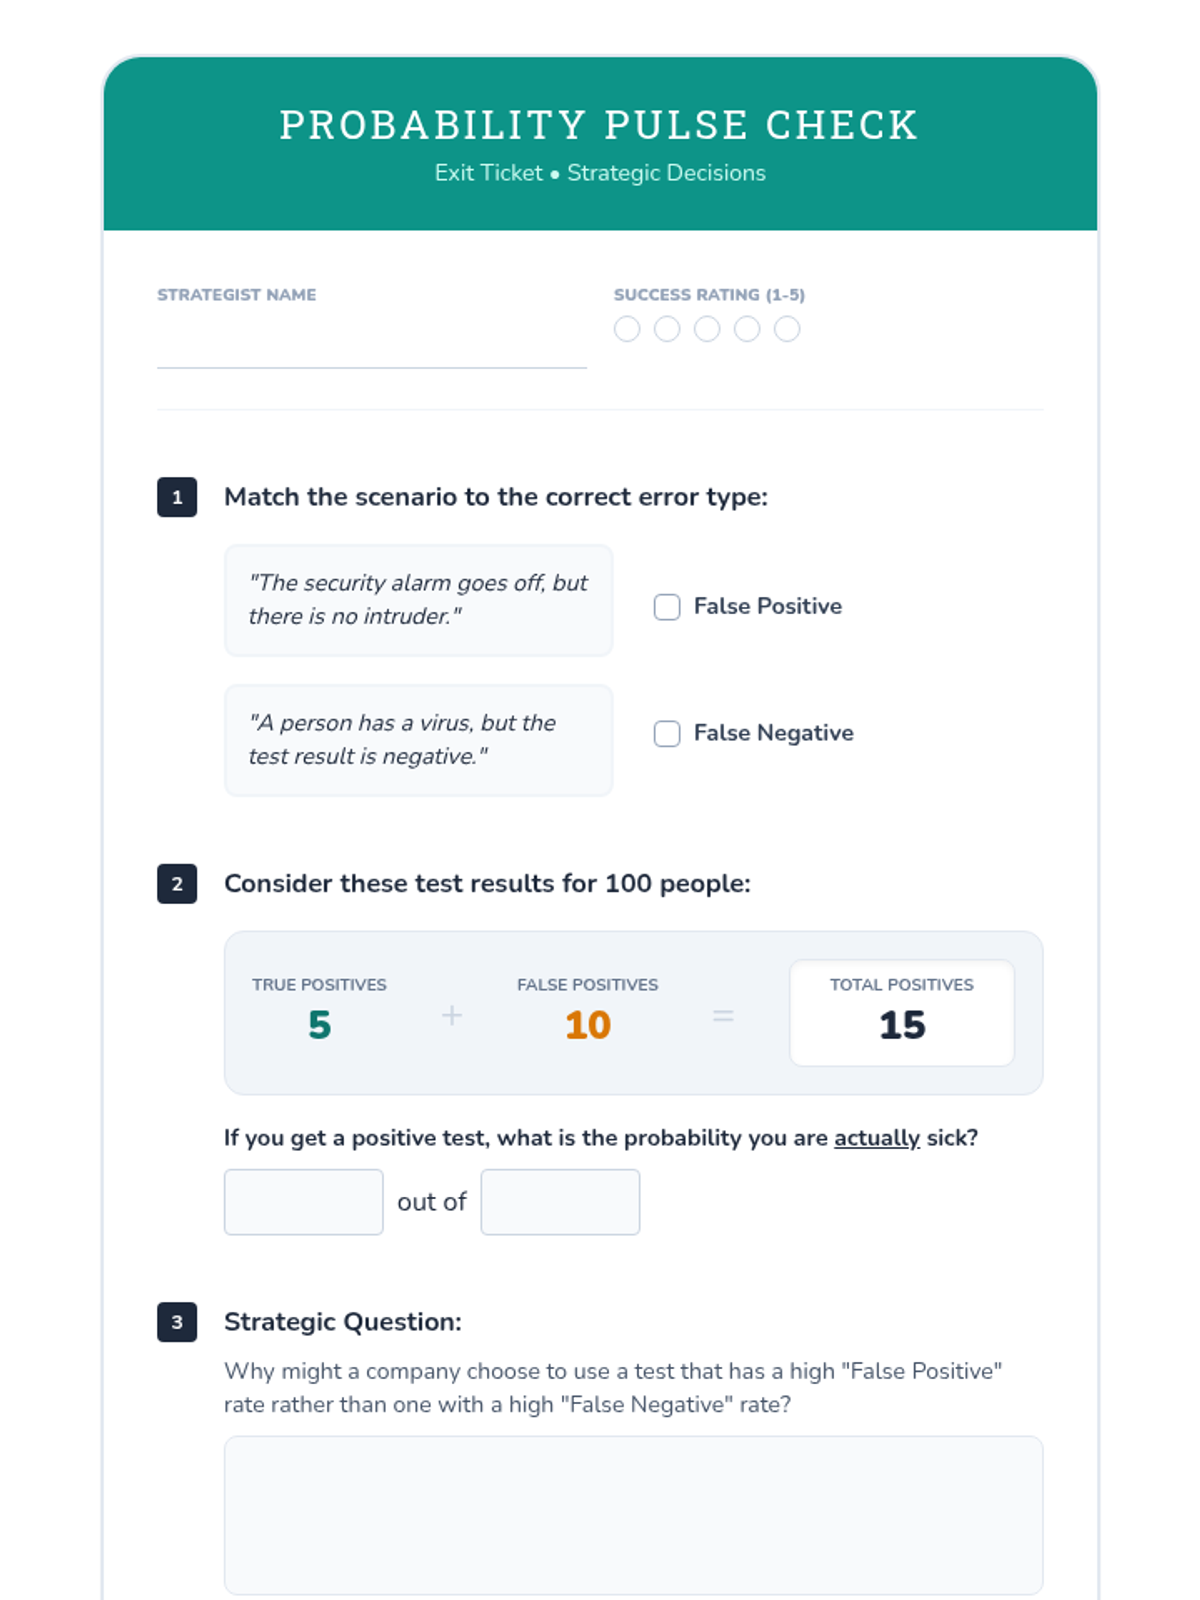
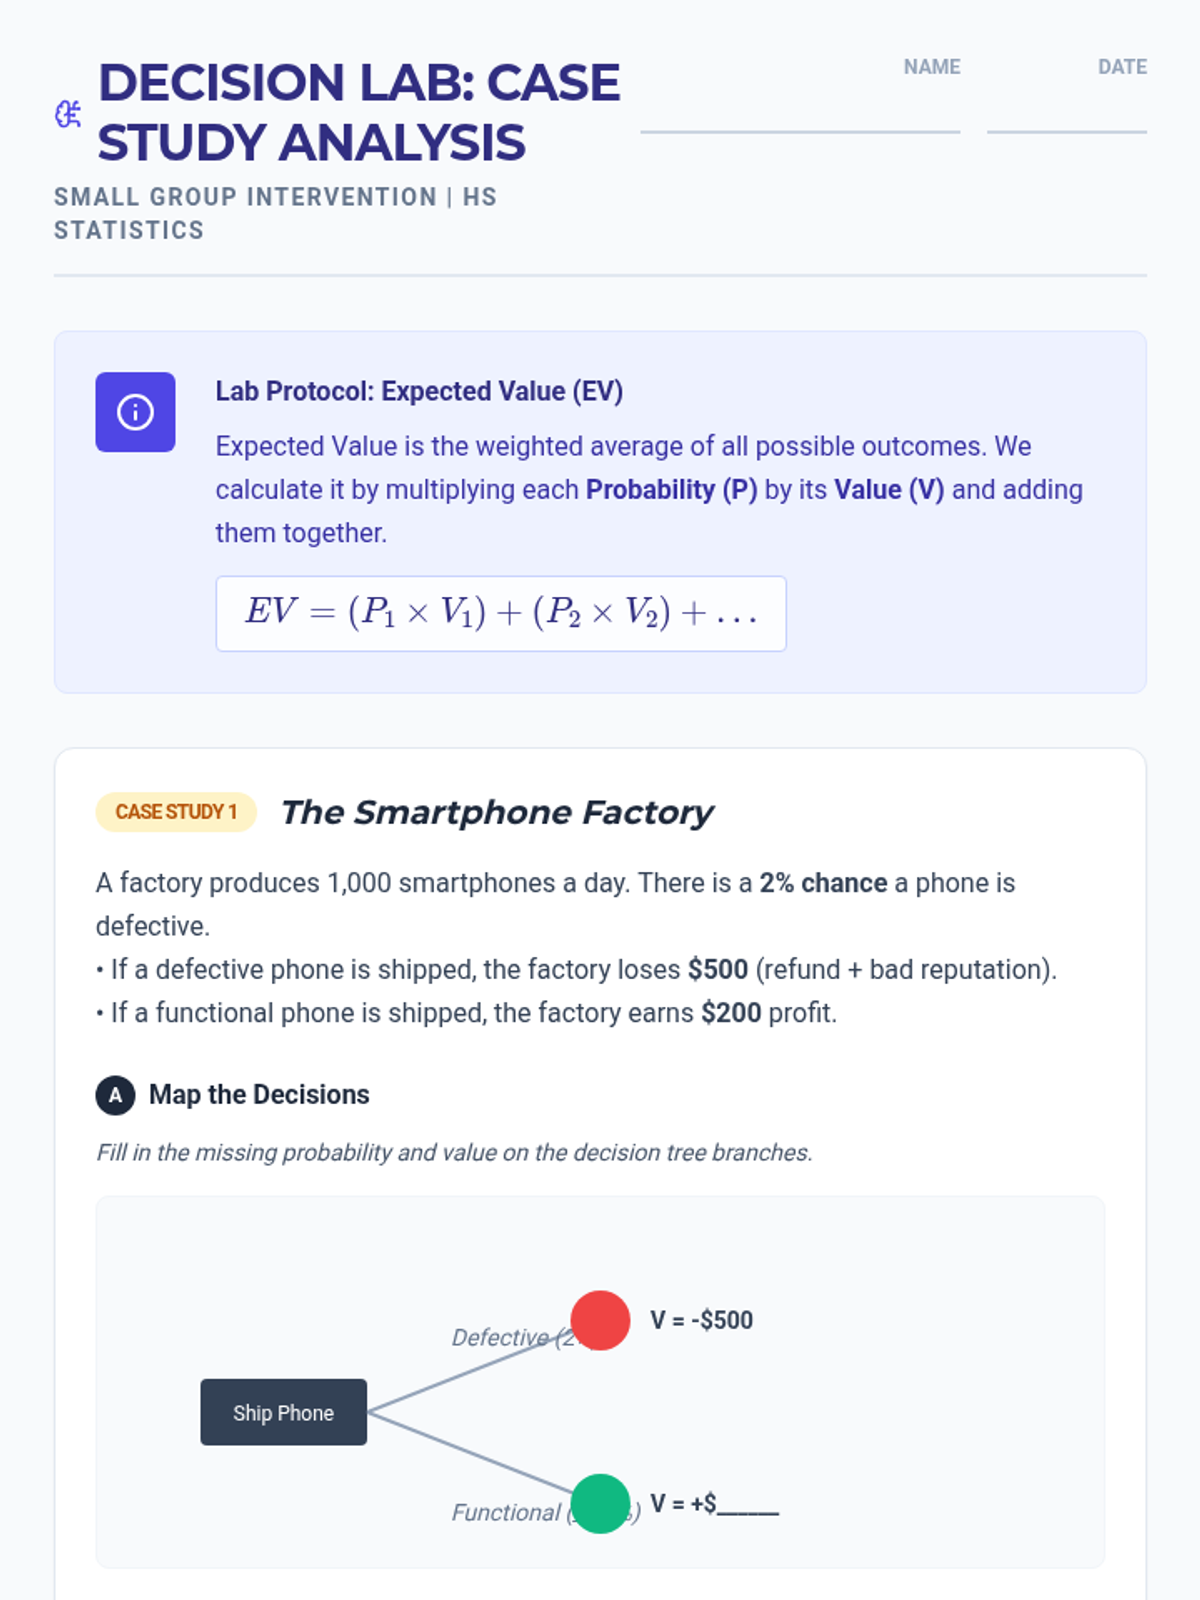
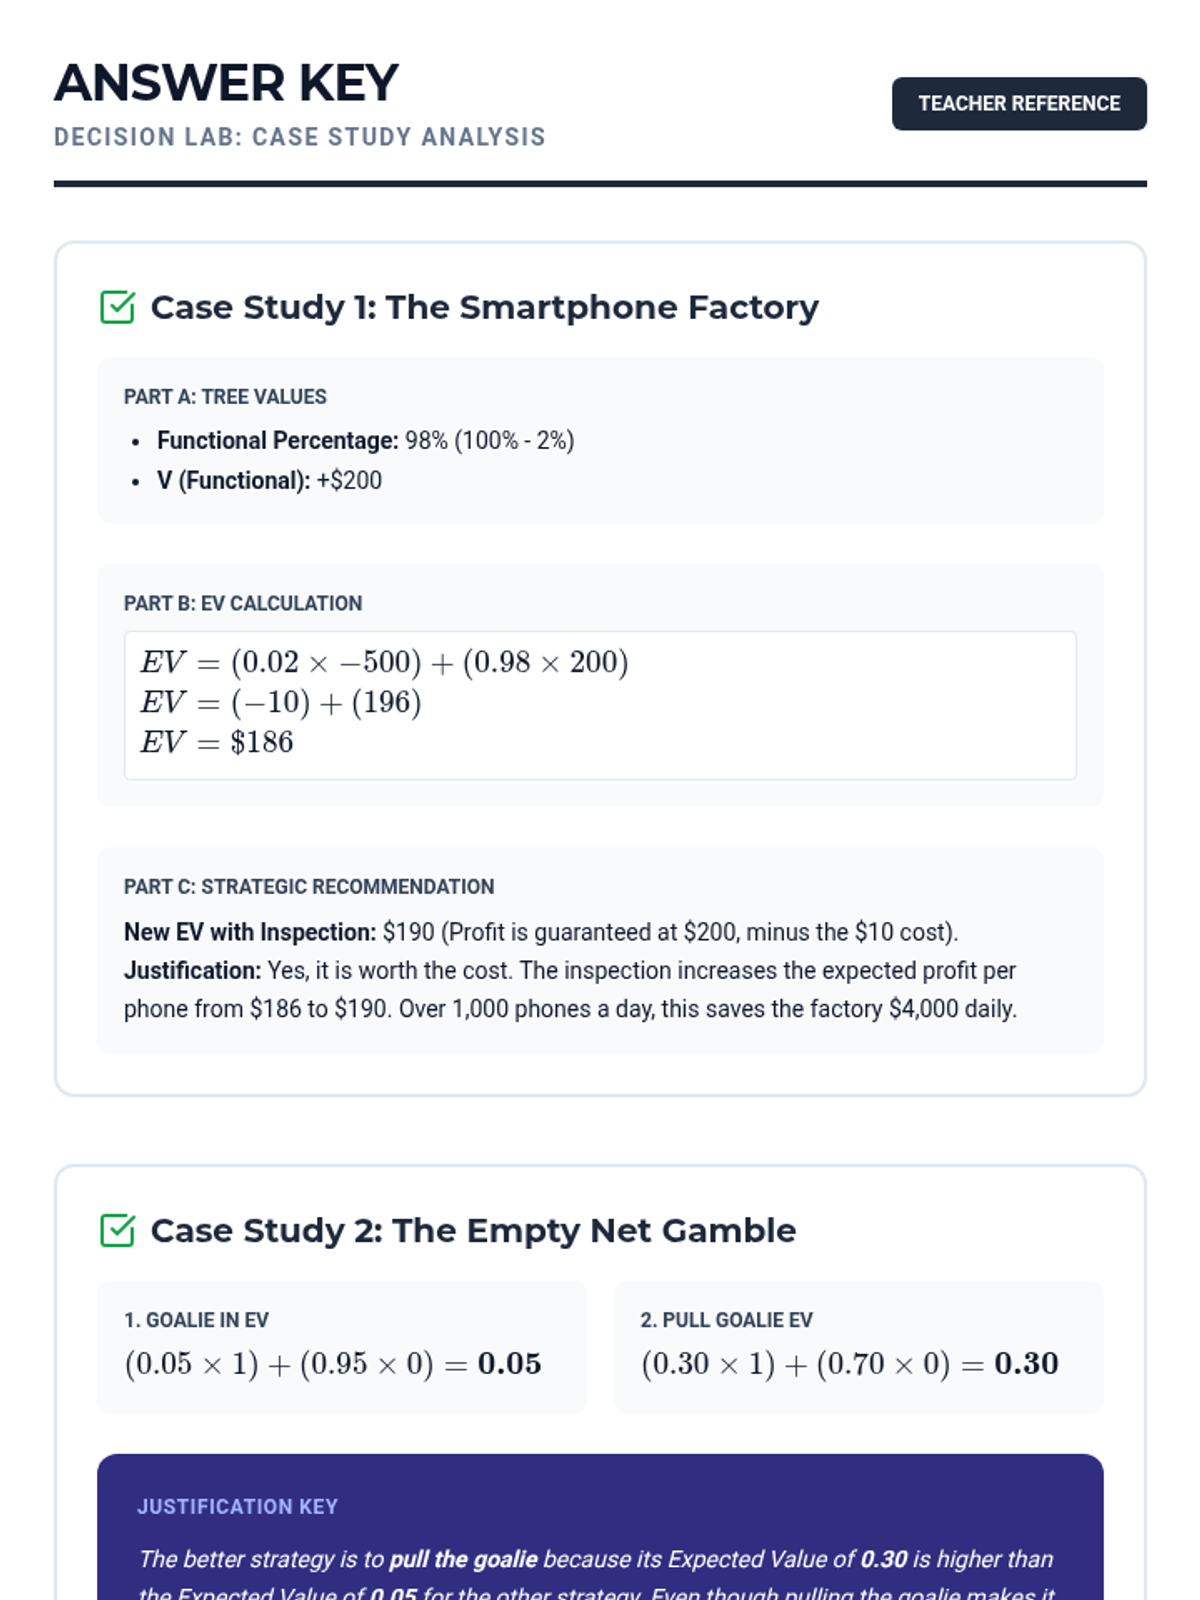
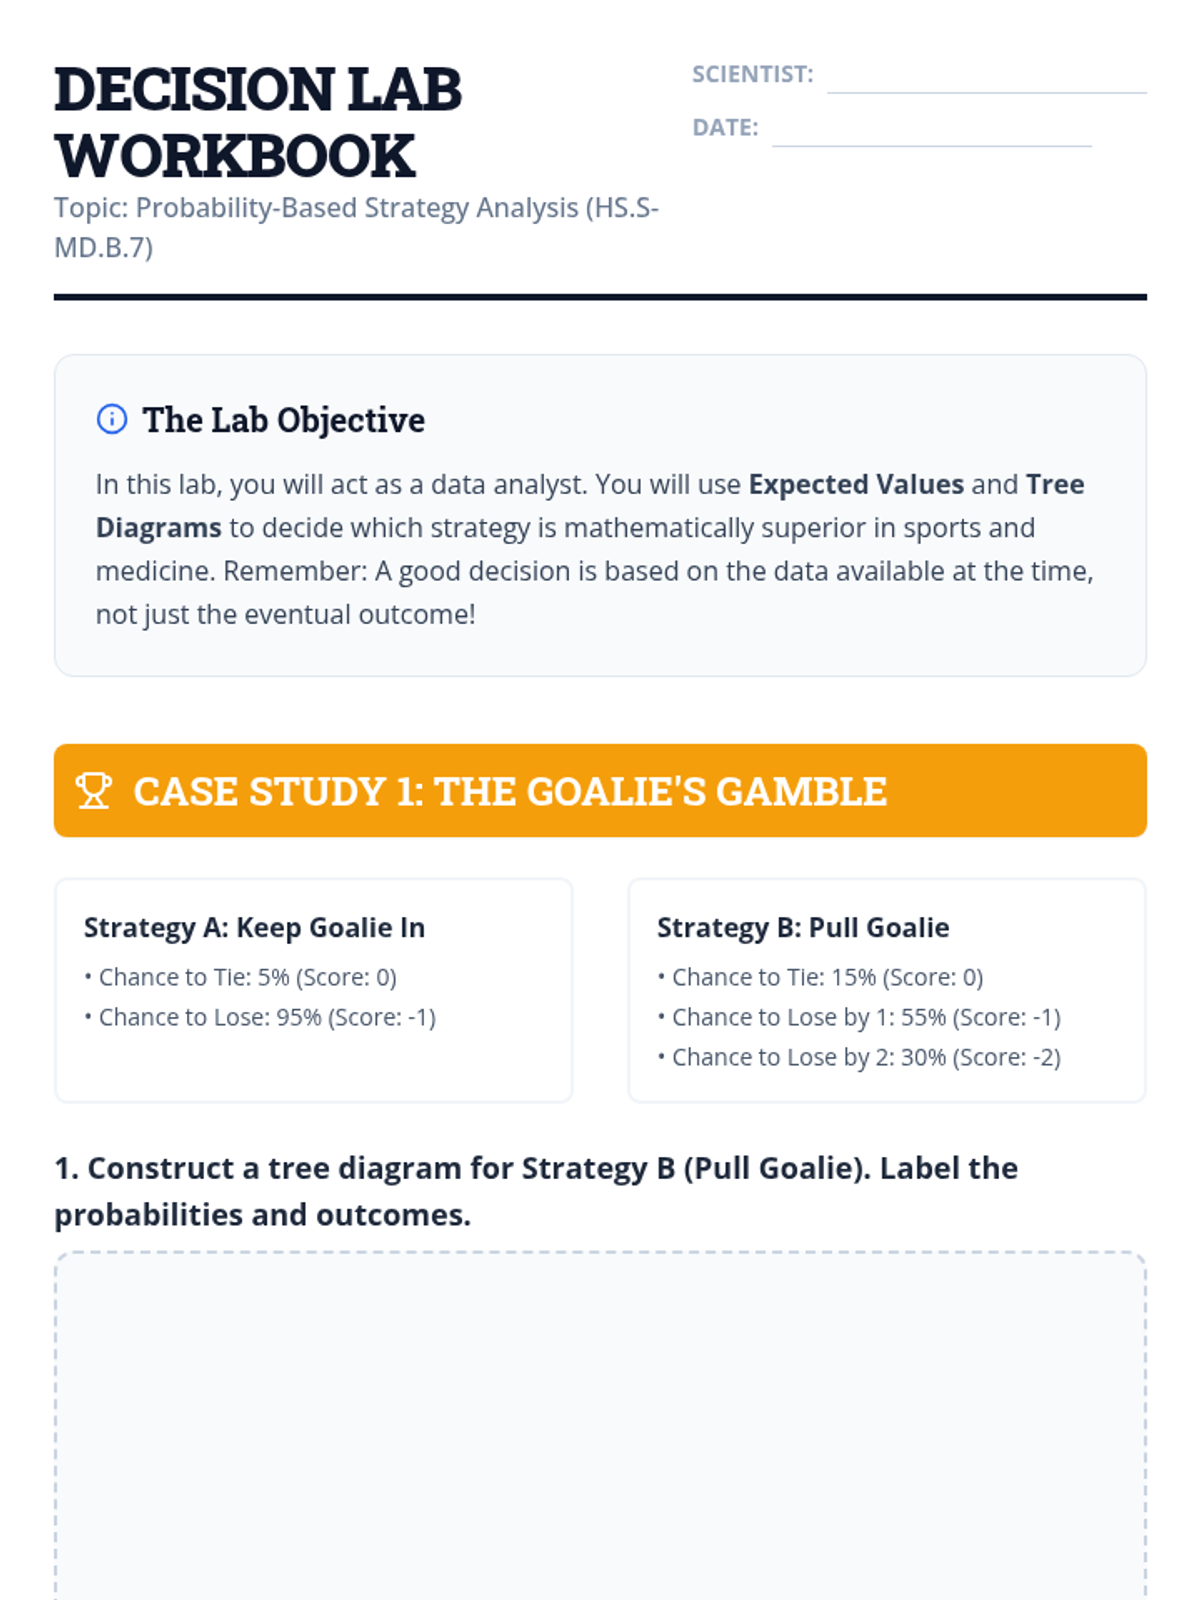
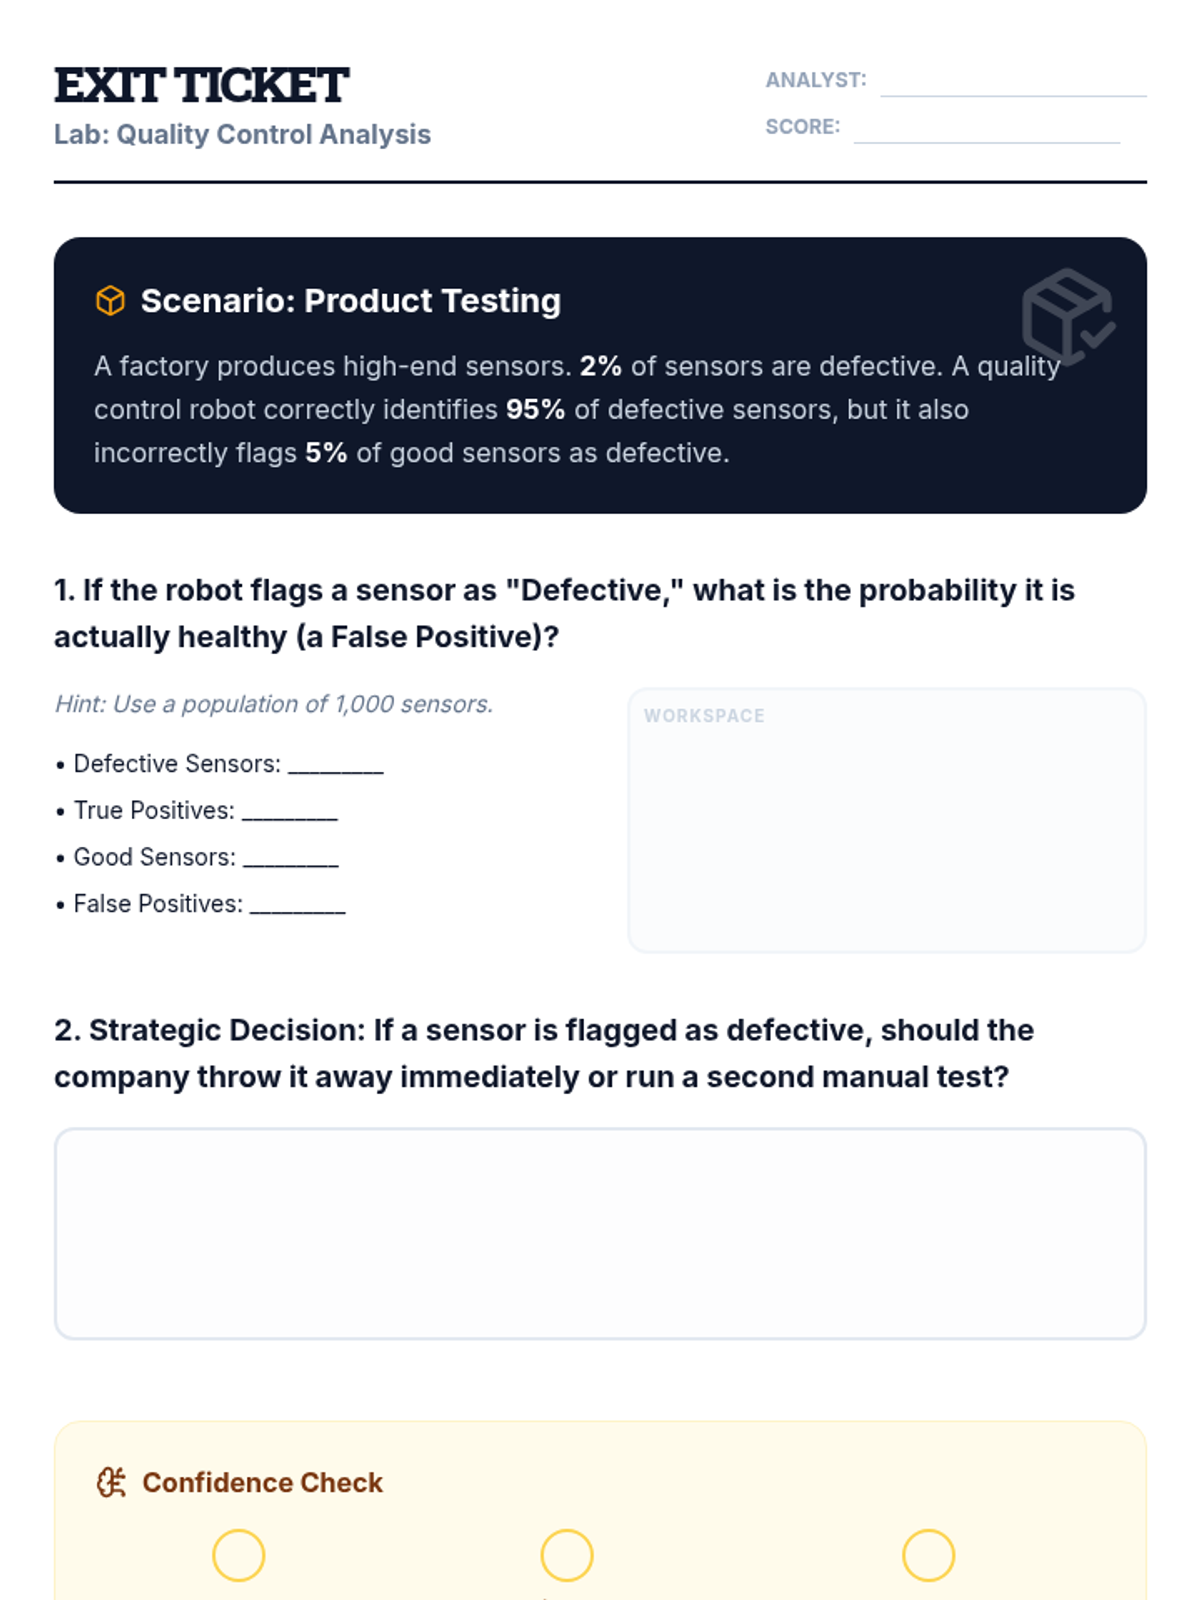
A scaffolded intervention lesson where students analyze the effectiveness of medical tests and strategic decisions using tree diagrams and expected value. Focused on High School Statistics standard HS.S-MD.B.7 with a heavy emphasis on visual logic and false positive/negative reasoning.
A scaffolded lesson where students test various random selection methods (drawing lots, dice, RNG) to determine if they are fair and use probability to justify their findings.
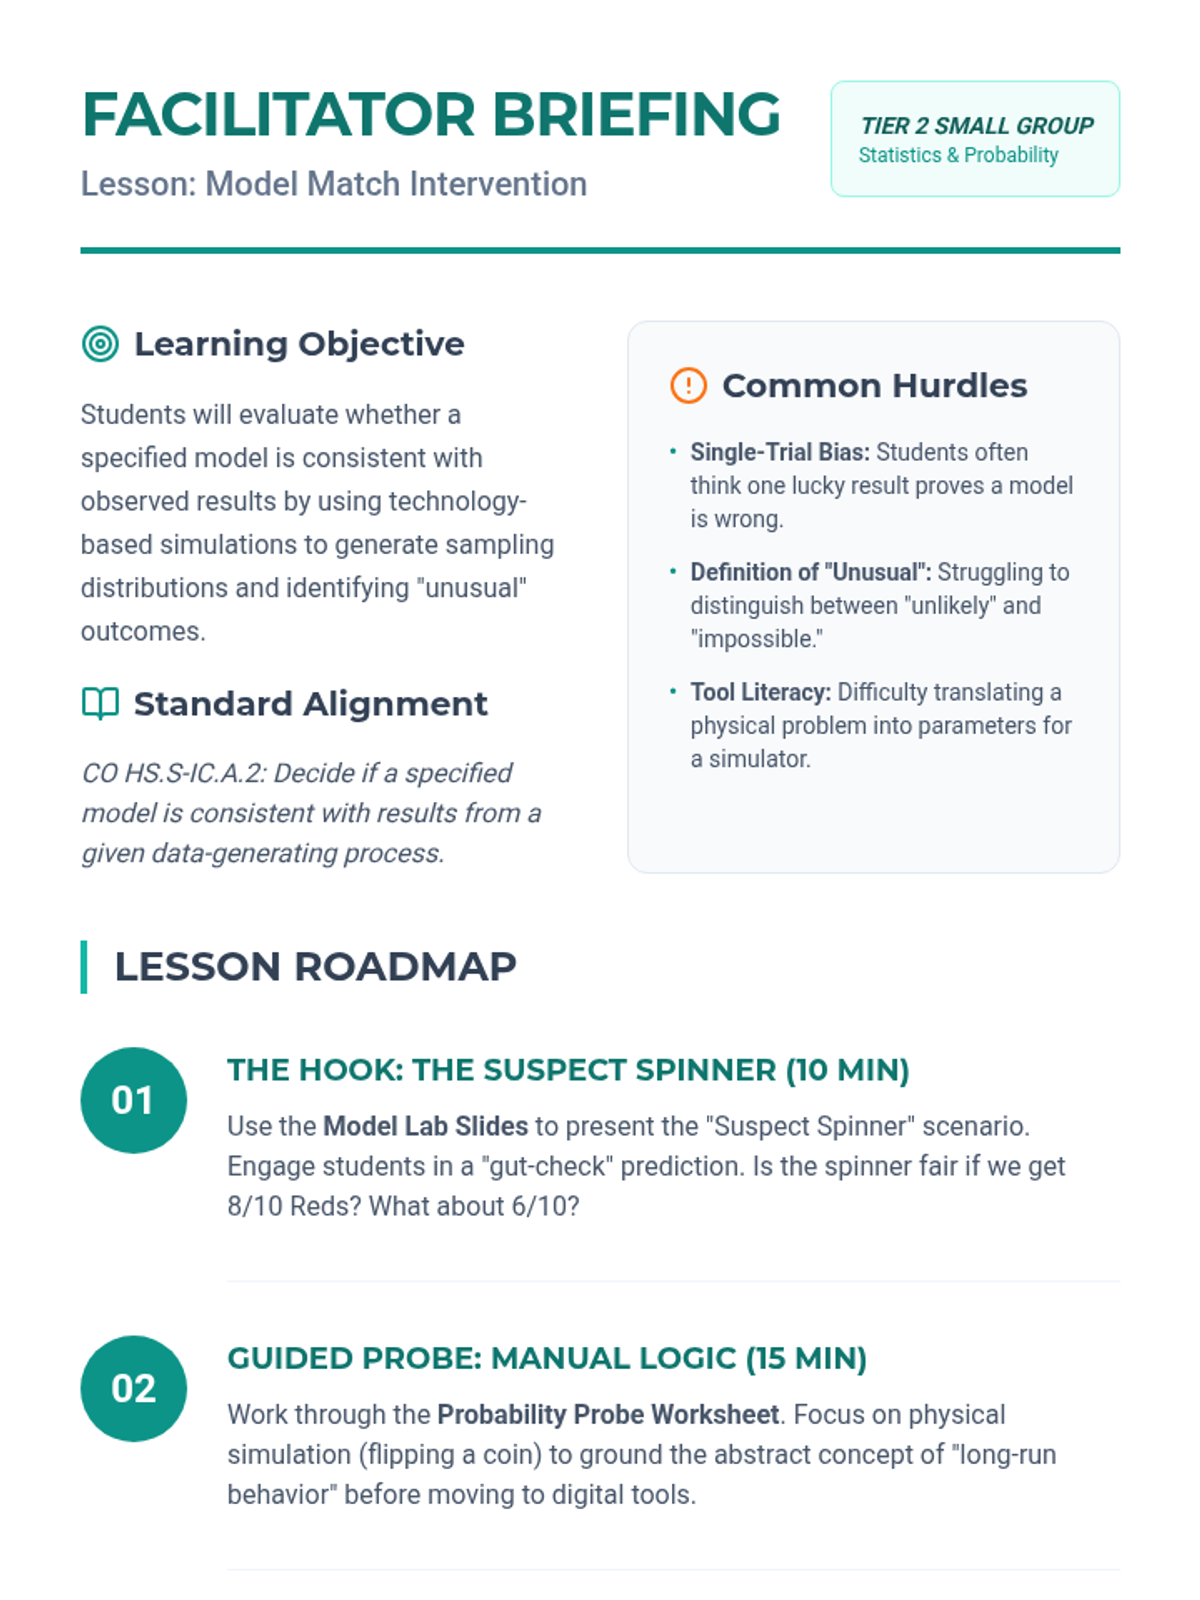
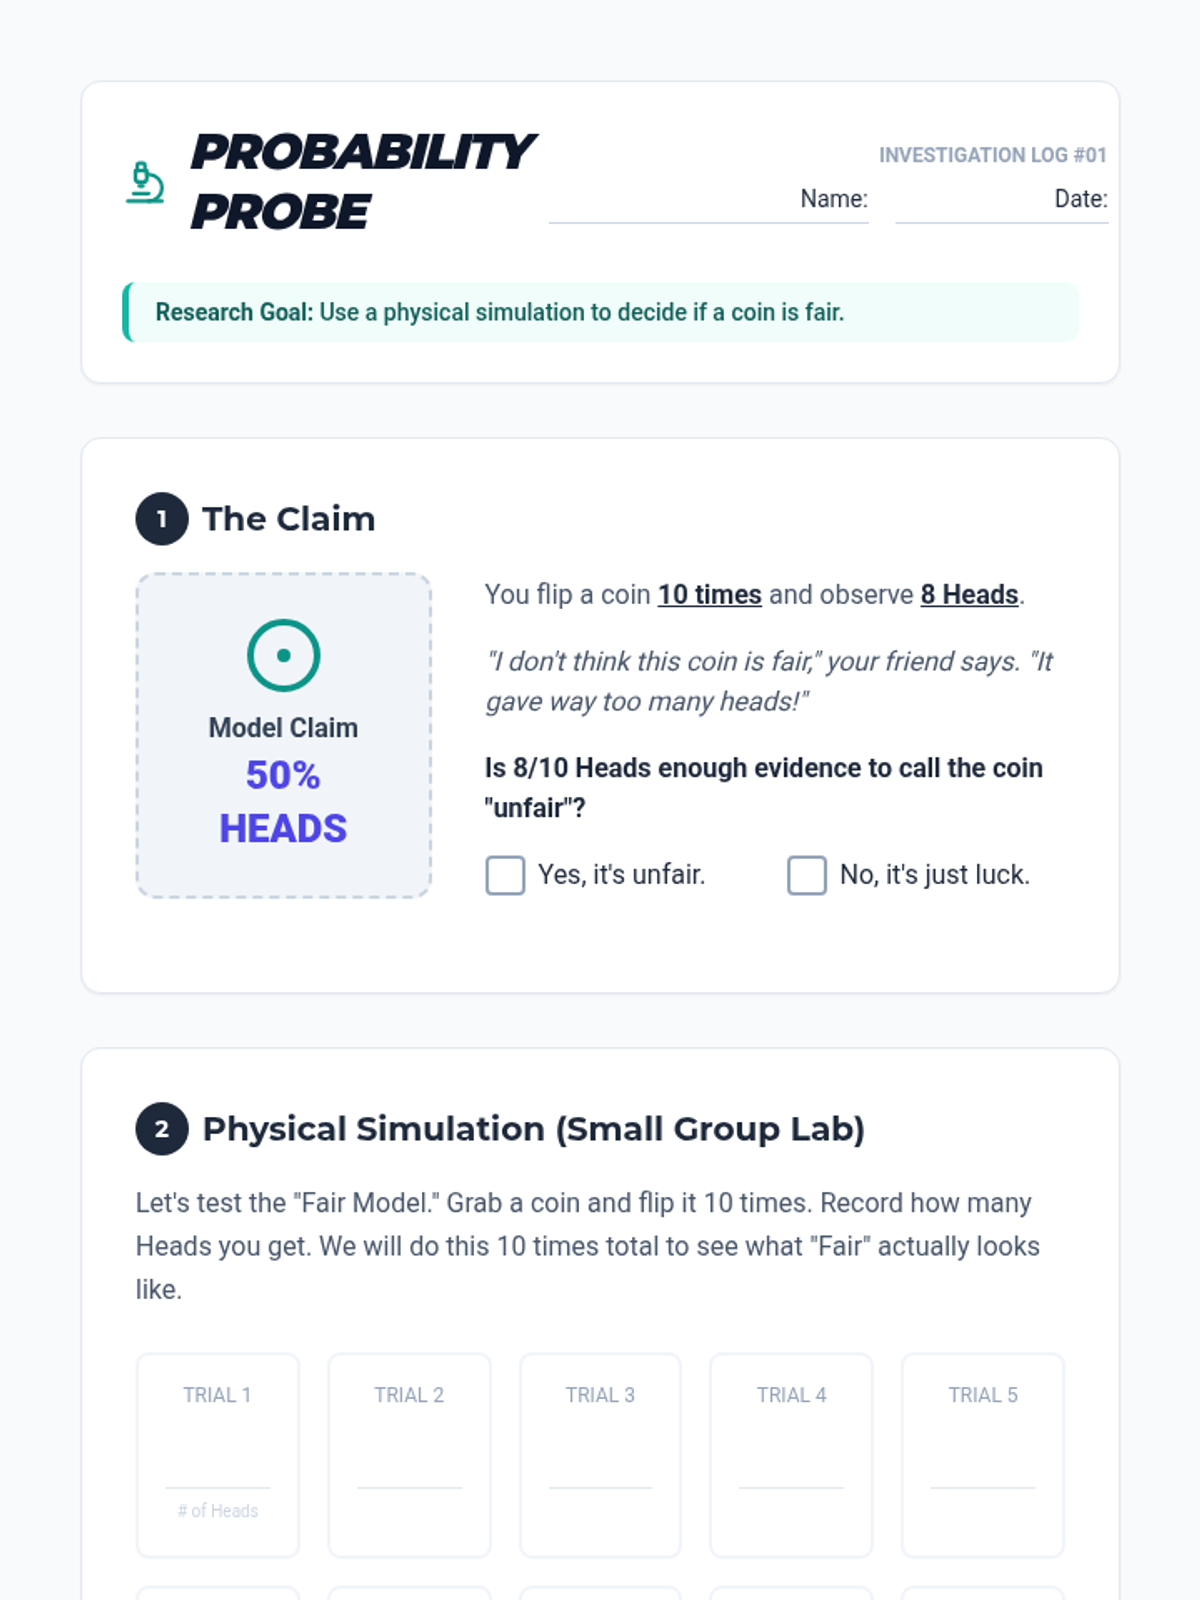
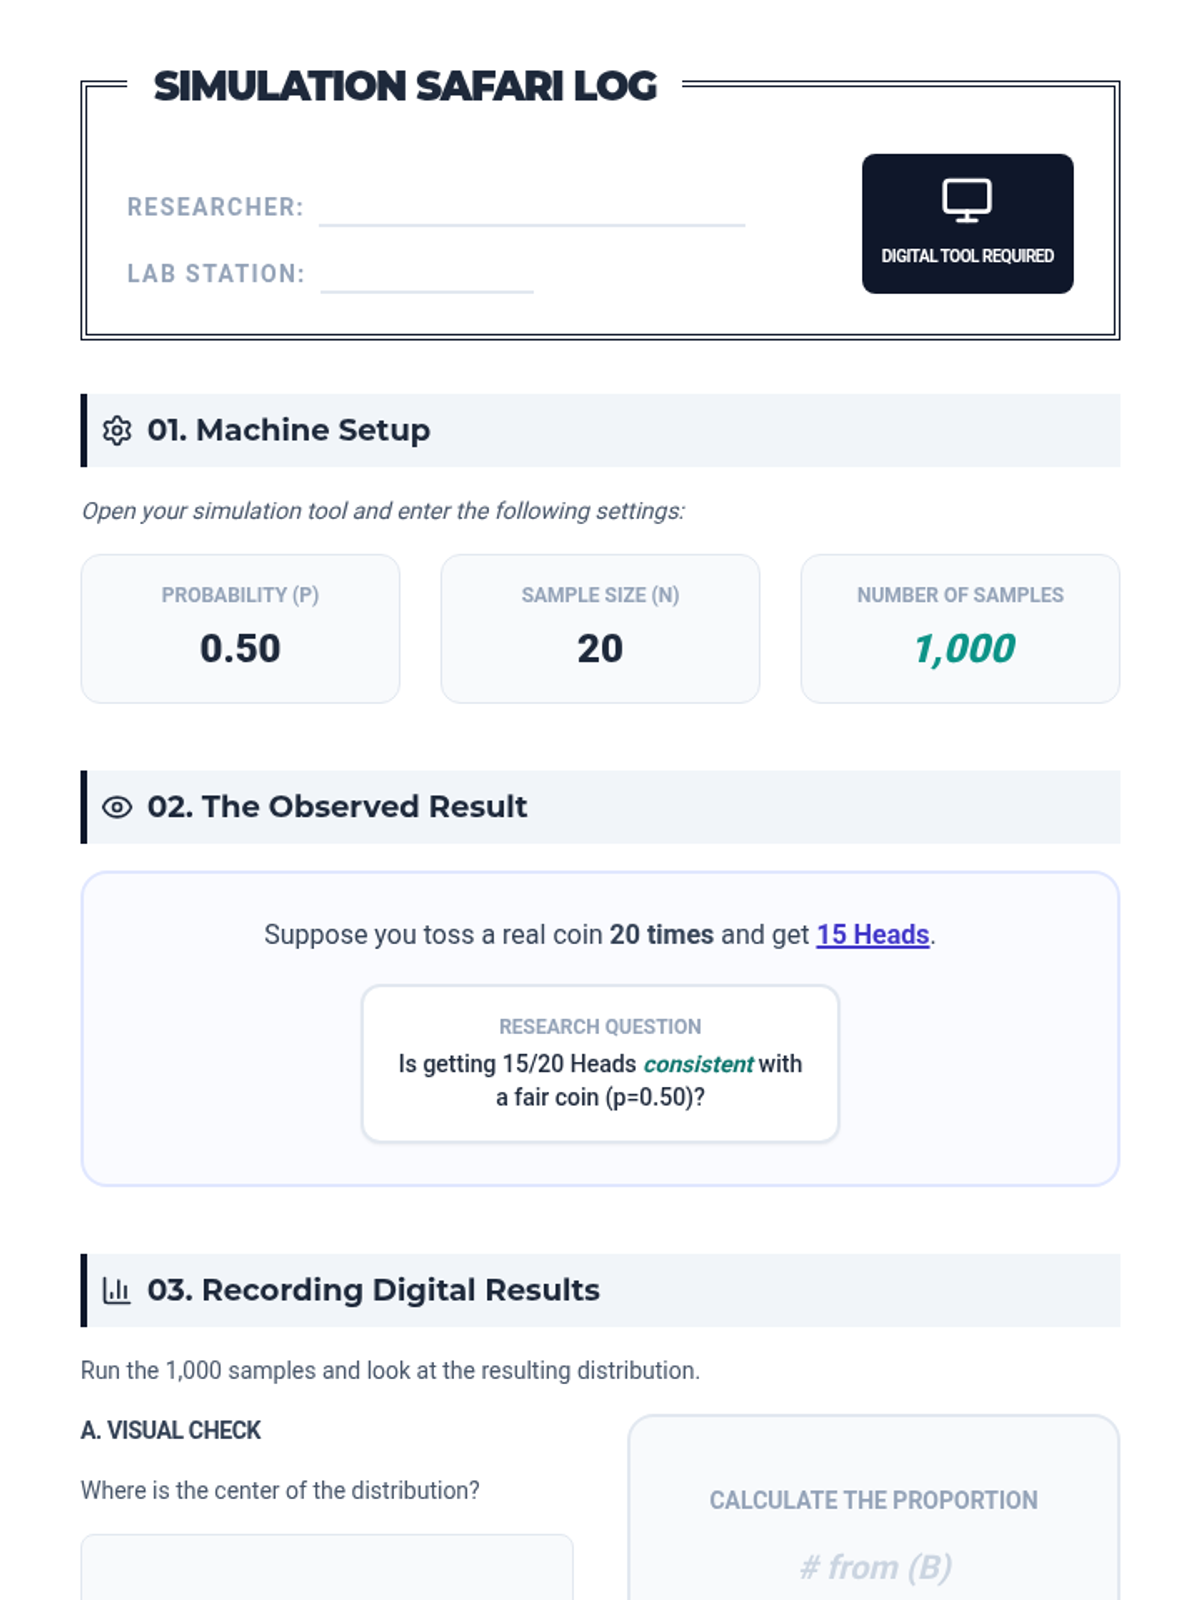
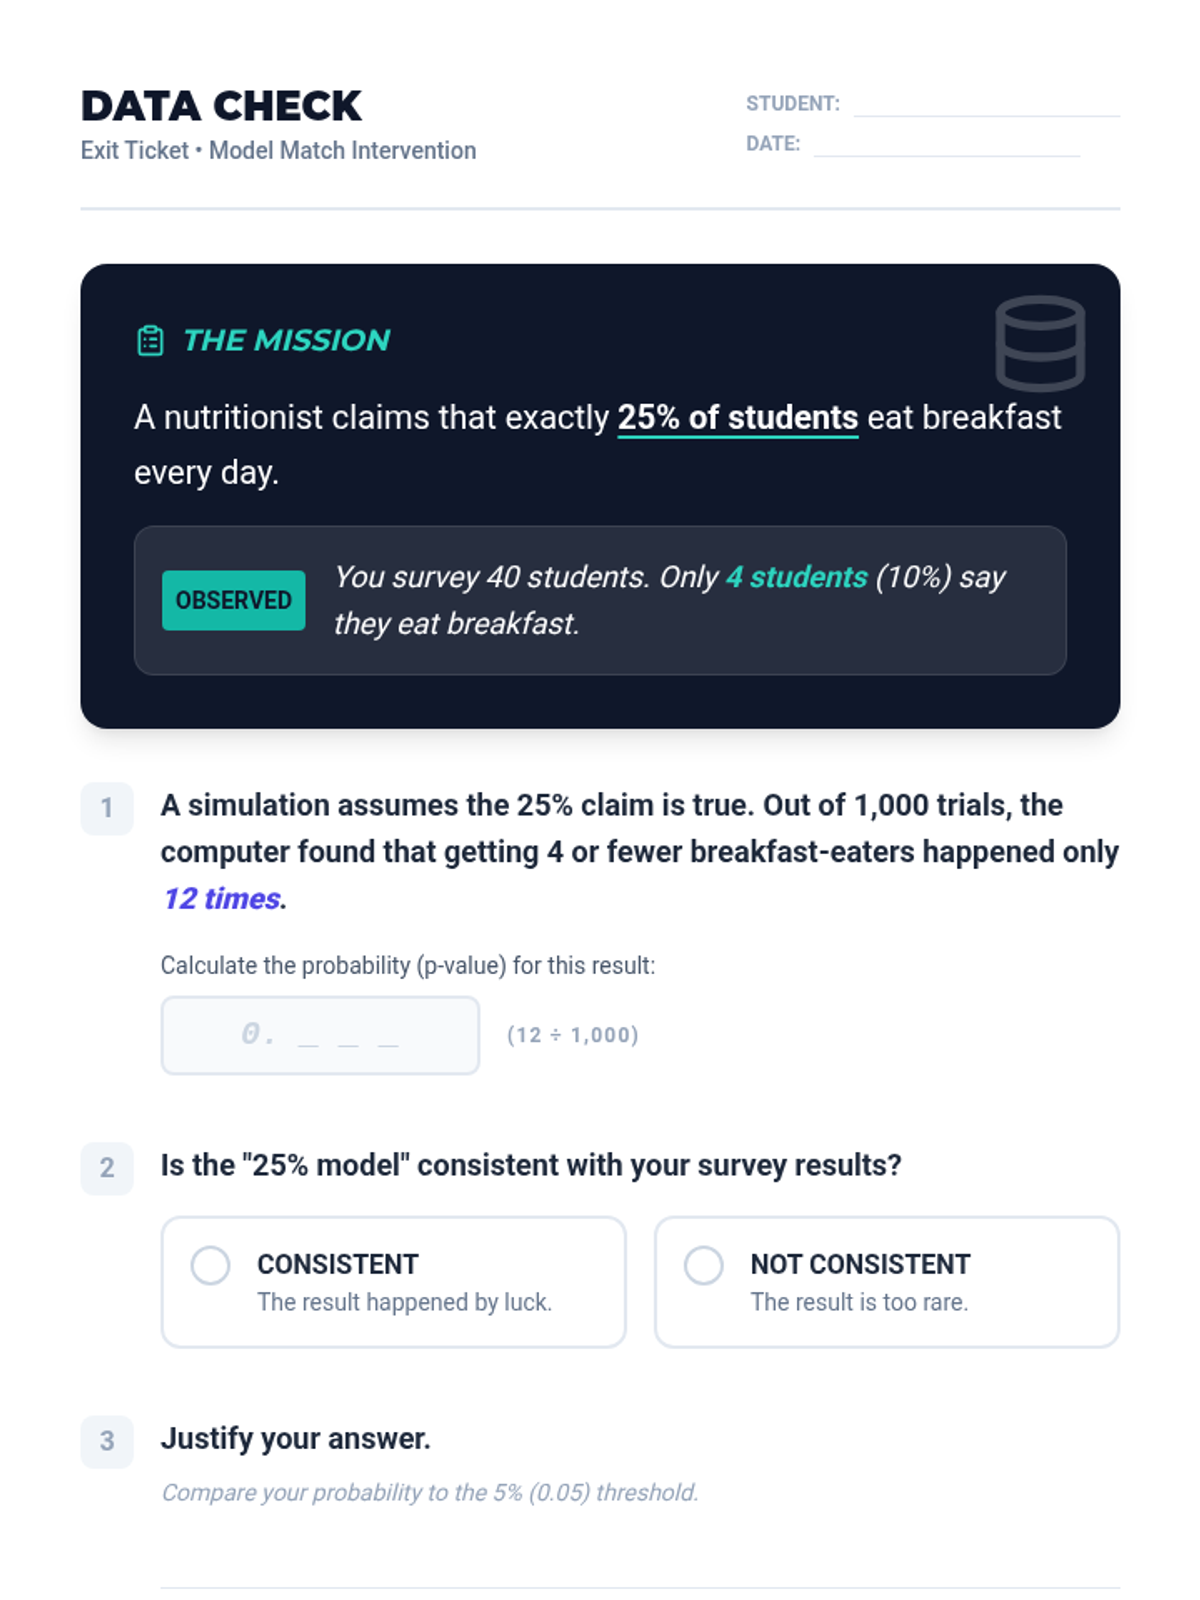
A targeted Tier 2 intervention lesson focusing on evaluating model consistency through simulations, designed for small group support in High School Statistics.
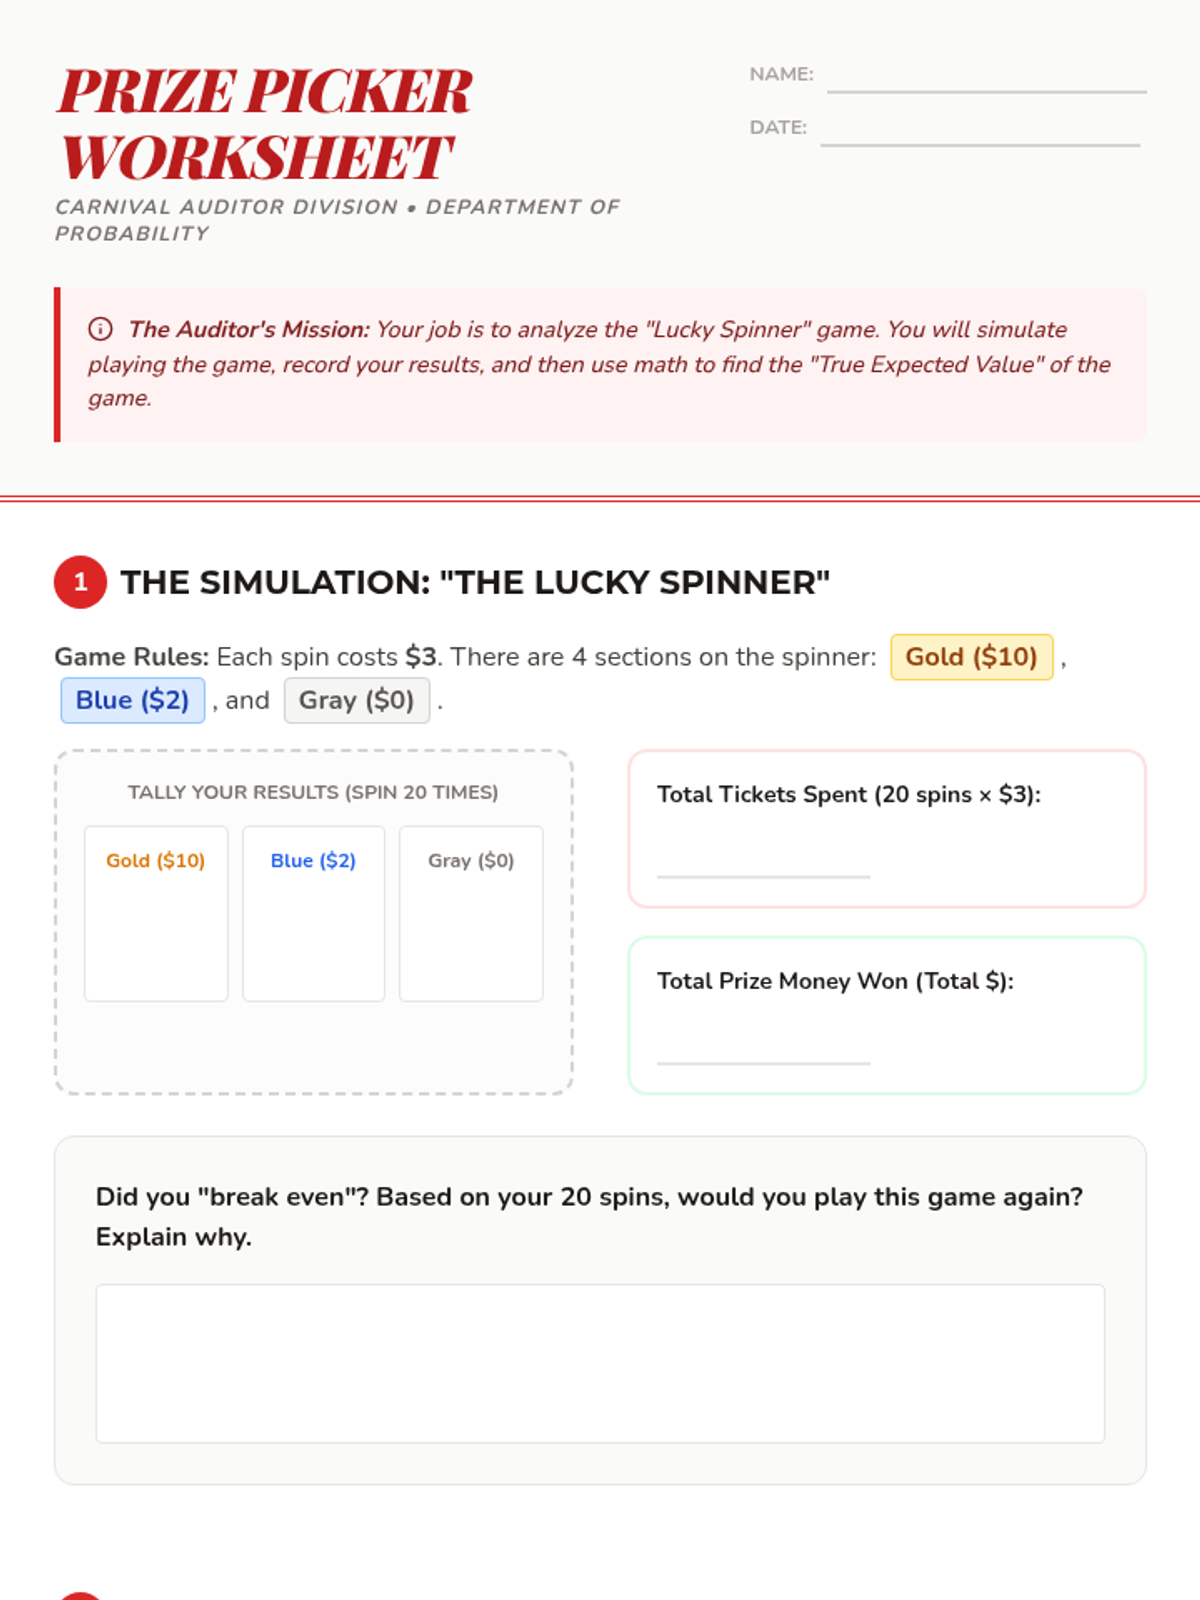
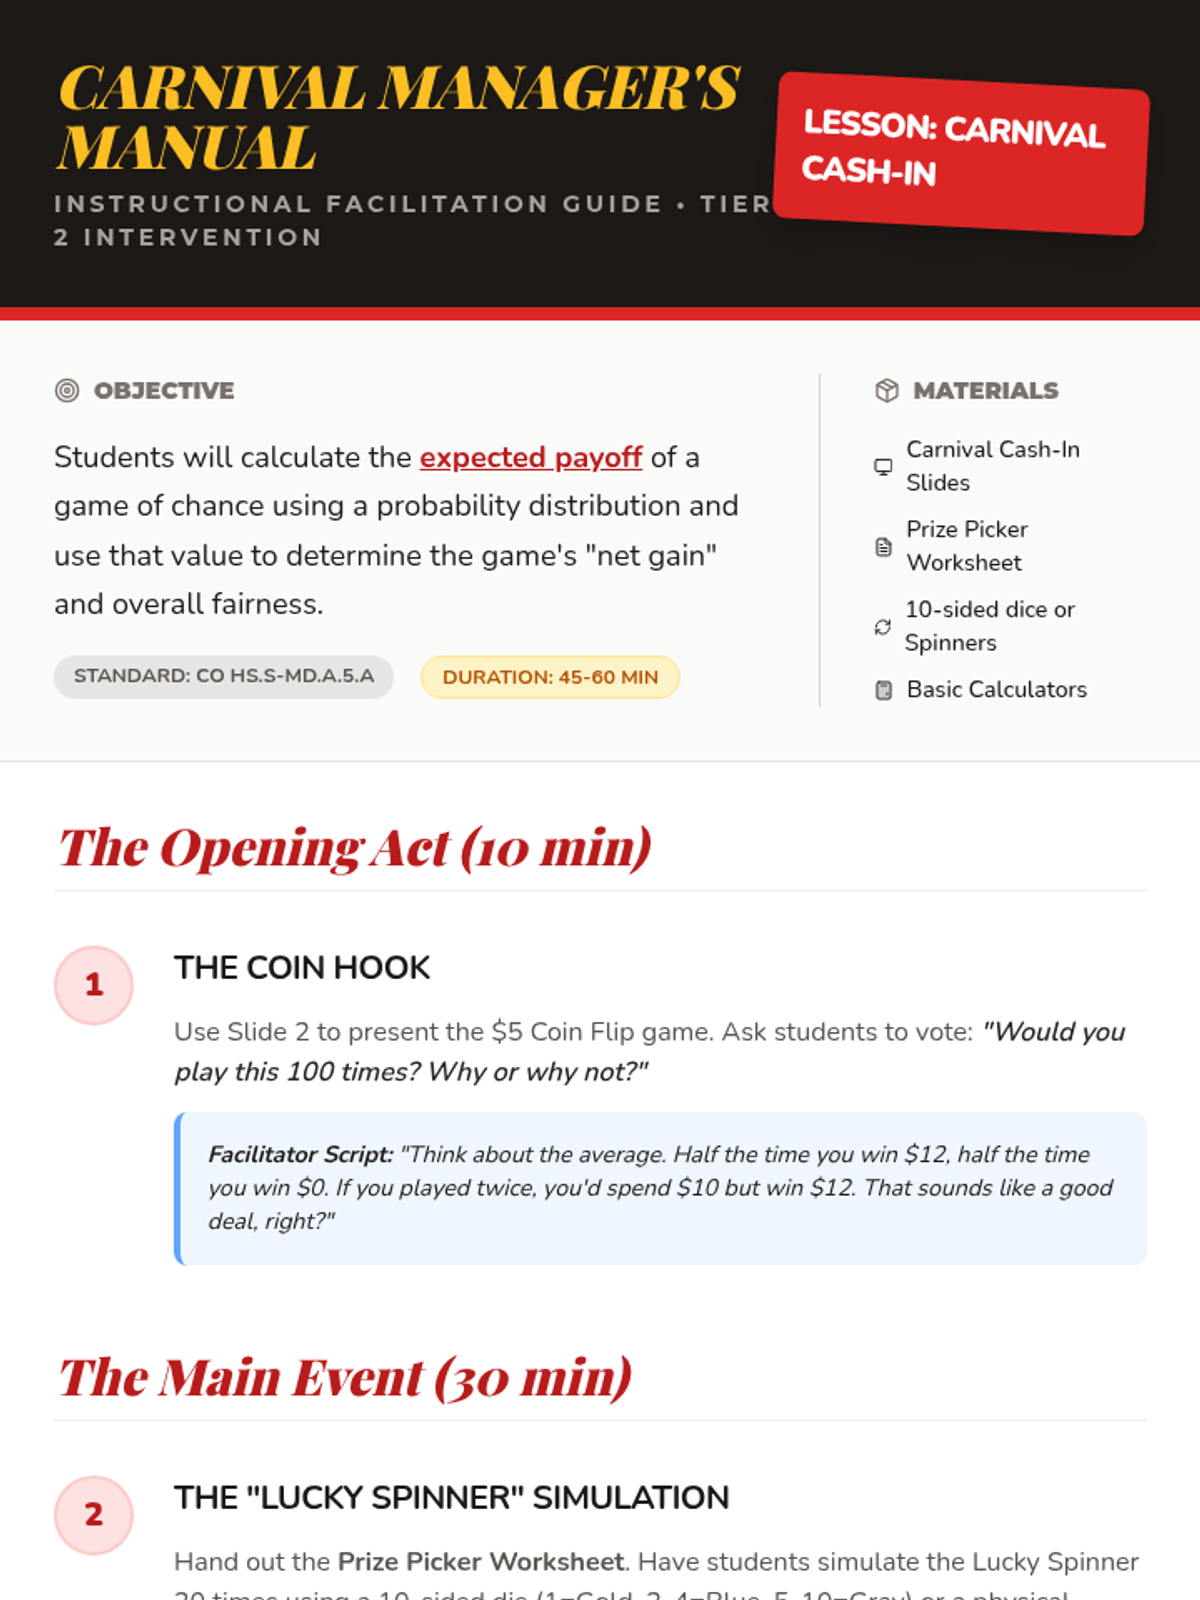
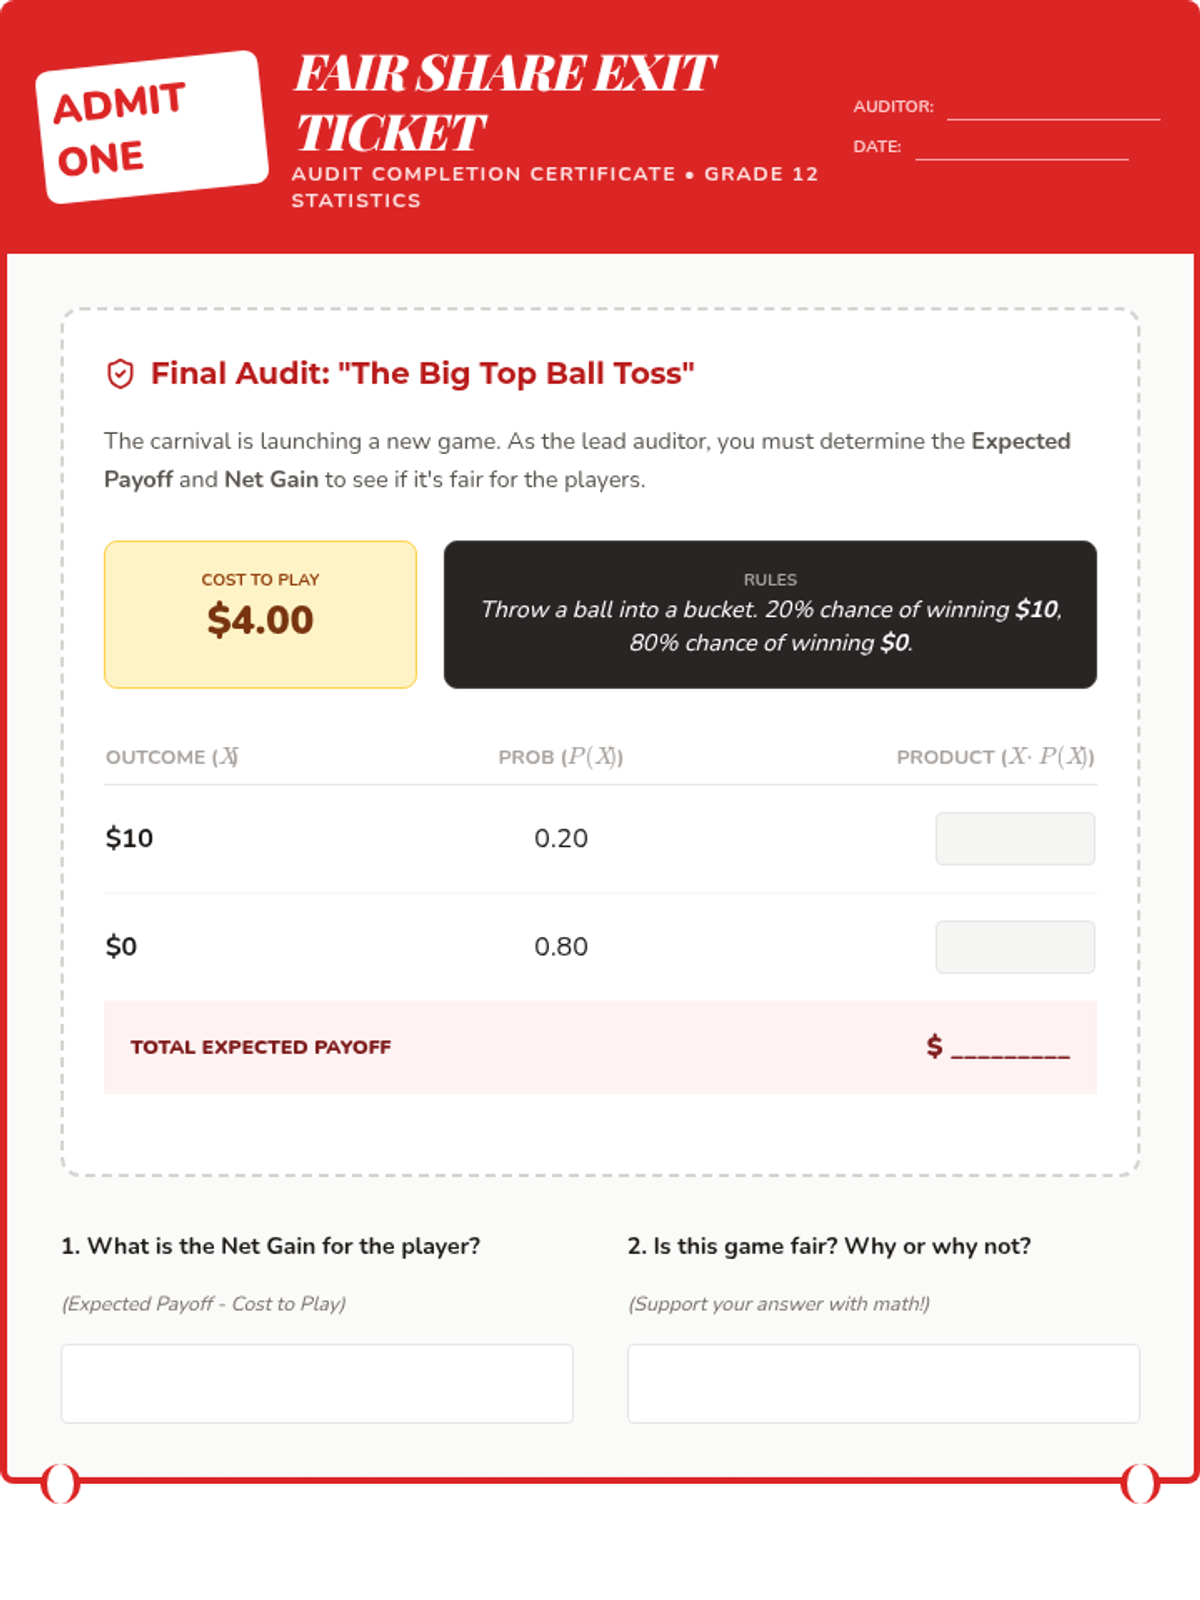
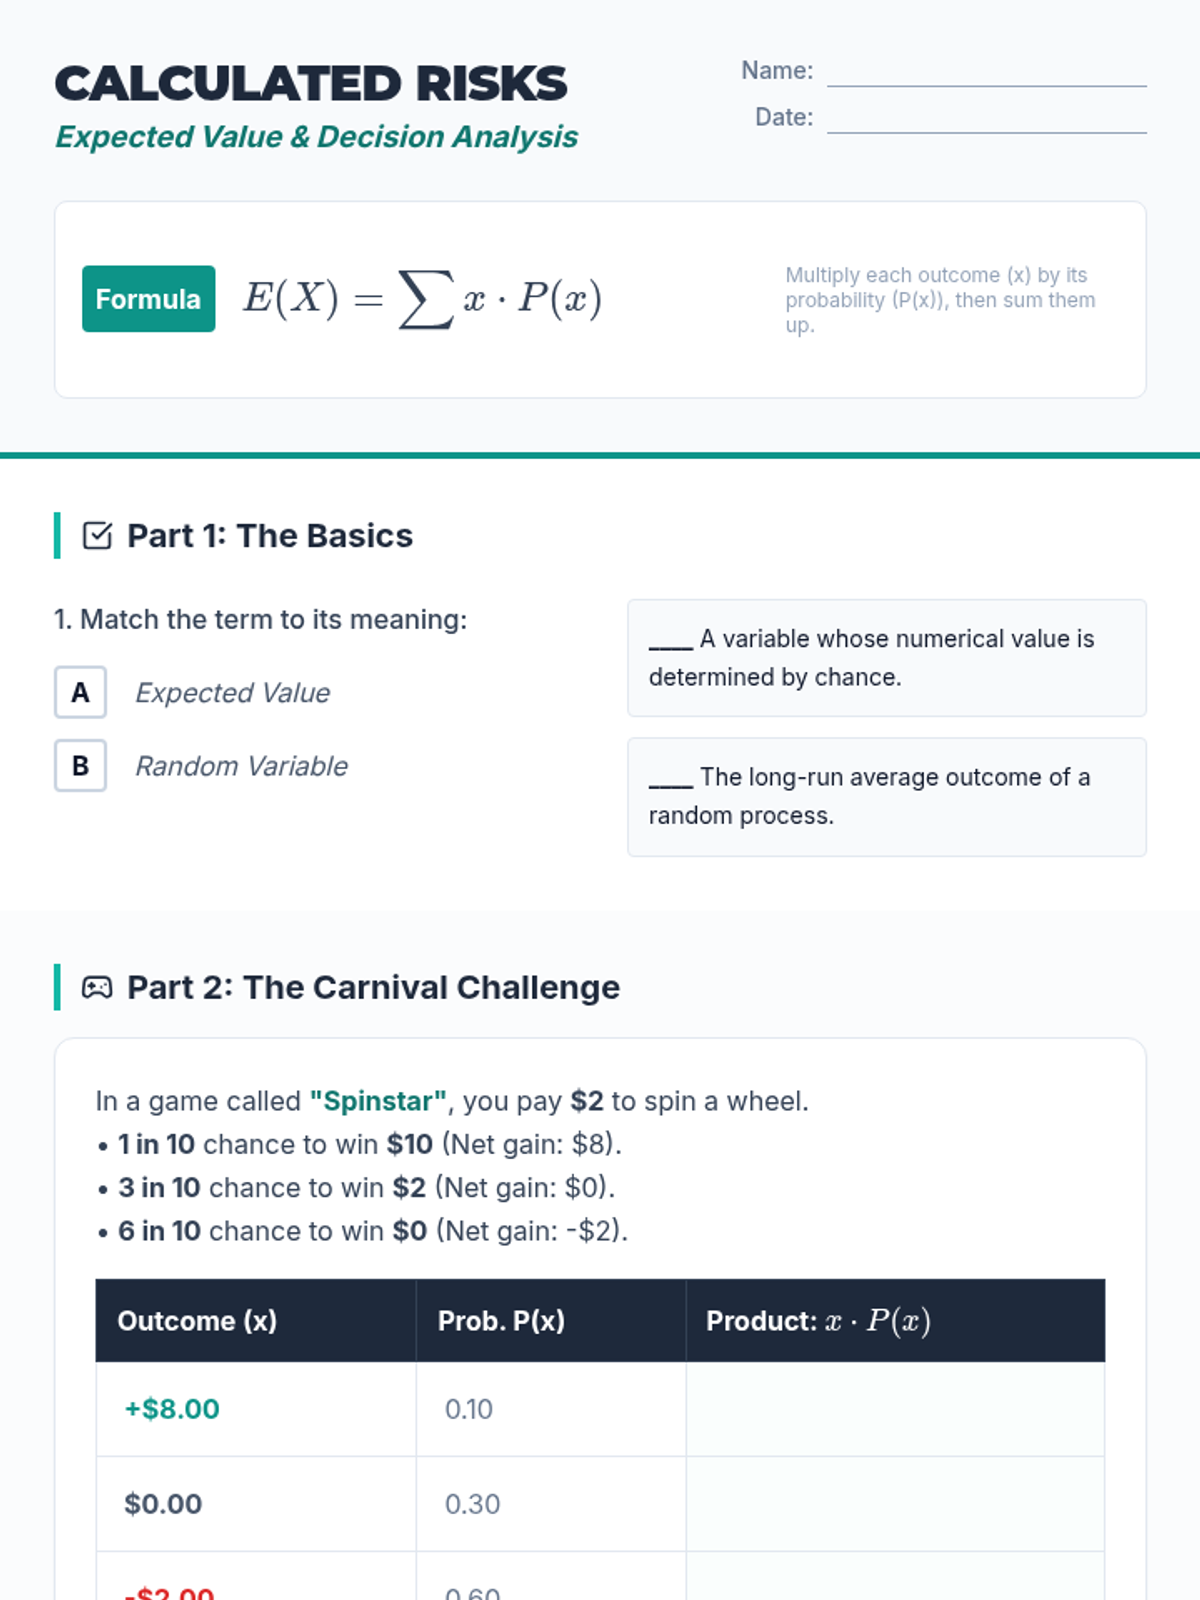
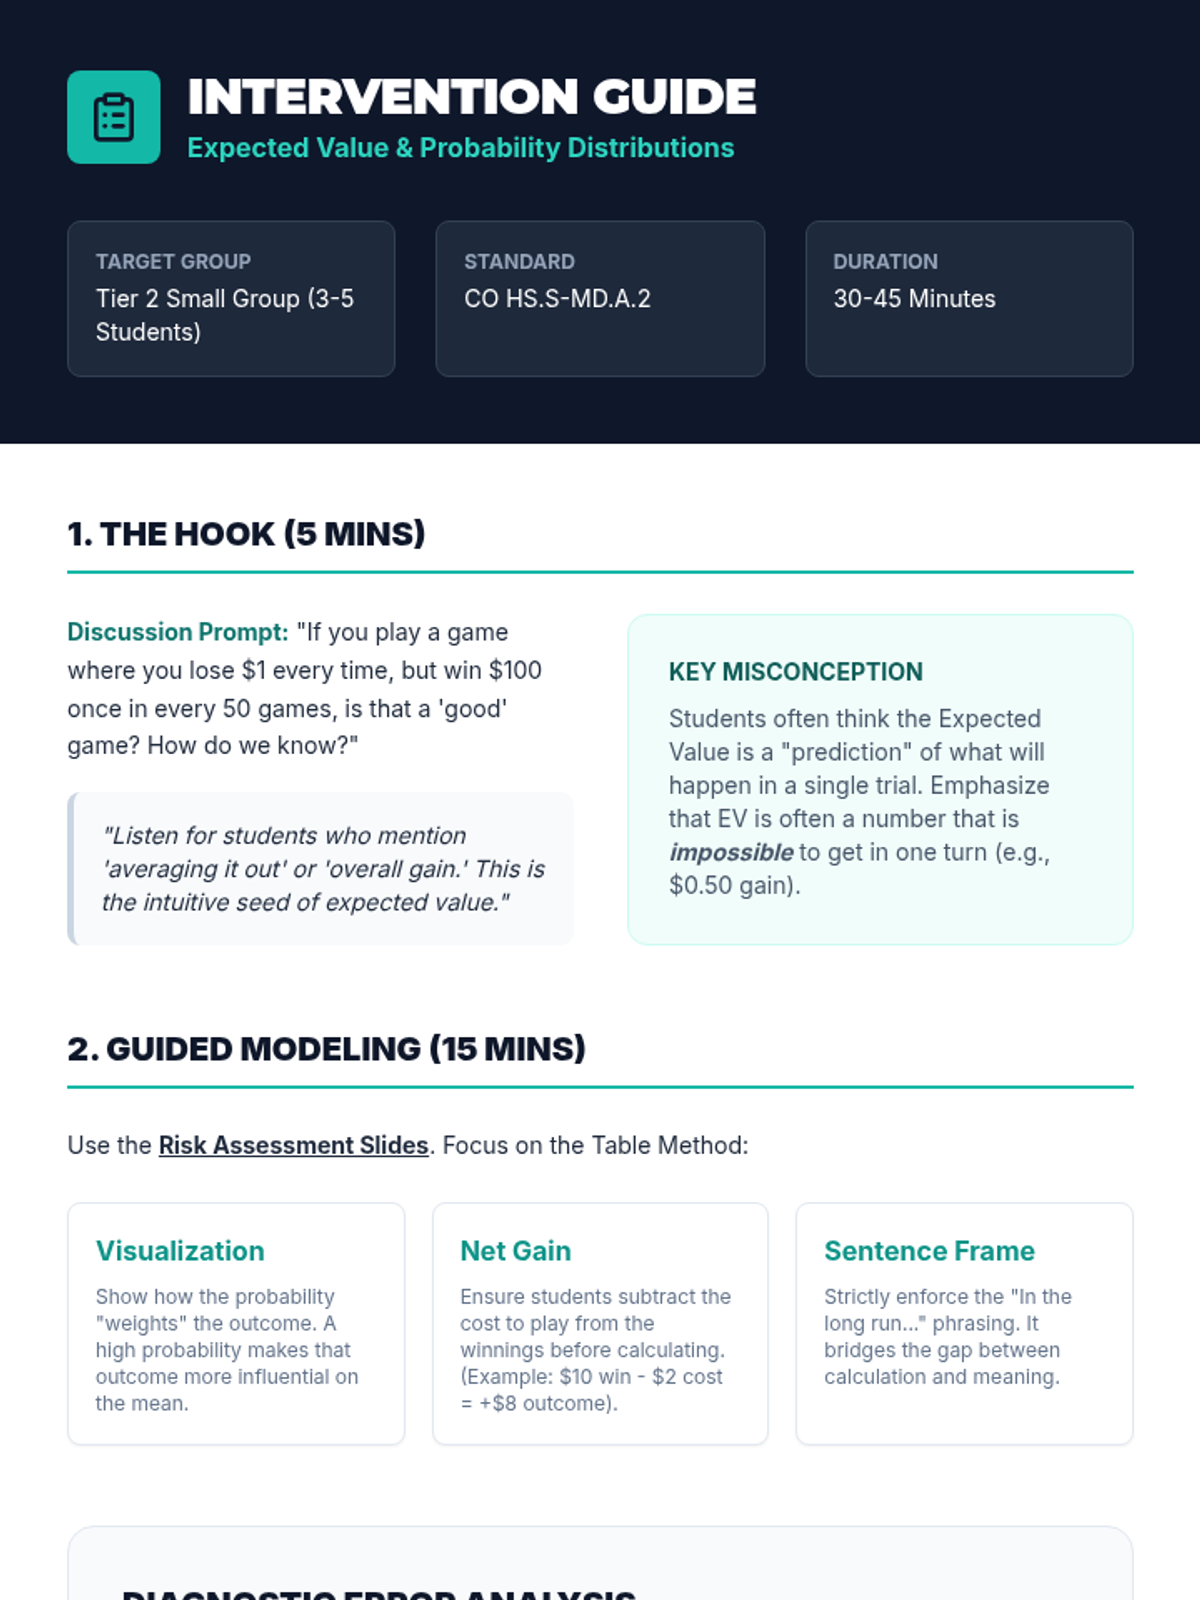
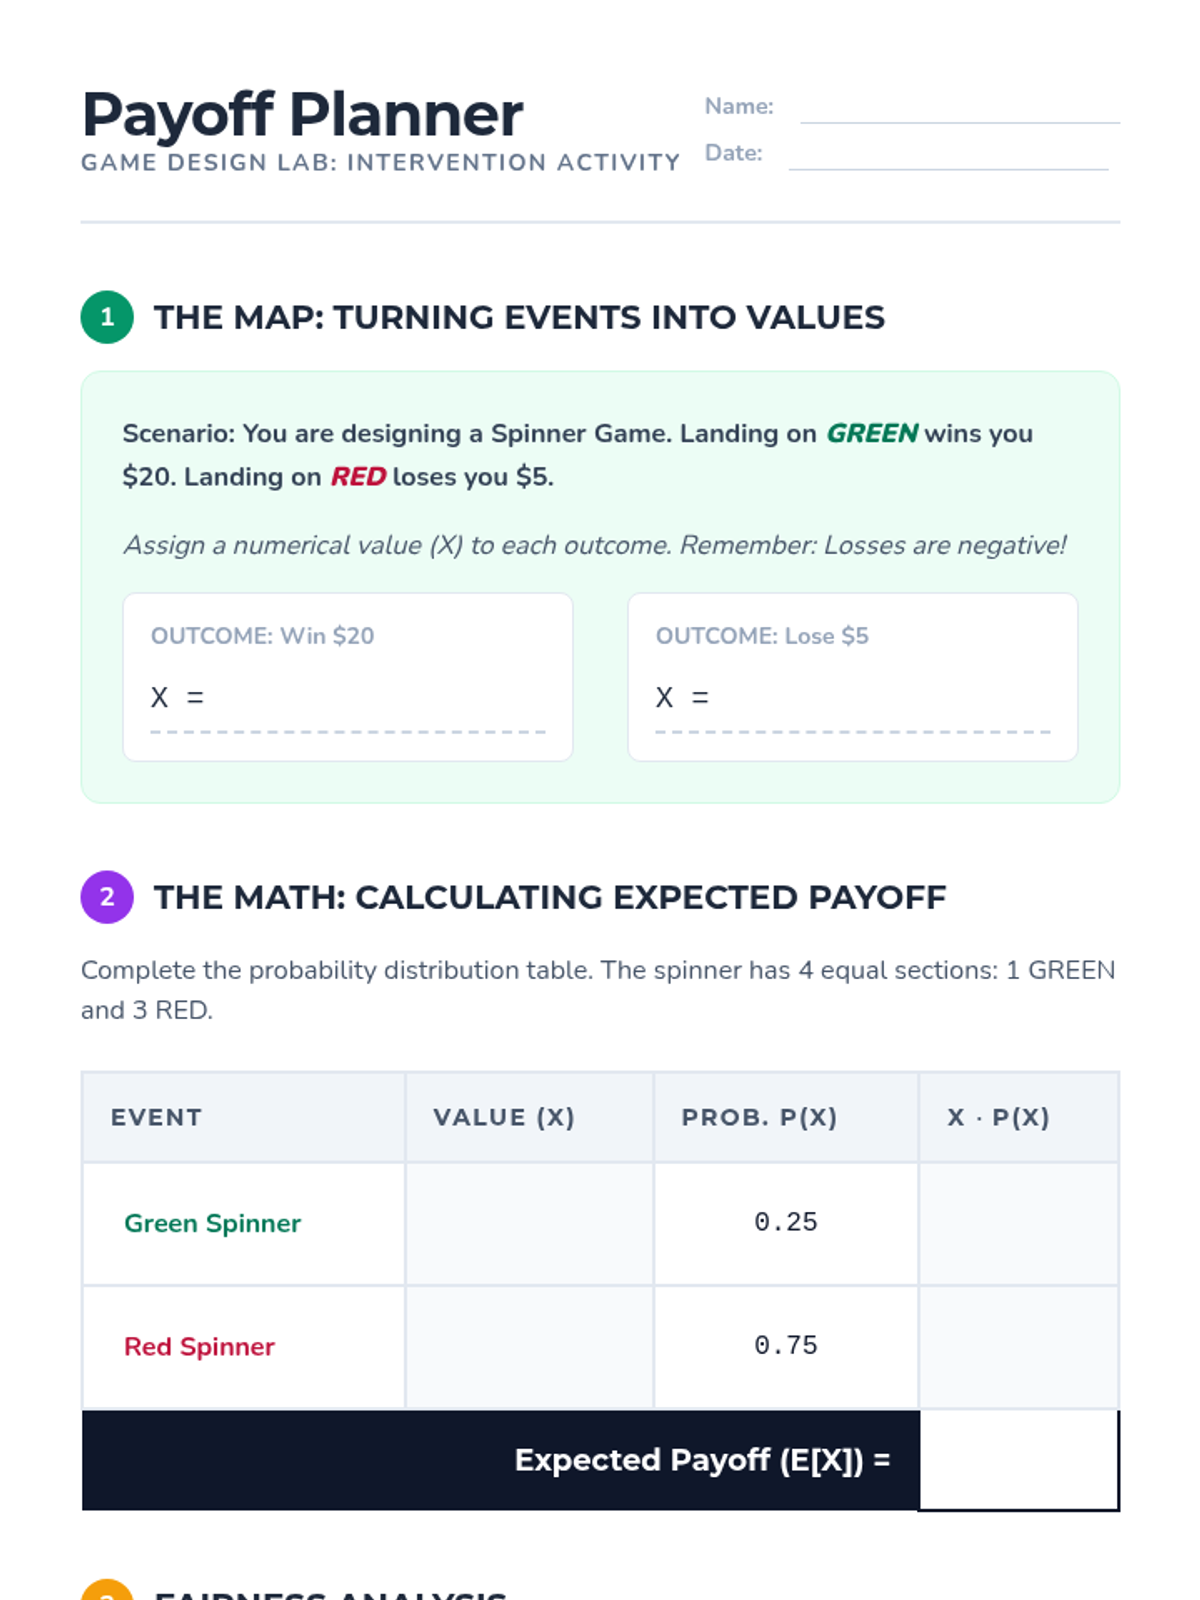
A Tier 2 intervention lesson focused on calculating expected payoffs for games of chance using a vintage carnival theme. Students use probability distributions to determine if carnival games are 'fair' through scaffolded, hands-on simulations.
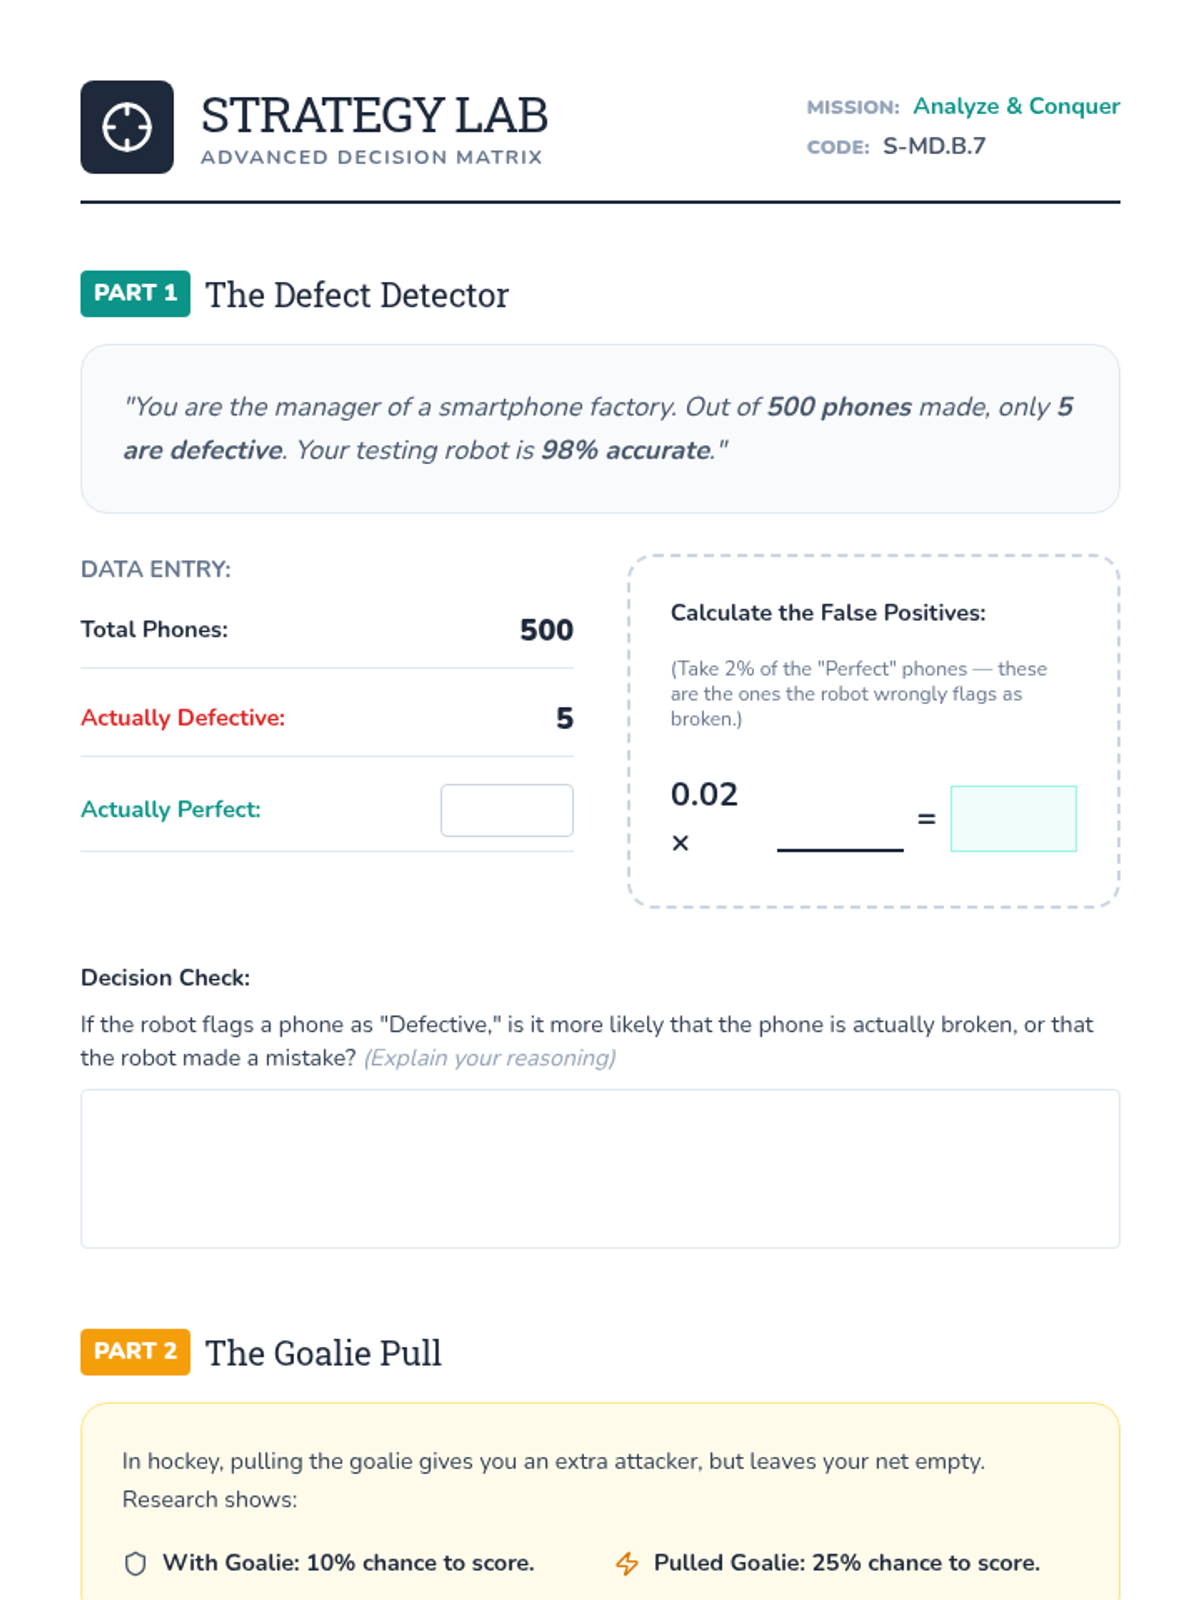
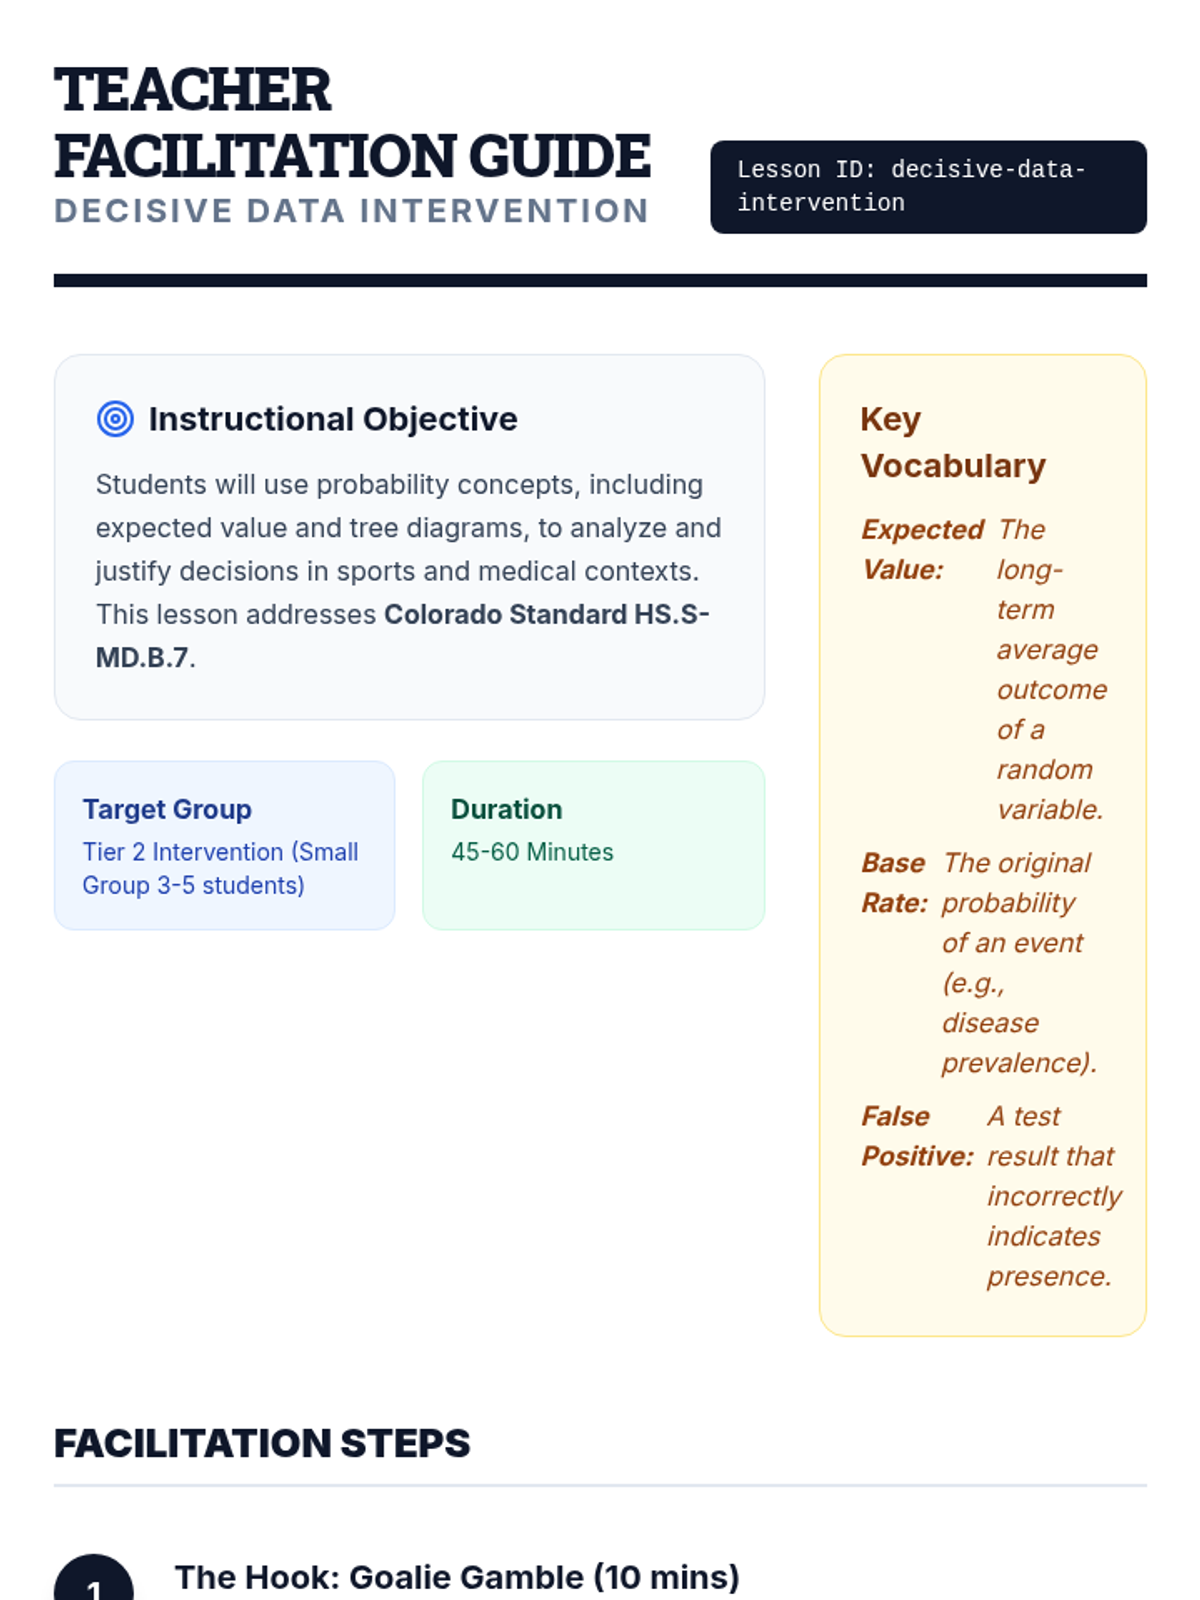
A Tier 2 intervention lesson focusing on using probability and expected value to analyze real-world decisions in medical testing, product quality, and sports strategy. Students use decision trees and justification templates to move from calculations to reasoned arguments.
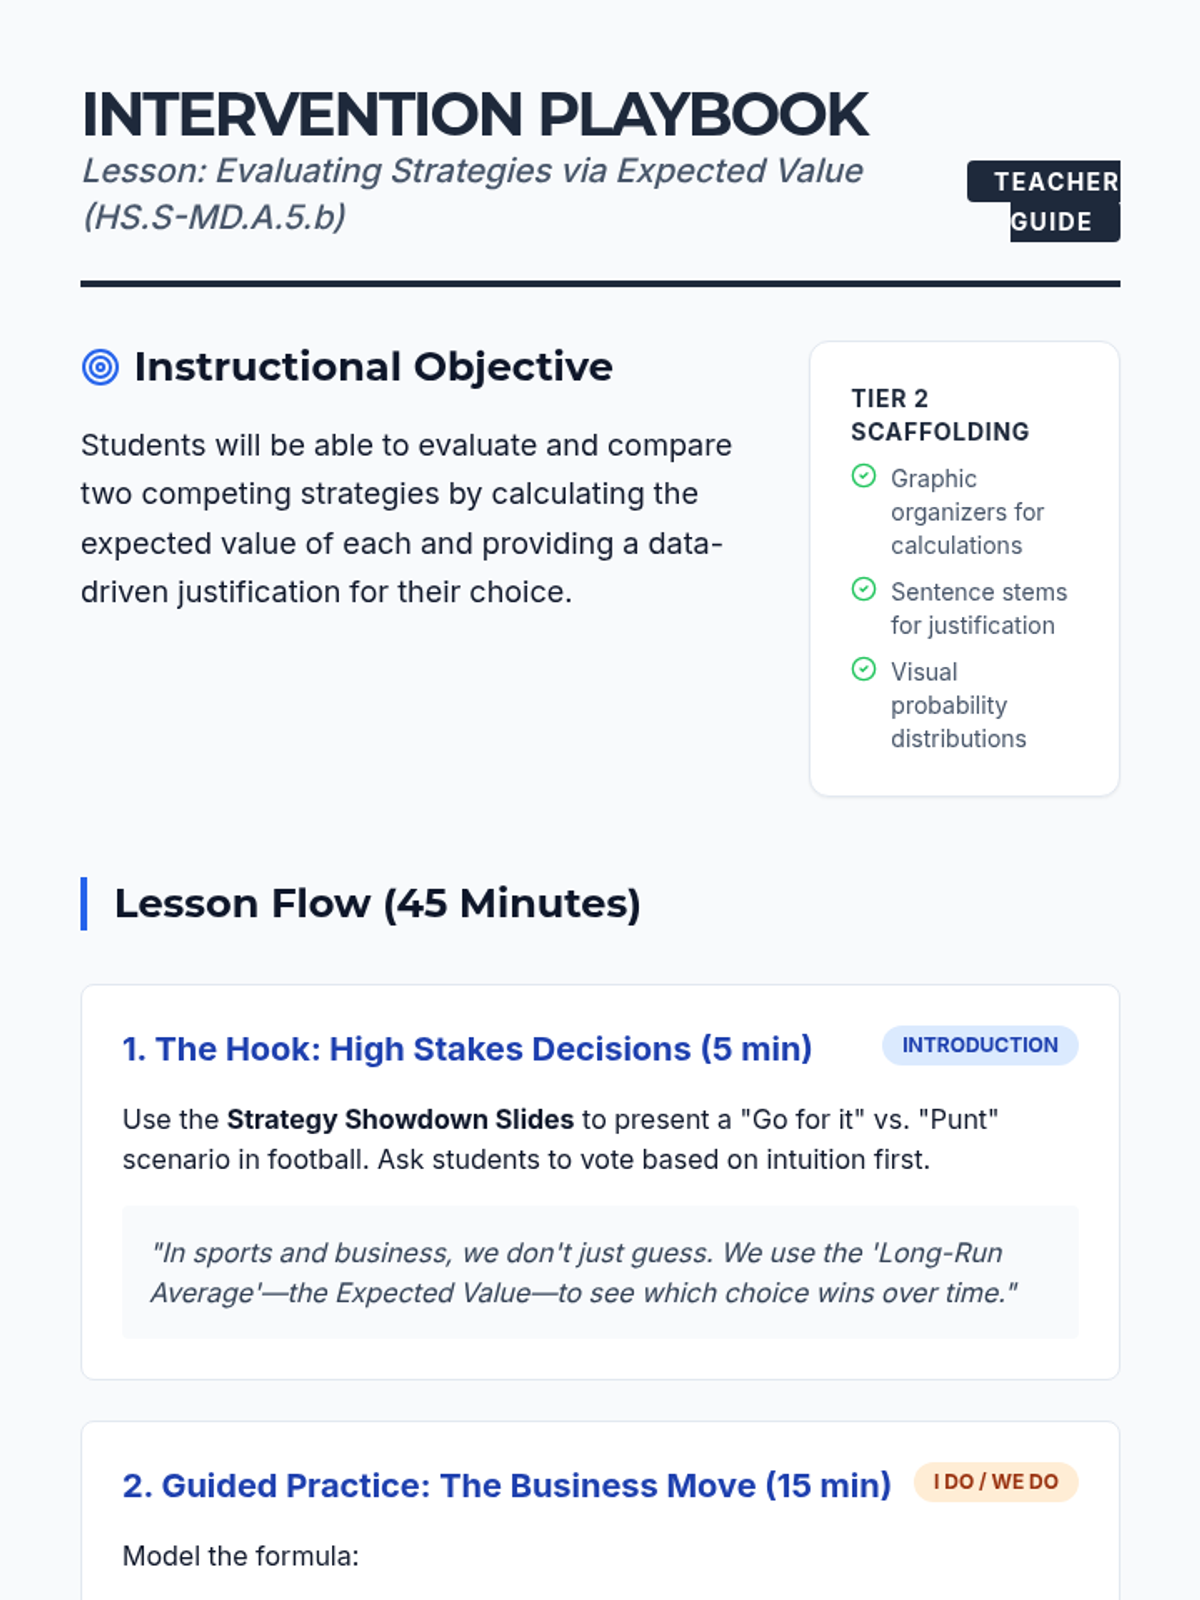
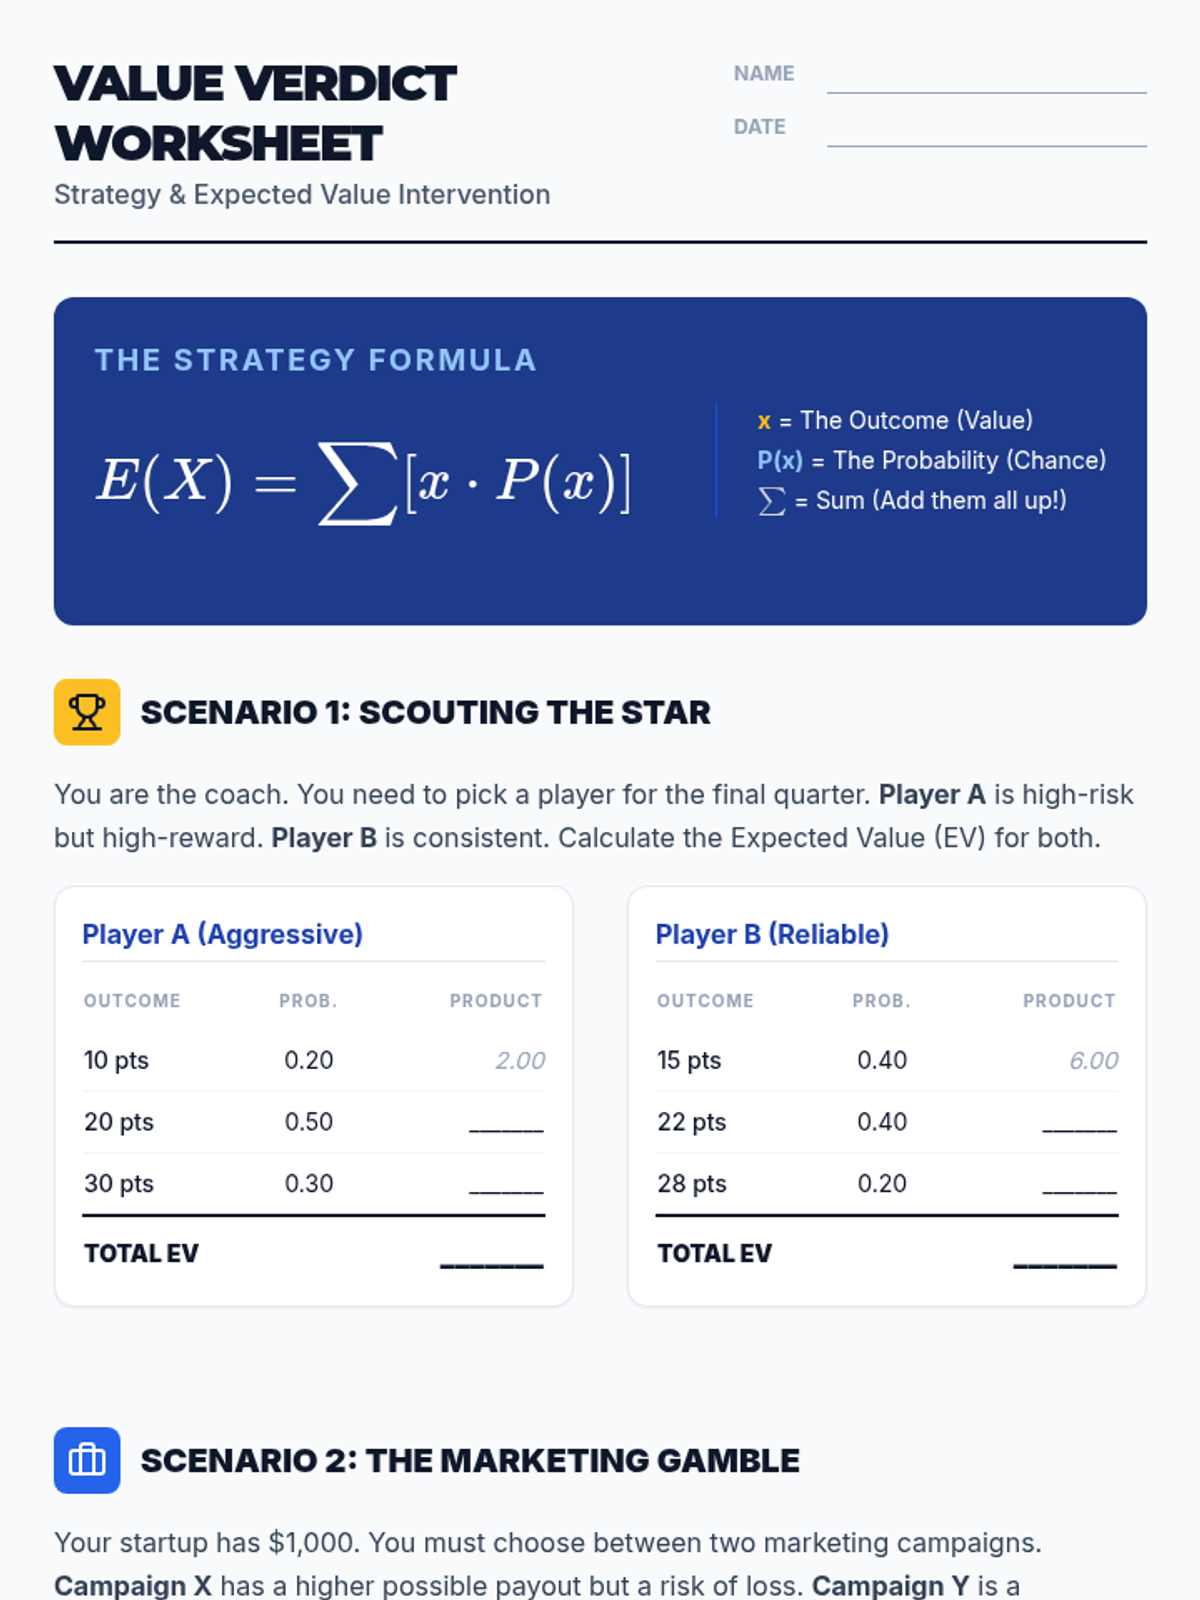
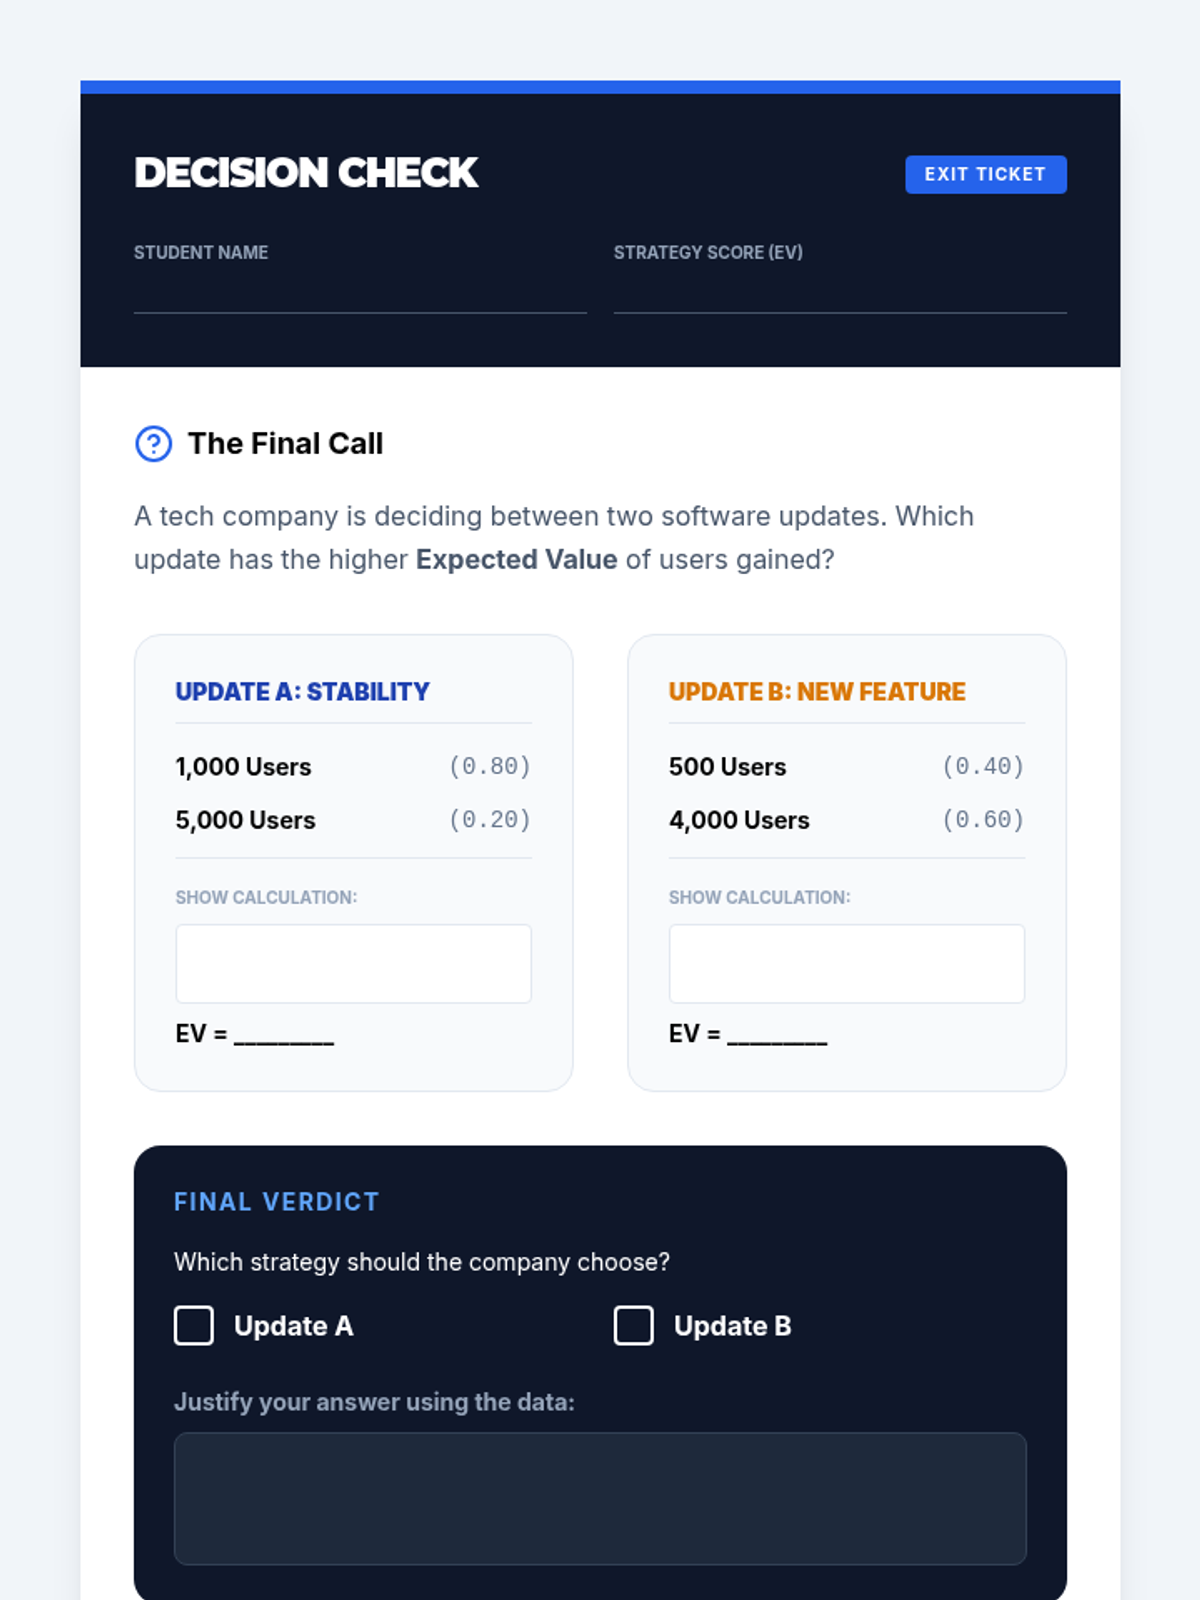
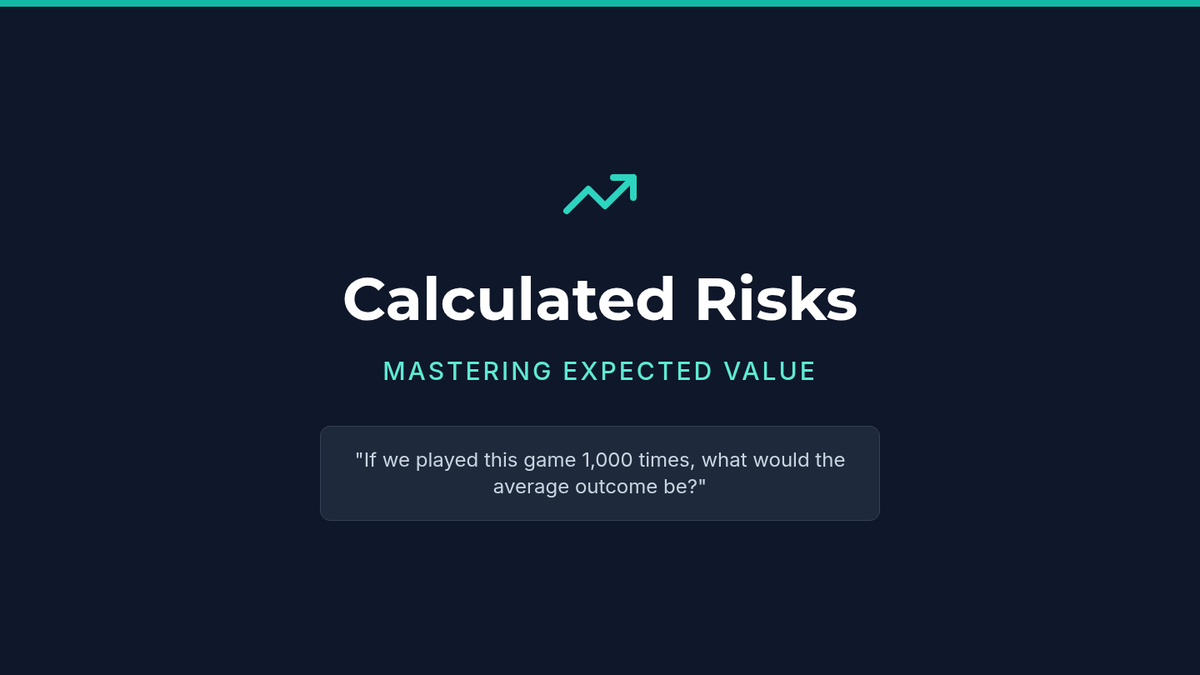
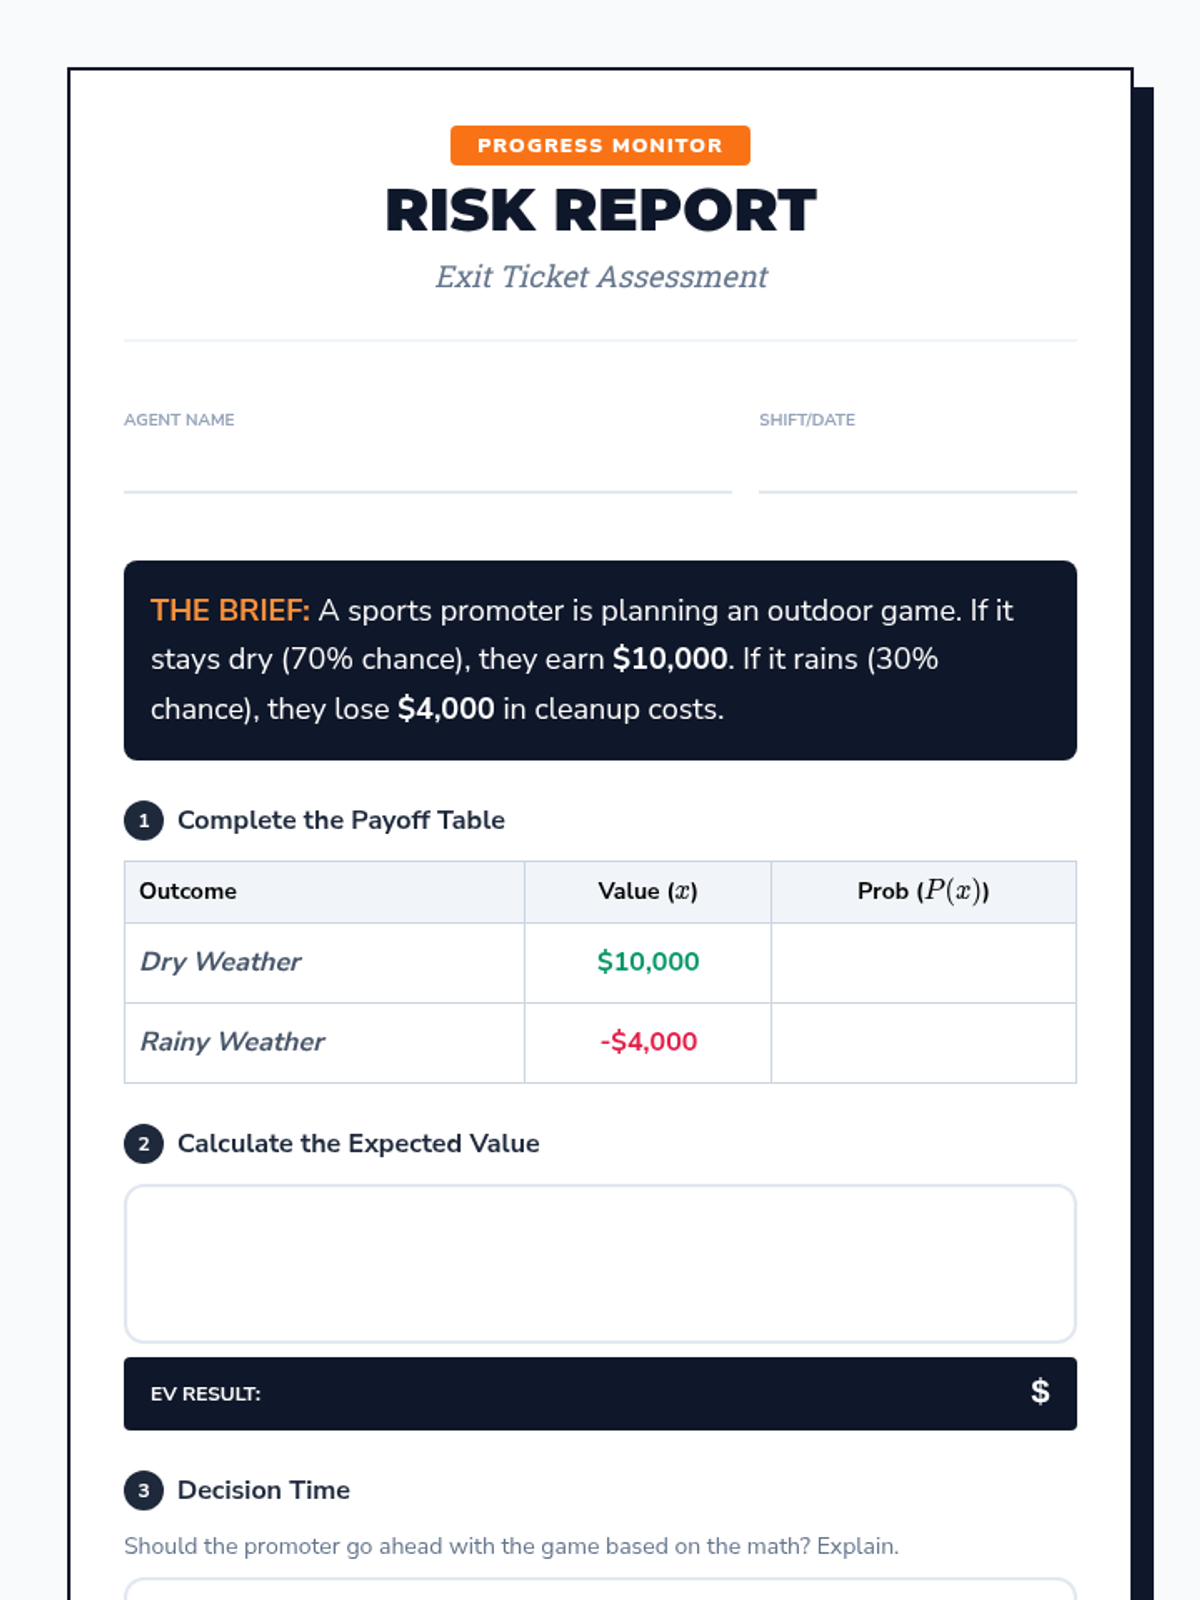
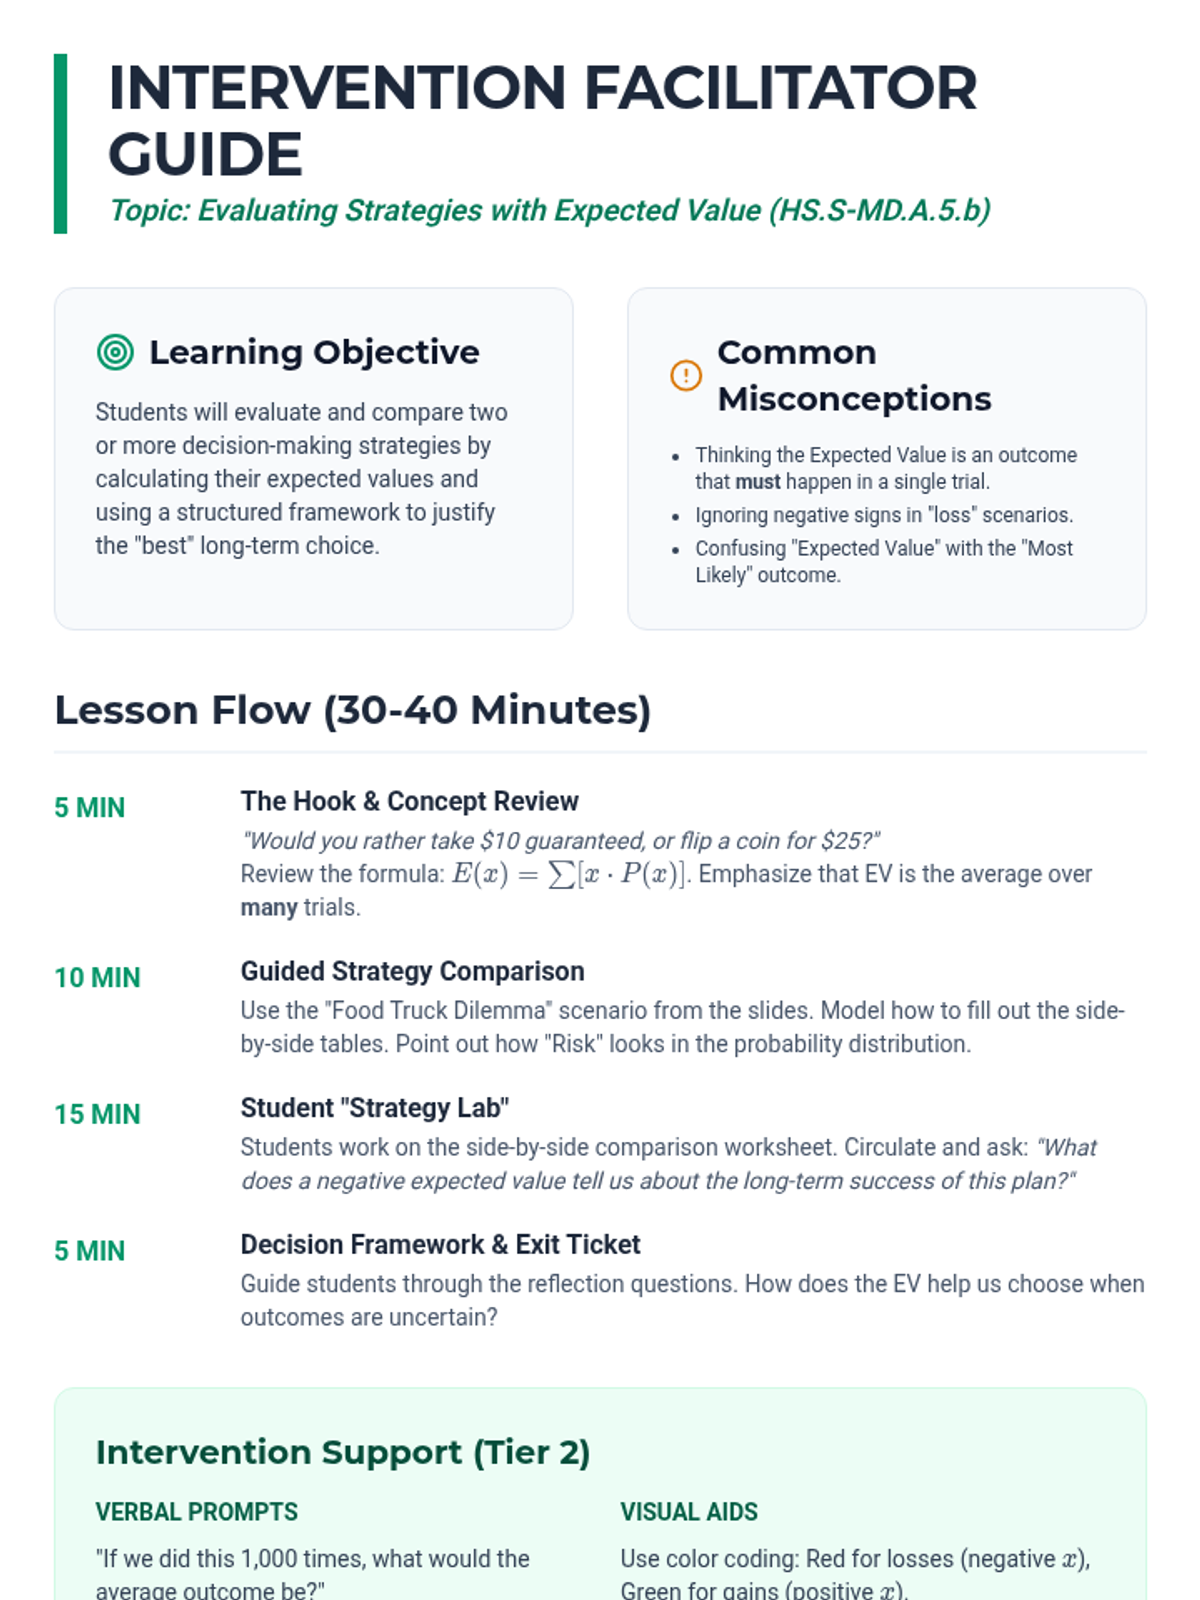
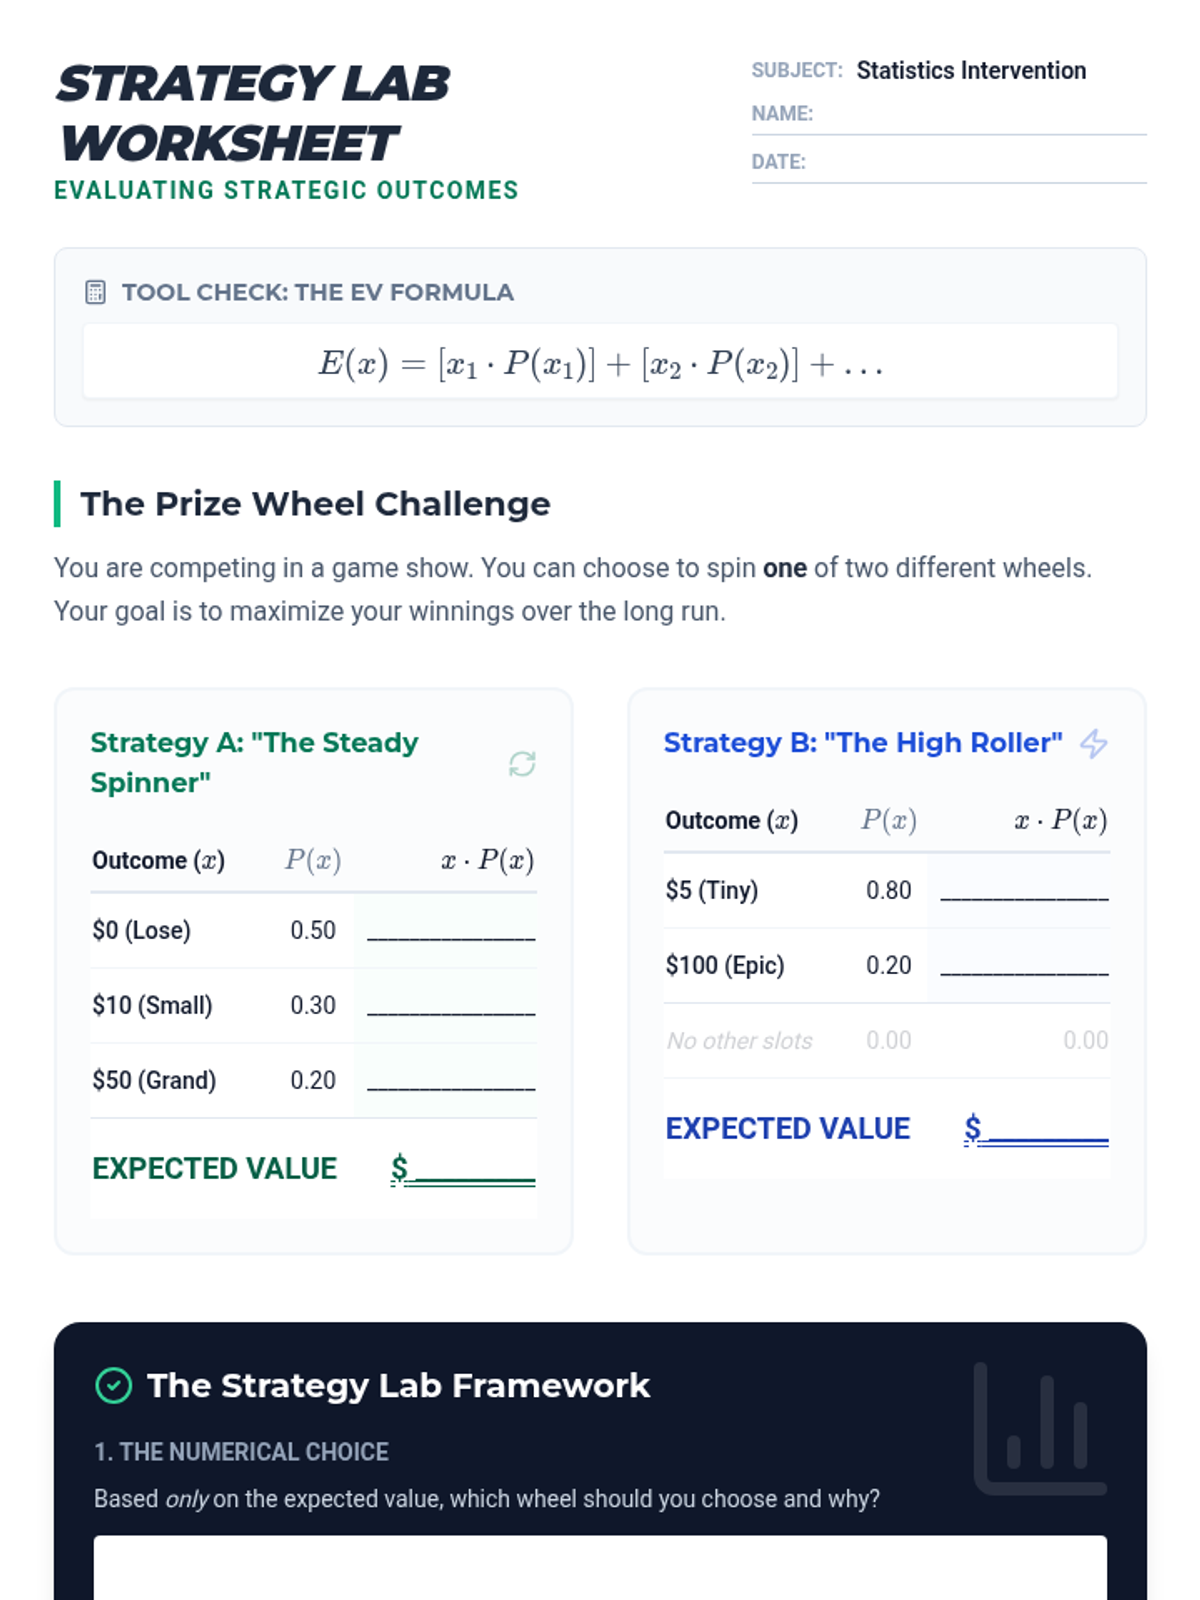
A targeted Tier 2 intervention lesson focused on calculating and comparing expected values to make informed decisions in sports and business contexts. Students will learn to evaluate competing strategies through scaffolded practice and peer justification.
A targeted small group intervention lesson focused on using probability to make and analyze real-world decisions in sports and medicine. Students will use expected value and tree diagrams to justify strategies like pulling a hockey goalie or interpreting medical tests.
A Tier 2 intervention lesson designed for small groups to master calculating and interpreting expected value through scaffolded practice with real-world scenarios like smartphone insurance and carnival games.
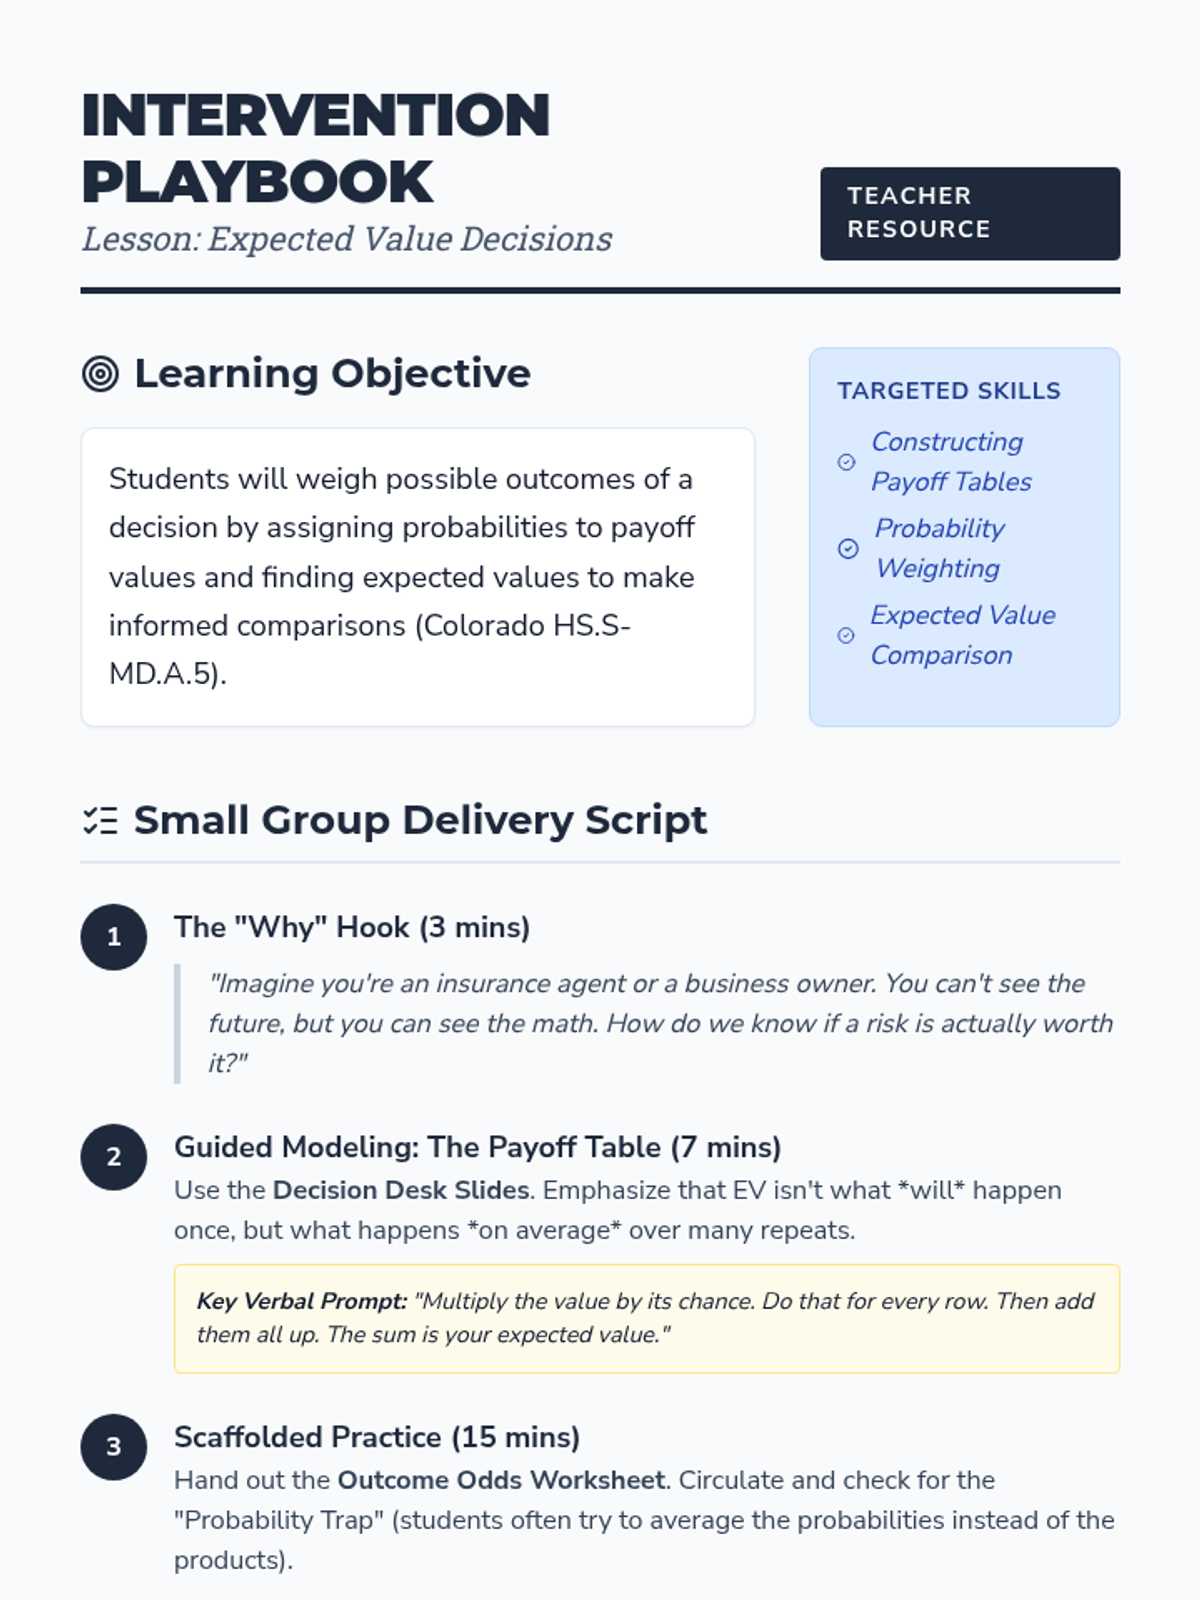
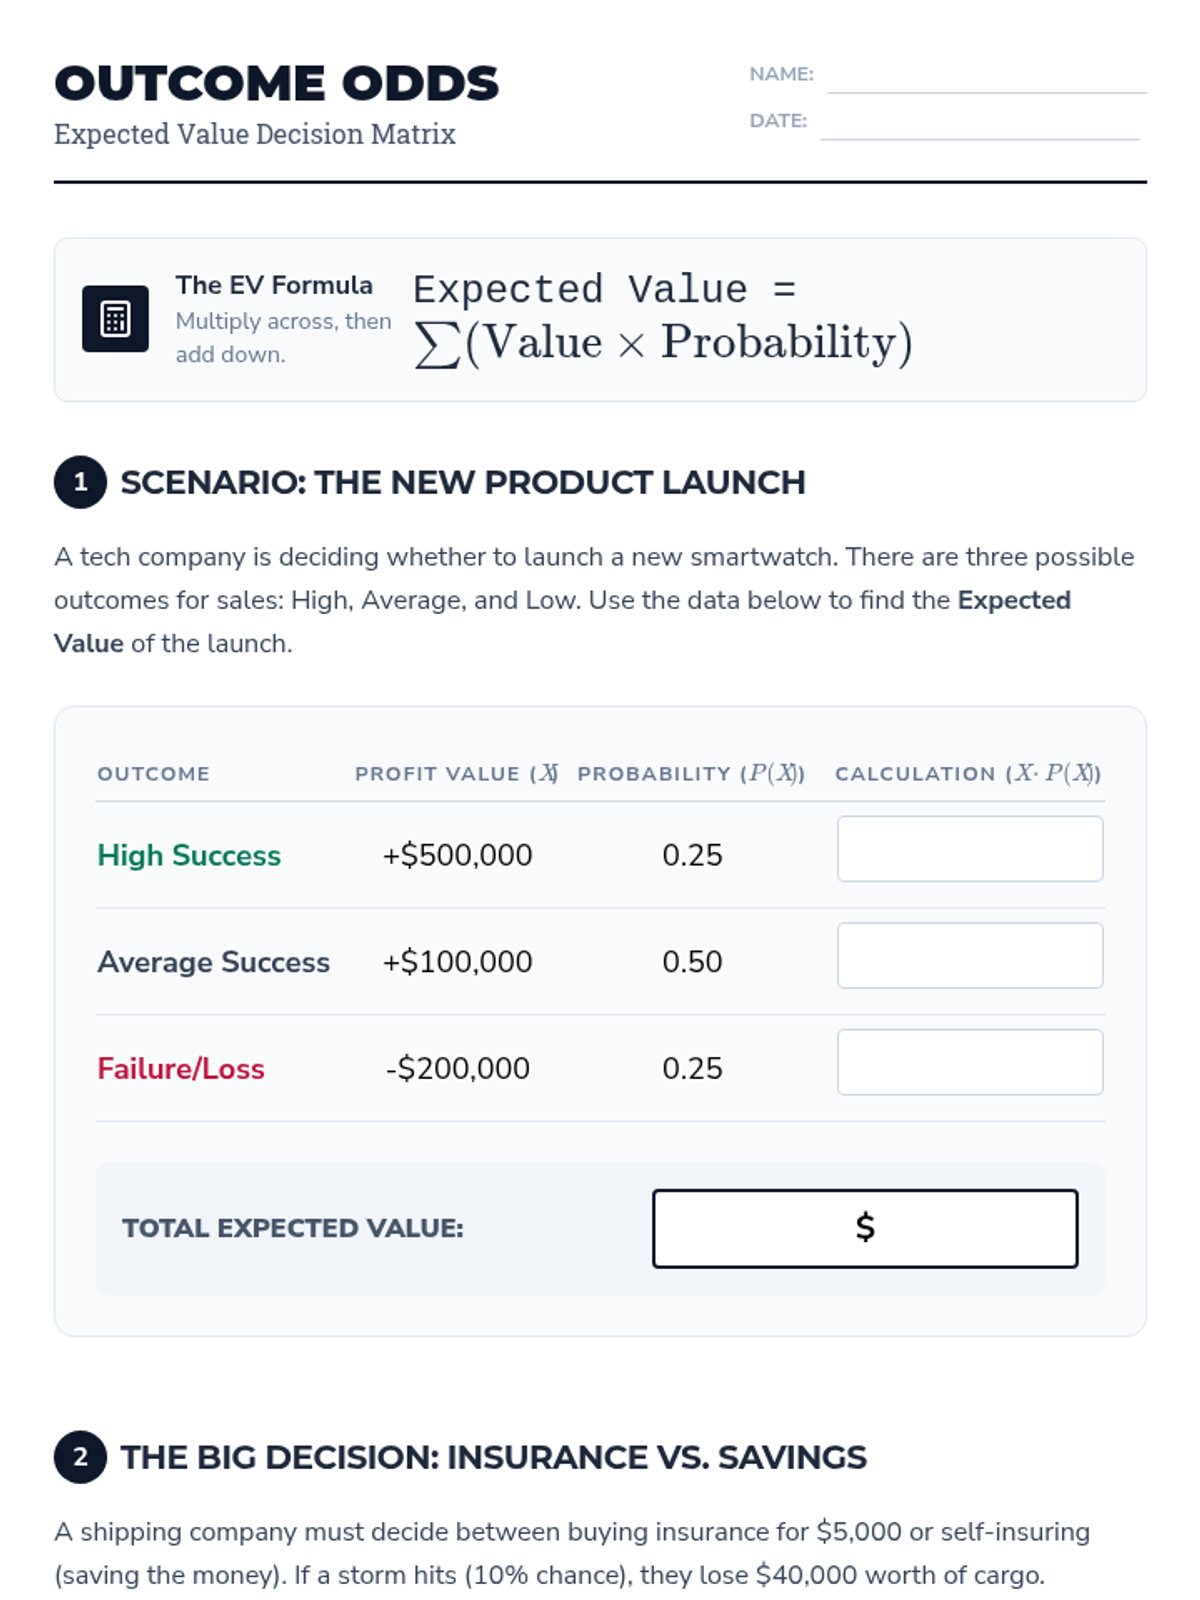
A targeted intervention lesson for high school students to master calculating expected values for decision-making. Includes guided practice with payoff tables and scaffolded comparisons of multiple options.
A targeted Tier 2 intervention lesson designed to help high school students evaluate and compare different strategies using expected value calculations and decision-making frameworks.
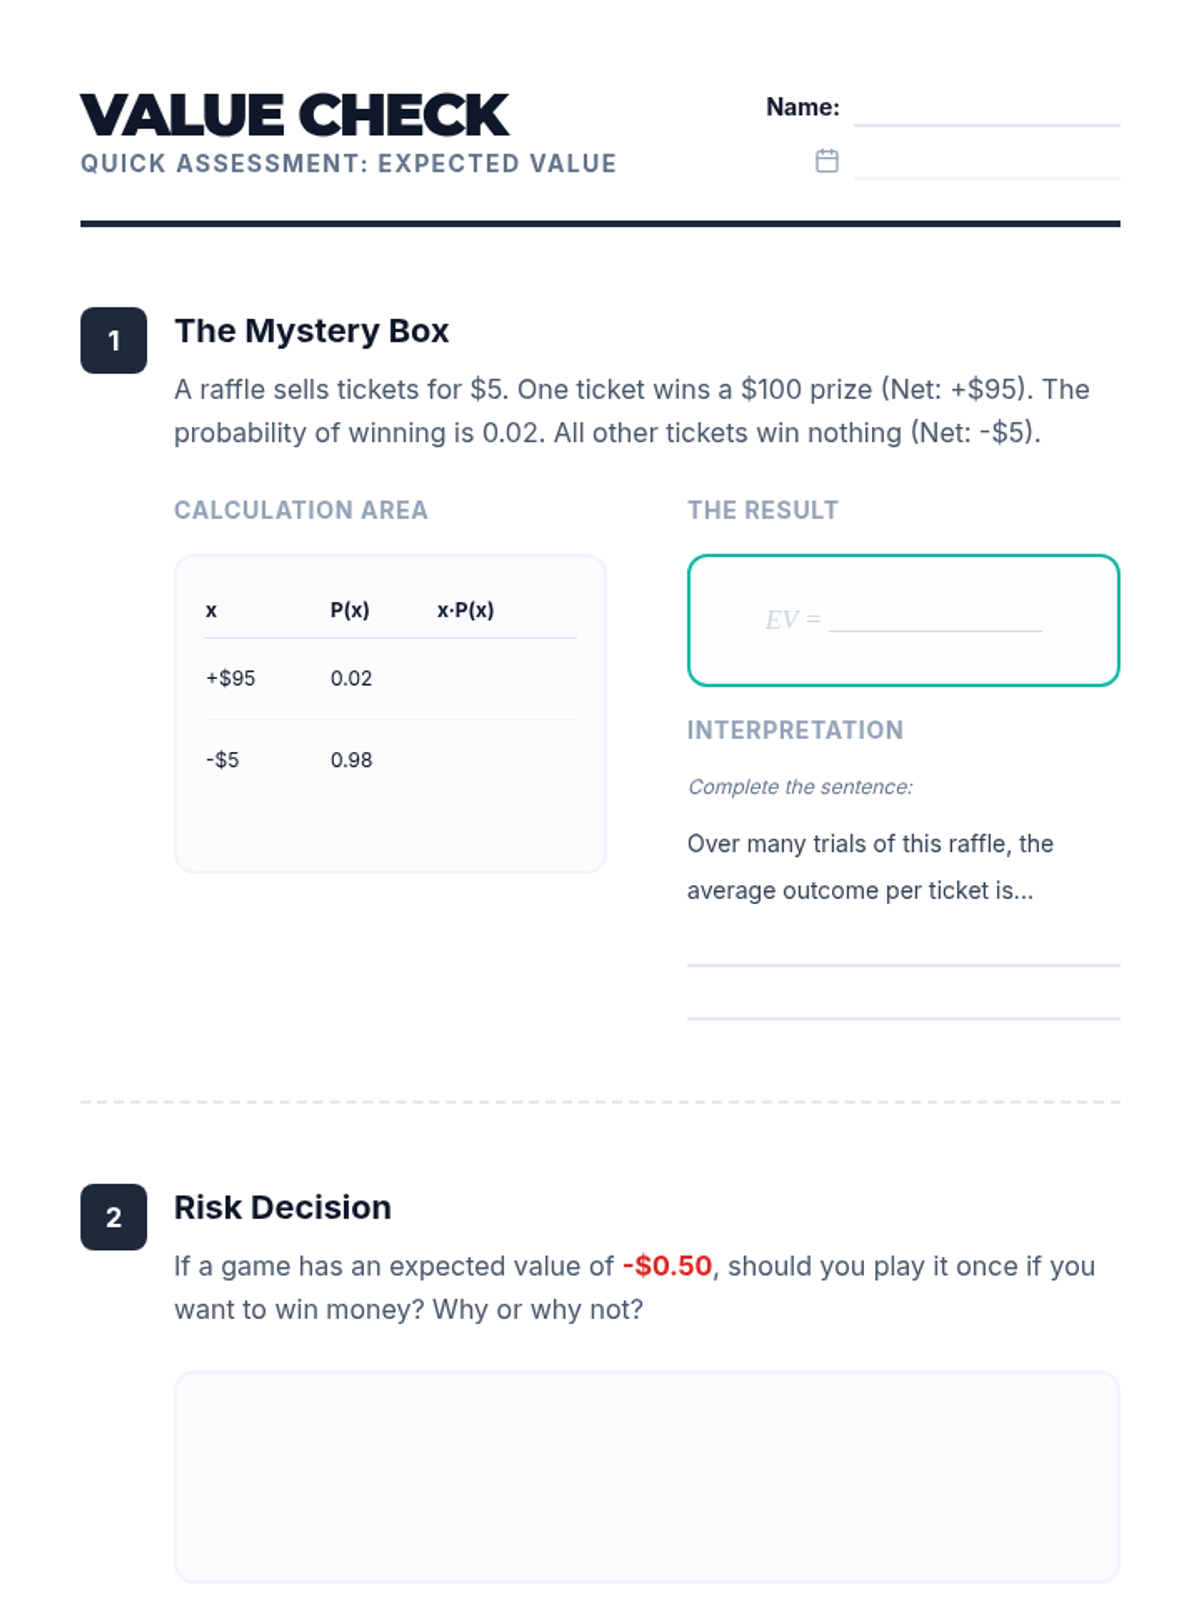
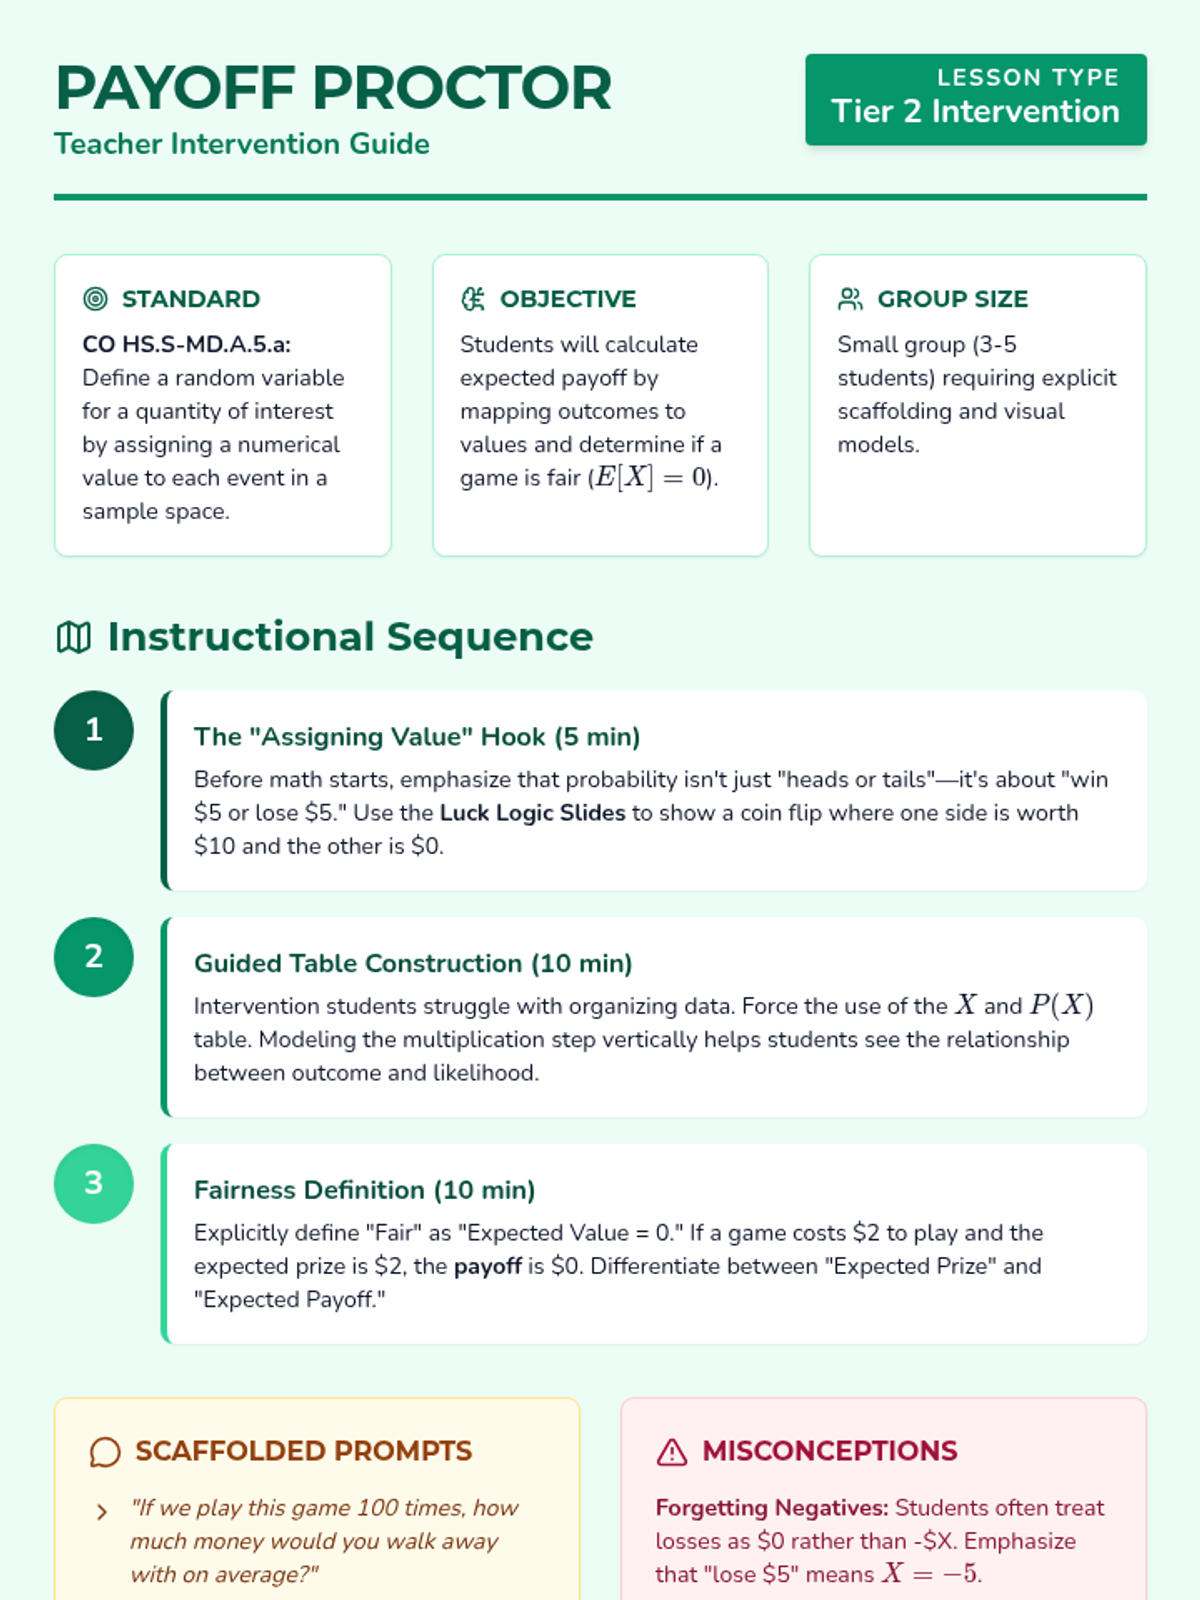
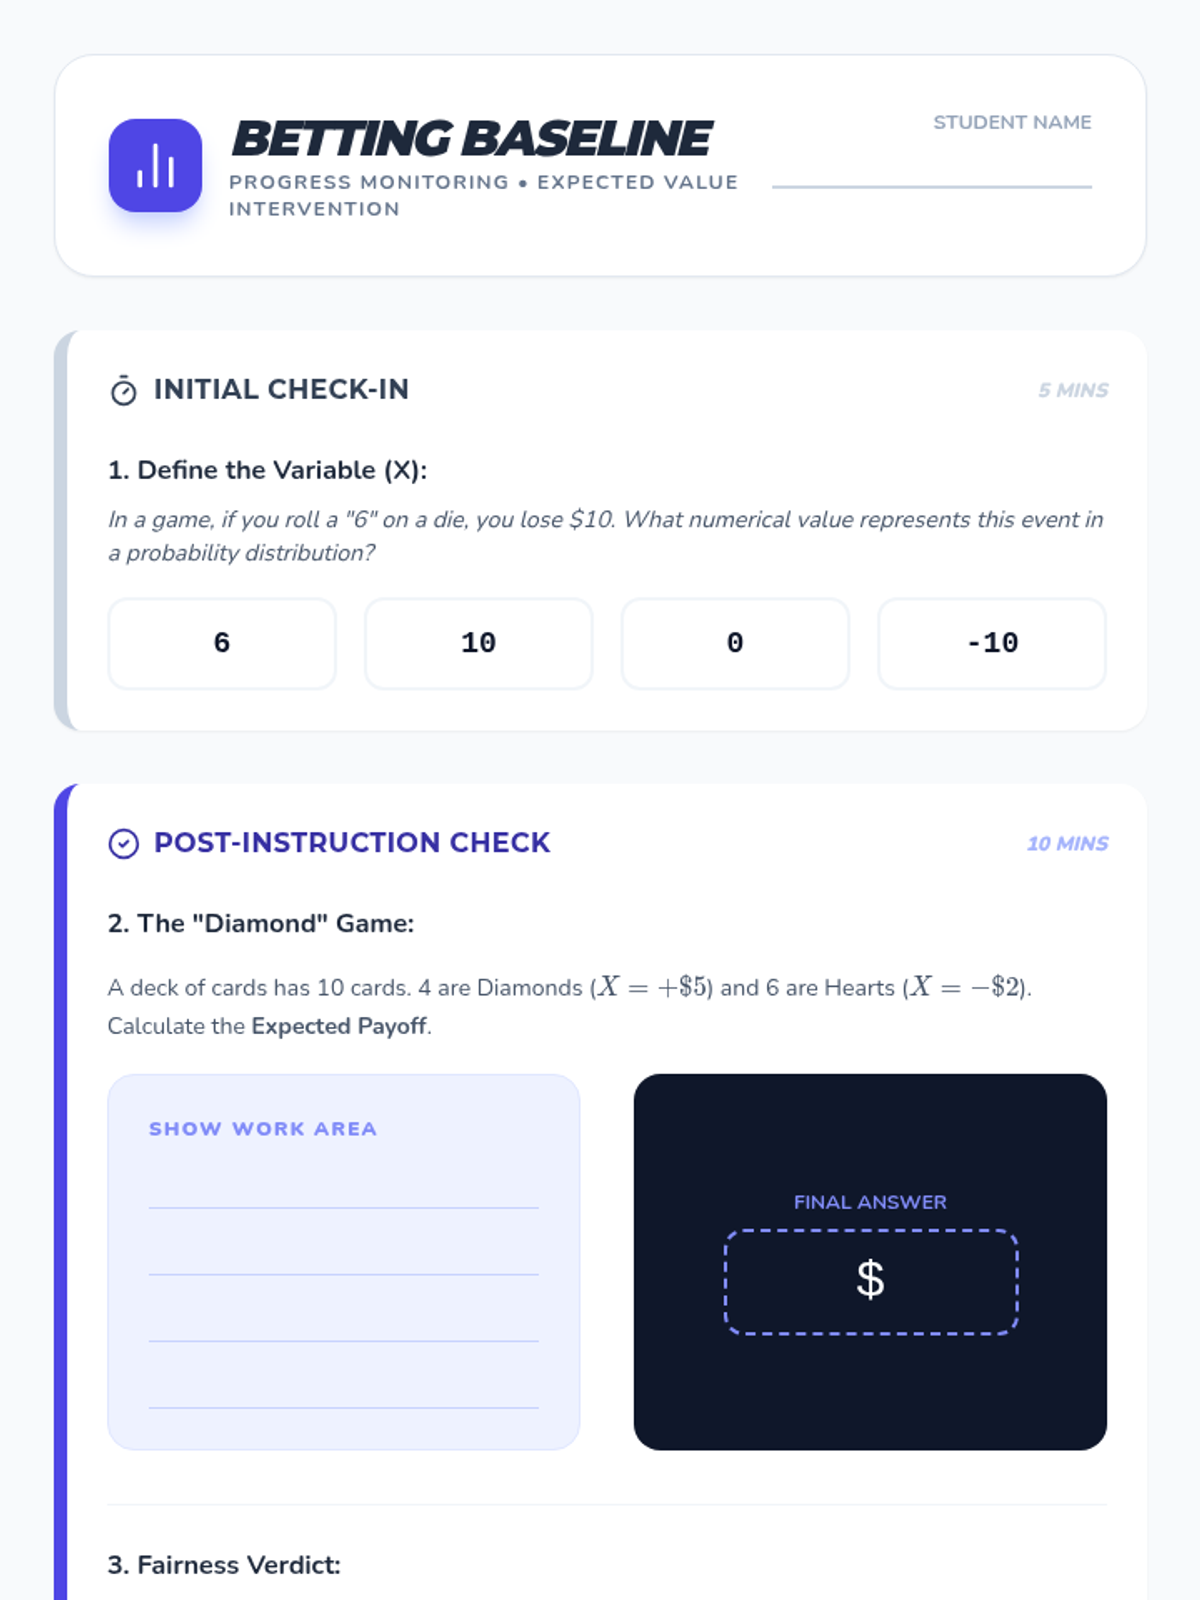
A targeted intervention lesson for high school students to master the calculation of expected value in games of chance, focusing on defining random variables and determining game fairness.
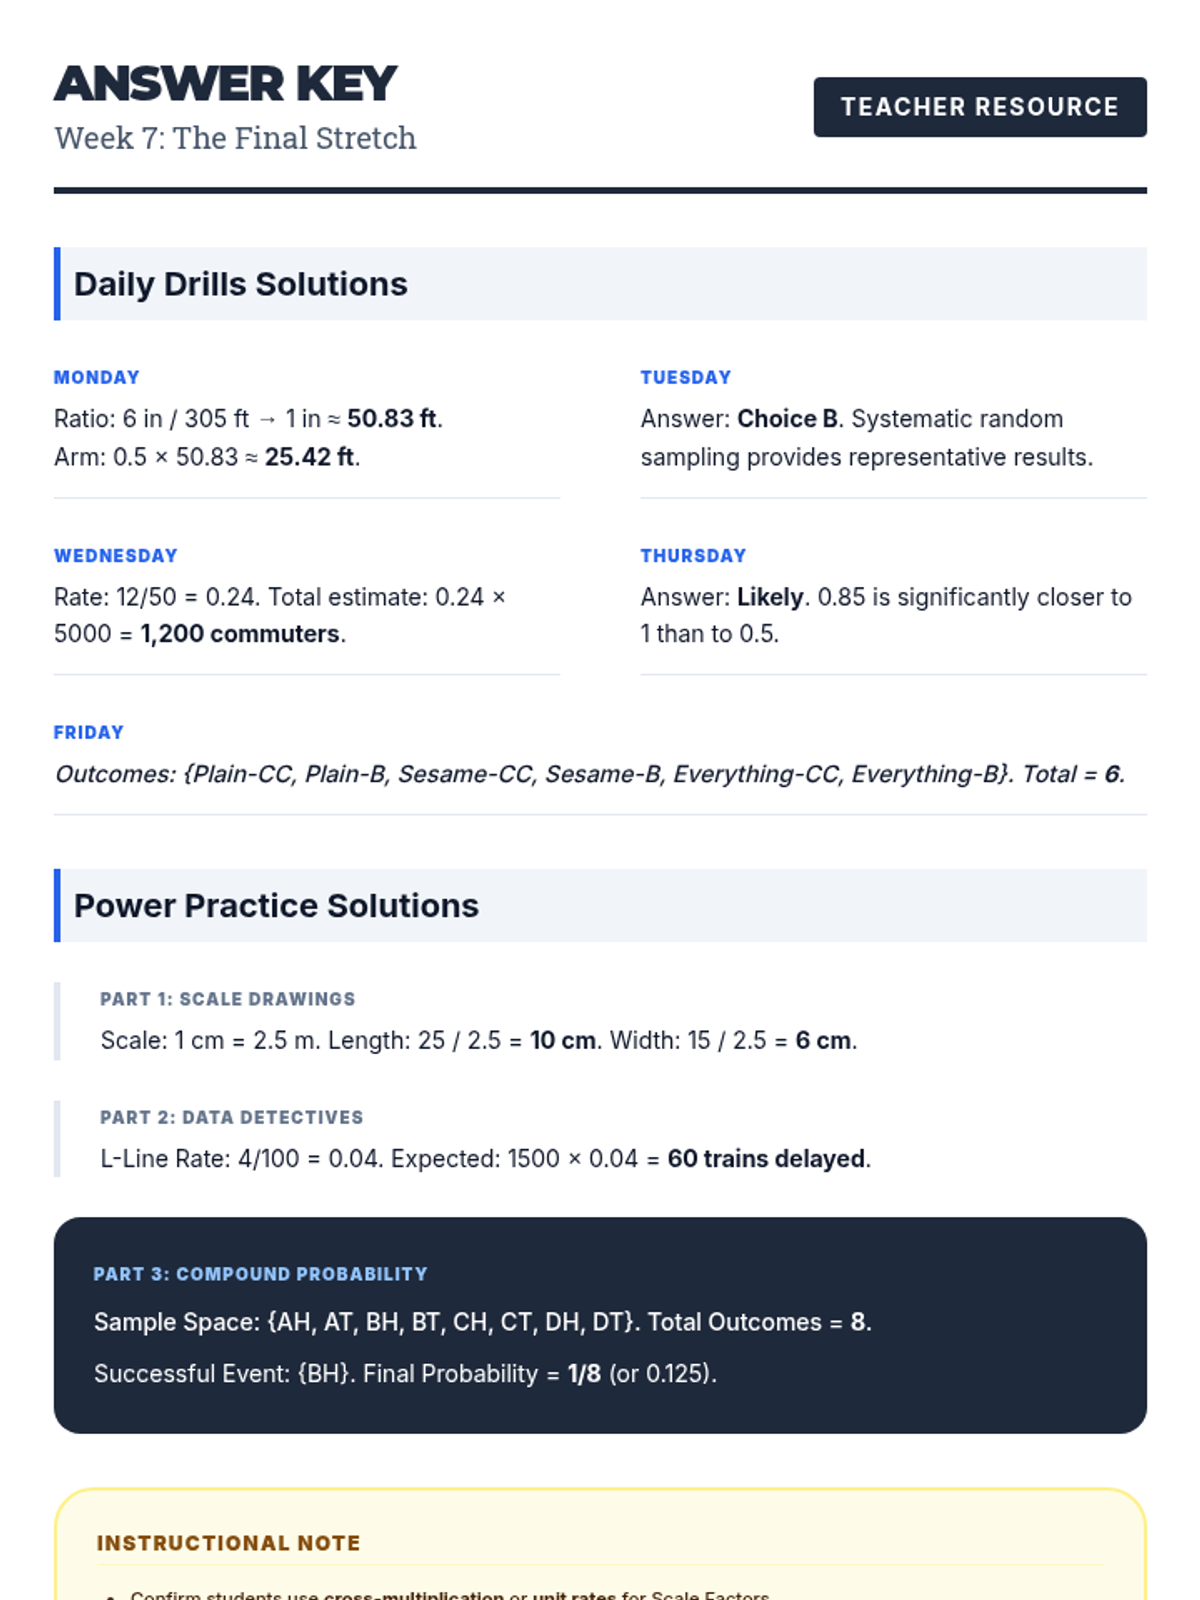
Reviewing scale drawings, statistics, and probability to round out the comprehensive NYS Assessment preparation.
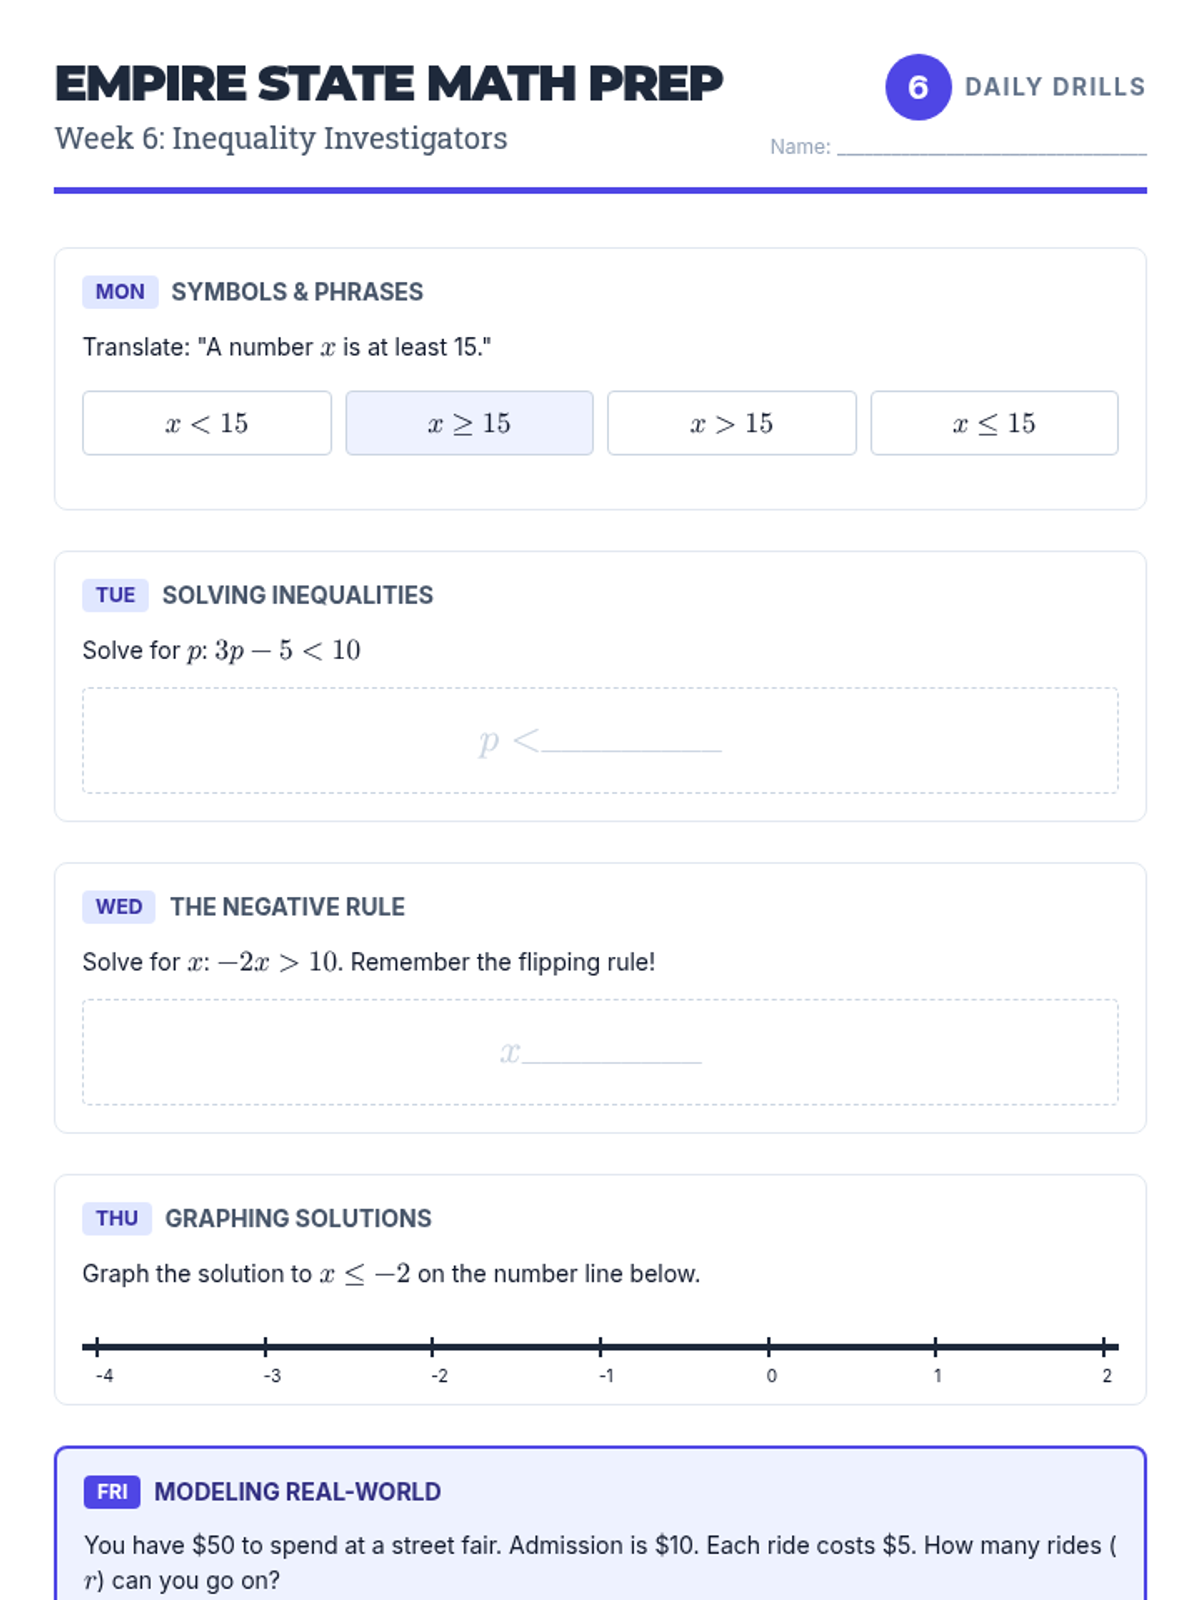
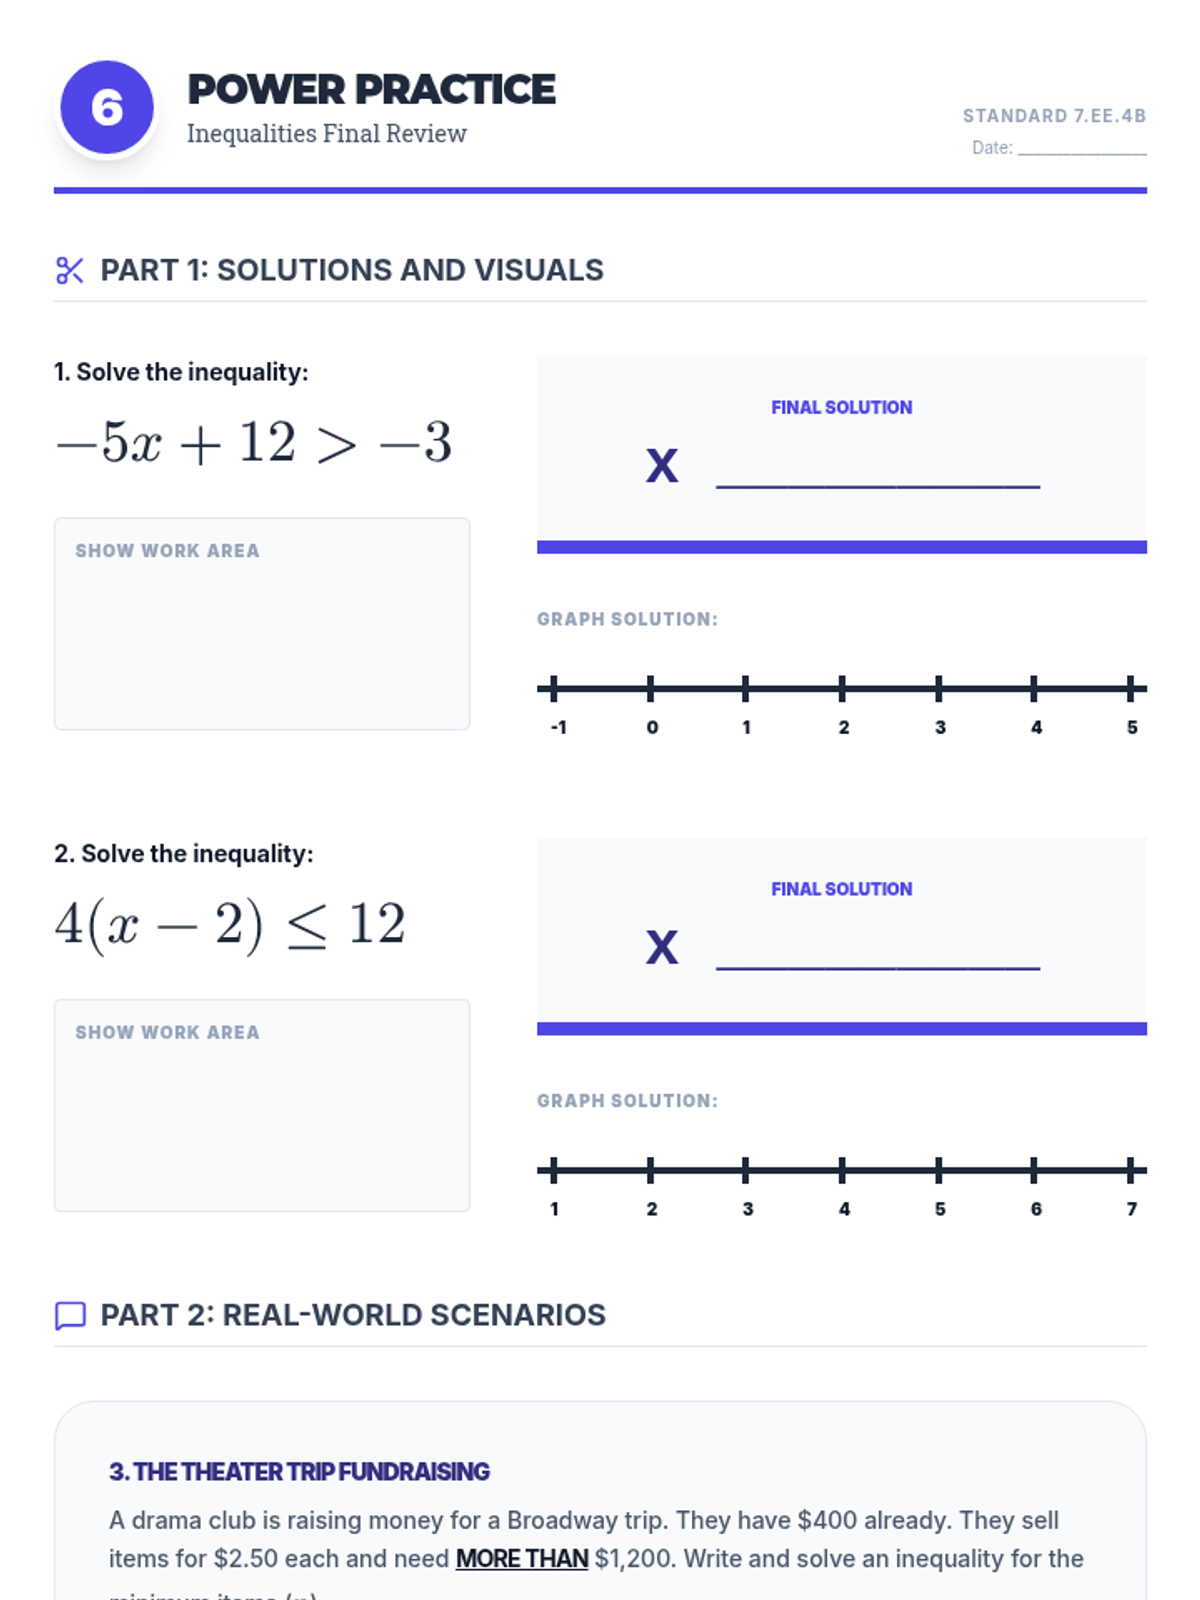
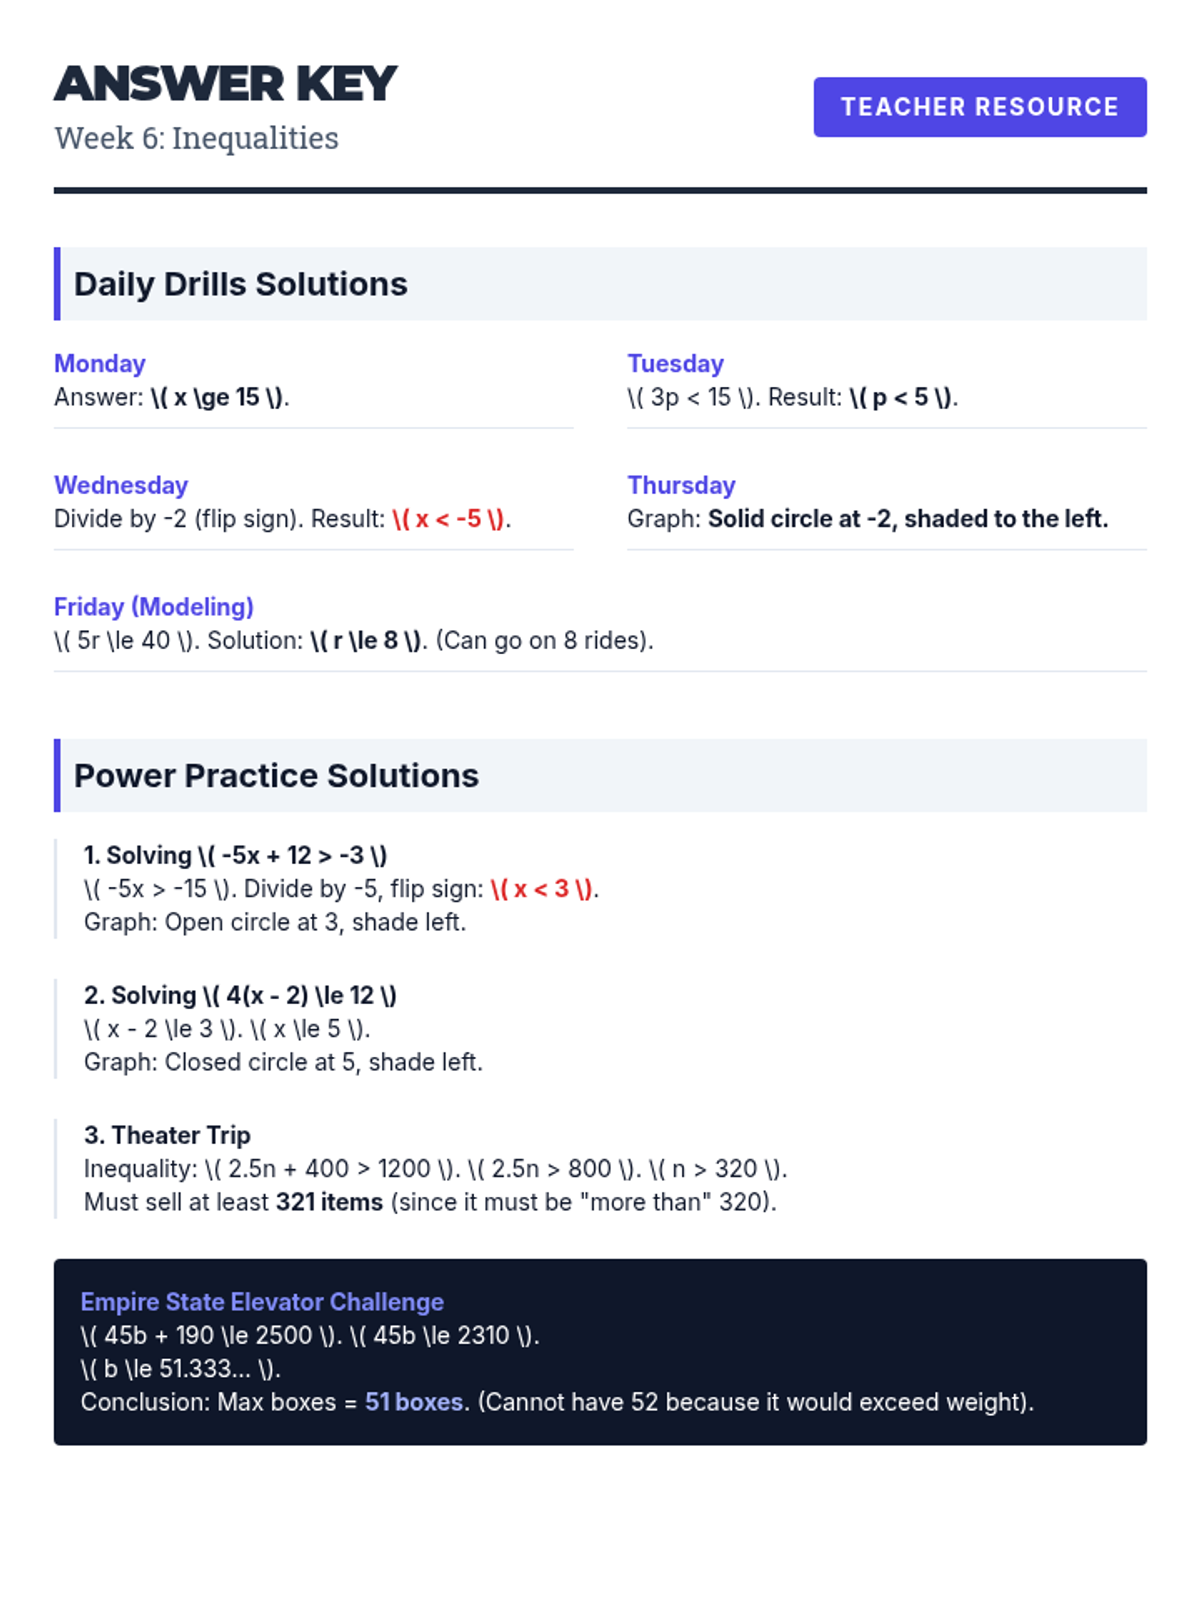
Solving and graphing linear inequalities and applying them to real-world NYS assessment scenarios.
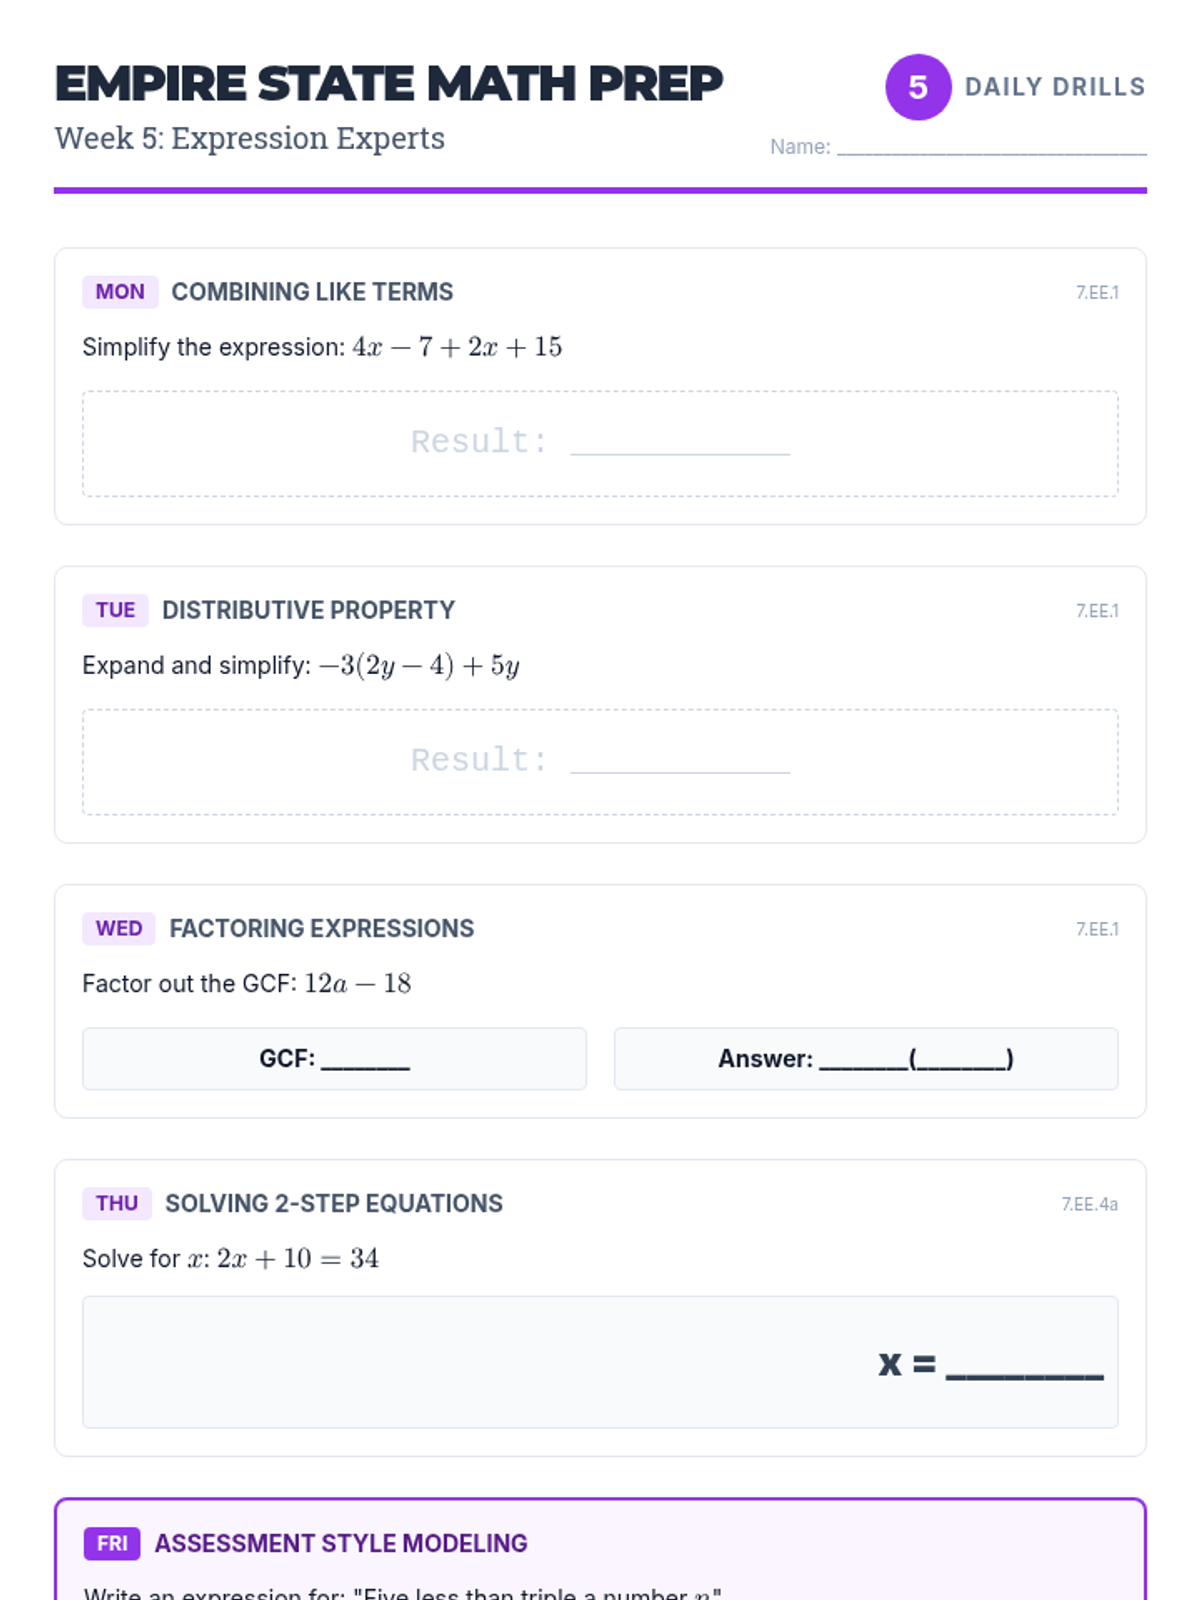
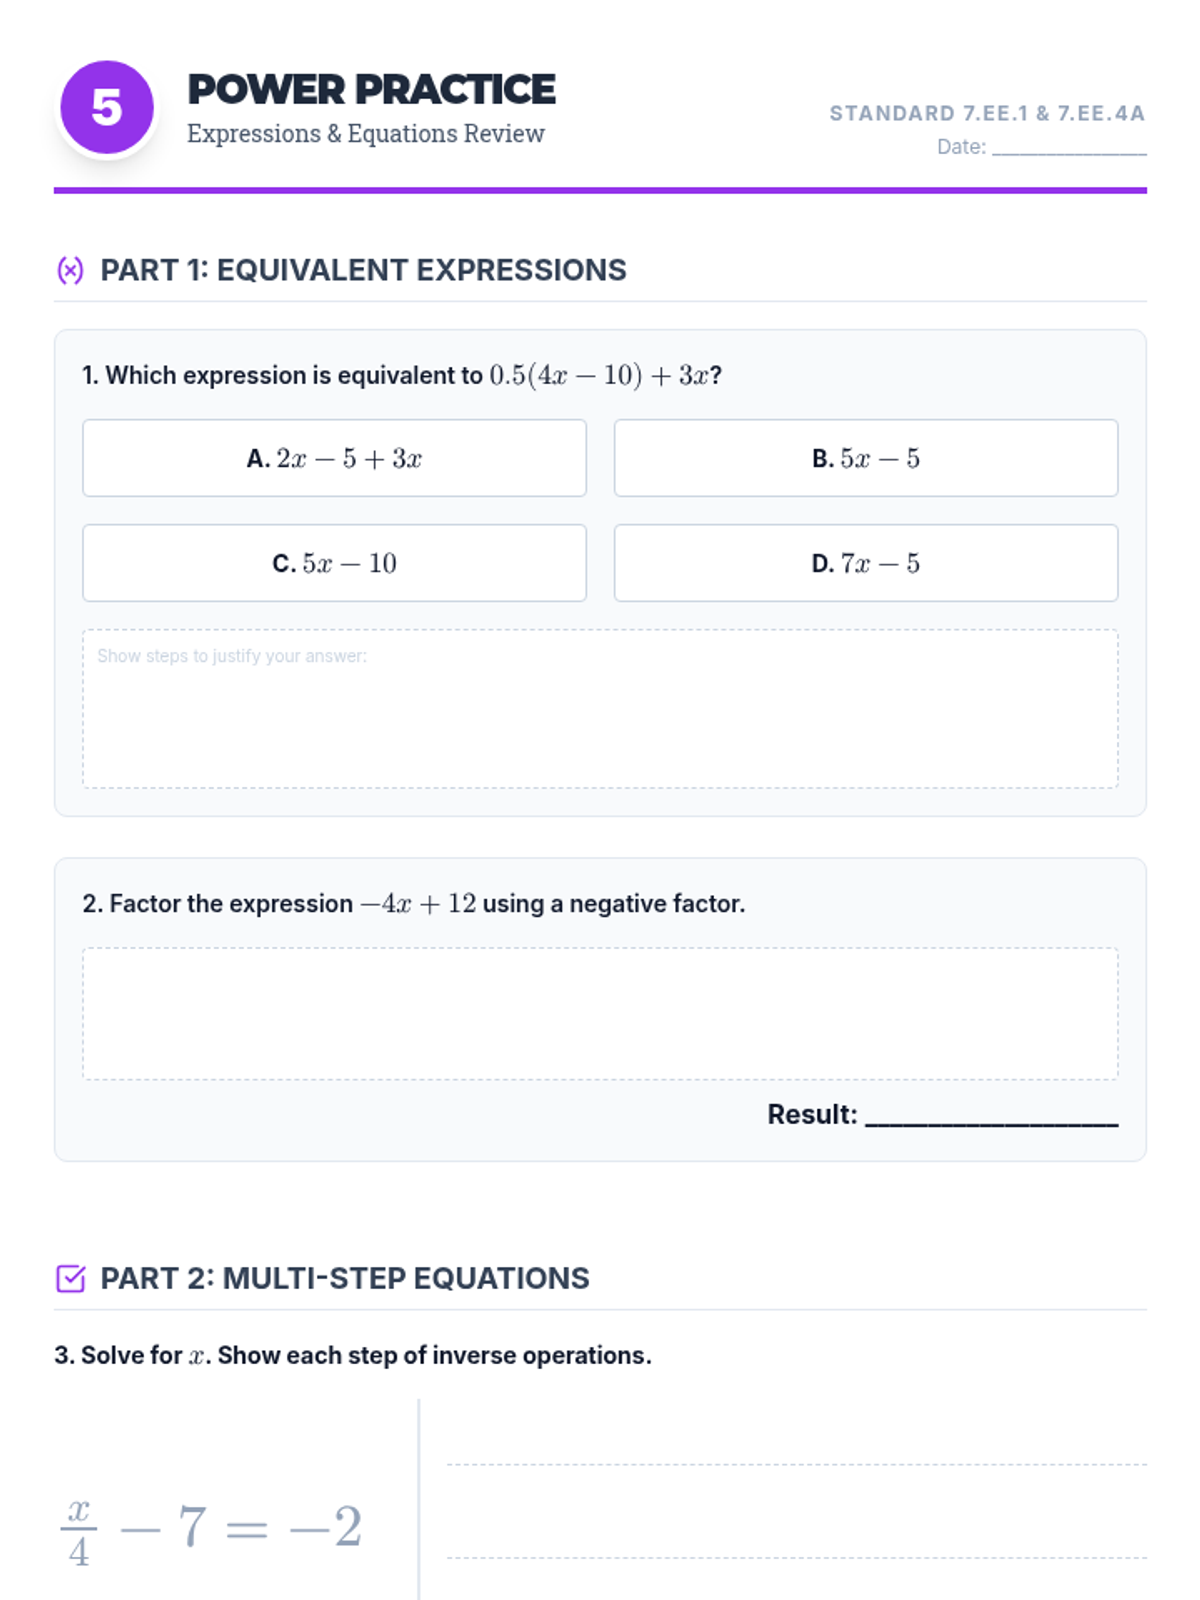
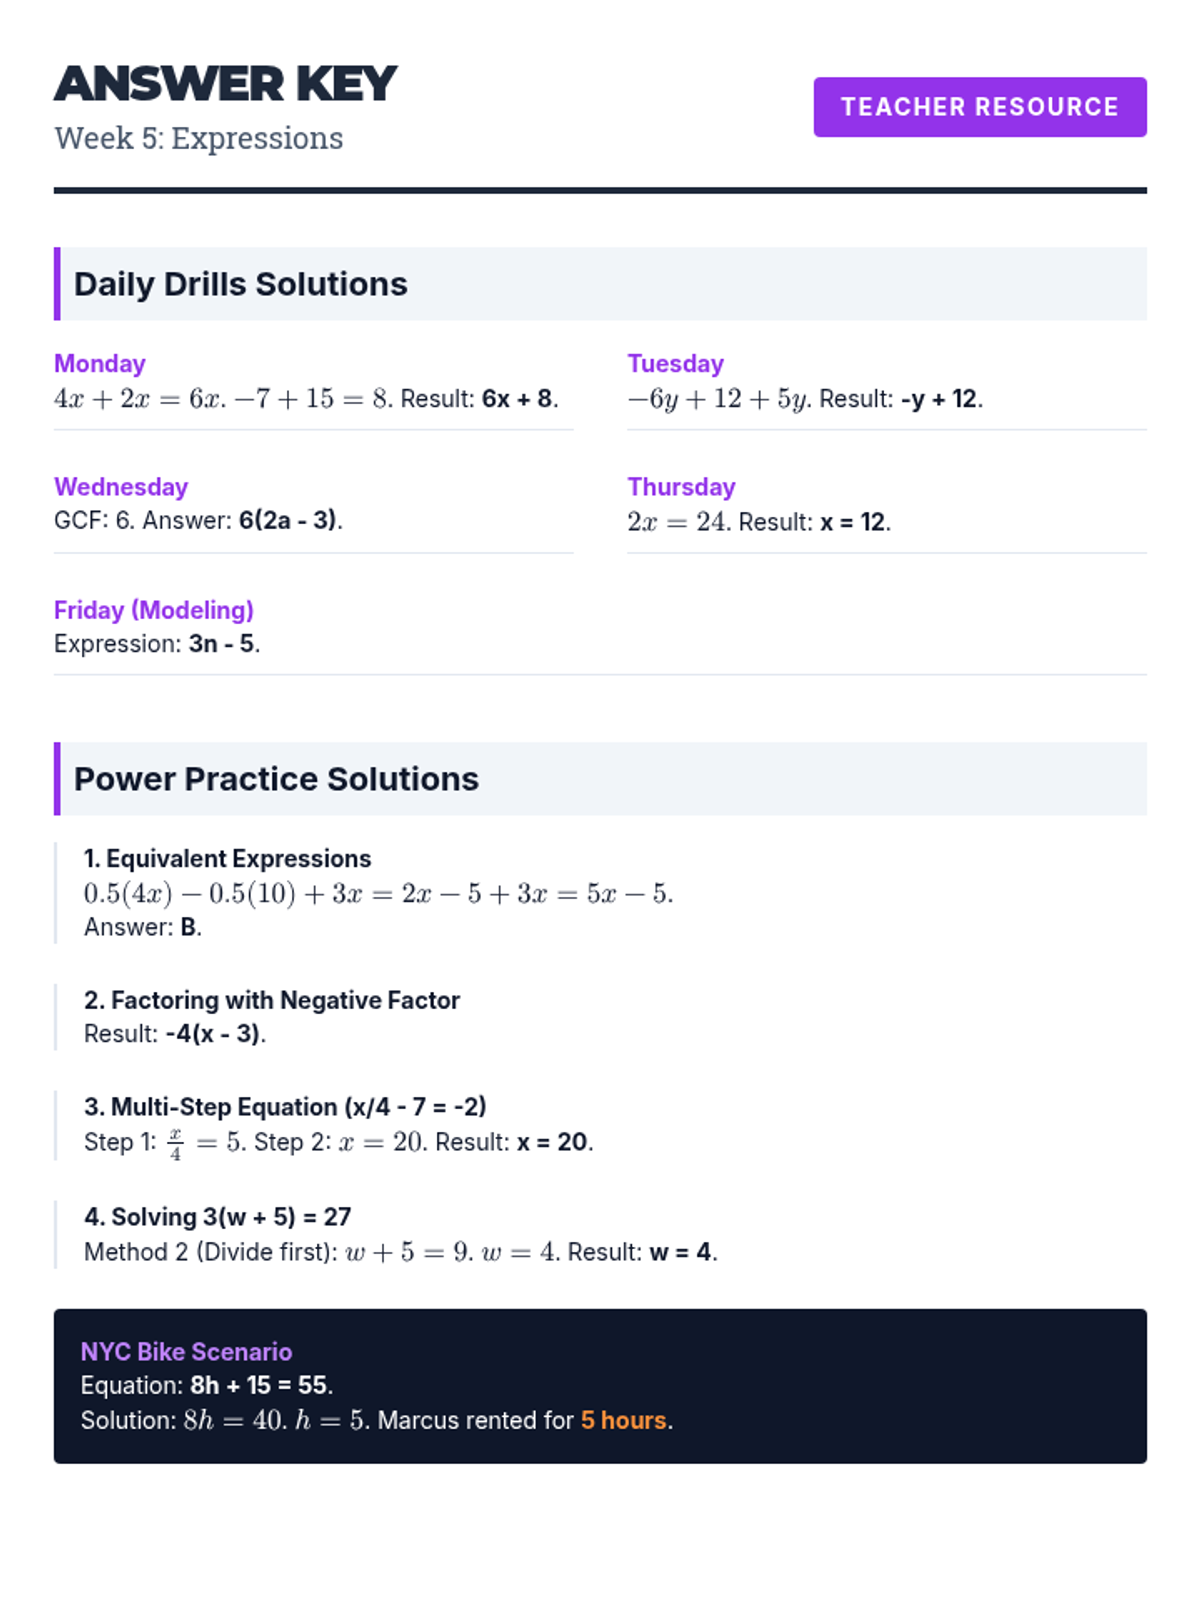
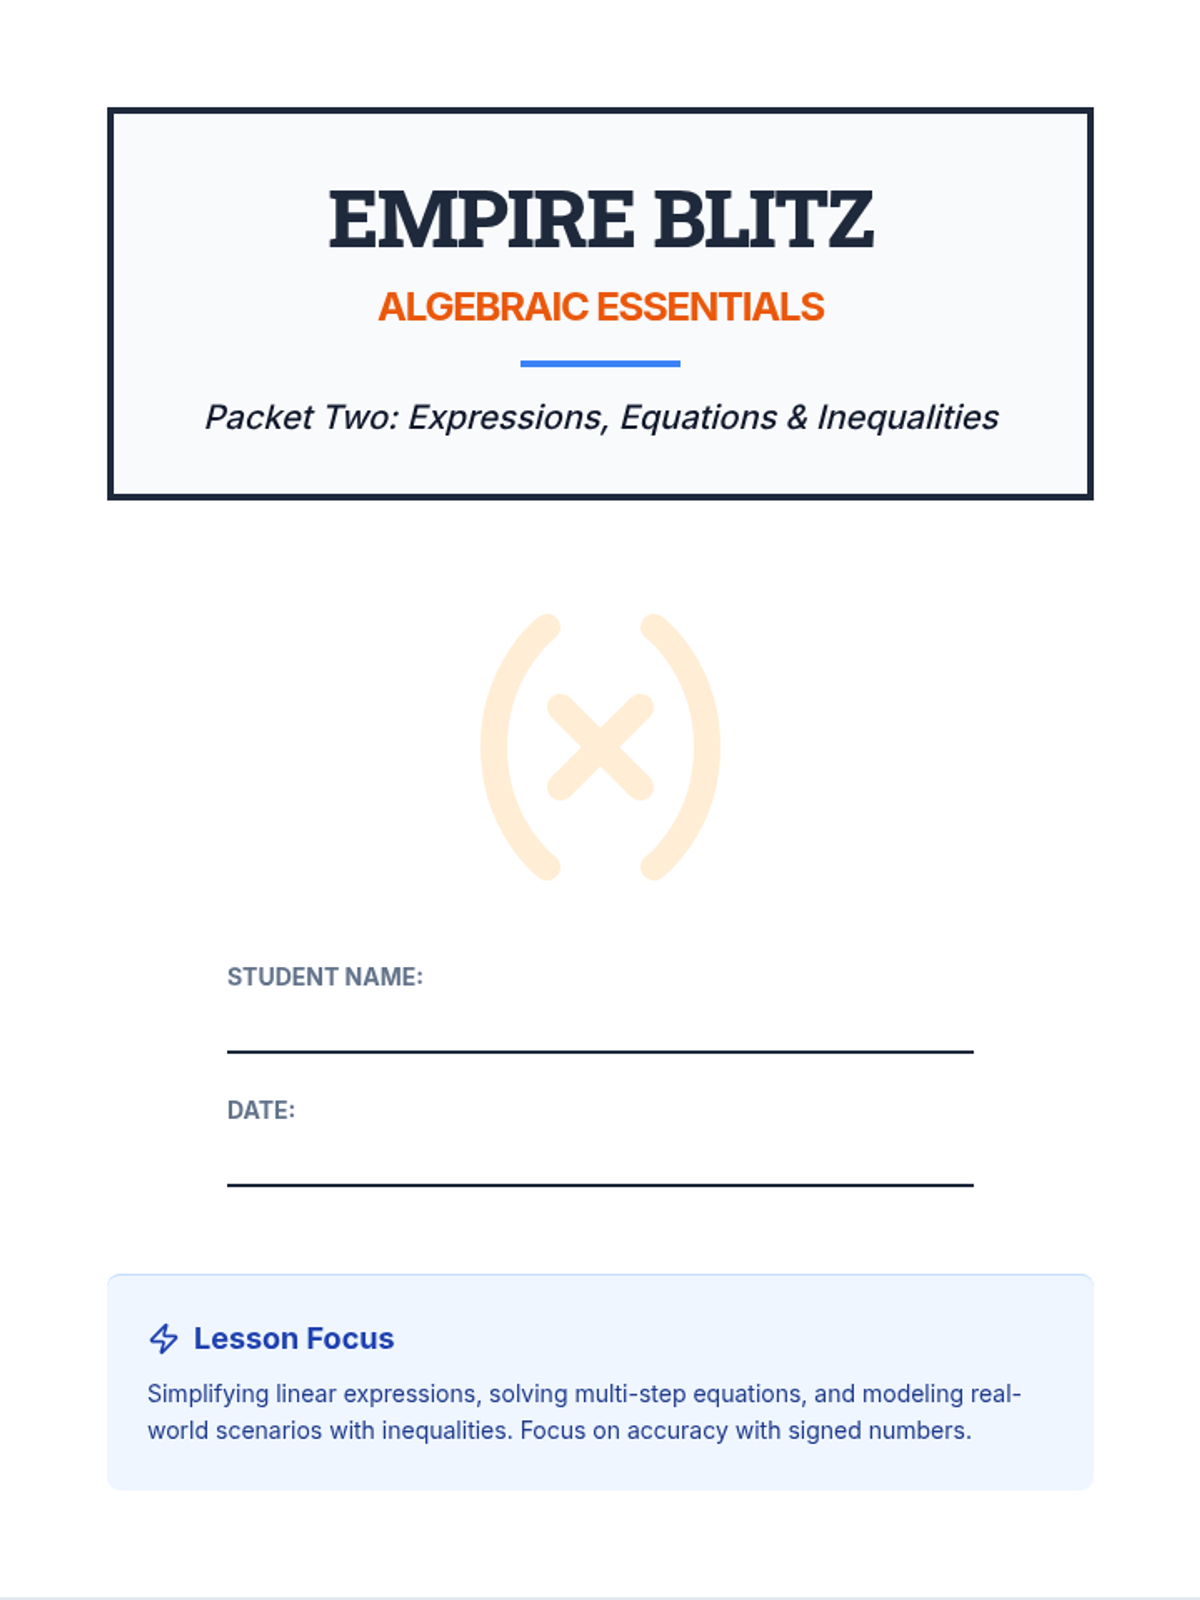
Simplifying linear expressions and solving multi-step equations using properties of operations.
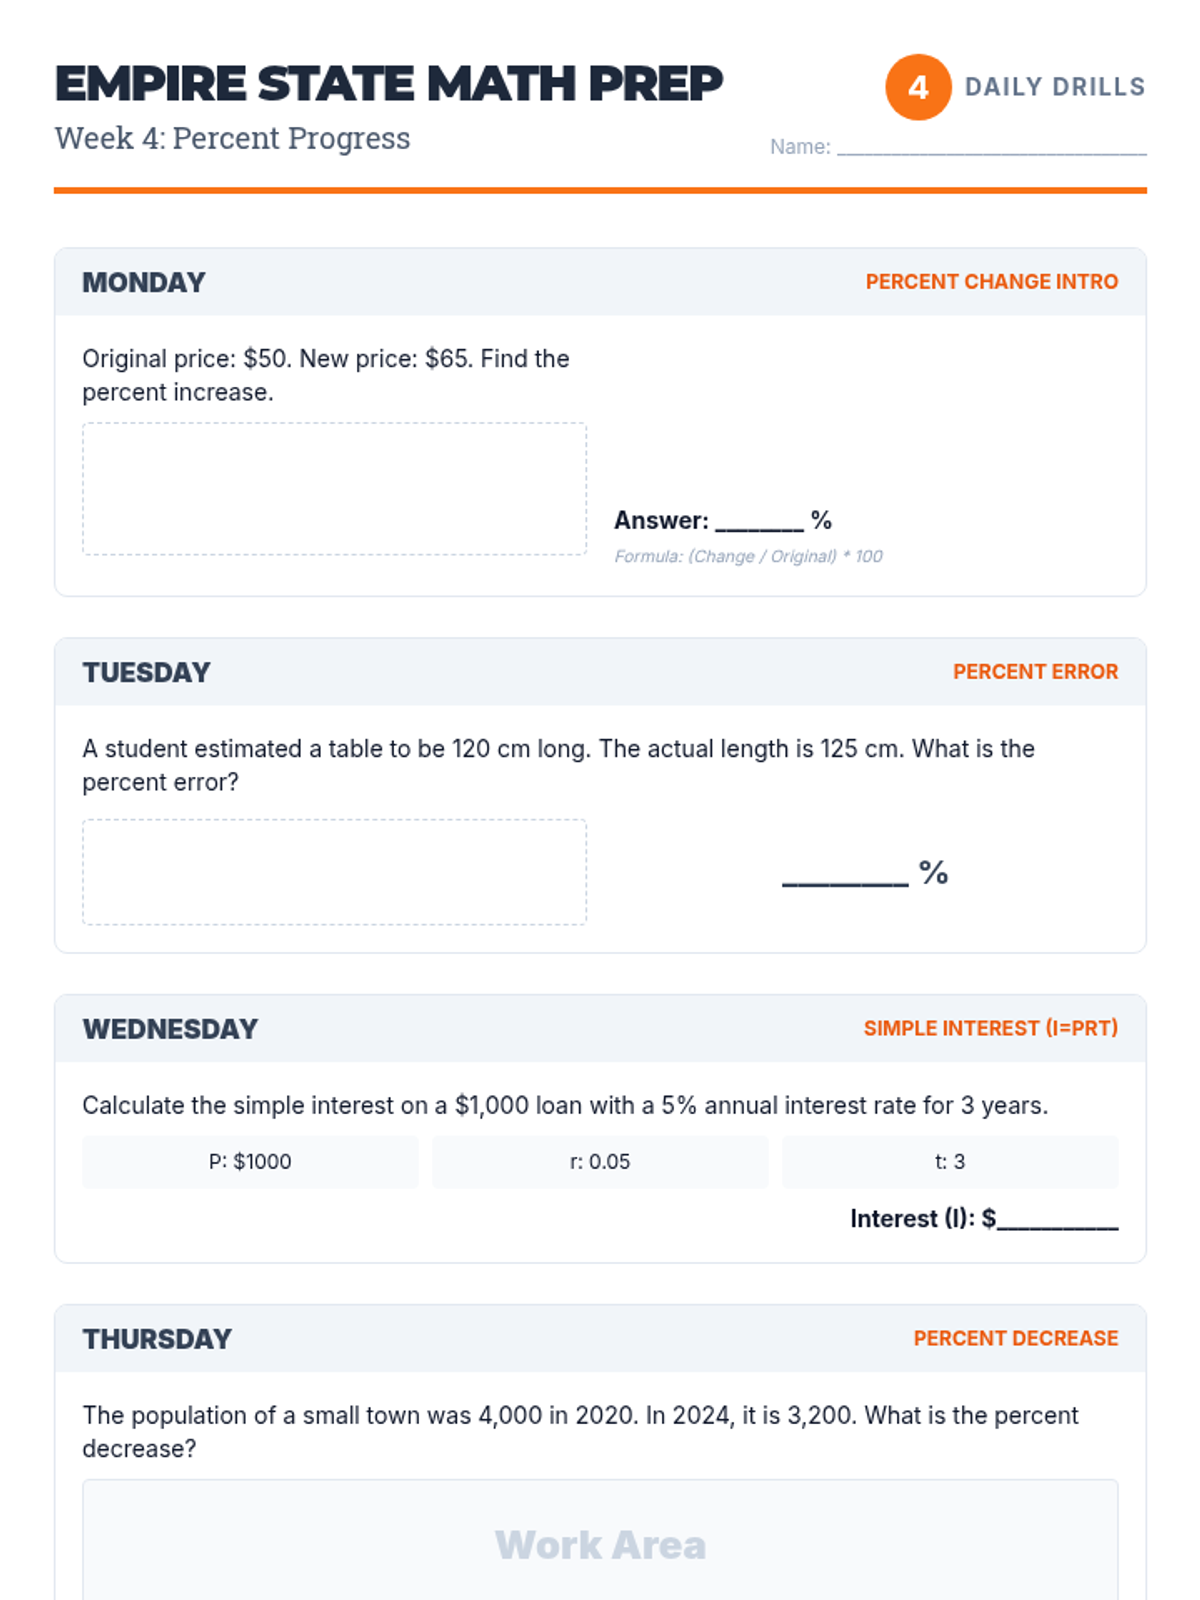
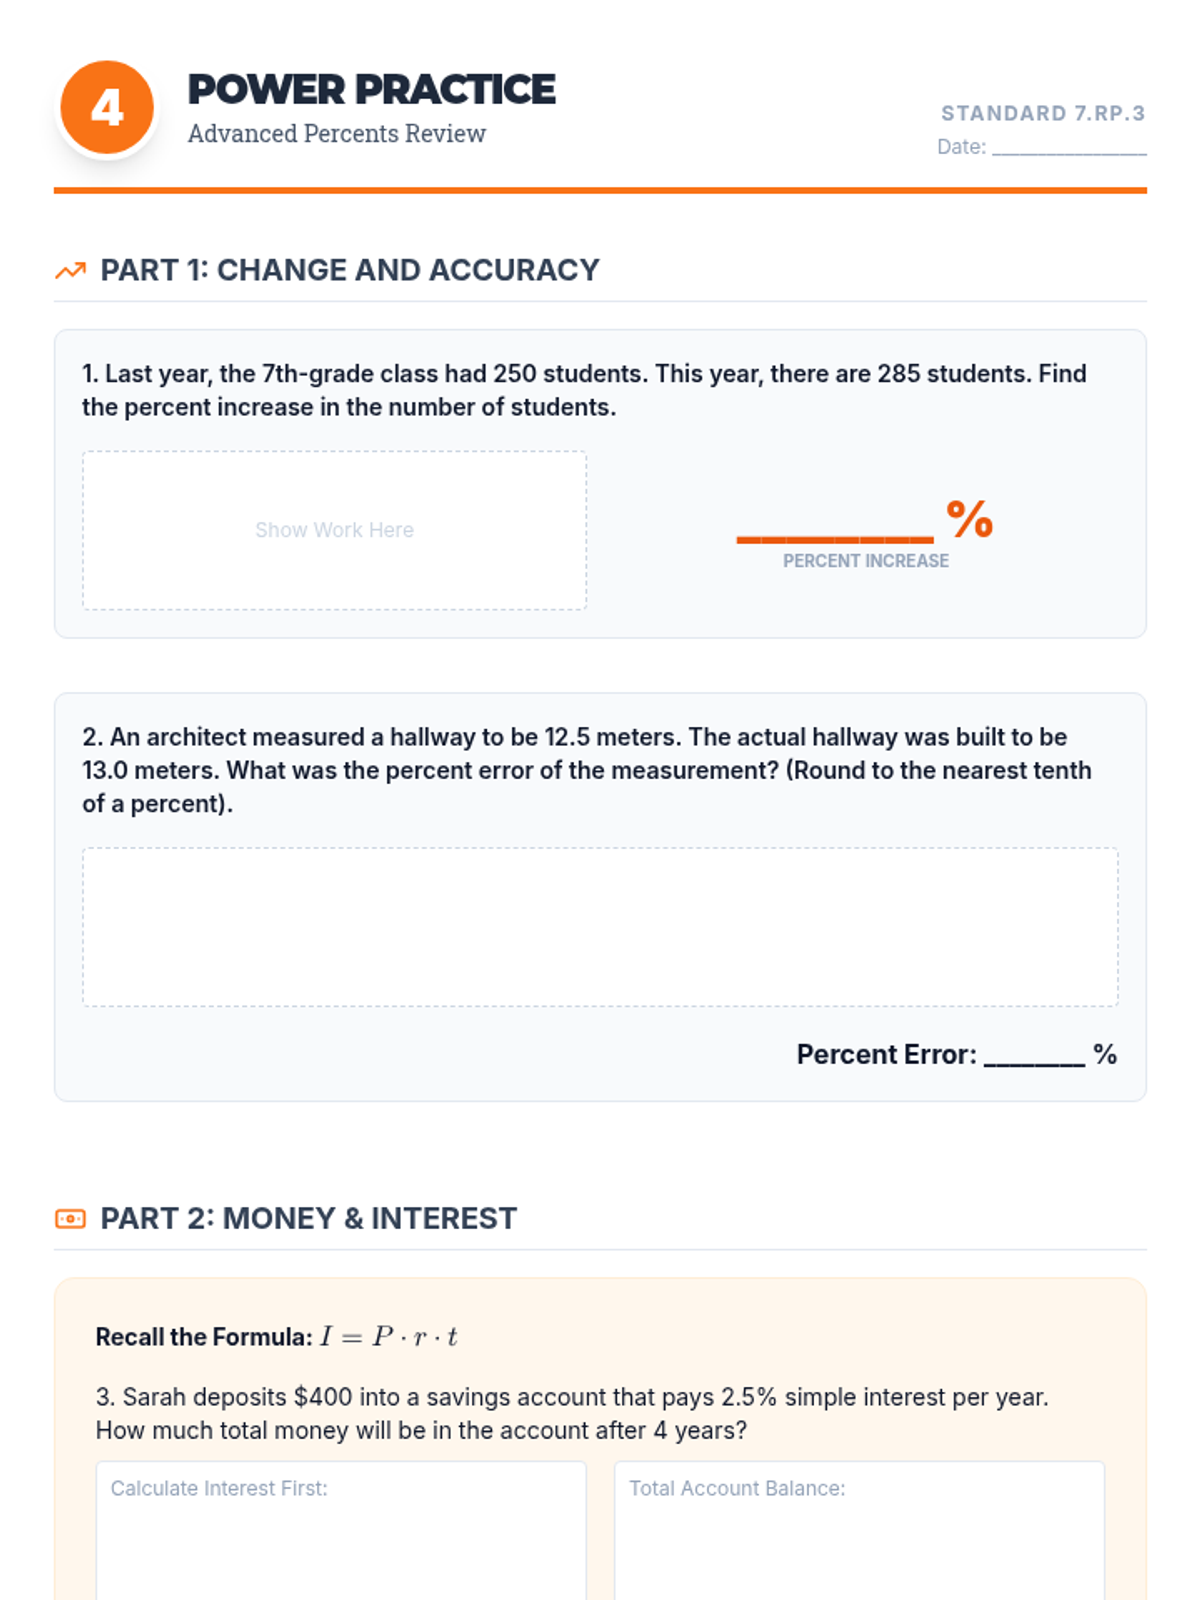
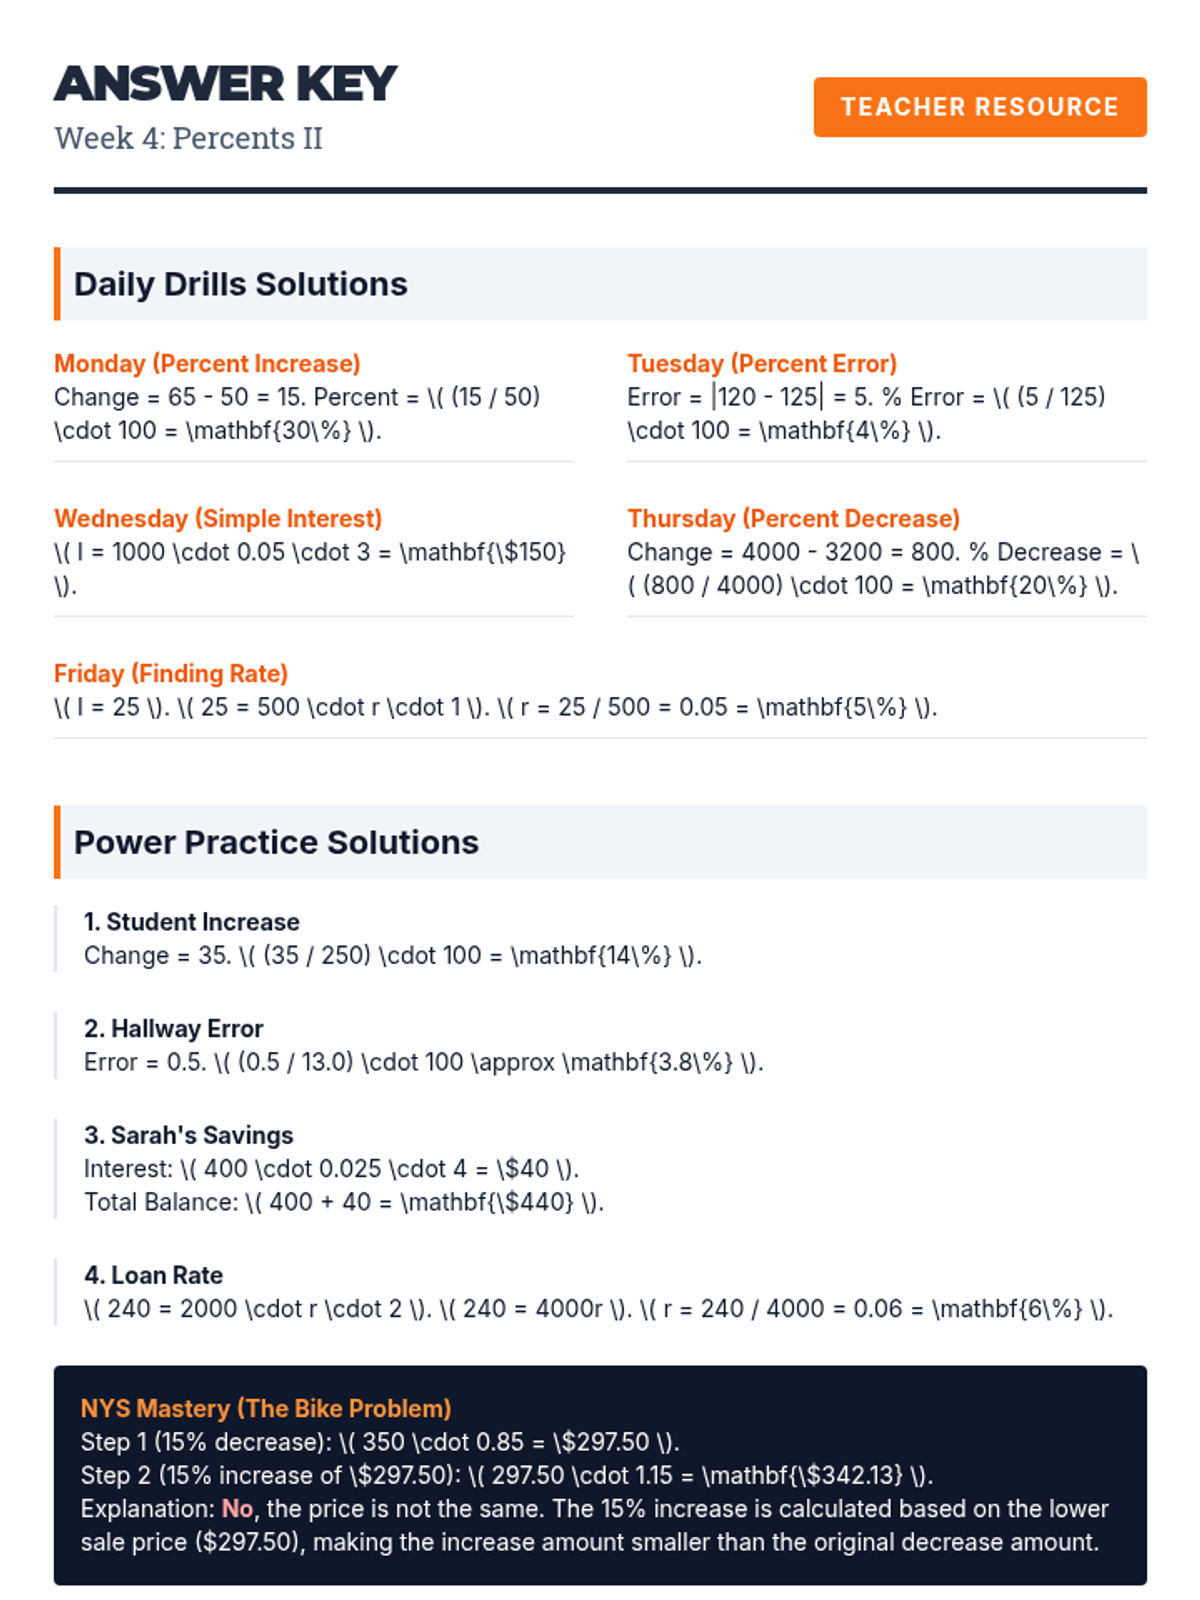
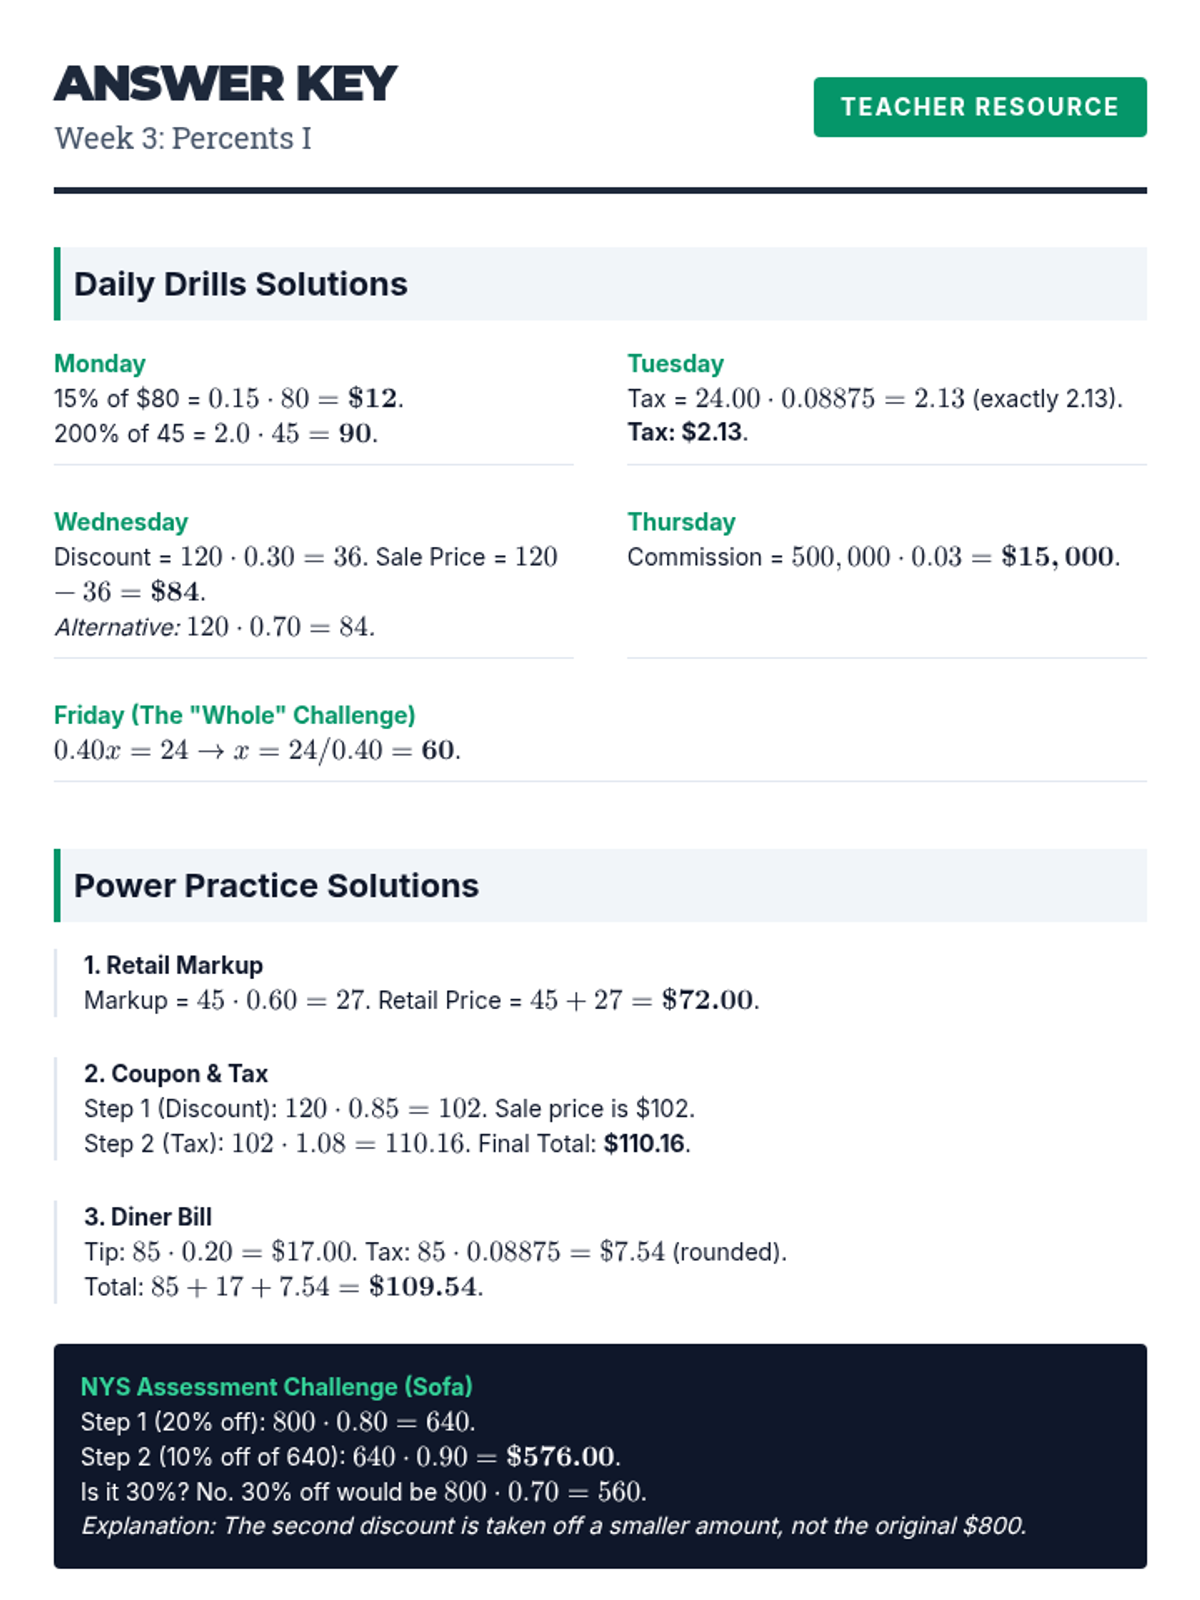
Advanced percent problems including simple interest, percent change (increase/decrease), and percent error.
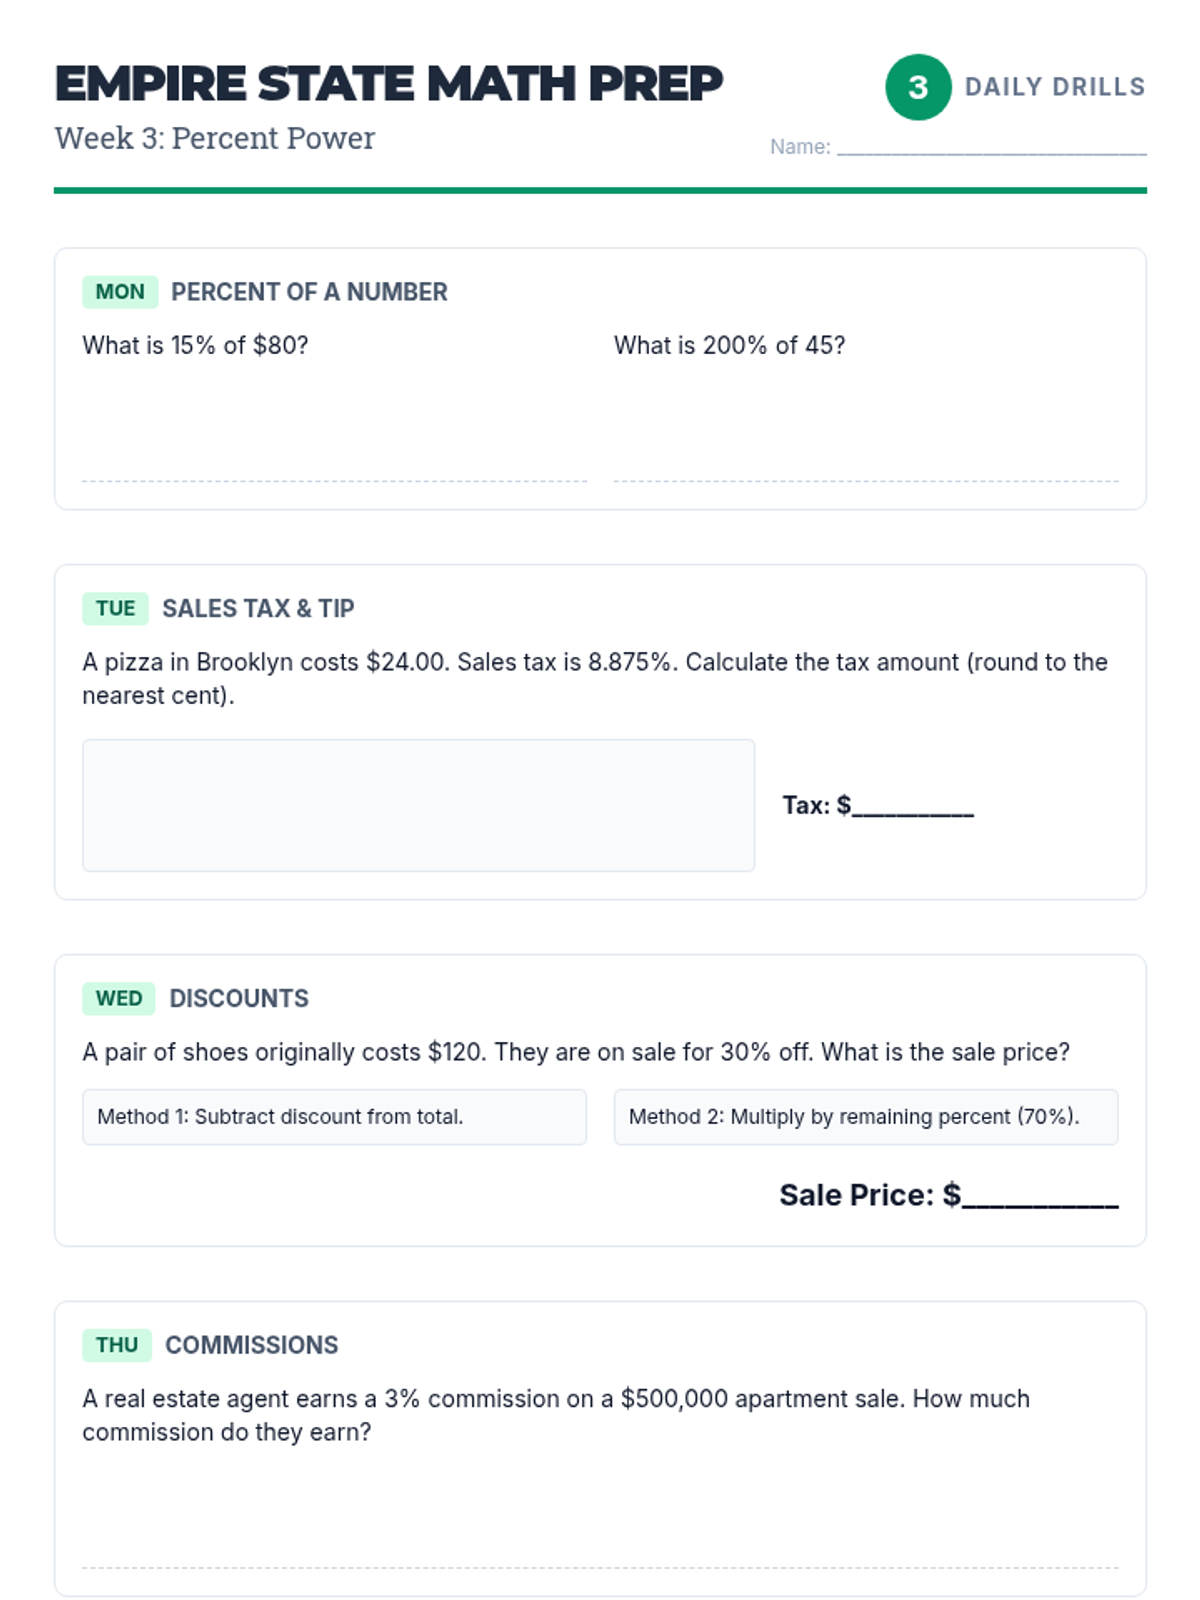
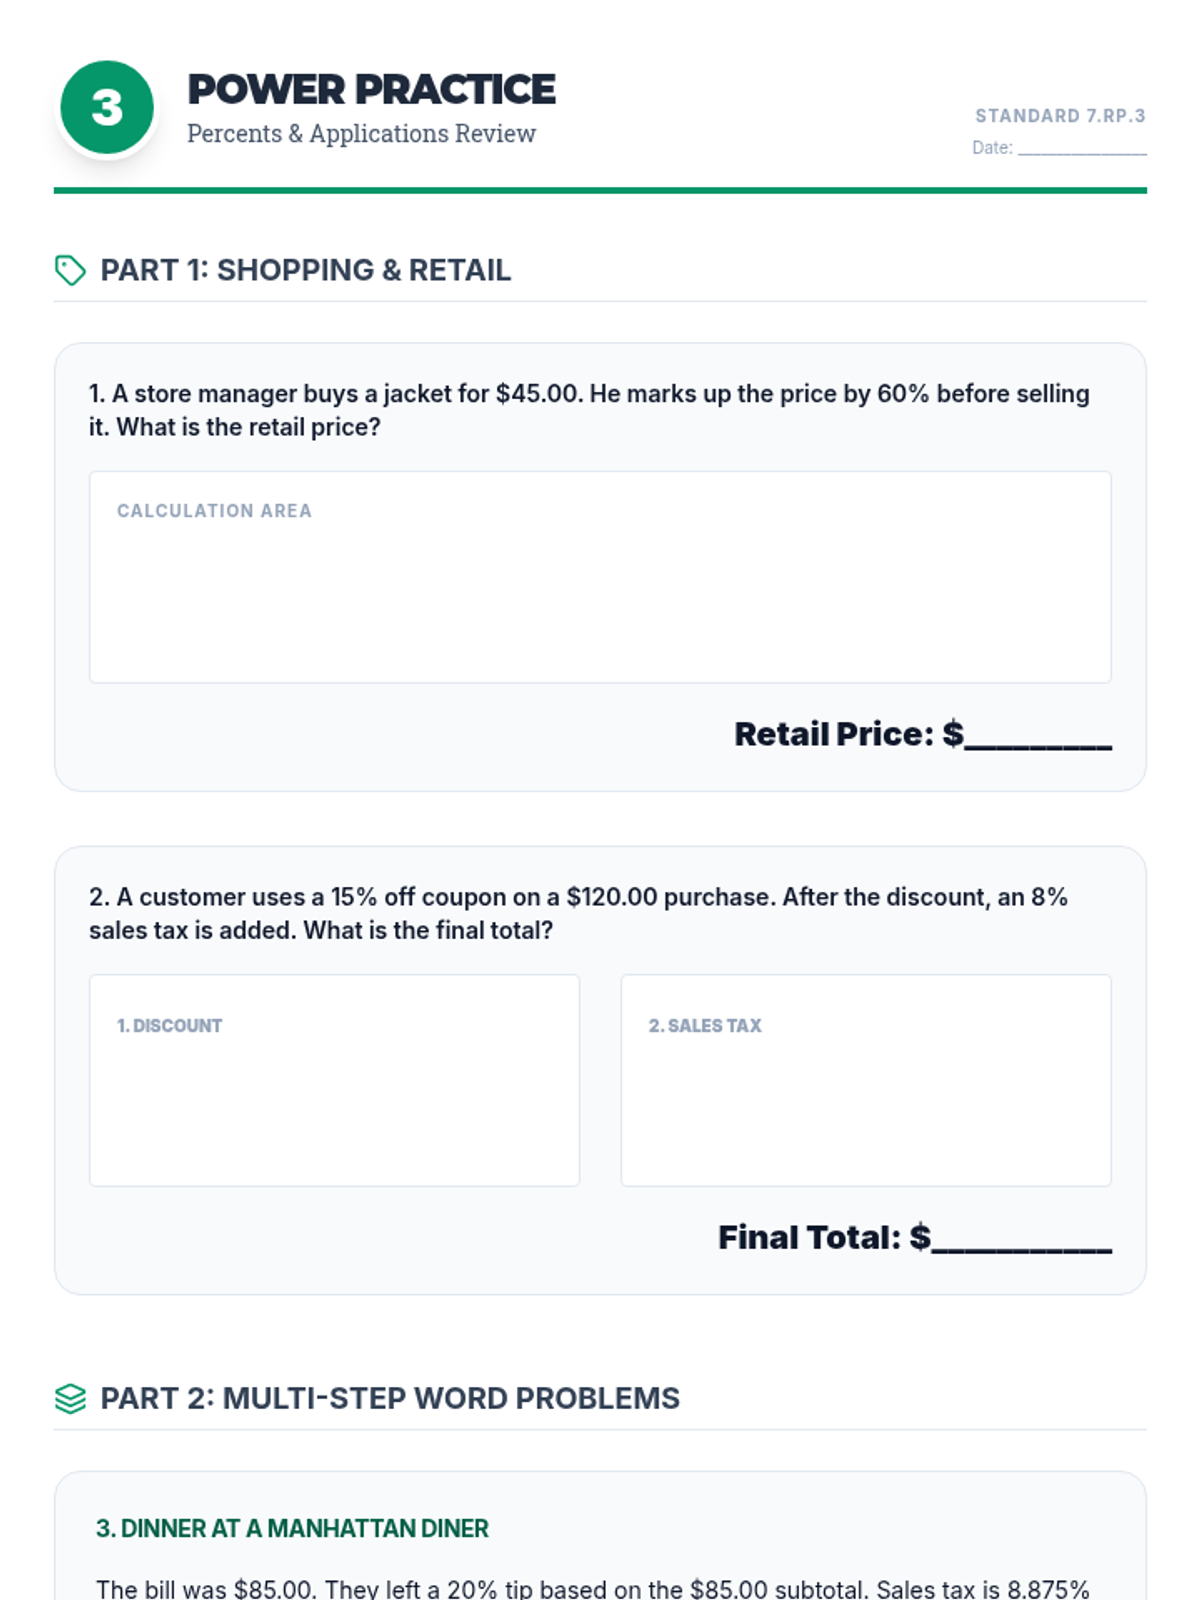
Practical applications of percents, including calculating tax, tip, commissions, discounts, and markups.
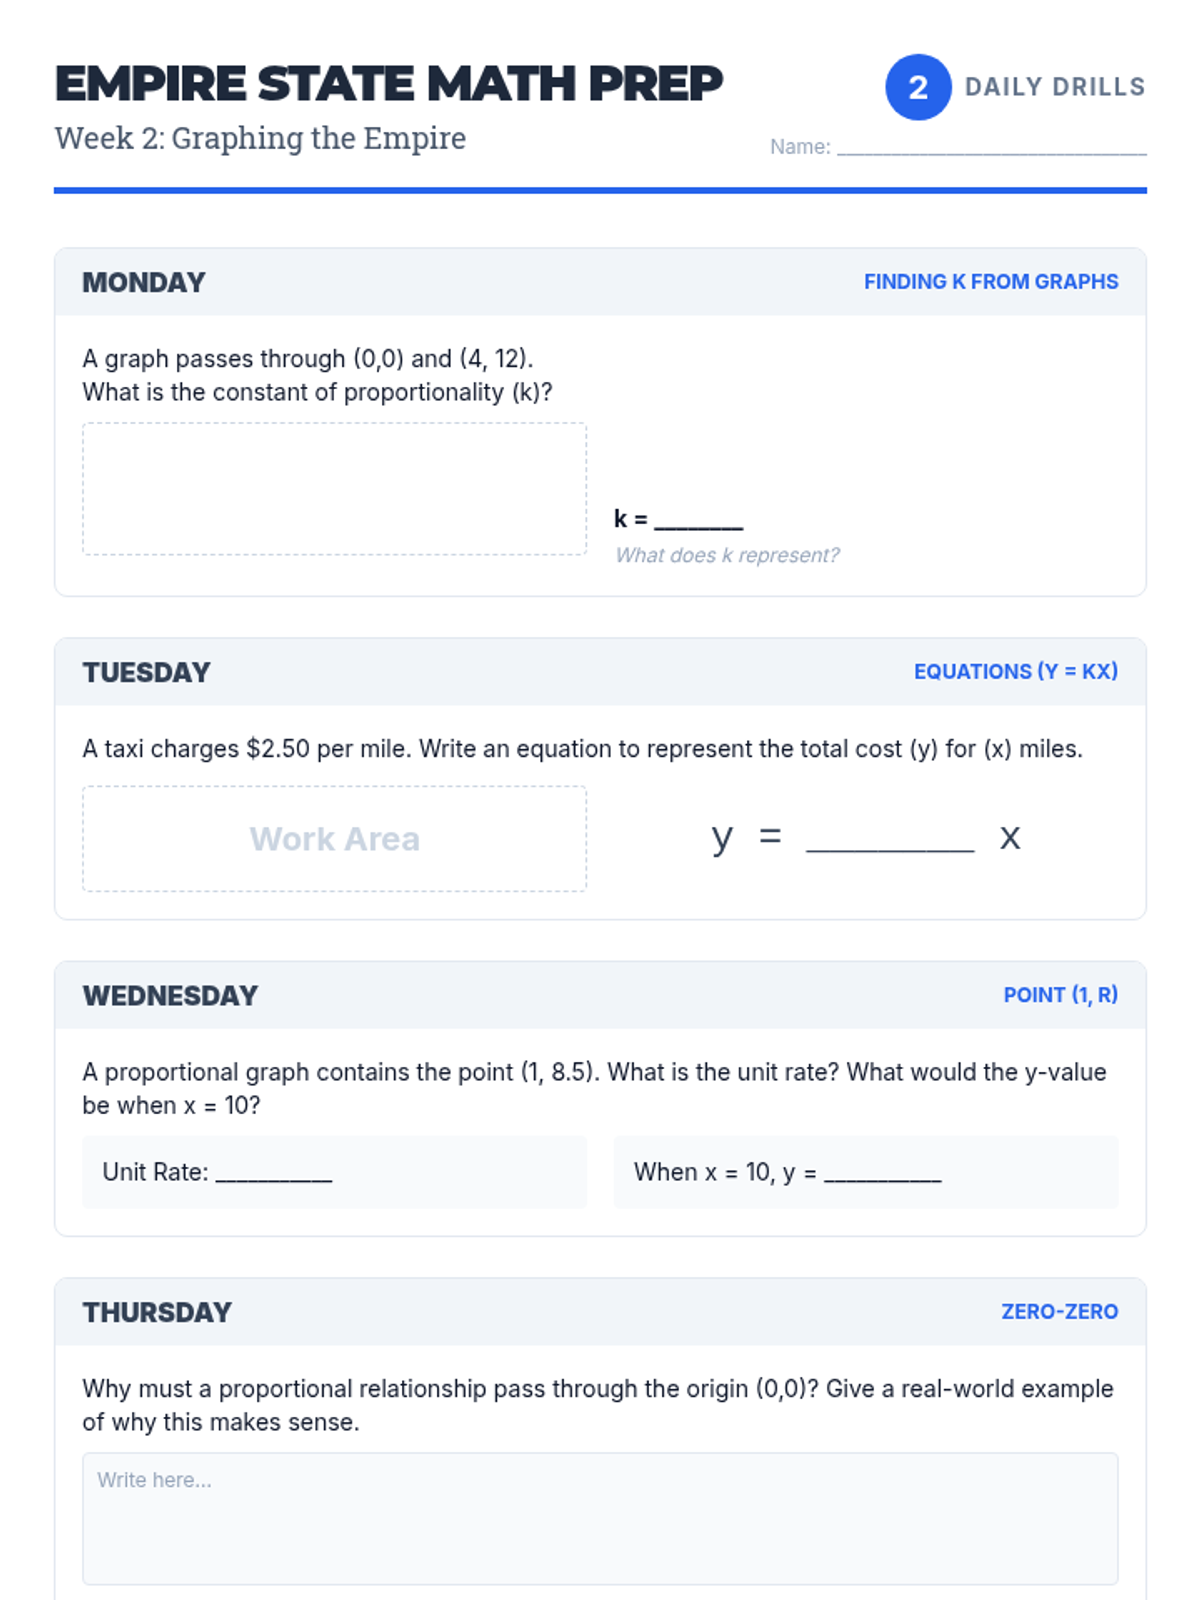
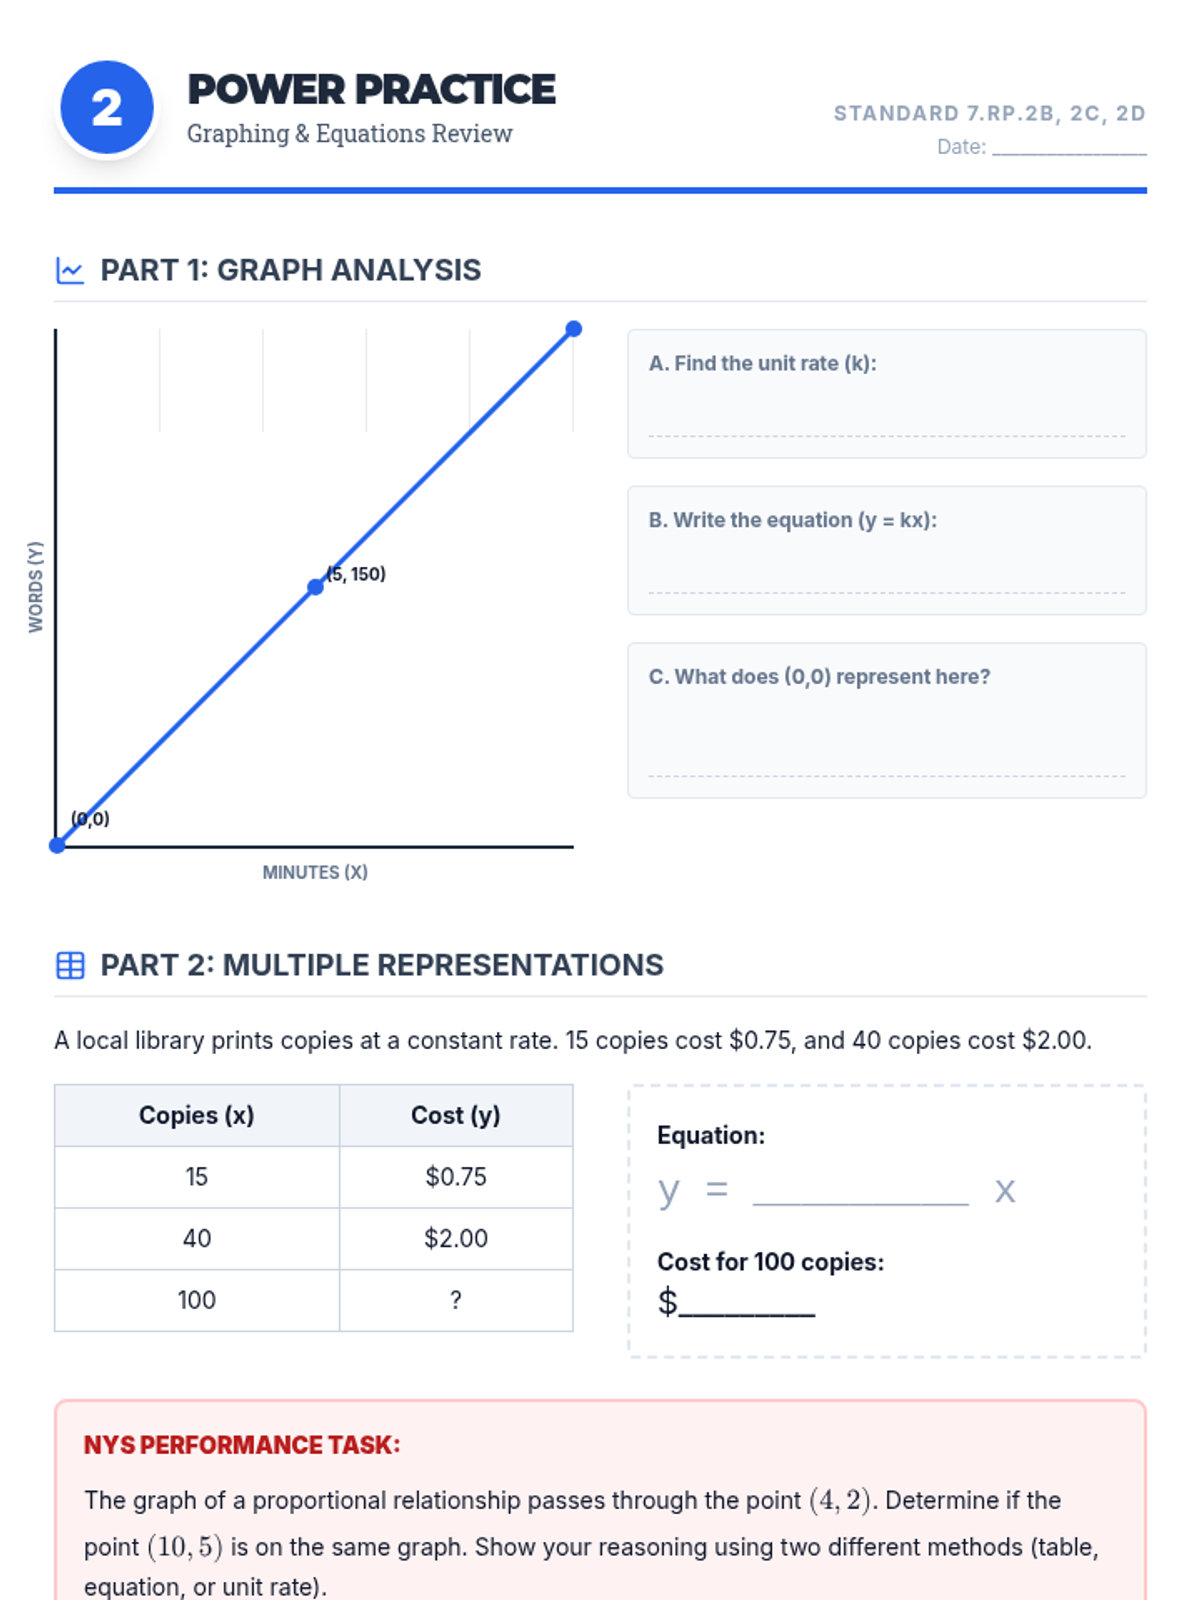
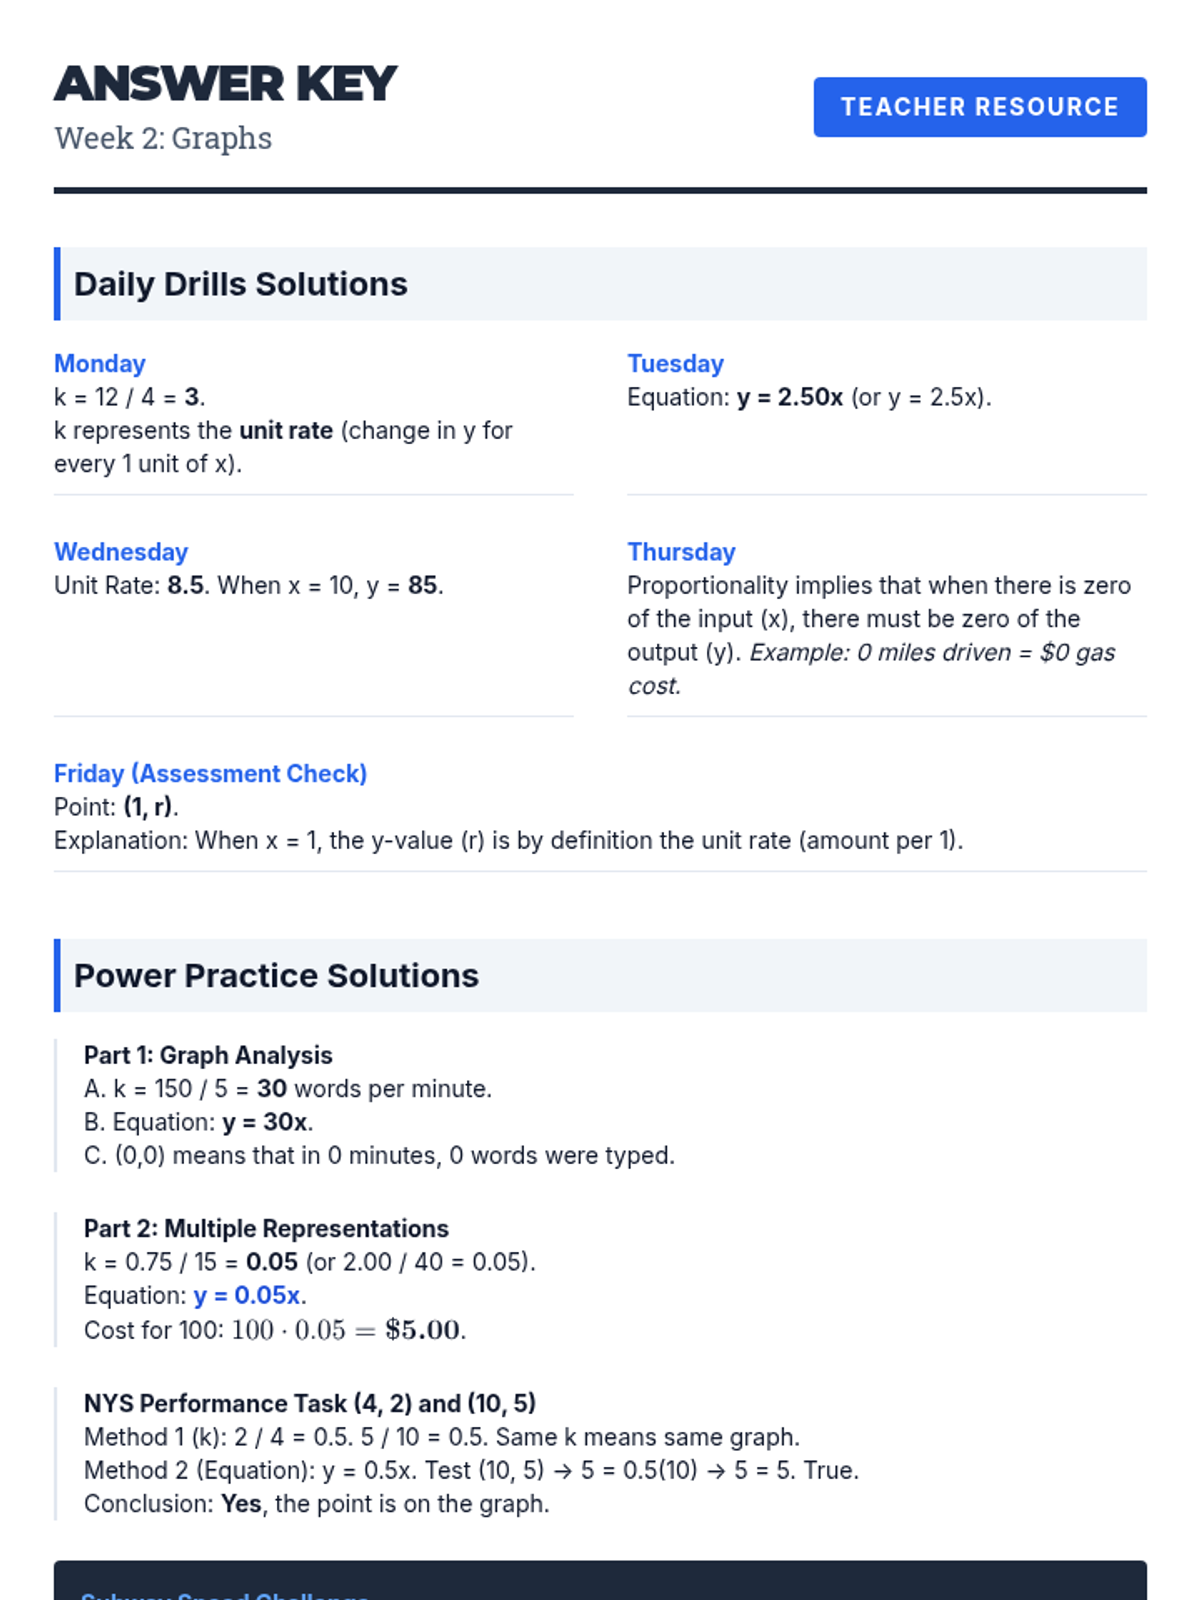
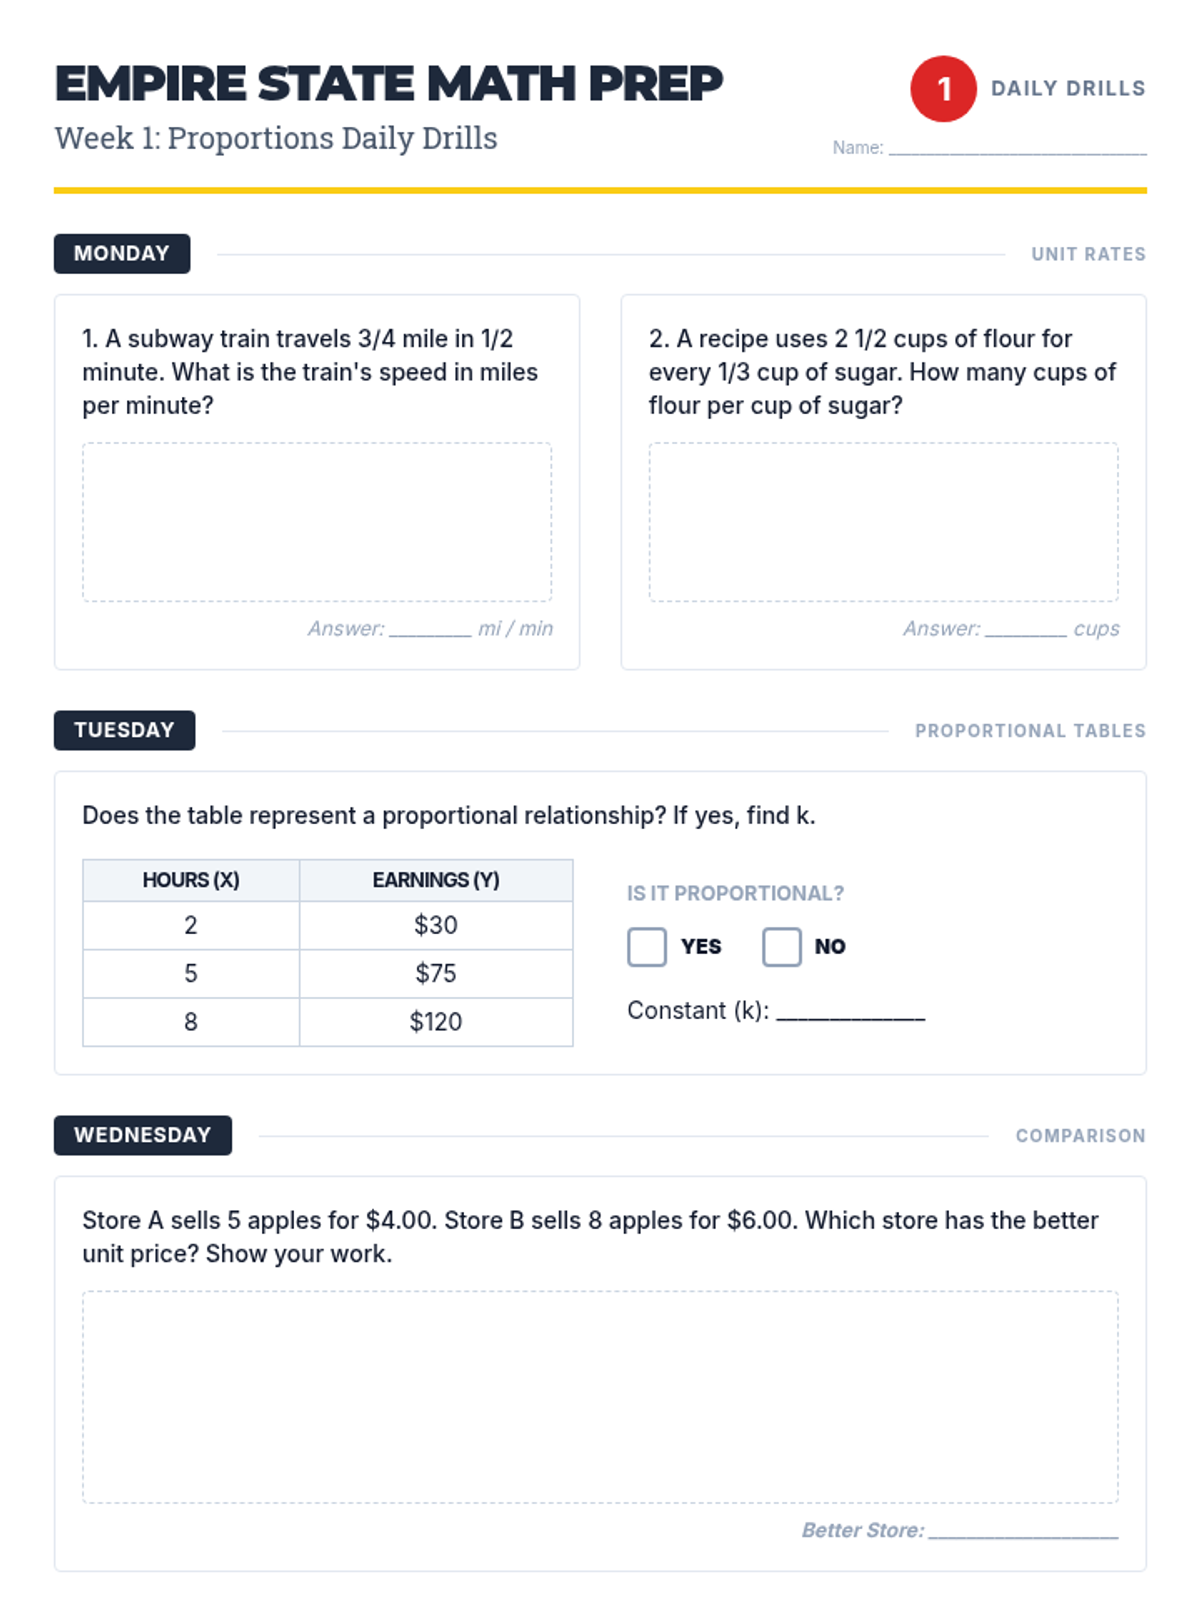
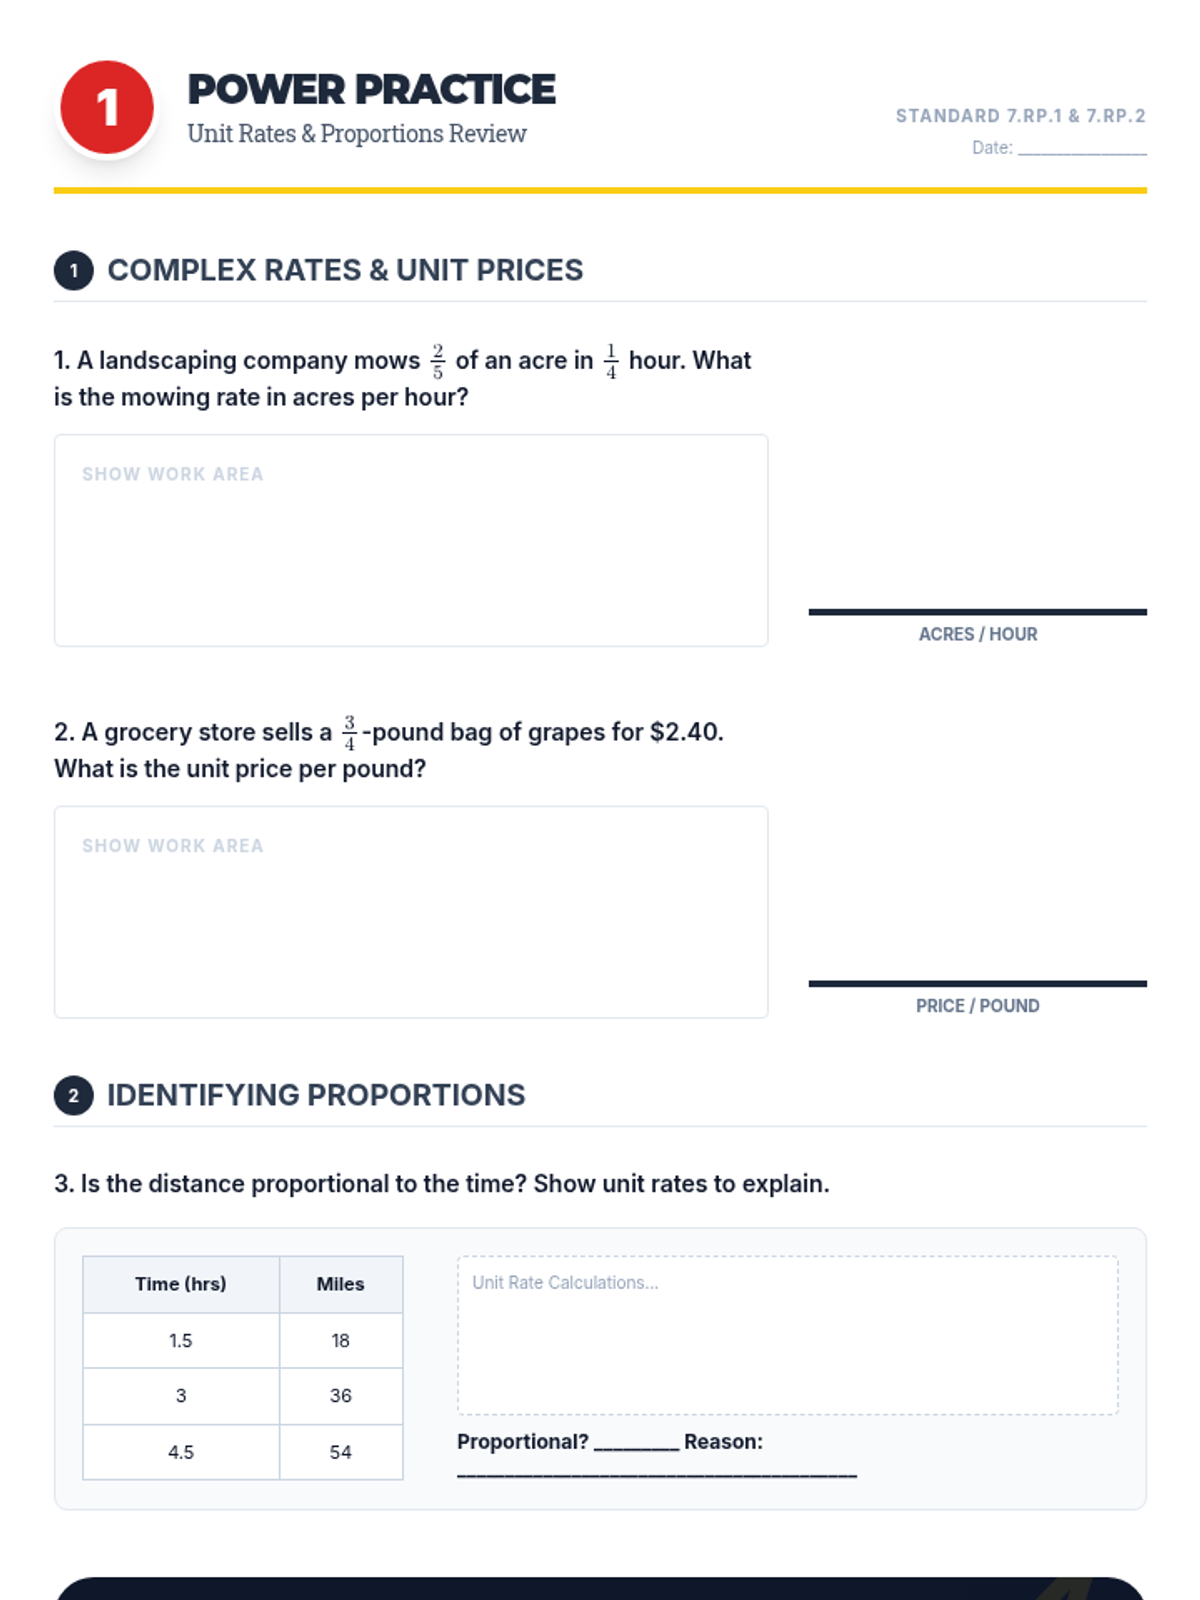
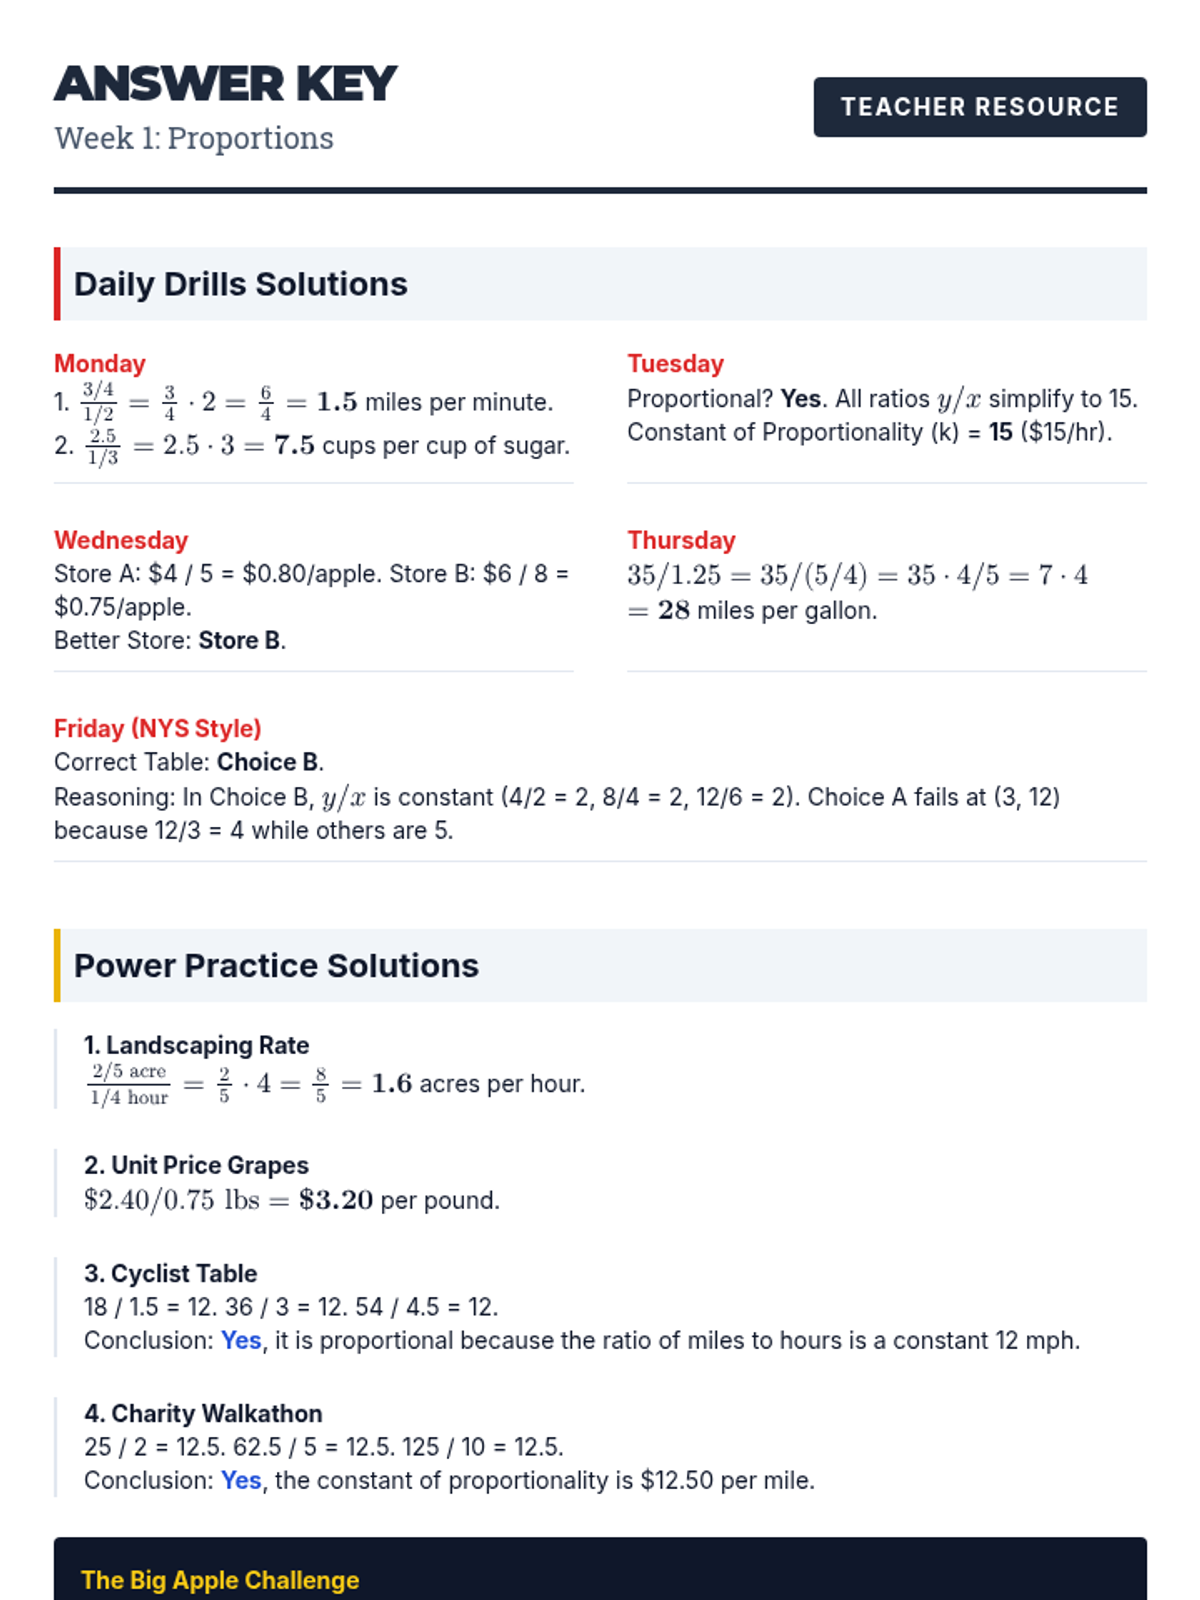
Analyzing graphs of proportional relationships, finding the constant of proportionality, and writing equations in the form y = kx.
Review of ratios, unit rates with fractions, and identifying proportional relationships in tables and context.
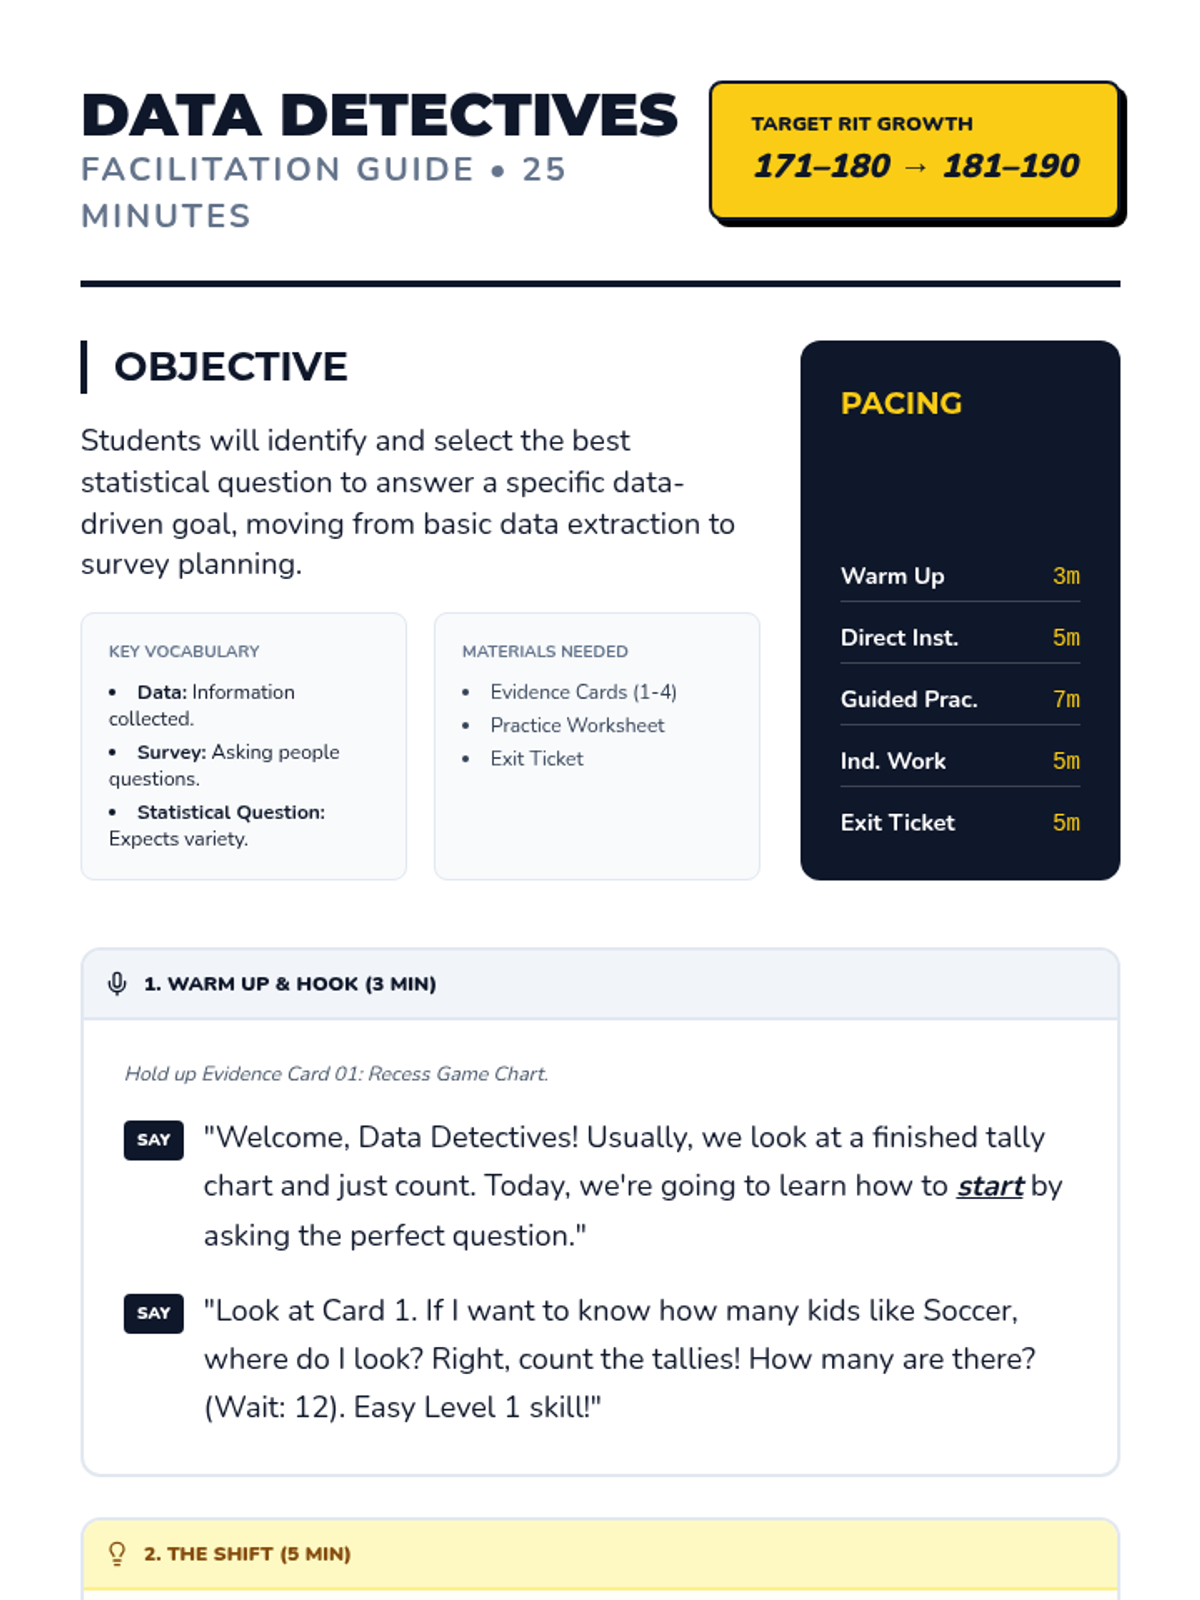
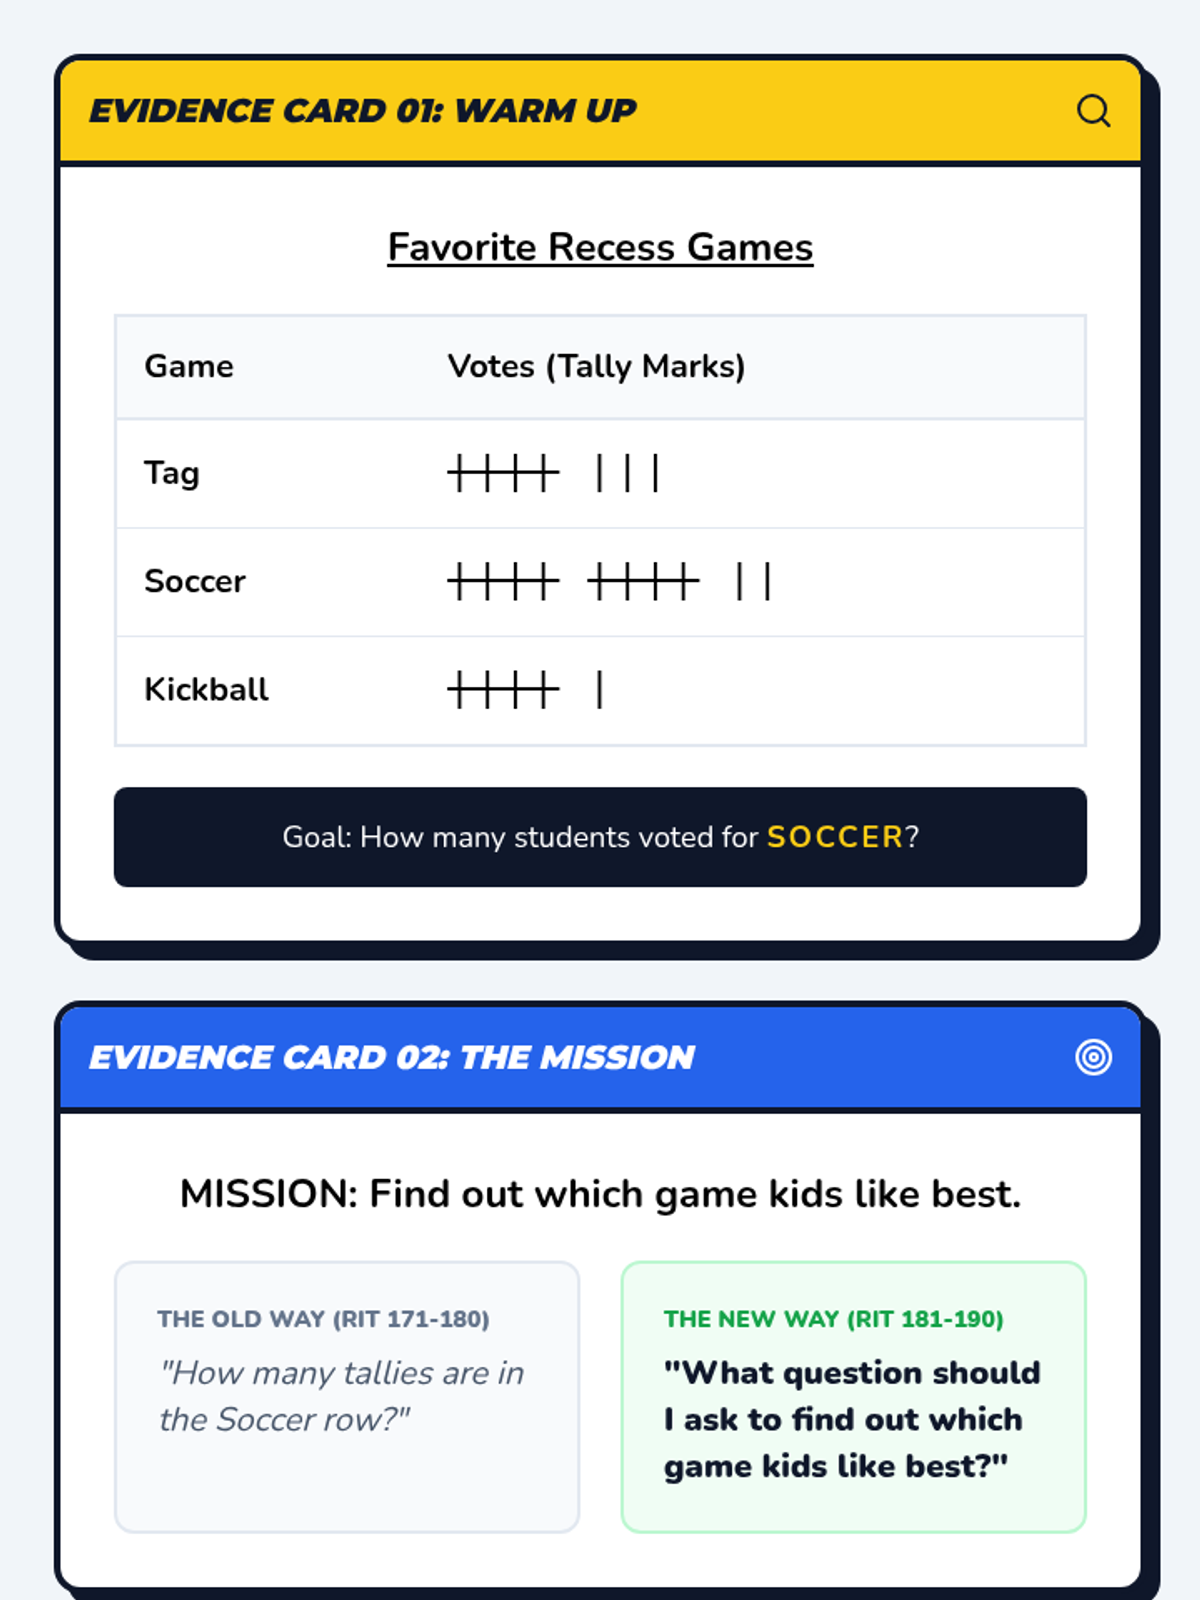
A 25-minute small group lesson designed to move students from RIT 171-180 to 181-190 by shifting from basic data interpretation to formulating and selecting effective statistical questions.
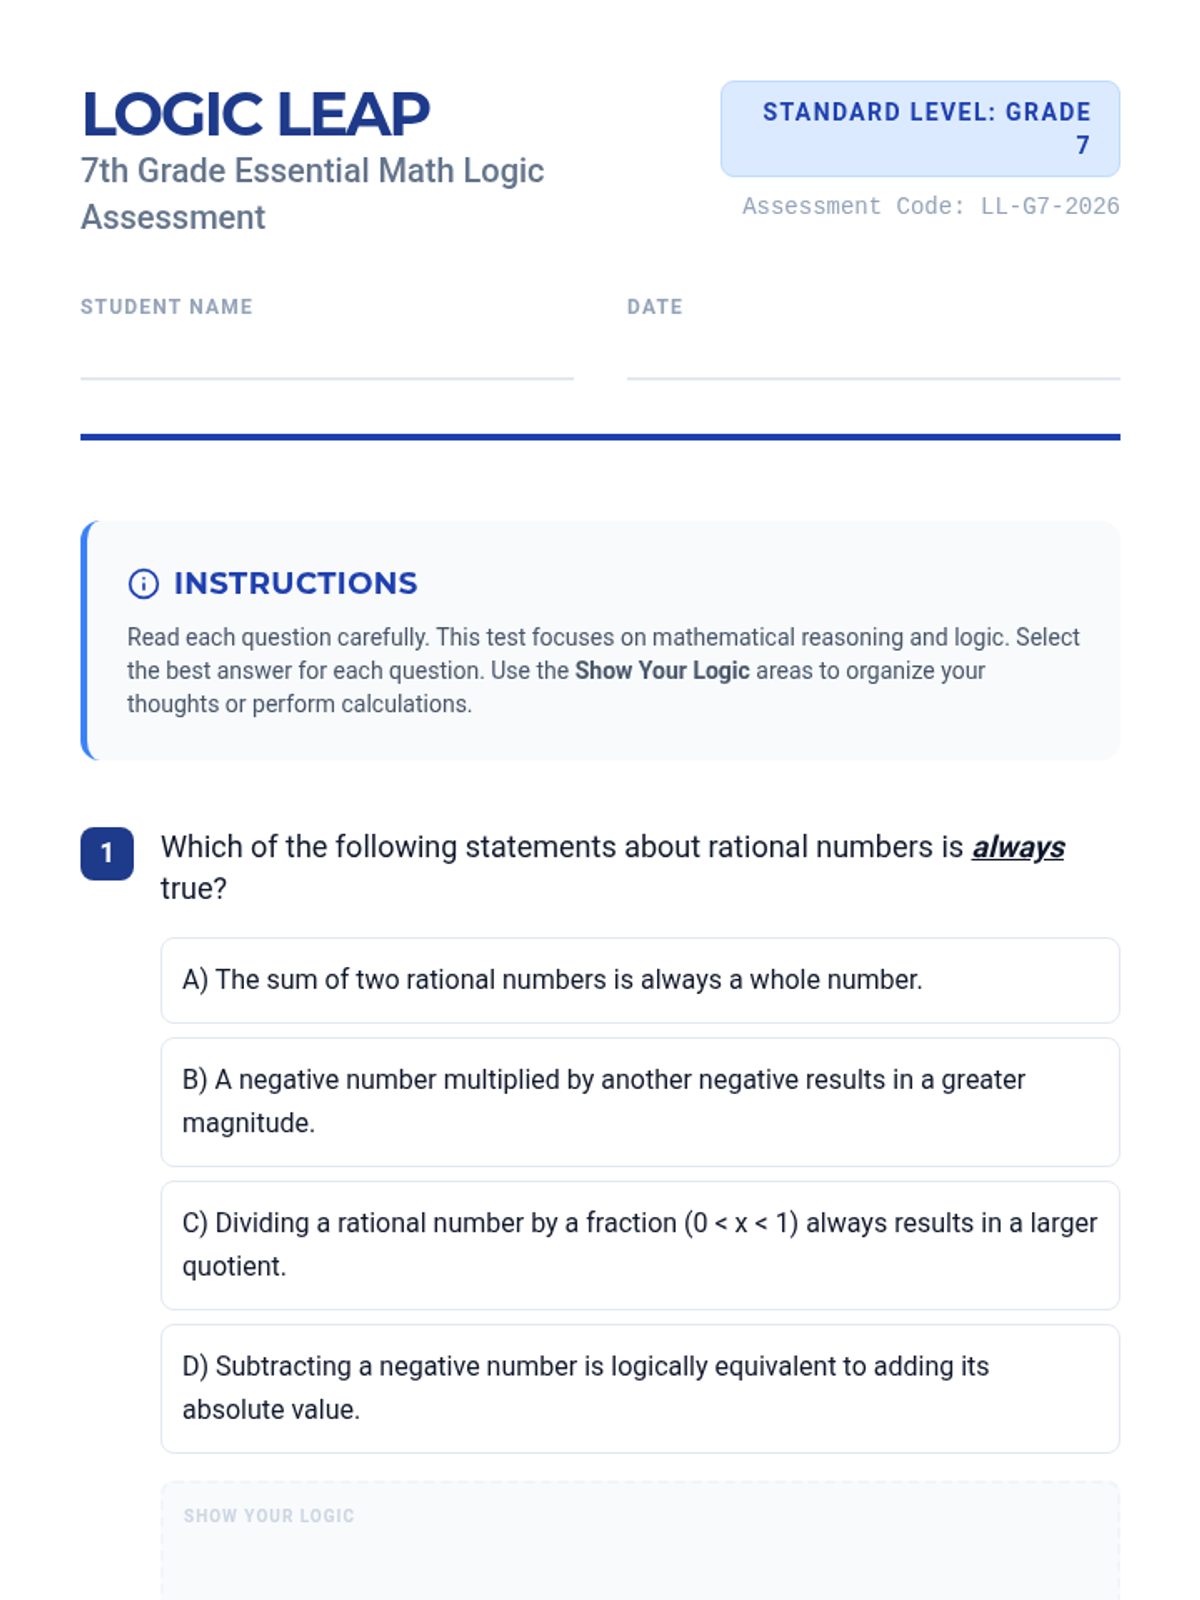
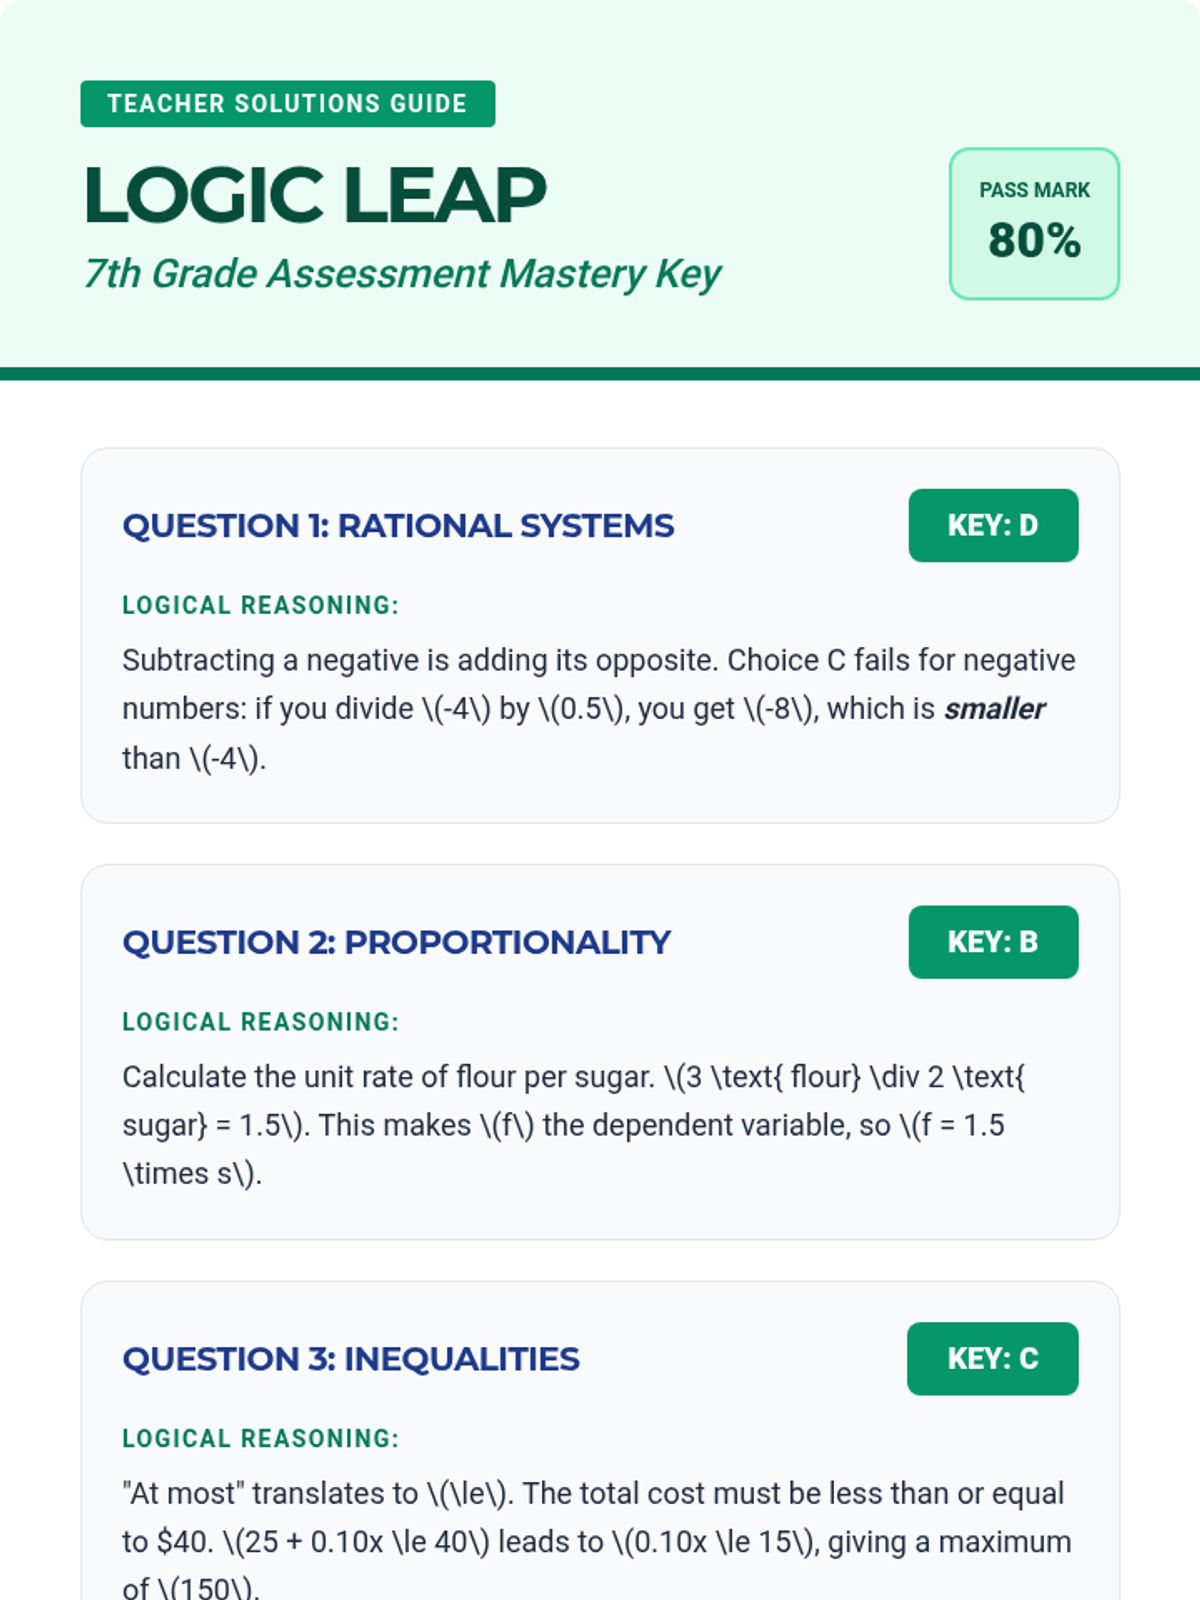
A comprehensive assessment and review lesson focusing on 7th-grade mathematical logic and reasoning across all core domains.
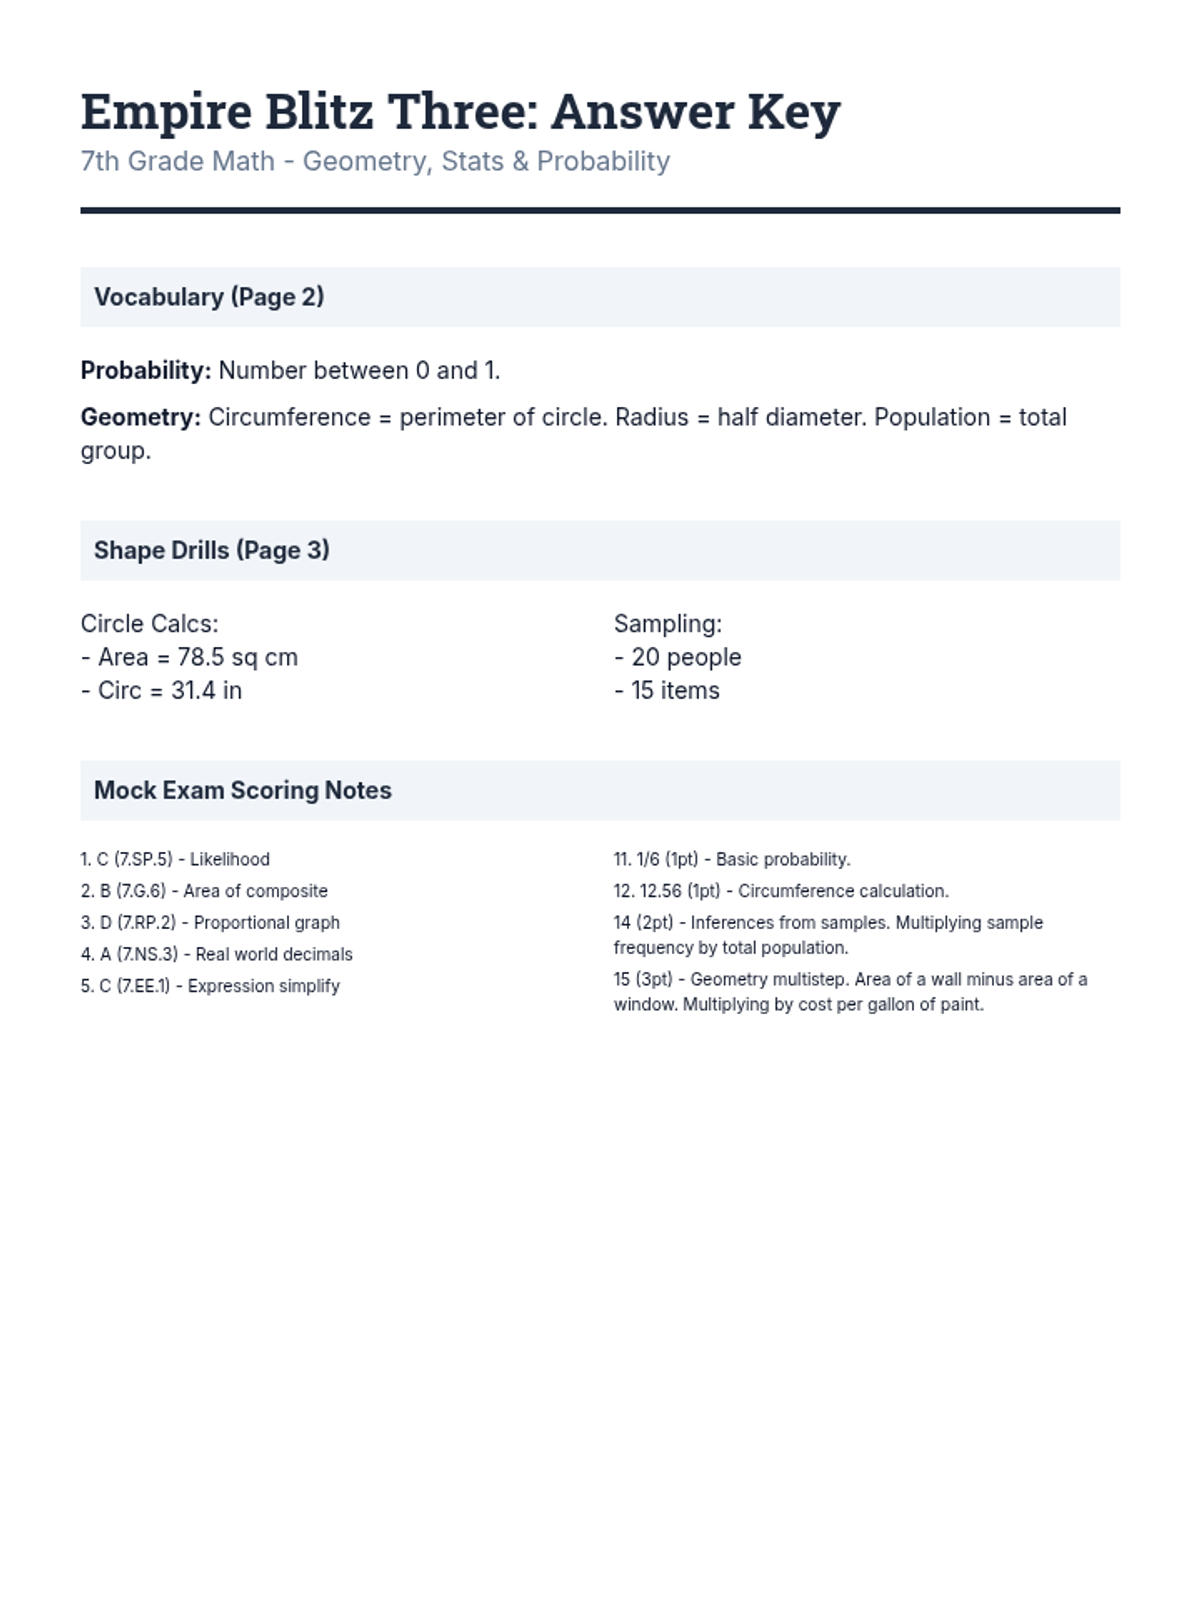
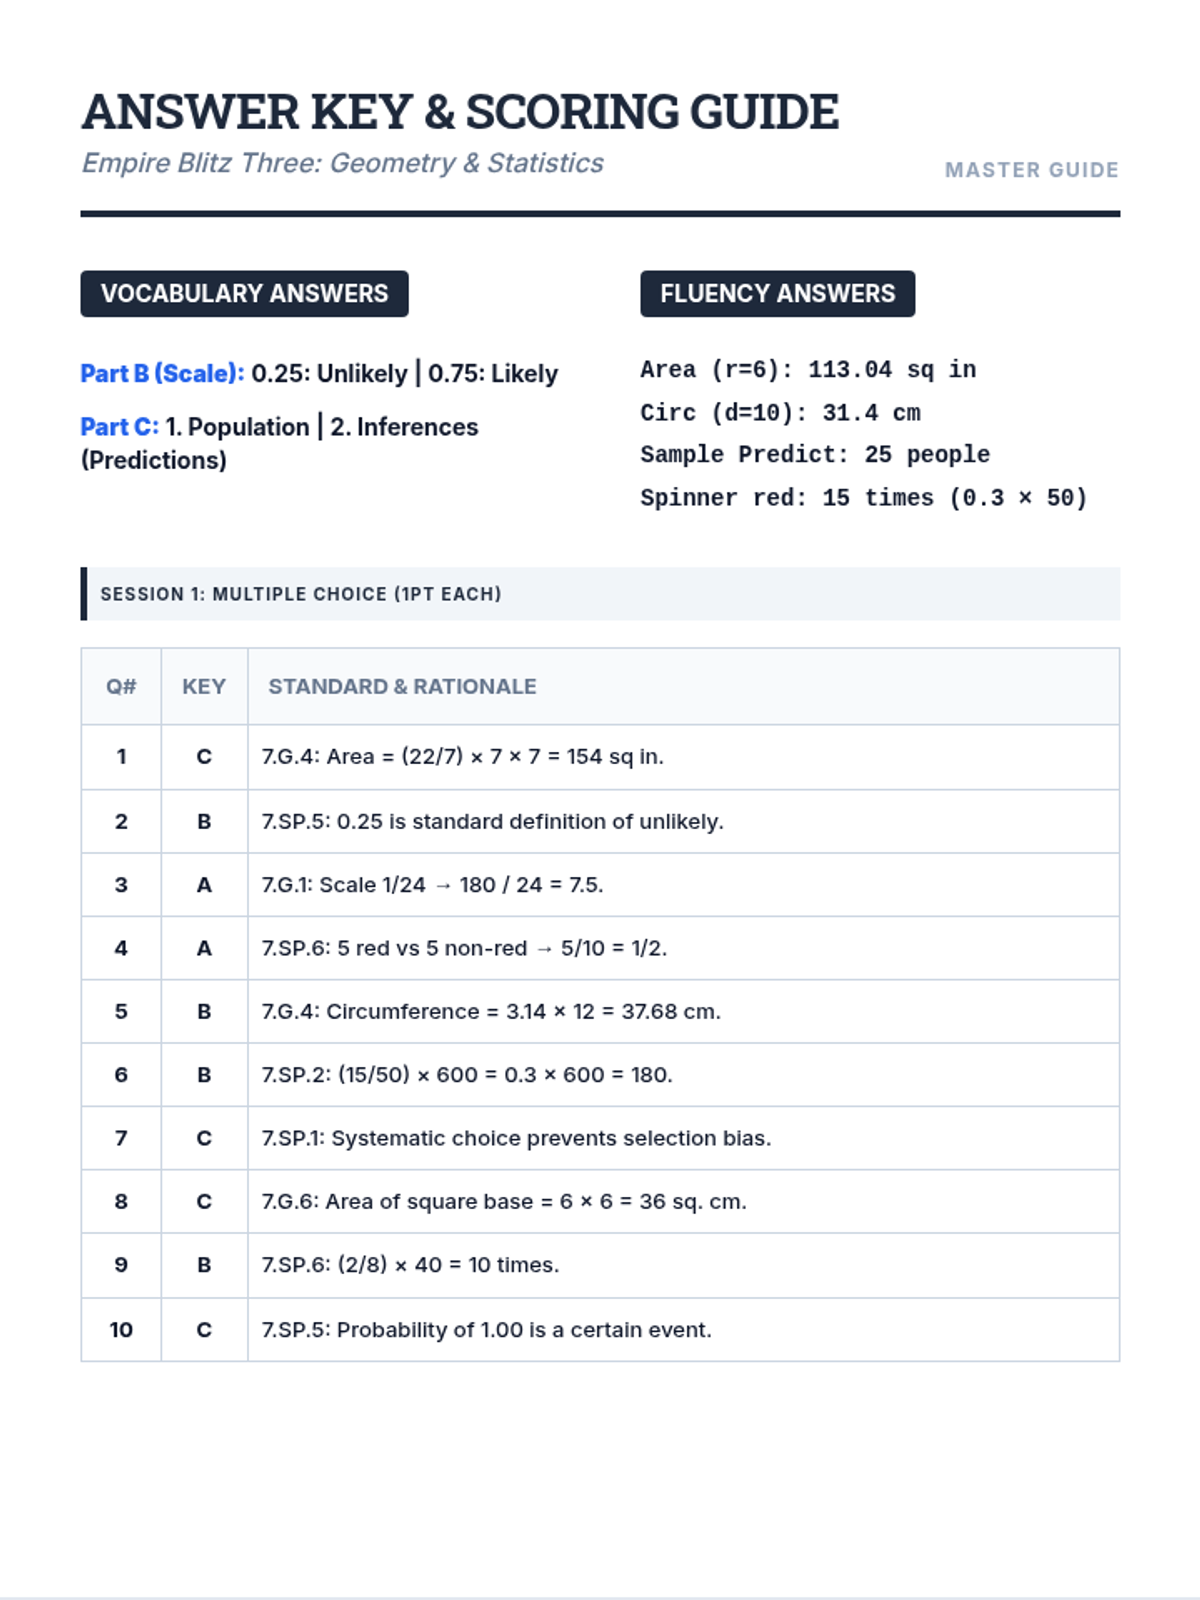
The third packet in the test prep series, highlighting Geometry and Statistics/Probability within a full-spectrum review of 7th grade math requirements.
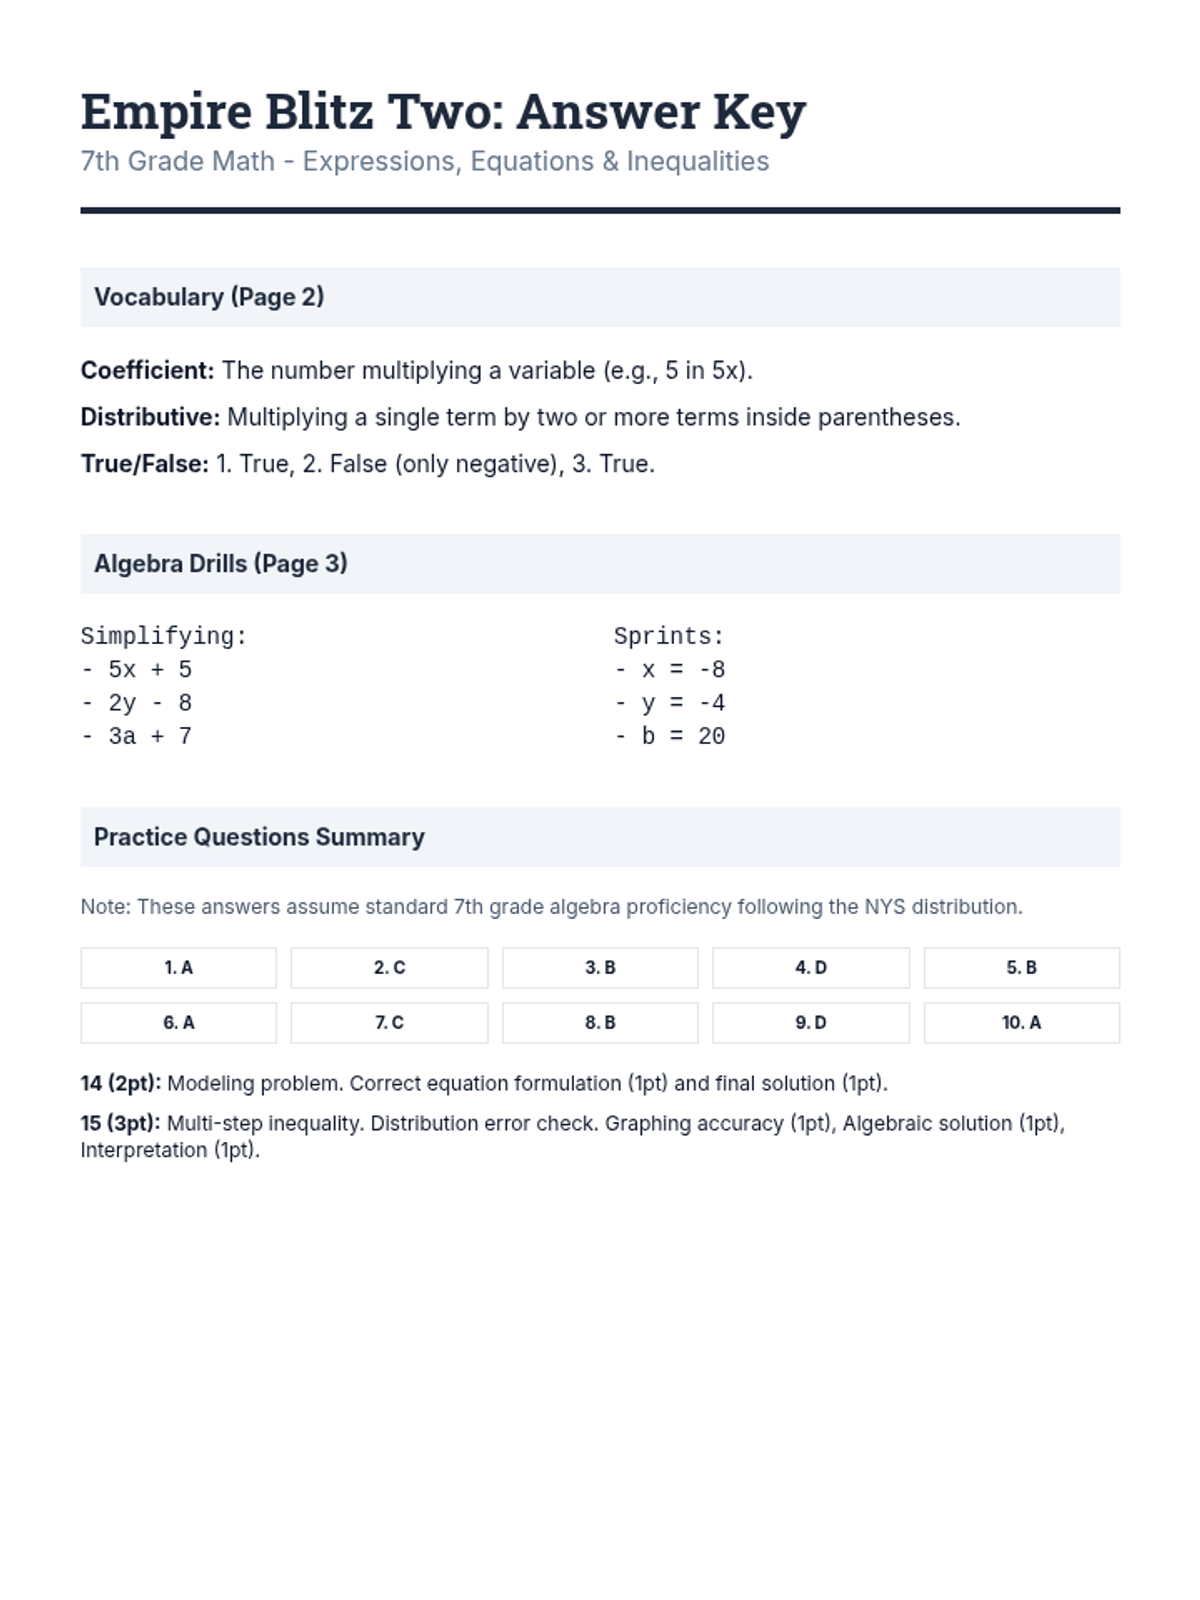
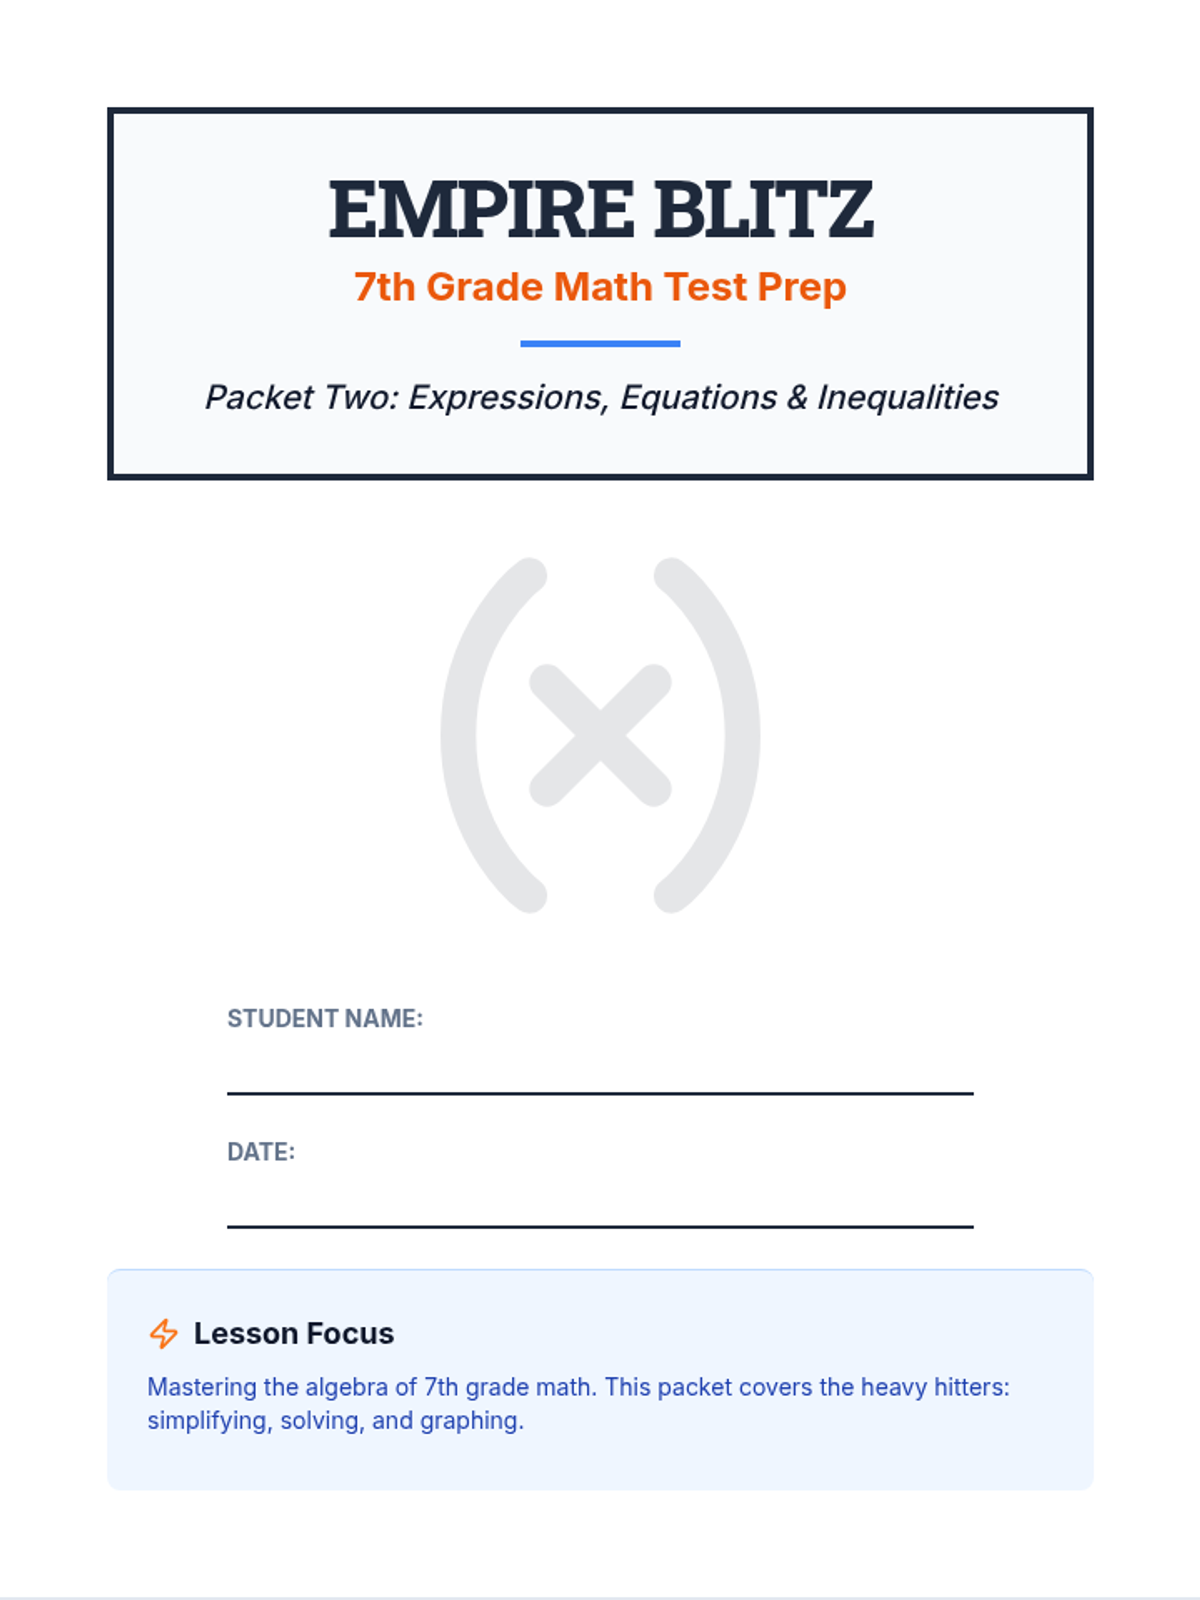
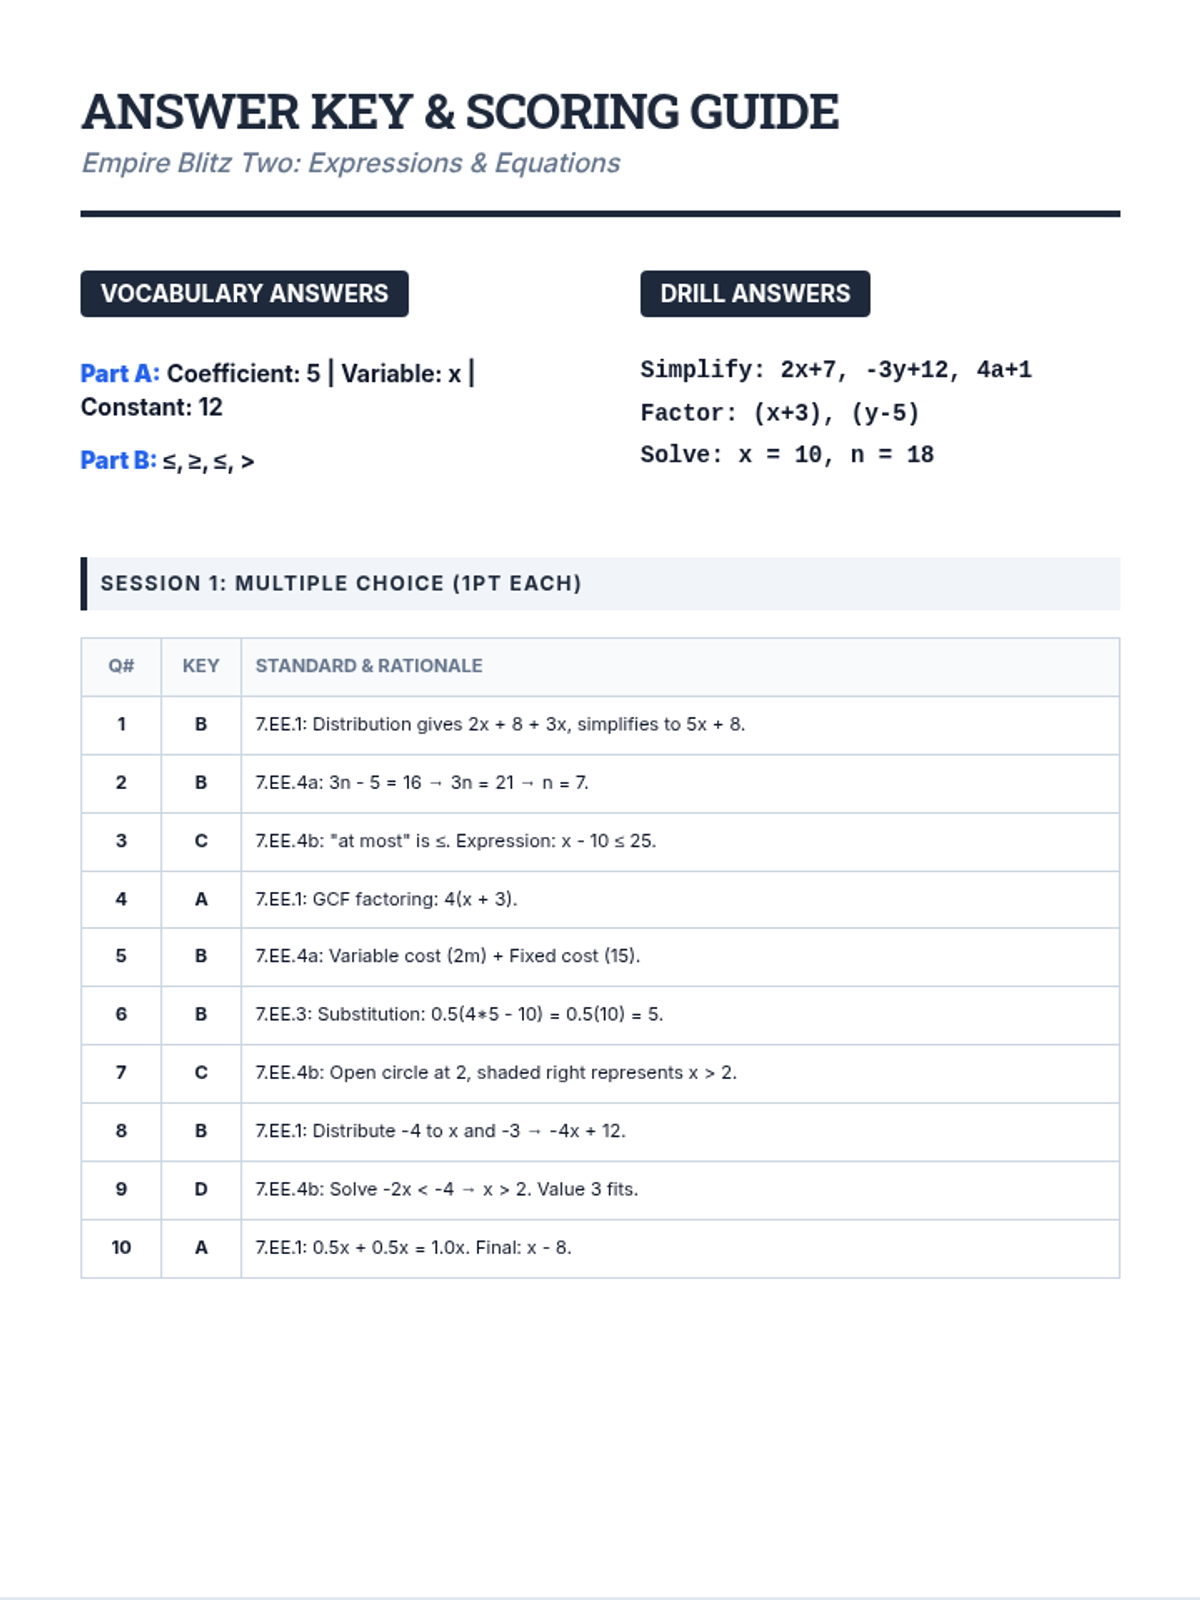
The second packet in the test prep series, with an emphasis on Expressions, Equations, and Inequalities, alongside a balanced distribution of other 7th grade standards.
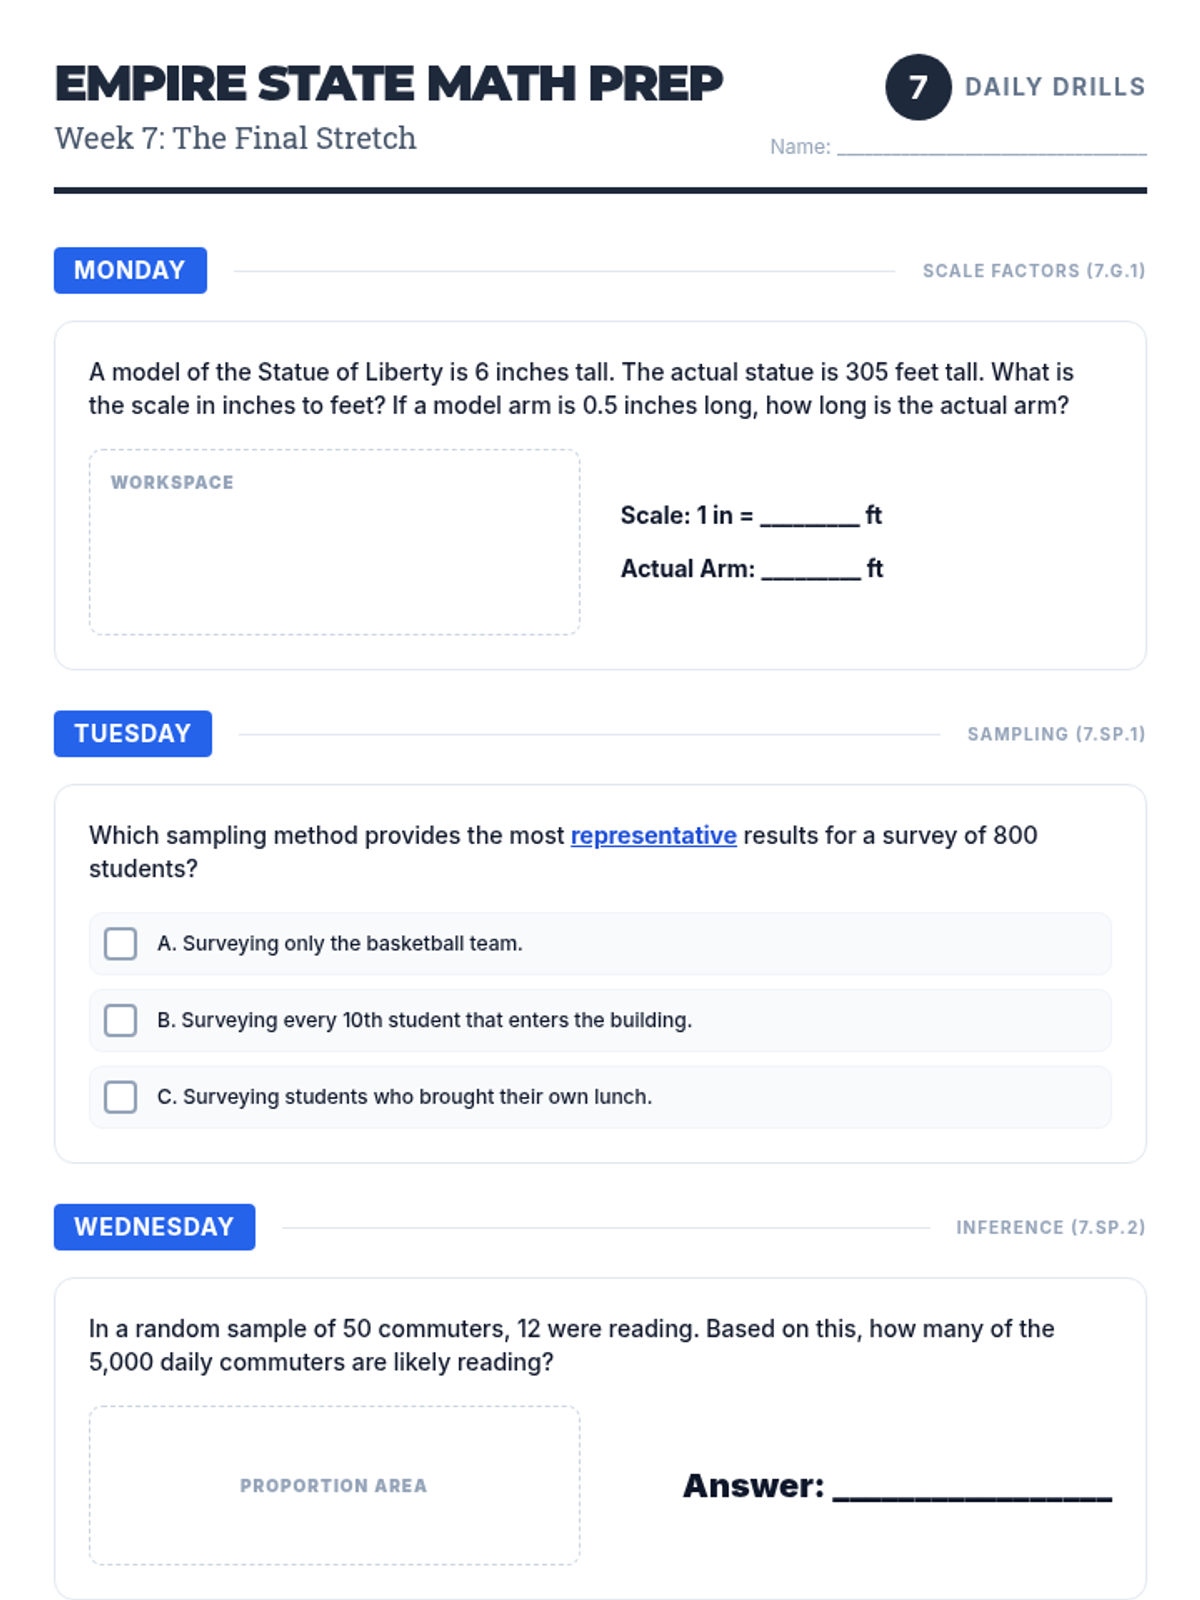
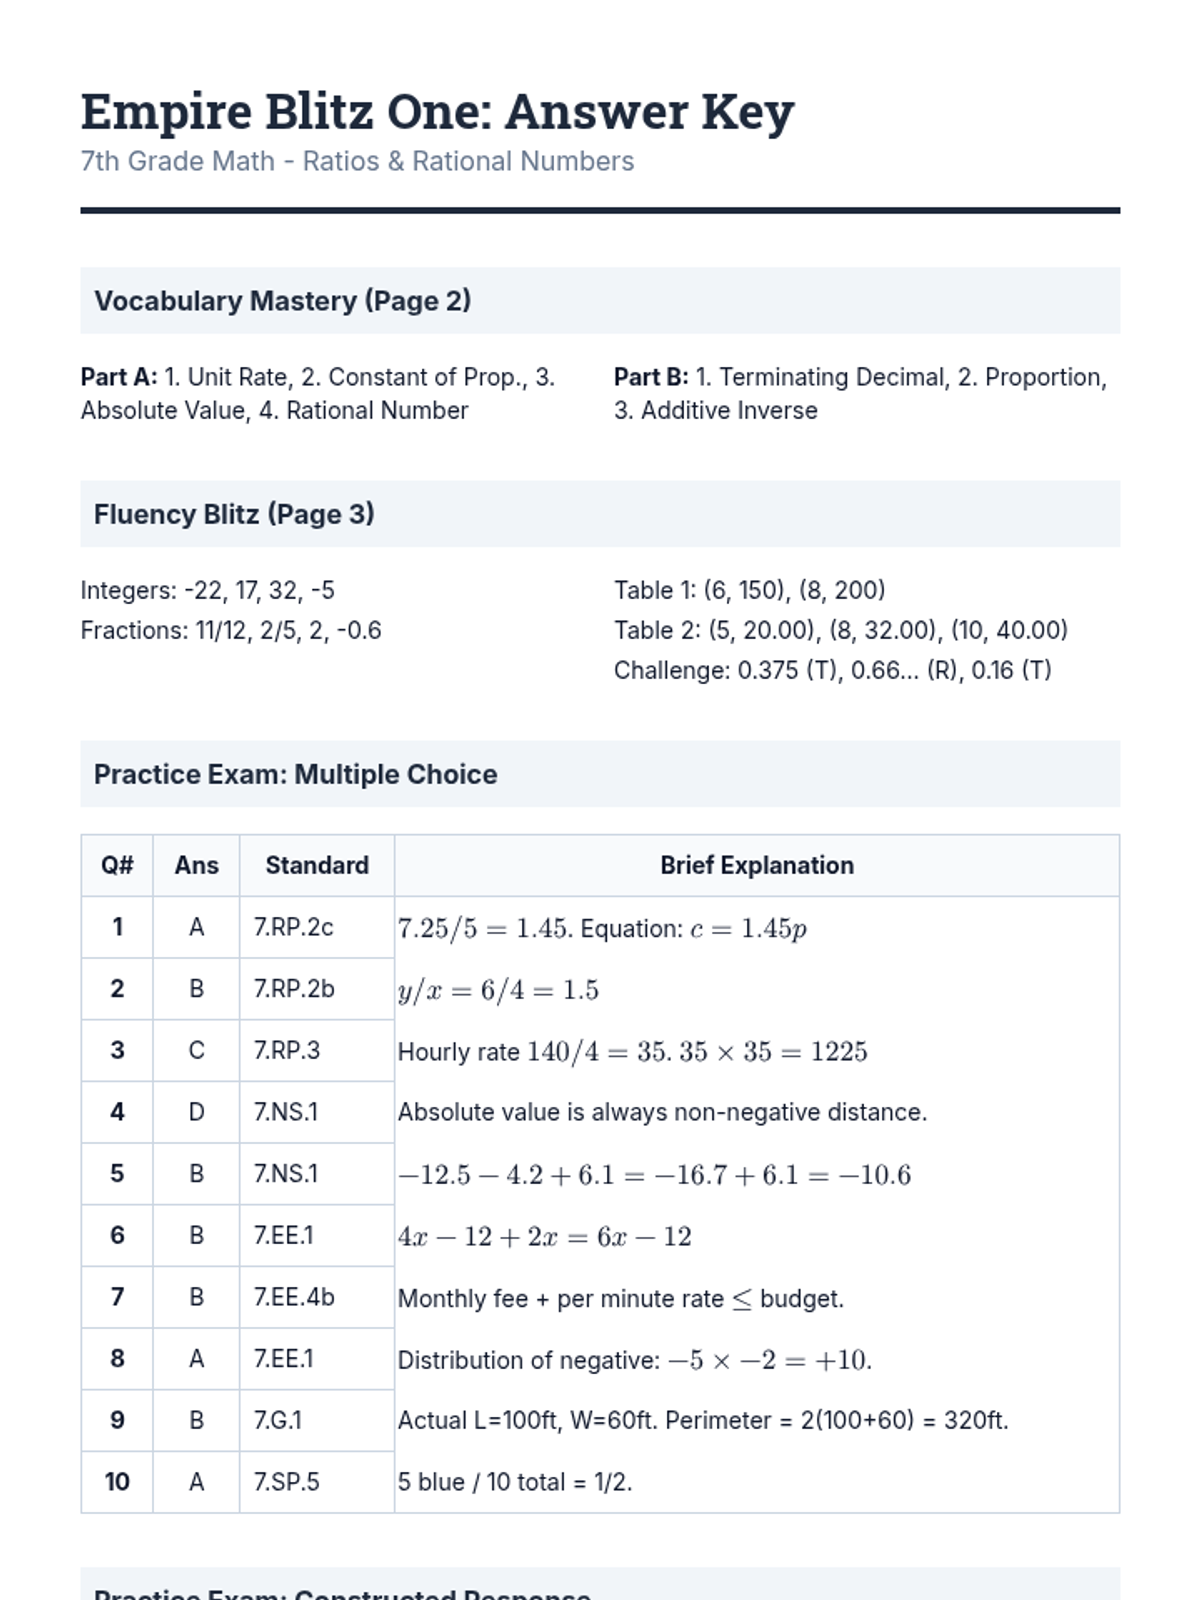
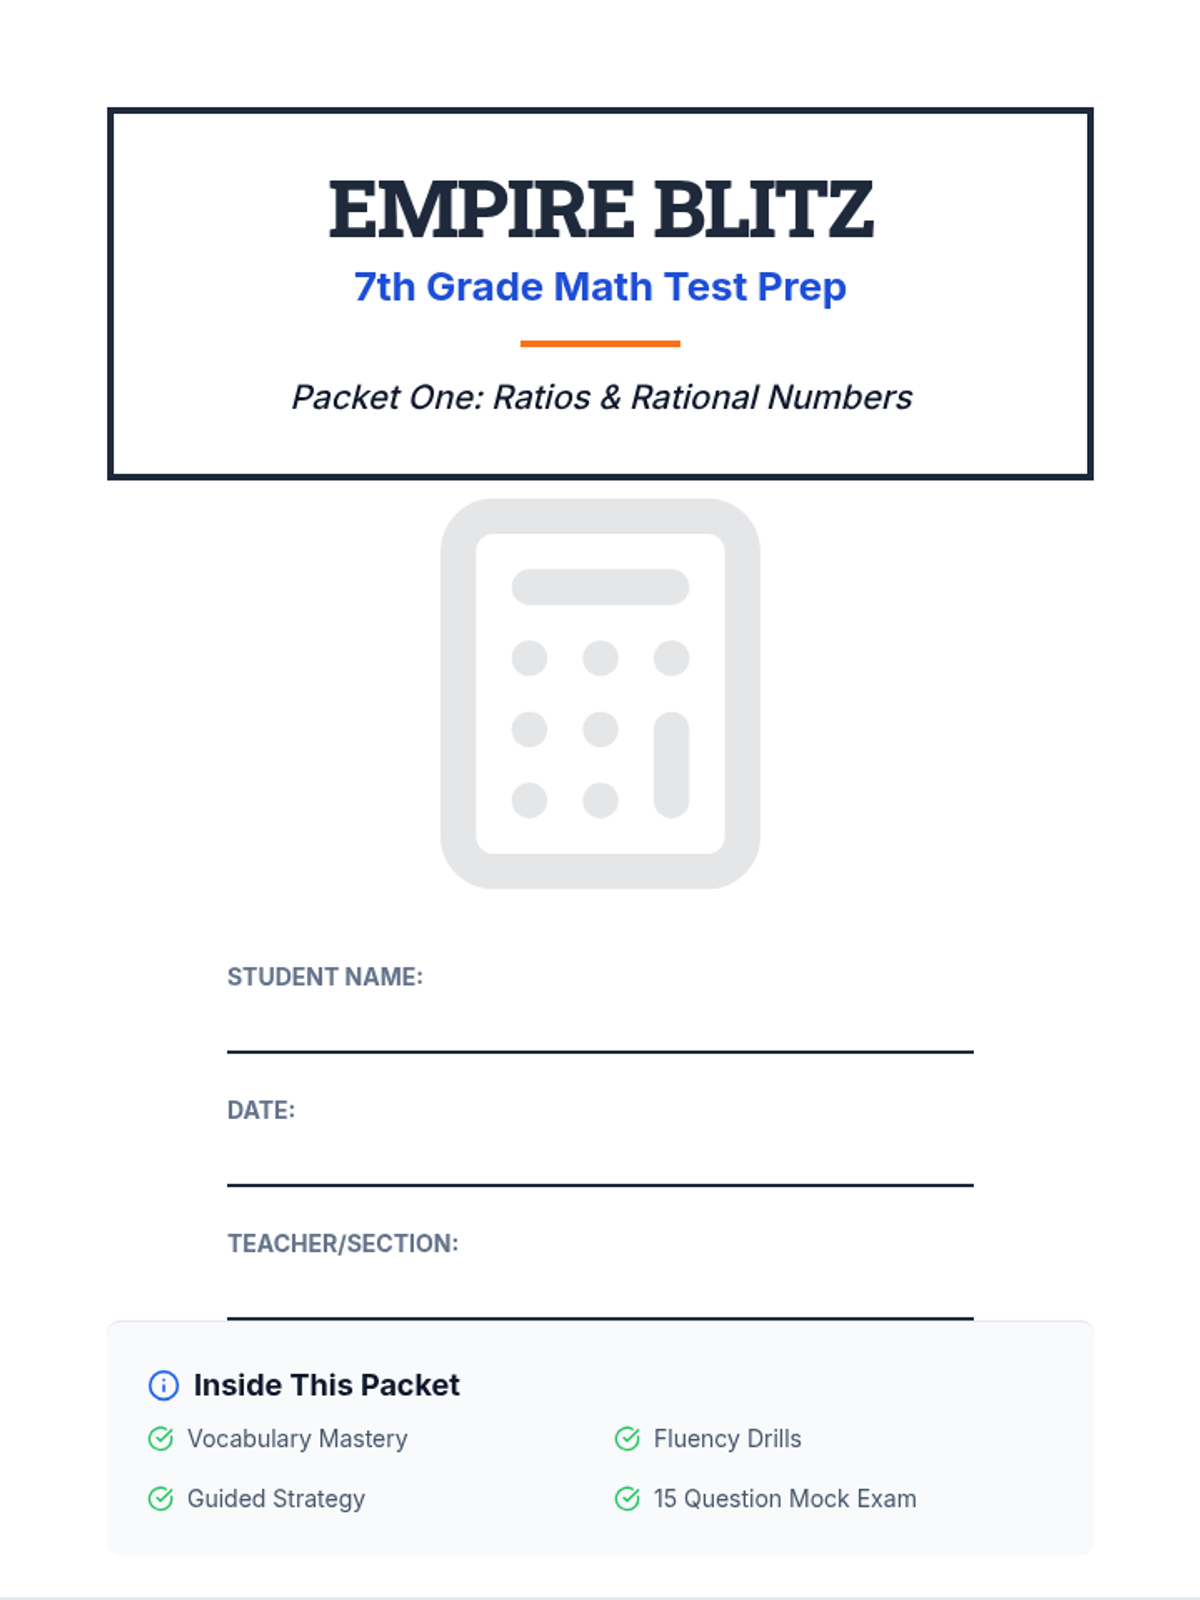
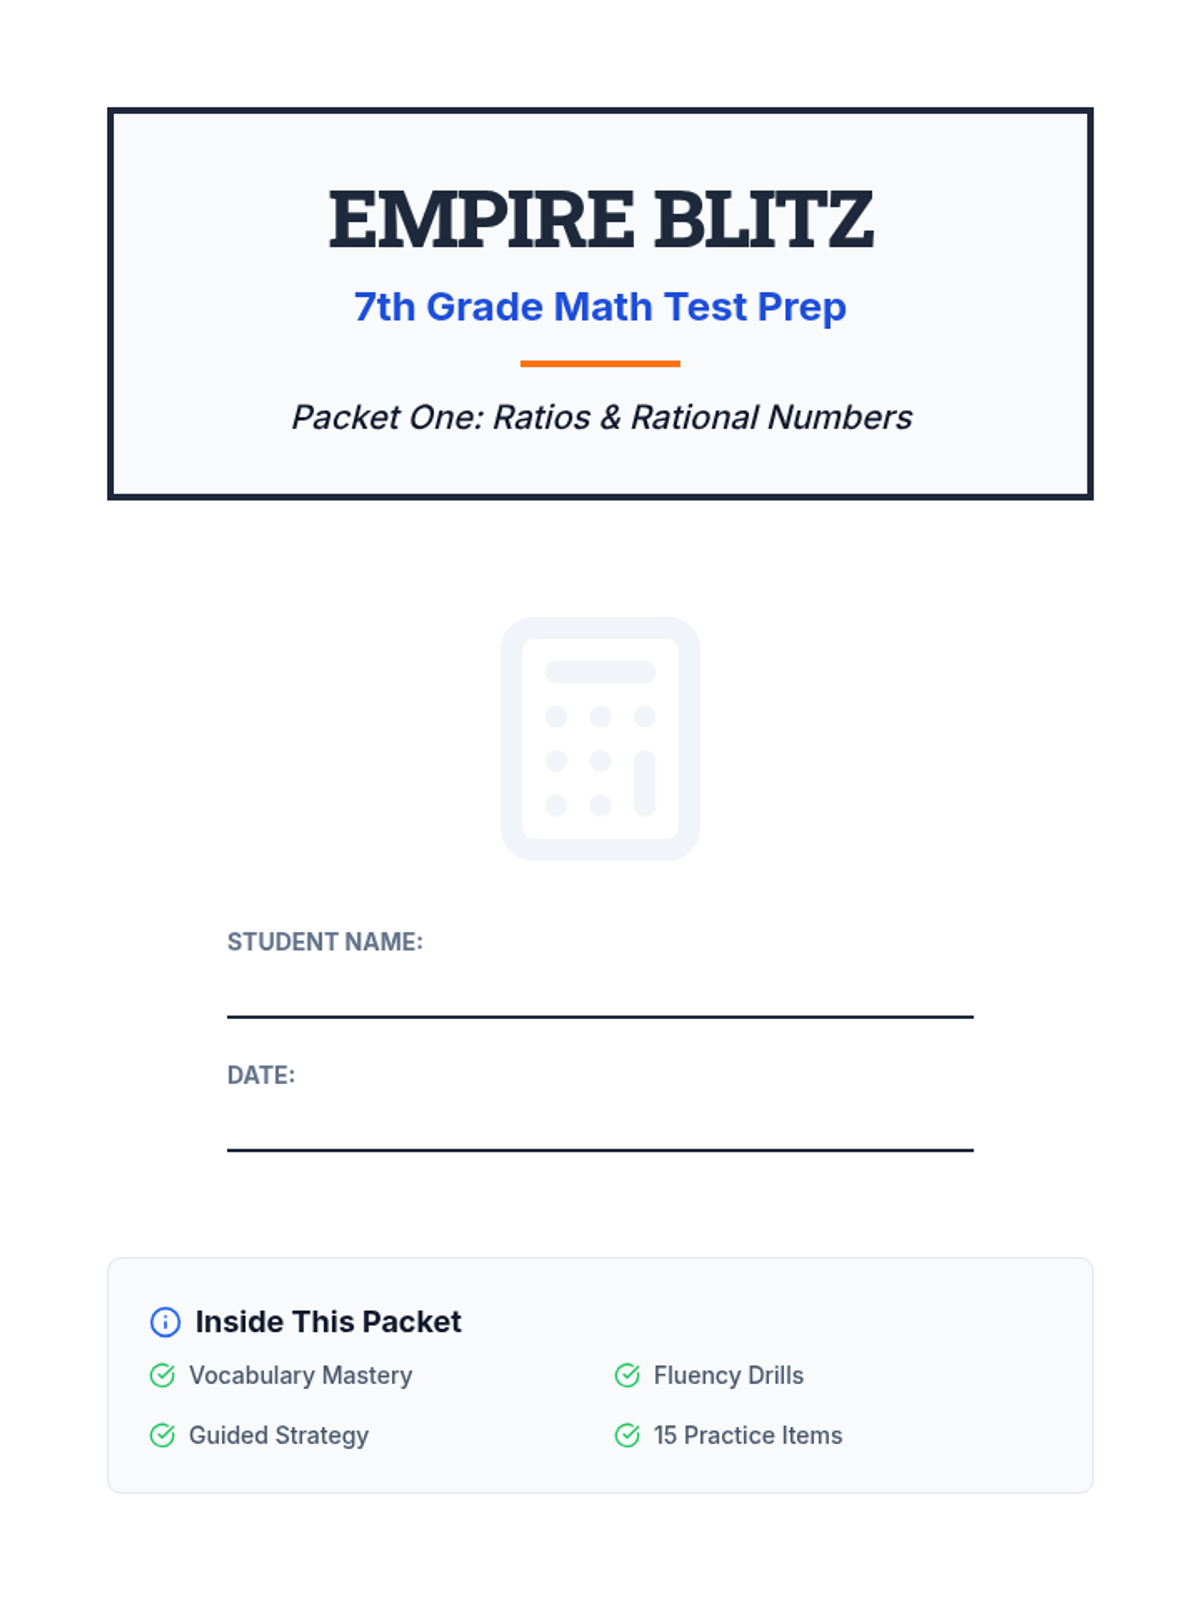
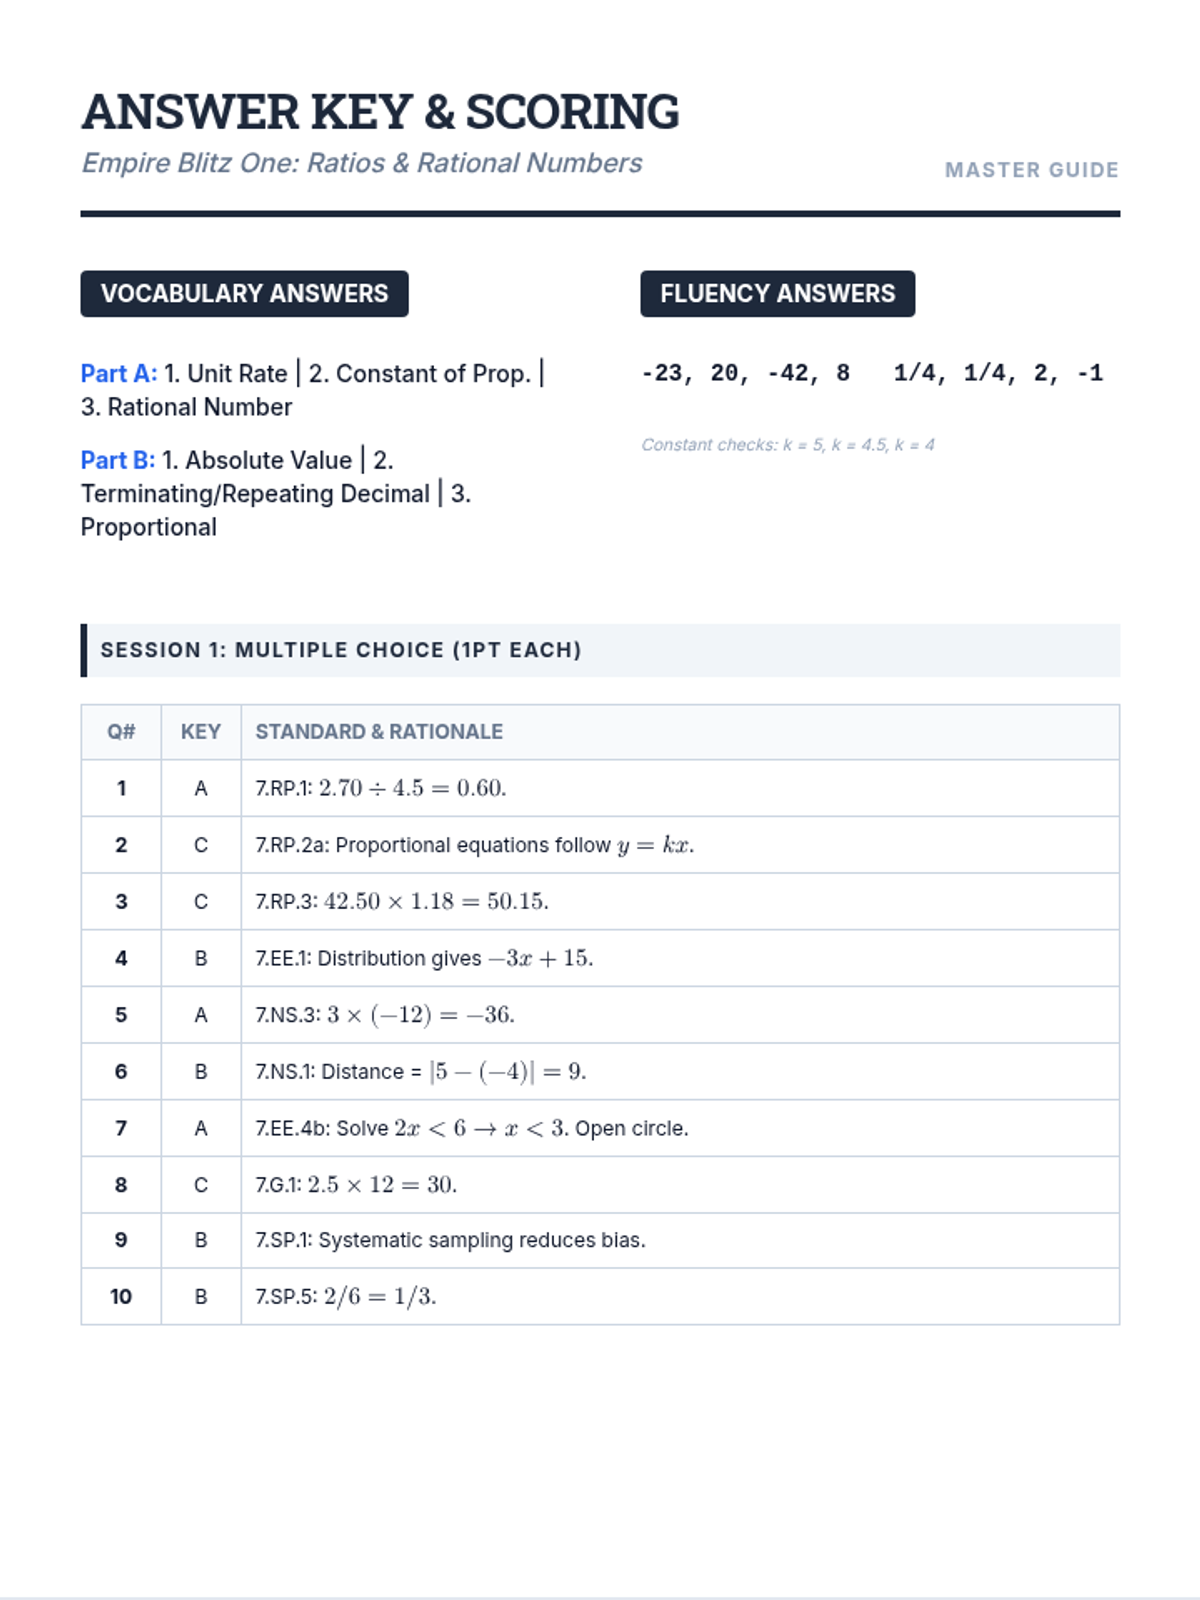
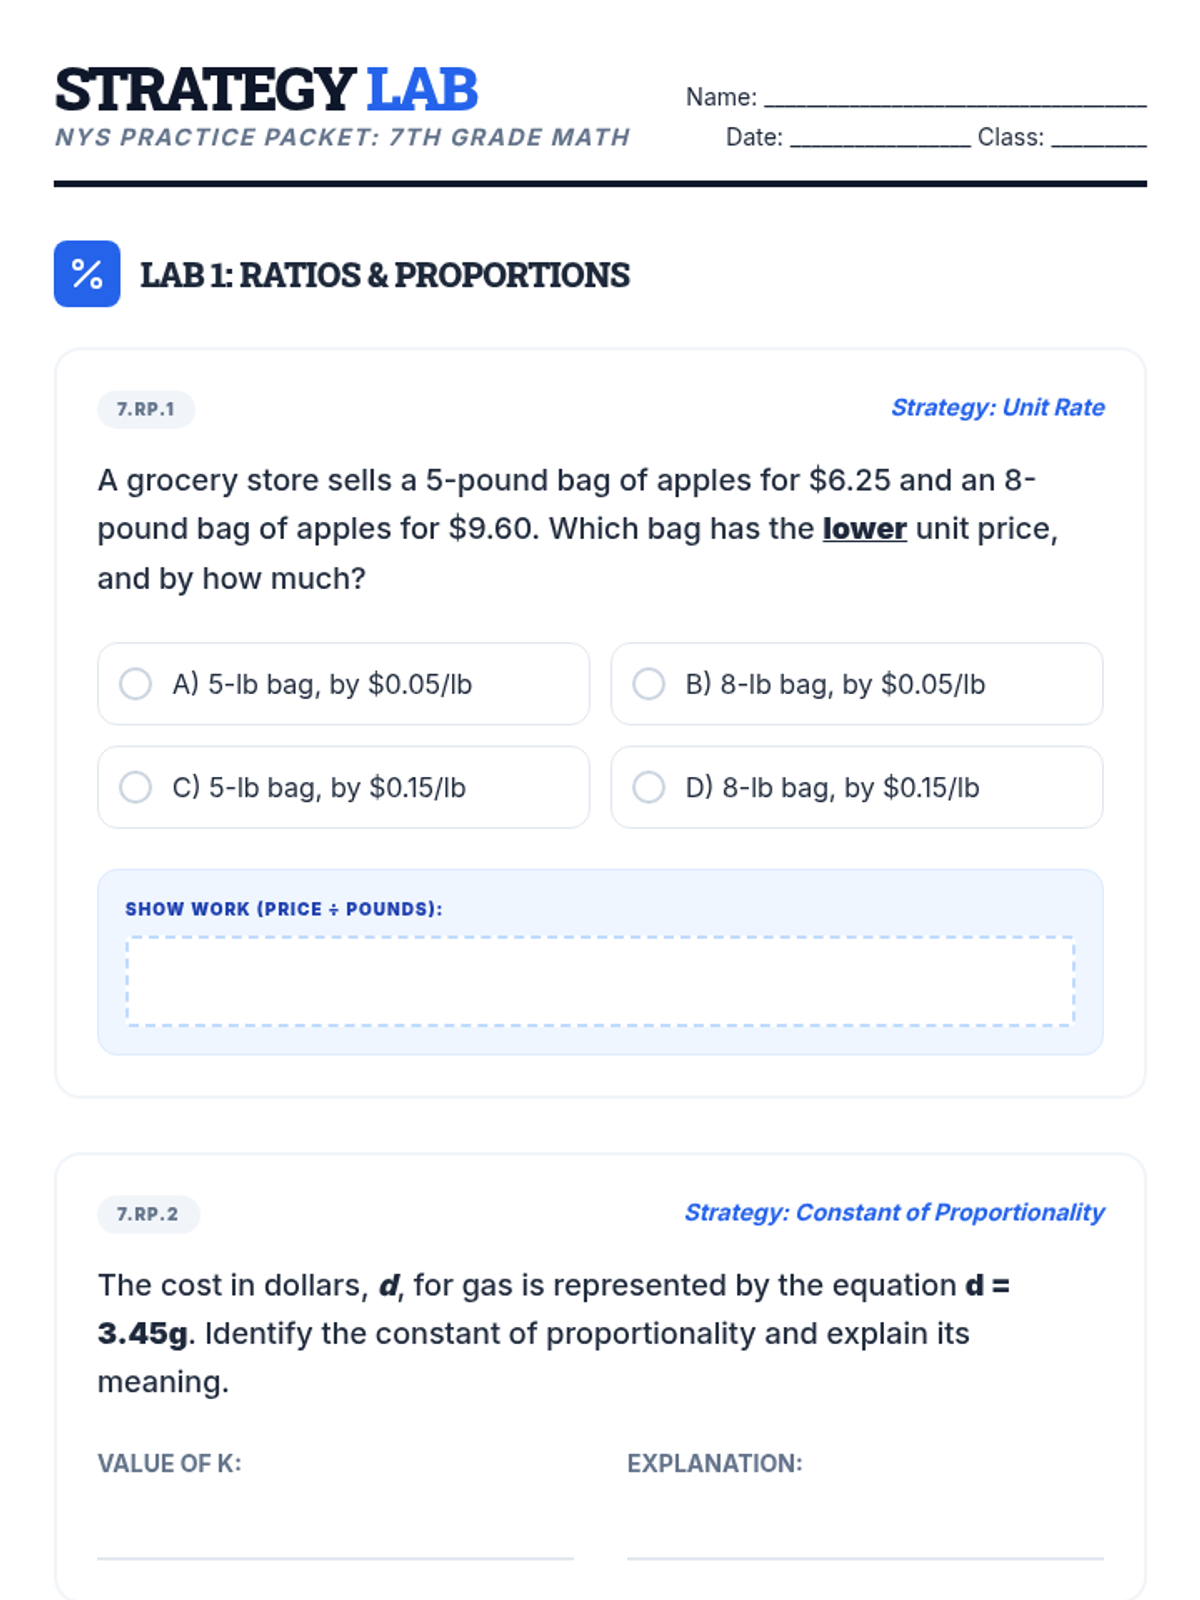
The first packet in the test prep series, focusing on Ratio and Proportional Relationships and the Number System, while maintaining a representative mix of all 7th grade domains.
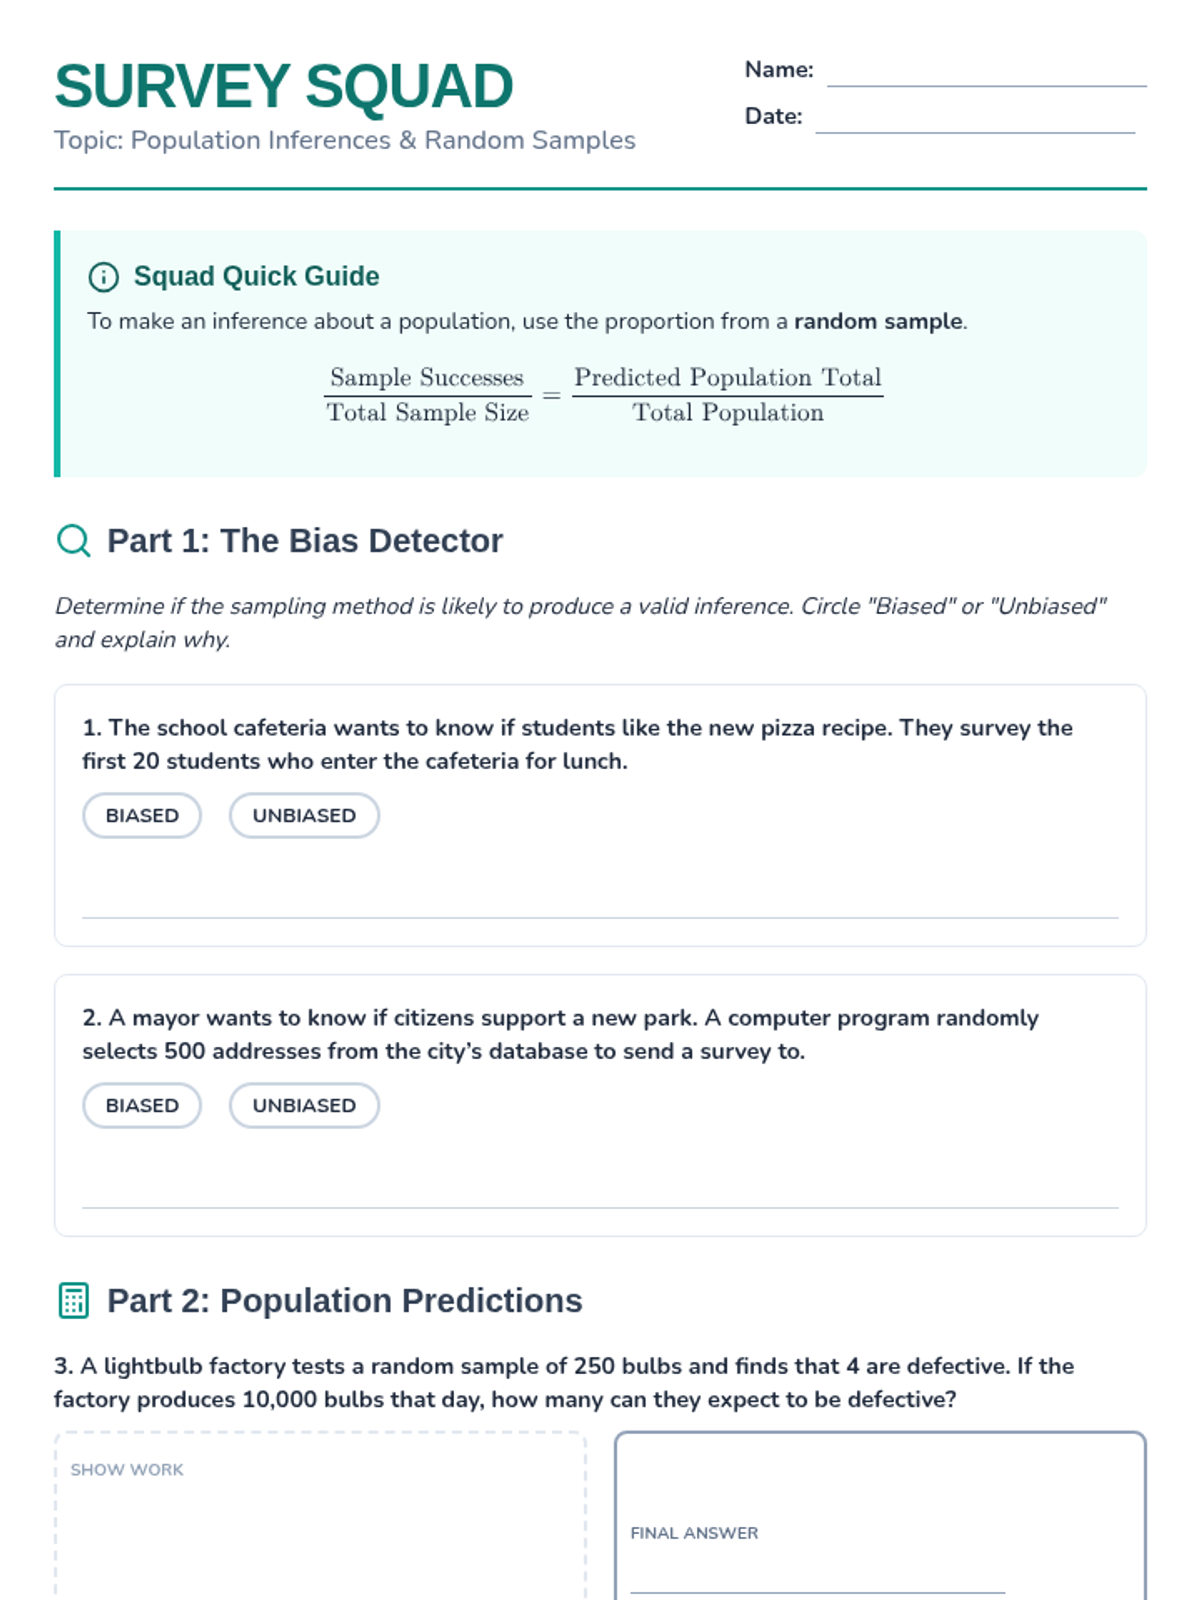
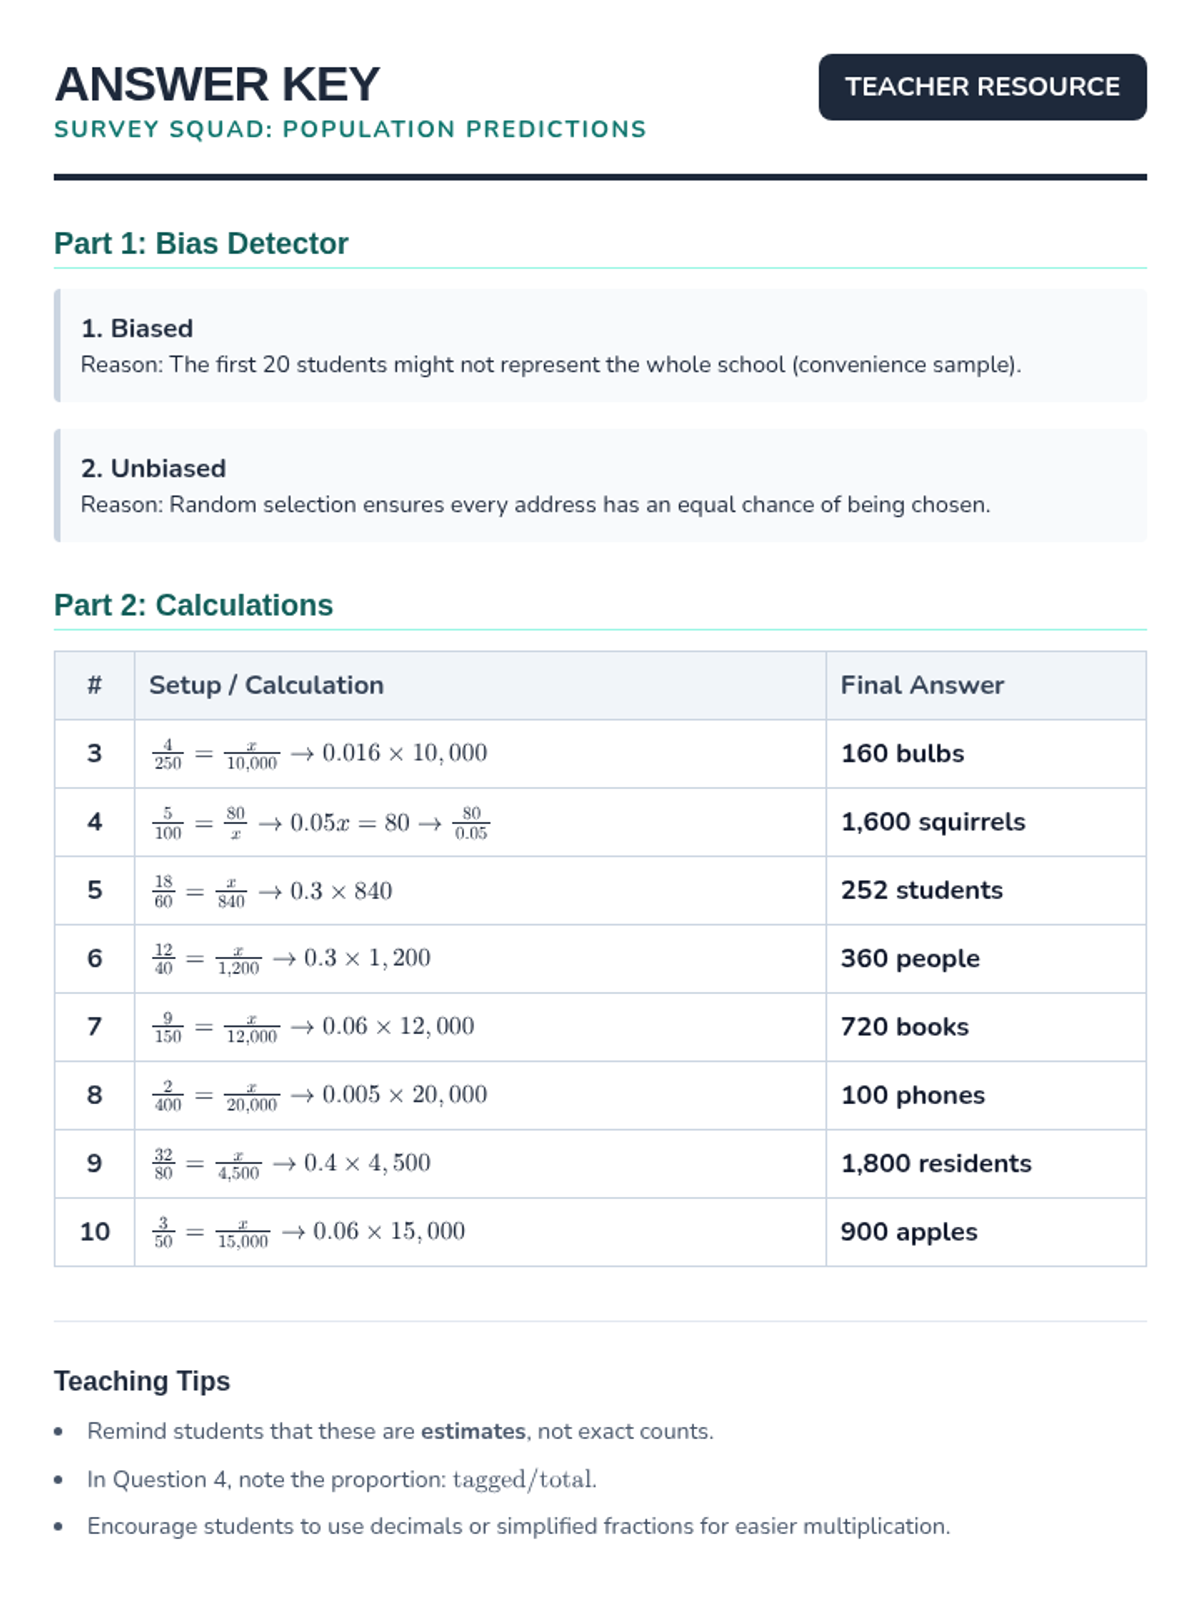
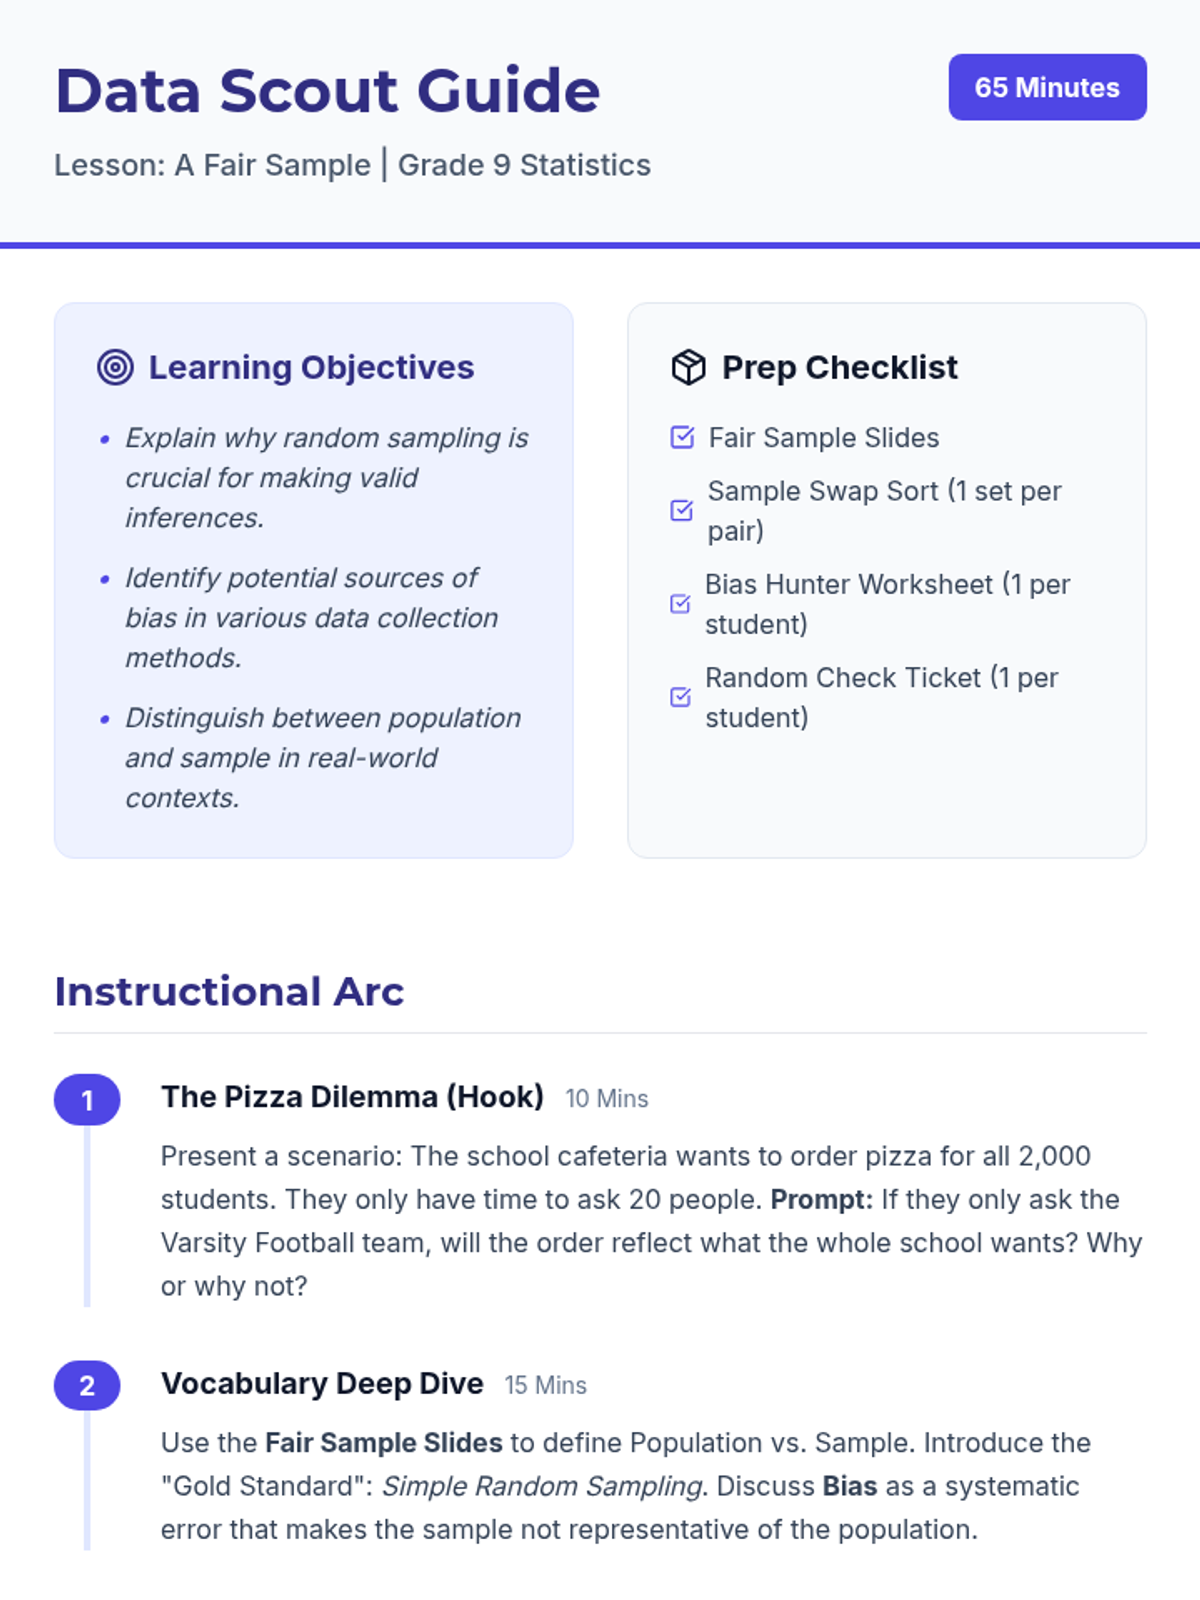
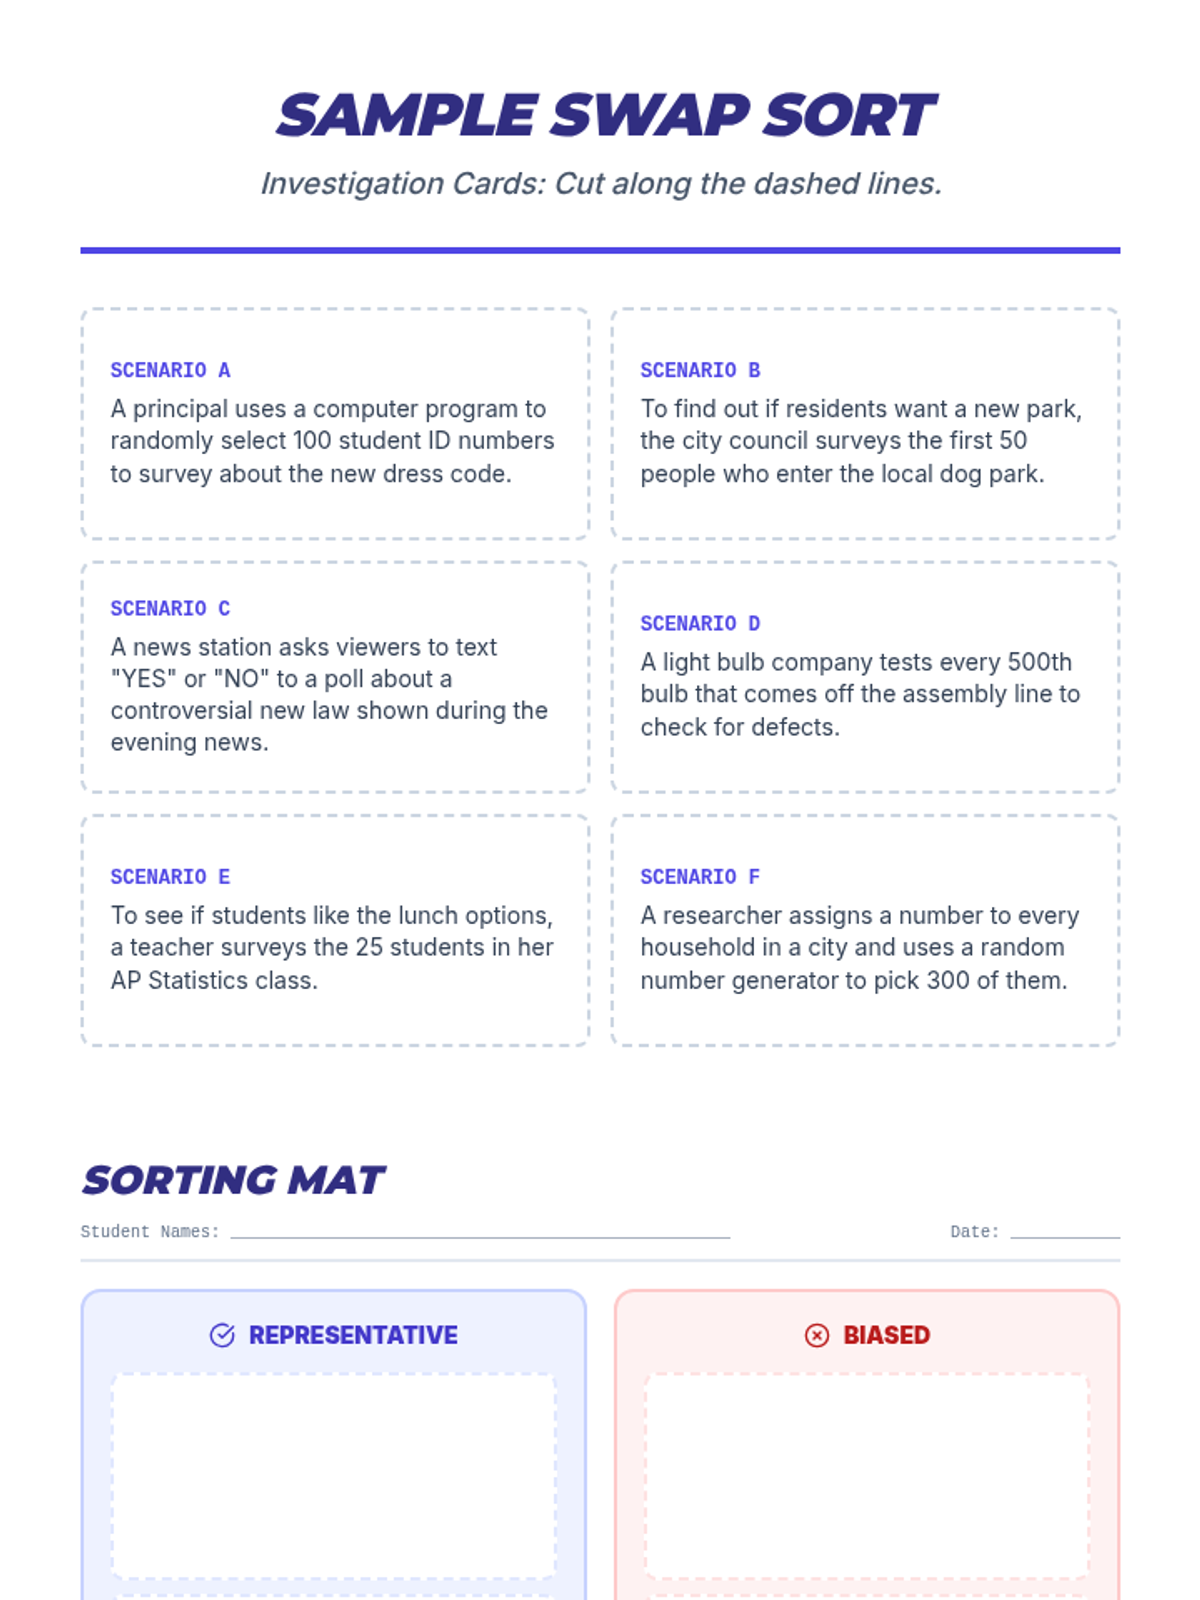
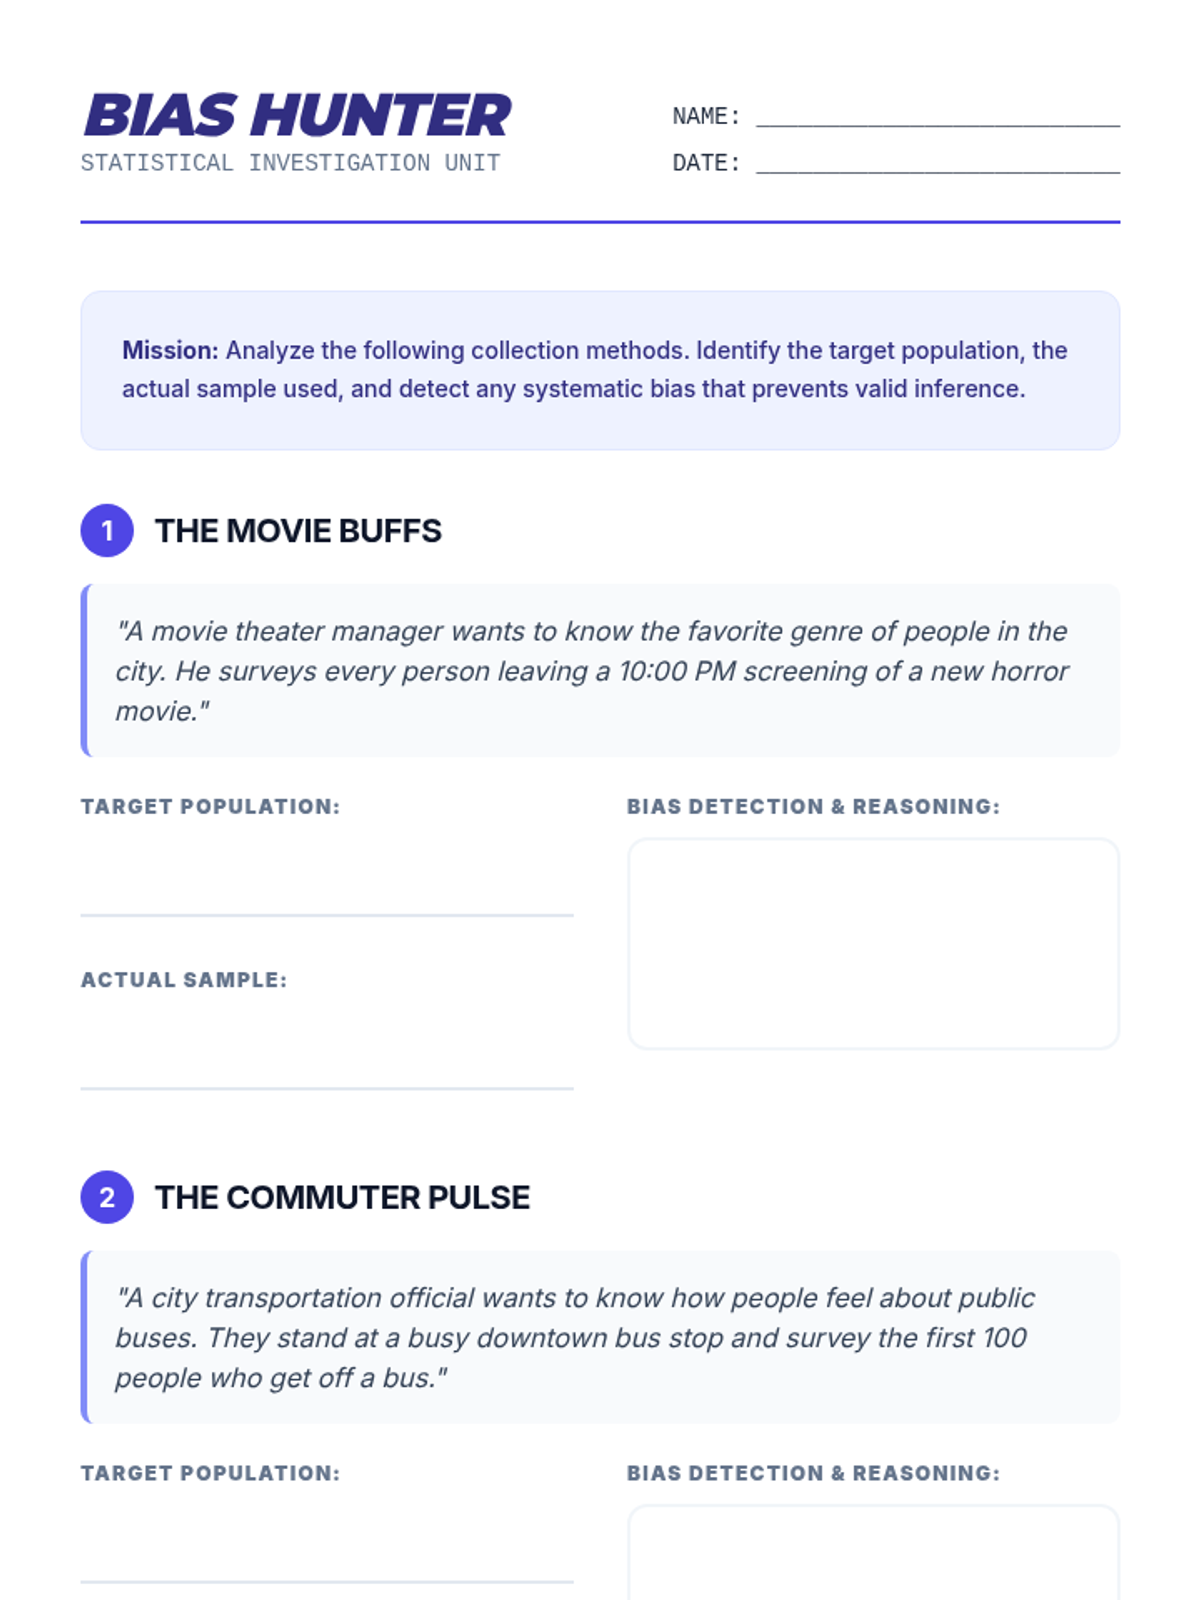
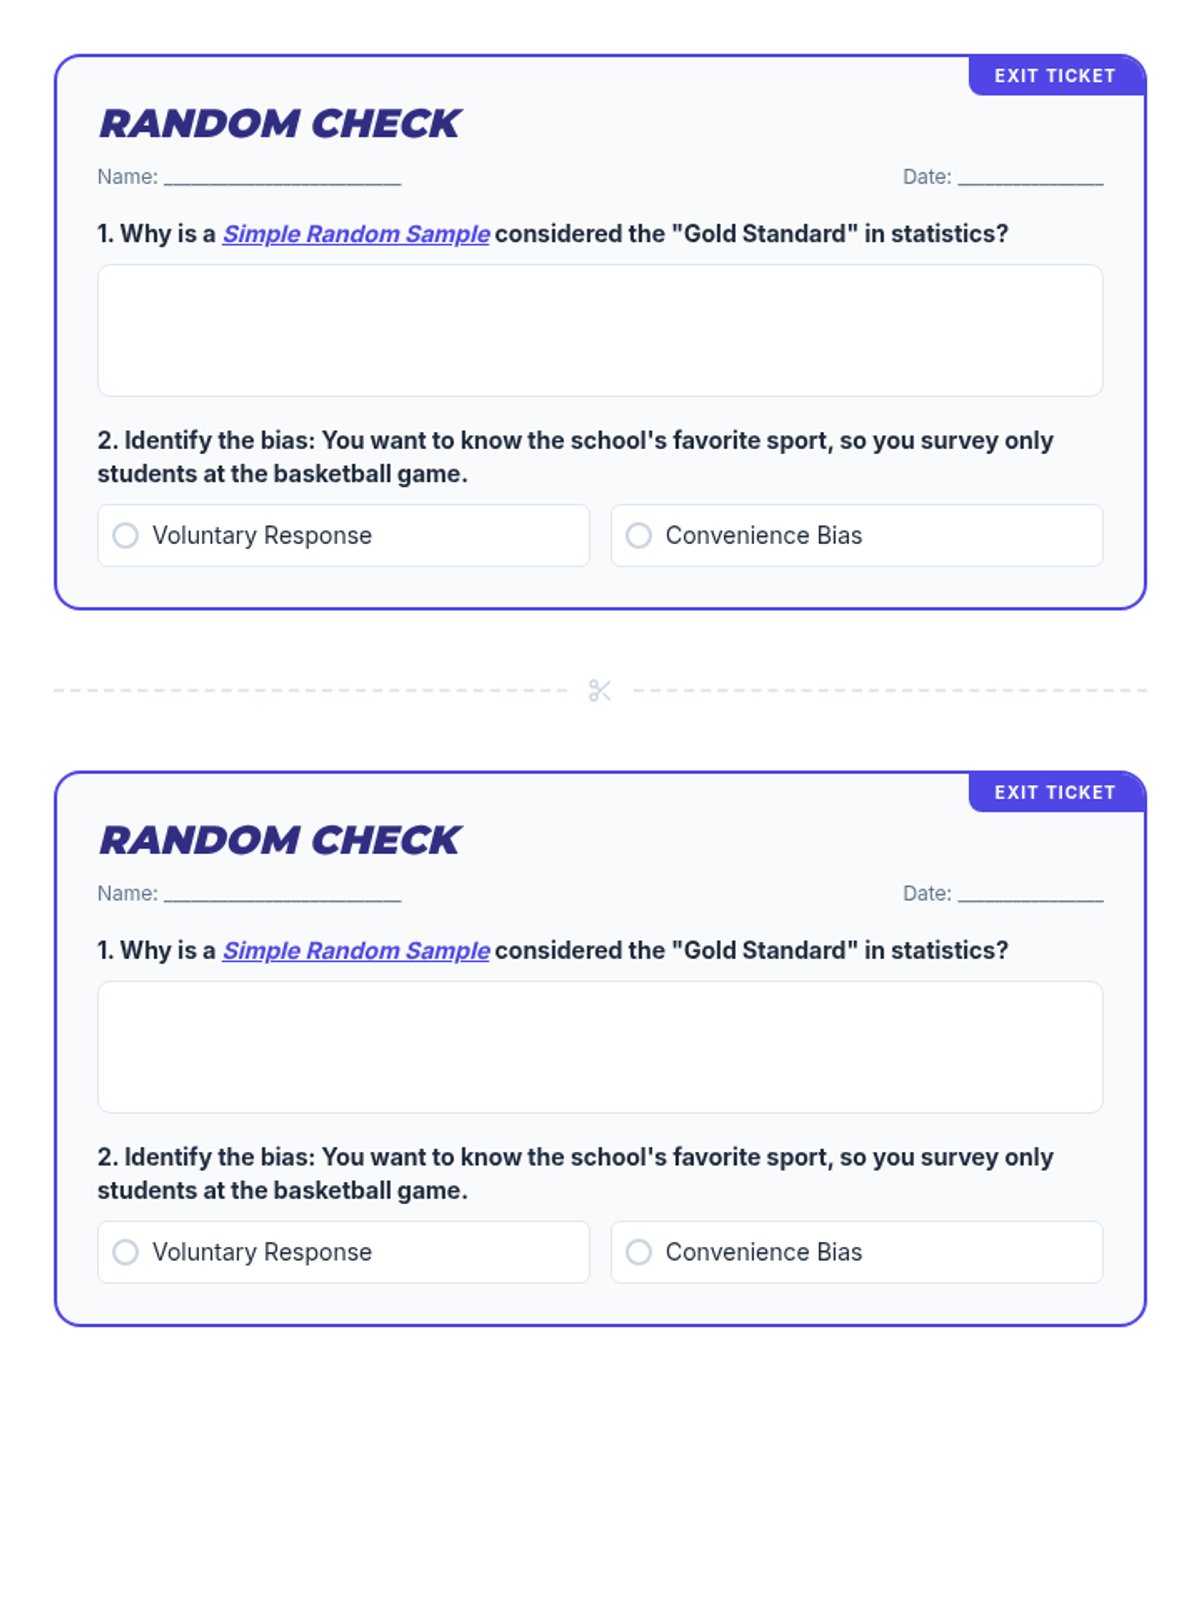
A lesson focused on using random sampling to make valid inferences about populations, including identifying bias and performing calculations.
A 65-minute lesson for 9th Grade students exploring the fundamental concepts of population, sampling, and statistical bias. Students learn to distinguish between fair and biased collection methods through scenario analysis and sorting activities.
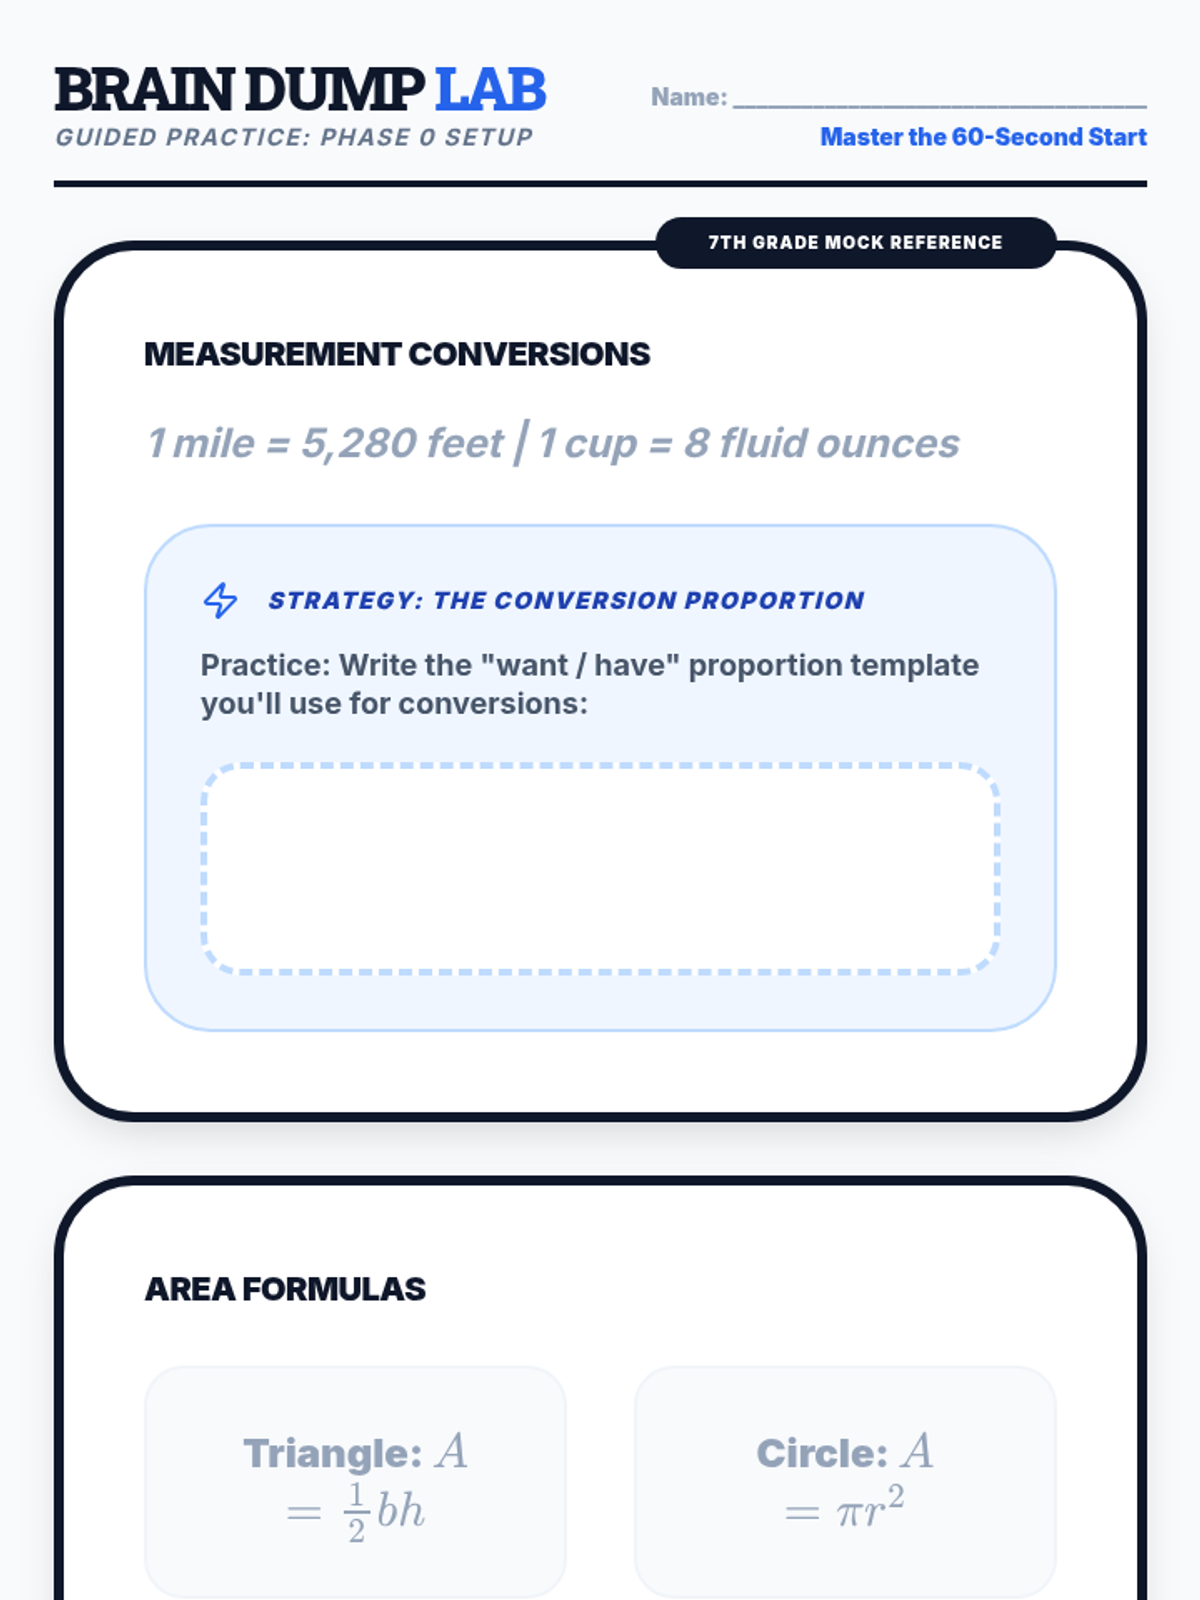
A pair of intensive, 30-minute test-prep morning work packets designed for the morning of the NYS Grade 7 Math Test, covering all major domains with a focus on confidence and strategy.
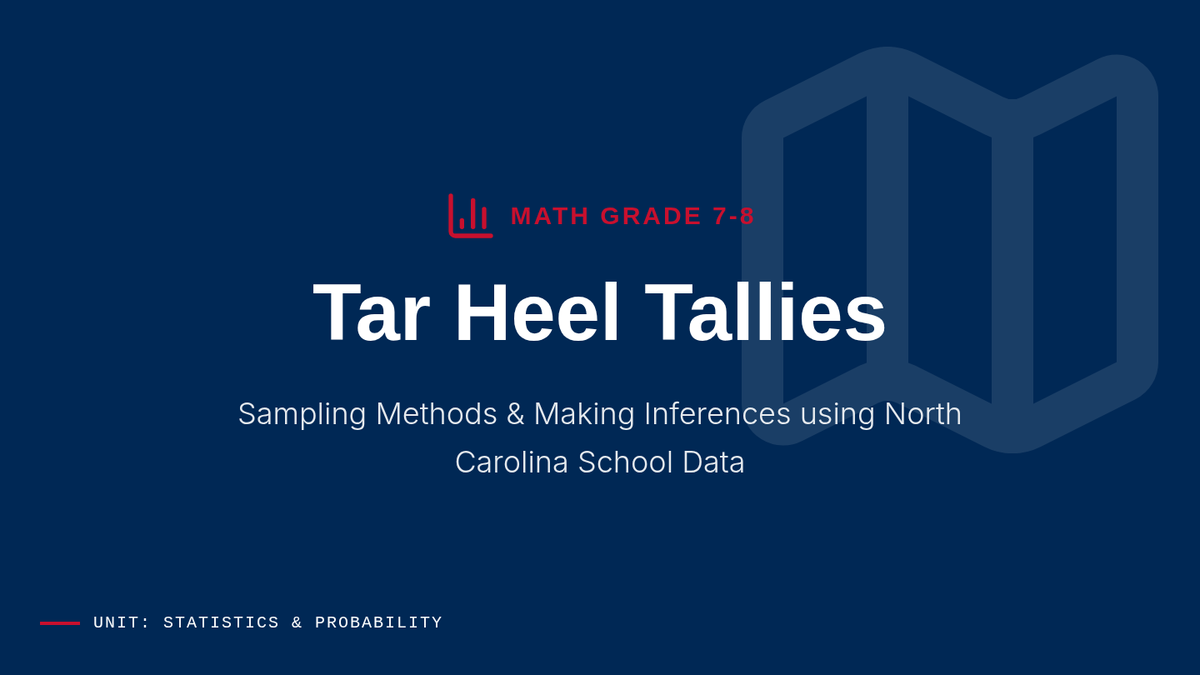
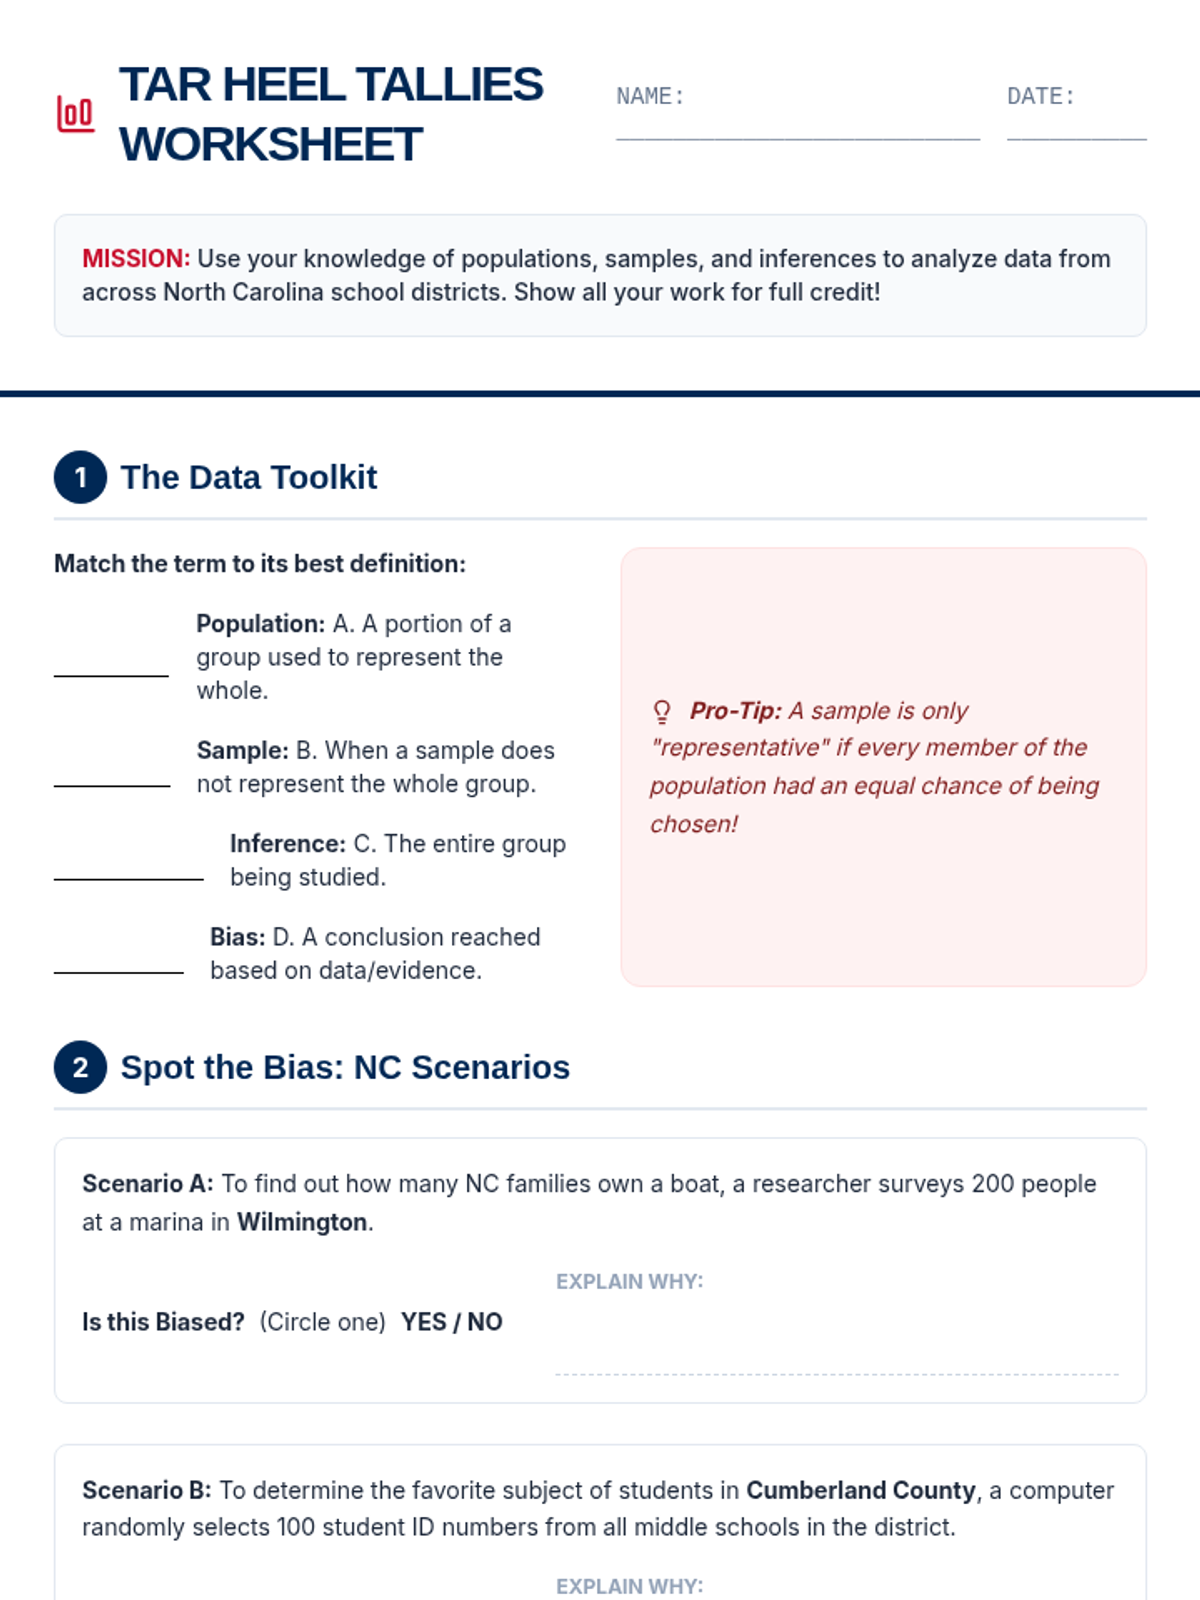
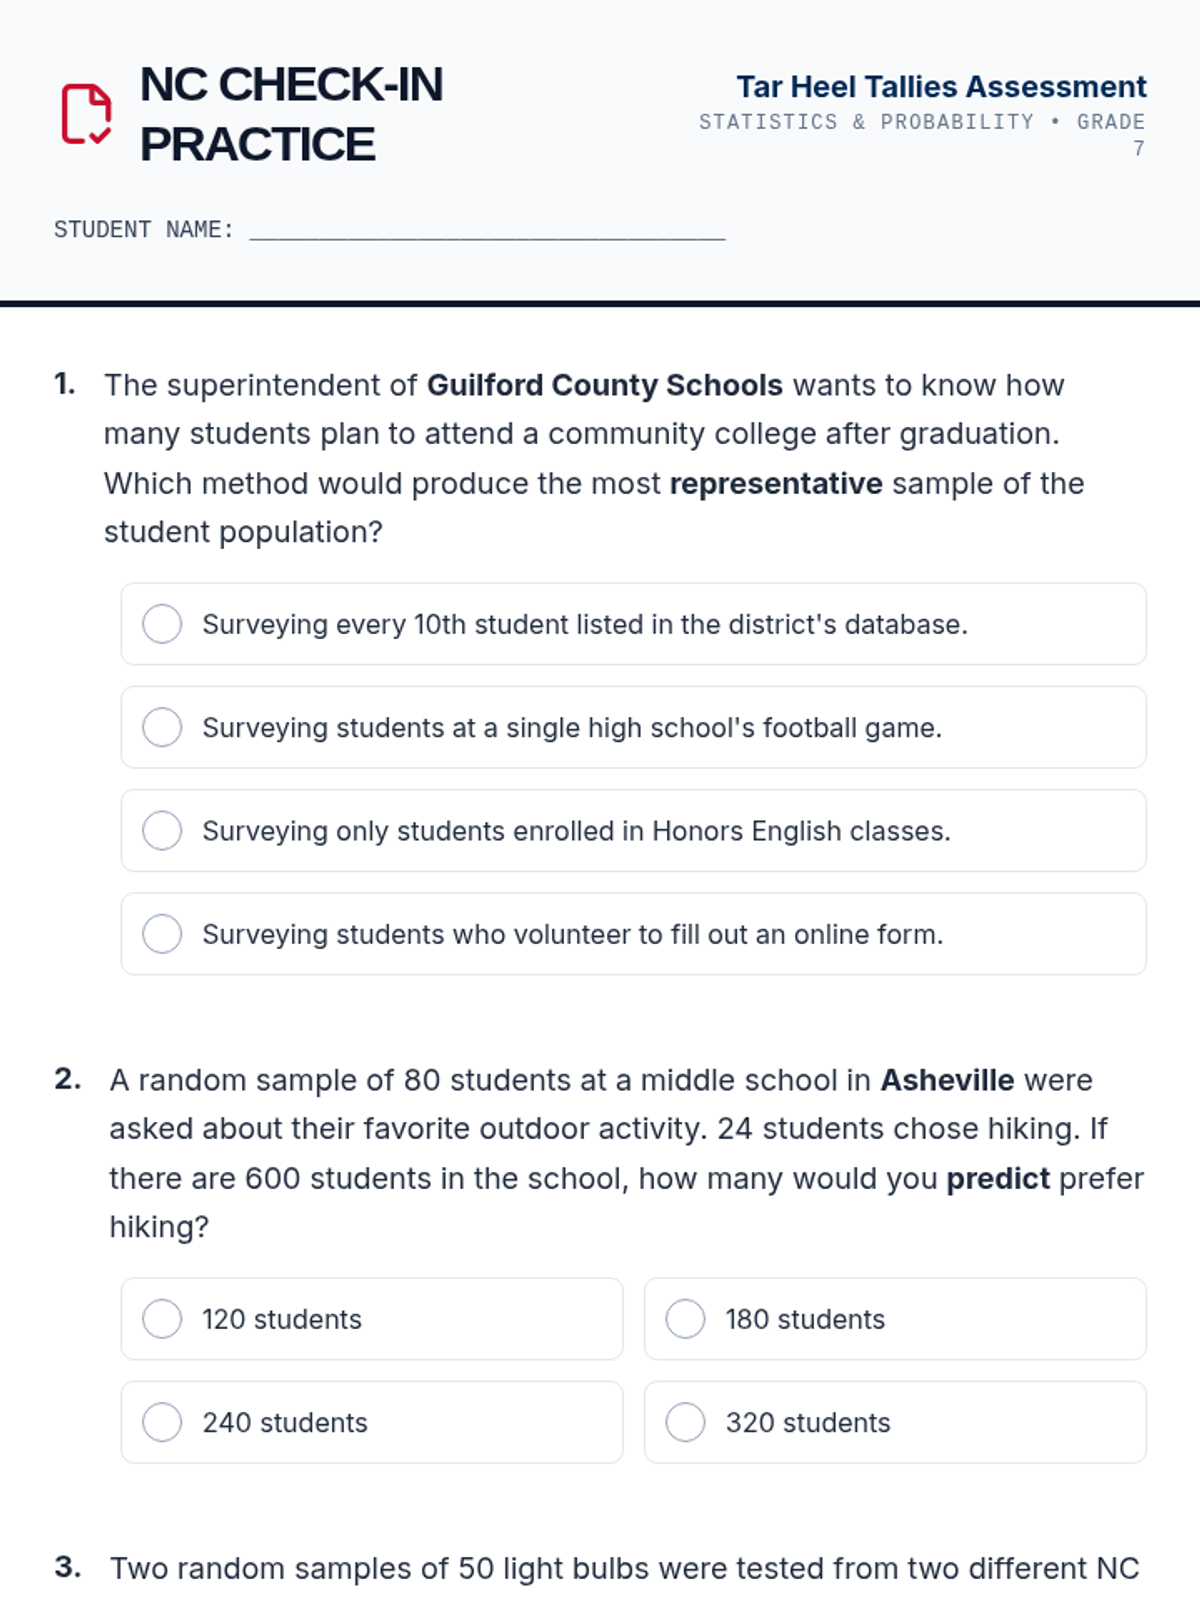
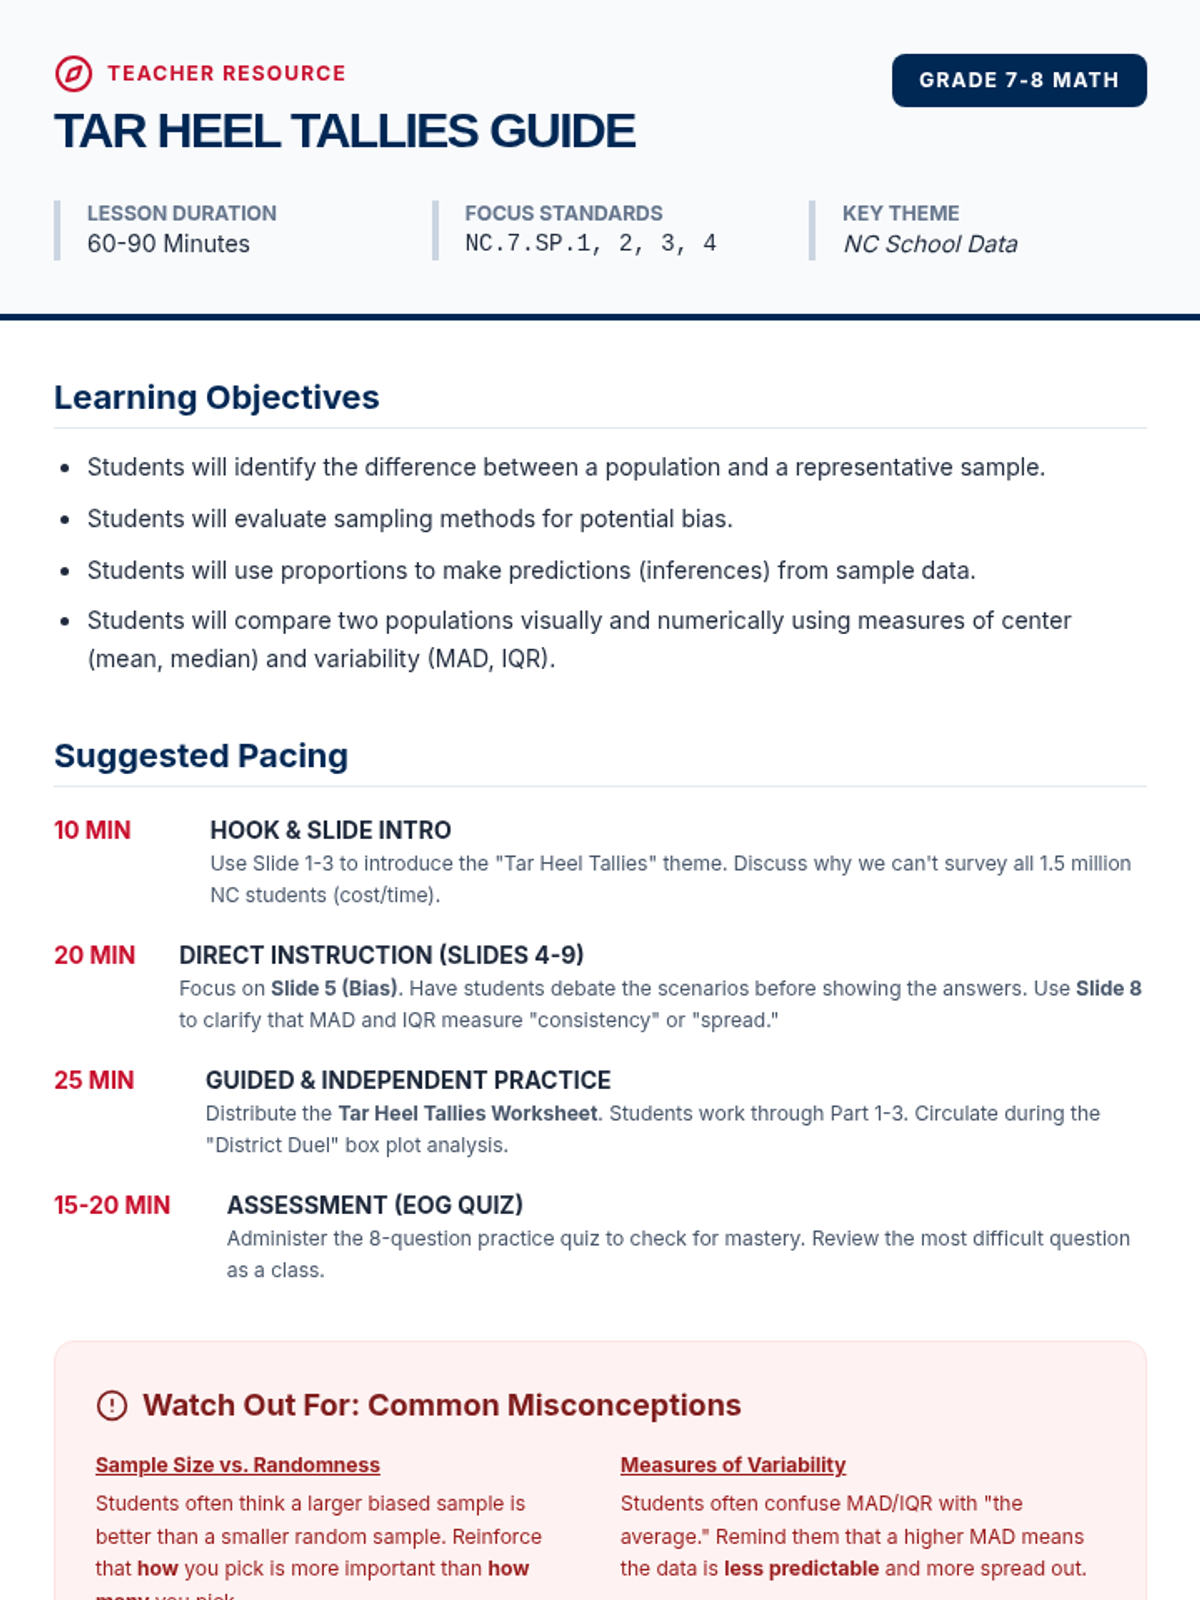
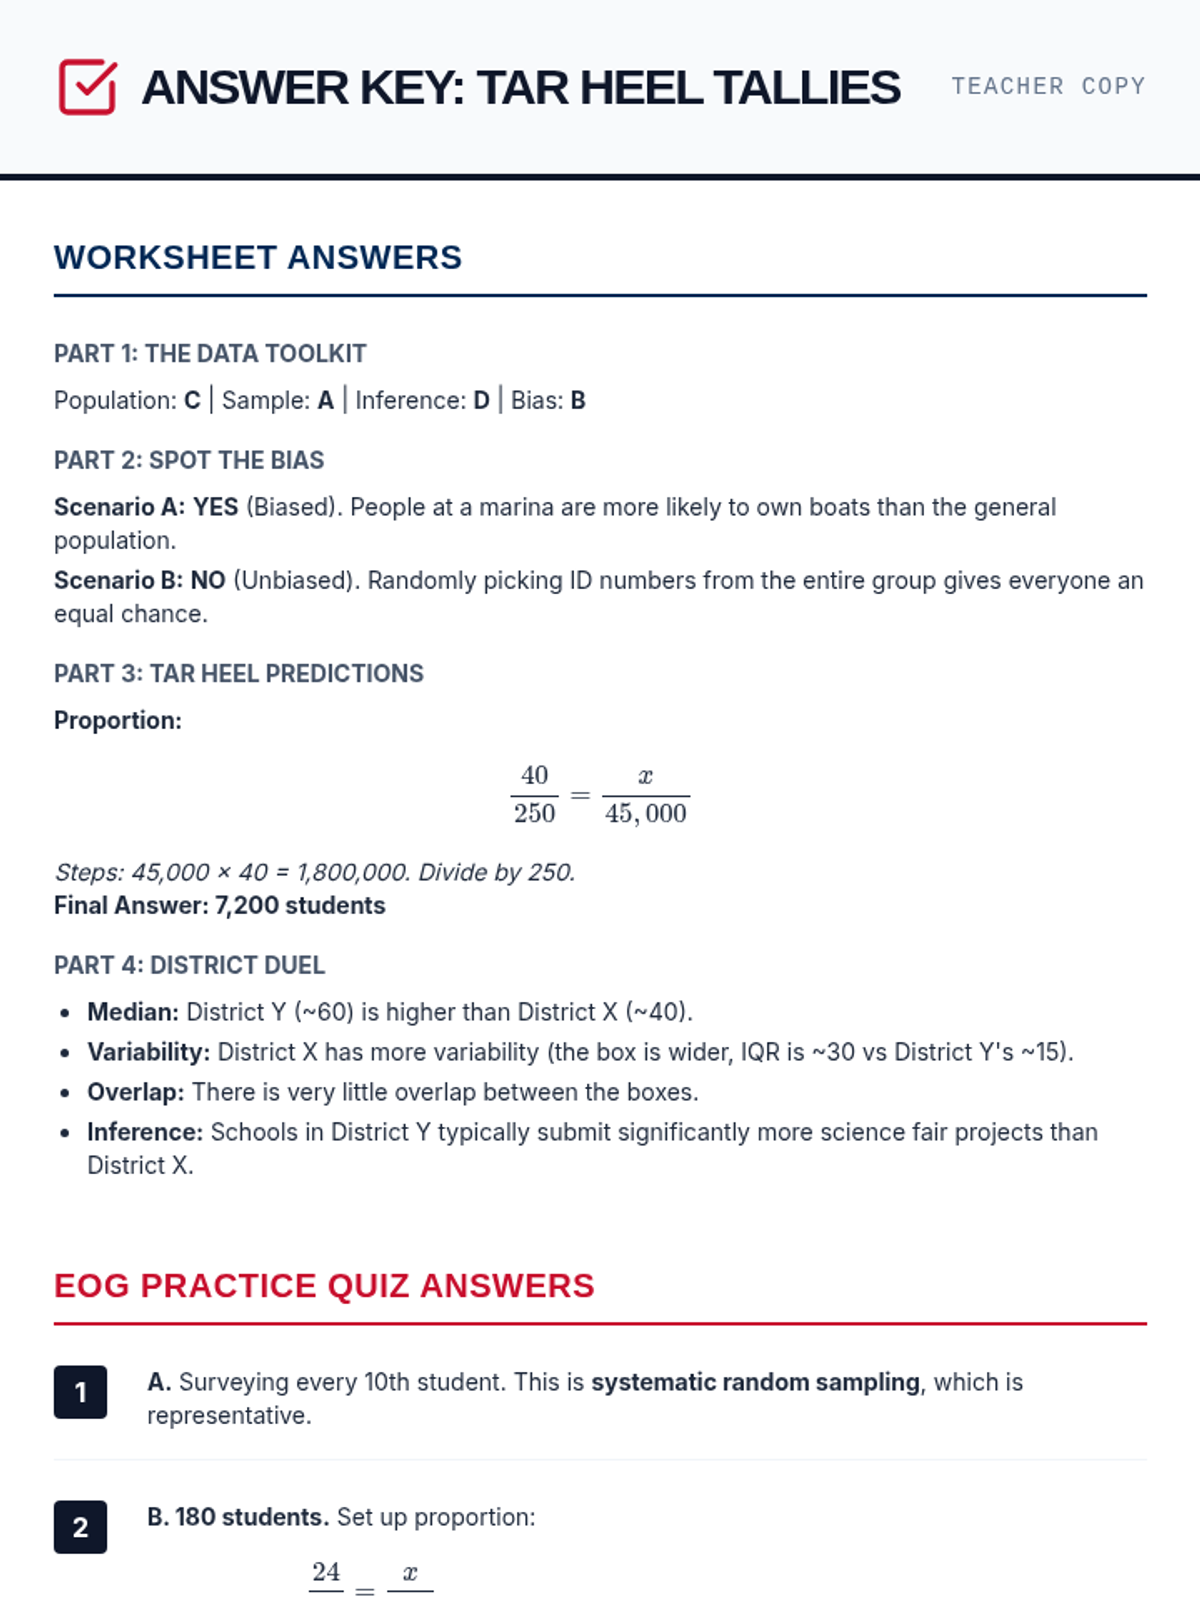
A comprehensive lesson on sampling techniques, population inferences, and data comparison using North Carolina school district data. Students will learn to identify biased sampling, make predictions from representative samples, and compare two populations using measures of center and variability.
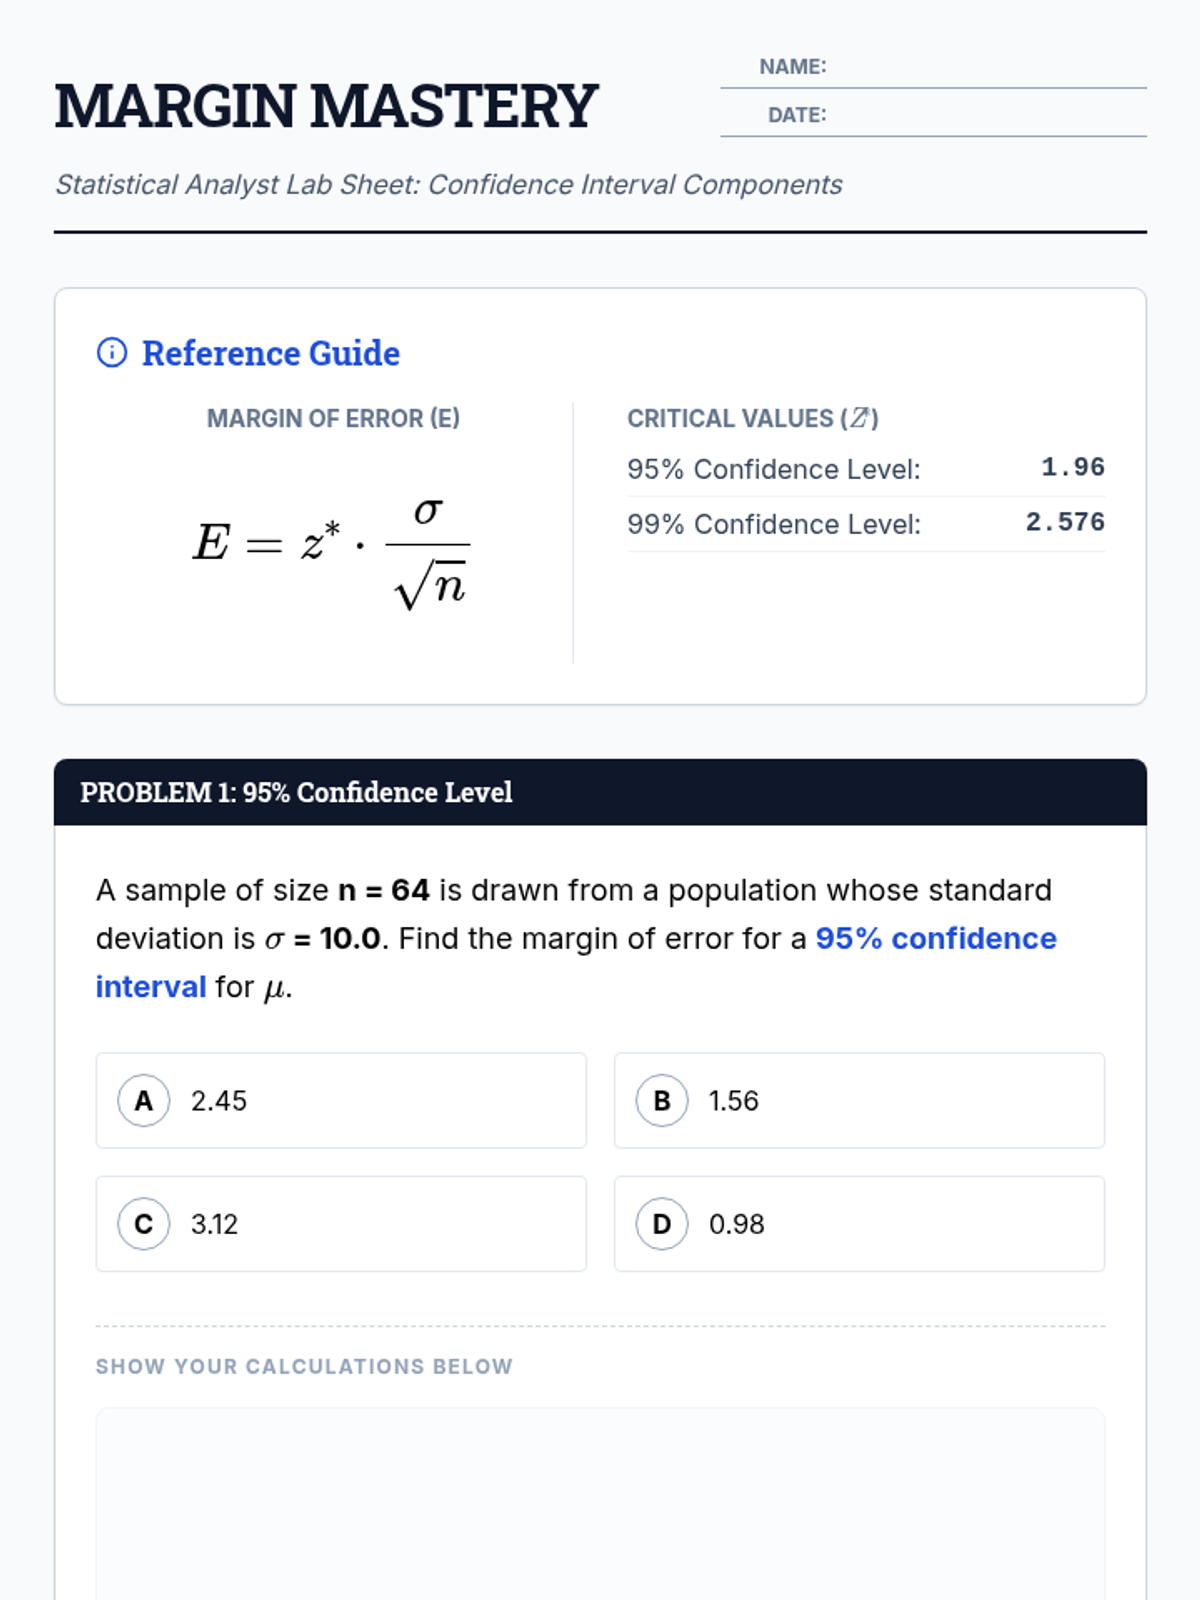
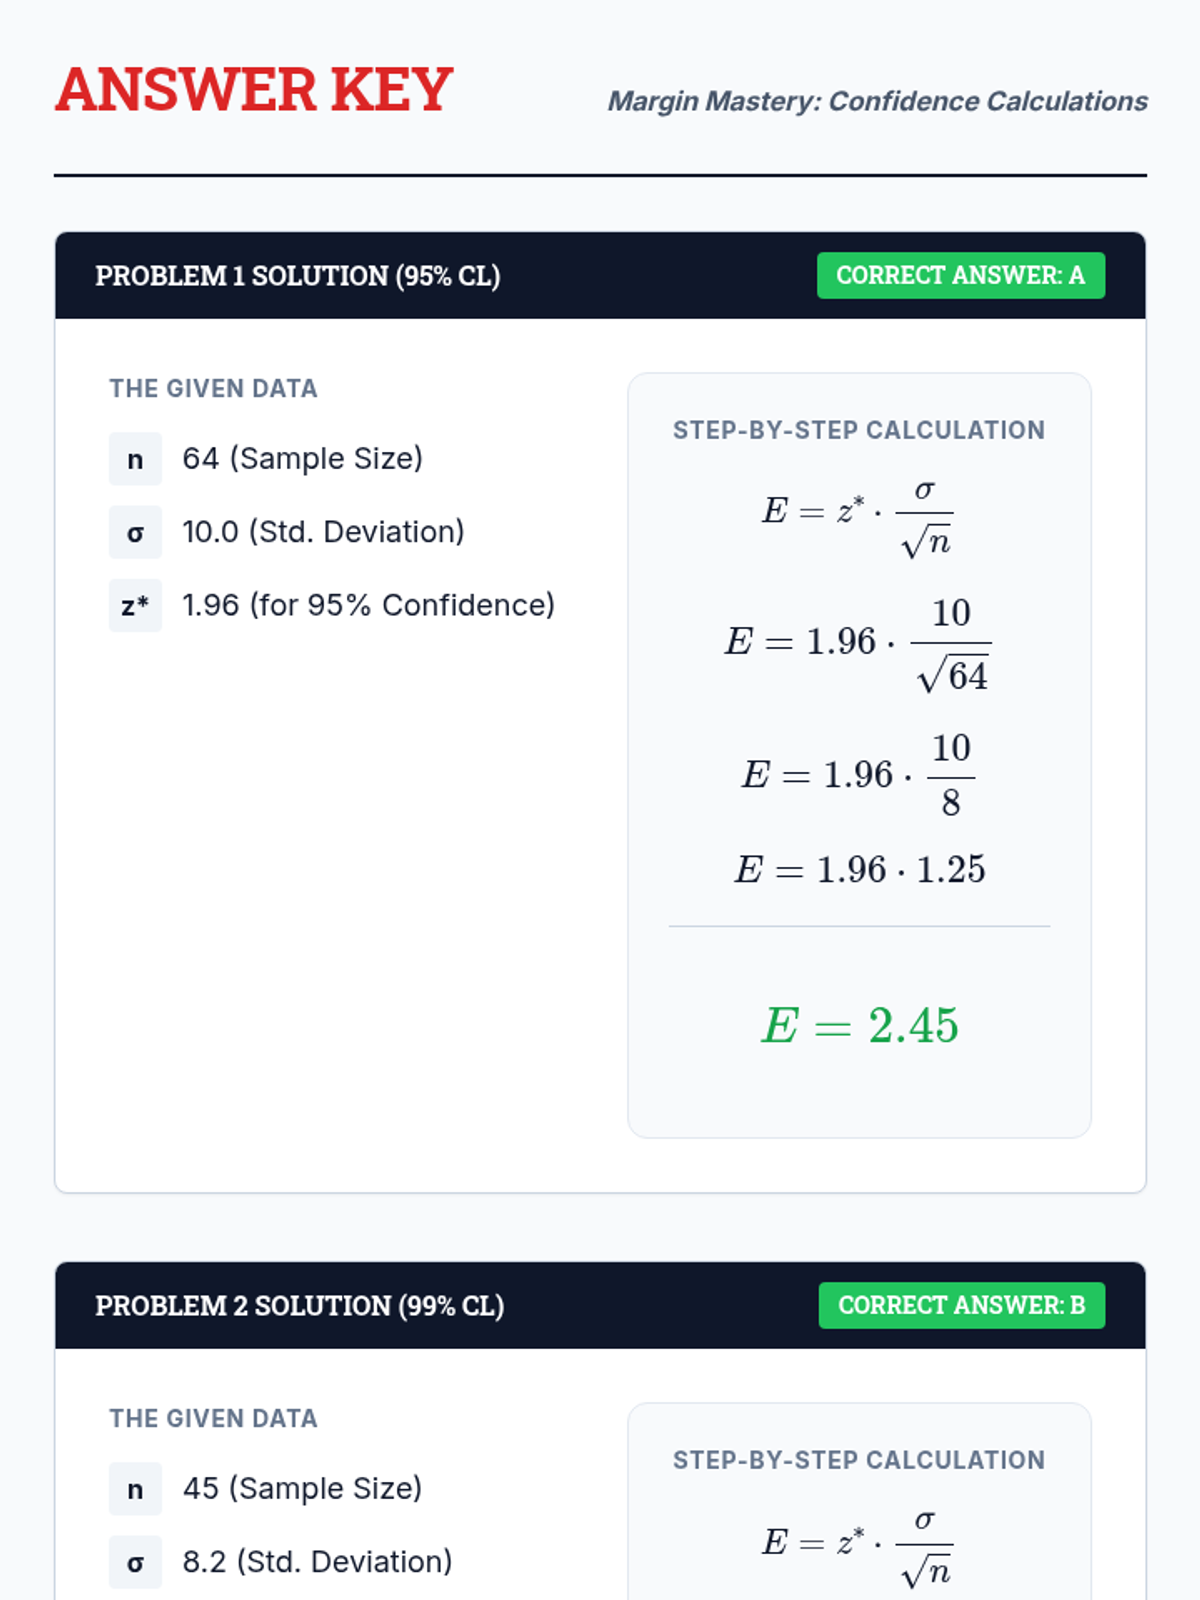
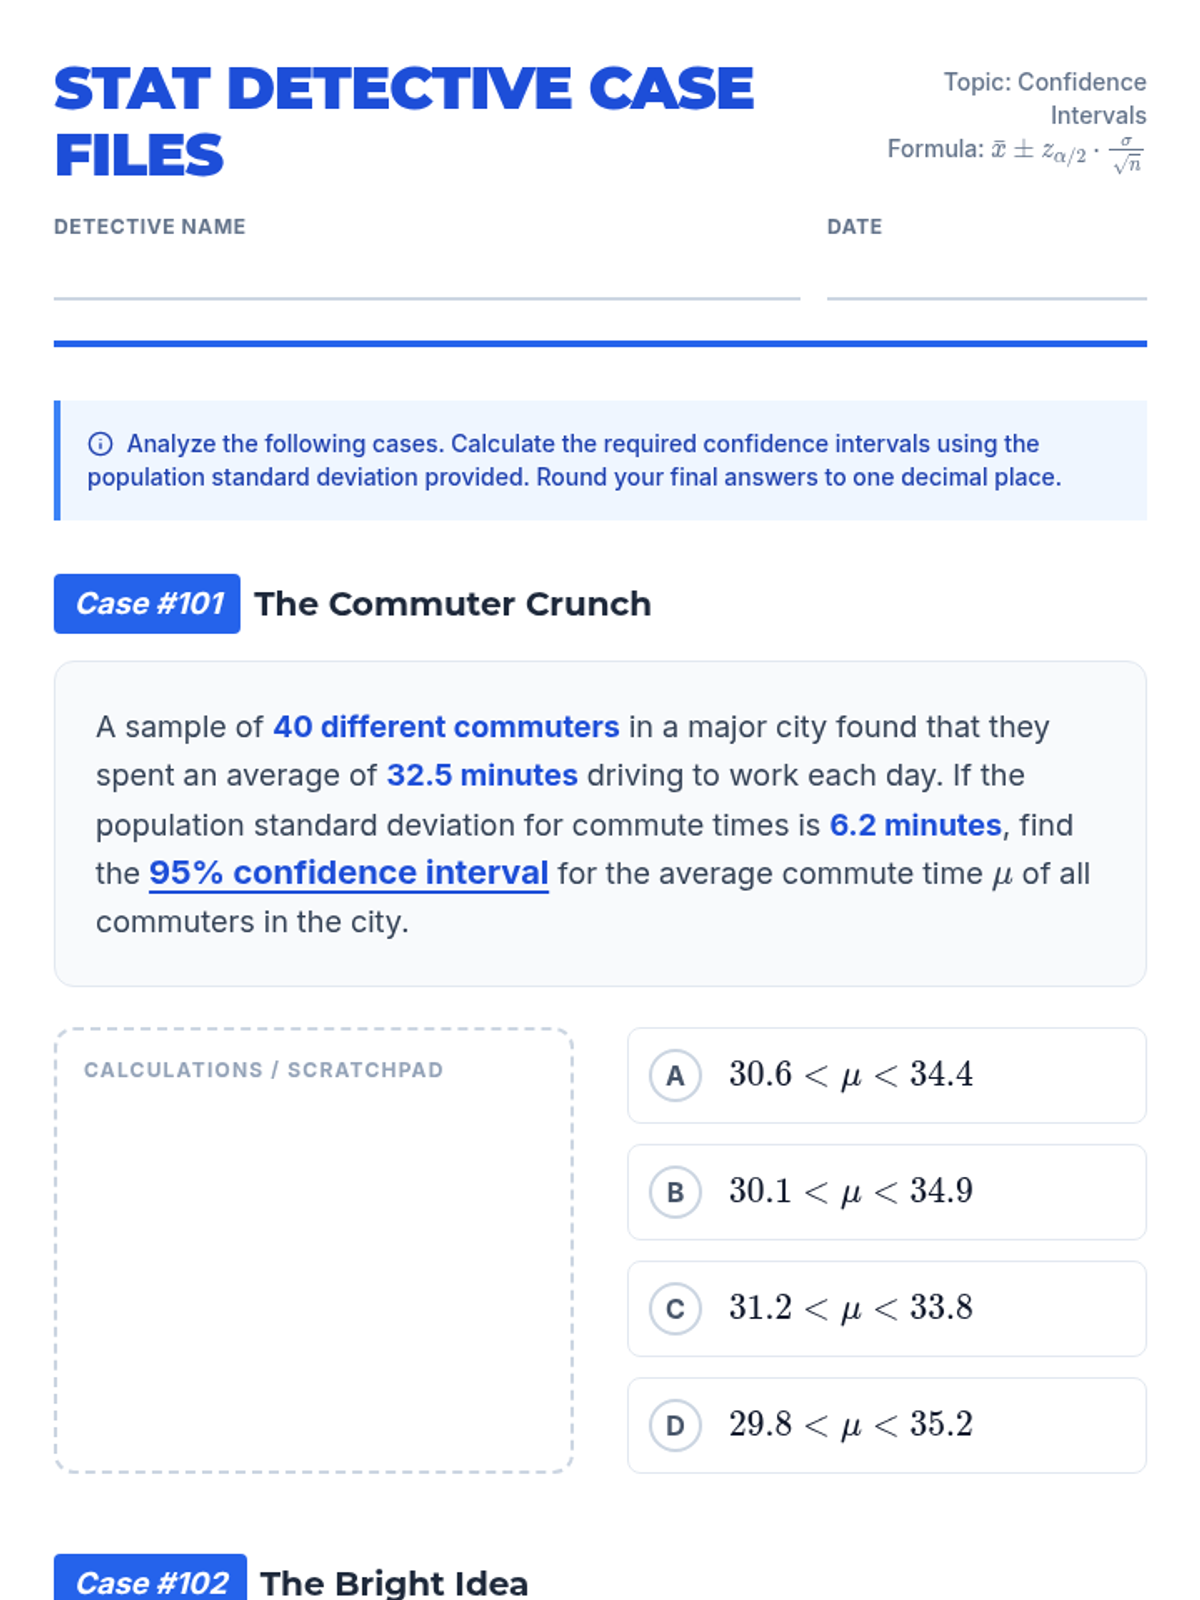
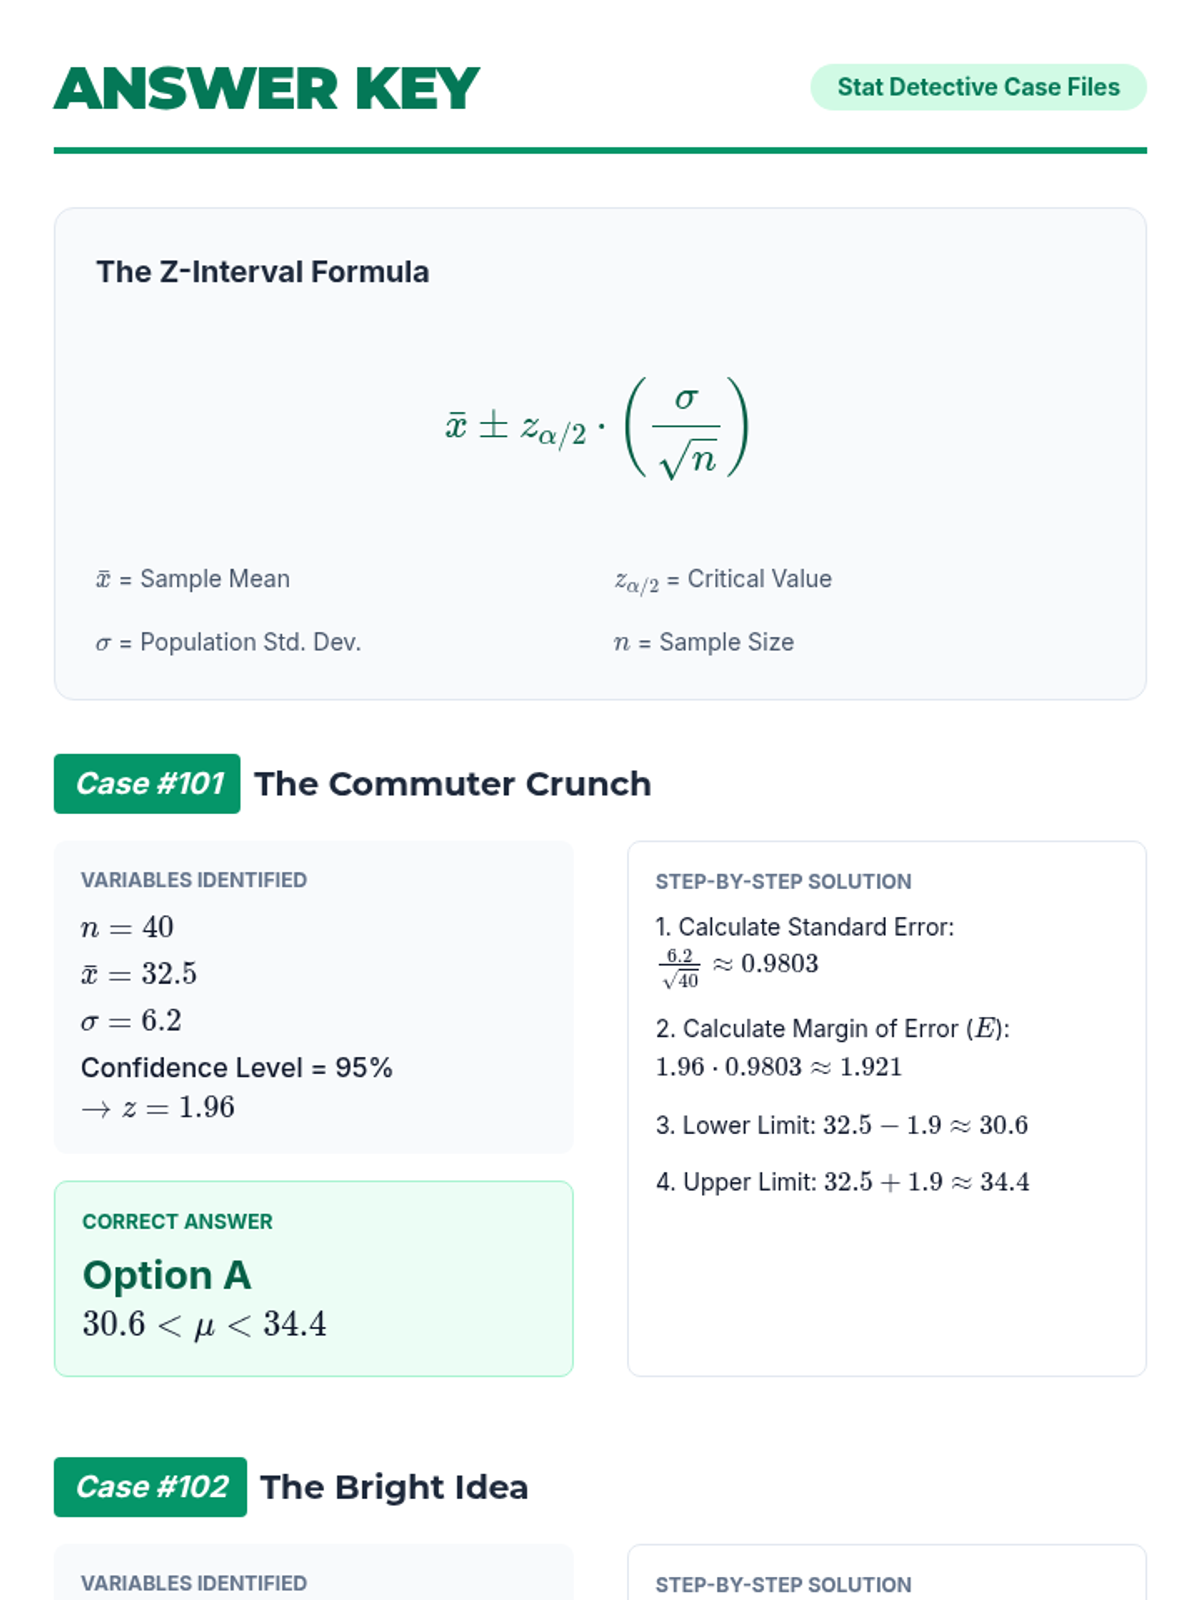
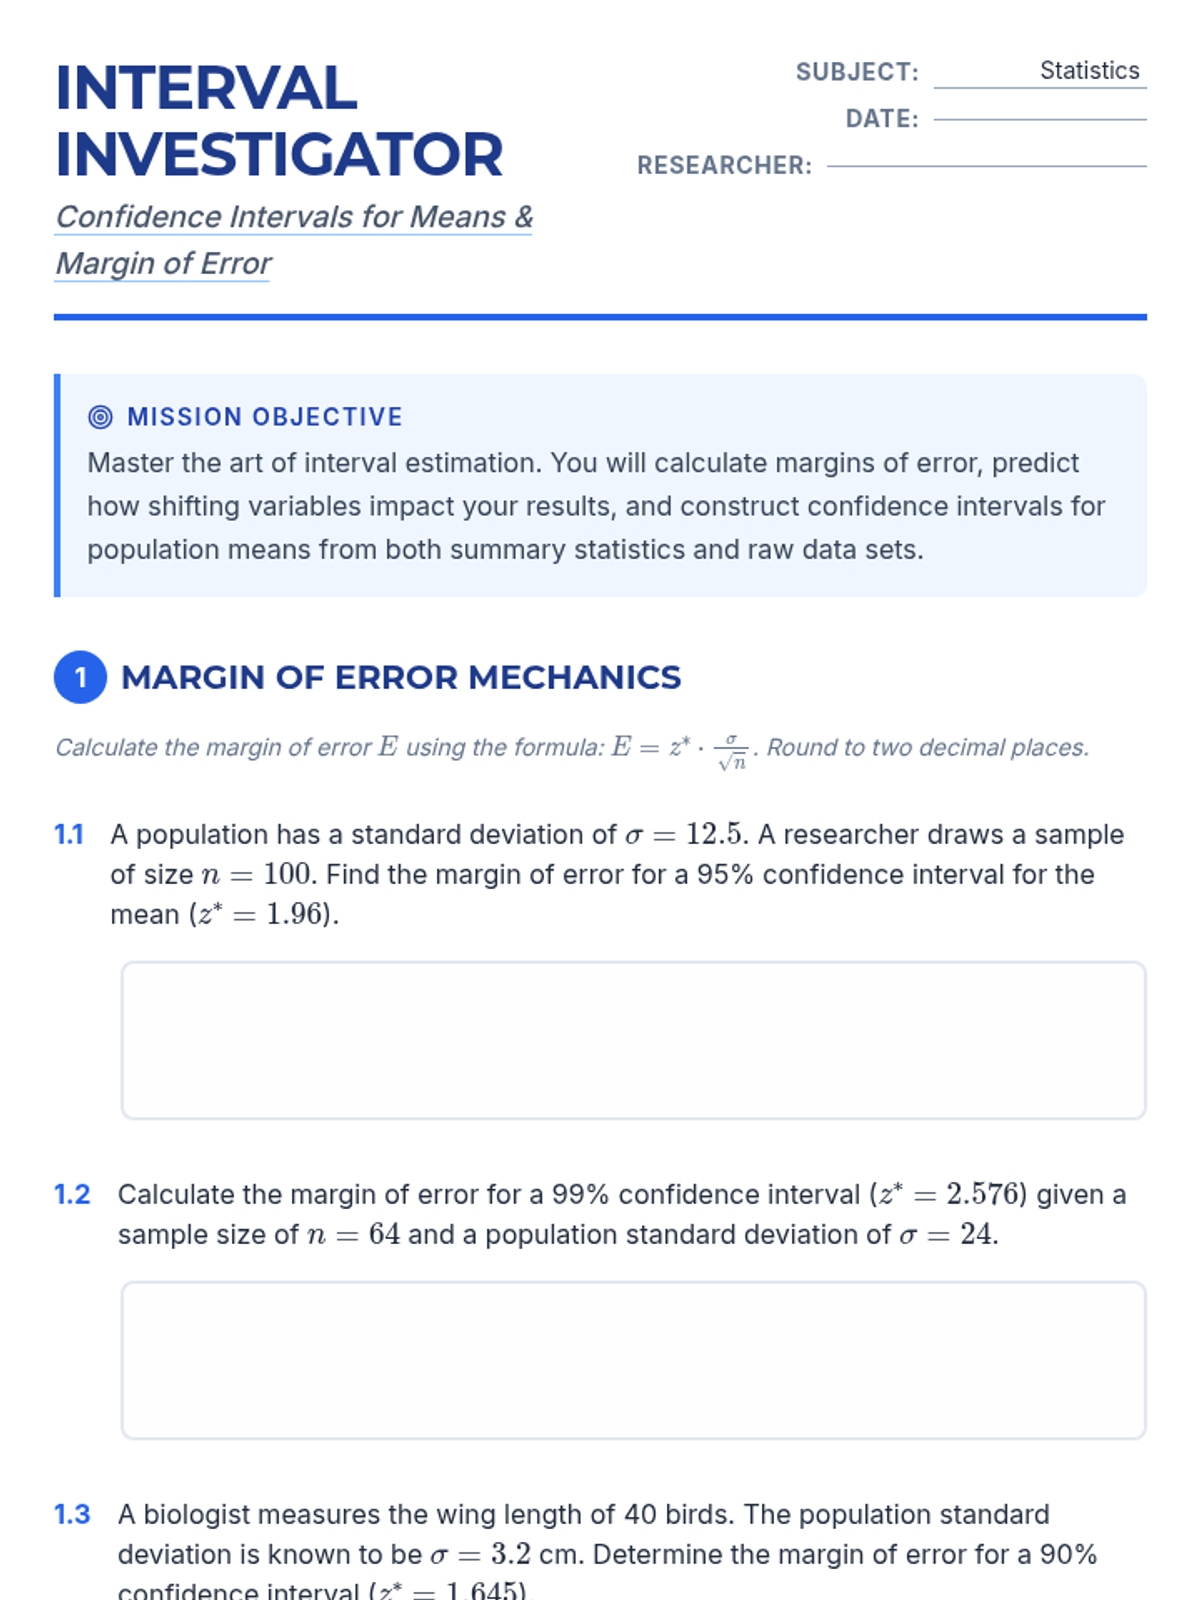
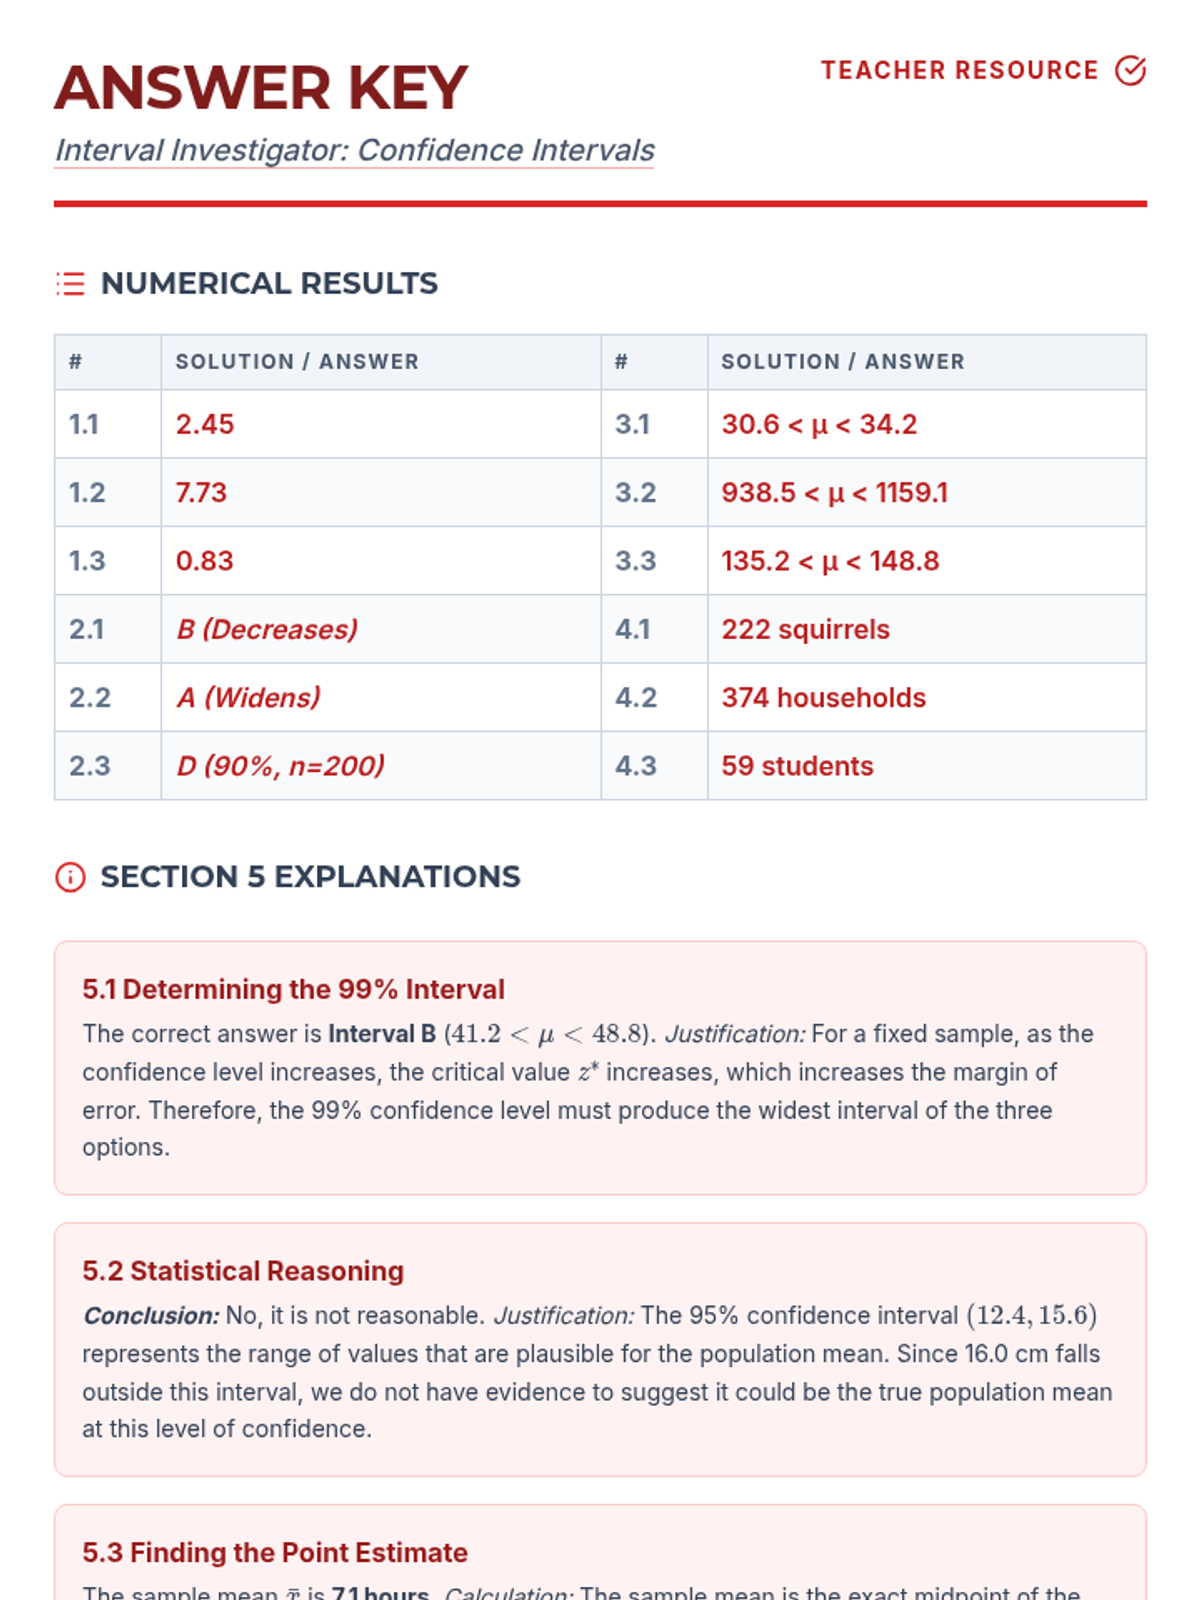
A lesson focused on calculating the margin of error for population means when the population standard deviation is known. Students practice using z-scores for different confidence levels.
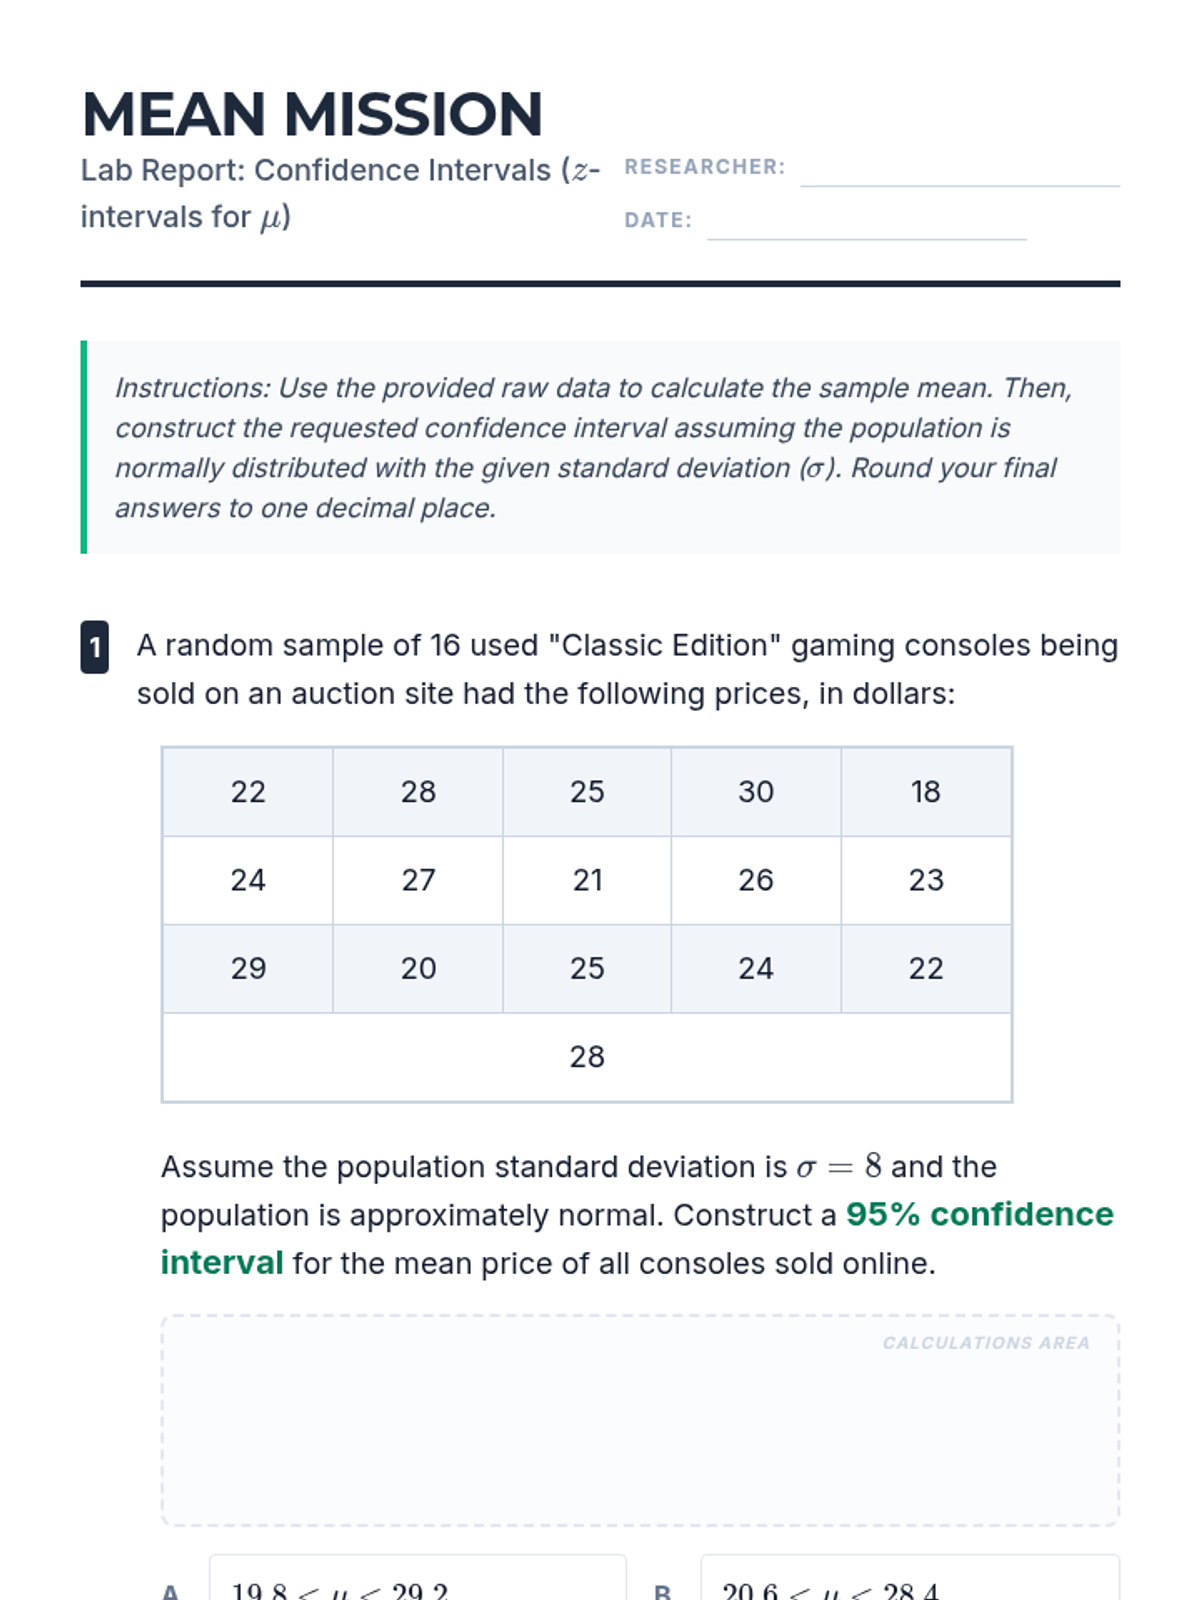
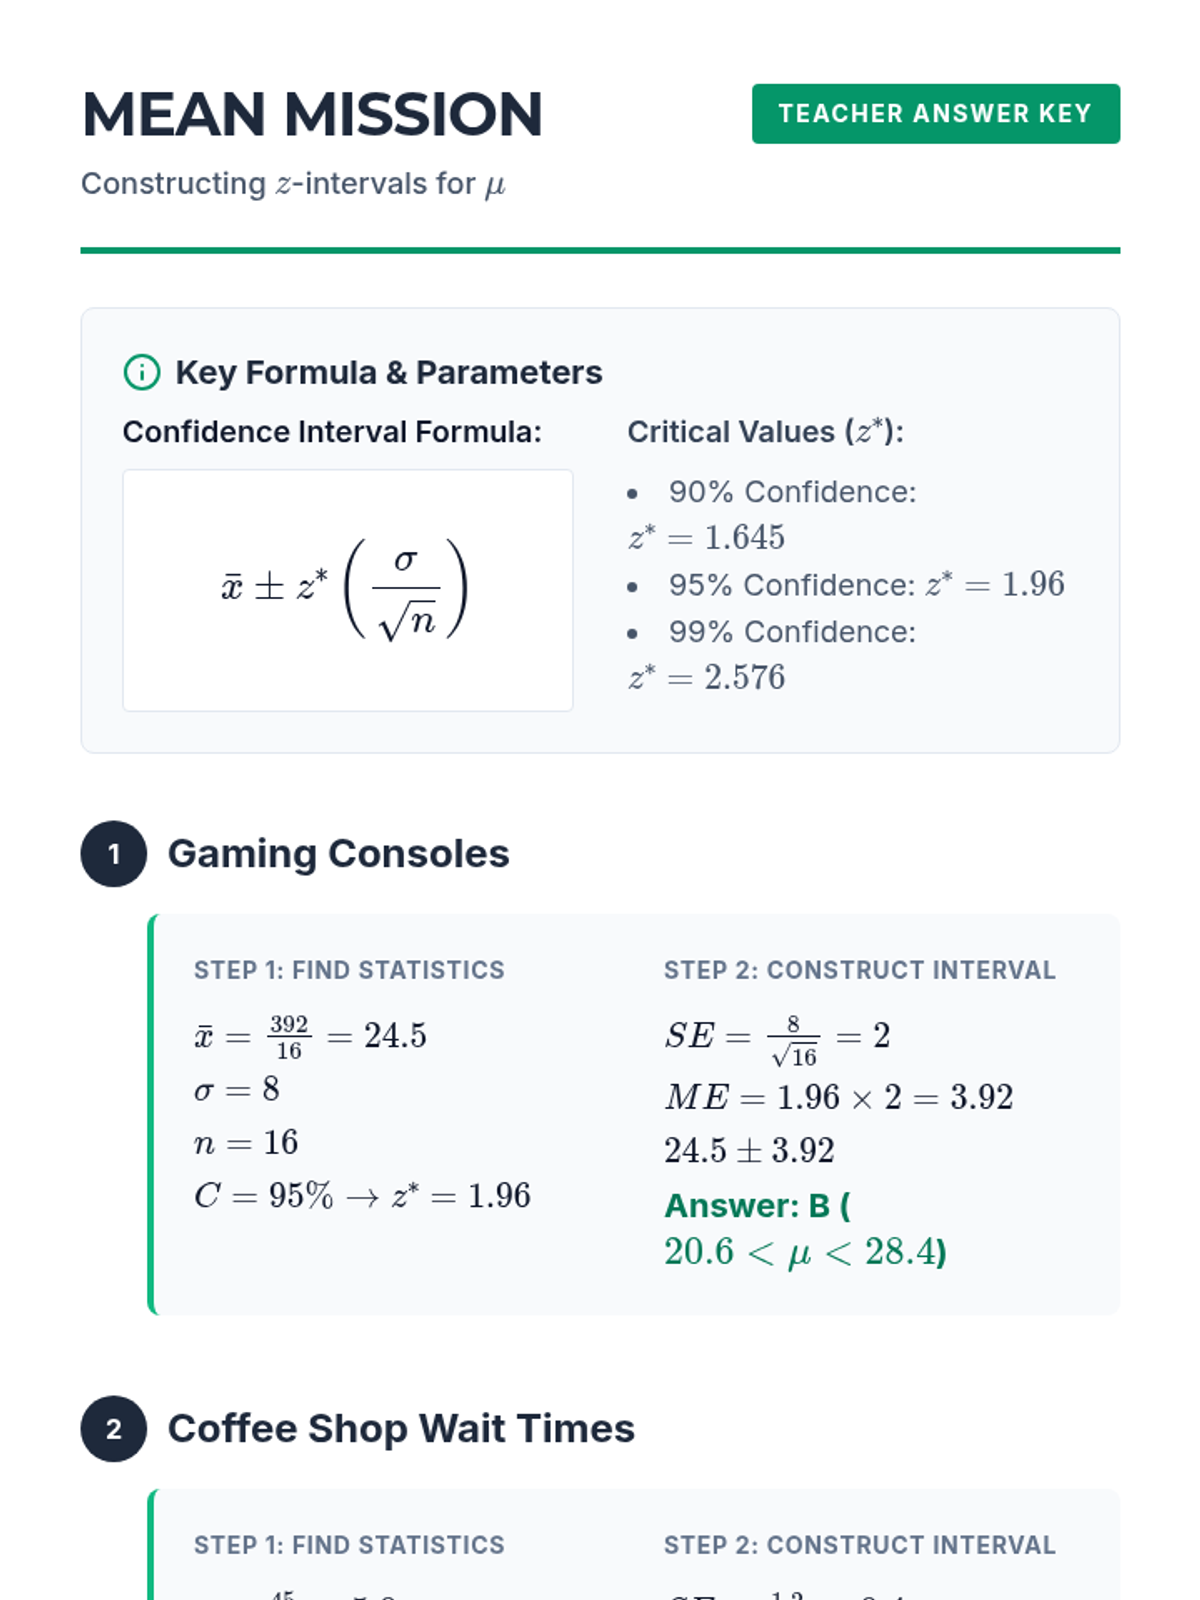
A focused practice session on constructing z-confidence intervals for the mean using raw data and known population standard deviations.
A lesson focused on calculating and interpreting confidence intervals for population means when the population standard deviation is known. Students practice identifying key statistics and applying the Z-interval formula to real-world scenarios.
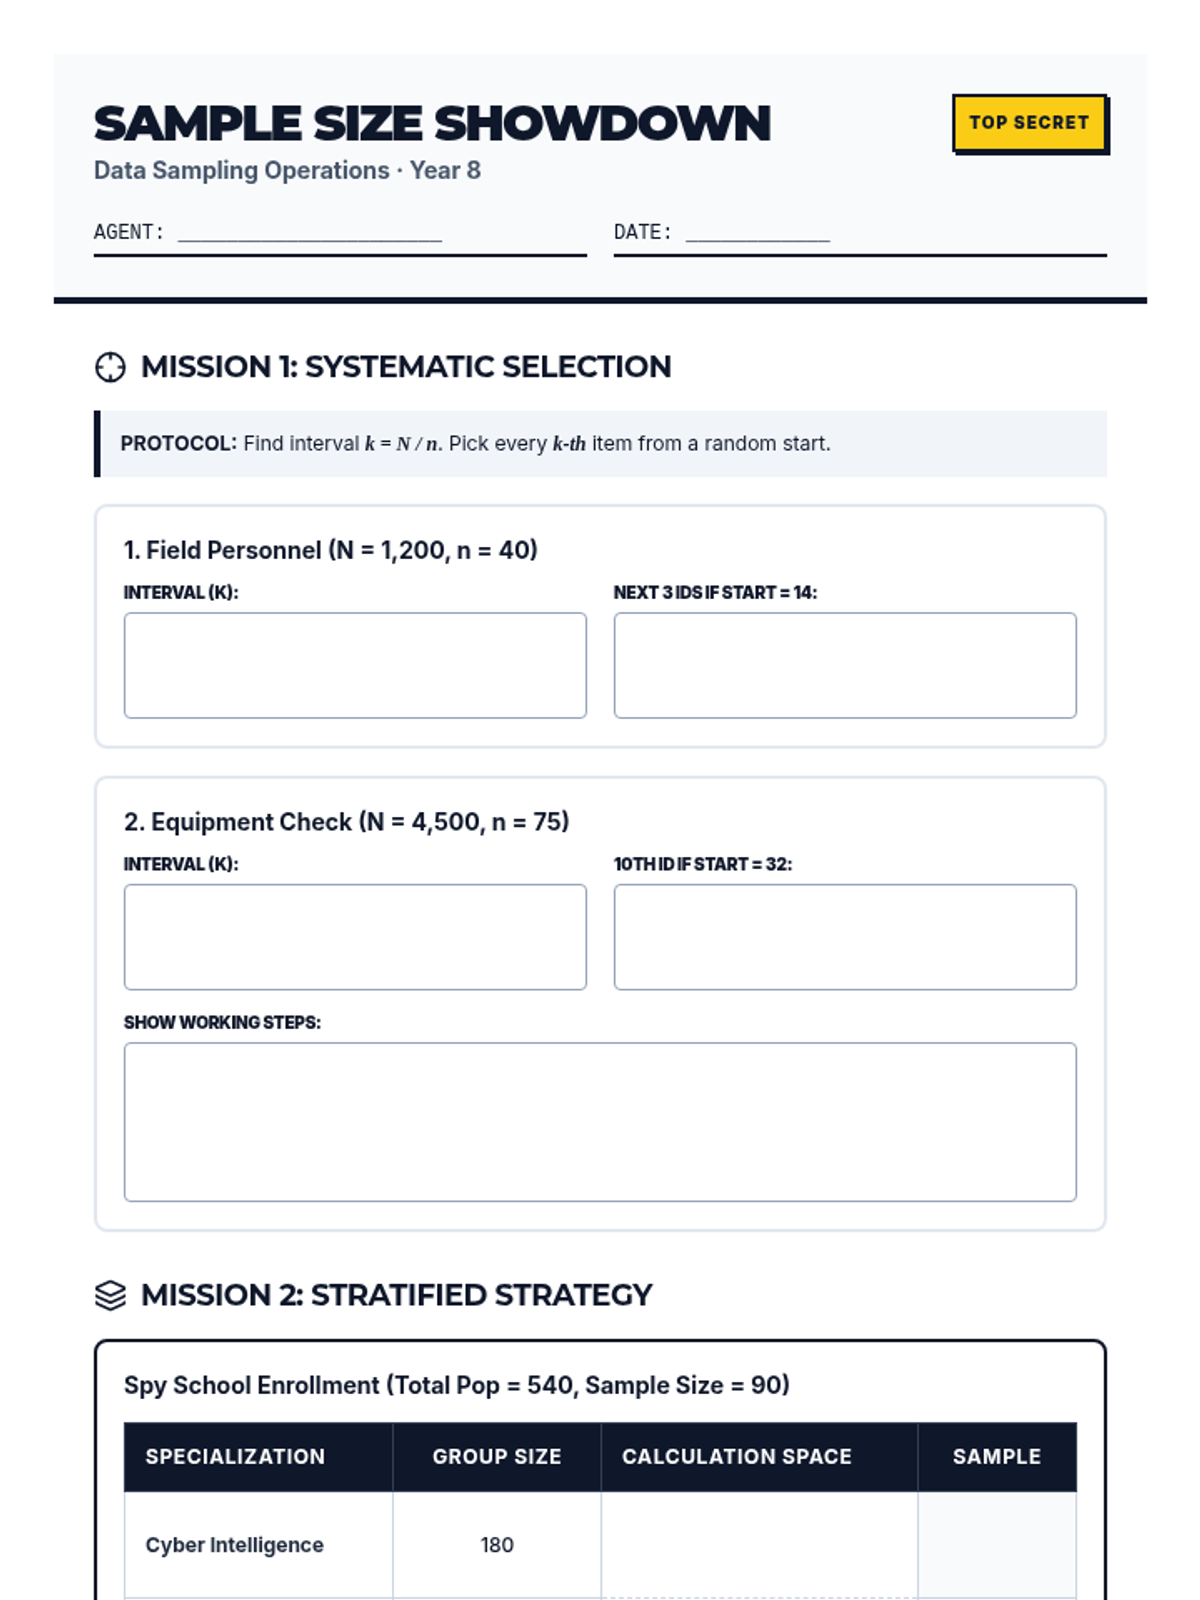
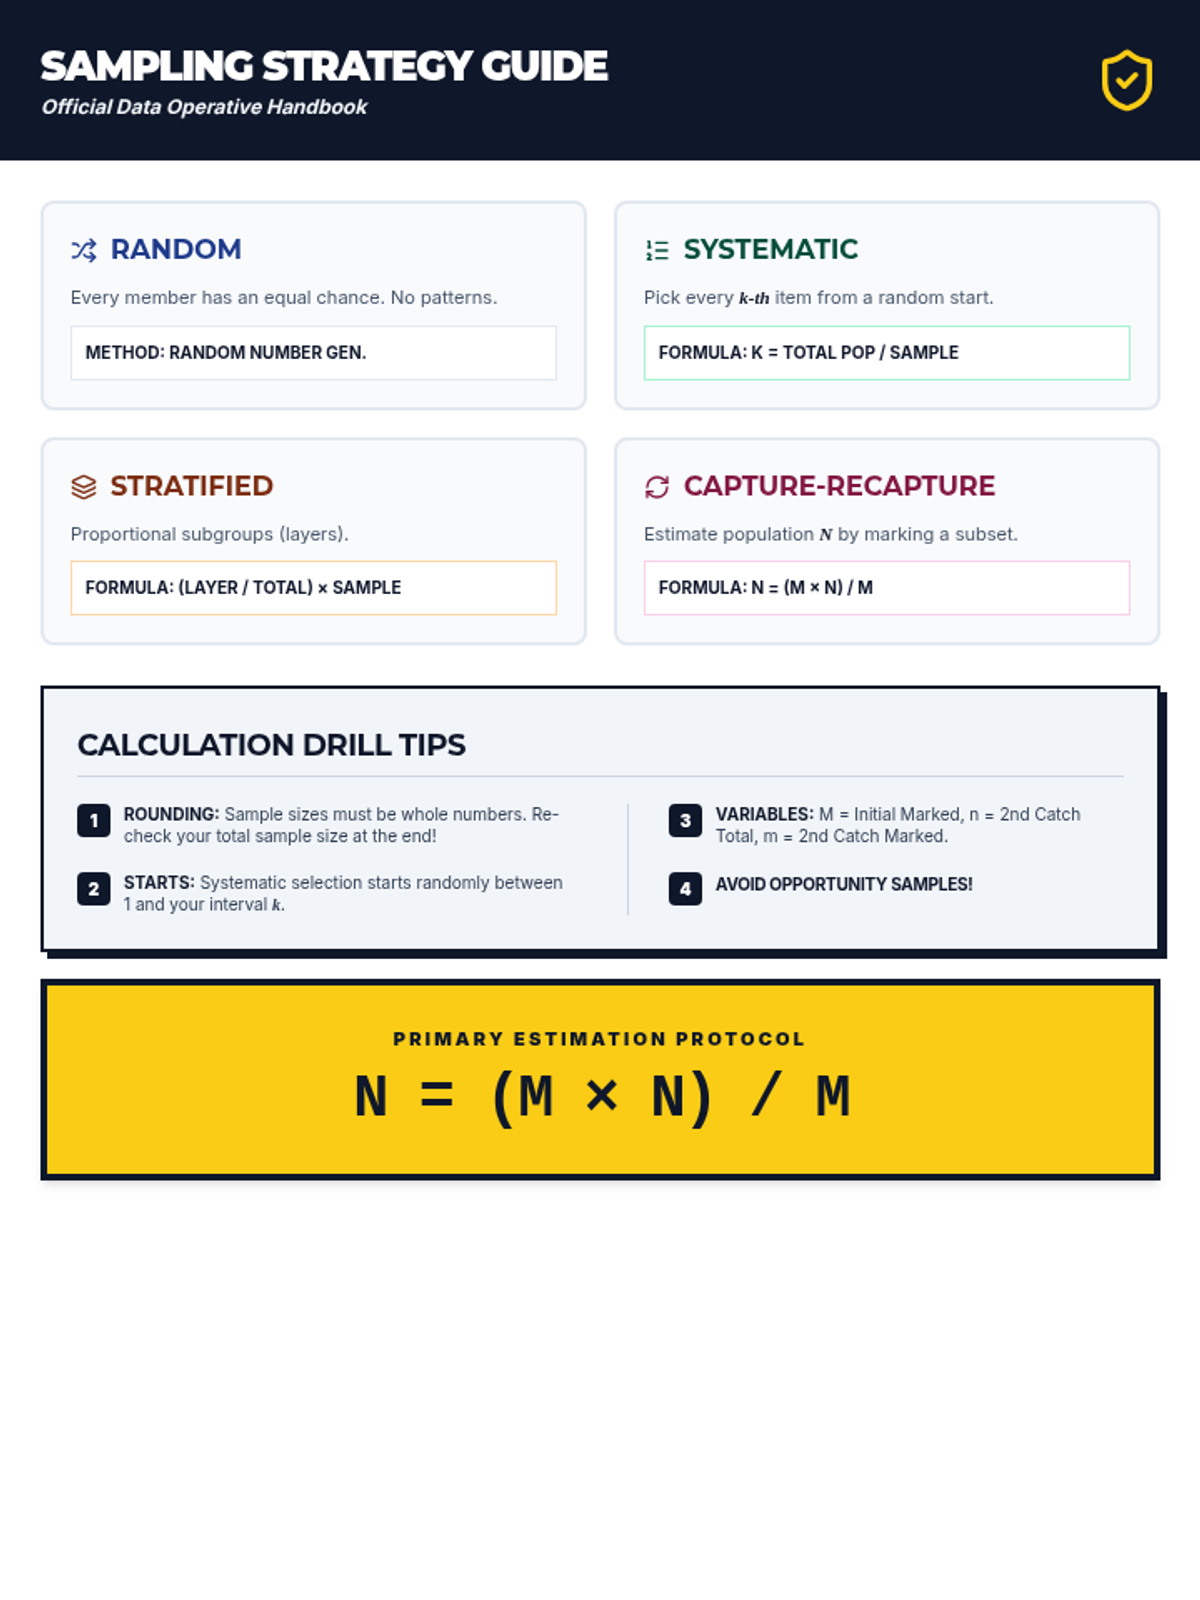
A comprehensive introduction to data sampling methods for Year 8 students, focusing on the mechanics of systematic, stratified, and capture-recapture calculations through a secret agent lens.
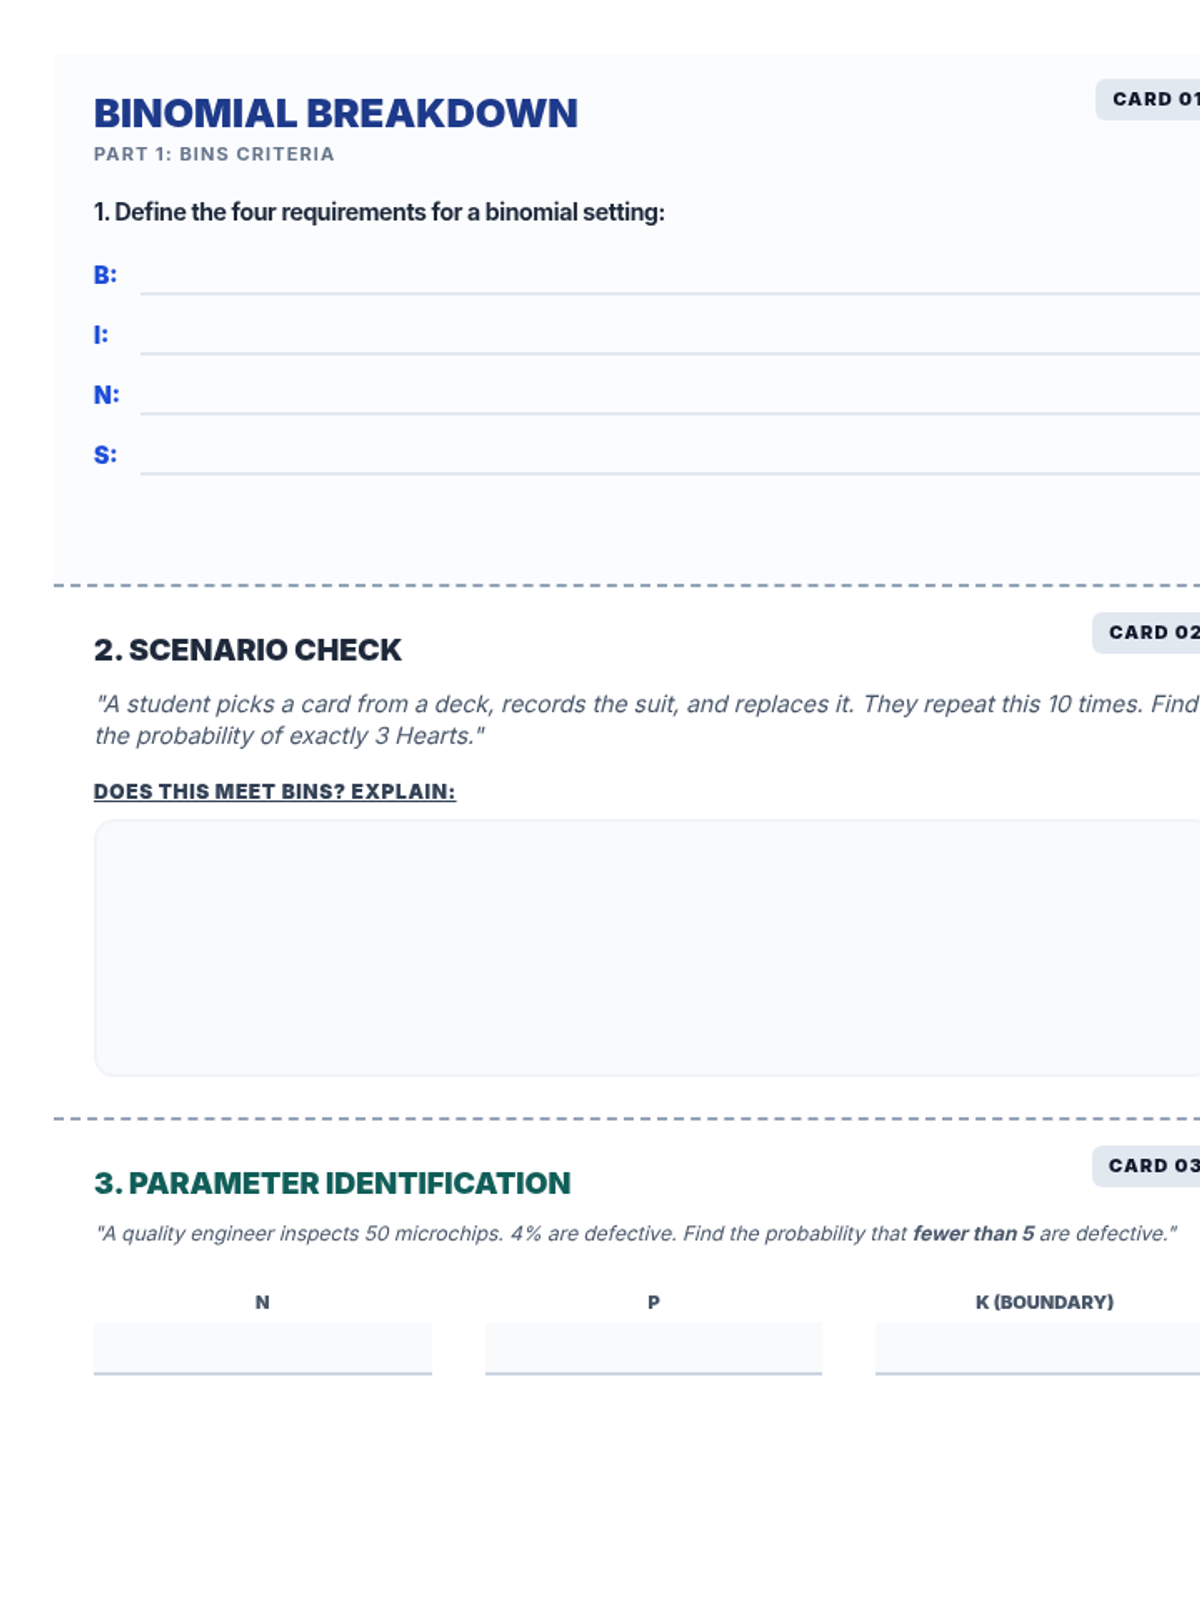
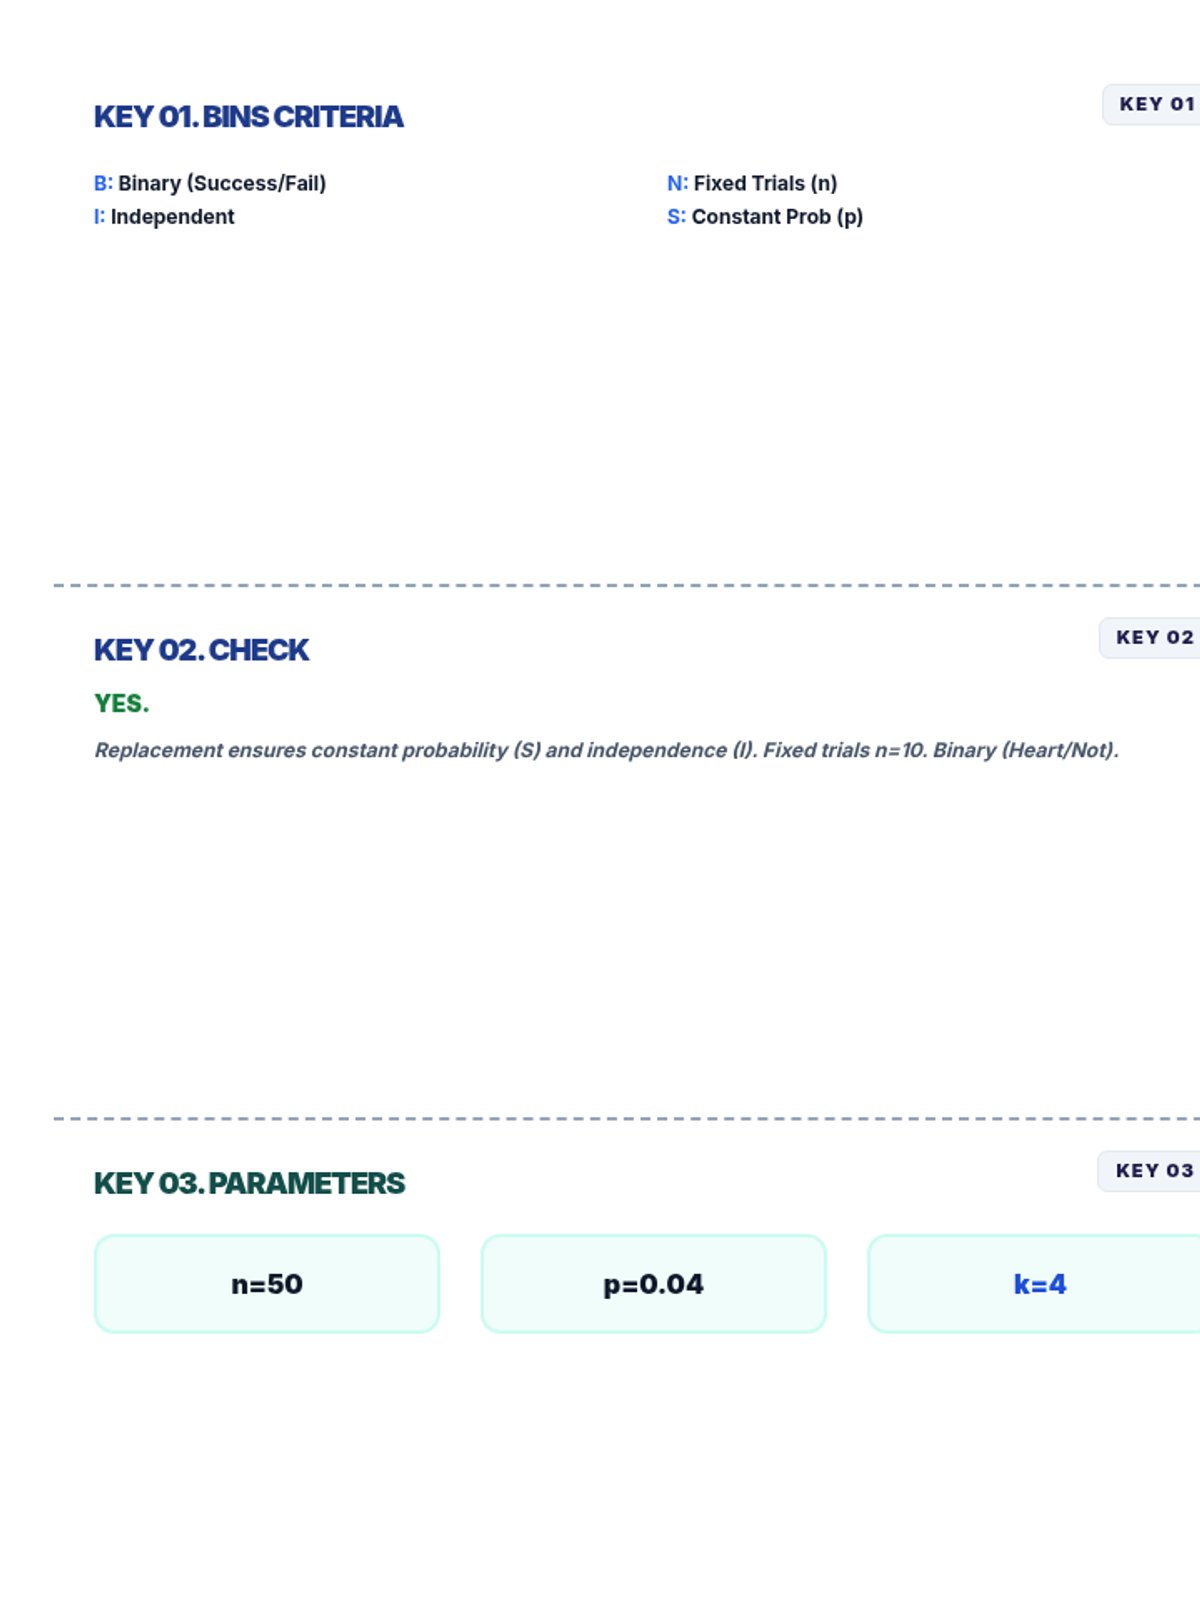
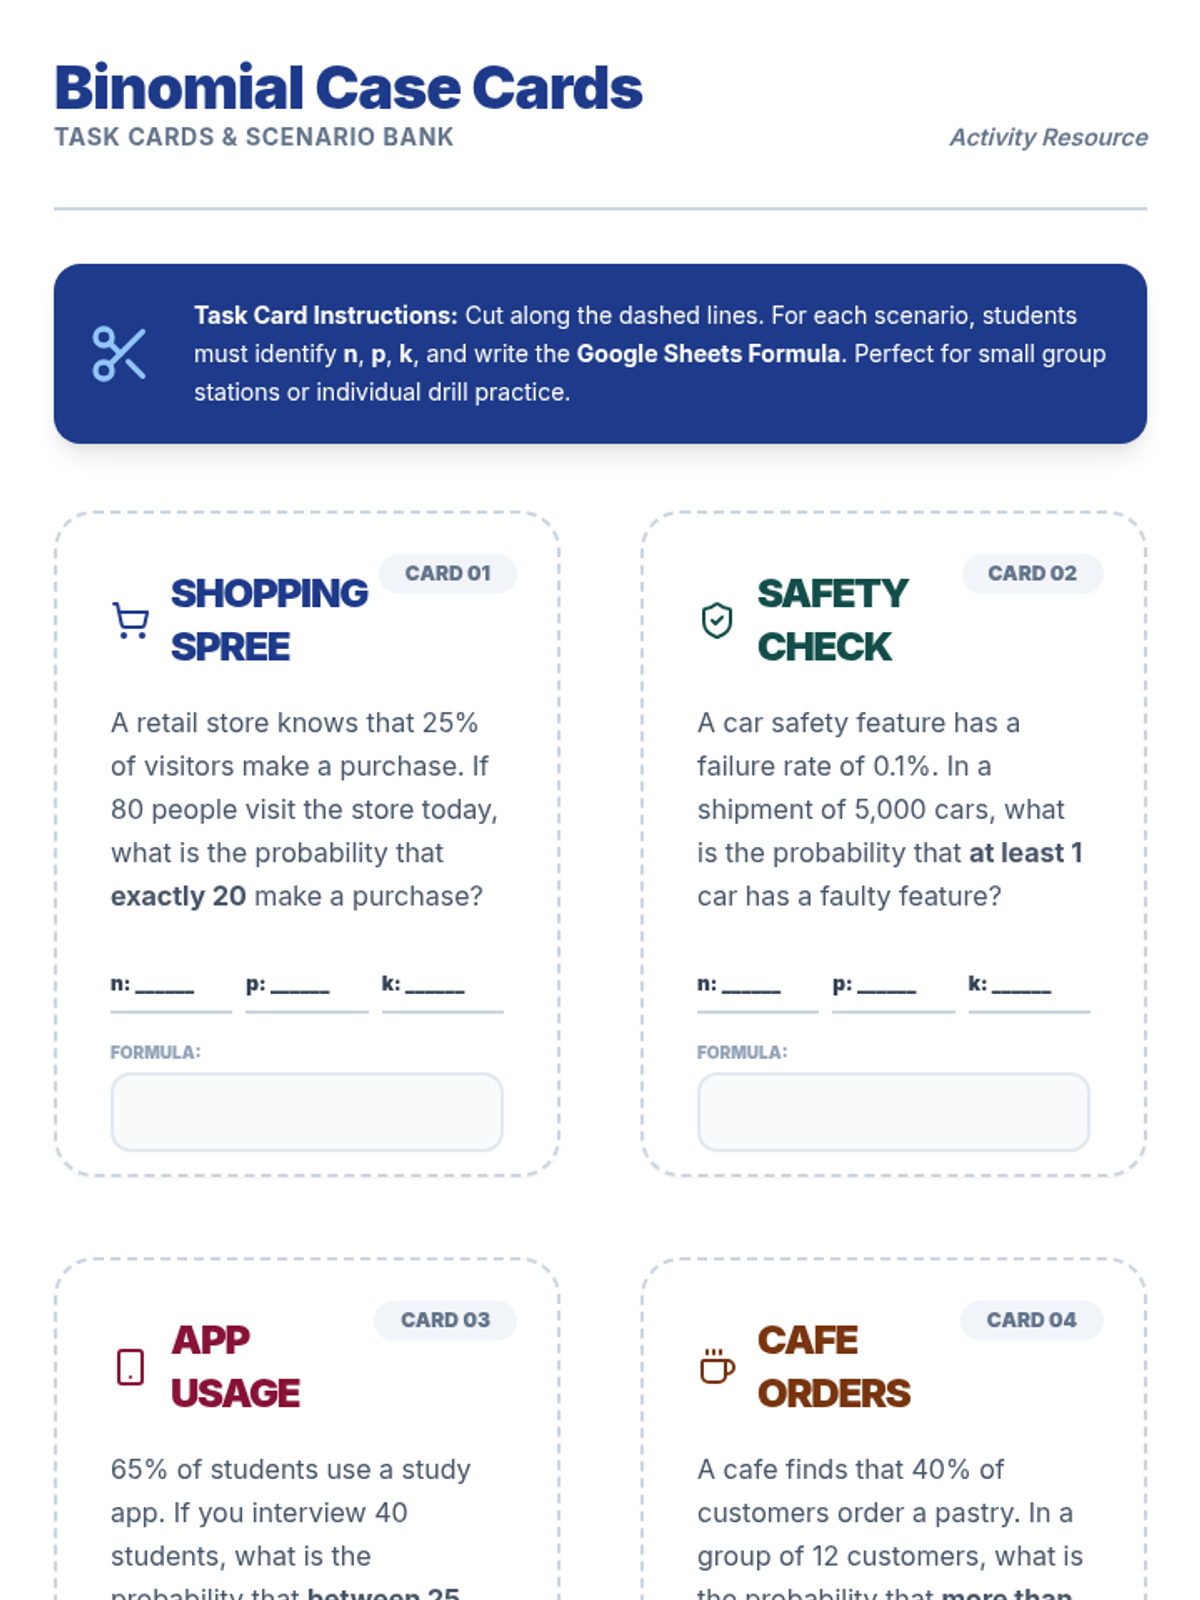
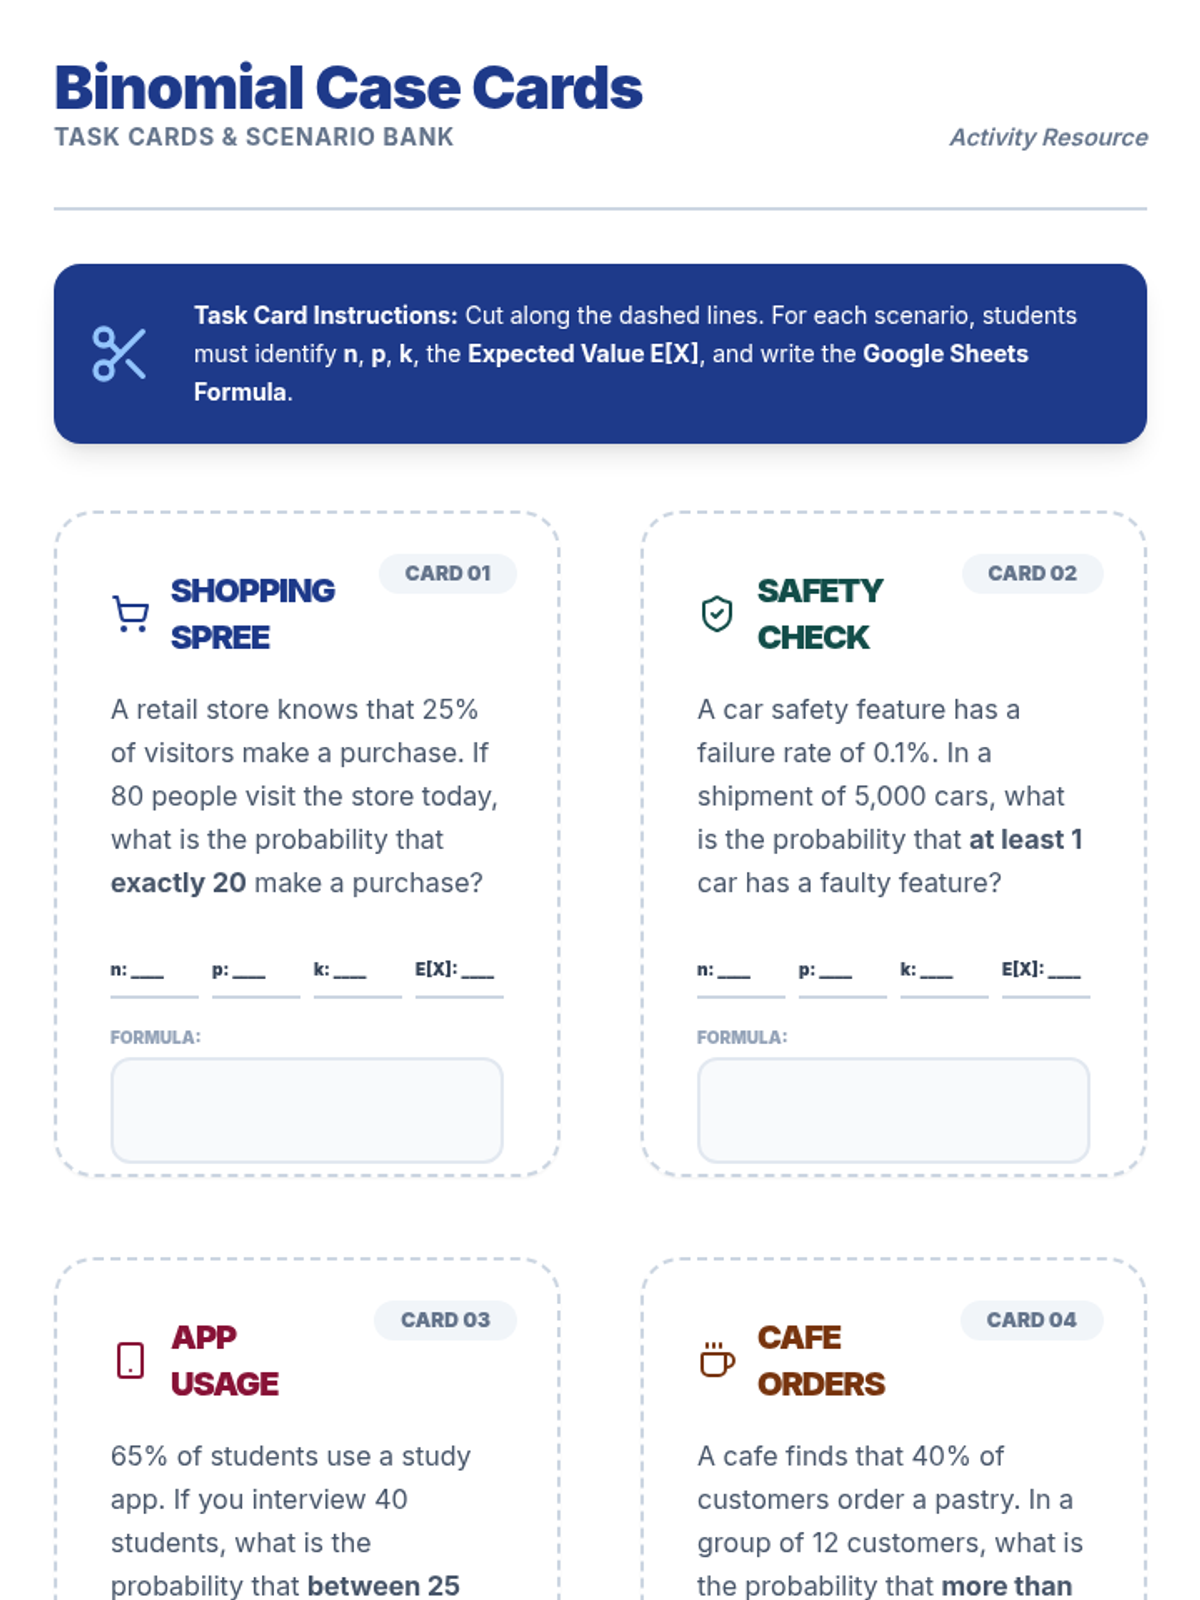
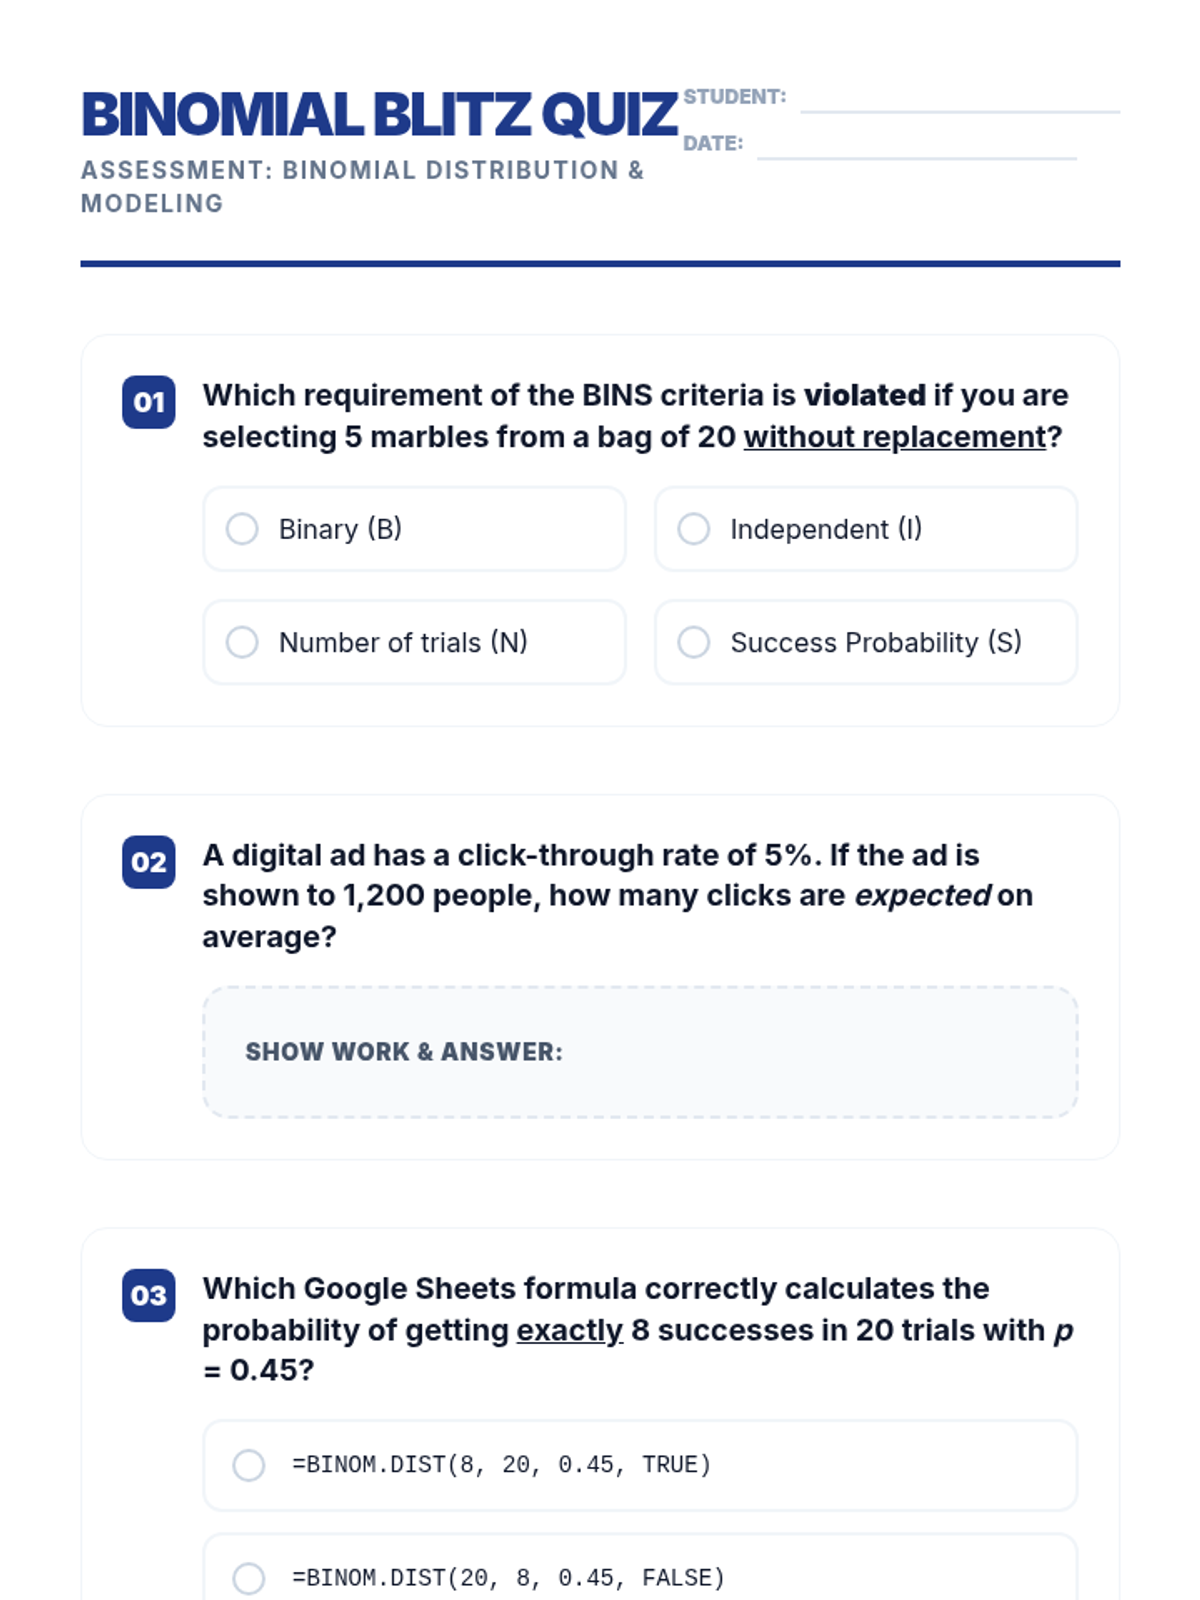
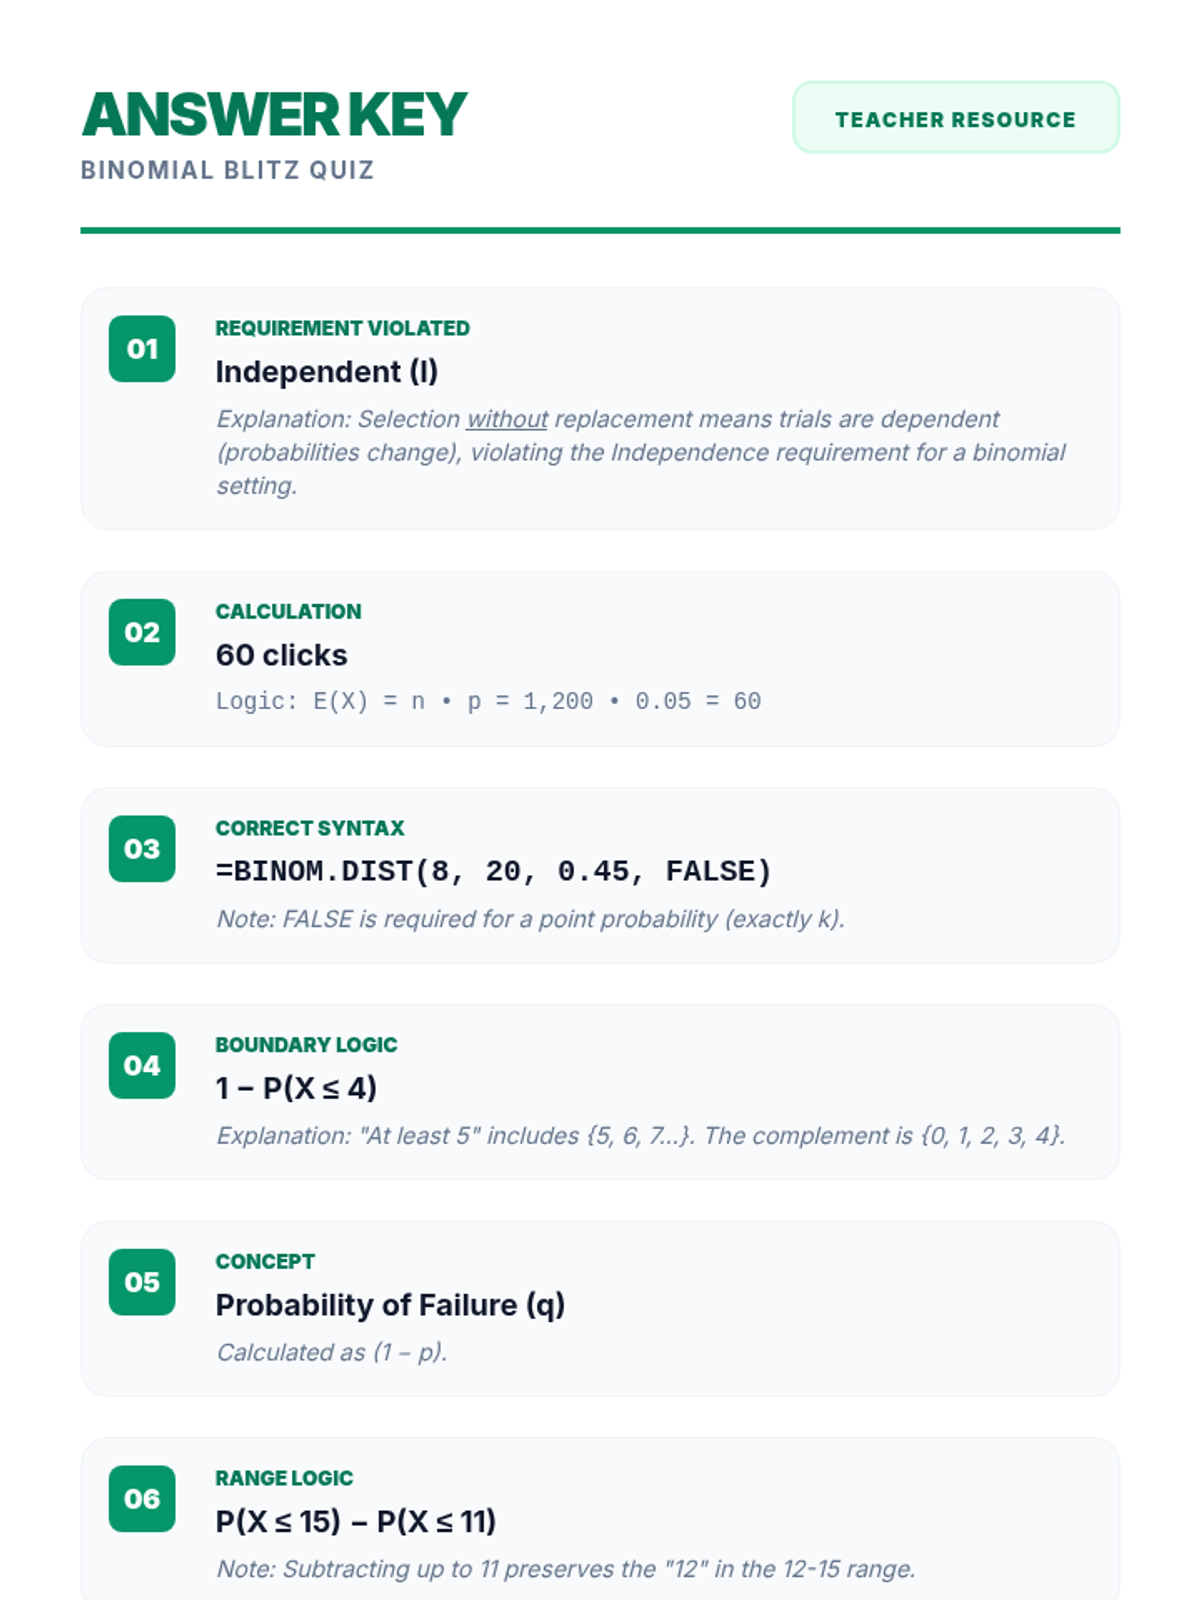
A focused lesson on the binomial distribution, covering the BINS criteria, identifying parameters, and calculating probabilities using digital spreadsheet tools.
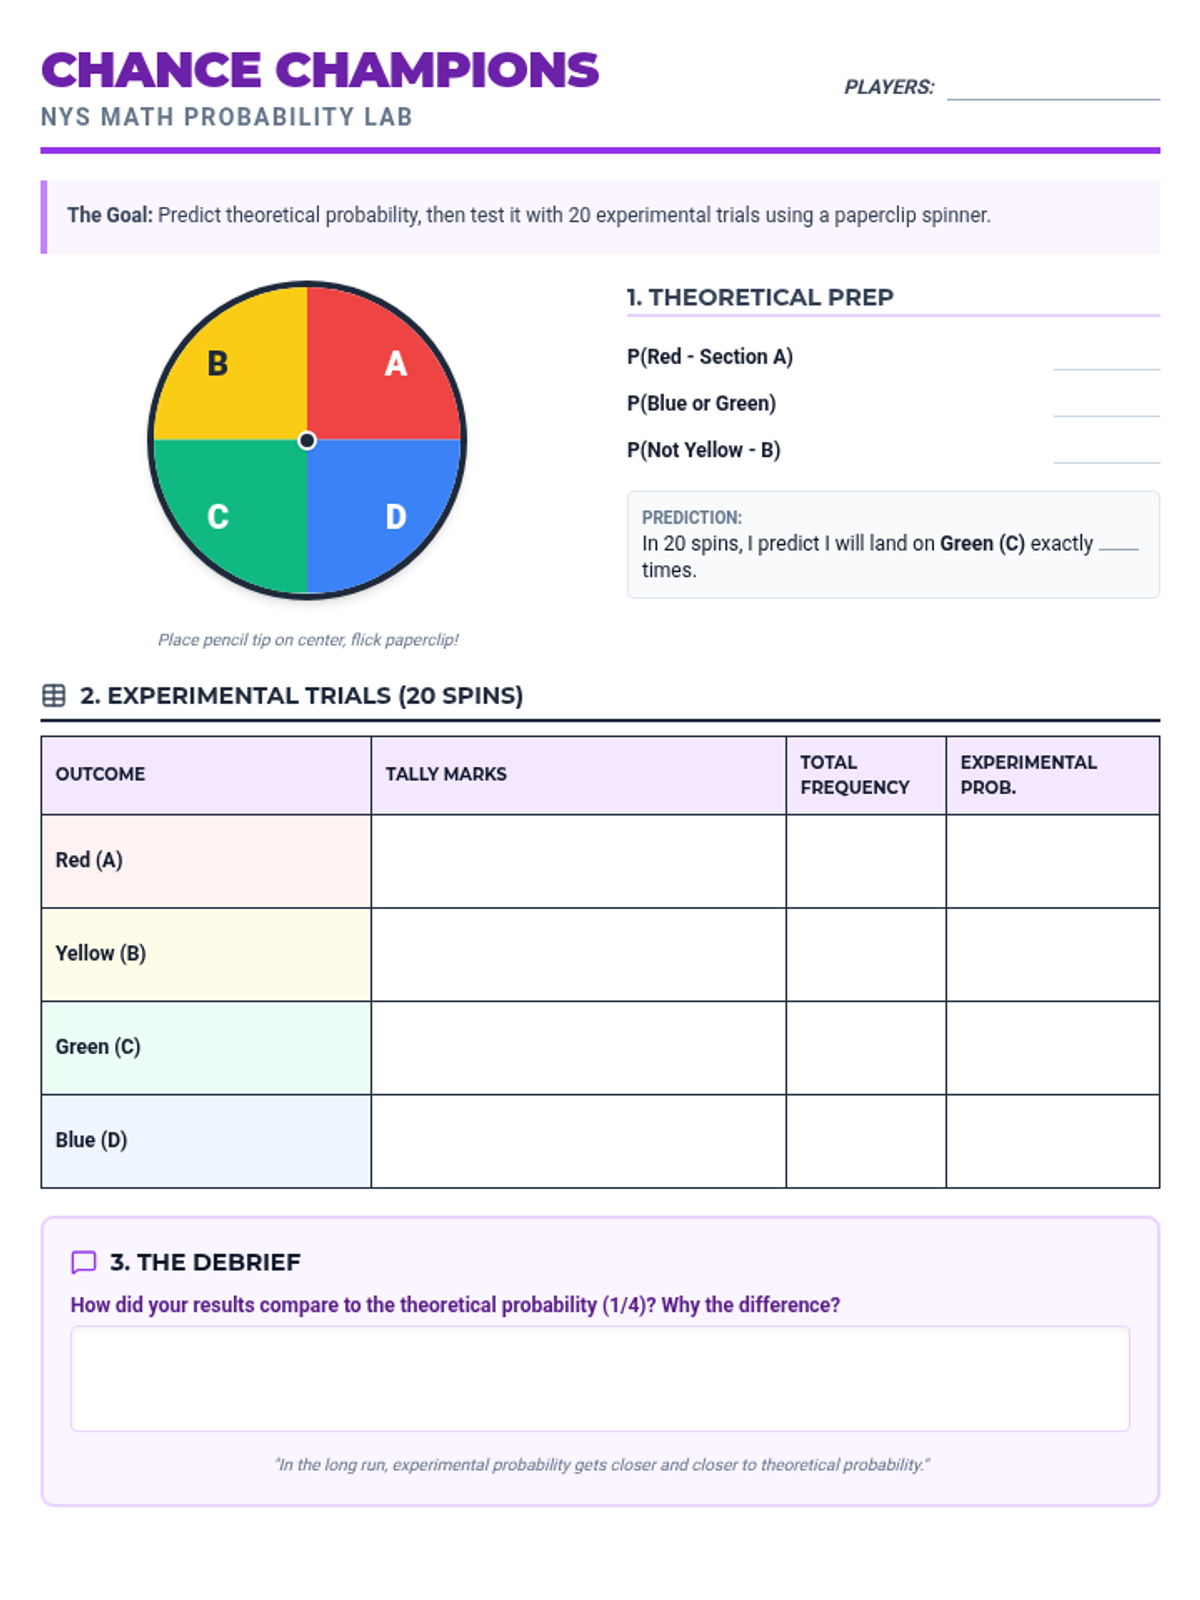
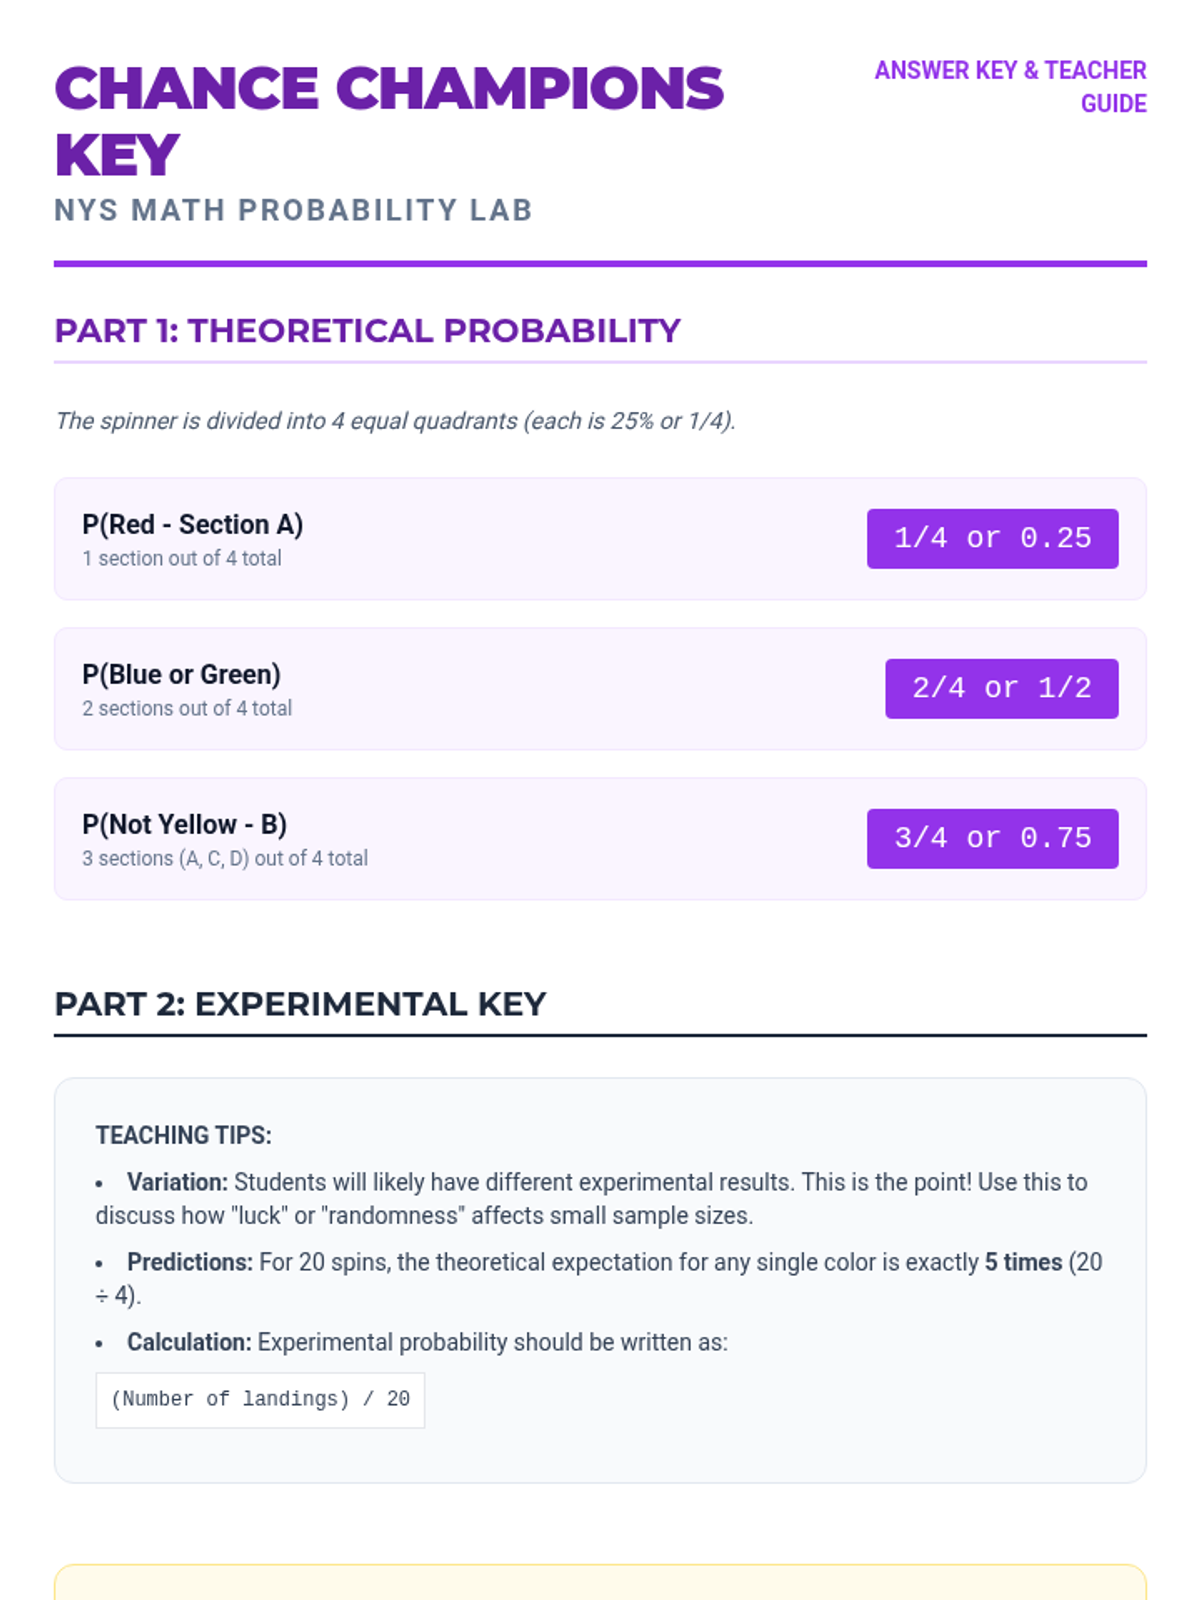
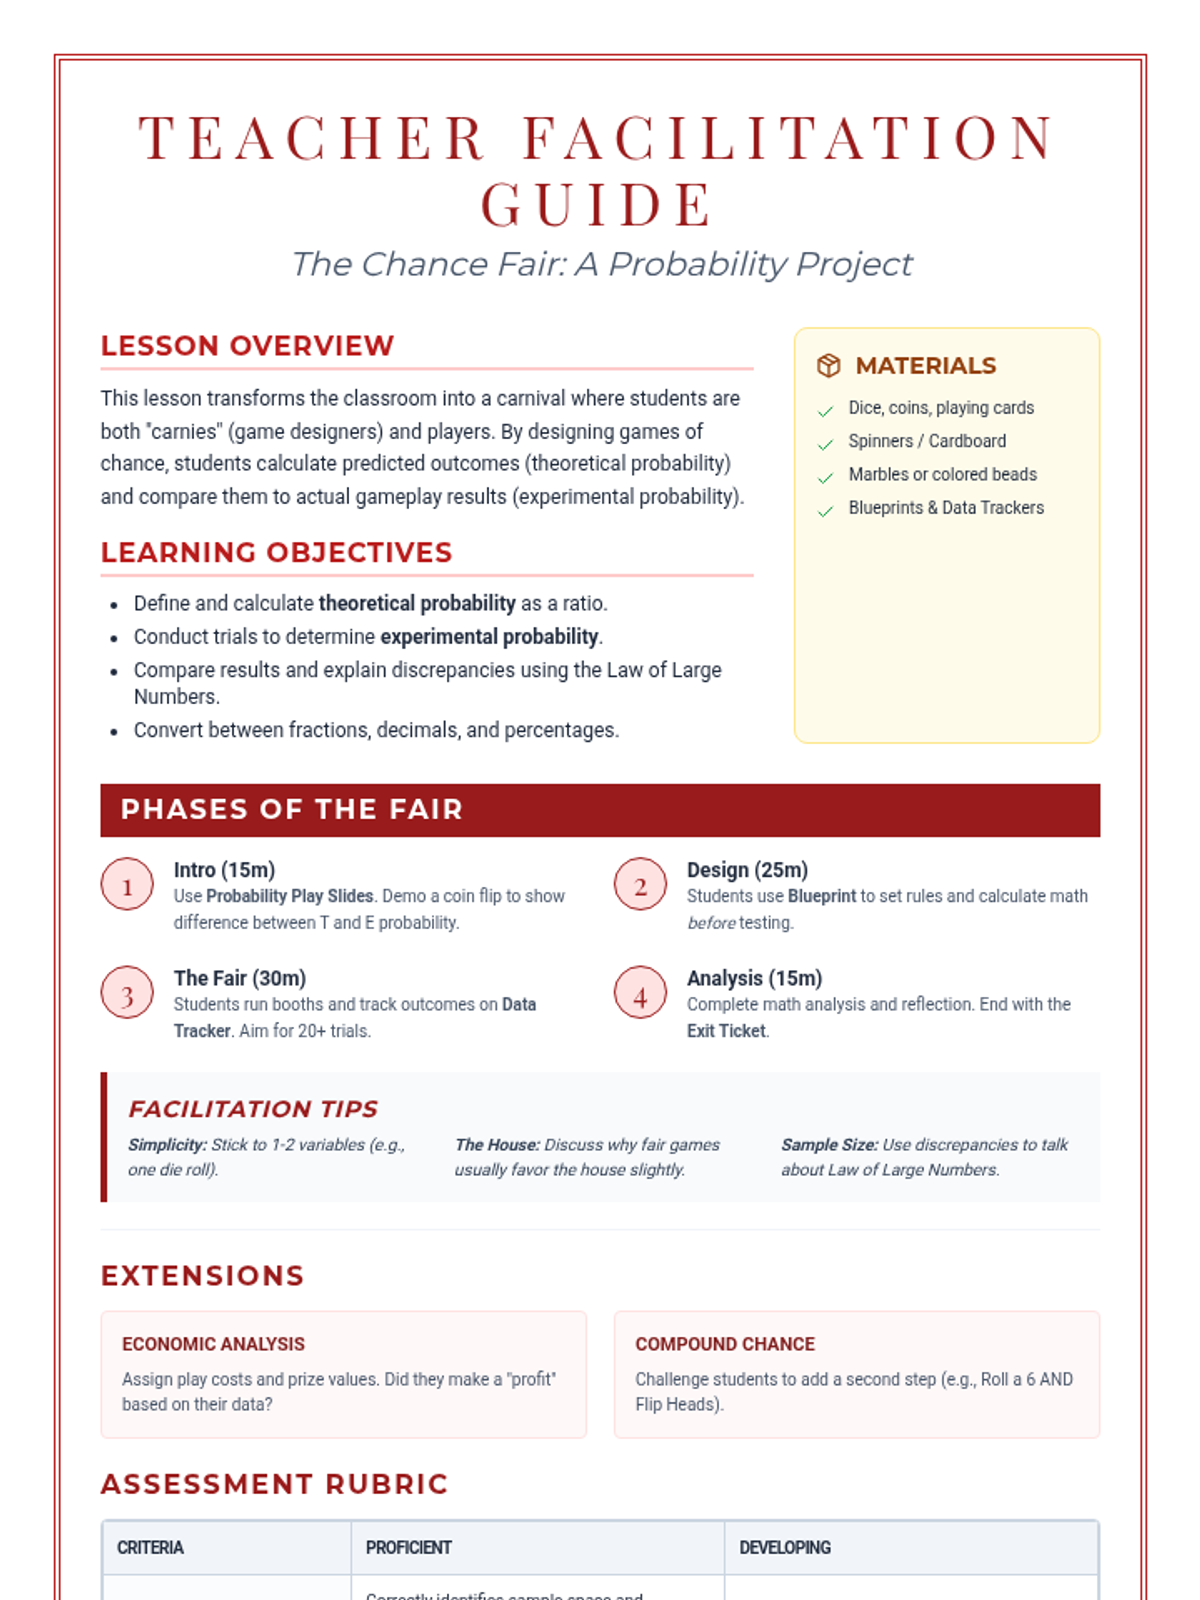
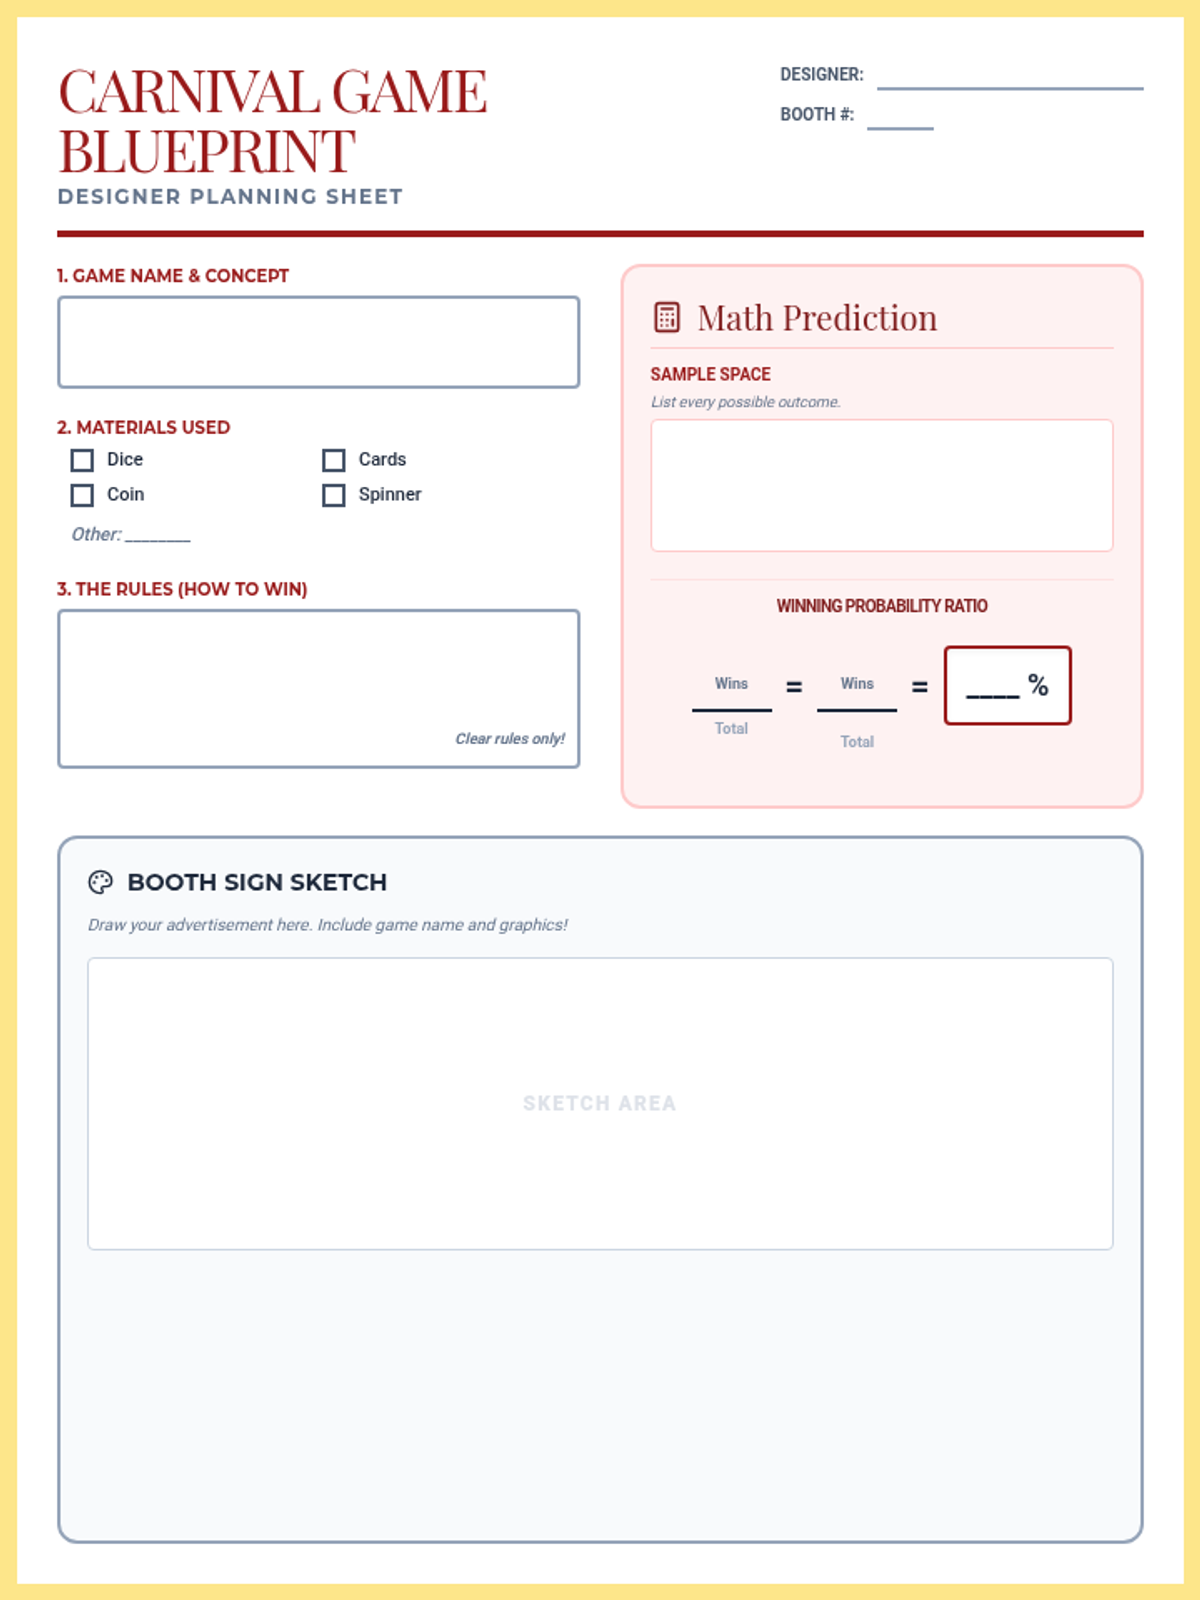
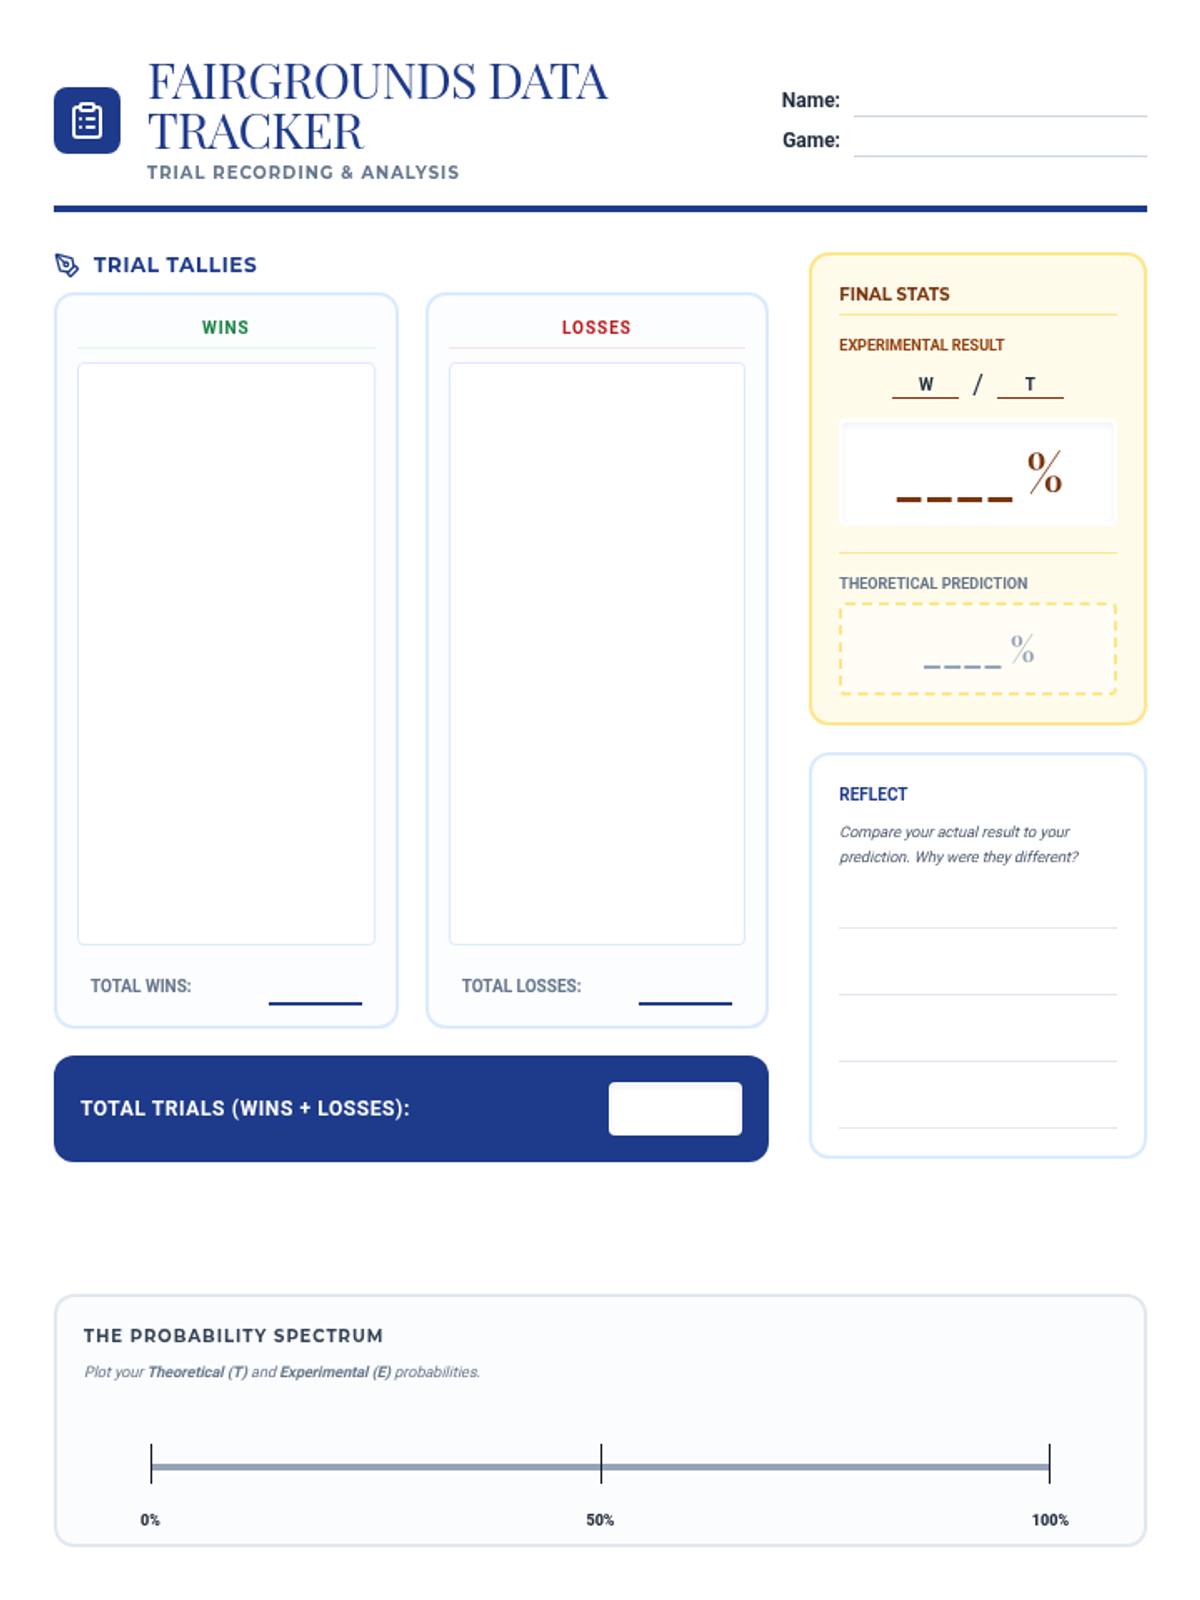
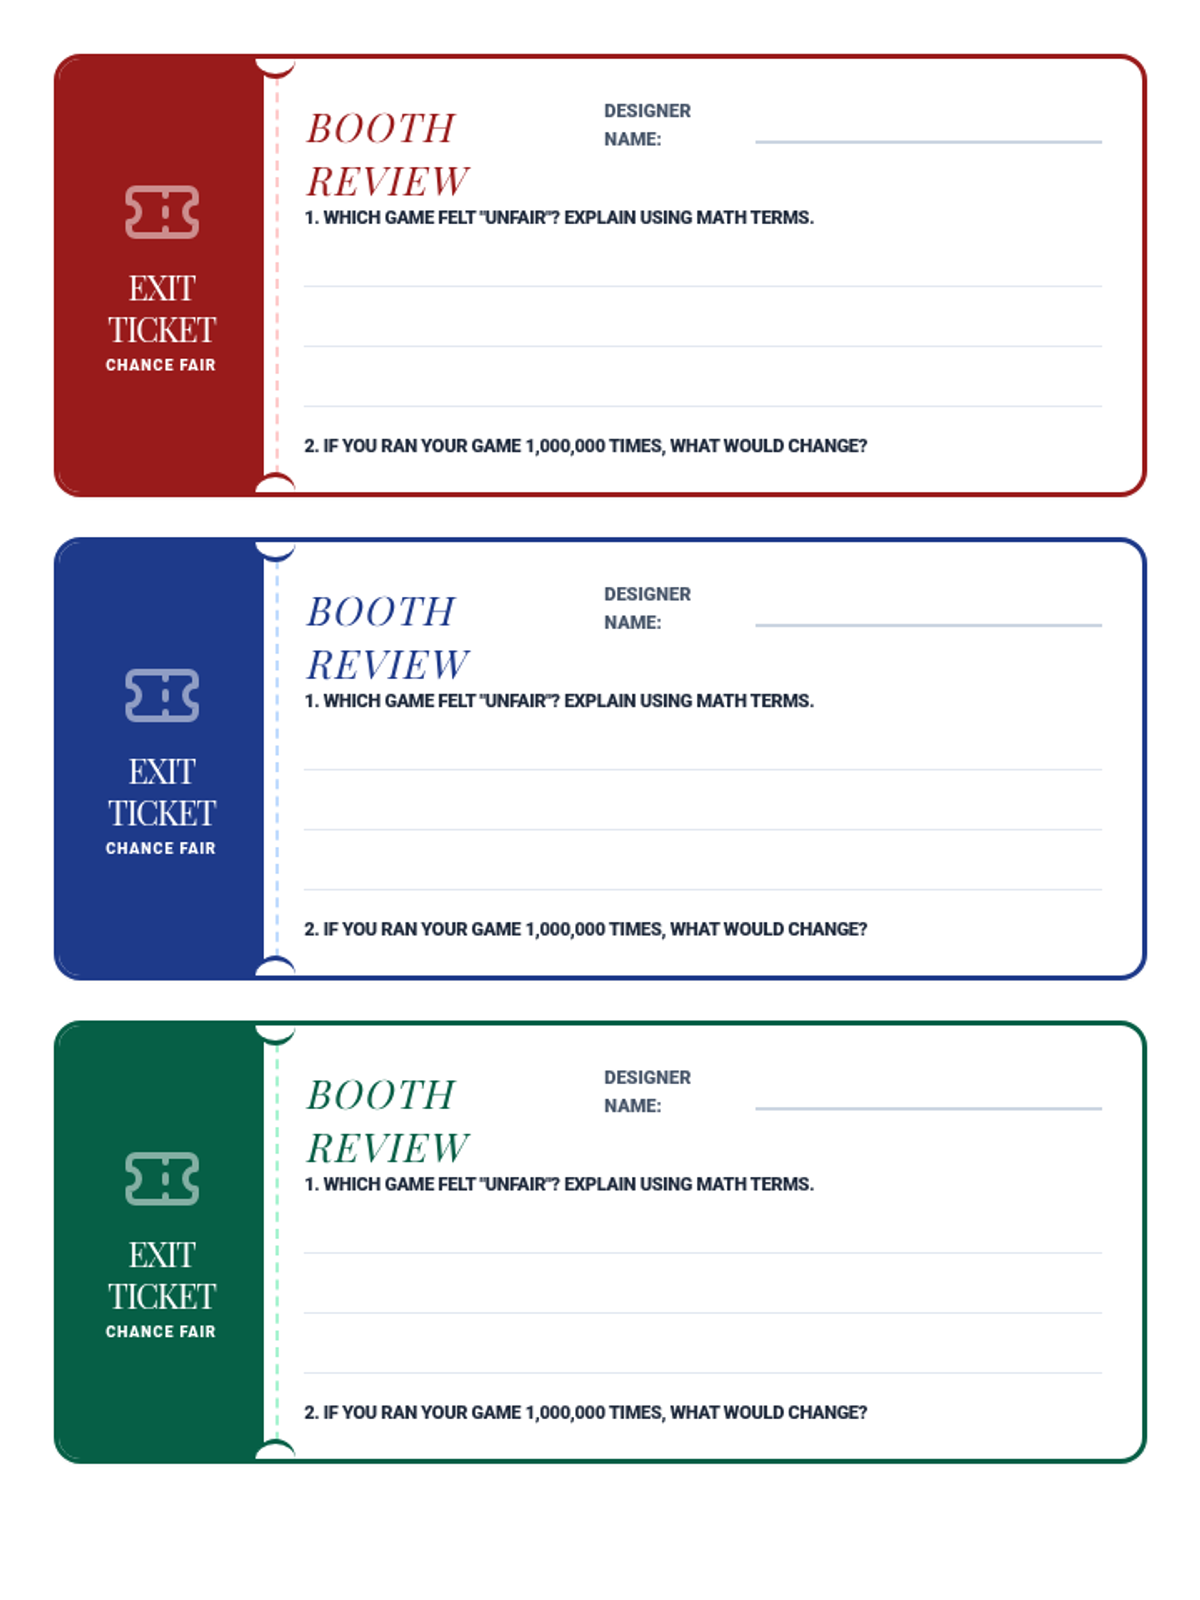
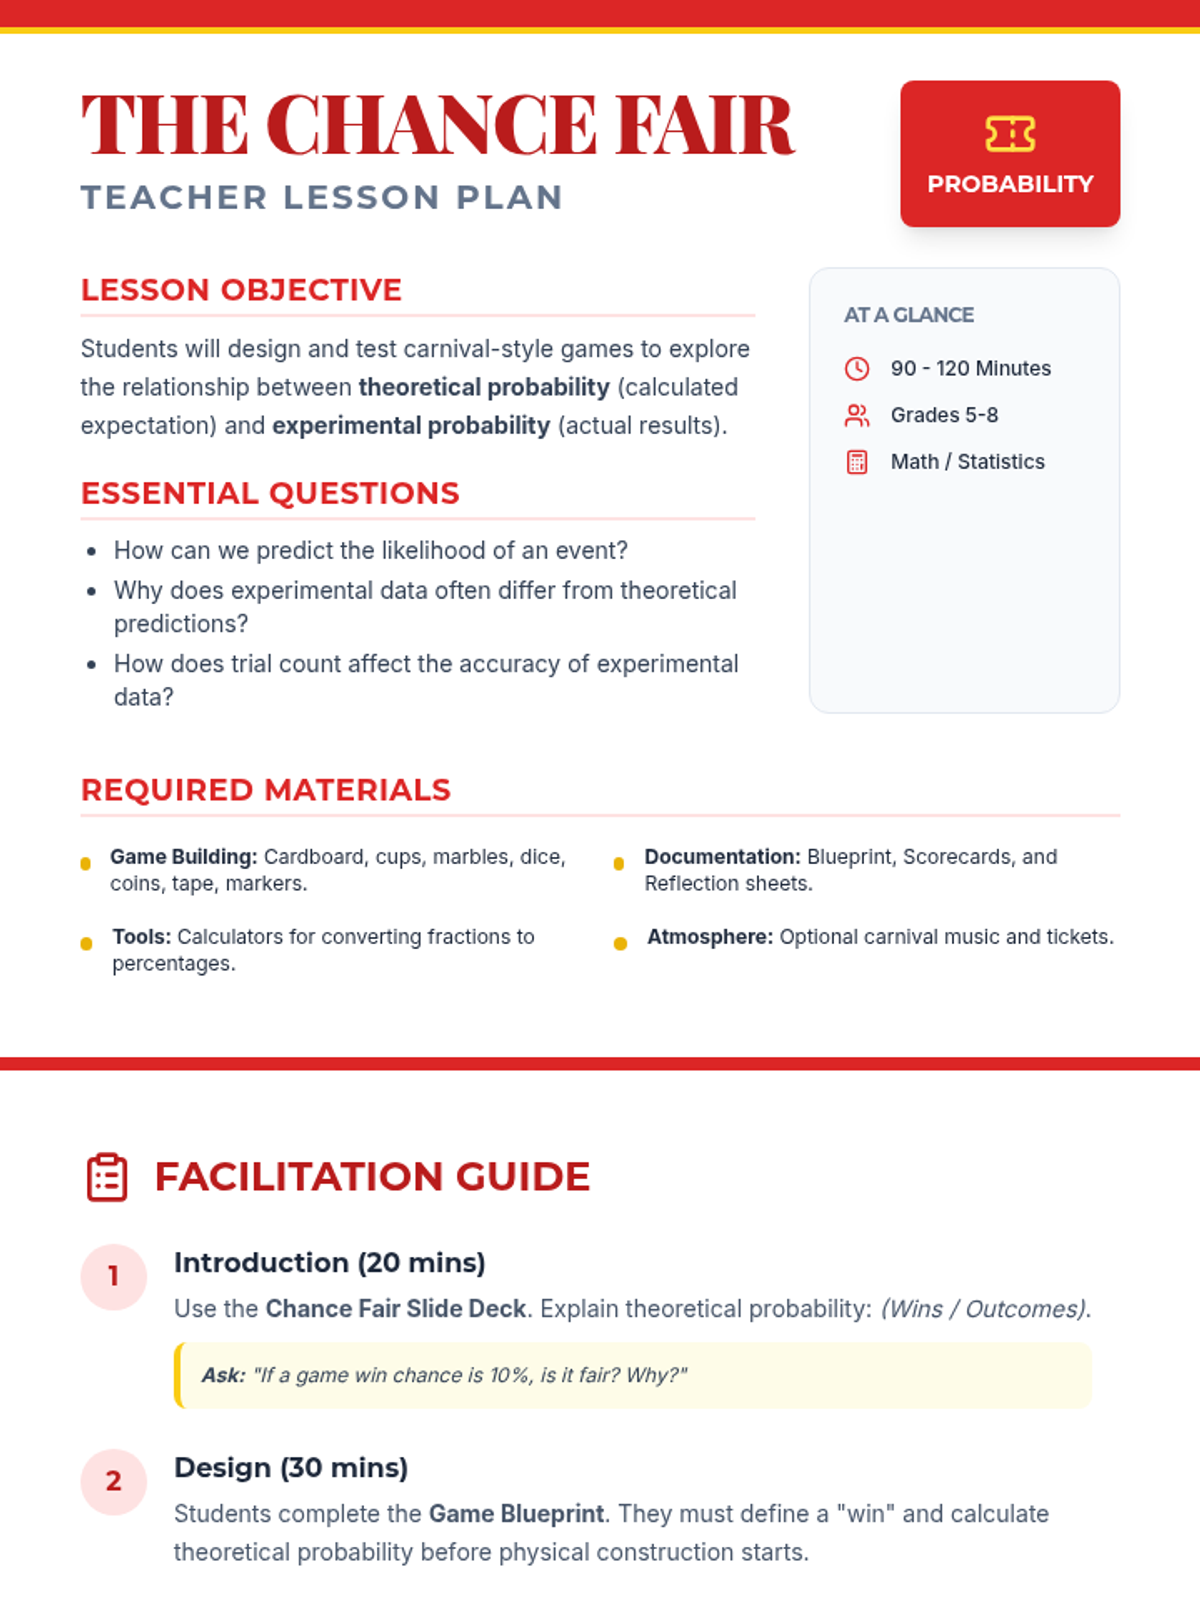
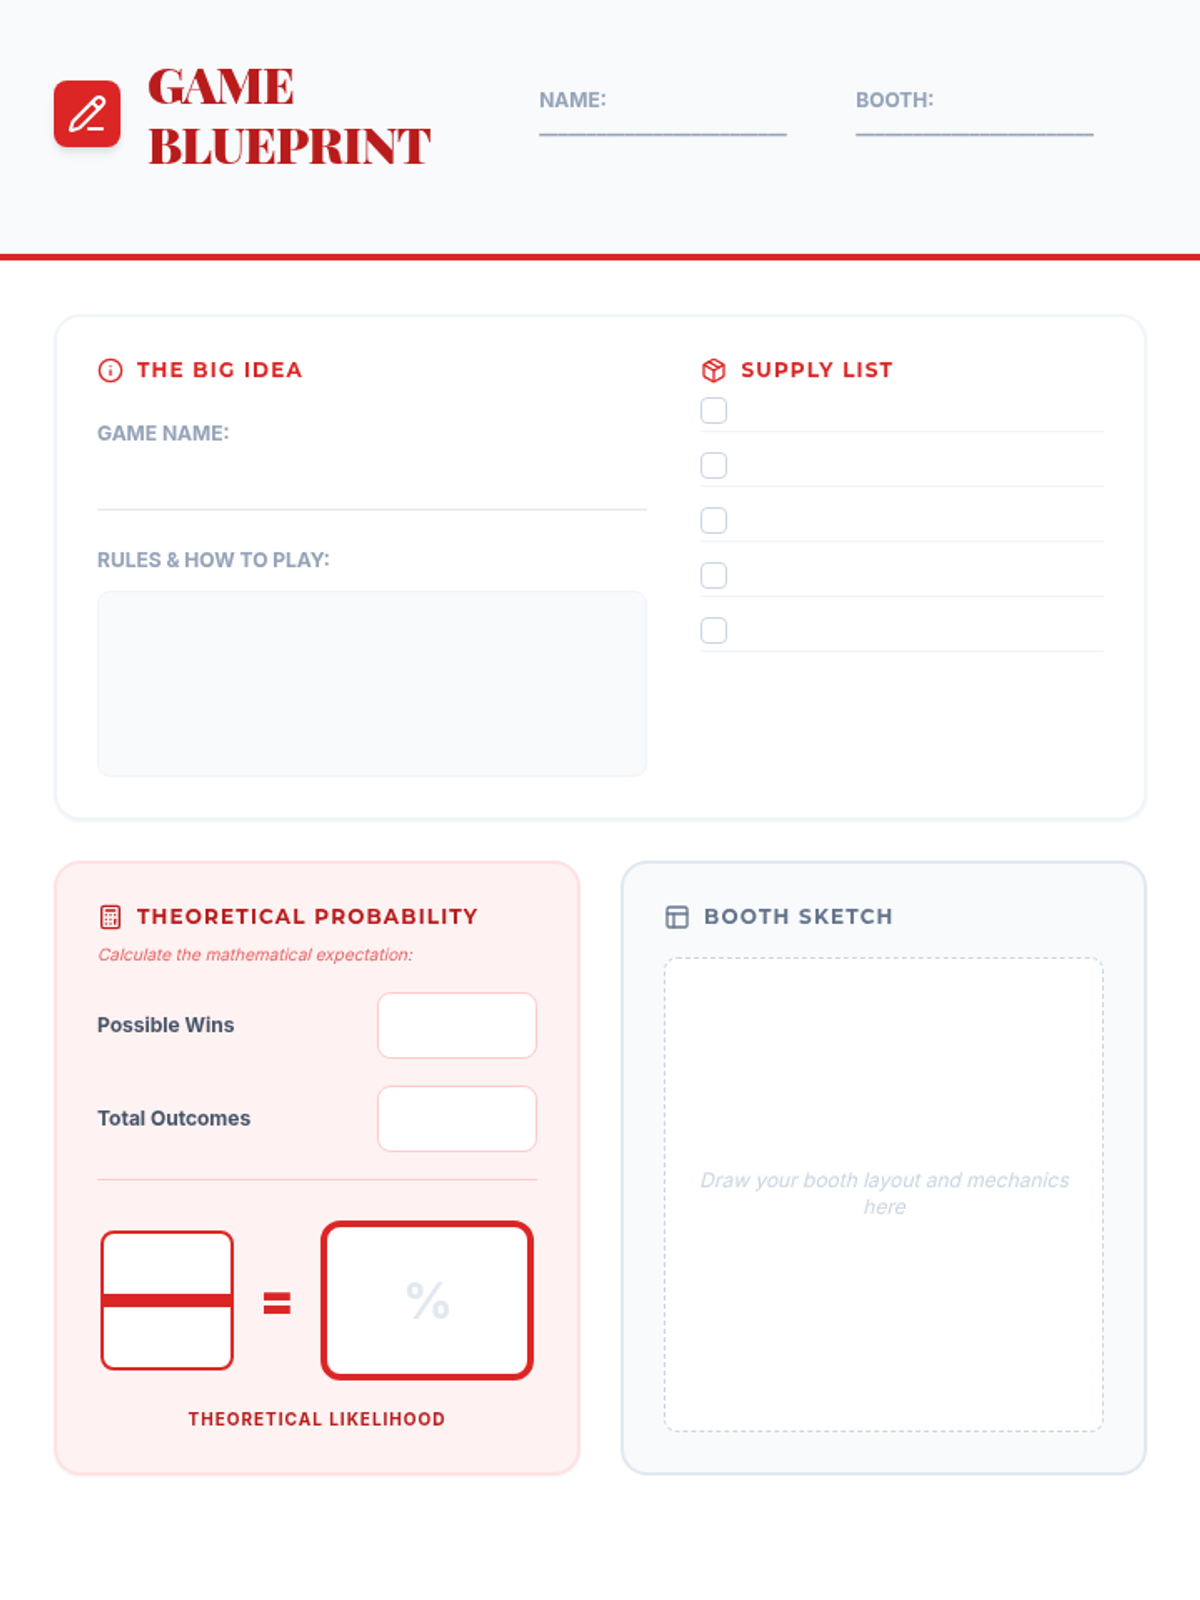
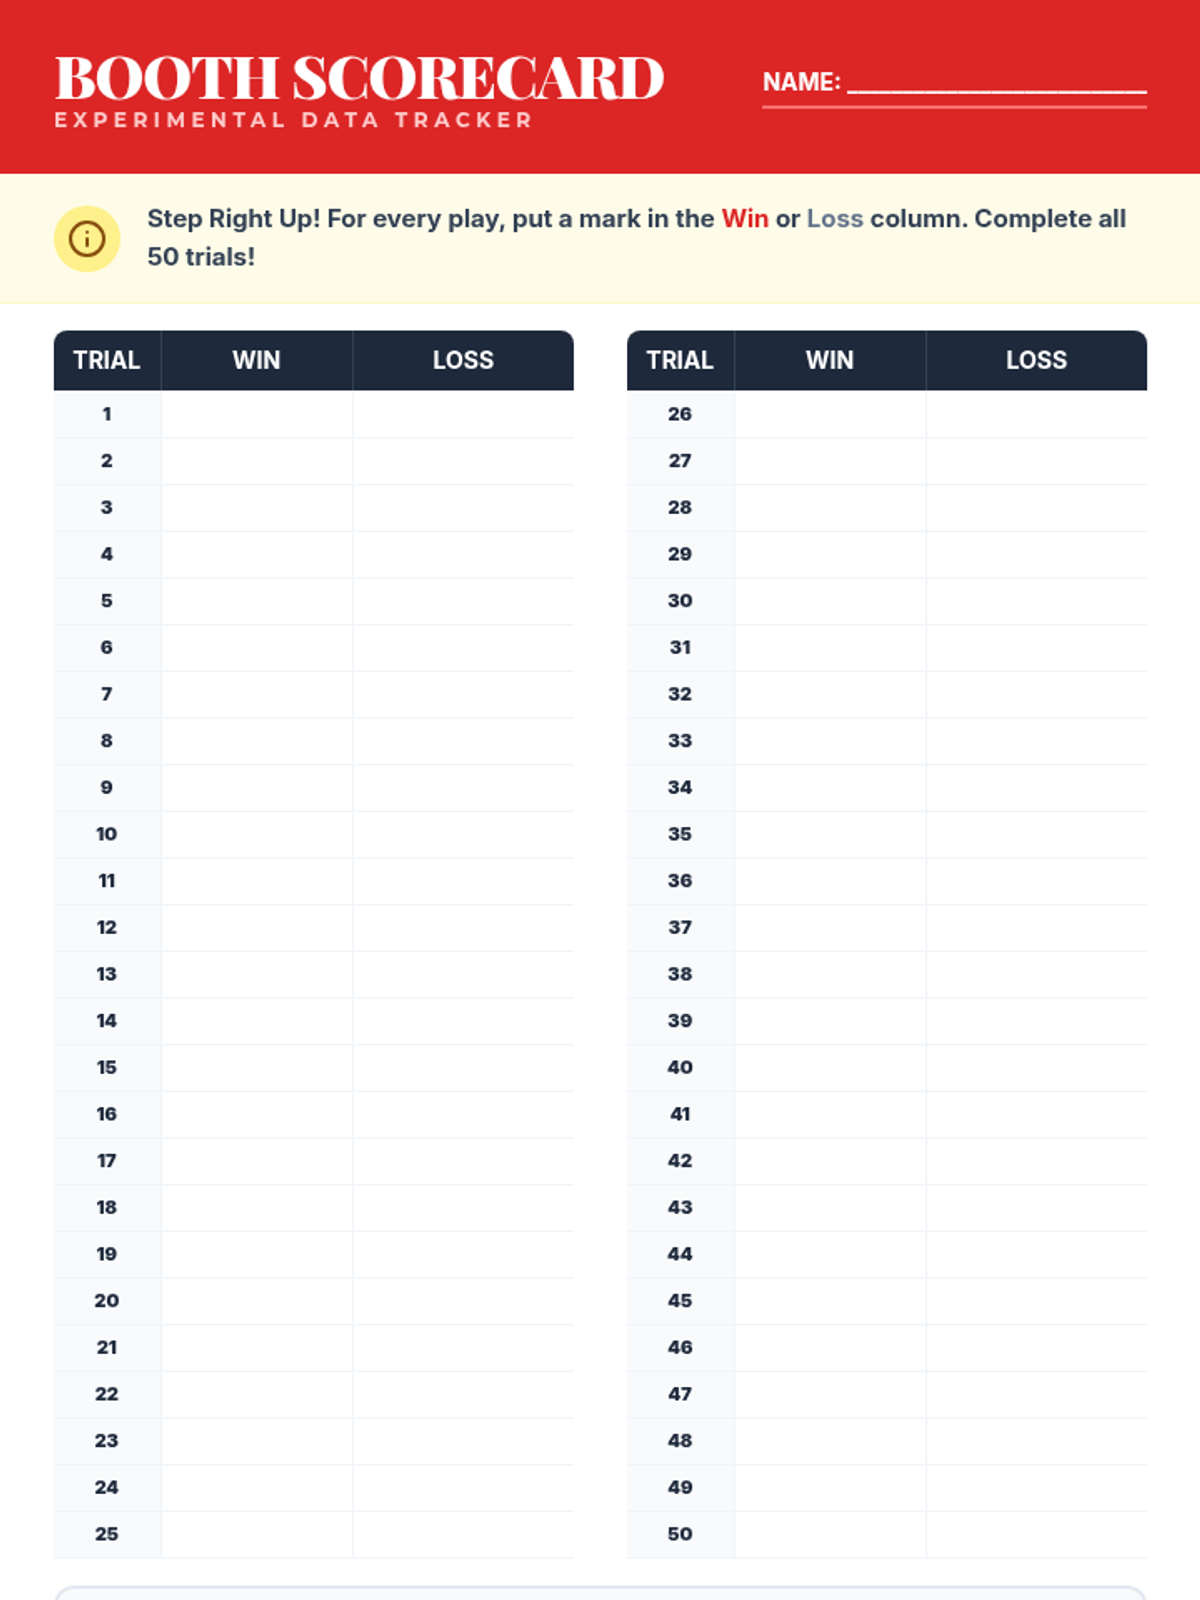
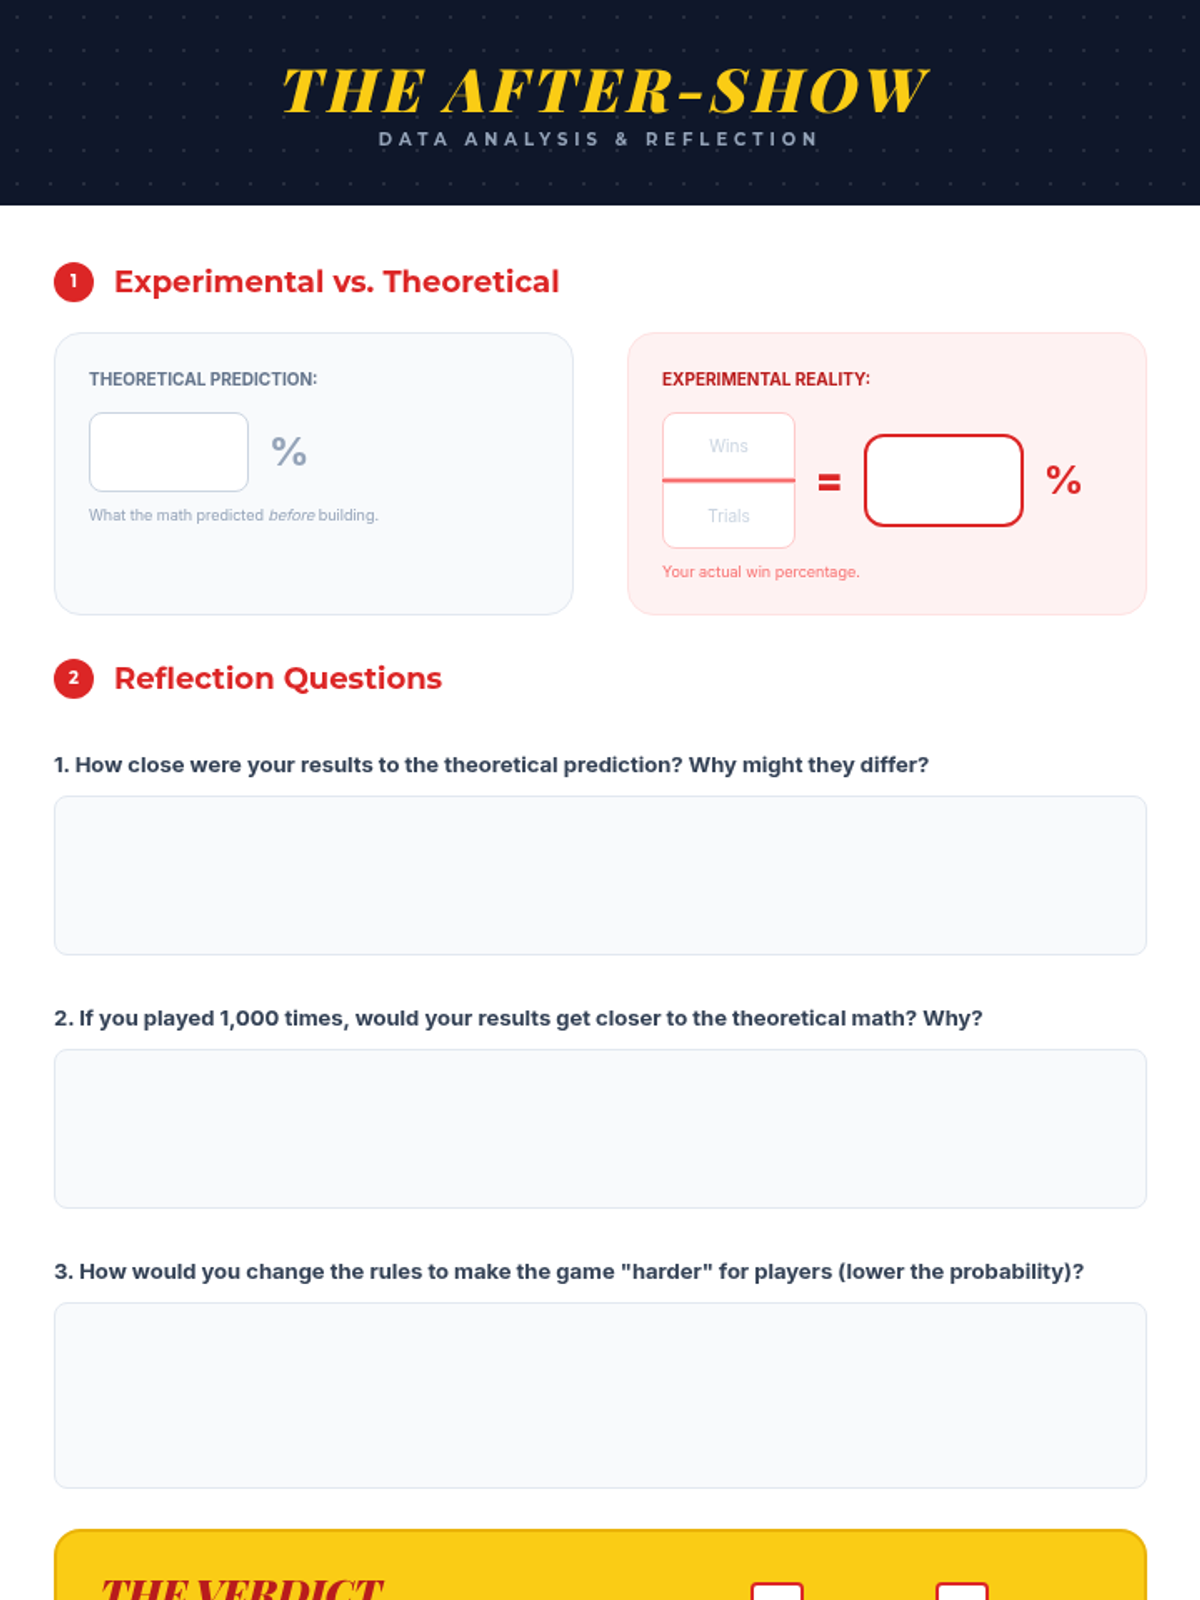
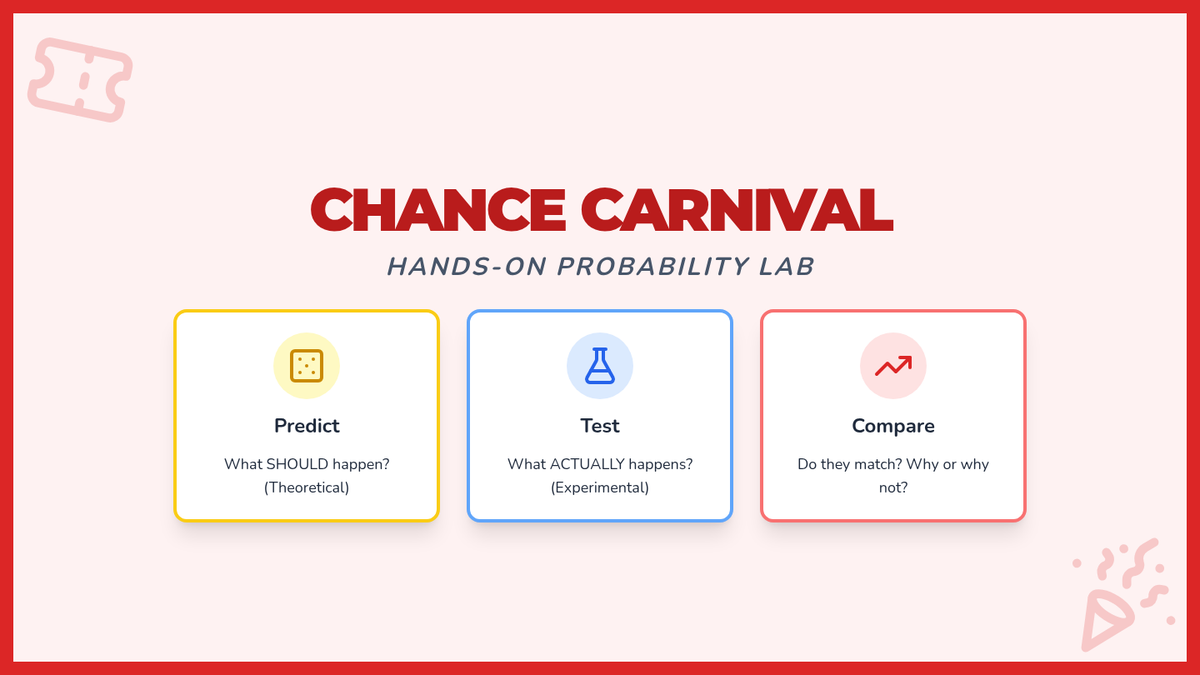
A hands-on math project where students design carnival games to explore theoretical versus experimental probability through data collection and analysis.
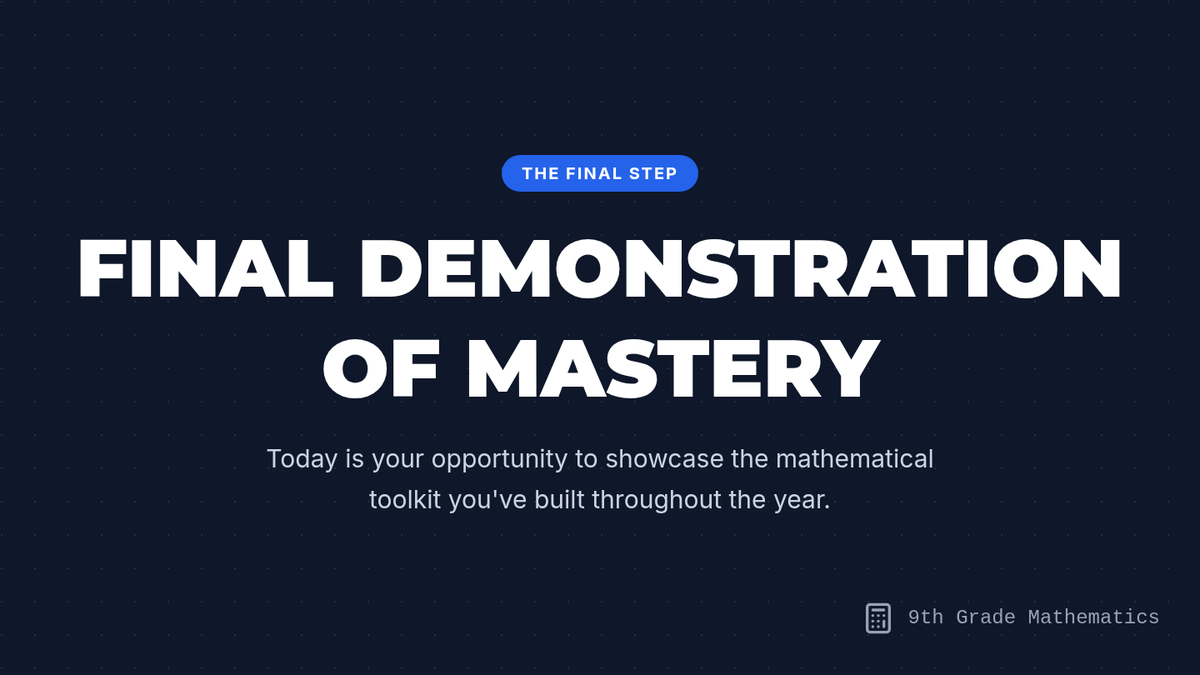
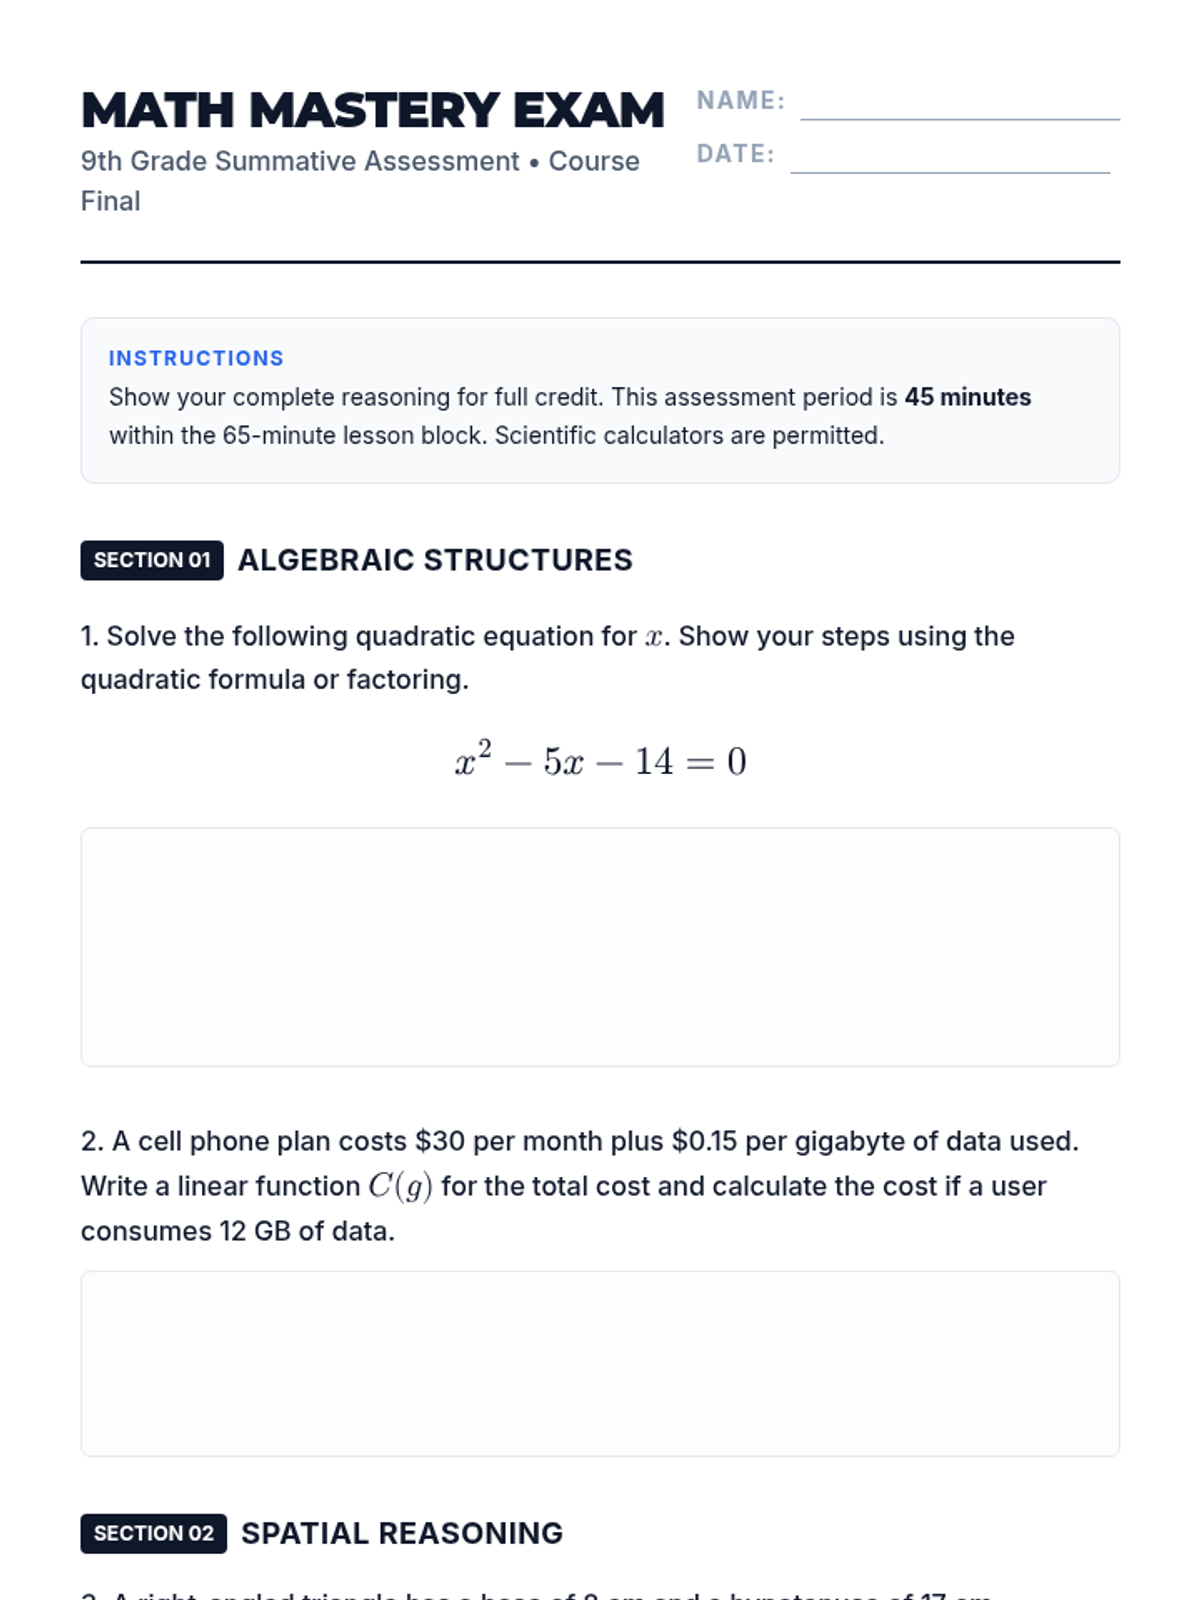
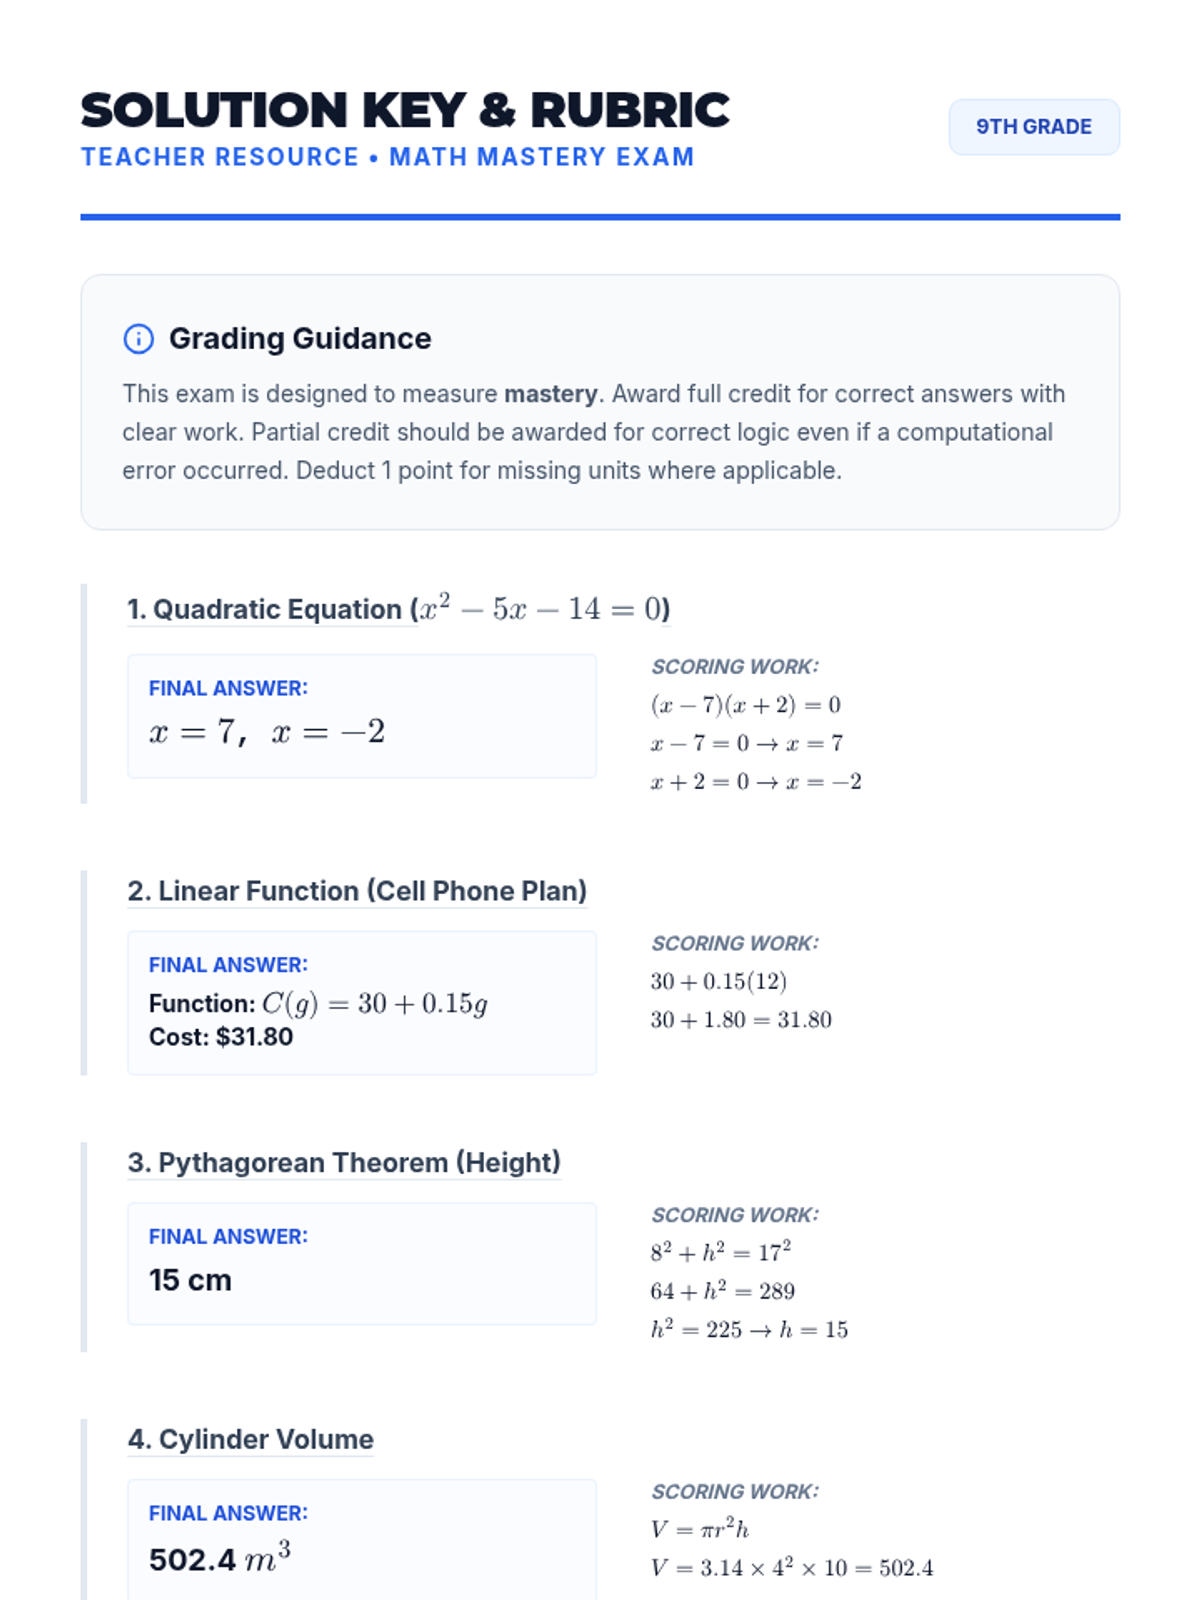
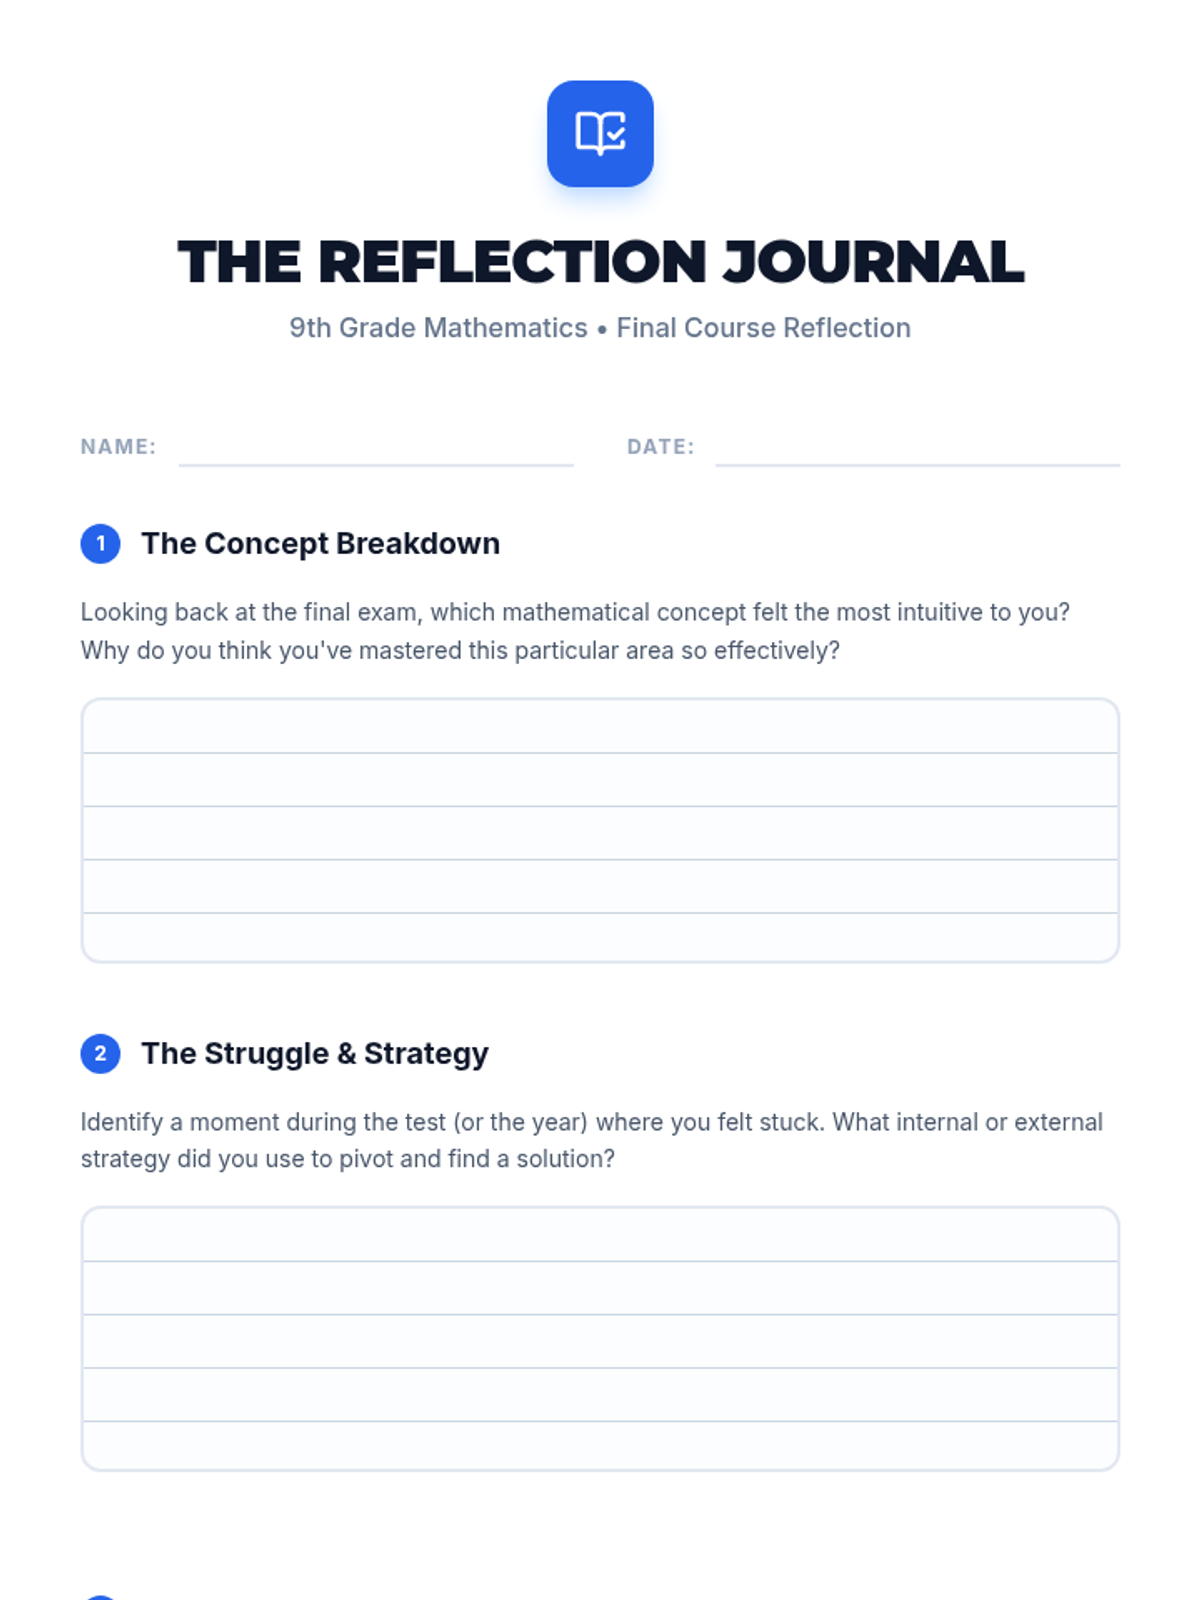
A comprehensive summative assessment lesson where 9th-grade students demonstrate their mathematical proficiency across algebra, geometry, and statistics before reflecting on their year-long growth.
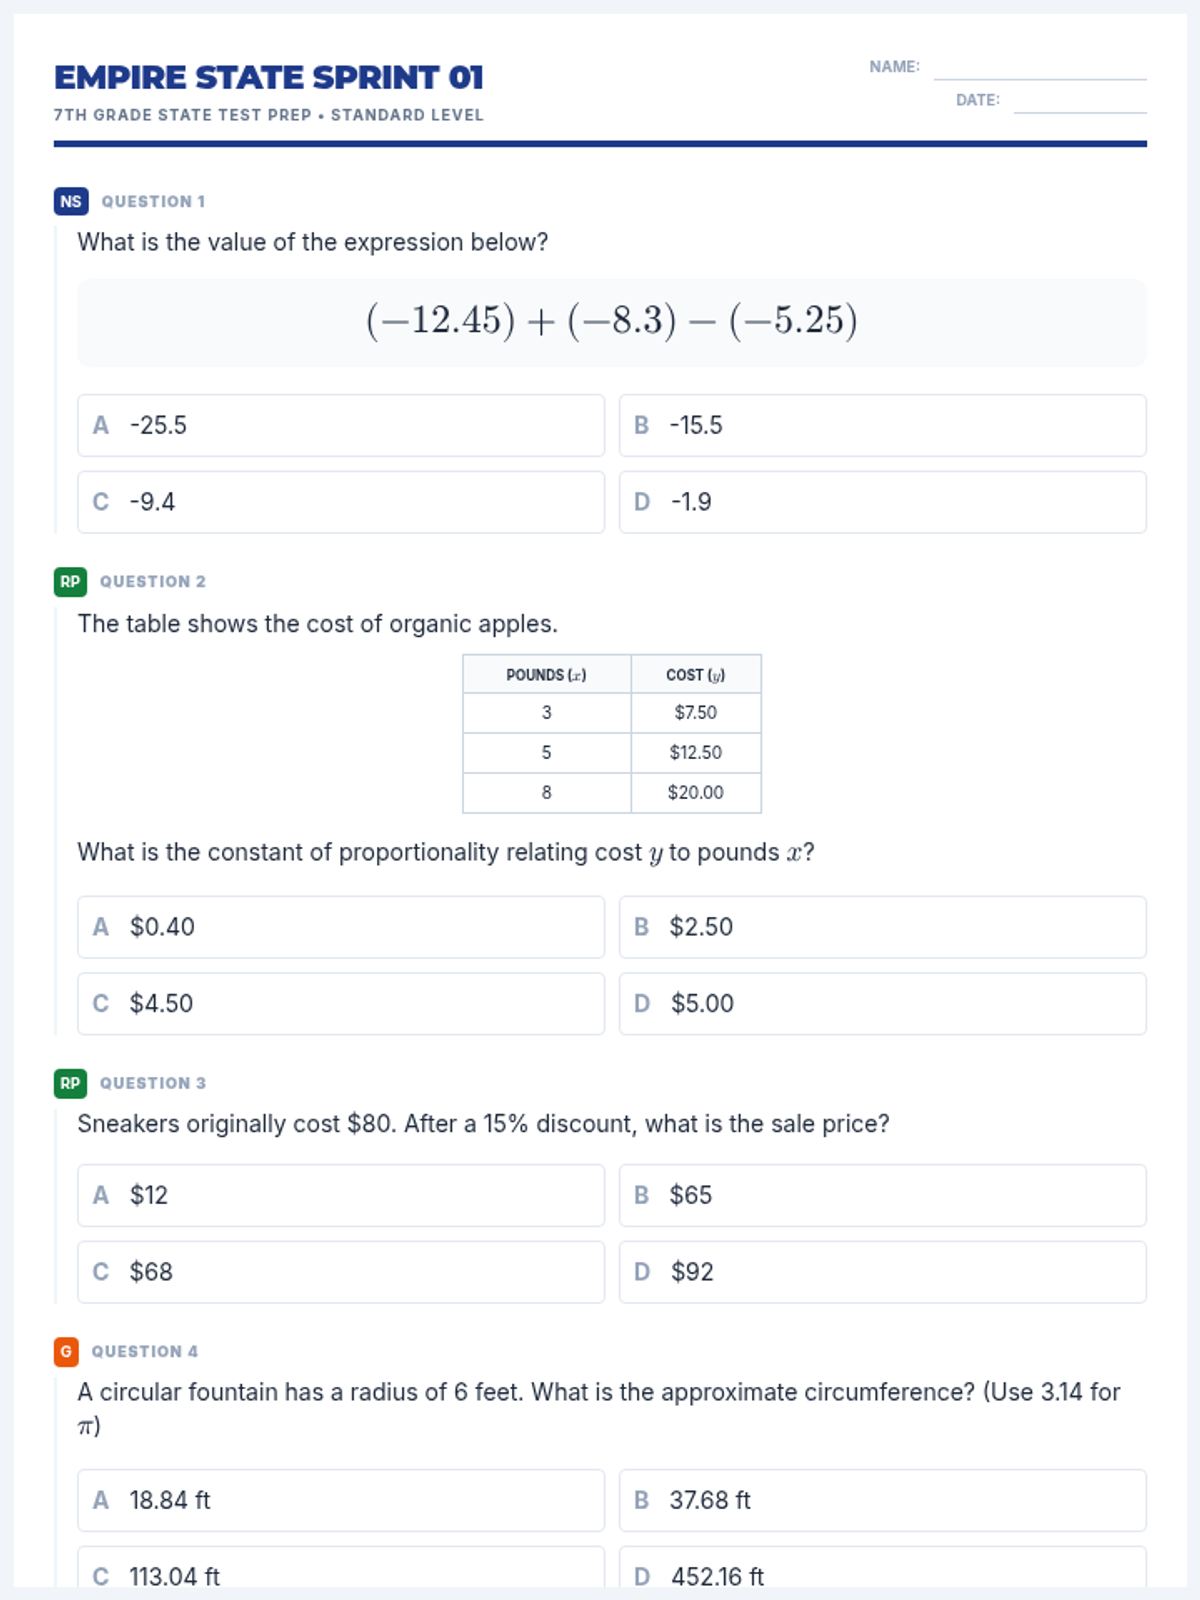
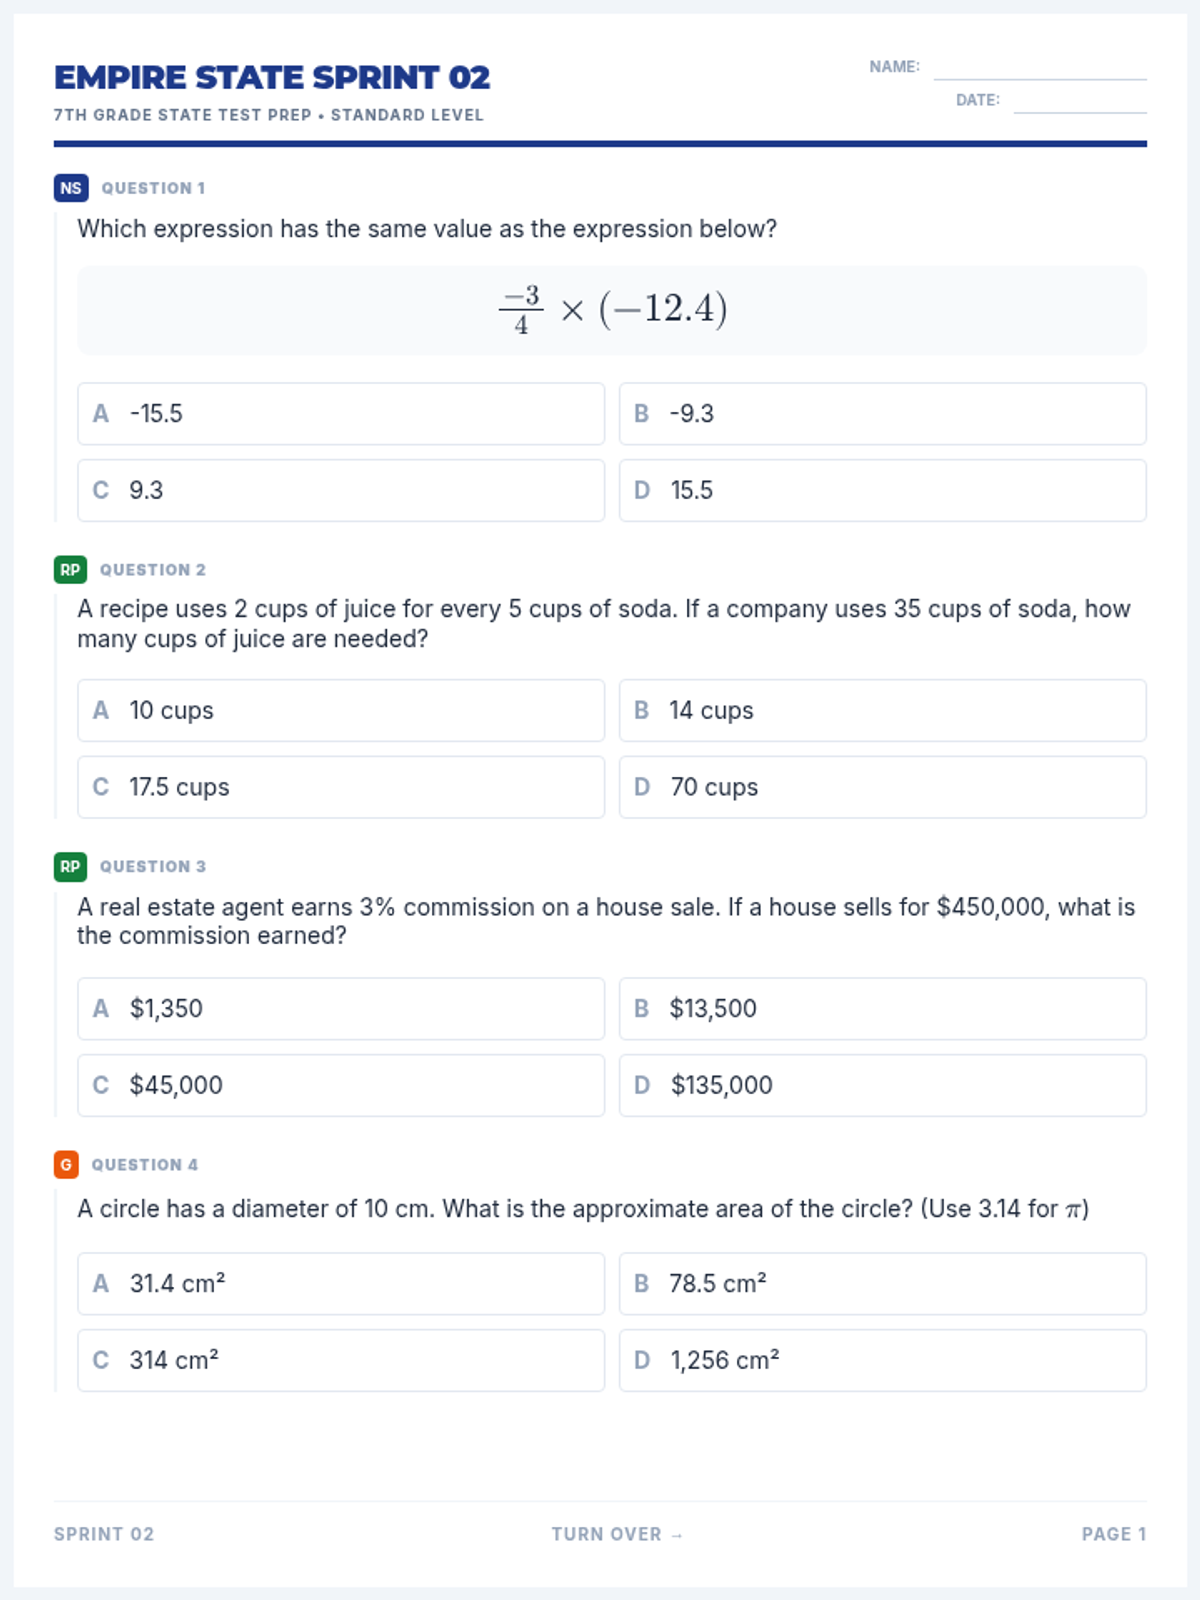
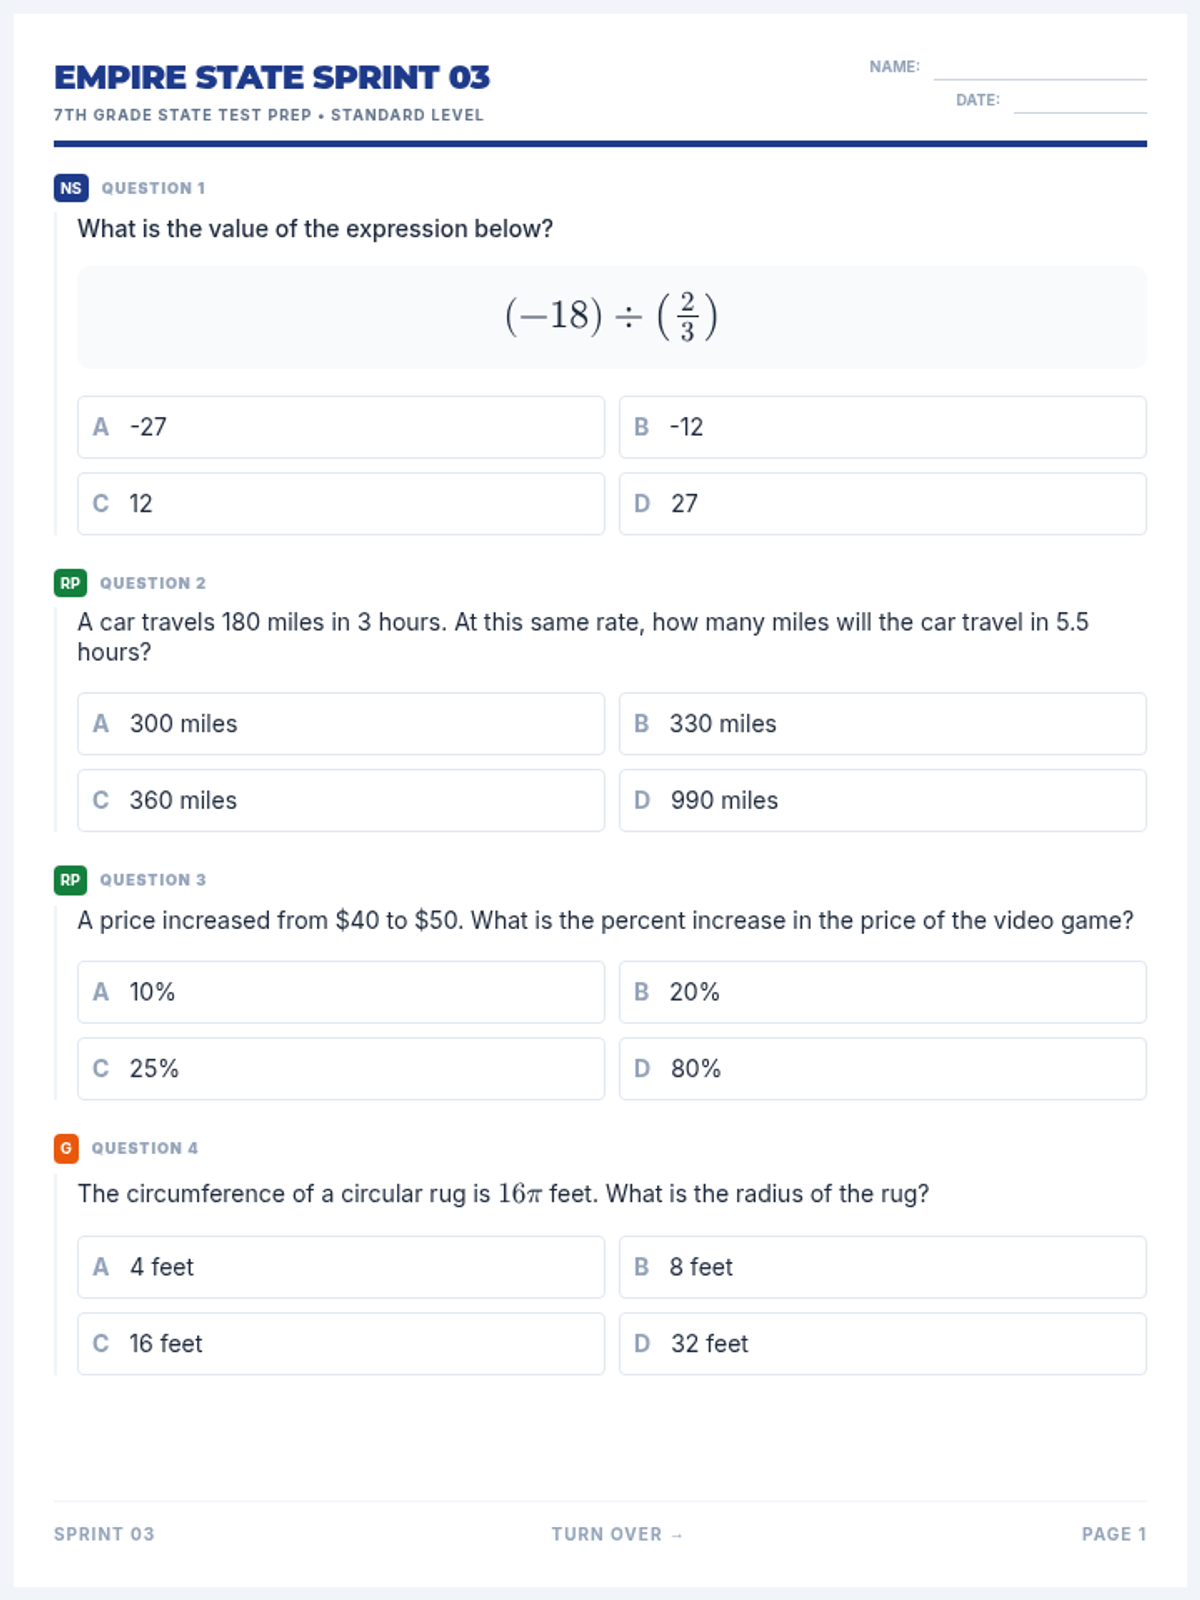
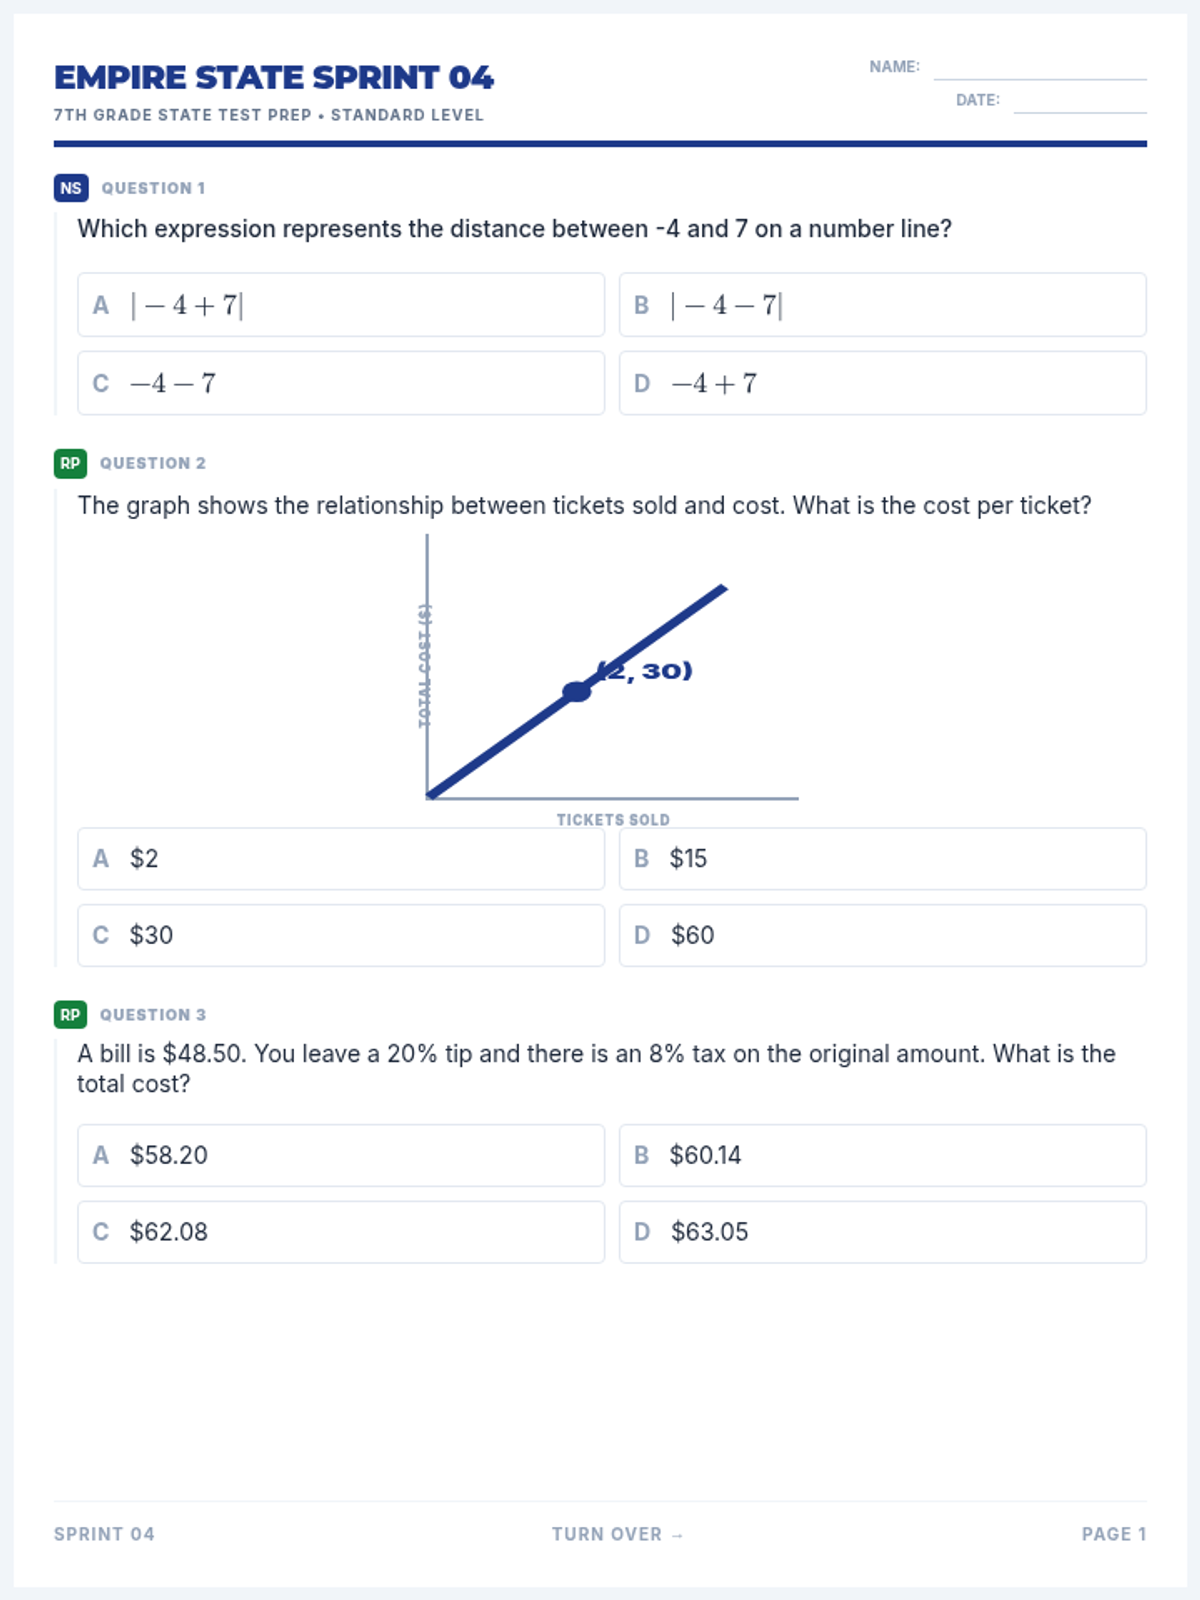
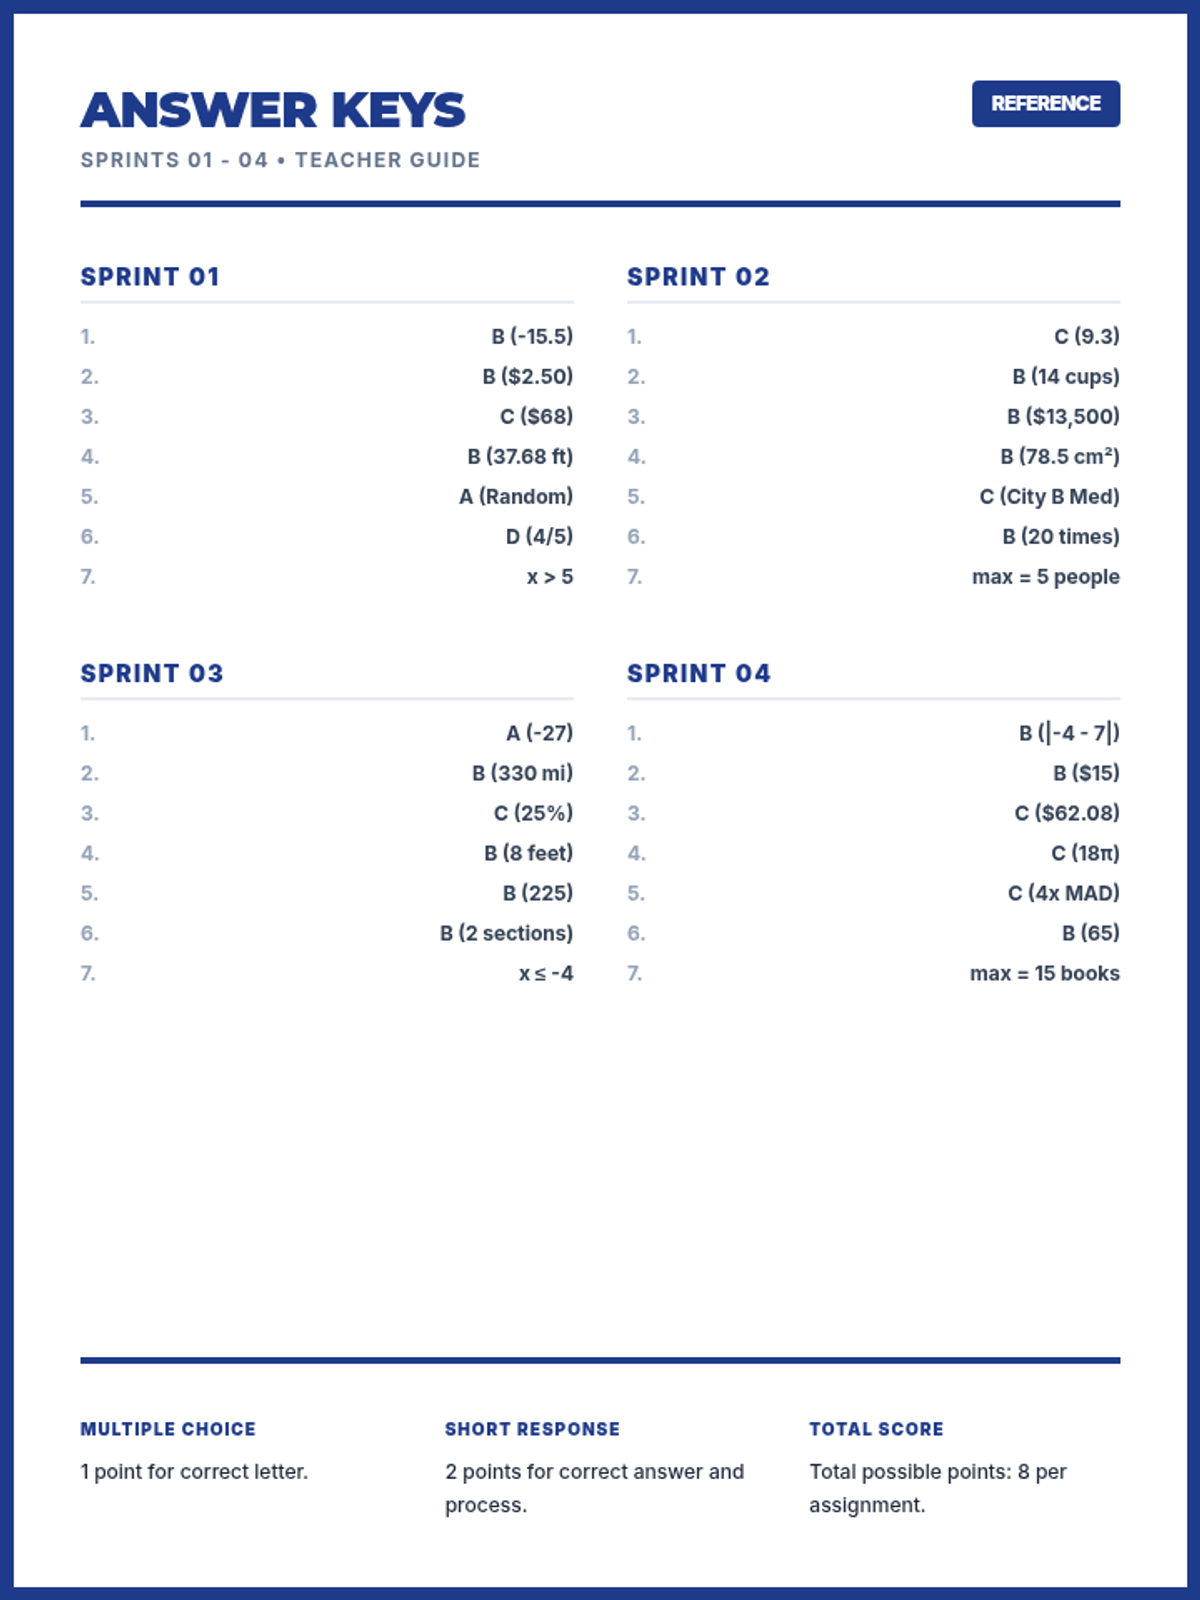
A collection of four double-sided homework assignments focusing on foundational 7th-grade math skills. Each "Sprint" contains seven standardized questions covering all major test categories to build stamina and accuracy.
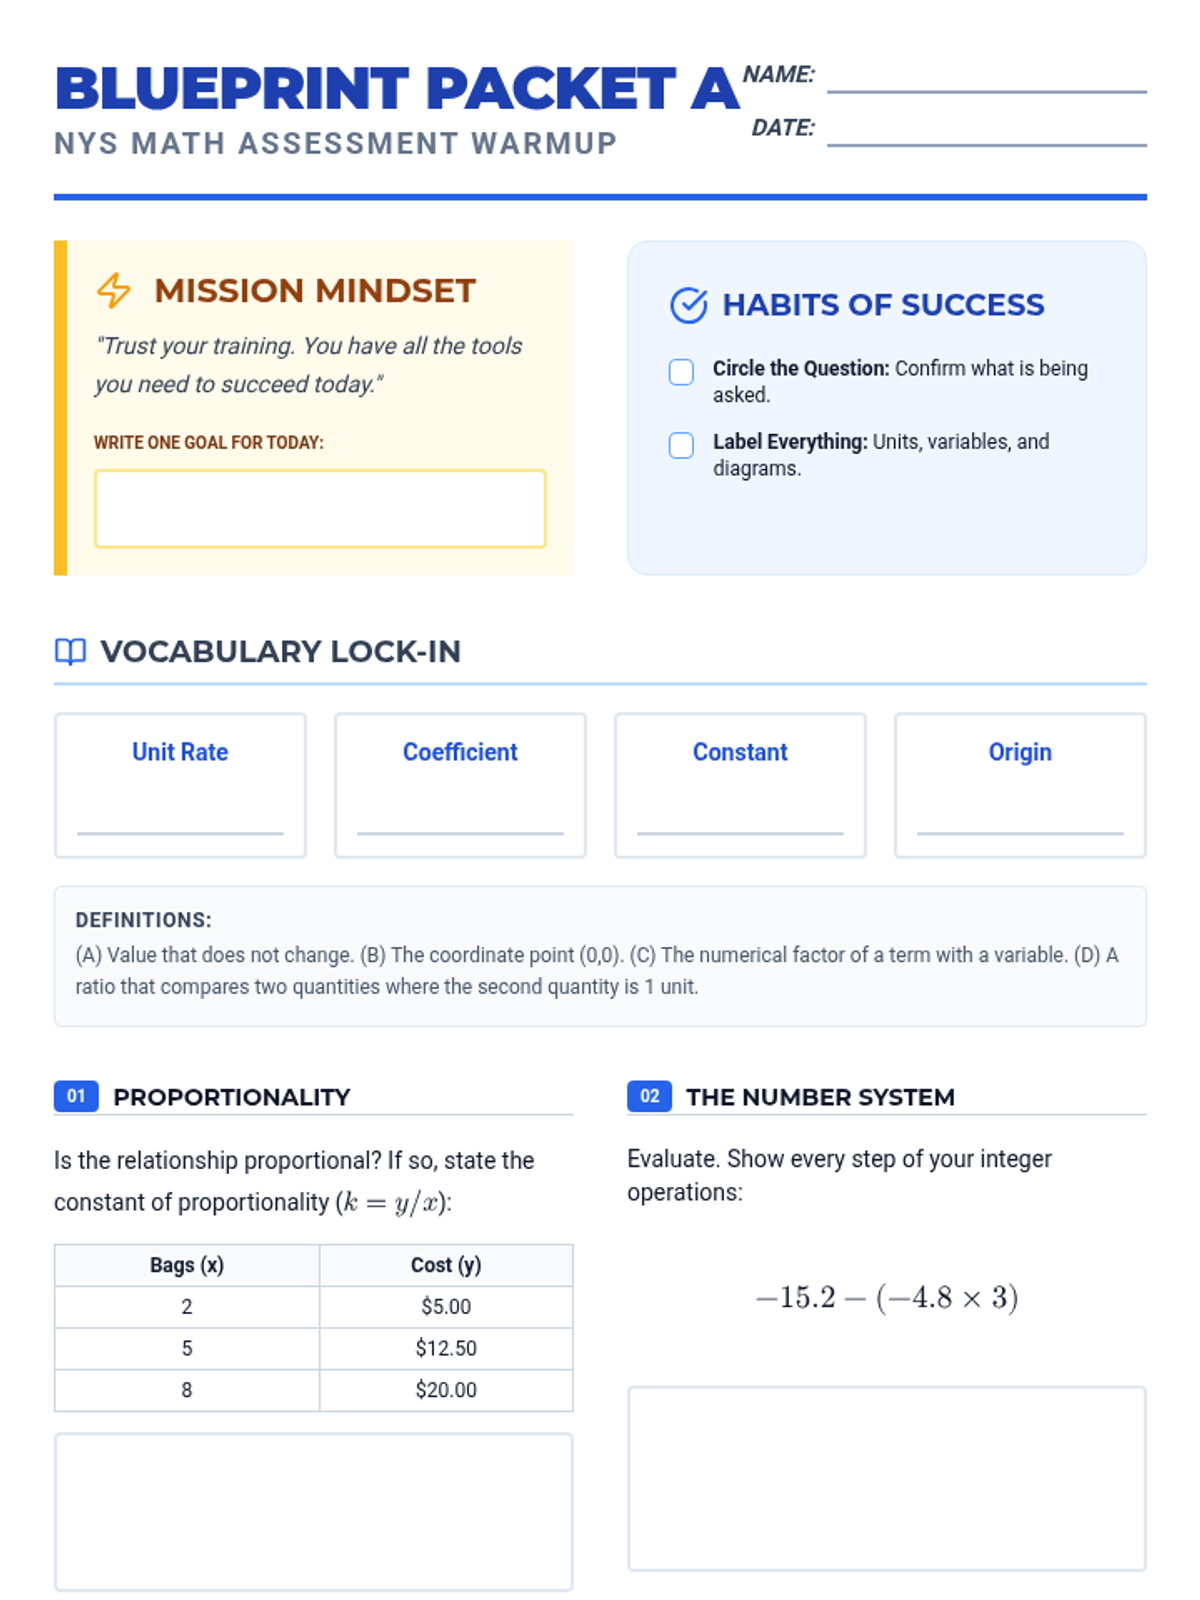
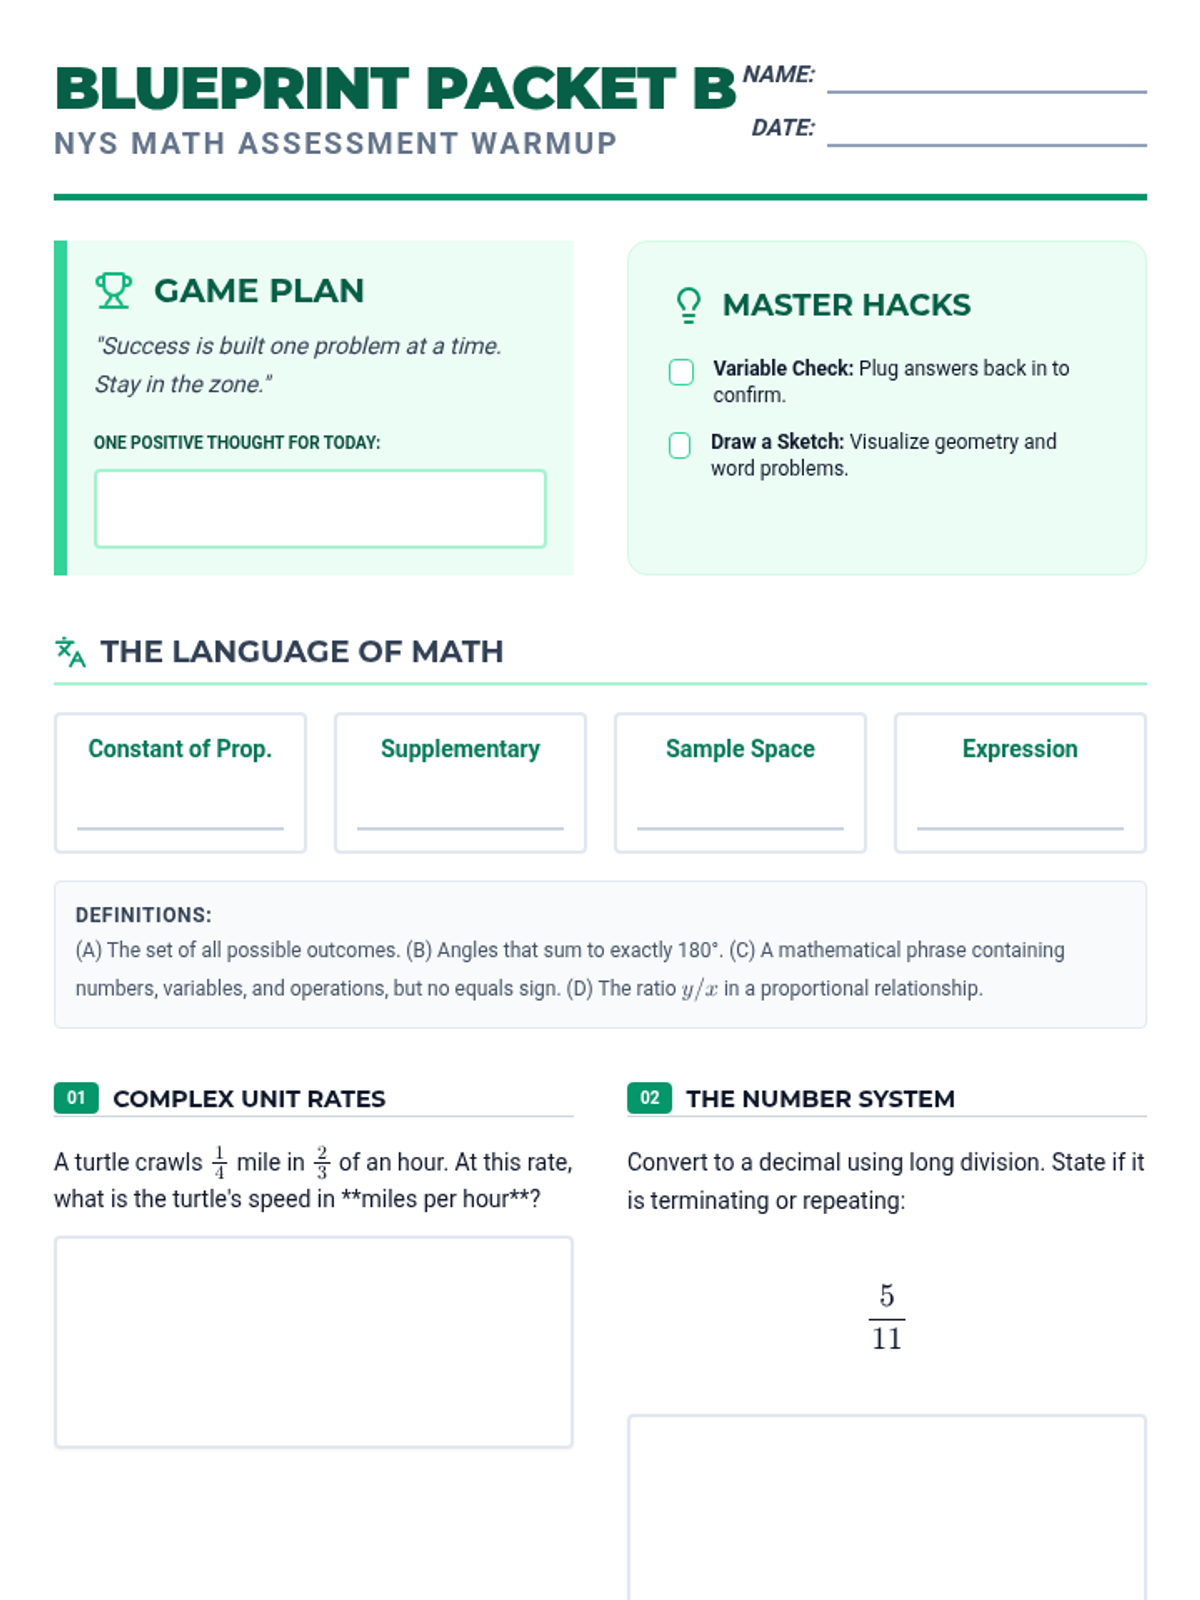
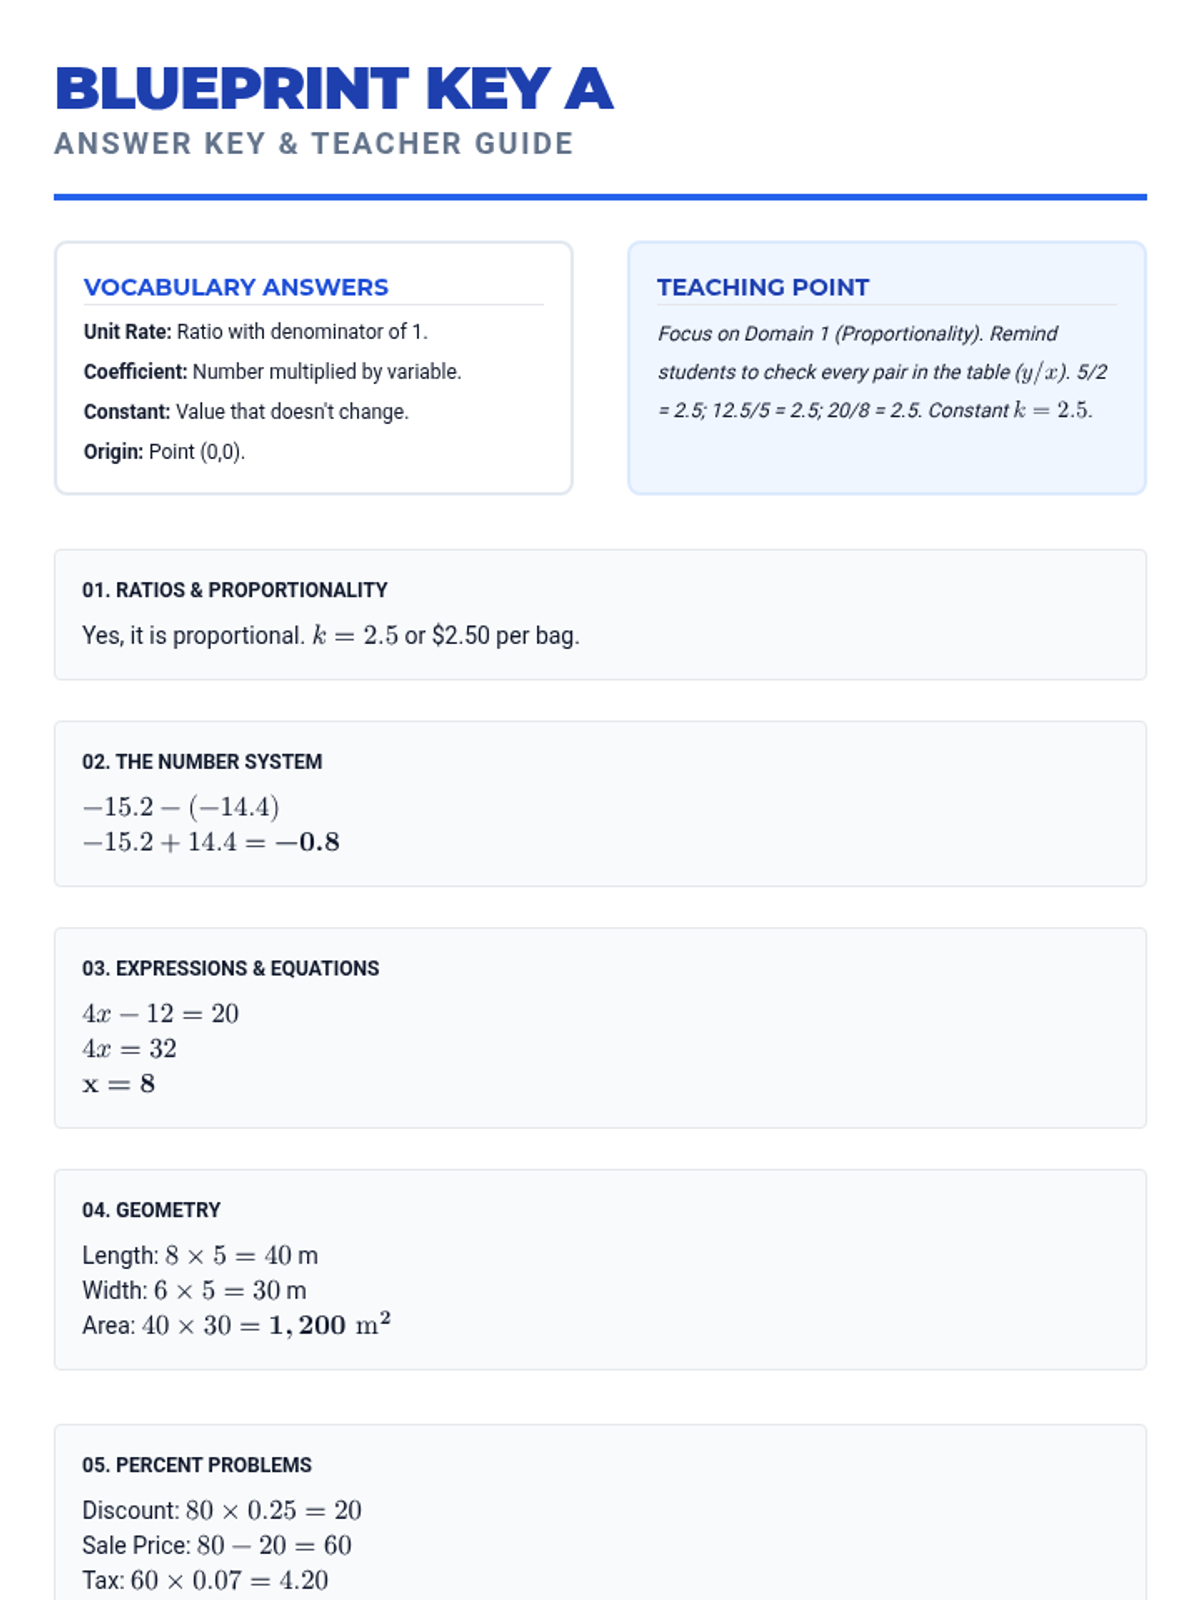
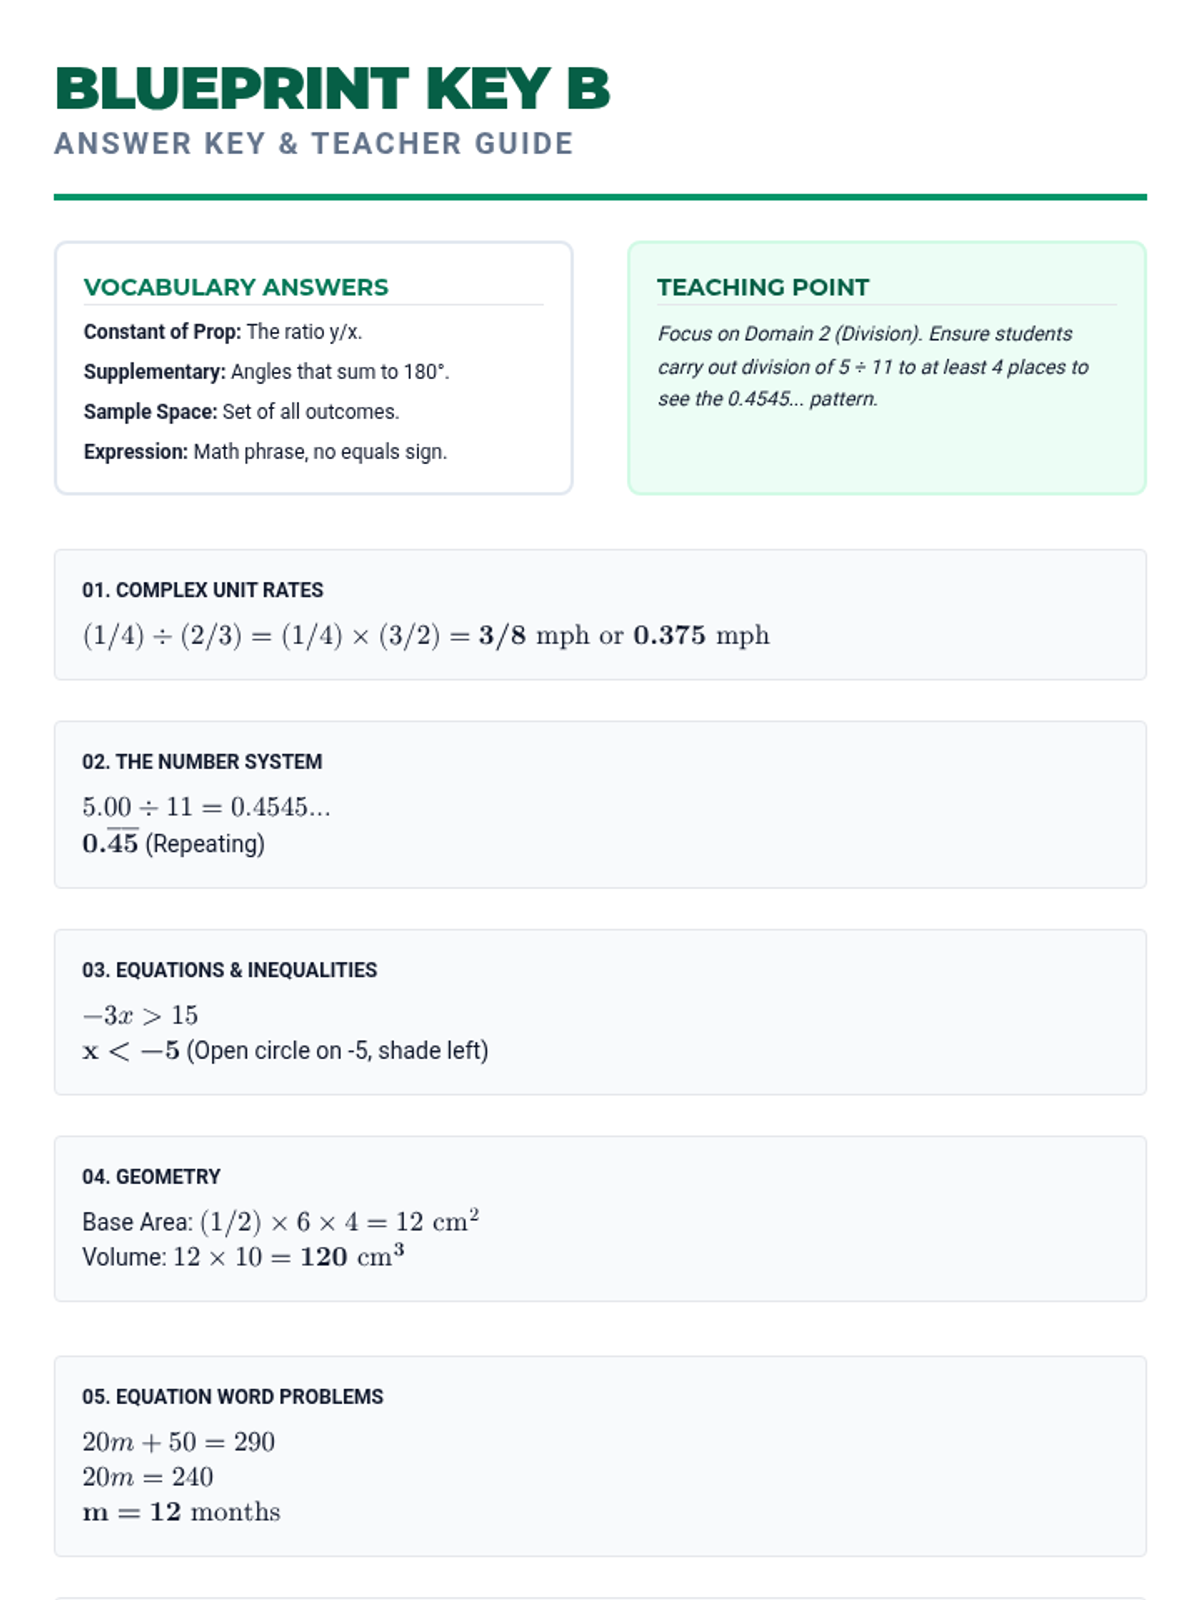
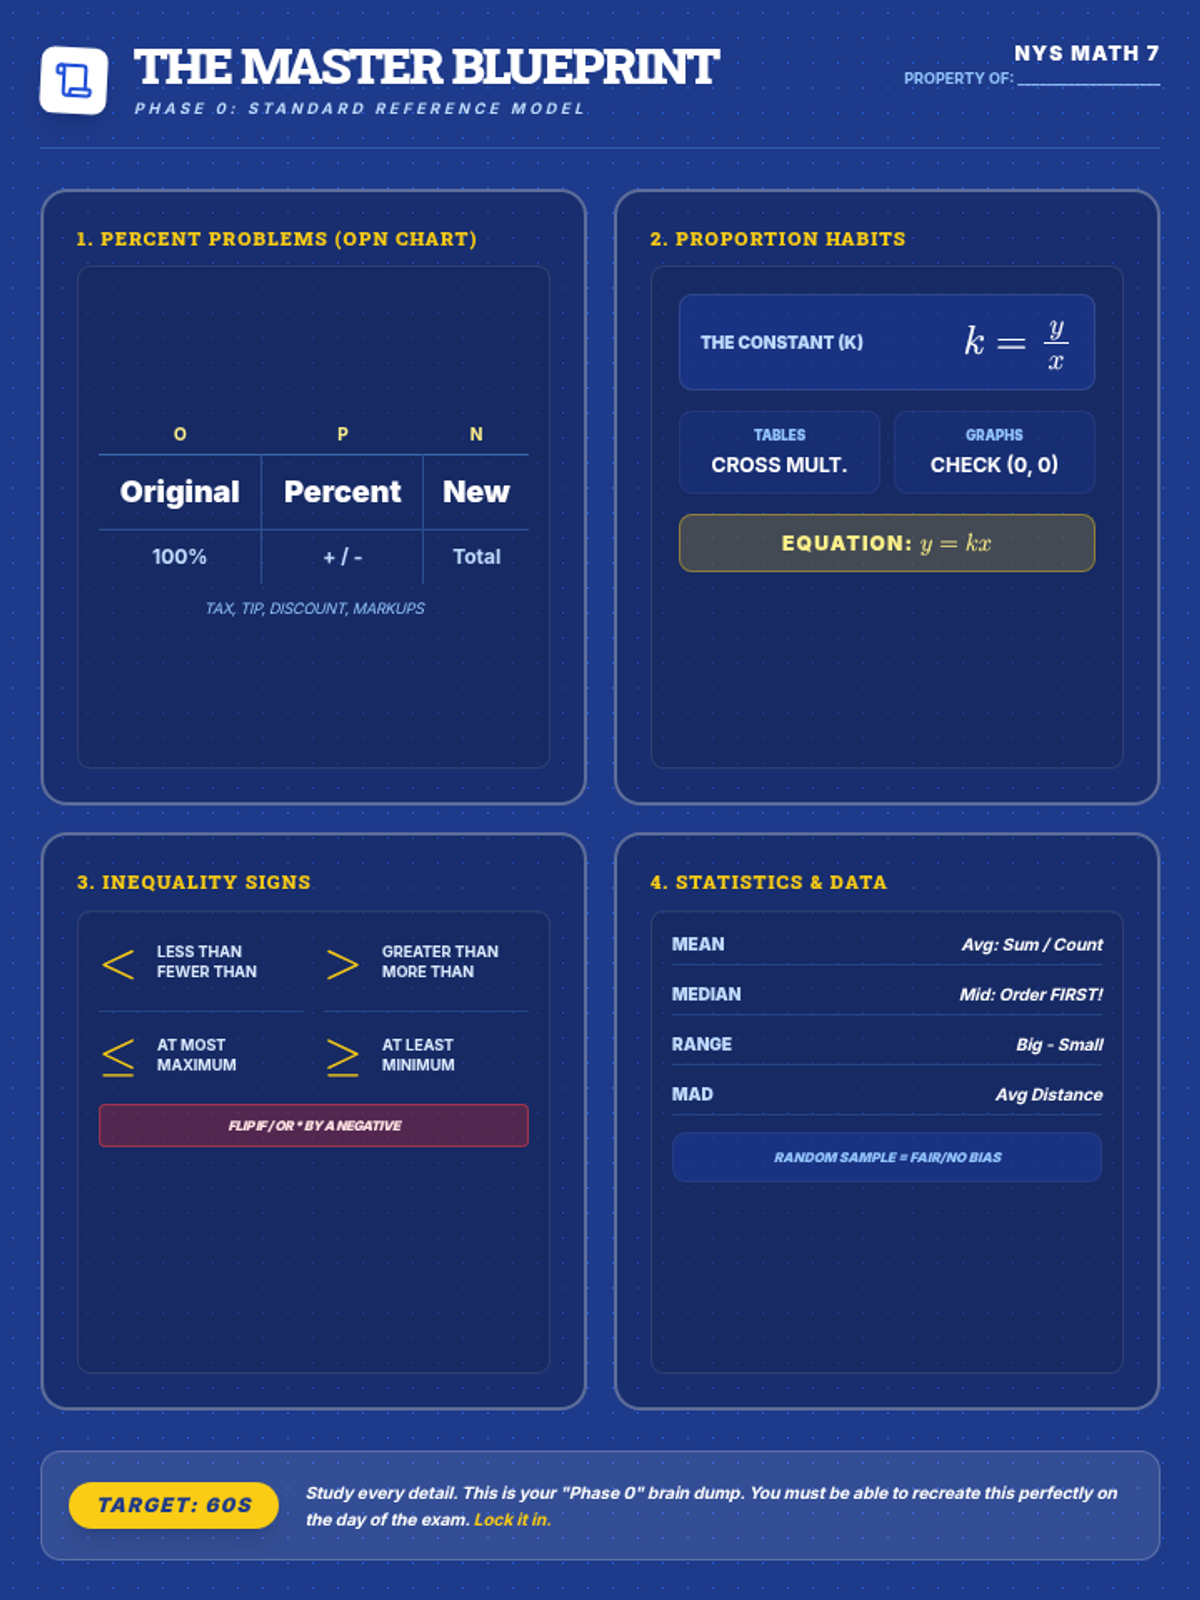
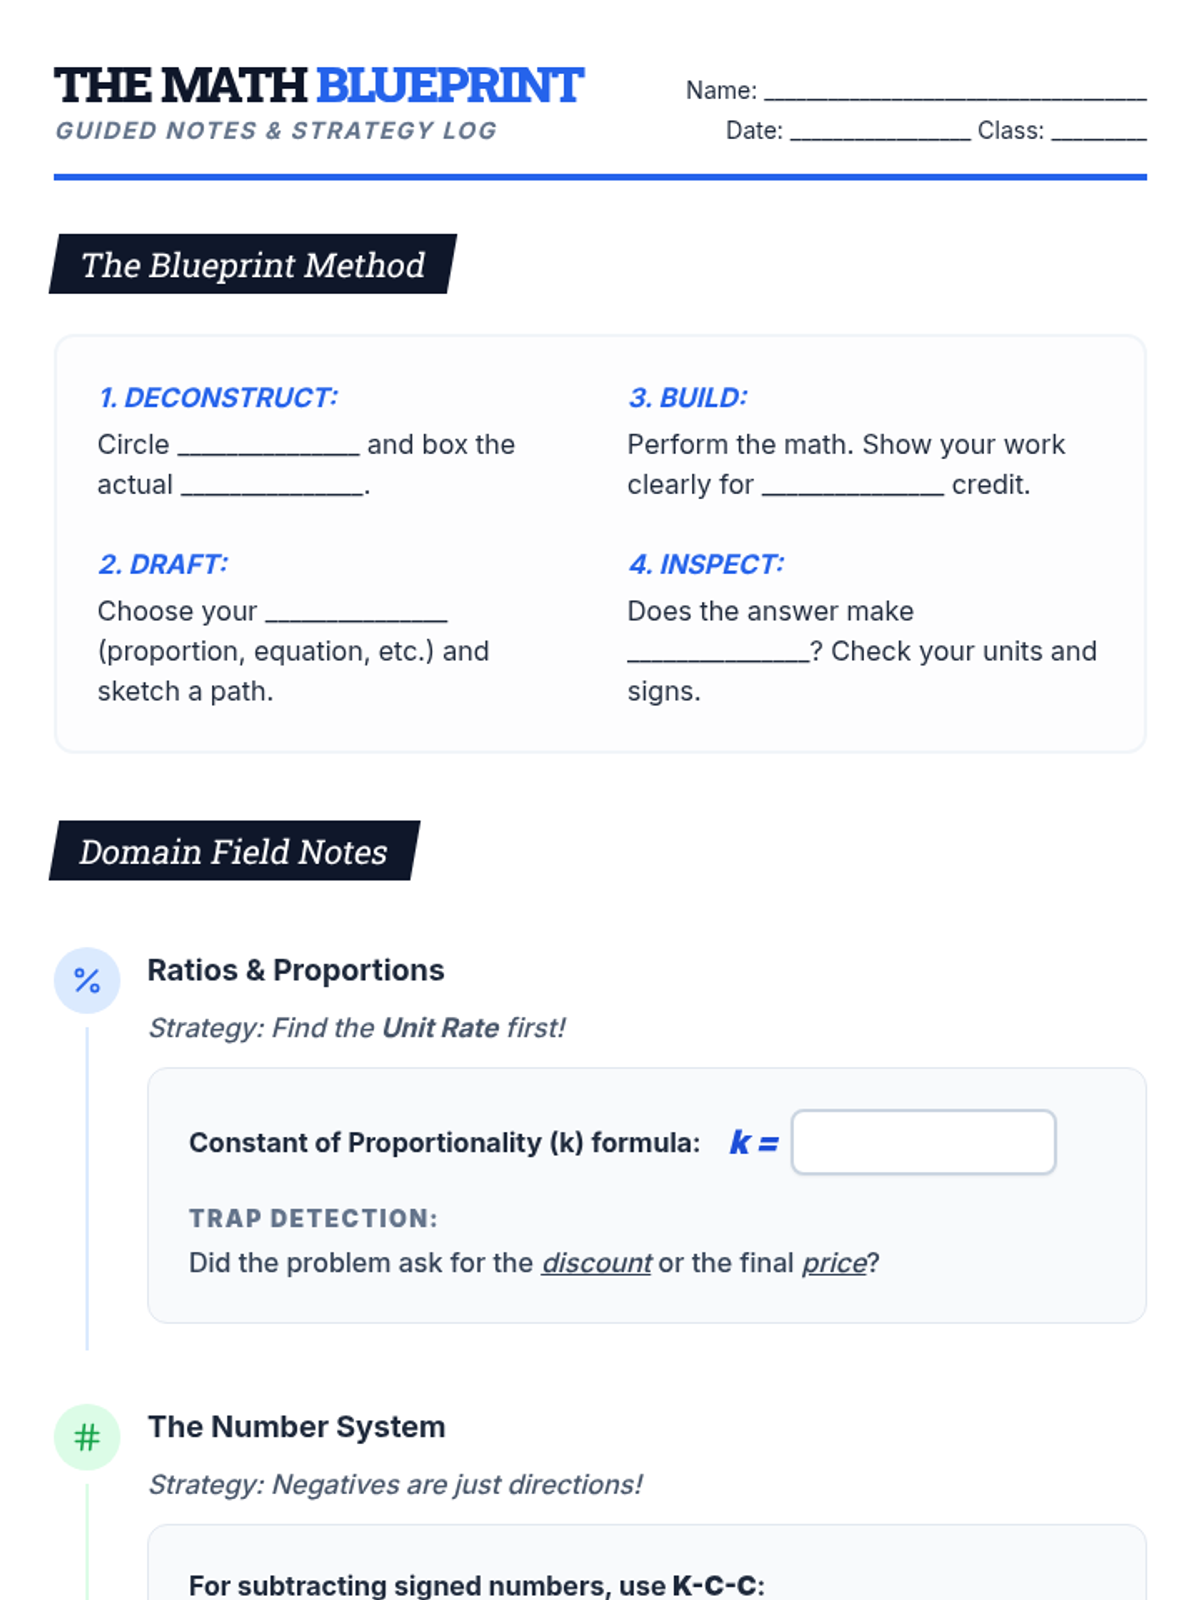
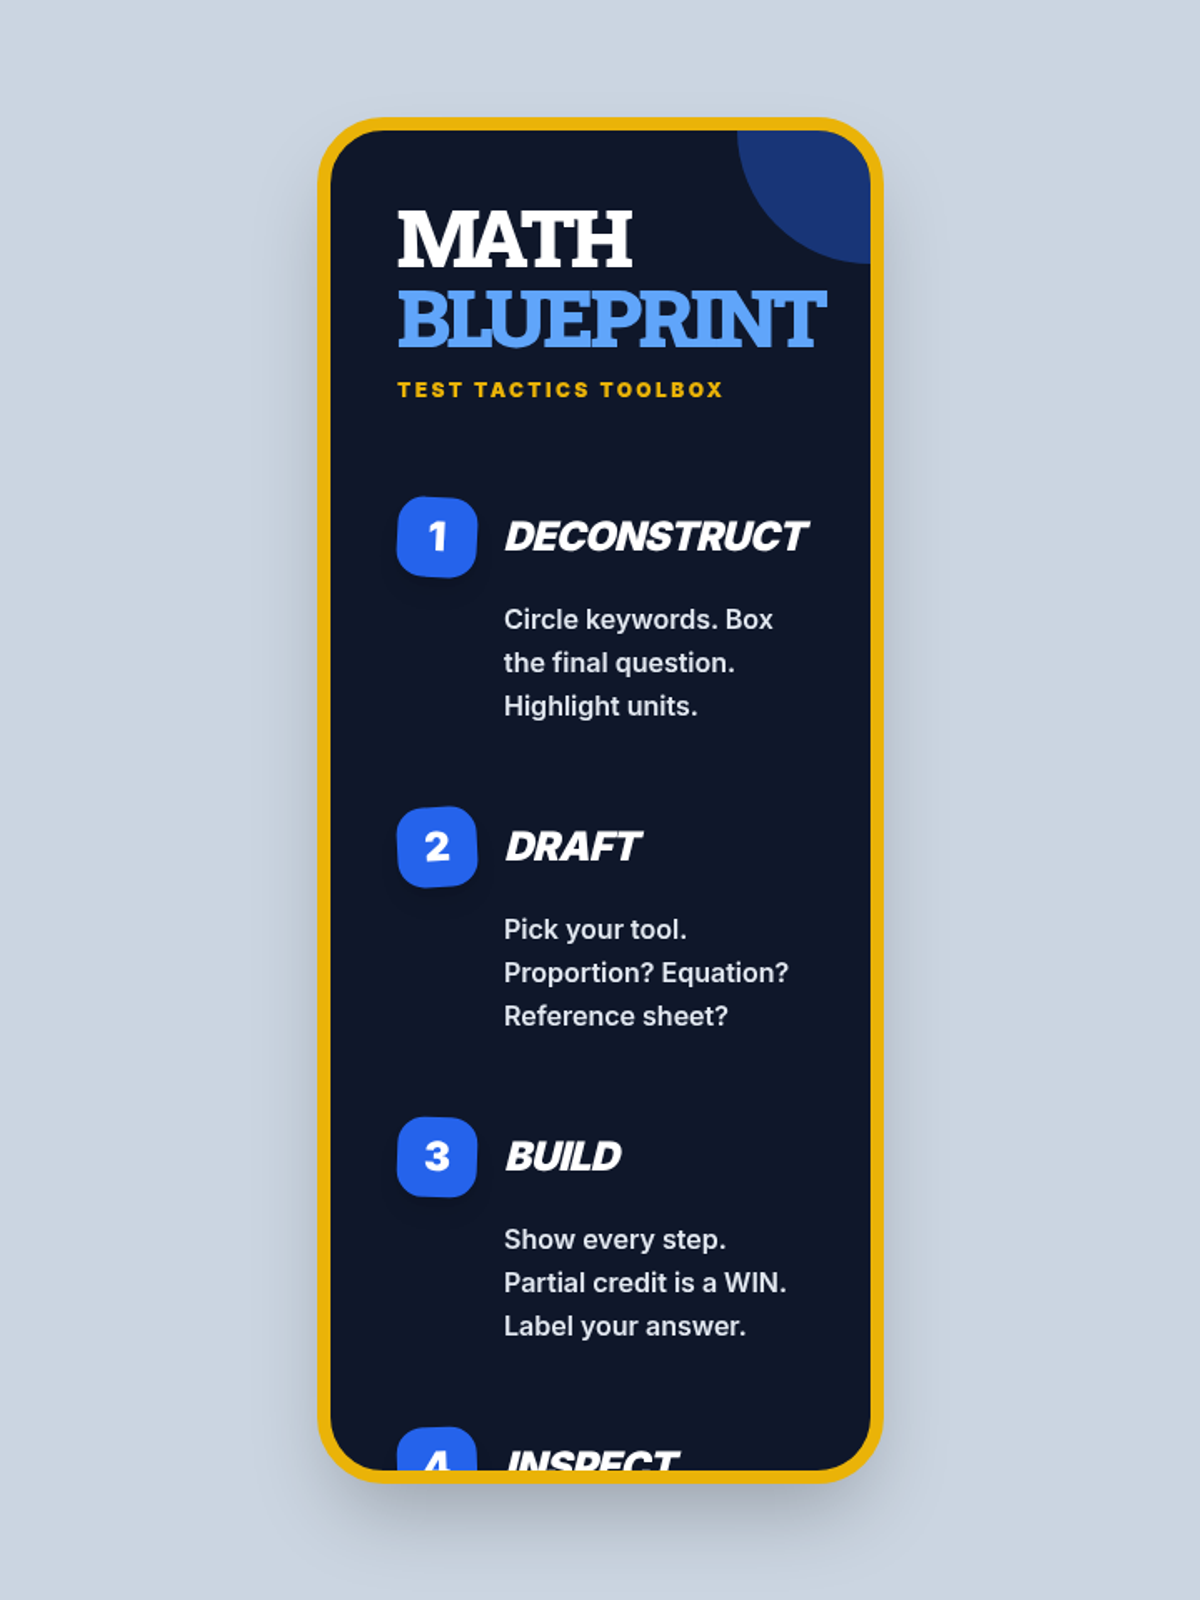
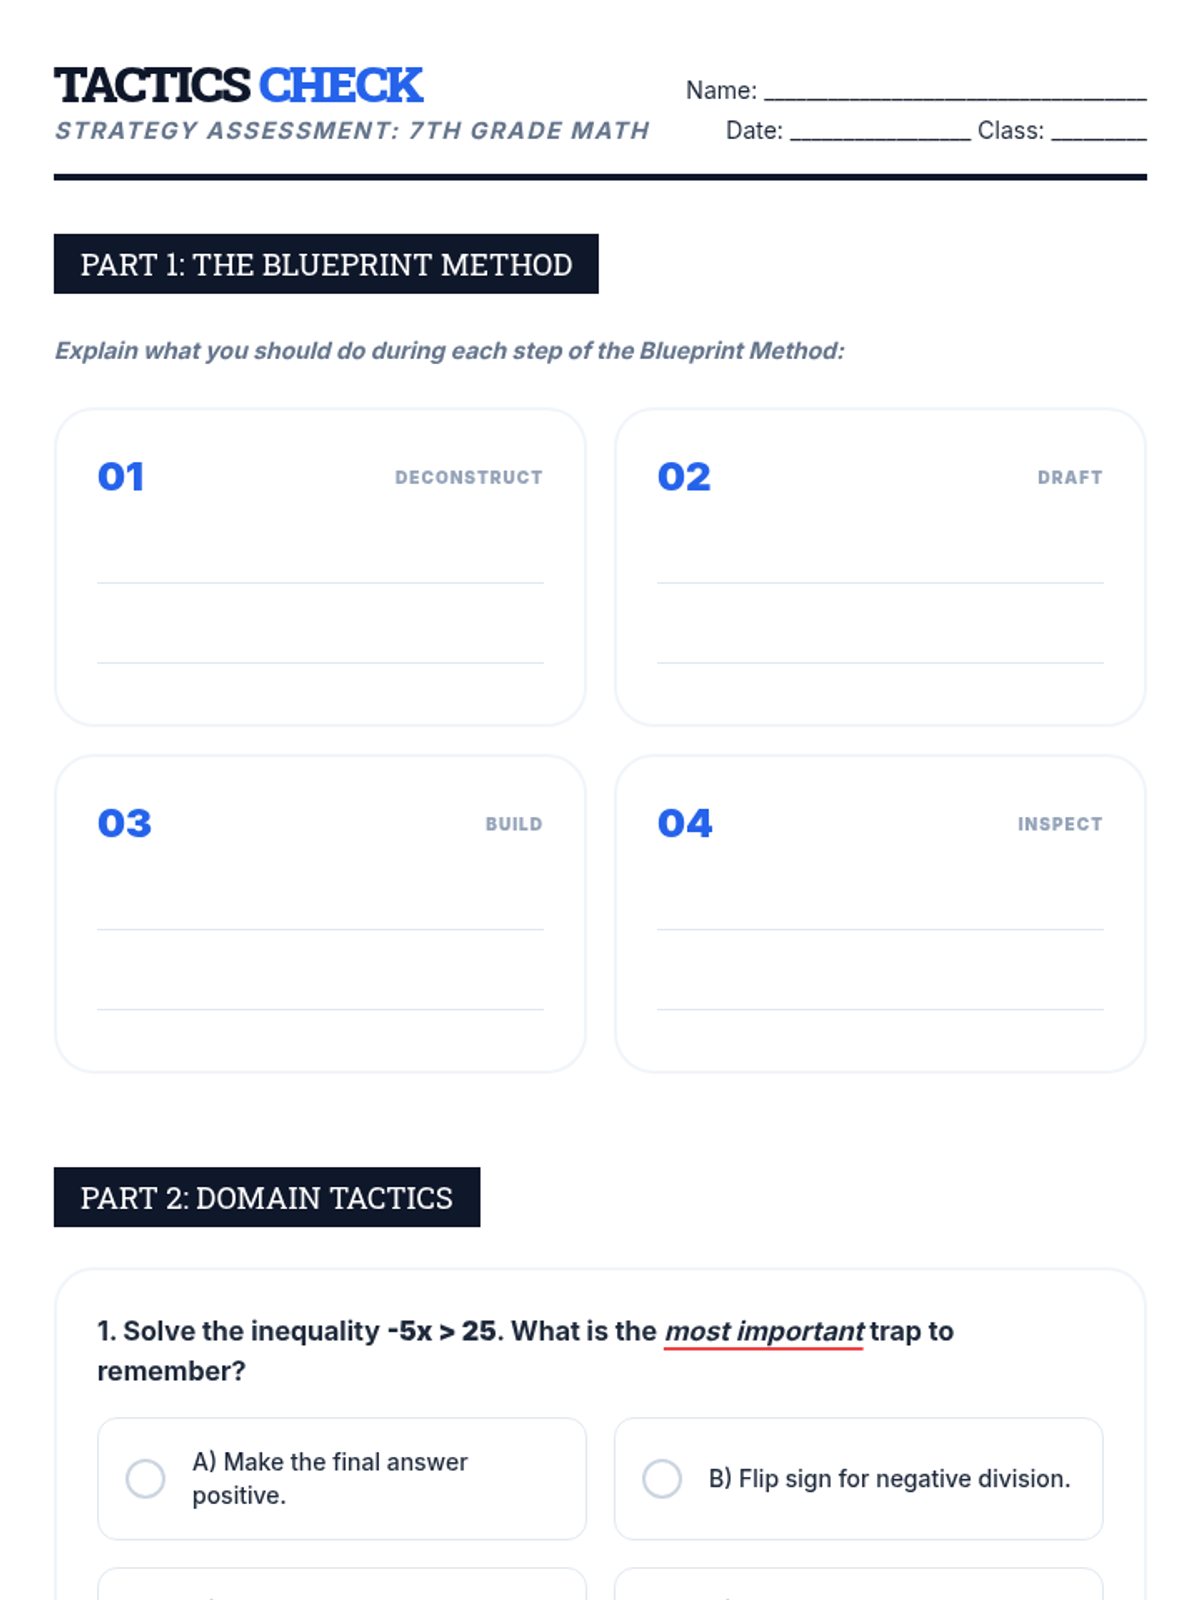
A comprehensive 7th-grade math lesson focused on test-taking strategies for the NYS exam, covering Ratios, Number Systems, Expressions, Geometry, and Statistics. Students learn the 'Blueprint Method' for deconstructing complex problems and apply specific tactics to standard-aligned questions.
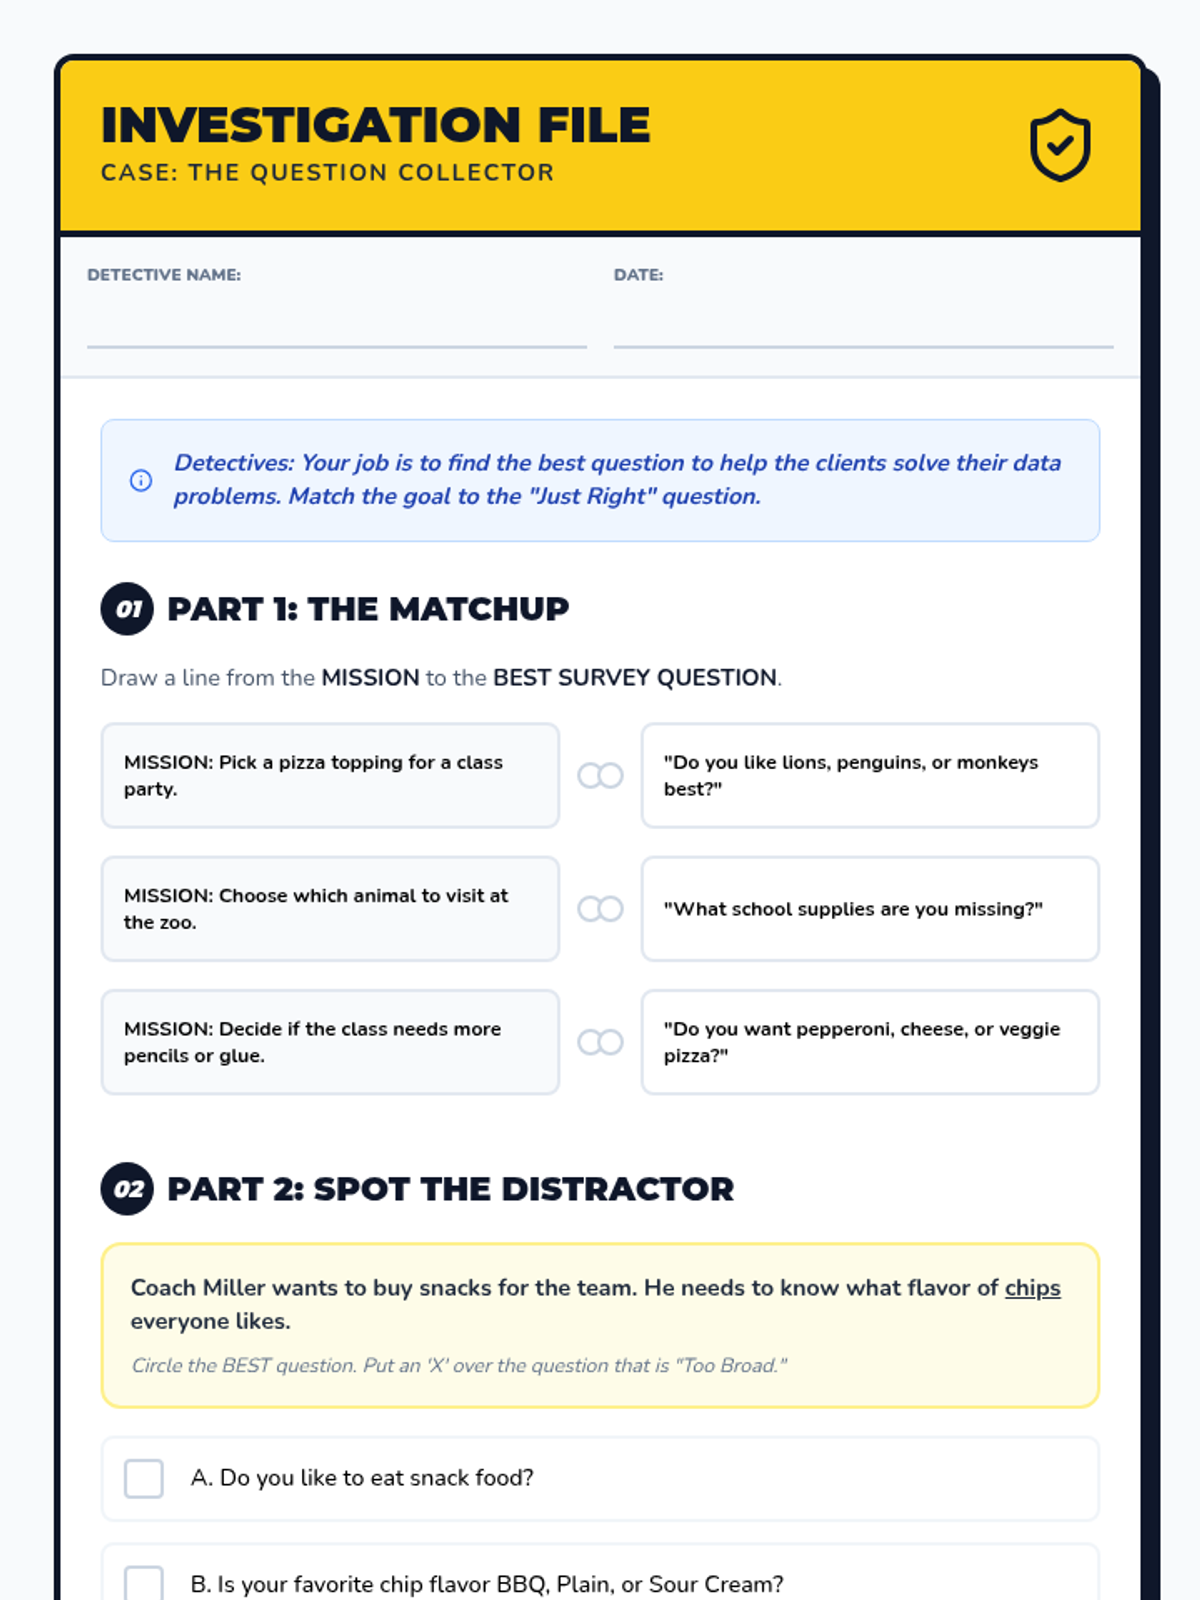
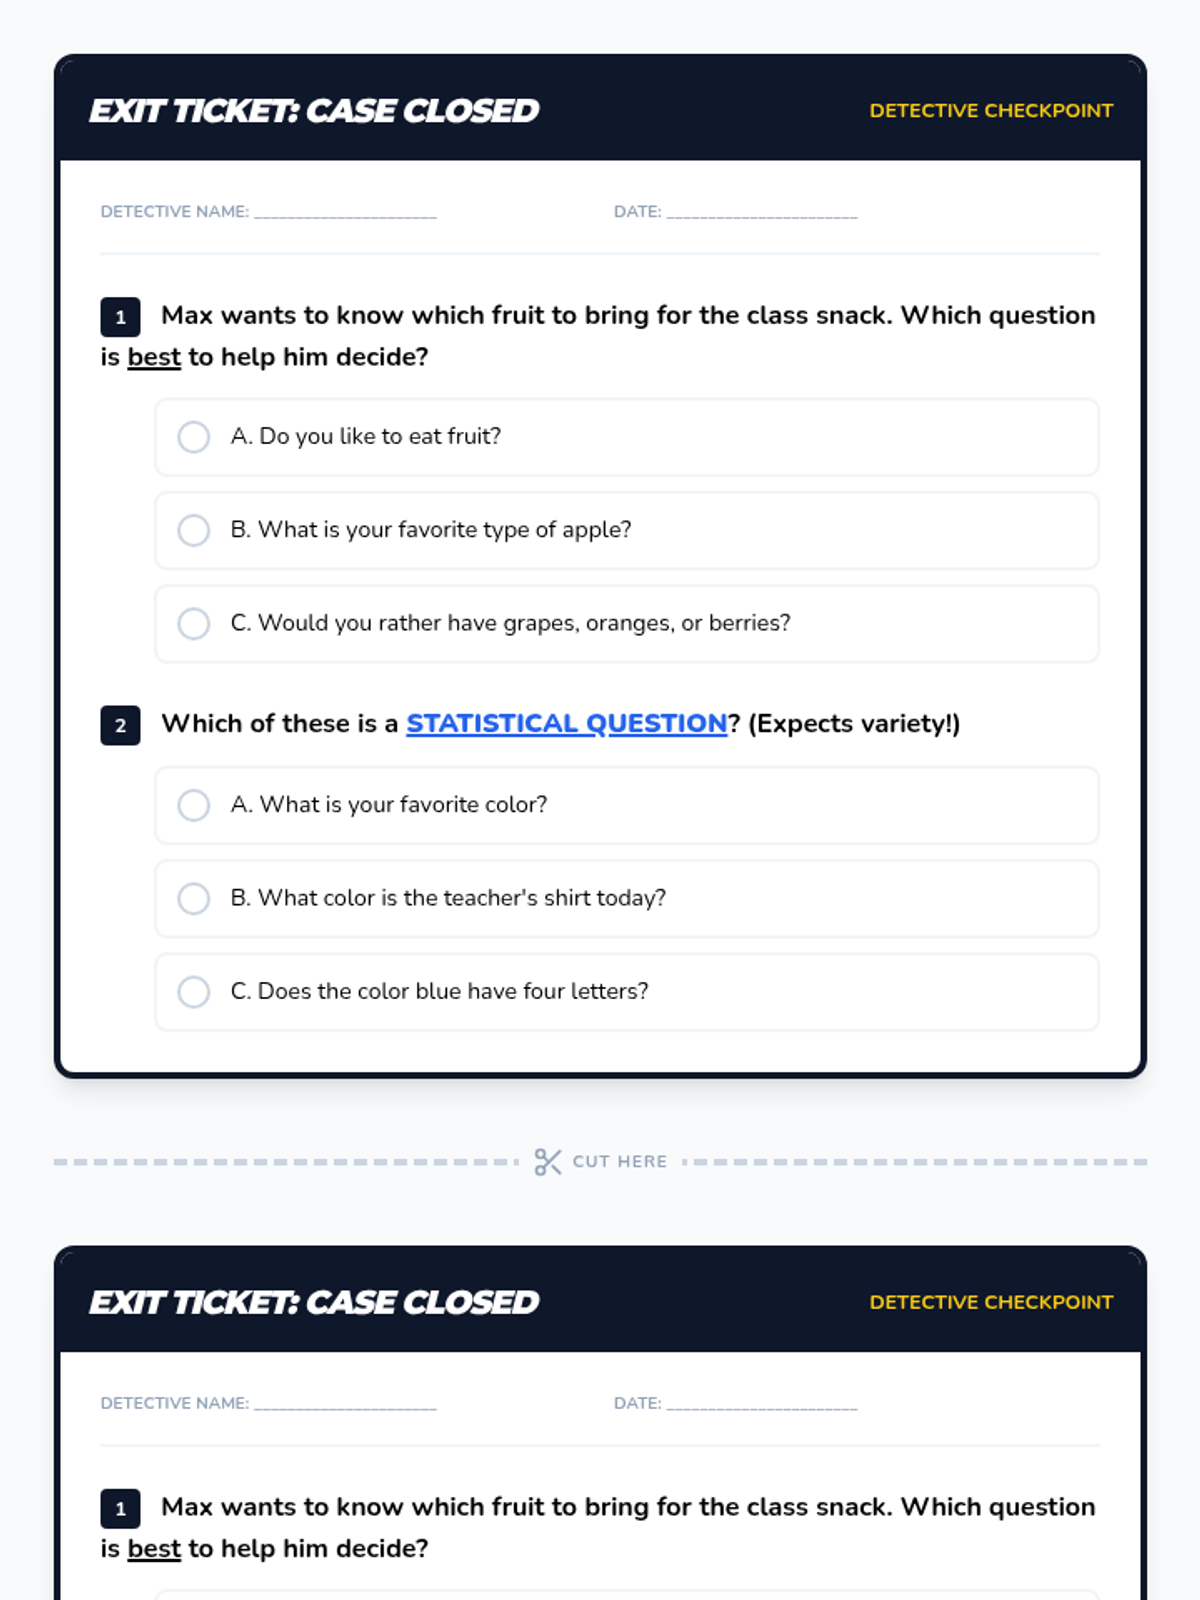
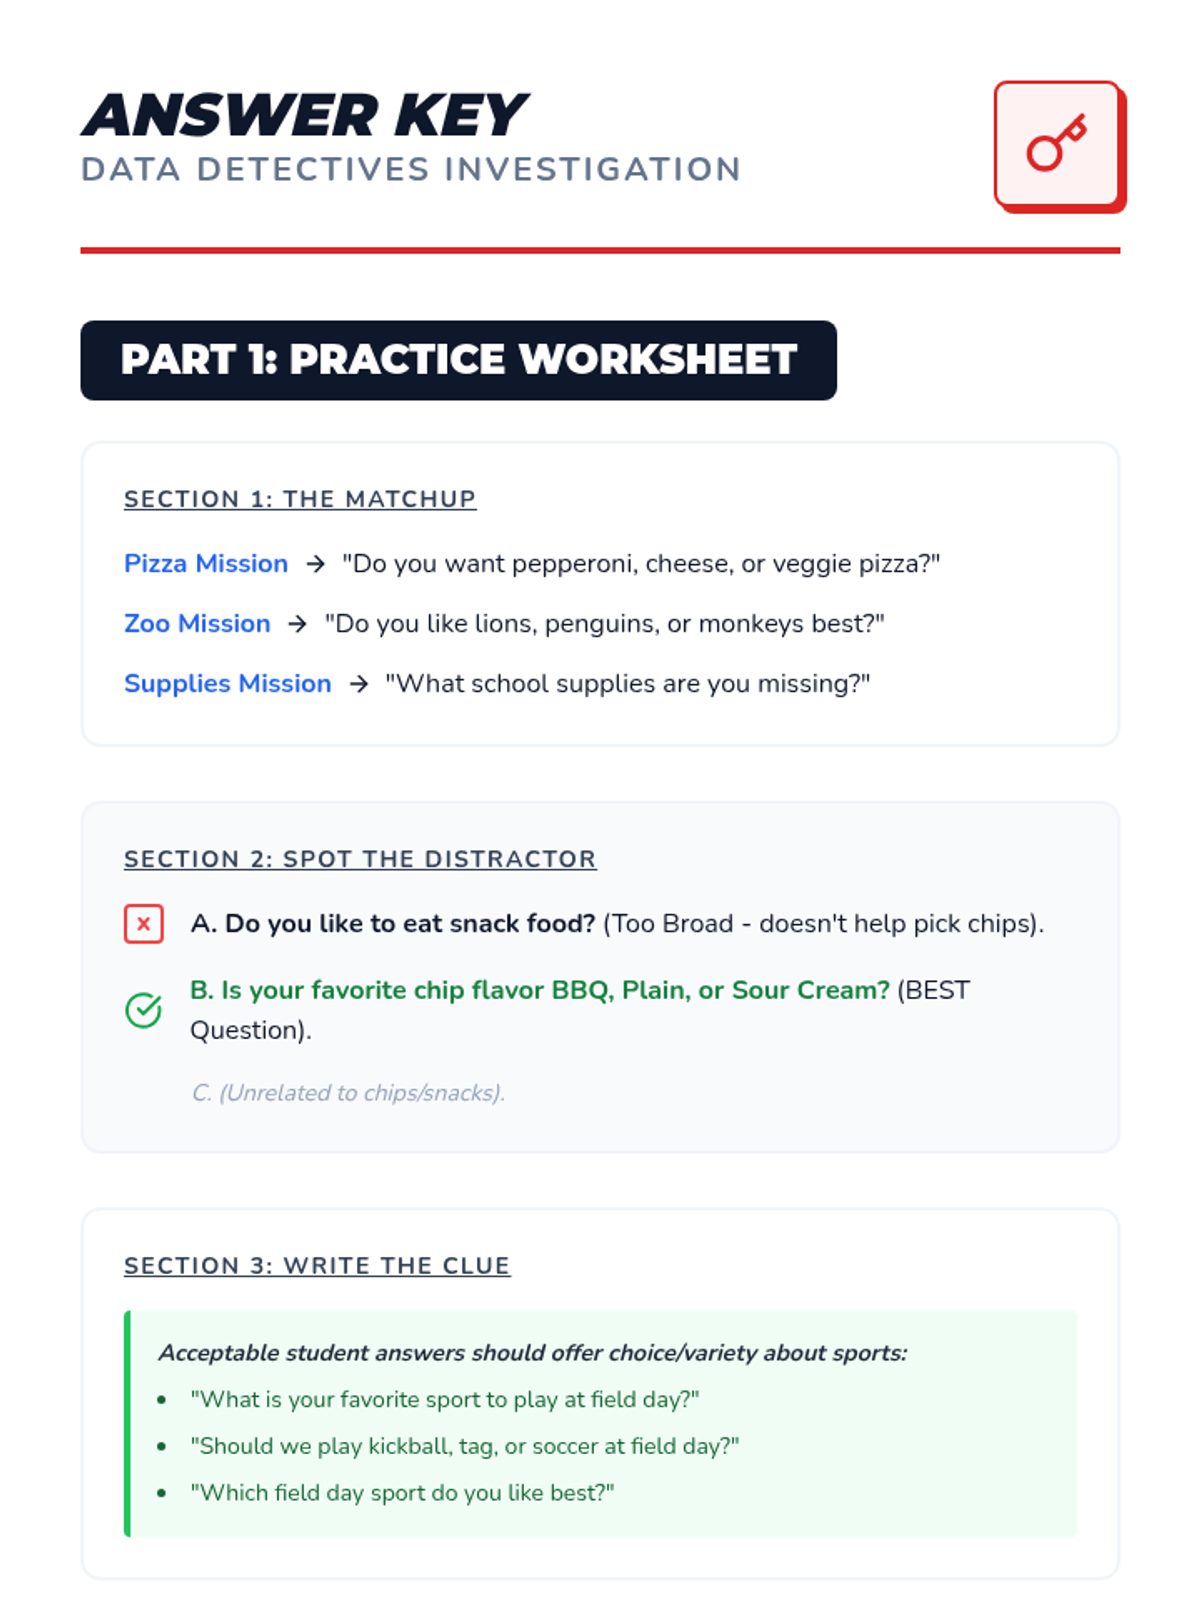
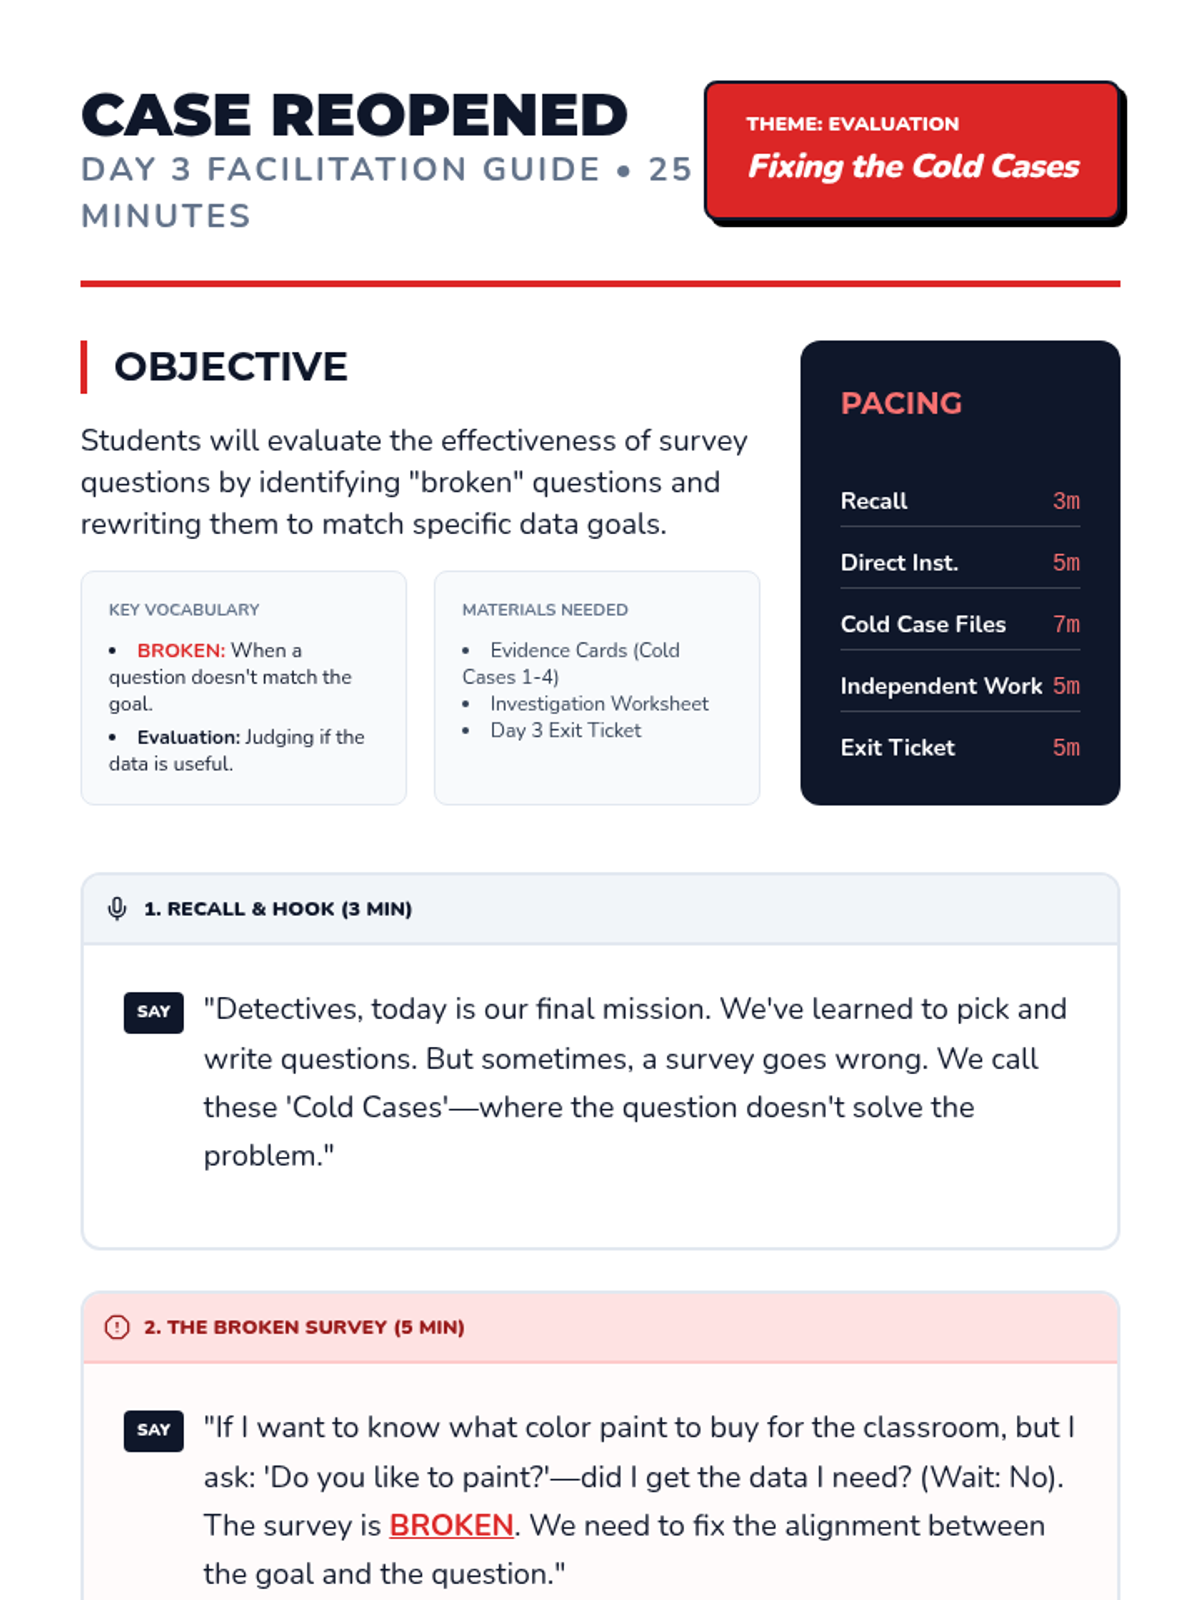
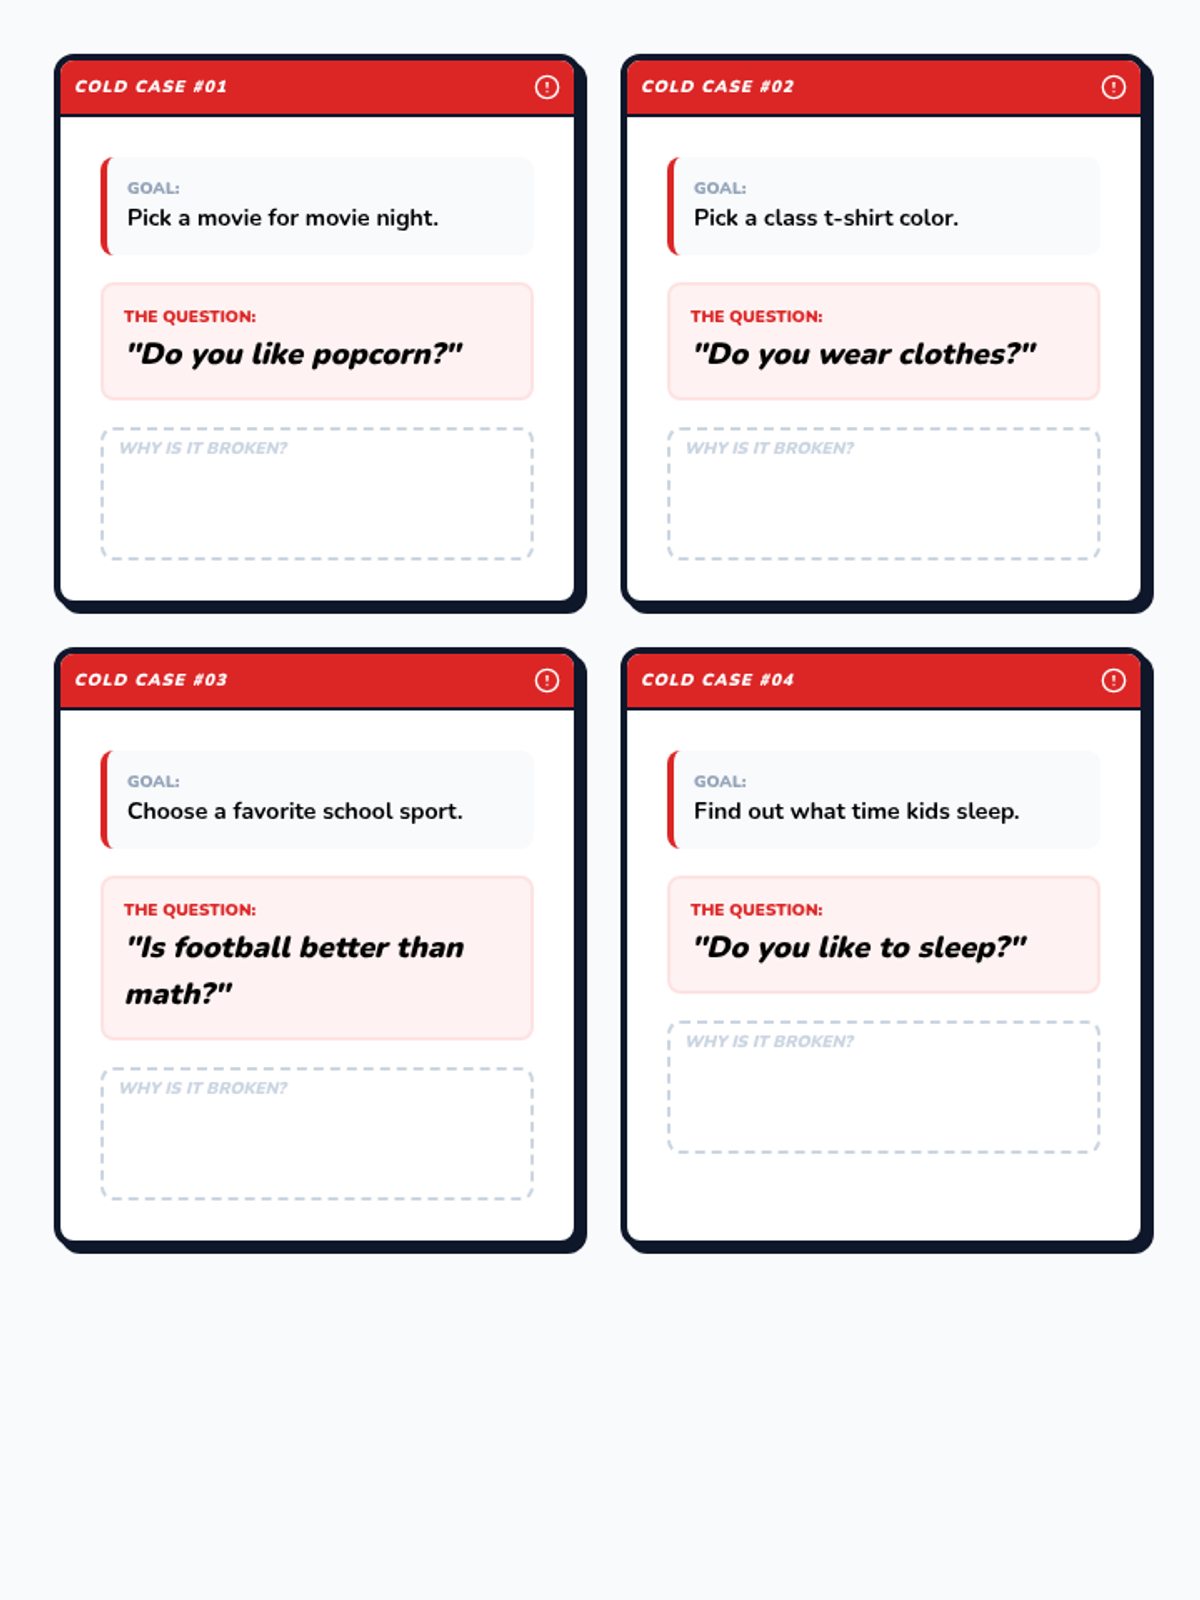
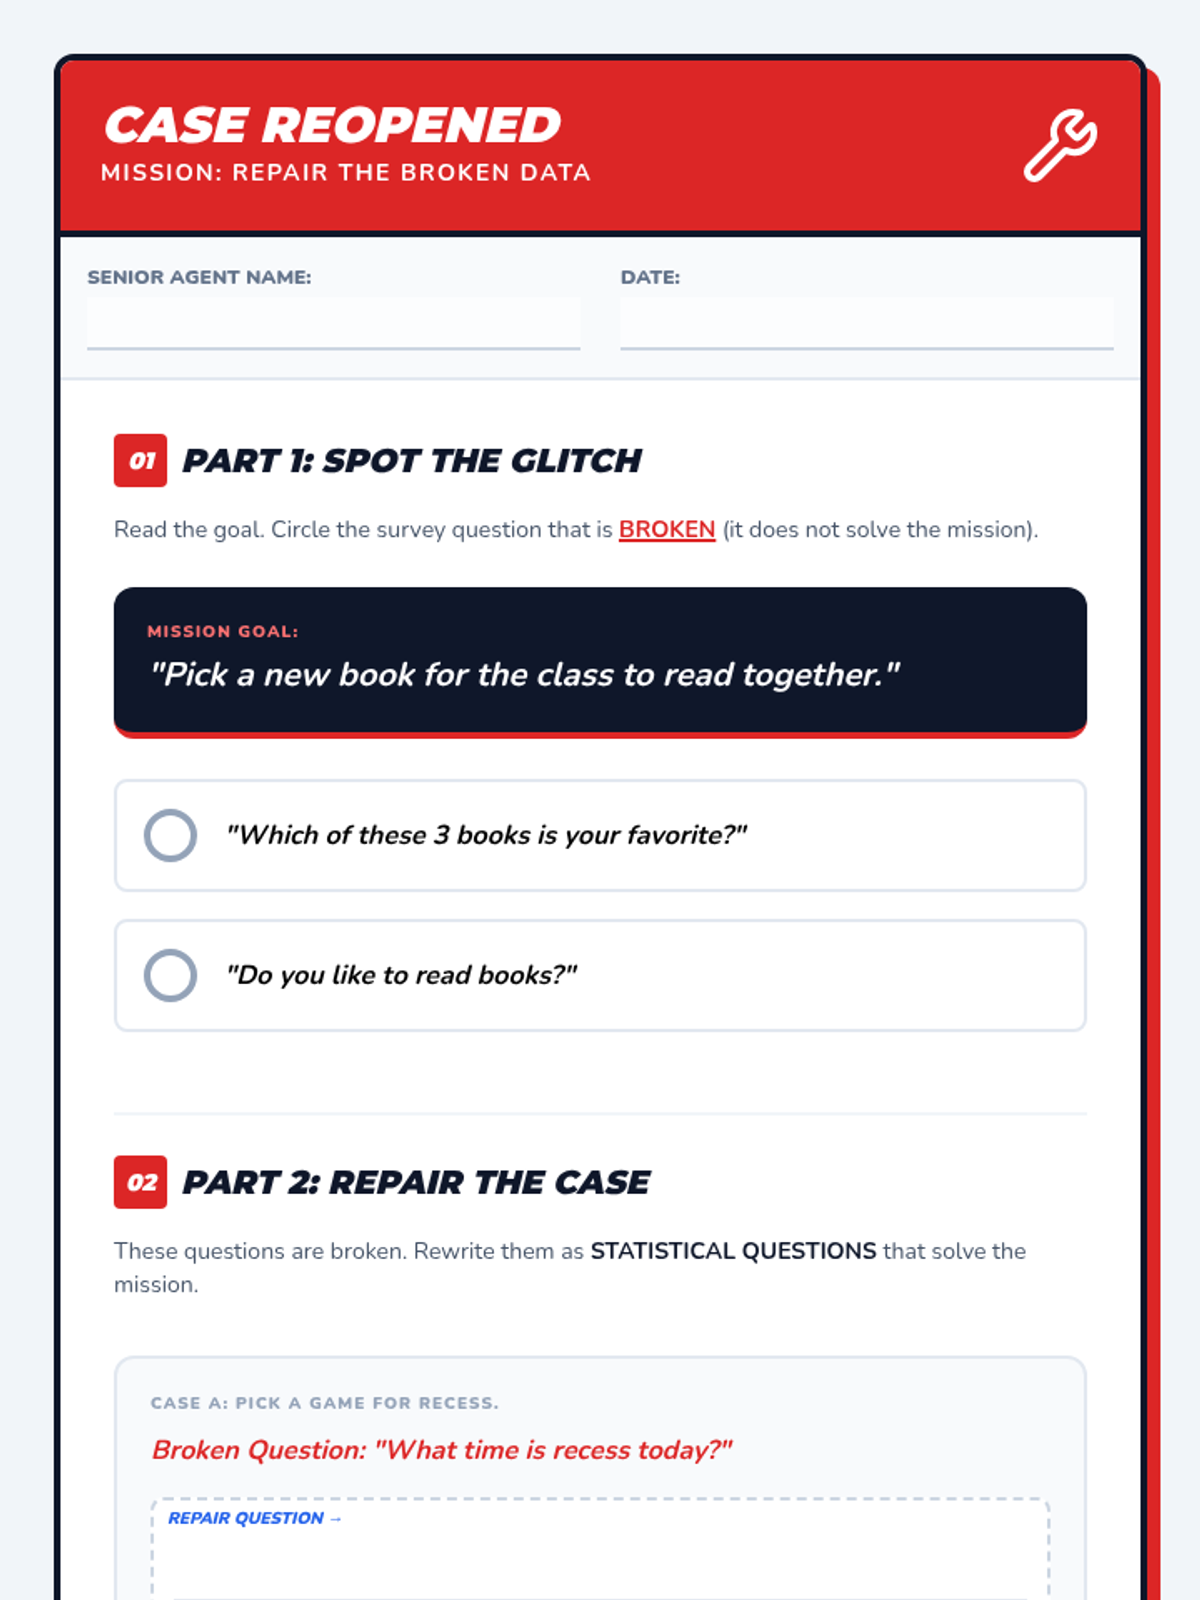
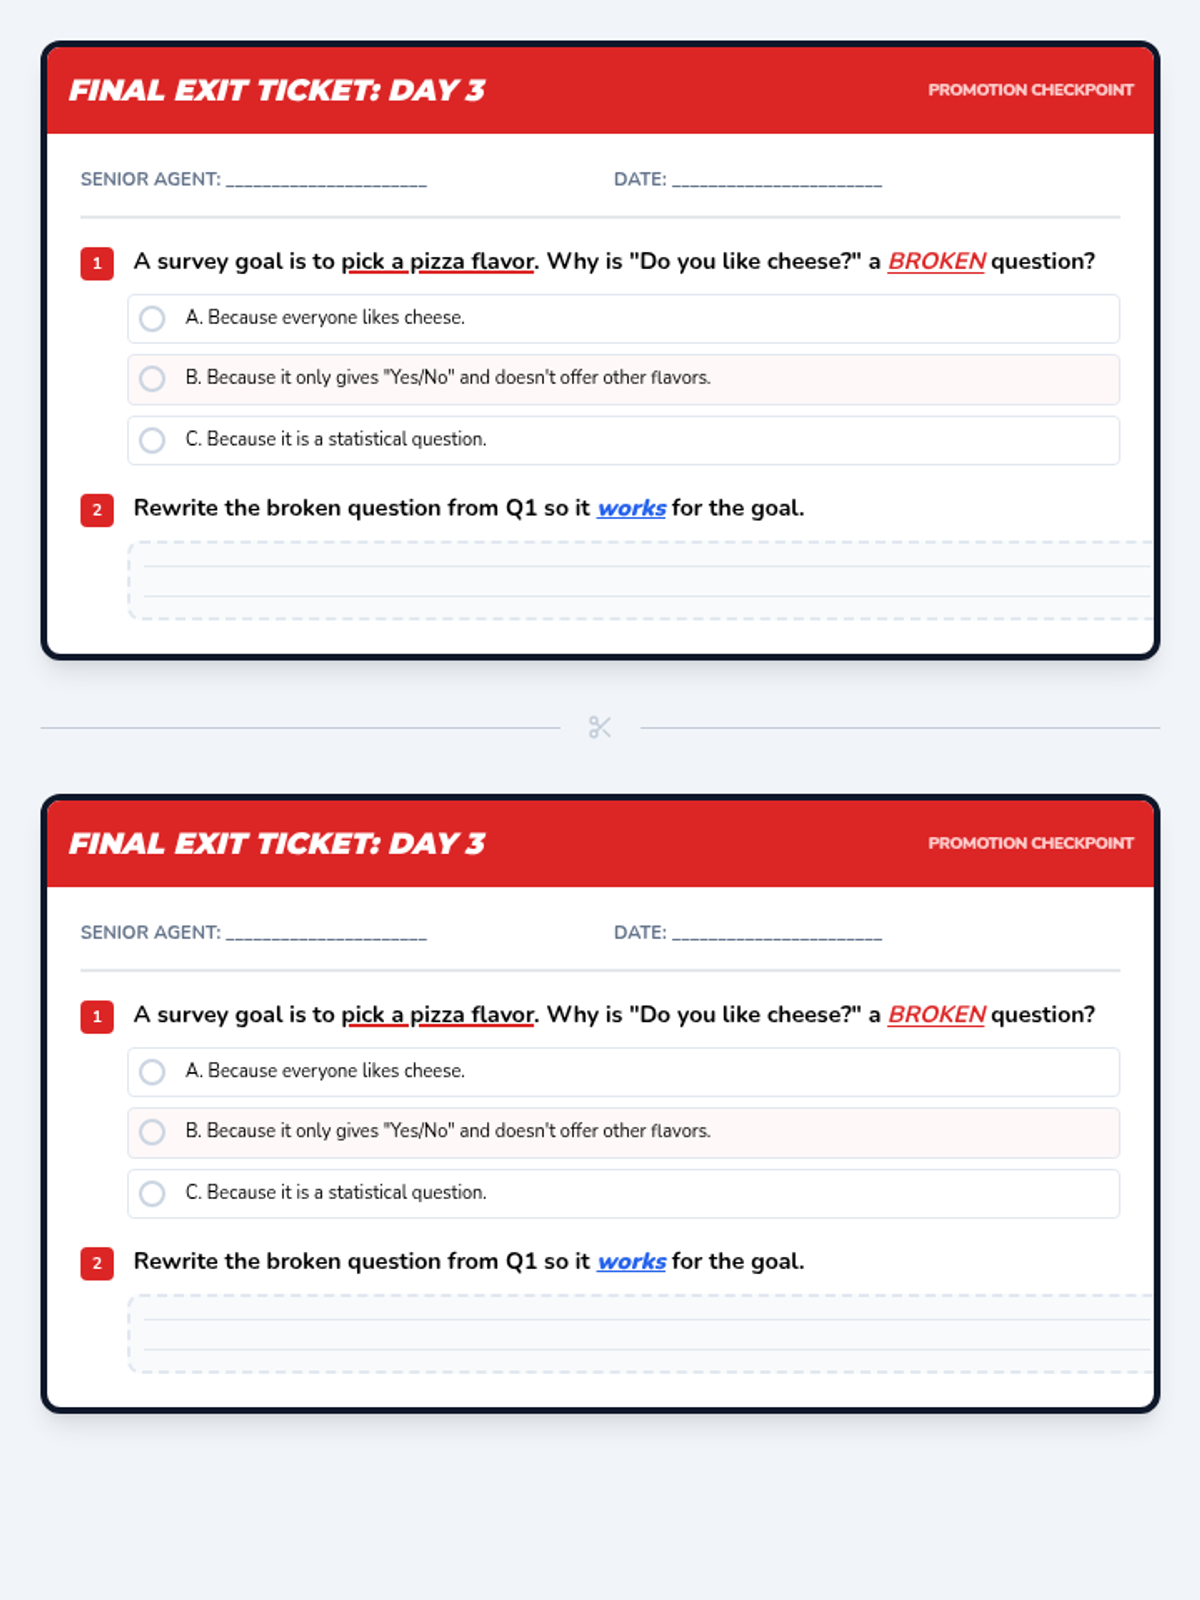
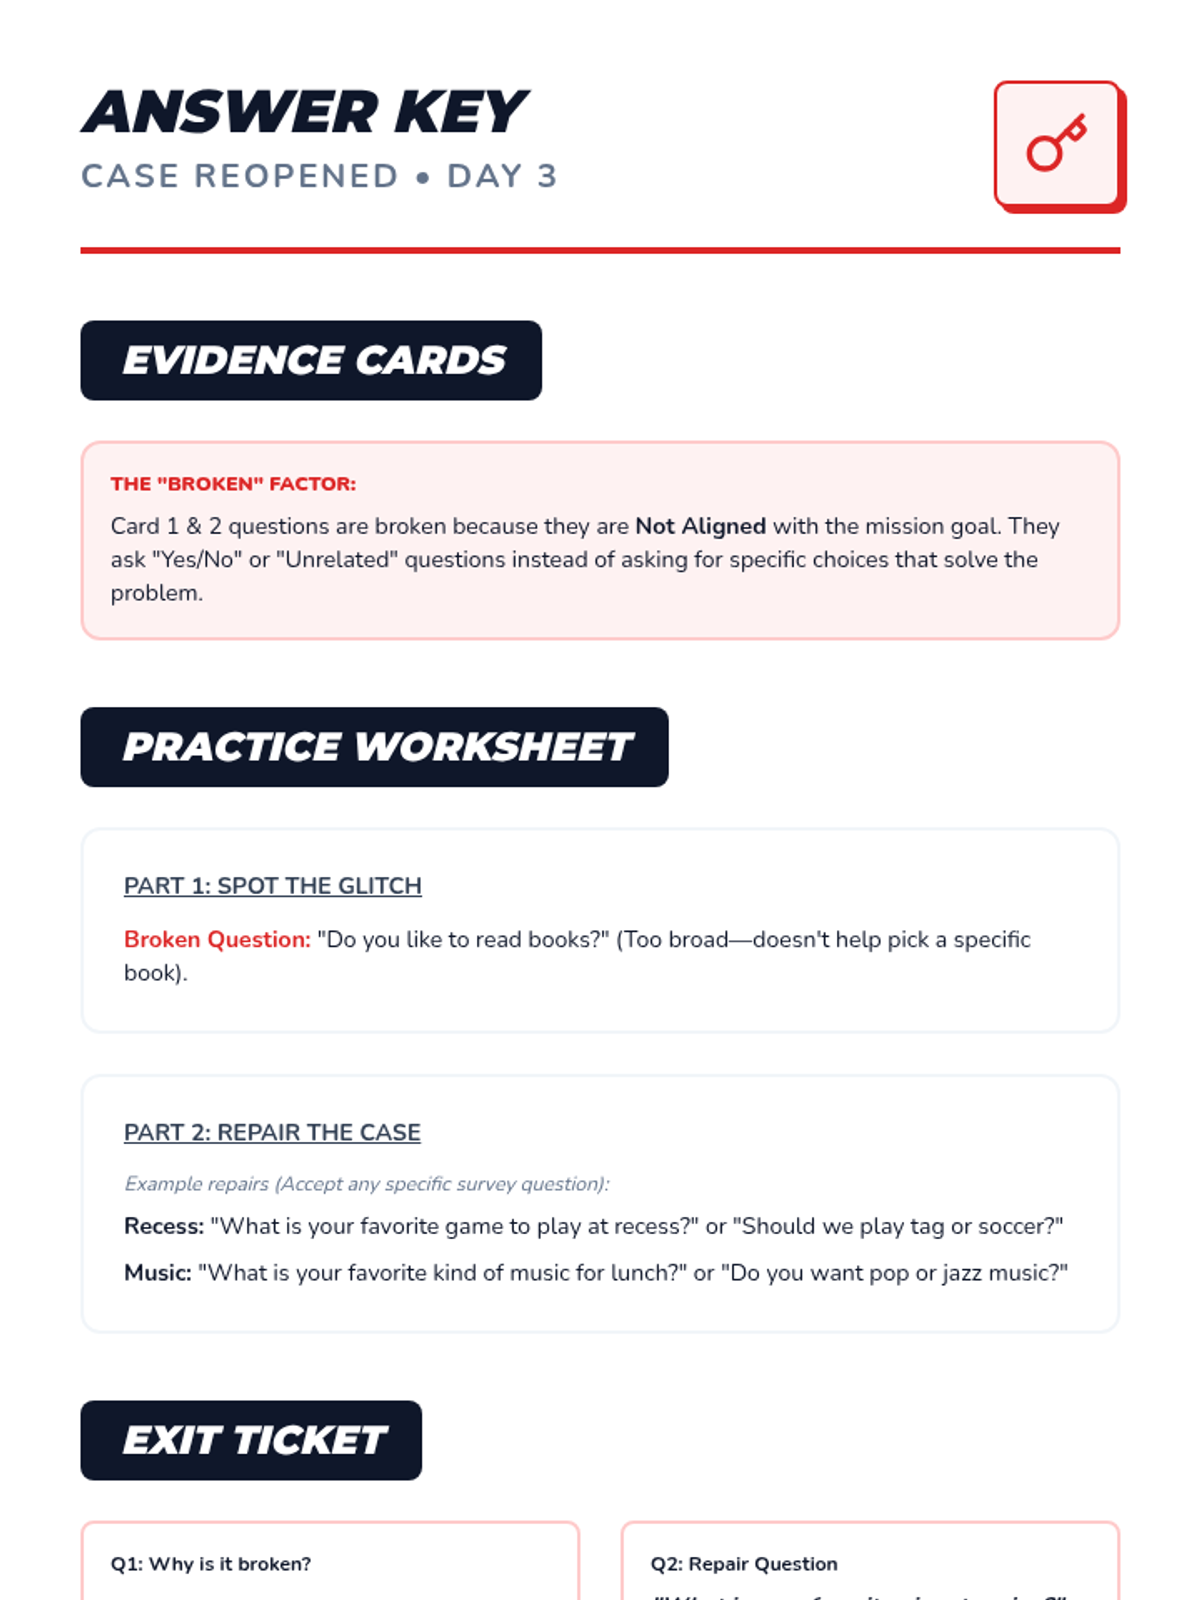
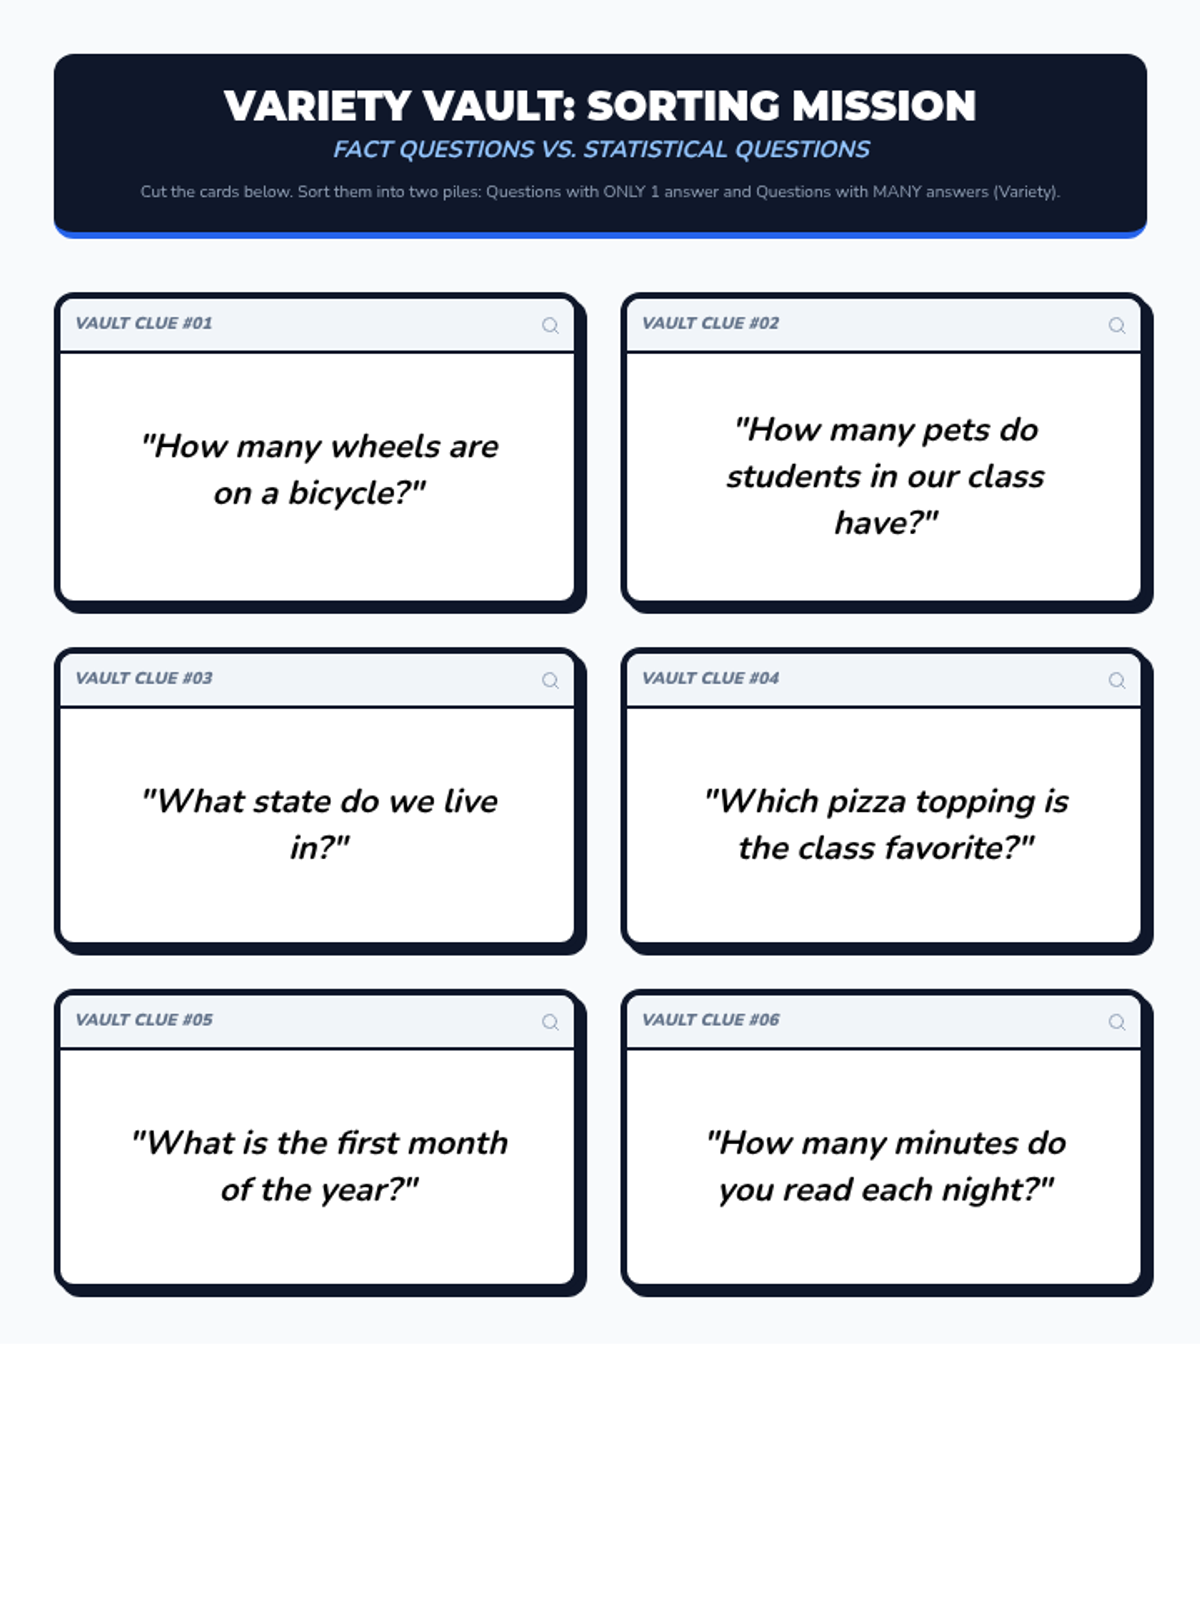
The final mission where students evaluate the effectiveness of data collection. They analyze "broken" surveys where the question didn't match the goal and practice rewriting them for accuracy.
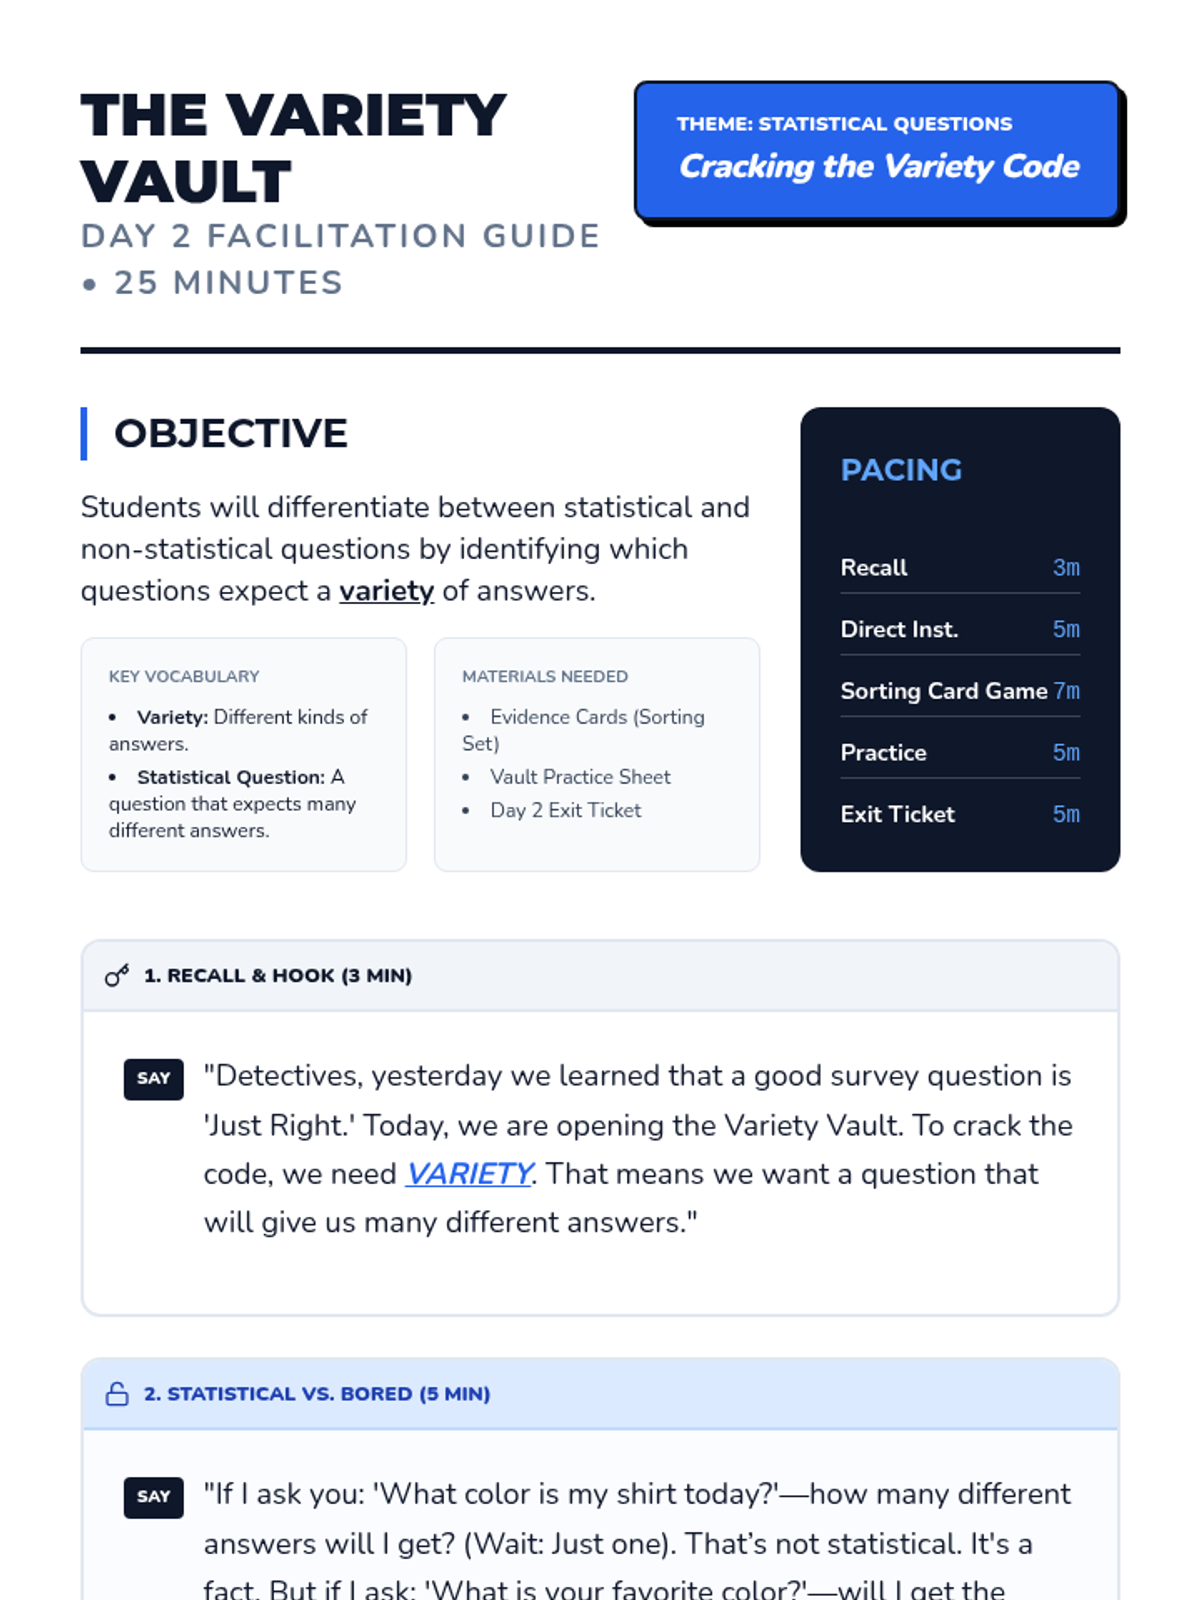
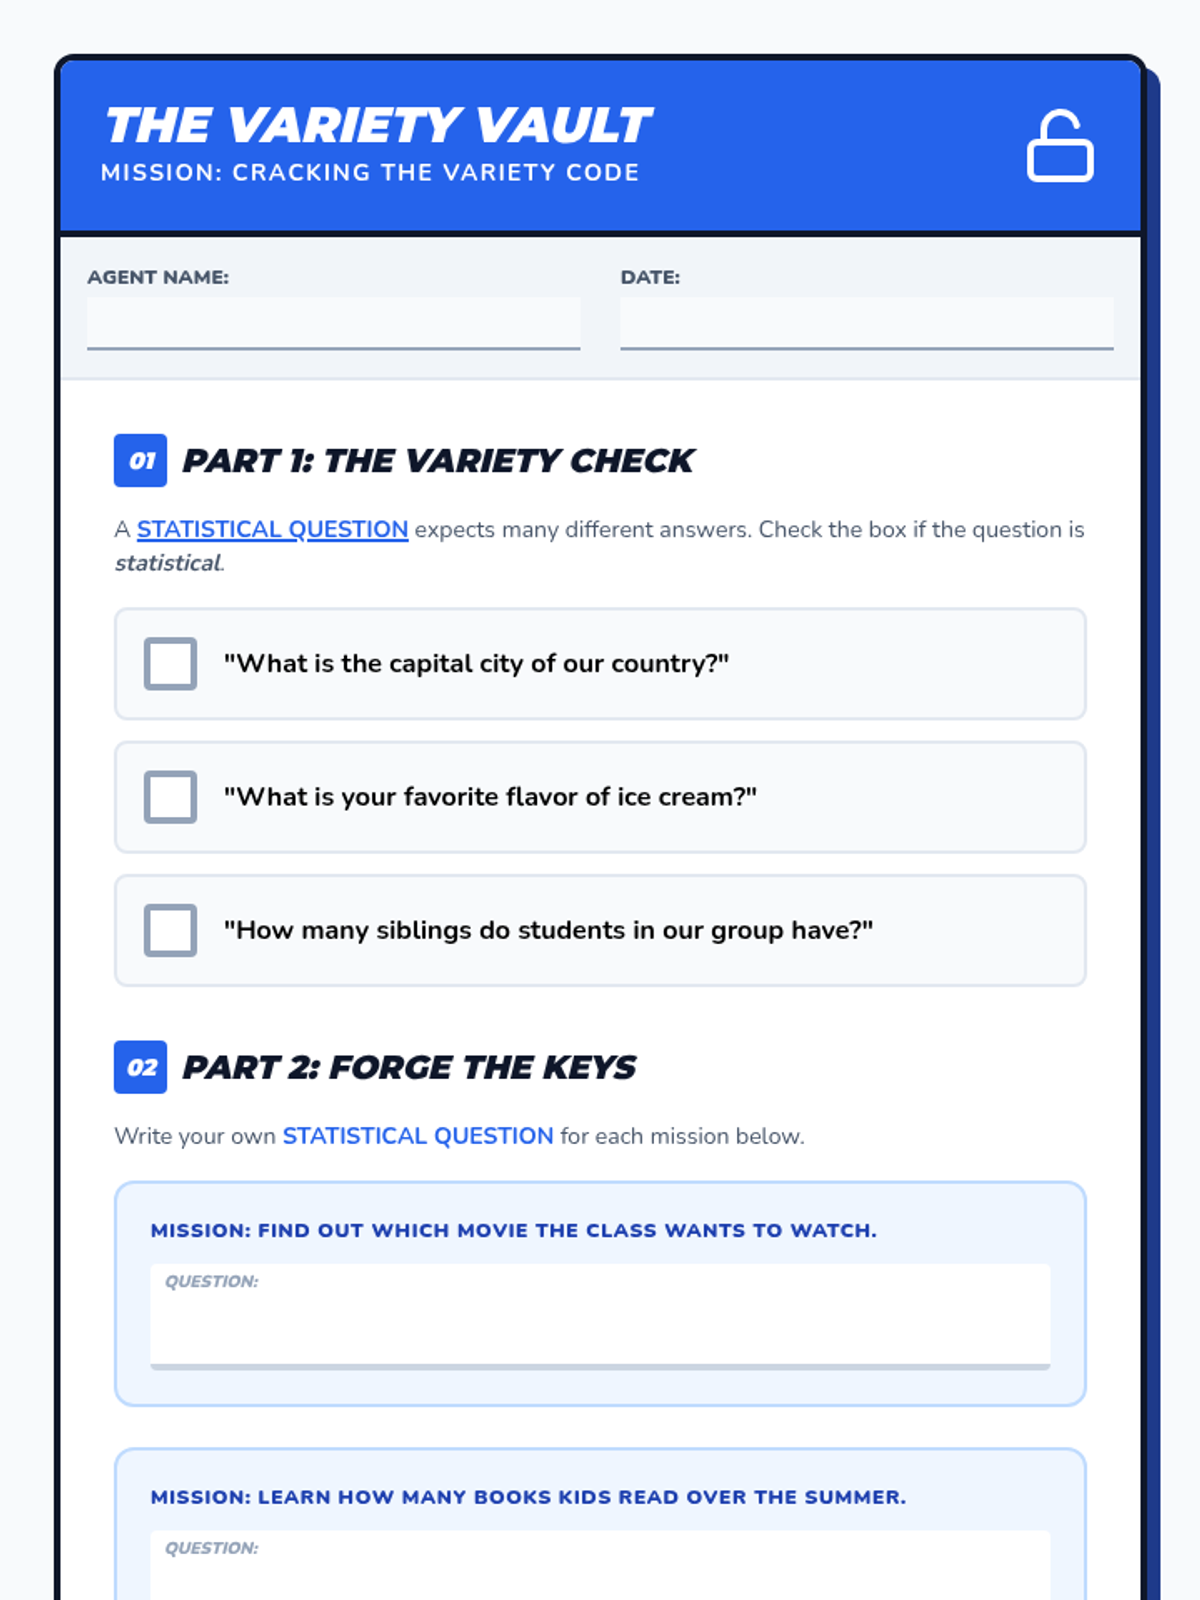
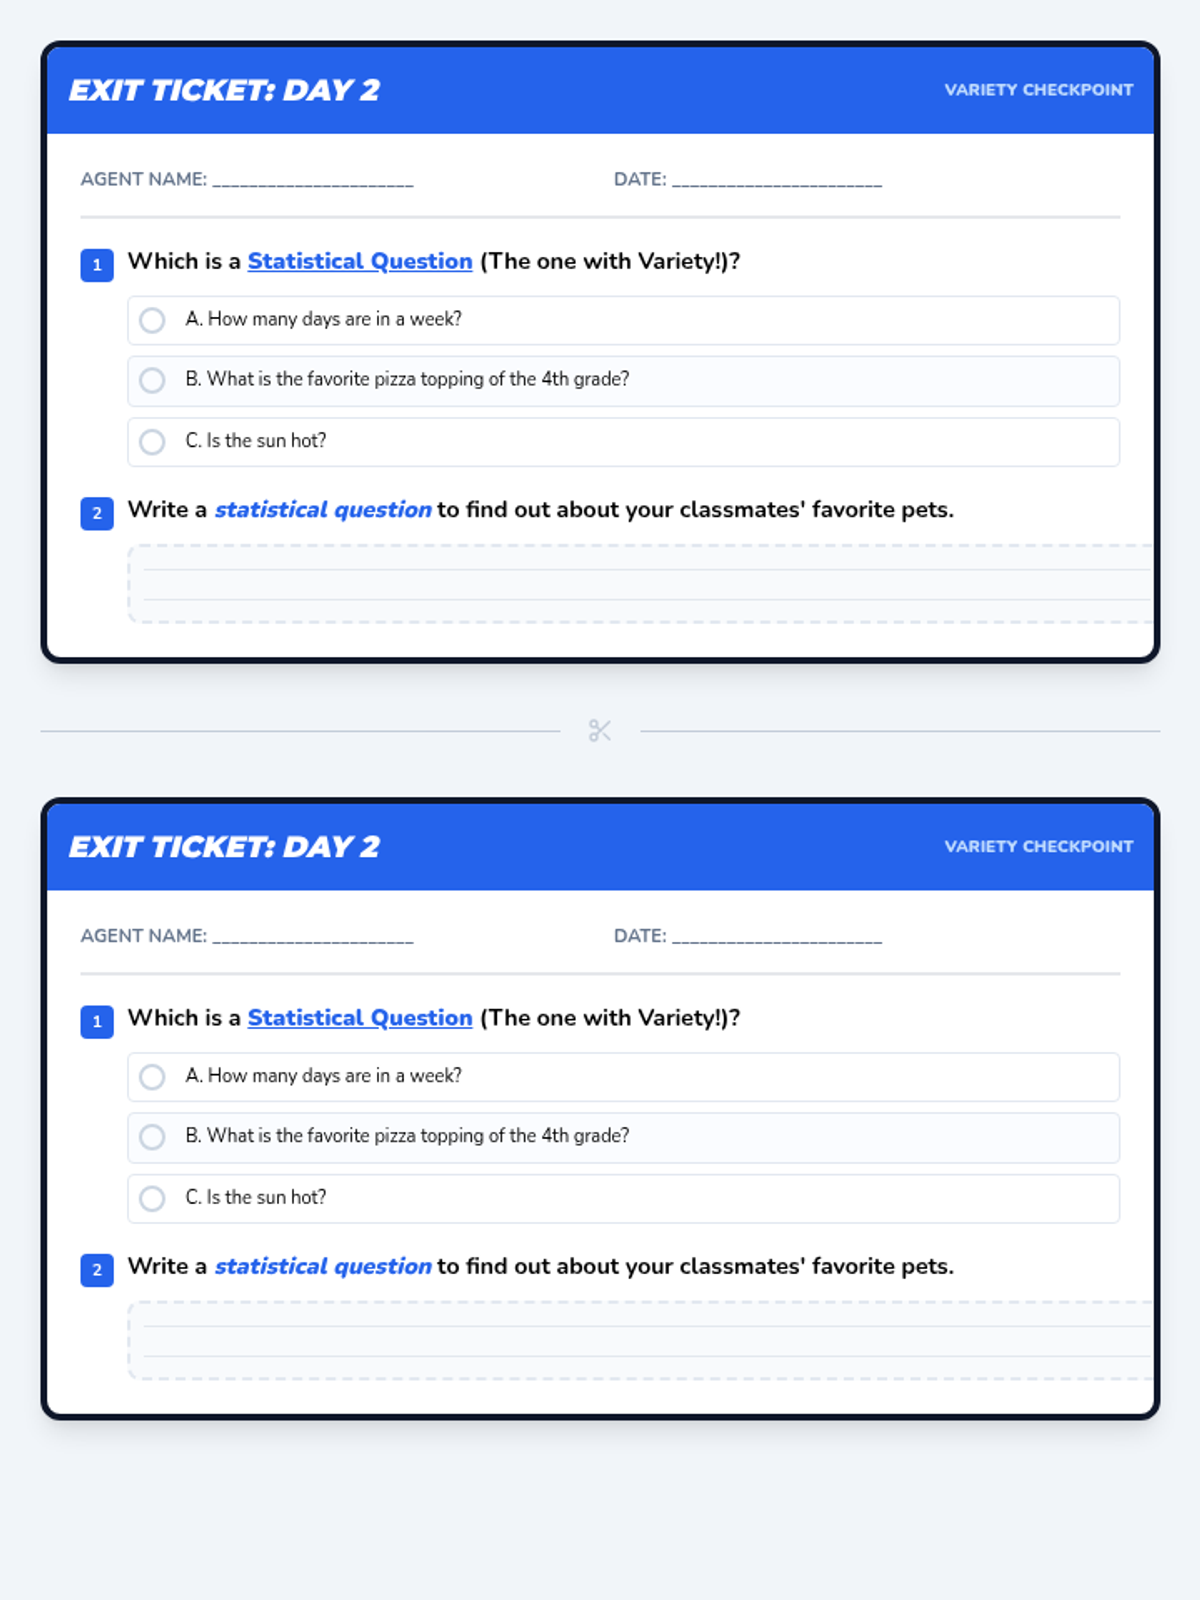
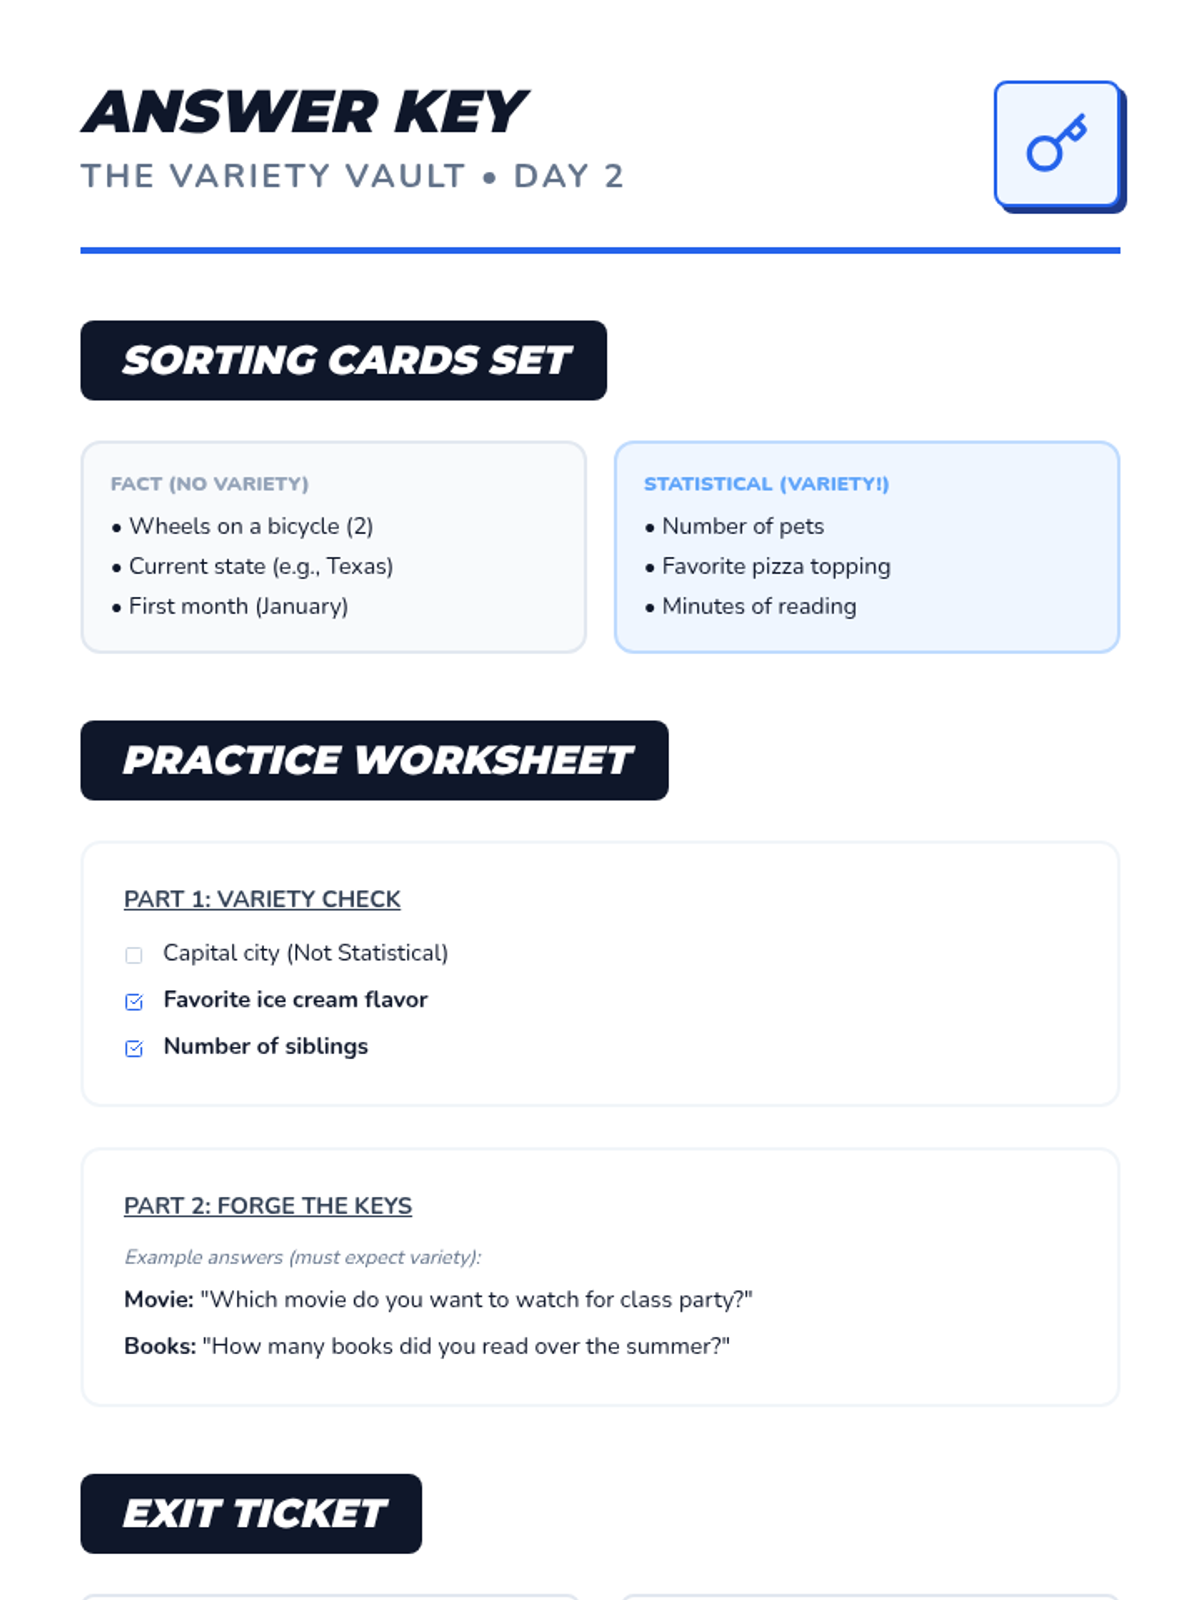
Focuses on differentiating between statistical and non-statistical questions. Students learn that a good survey question must expect a variety of answers to be useful for data collection.
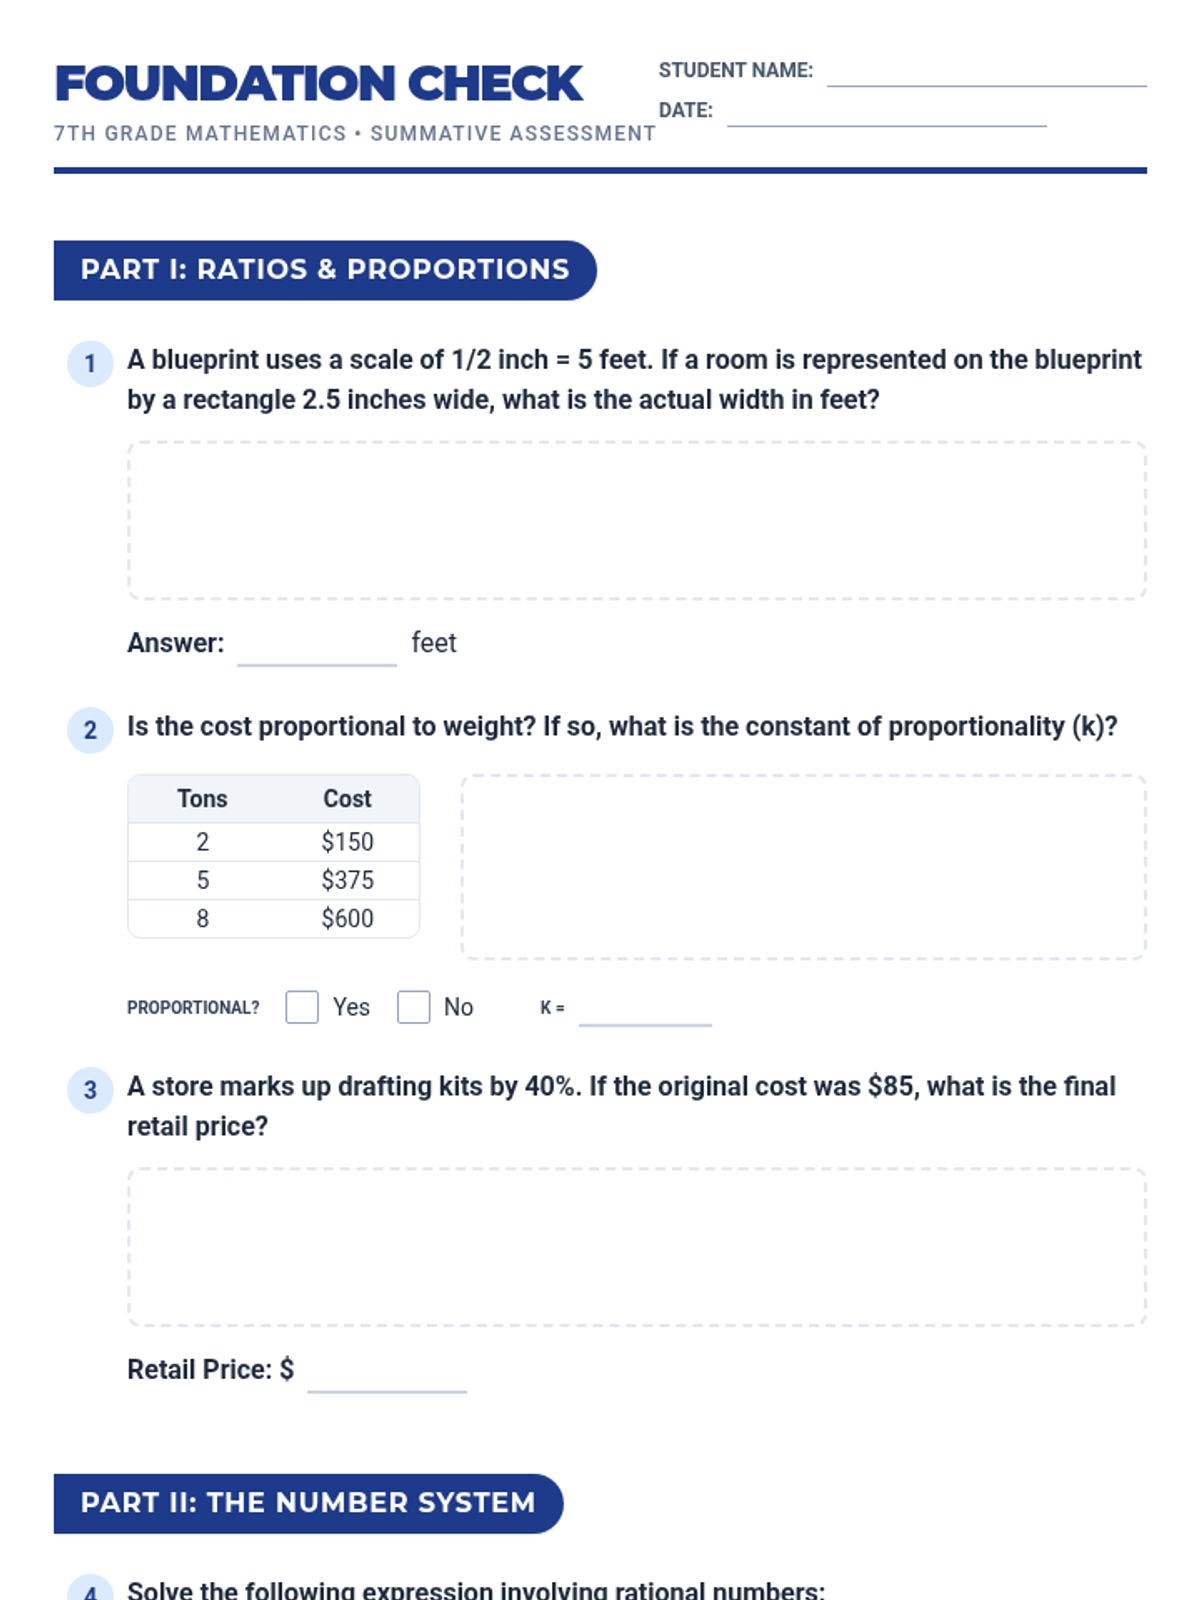
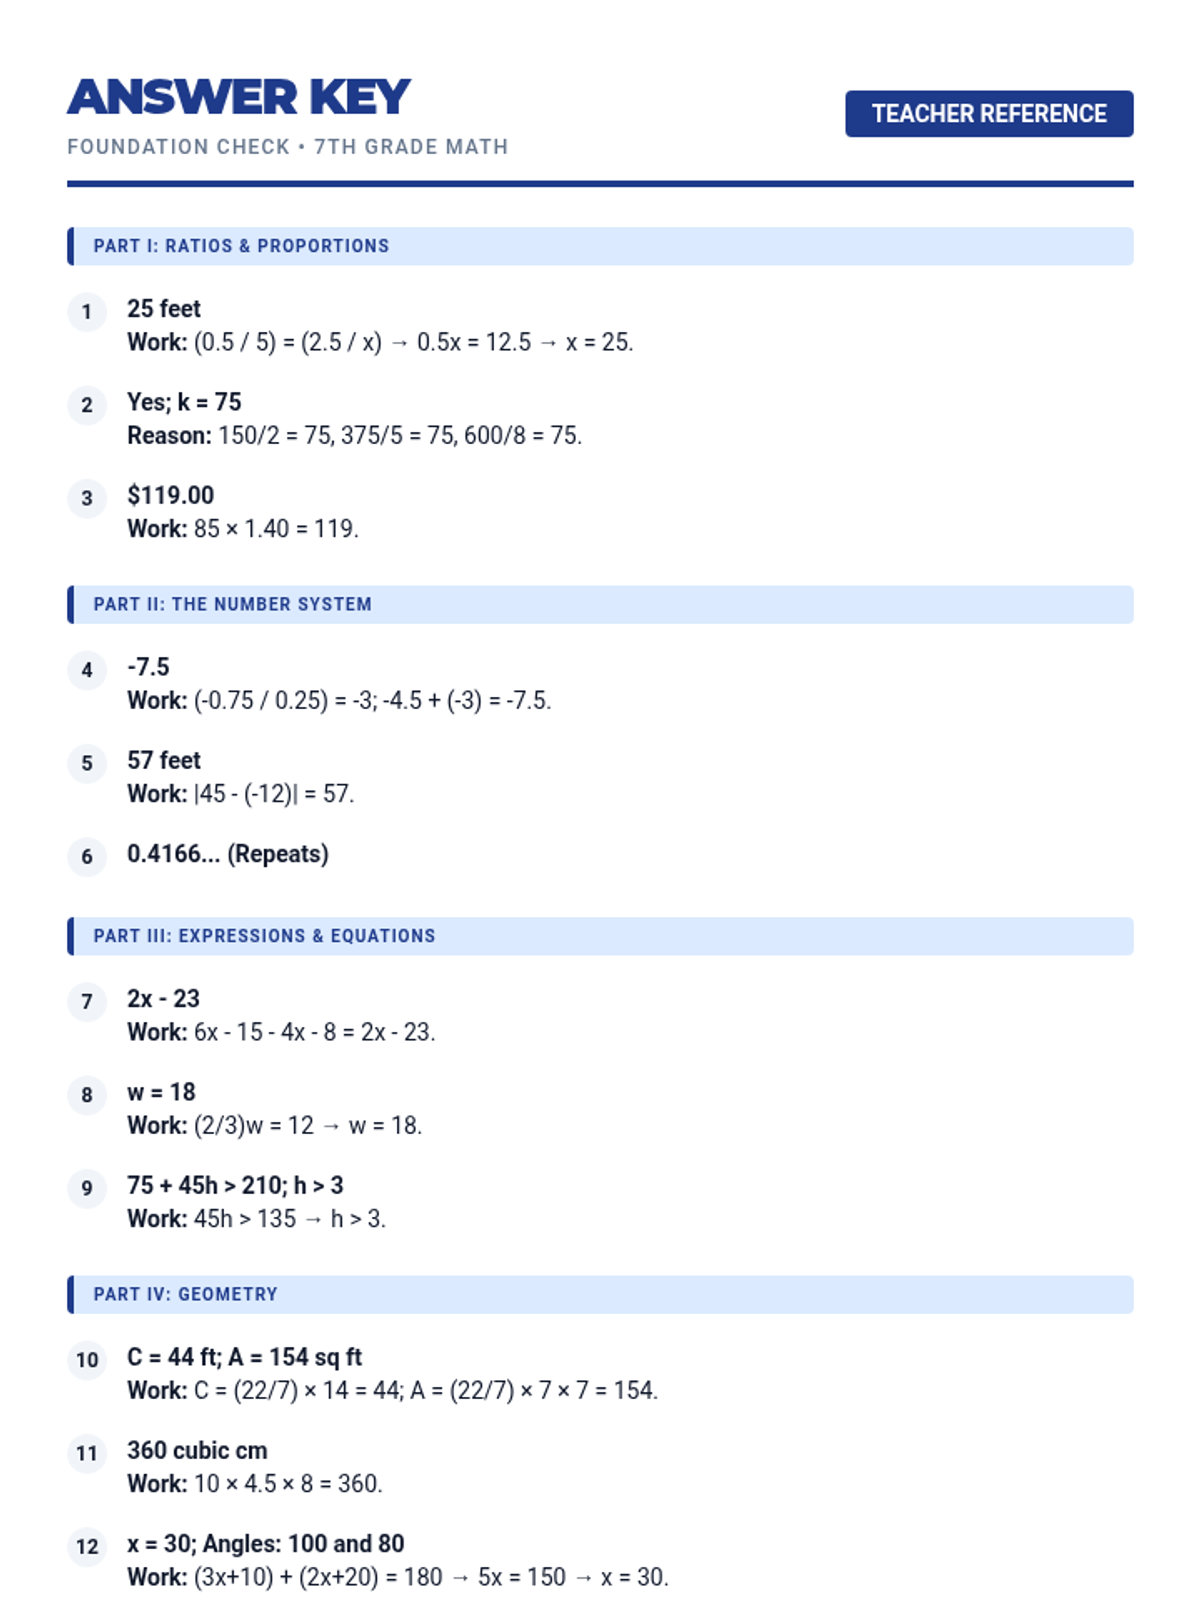
A comprehensive end-of-year assessment for 7th-grade math, covering ratios, the number system, expressions, geometry, and statistics. Includes a student test, a teacher answer key, and introductory review slides.
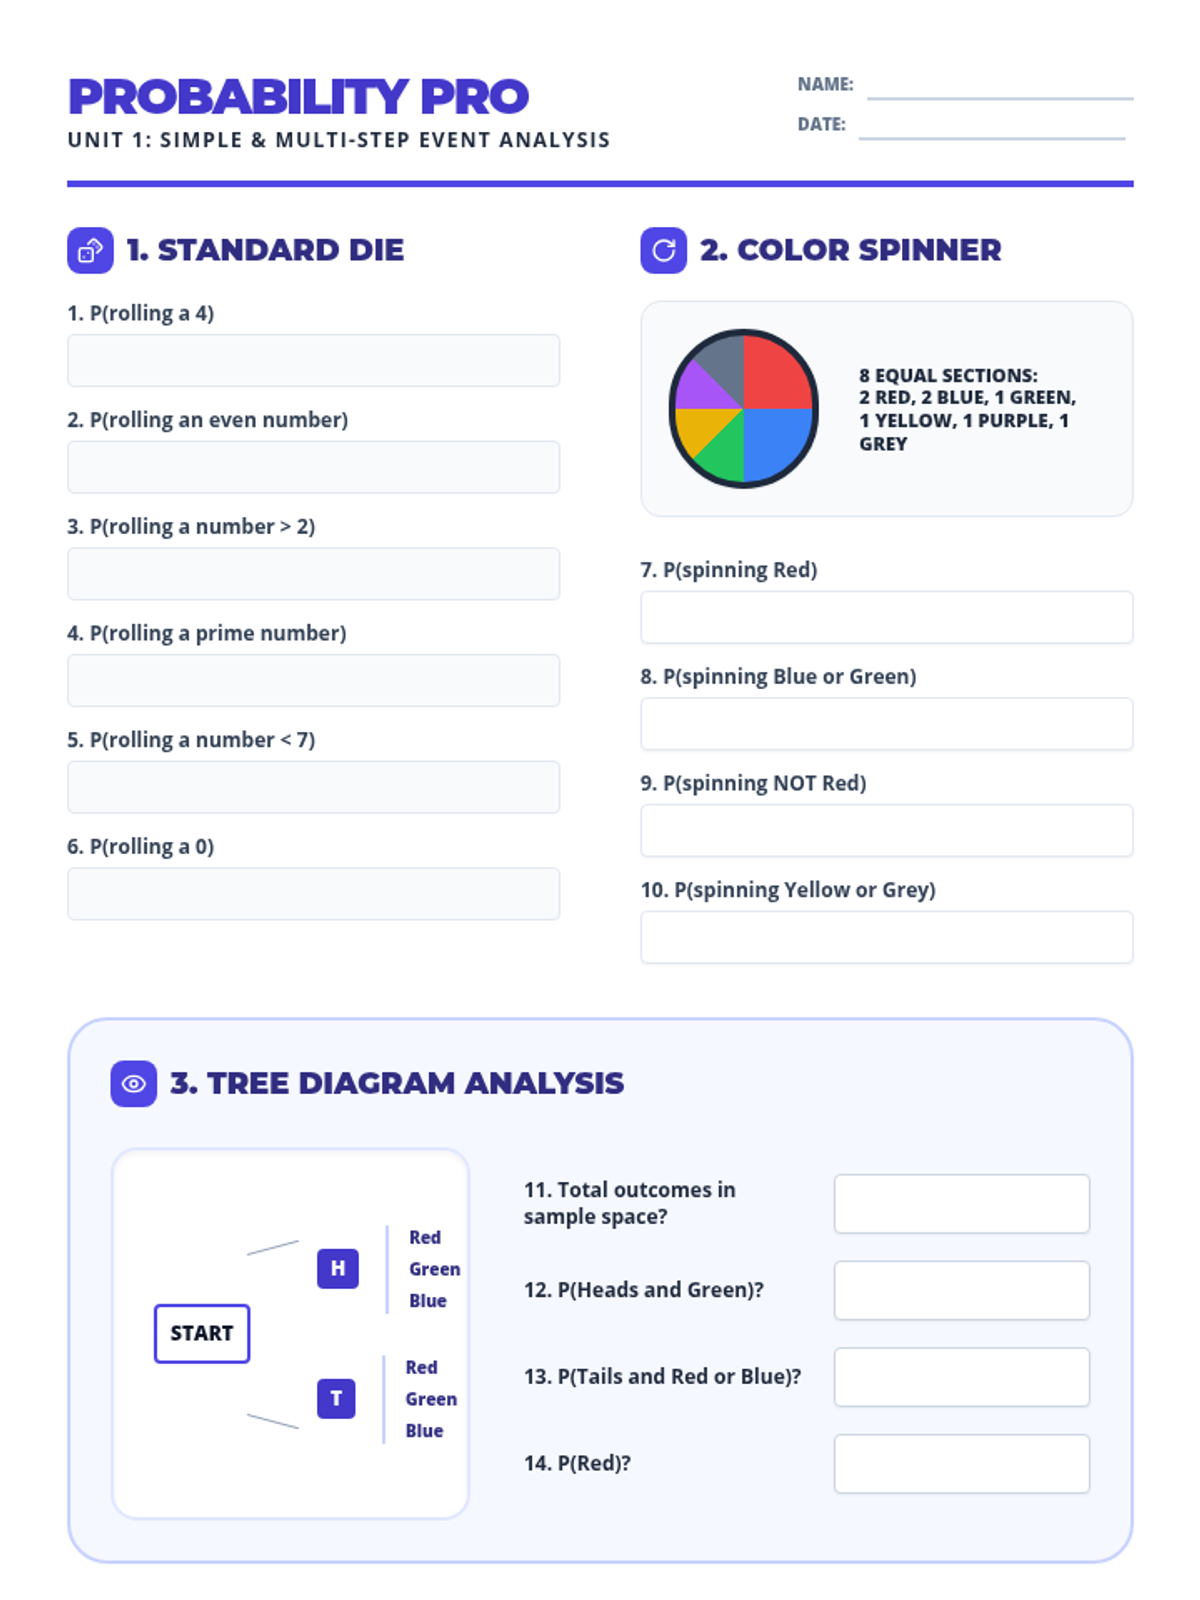
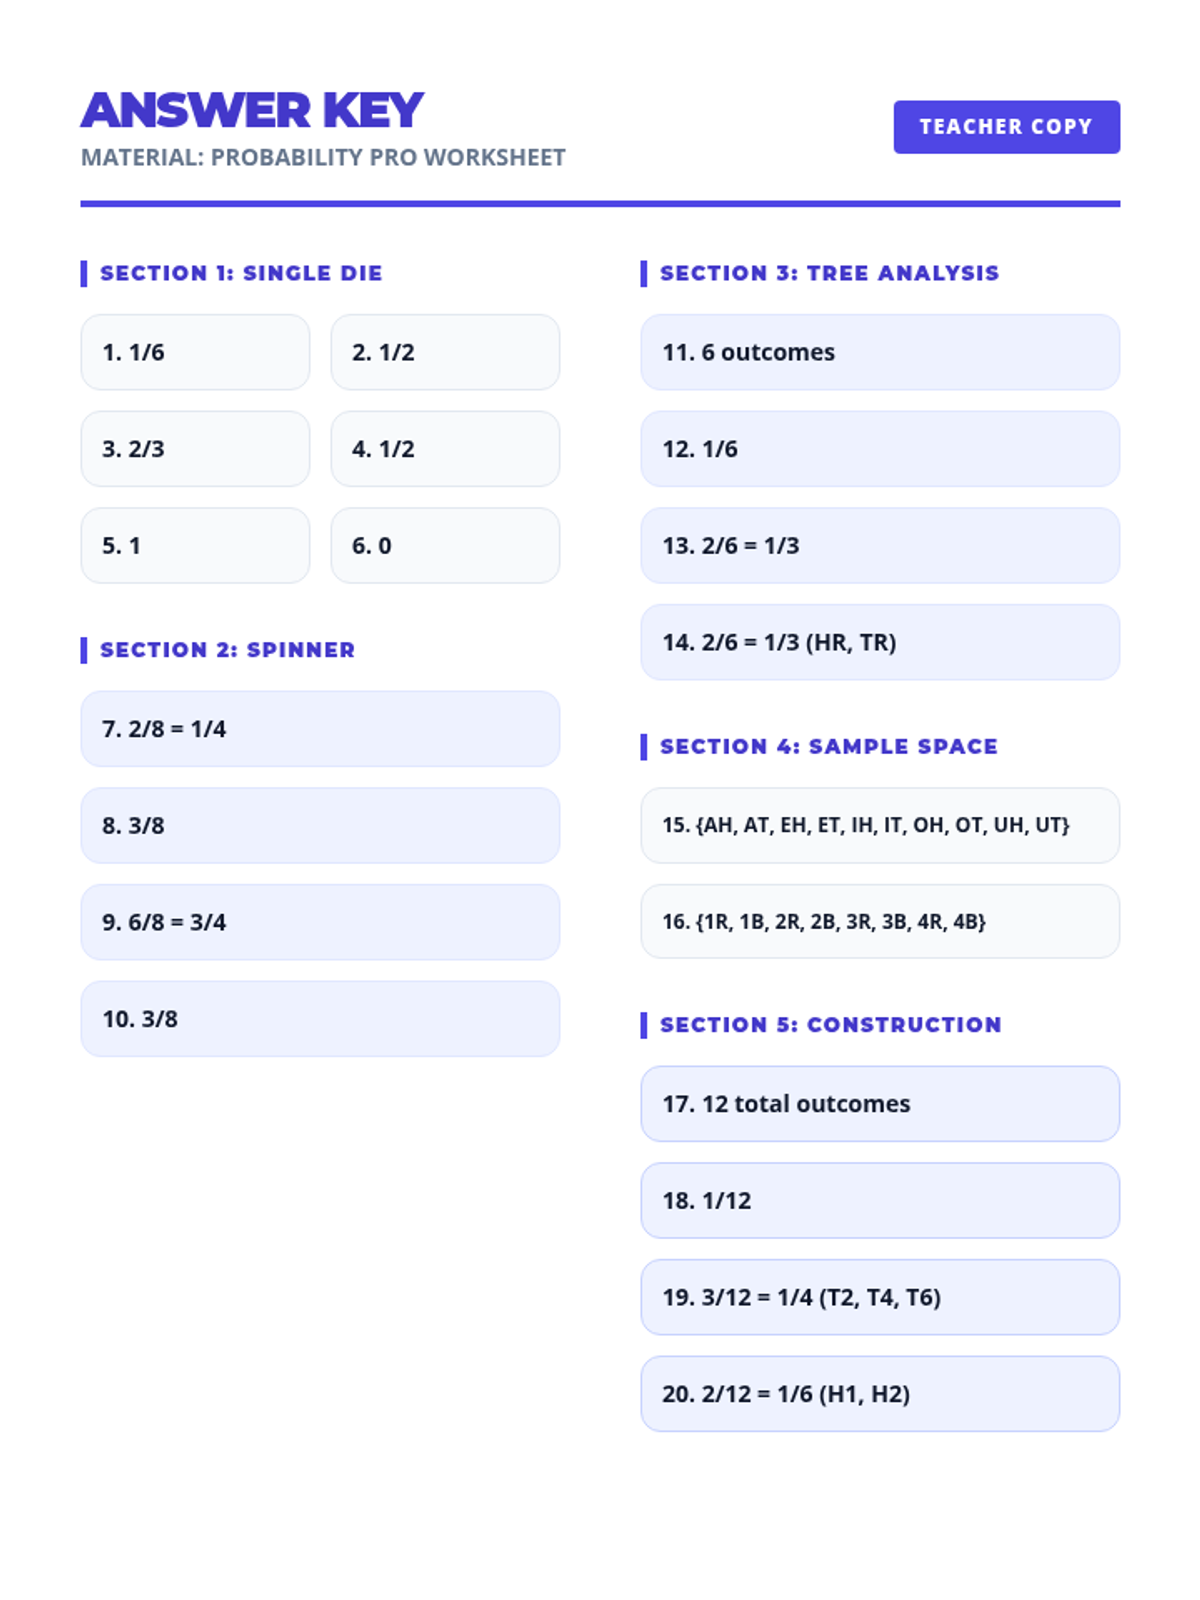
A comprehensive introduction to probability focusing on simple events, sample spaces, and the analysis and construction of tree diagrams for multi-step events.
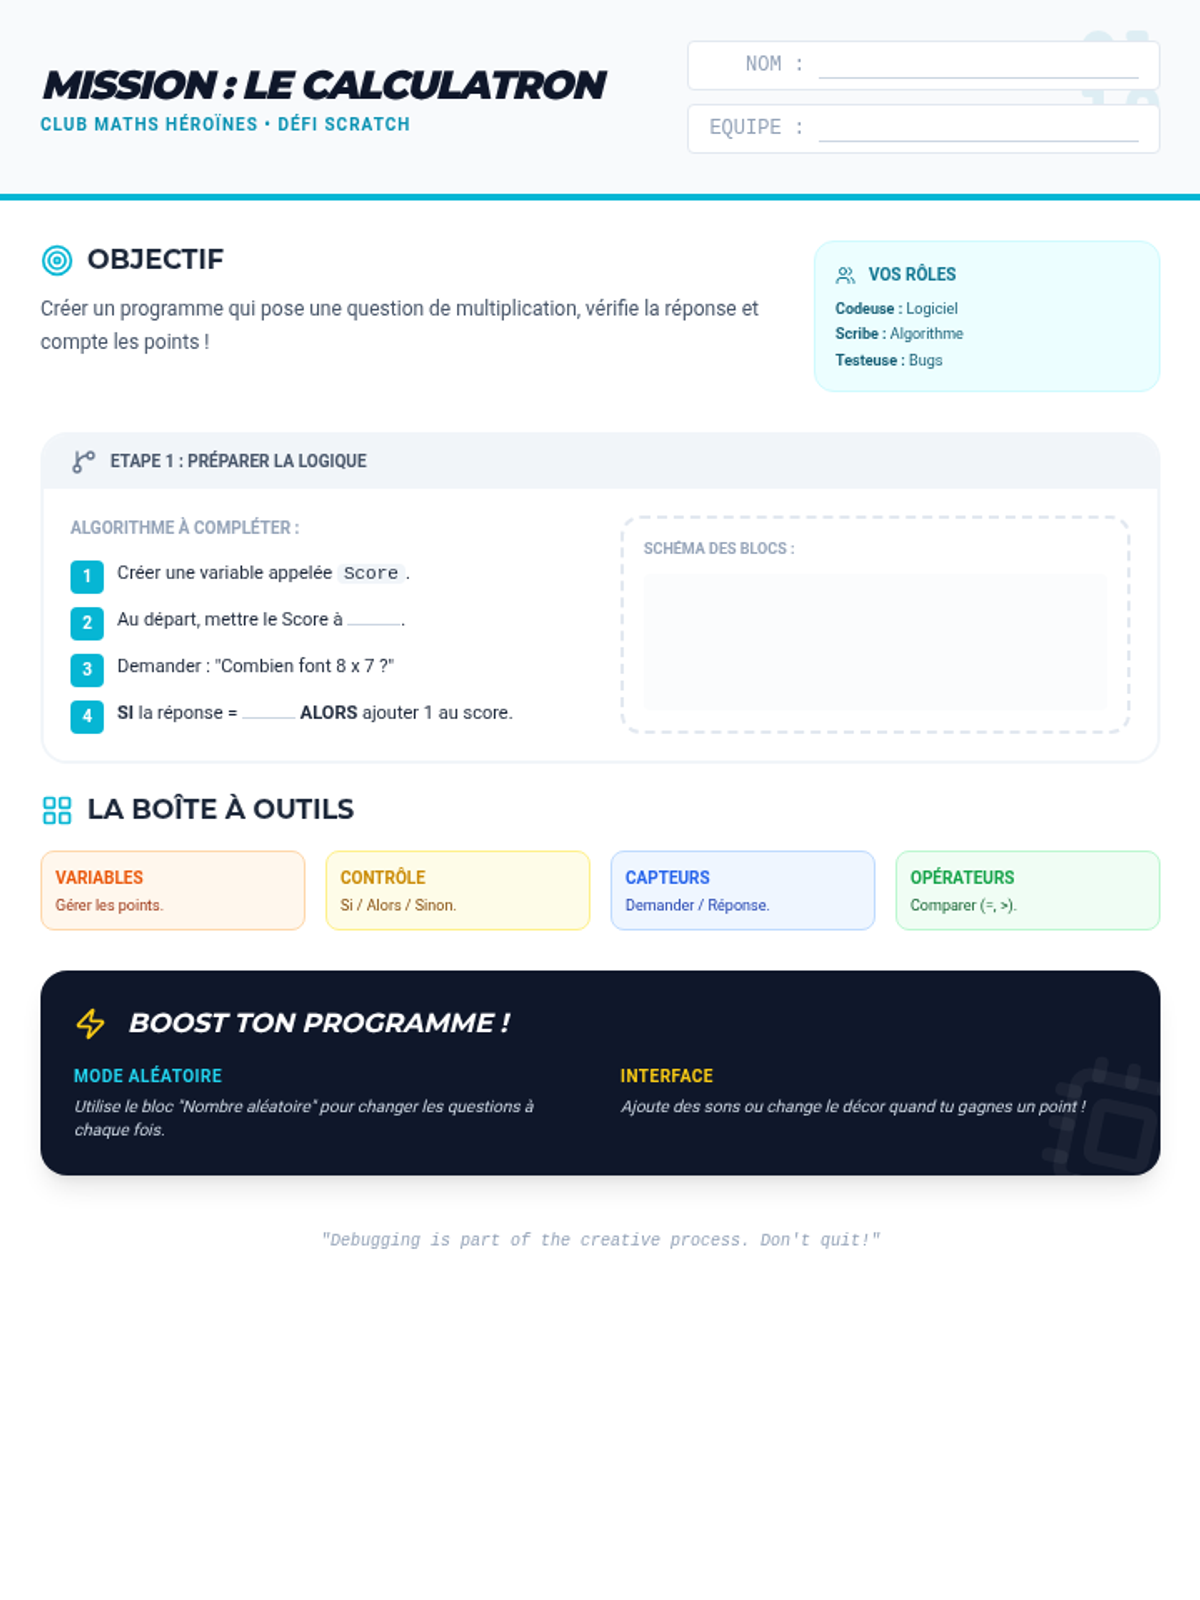
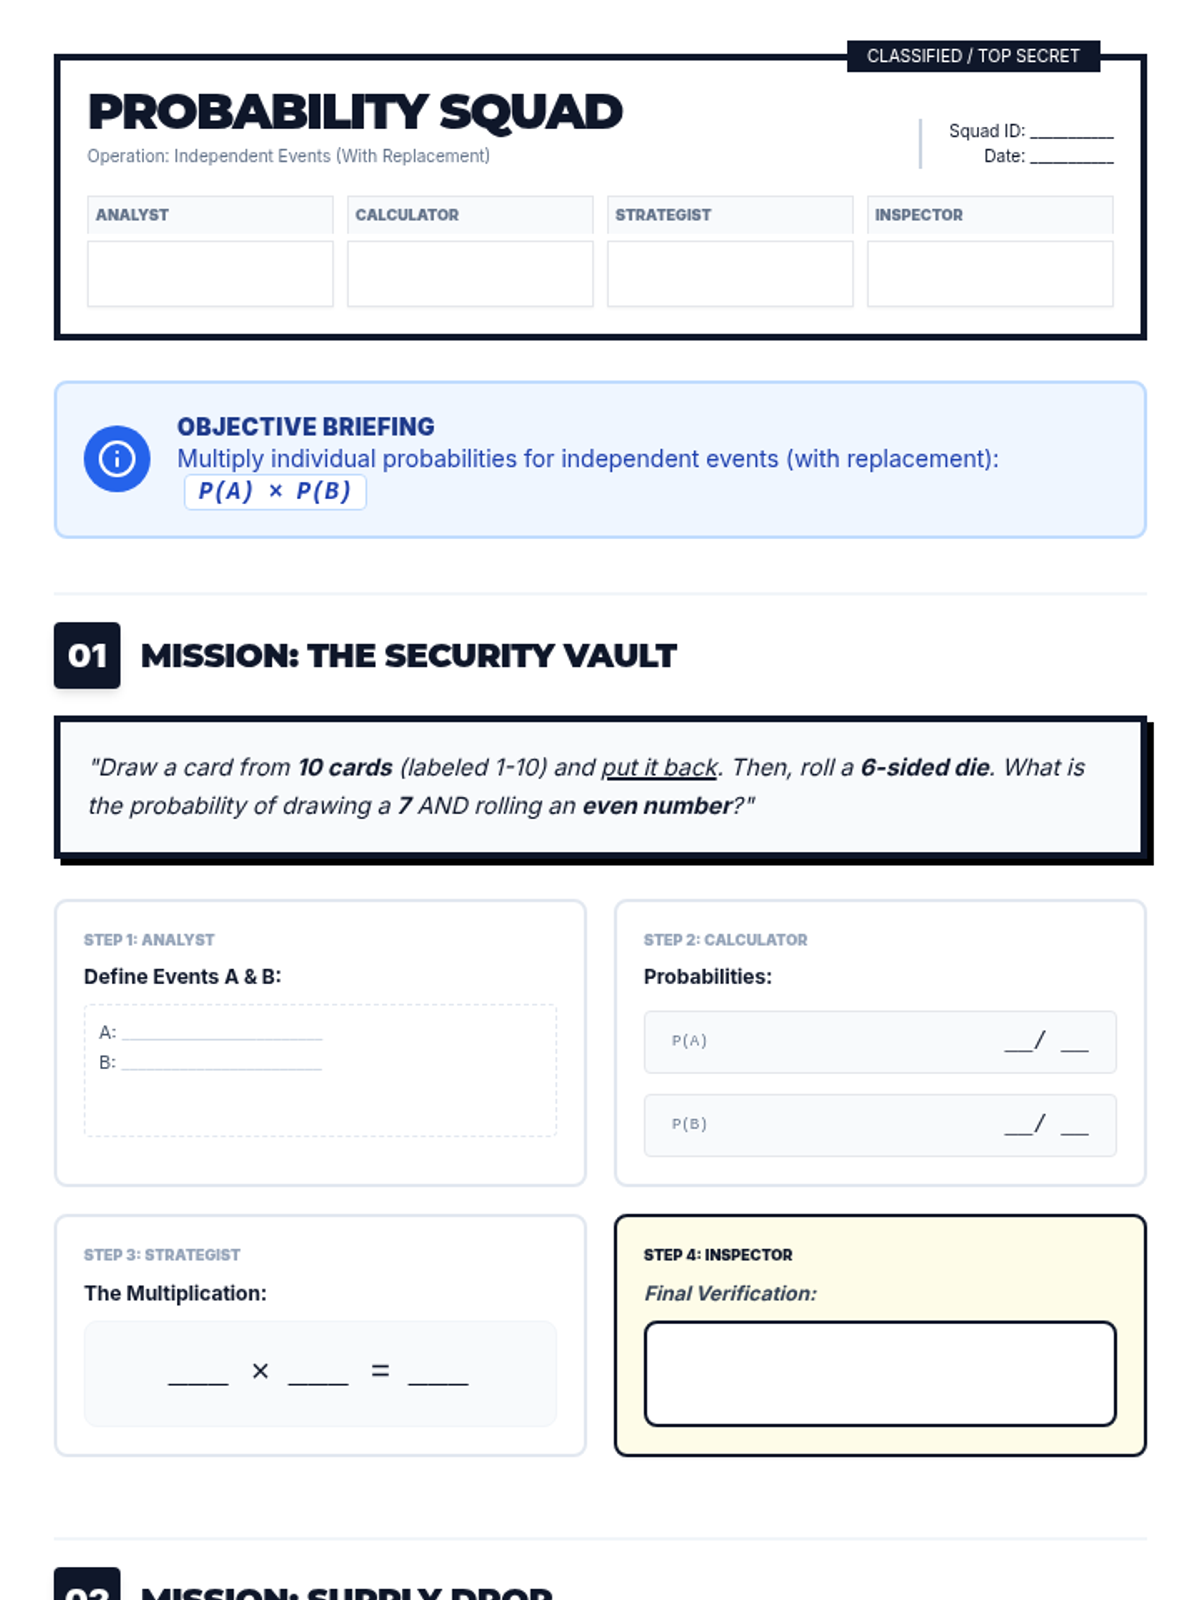
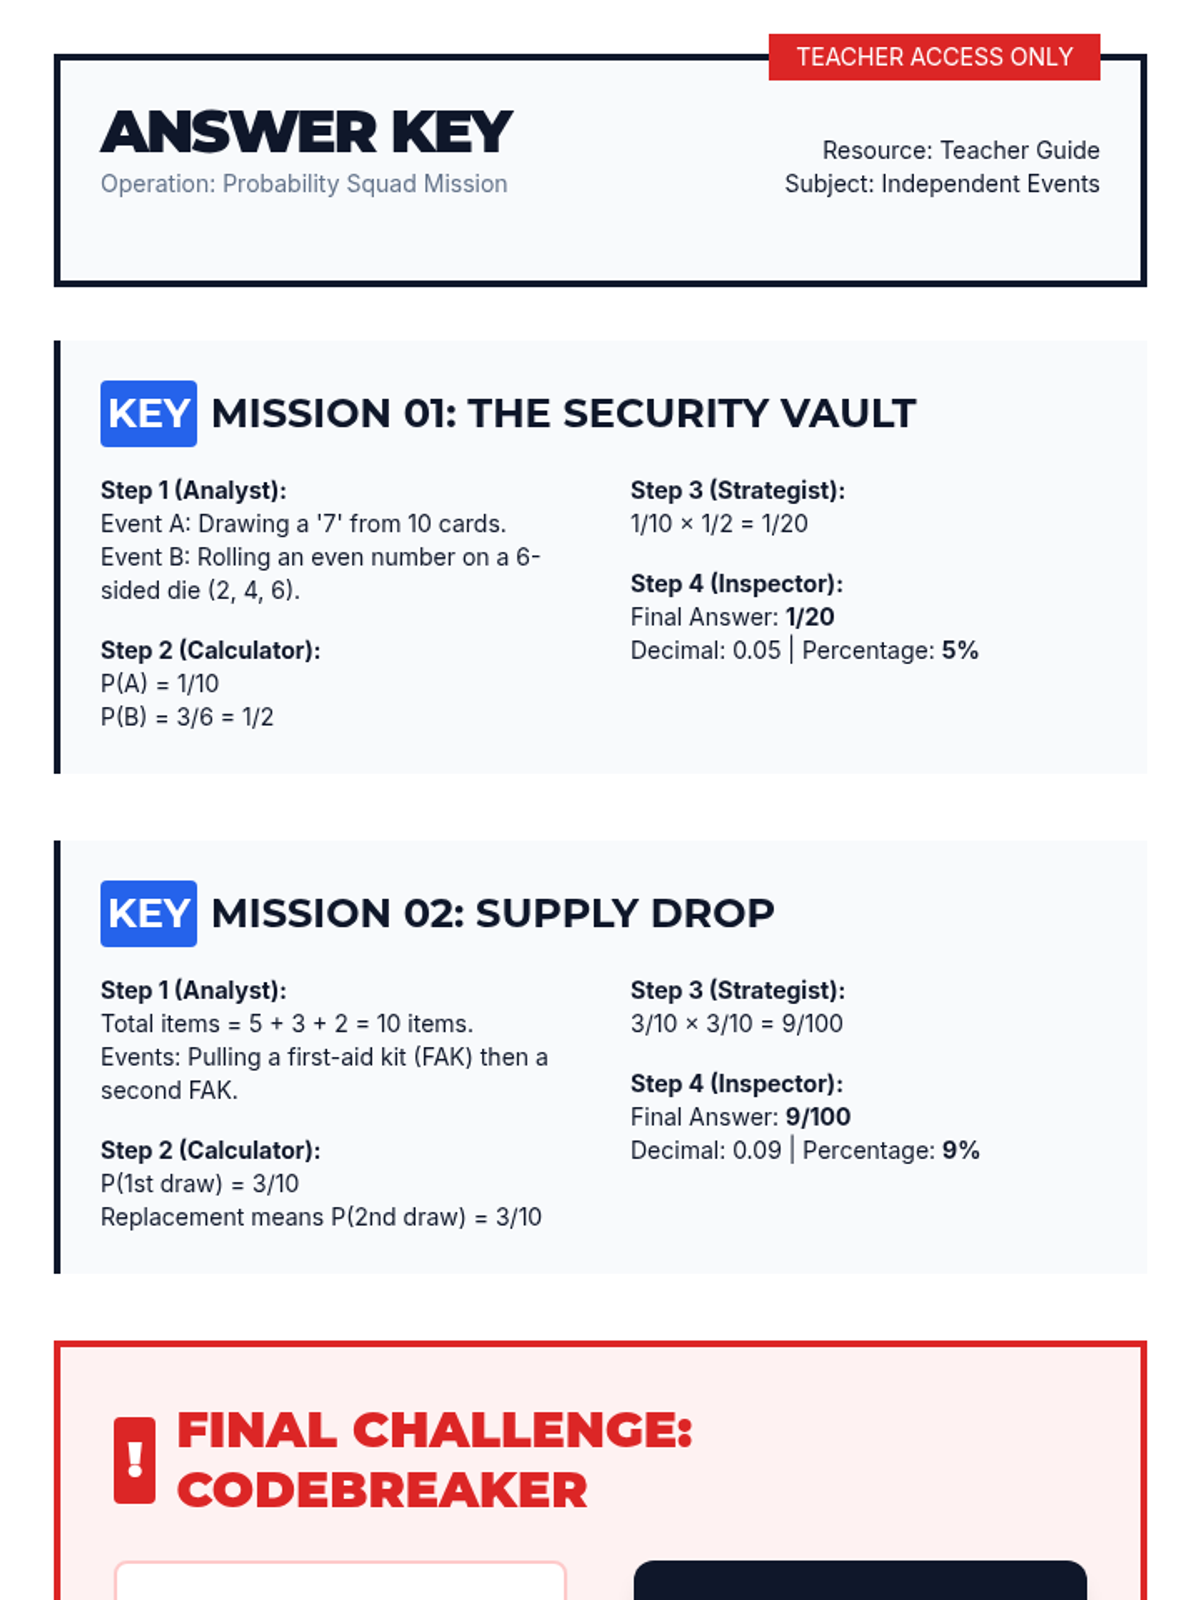
A collaborative lesson where students work in specialized roles to master compound probability of independent events with replacement through step-by-step mission scenarios.
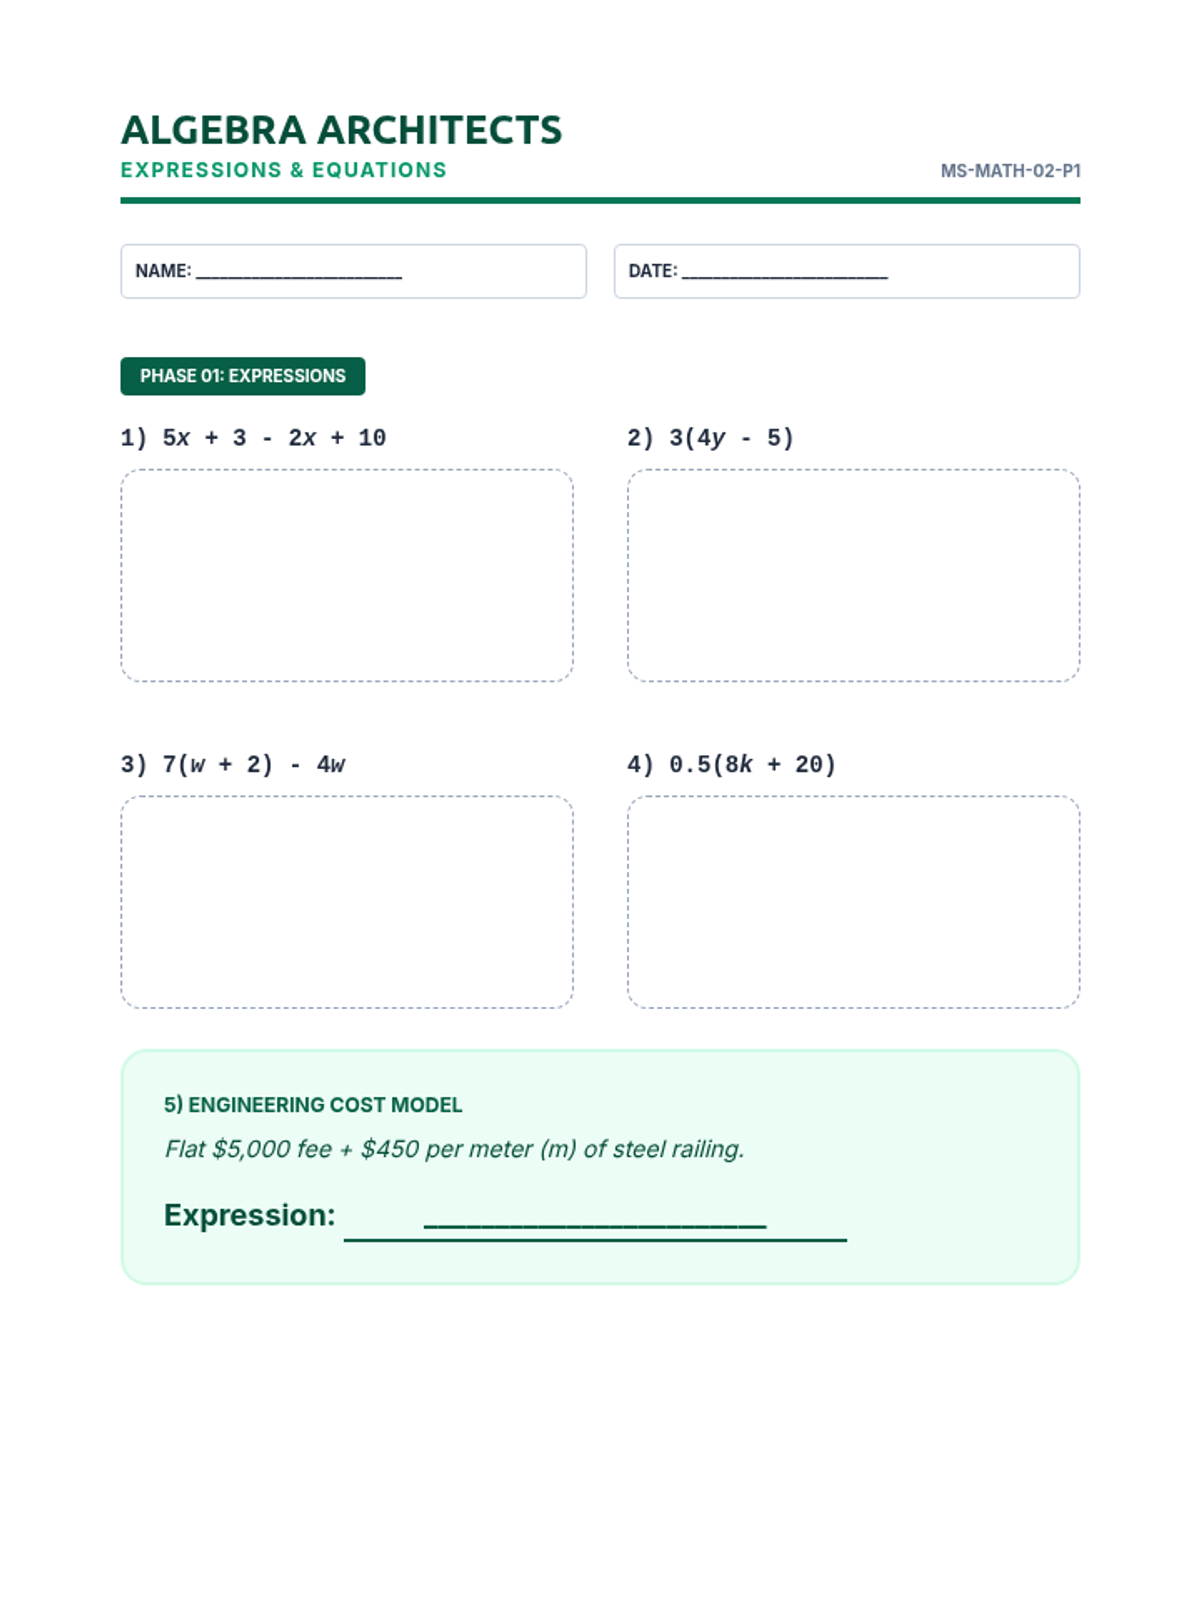
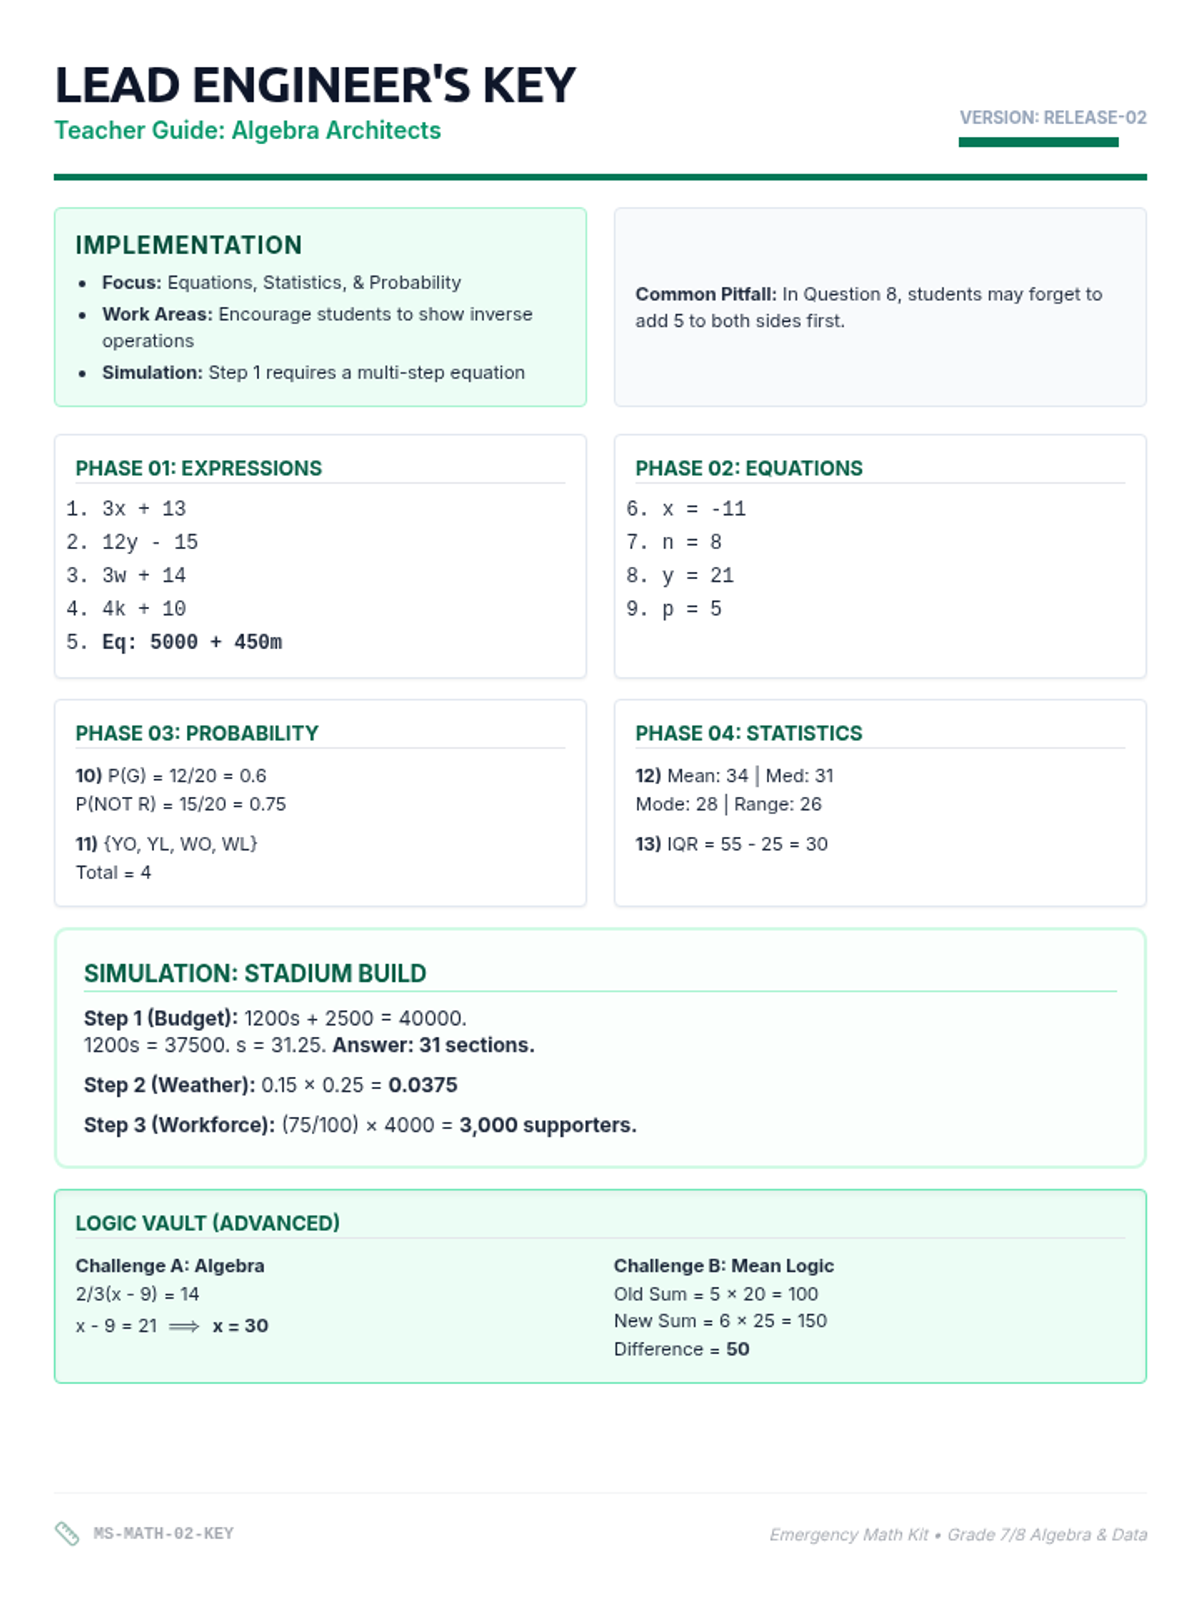
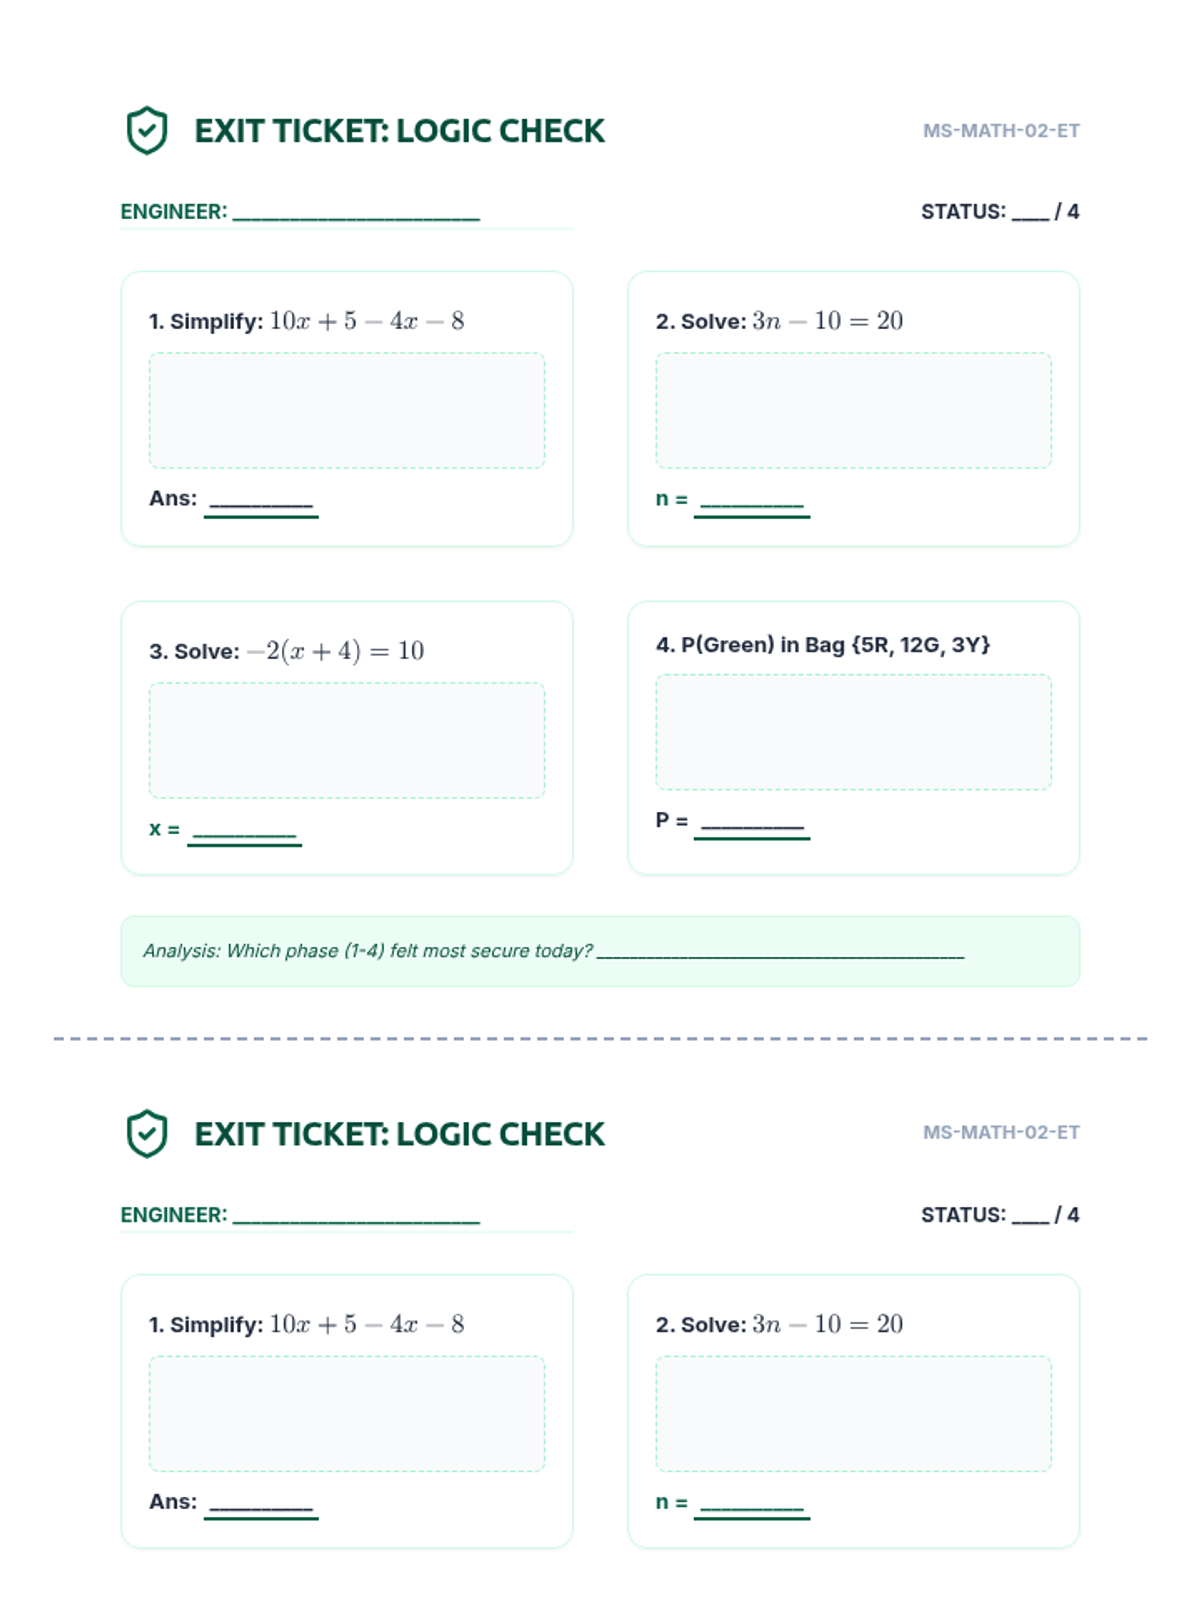
A 90-minute substitute-ready packet covering linear expressions, one- and two-step equations, probability, and statistics. Students act as "logic engineers" to solve real-world modeling problems and analyze data sets.
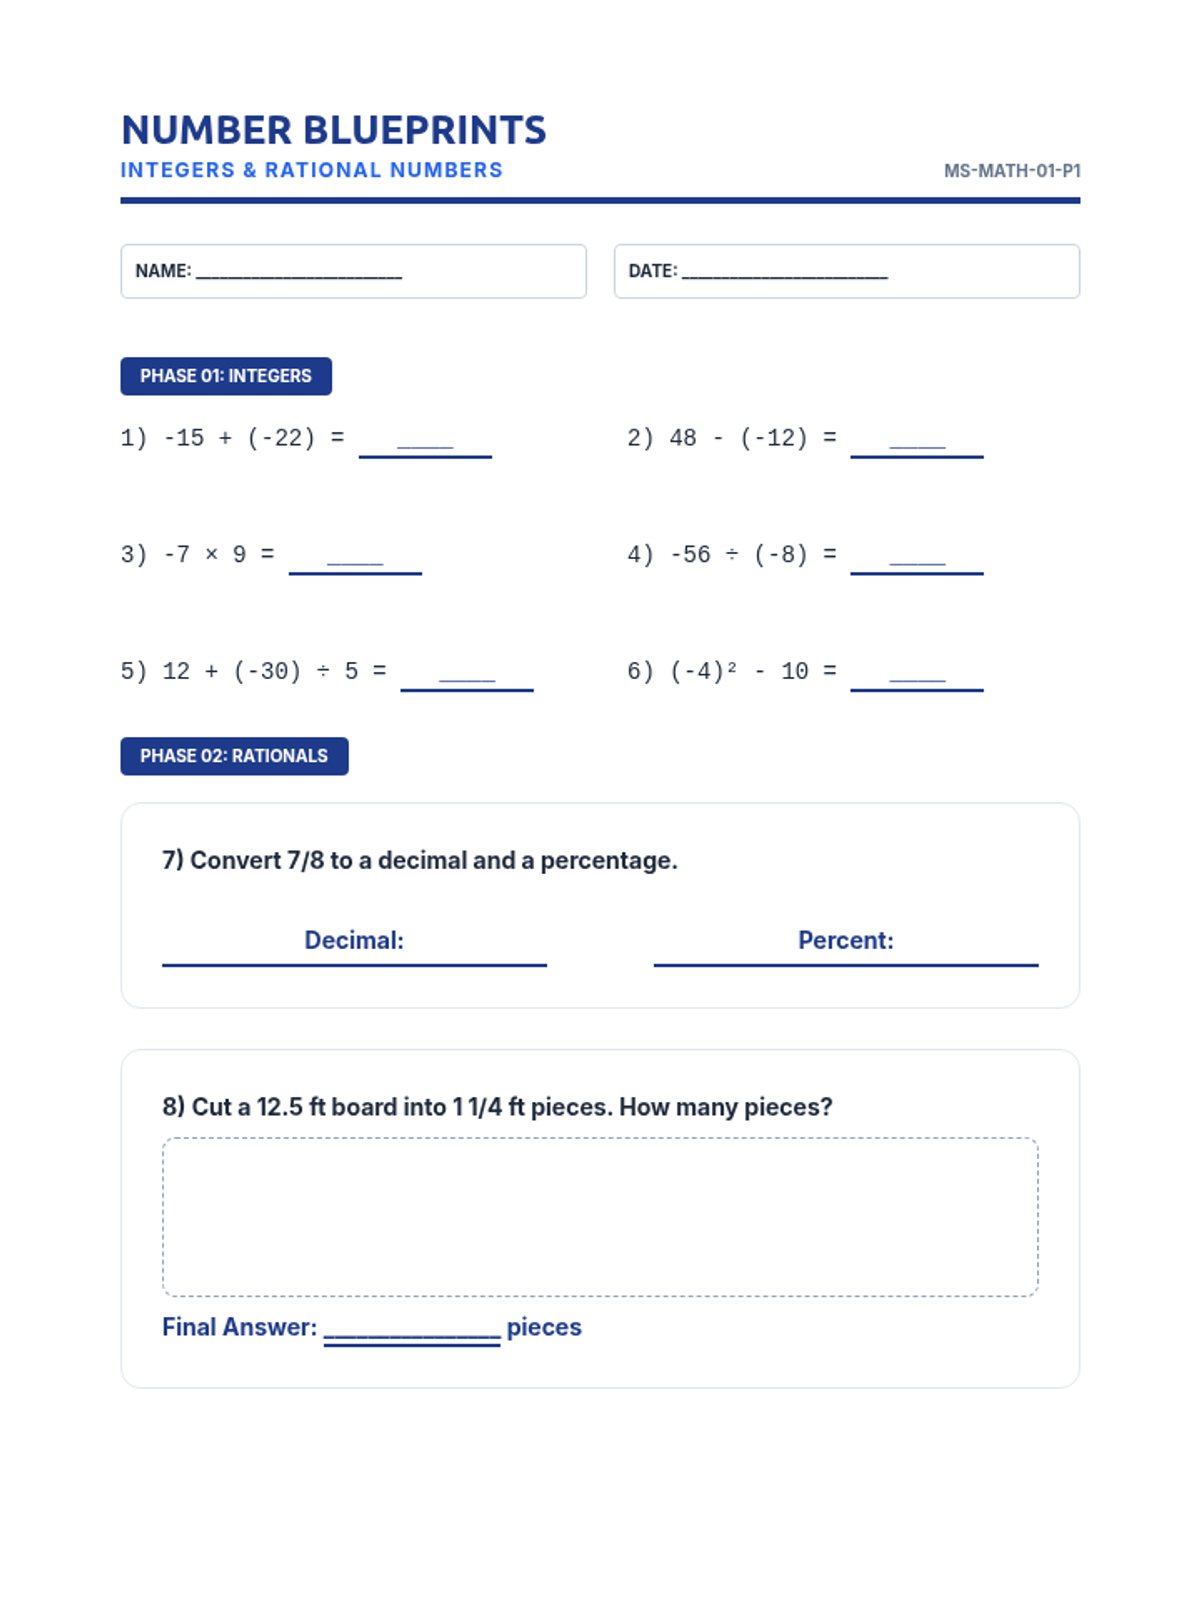
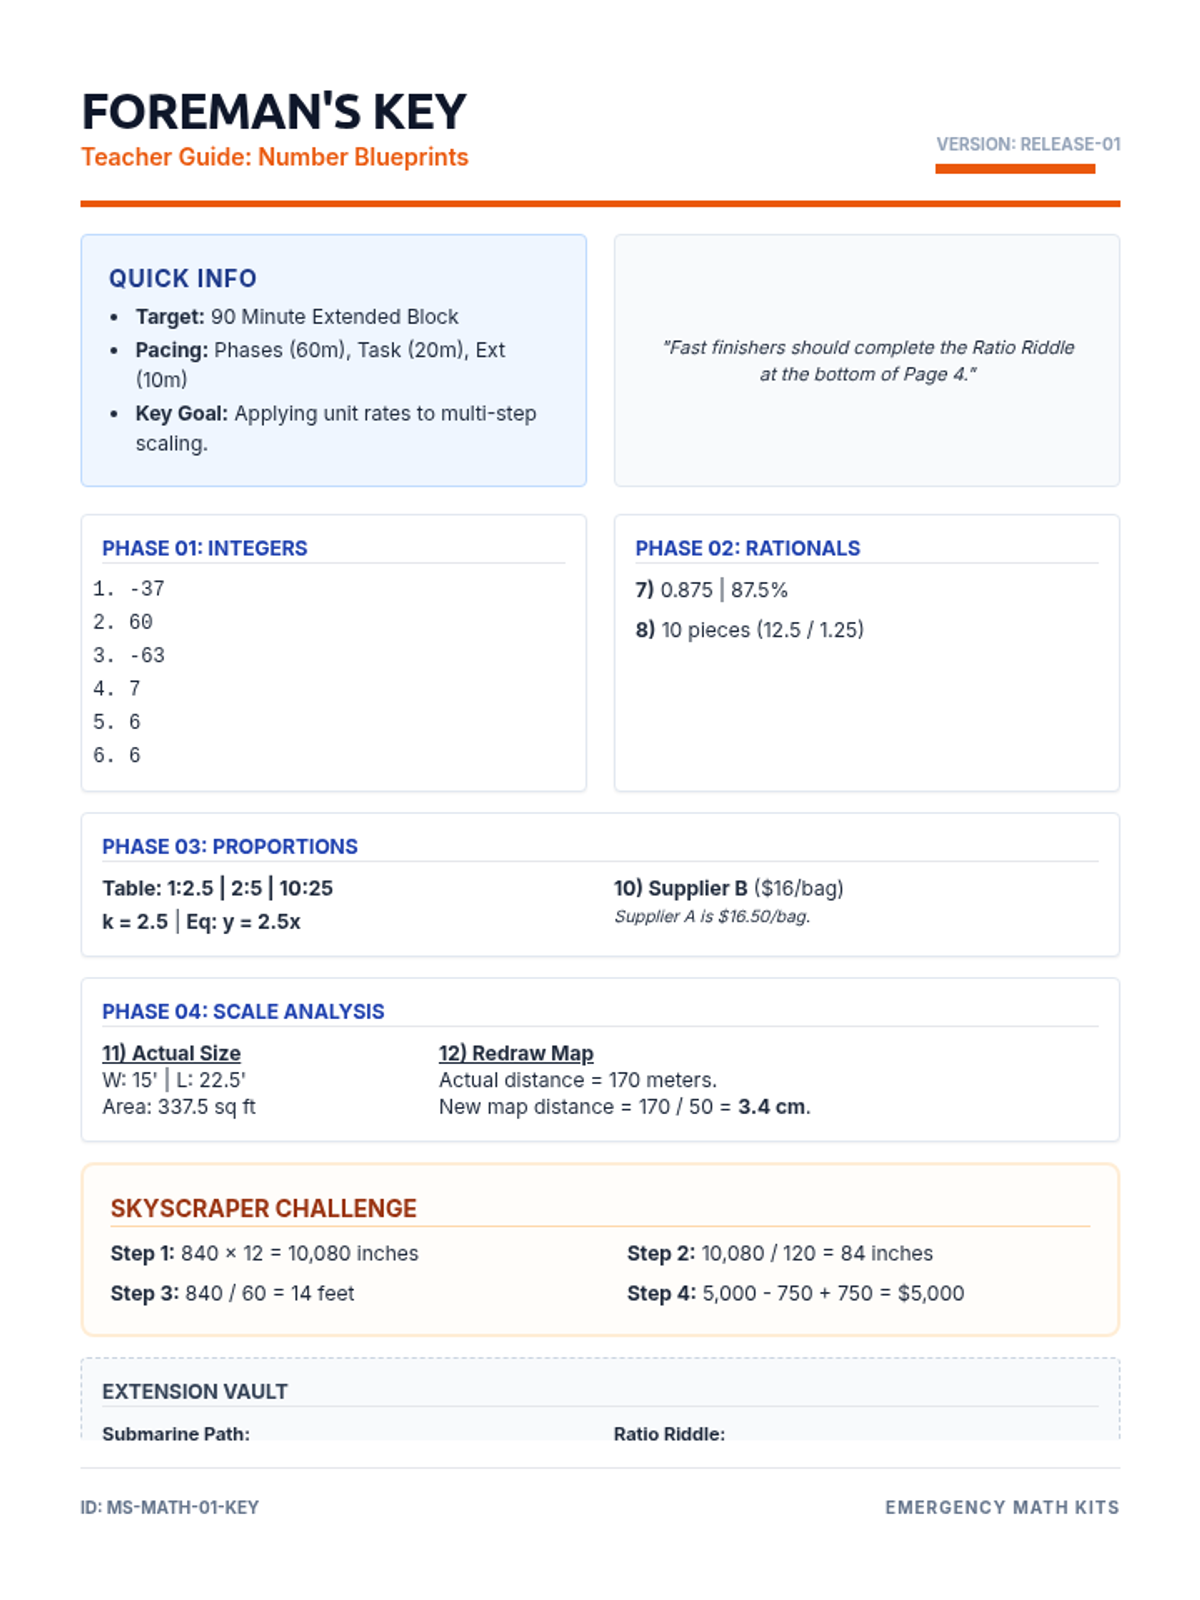
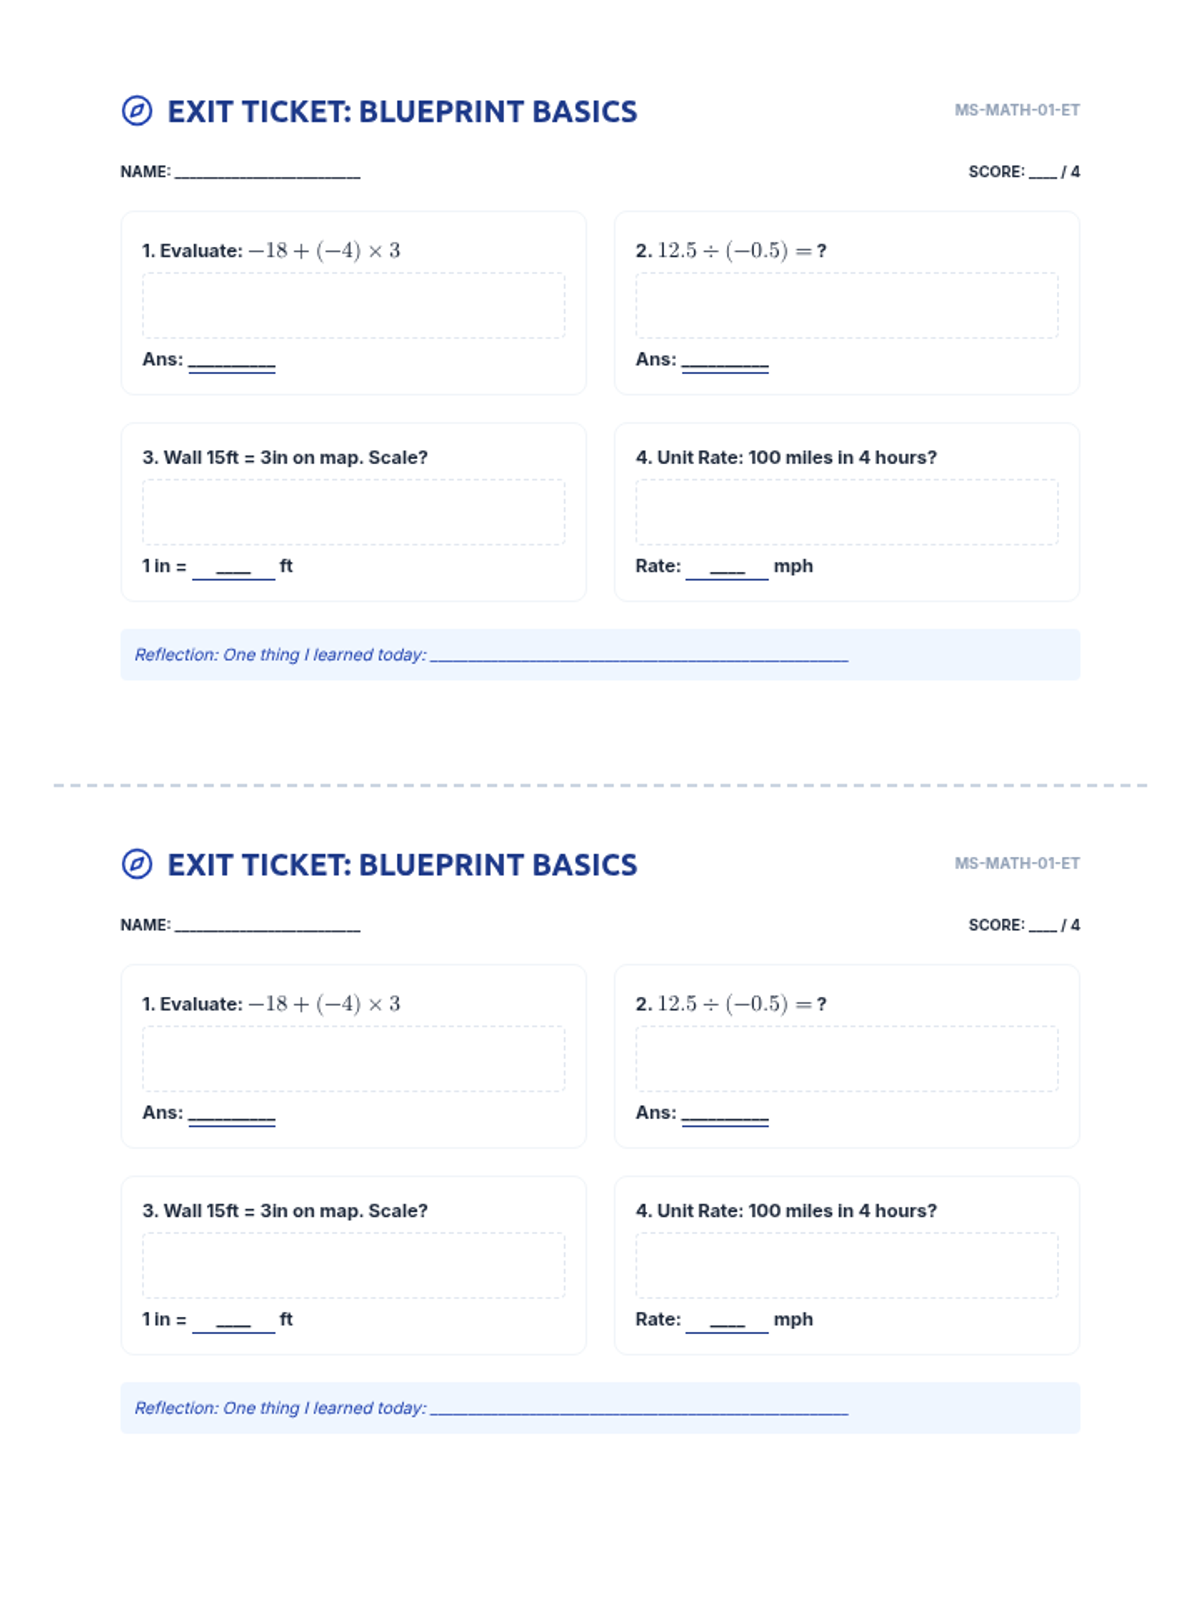
A 90-minute substitute-ready packet focusing on operations with integers, rational numbers, proportions, and scale factors. Students work through a series of "blueprint" challenges to apply their number sense and proportional reasoning.
A hands-on probability project where students design, build, and test carnival games. They will calculate theoretical probability, collect experimental data, and analyze the results to understand statistical likelihood.
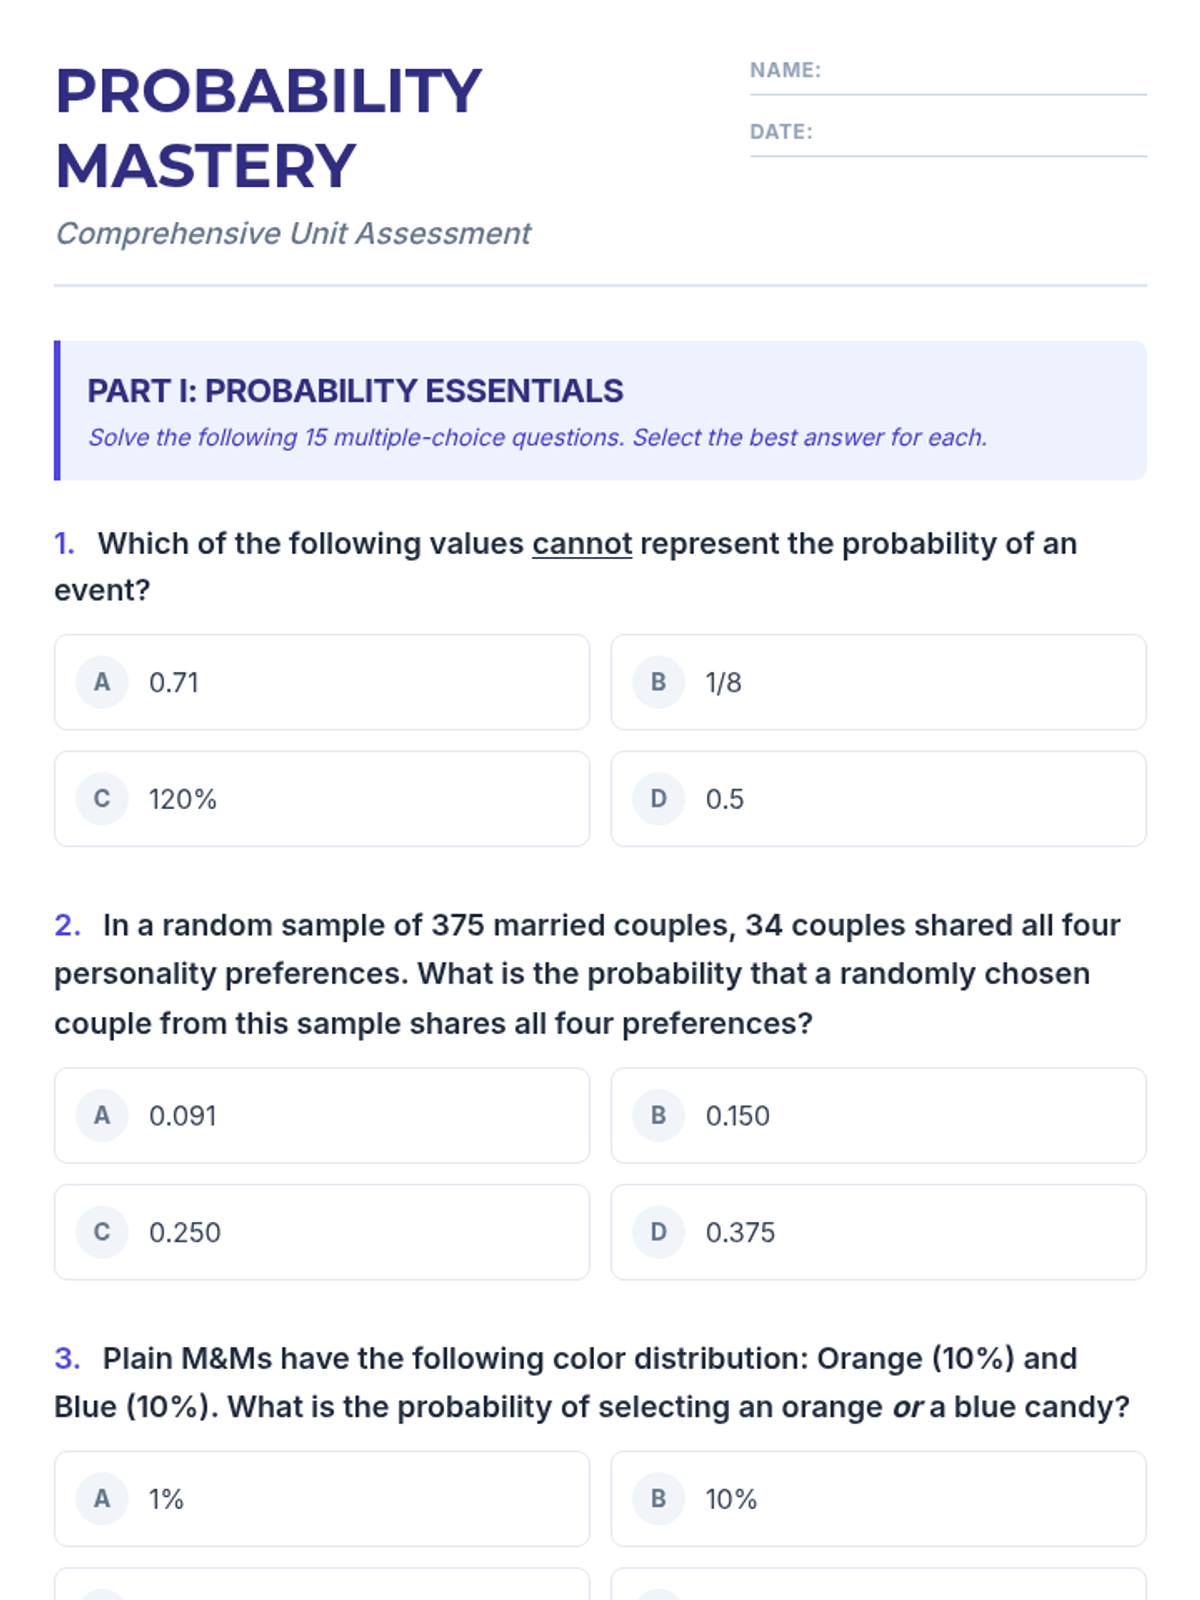
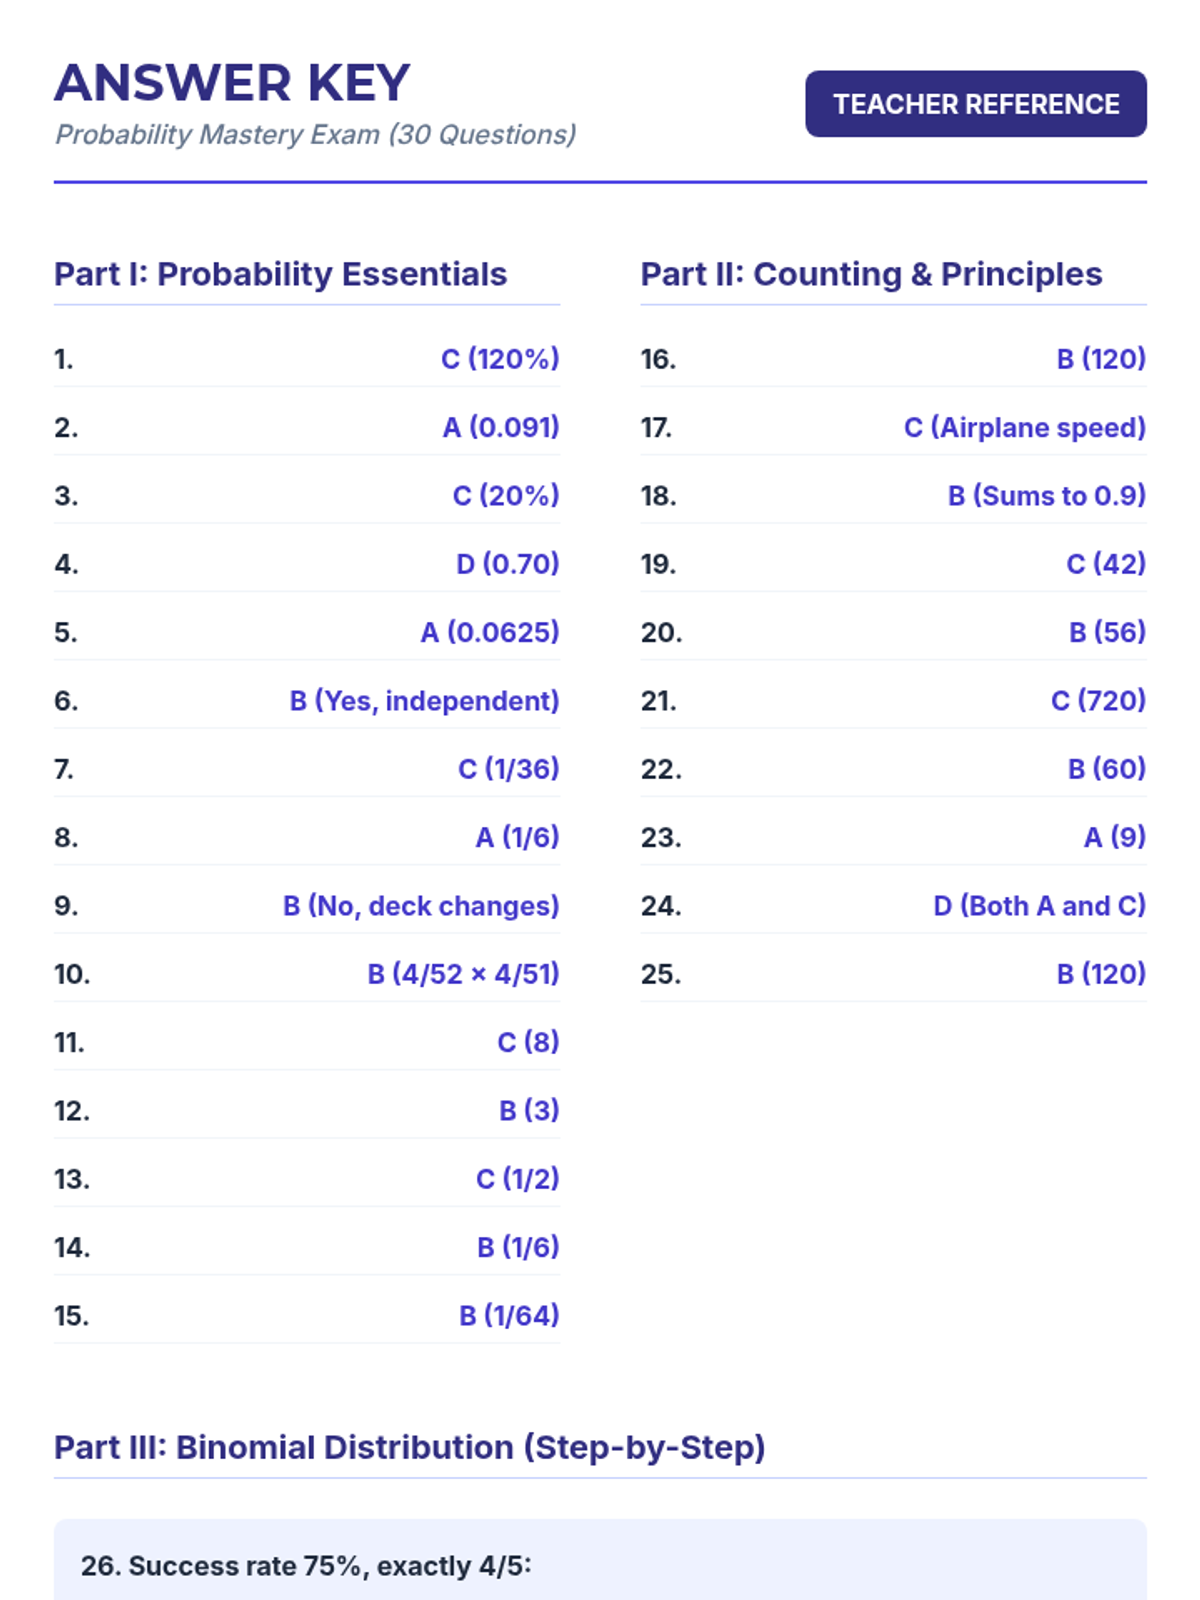
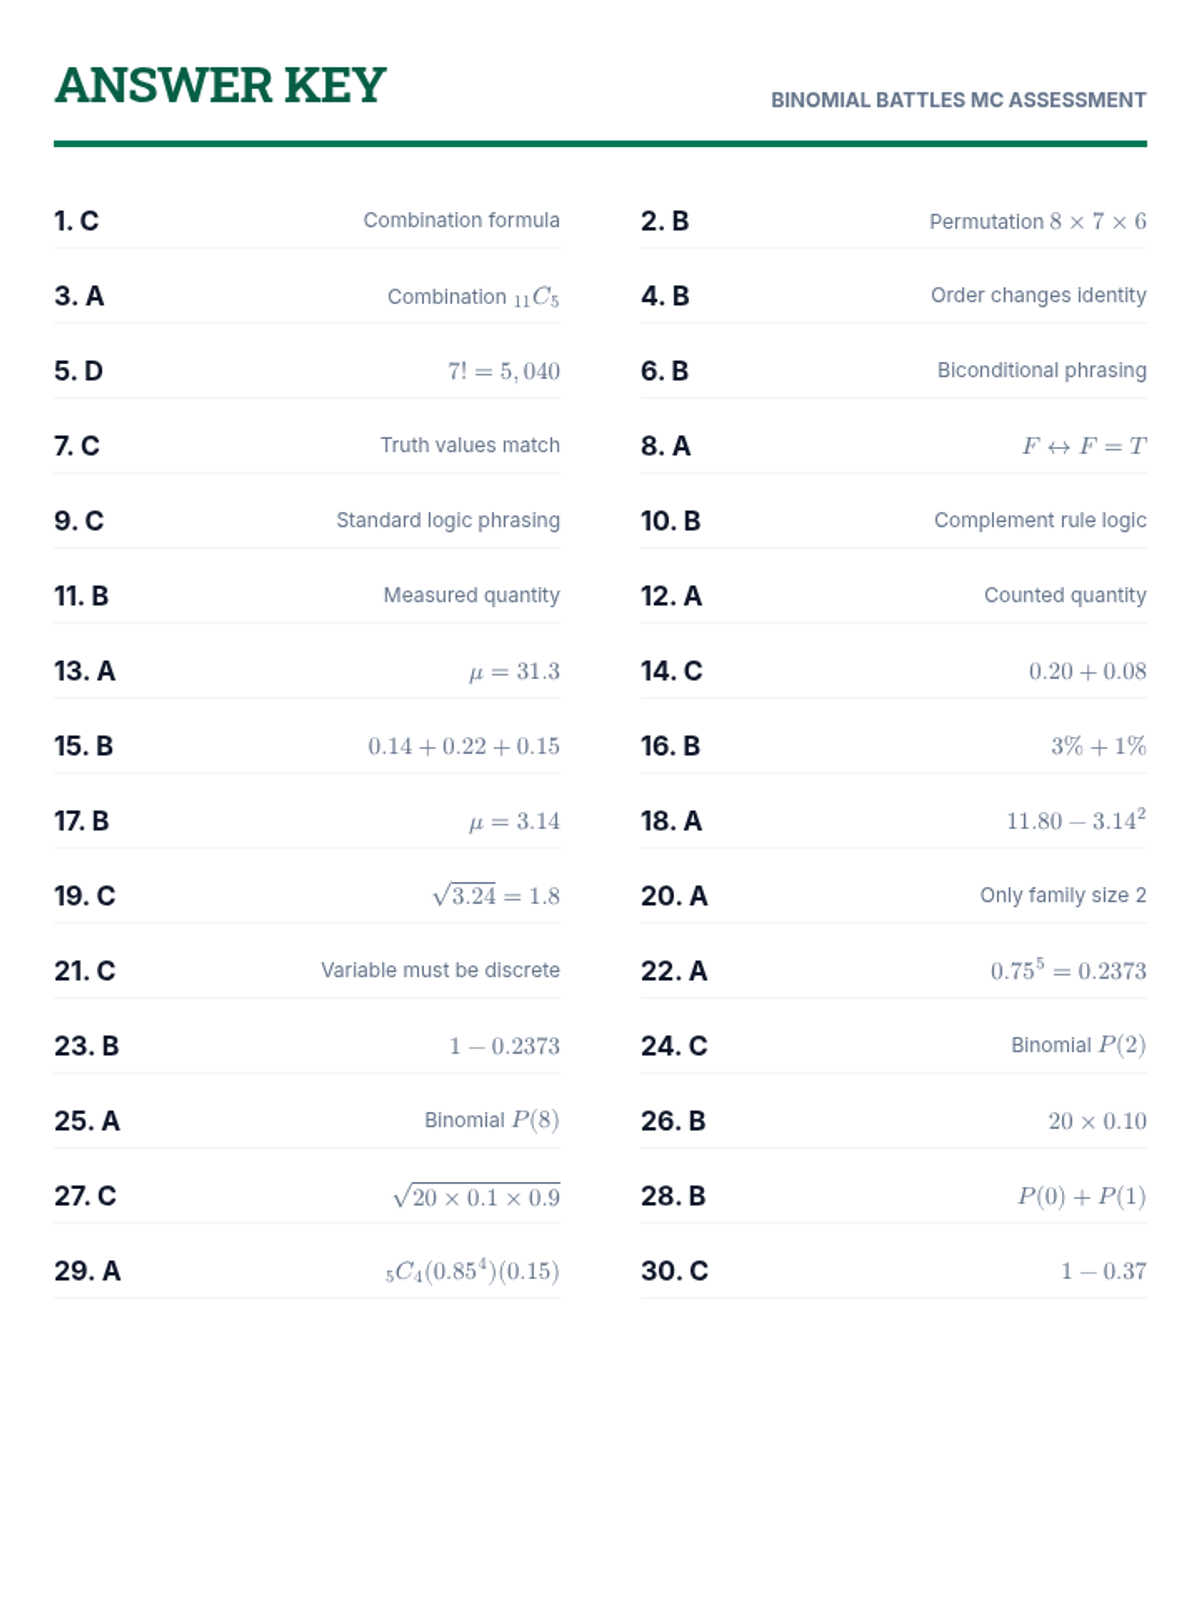
A comprehensive lesson covering probability basics, counting principles, and the binomial distribution, concluding with a summative 30-question mastery exam.
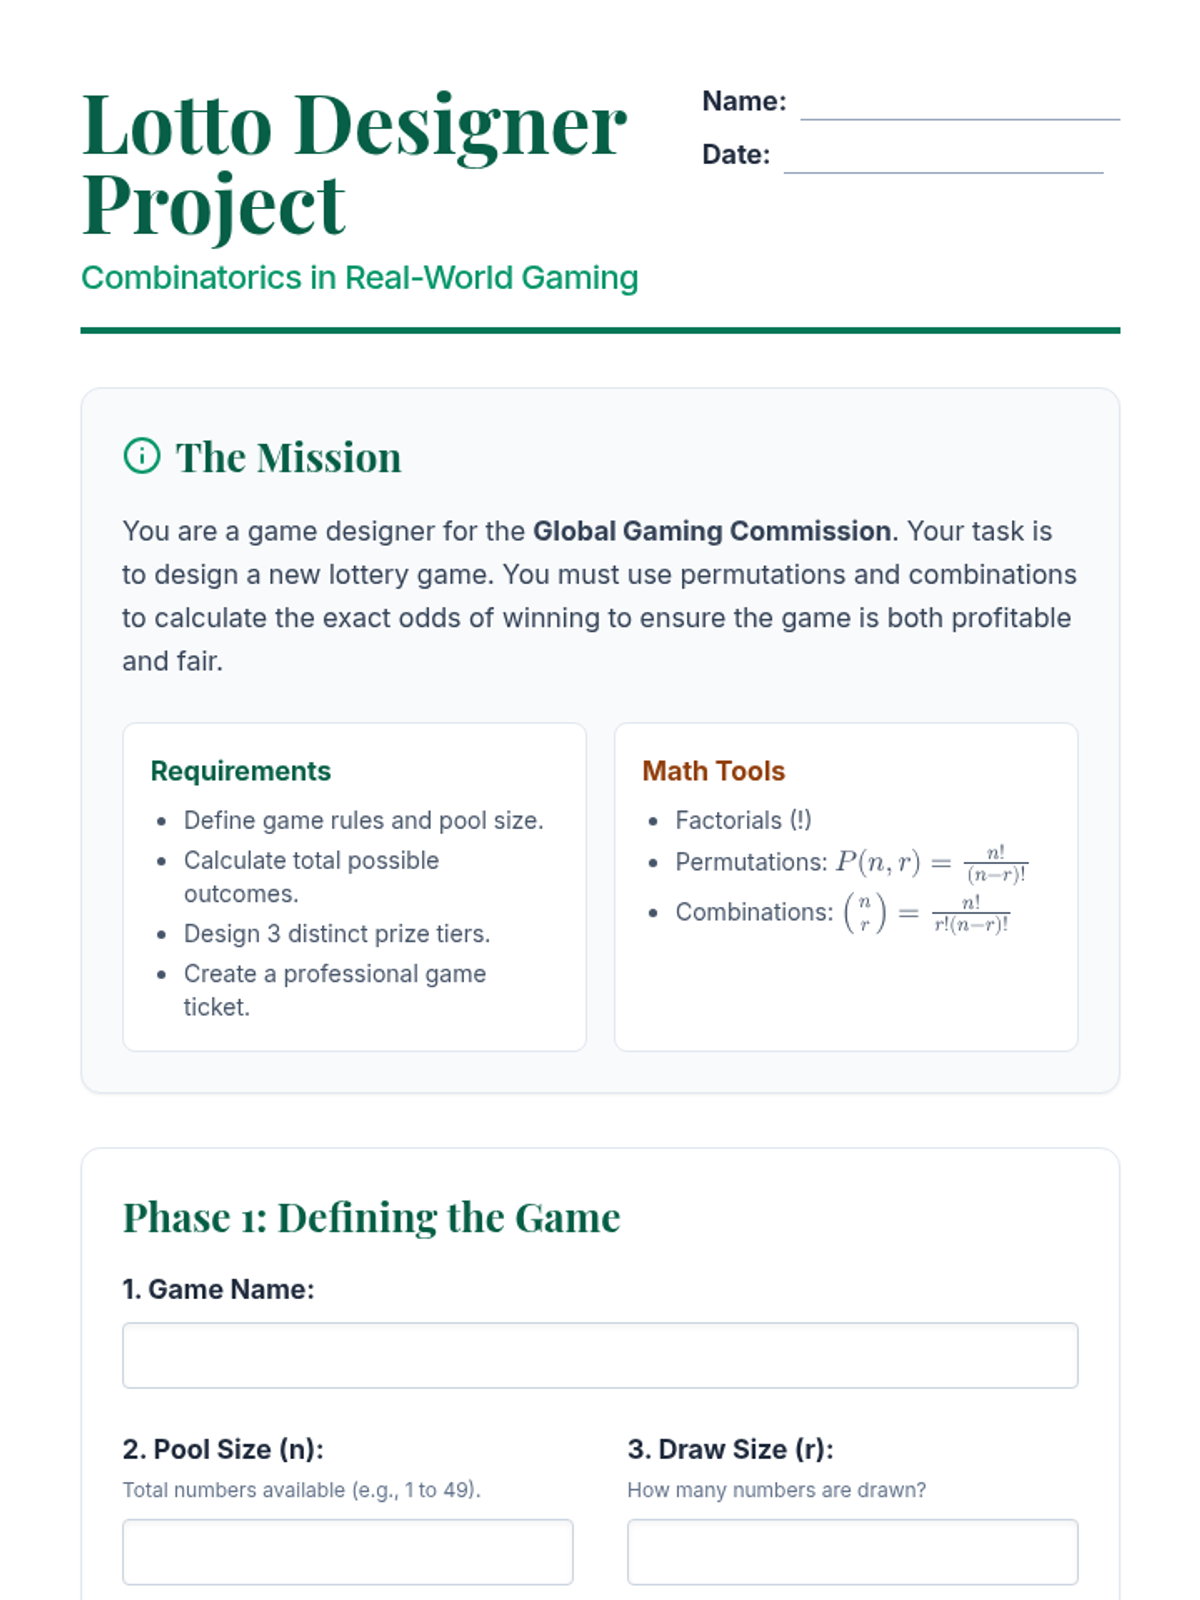
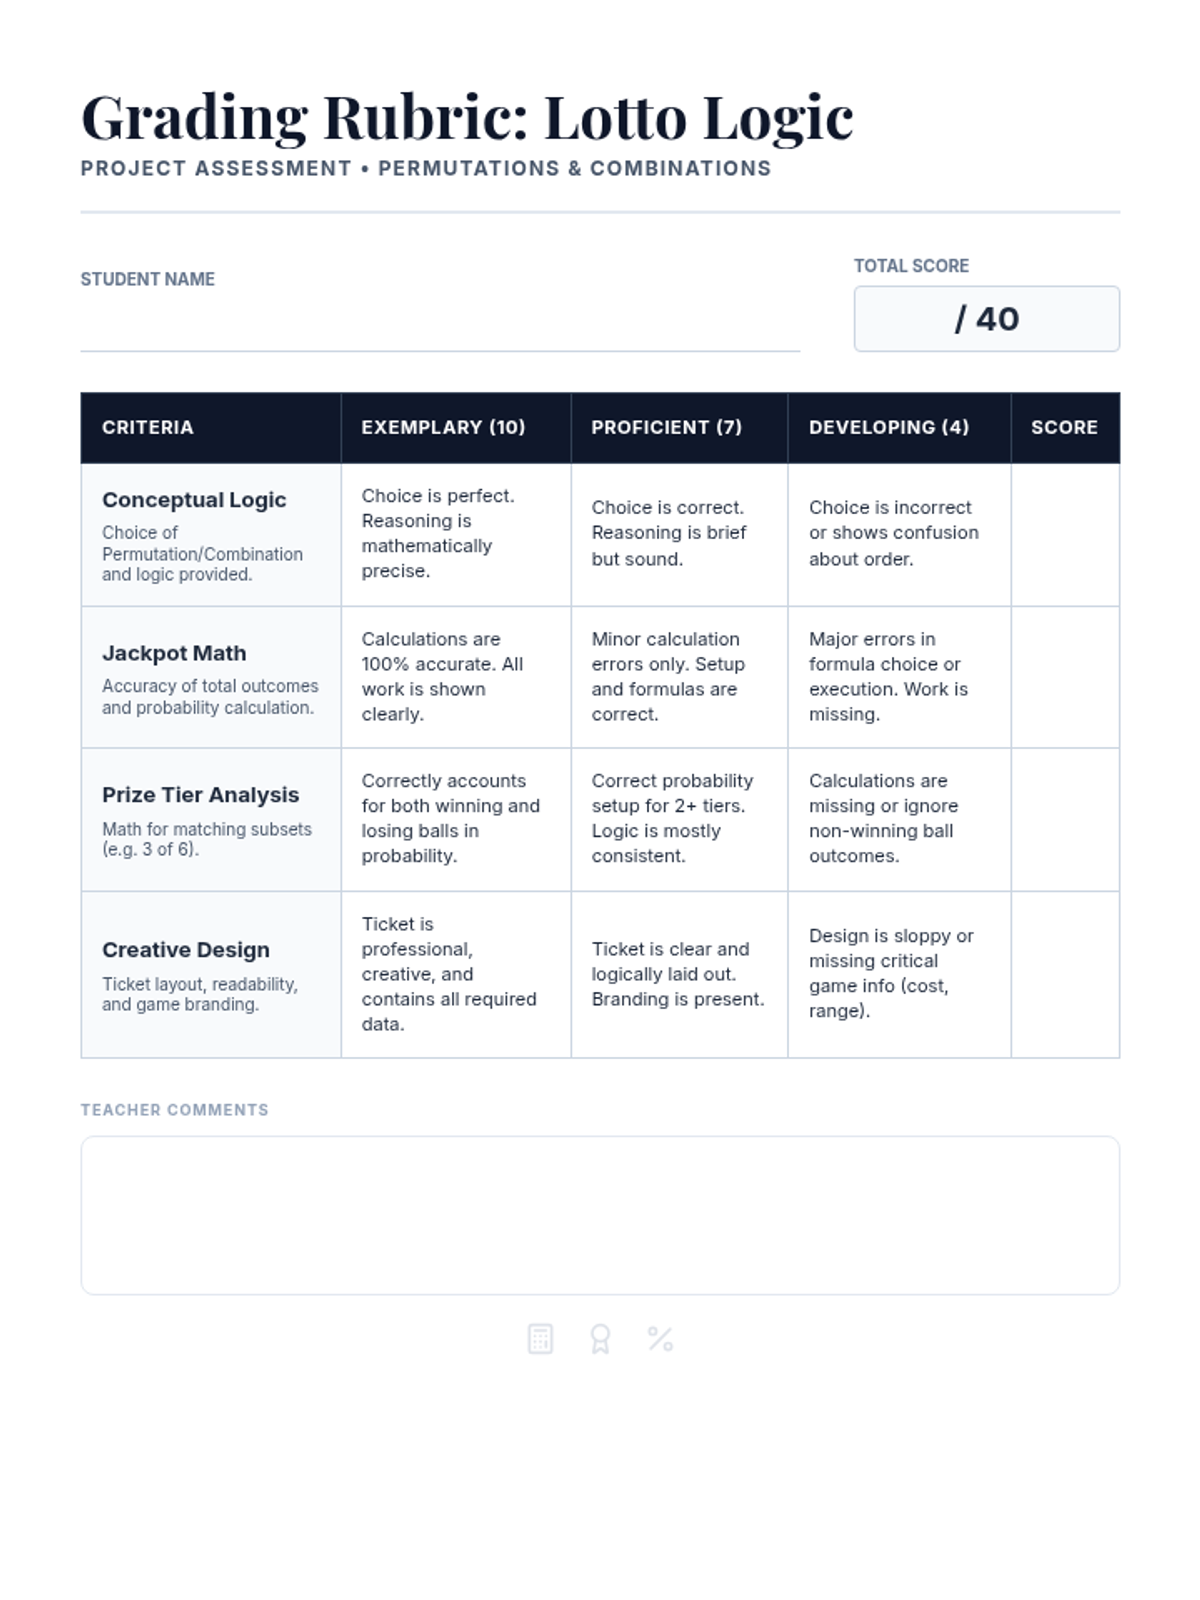
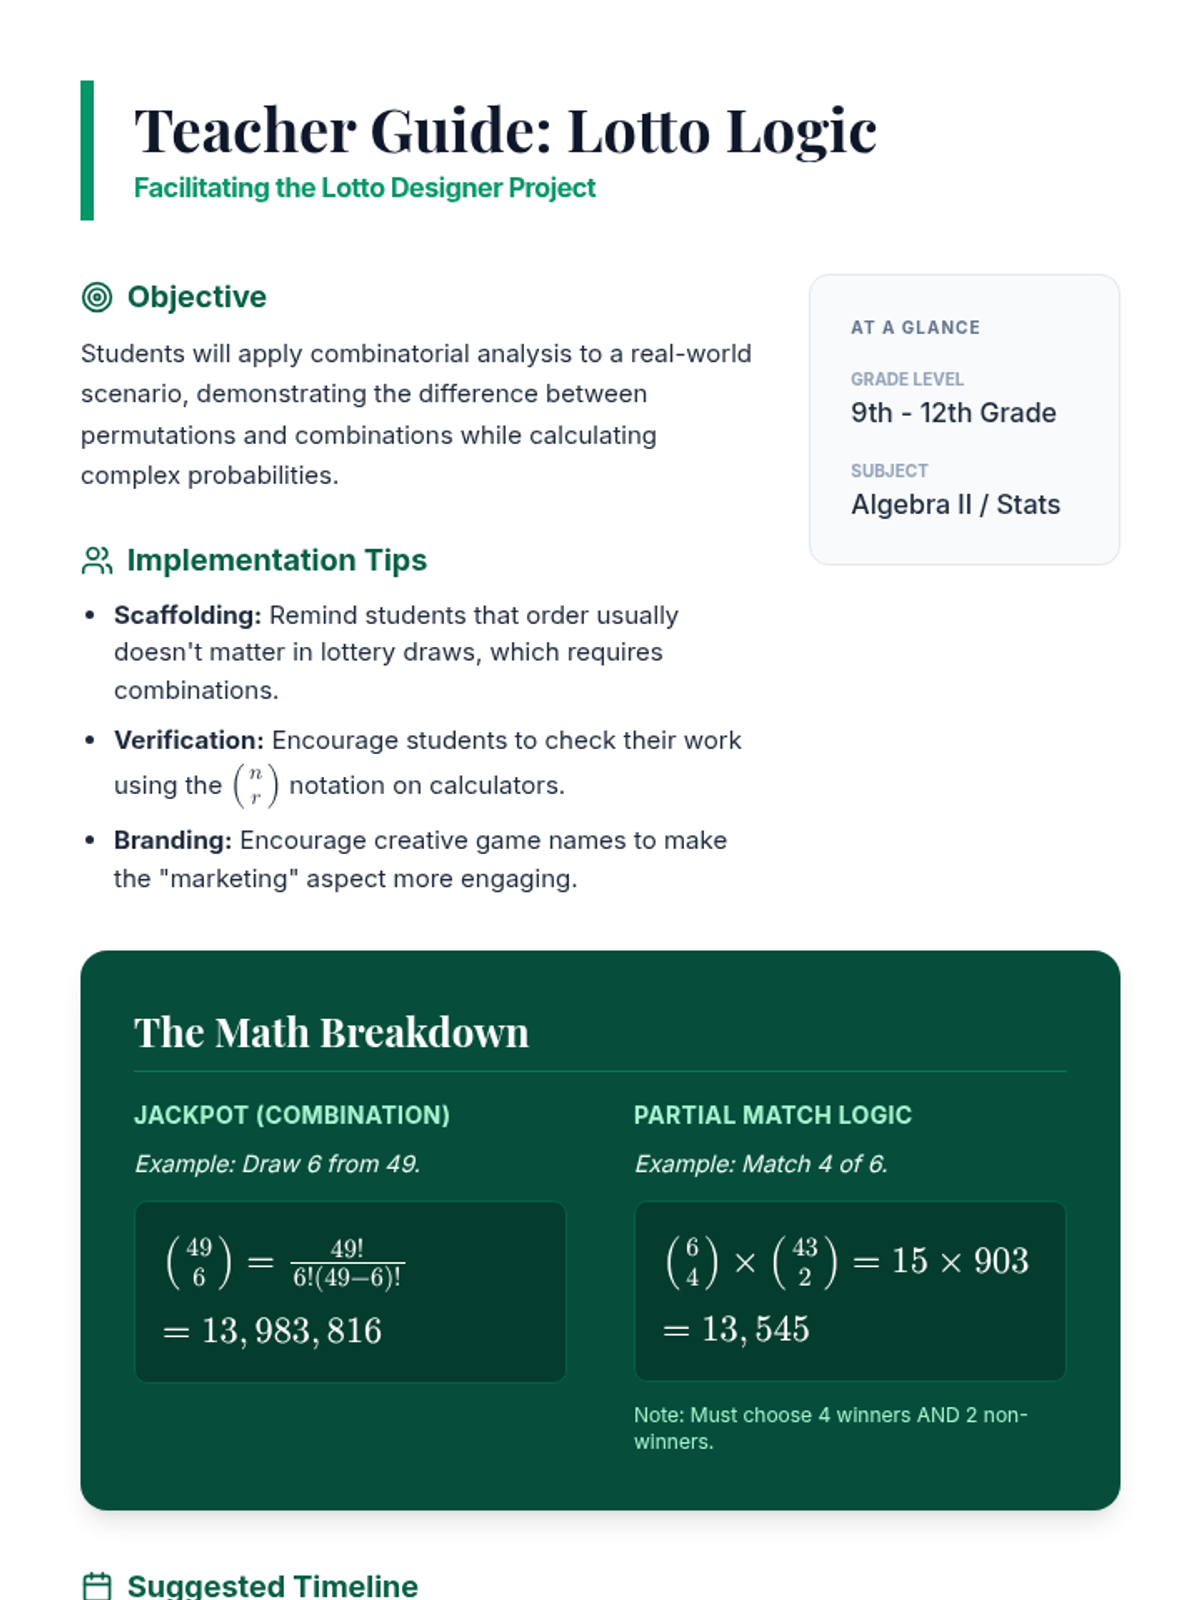
Students apply their knowledge of permutations and combinations to design their own lottery game, calculating the odds of winning and presenting their mathematical findings in a professional format.
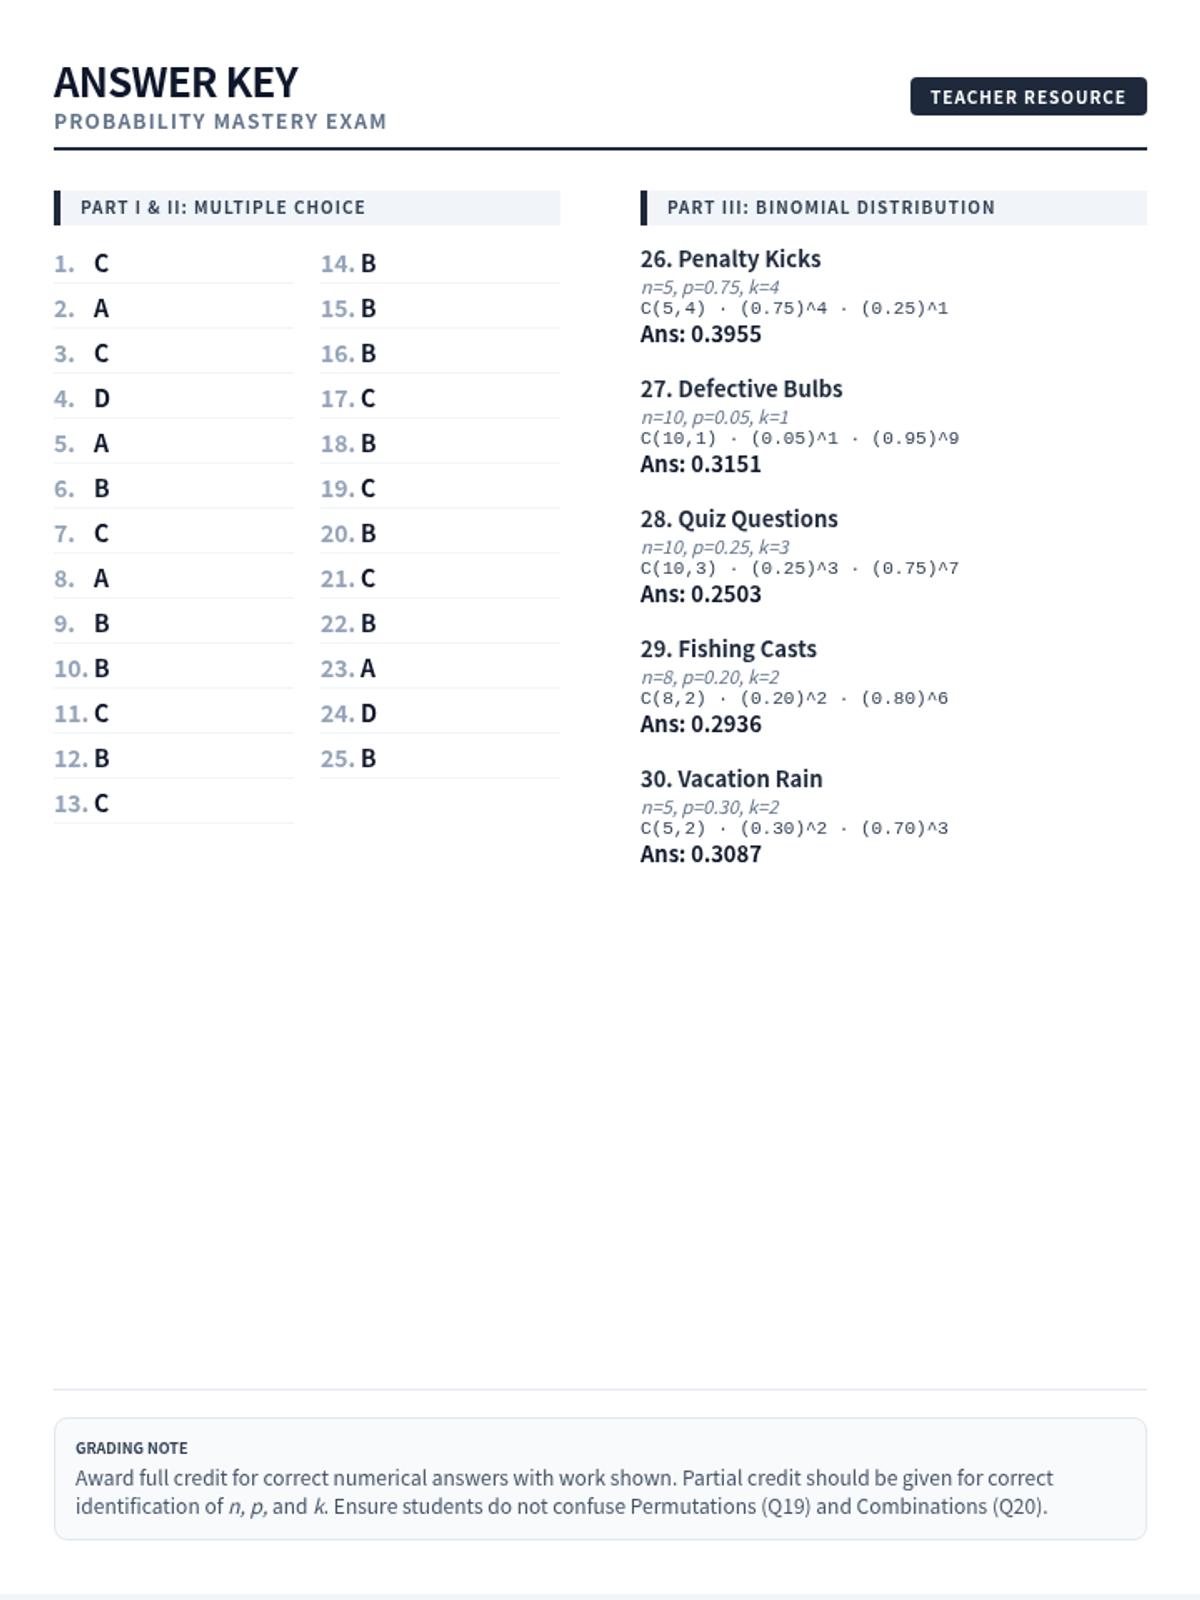
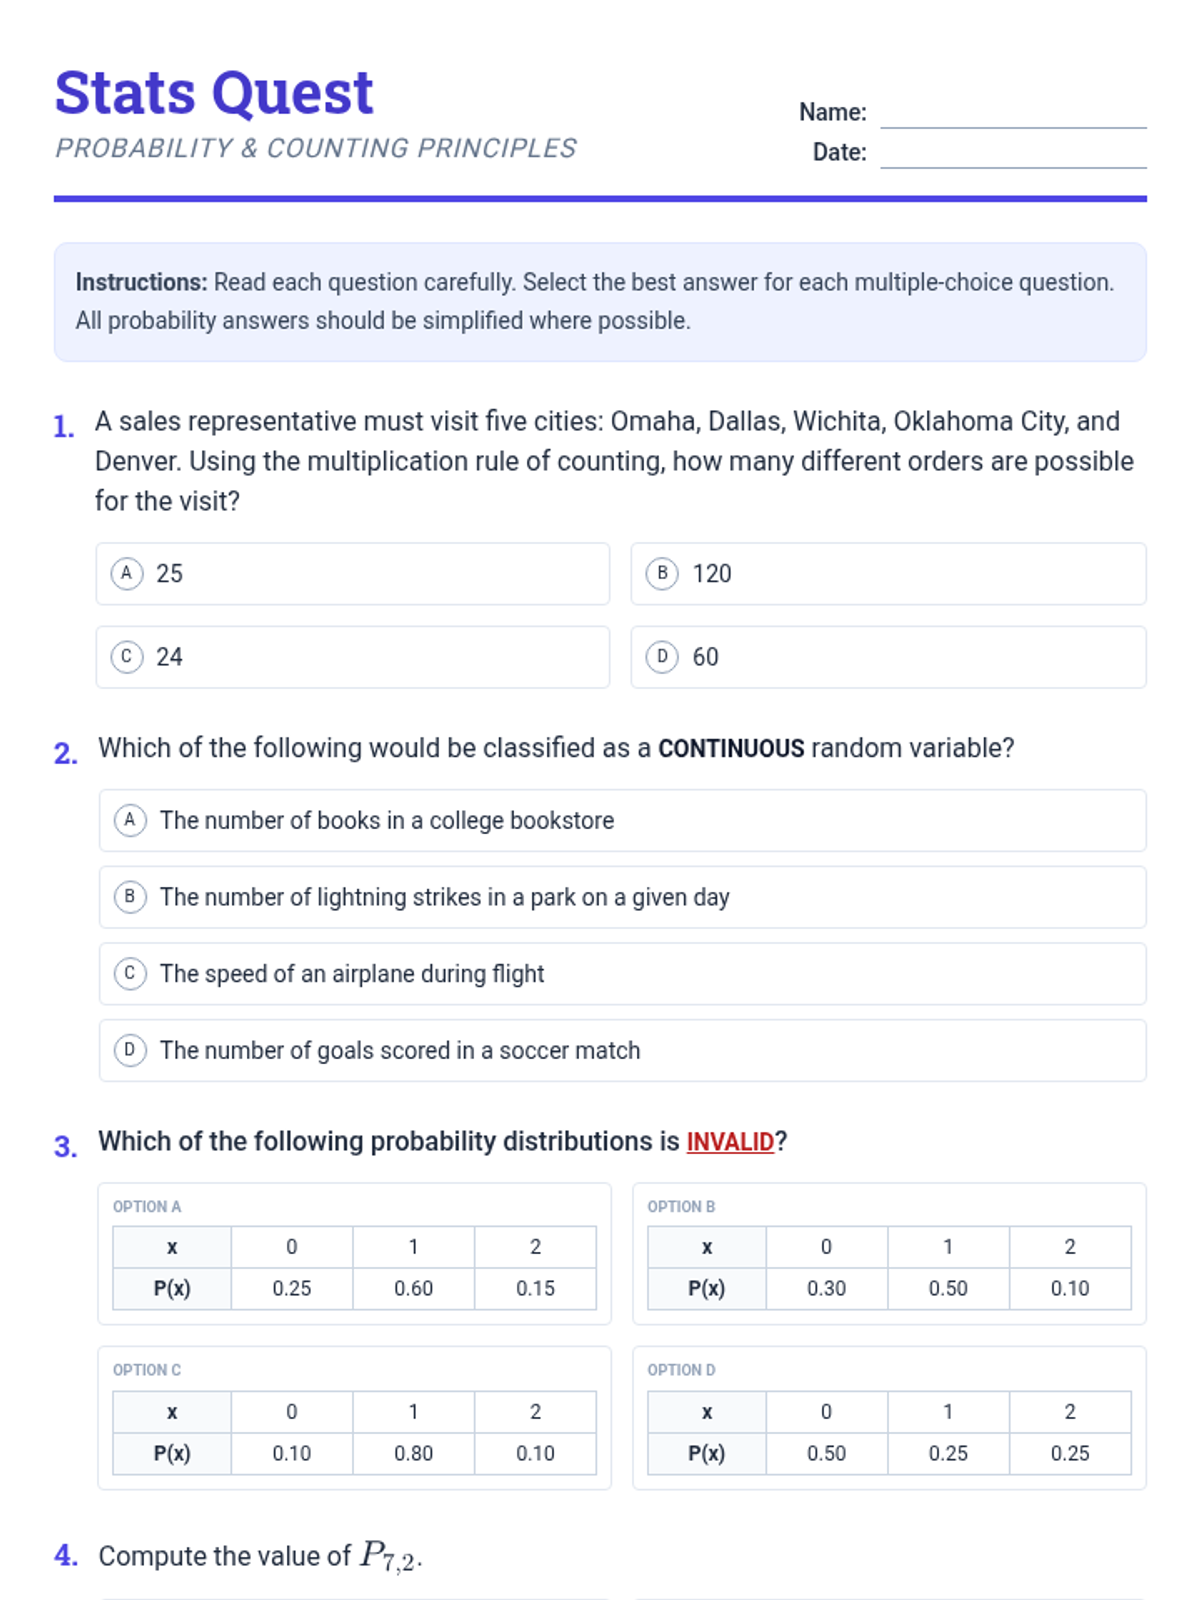
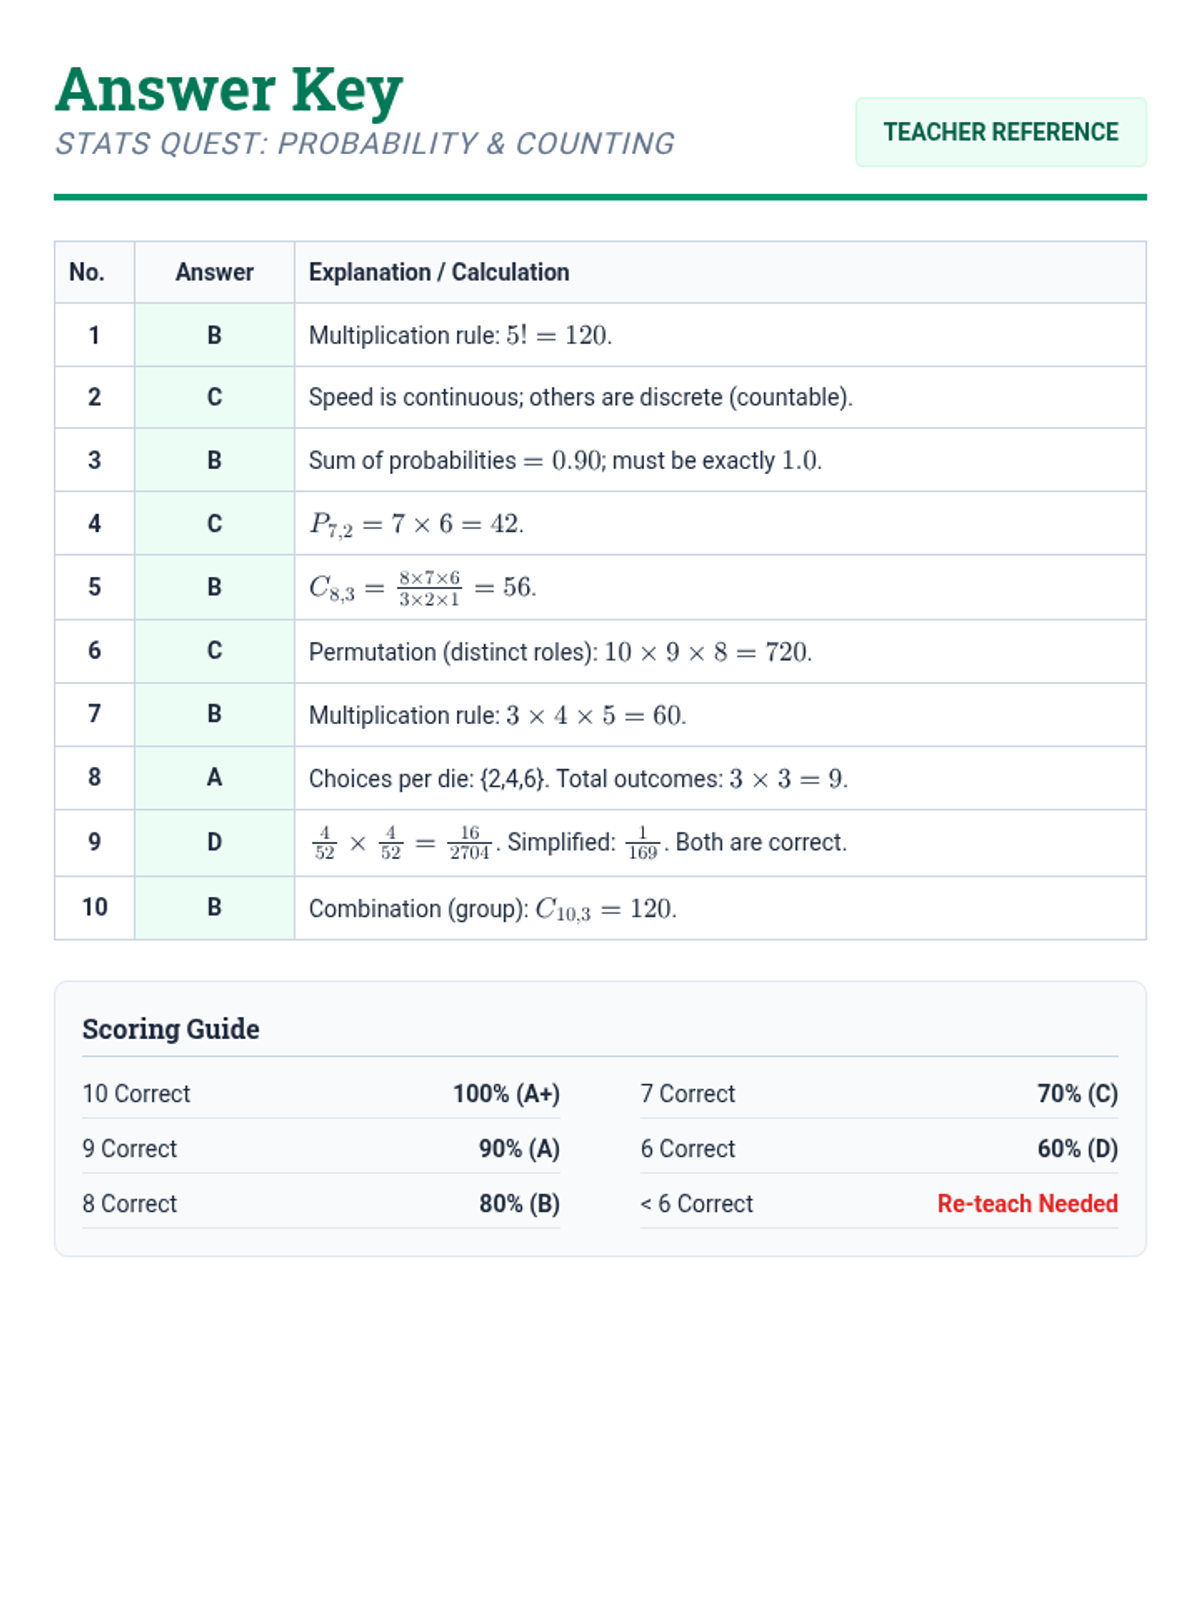
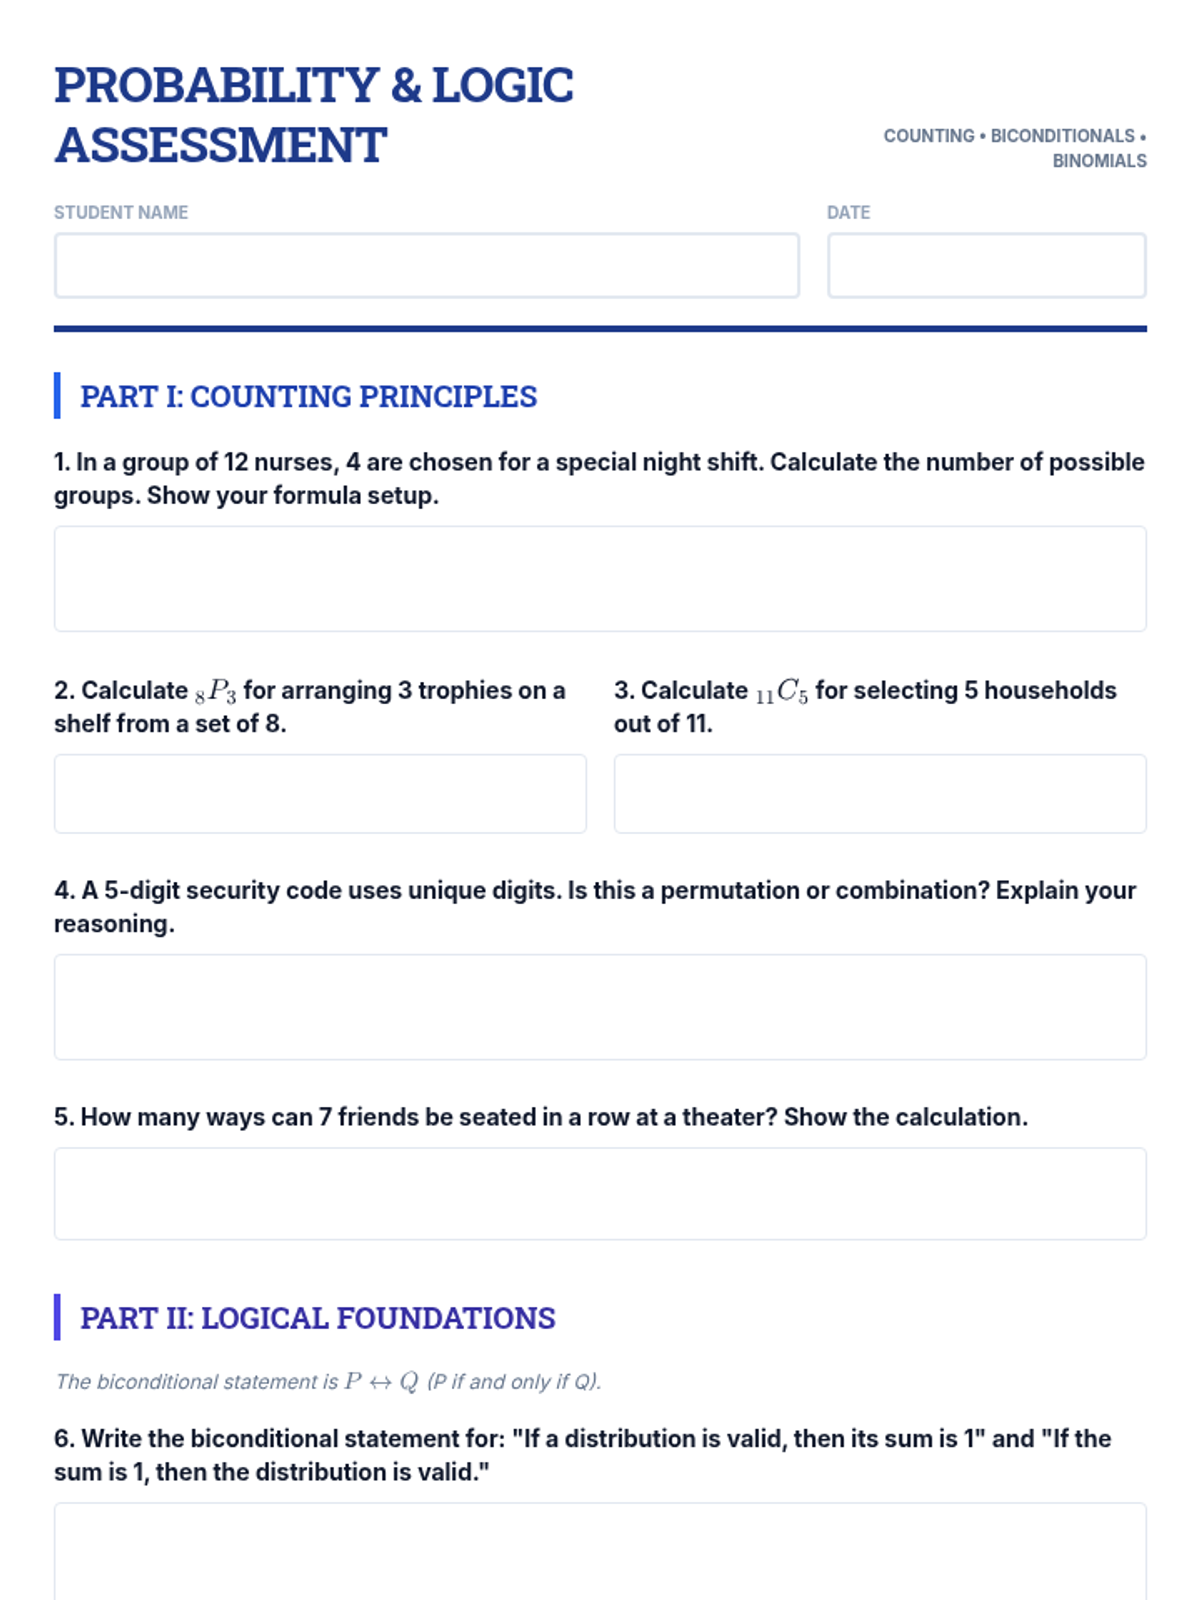
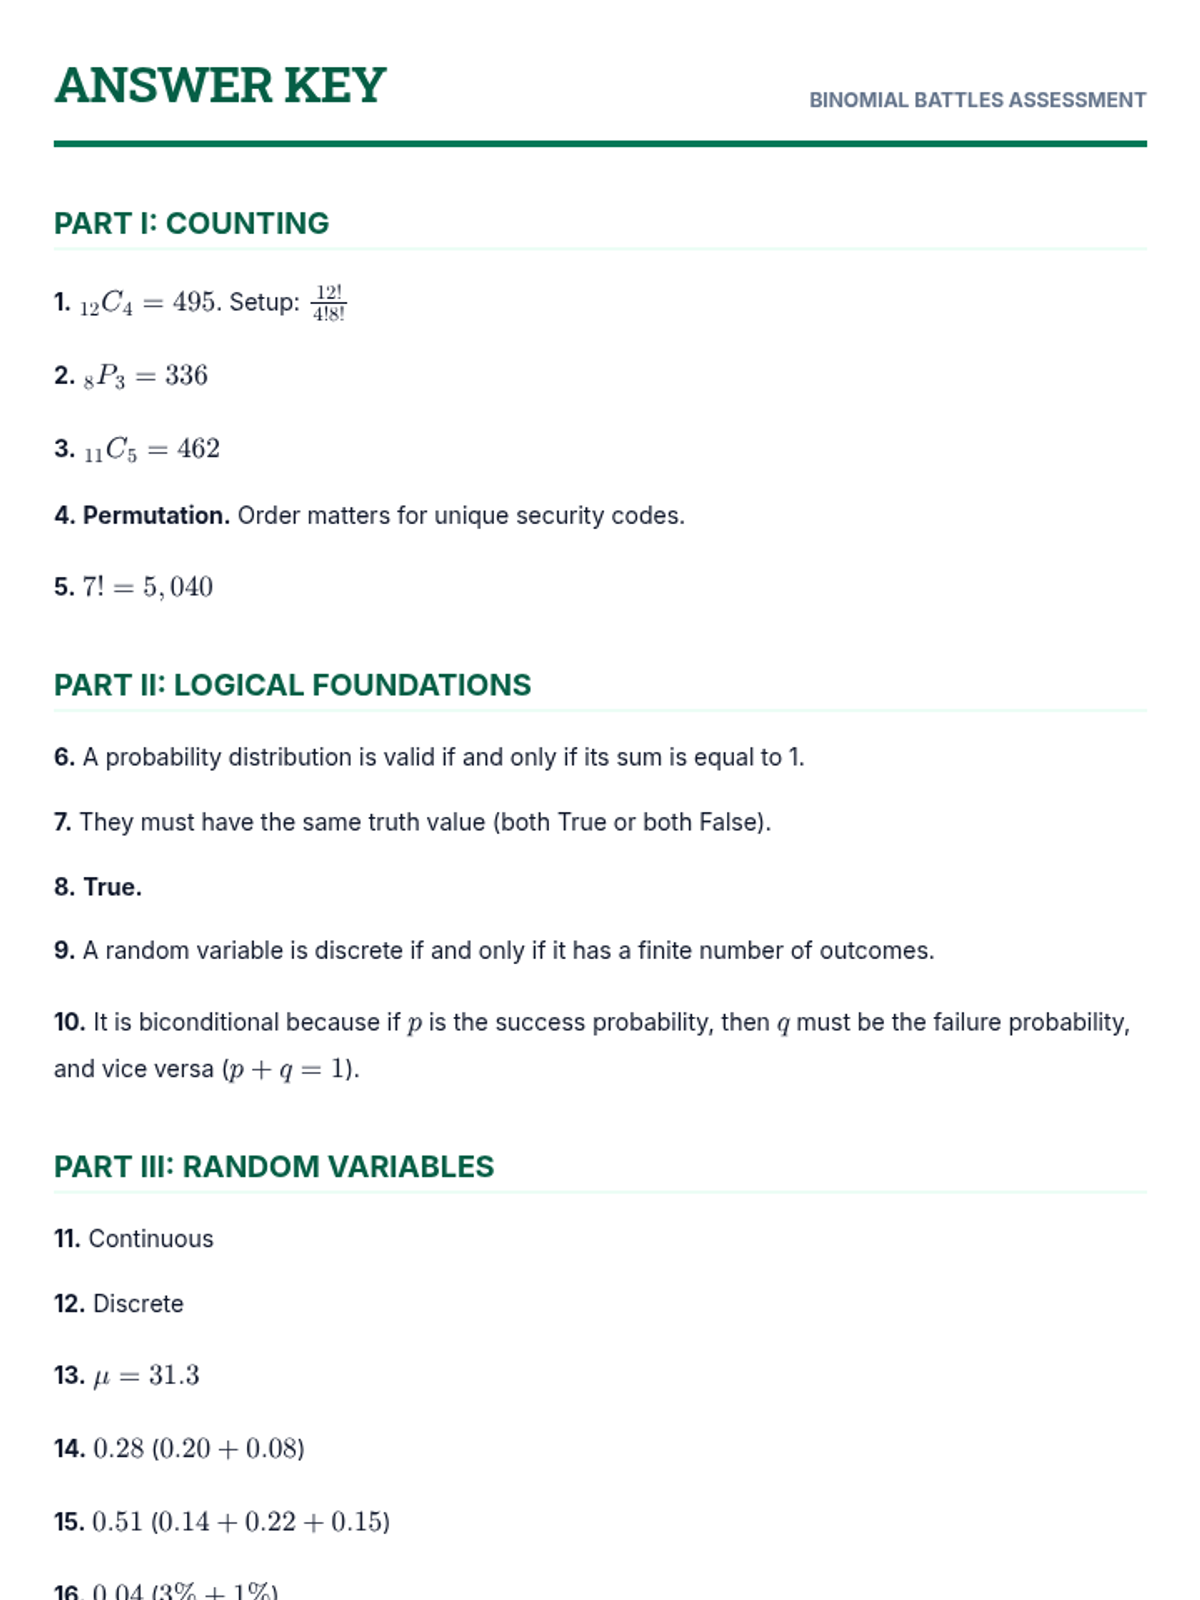
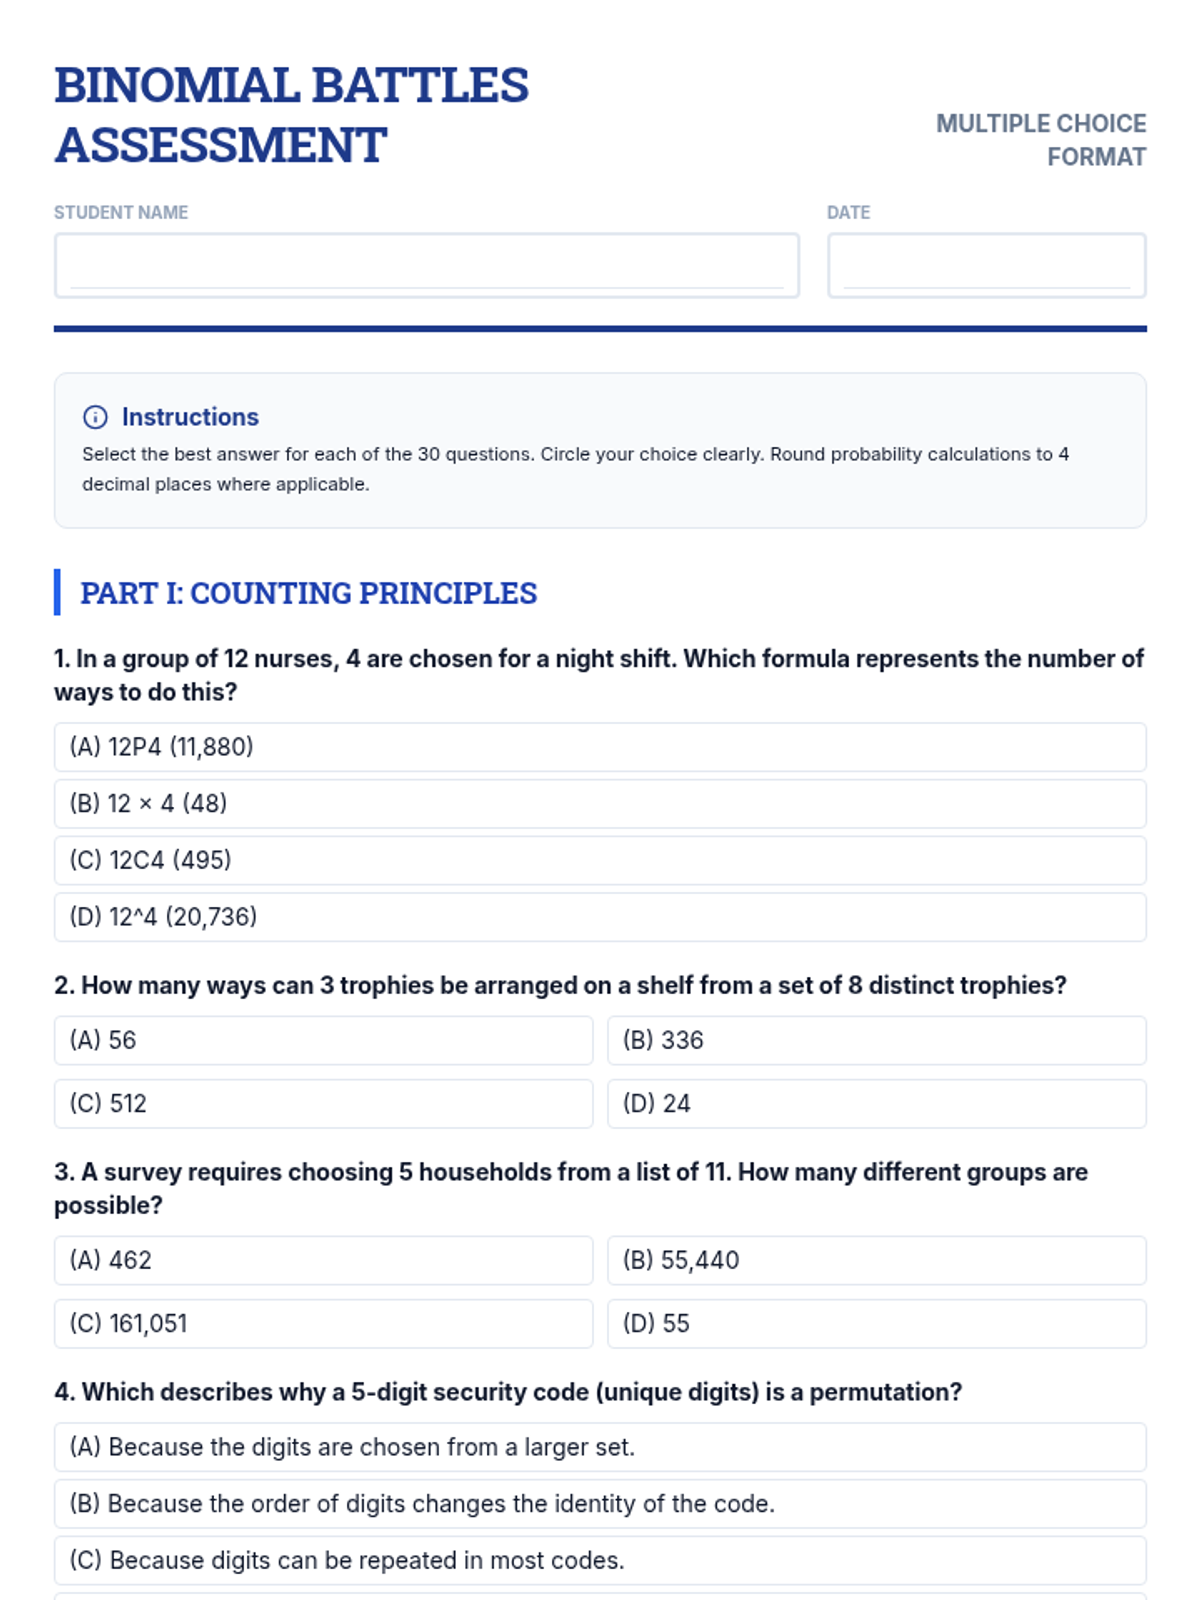
A comprehensive examination combining elementary probability theory, counting principles, and binomial distribution problems into a single rigorous assessment.
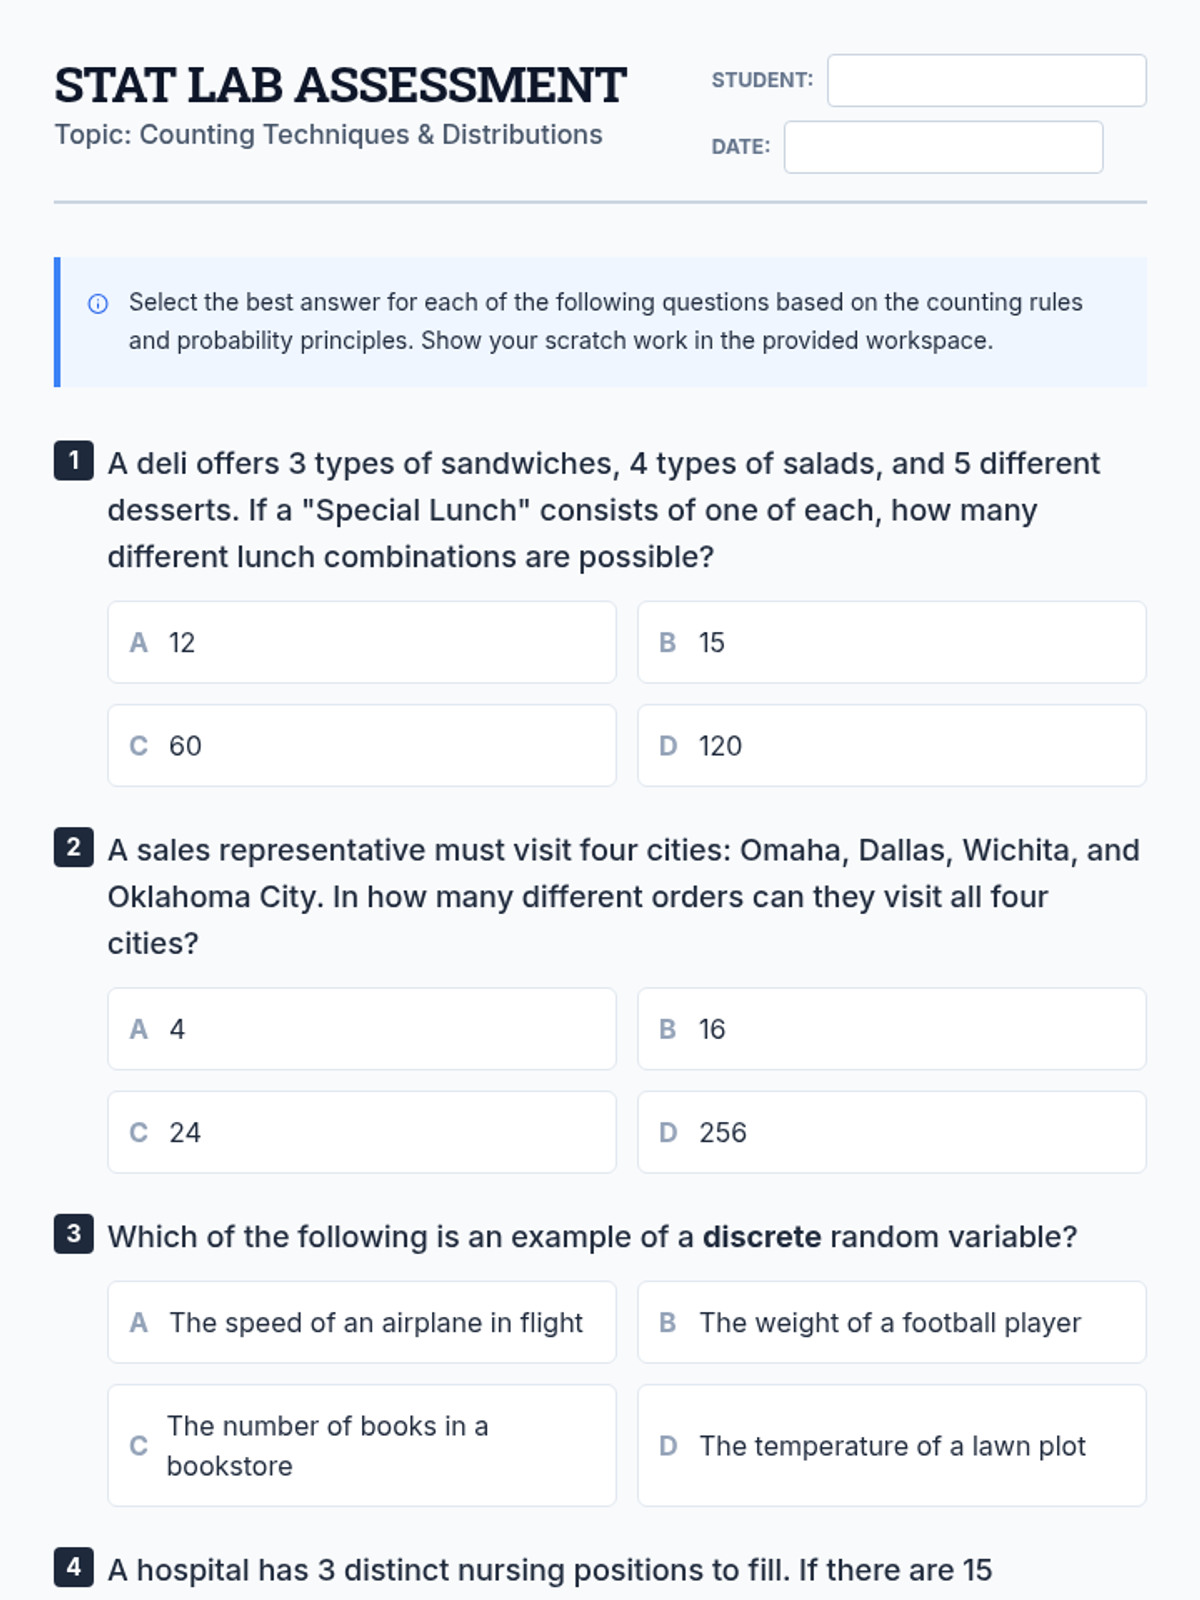
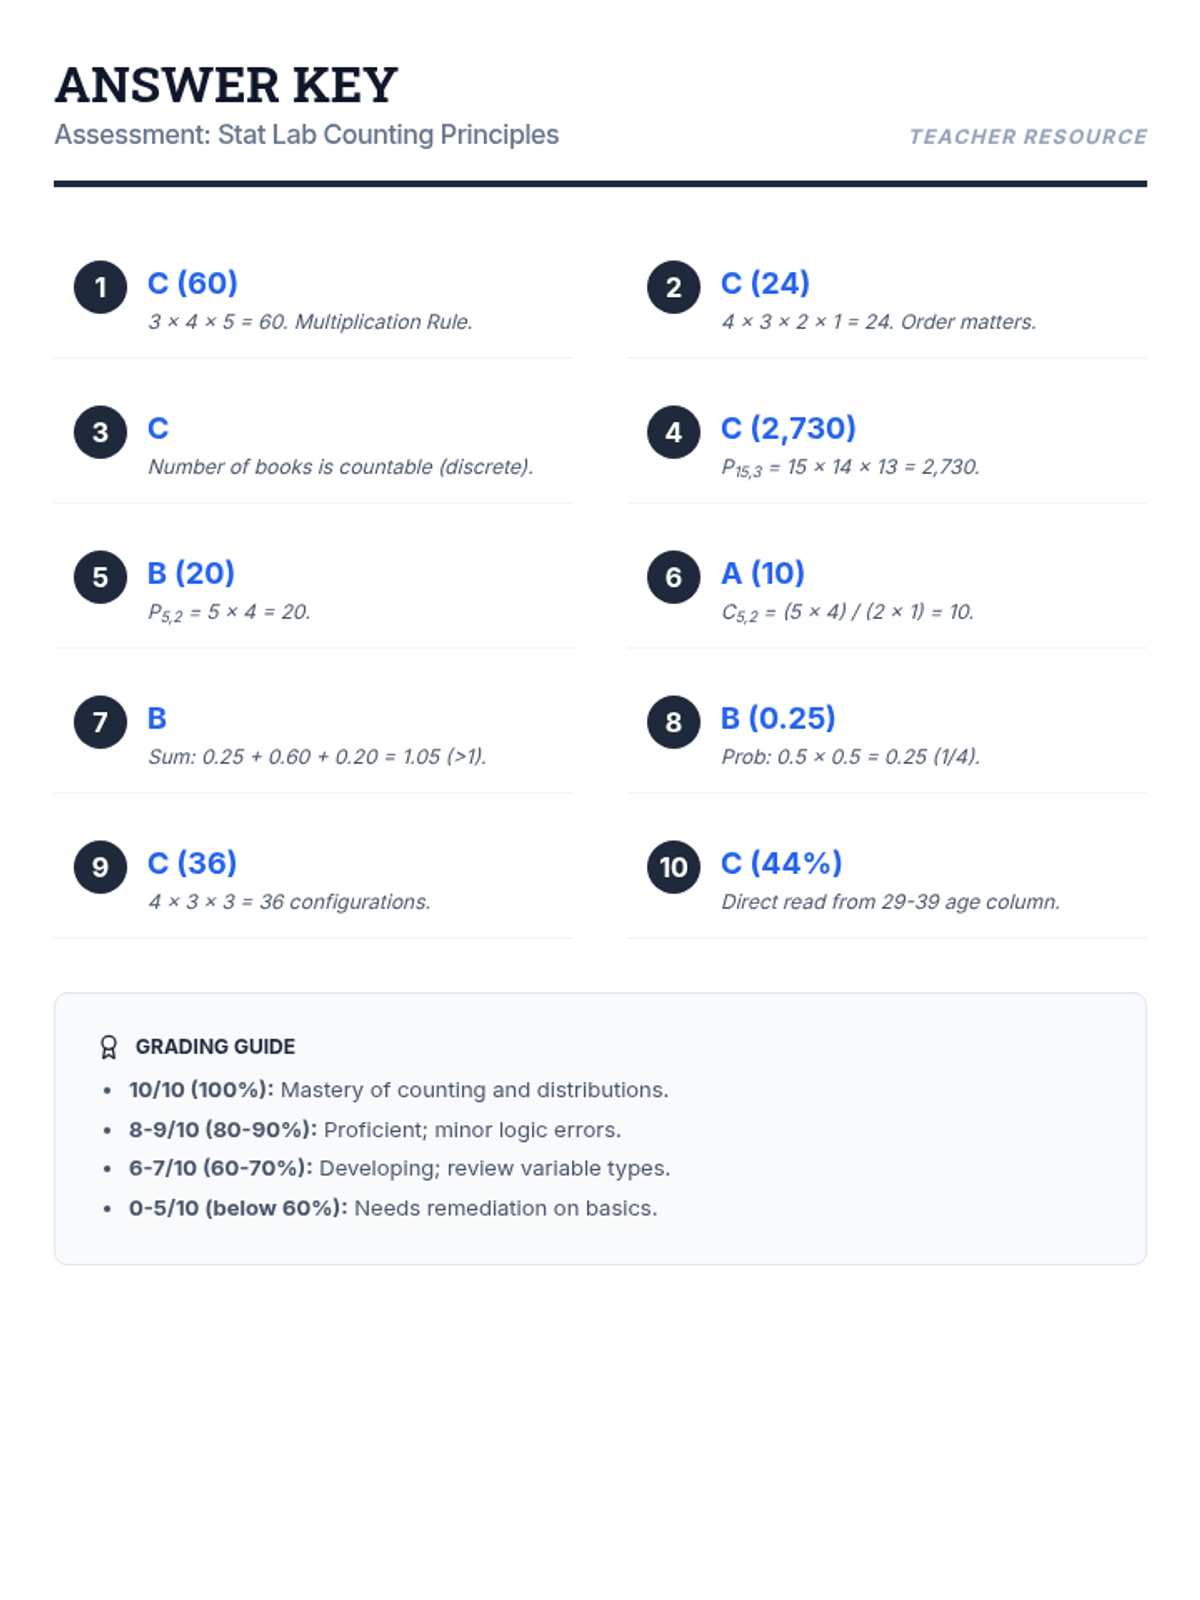
A comprehensive lesson covering counting techniques, permutations, combinations, and basic probability distributions based on statistical principles.
A lesson covering fundamental counting techniques, random variable classification, and probability distributions based on statistical principles.
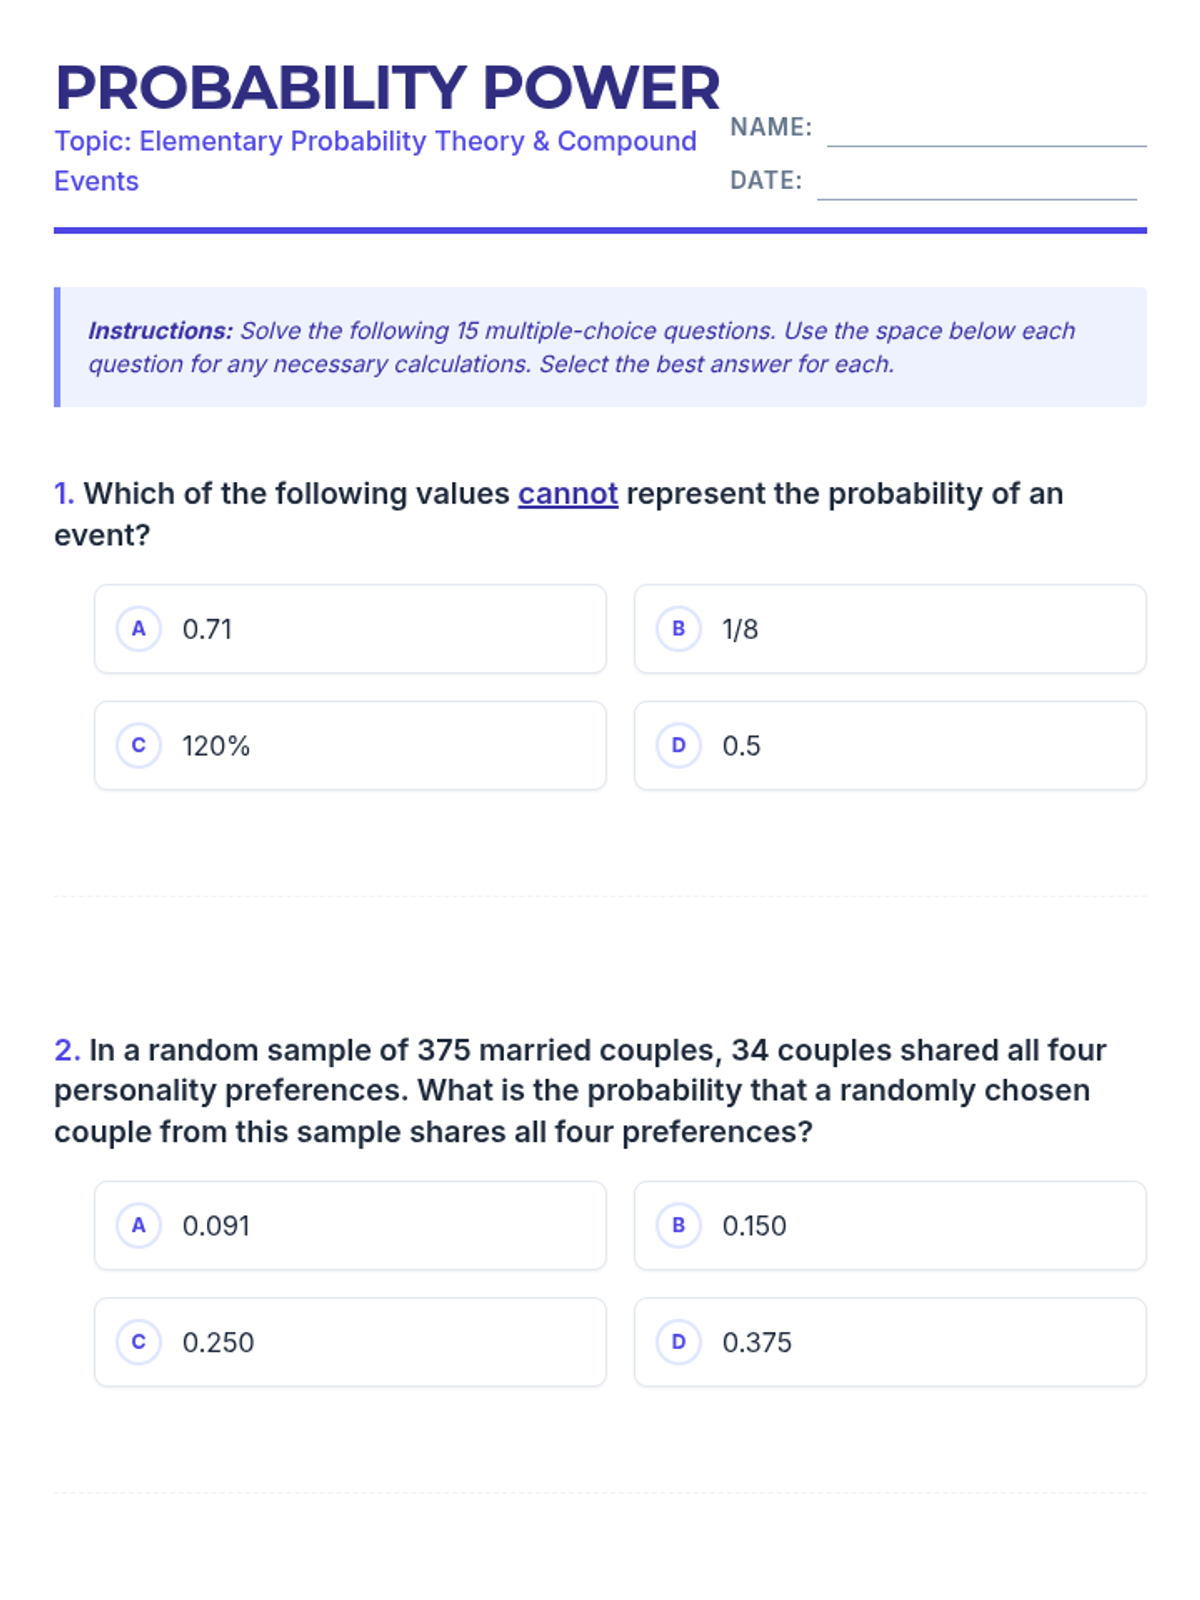
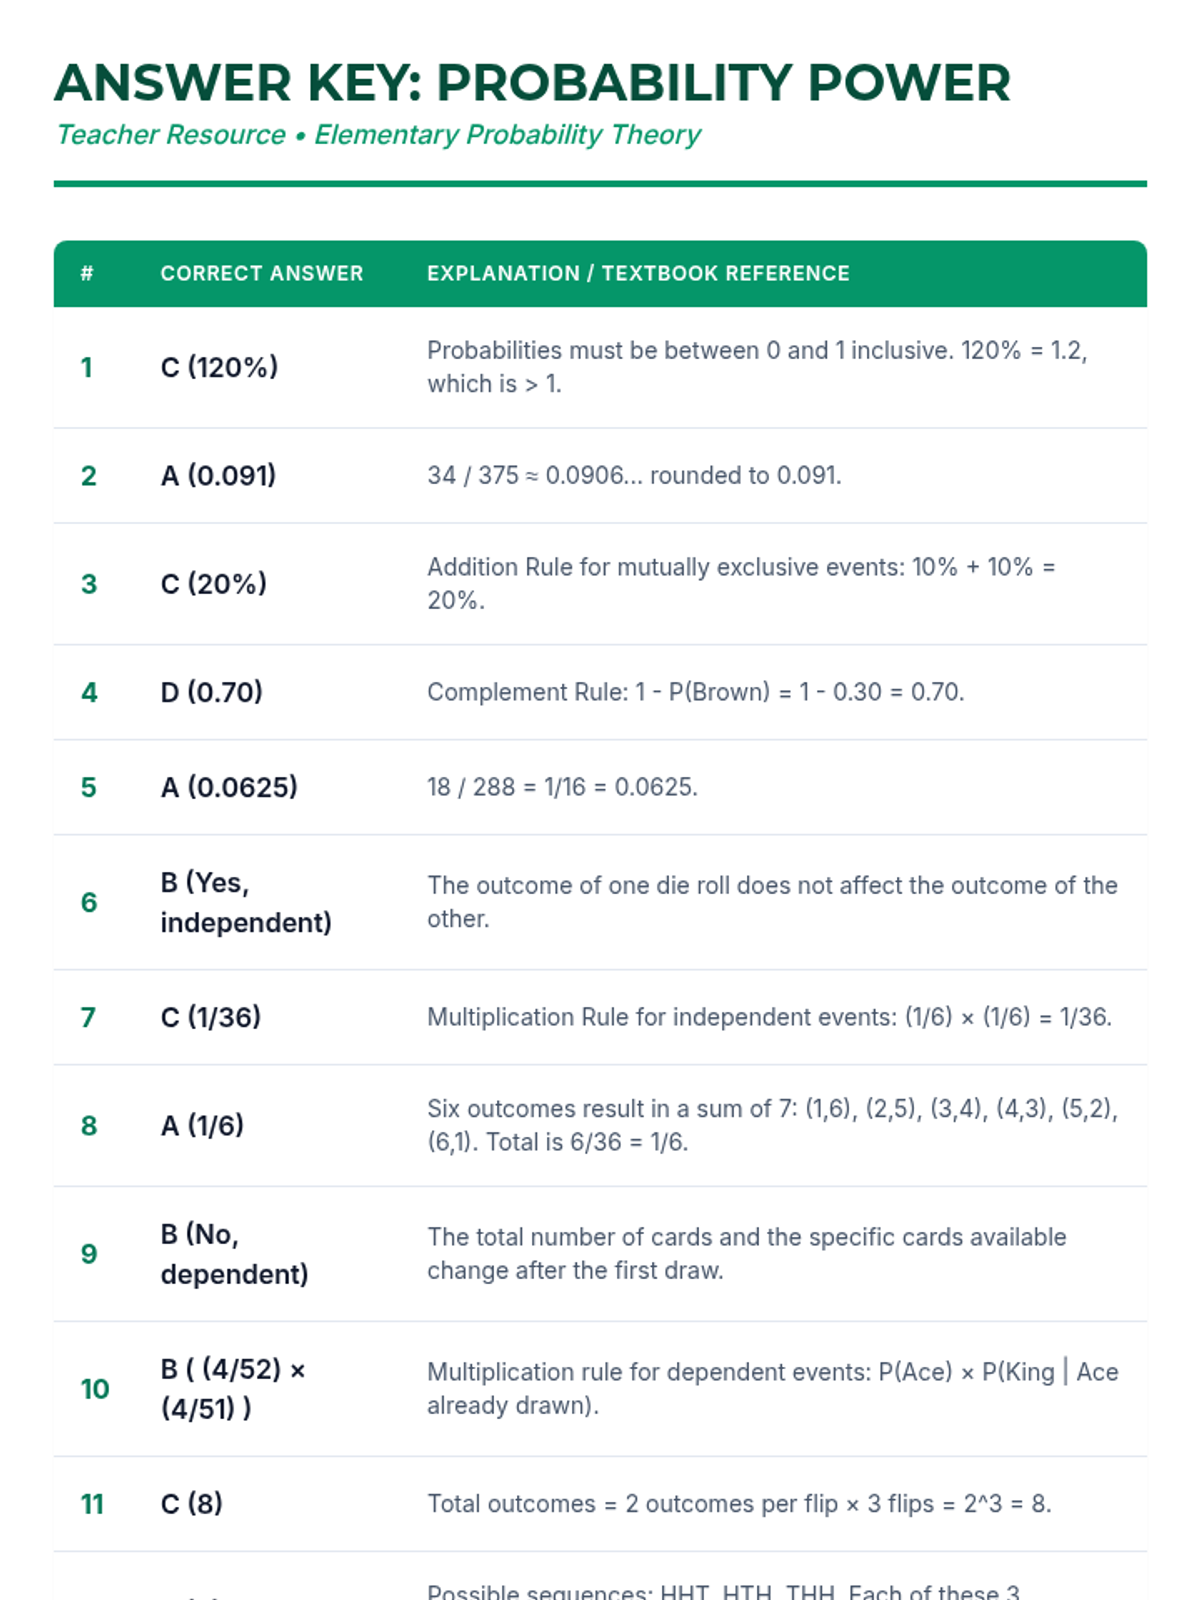
A comprehensive lesson on elementary probability theory covering valid probability ranges, compound events, independent and dependent outcomes, and tree diagrams based on textbook problems.
A comprehensive assessment covering discrete random variables, permutations, combinations, and the binomial probability distribution based on real-world statistical data.
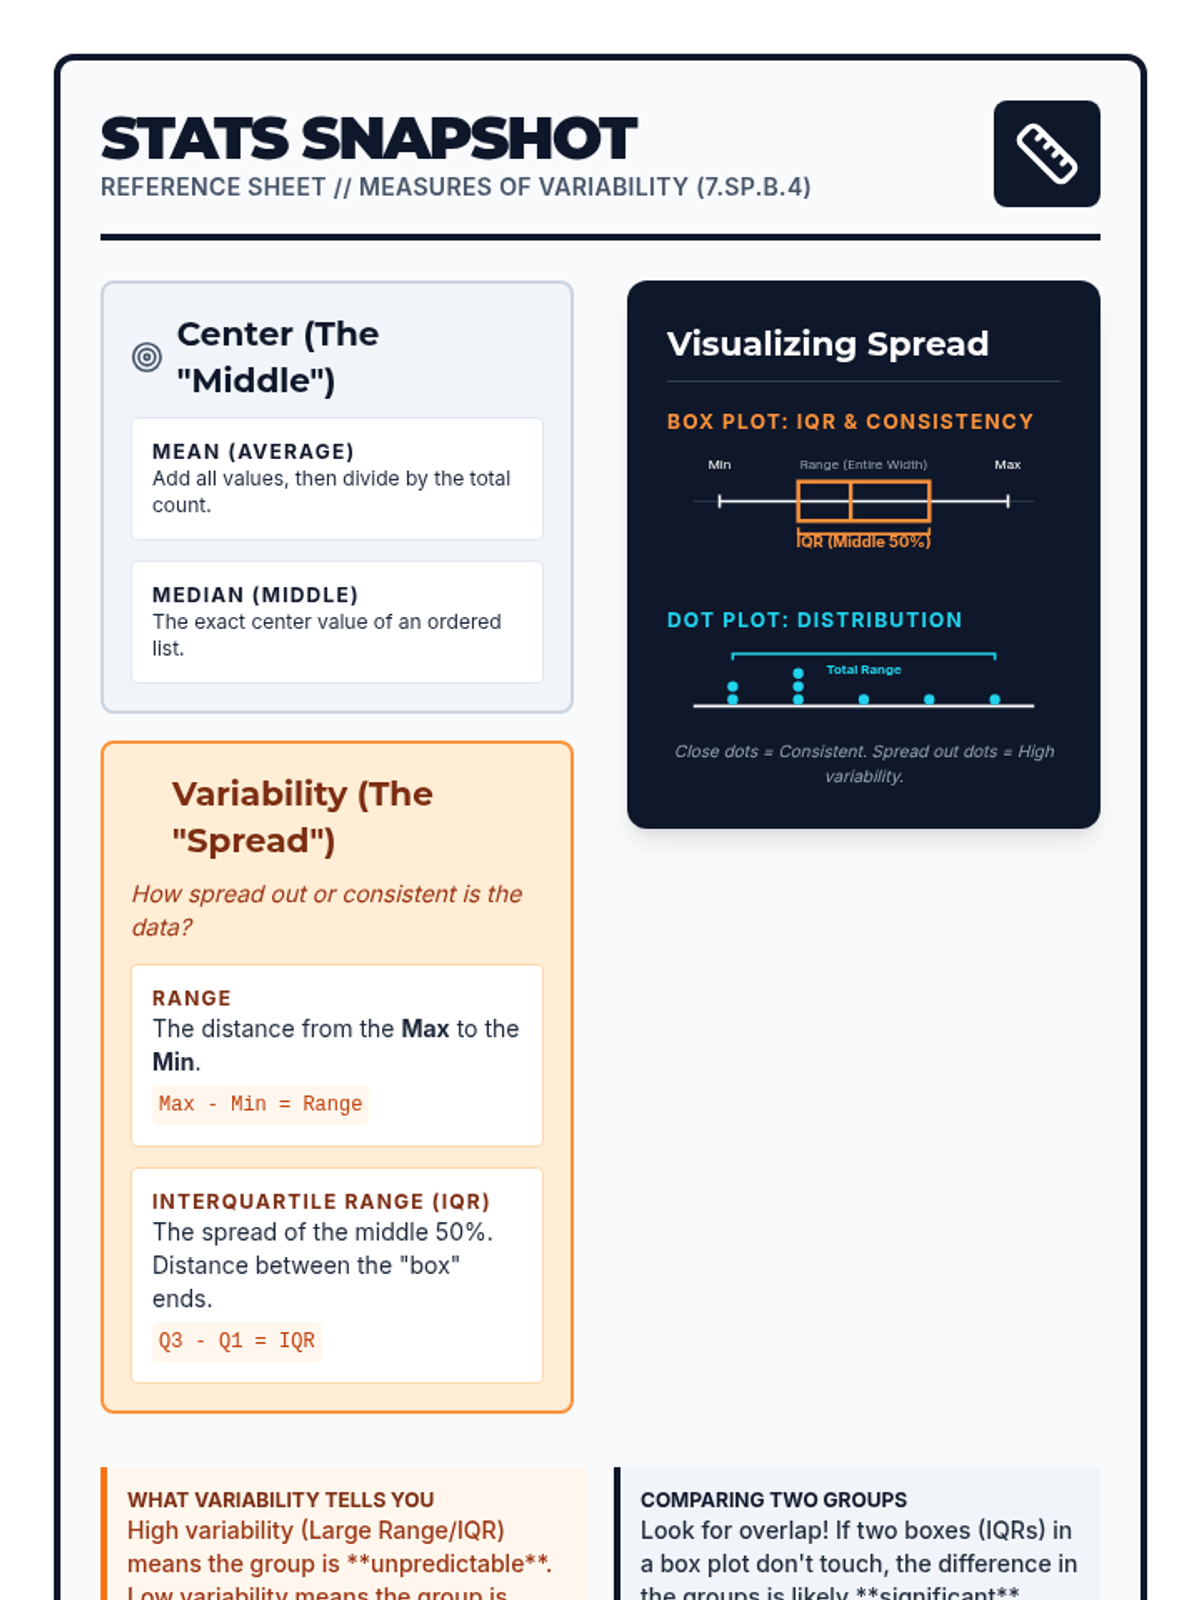
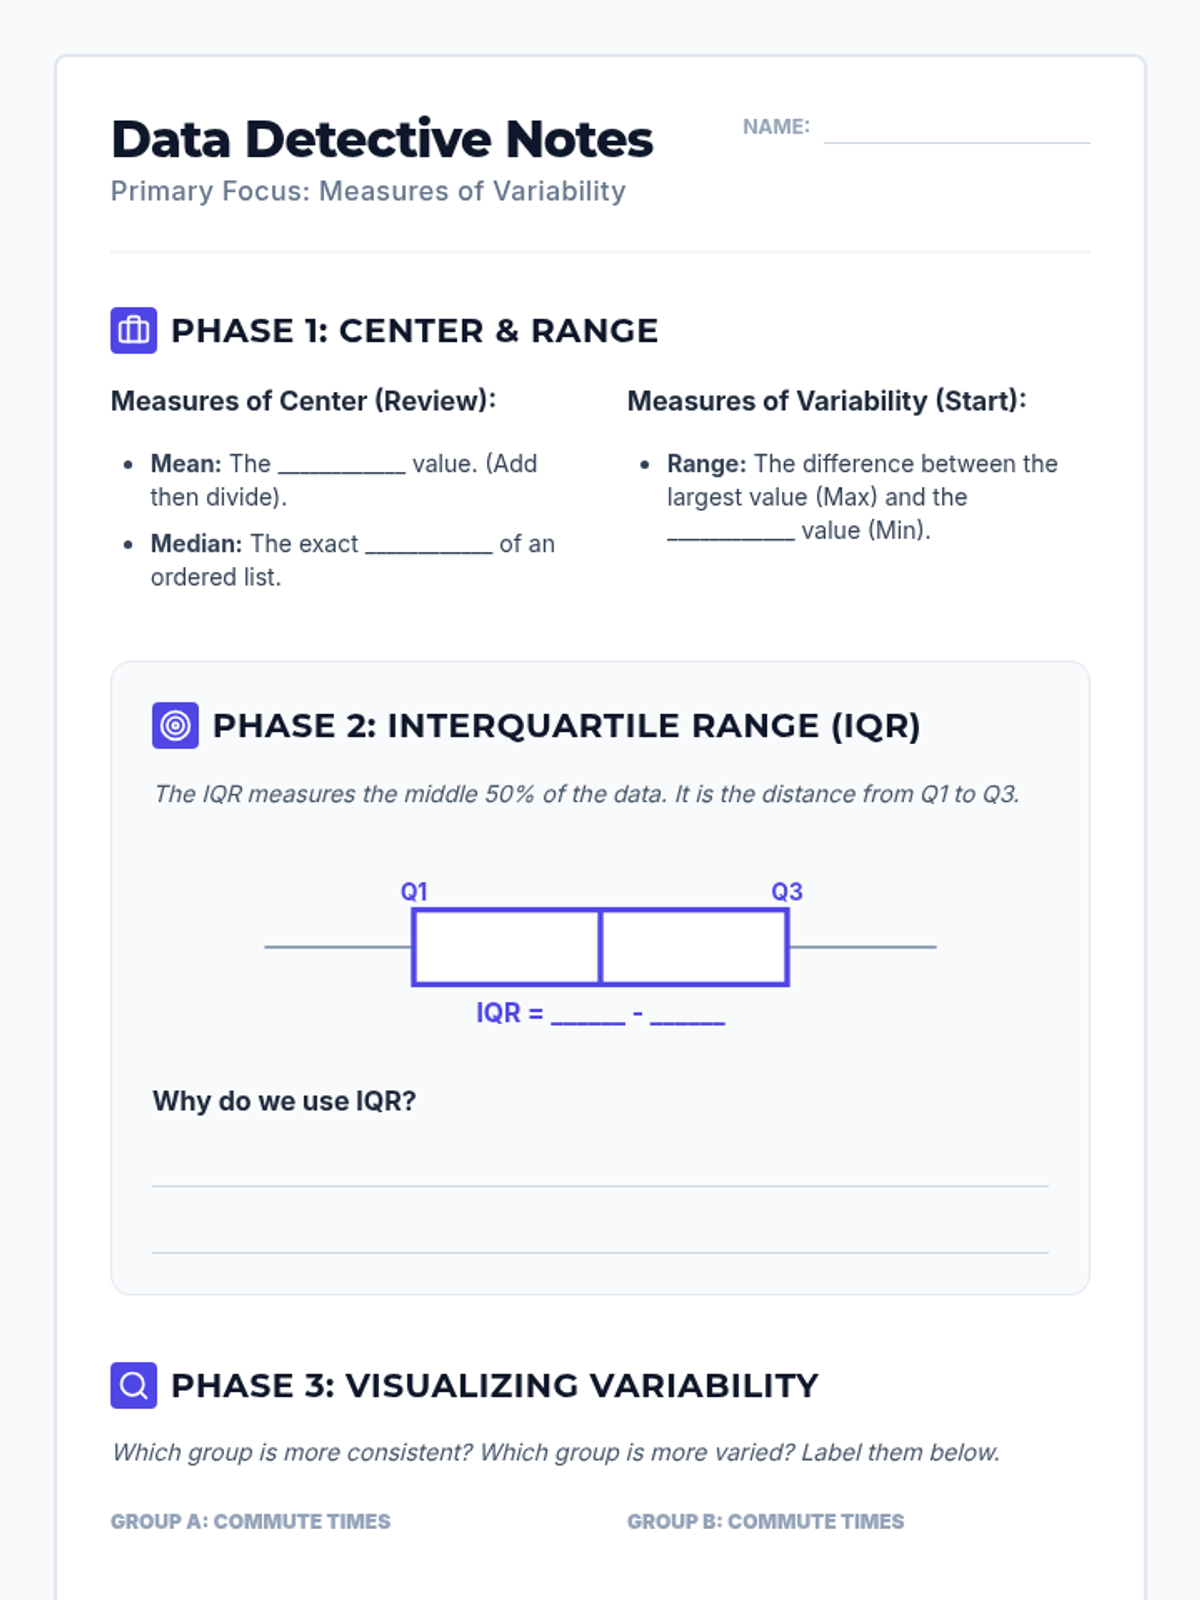
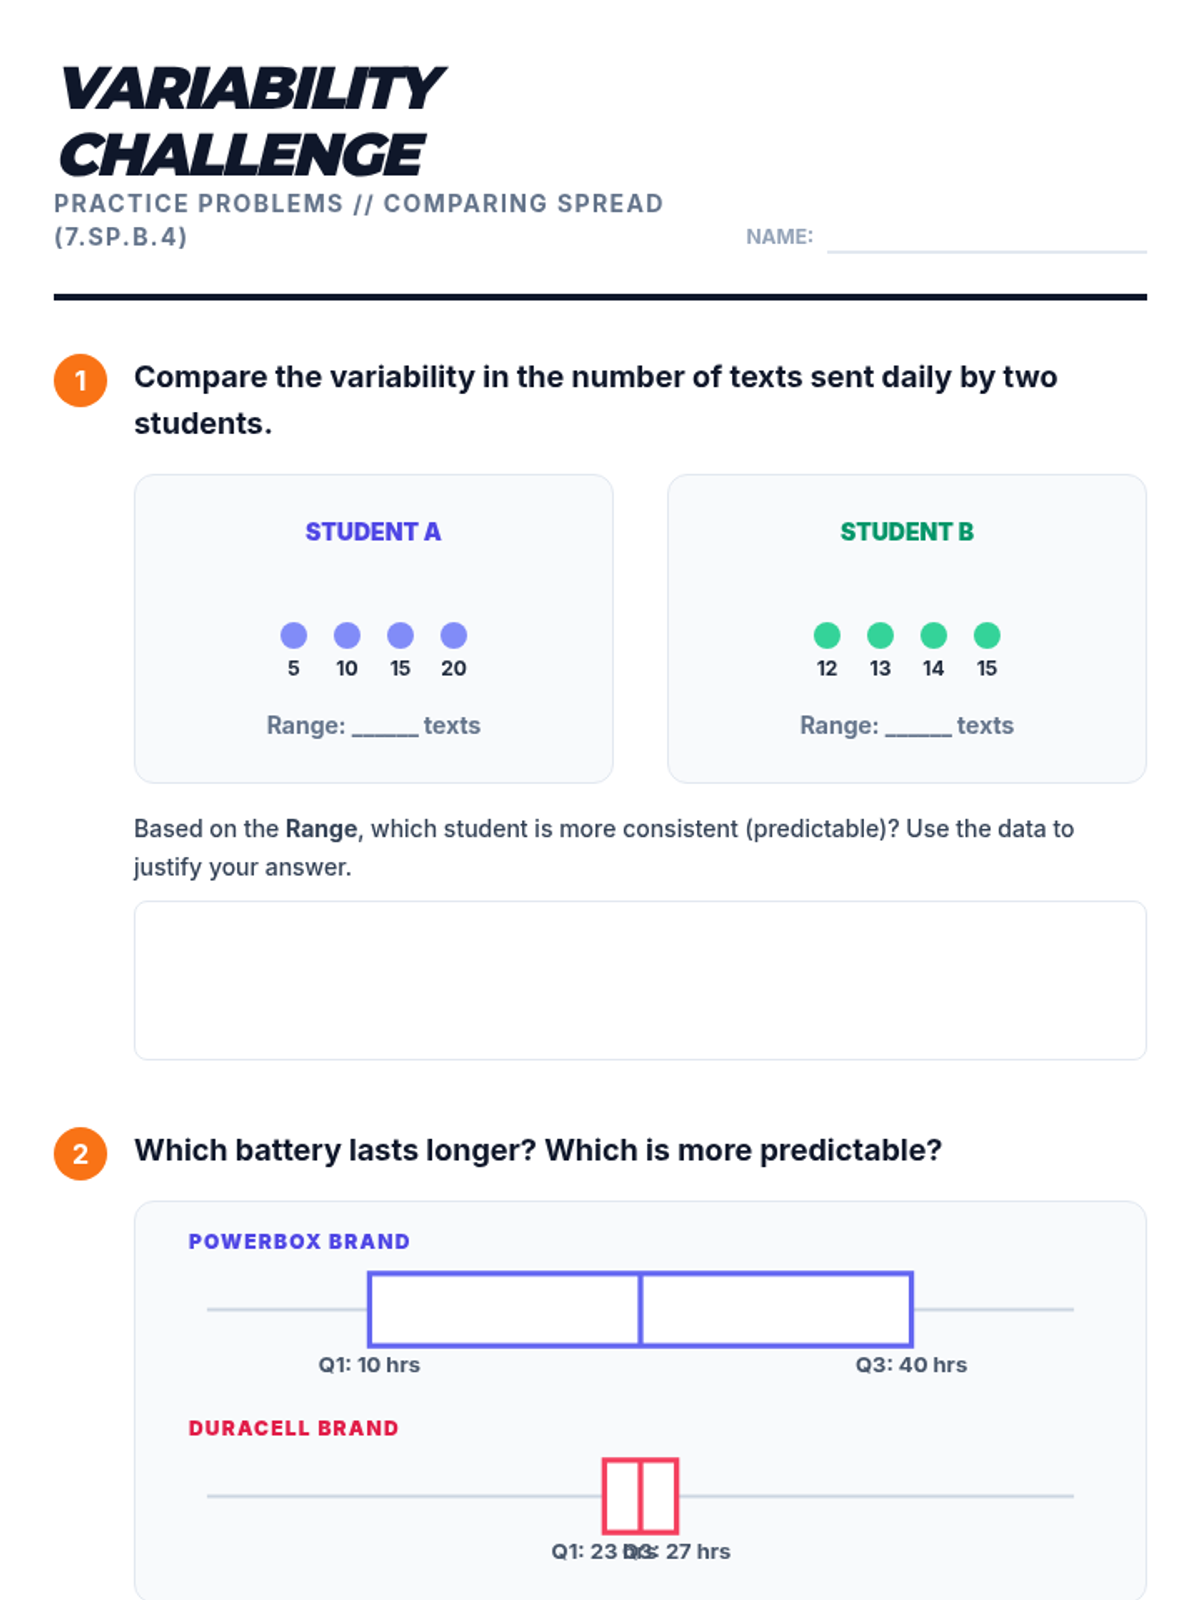
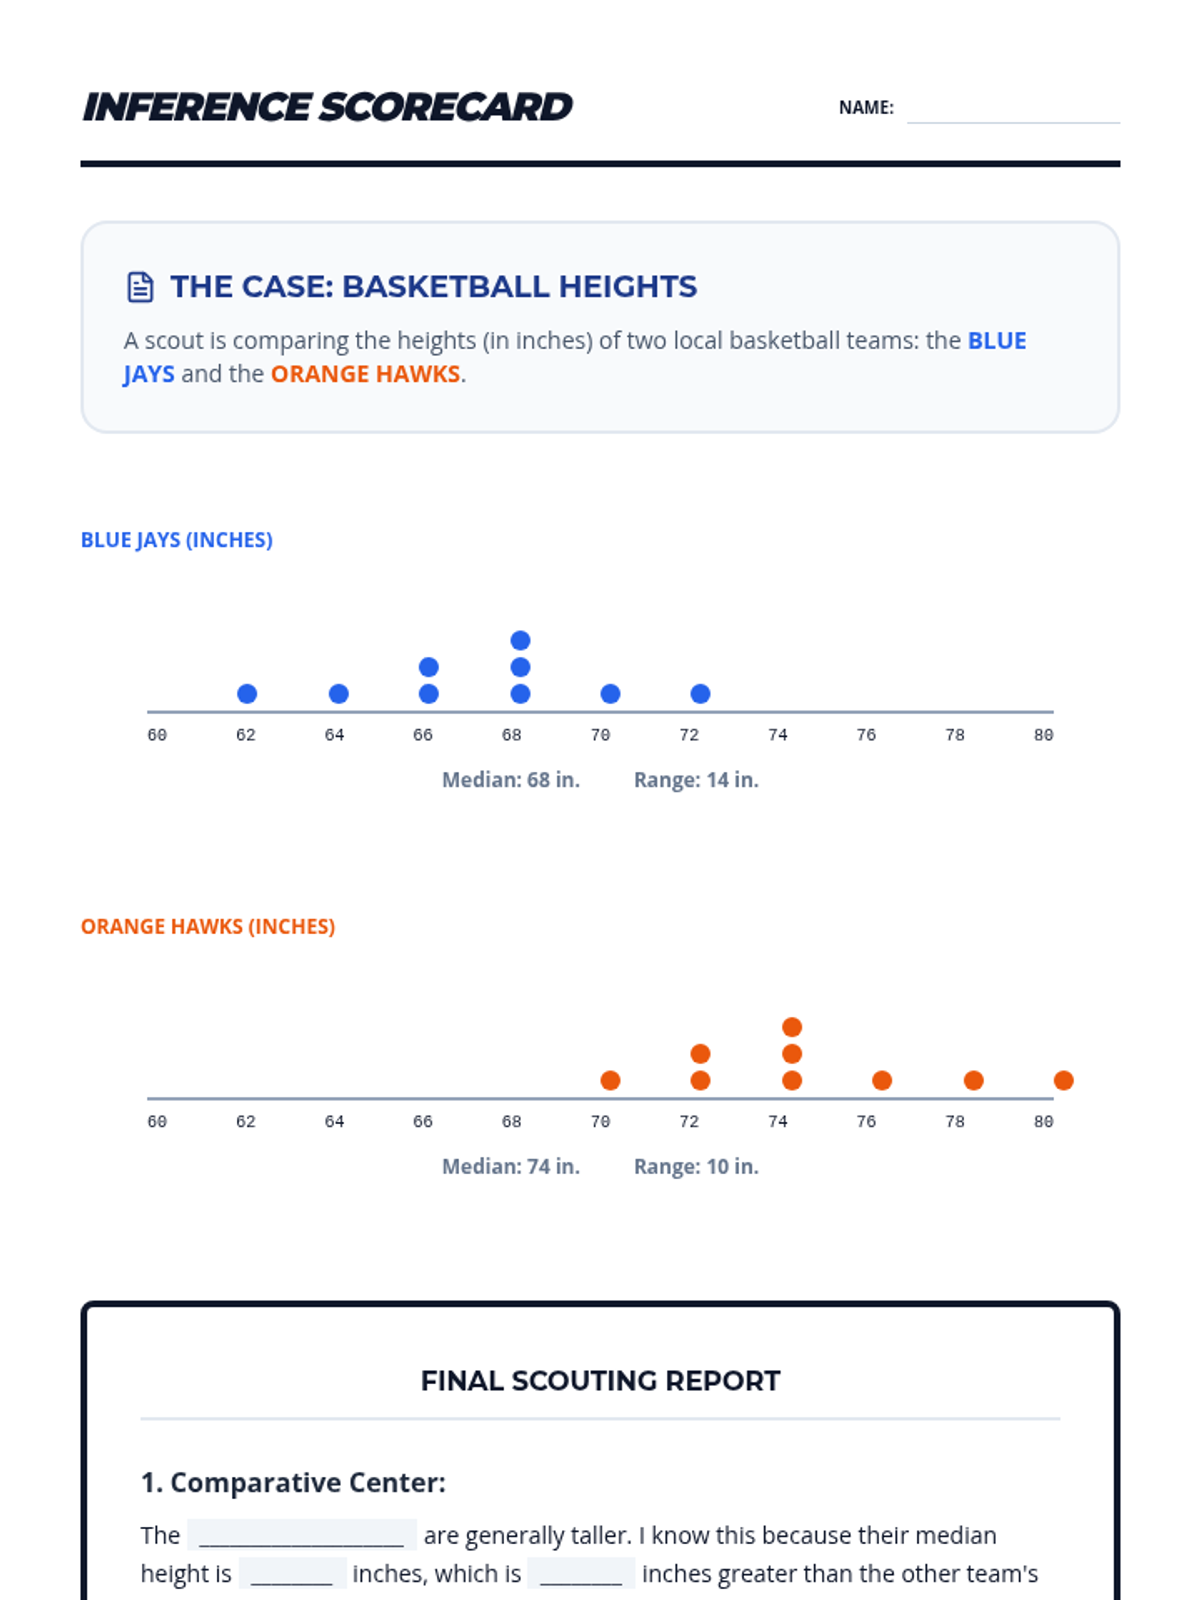
A mini-lesson on comparing two populations using measures of center (mean, median) and variability (IQR) based on CCSS 7.SP.4. Includes guided notes, practice problems, and a reference sheet.
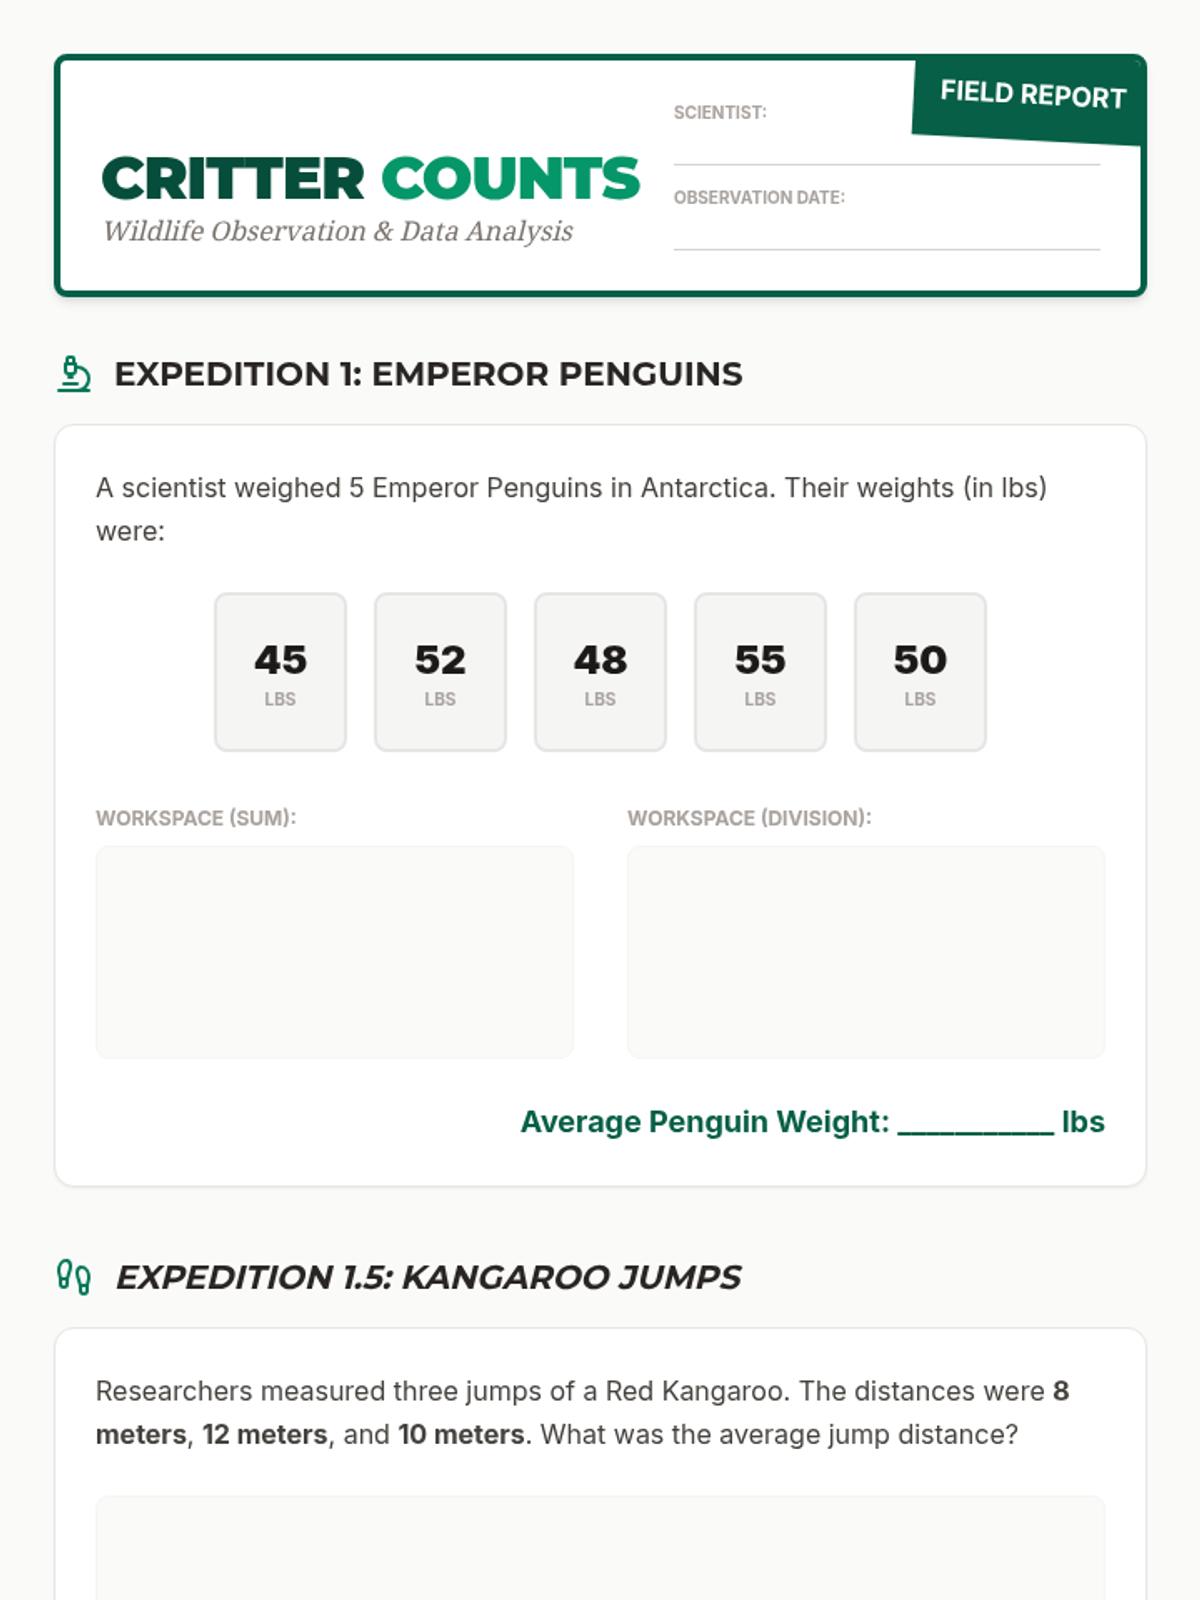
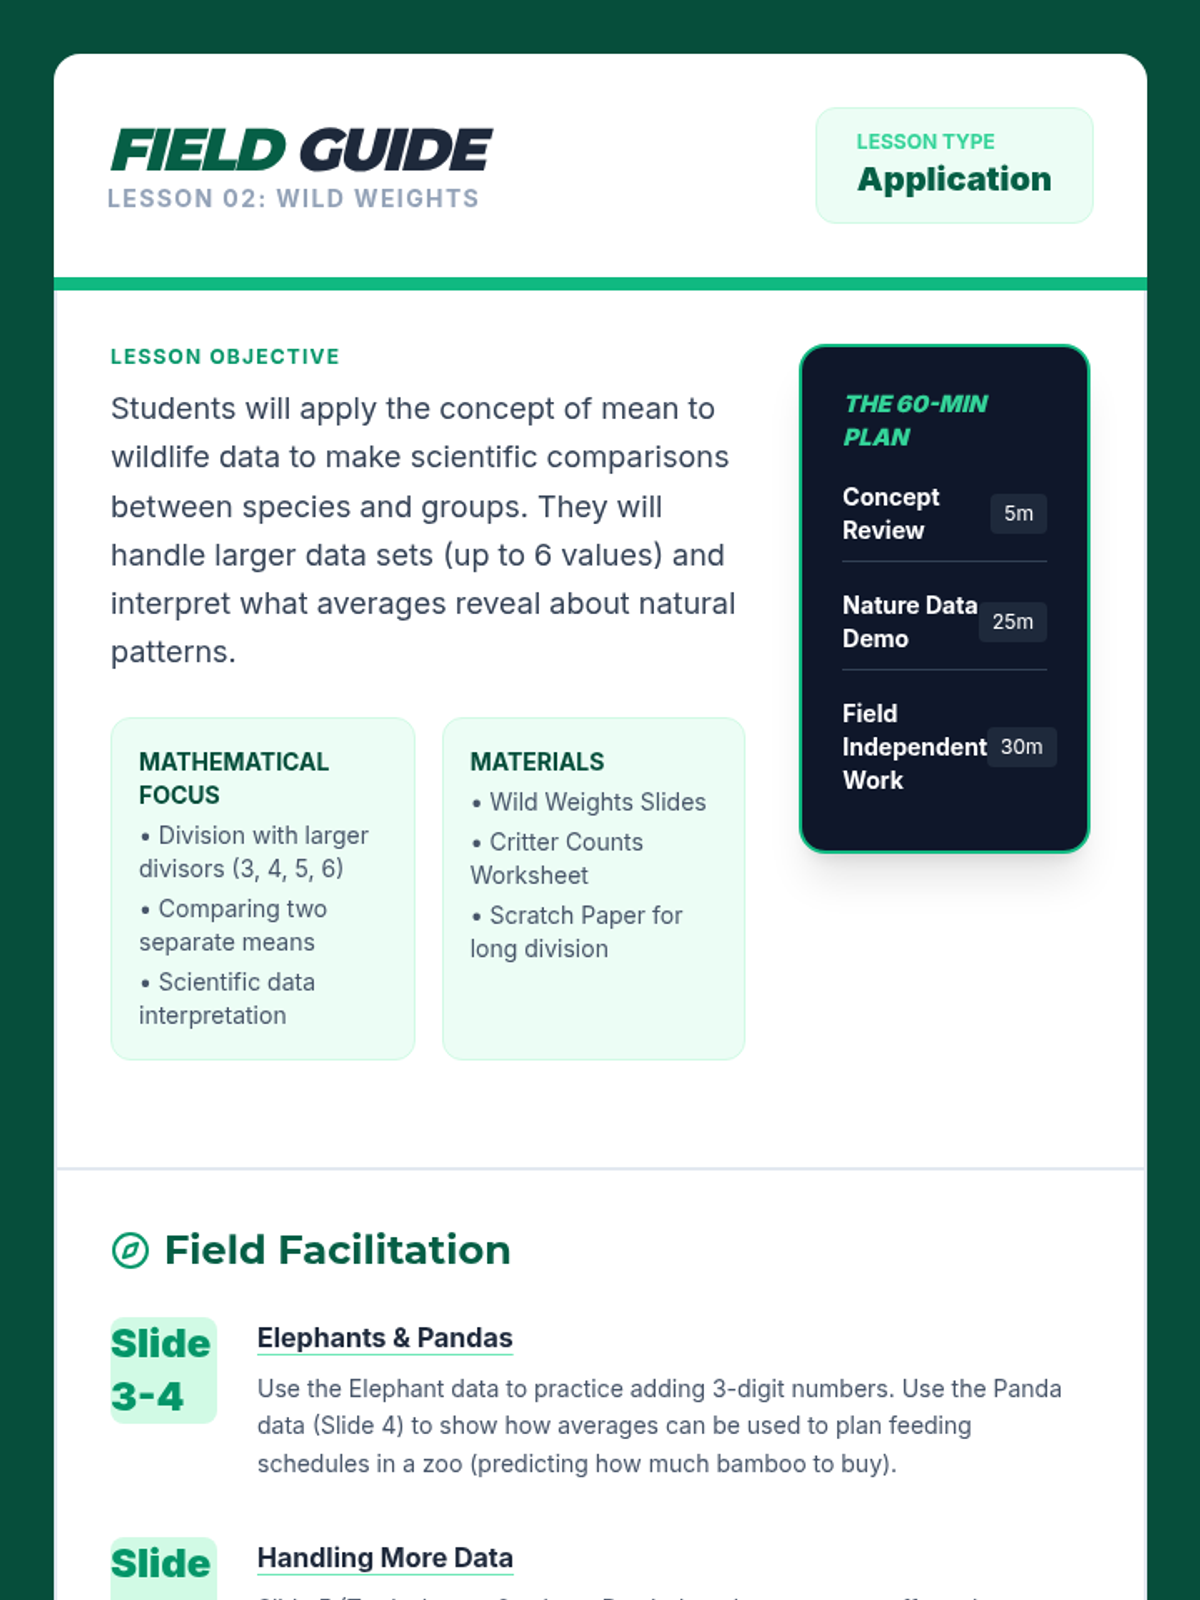
Applying the mean to animal data sets, exploring how averages help scientists understand the natural world.
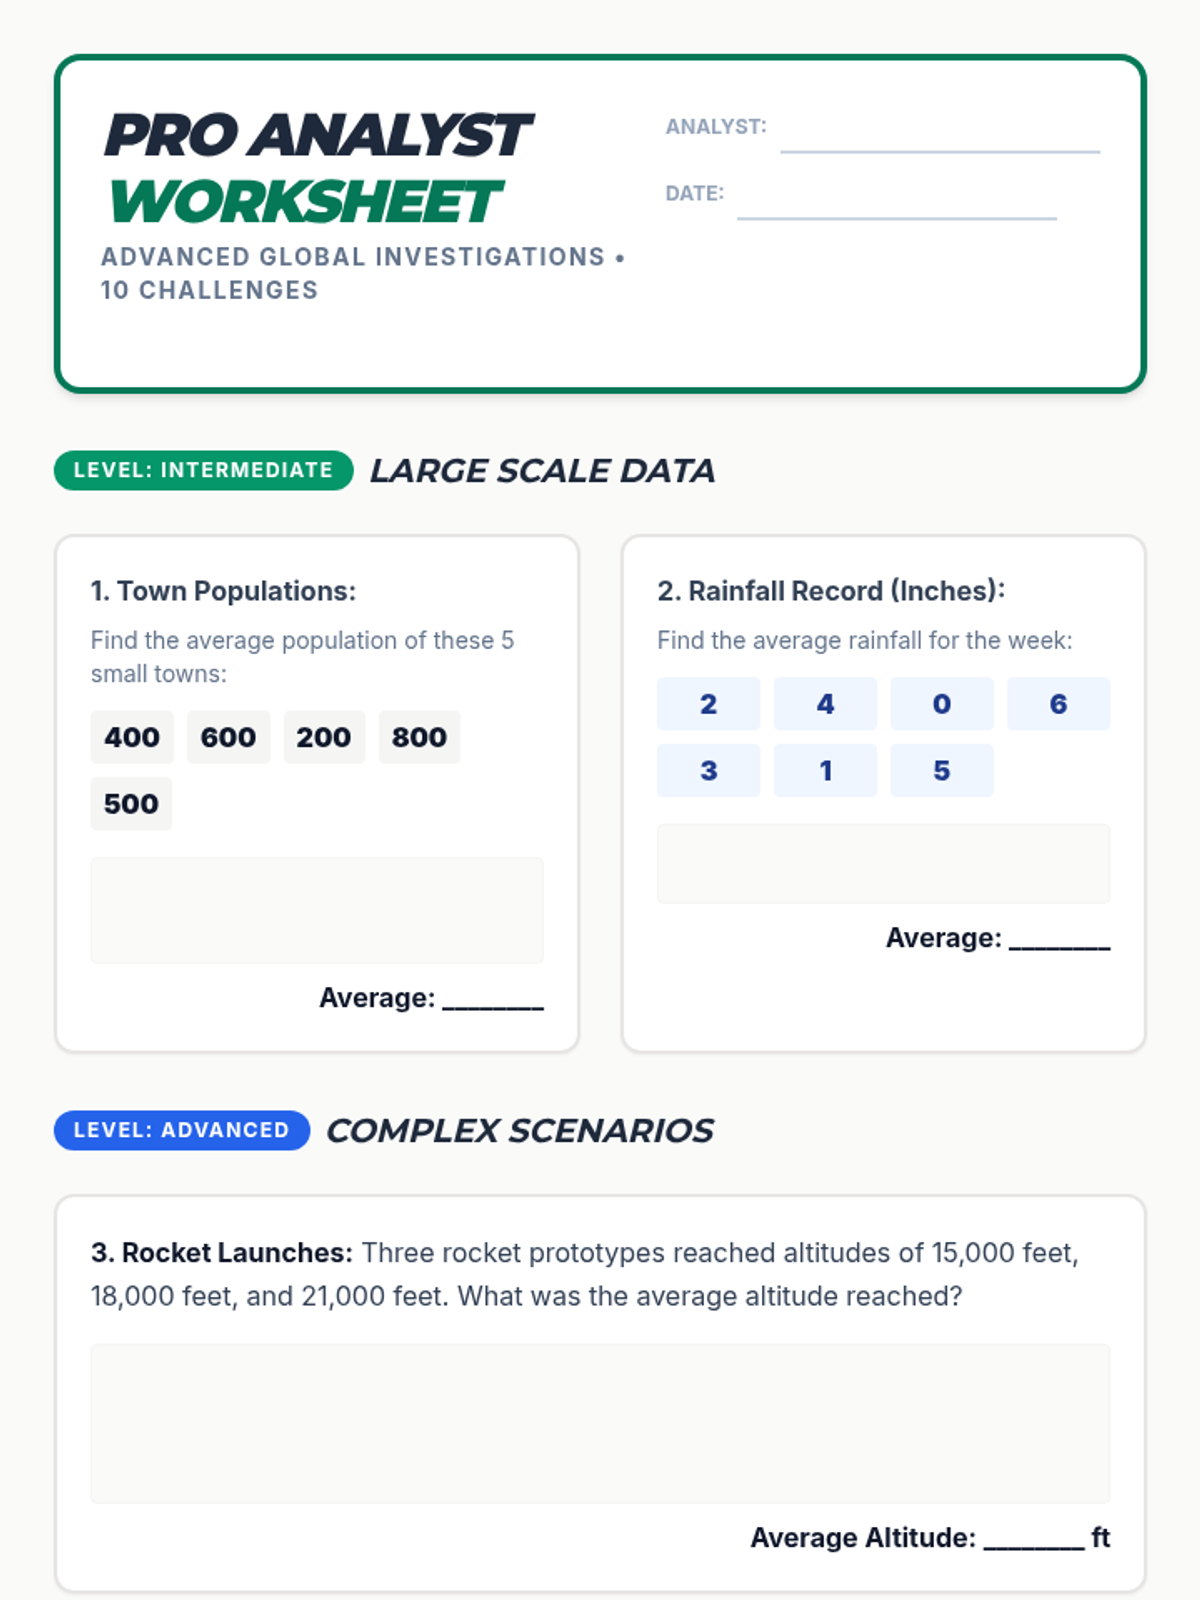
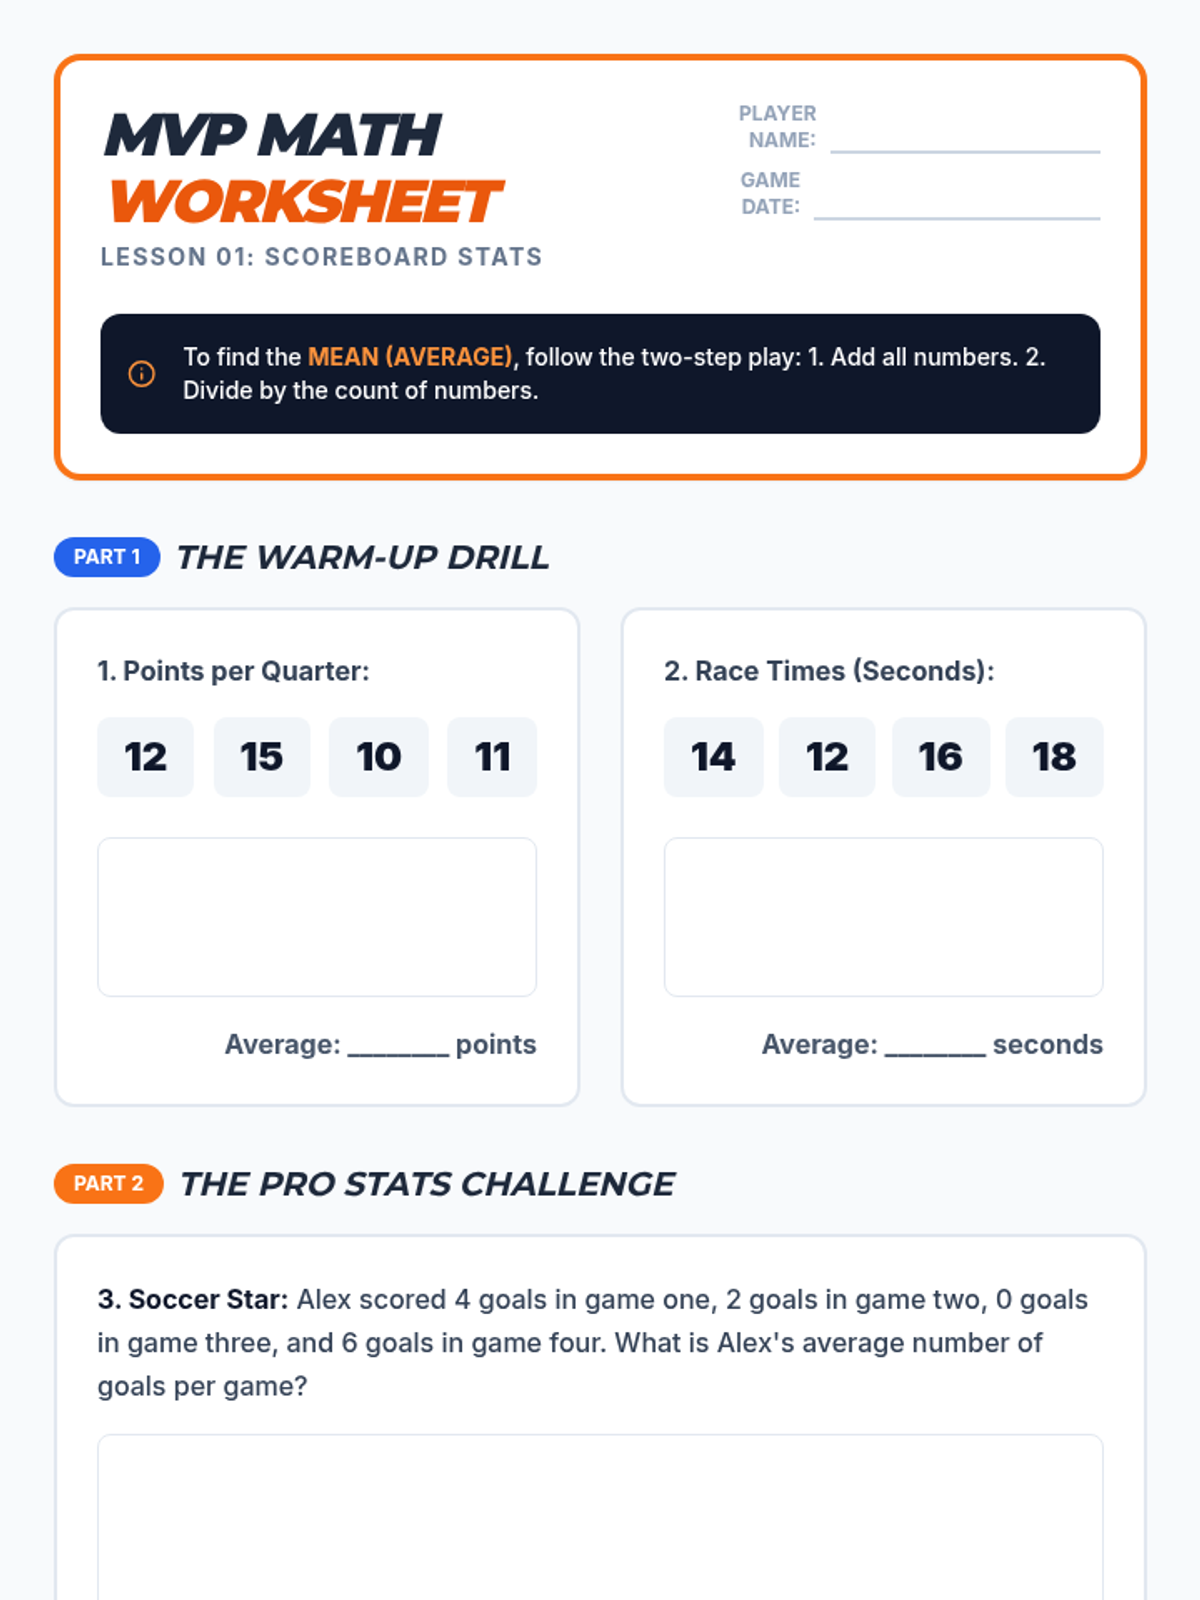
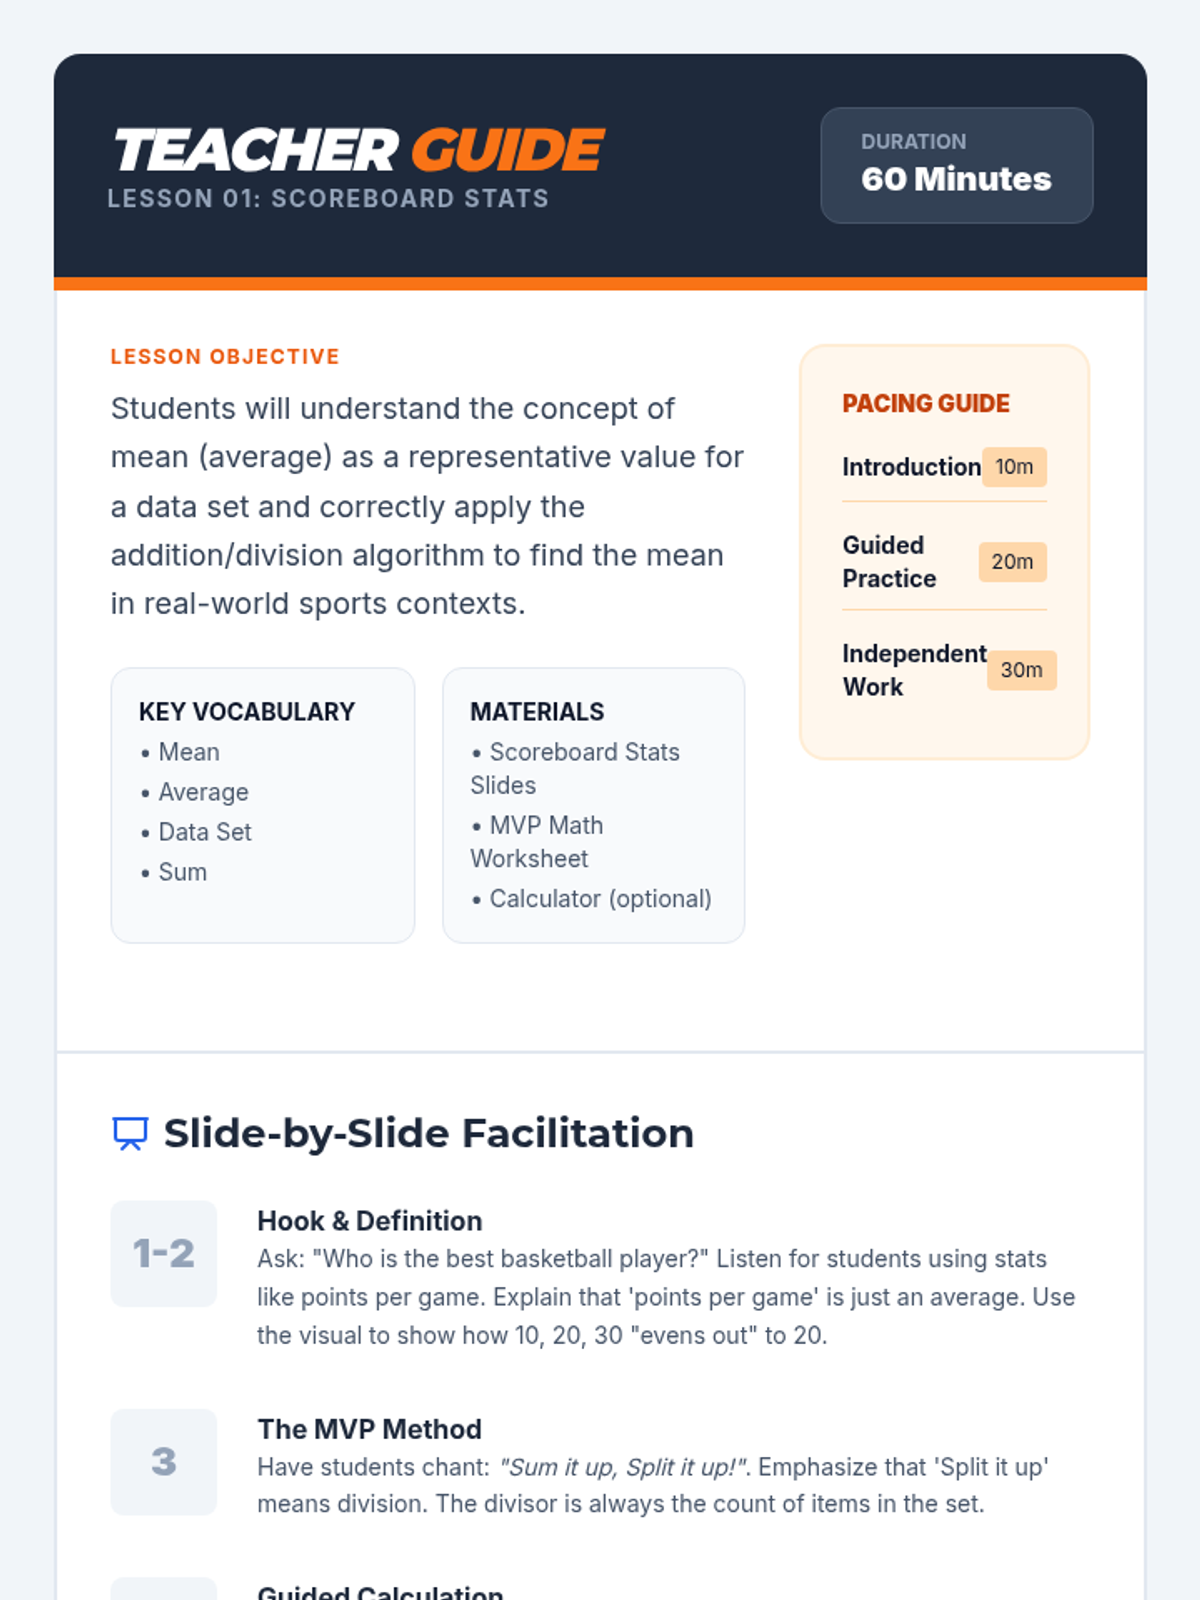
An introduction to the concept of averages using sports statistics, focusing on the 'add then divide' algorithm.
A comprehensive lesson focusing on constructing and interpreting confidence intervals for population means, specifically targeting how various factors like sample size and confidence level influence the margin of error.
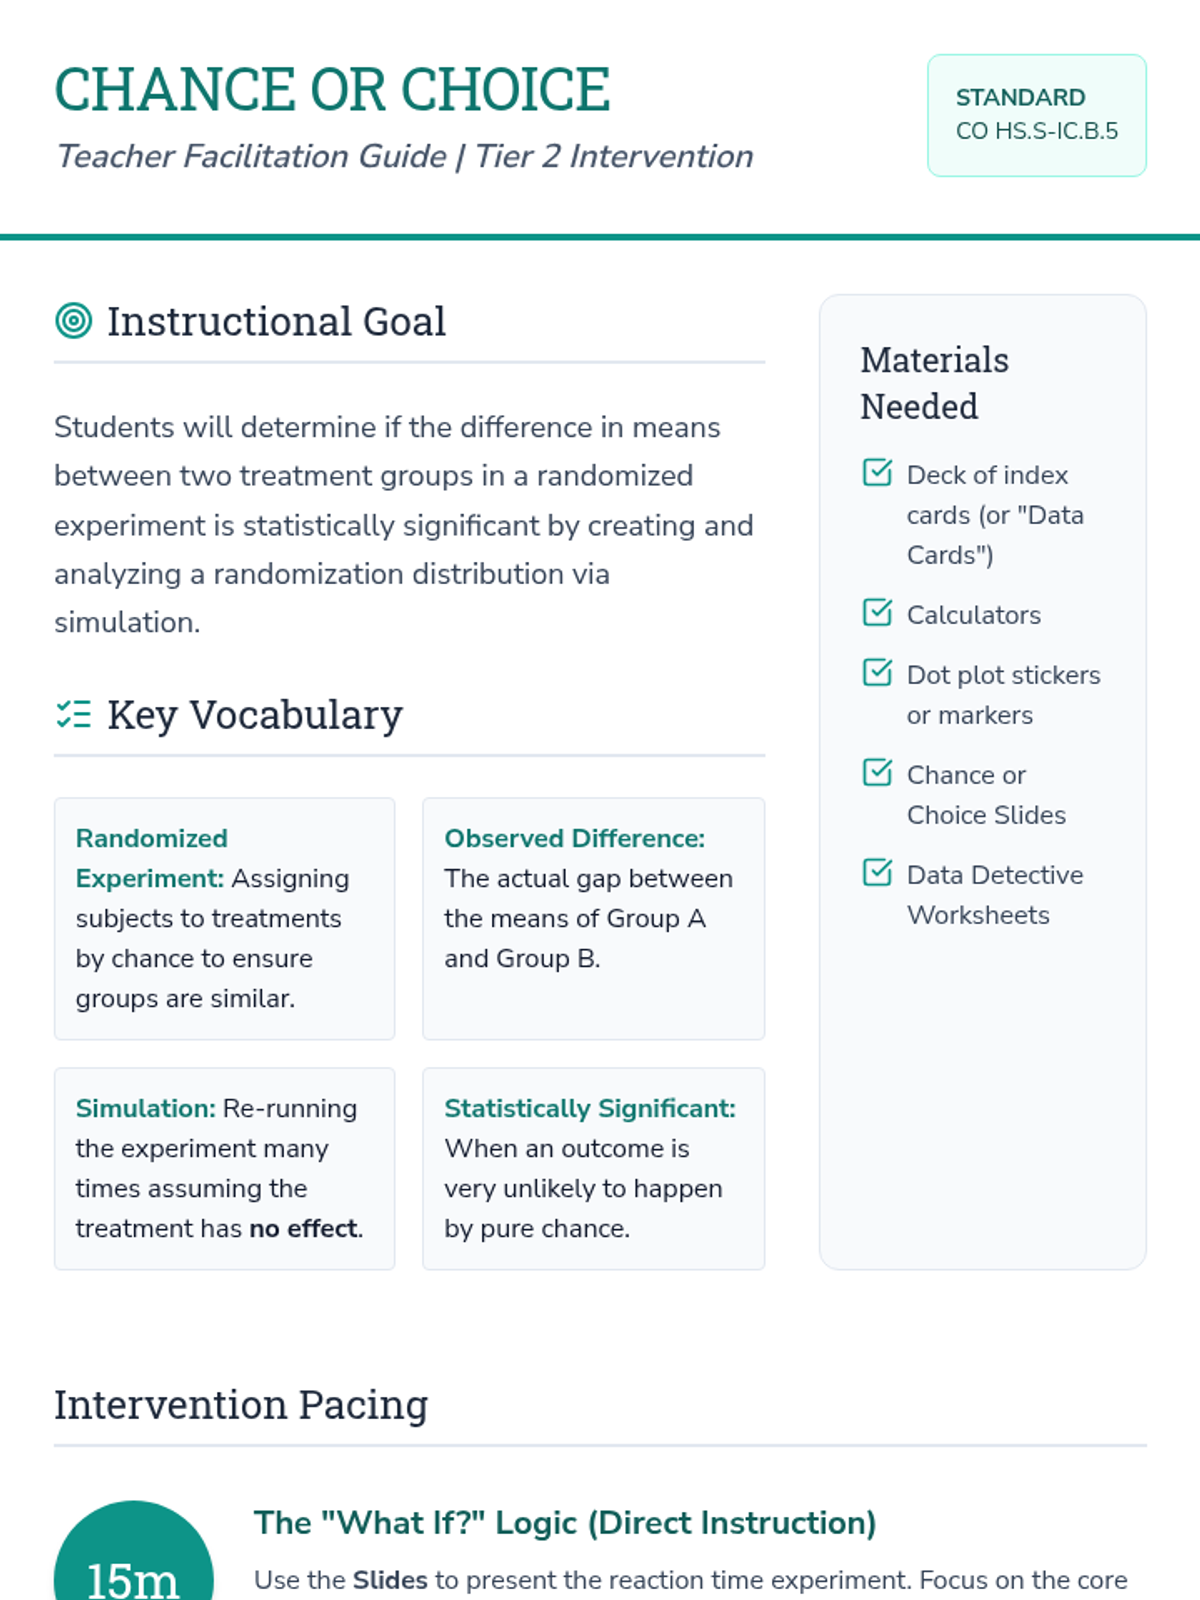
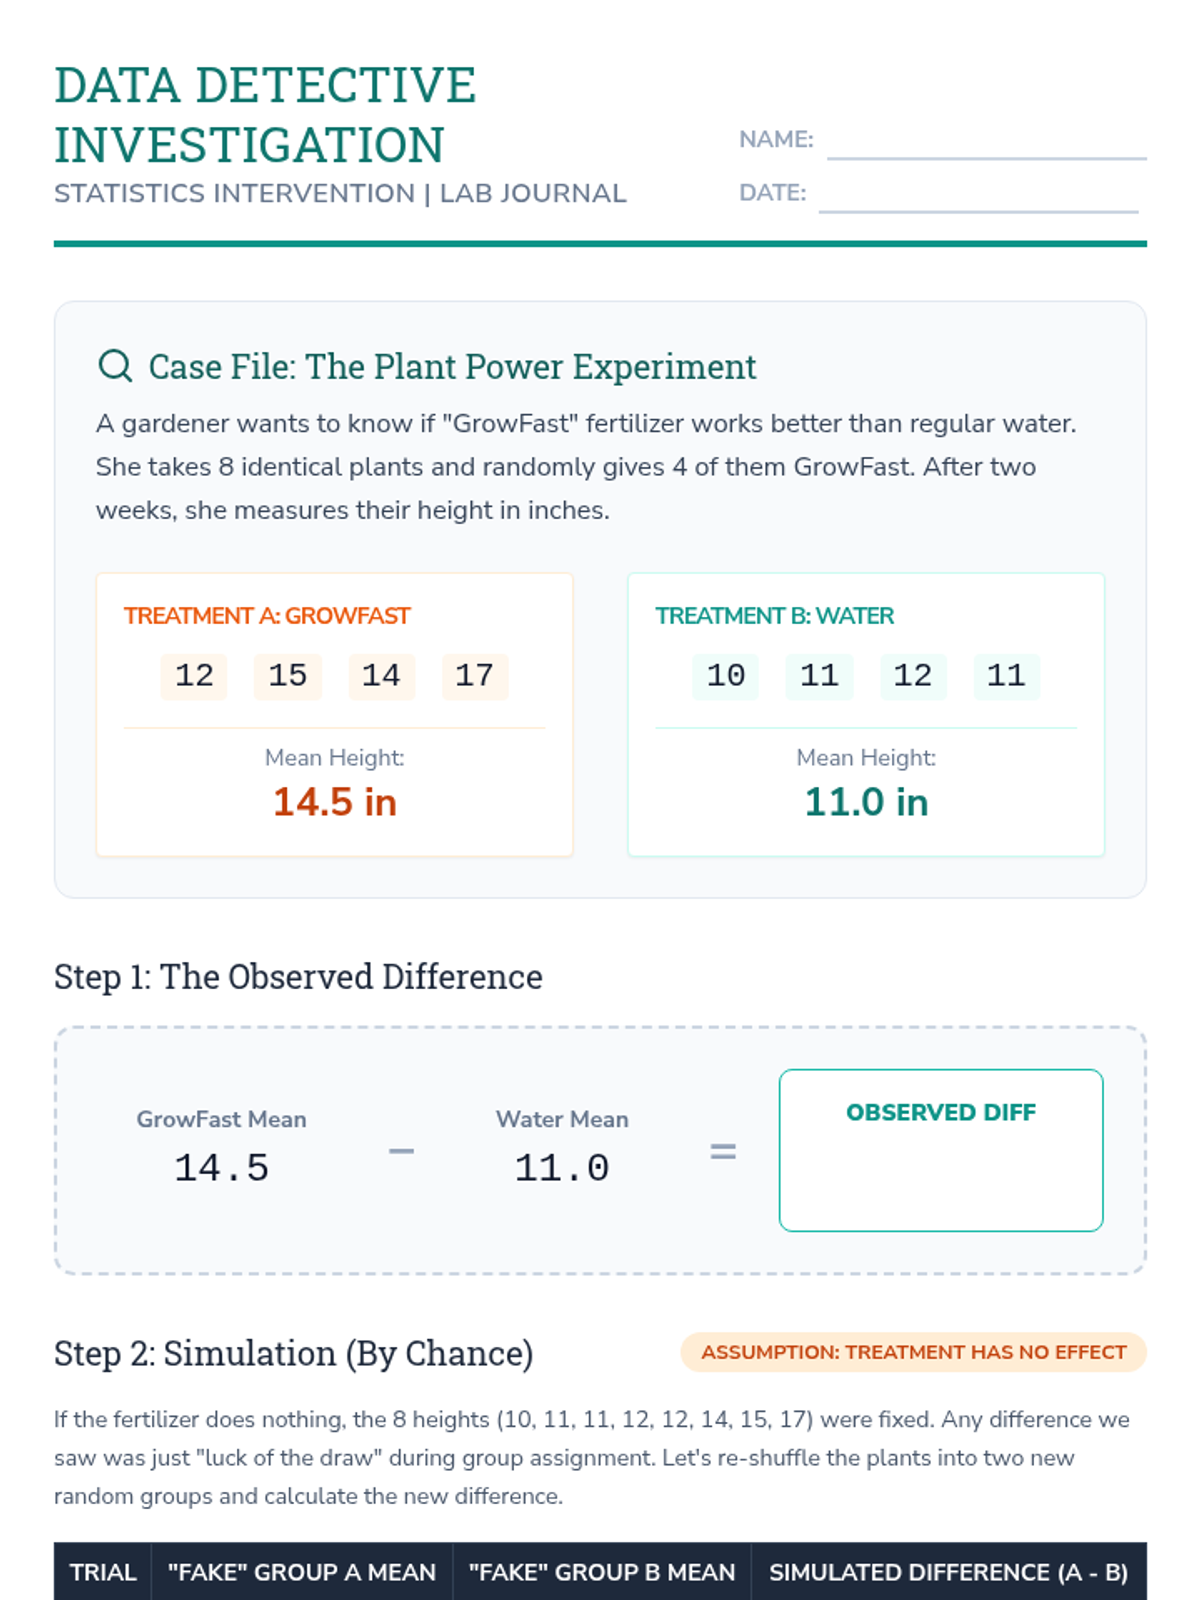
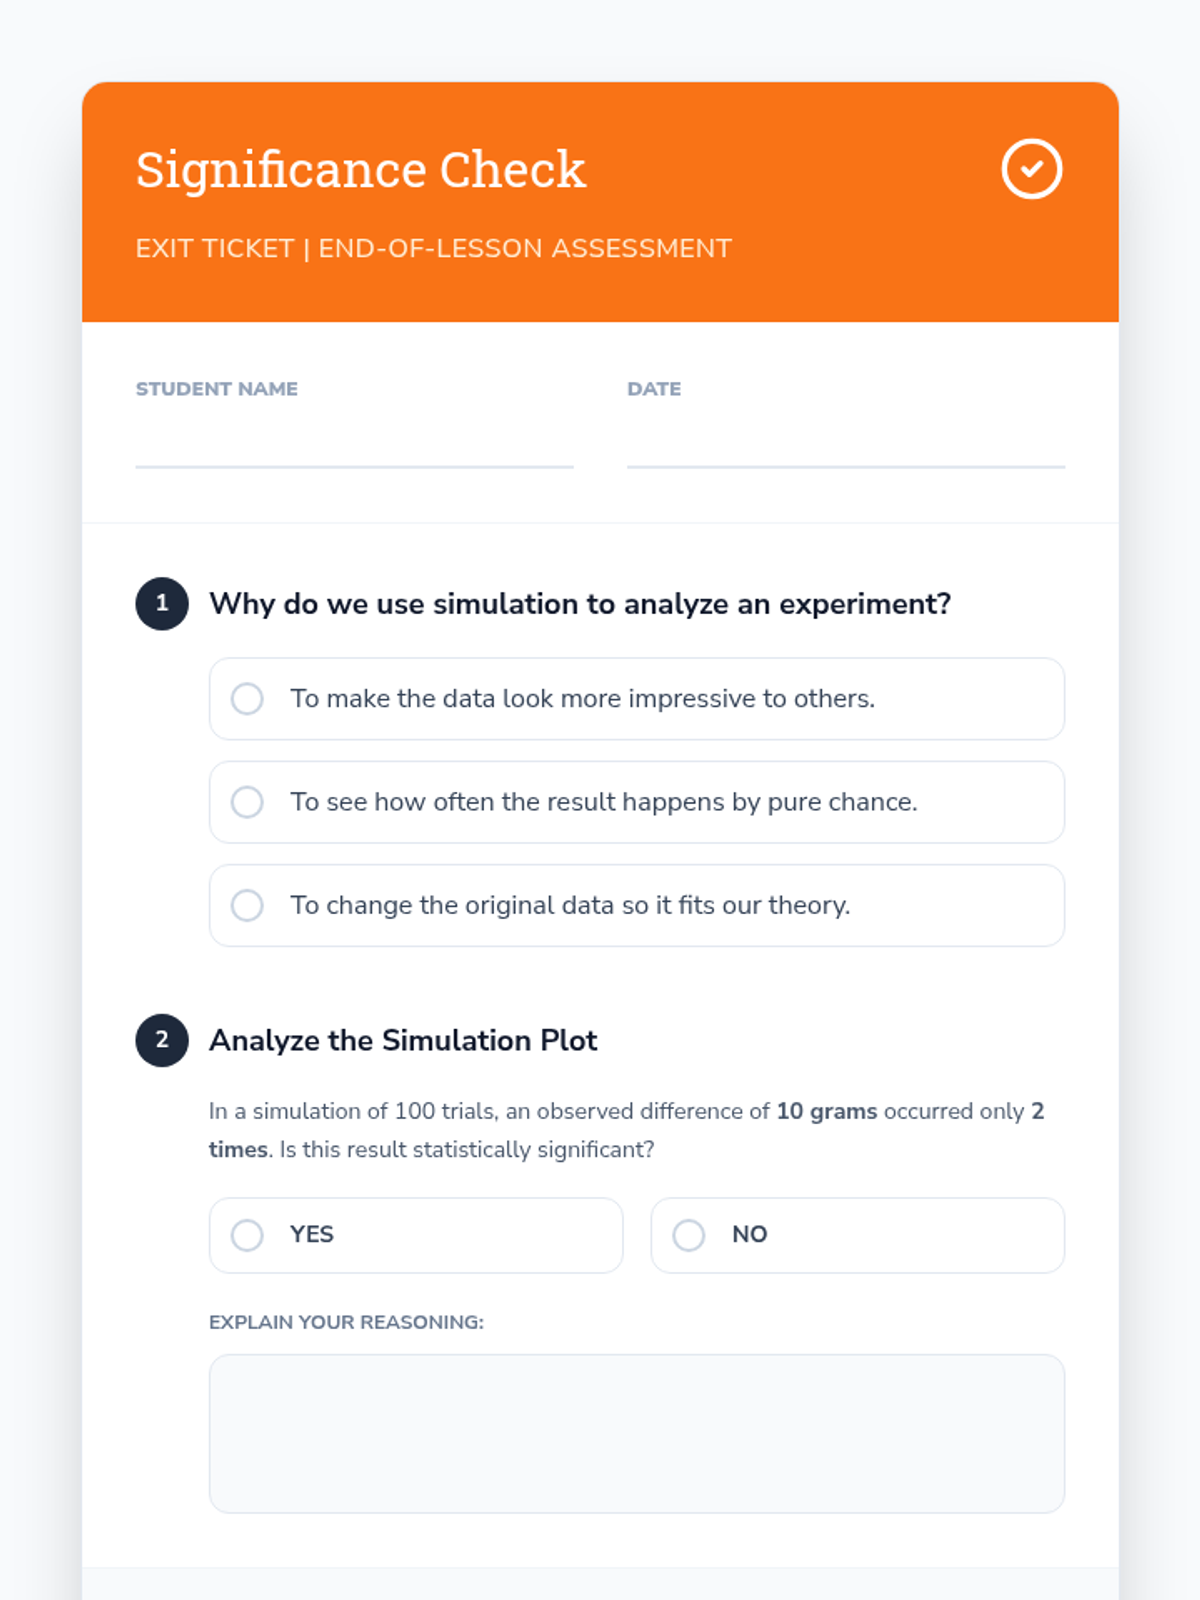
A Tier 2 intervention lesson focusing on randomized experiments and simulation-based significance testing. Students learn to determine if observed differences between two treatments are statistically significant using a hands-on shuffling simulation approach.
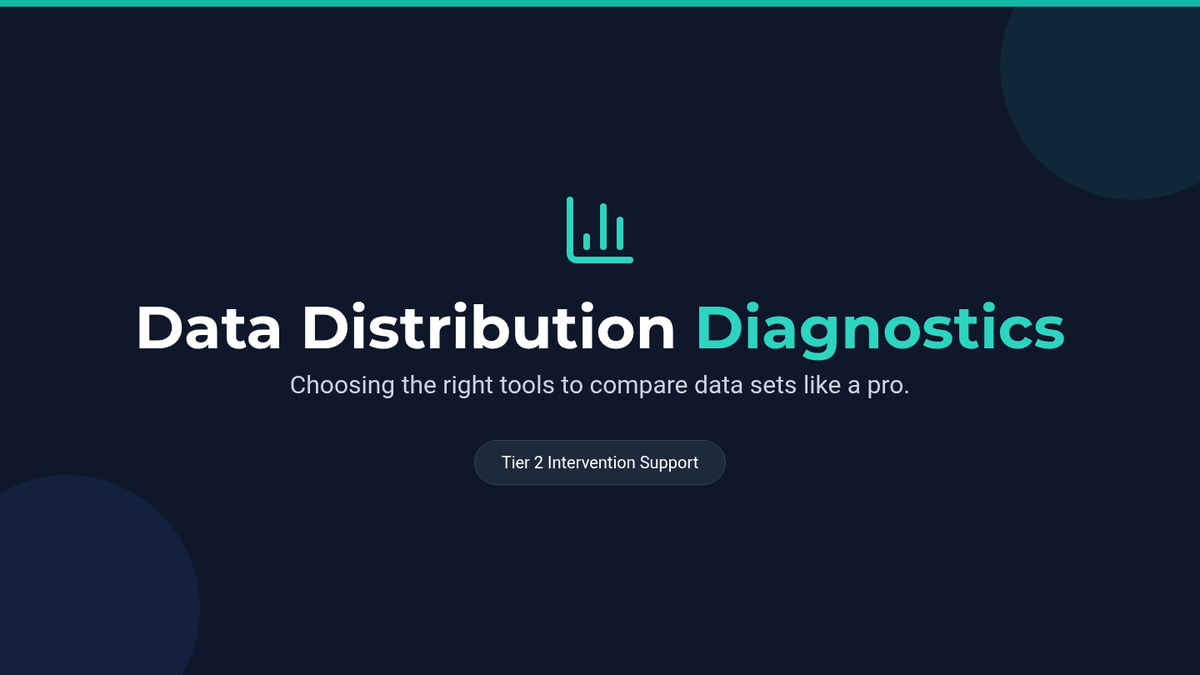
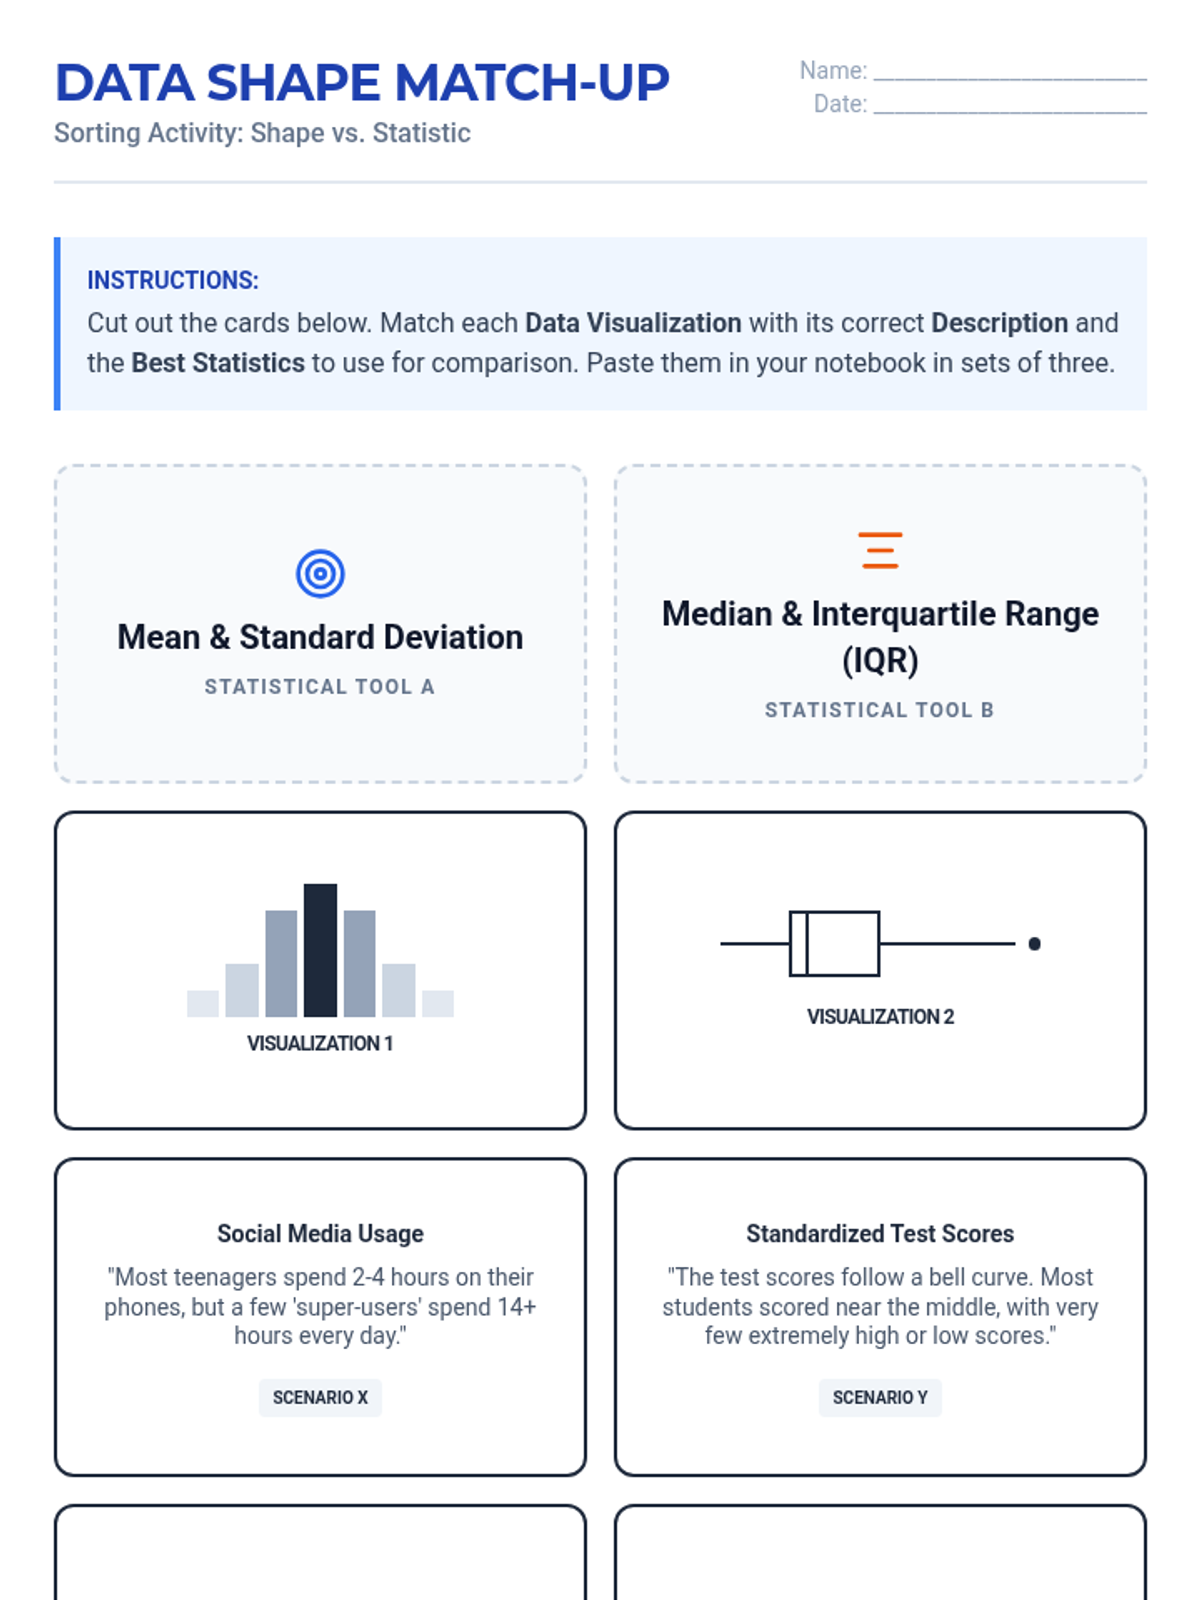
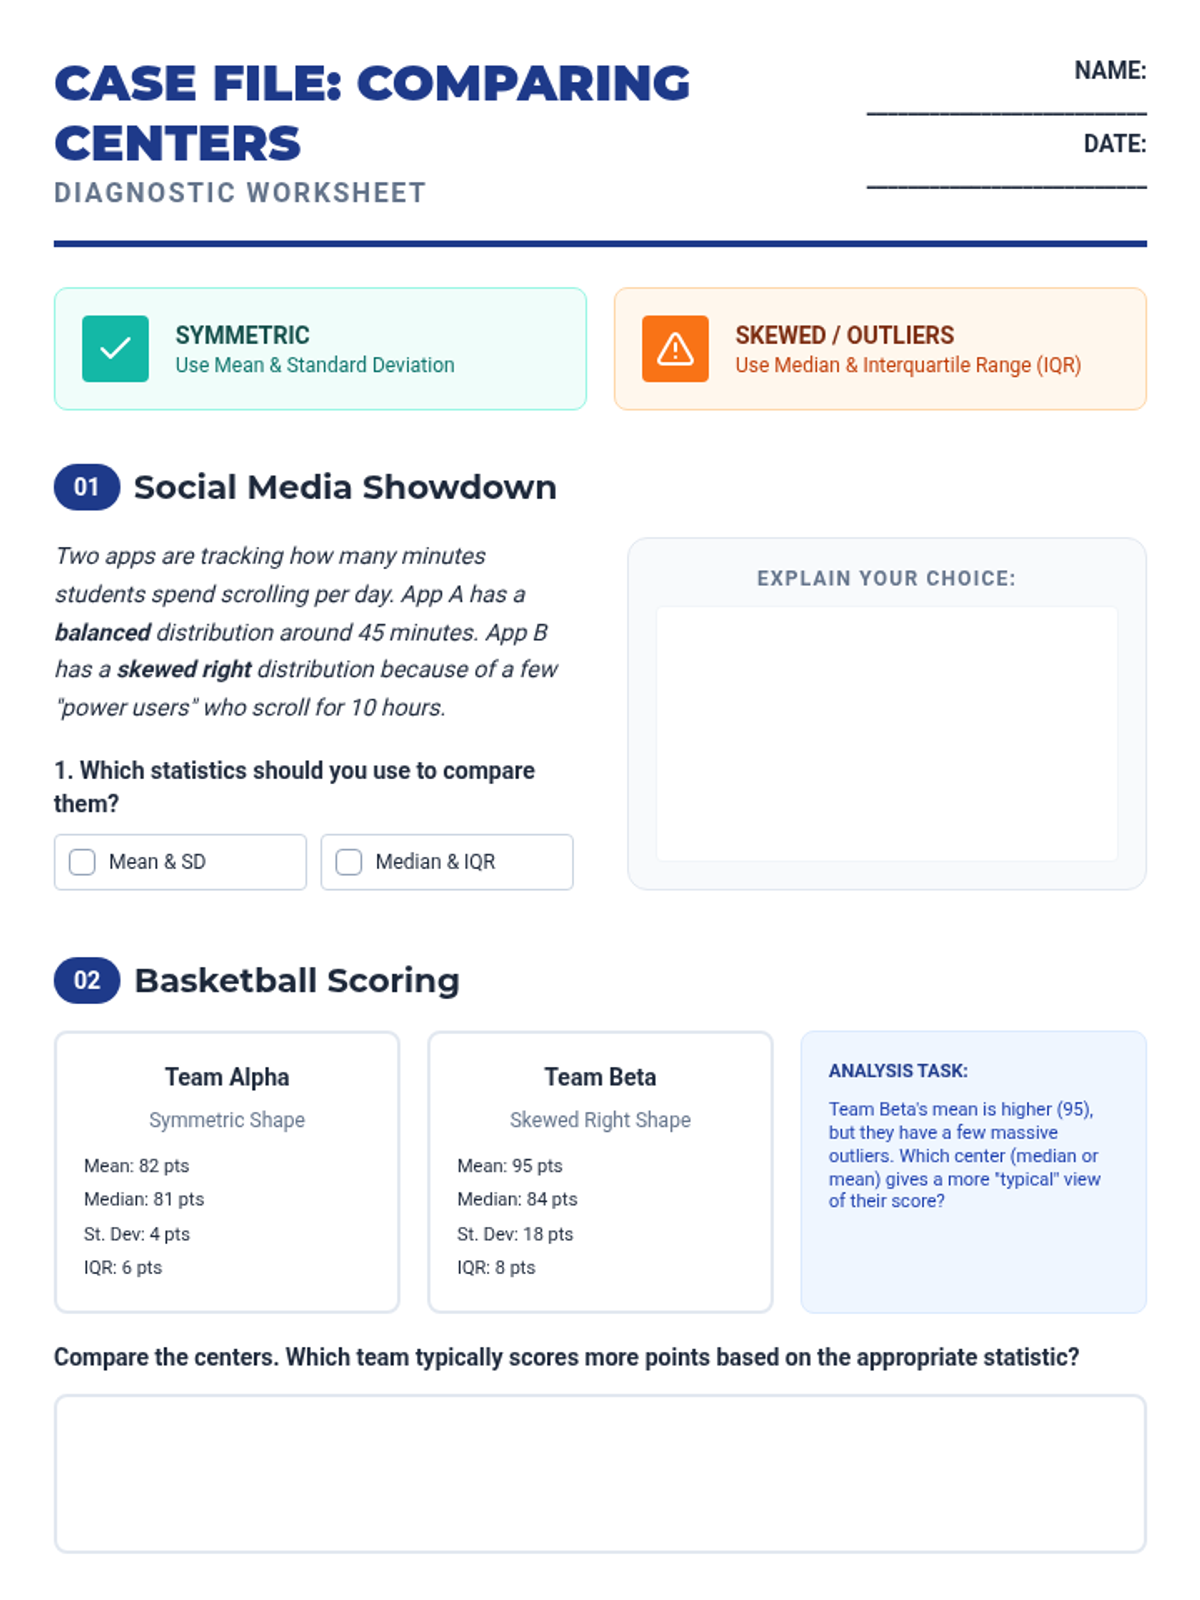
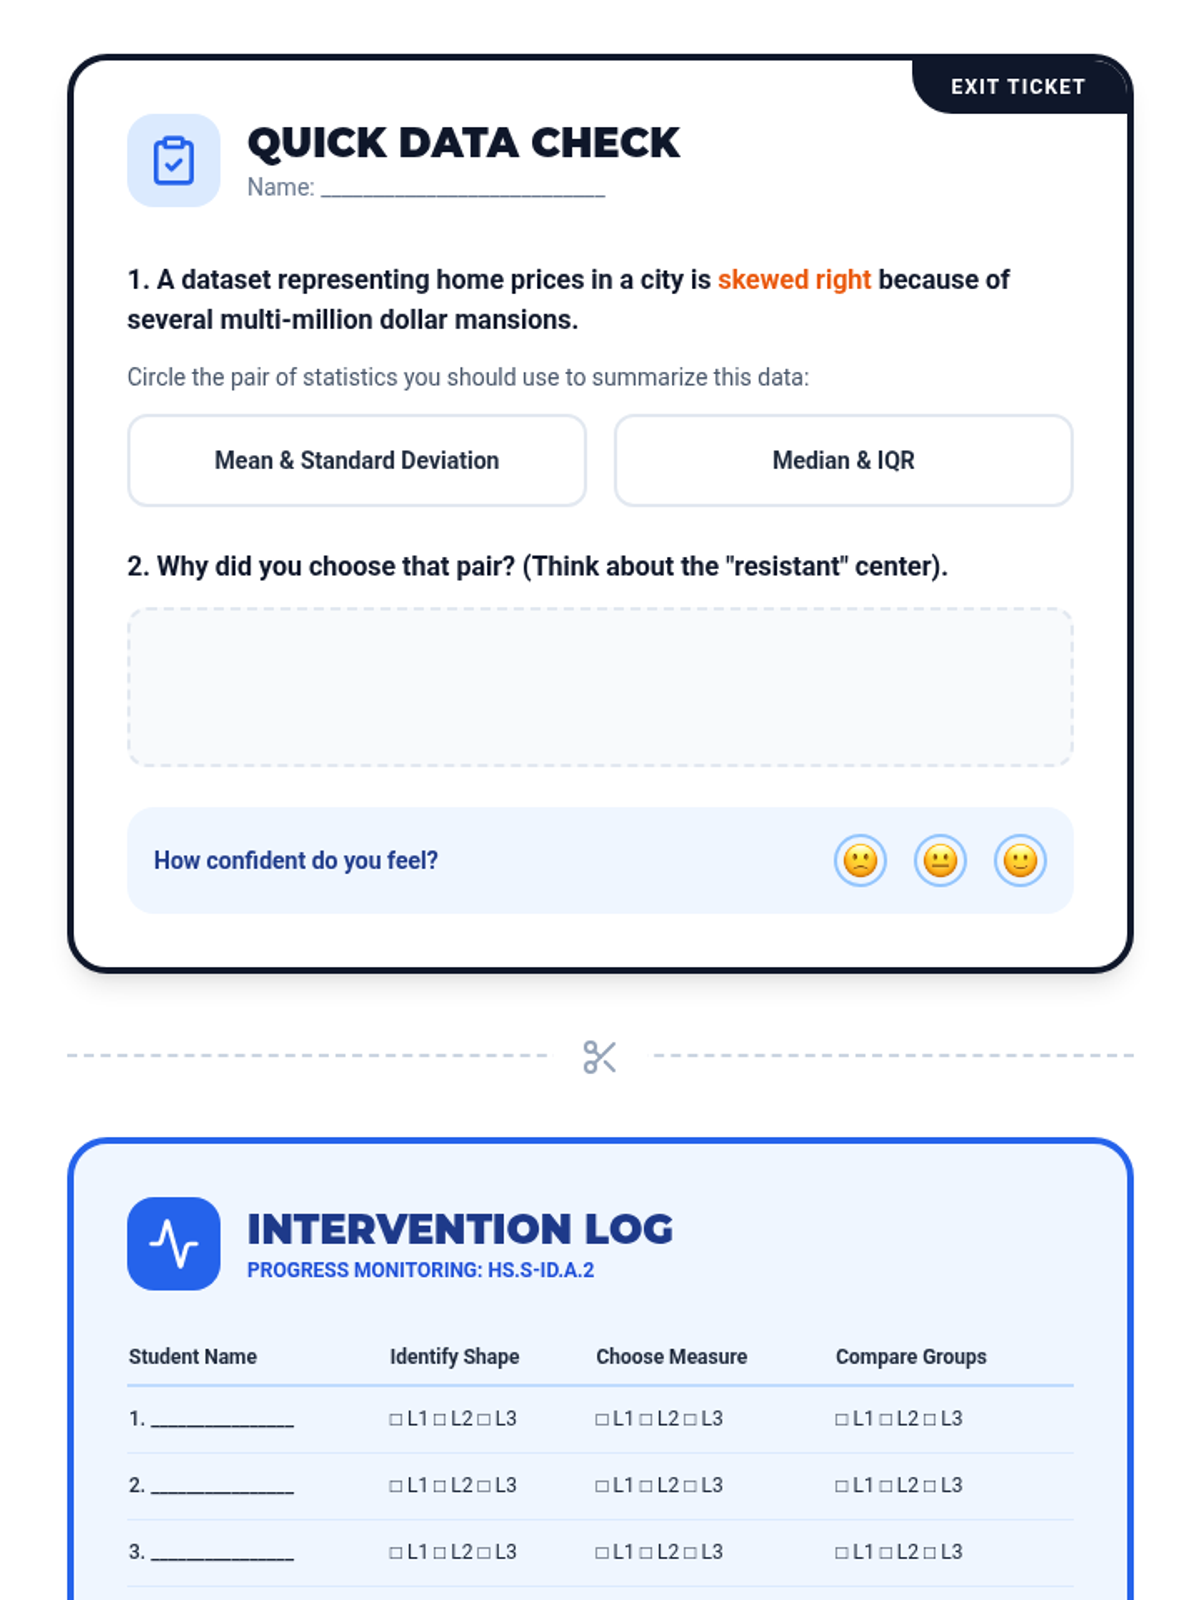
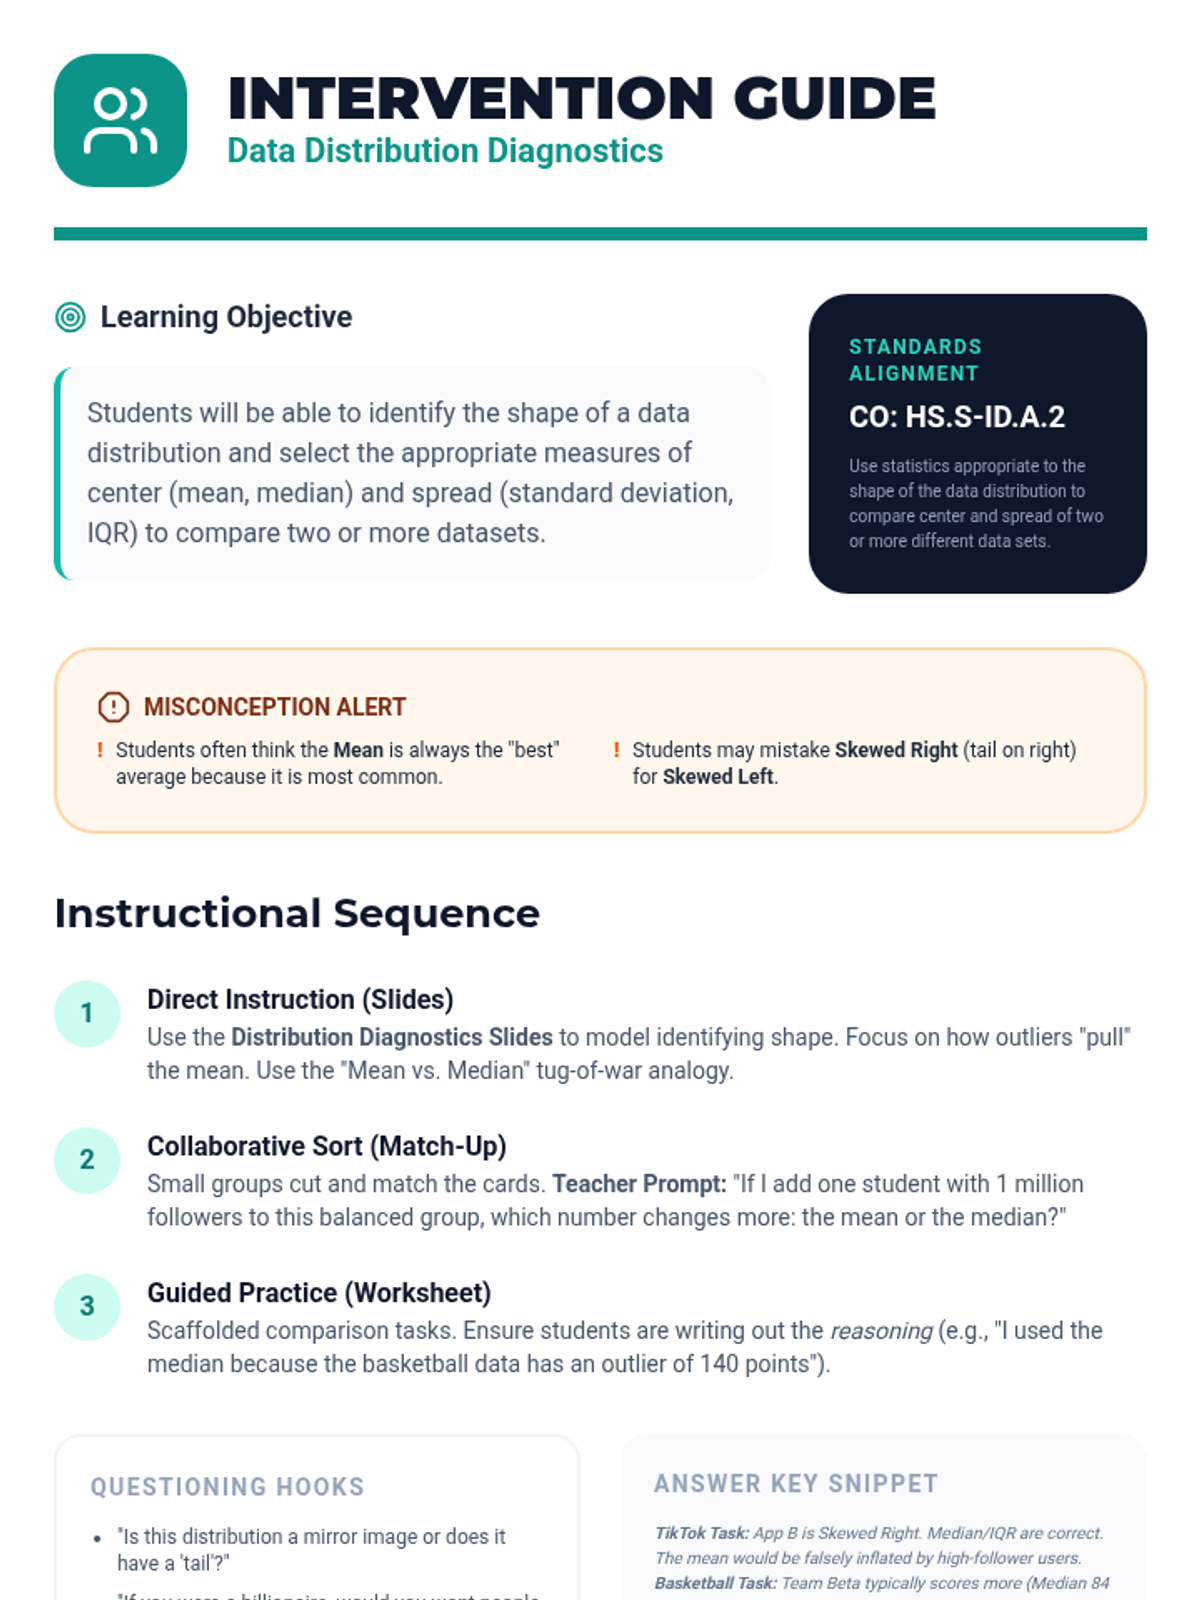
A targeted Tier 2 intervention lesson focusing on choosing the correct measures of center and spread based on data distribution shape to compare datasets. Includes scaffolded matching activities and real-world contexts like social media and sports.
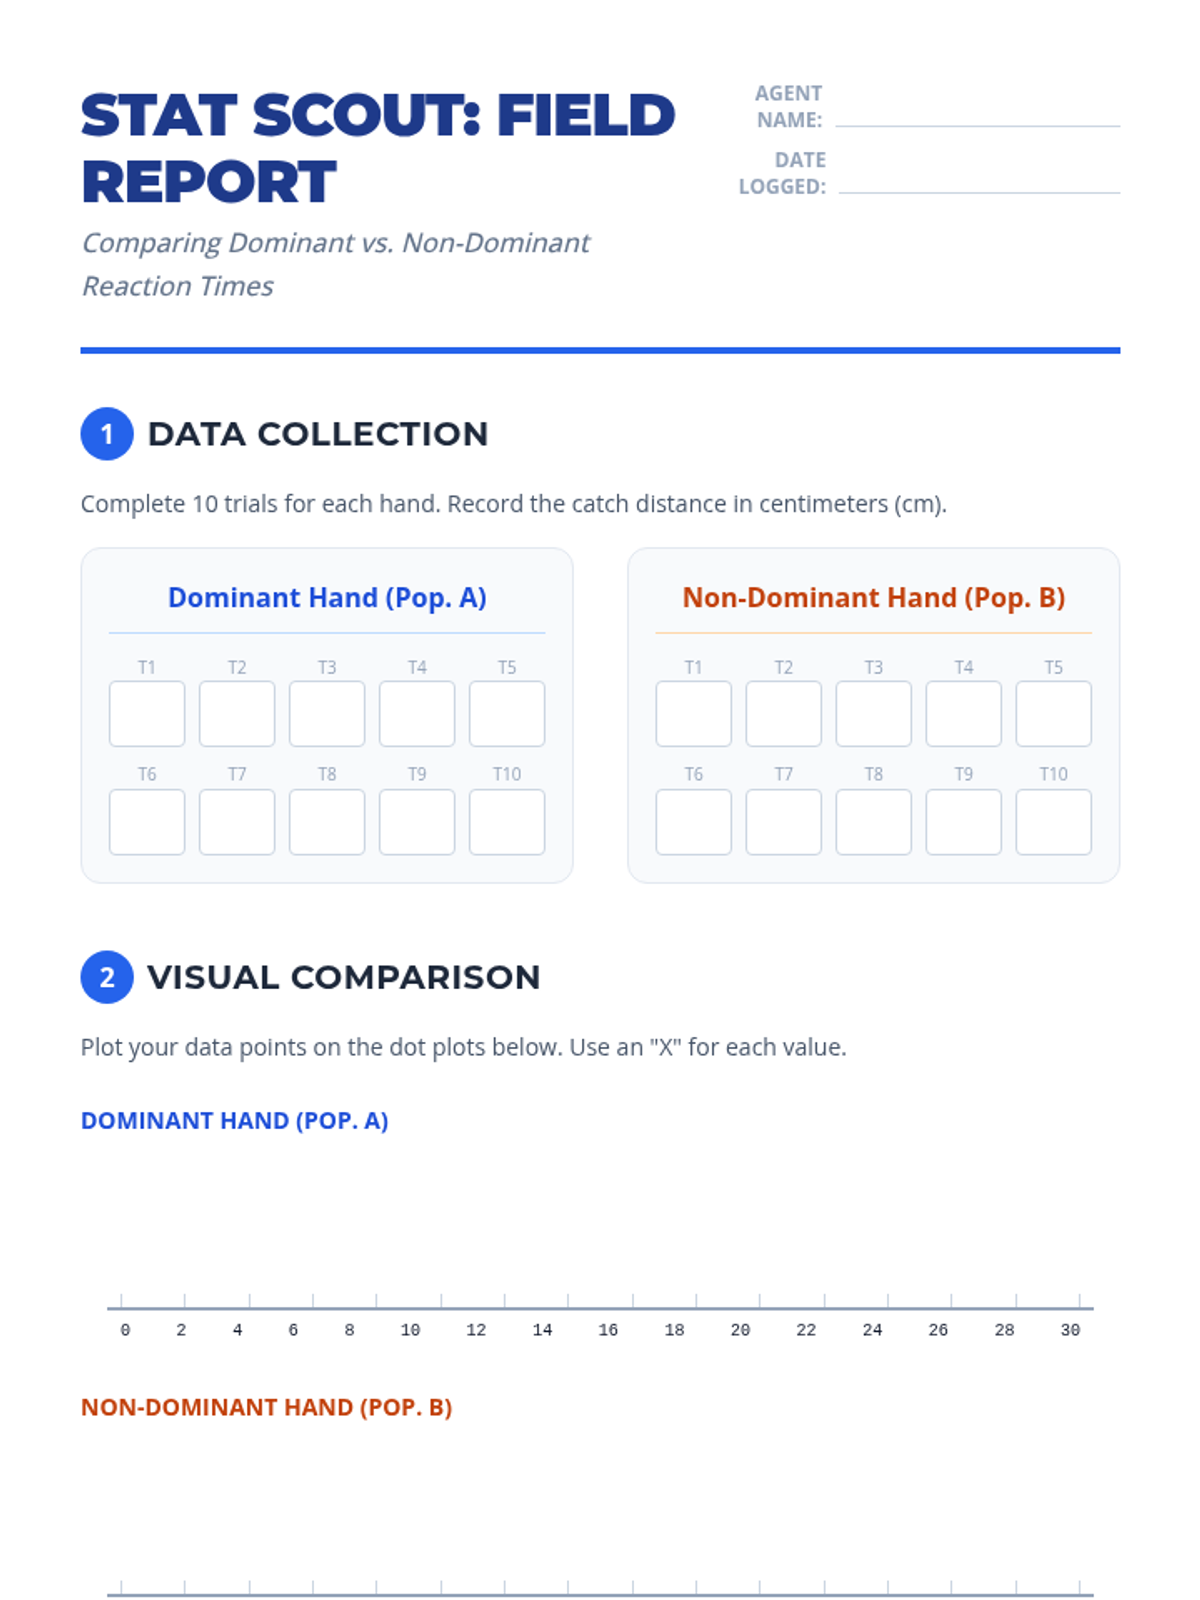
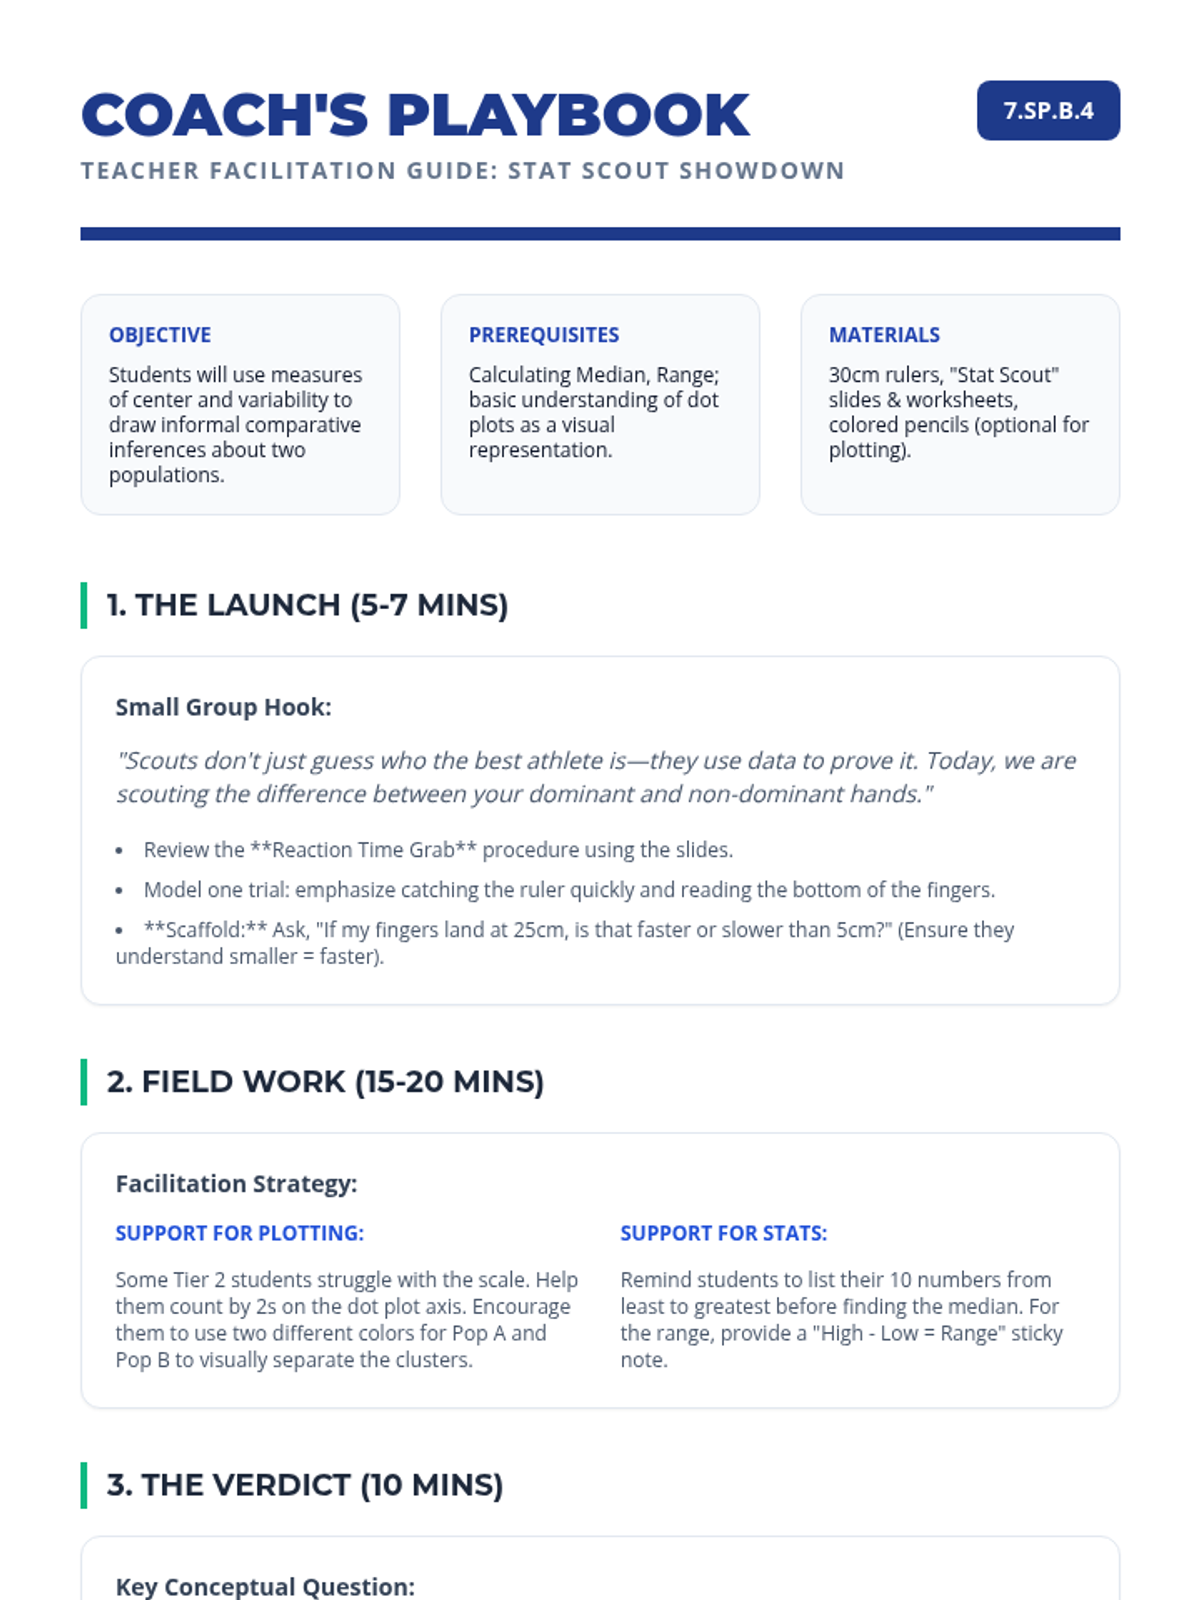
A Tier 2 intervention lesson focusing on drawing comparative inferences about two populations using measures of center and variability through a hands-on reaction time experiment.
A comprehensive 7th-grade math review focused on NYS common core standards, simulating a test environment with confidence-building exercises and error analysis.
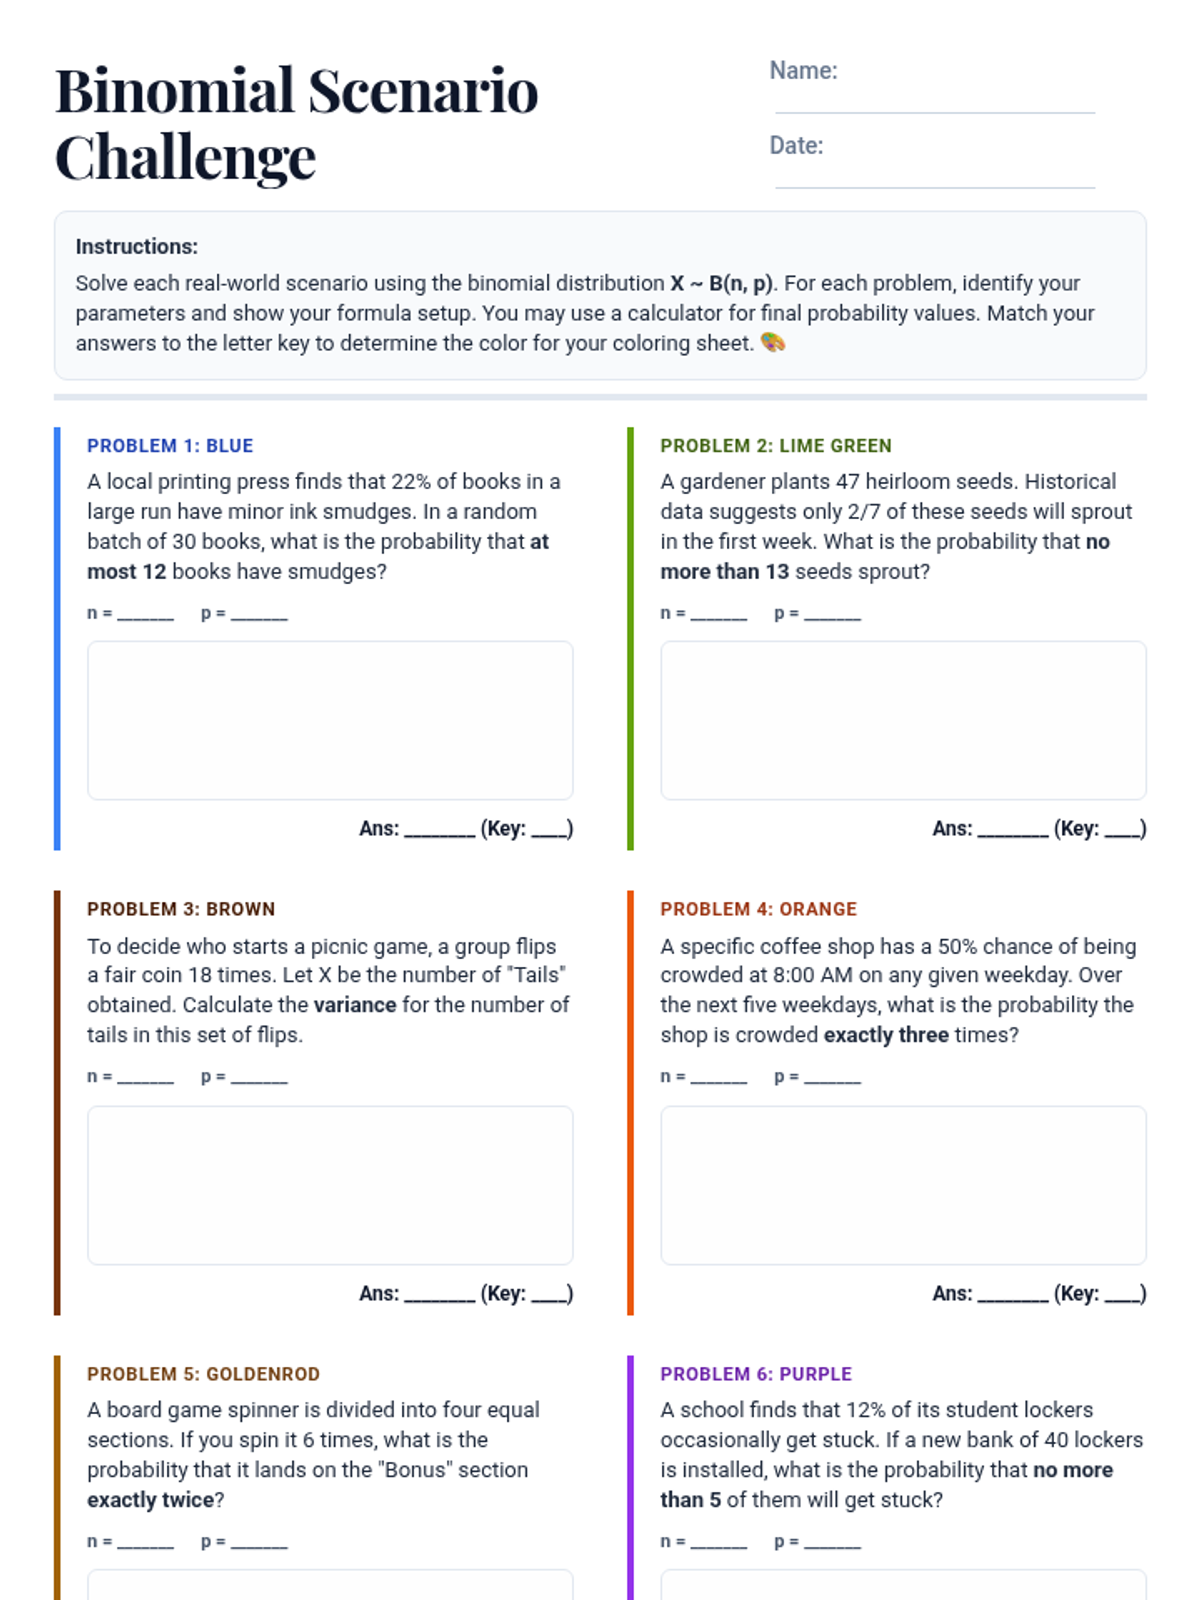
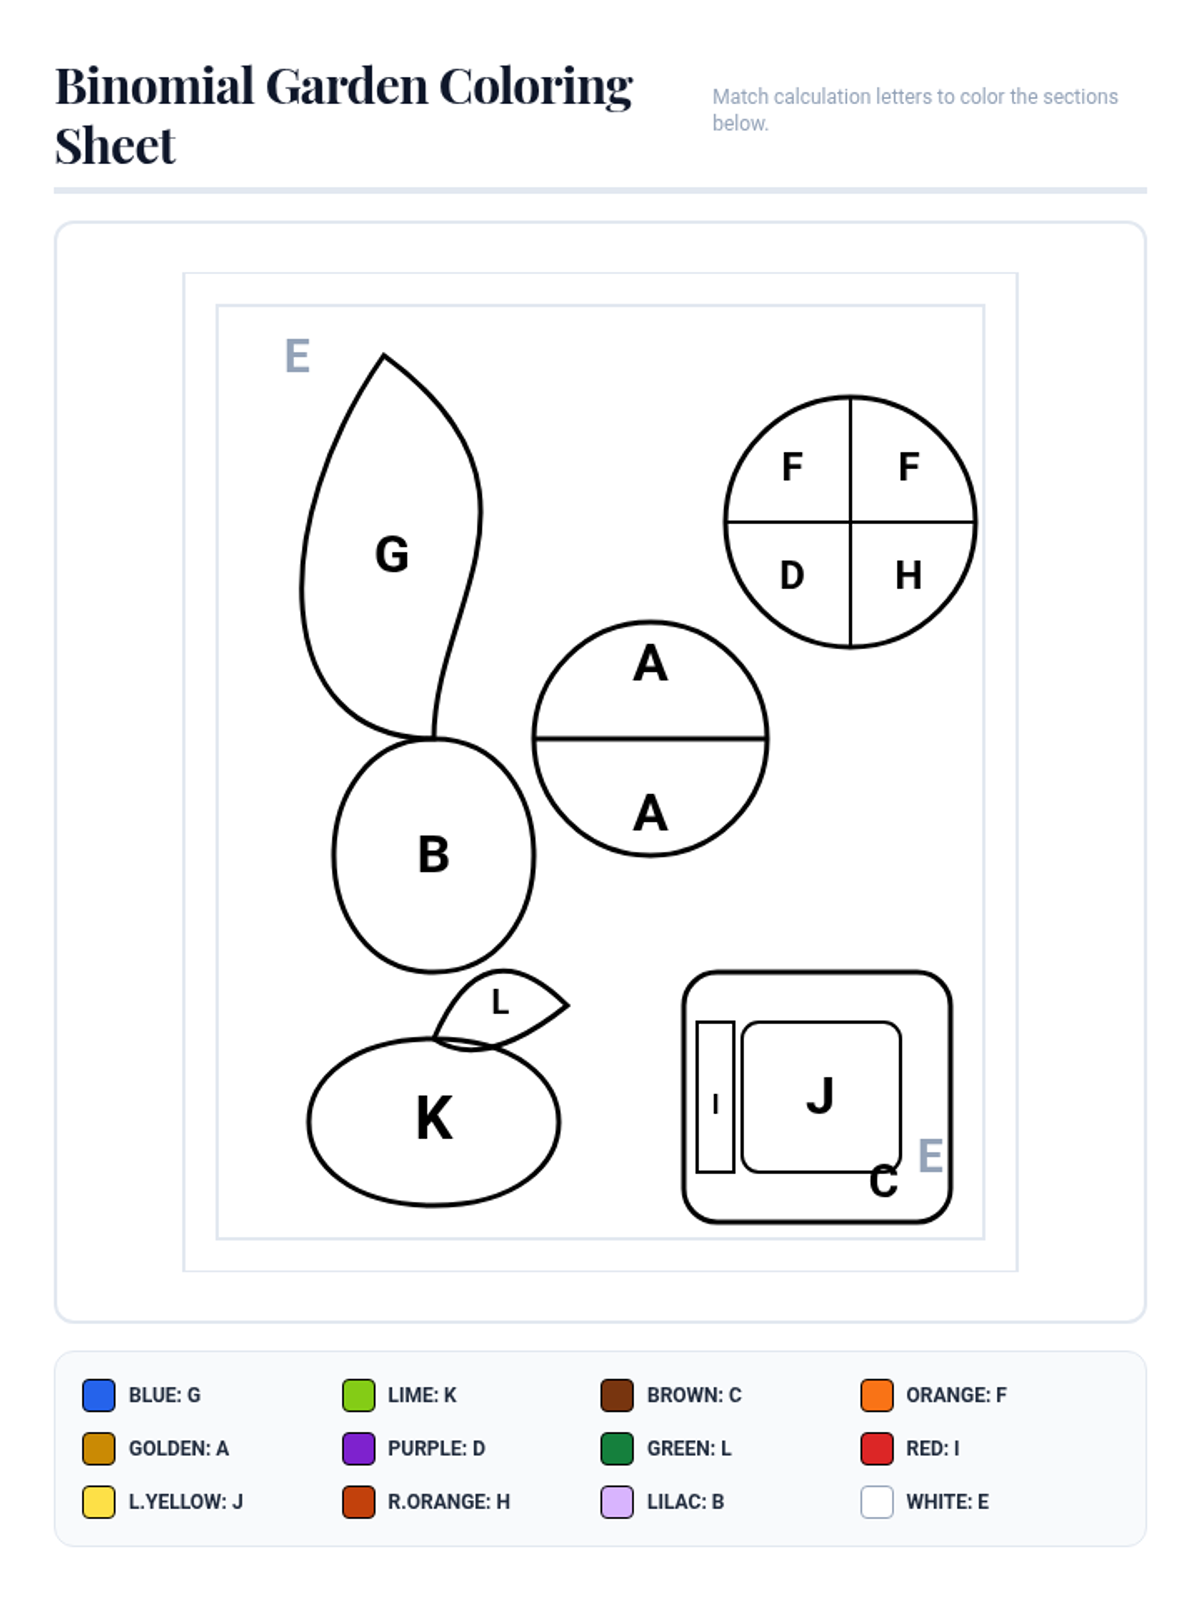
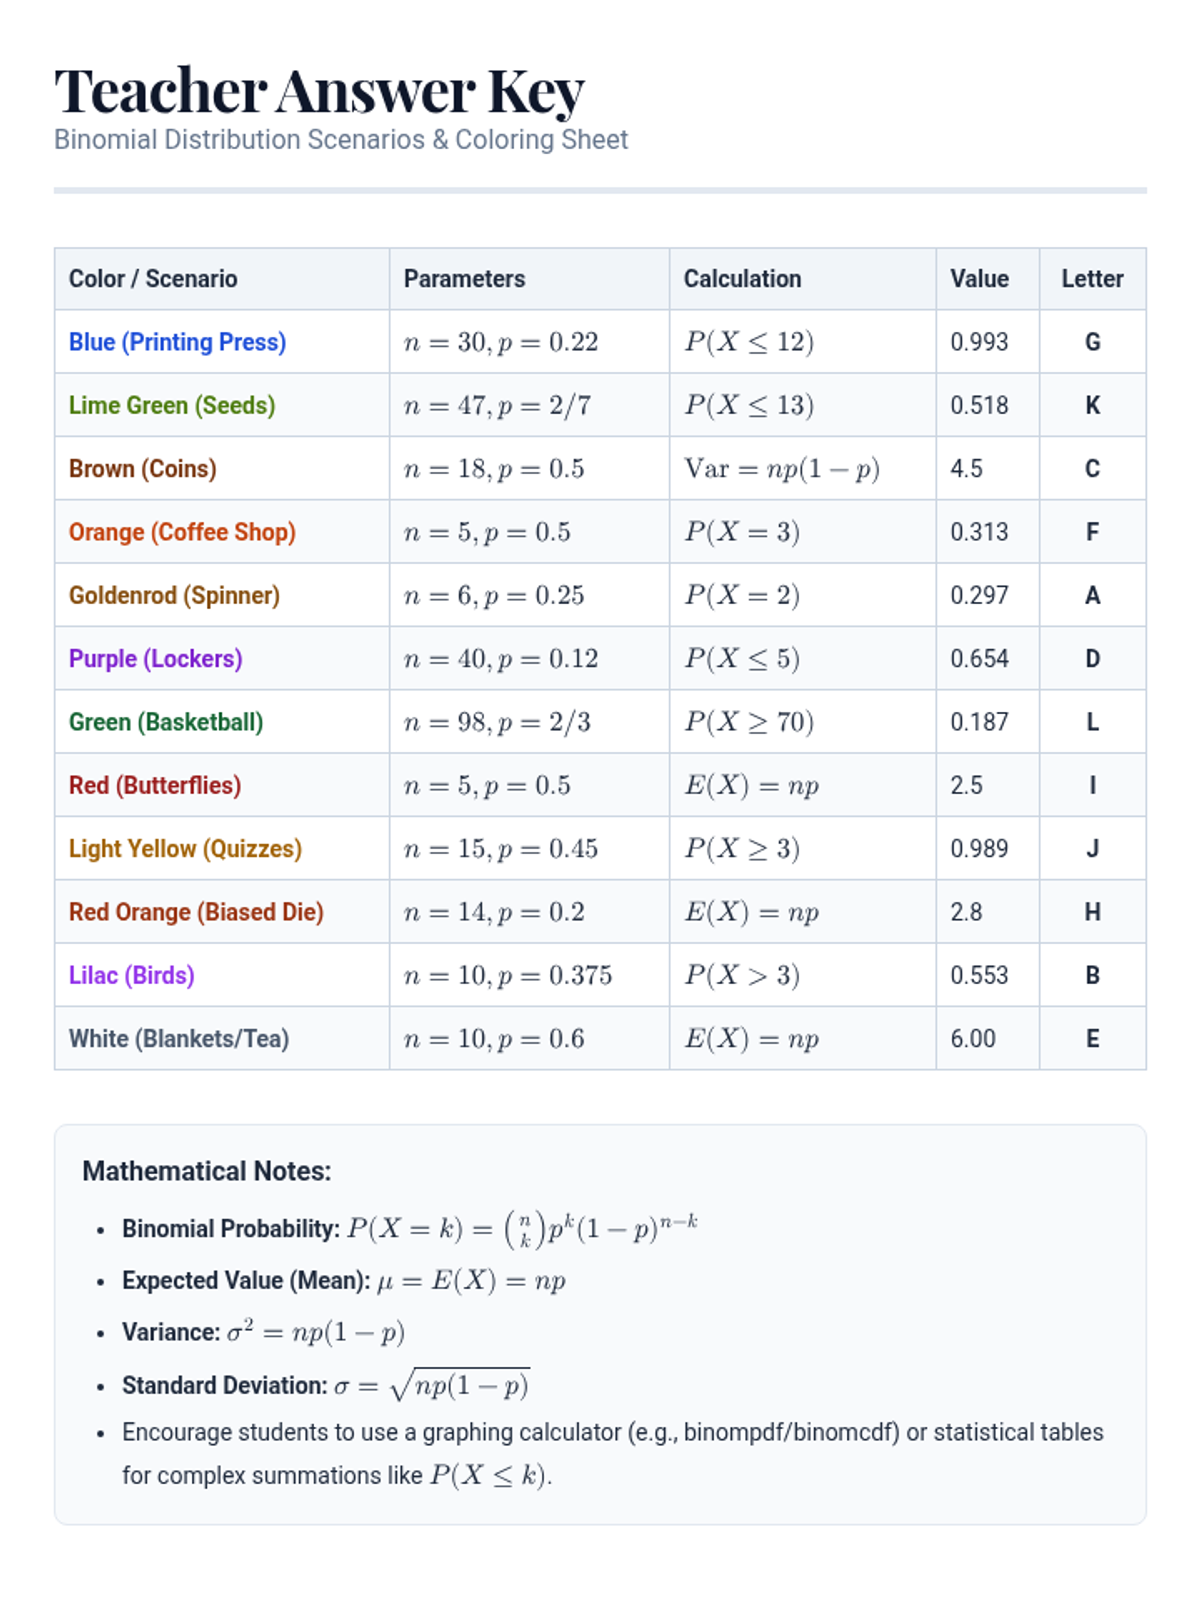
A lesson focused on applying binomial distribution concepts to real-world scenarios through a creative coloring activity. Students translate narrative word problems into mathematical models to calculate probabilities, means, and variances.
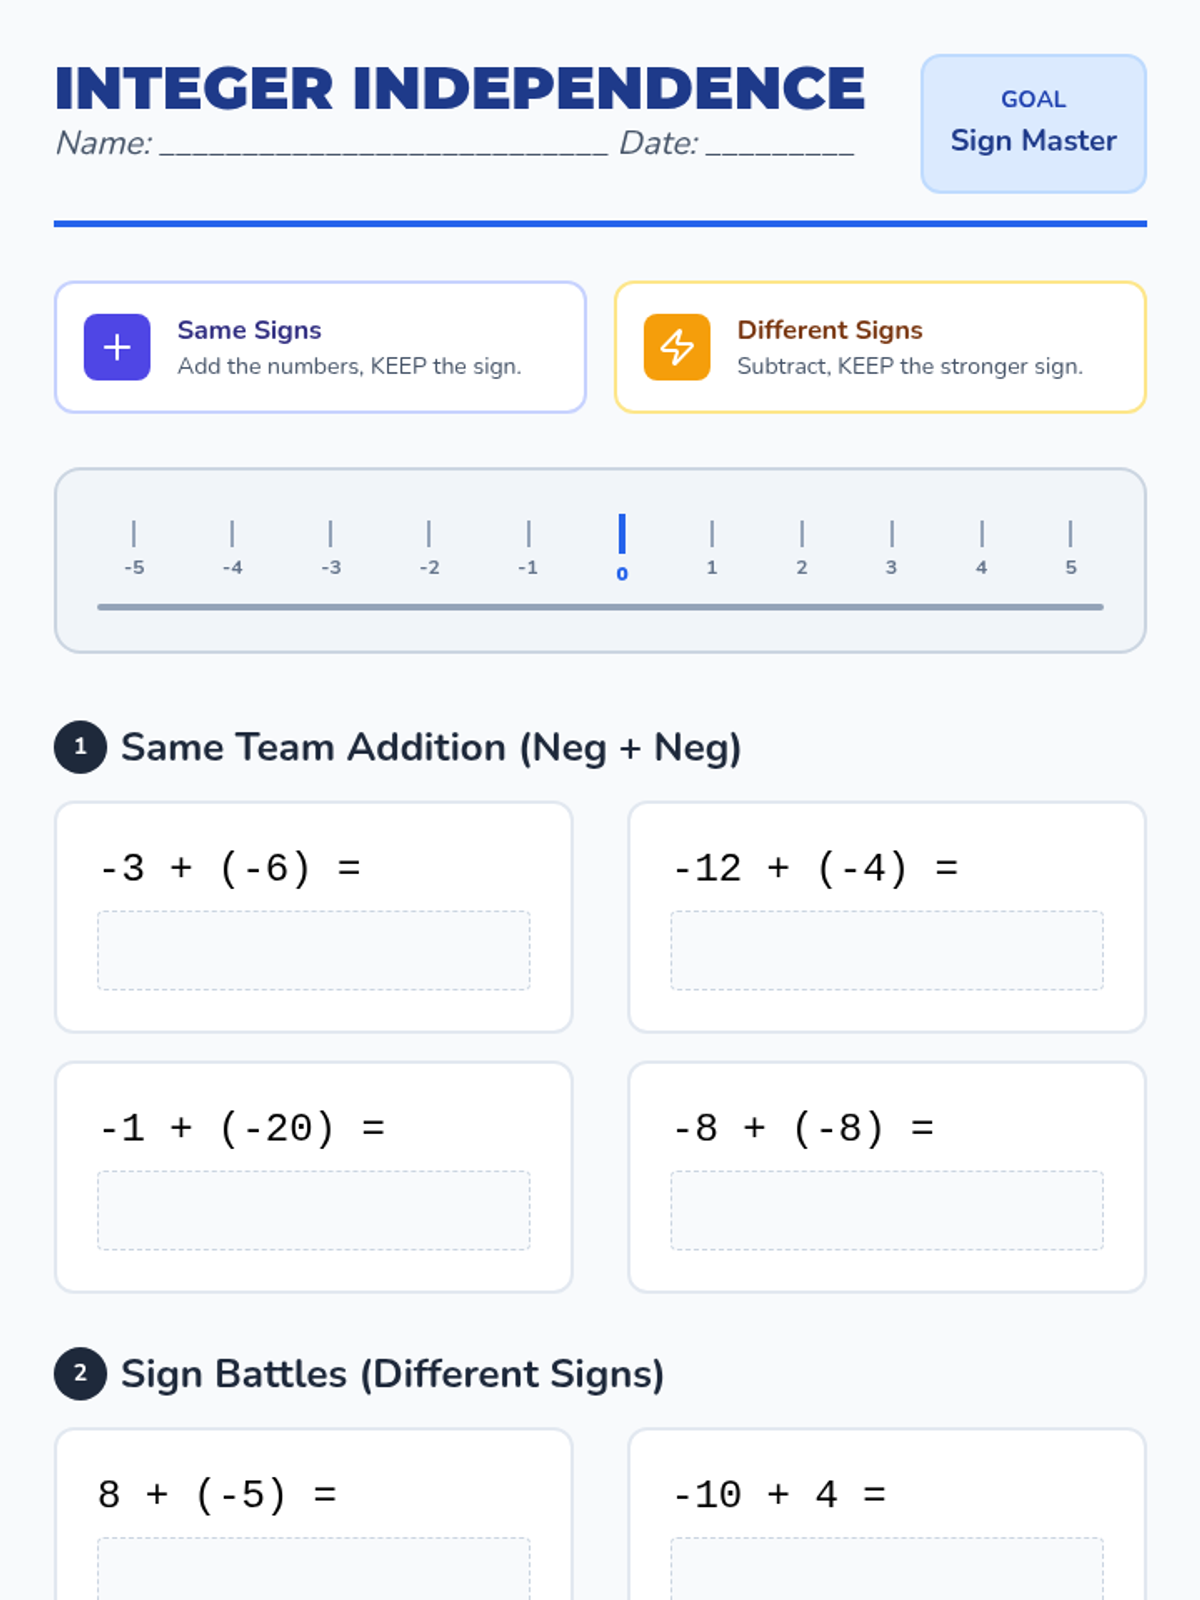
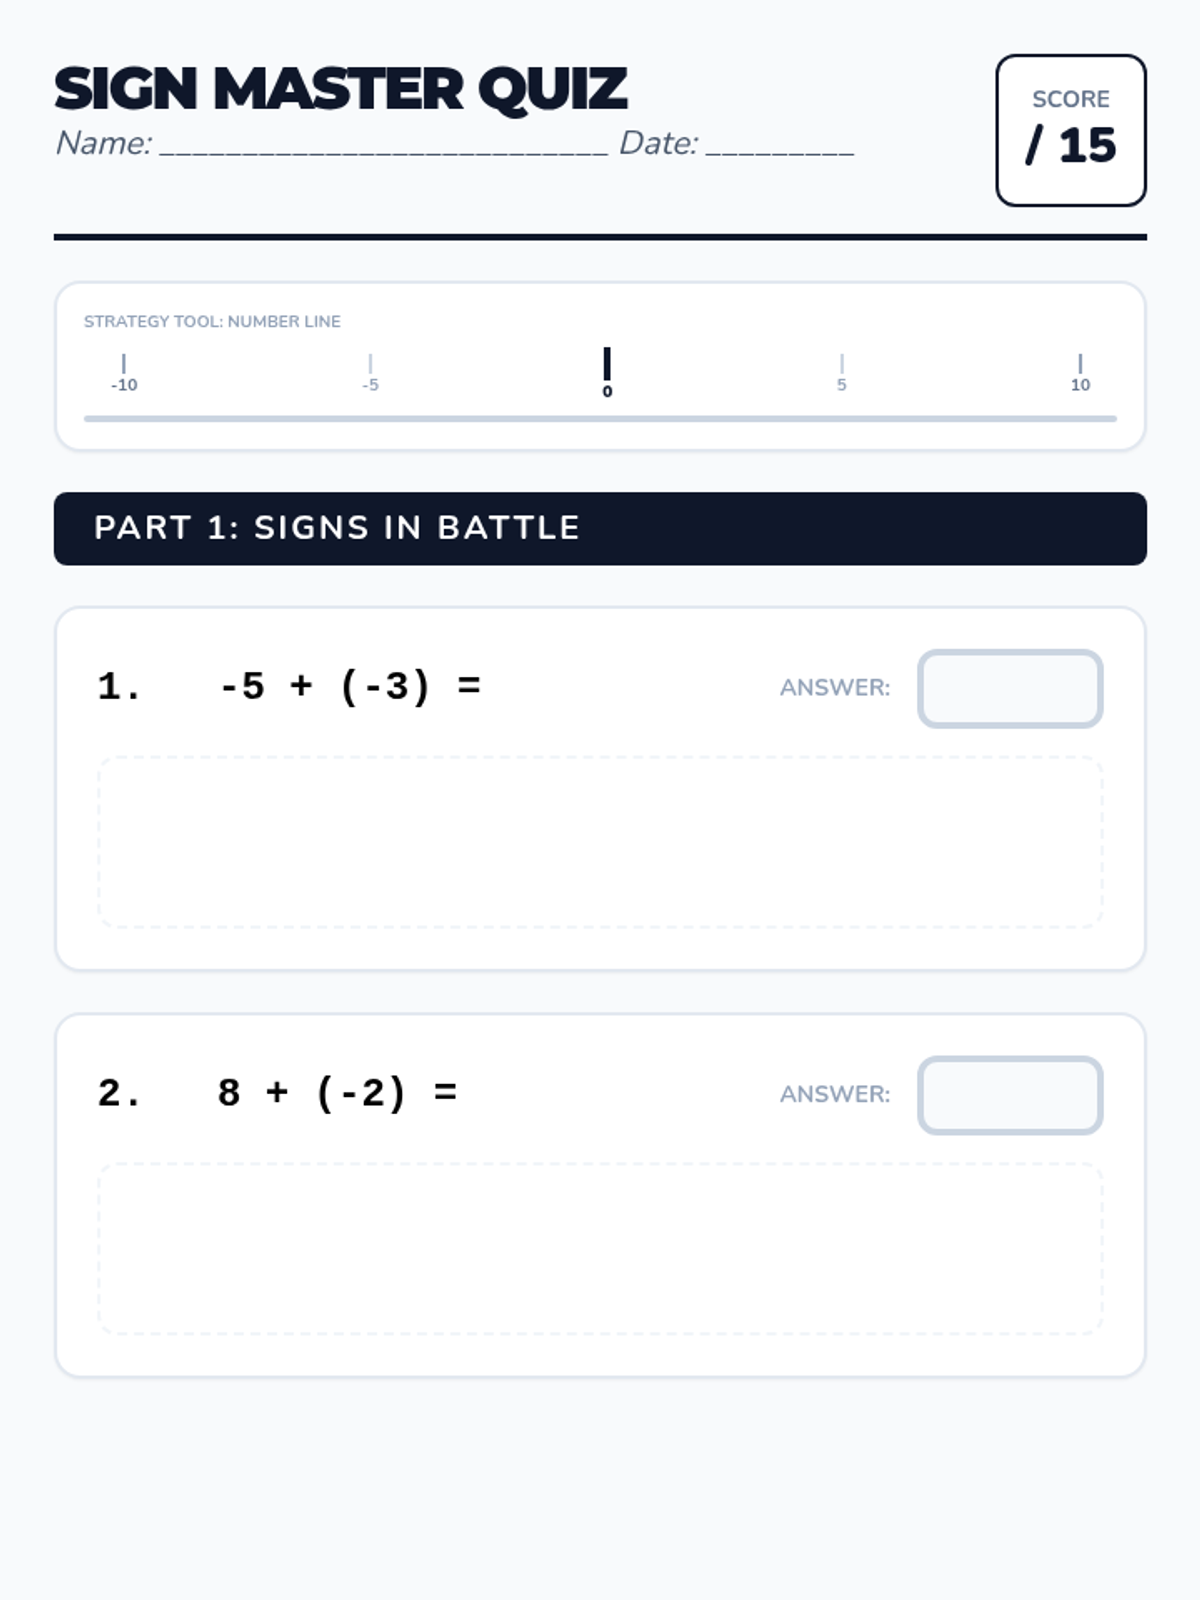
A 50-minute practice session and homework assignment focused on independent mastery of integer addition and subtraction with high-contrast visual aids.
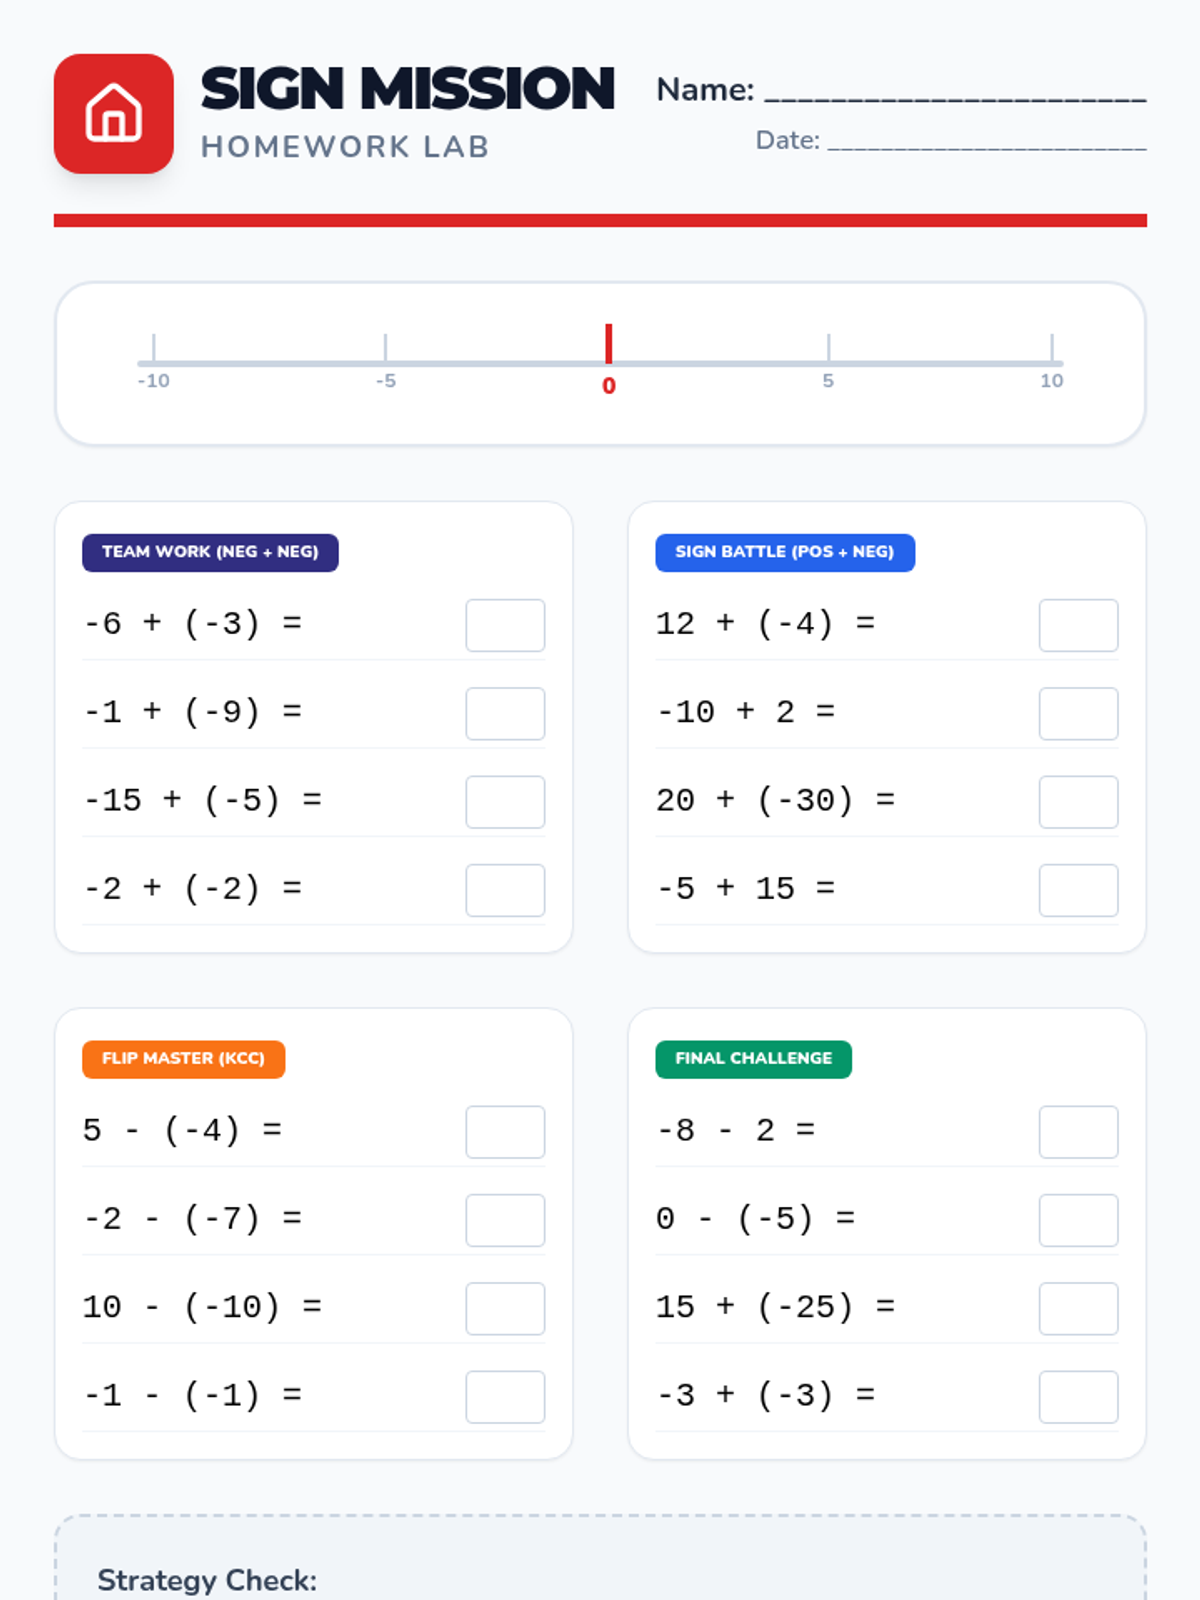
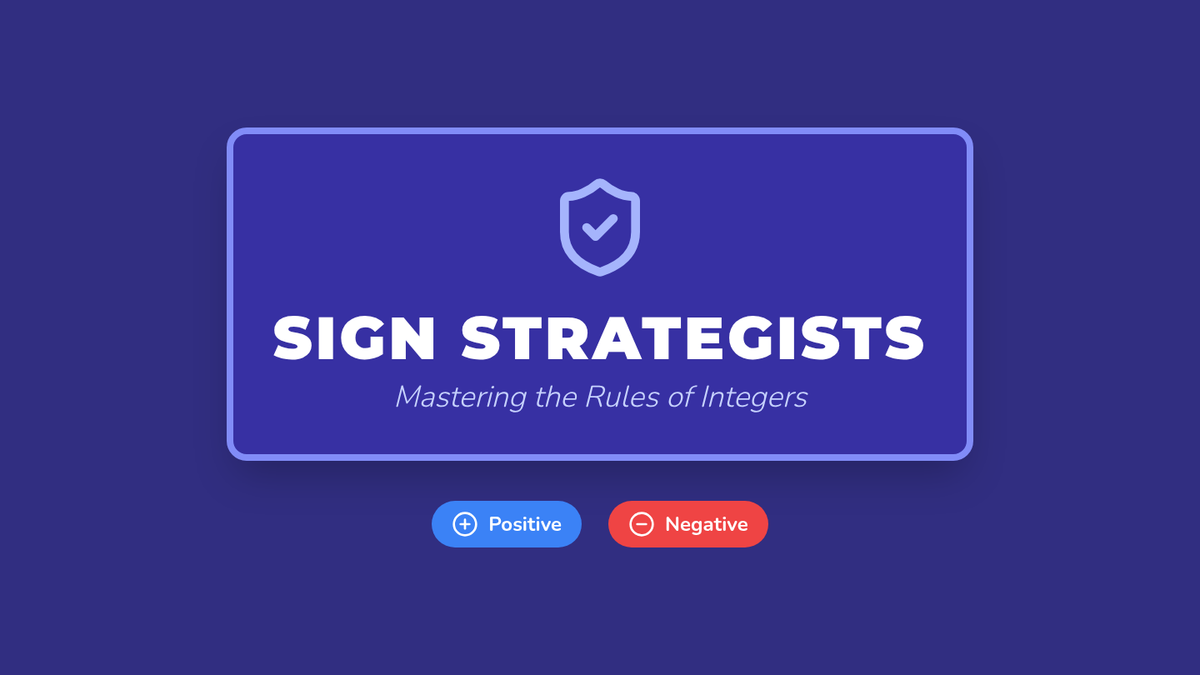
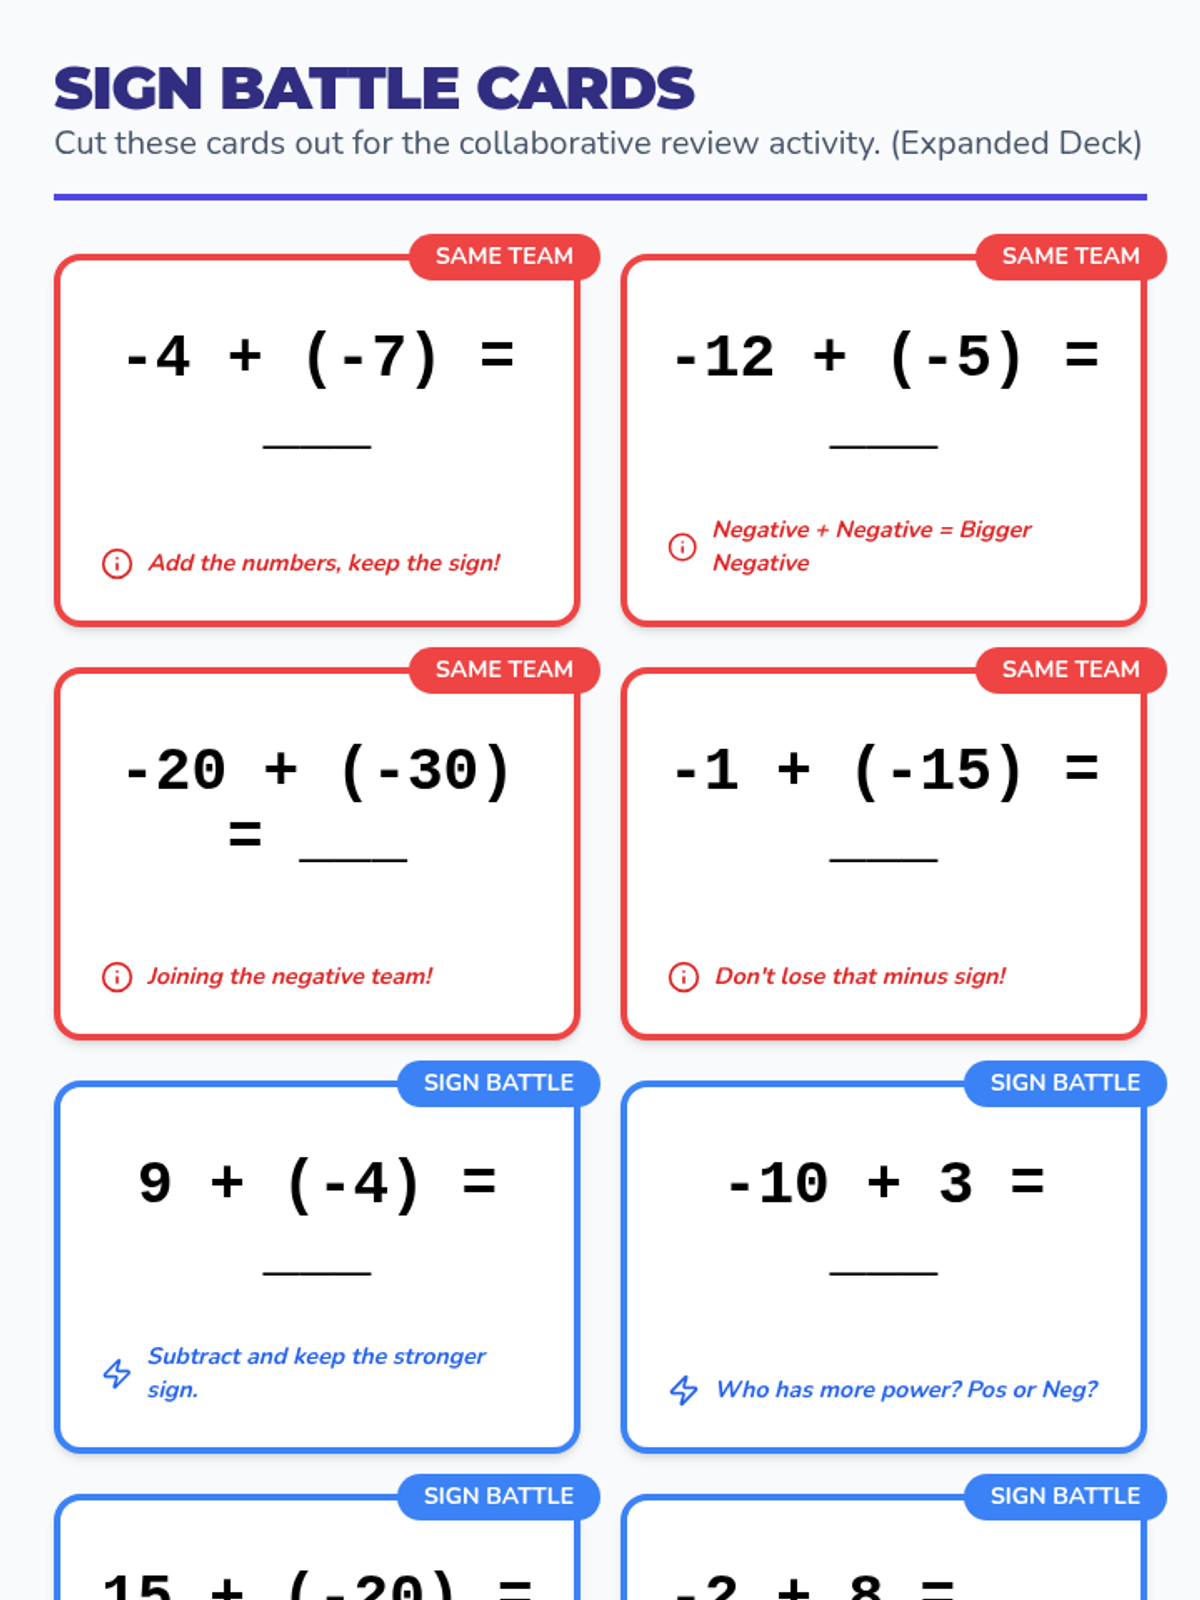
A 50-minute review session focused on four key integer rules using a collaborative 'Sign Battle' activity and visual number lines.
An introduction to random variables, distinguishing between discrete and continuous types, graphing probability distributions, and calculating mean and standard deviation.
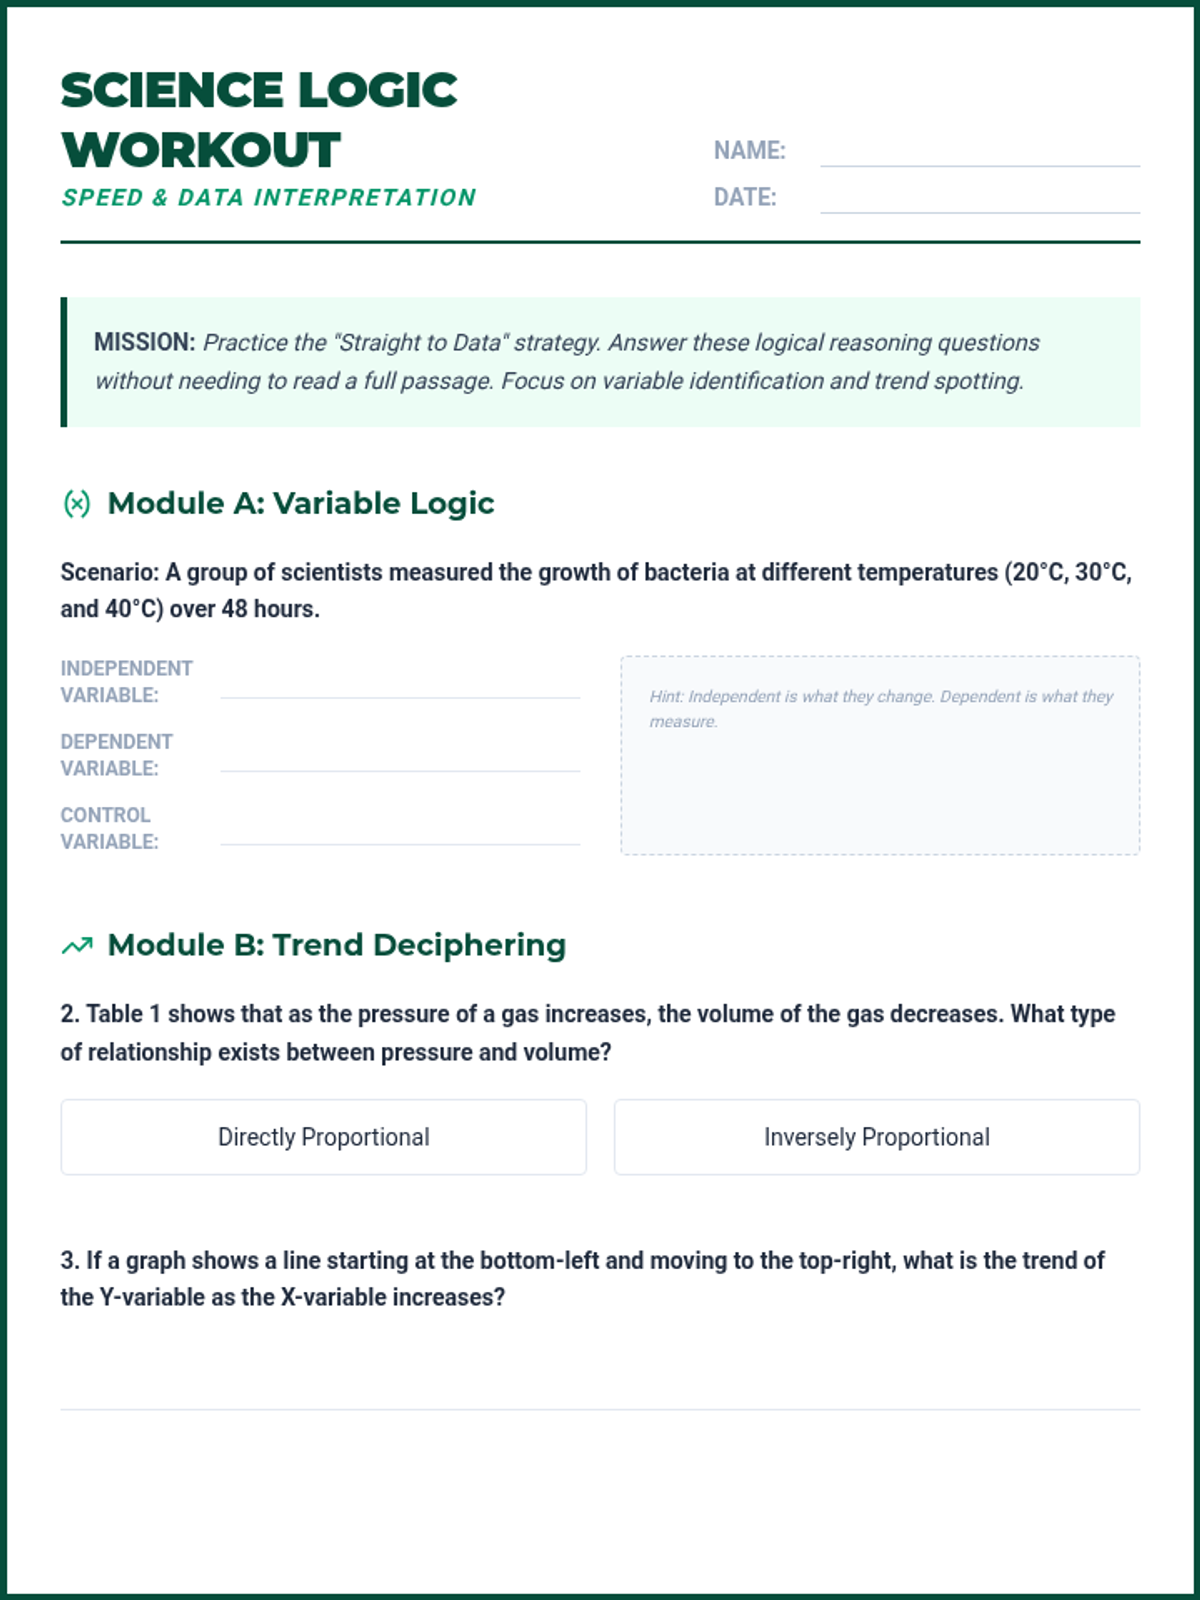
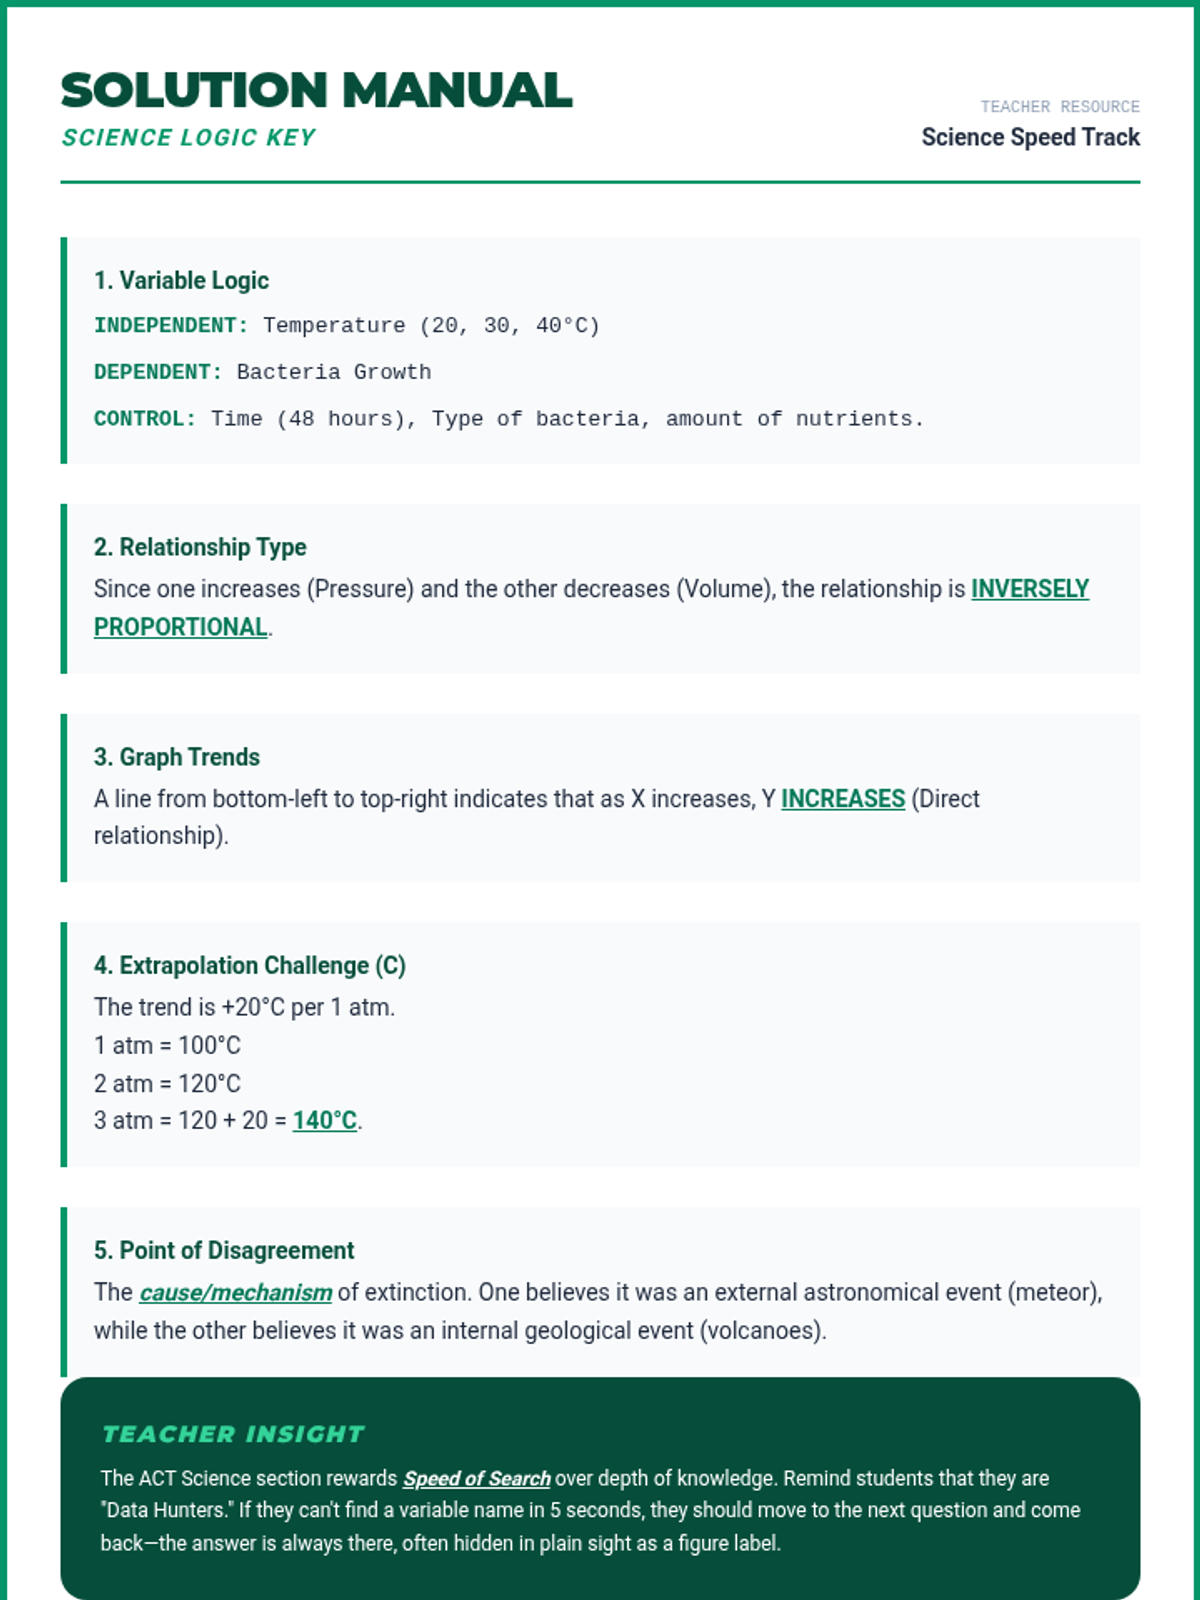
A strategic masterclass for the ACT Science section, focusing on speed-reading data sets, identifying experimental variables, and decoding scientific logic. This lesson emphasizes the 'Straight to the Data' approach to maximize score in the 35-minute time limit.
A lesson focused on calculating the mean, variance, and standard deviation of binomial probability distributions in real-world contexts.
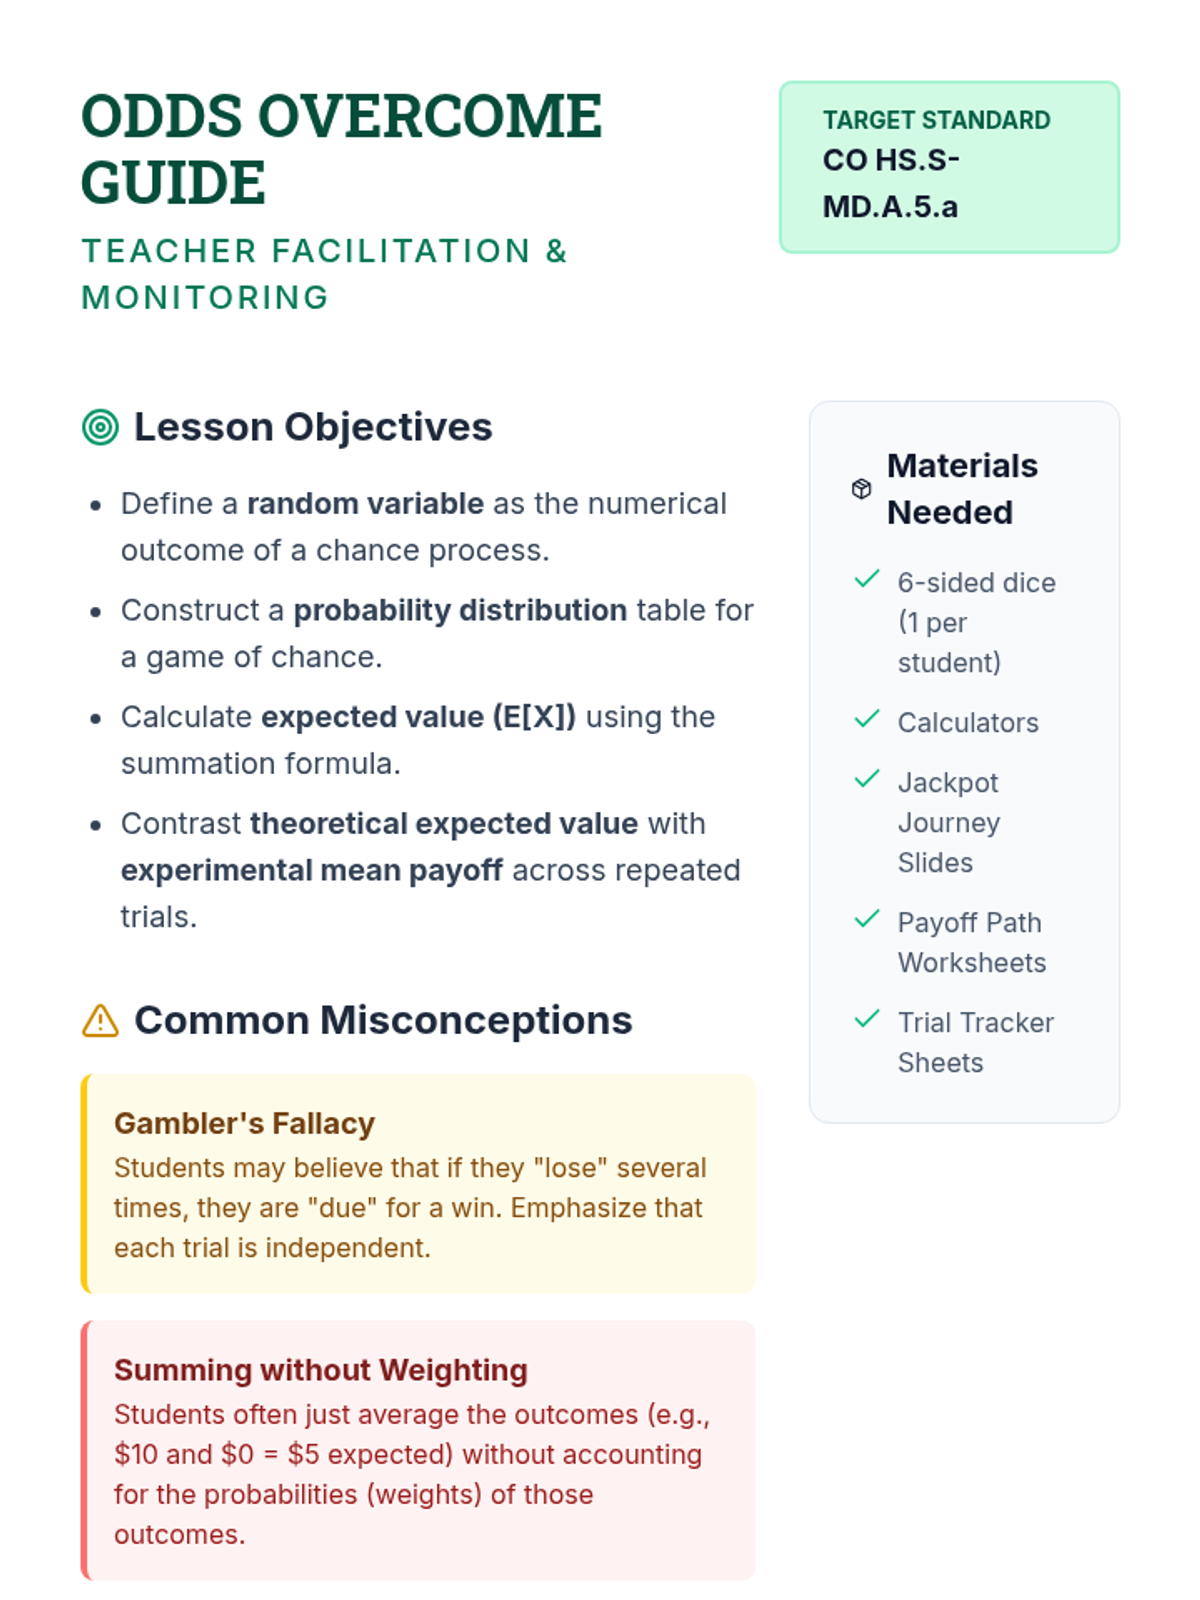
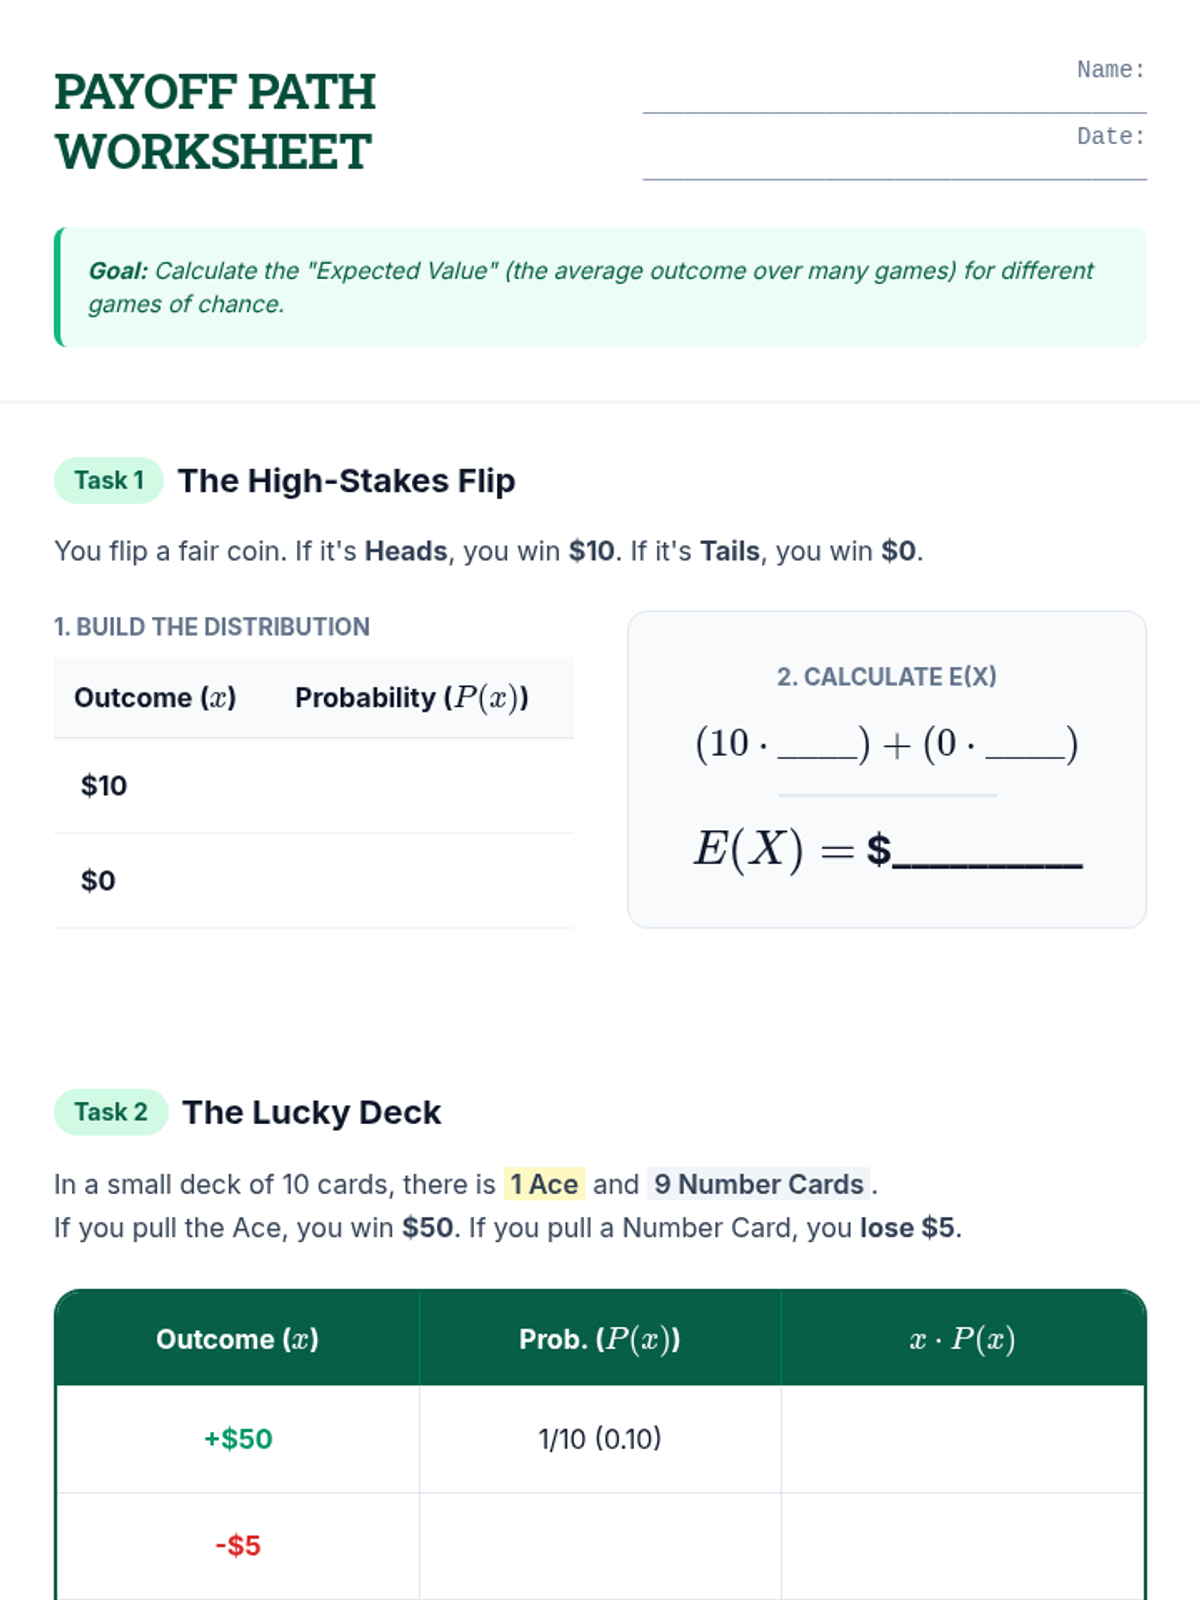
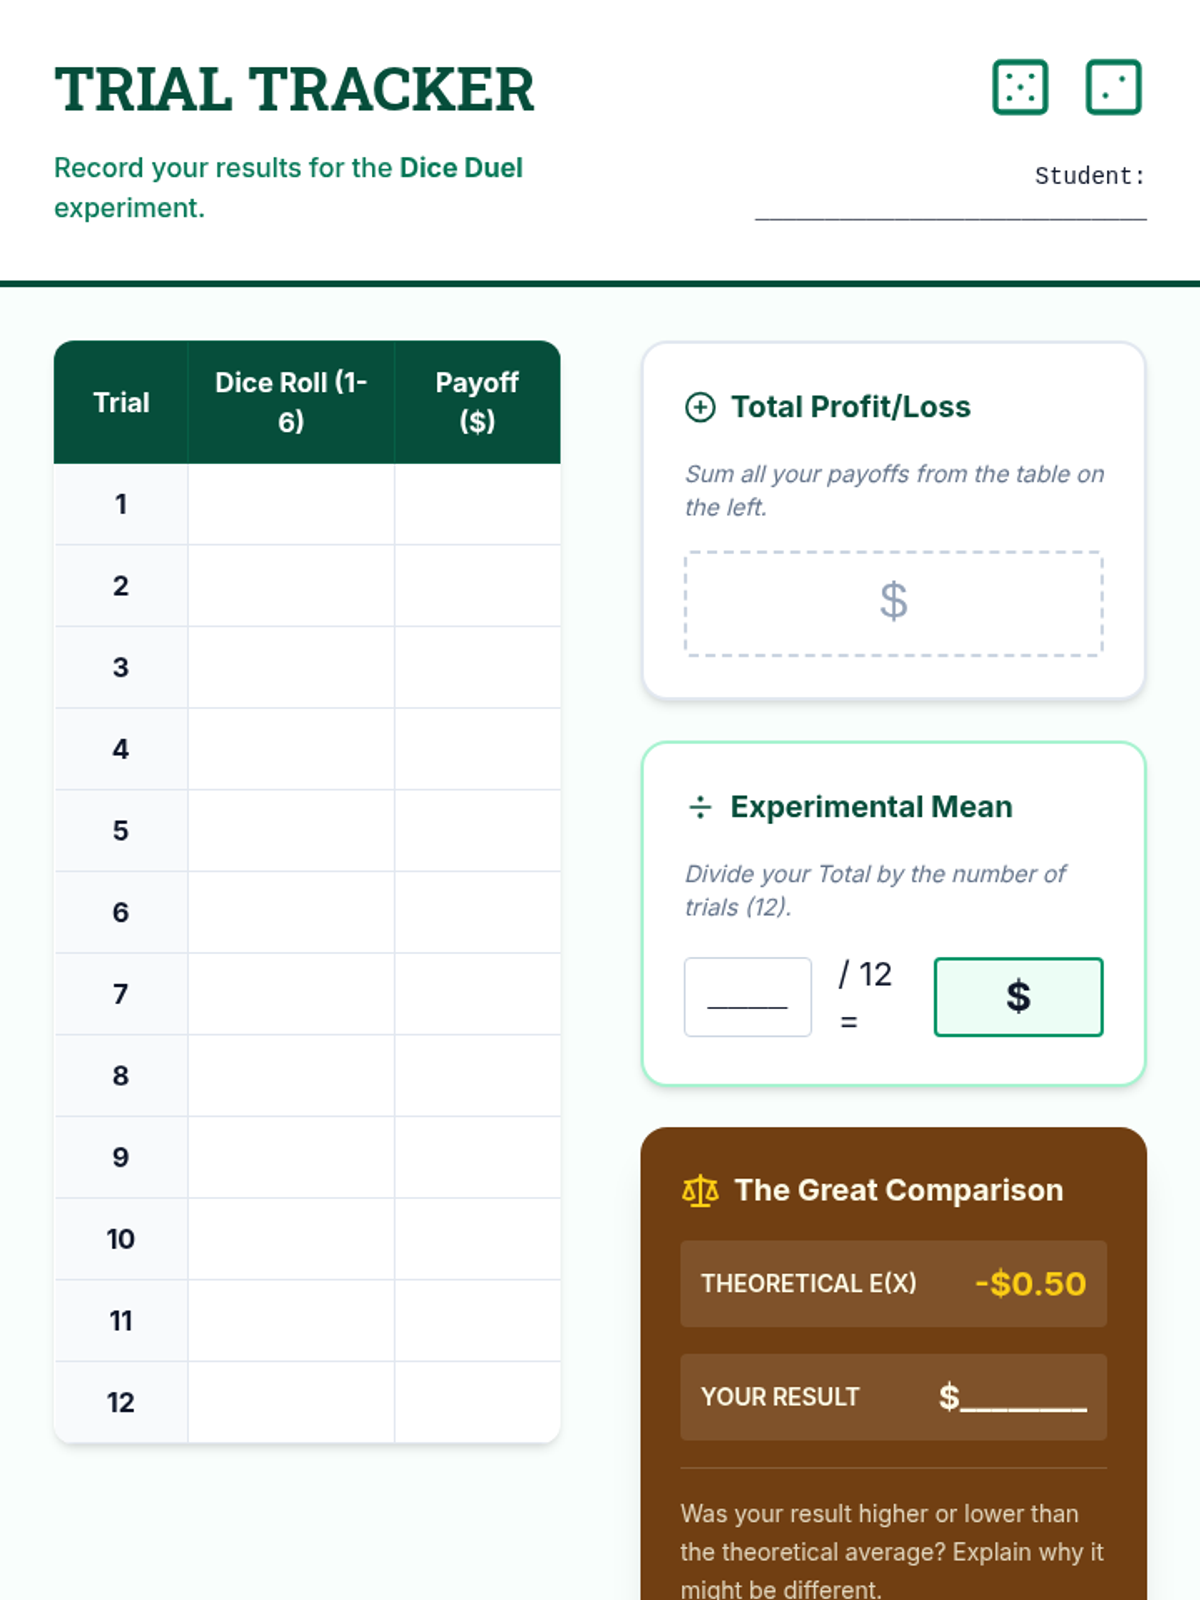
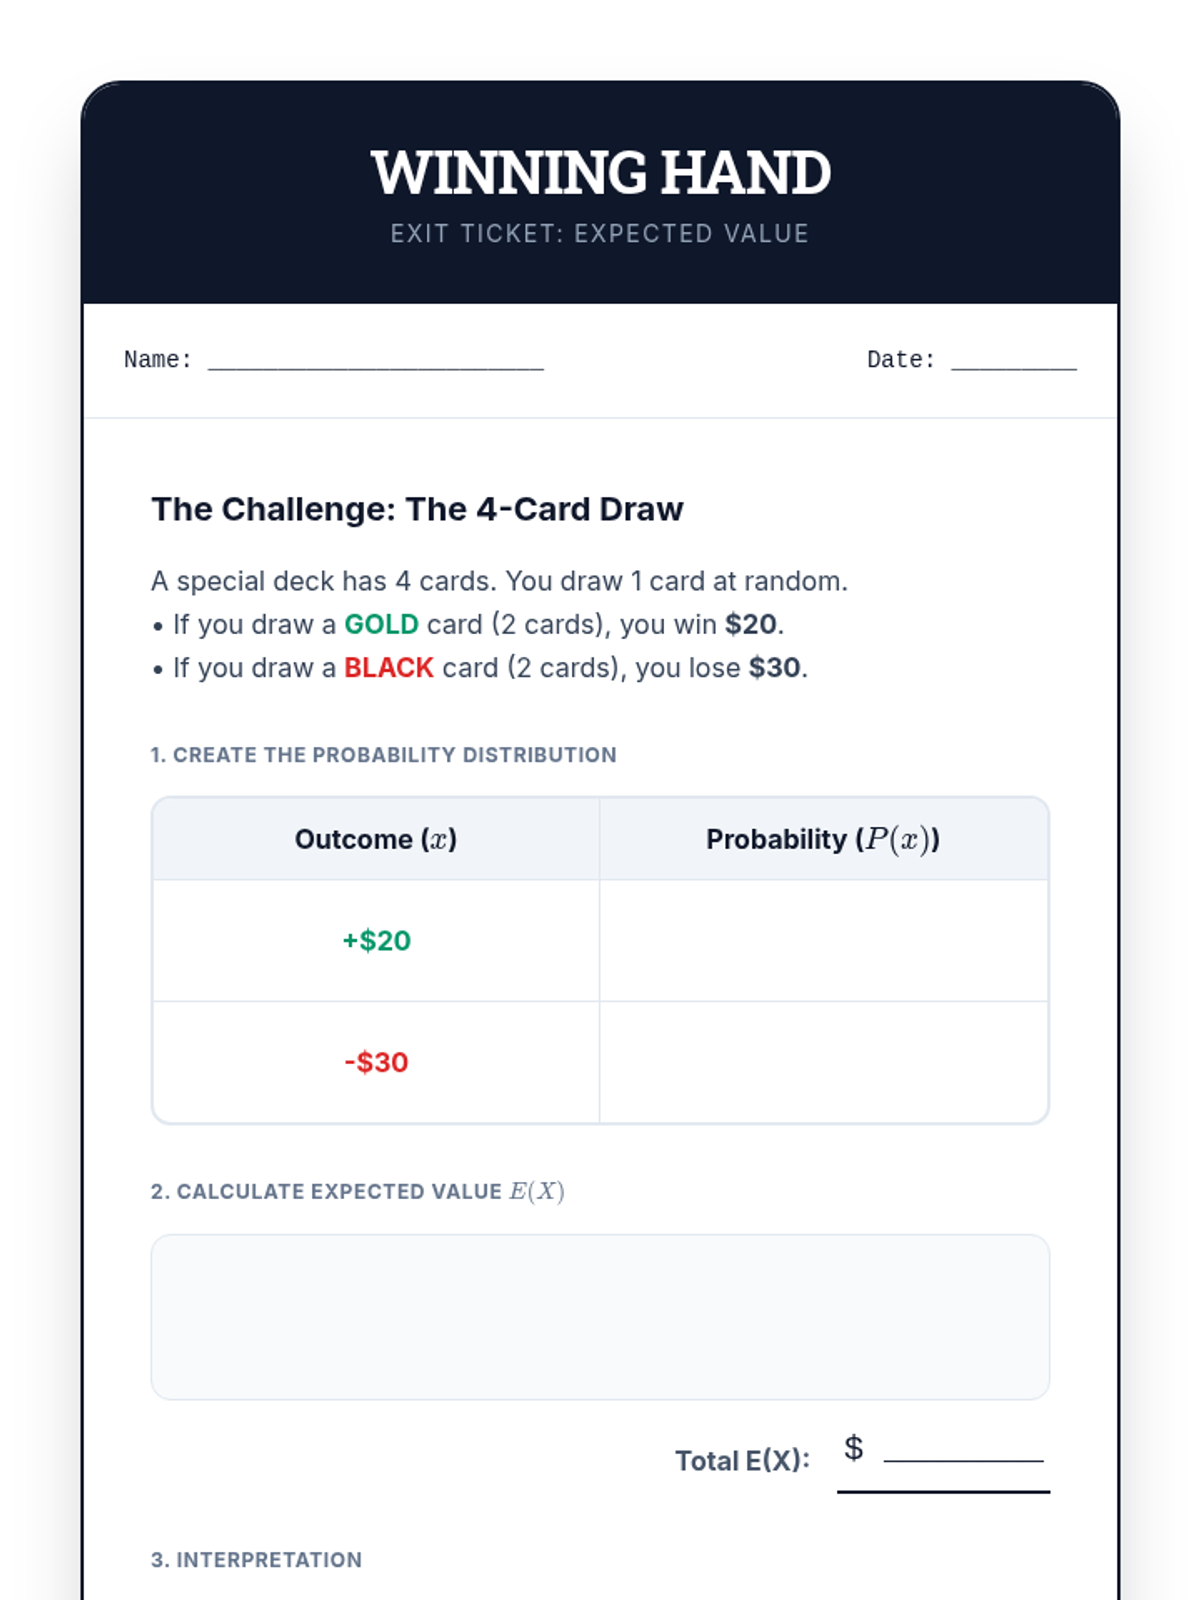
Students define random variables, create probability distributions, and calculate the expected value (mean) of a game of chance. The lesson concludes with a multi-trial experiment to see how experimental results converge on theoretical expectations.
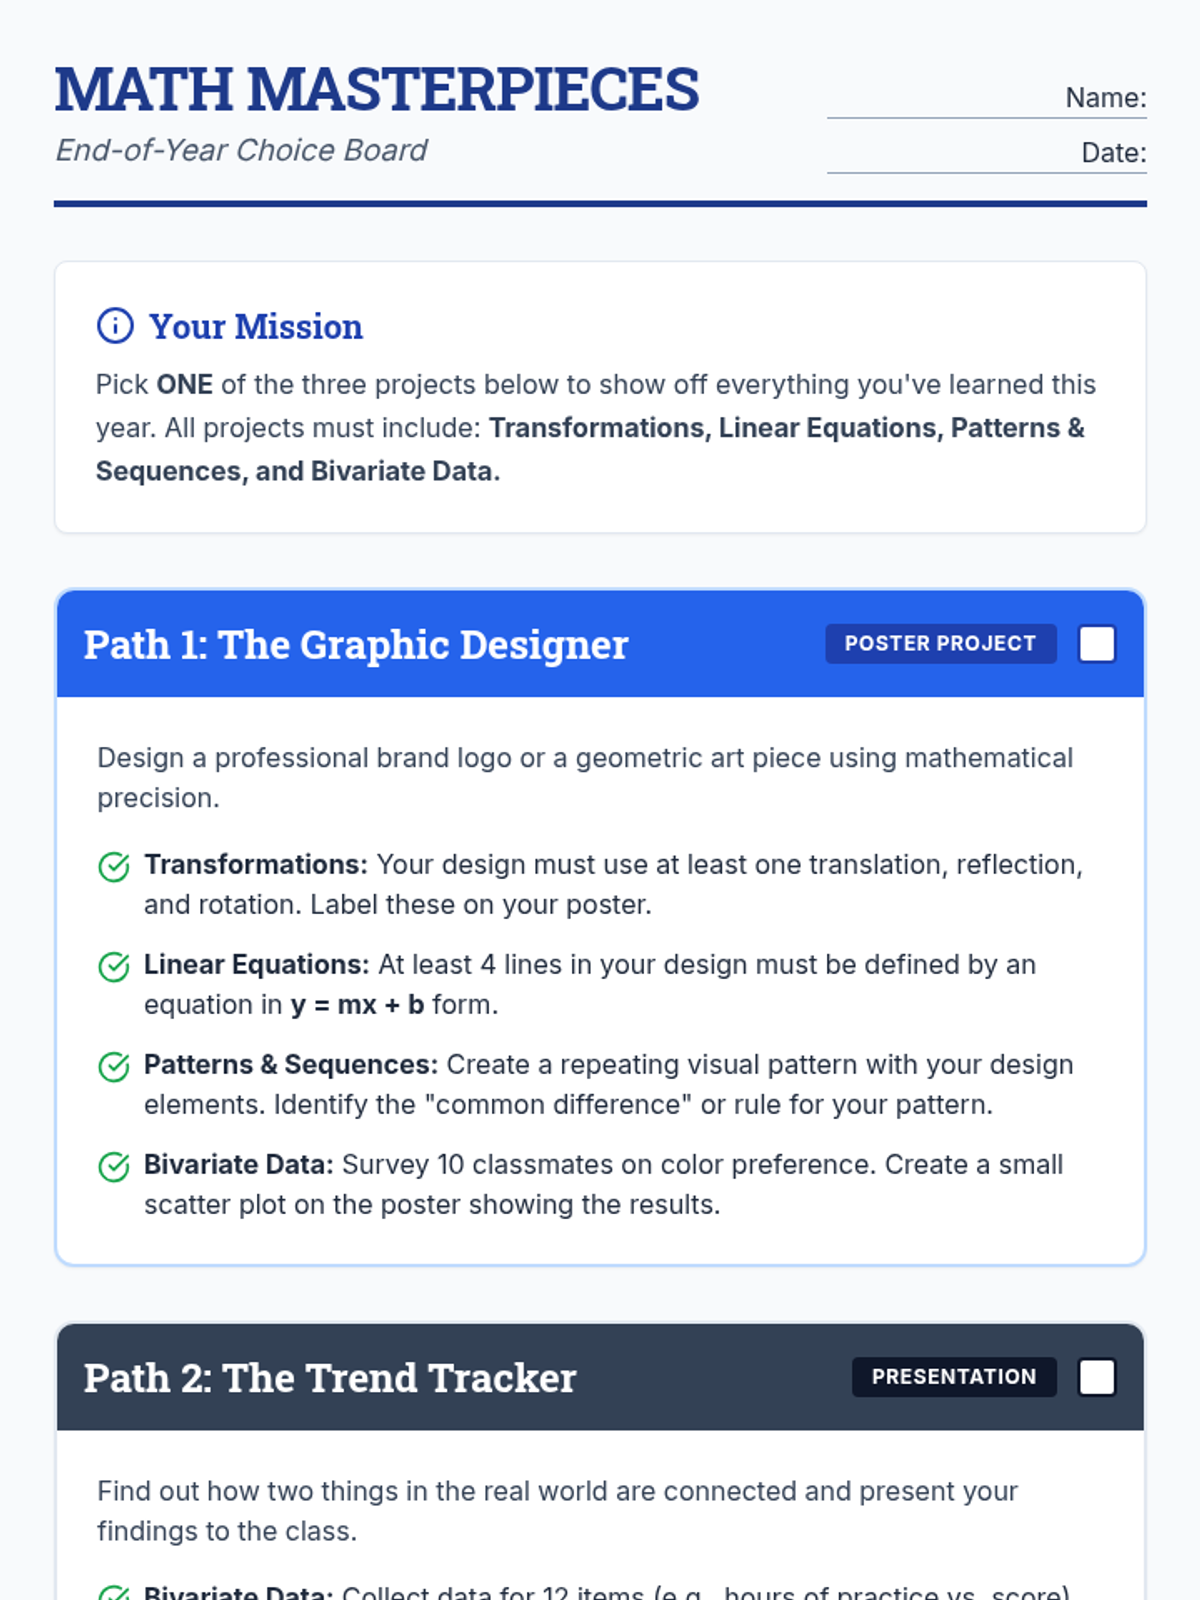
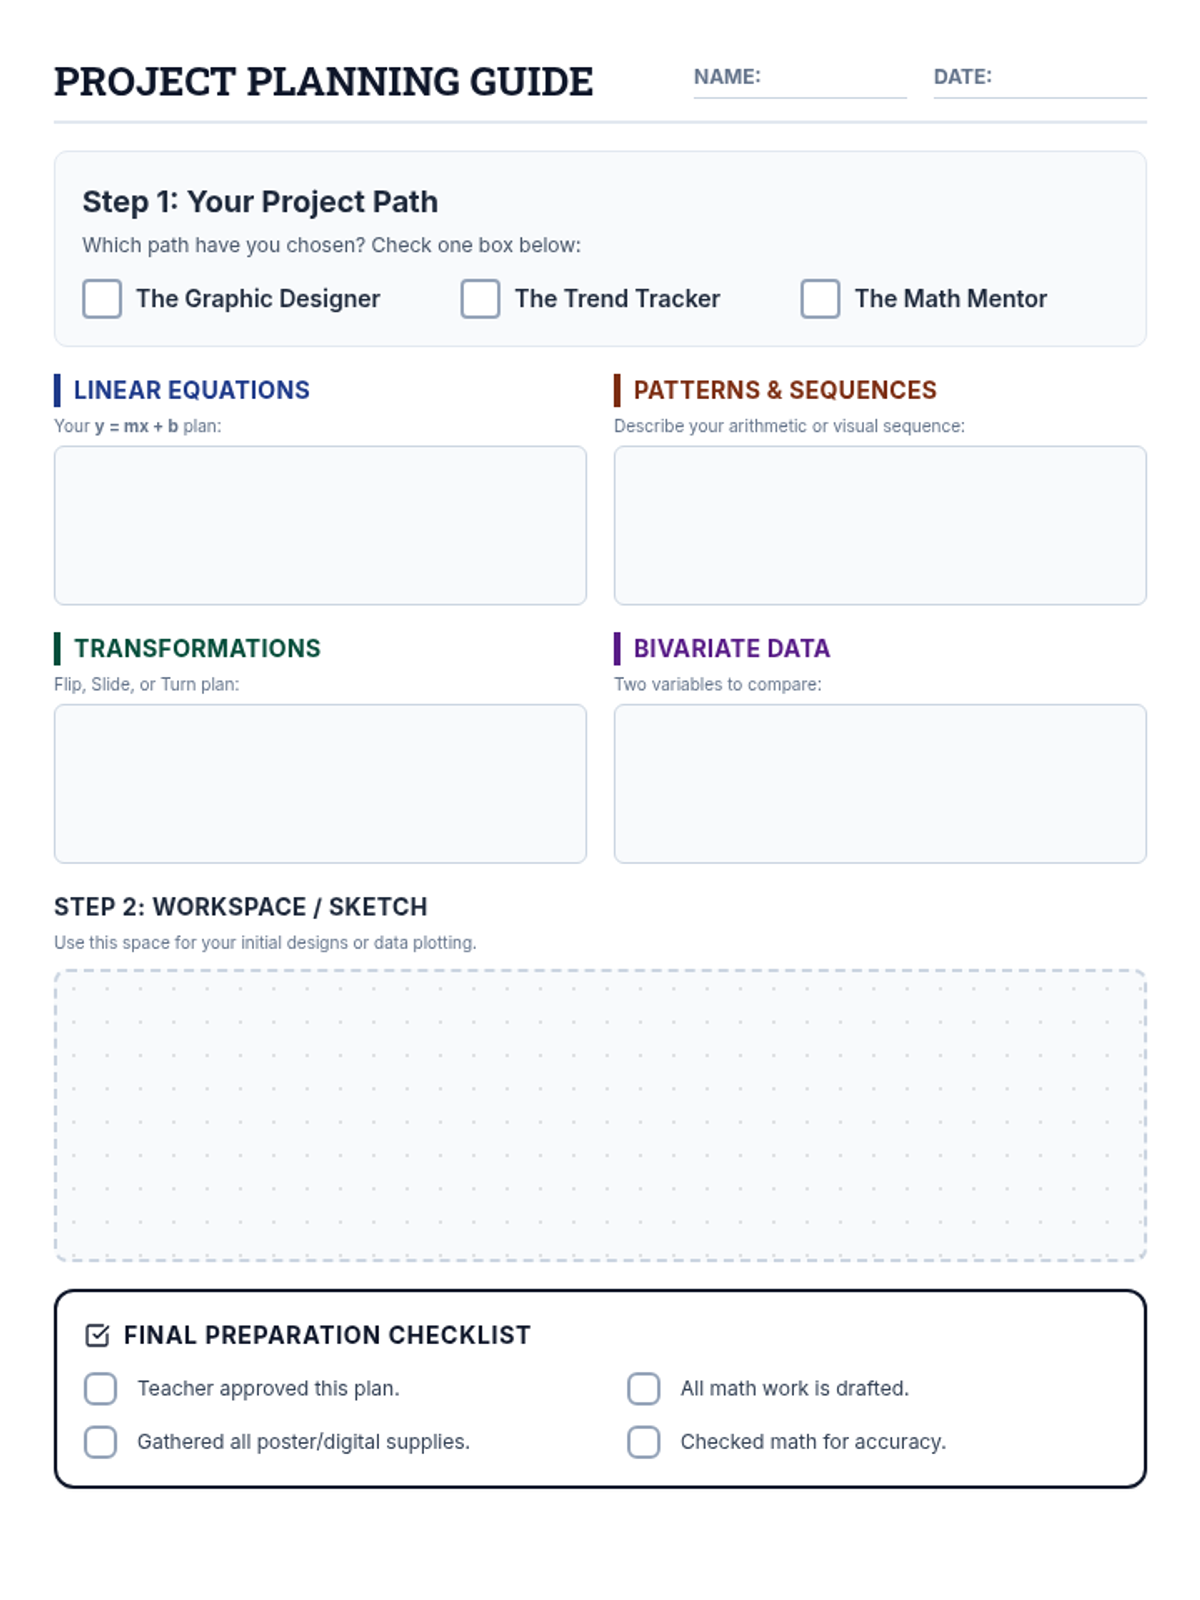
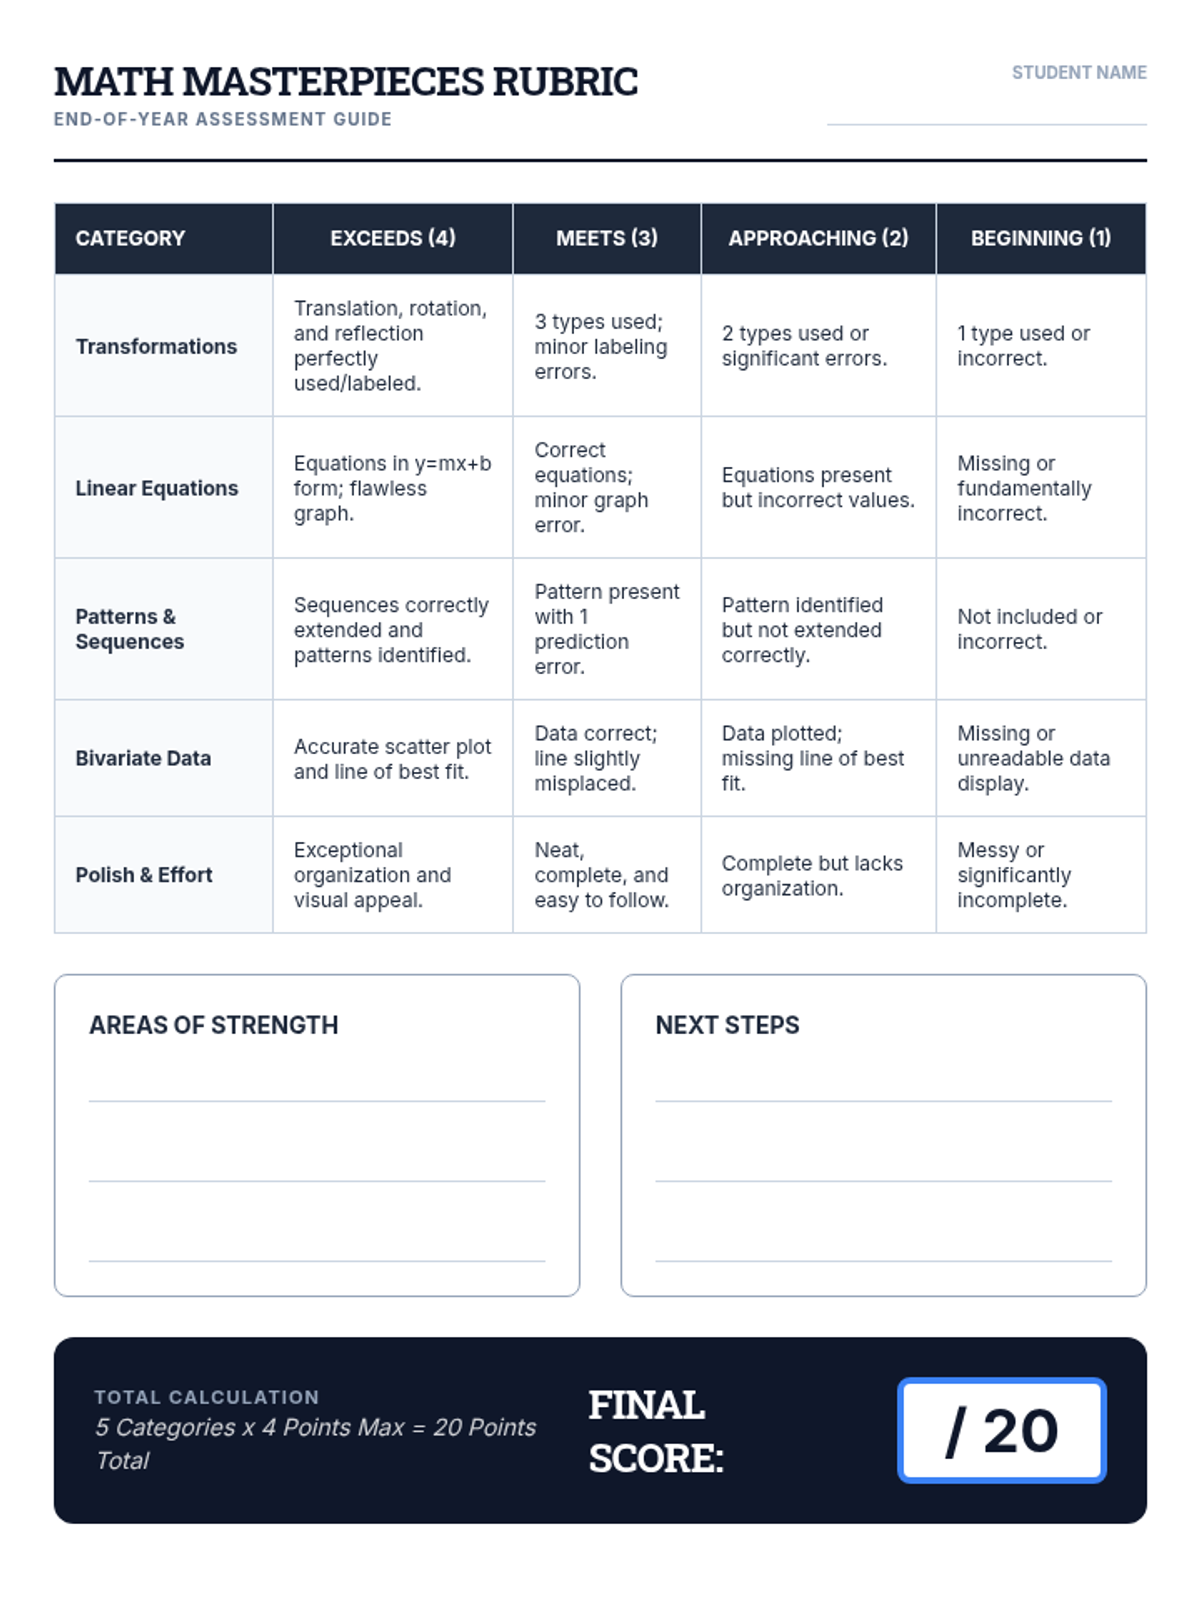
A creative end-of-year project where students choose between three paths to demonstrate mastery of transformations, linear equations, exponents, and bivariate data. Designed with scaffolded options for 8th-grade students.
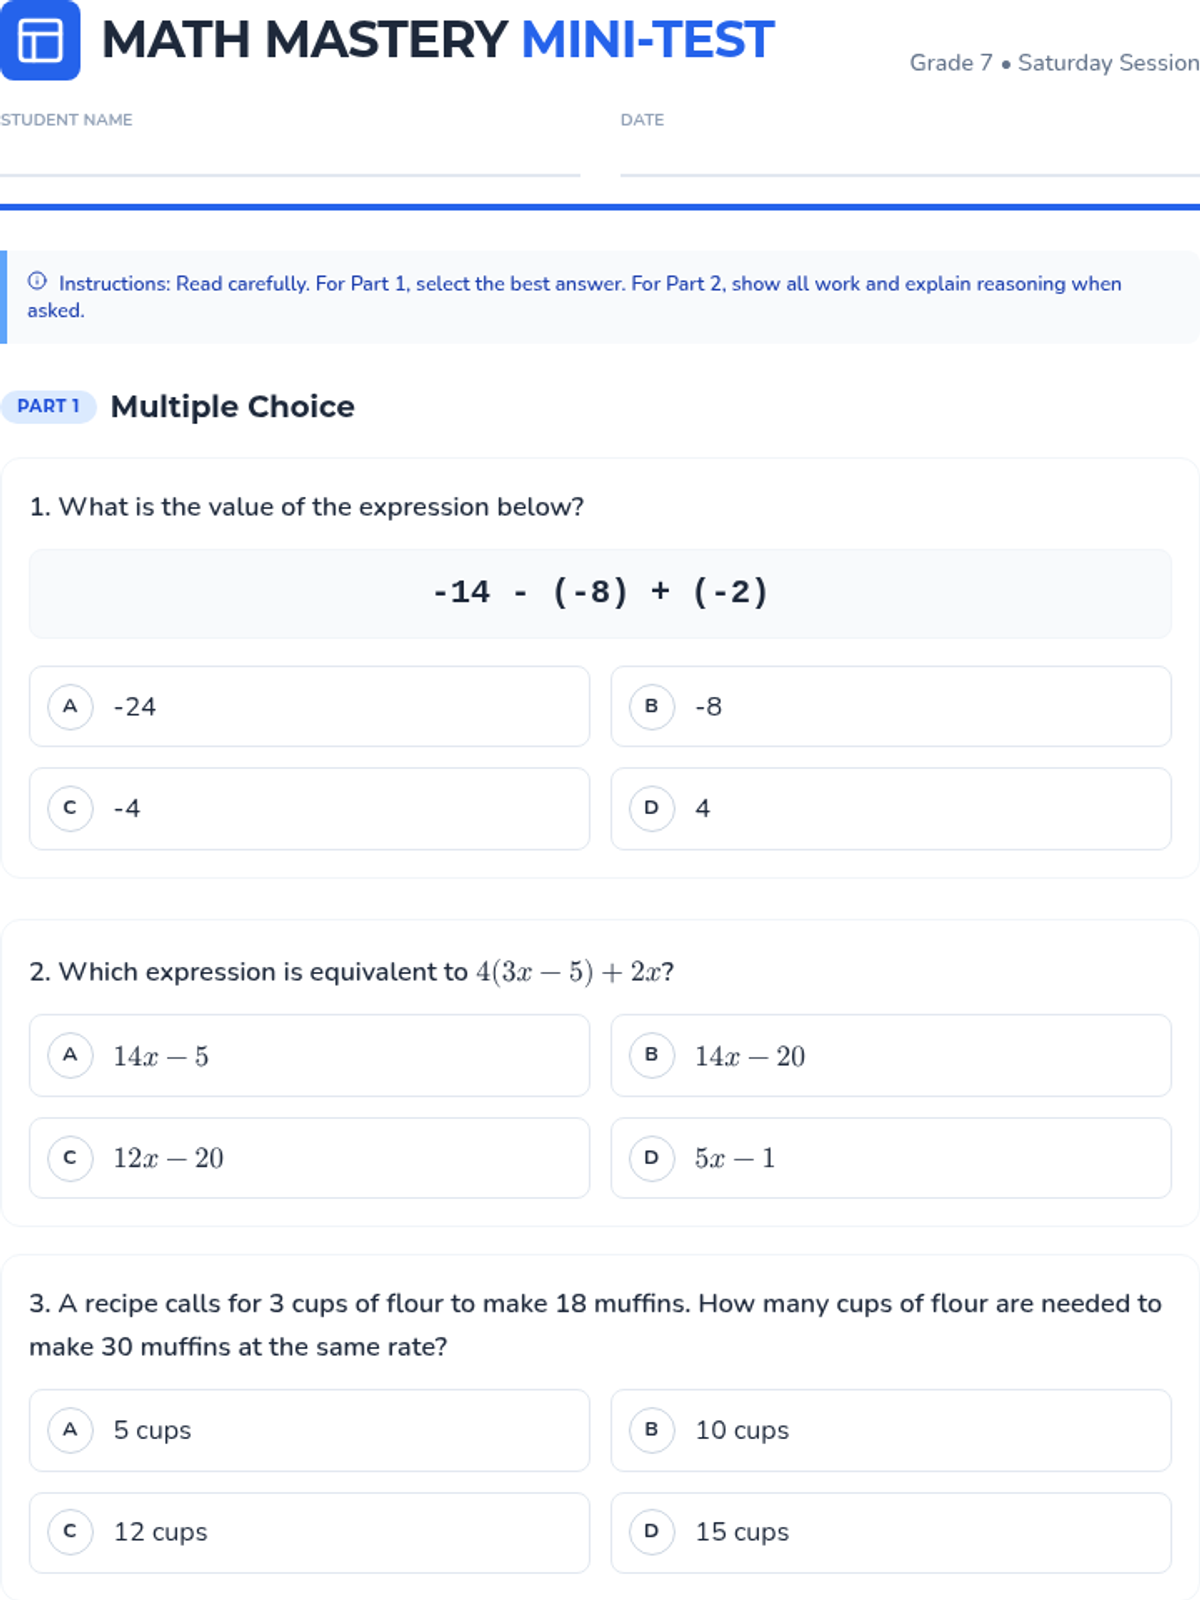
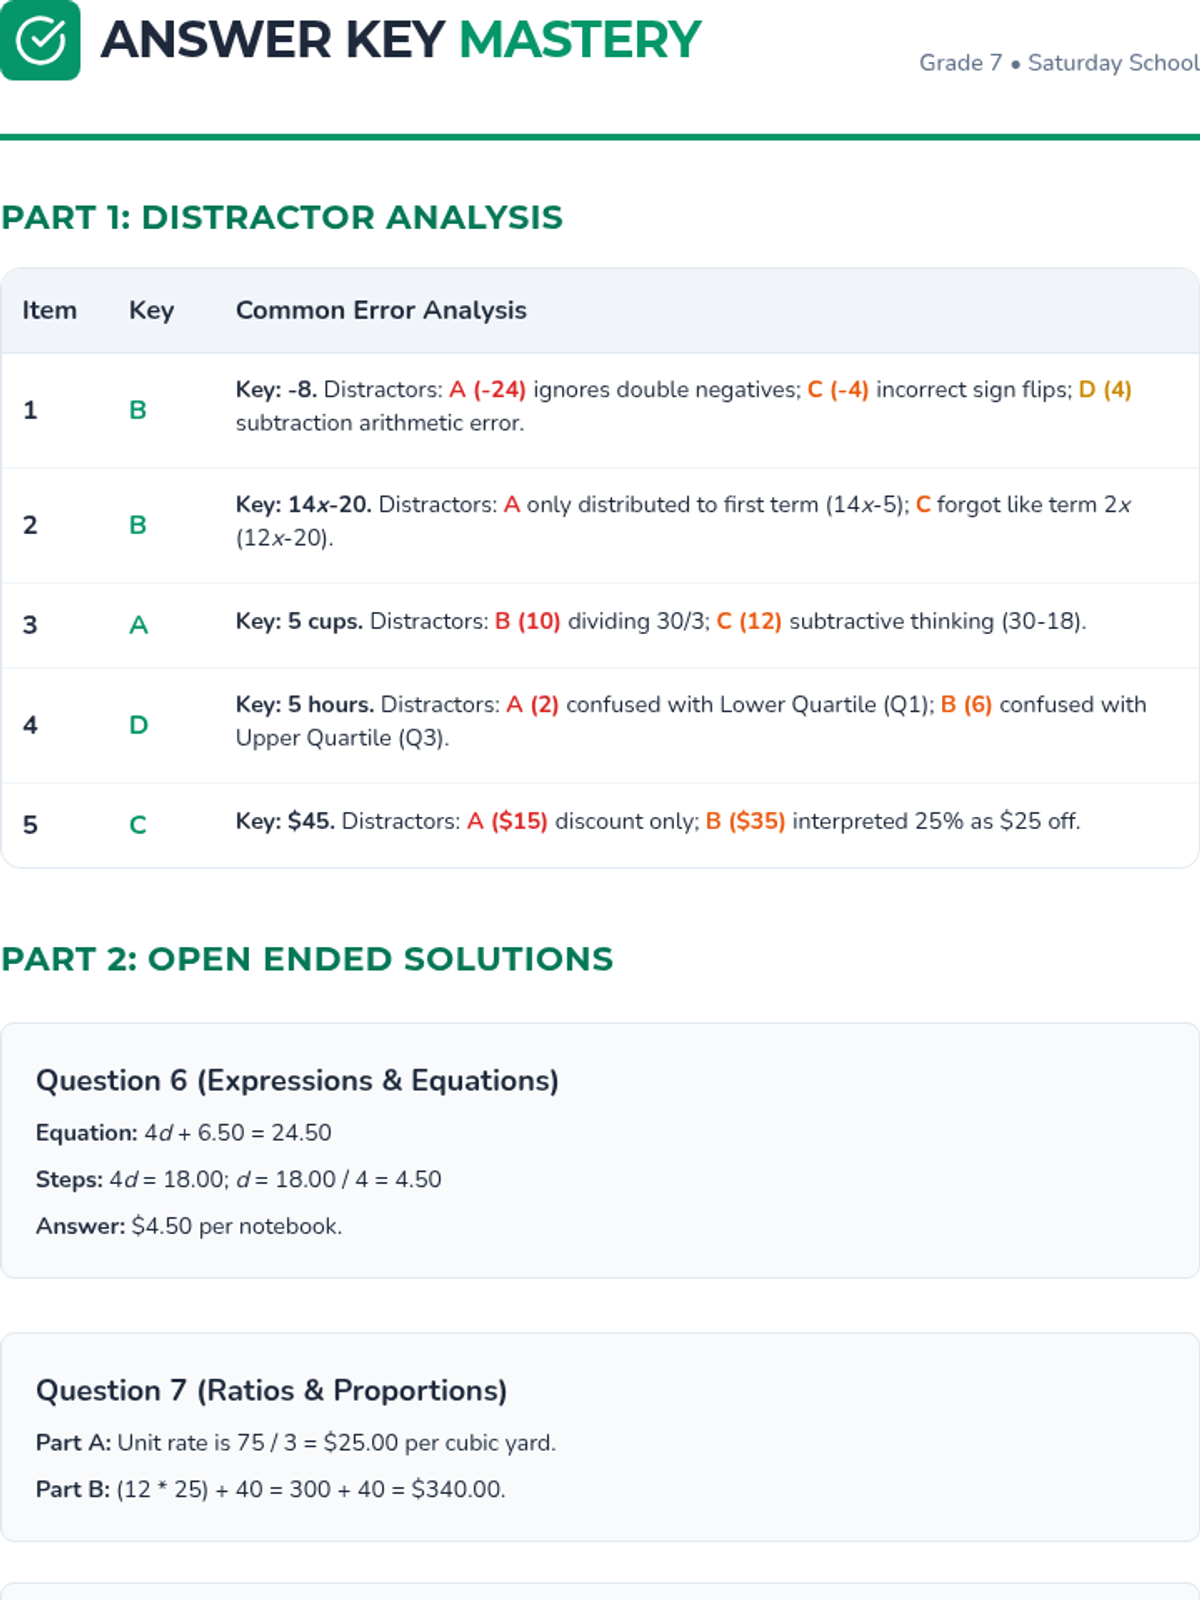
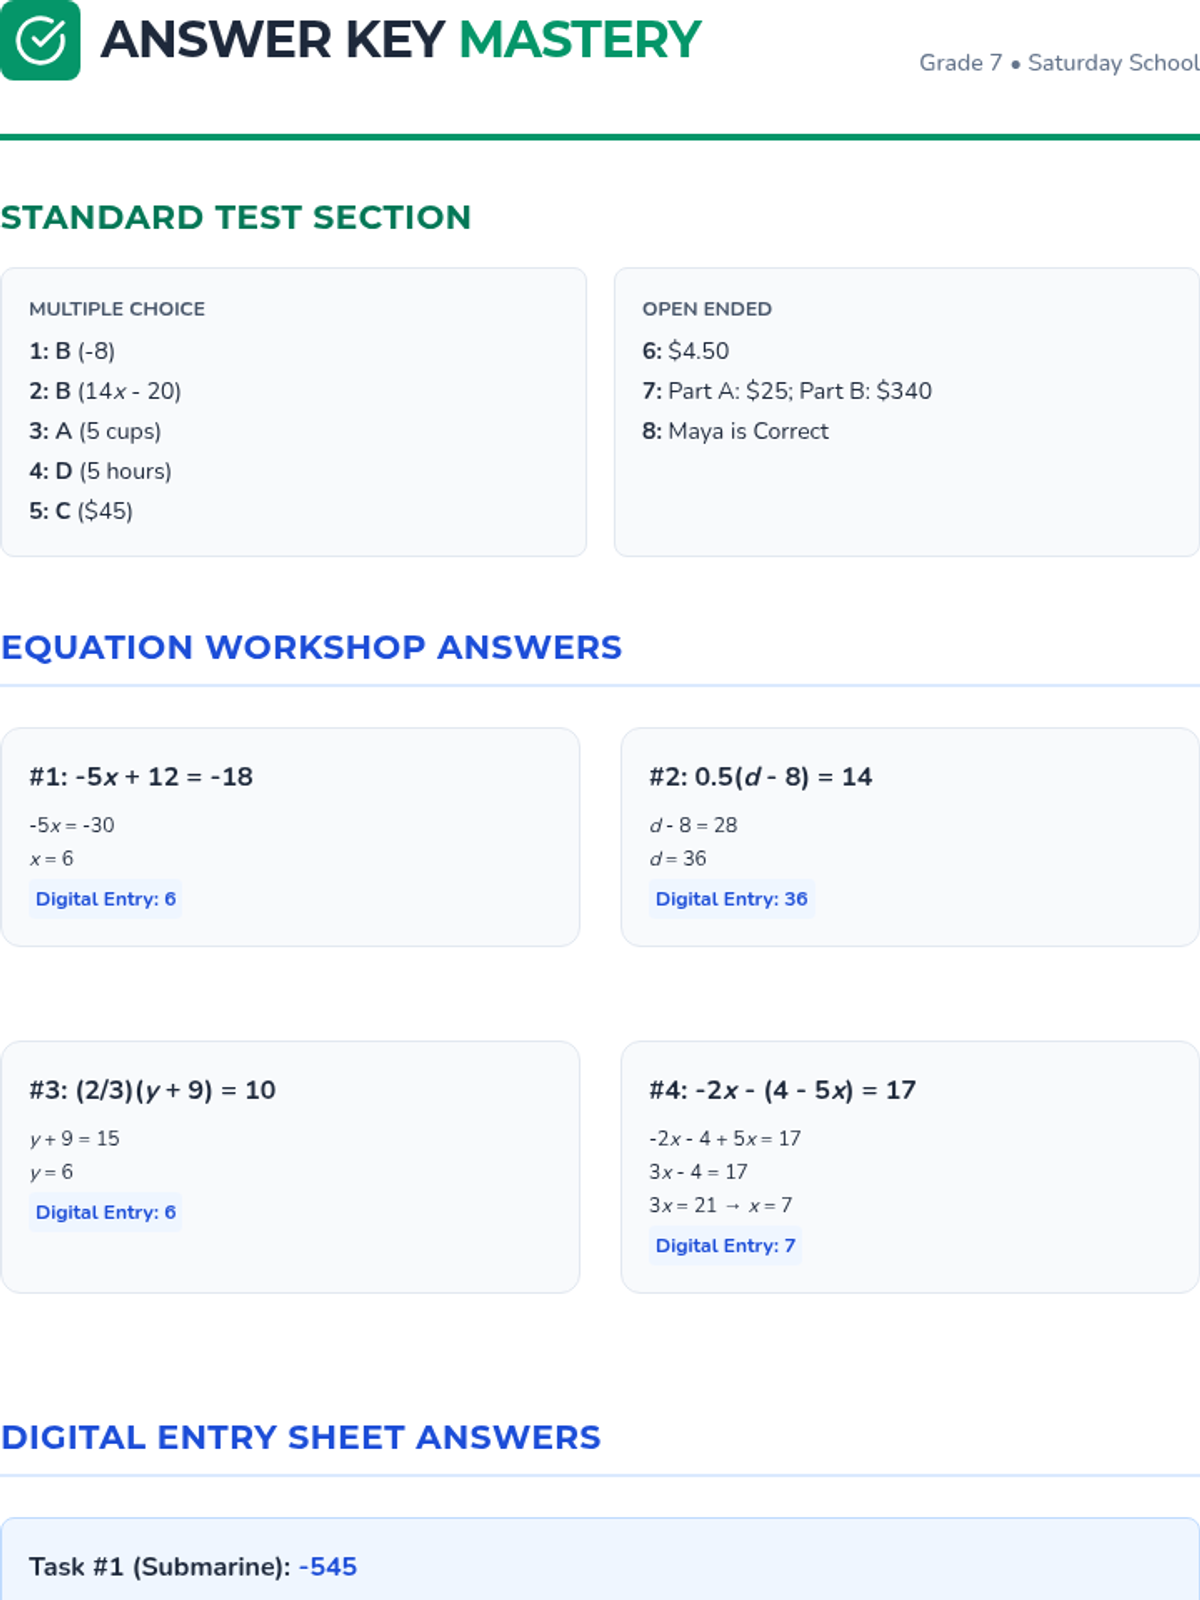
A 7th-grade math mini-test designed for Saturday school, focusing on core NYS standards including Number Systems, Expressions and Equations, Ratios and Proportions, and Statistics. Includes a student test packet and a teacher answer key.
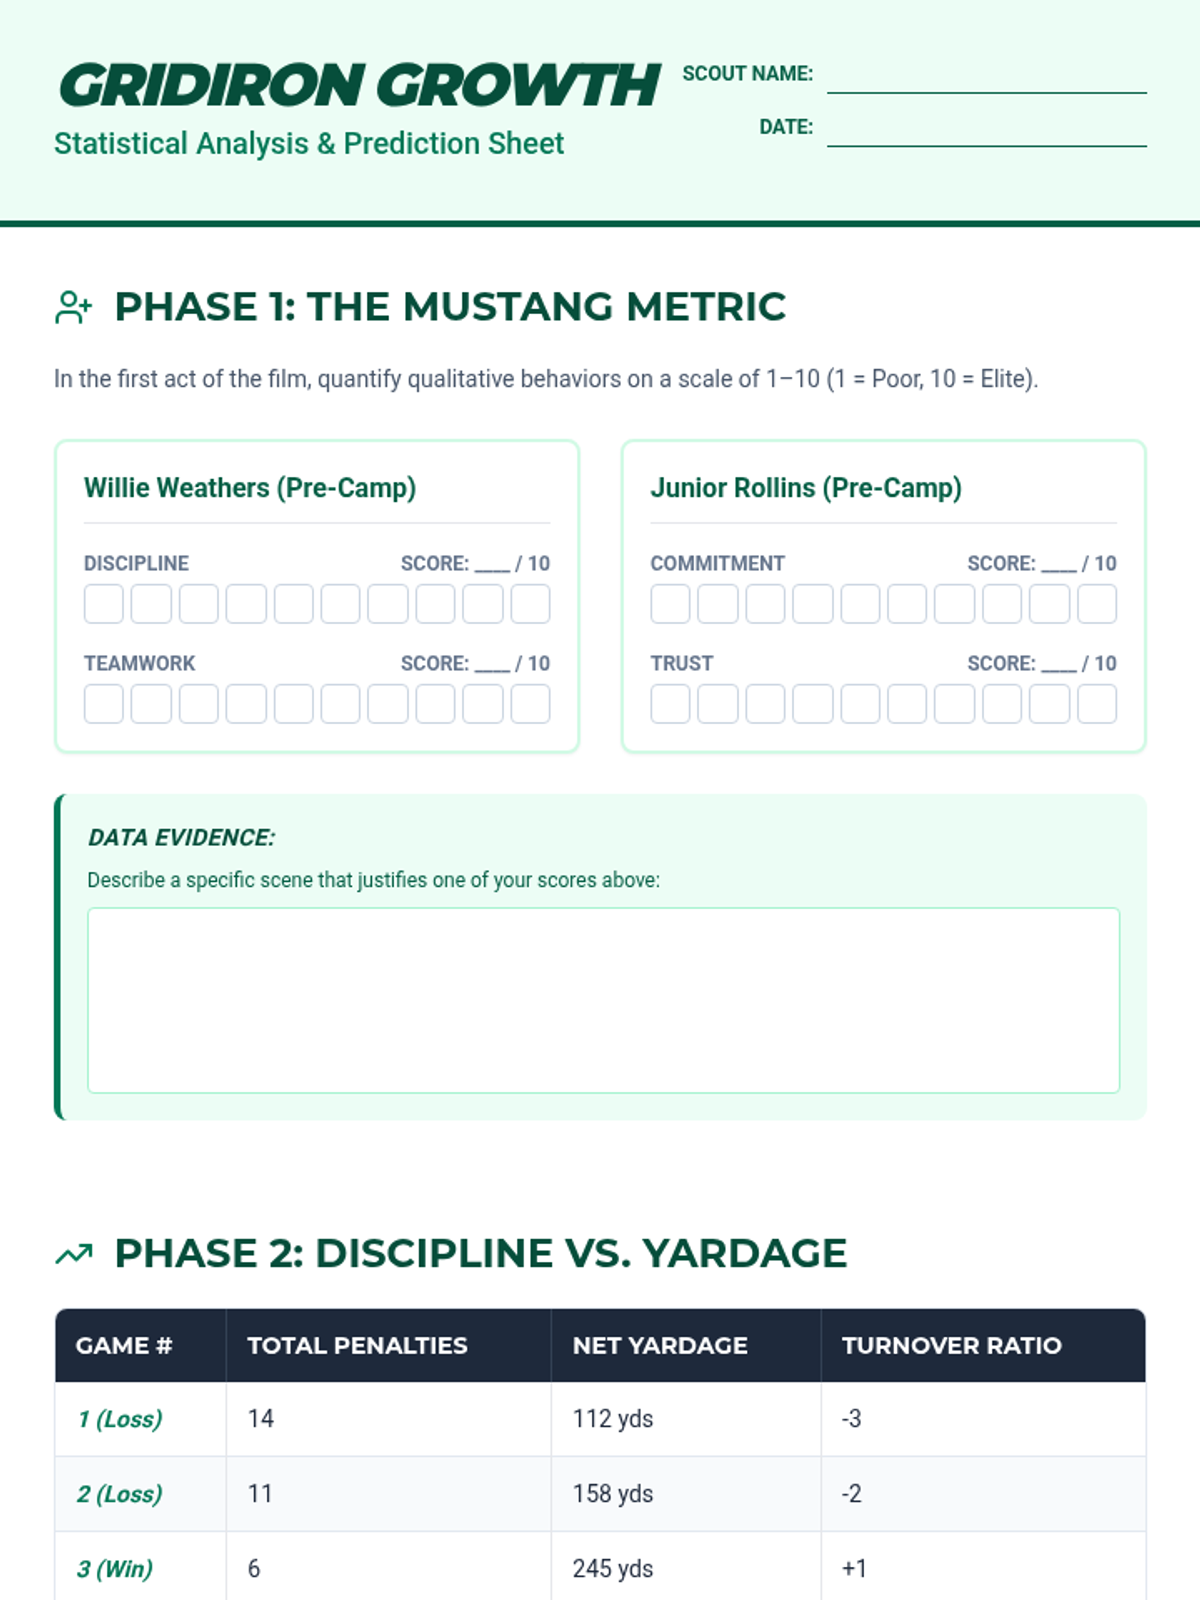
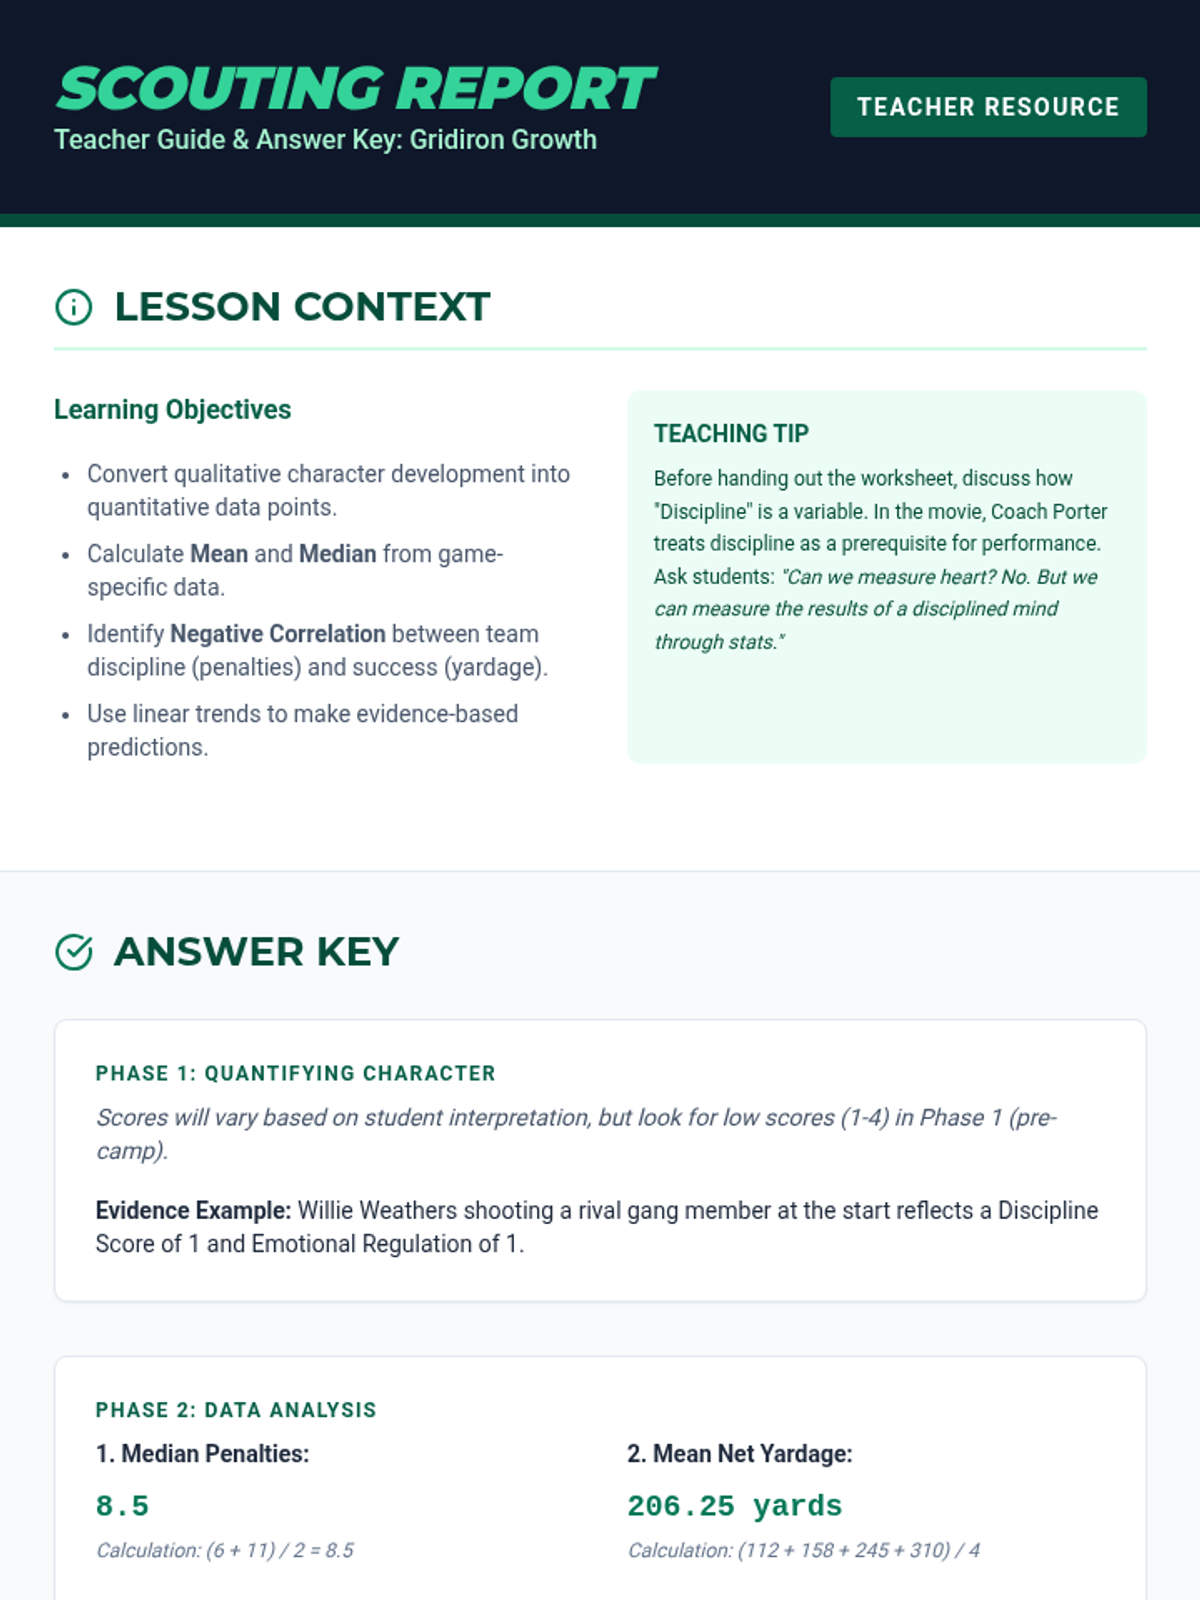
A high school lesson that uses the film Gridiron Gang to teach statistical analysis and data-driven predictions based on character development and team performance. Students will quantify qualitative character traits and use team statistics to forecast game outcomes.
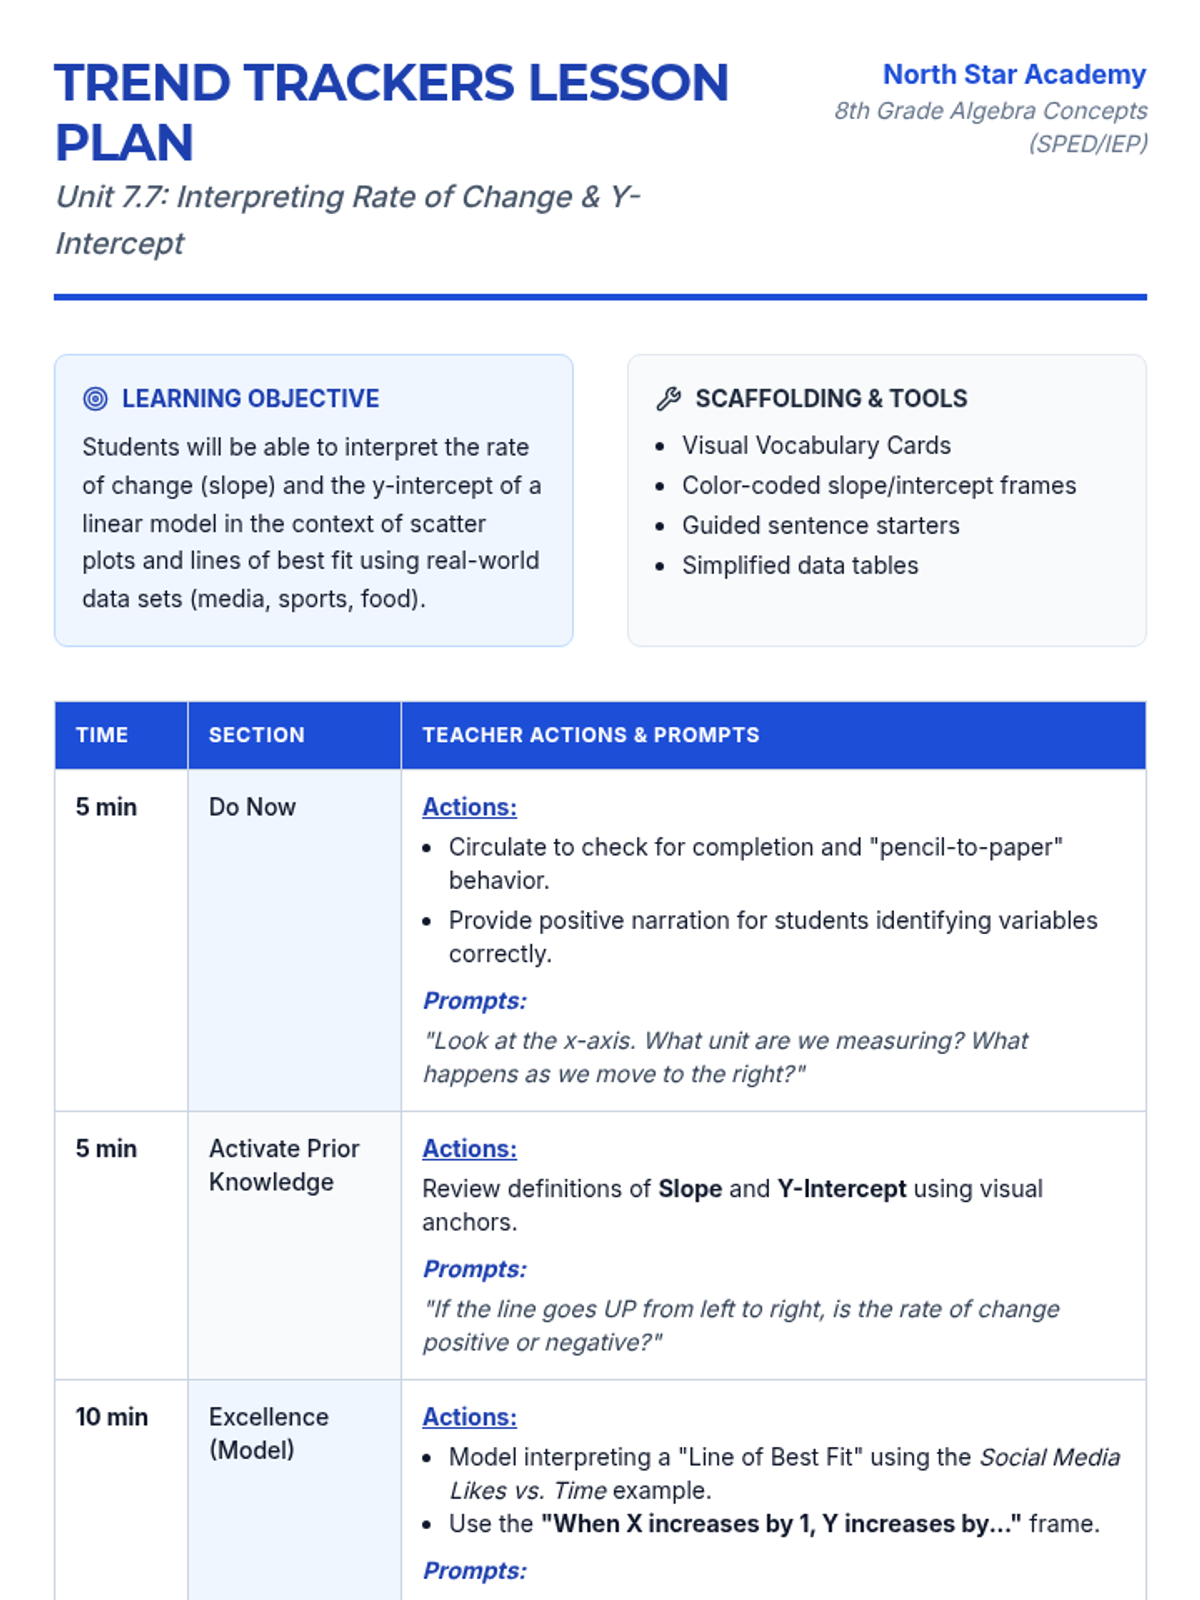
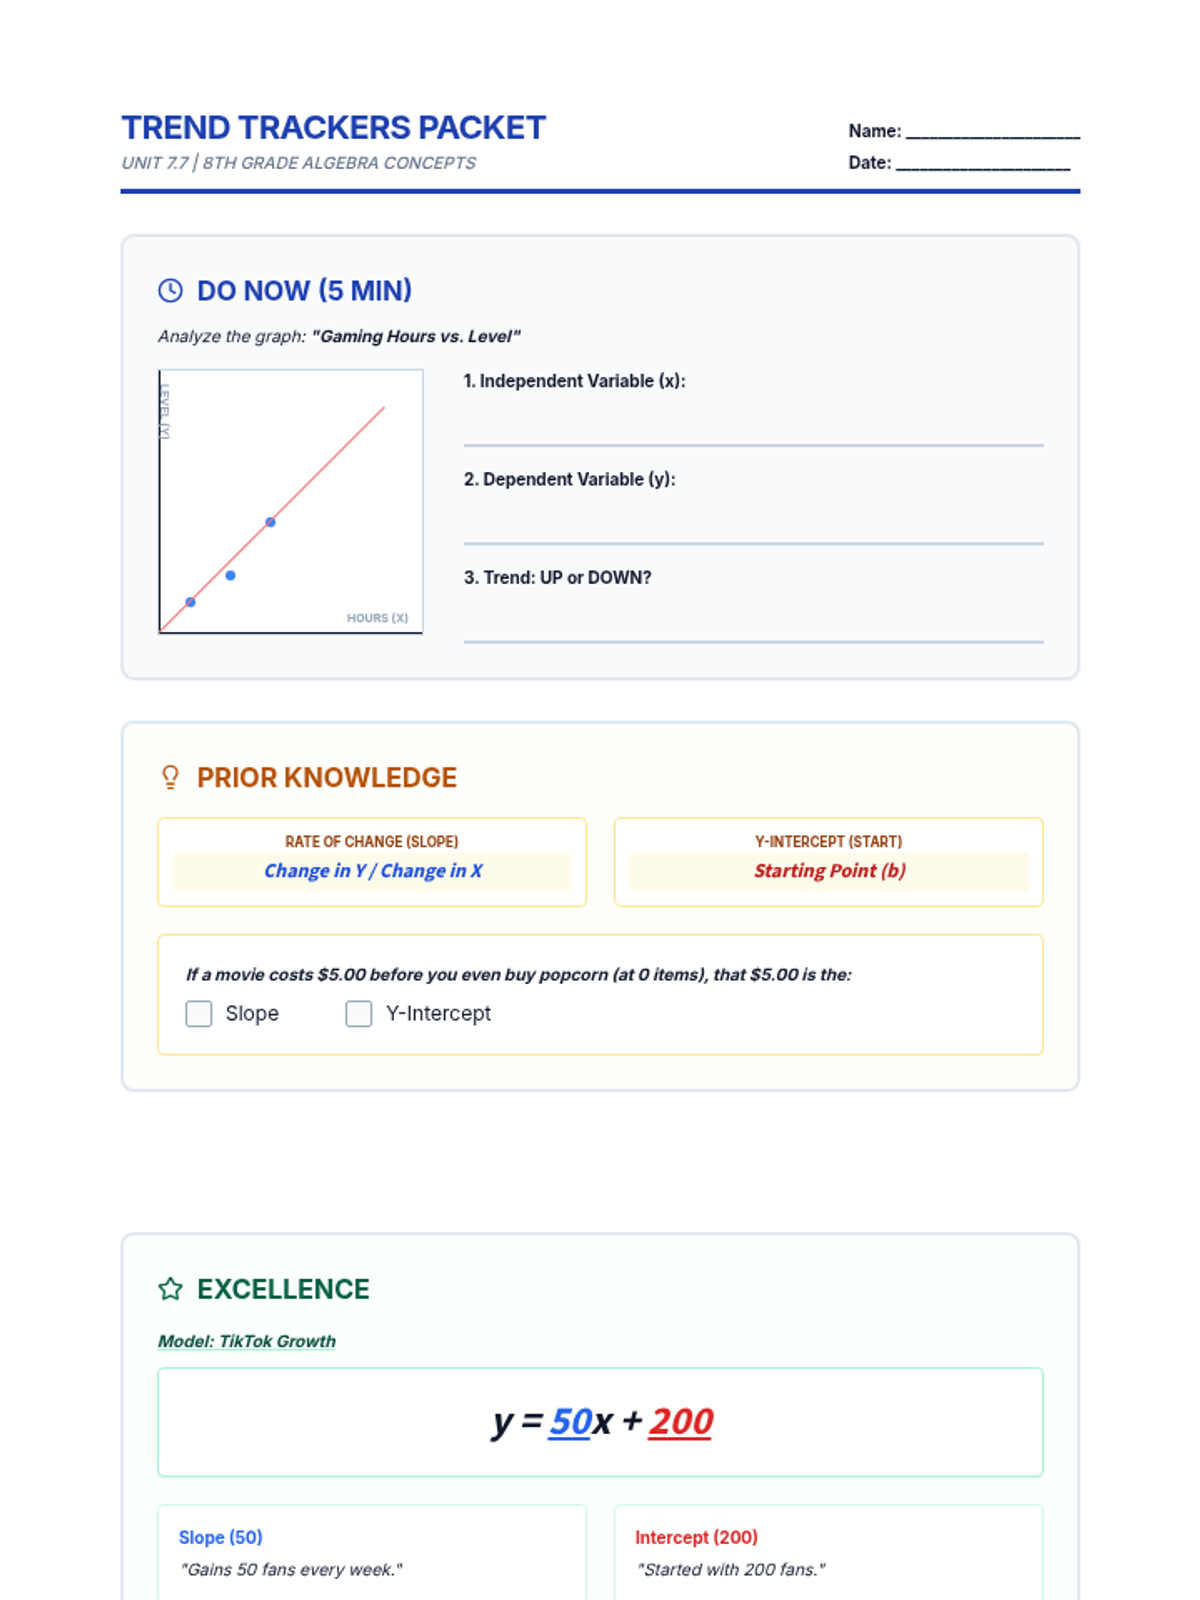
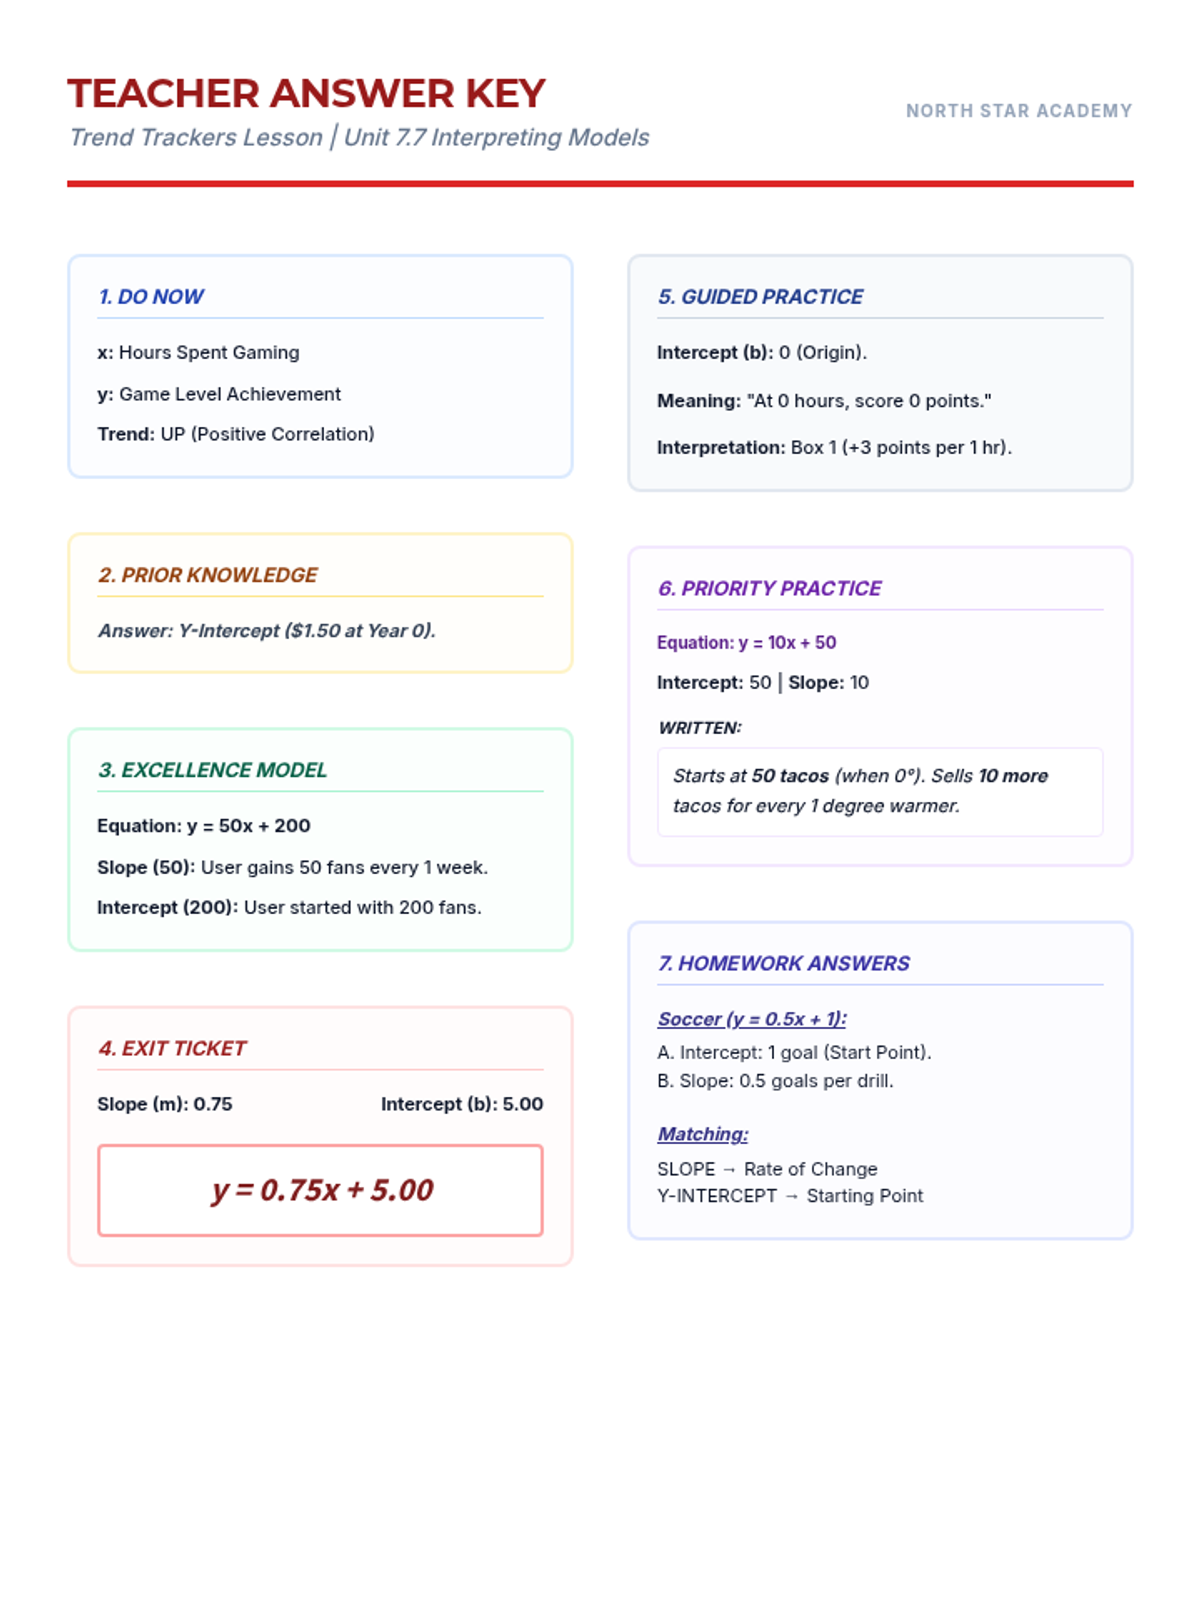
An 8th grade Algebra lesson focused on interpreting slope and y-intercept in the context of scatter plots and lines of best fit, specifically designed for Special Education students with IEP supports.
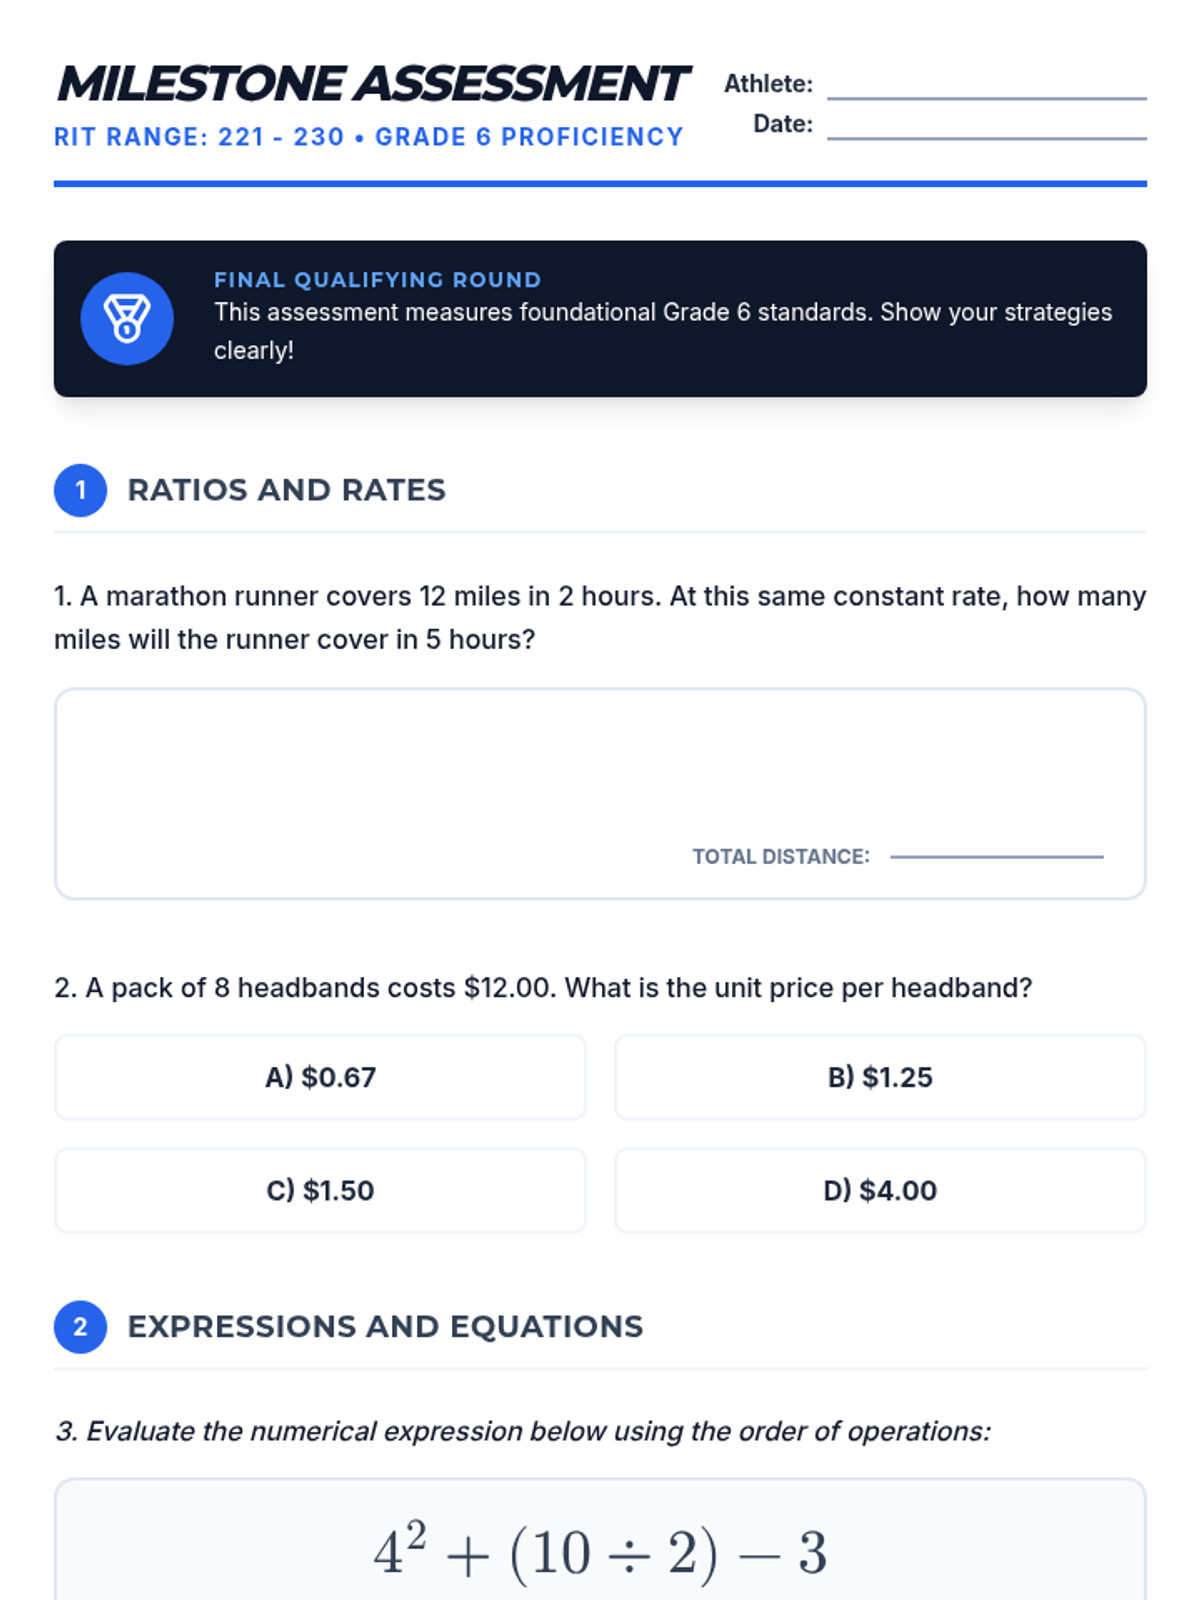
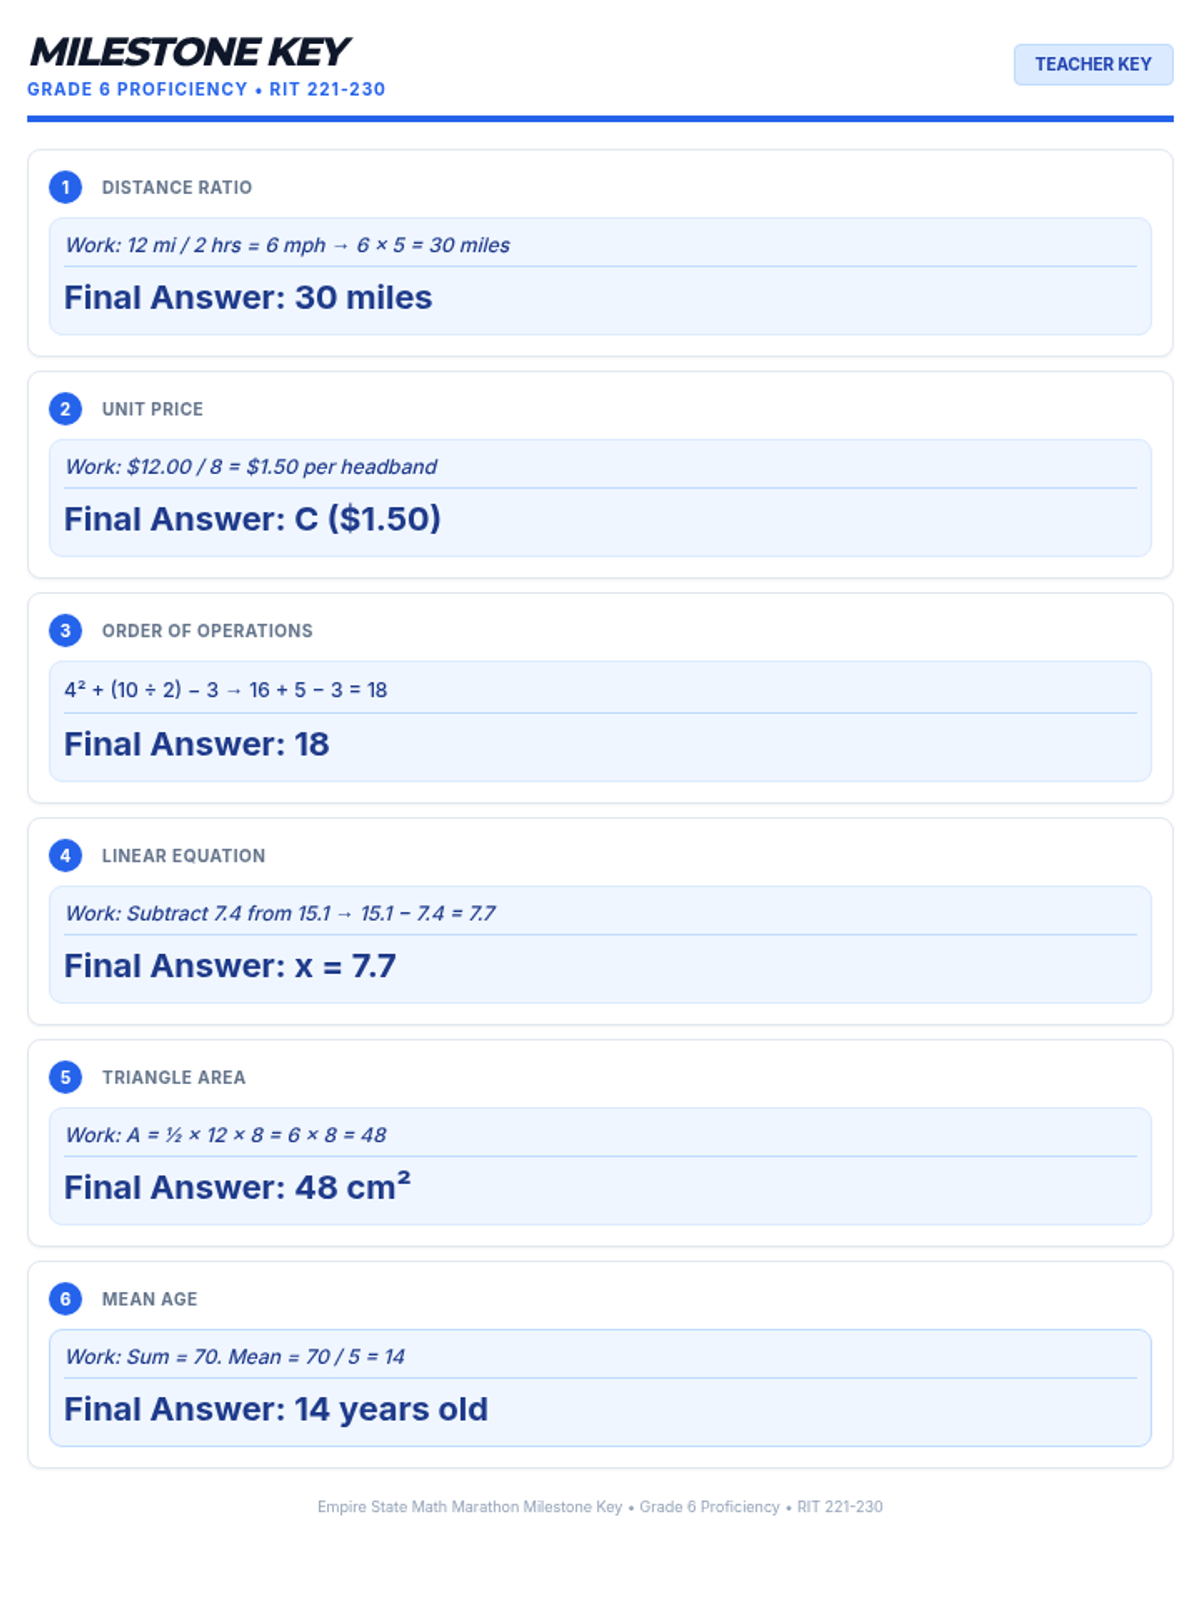
A cumulative milestone assessment designed for students at Grade 6 proficiency (RIT 221-230). This assessment checks foundational understanding of ratios, expressions, and geometry needed for 8th-grade success.
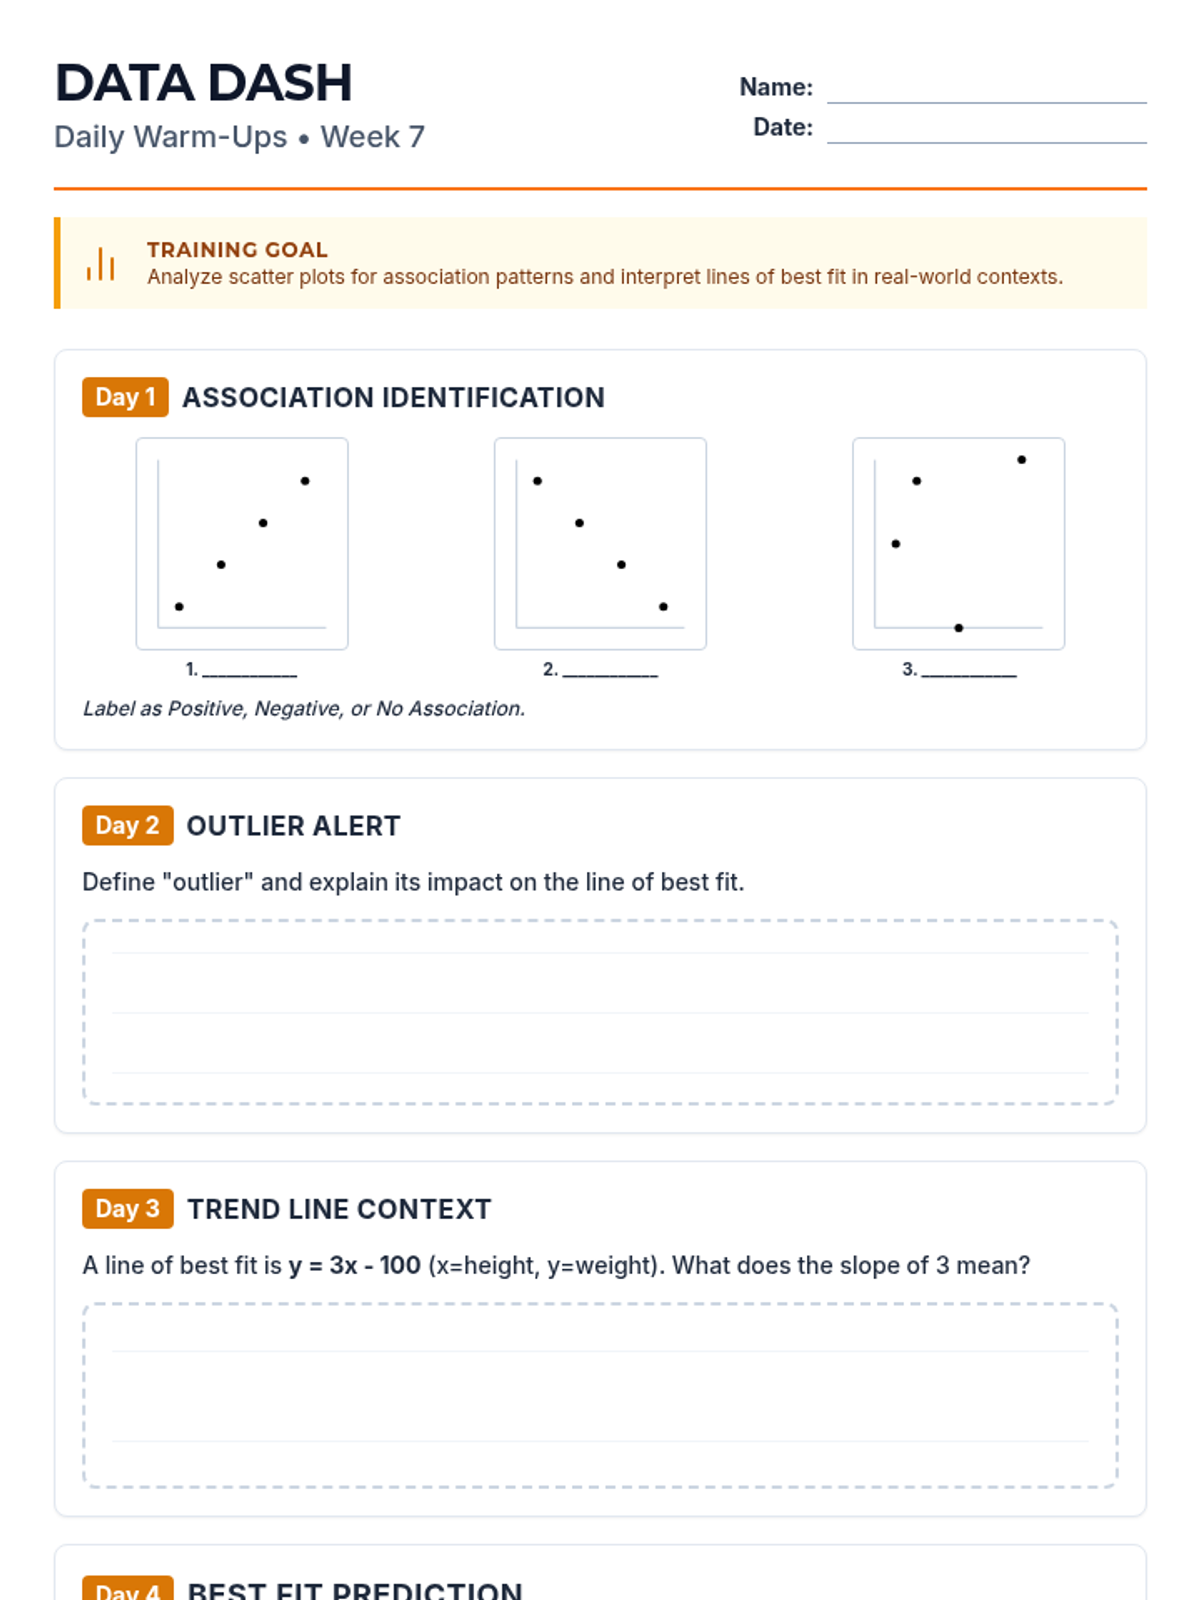
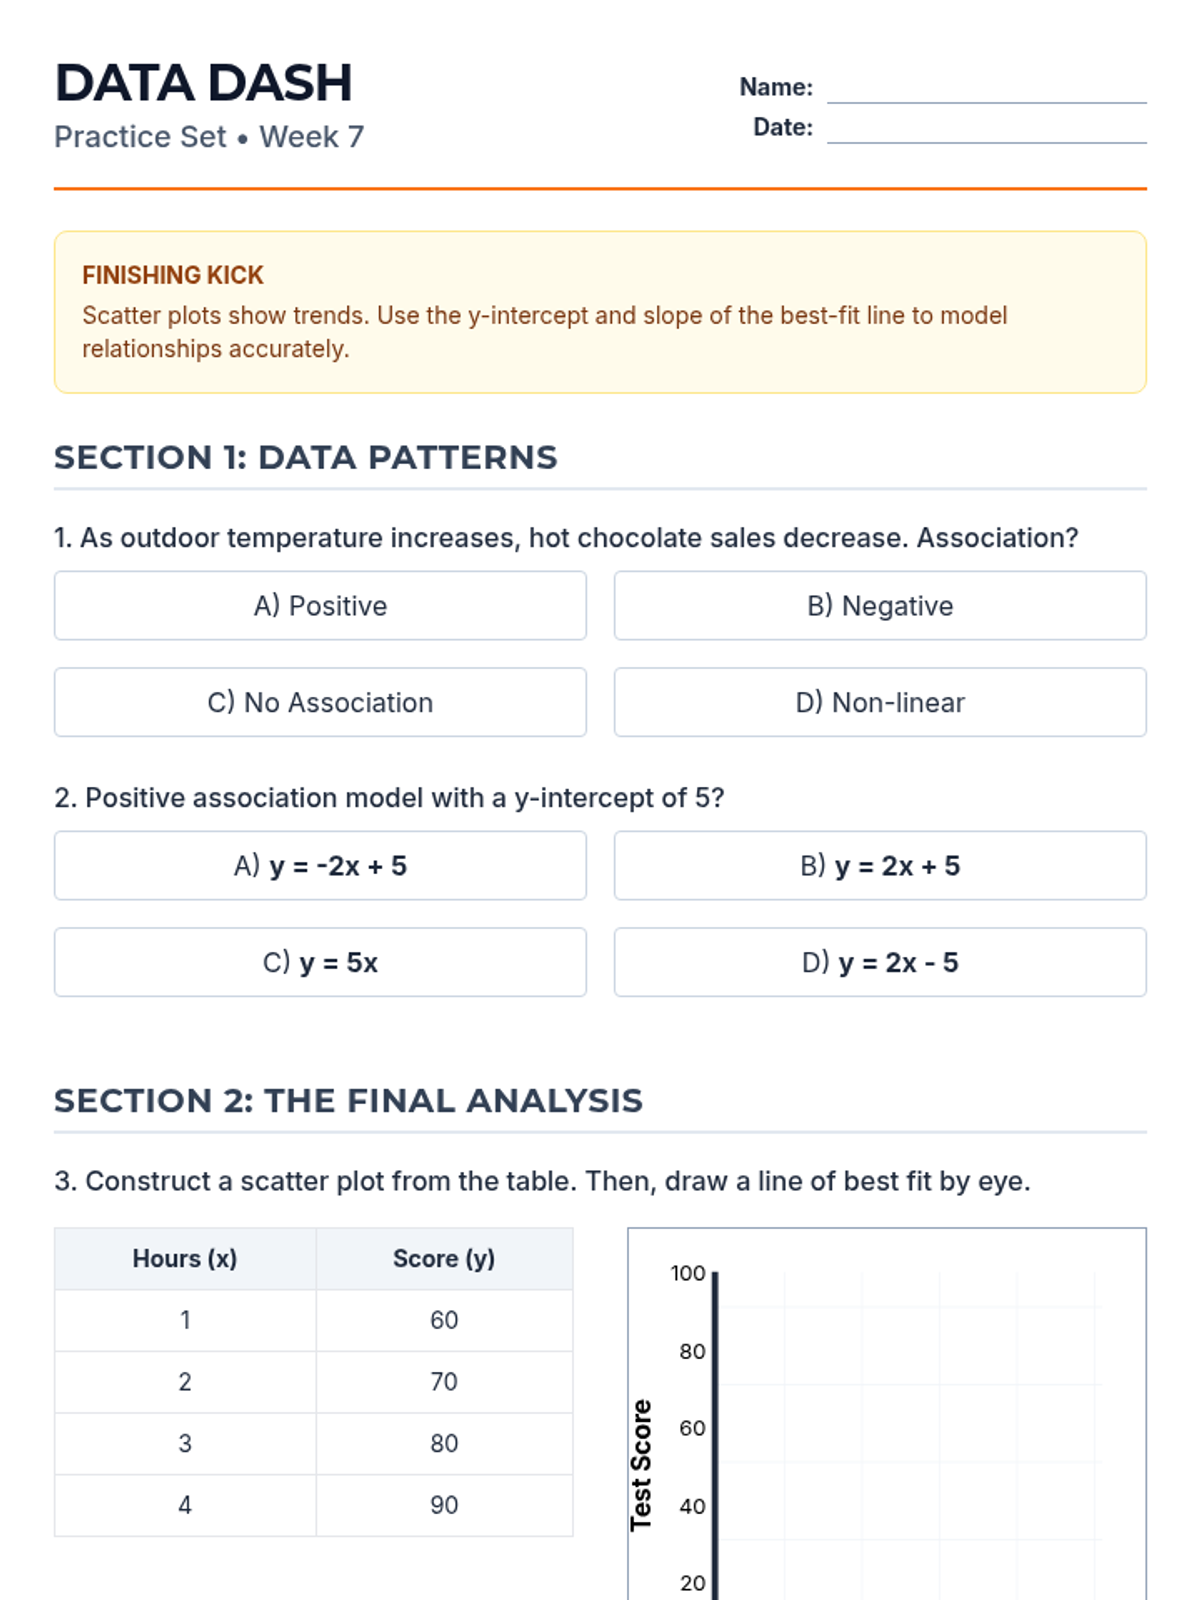
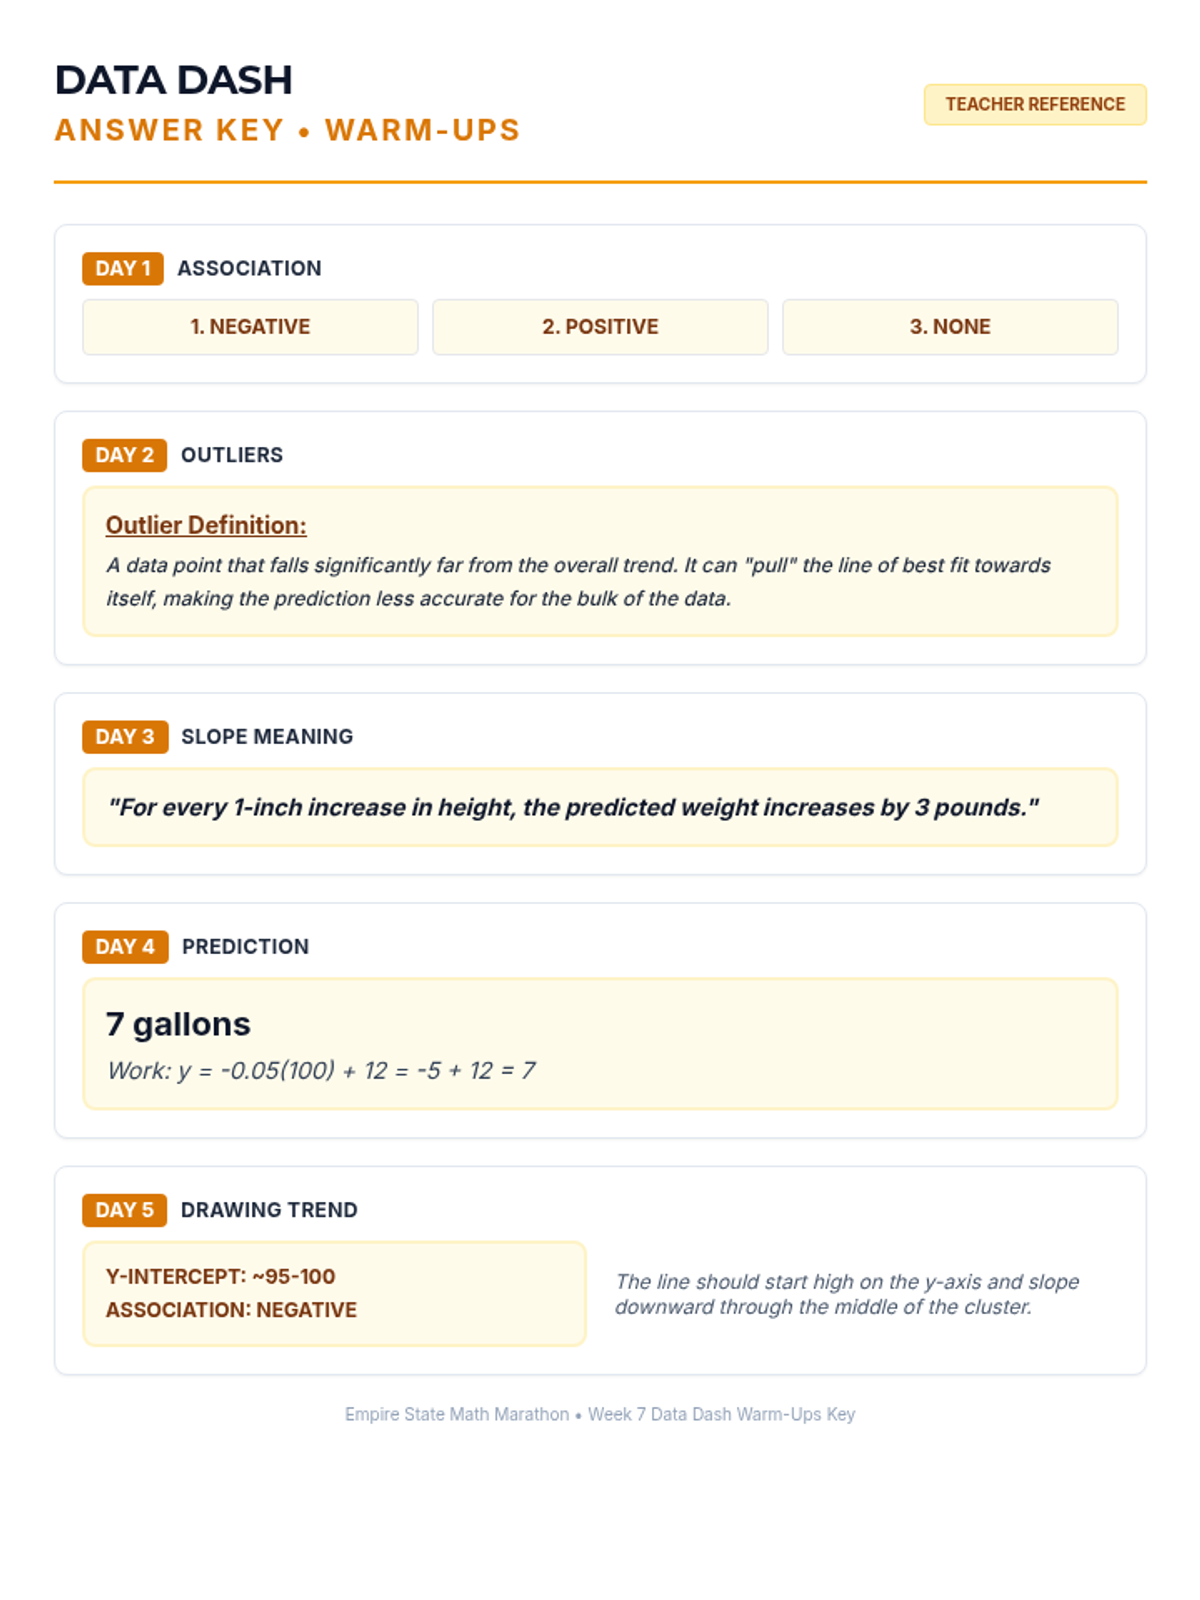
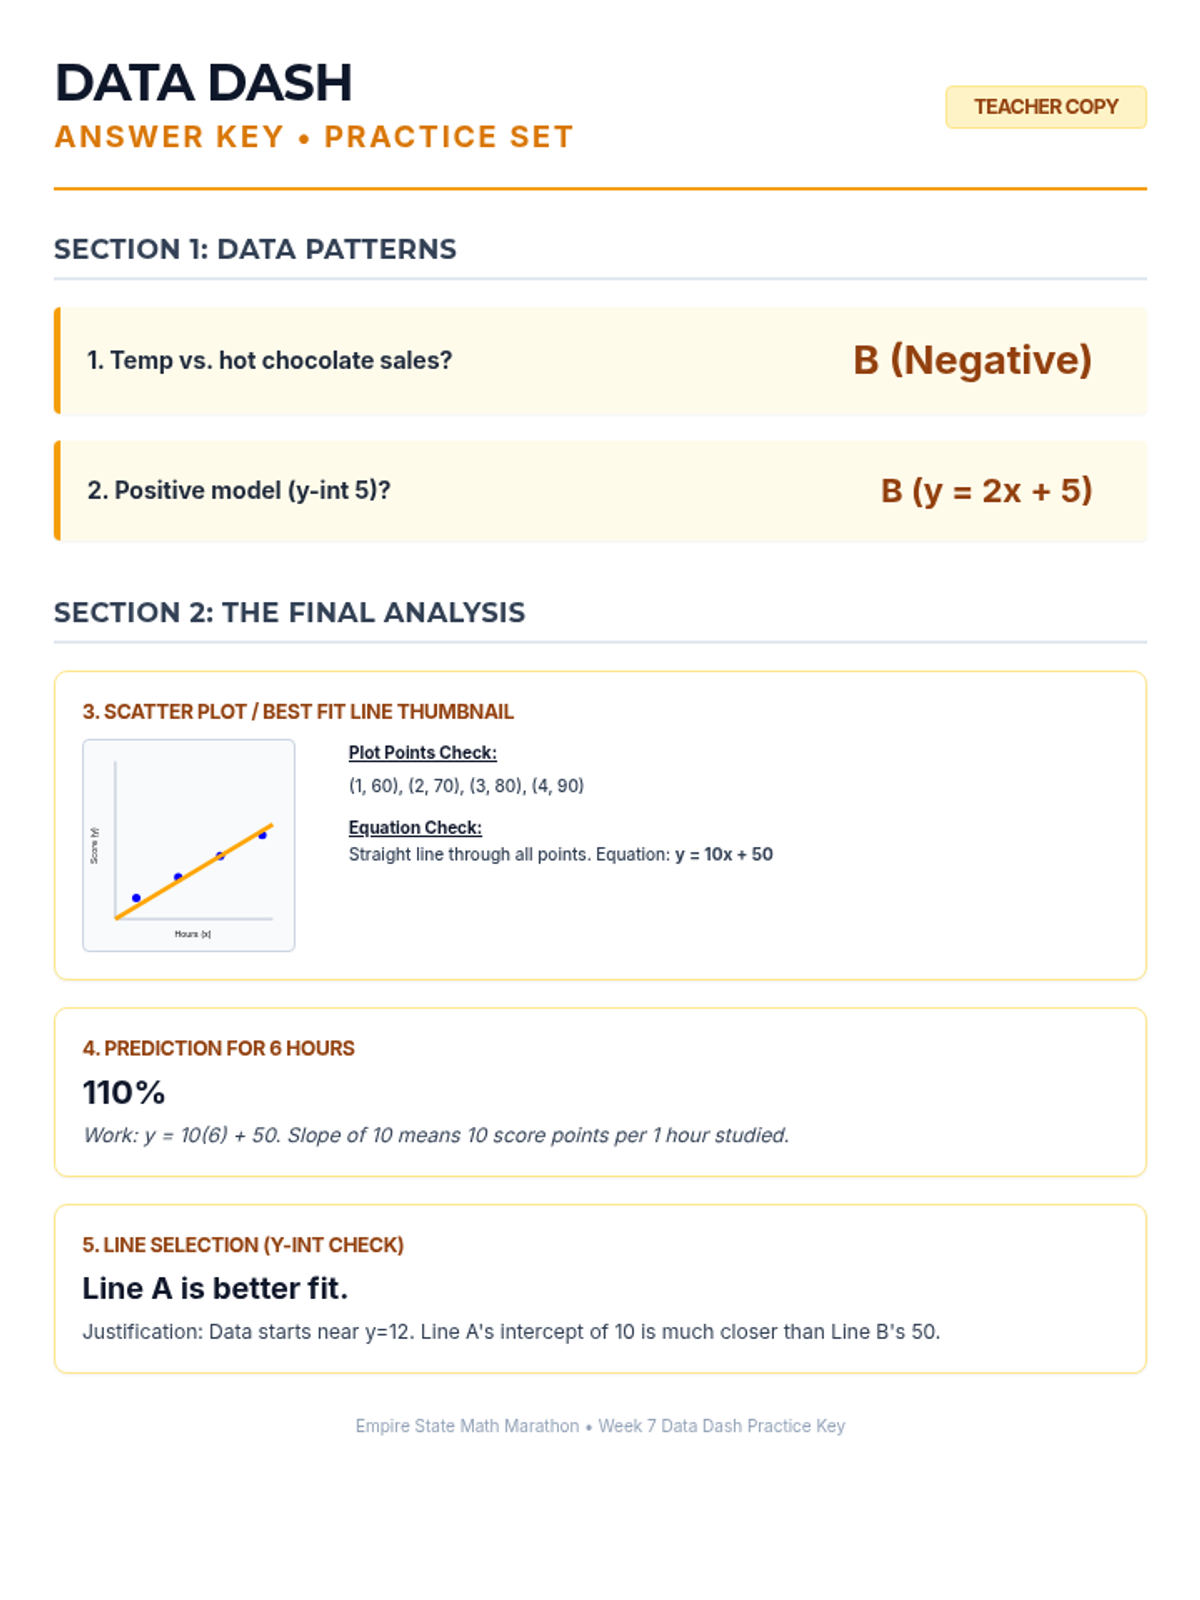
Week 7 analyzes bivariate data through scatter plots, interpreting lines of best fit, and using linear models to make predictions.
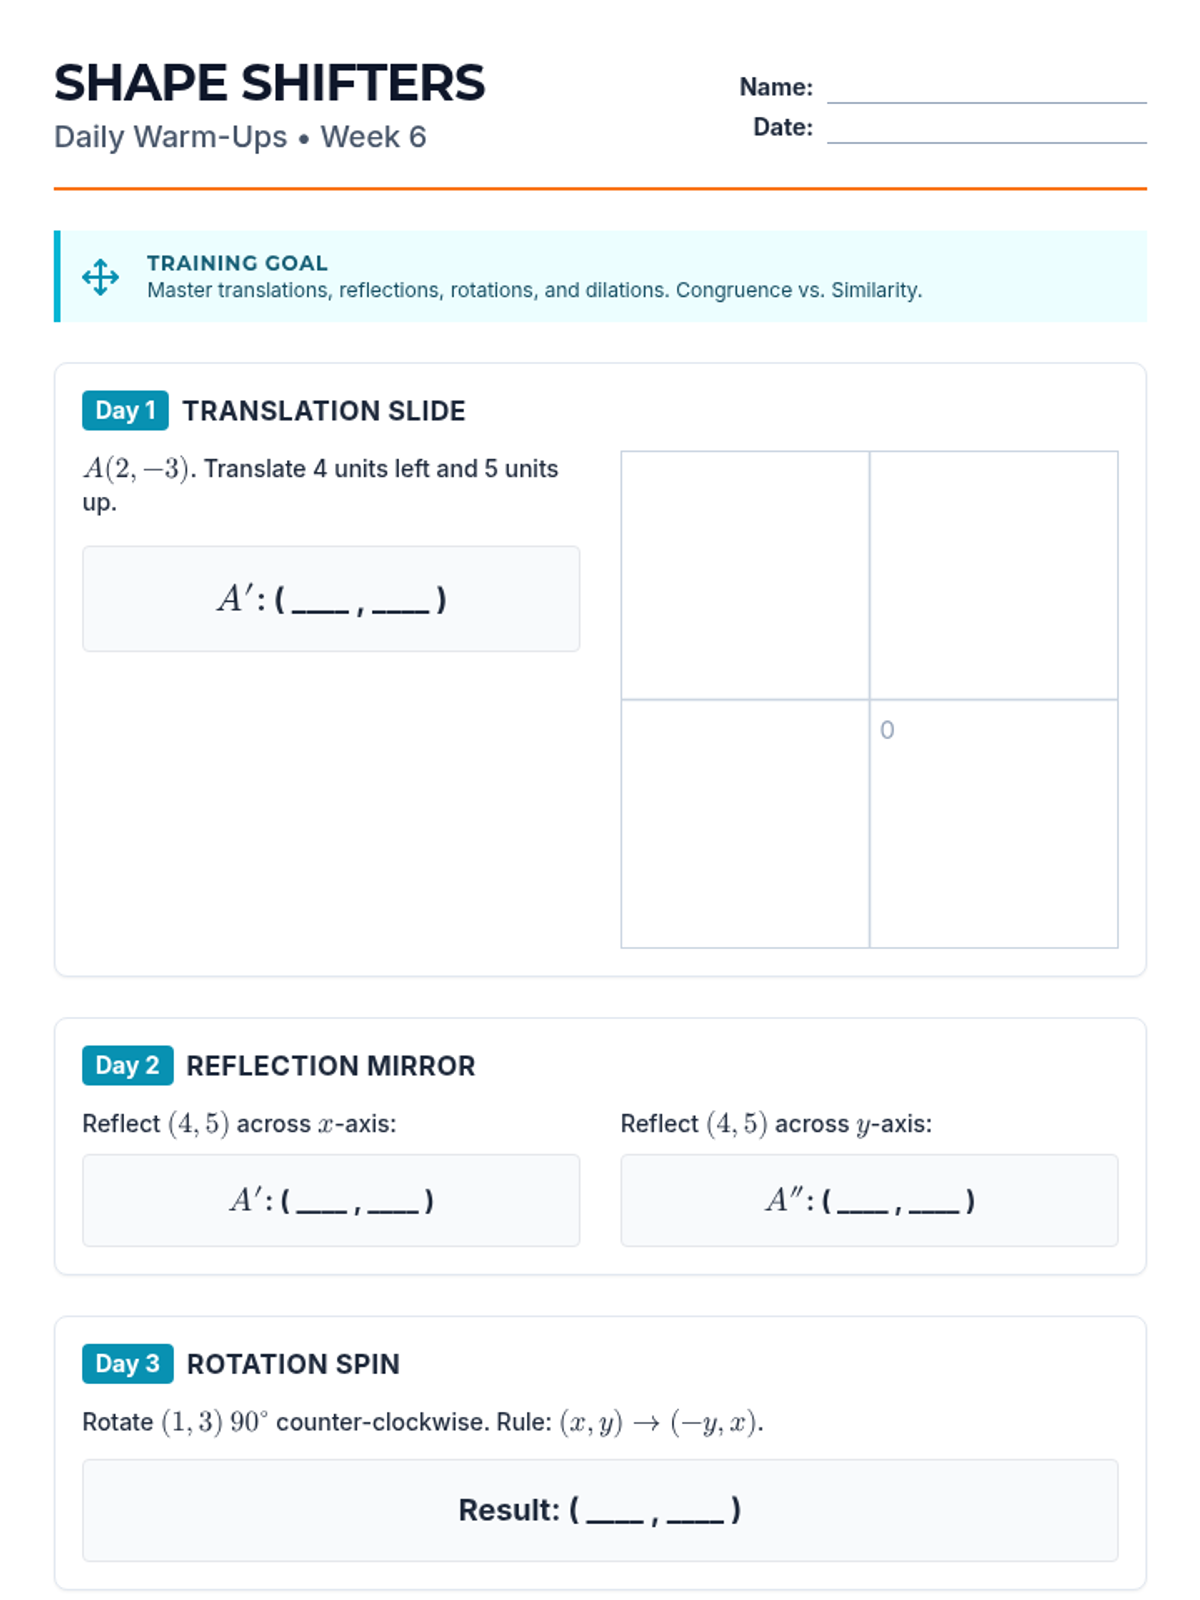
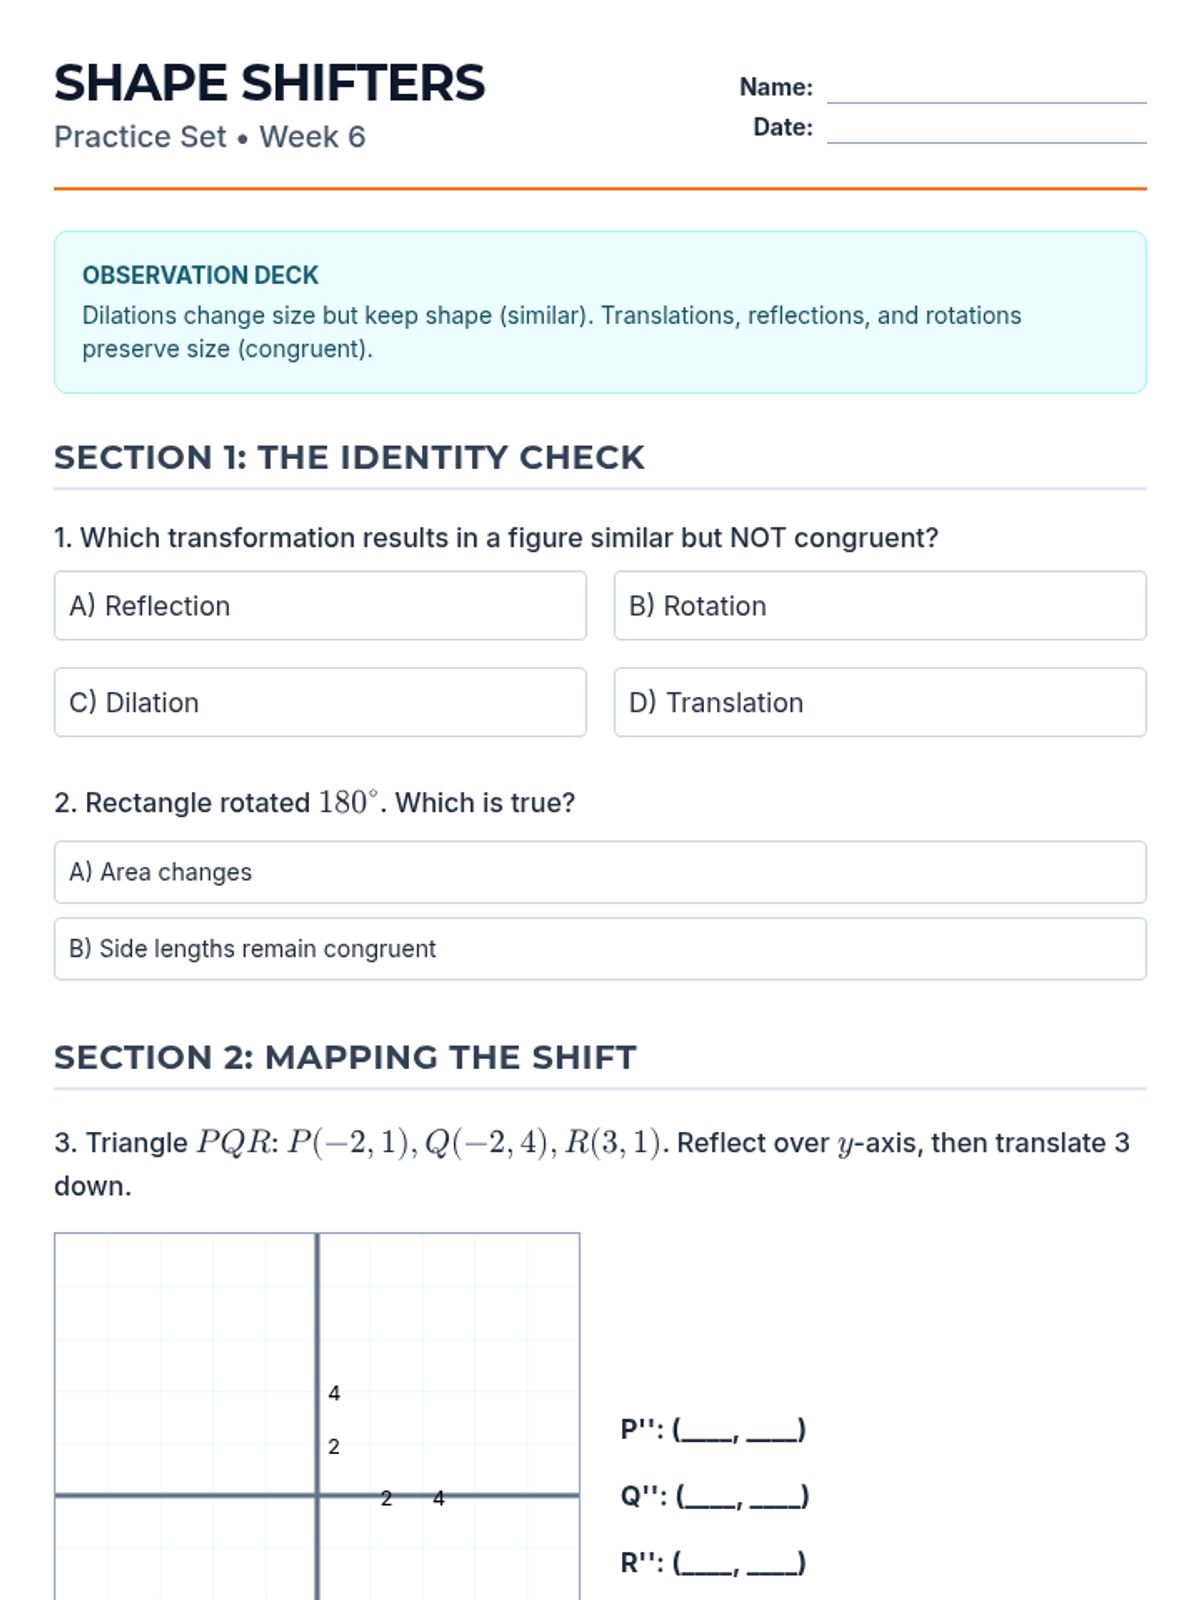
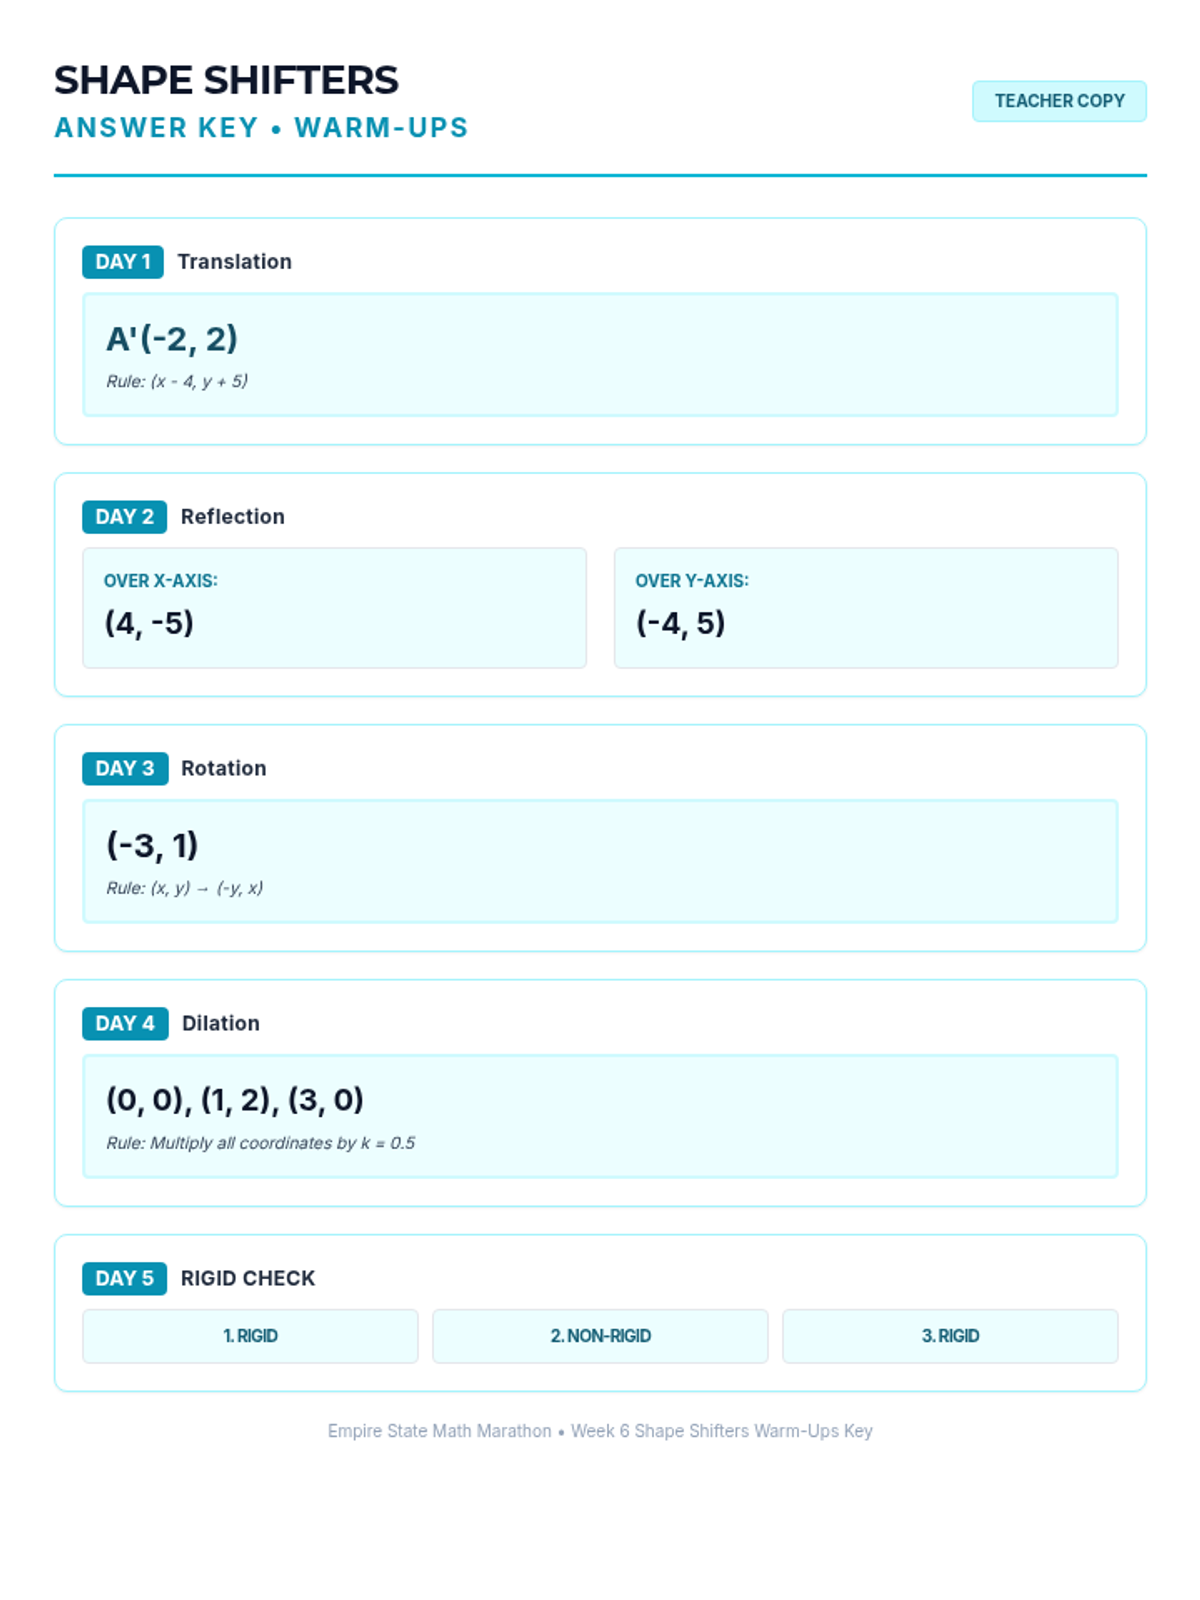
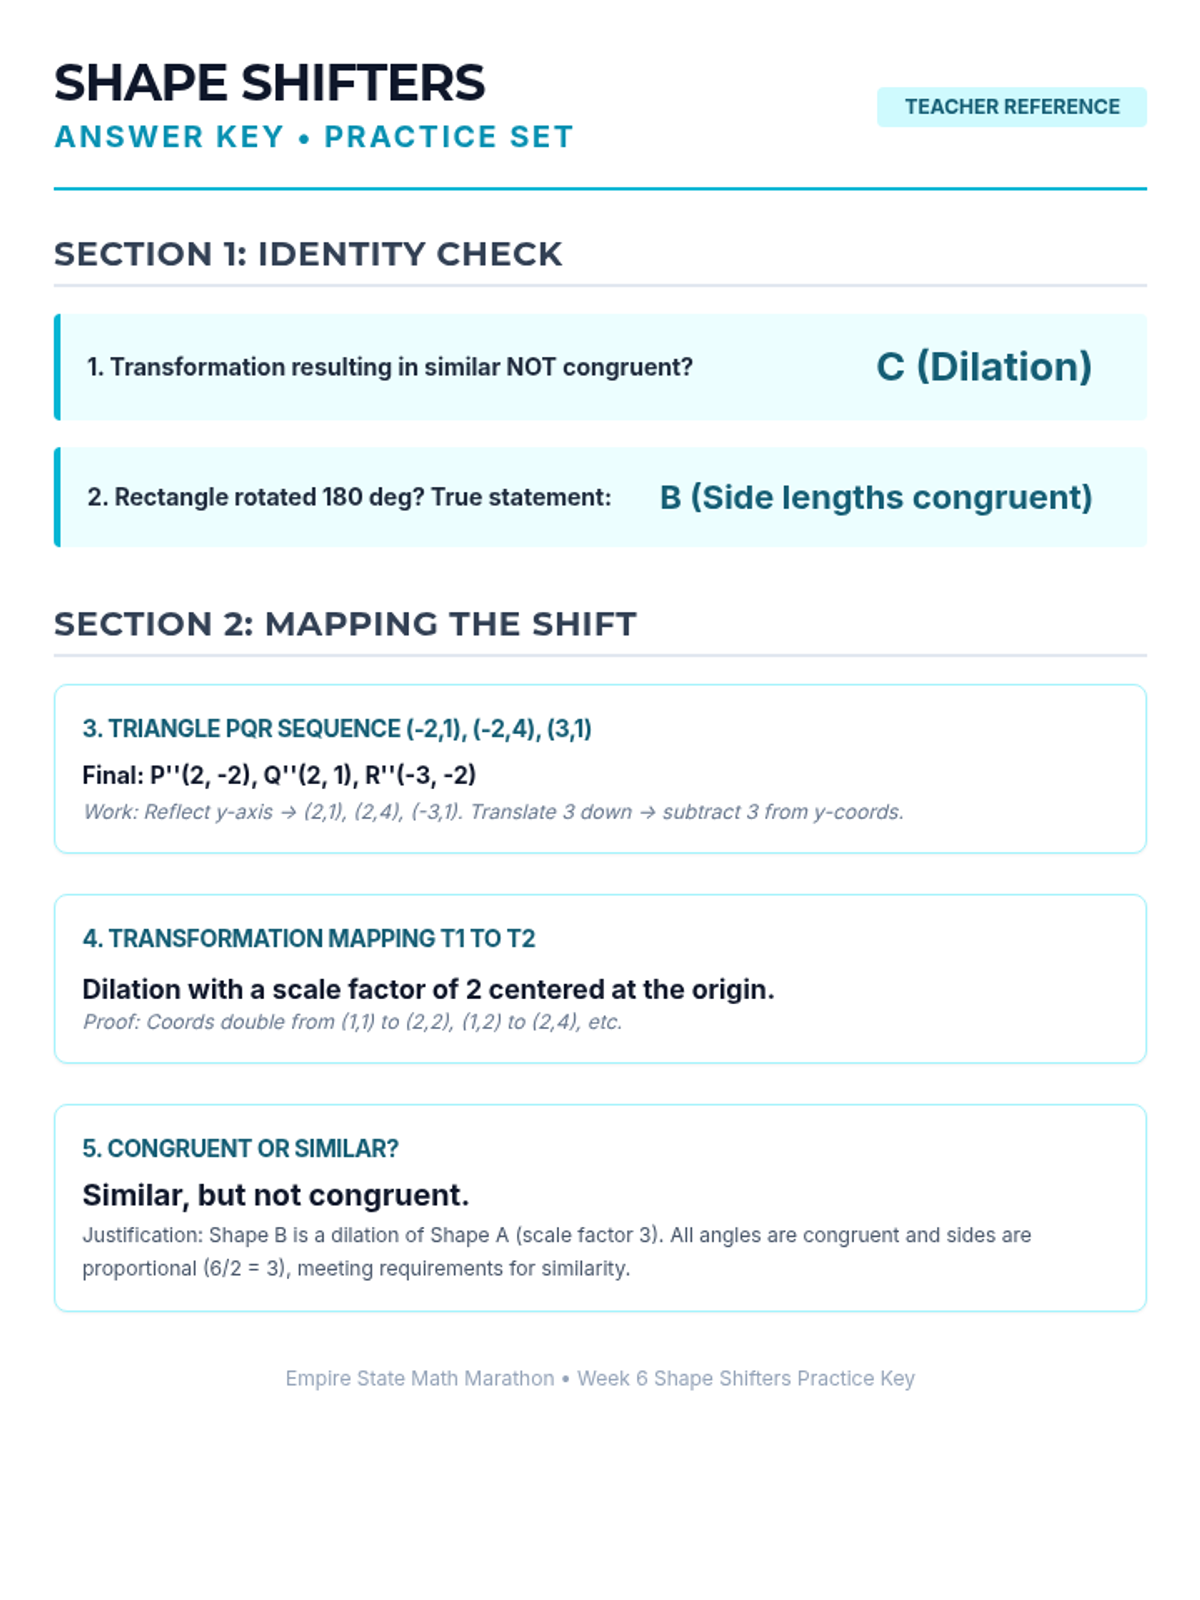
Week 6 focuses on rigid transformations (translations, reflections, rotations) and similarity transformations (dilations).
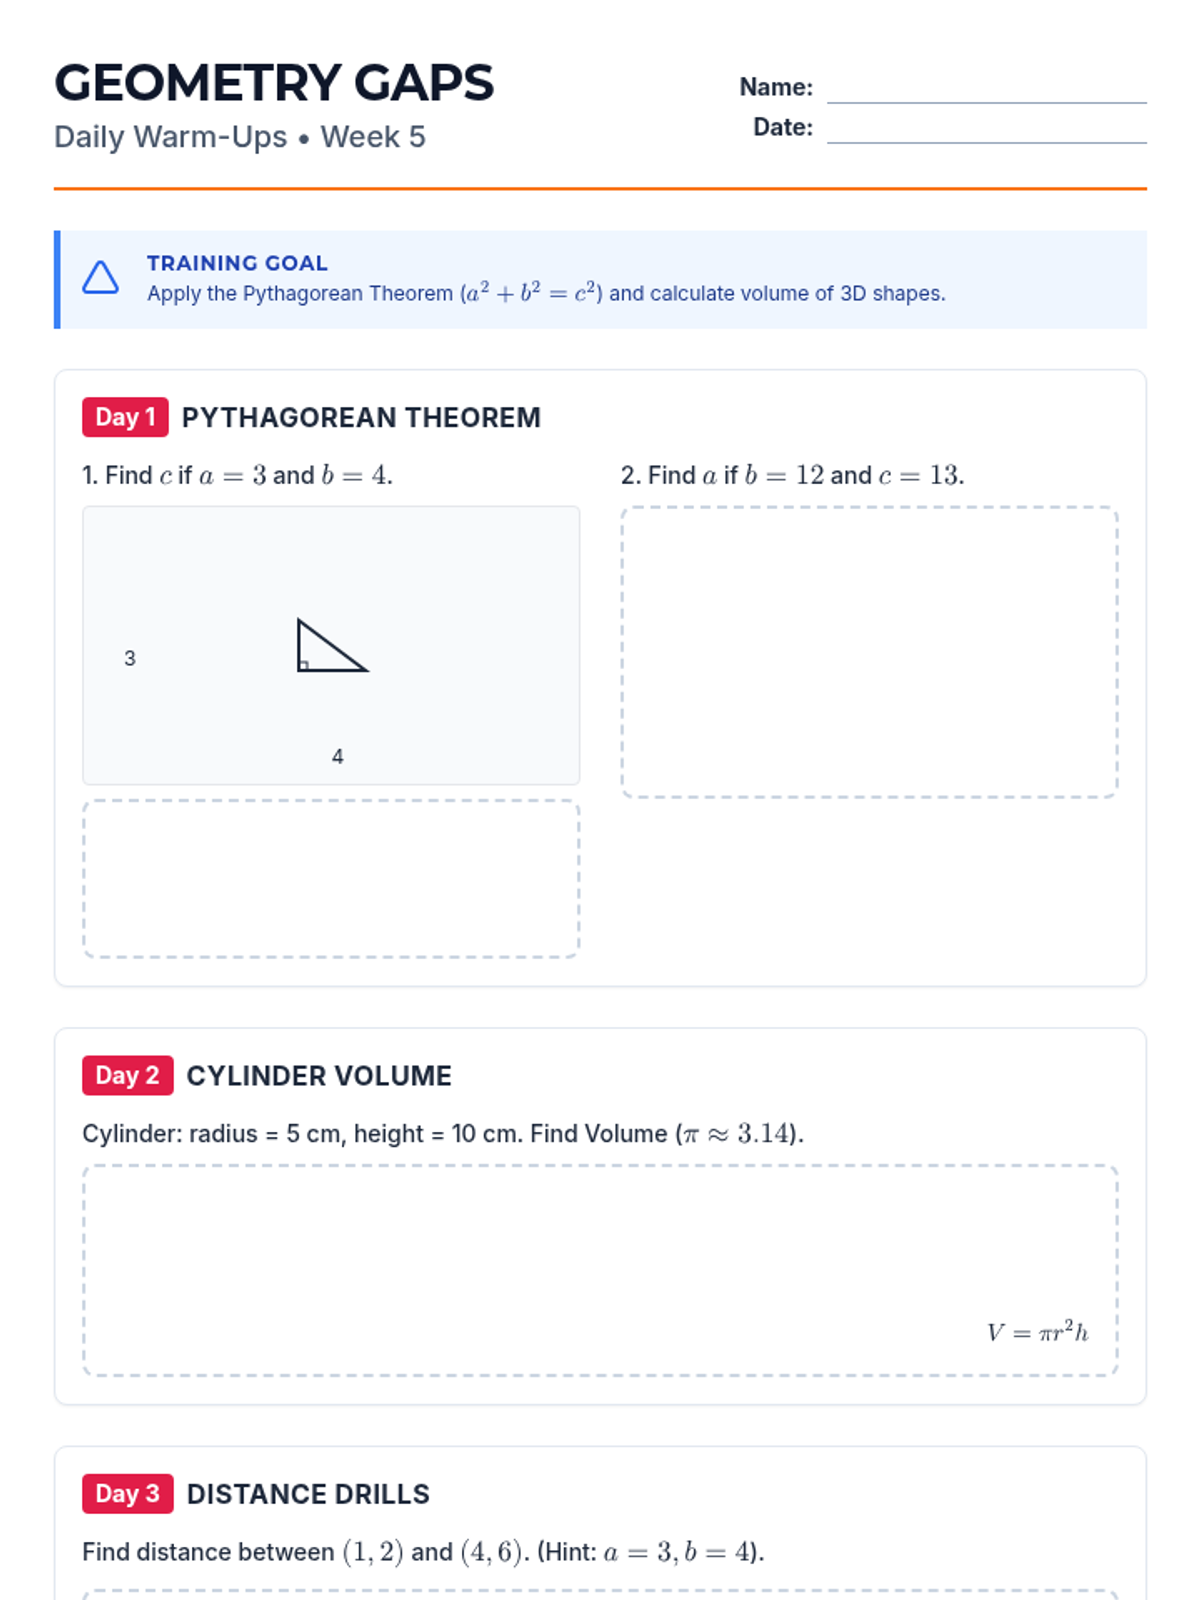
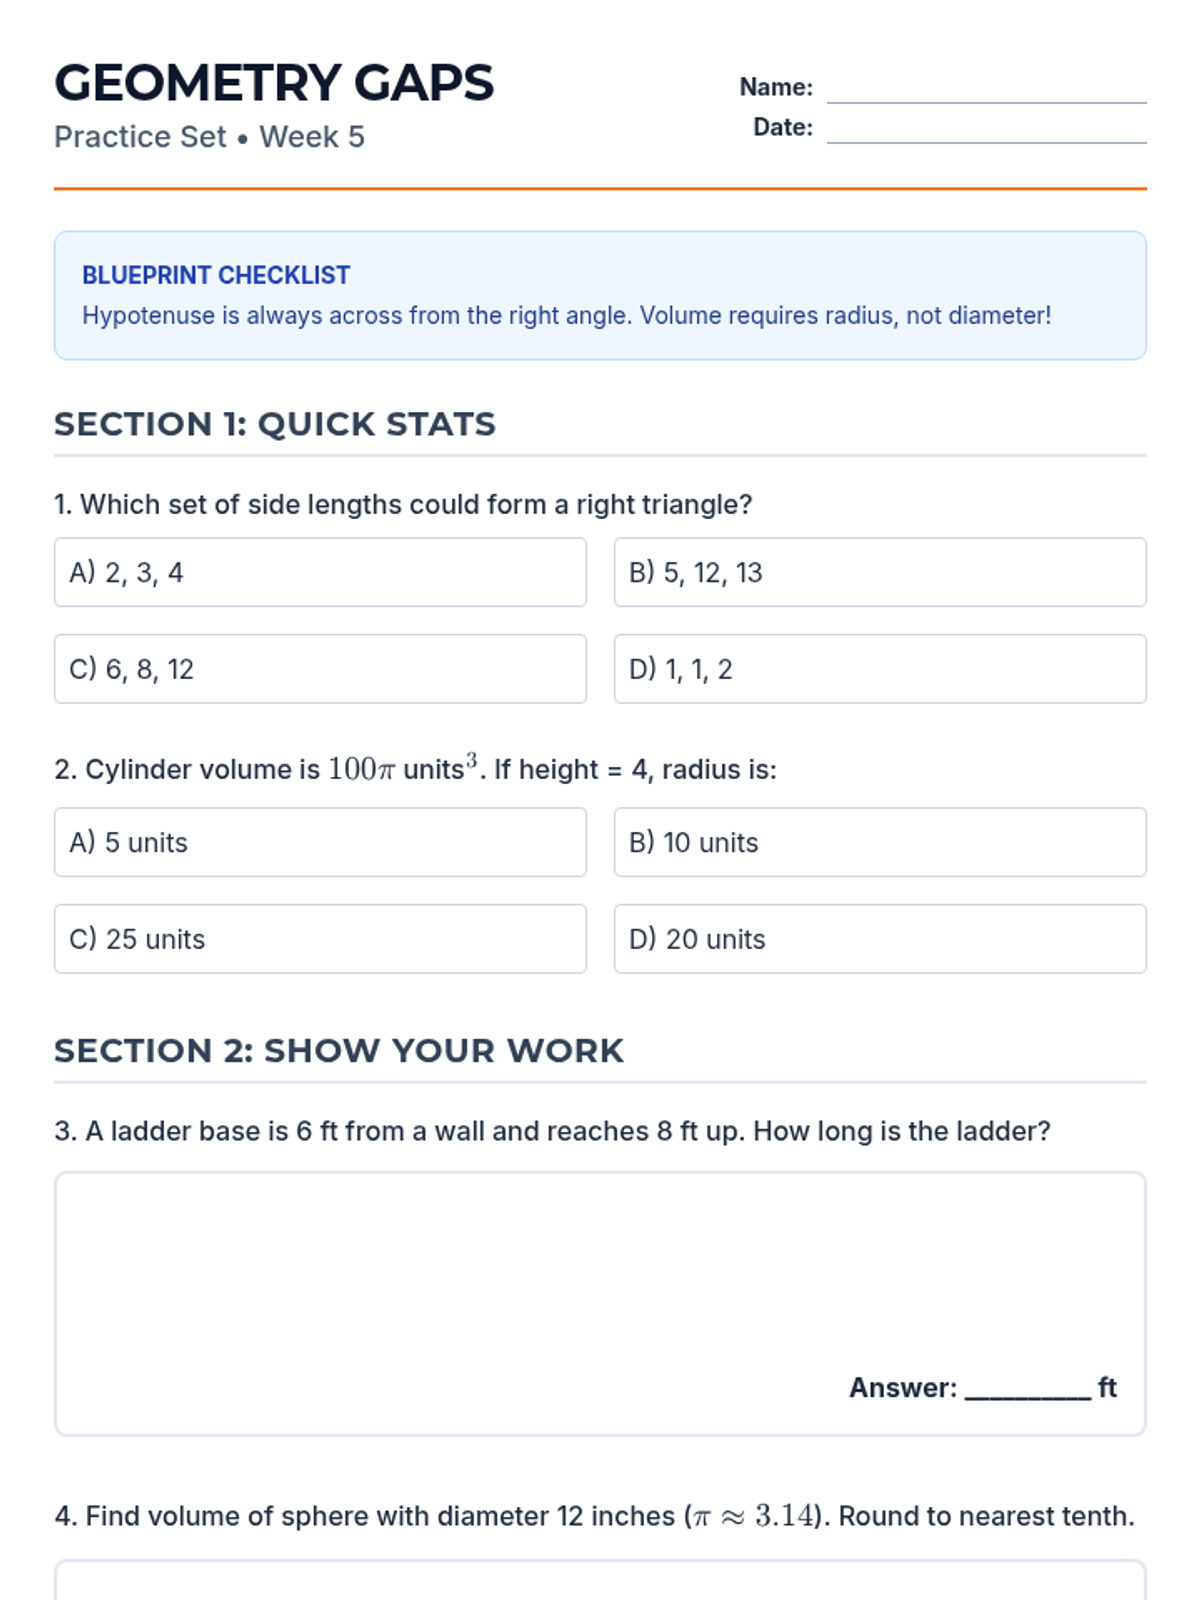
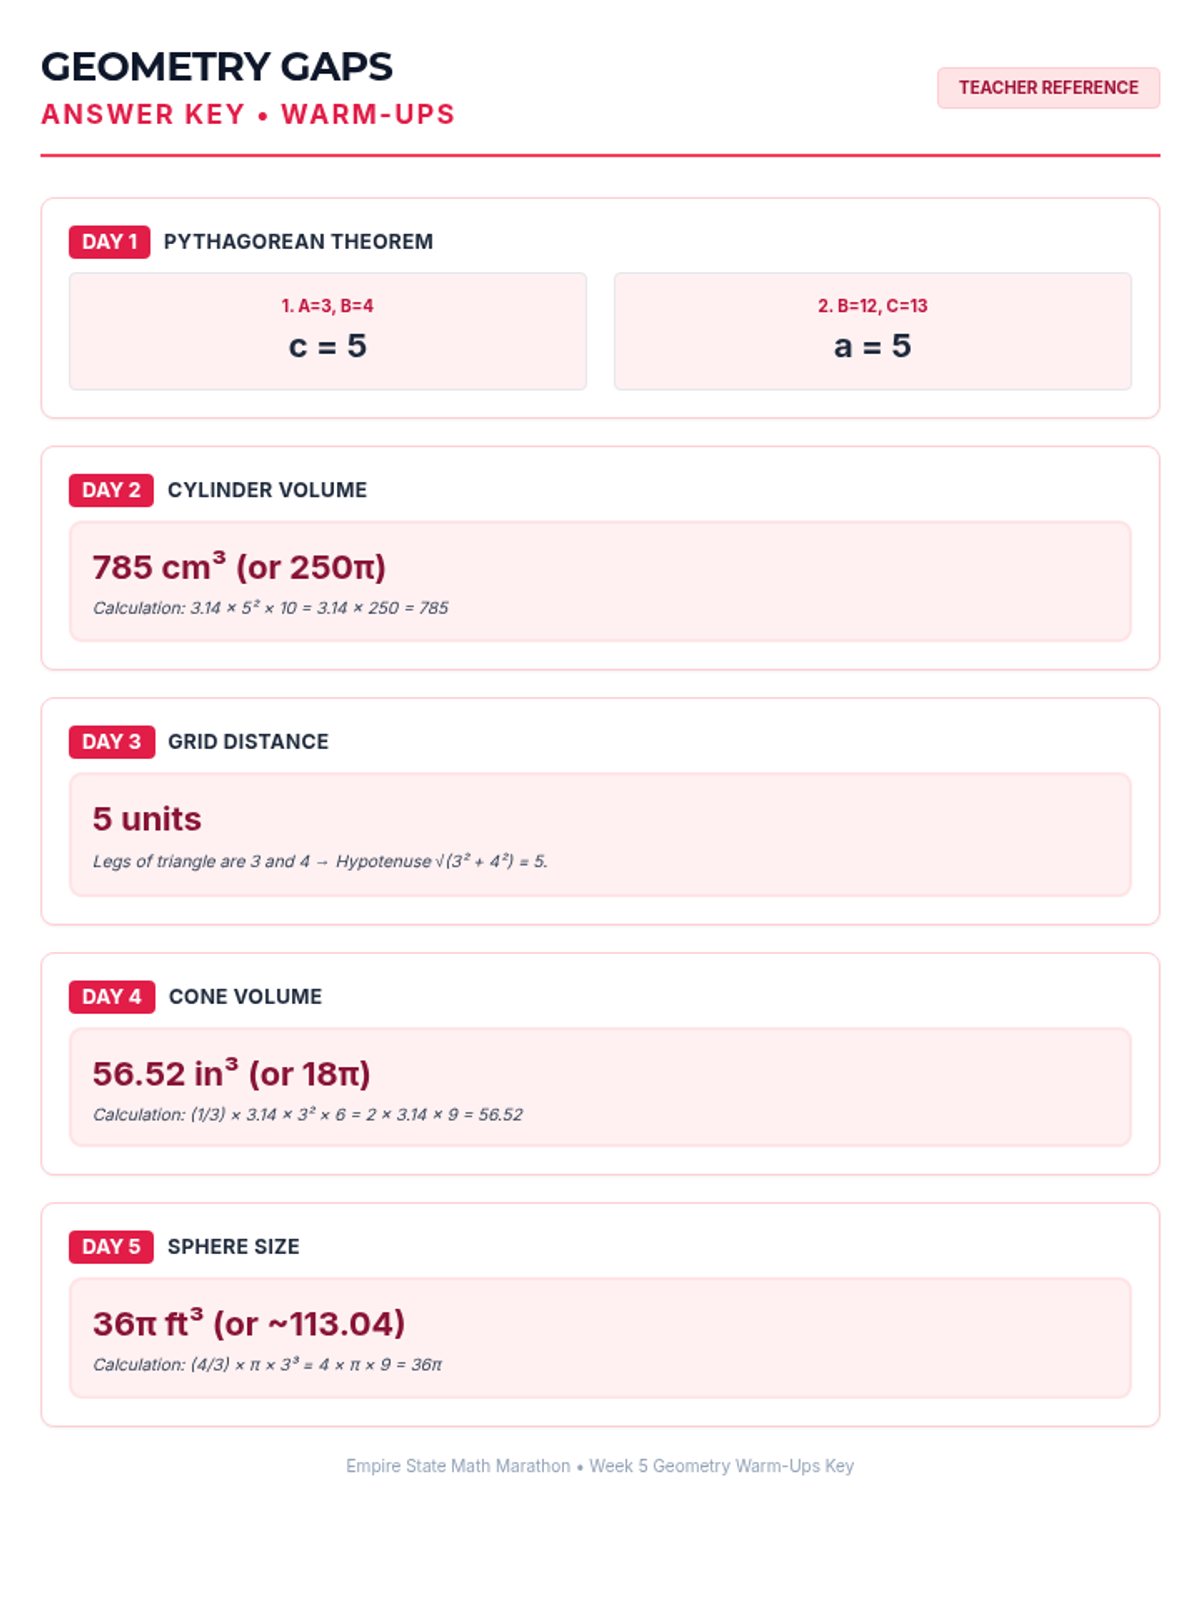
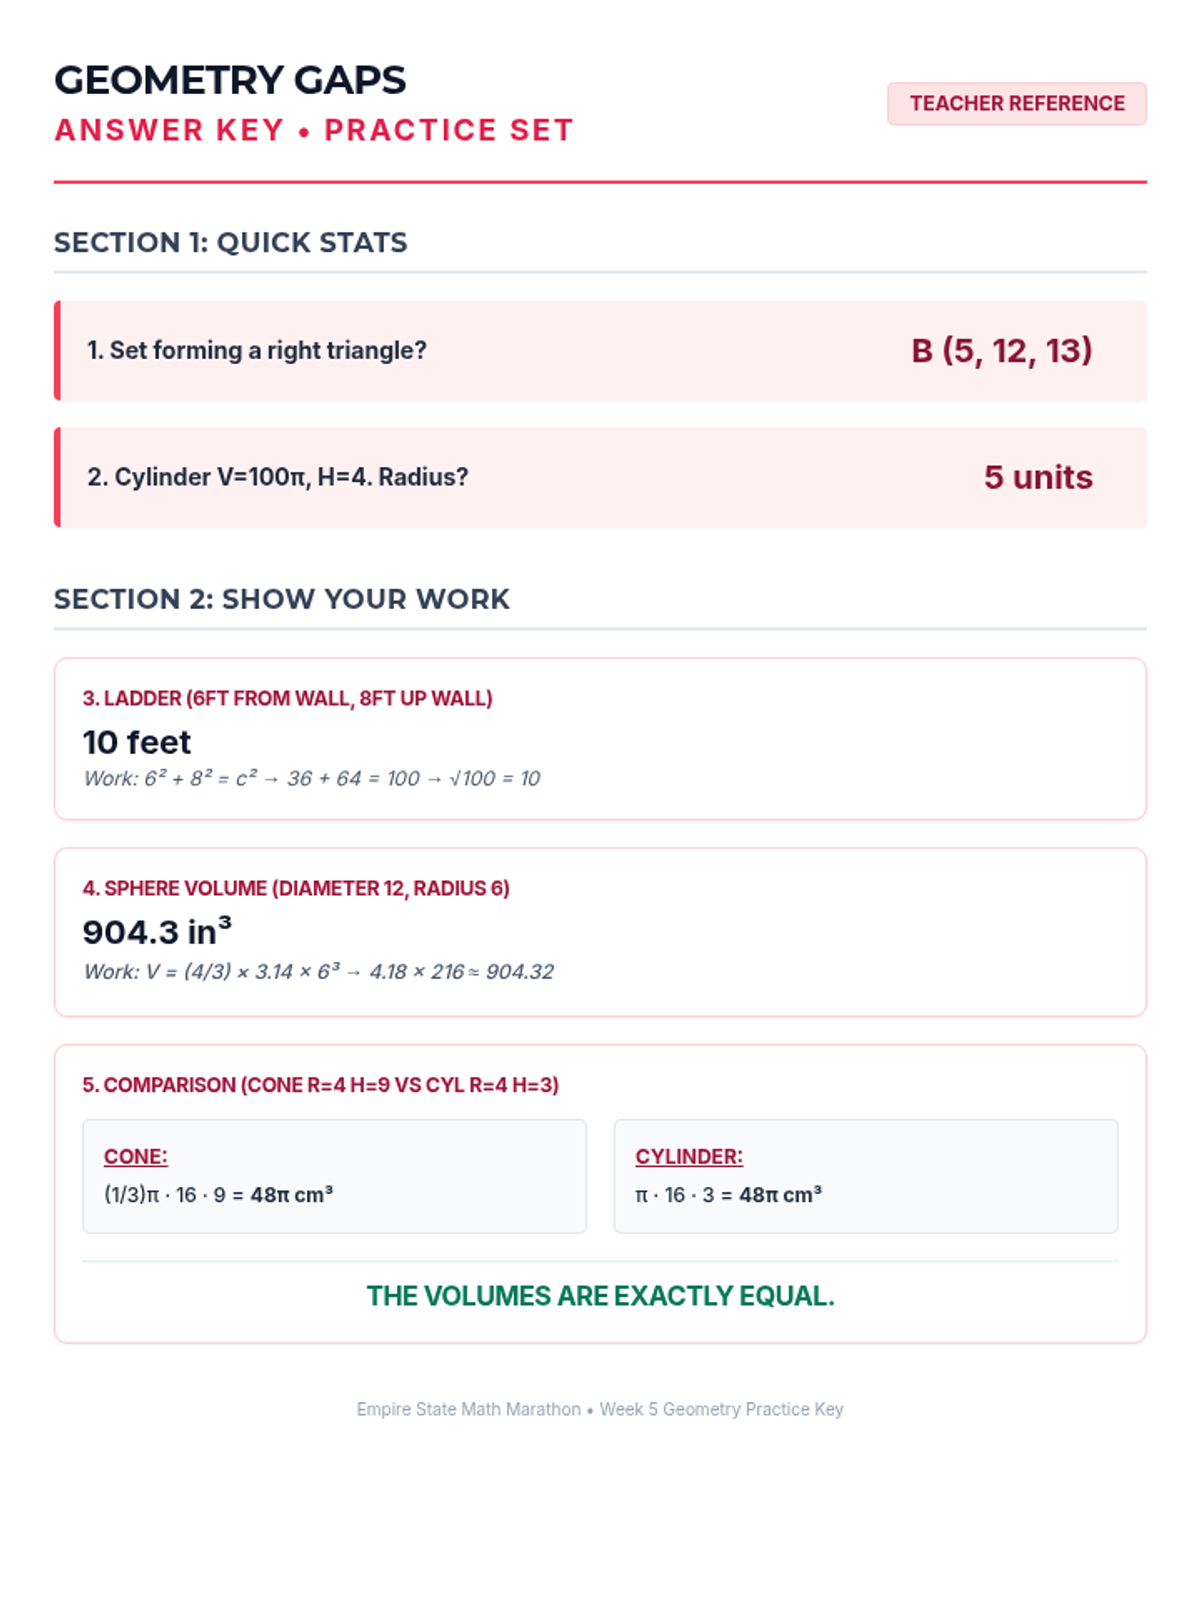
Week 5 reviews the Pythagorean Theorem and volume formulas for cylinders, cones, and spheres.
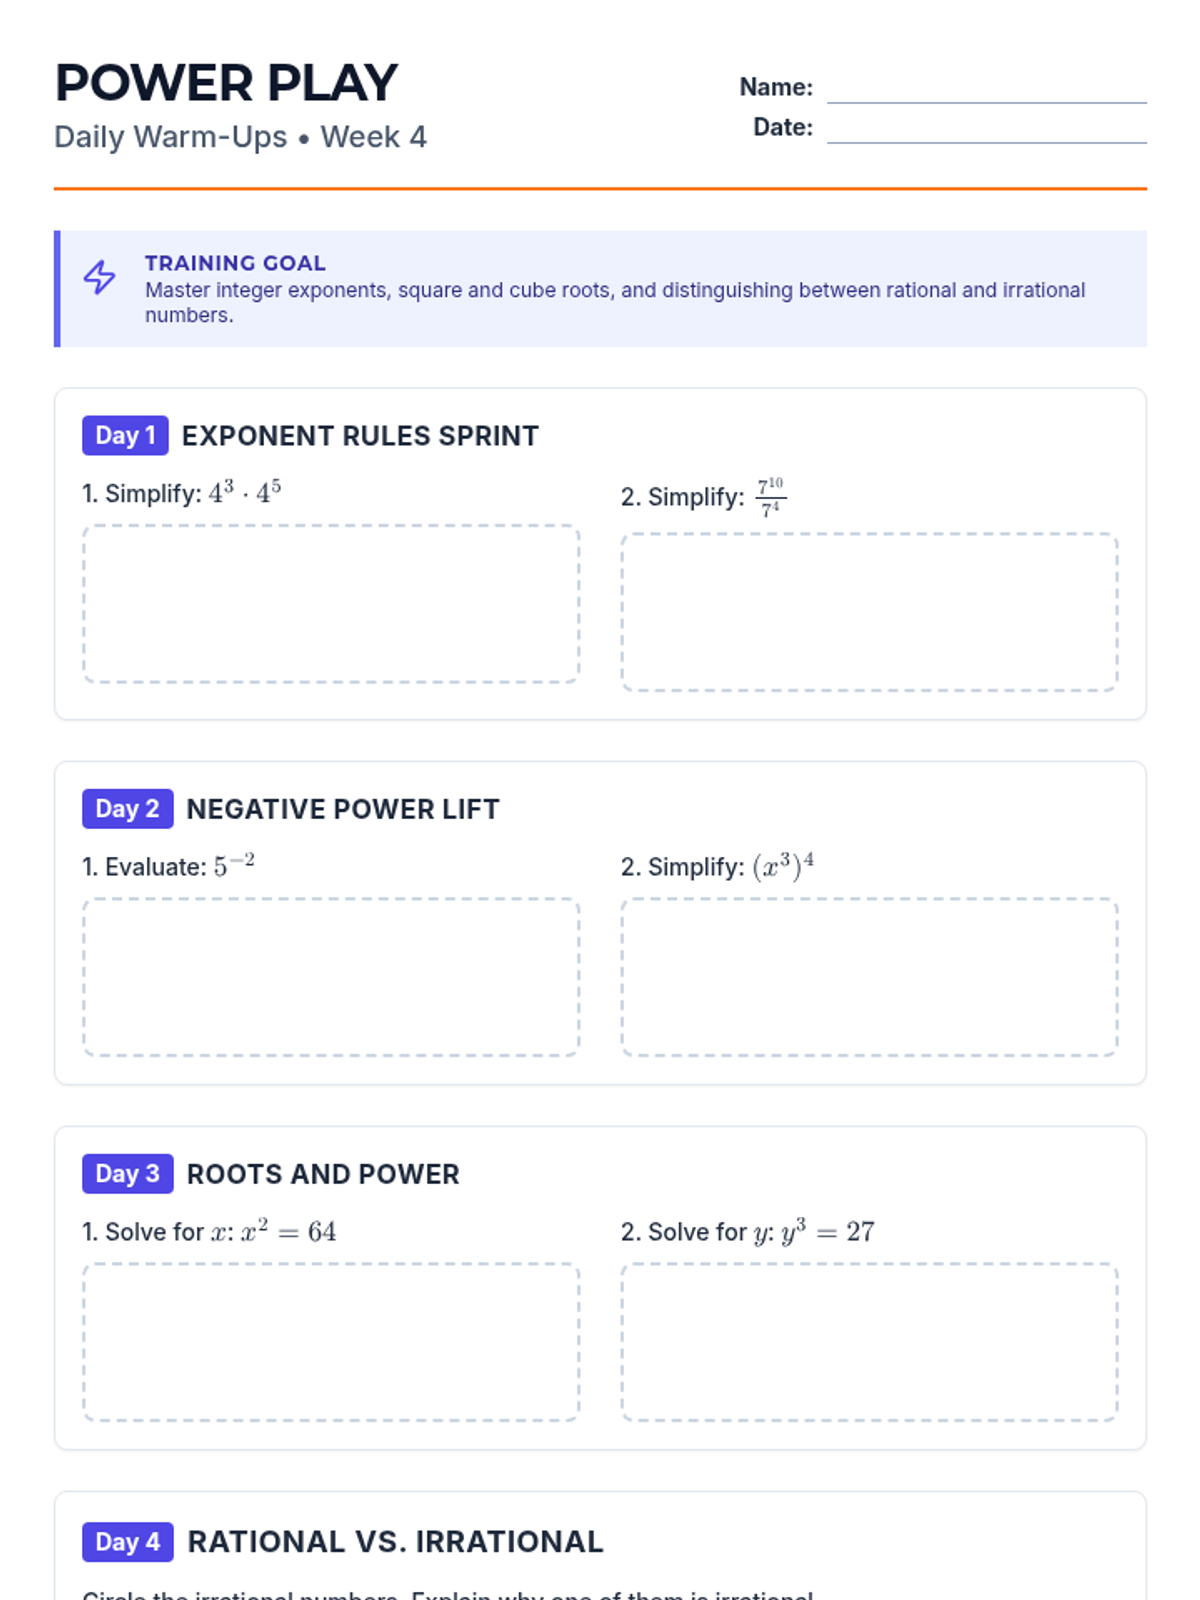
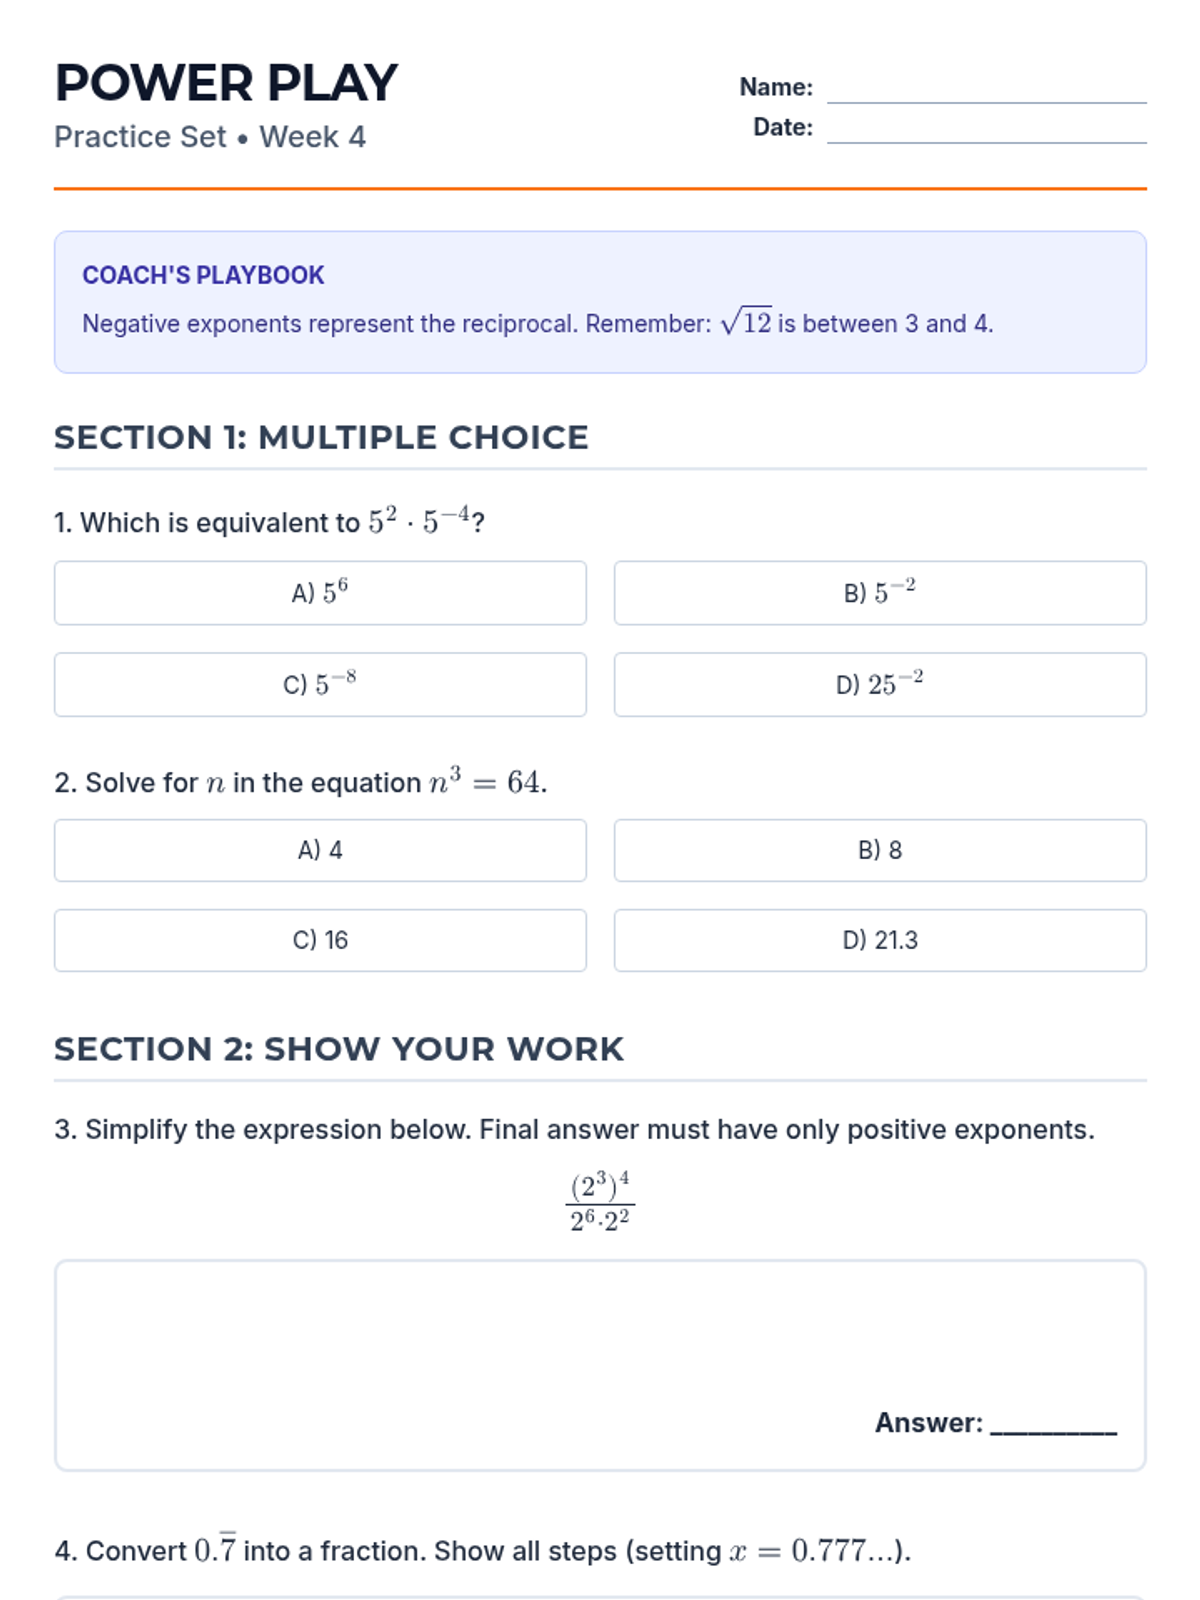
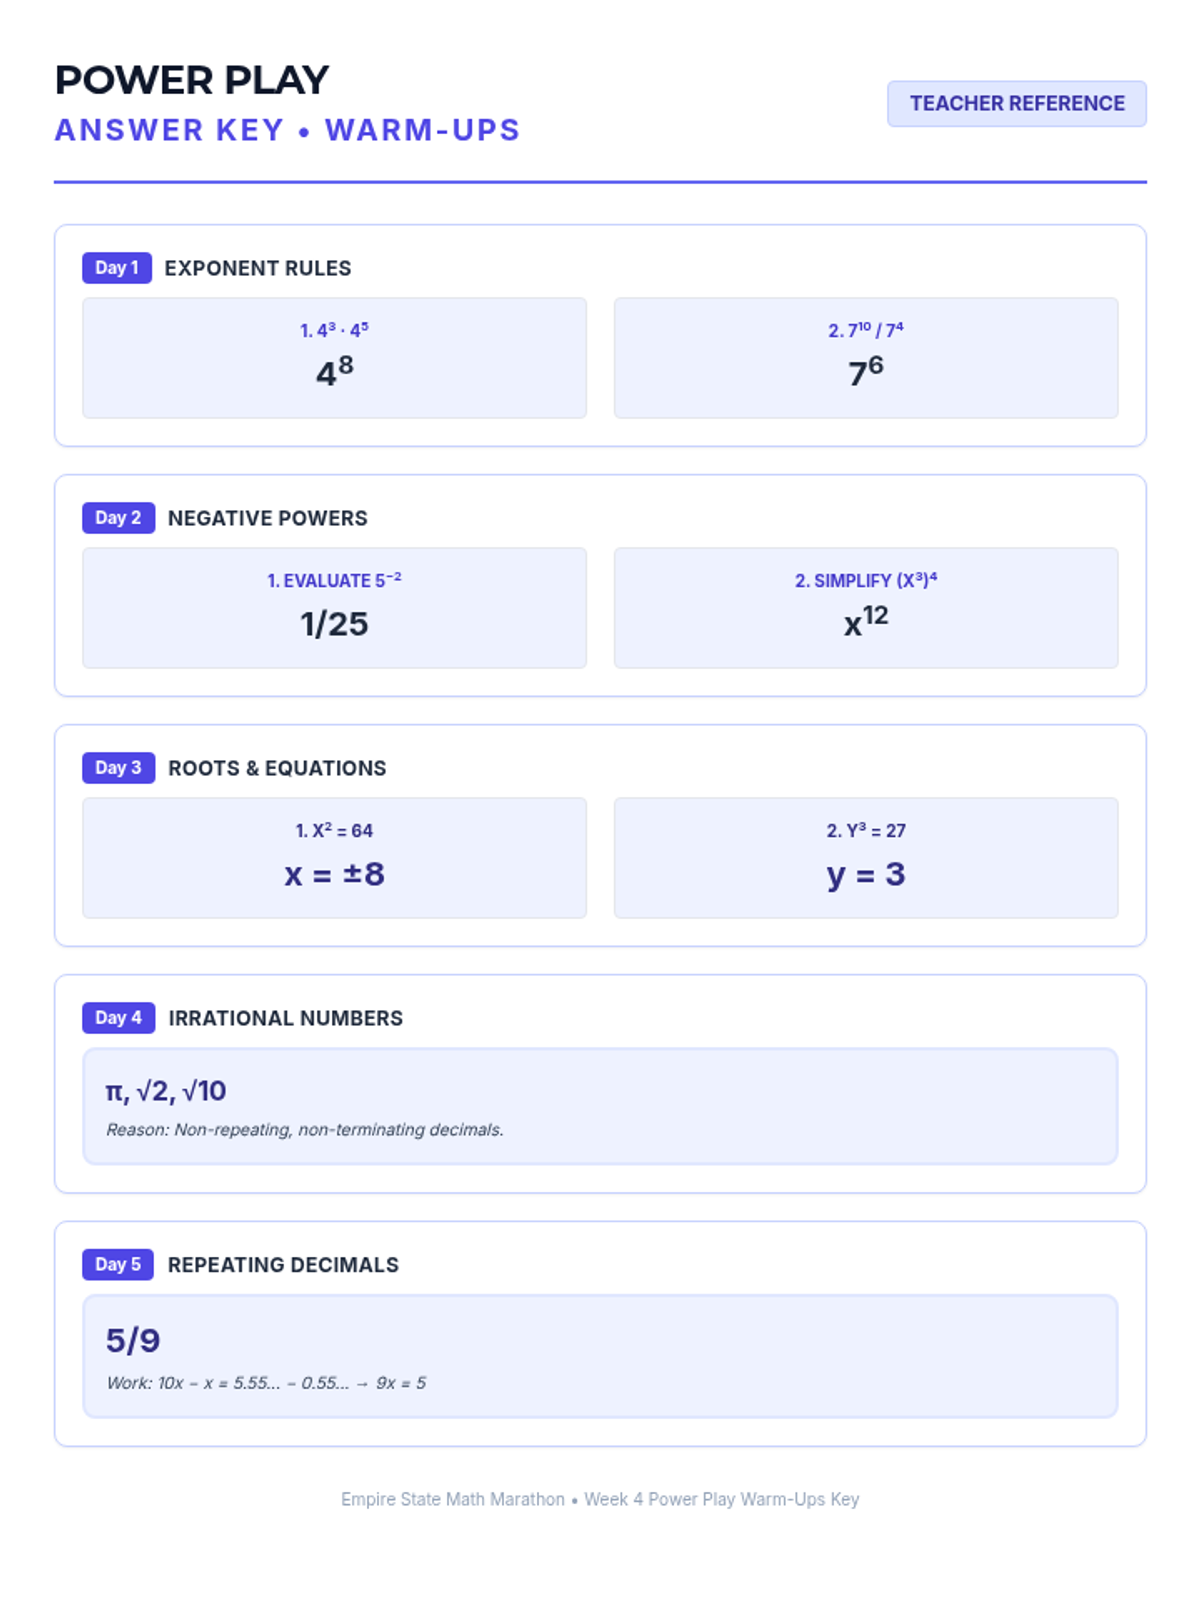
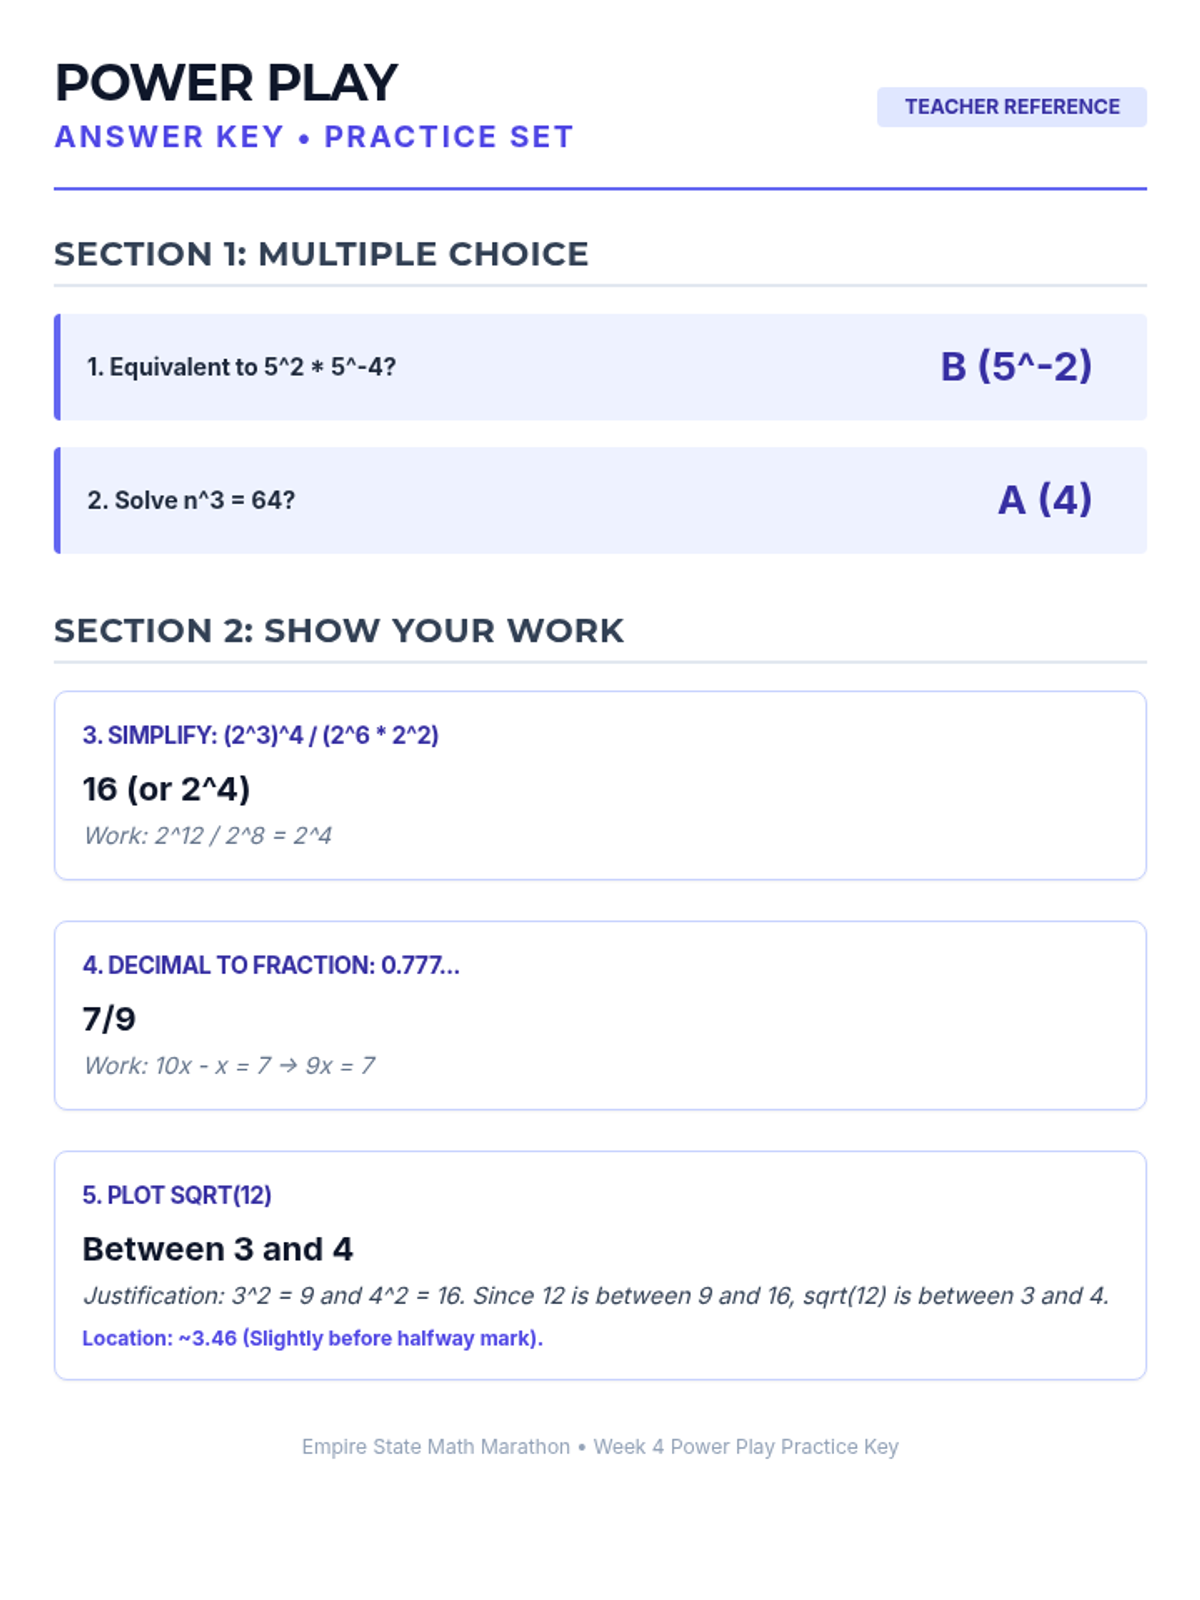
Week 4 explores integer exponent rules, perfect squares and cubes, and distinguishing between rational and irrational numbers.
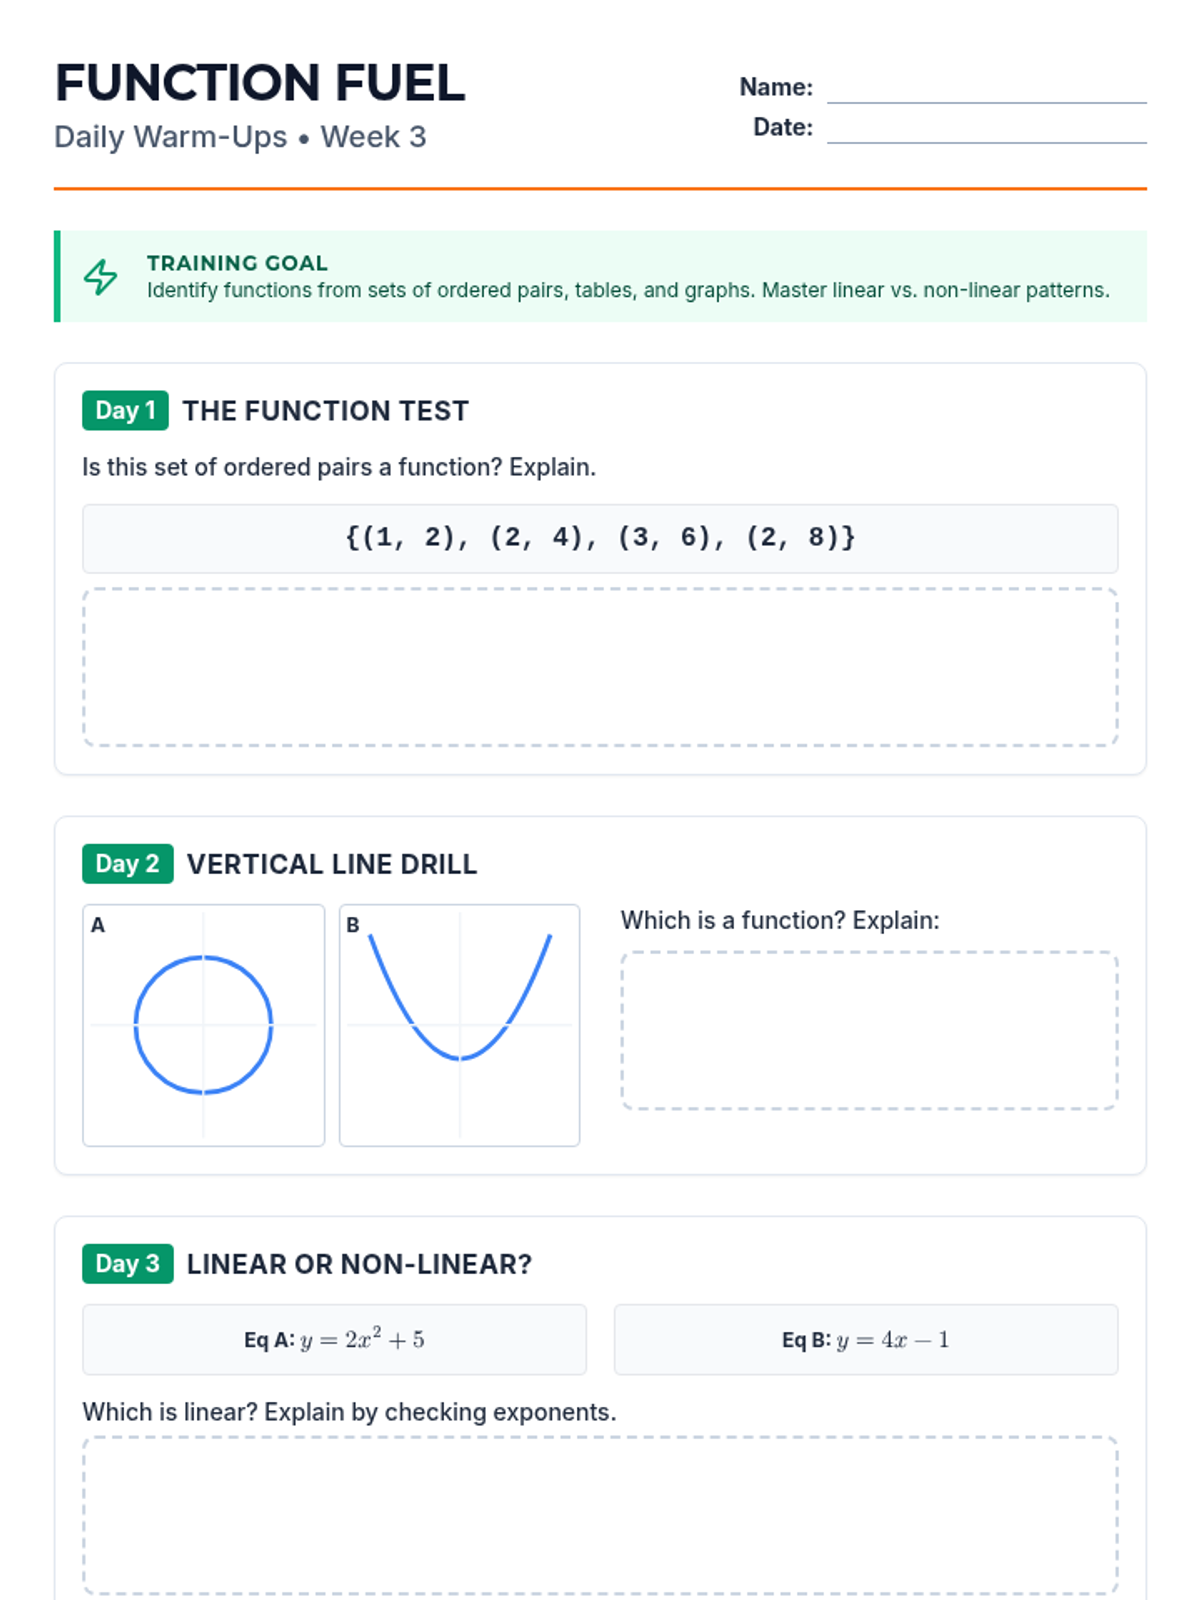
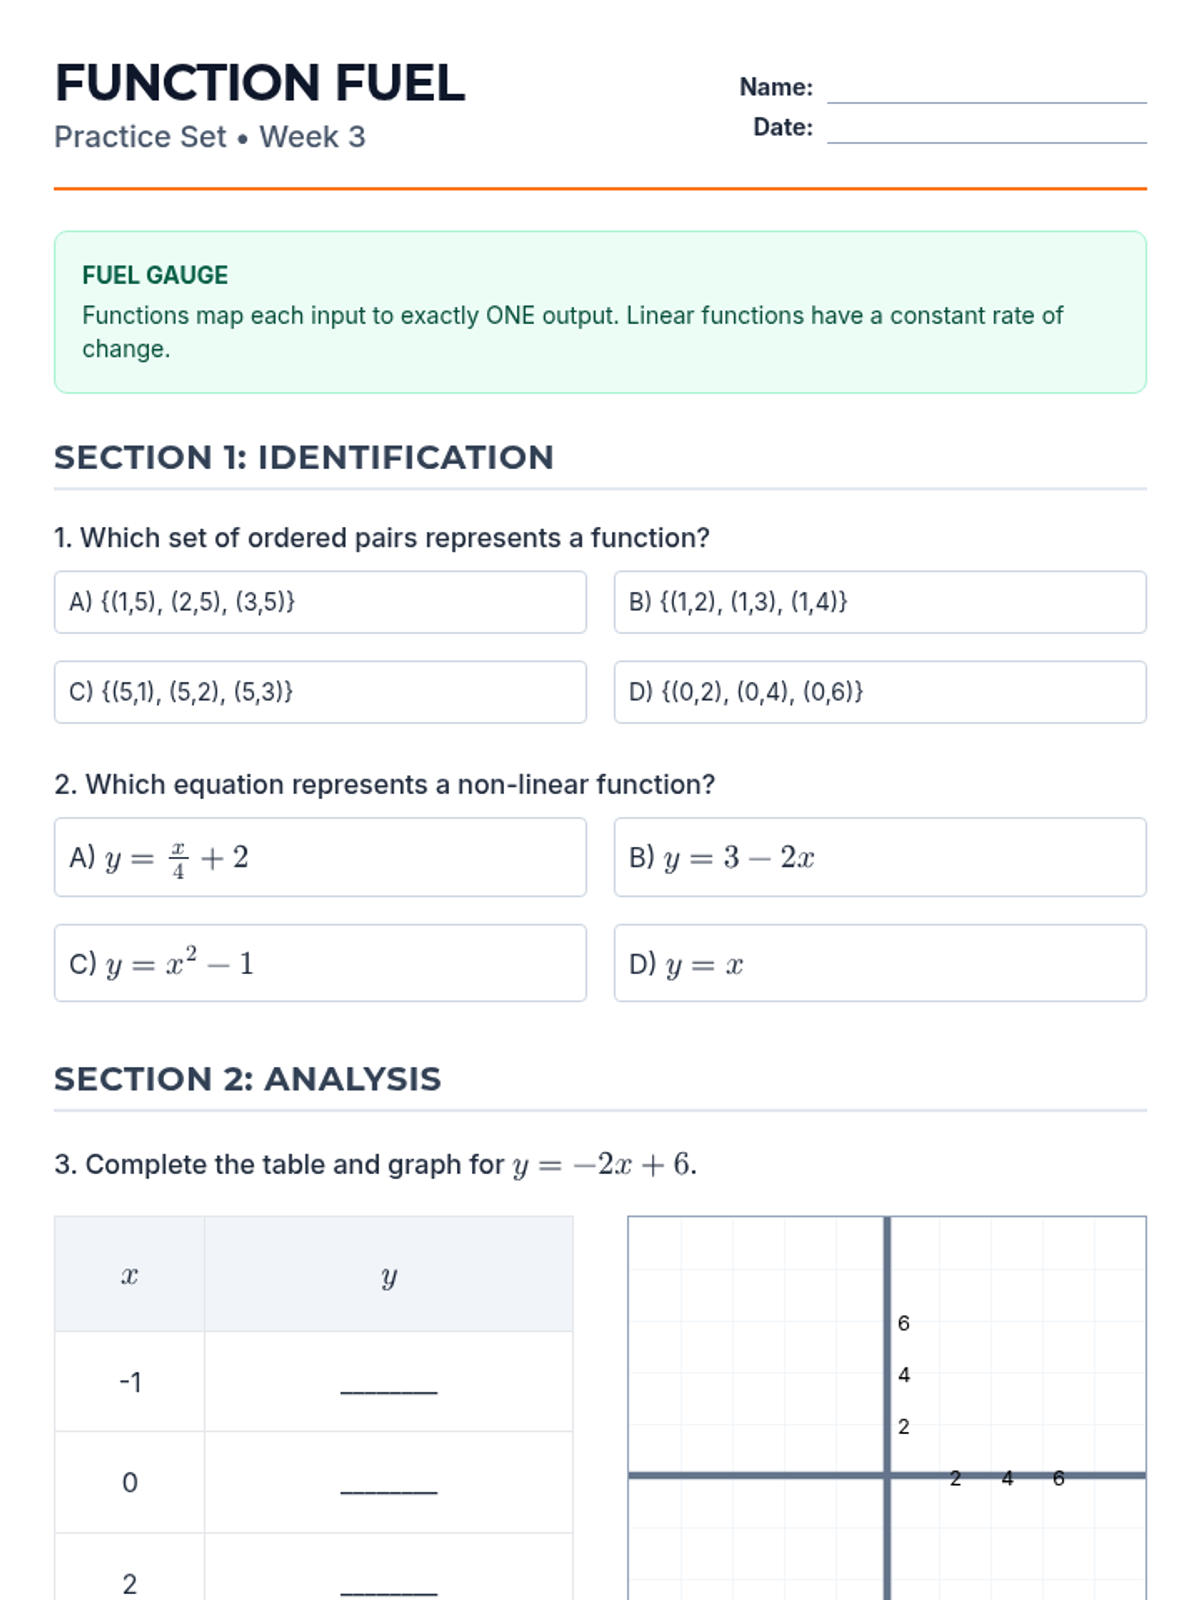
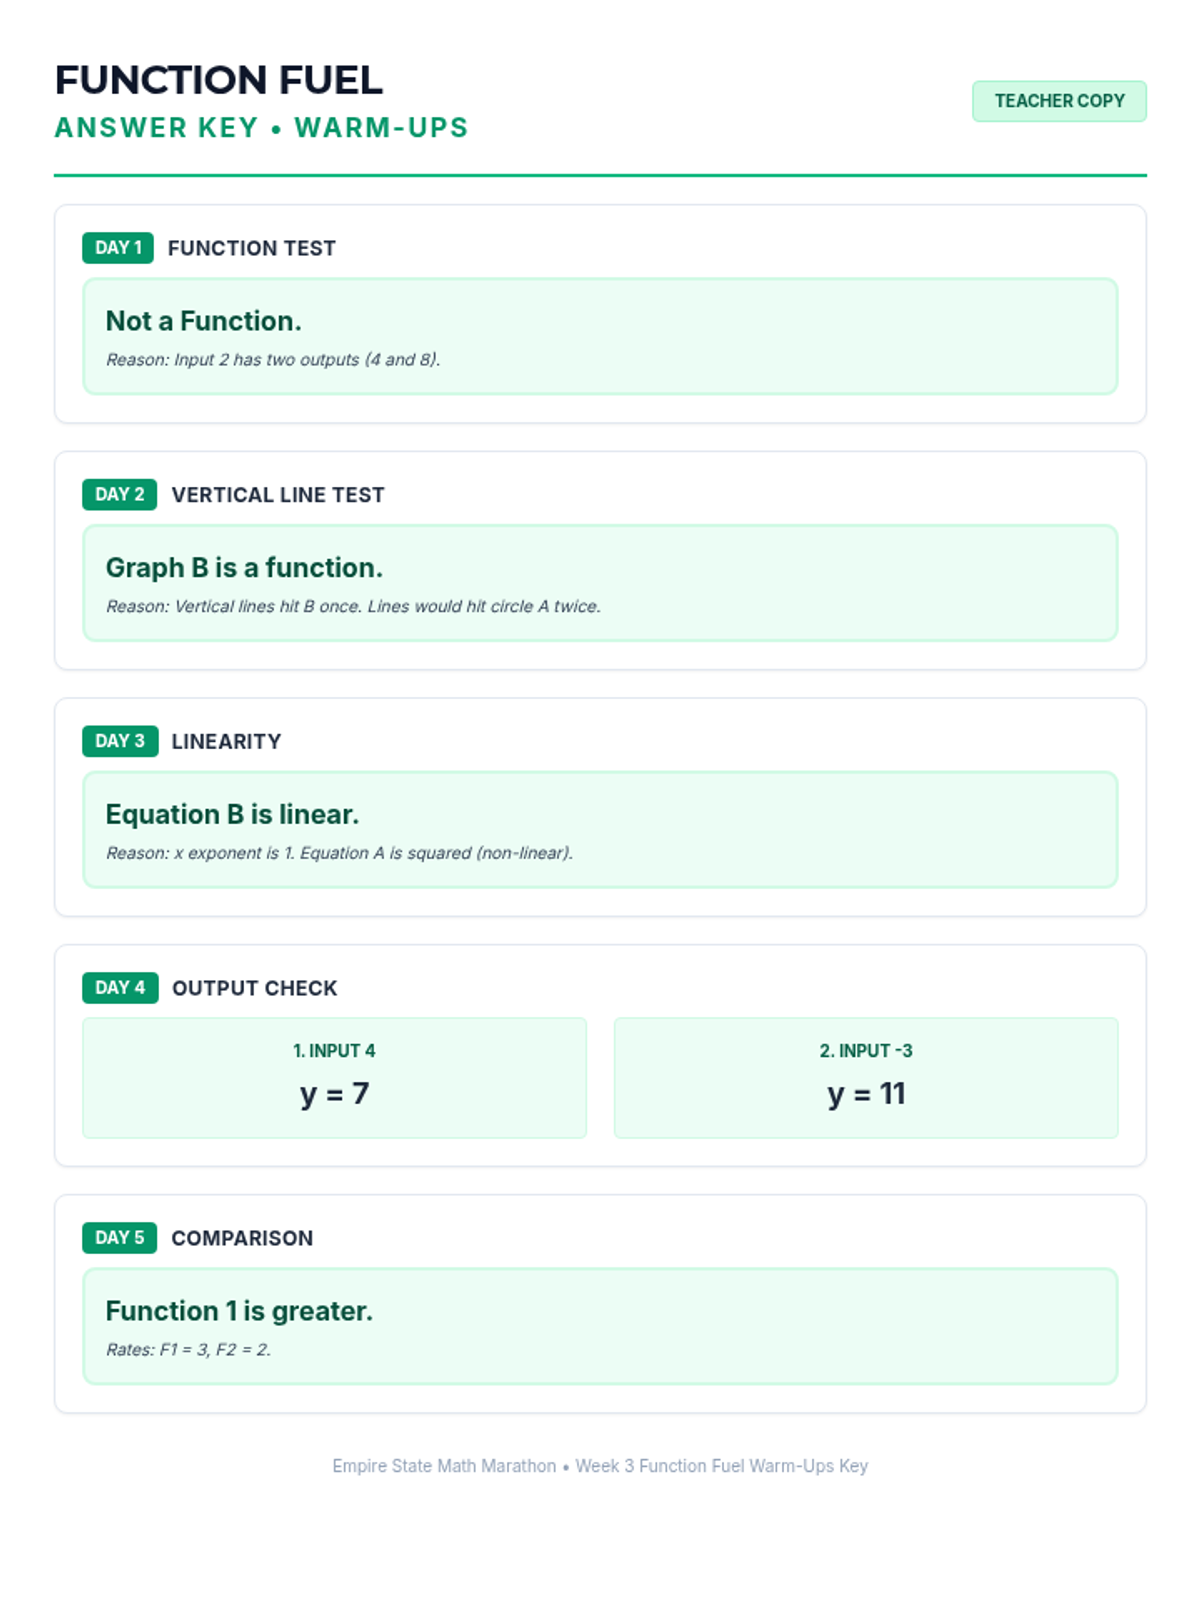
Week 3 defines, evaluates, and compares functions represented in different ways (tables, graphs, equations).
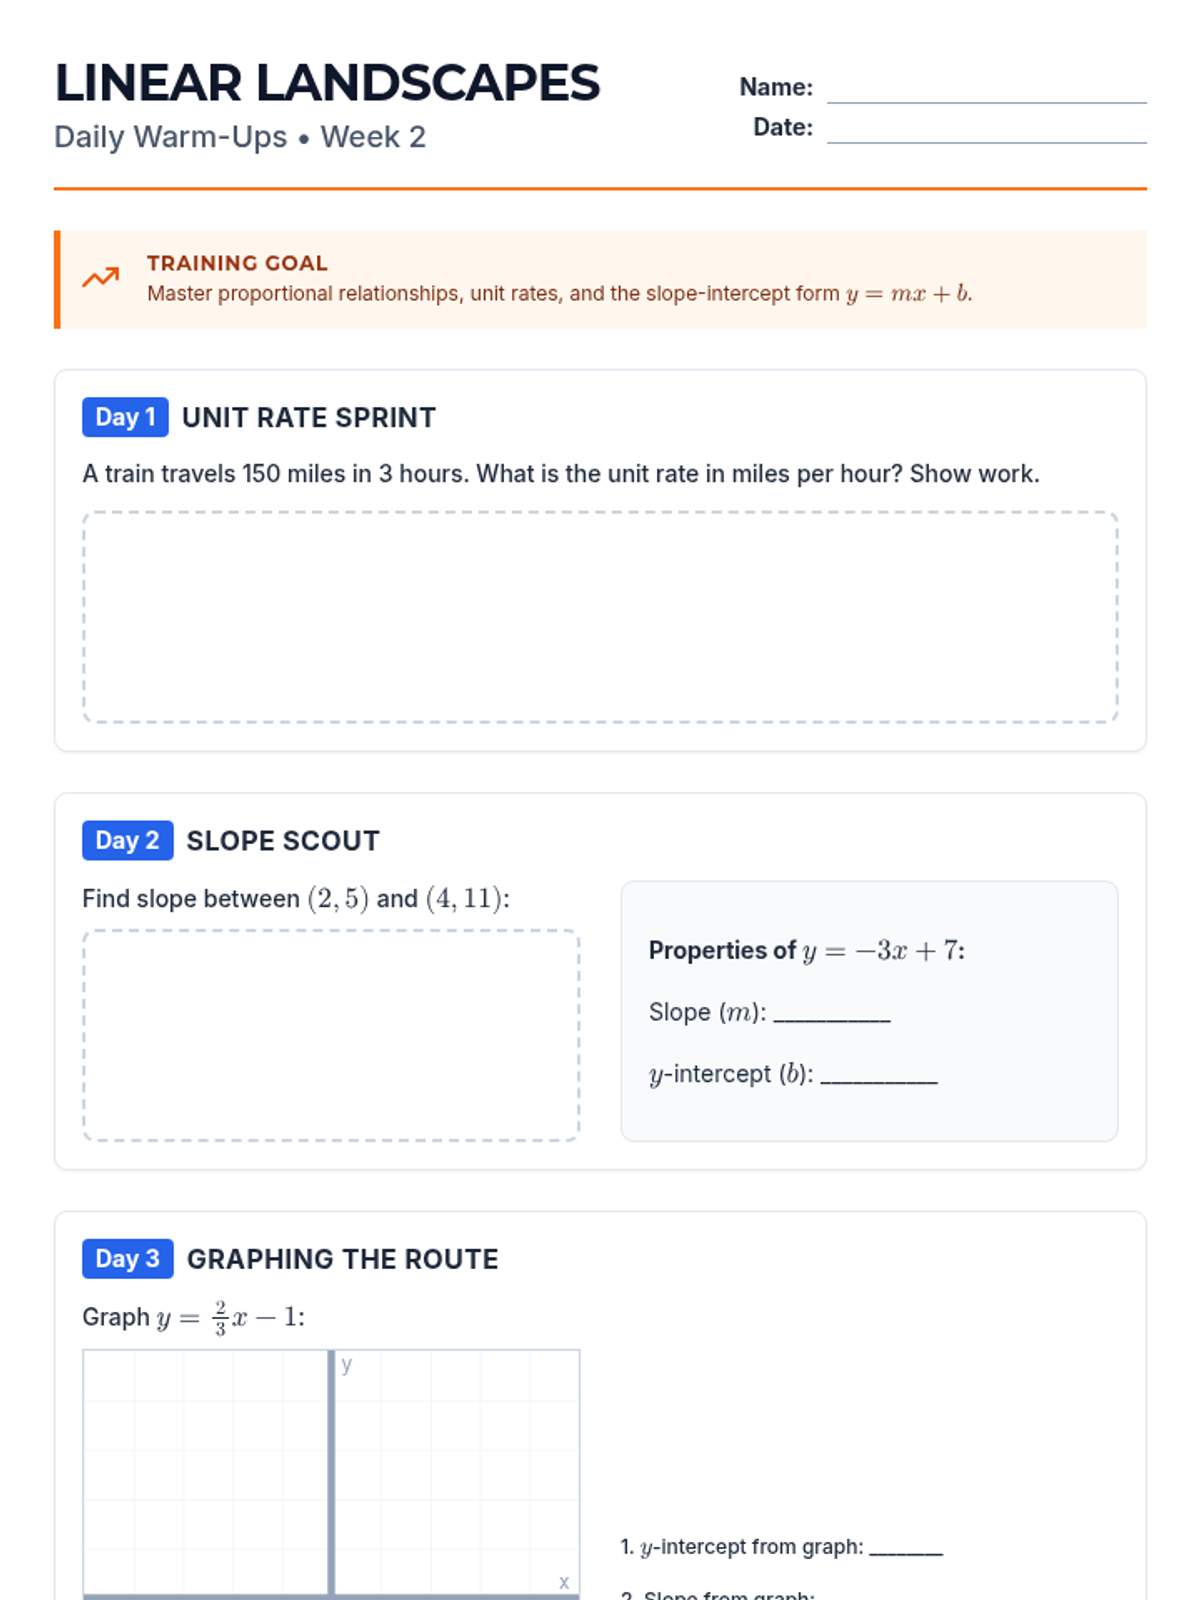
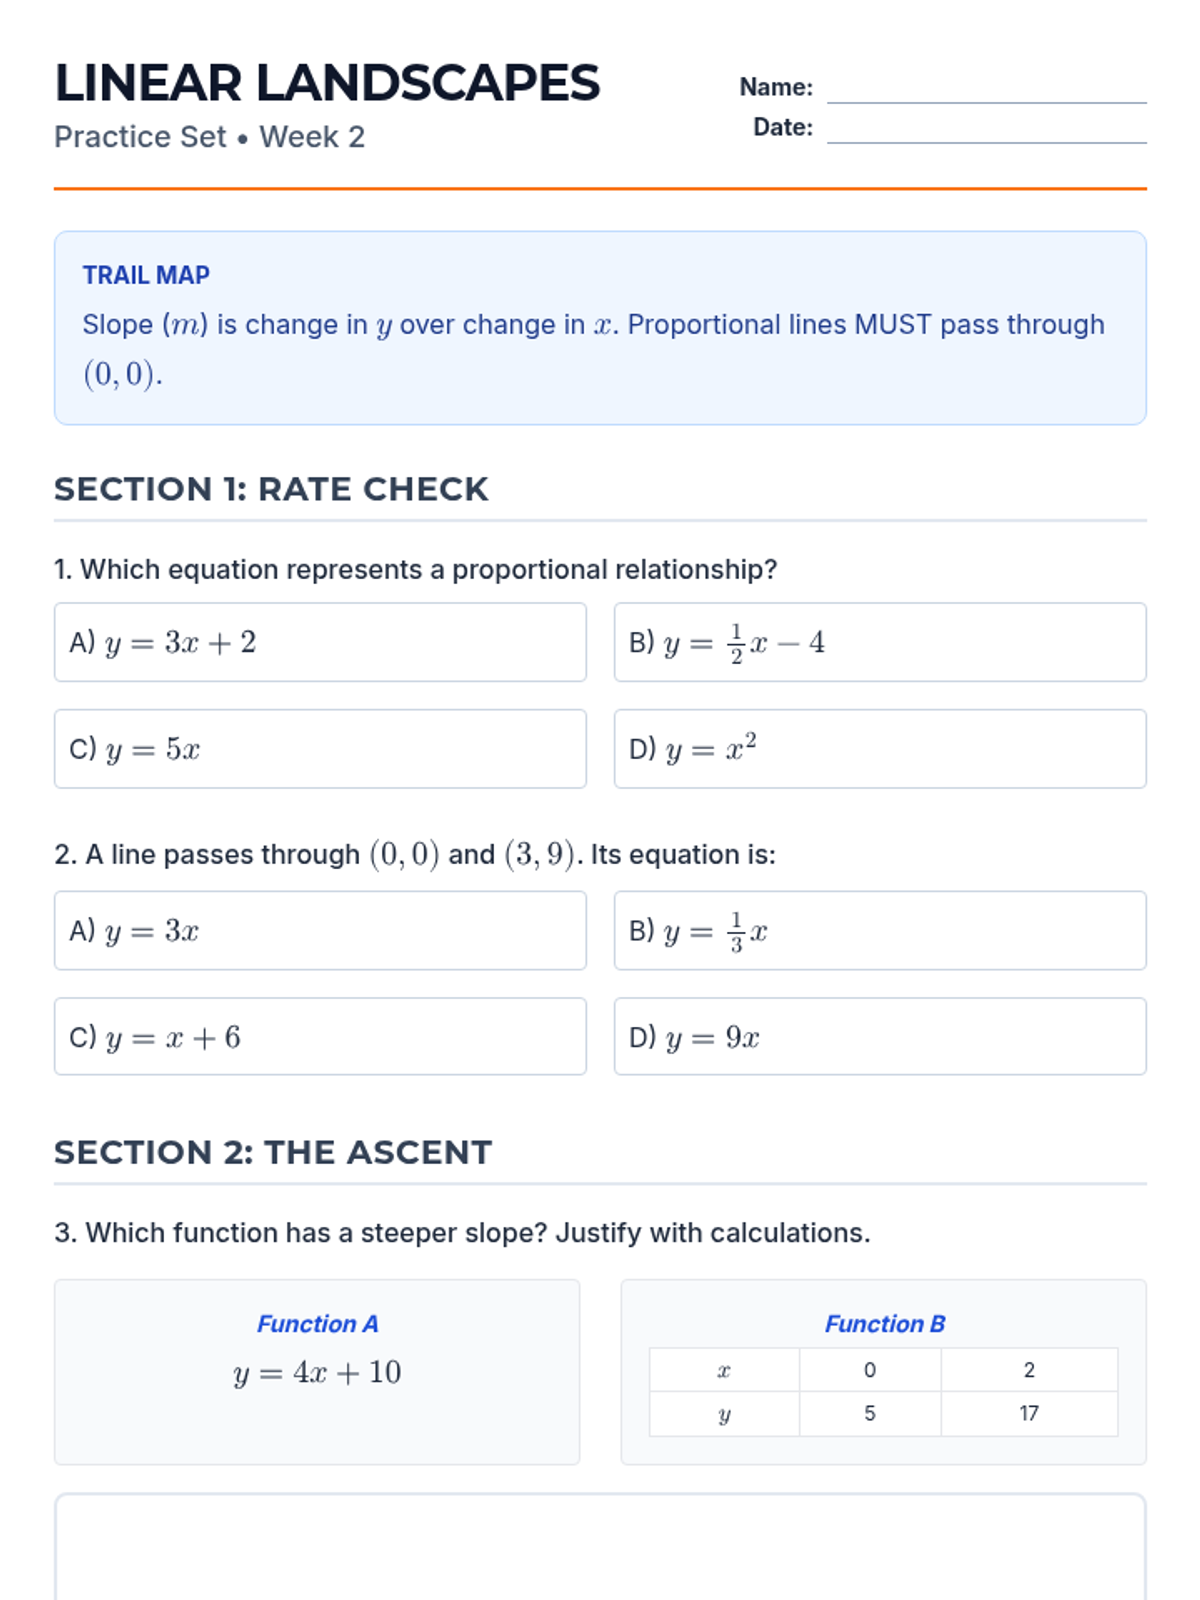
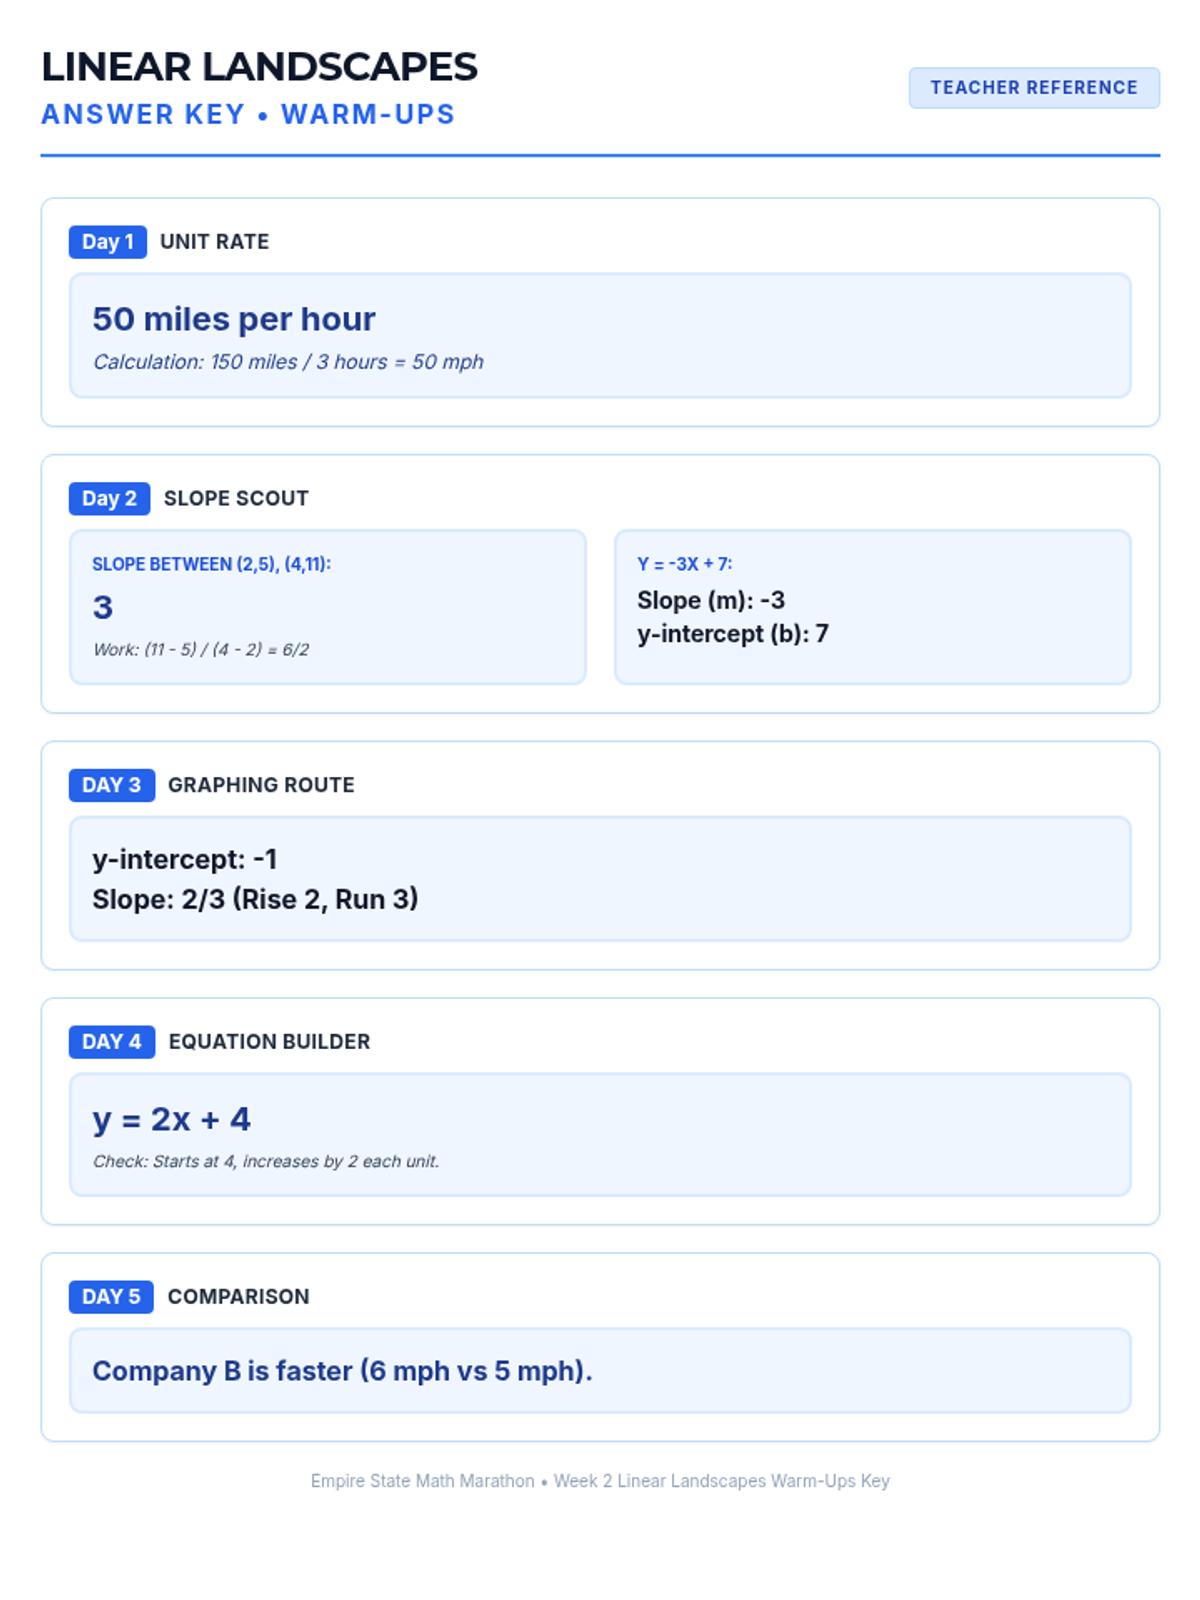
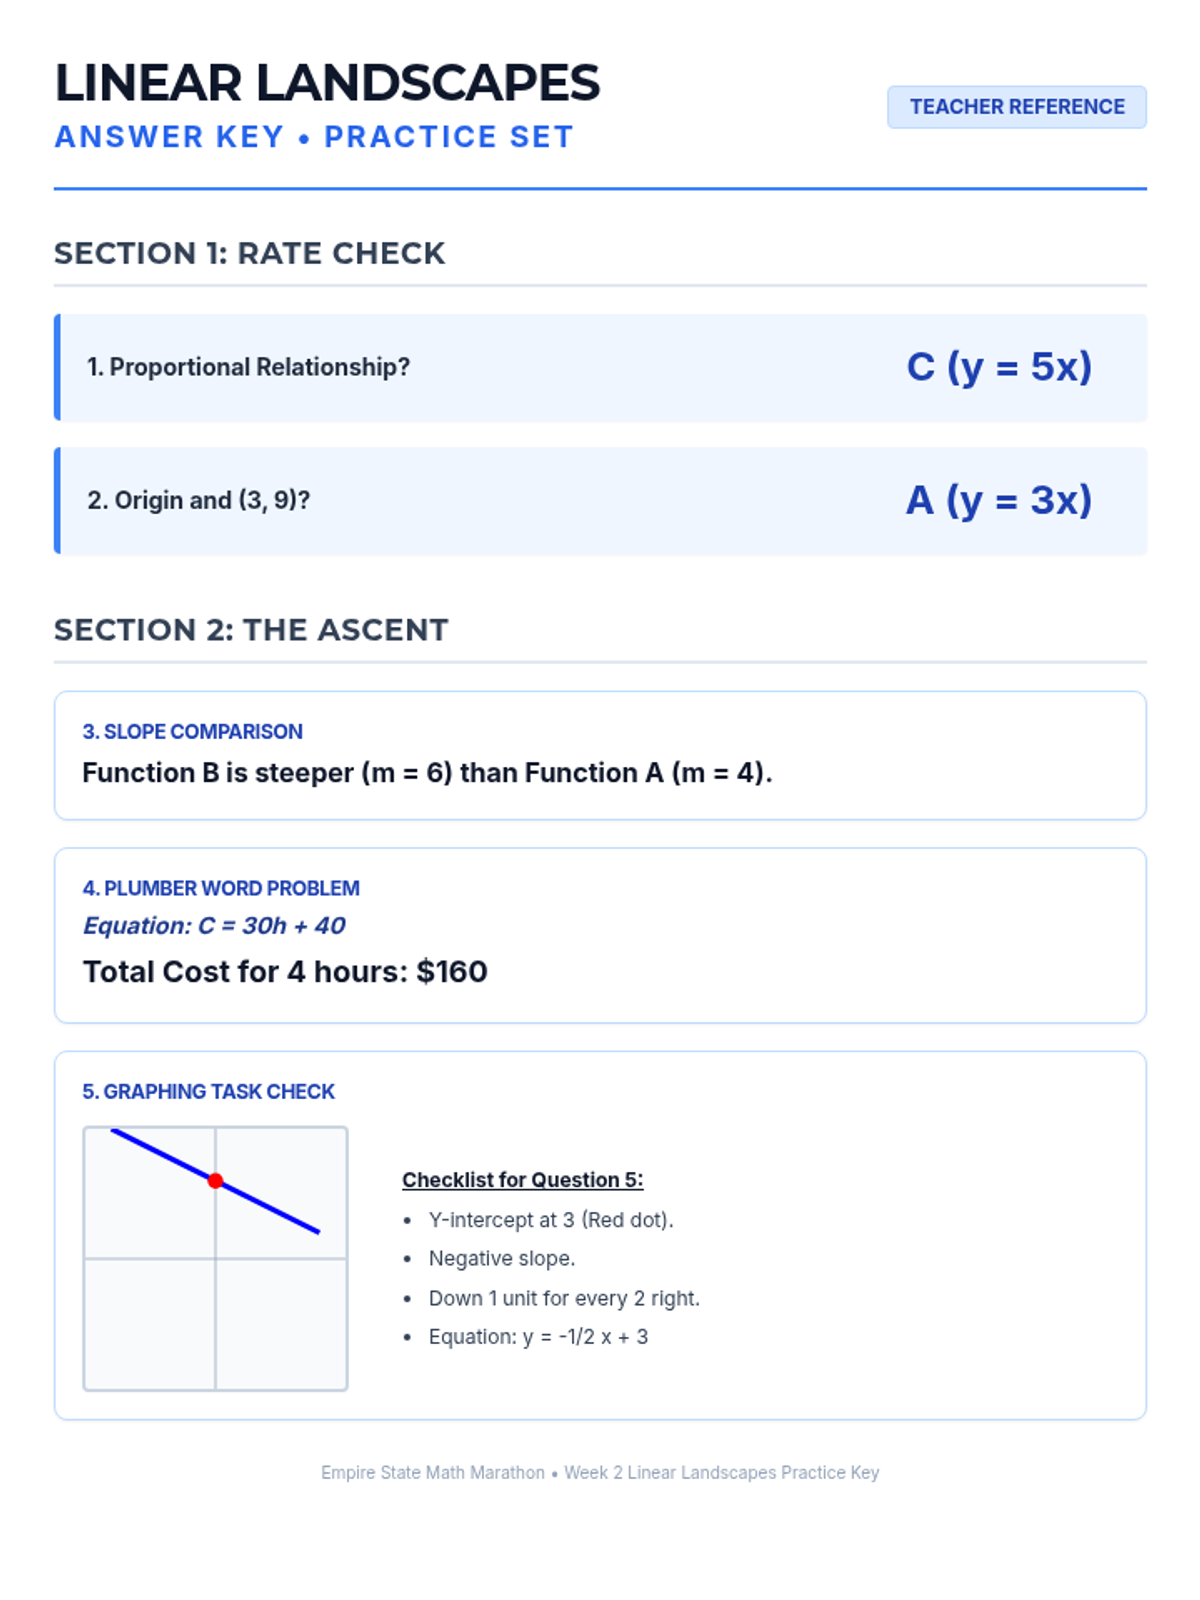
Week 2 covers proportional relationships, unit rates, and the slope-intercept form of linear equations.
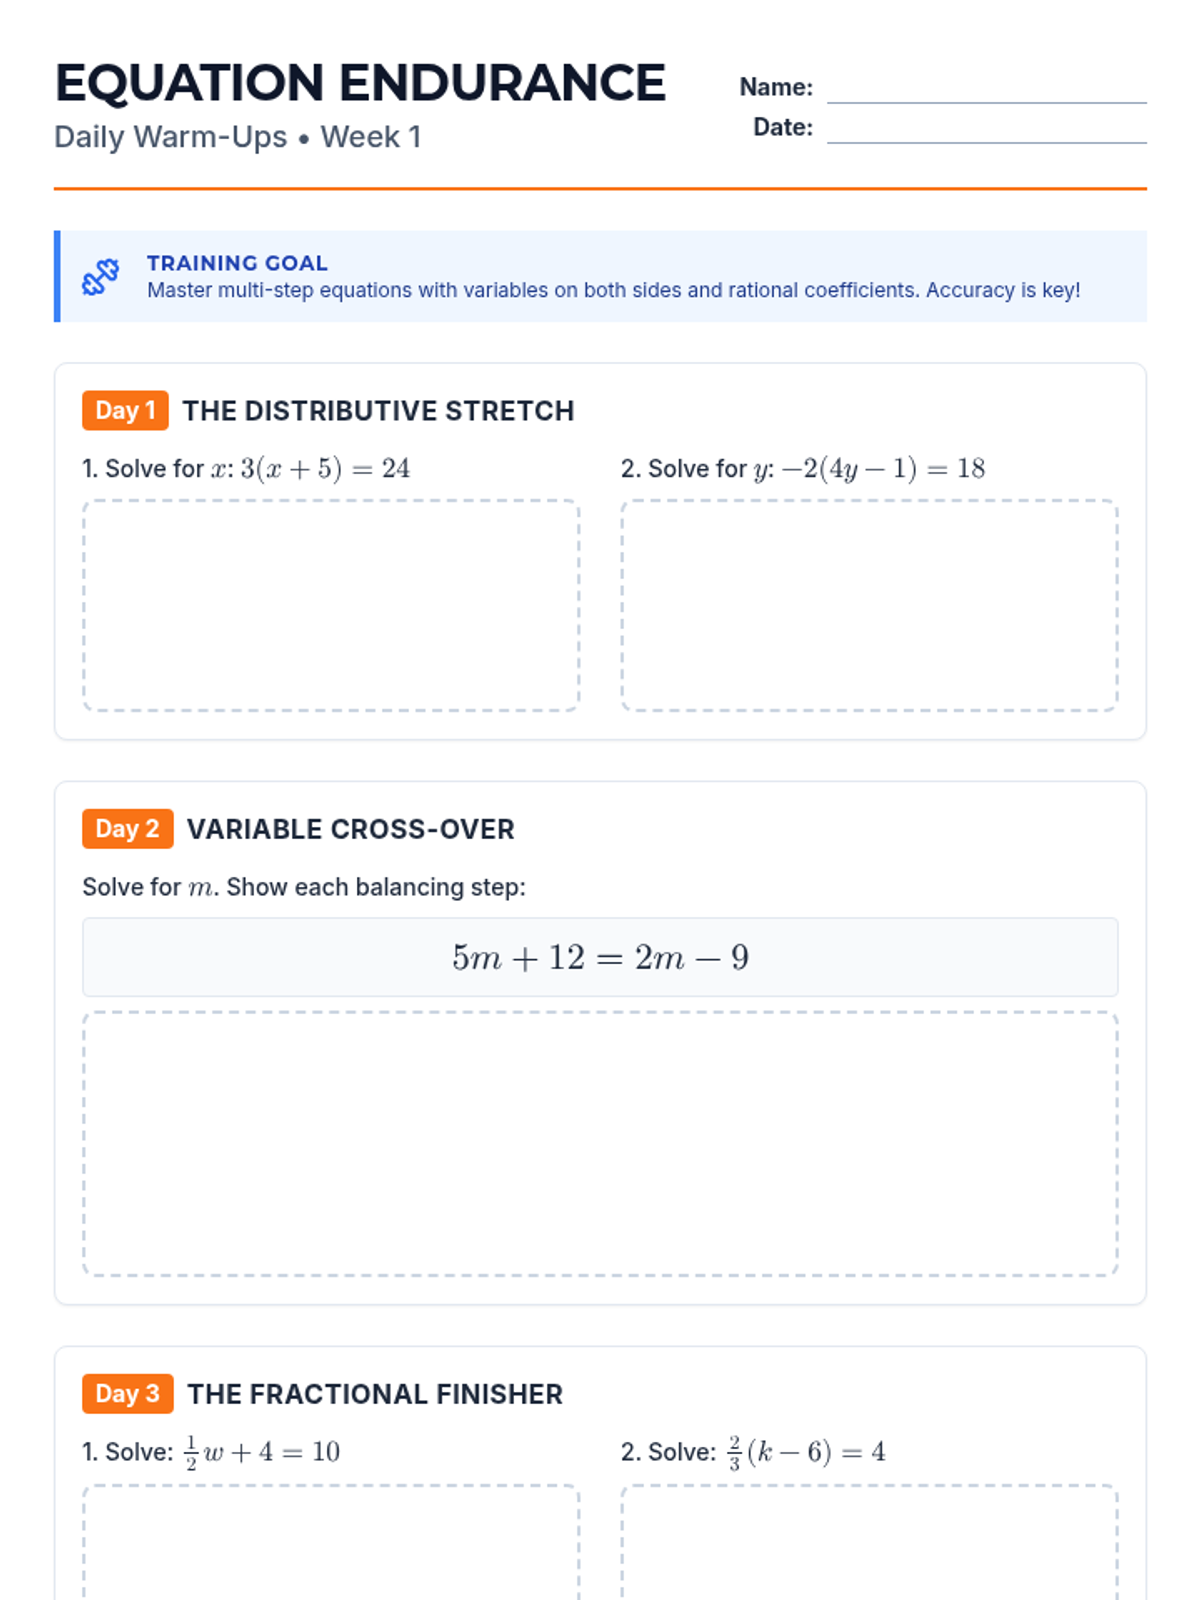
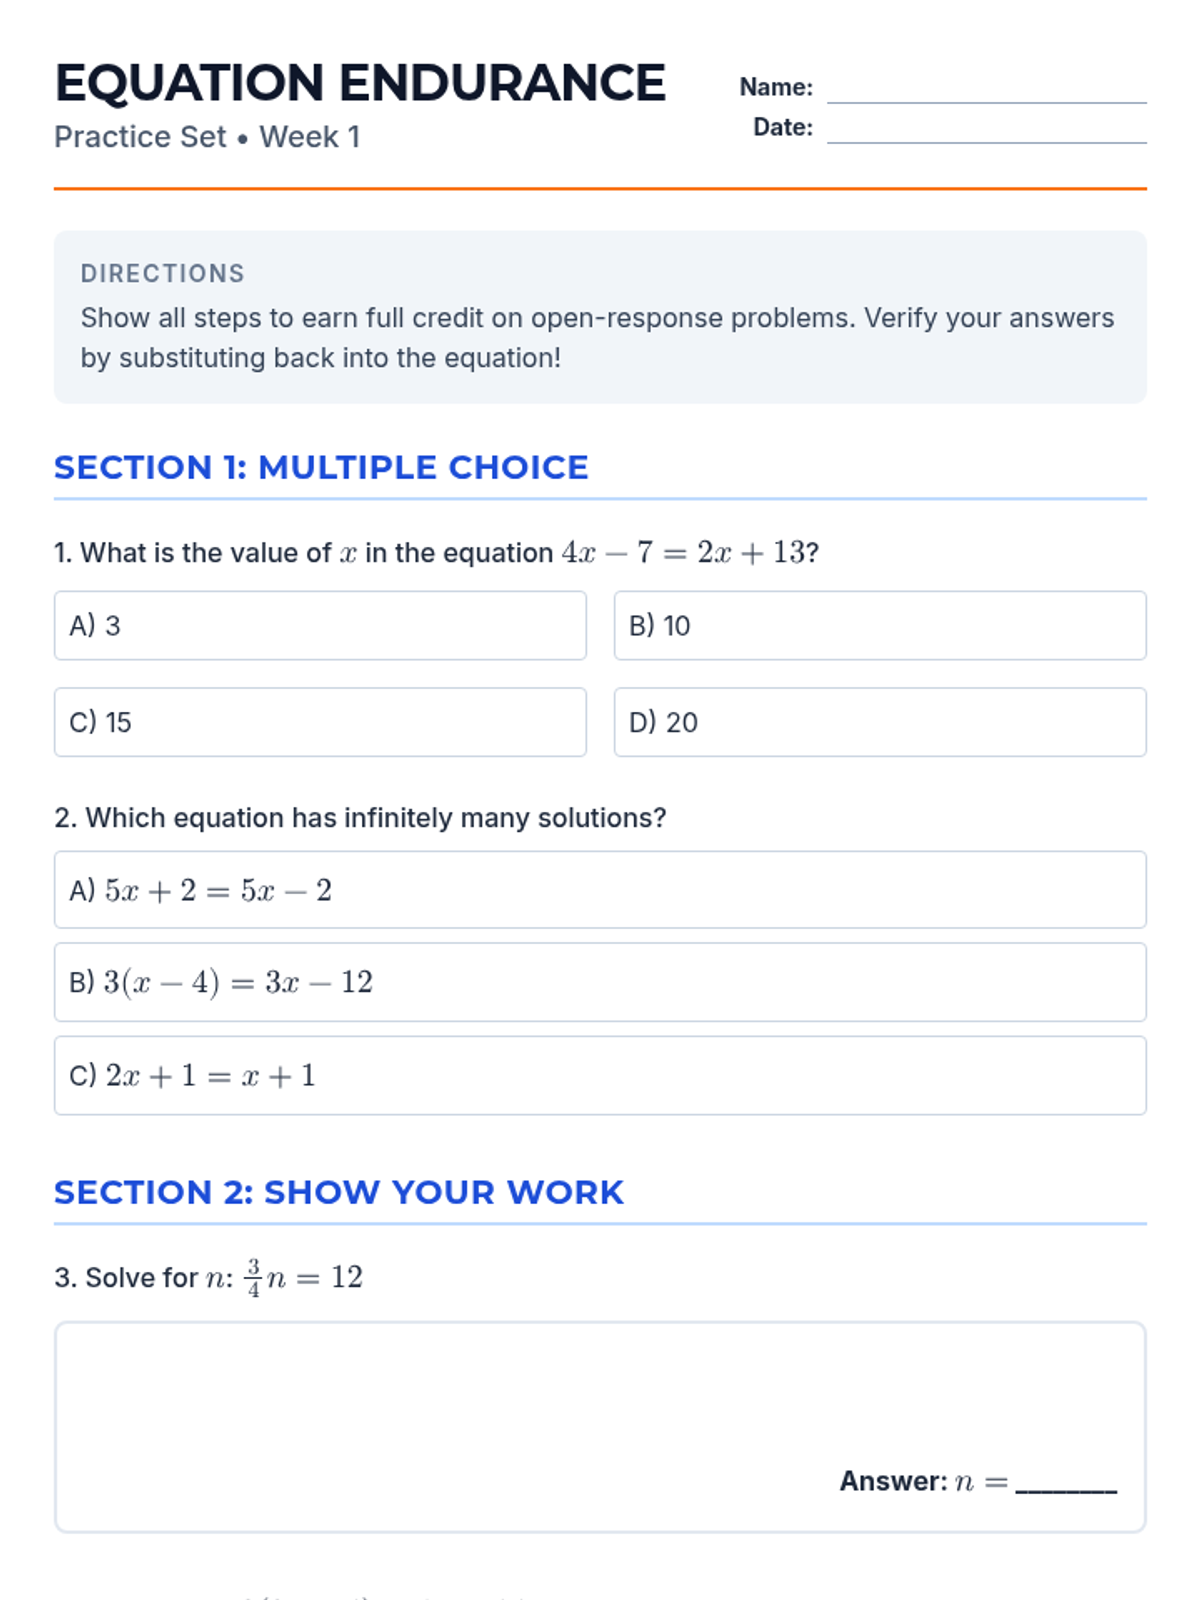
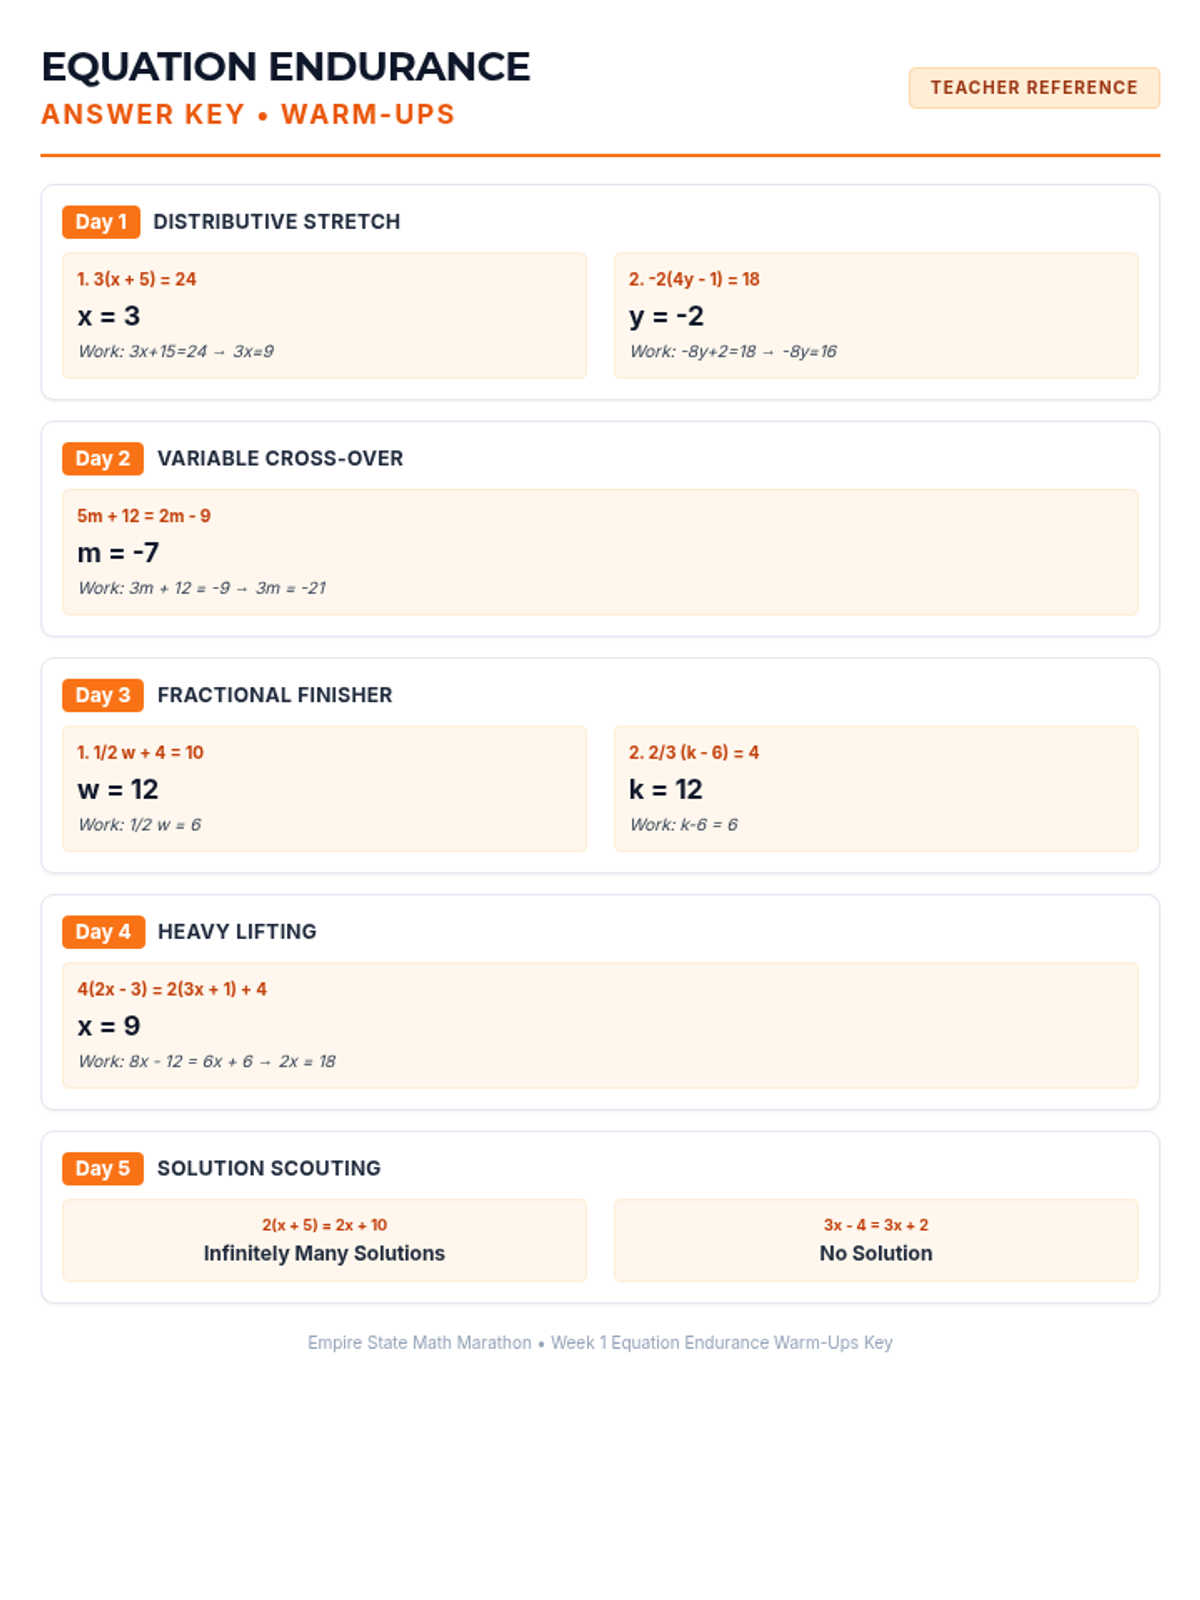
Week 1 focuses on solving multi-step equations, including those with variables on both sides, rational coefficients, and checking solutions.
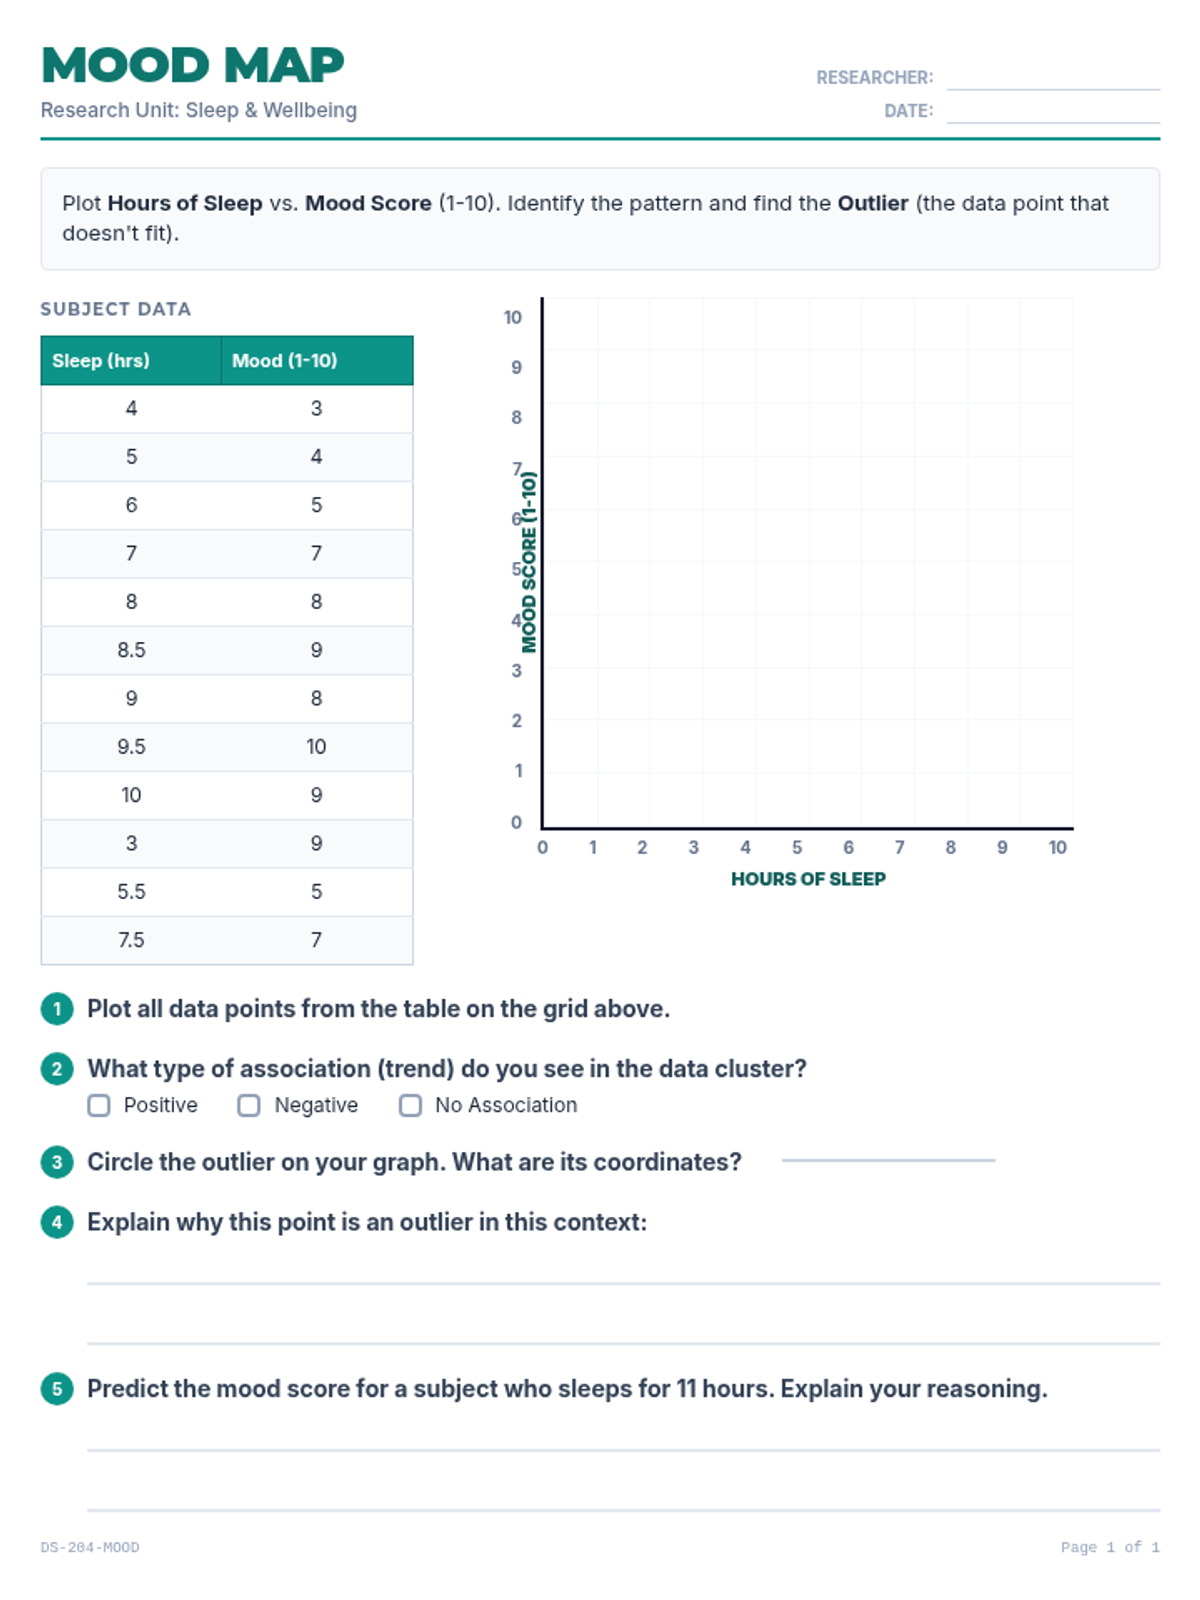
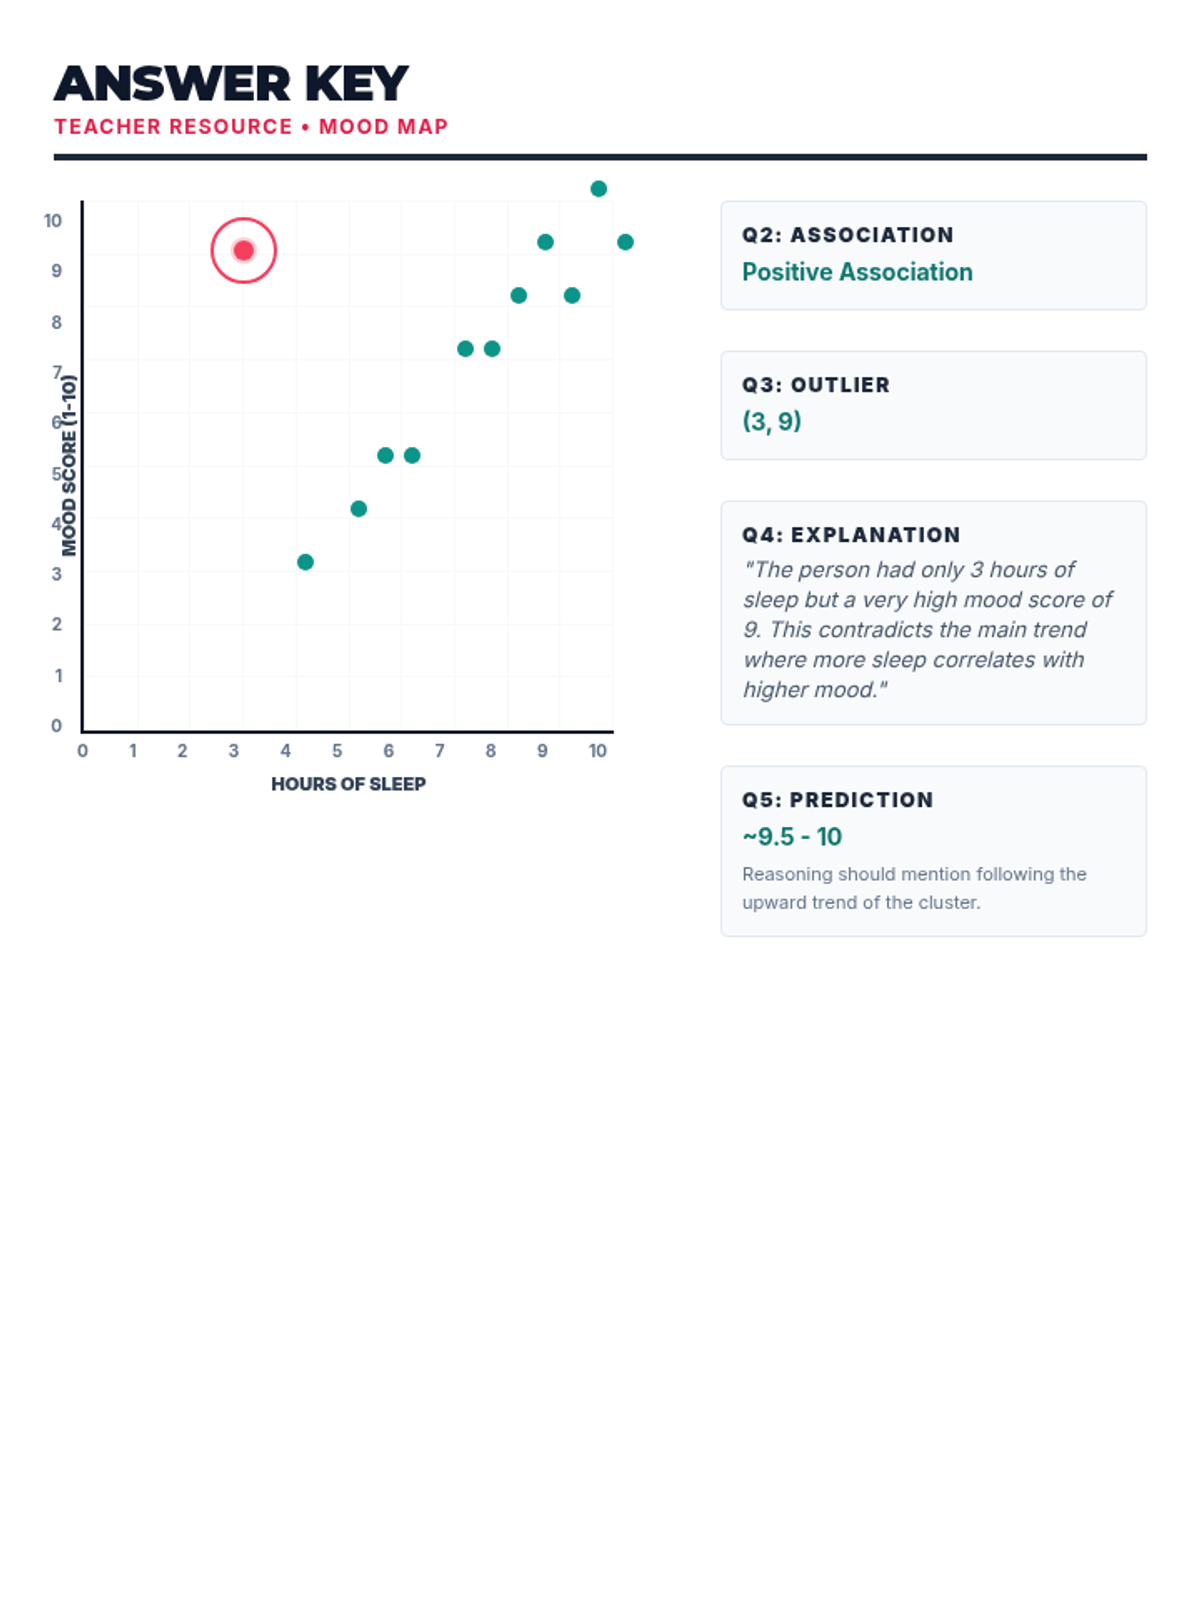
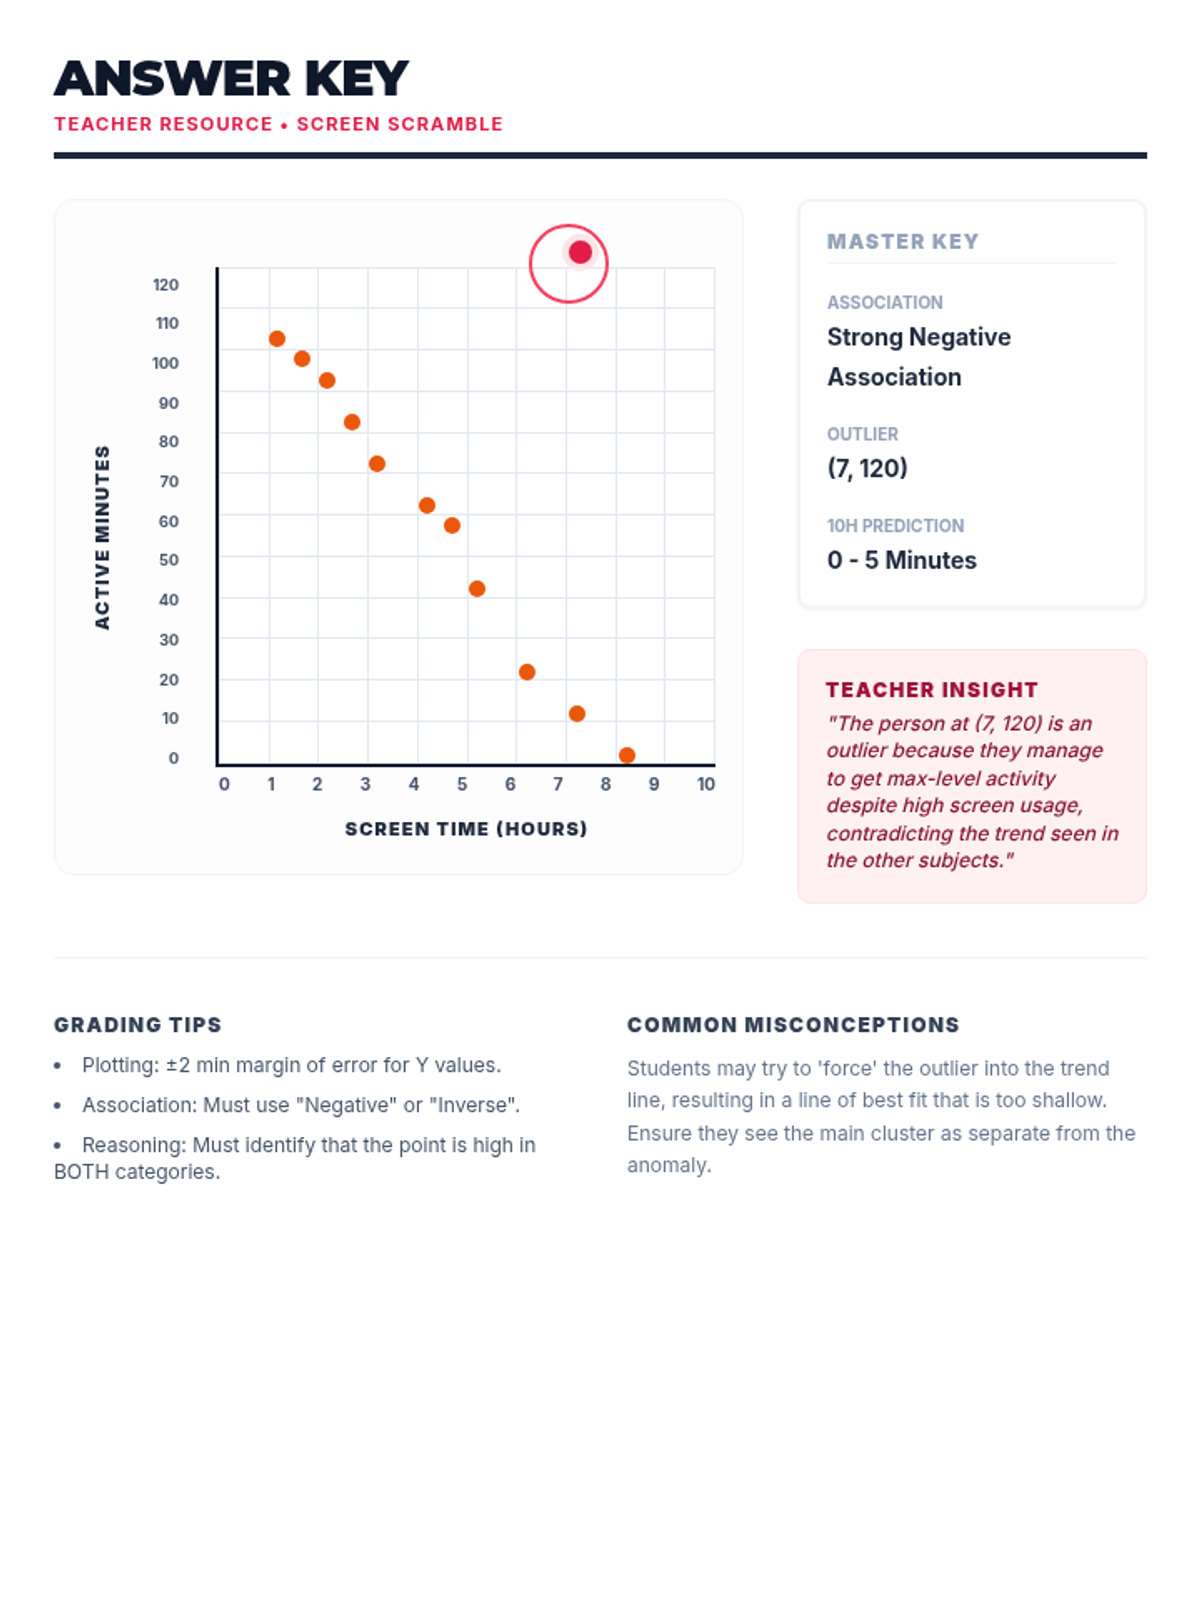
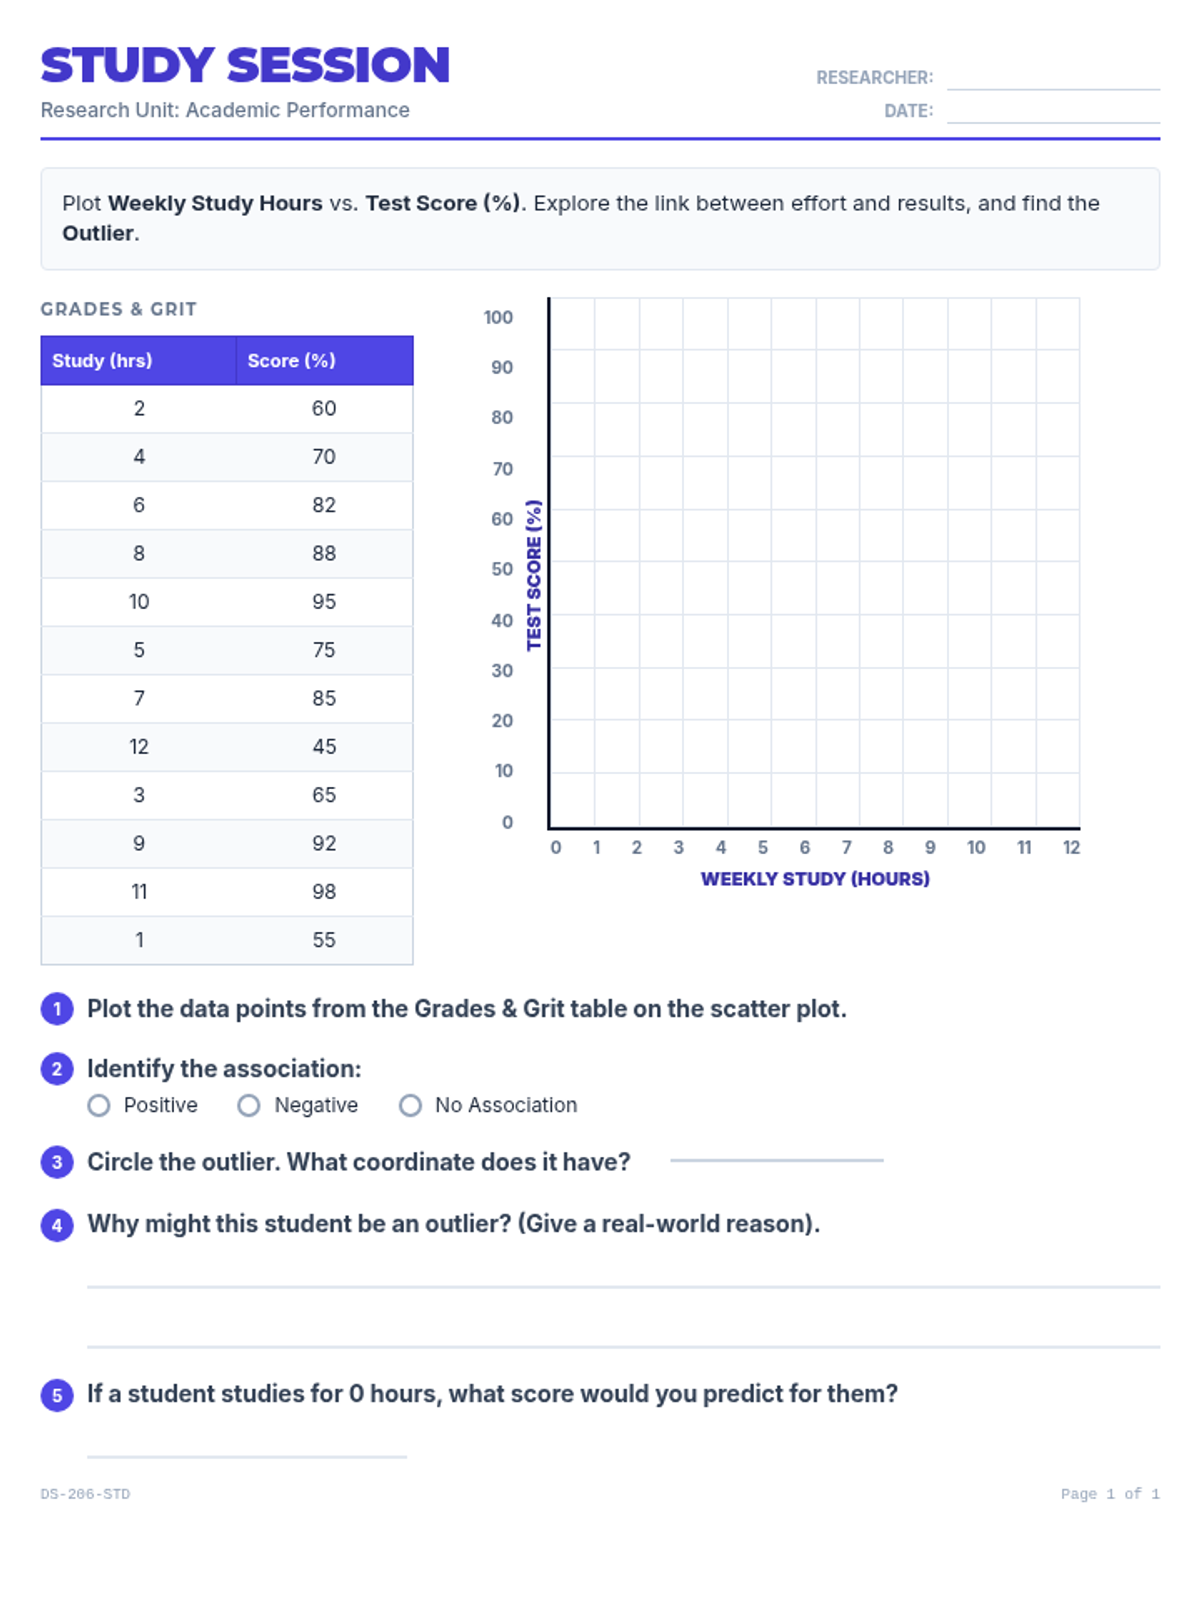
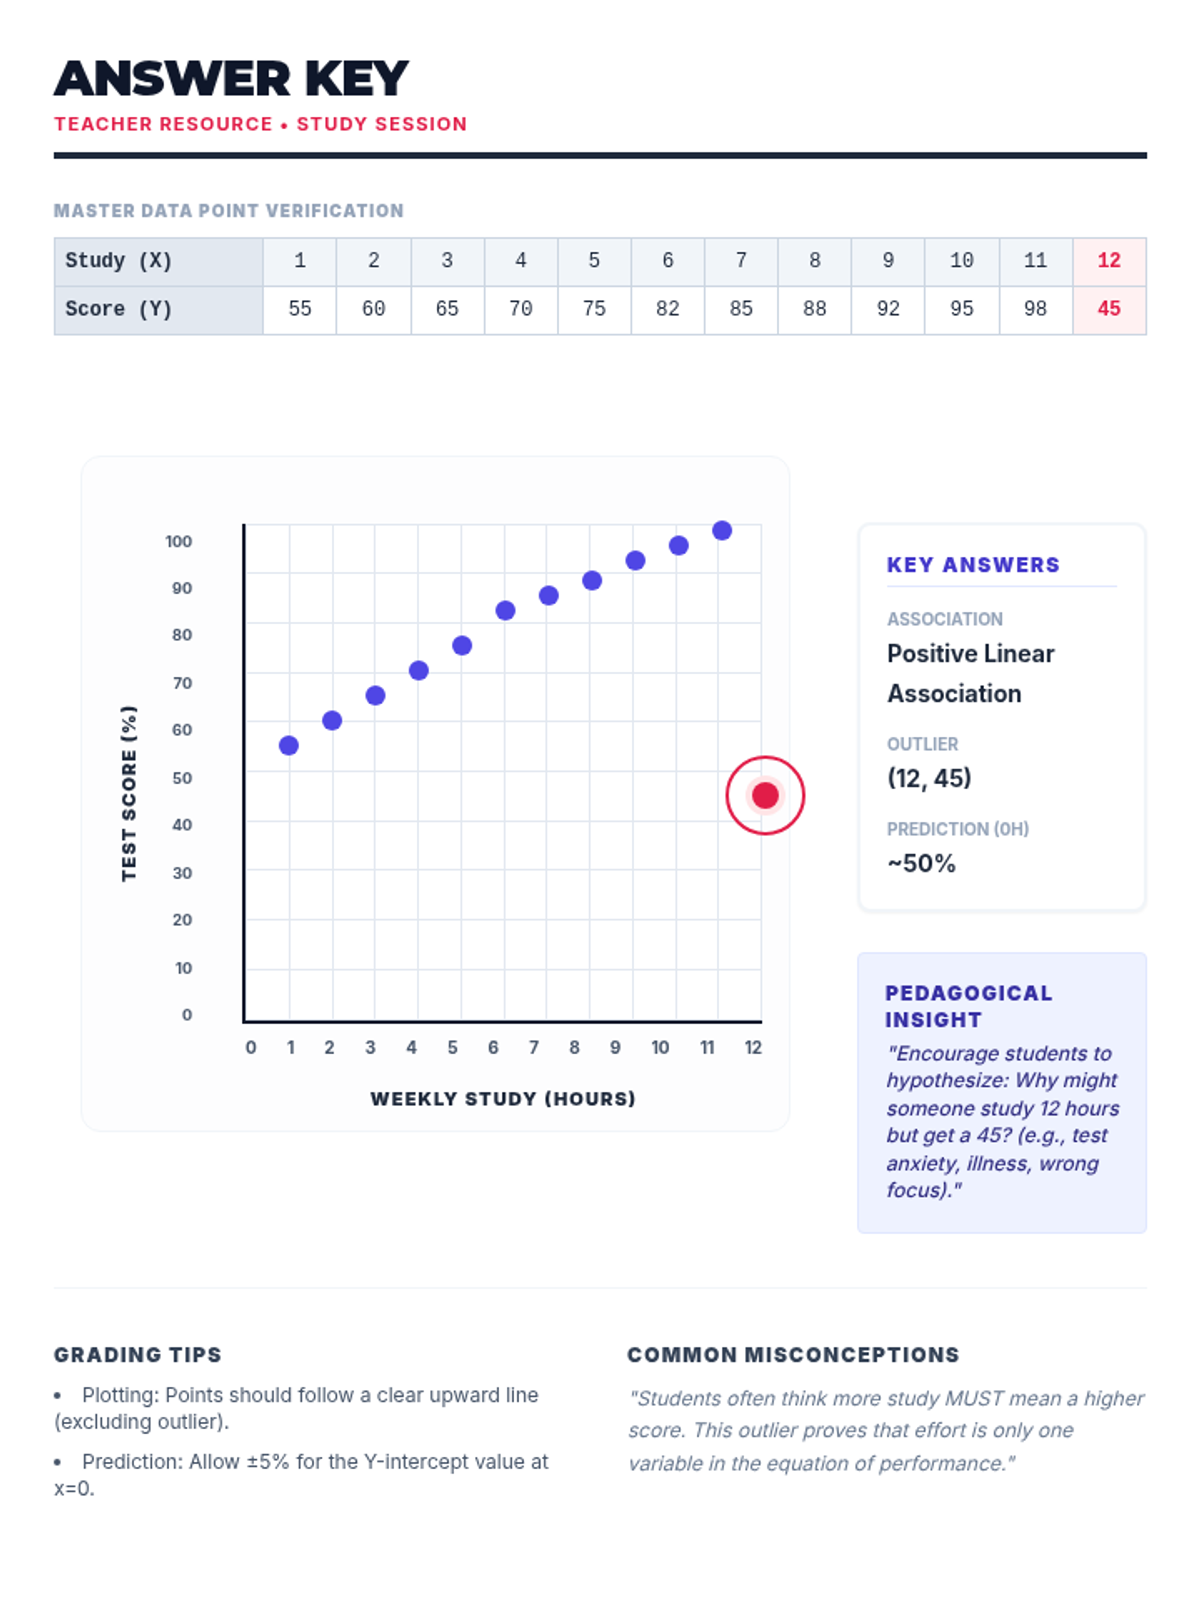
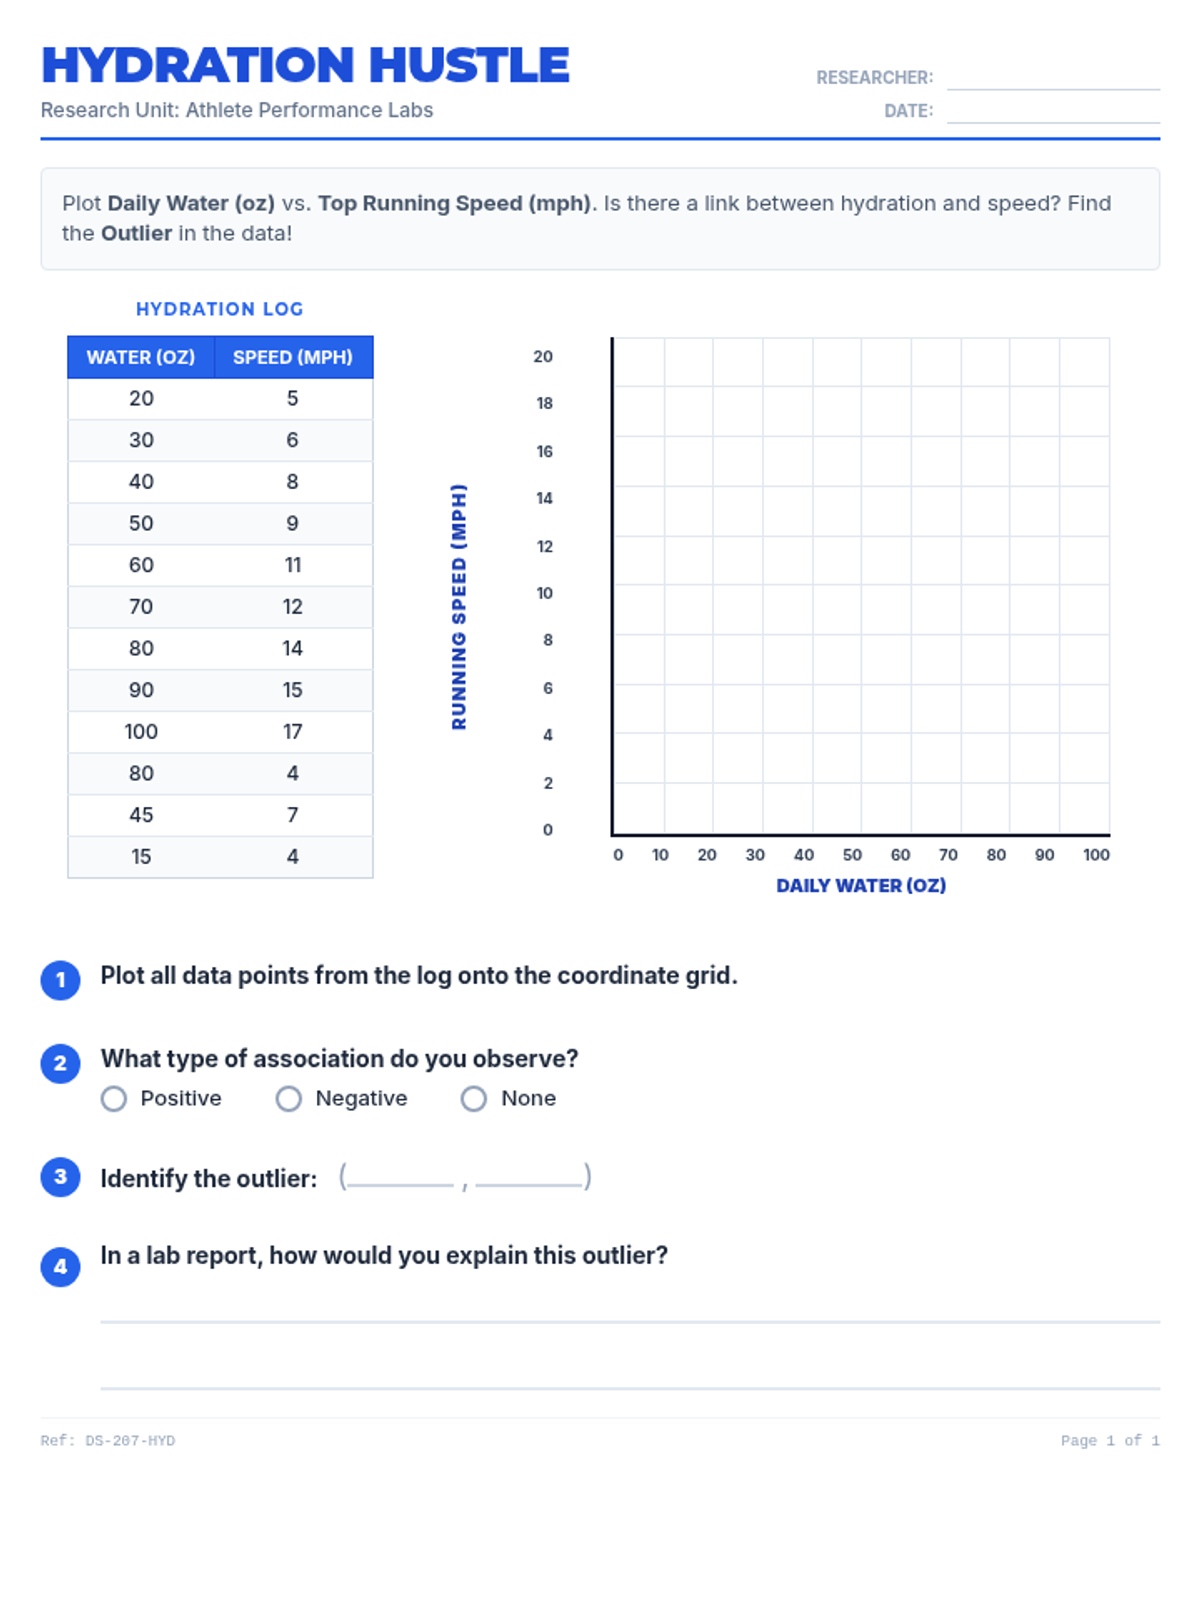
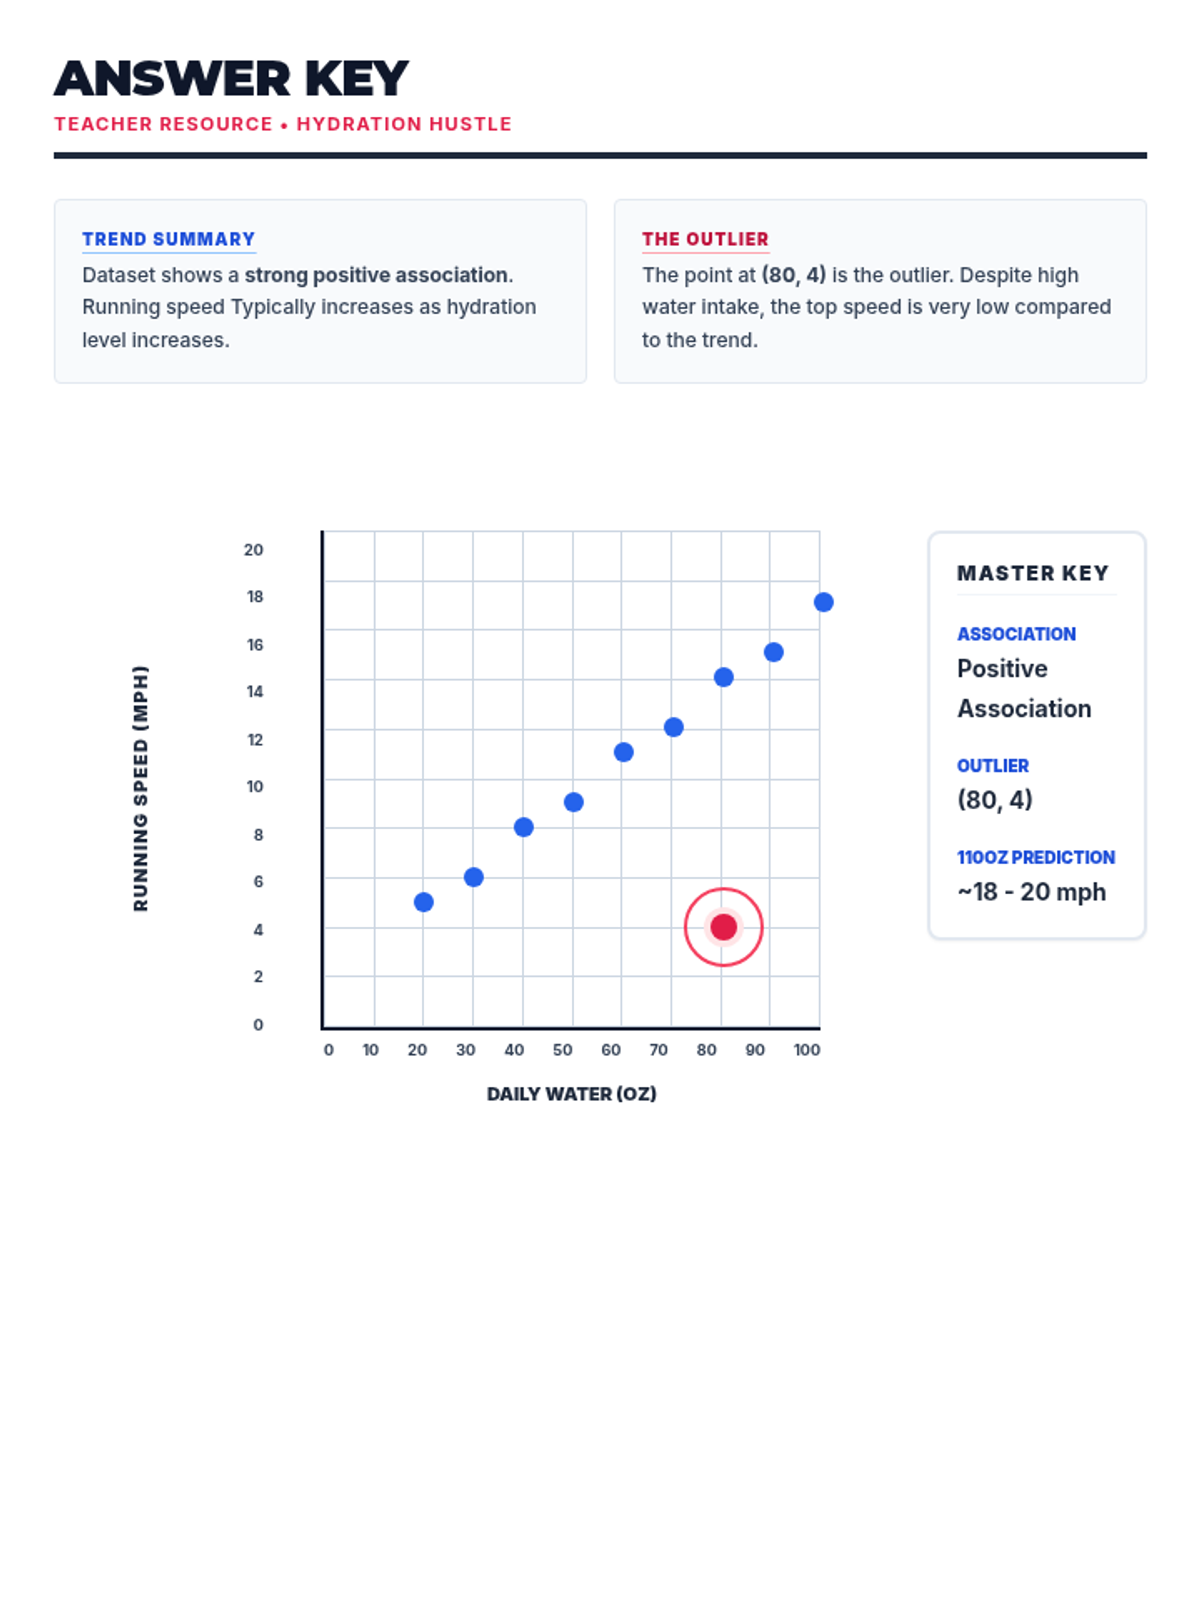
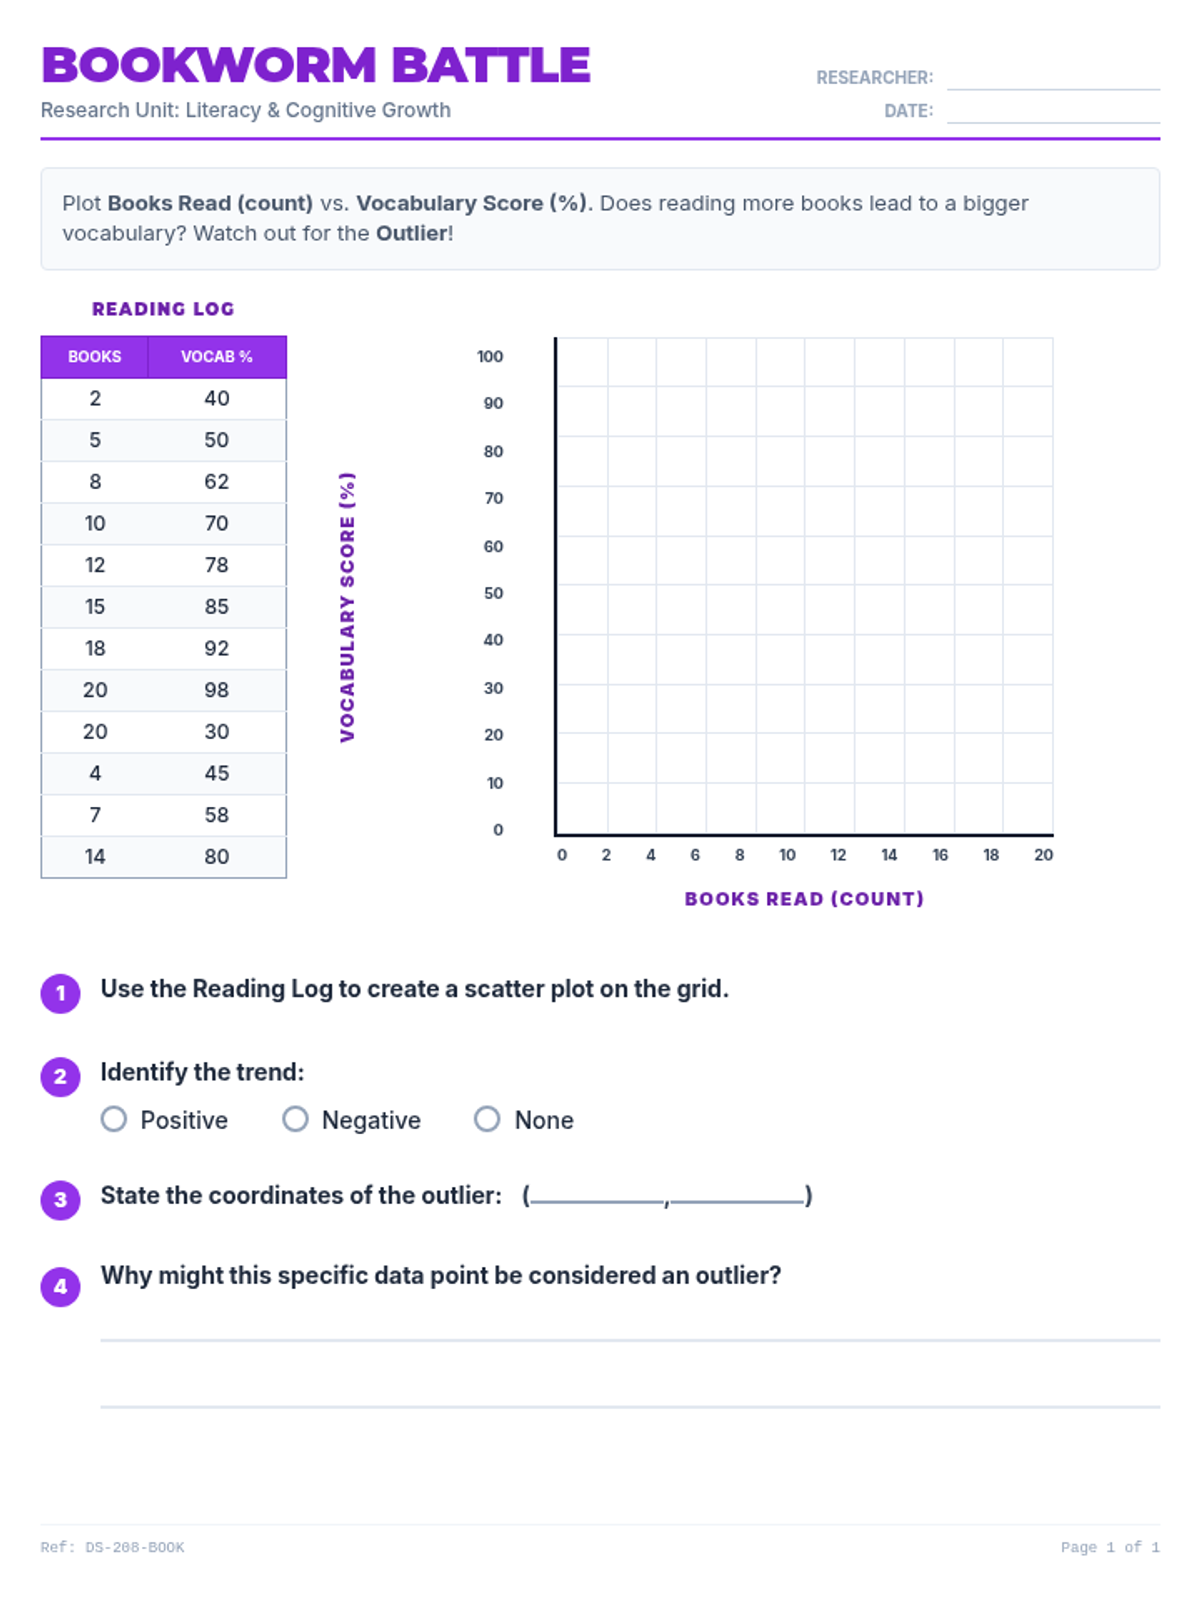
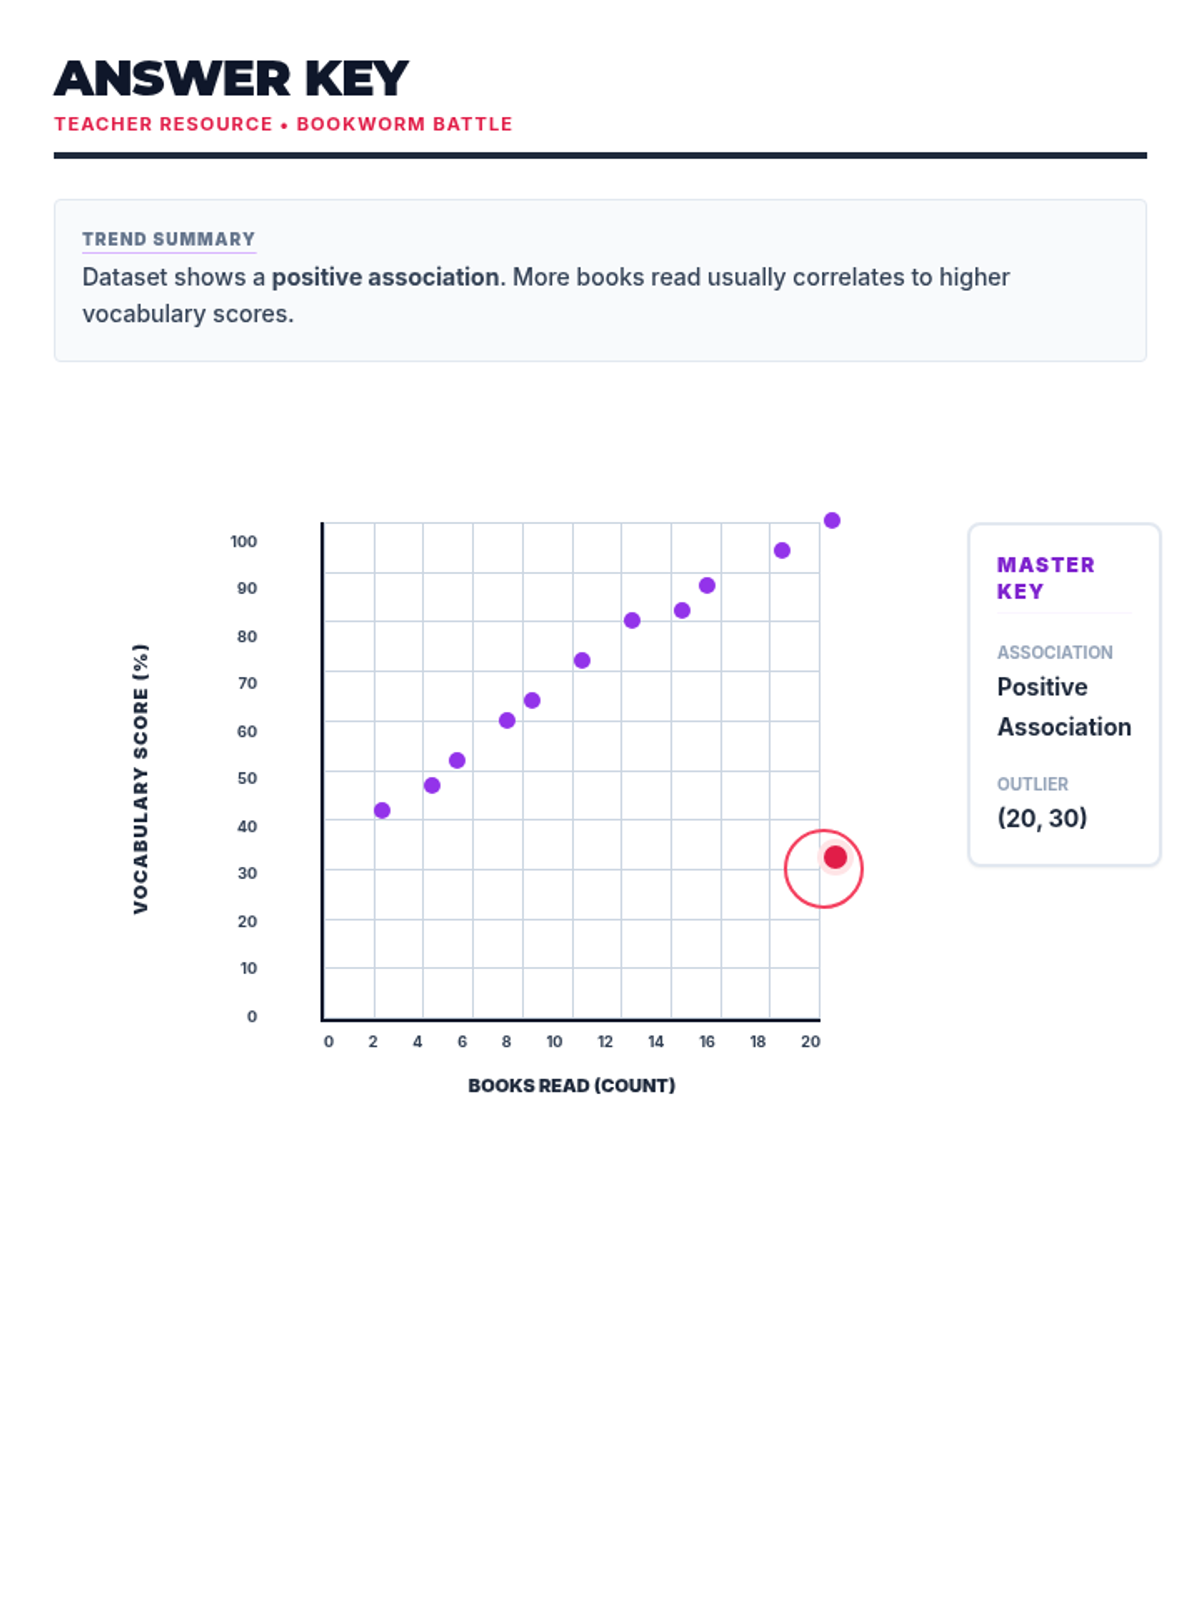
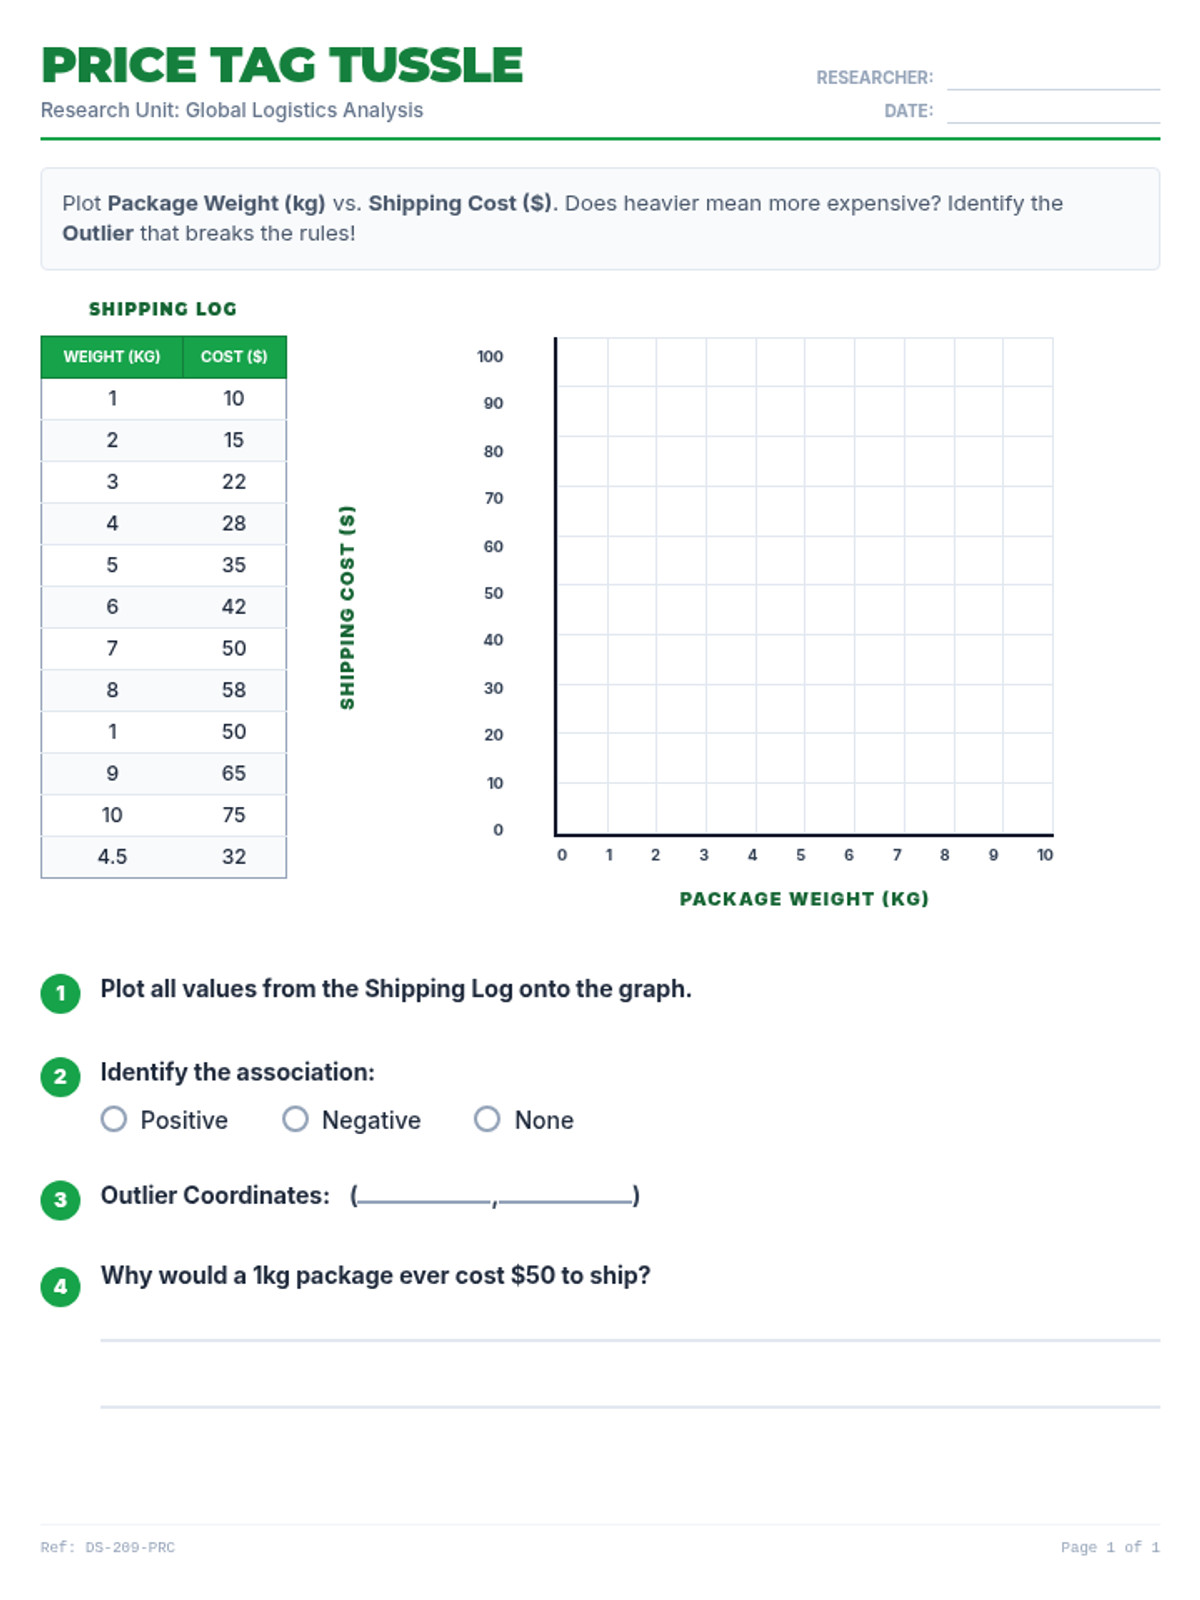
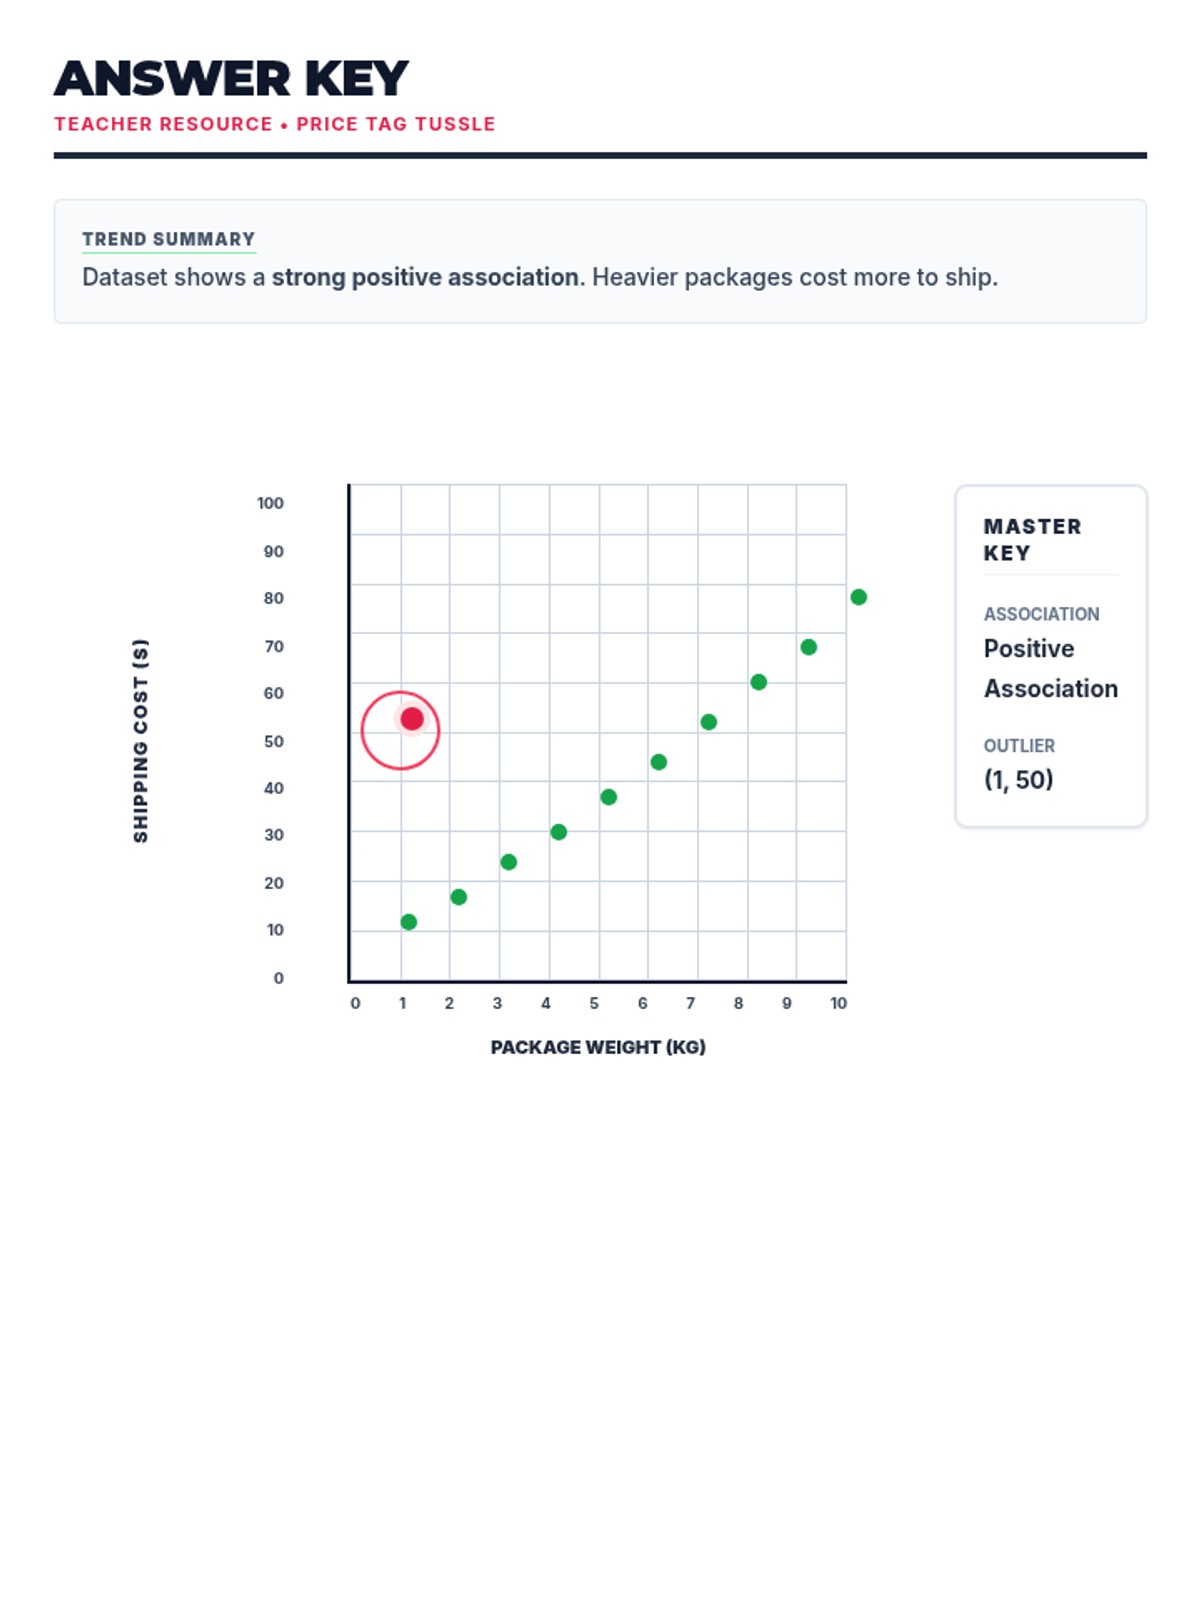
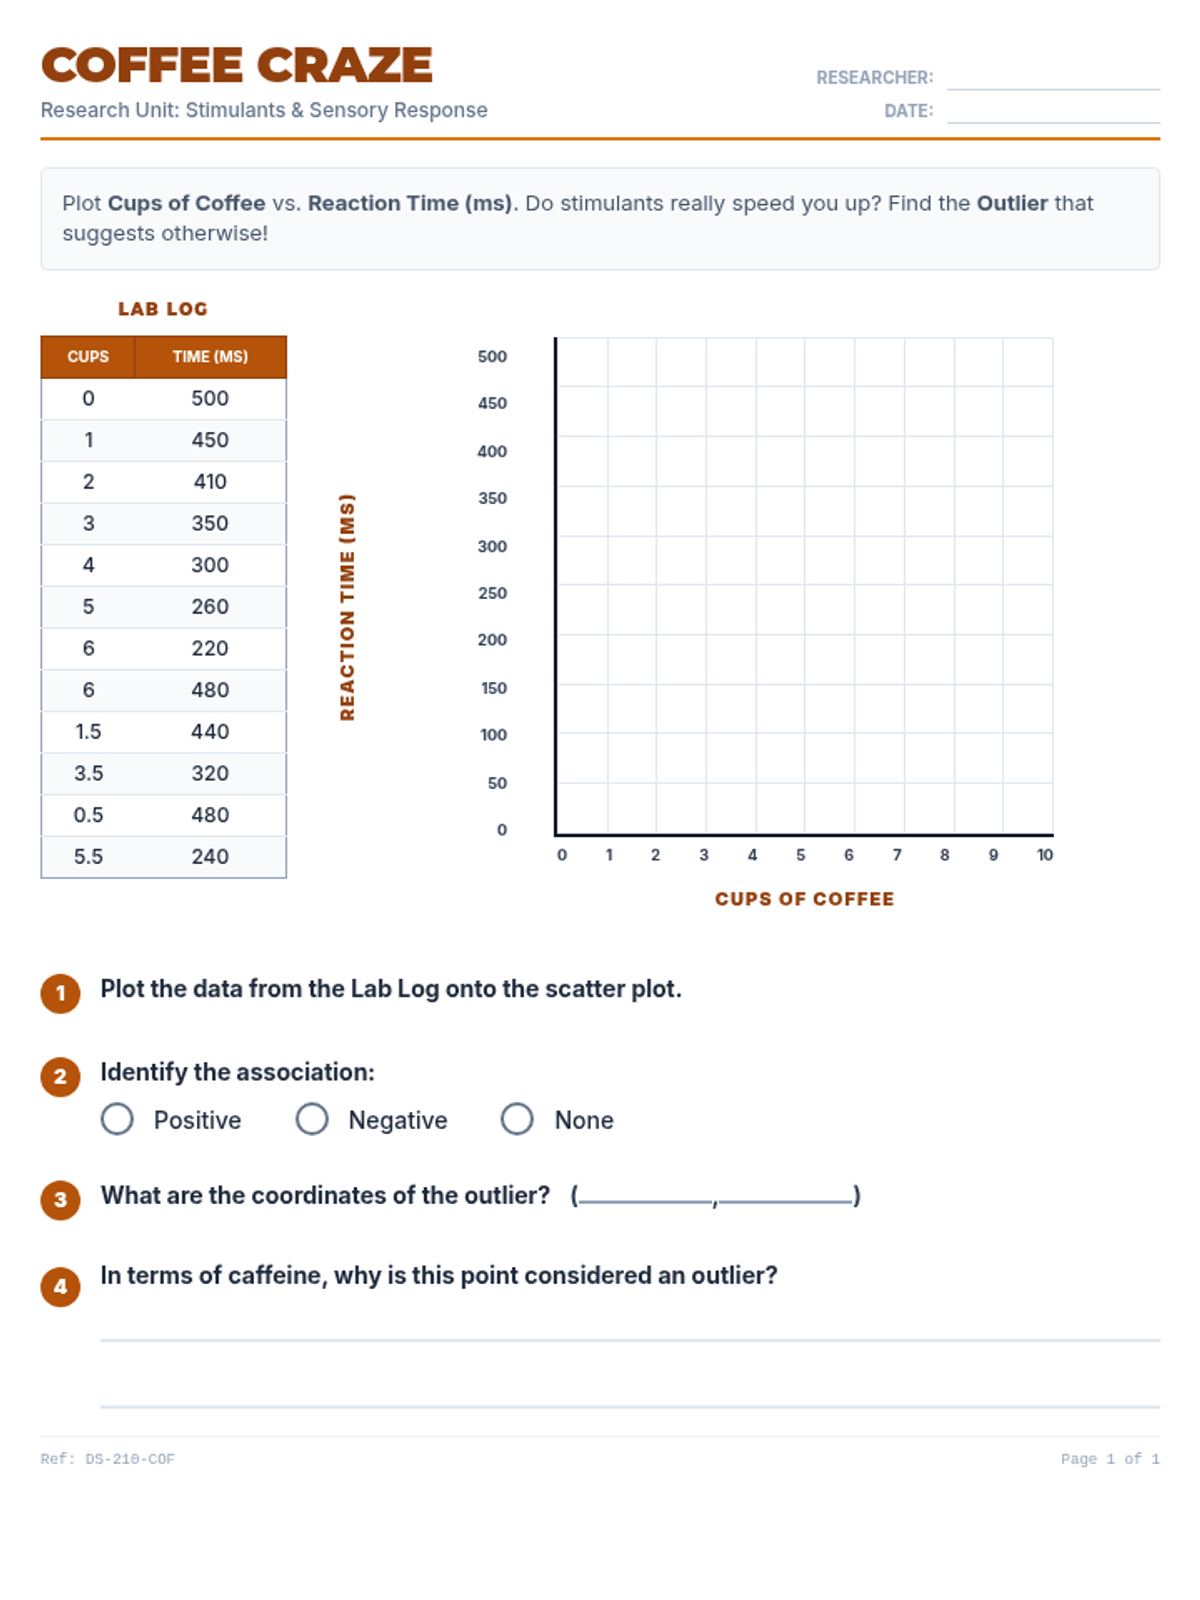
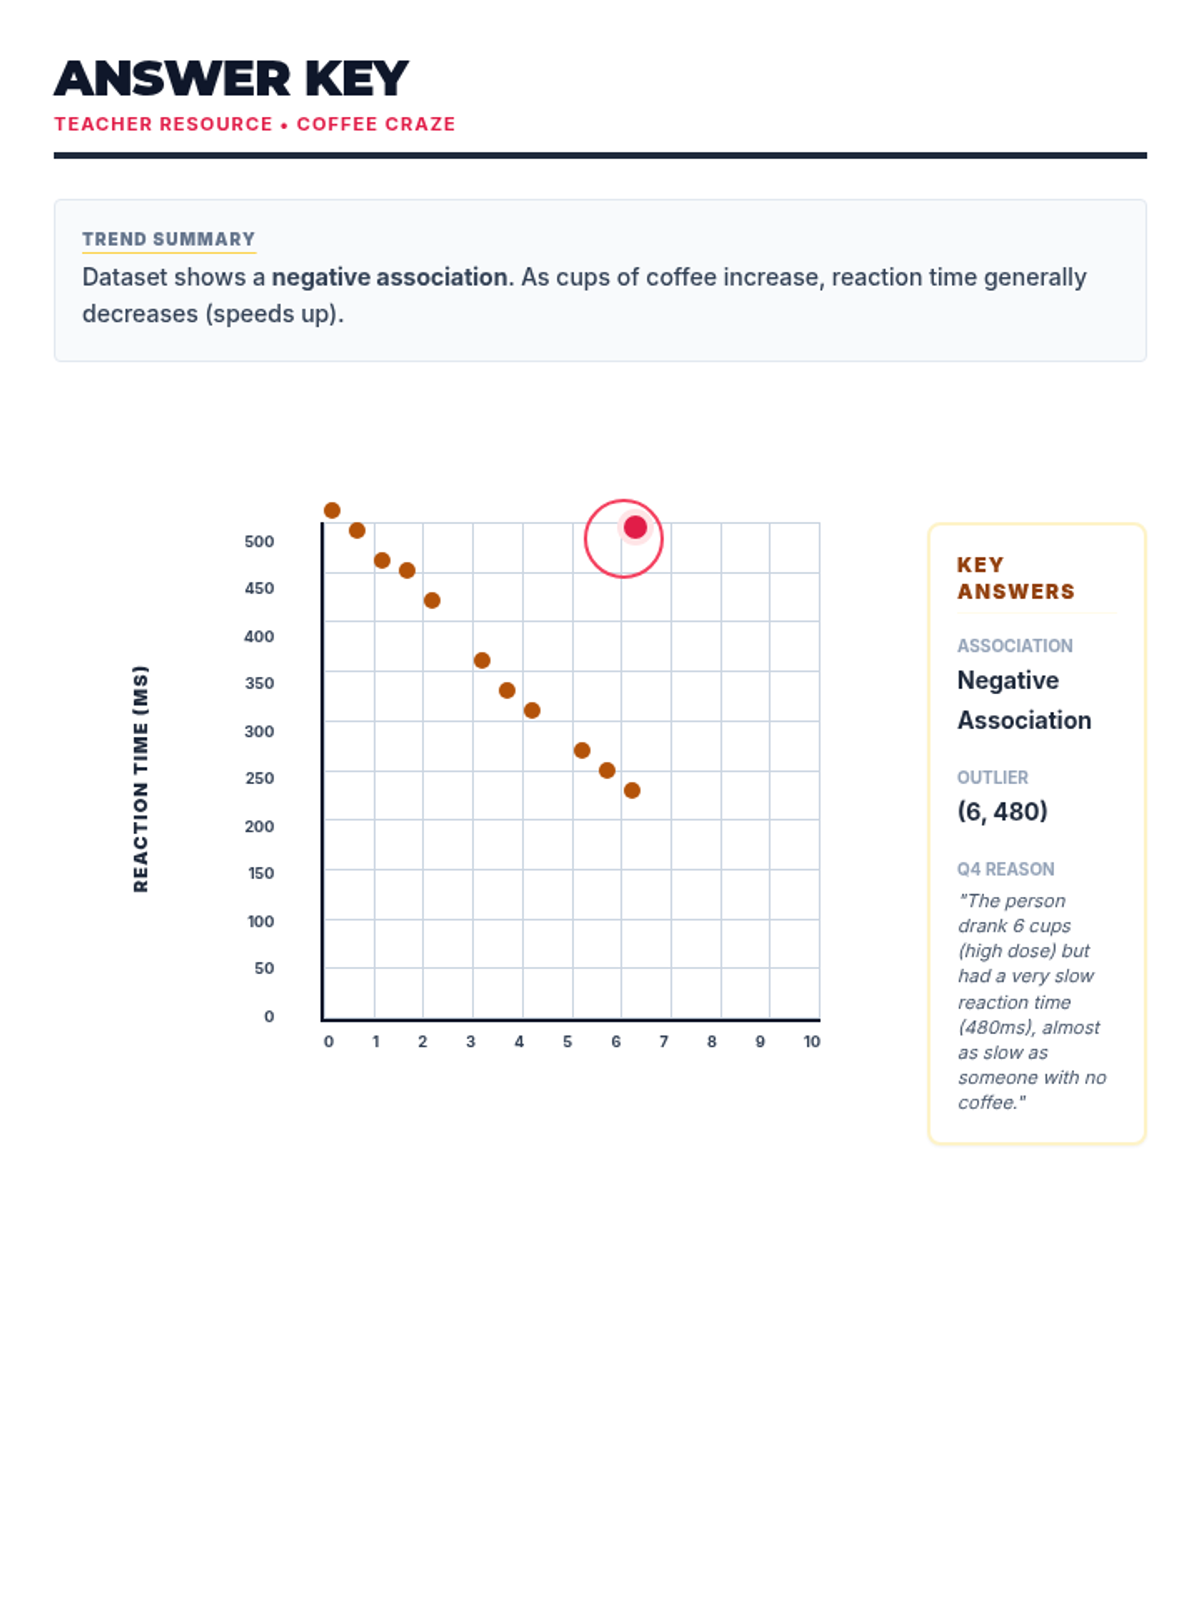
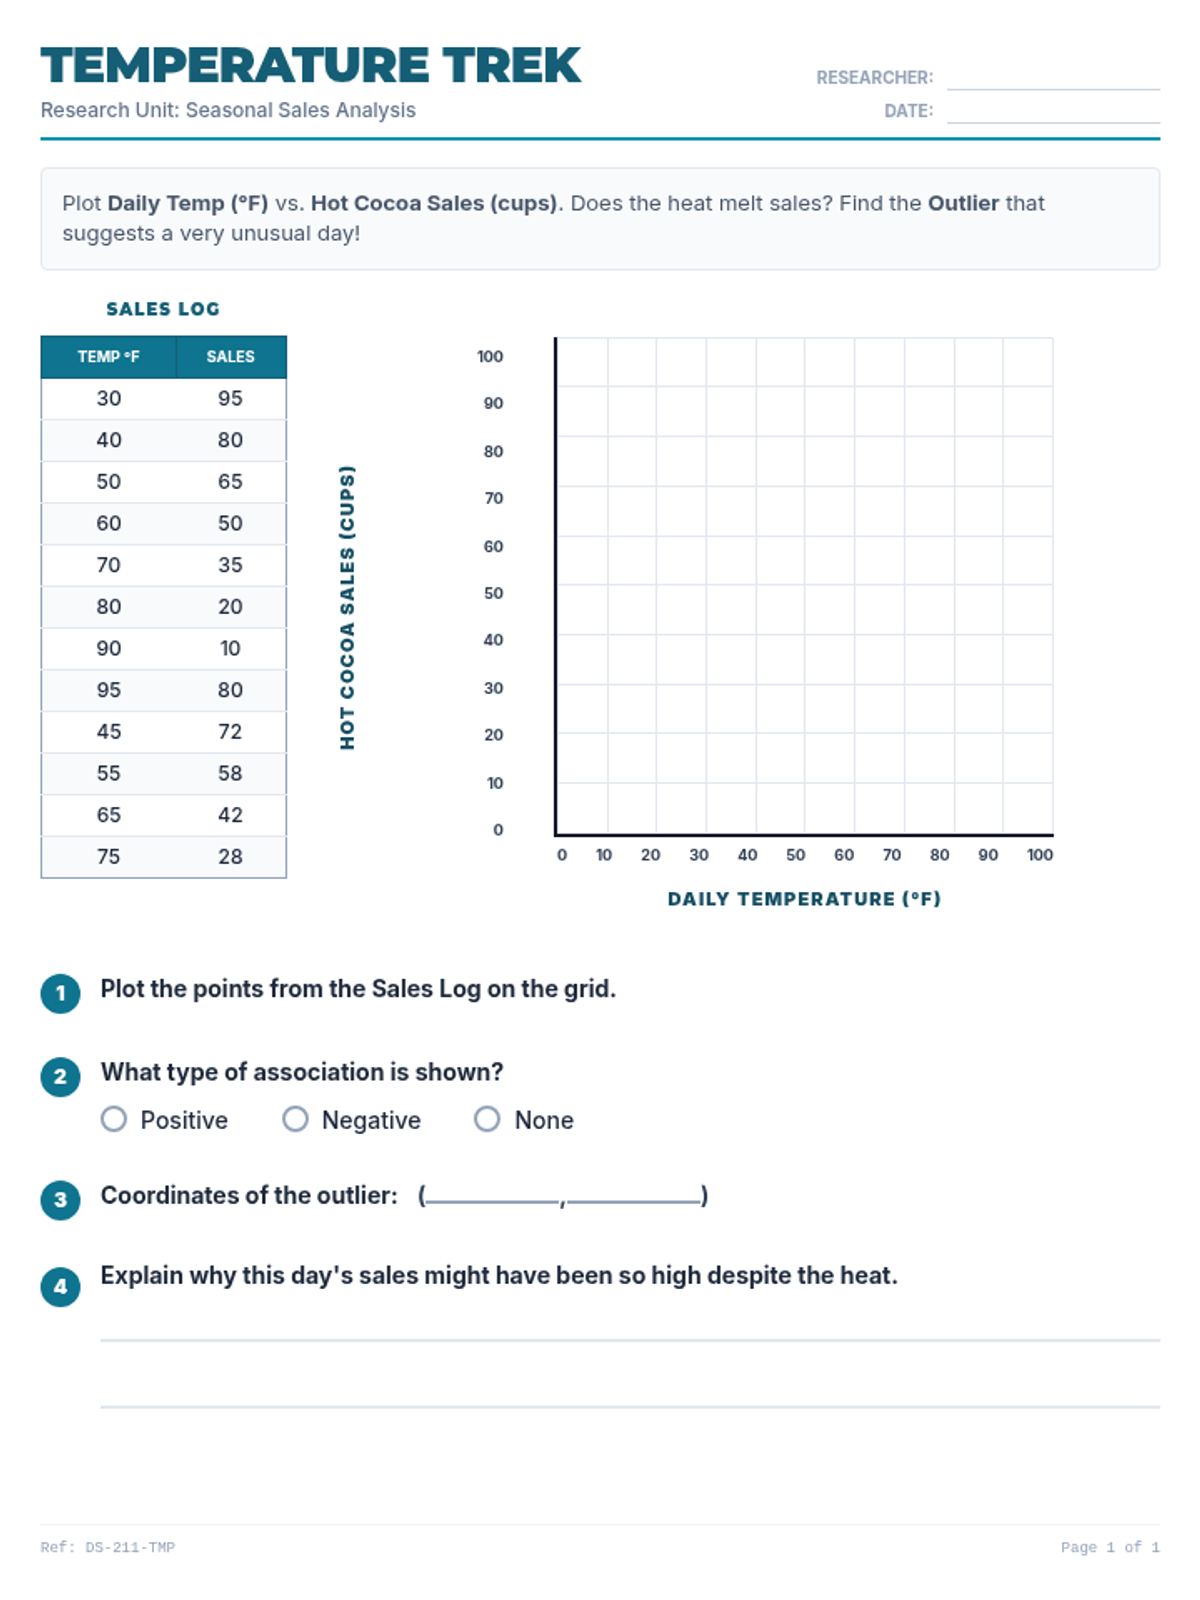
Students learn to plot bivariate data, identify trends, and spot outliers using a real-world scenario of sleep and mood.
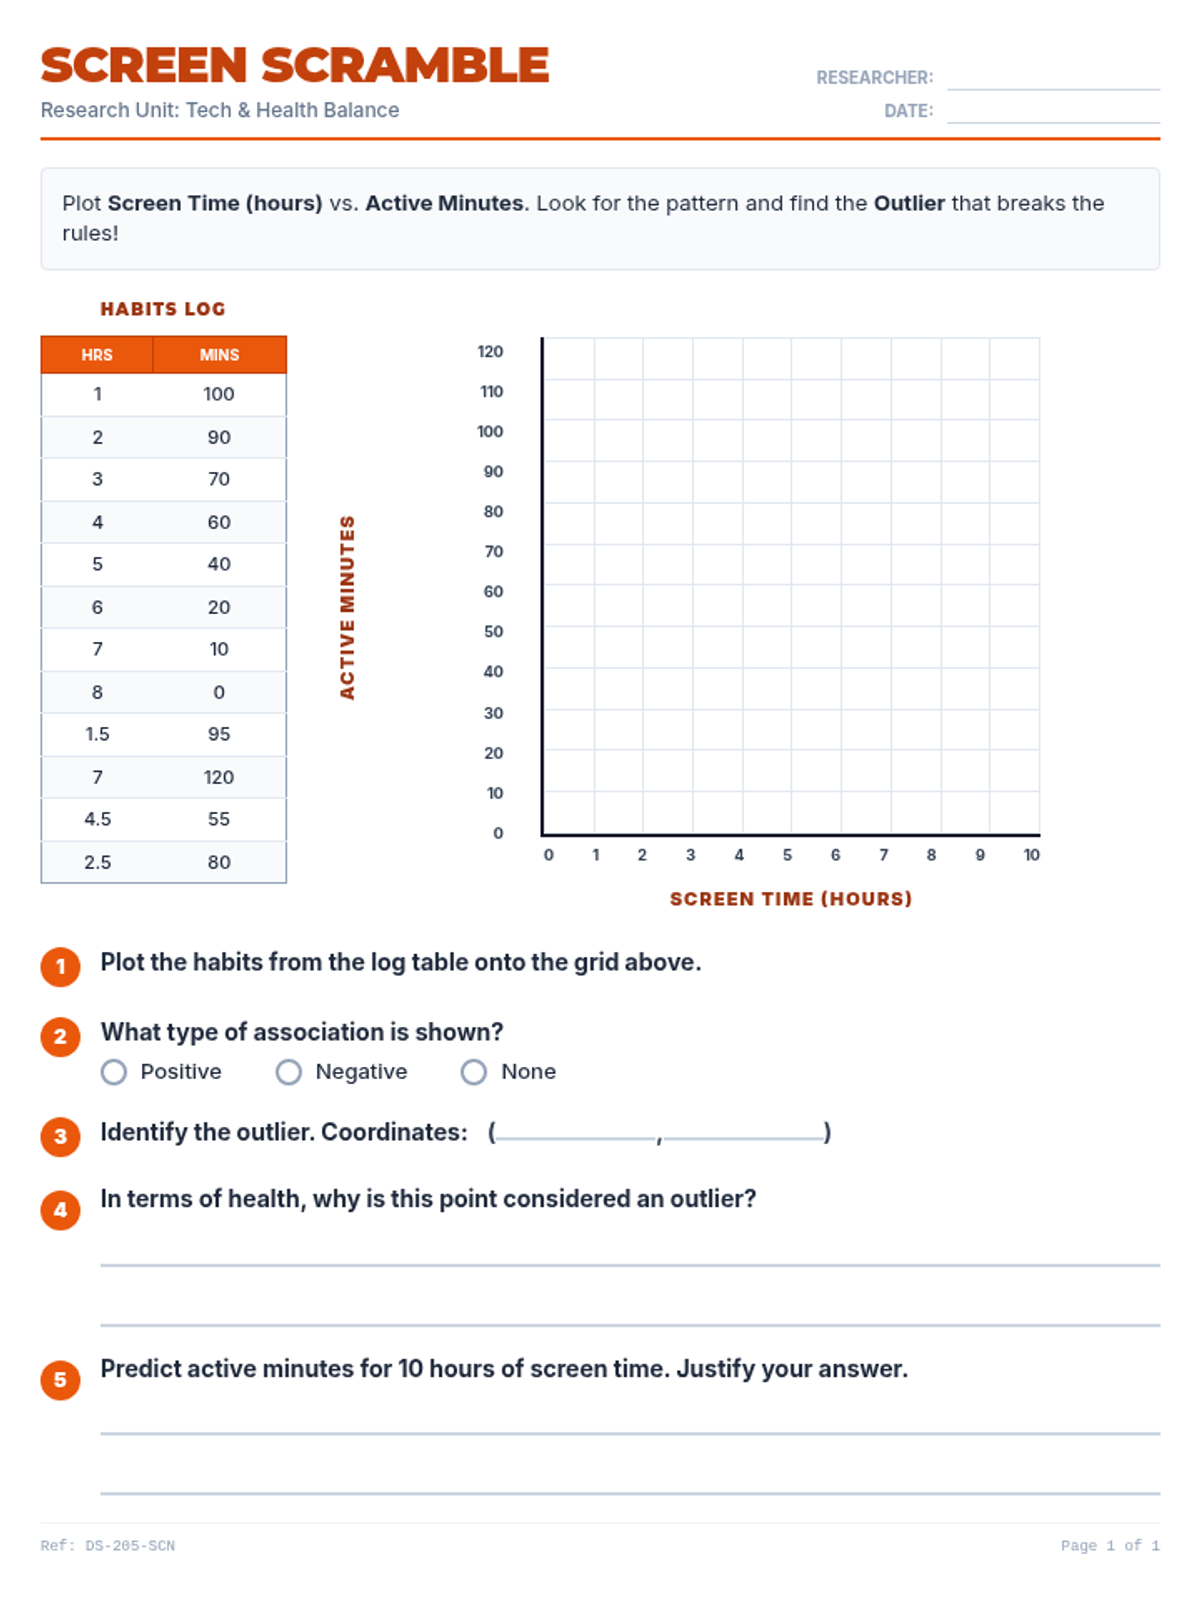
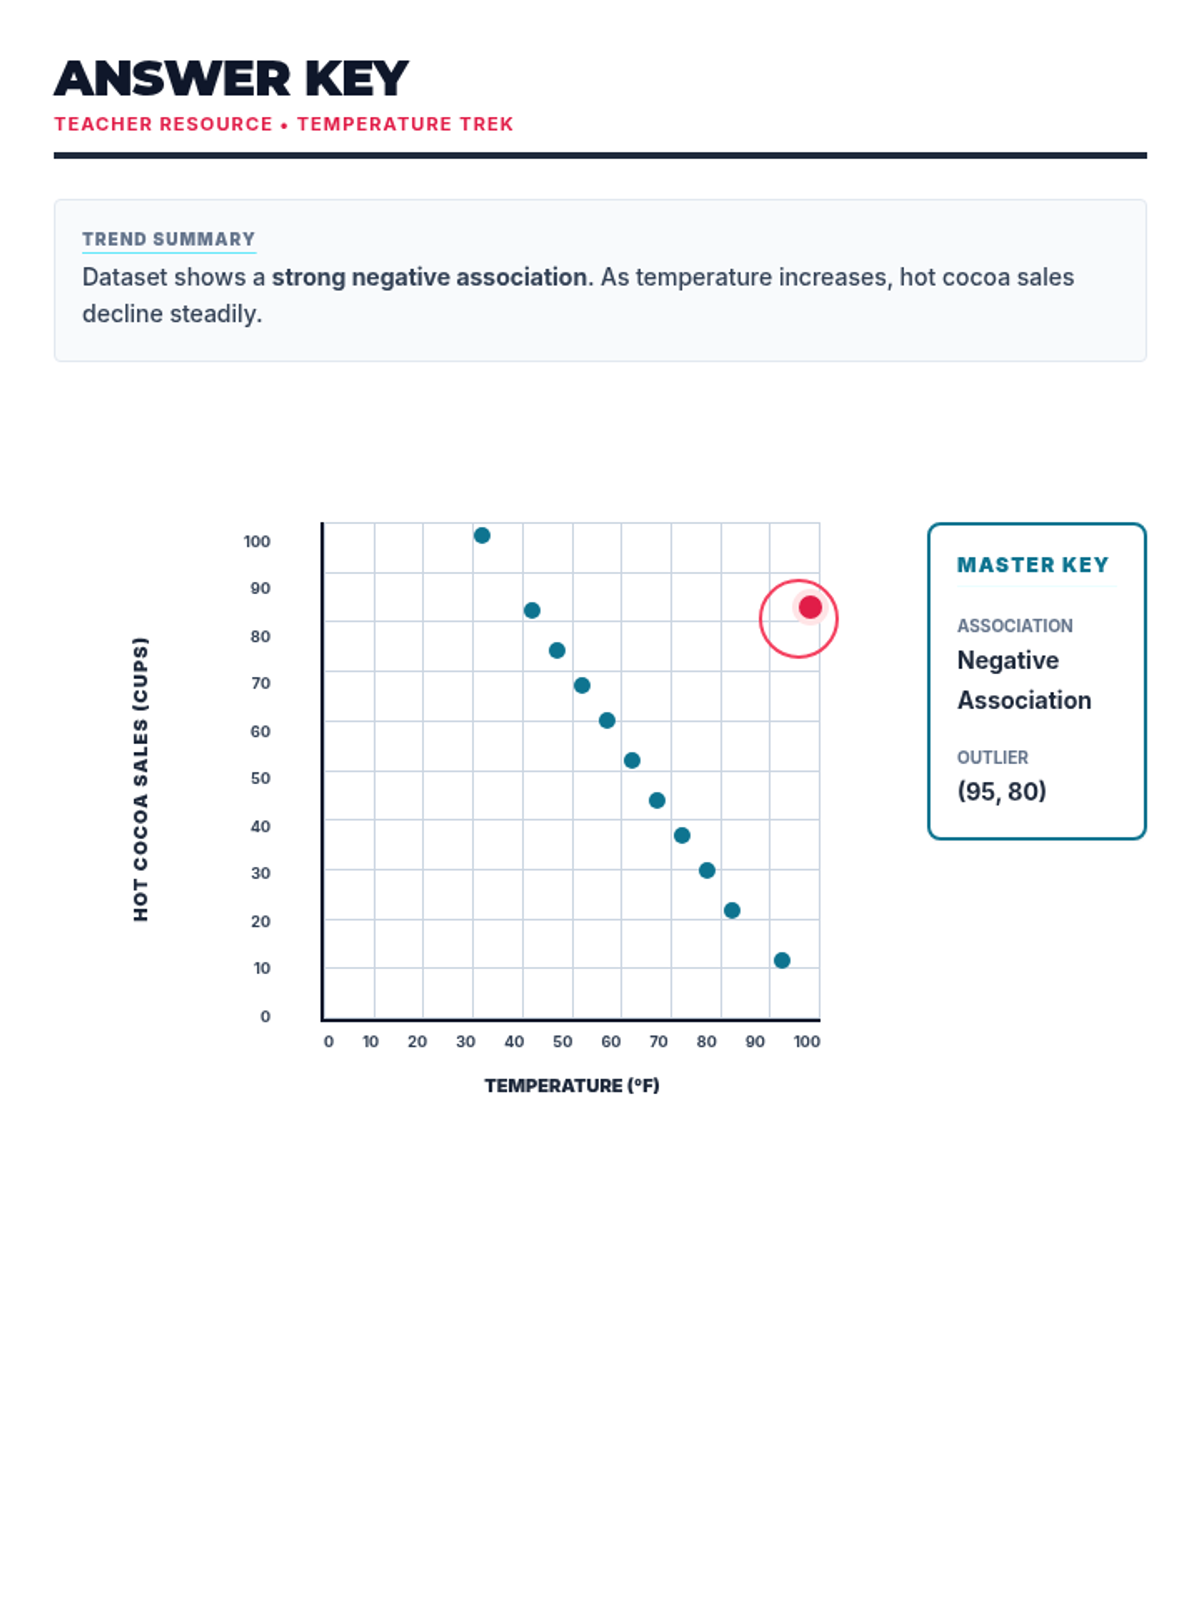
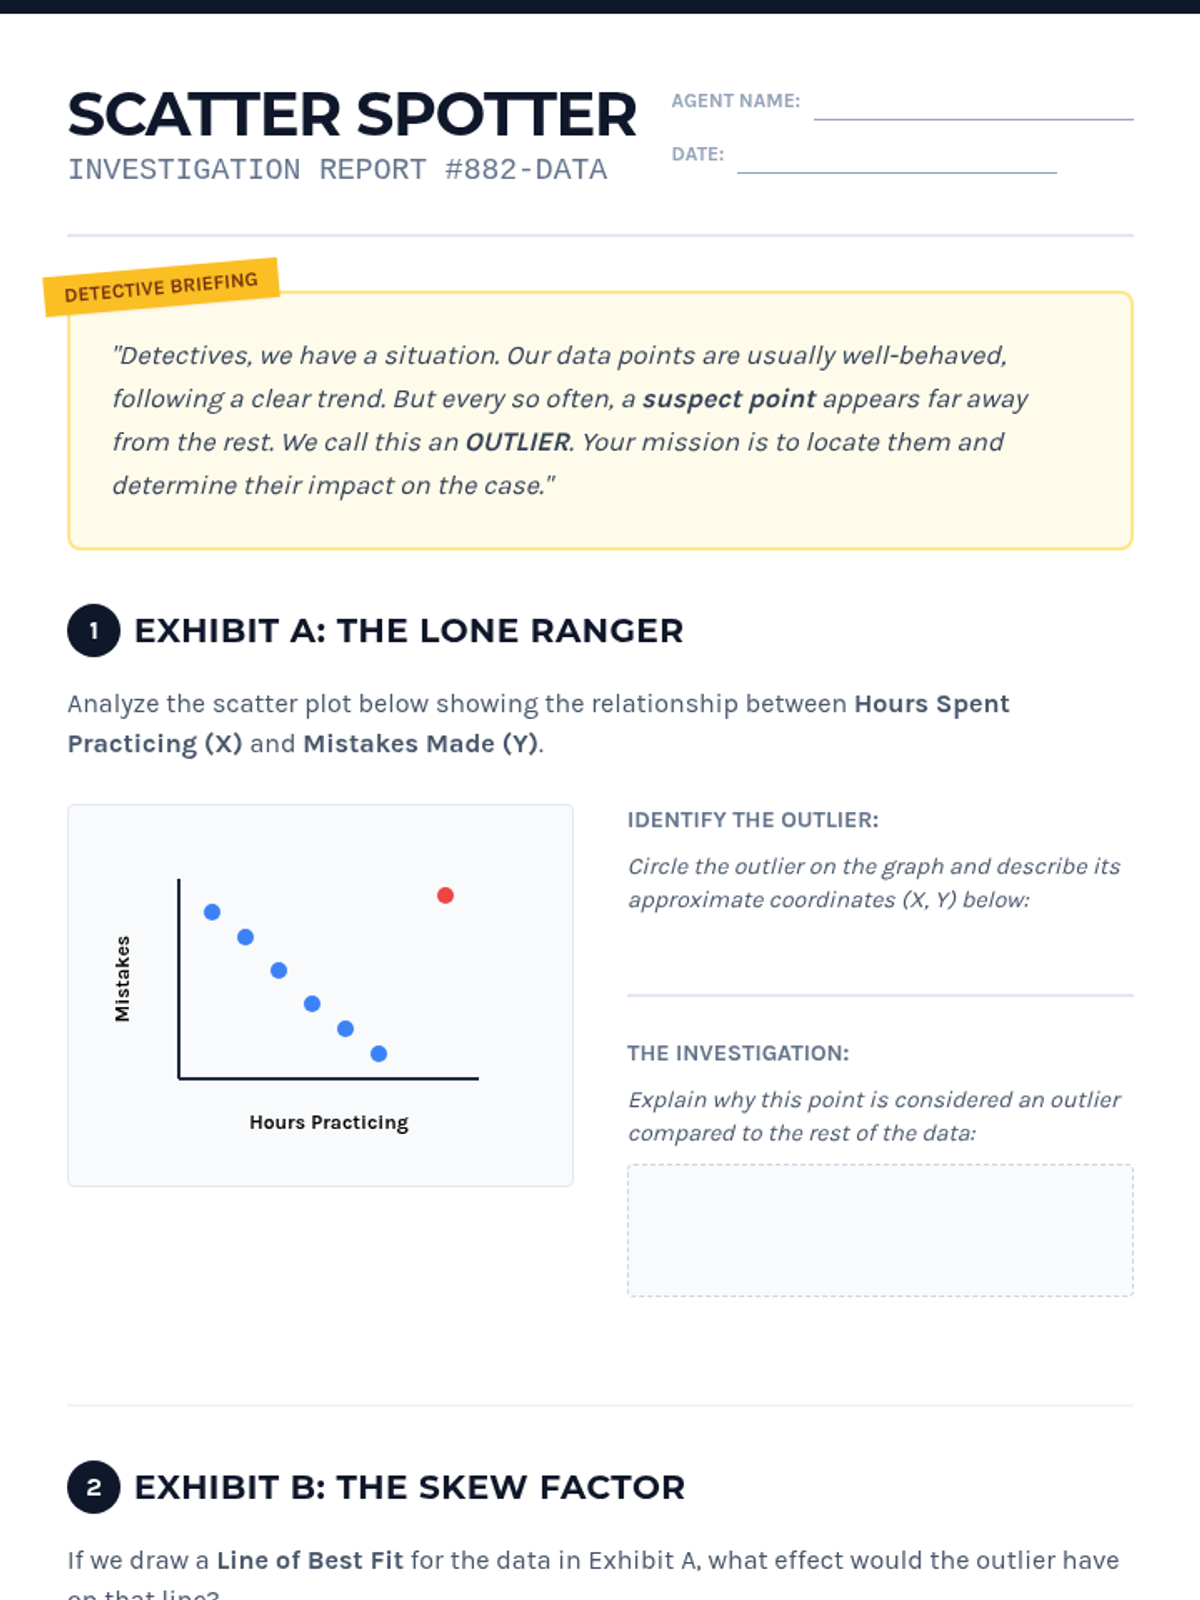
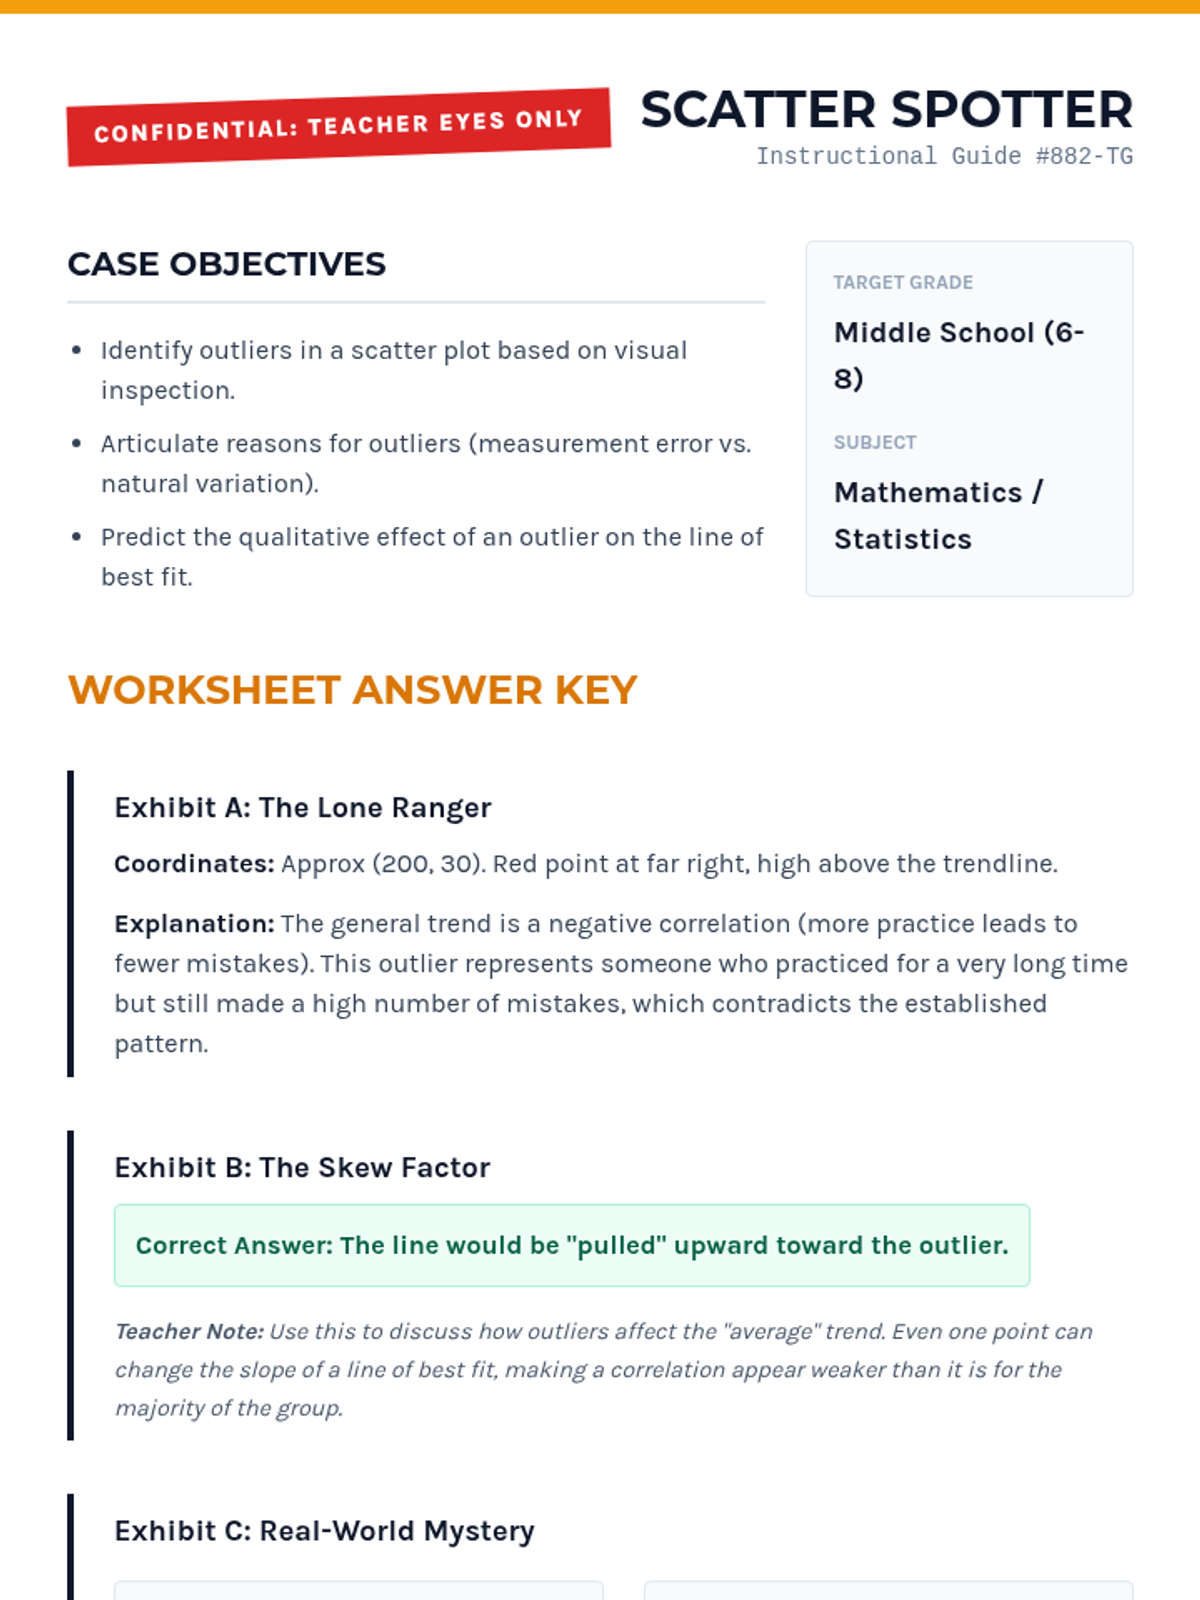
A comprehensive lesson on identifying and analyzing outliers within scatter plots using a 'Data Detective' theme. Students will learn to spot anomalous data points and understand their impact on trends.
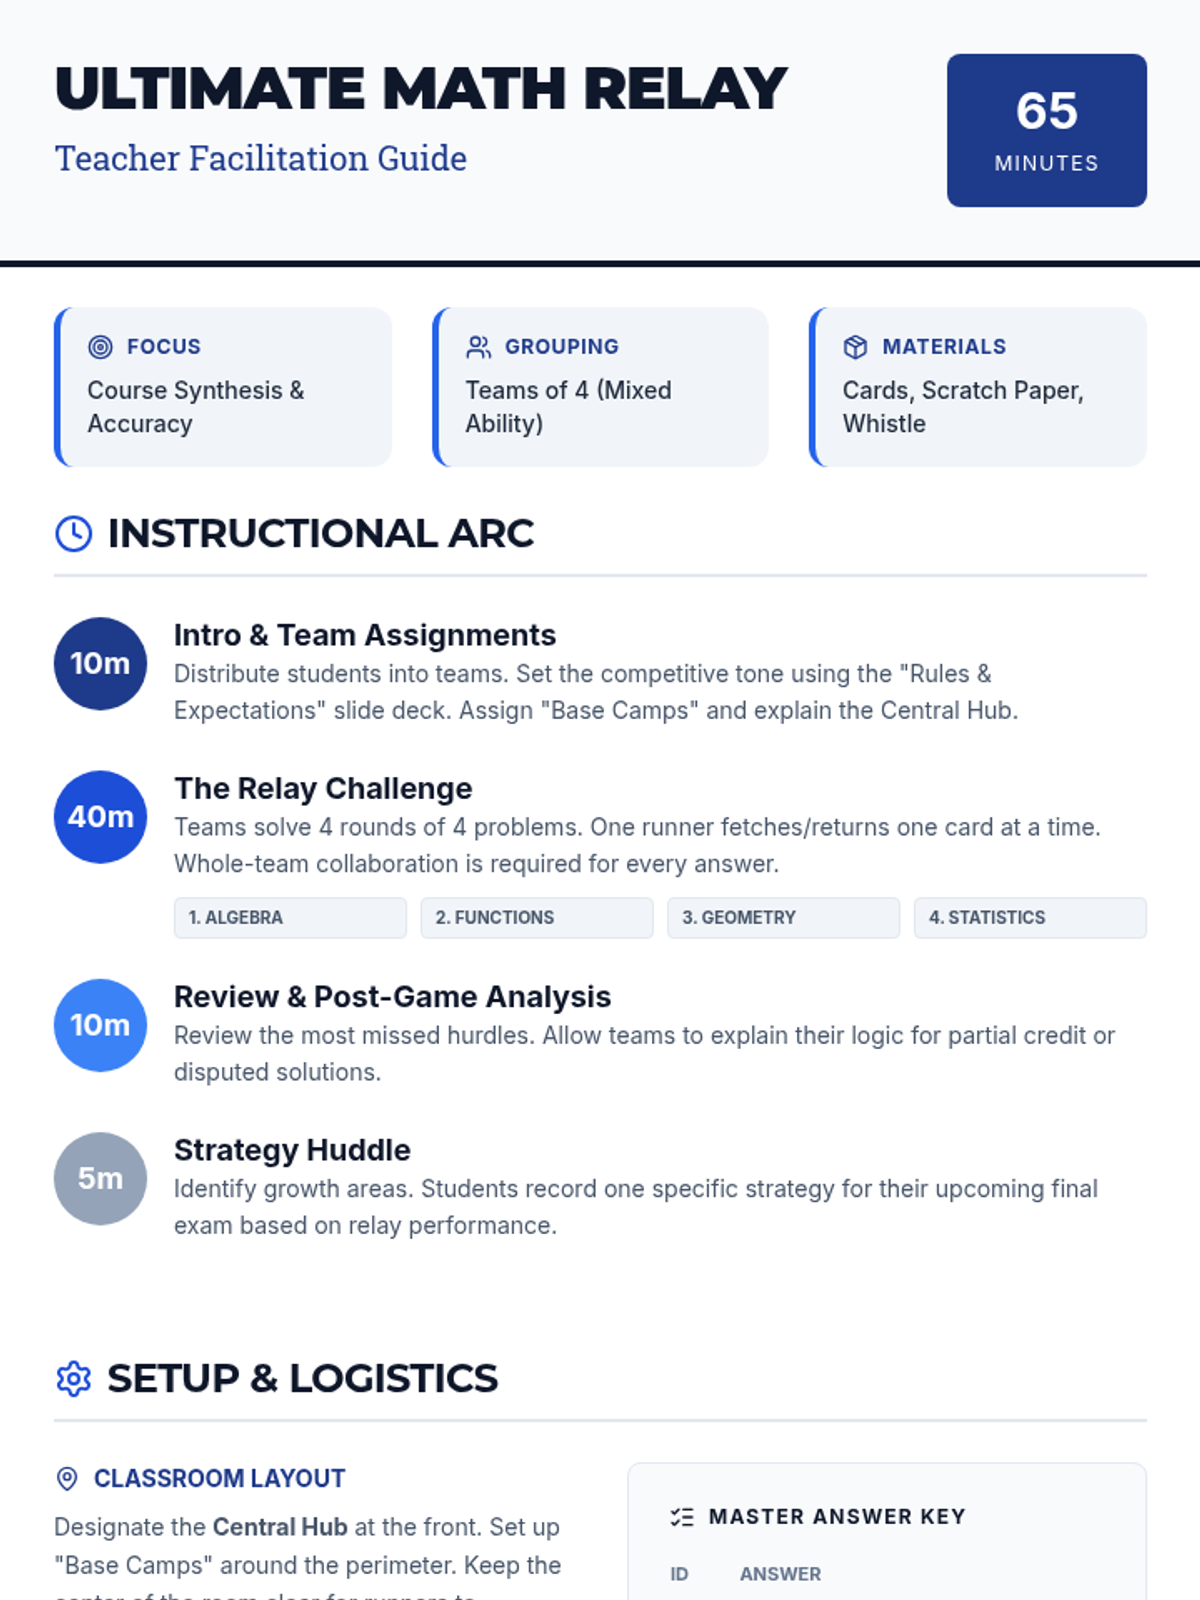
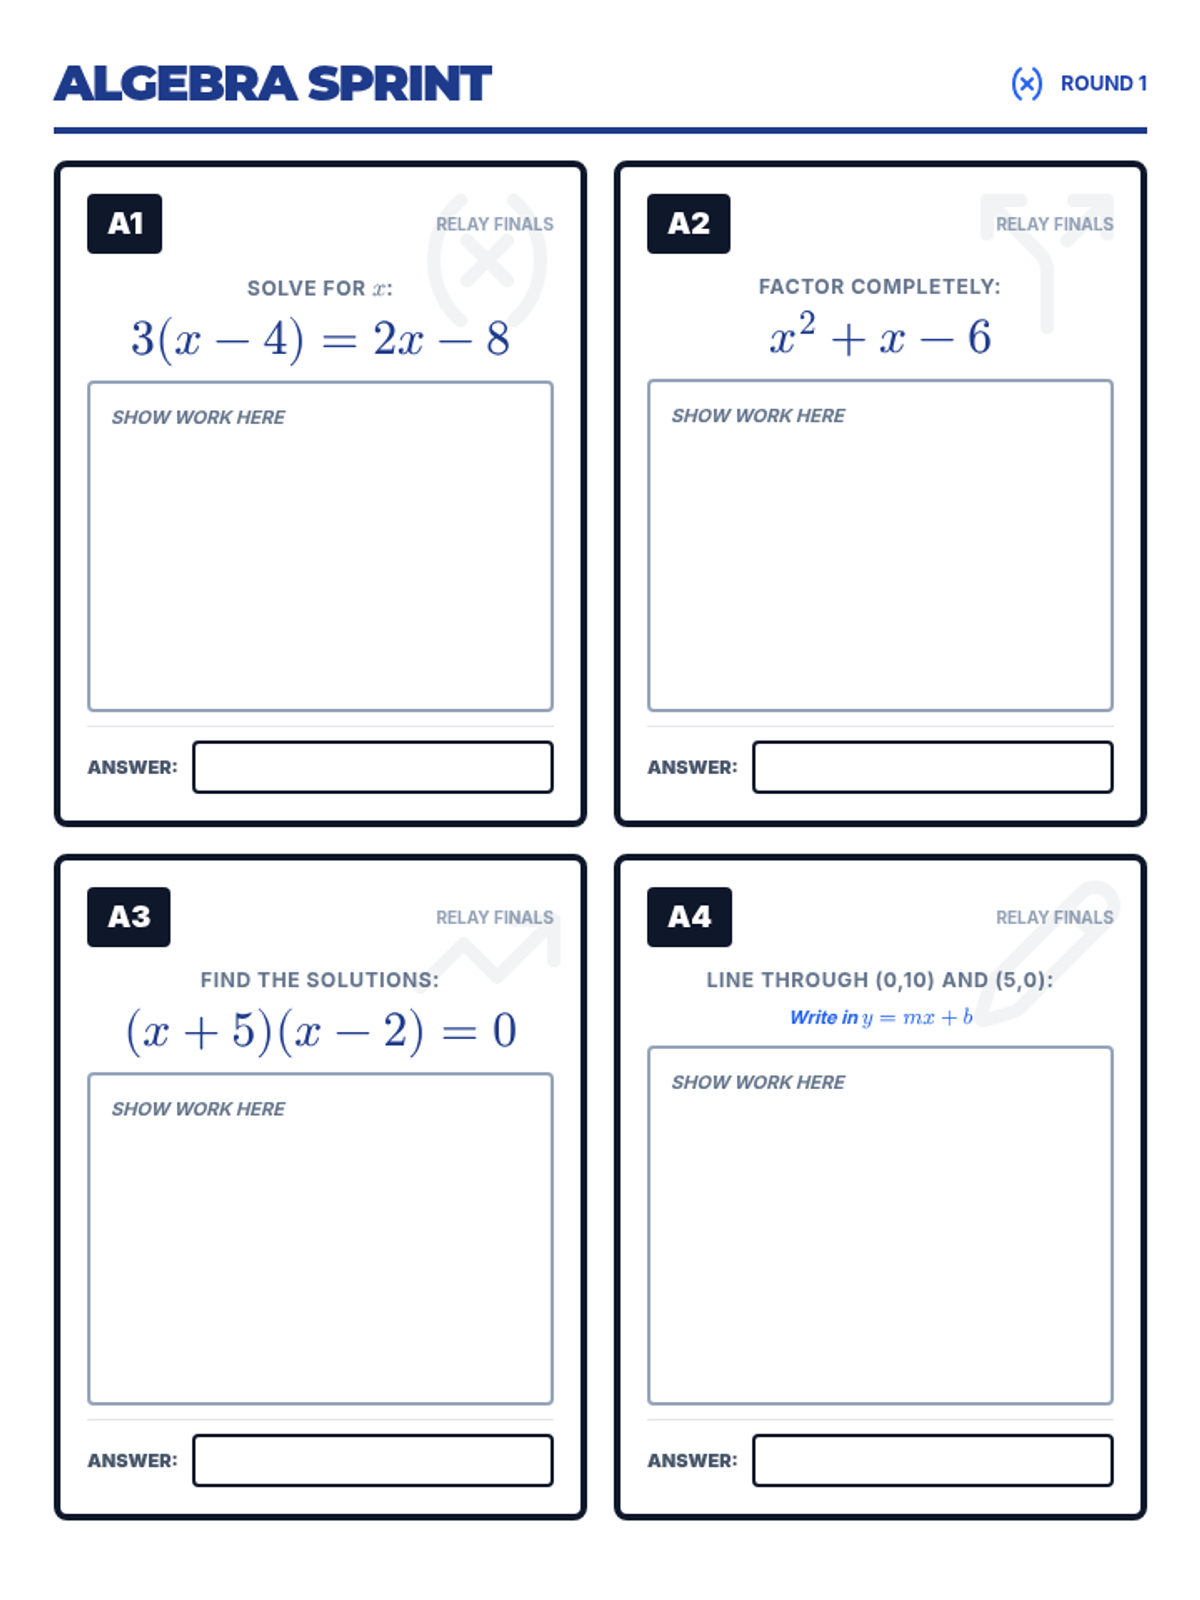
A high-energy, comprehensive review lesson for 9th-grade math students to synthesize their learning through a competitive team relay challenge covering all major domains.
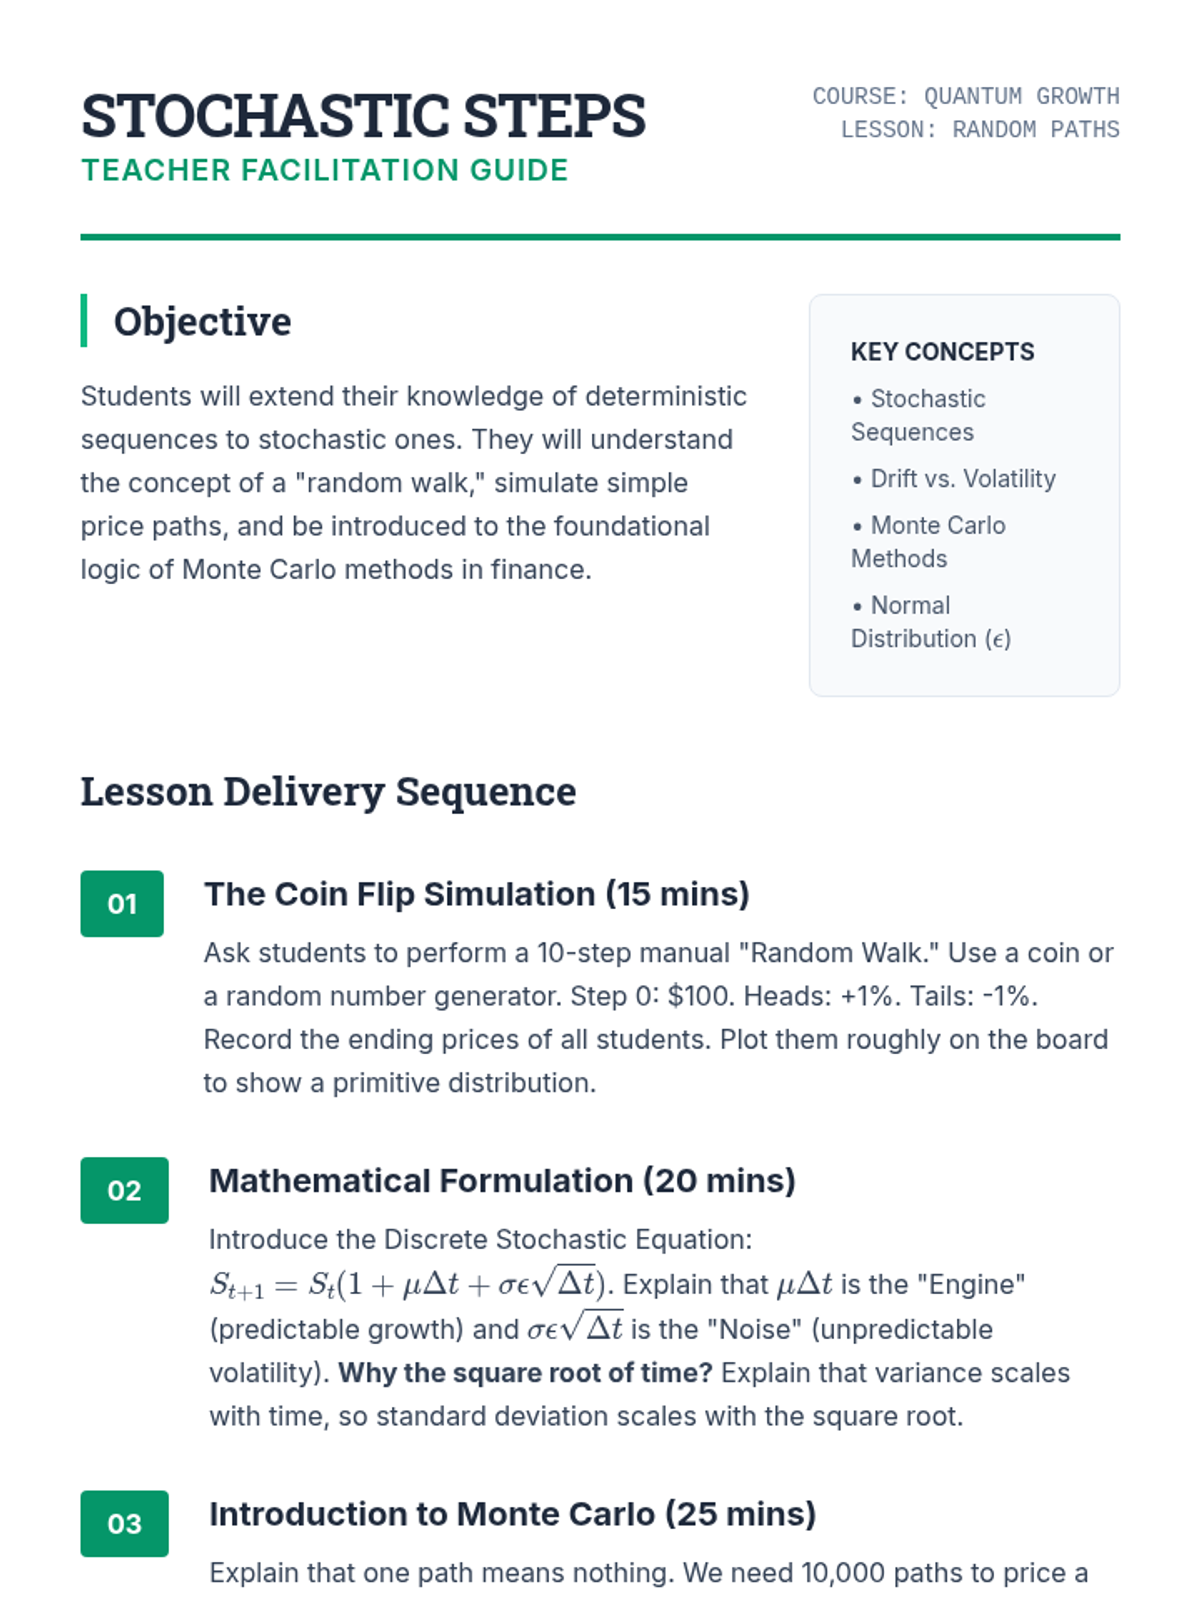
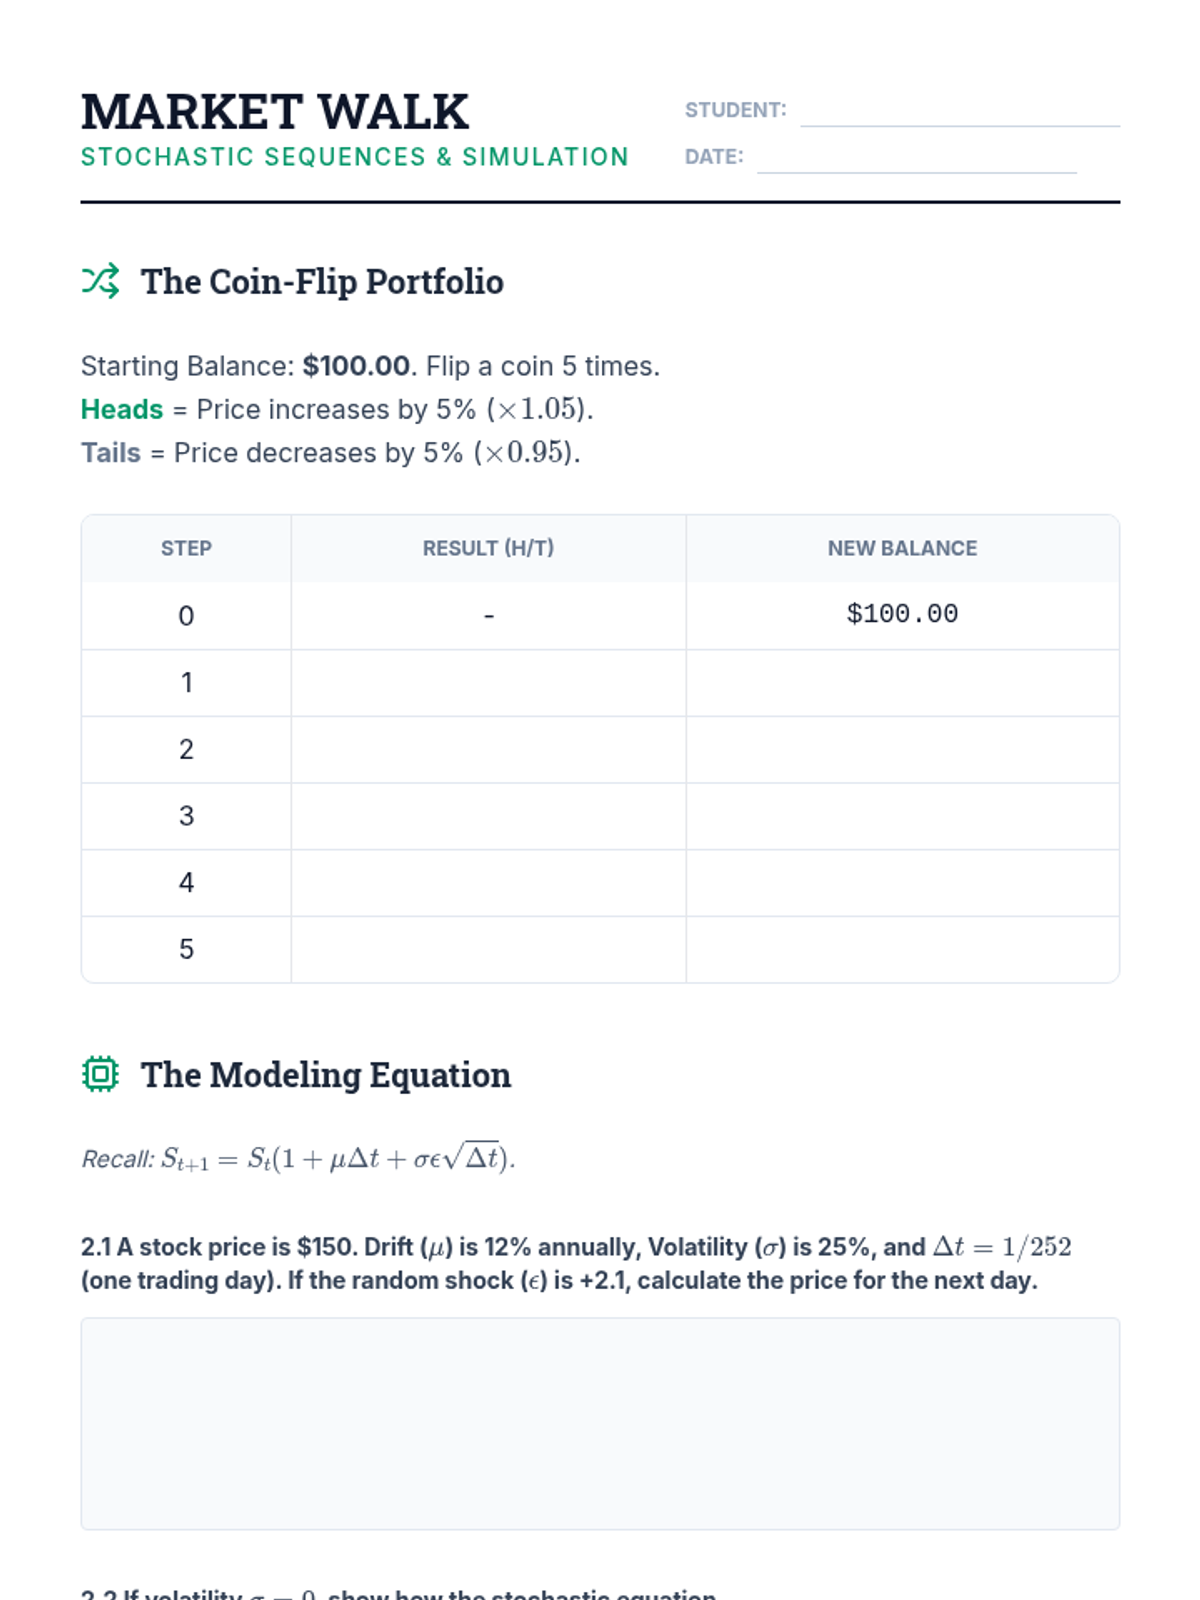
The sequence concludes with an introduction to stochastic sequences, simulating random walks to model stock price movements.
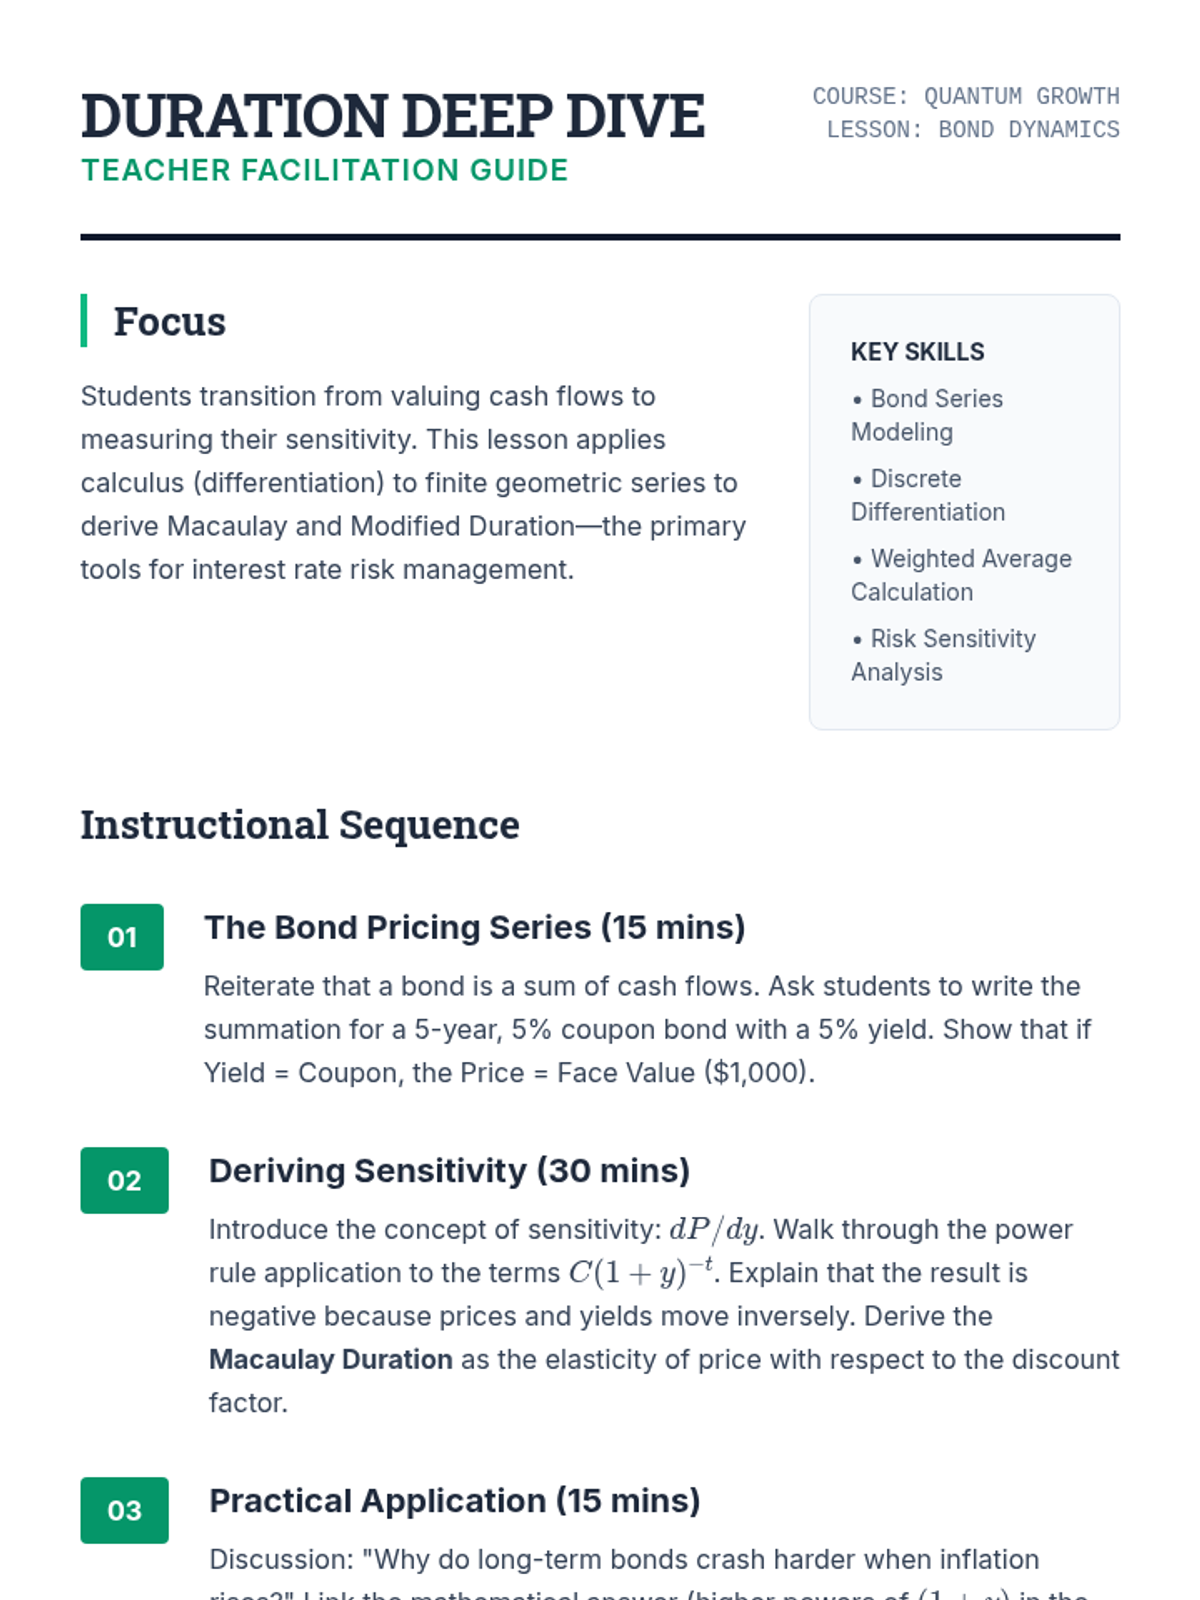
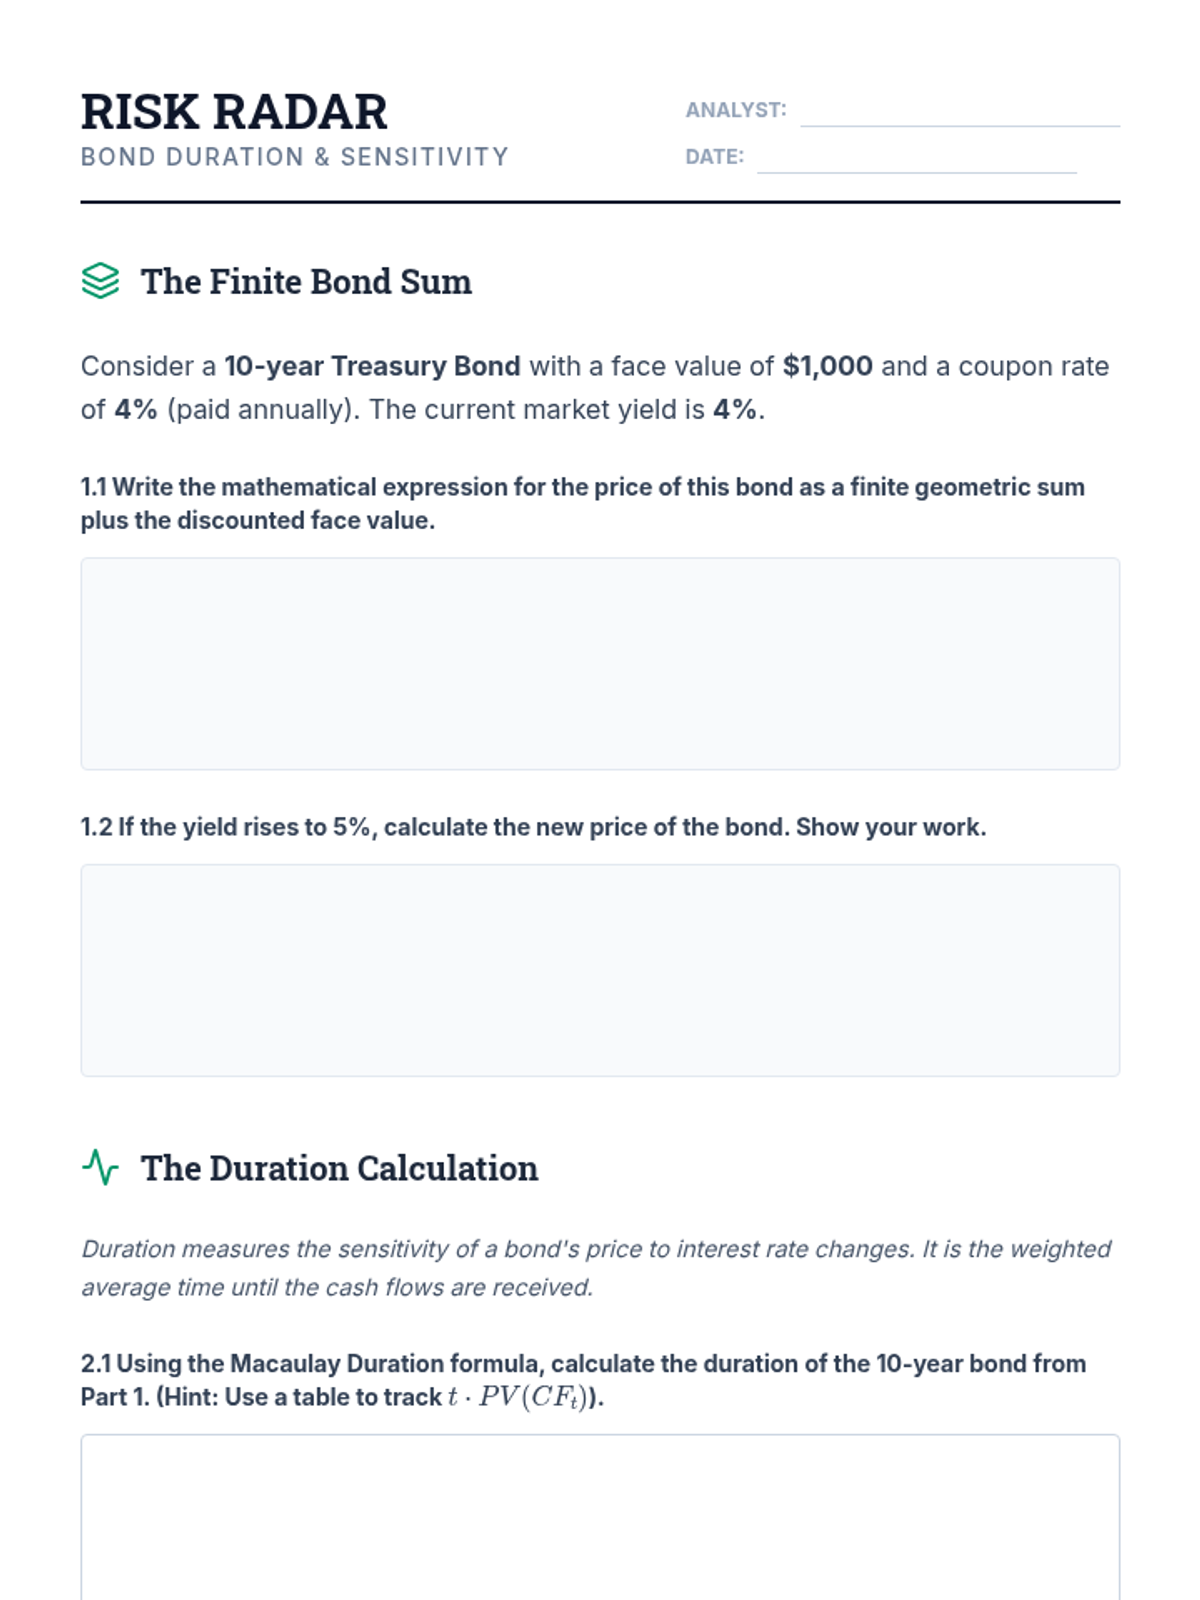
Students analyze bonds as series of cash flows, using differentiation to calculate Duration and assess interest rate risk.
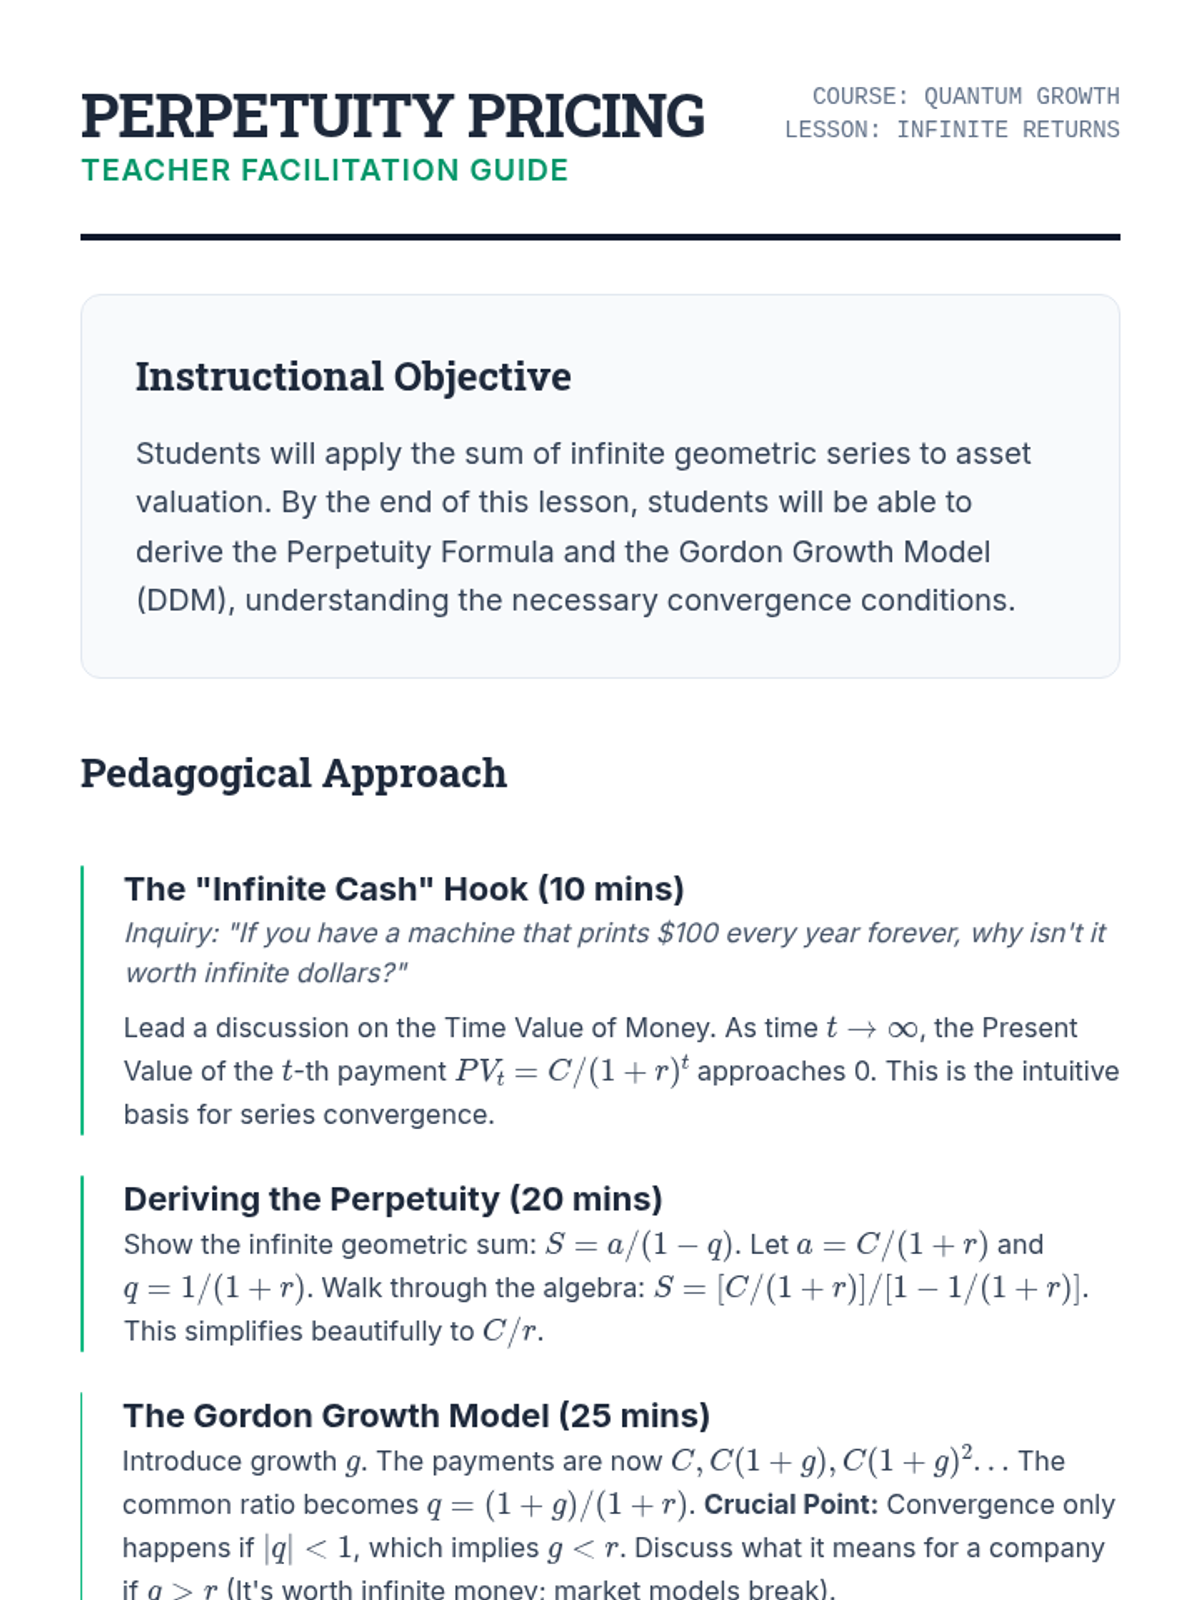
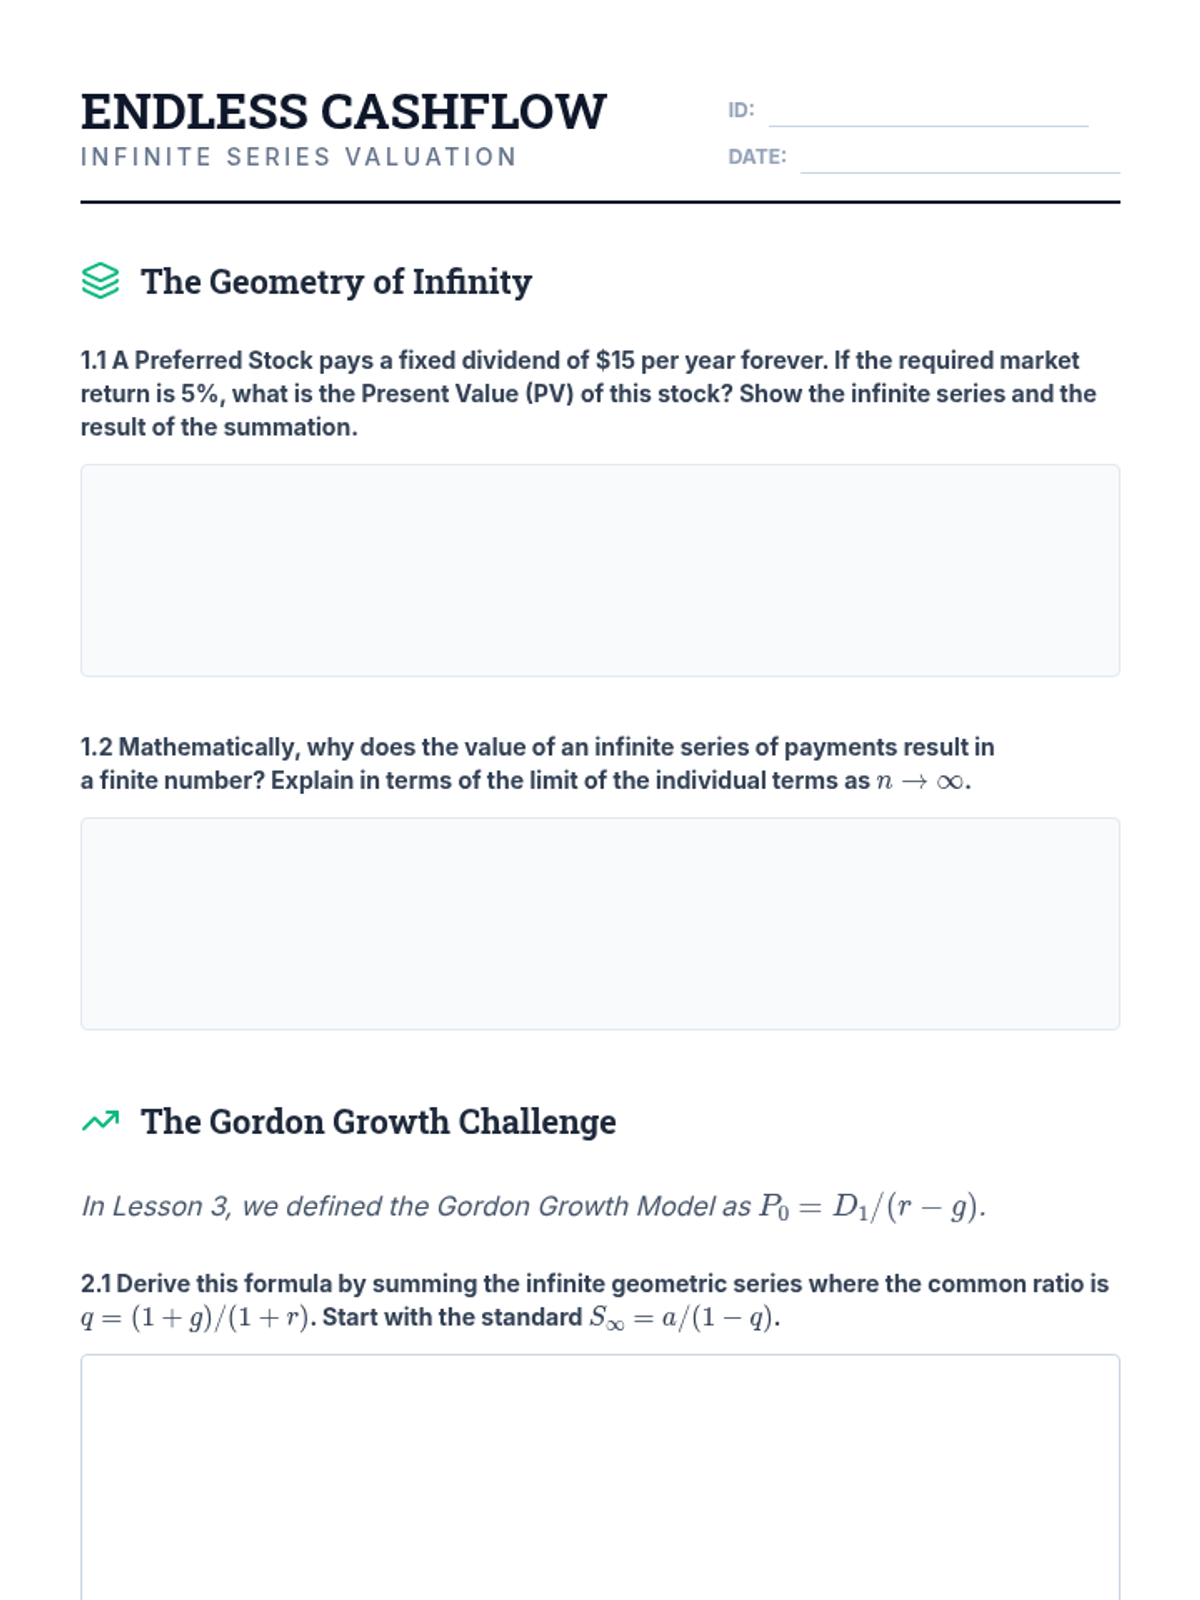
This lesson explores the valuation of infinite horizons, applying geometric series convergence to price perpetuities and the Dividend Discount Model.
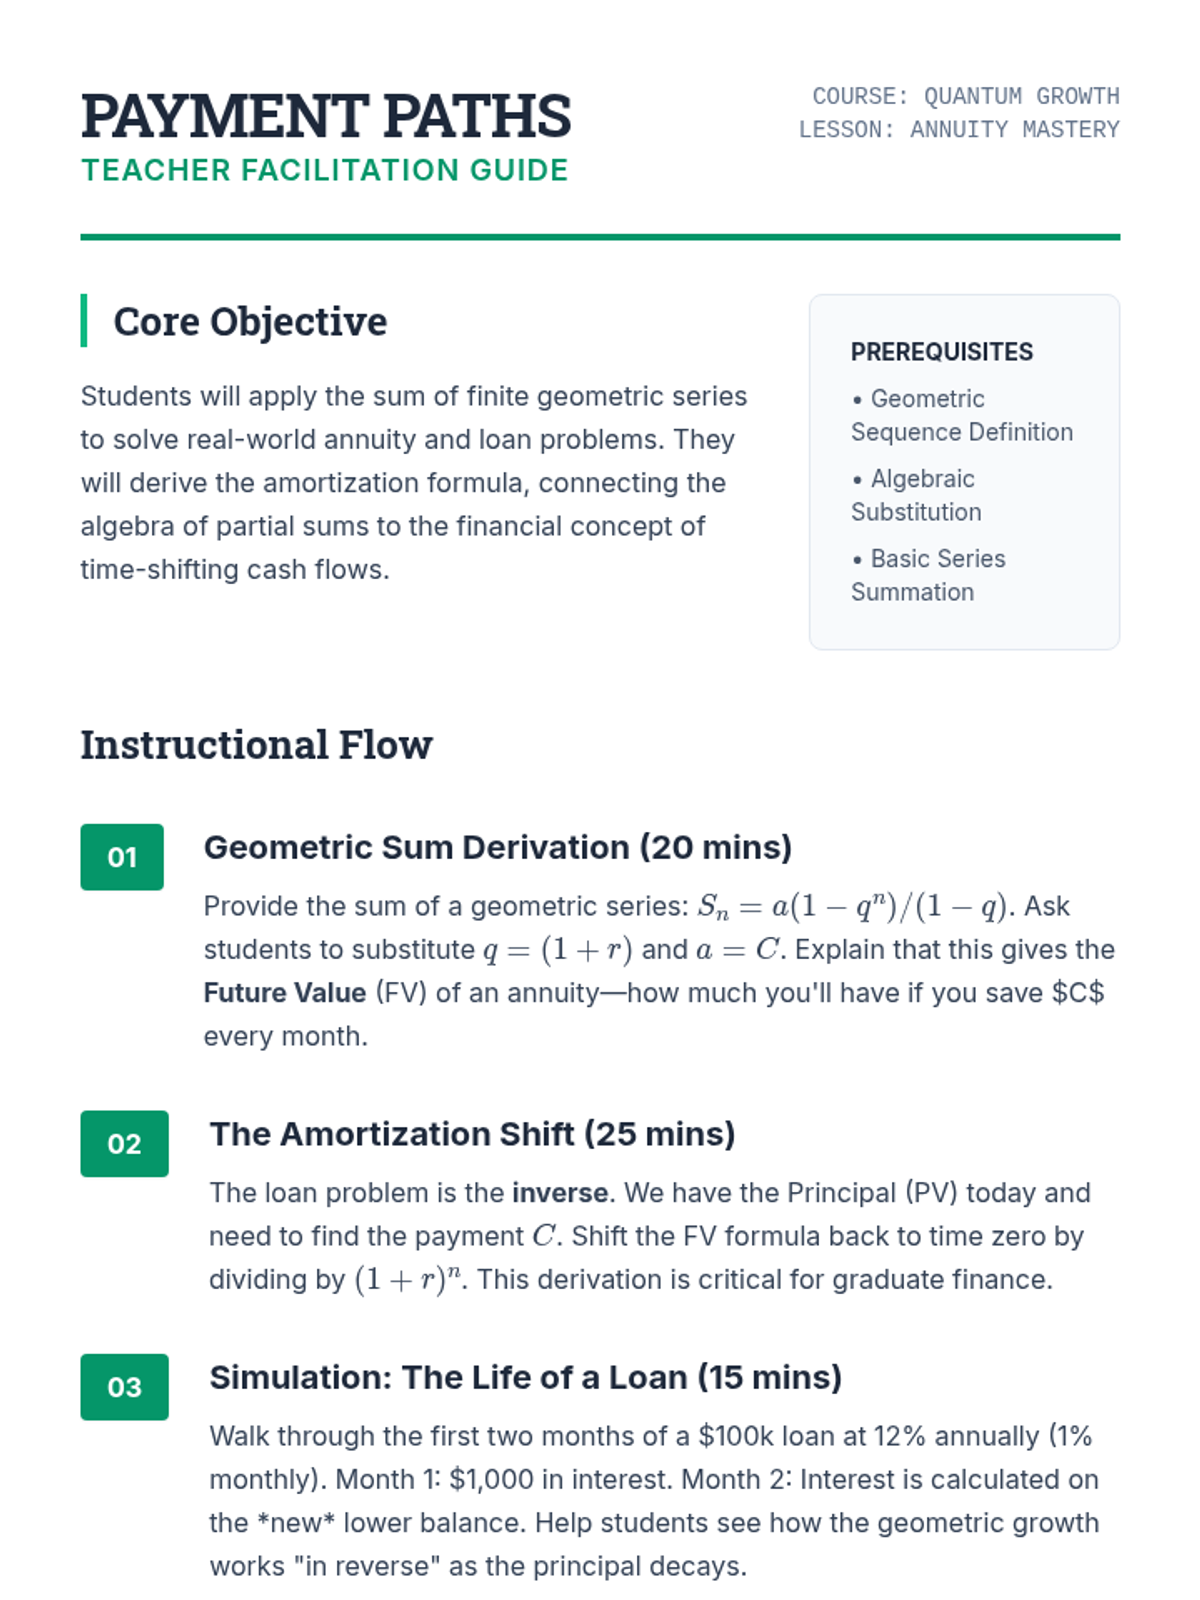
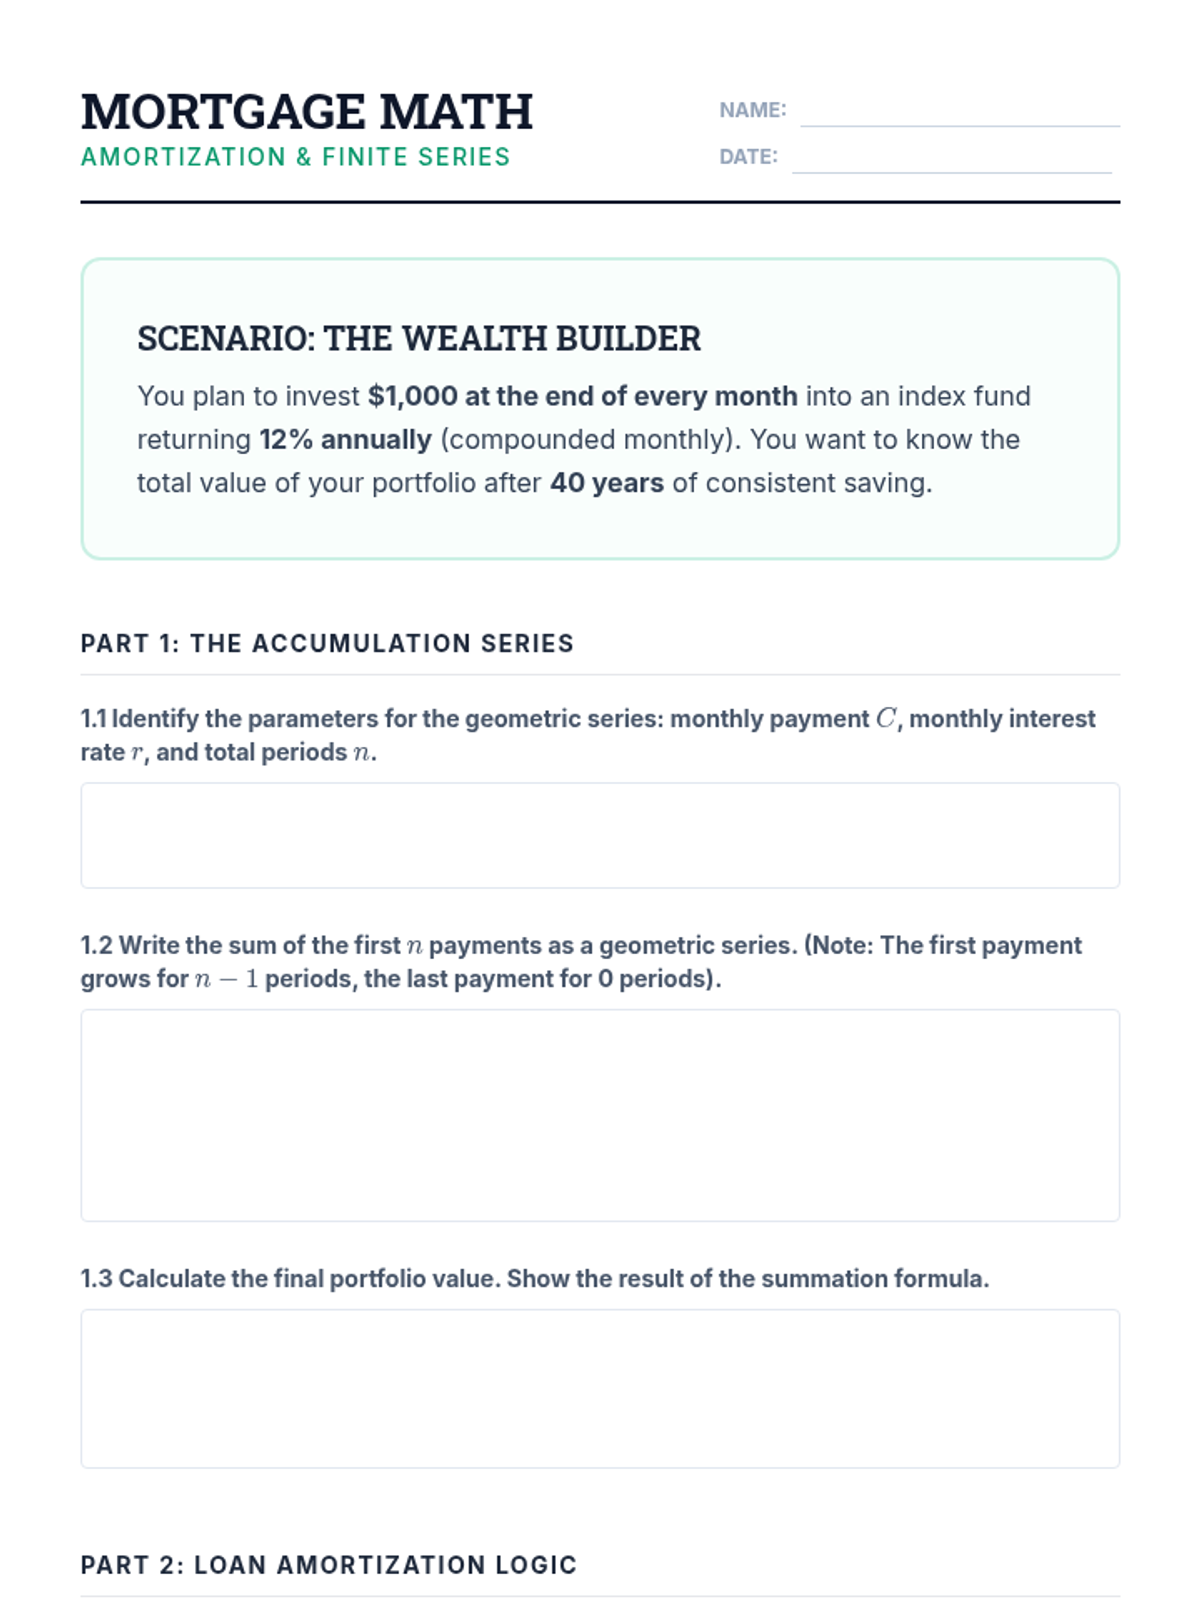
Learners model loan payments and savings plans using finite geometric series, deriving amortization formulas for mortgages and annuities.
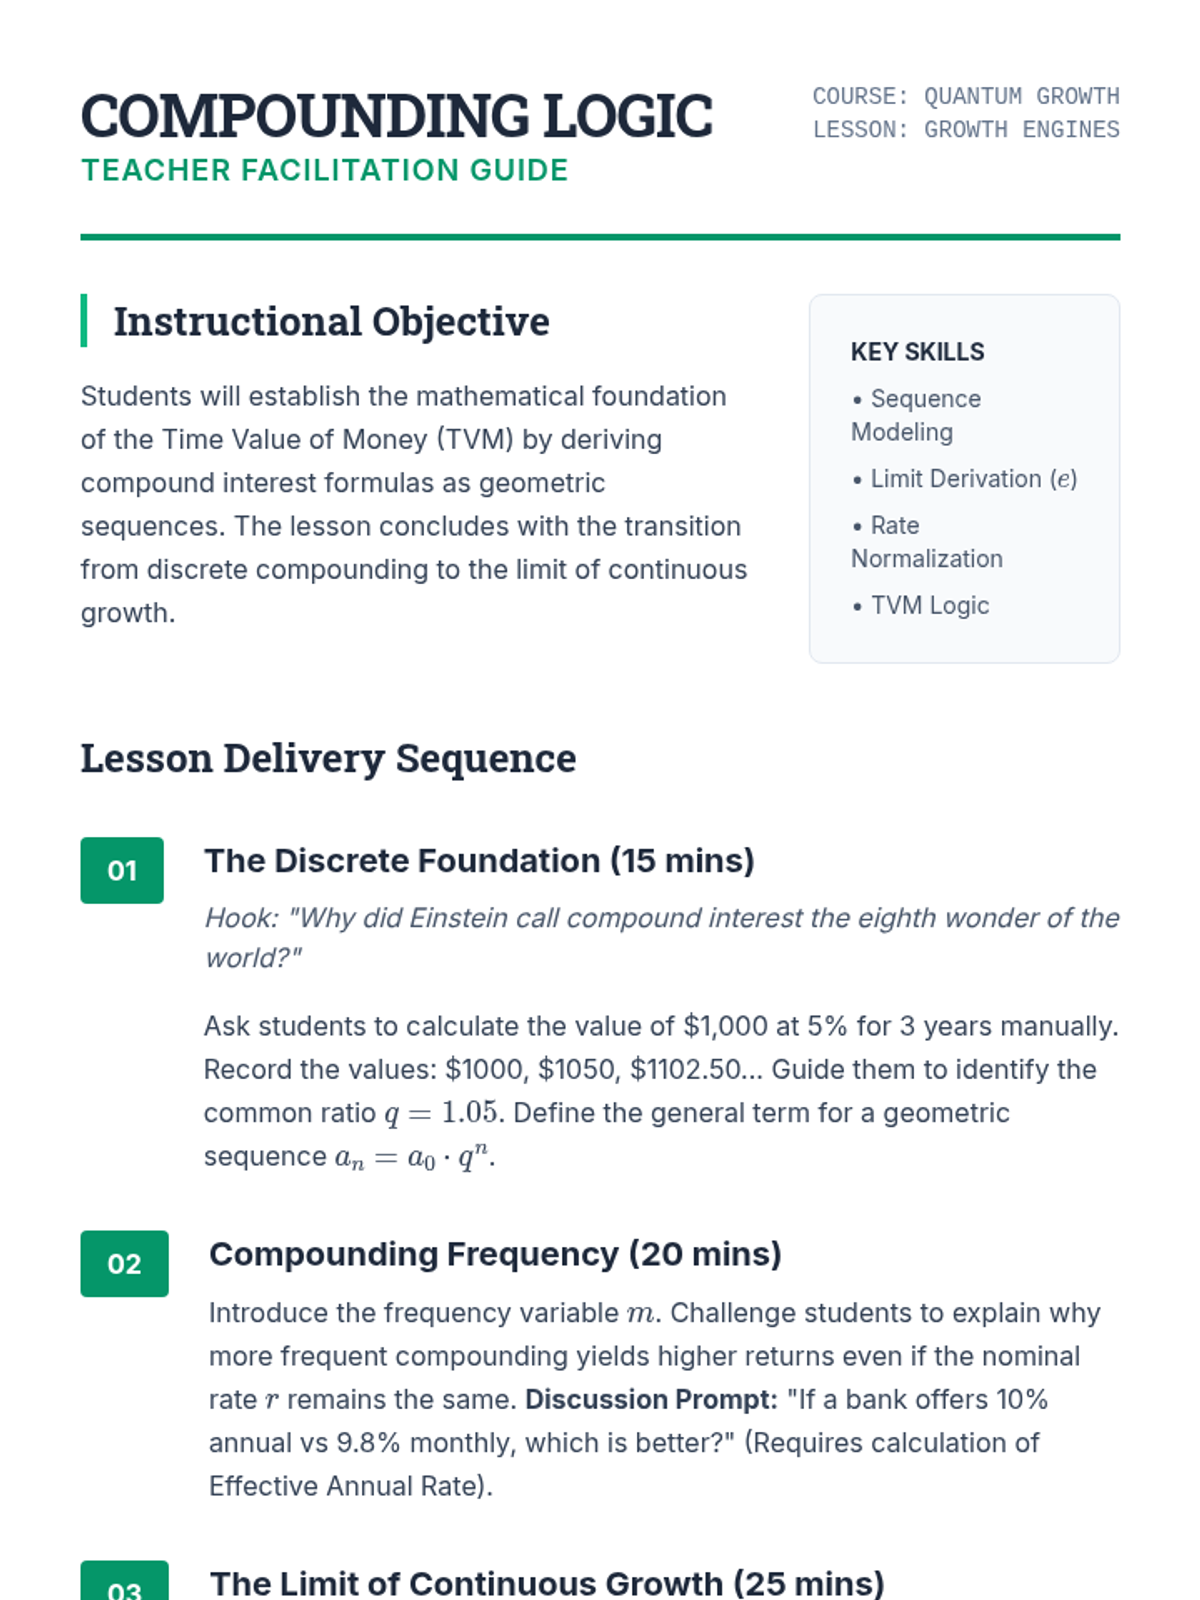
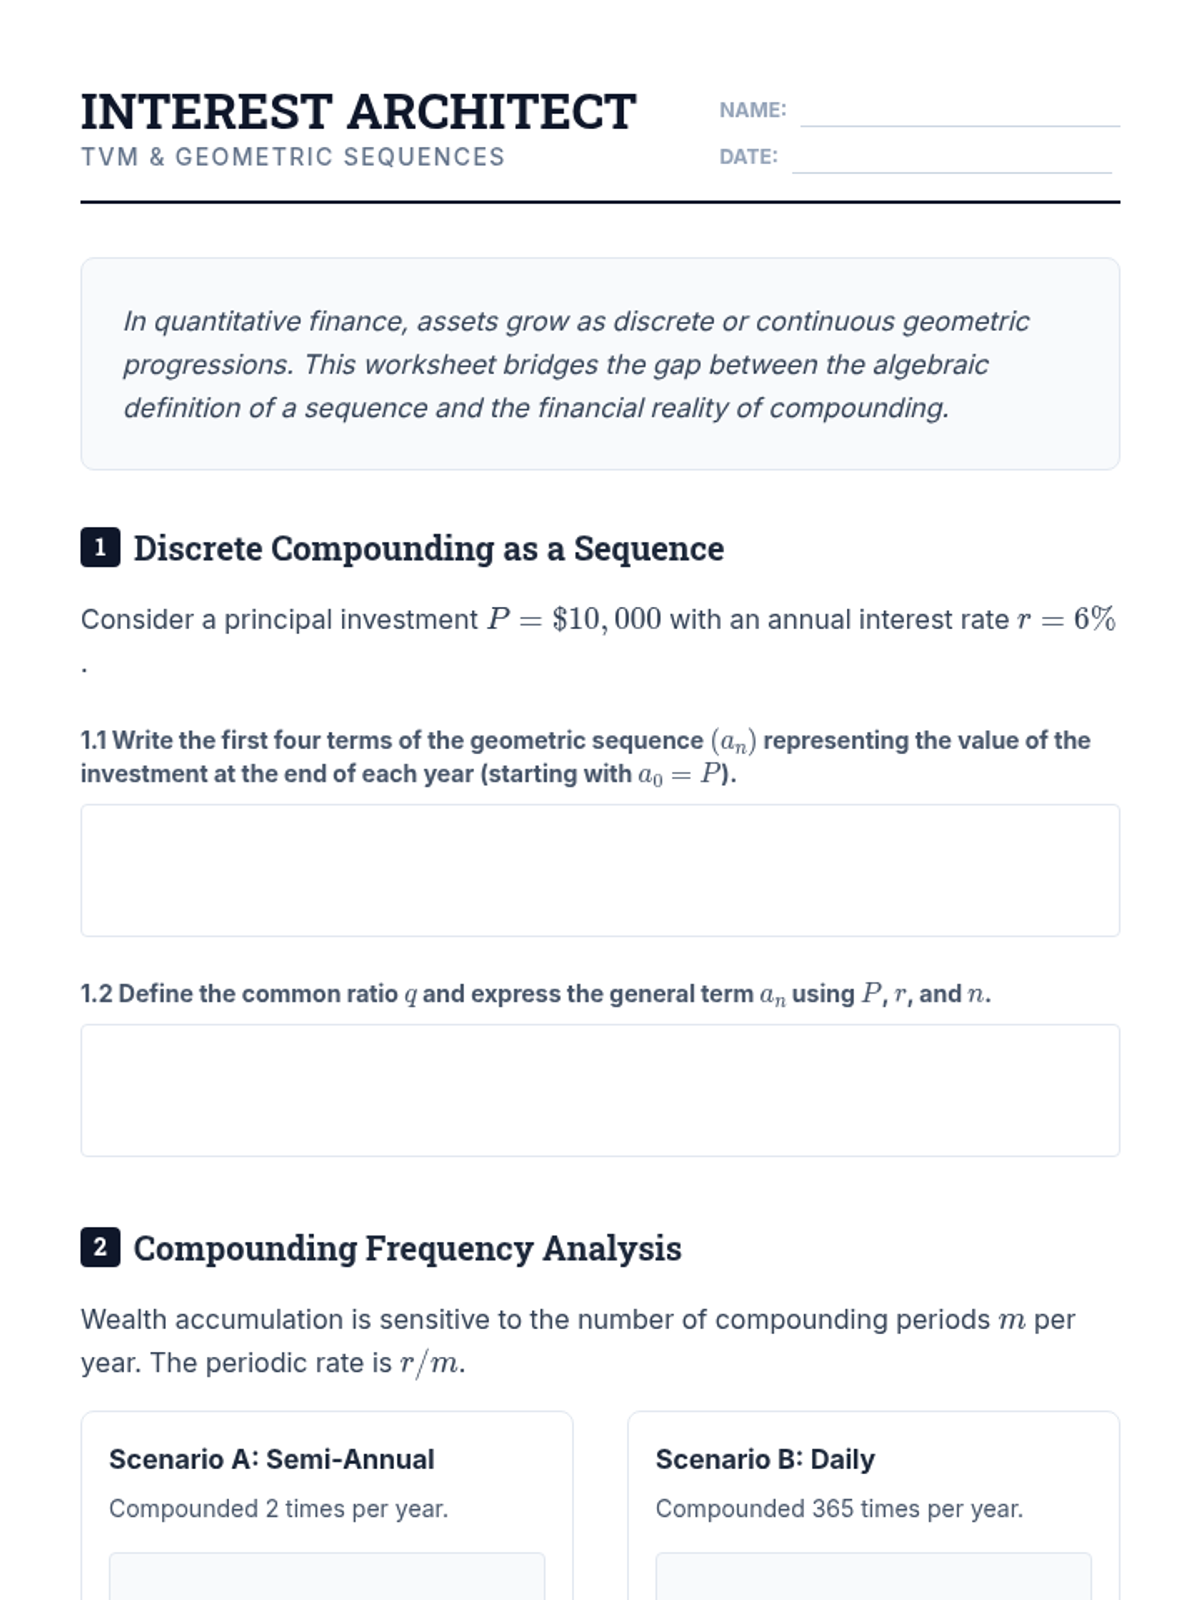
Students derive the compound interest formulas as geometric sequences, exploring the impact of compounding frequency and the limit as it approaches infinity (continuous compounding).
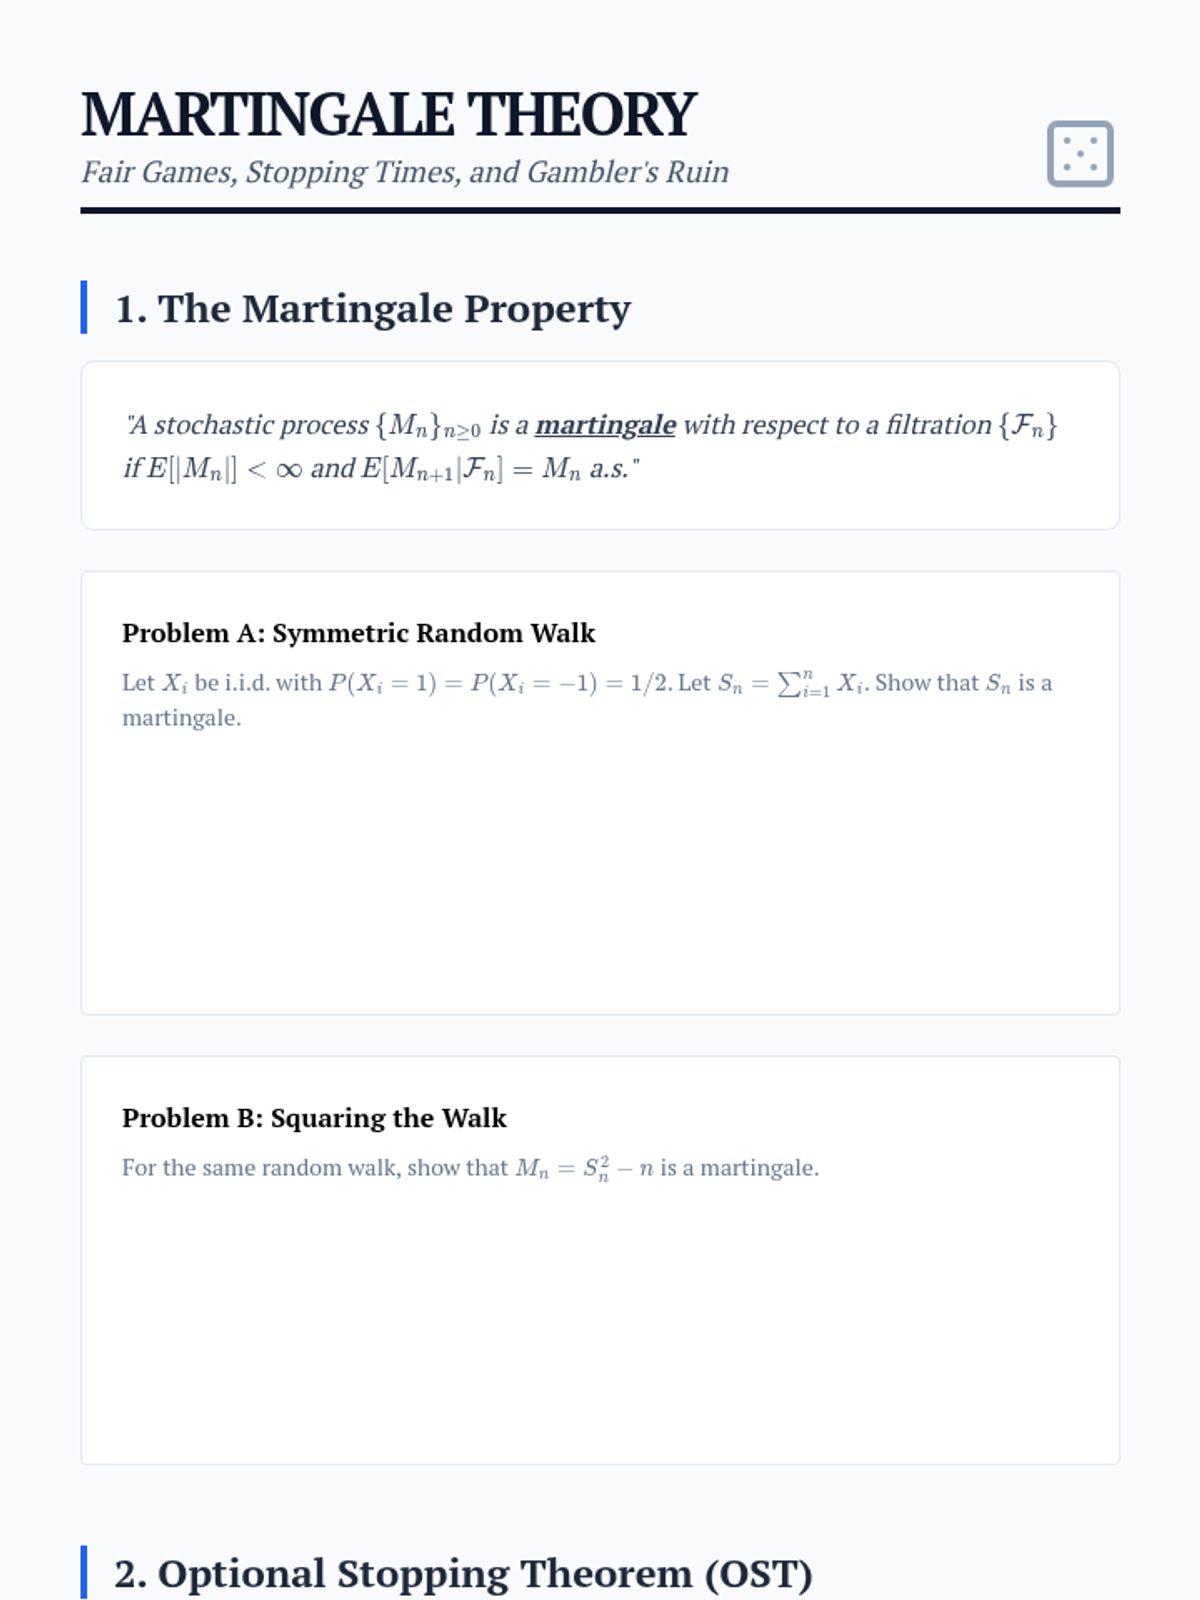
Introduction to Martingales and the Optional Stopping Theorem, applying these concepts to fair games and boundary crossing probabilities.
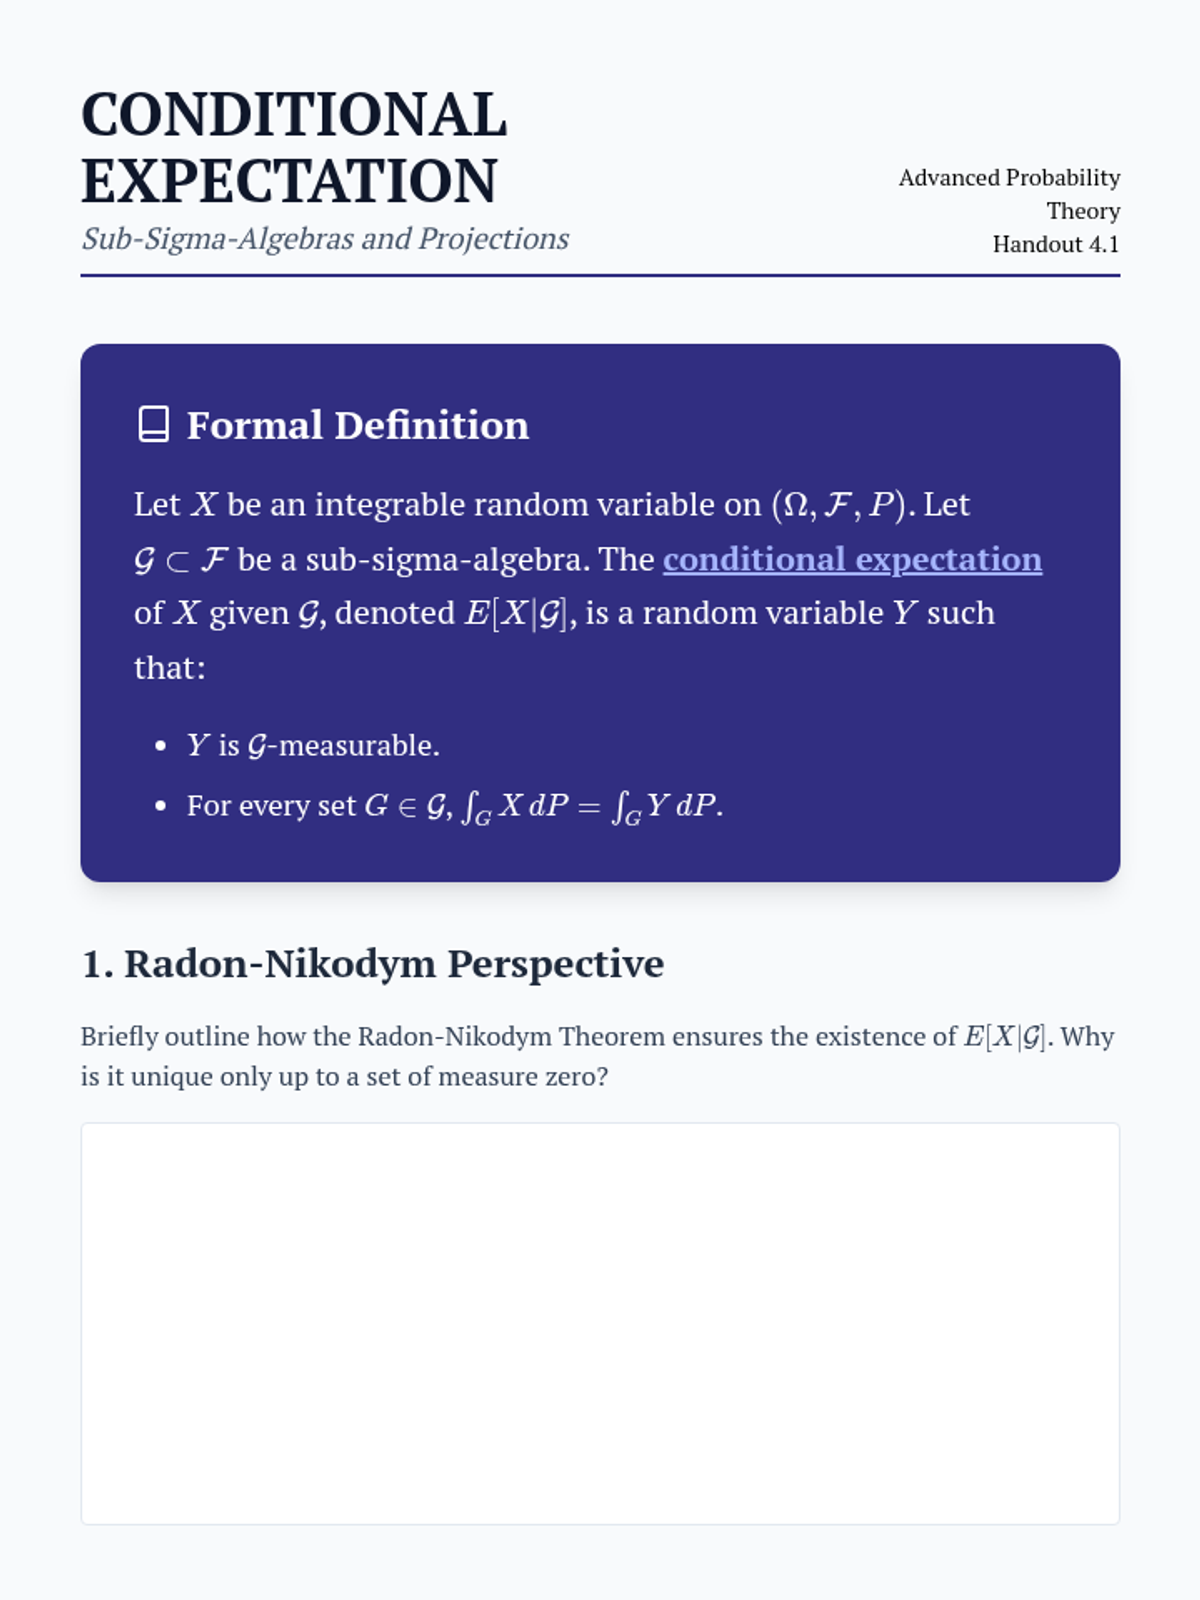
Defines conditional expectation as a random variable measurable with respect to a sub-sigma-algebra, utilizing the Radon-Nikodym theorem.
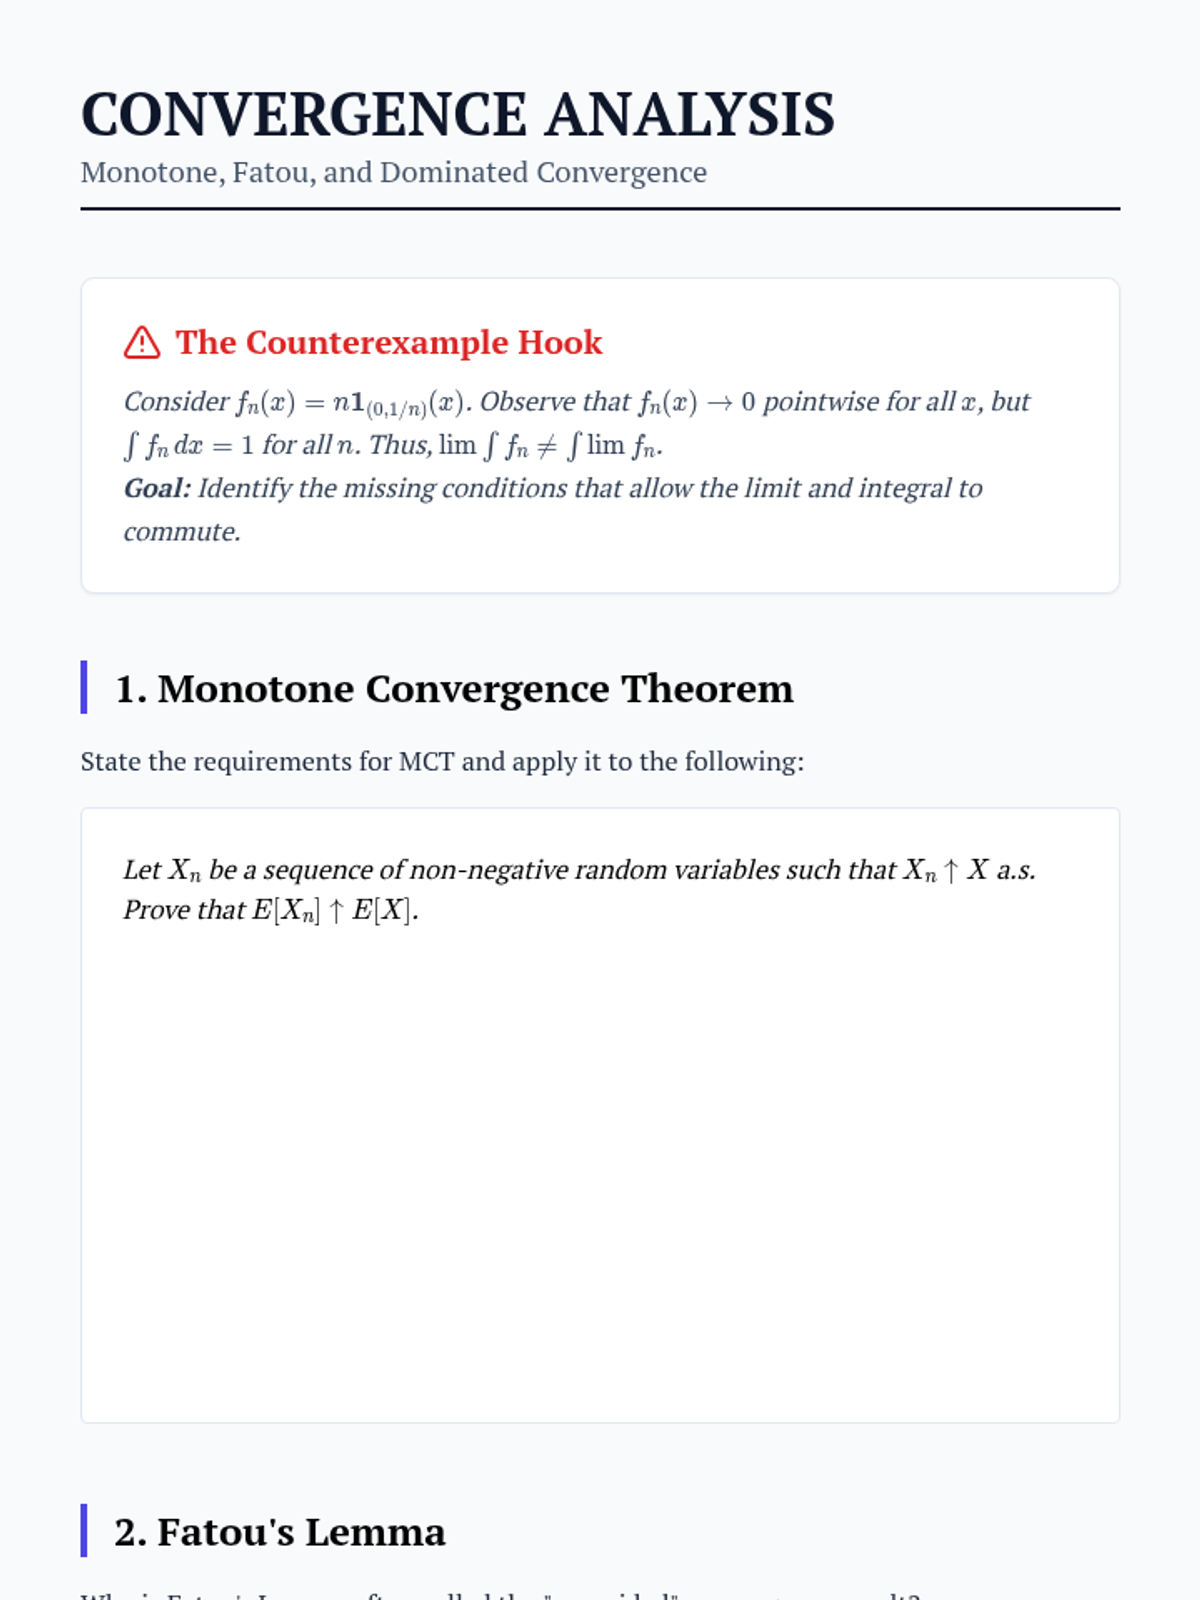
Analysis of Monotone Convergence, Fatou's Lemma, and Dominated Convergence Theorems to determine when limits and expectations commute.
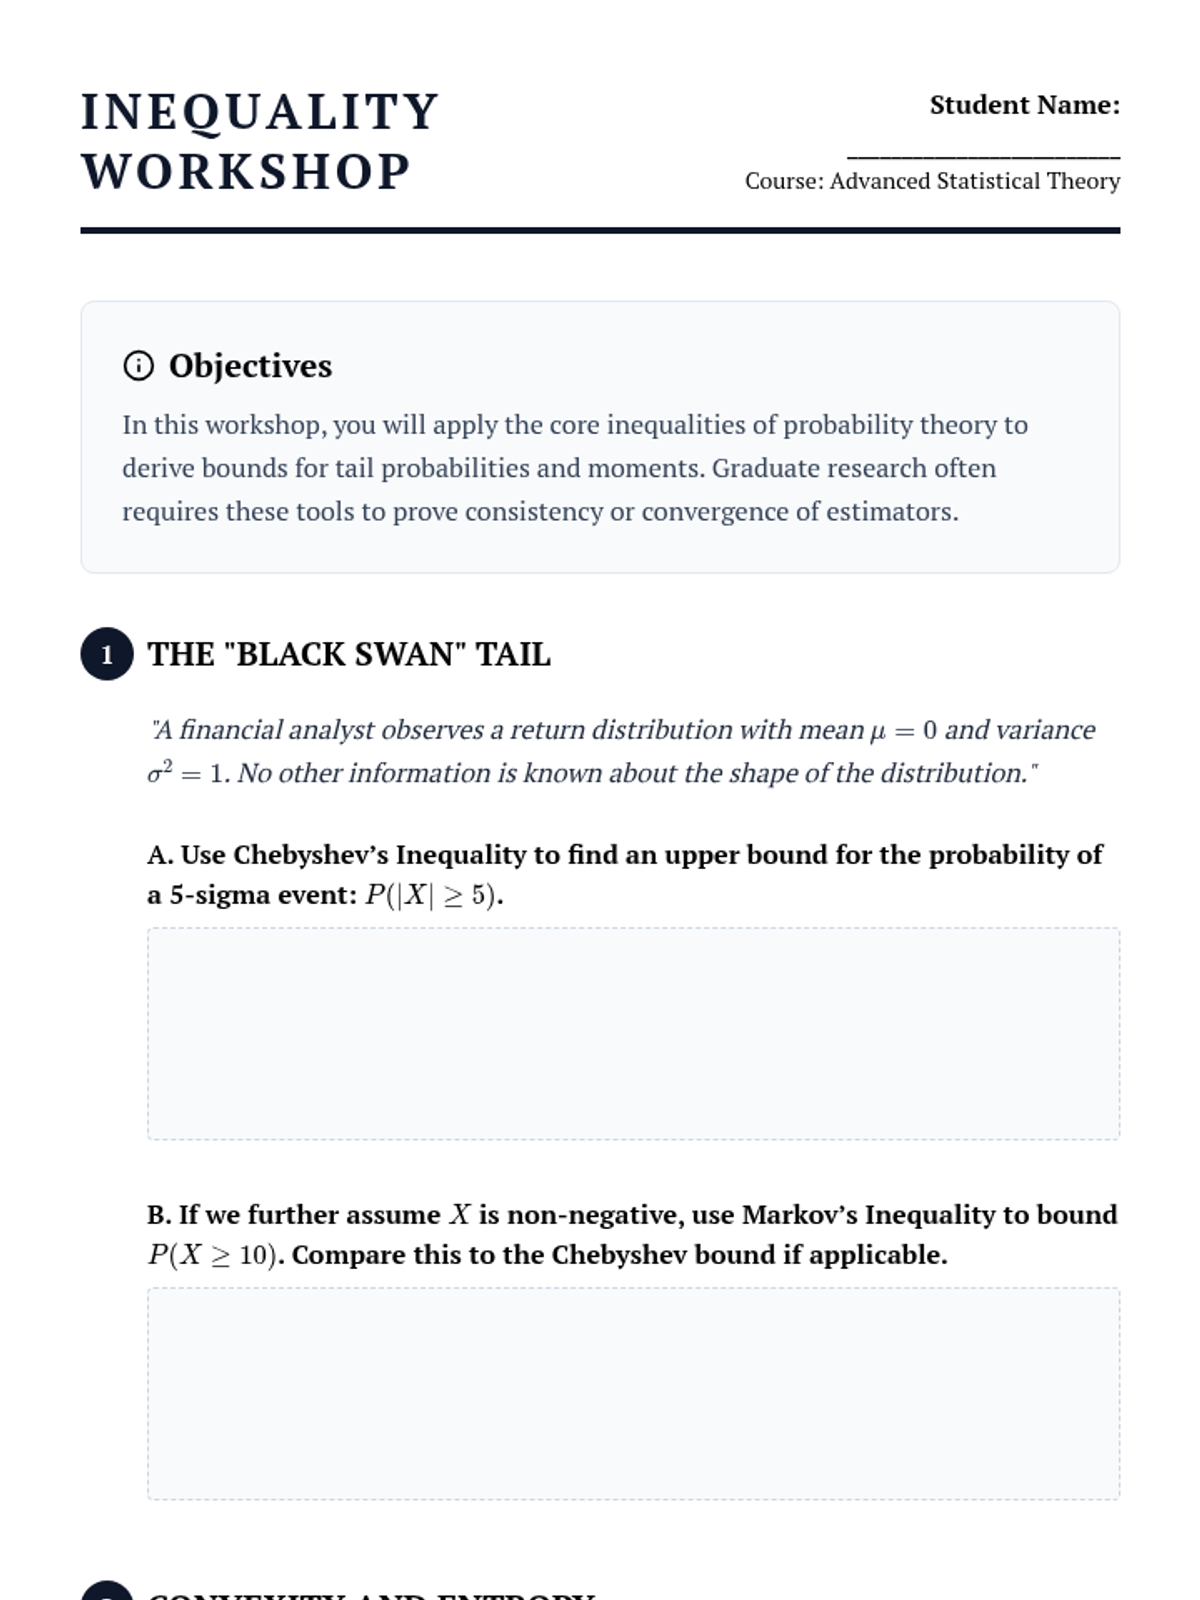
Focuses on the derivation and application of Markov, Chebyshev, Jensen, Hölder, and Minkowski inequalities to bound expected values.
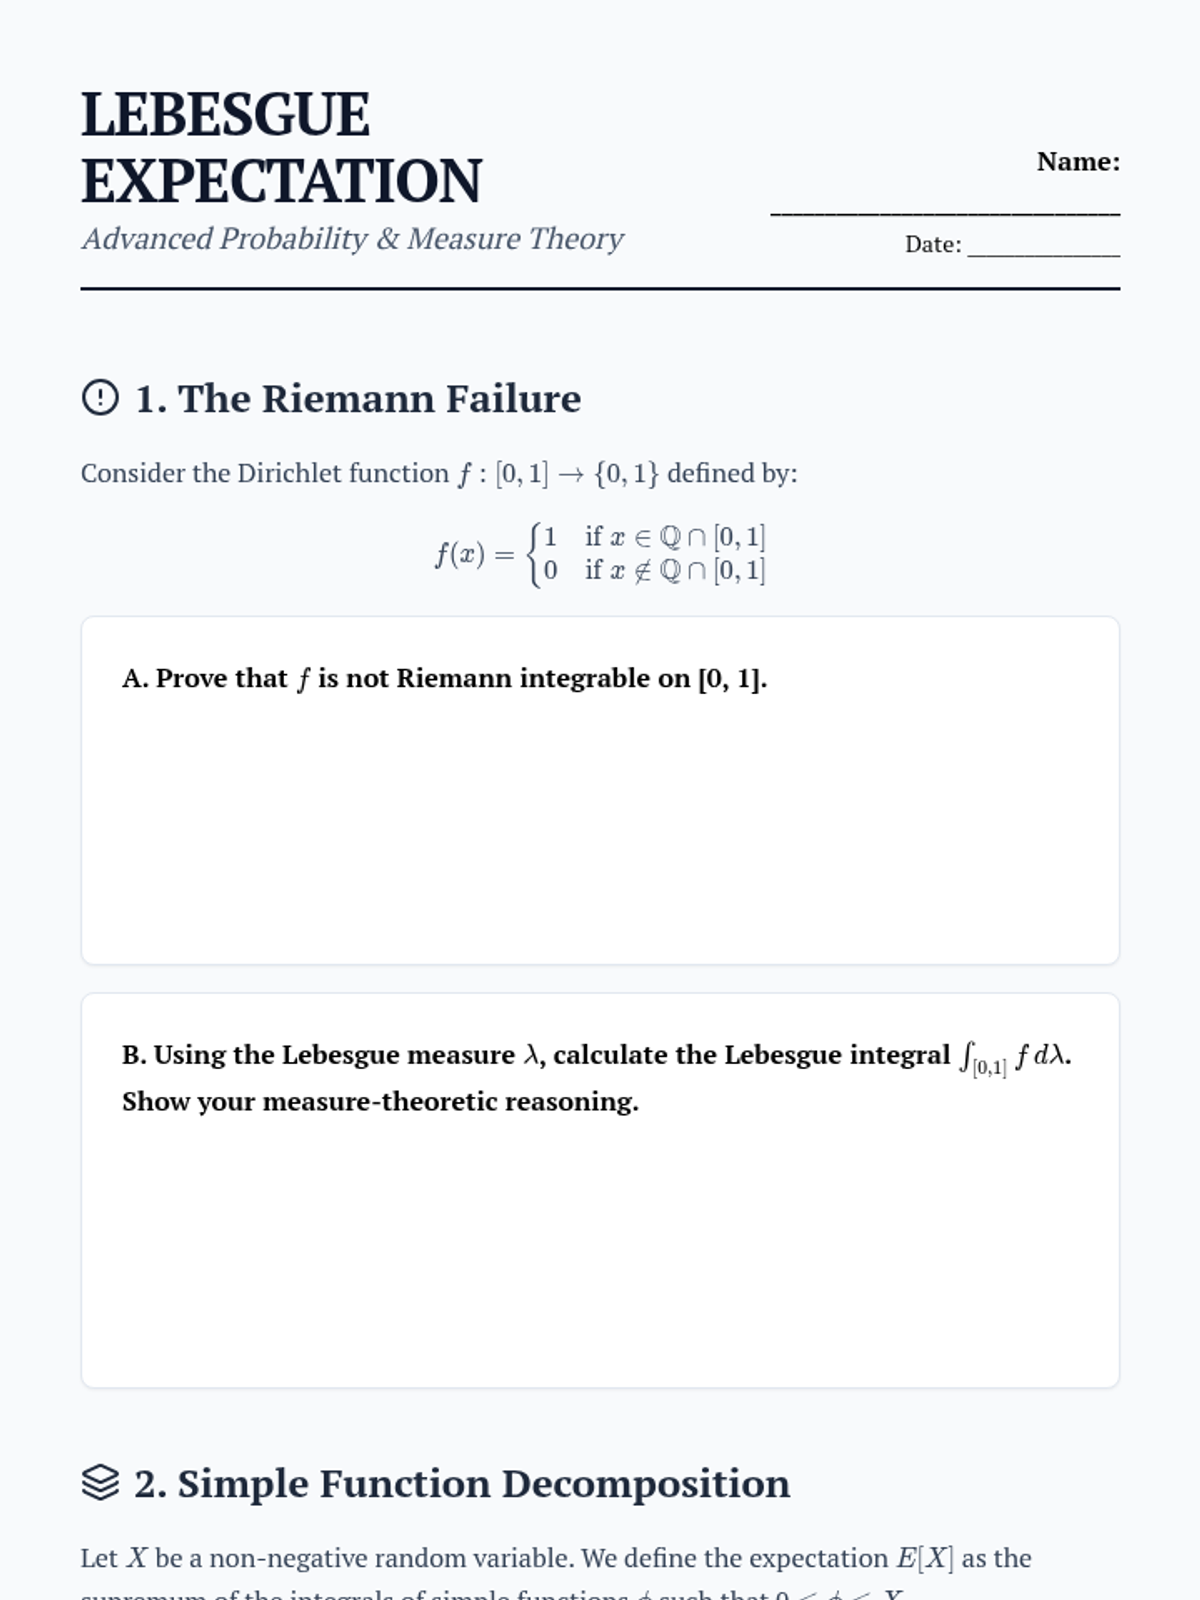
Students define expectation using the Lebesgue integral, moving from simple functions to non-negative random variables and addressing the limitations of Riemann integration.
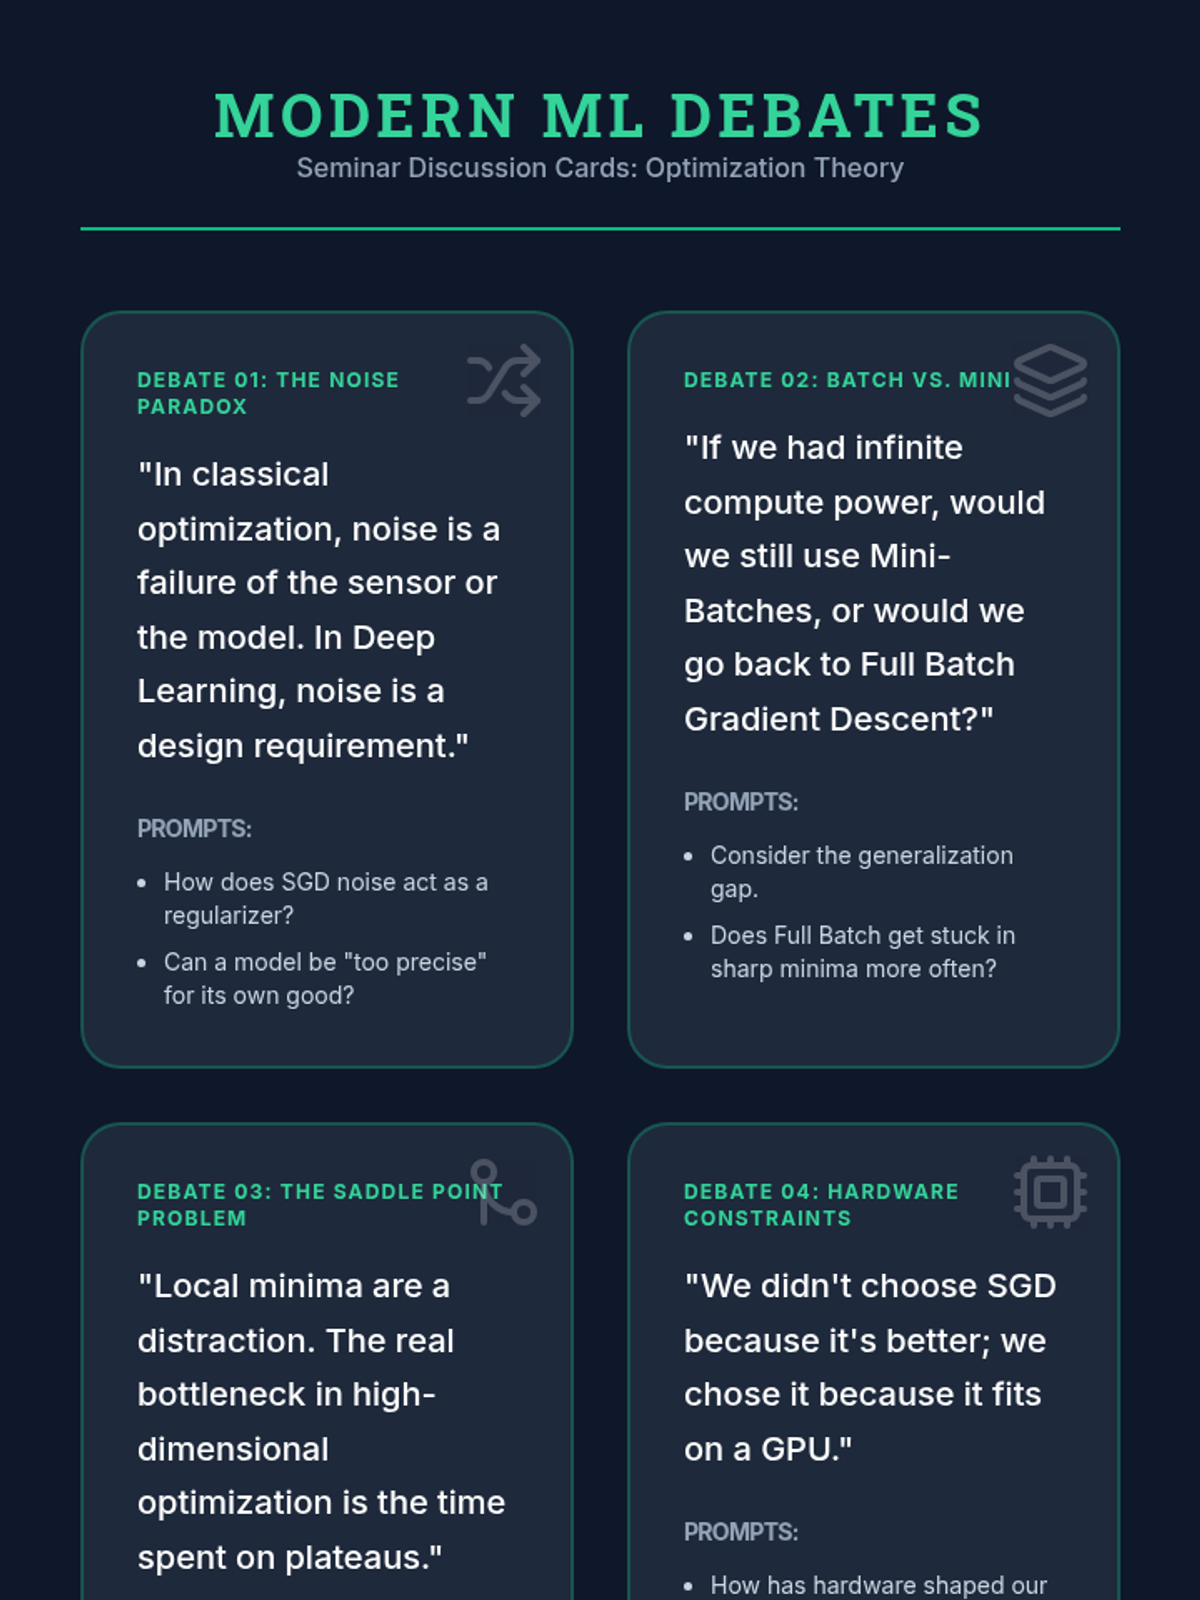
Exploring Stochastic Gradient Descent (SGD) and its role in navigating high-dimensional, non-convex landscapes in machine learning.
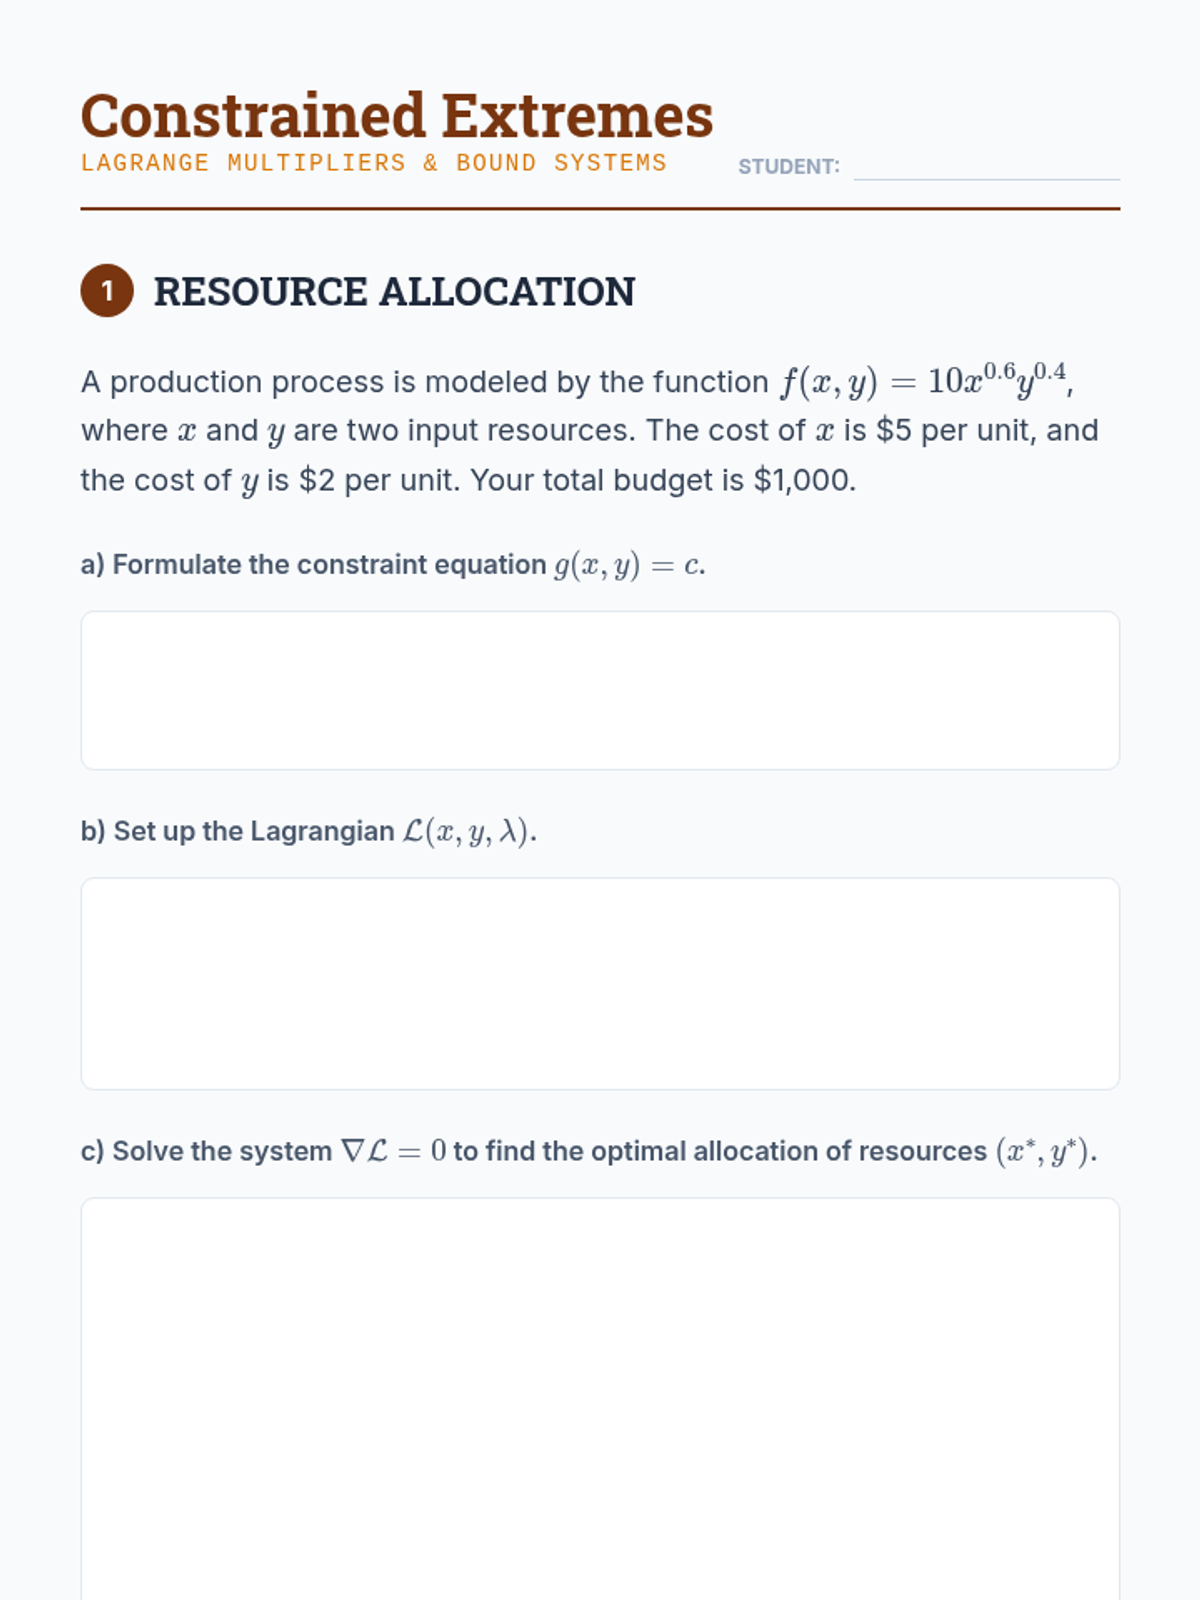
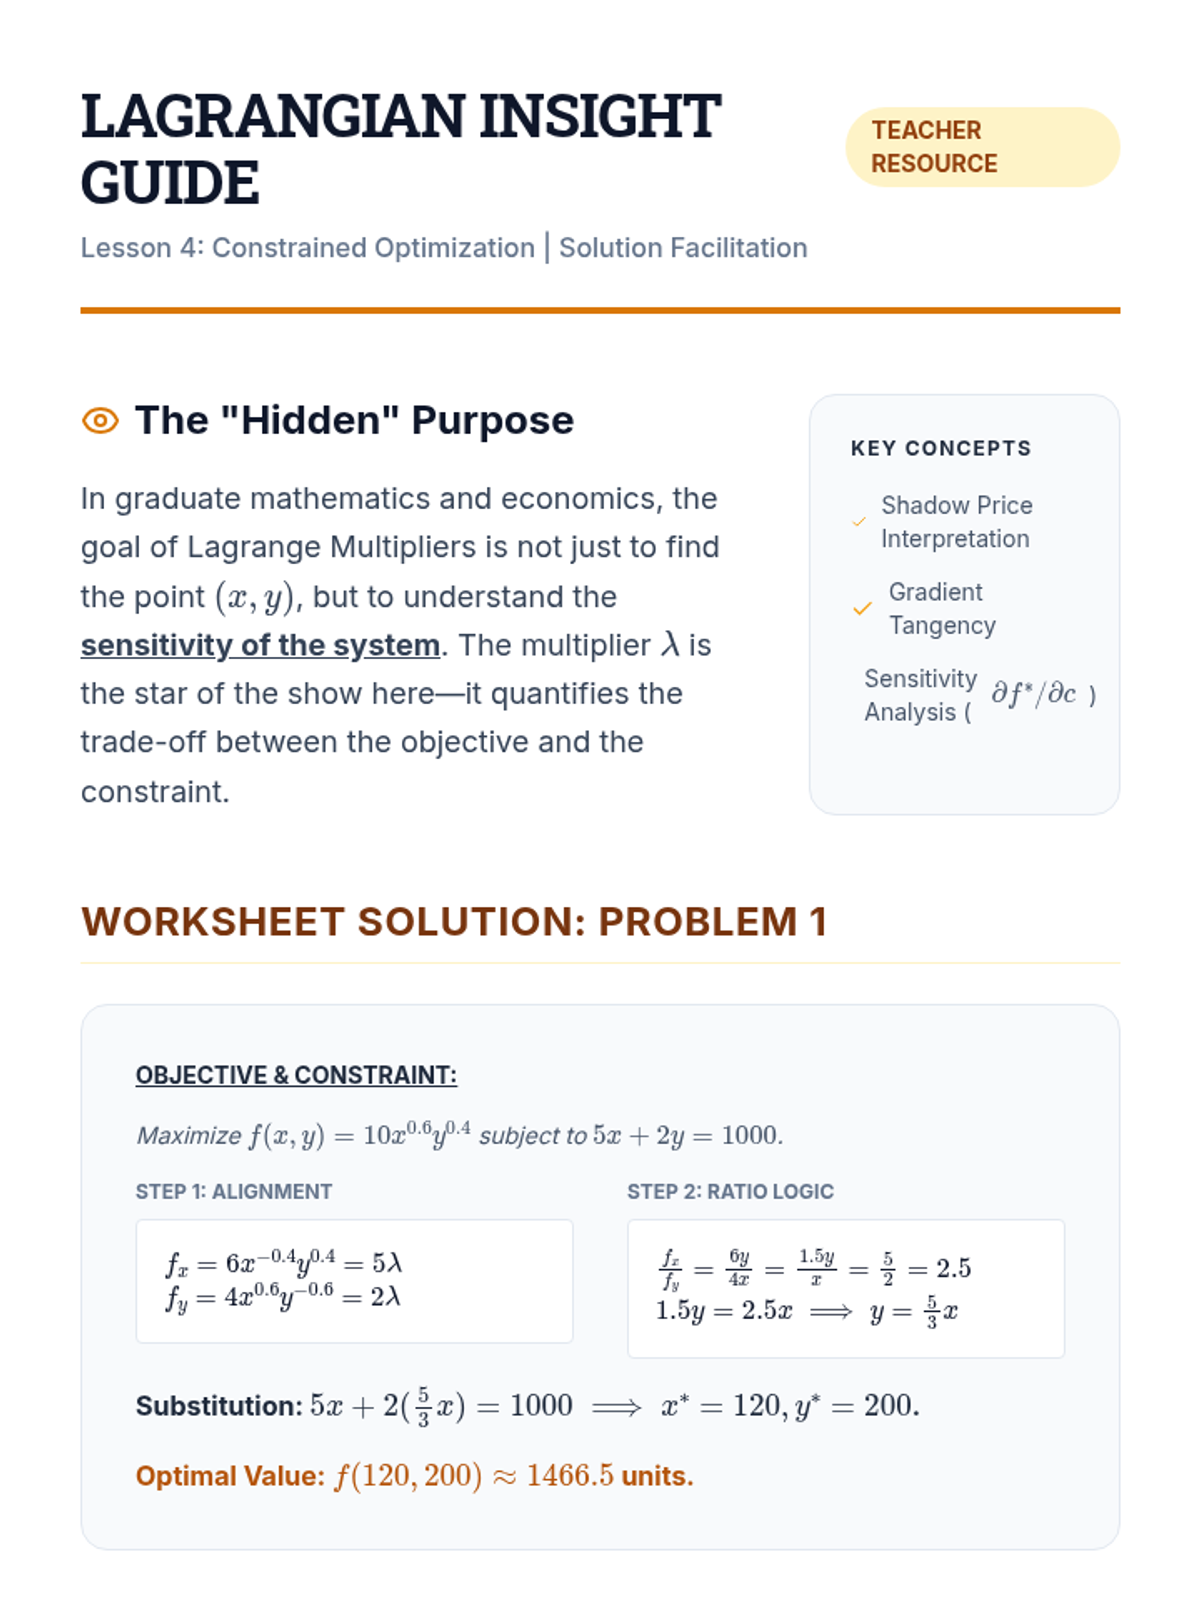
Solving optimization problems under constraints using the method of Lagrange multipliers, focusing on the alignment of gradient vectors.
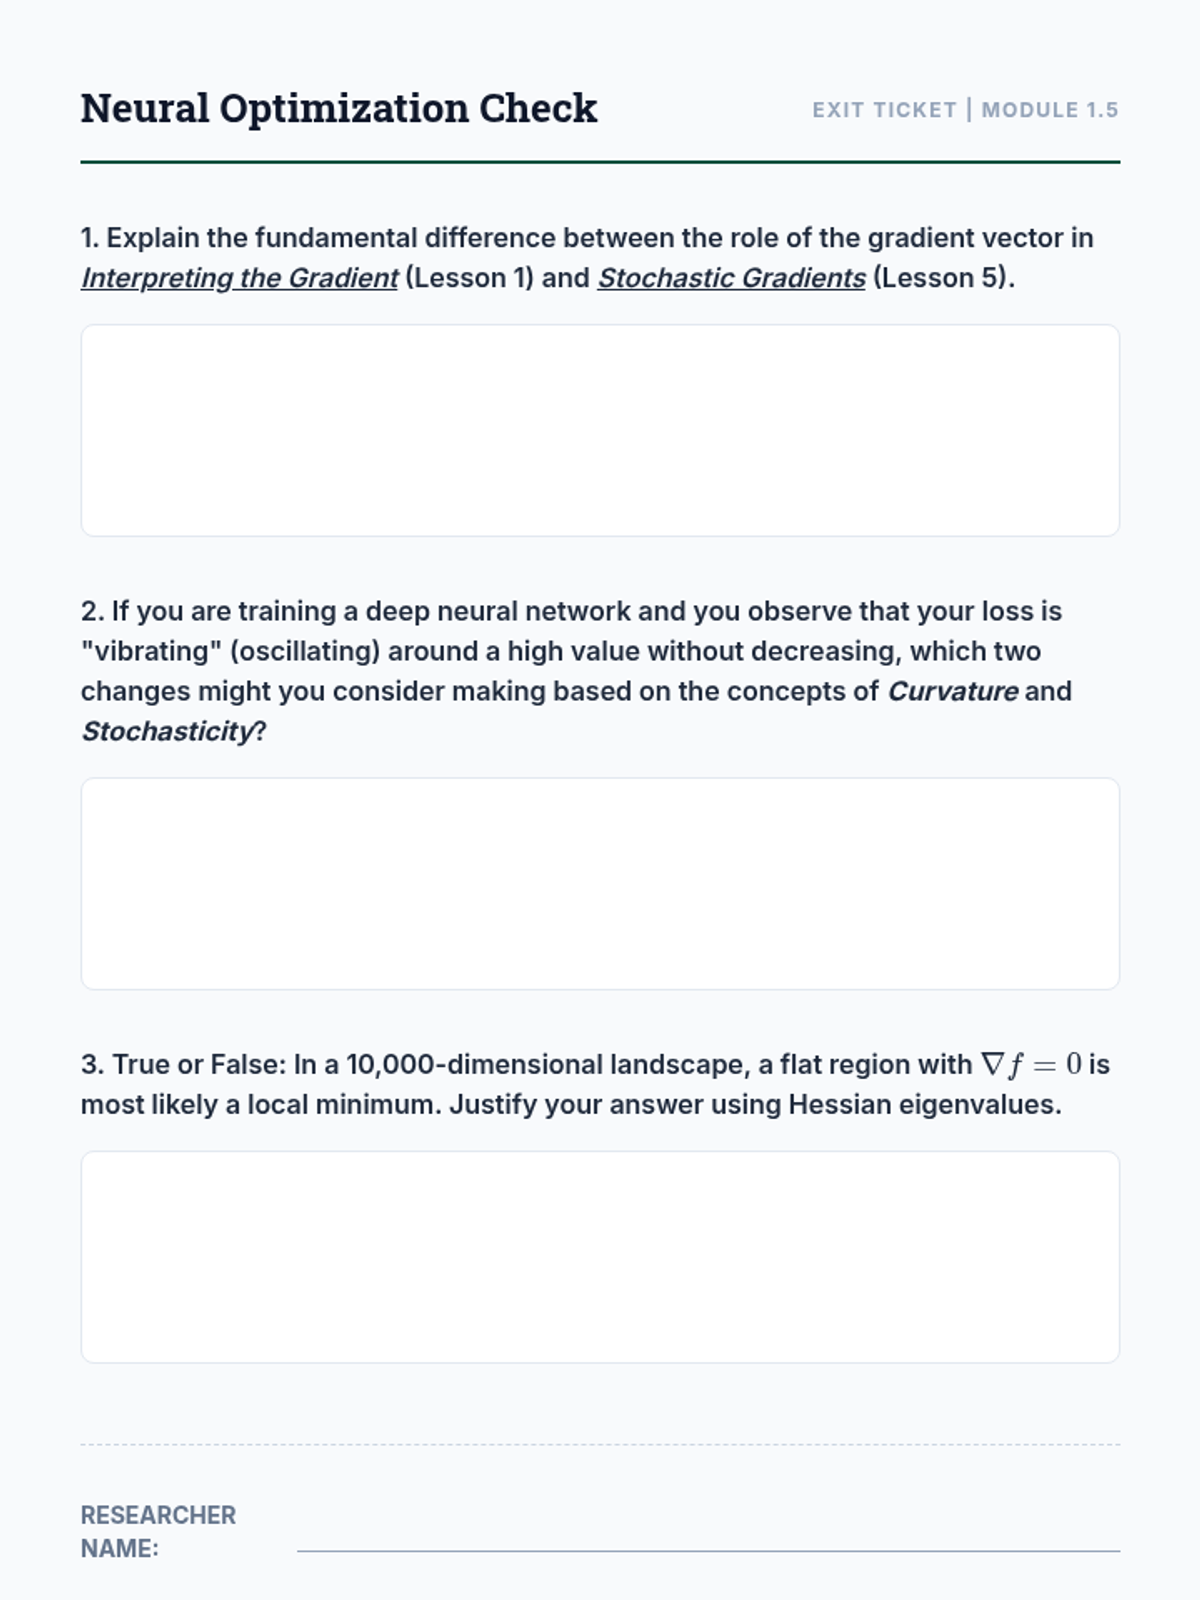
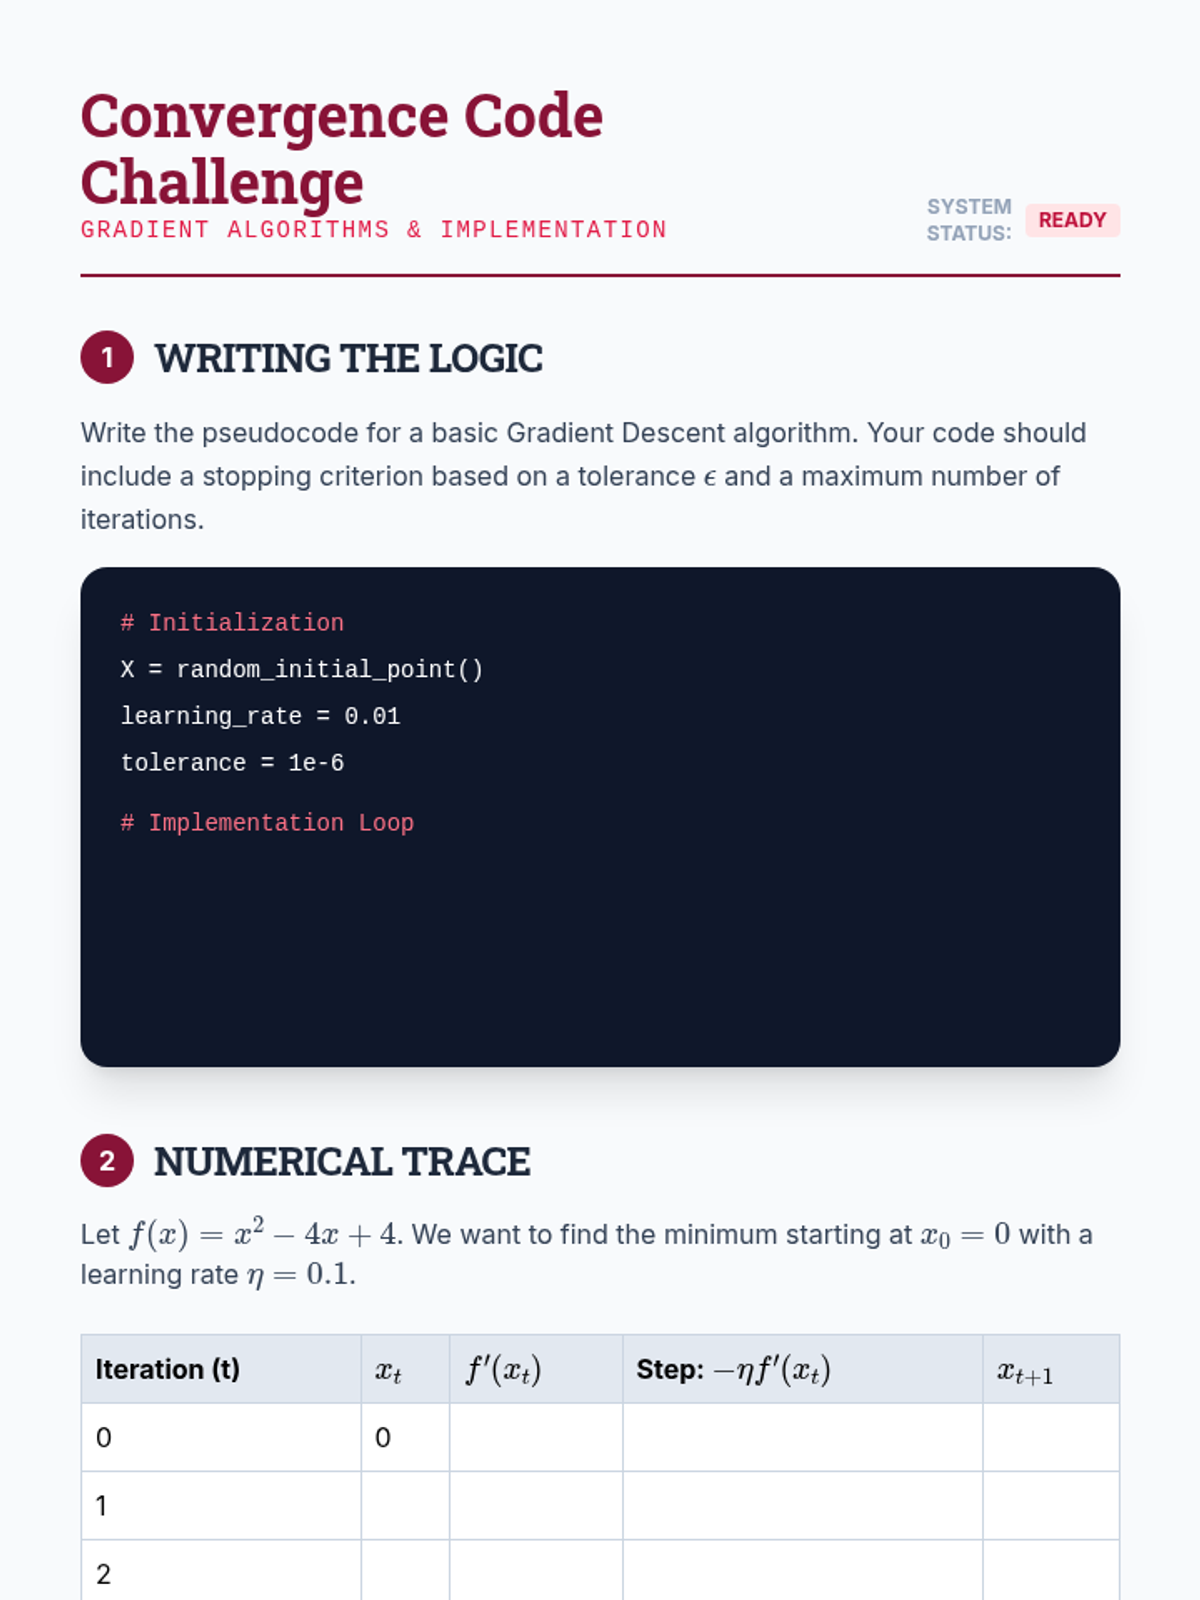
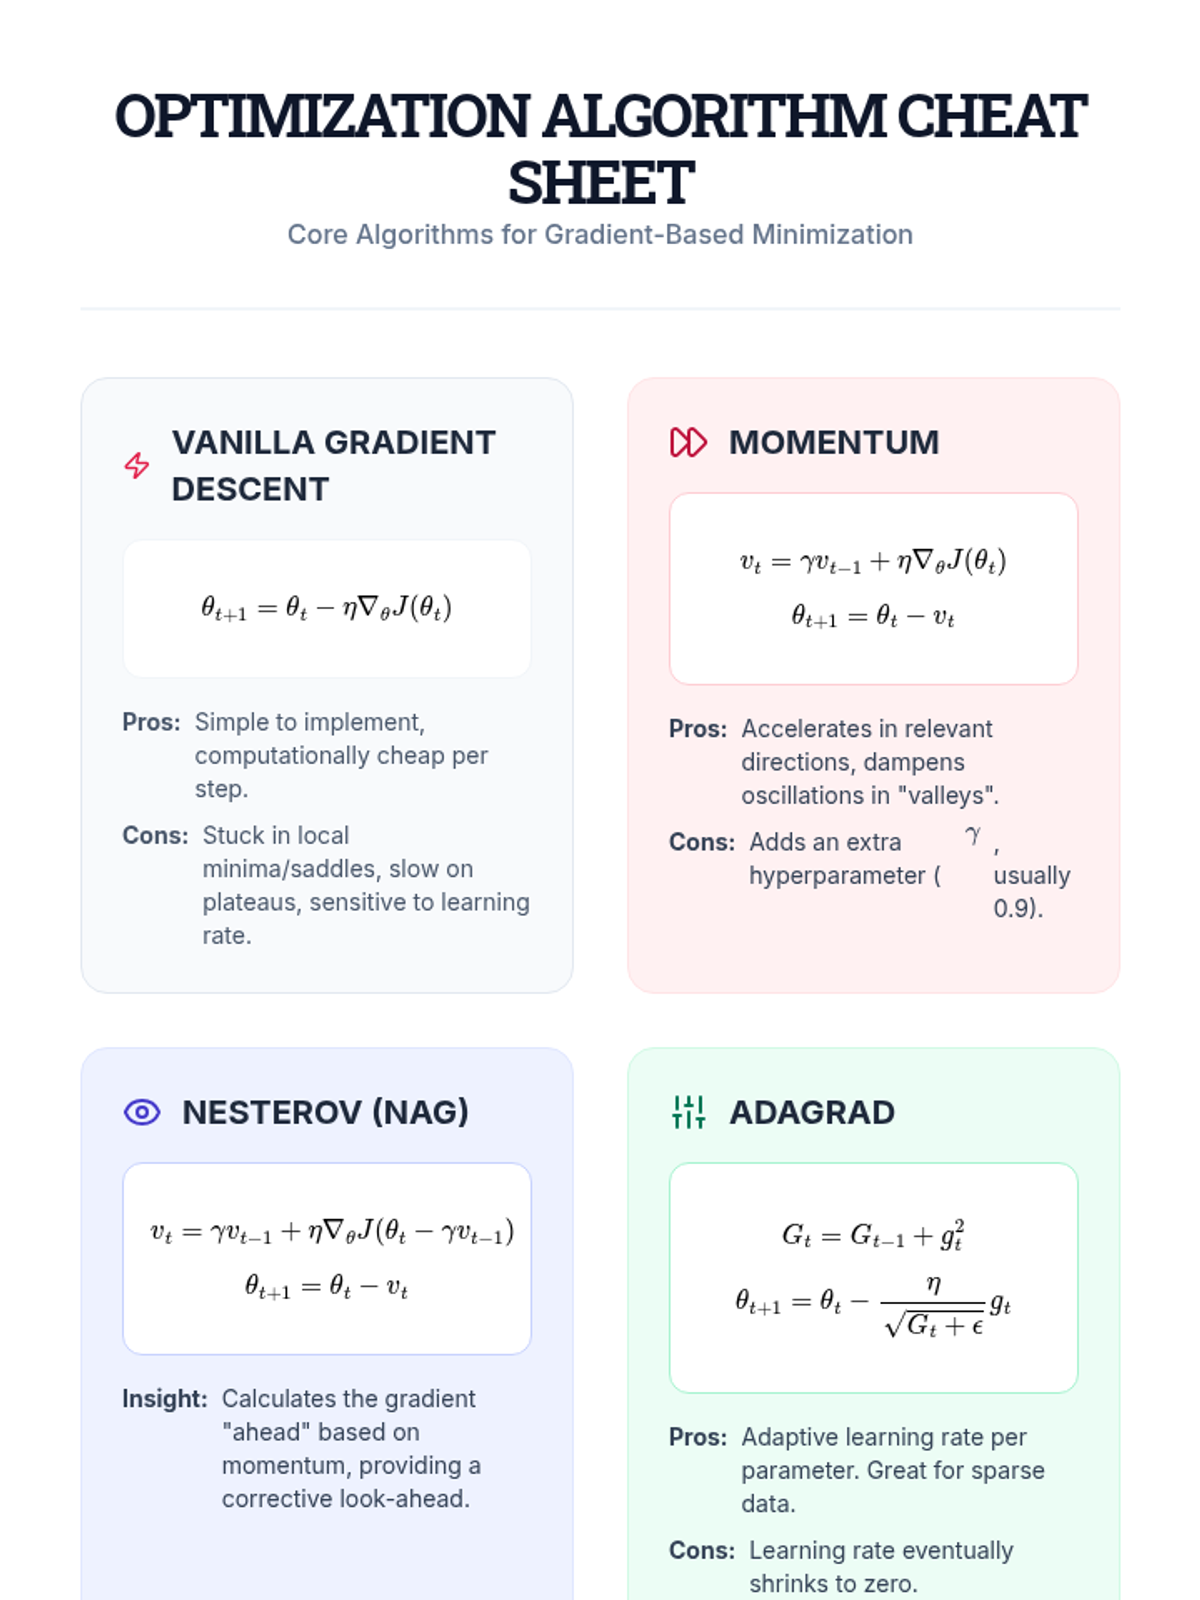
Implementation of iterative numerical methods, focusing on the geometry of convergence, learning rates, and momentum in gradient descent.
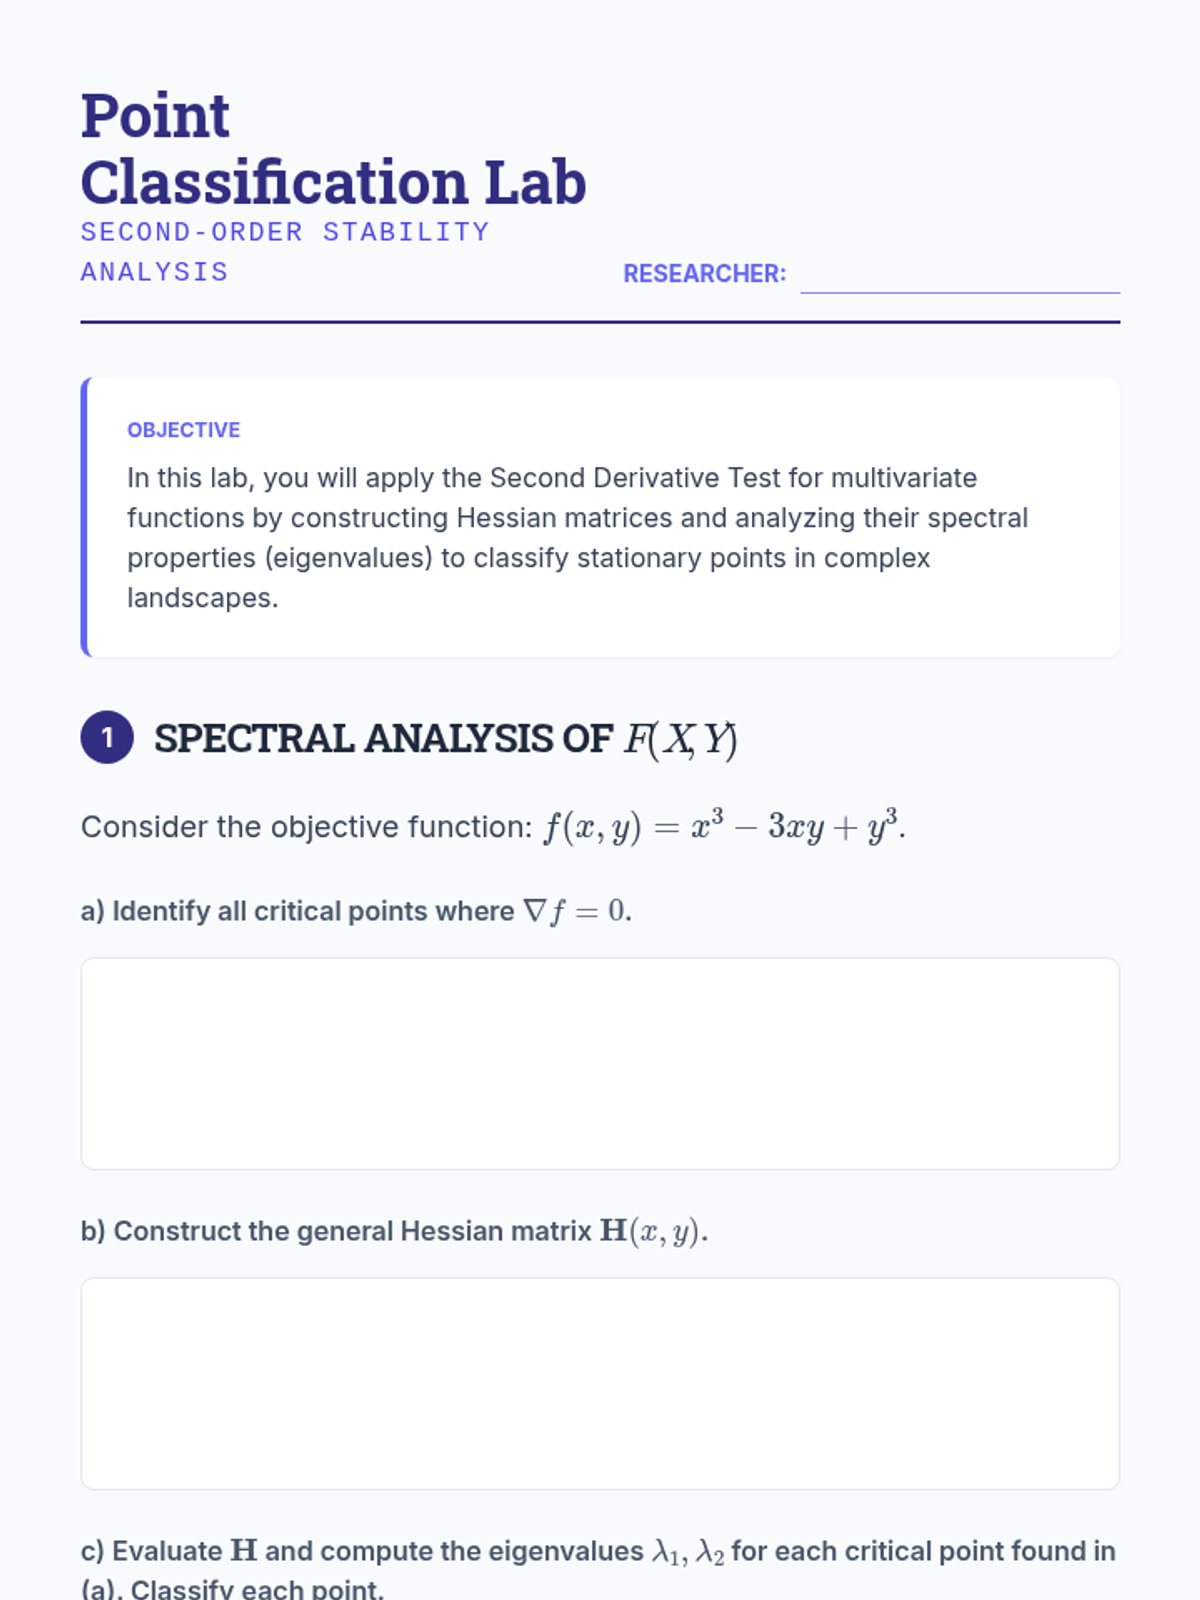
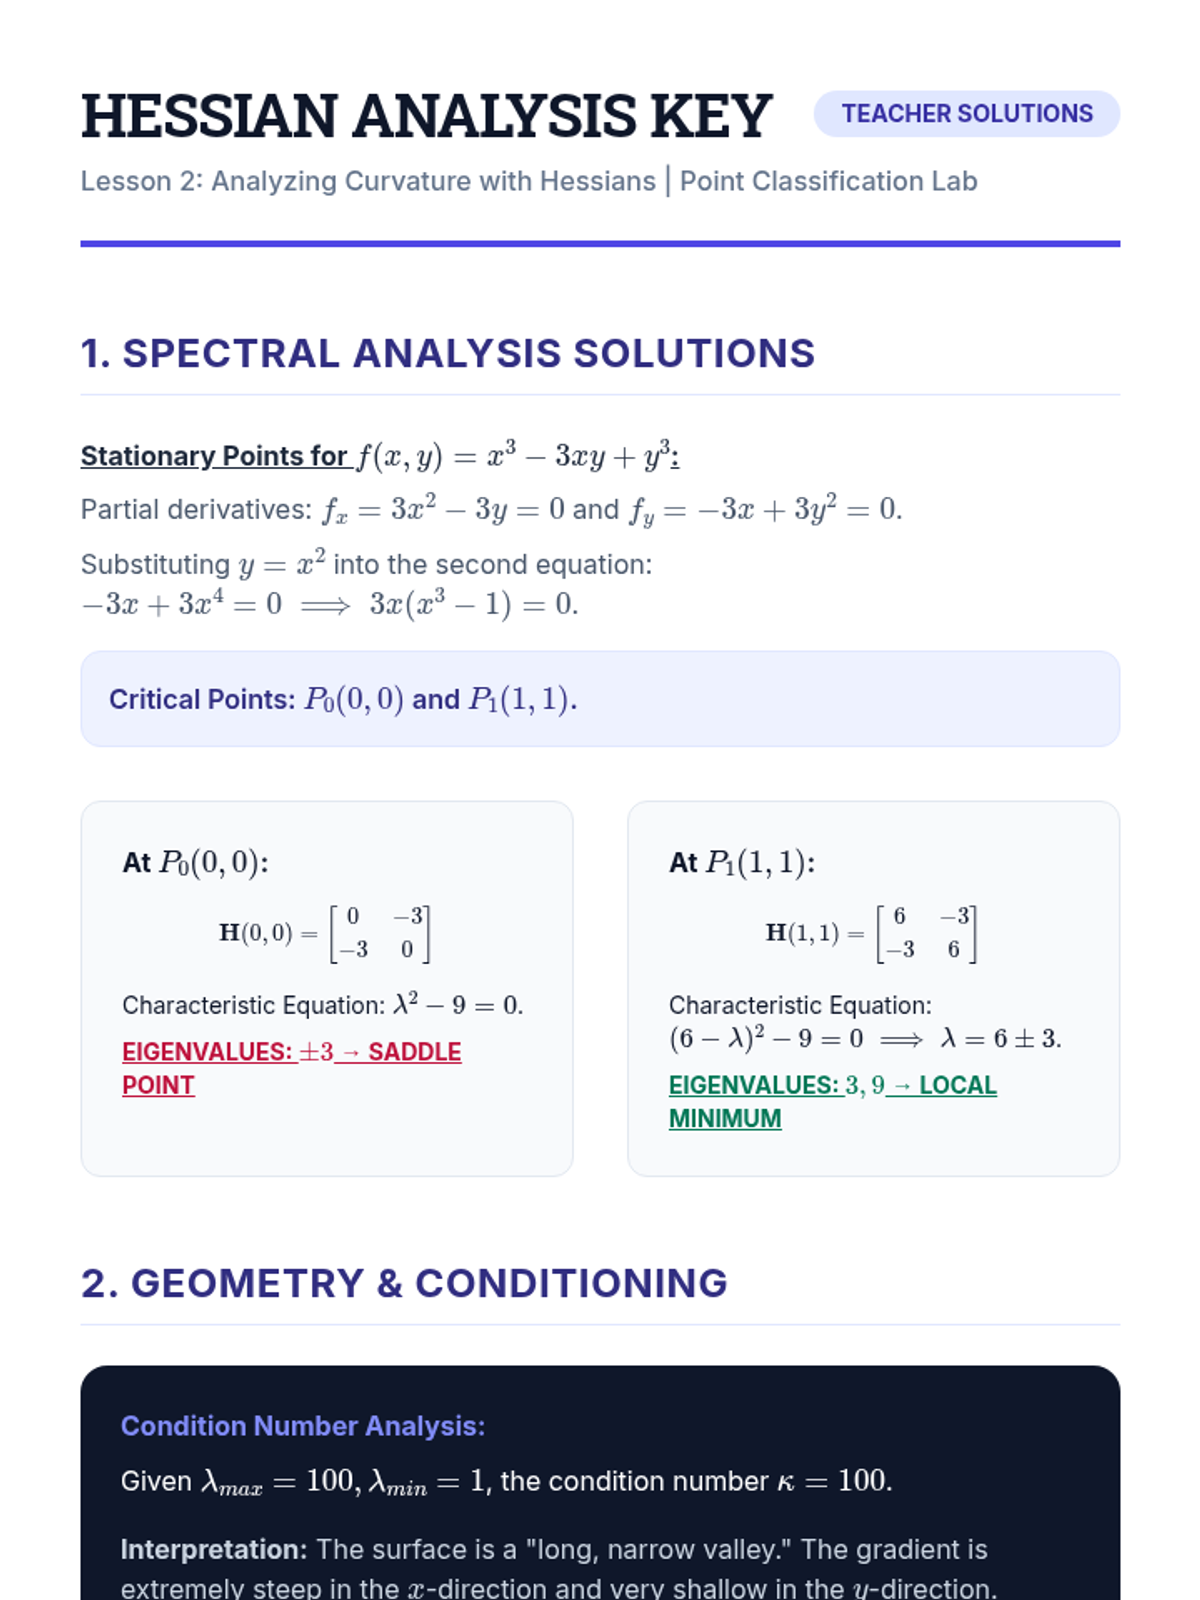
An examination of second-order derivatives via the Hessian matrix to understand surface curvature and classify critical points using eigenvalues.
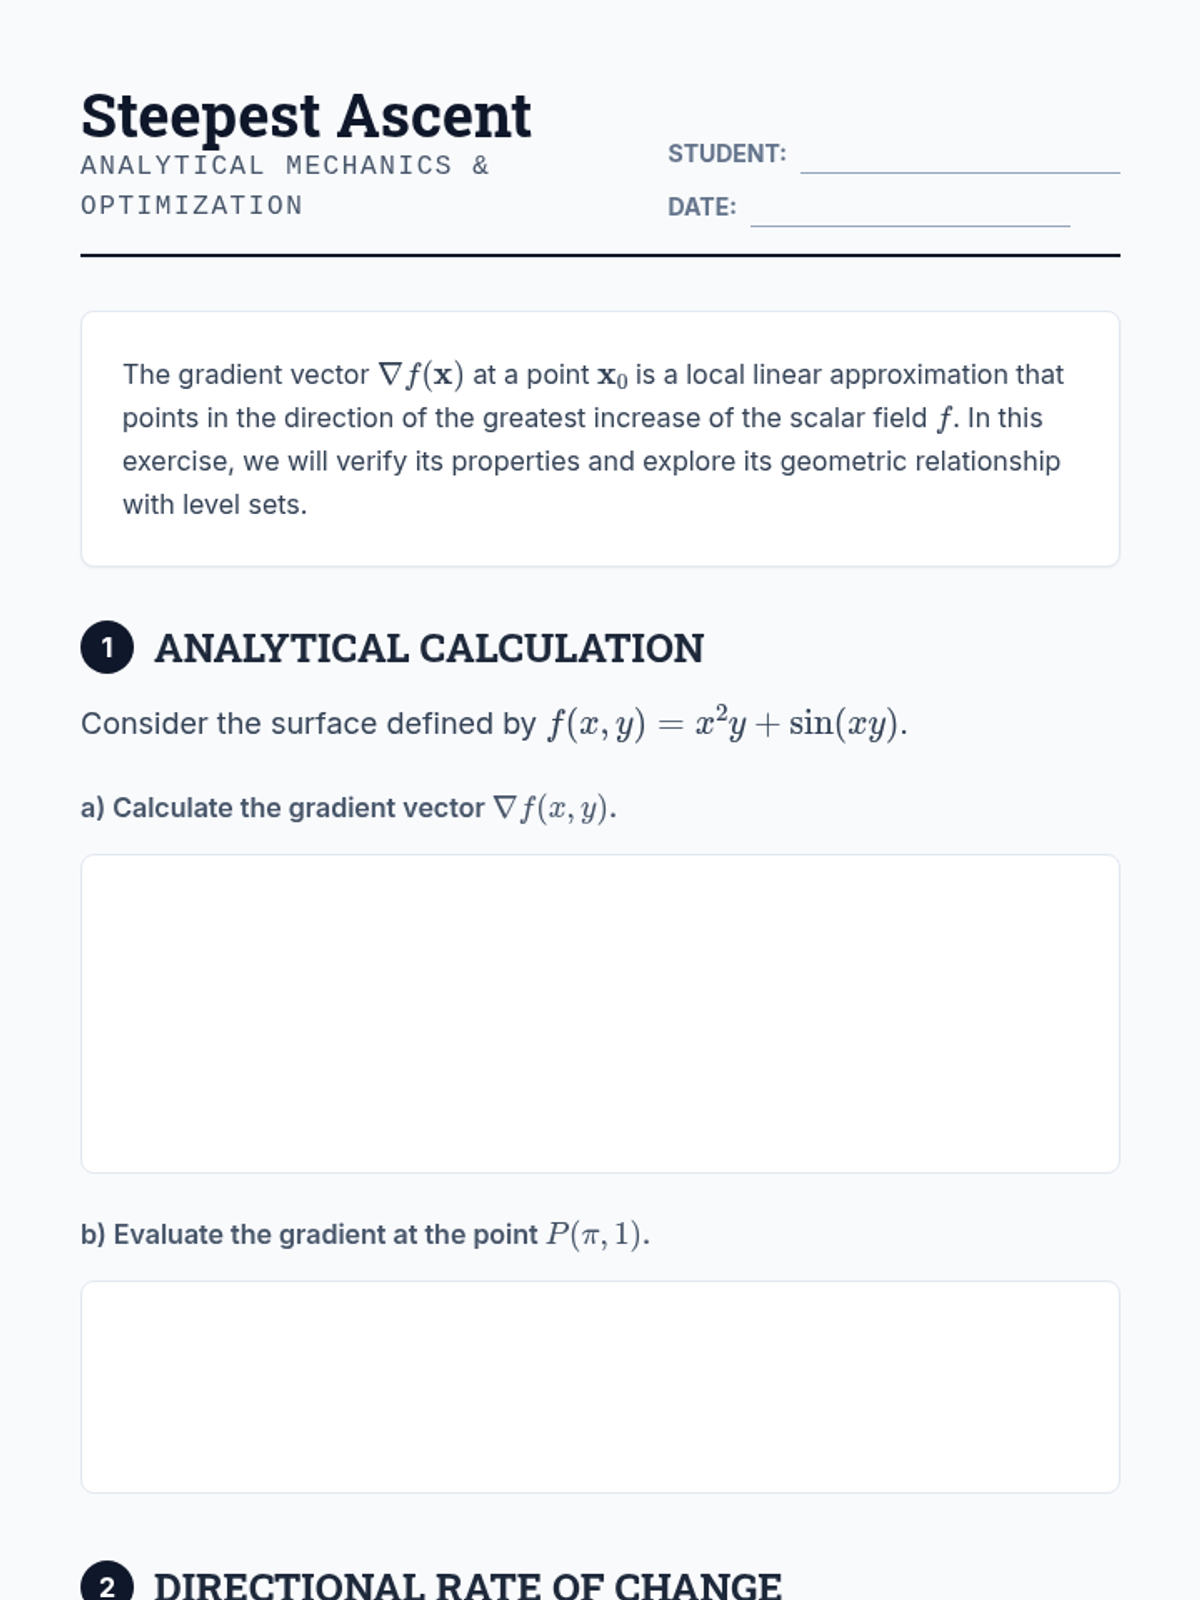
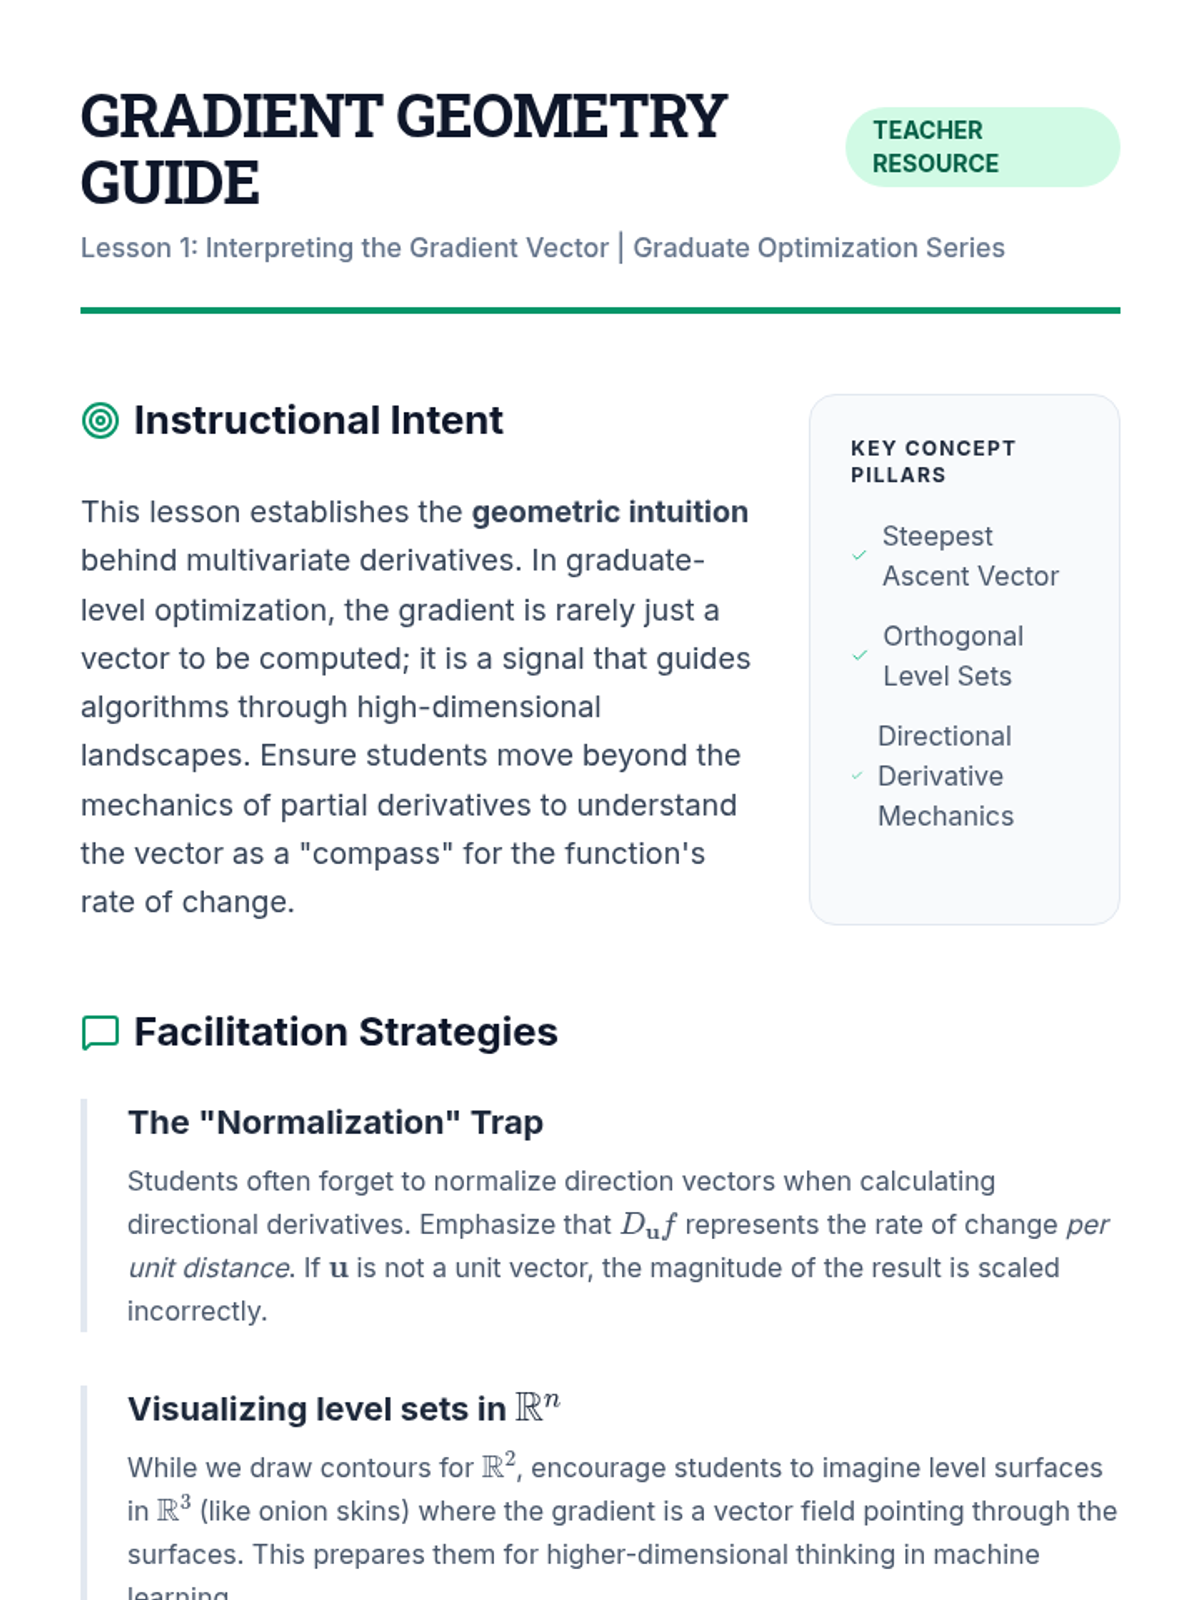
Students analyze the gradient vector as a directional quantity, establishing its geometric relationship with level sets and proving it indicates the steepest ascent.
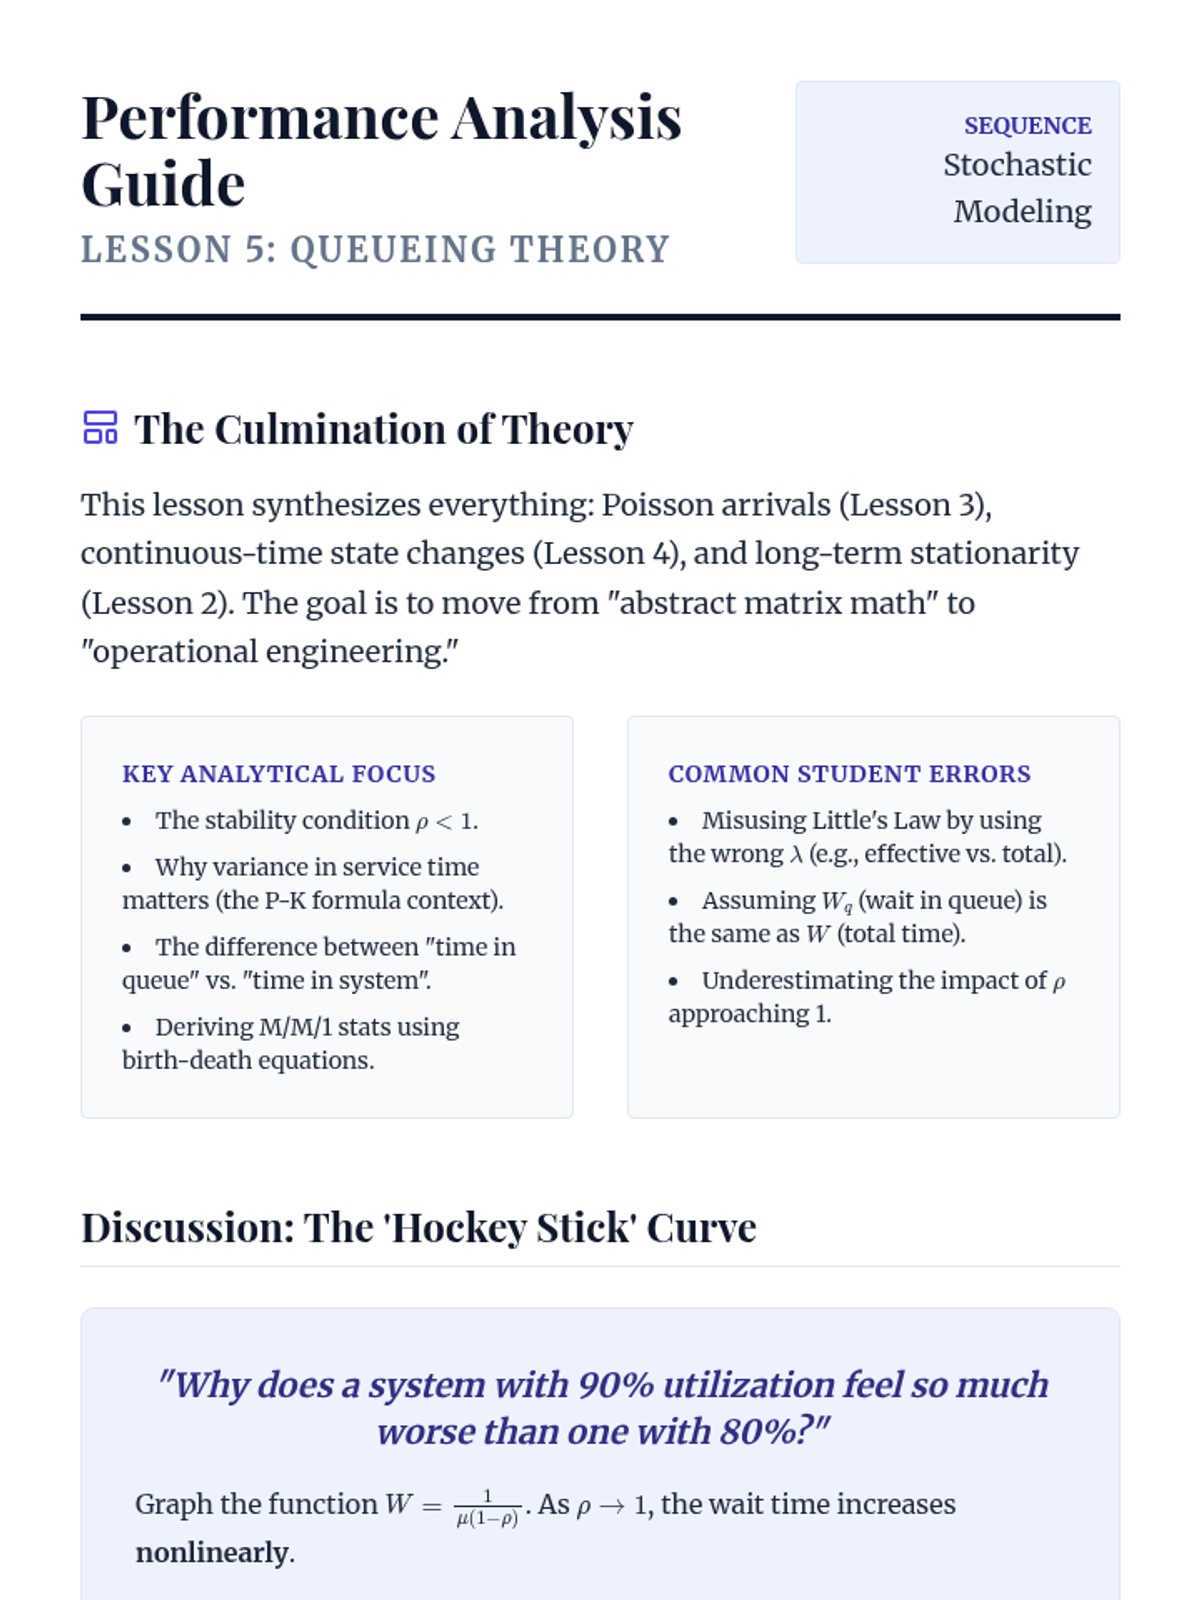
Application of stochastic modeling to queueing systems, using Little's Law and steady-state analysis to optimize performance in complex environments.
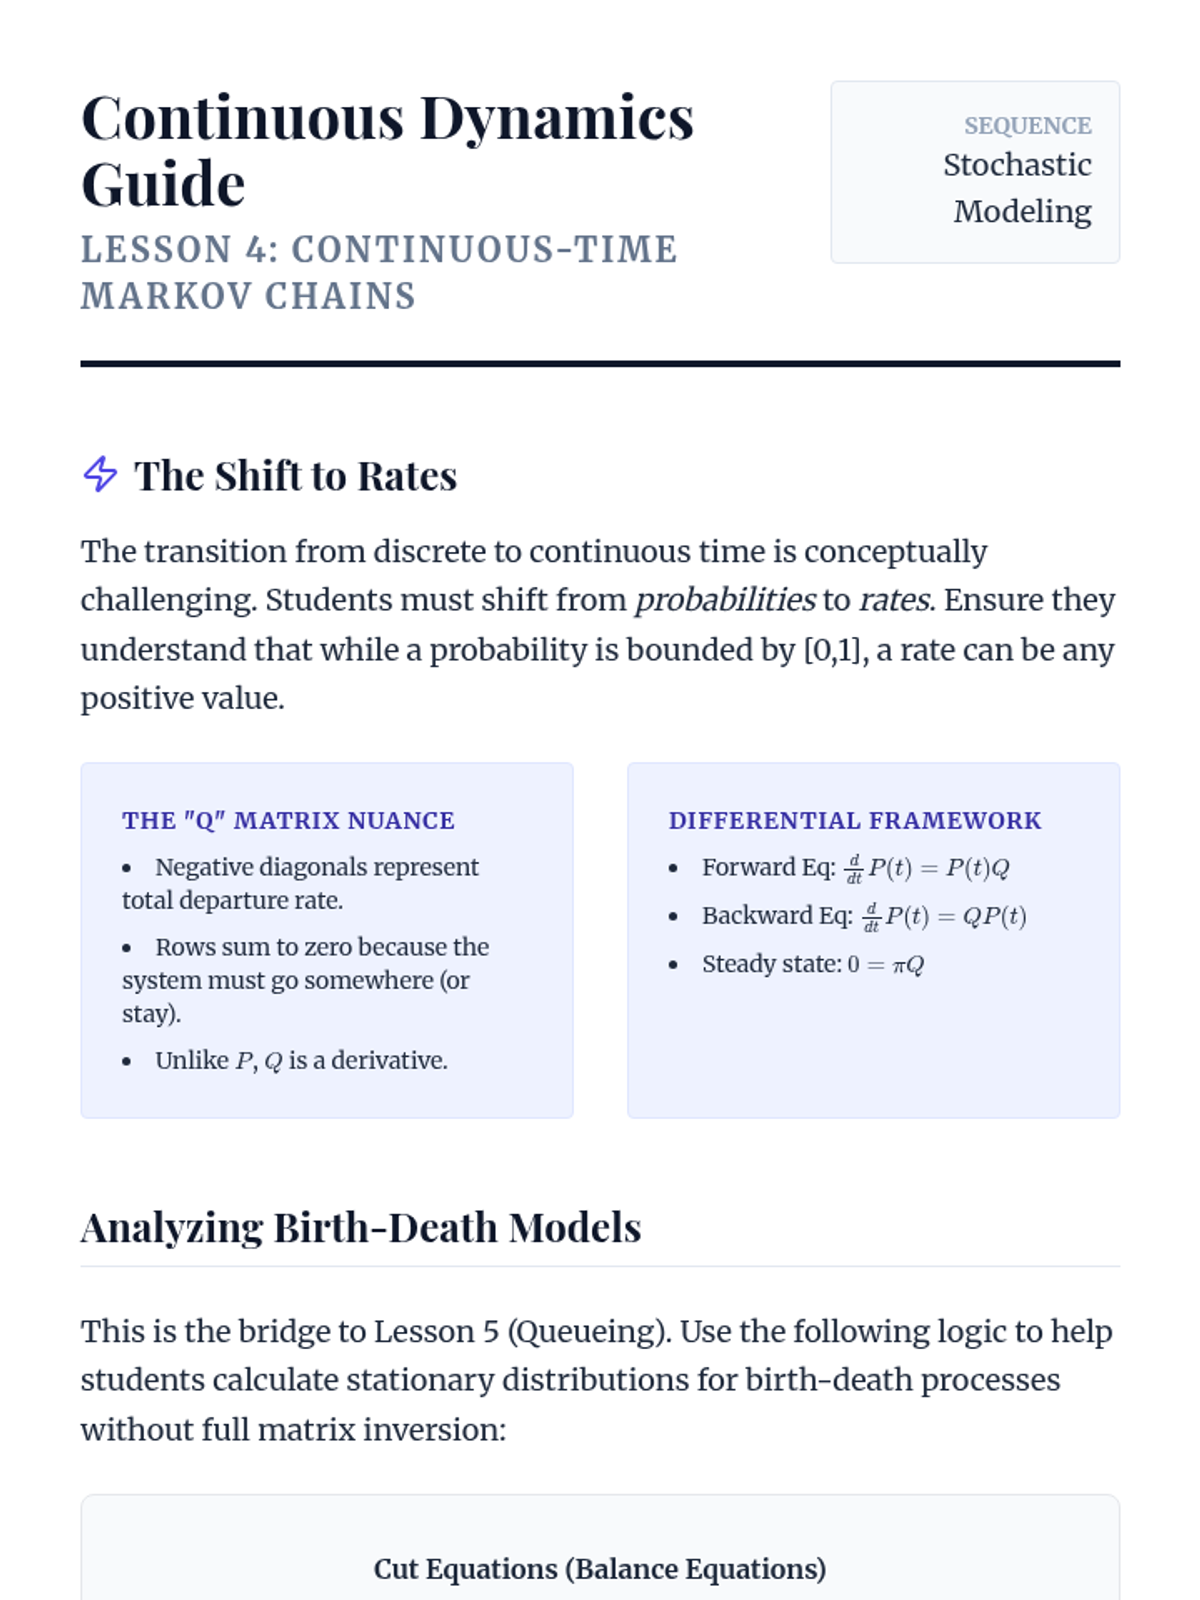
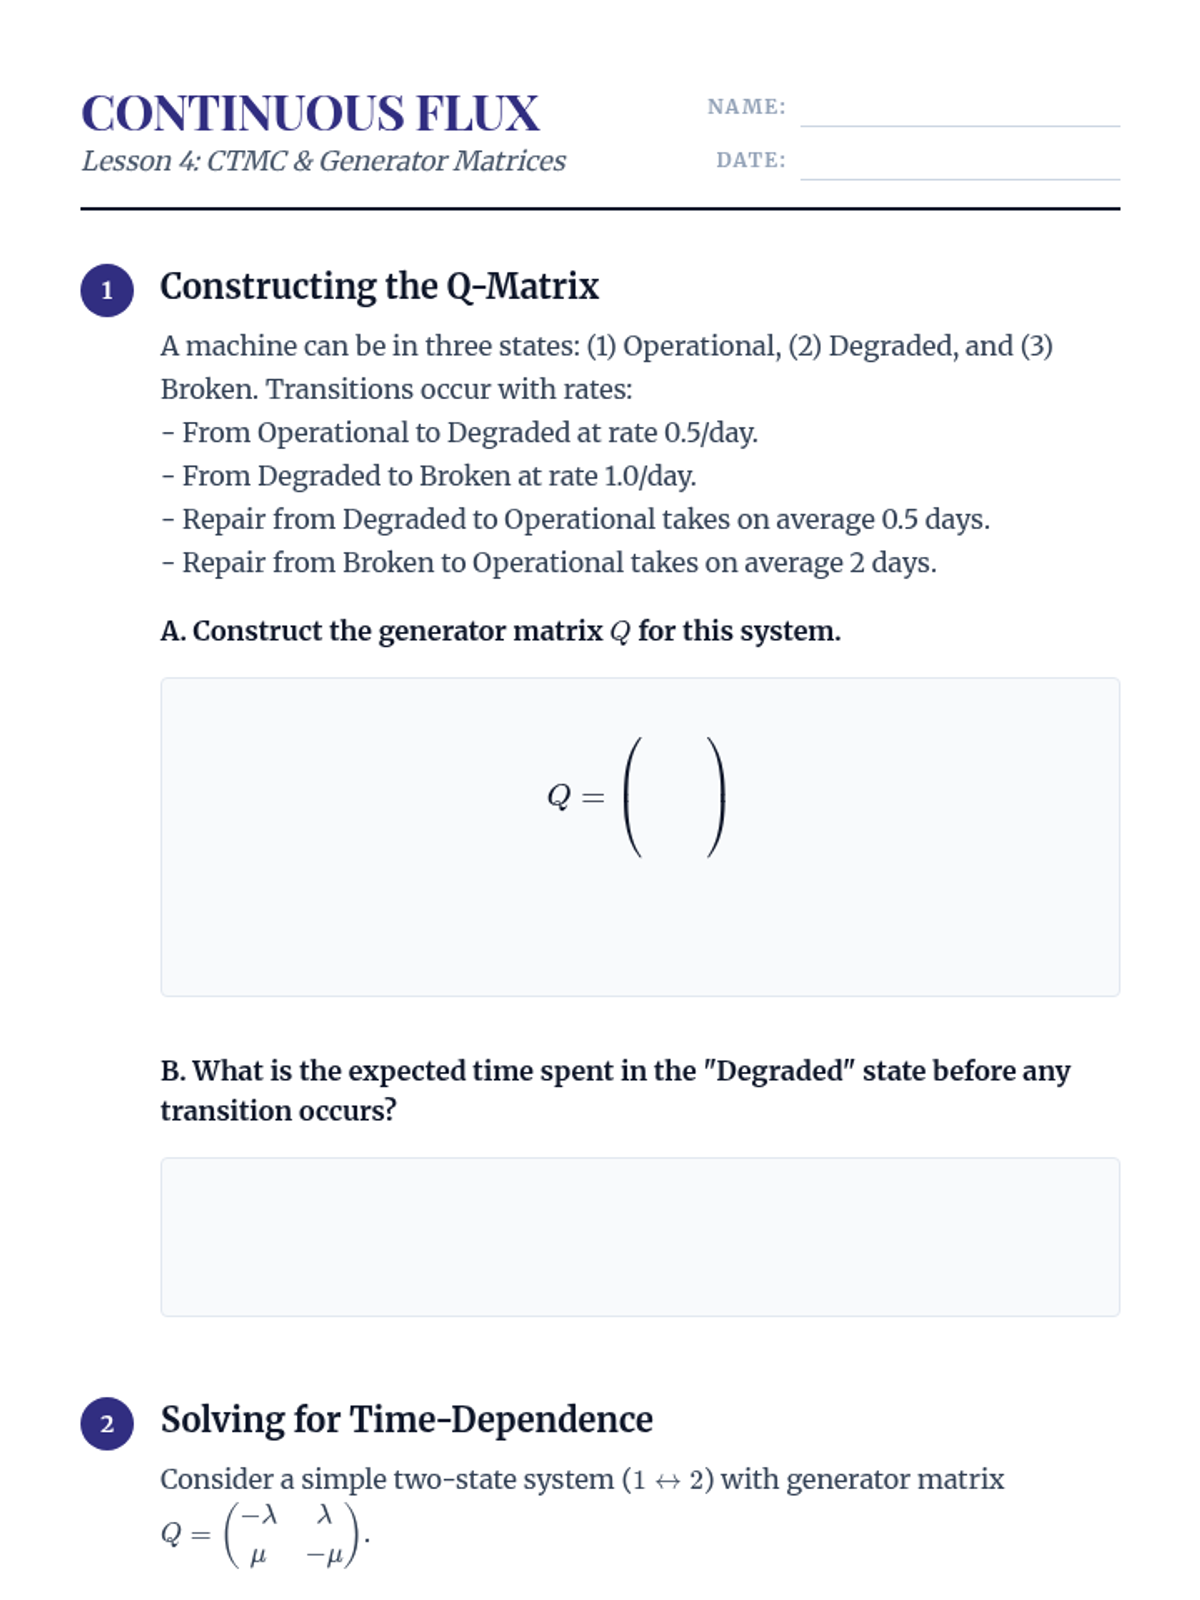
Transitioning to continuous-time Markov chains using generator matrices and solving Kolmogorov's differential equations for birth-death processes.
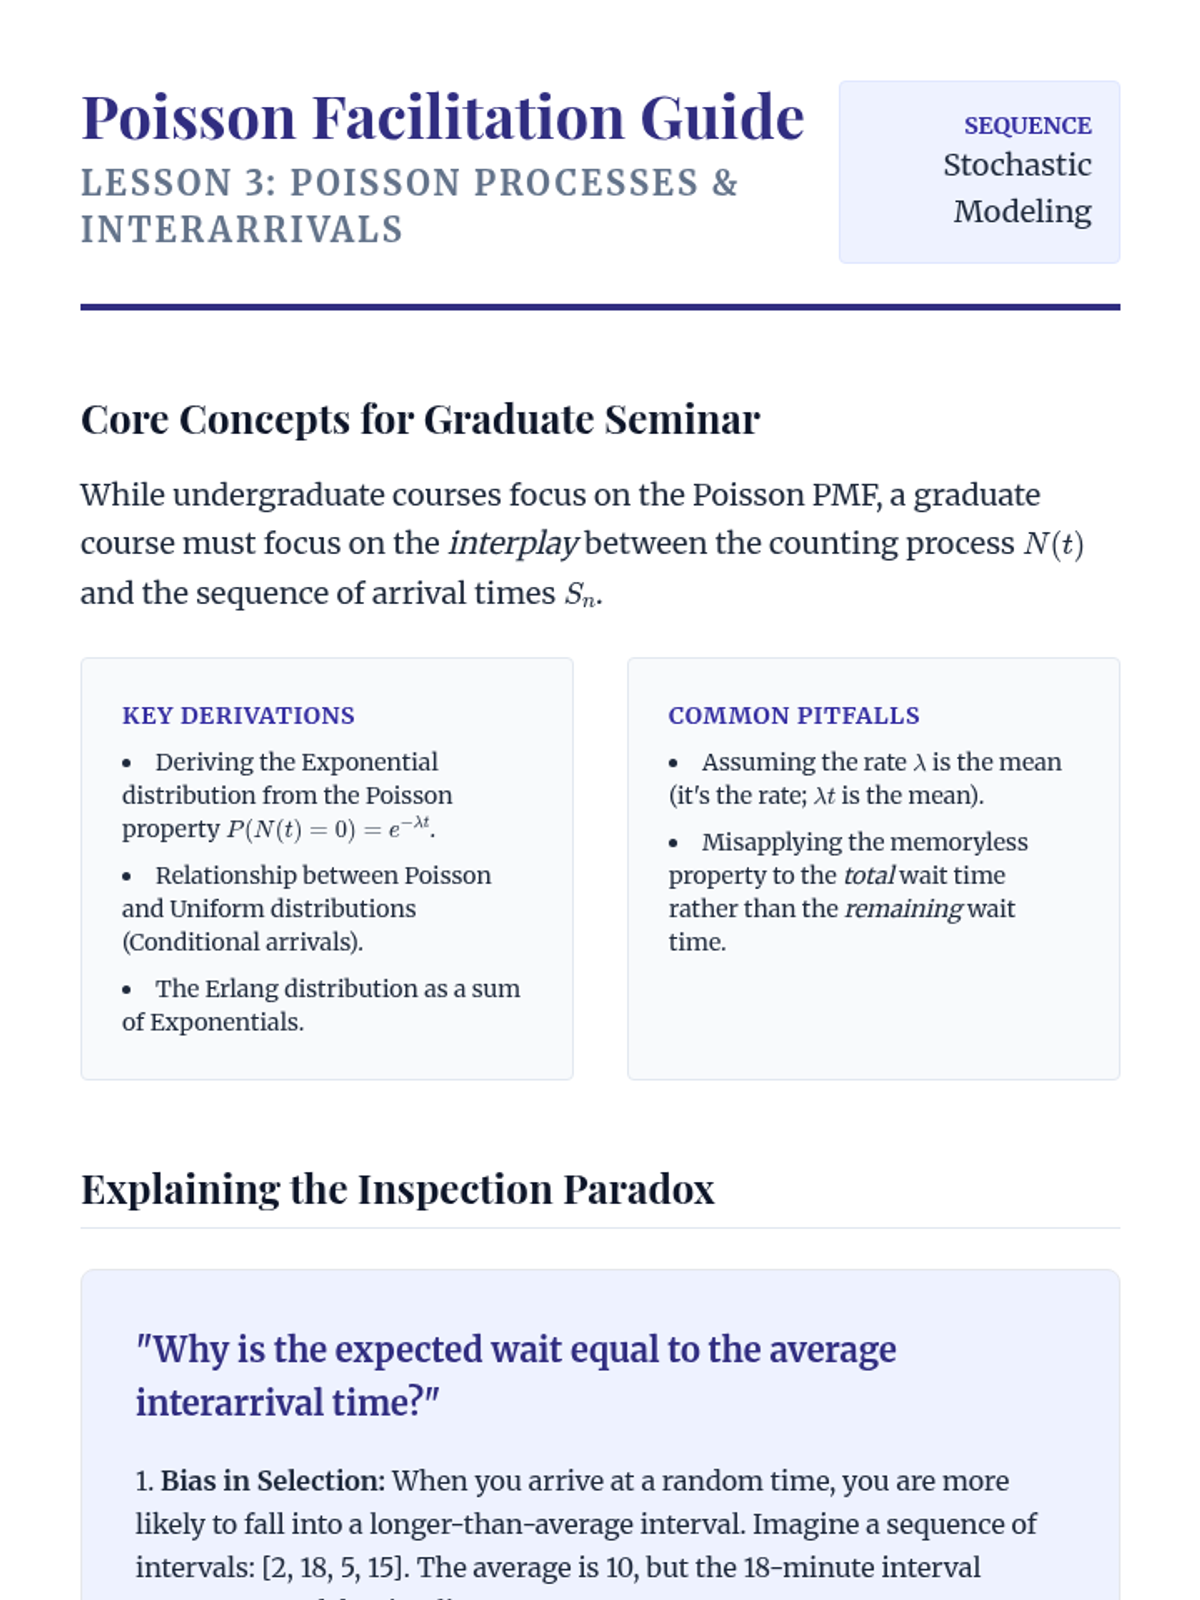
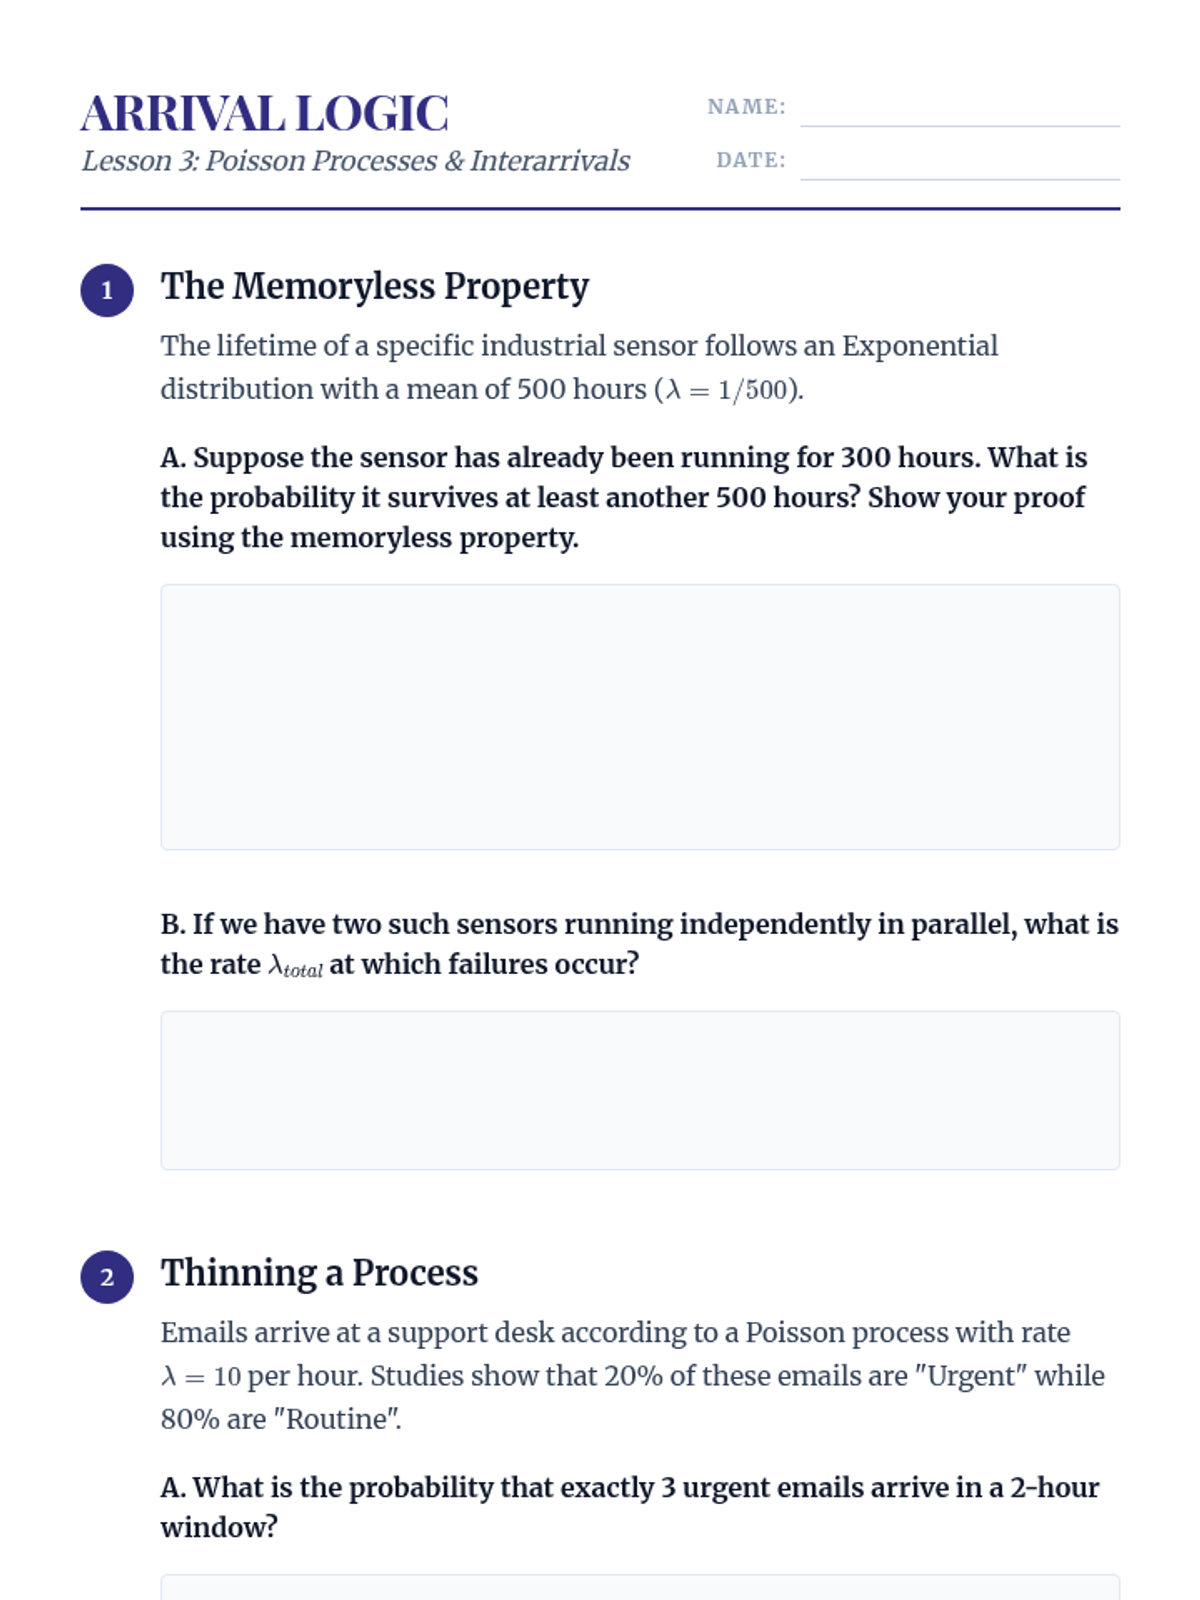
Investigation of the Poisson process, its relationship to the exponential distribution, and the implications of the memoryless property in continuous-time modeling.
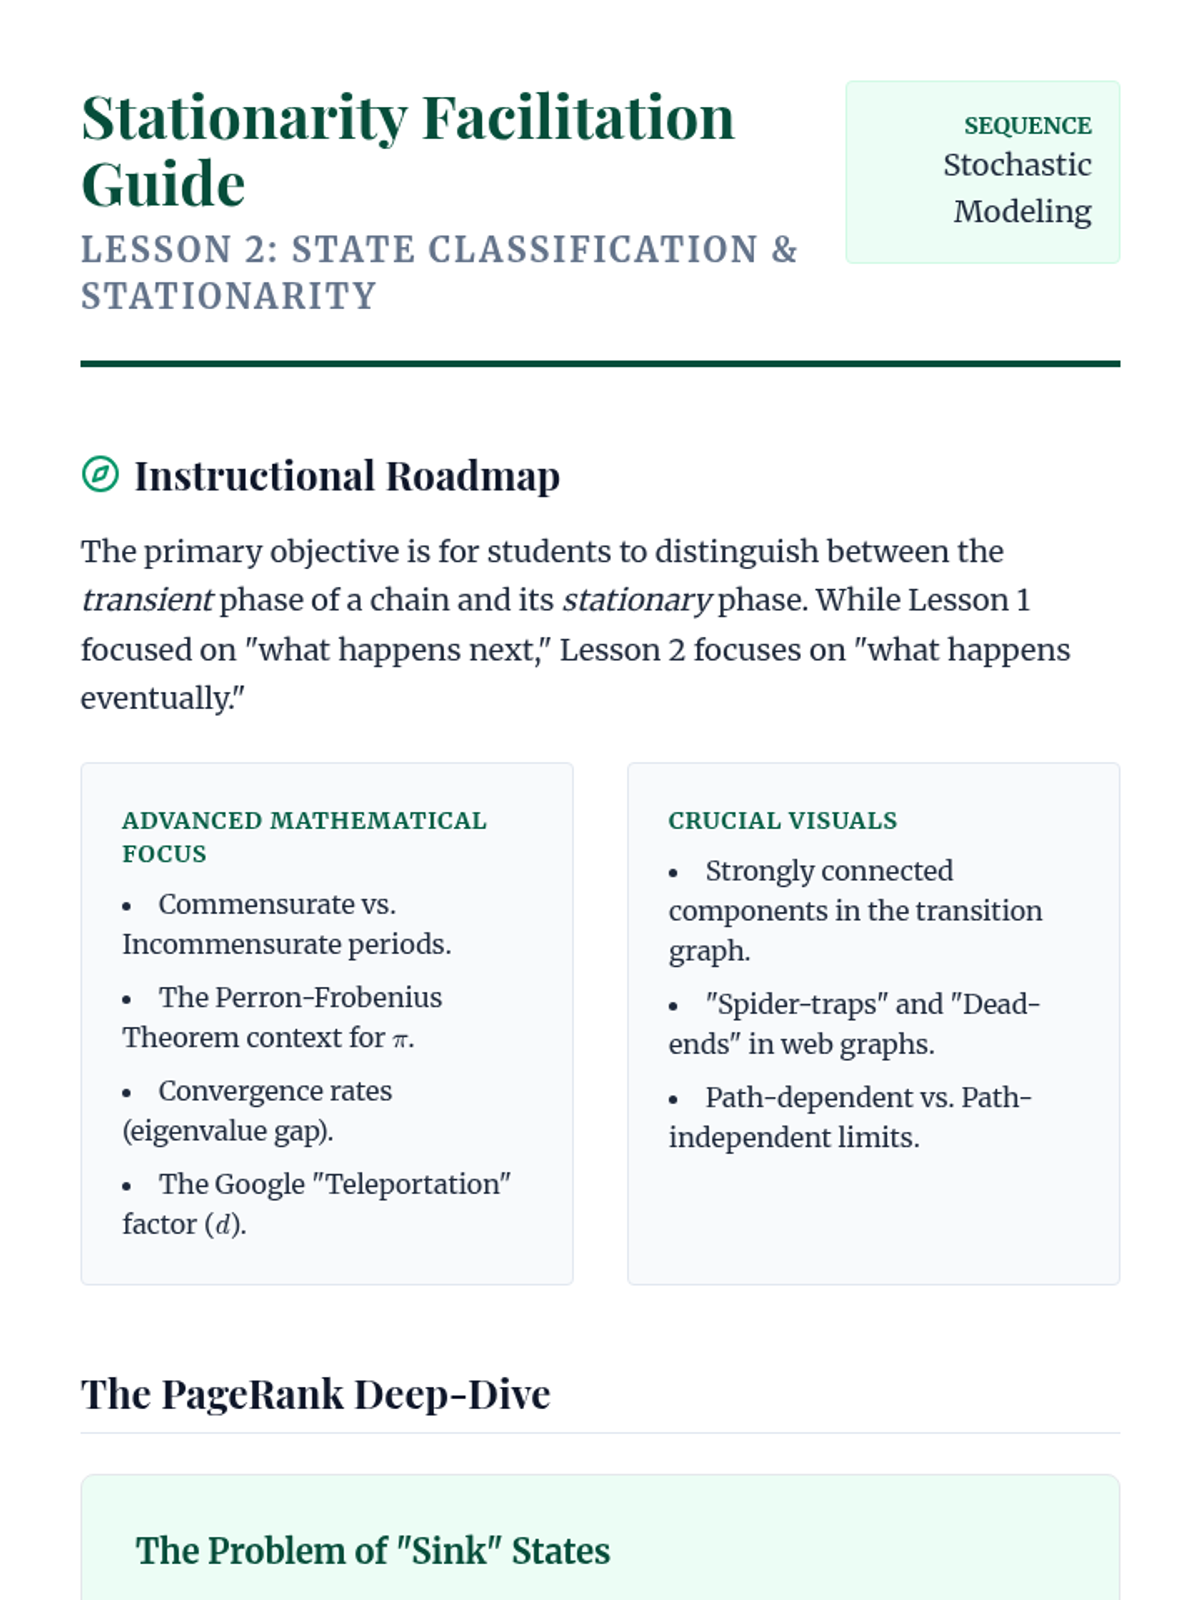
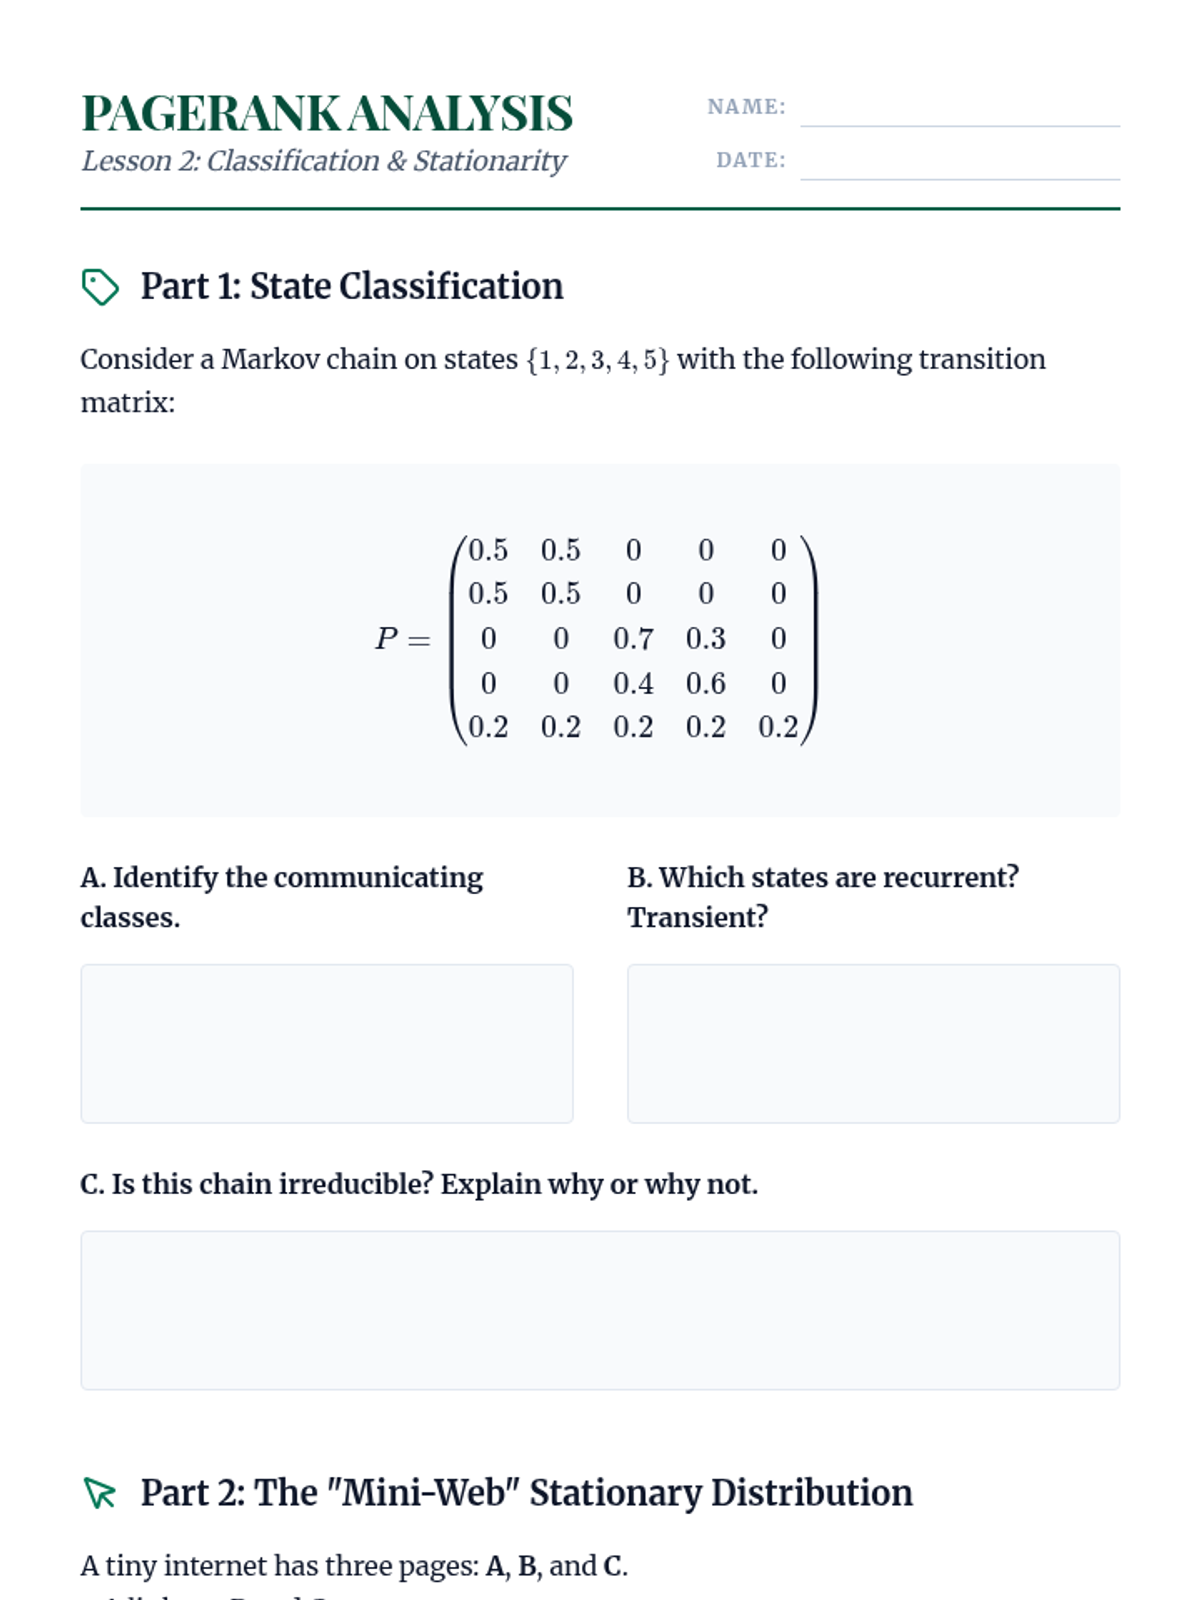
Analysis of the long-term behavior of Markov chains, focusing on state classification (recurrence, transience) and the computation of stationary distributions.
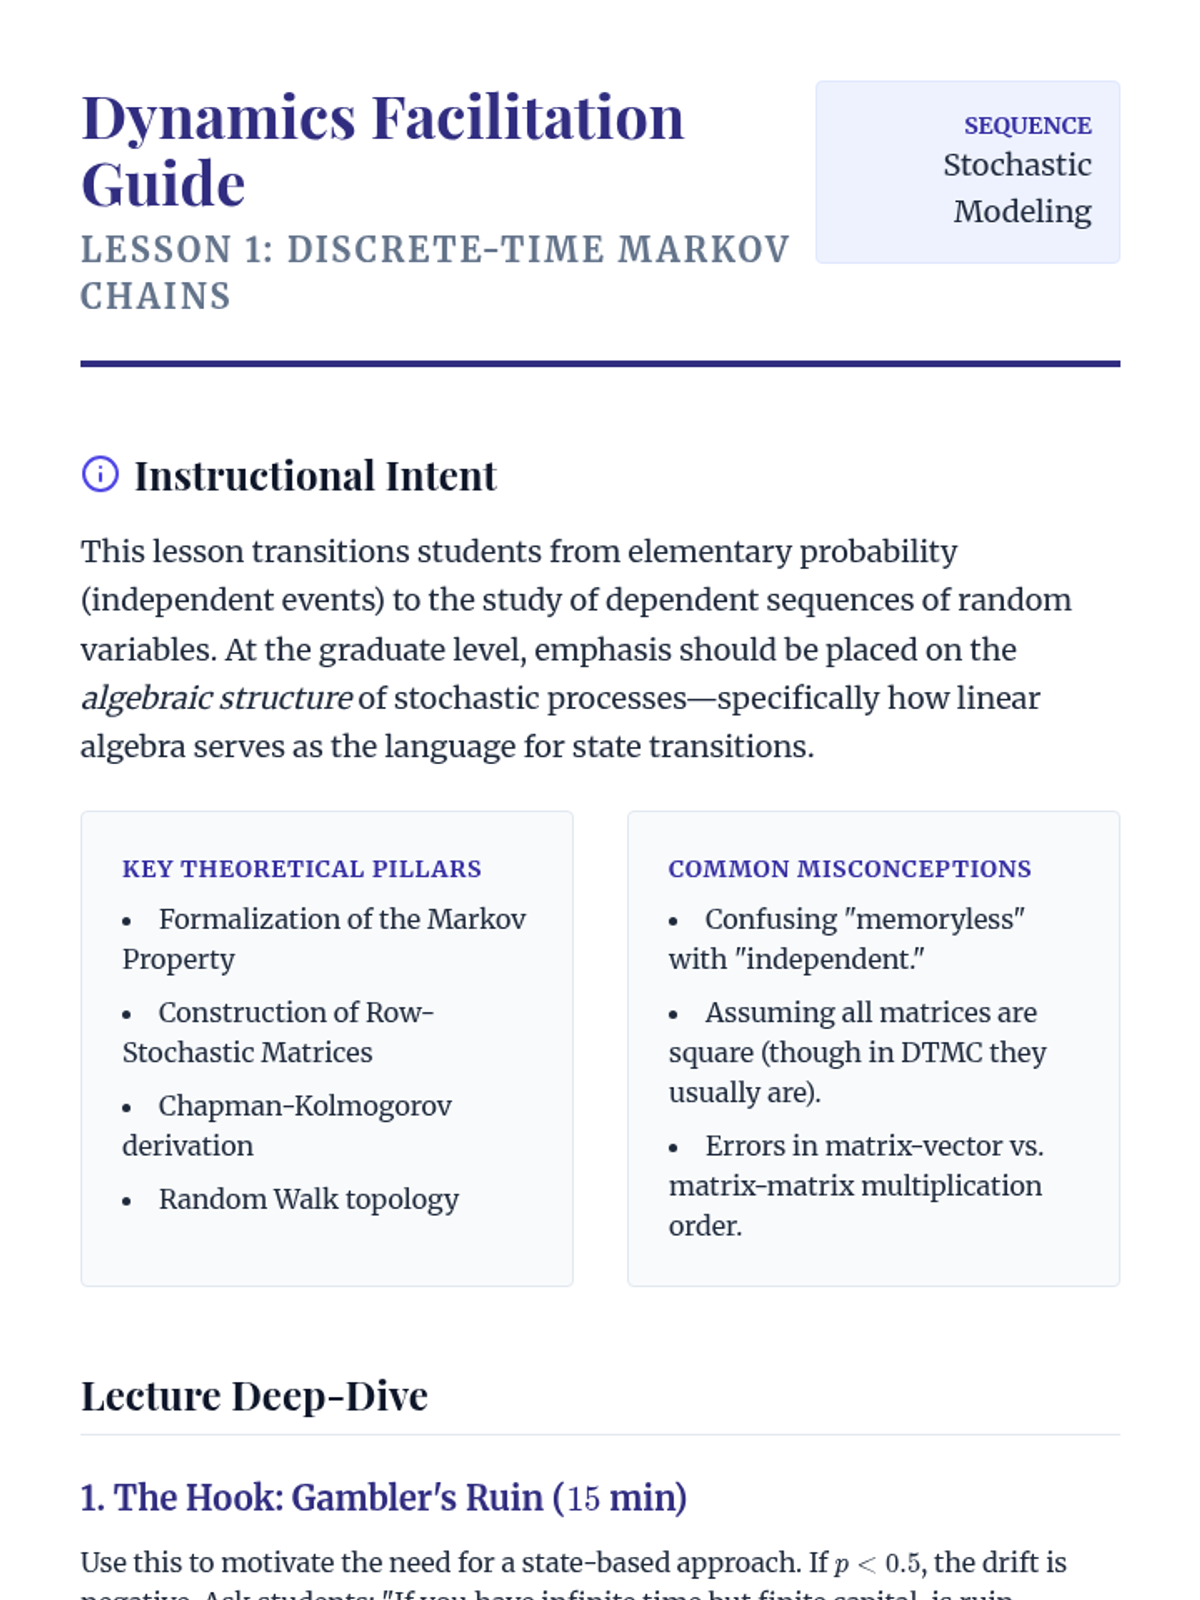
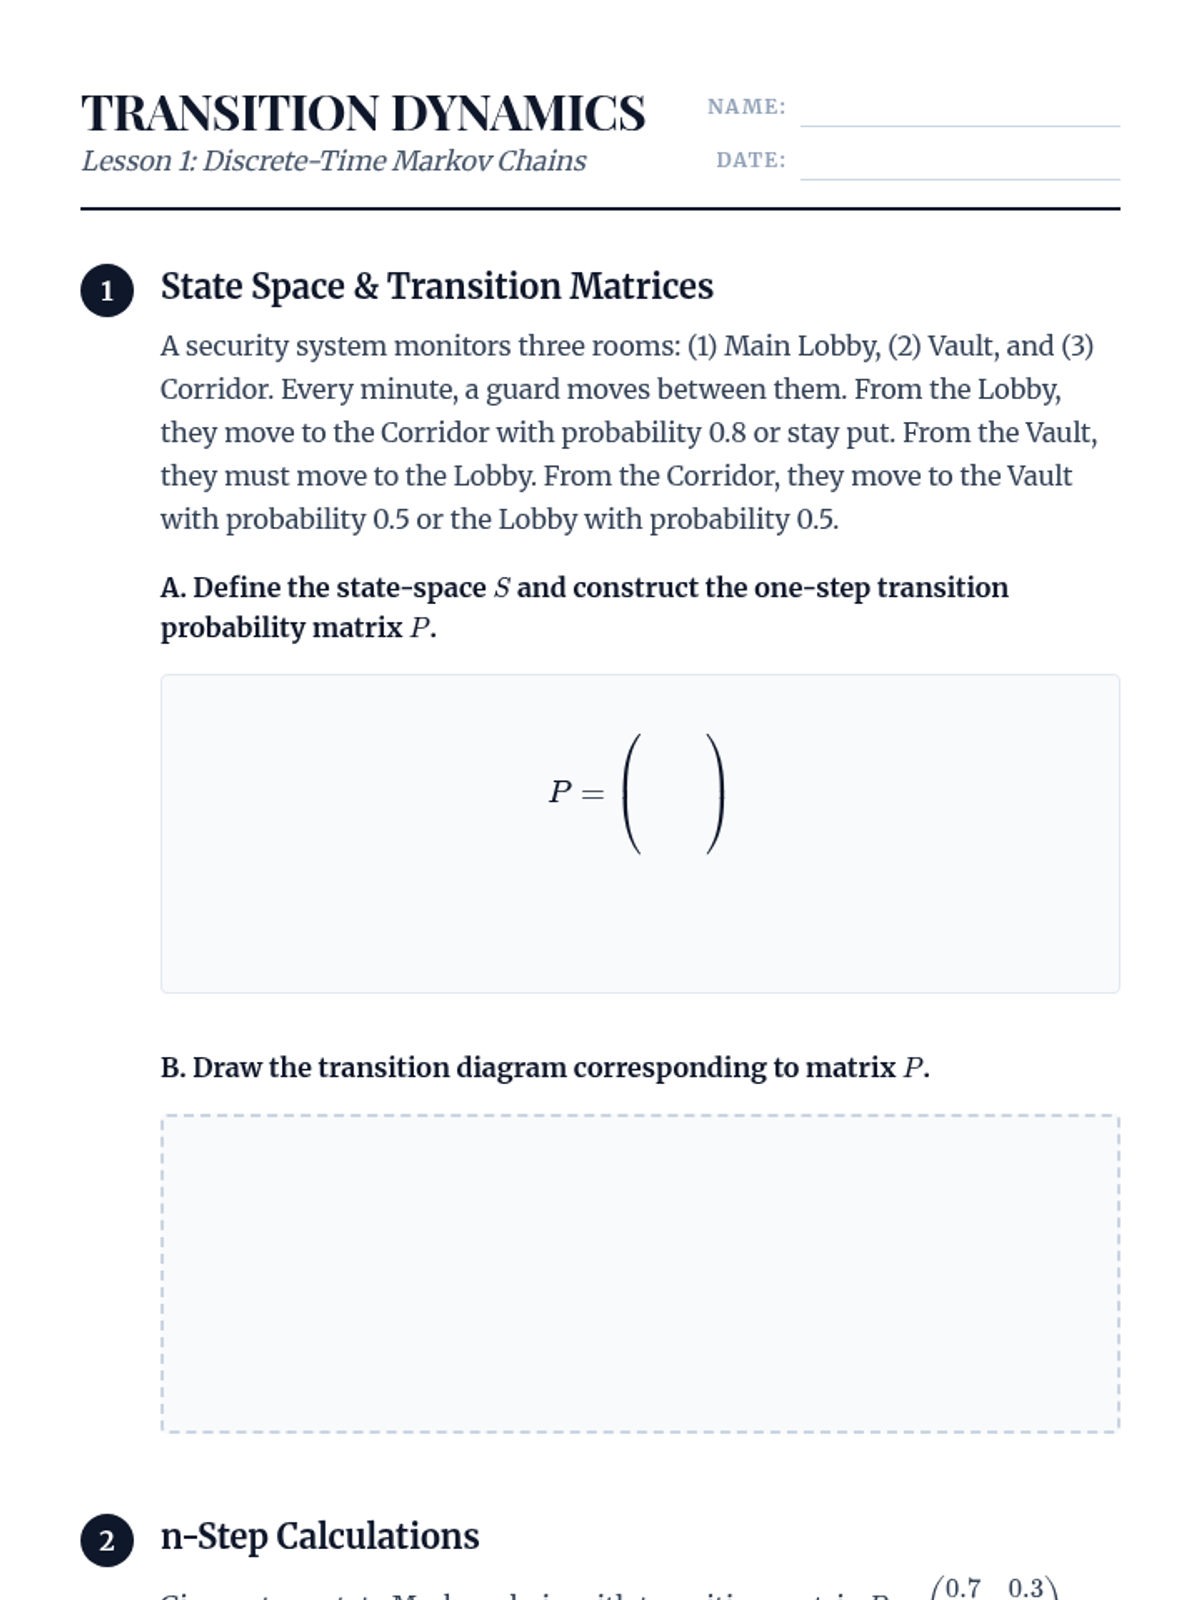
Foundational concepts of Markov processes, the Markov property, and the mathematical framework of transition matrices and Chapman-Kolmogorov equations.
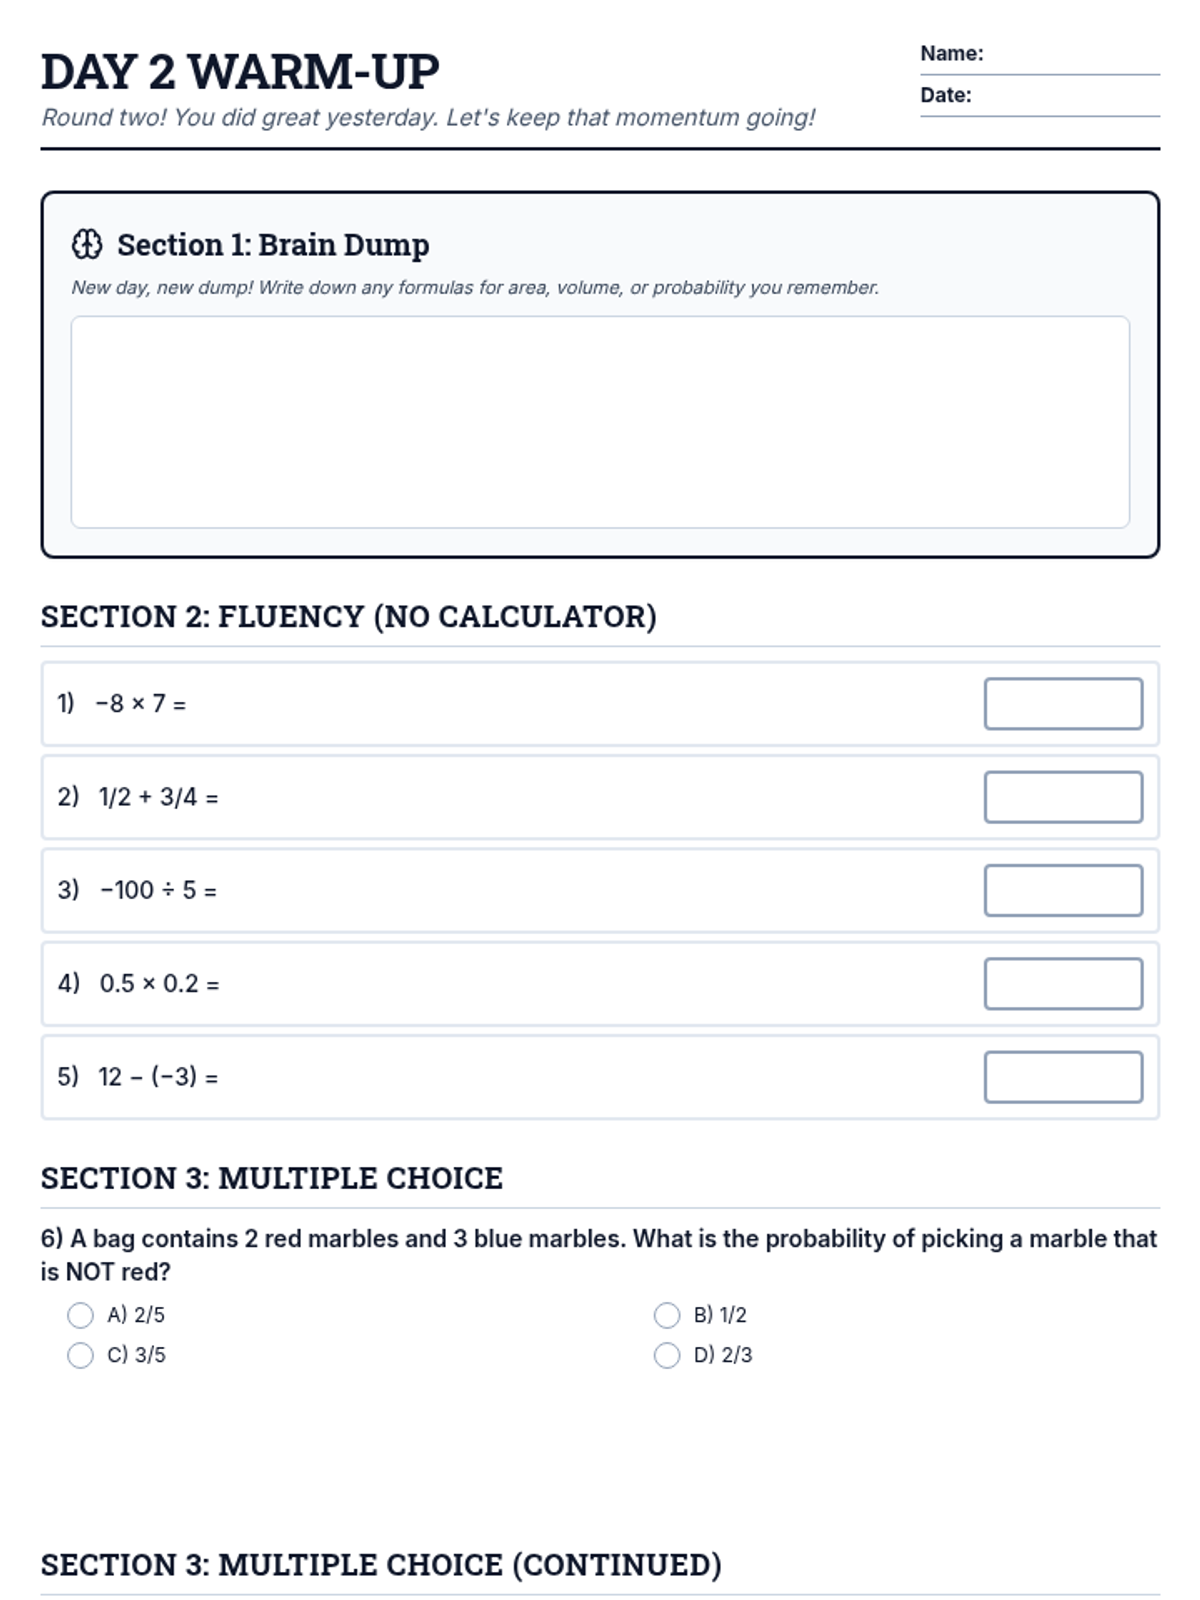
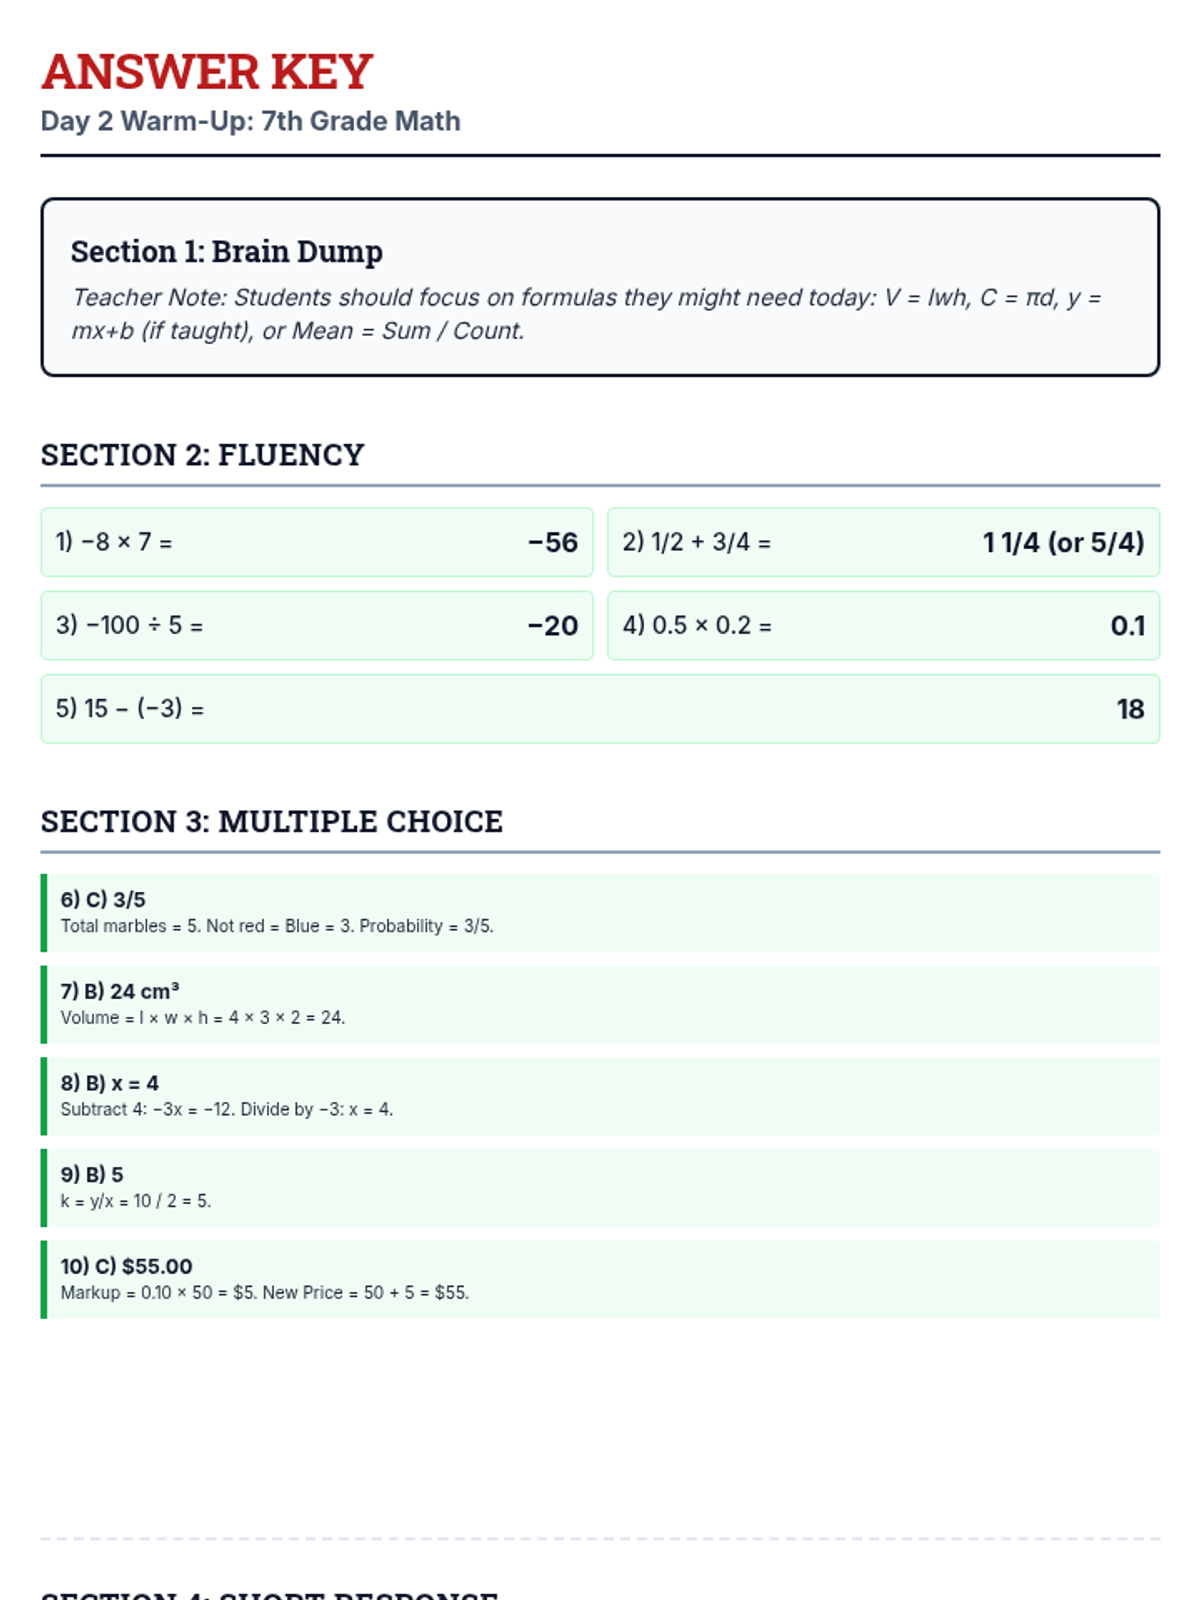
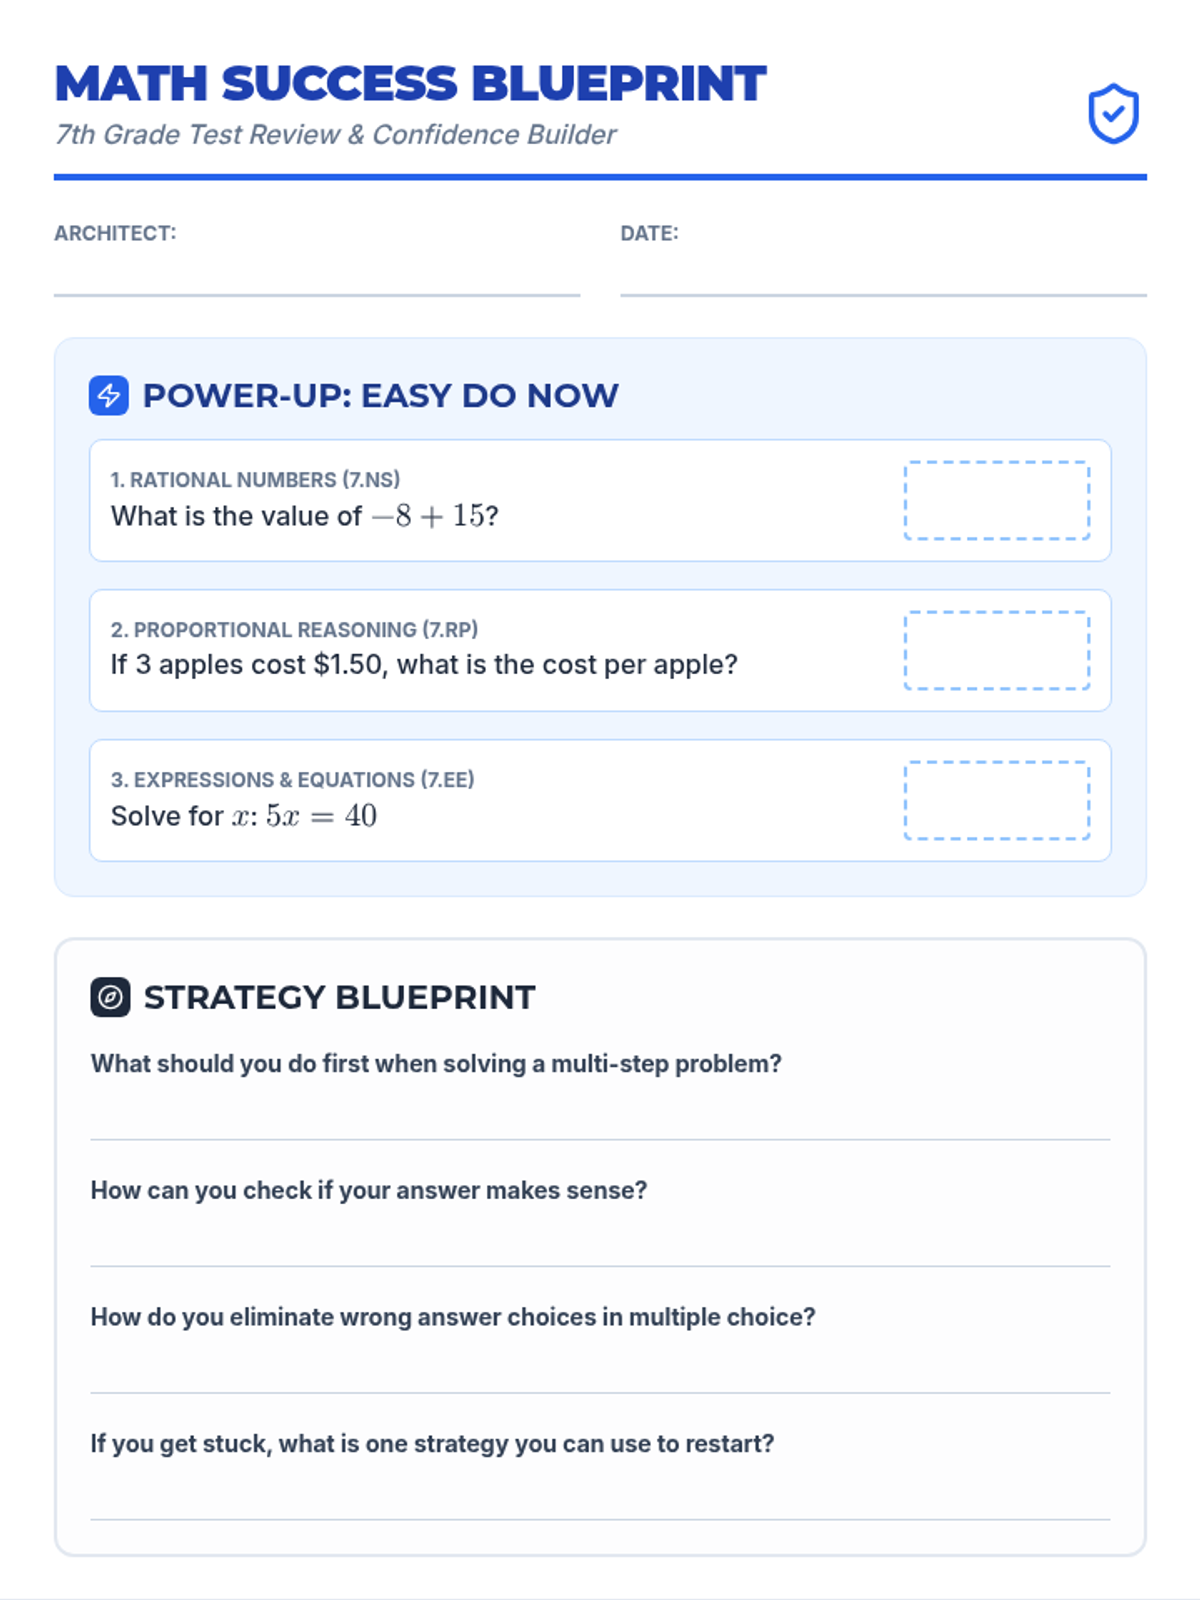
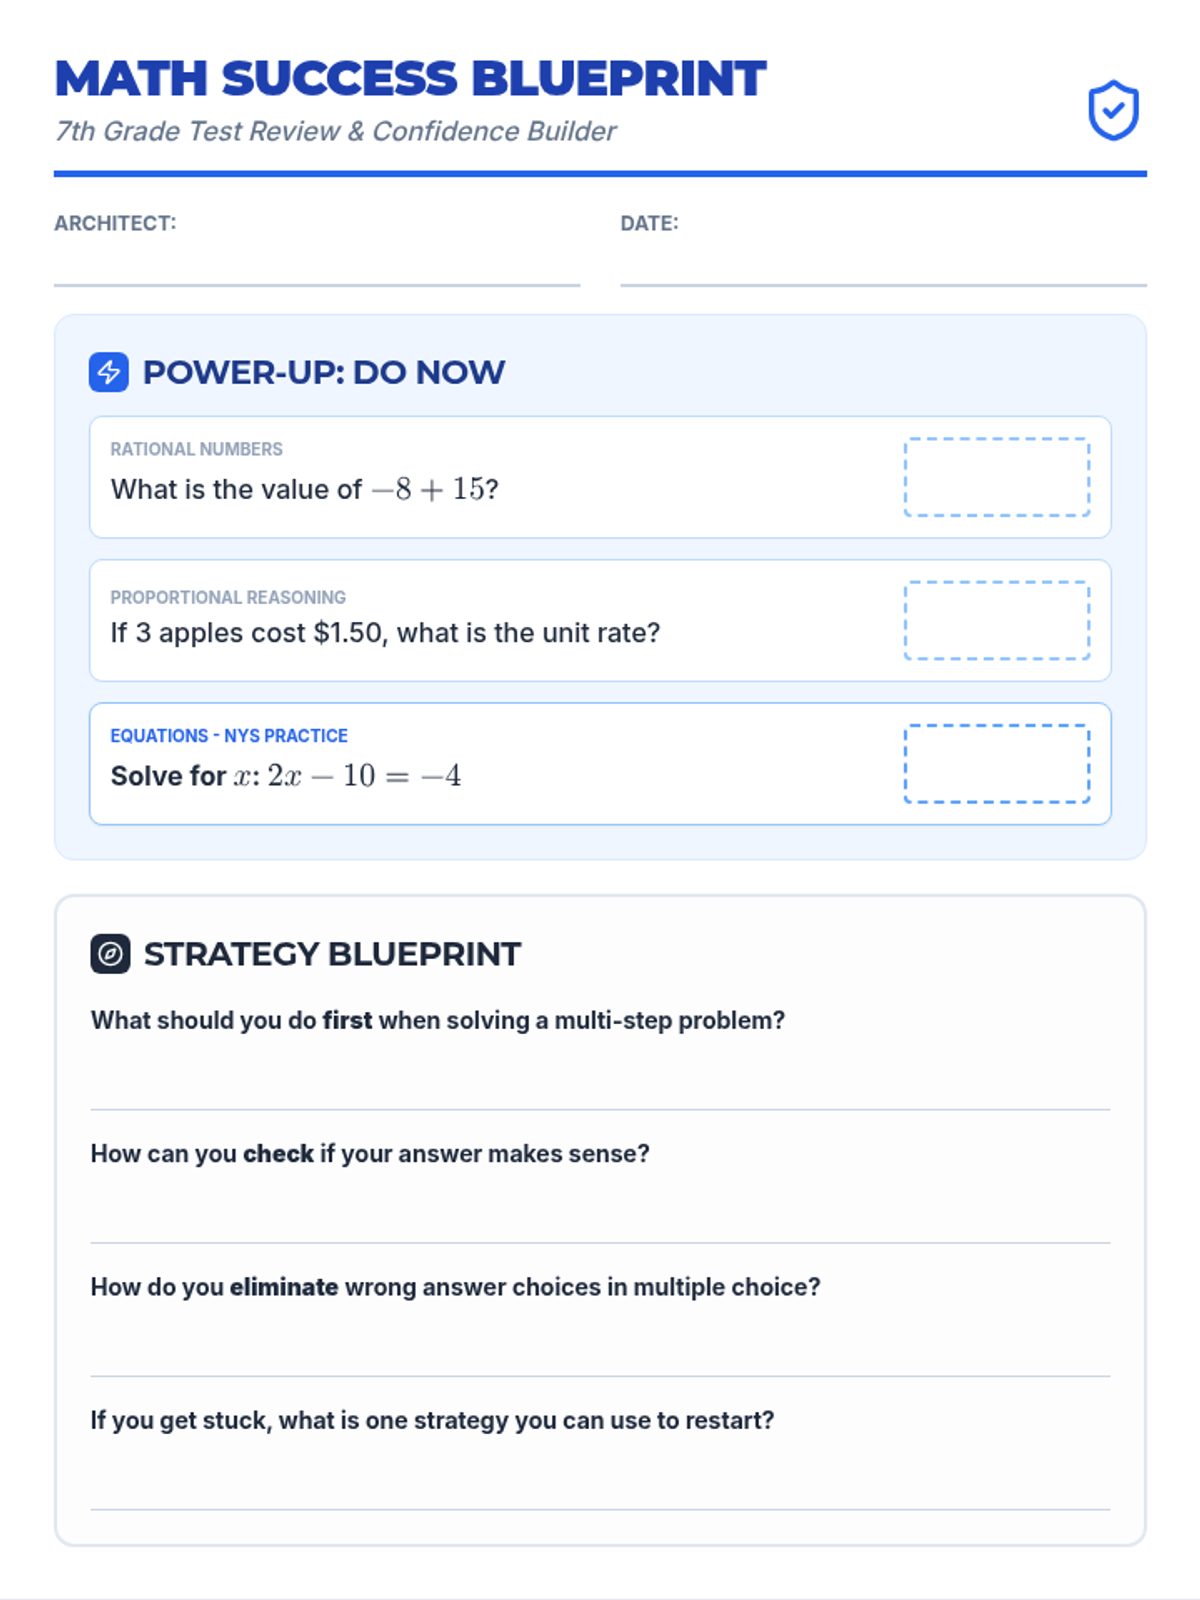
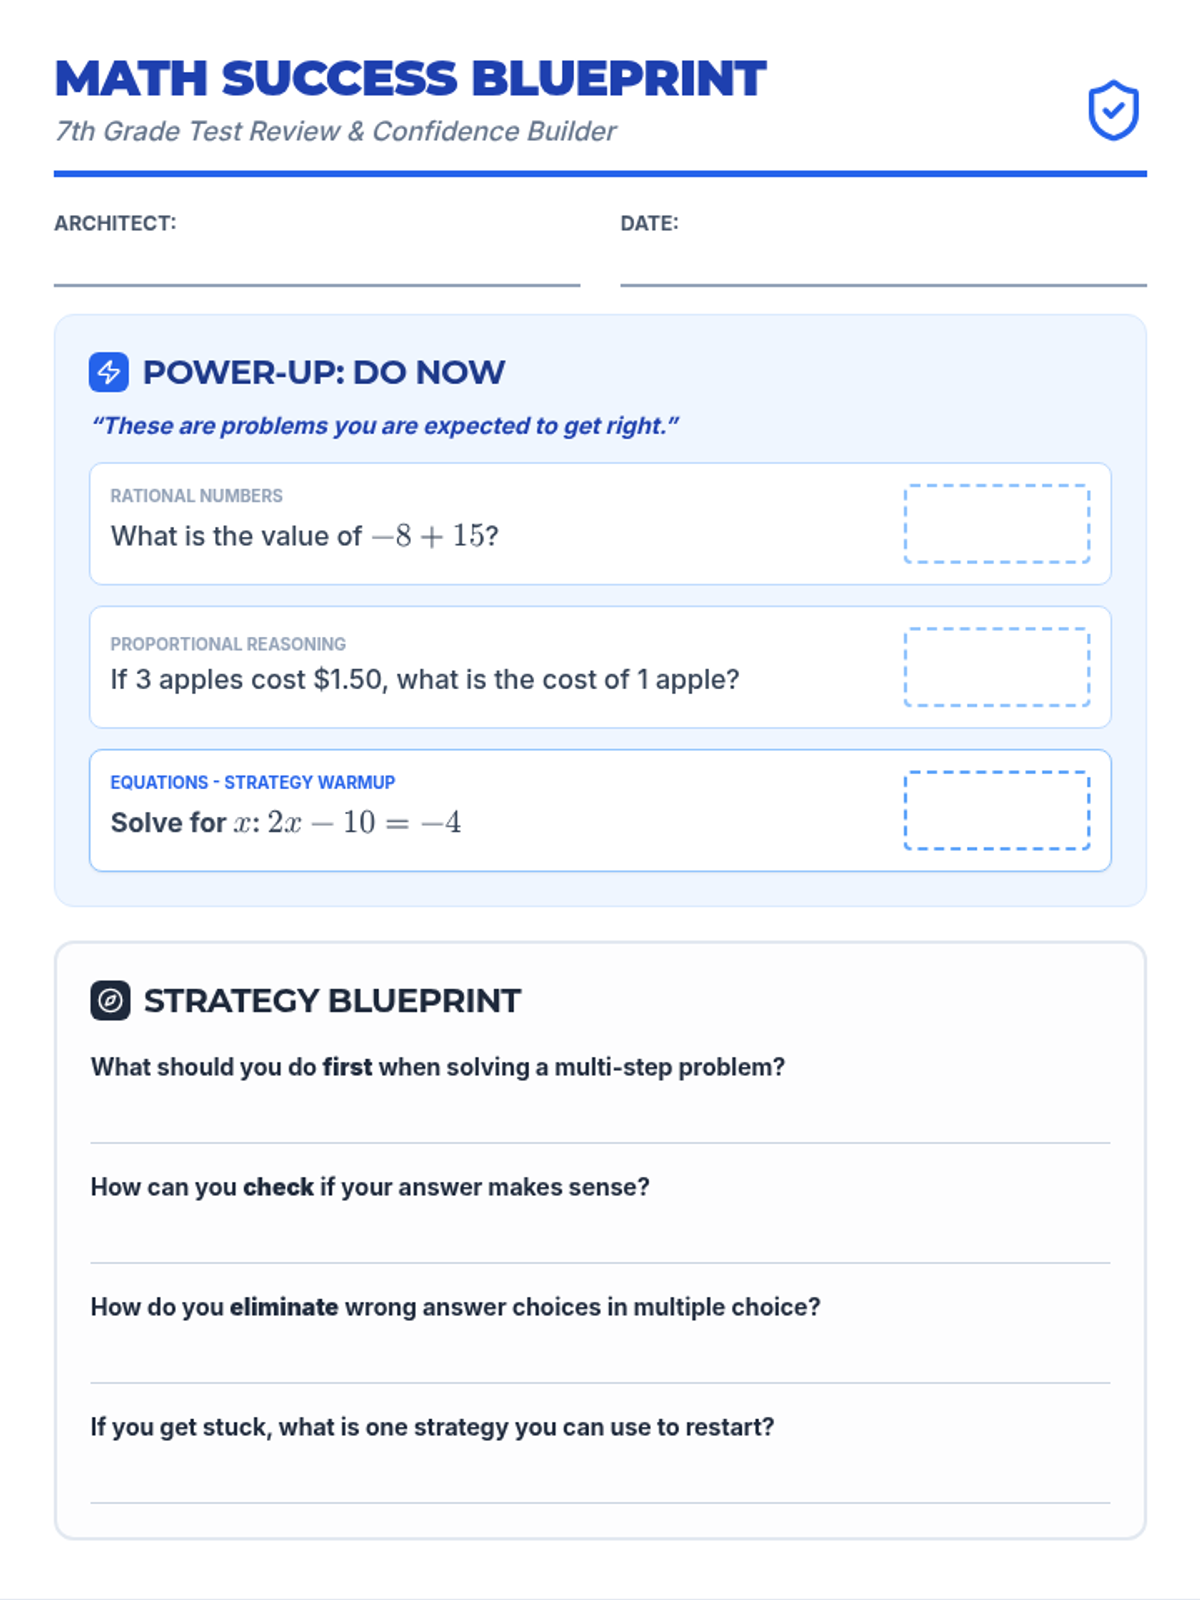
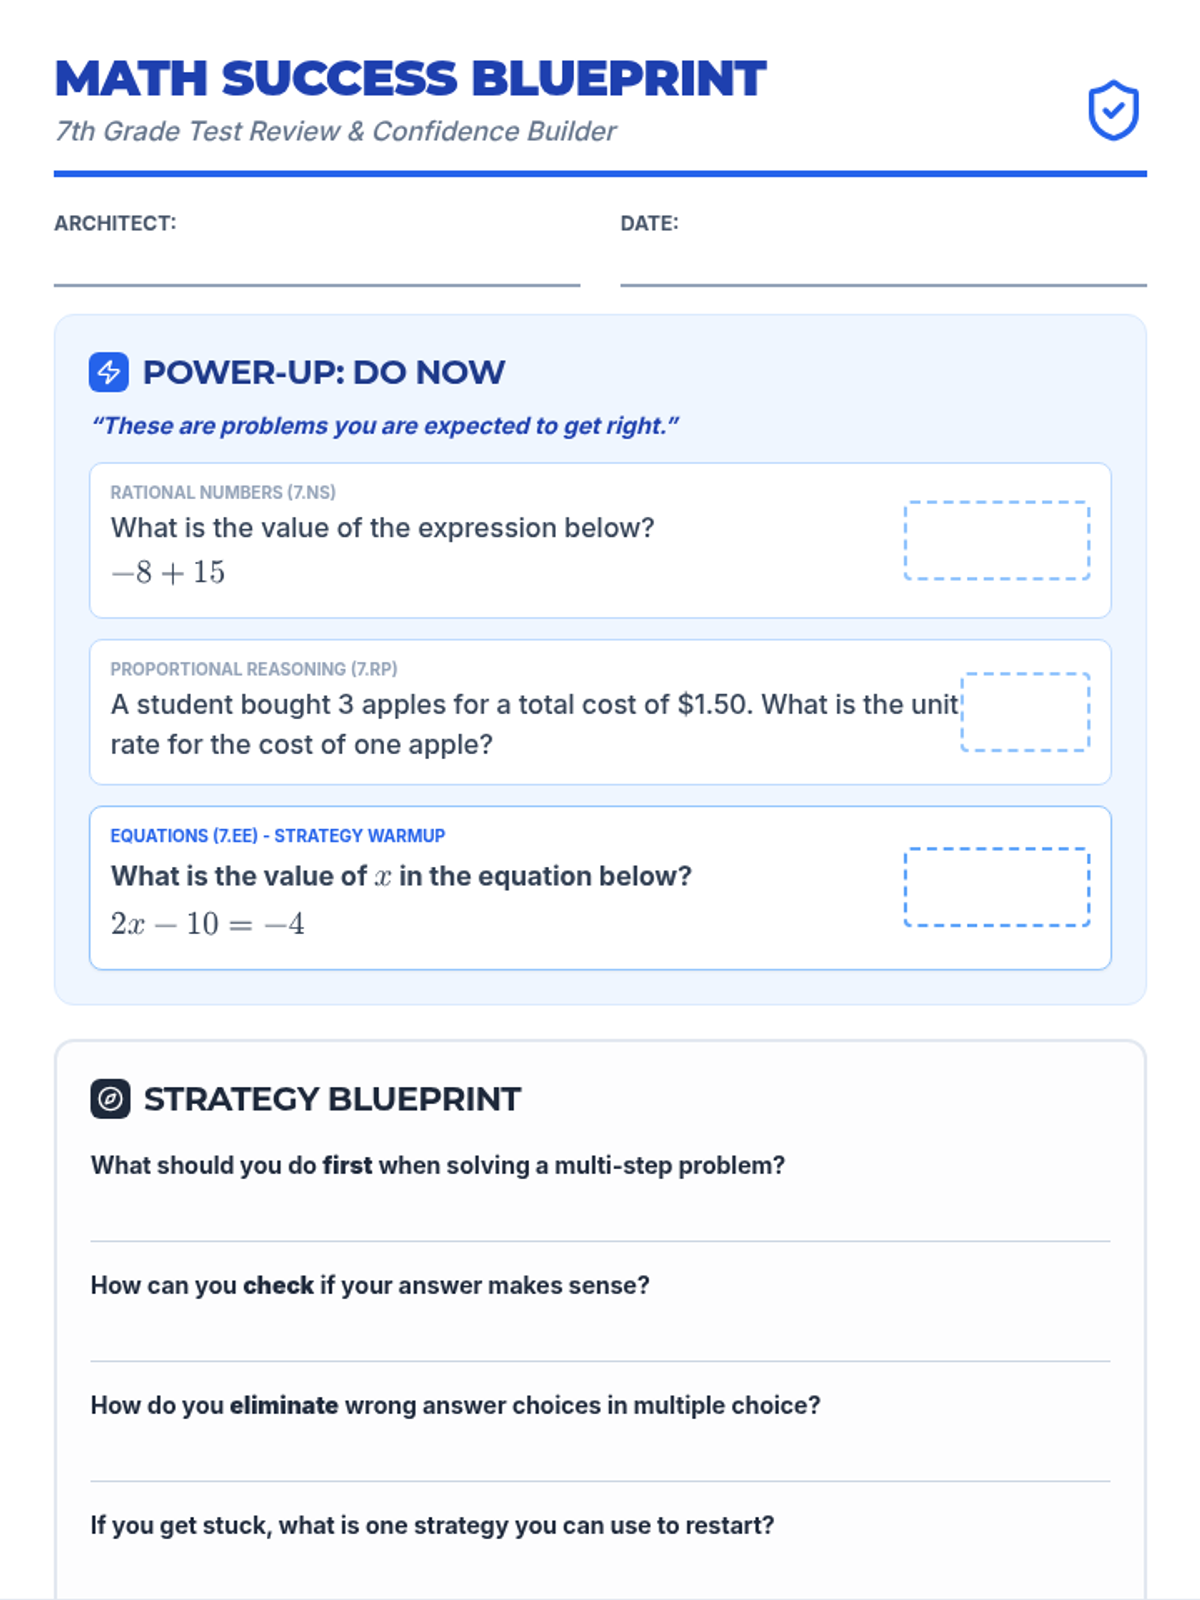
A low-pressure, confidence-building morning work packet designed for 7th-grade students on the day of their state math exam to help them warm up their thinking.
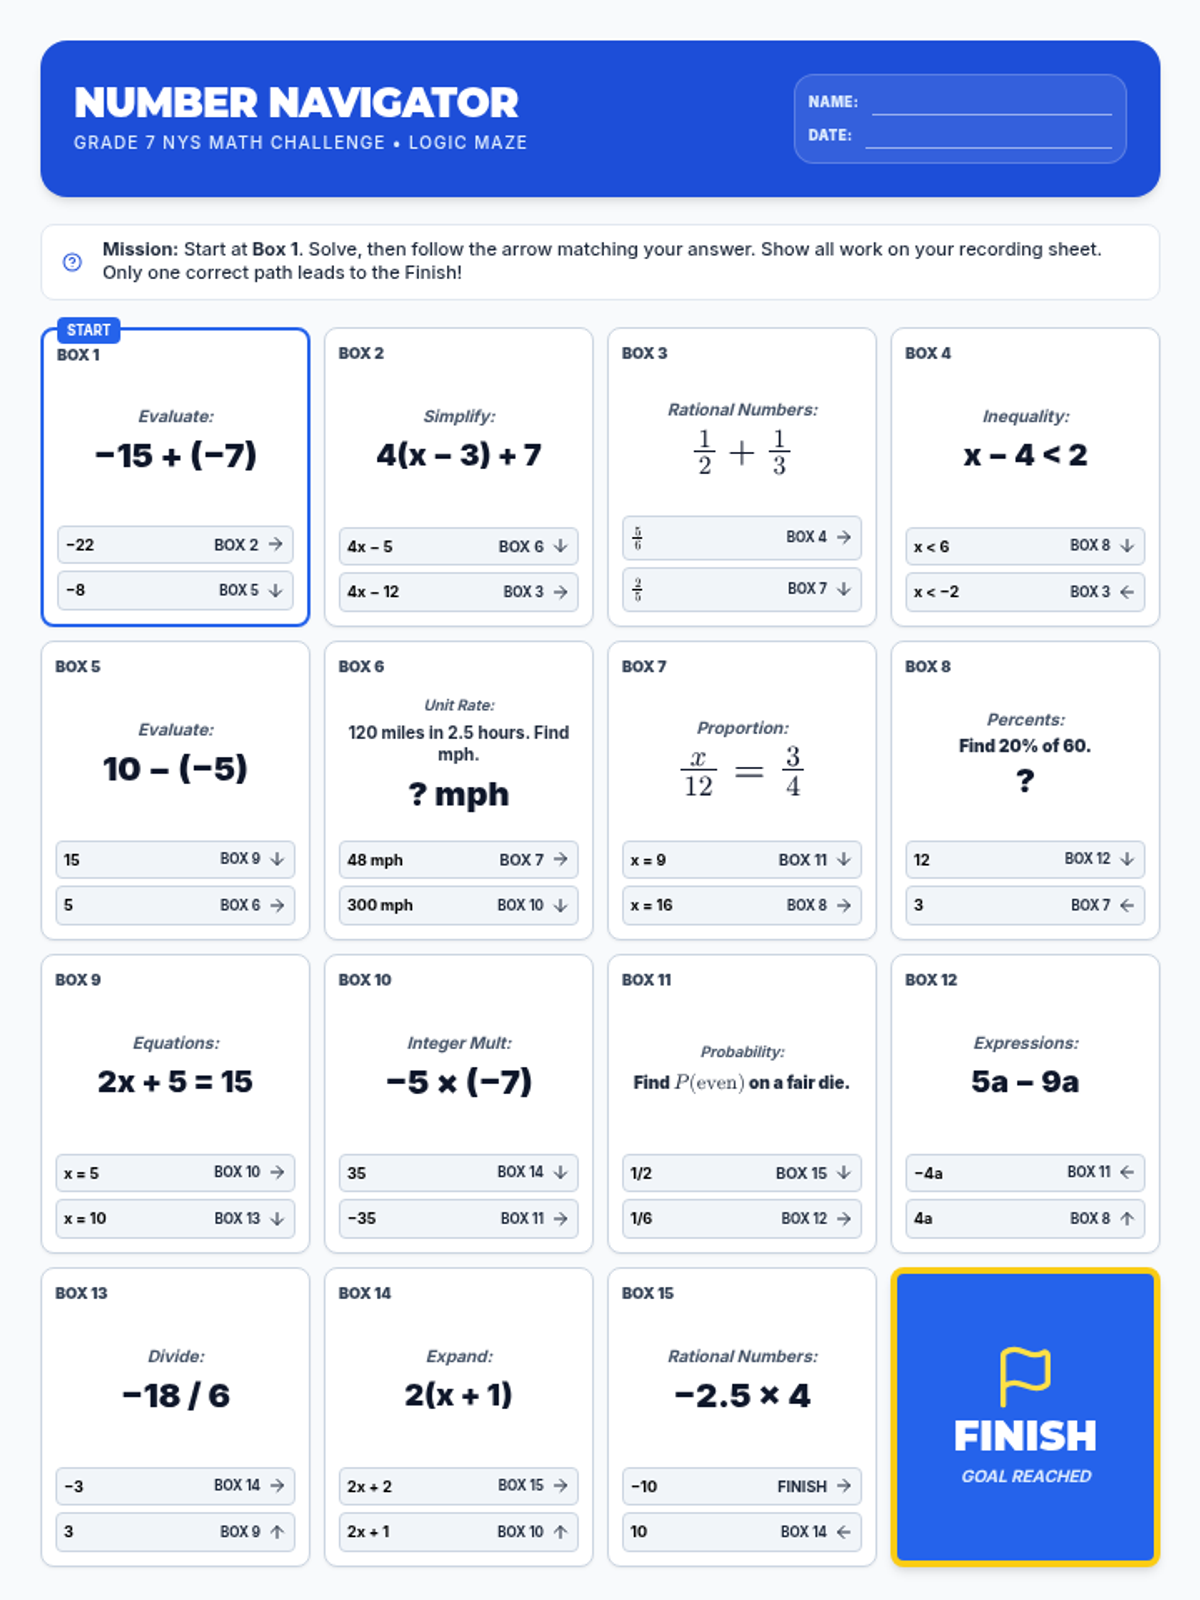
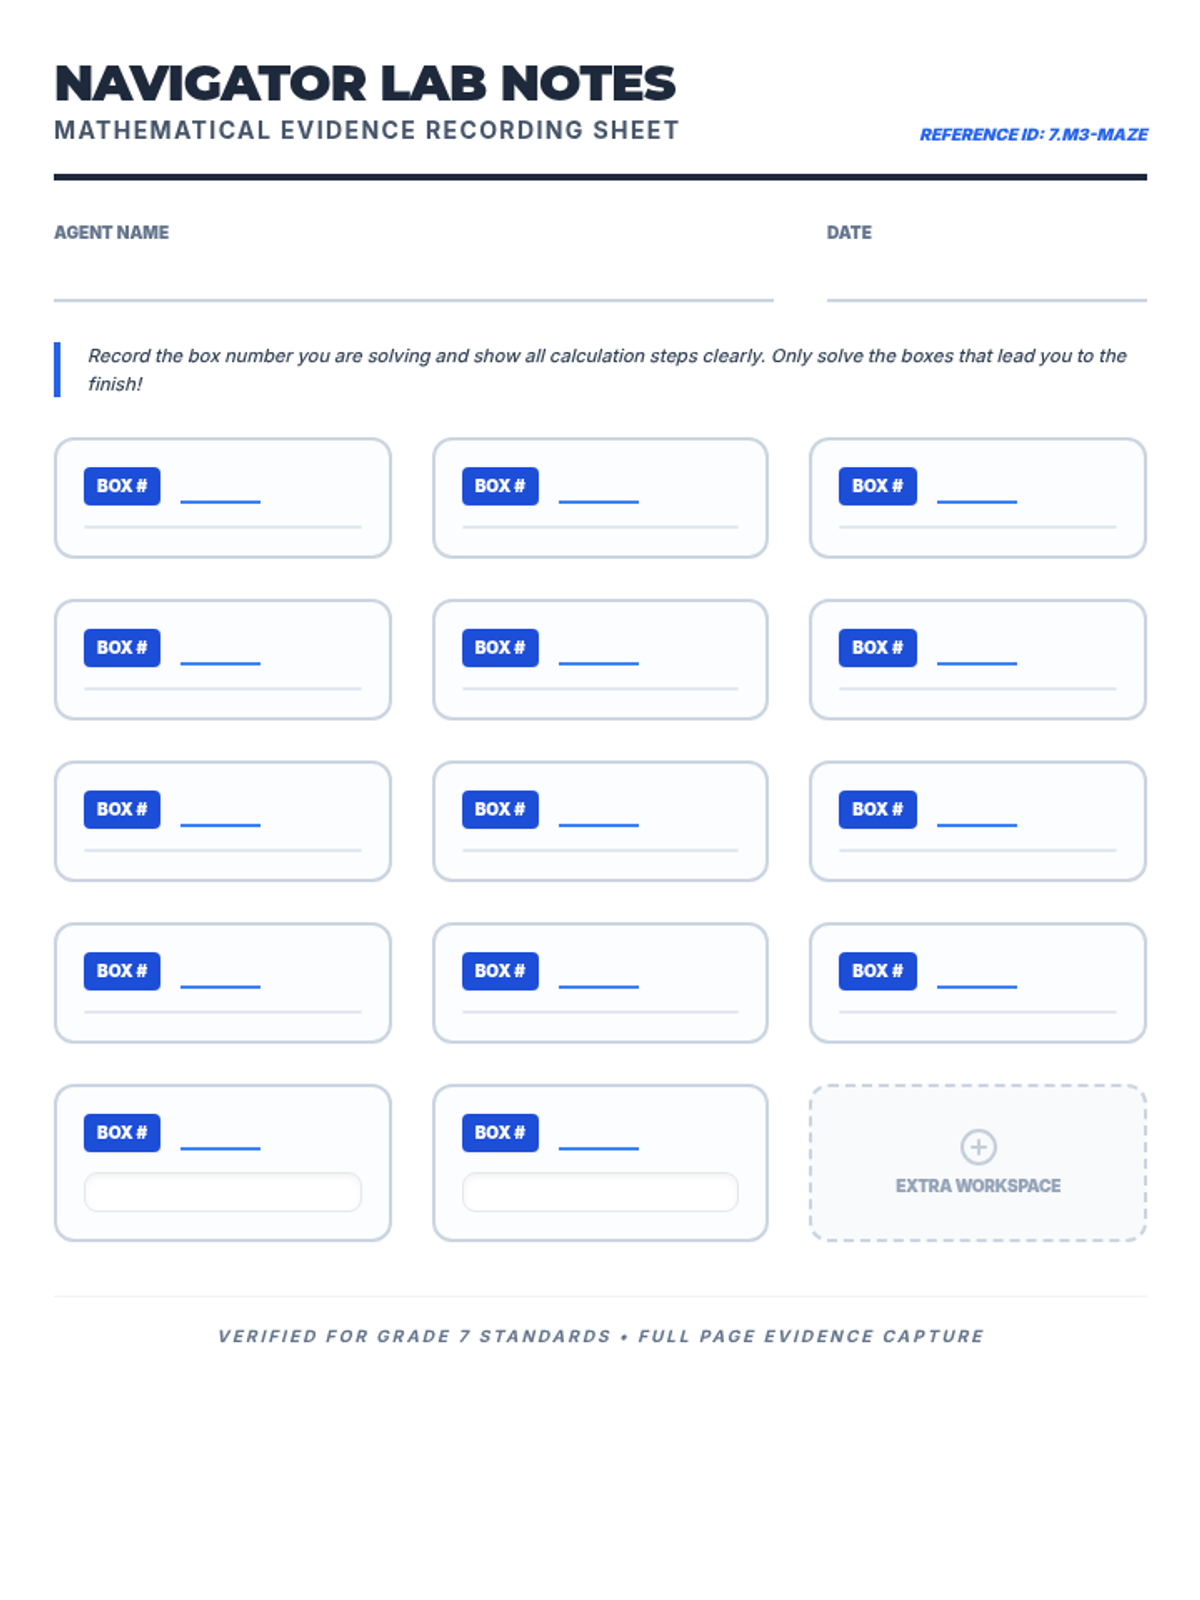
A comprehensive 7th-grade math review using a maze-style activity to practice operations with rational numbers, expressions, equations, ratios, and probability.
A confidence-building review session designed to reduce math anxiety and reinforce core 7th grade CCSS skills through low-stakes practice and strategy reflection.
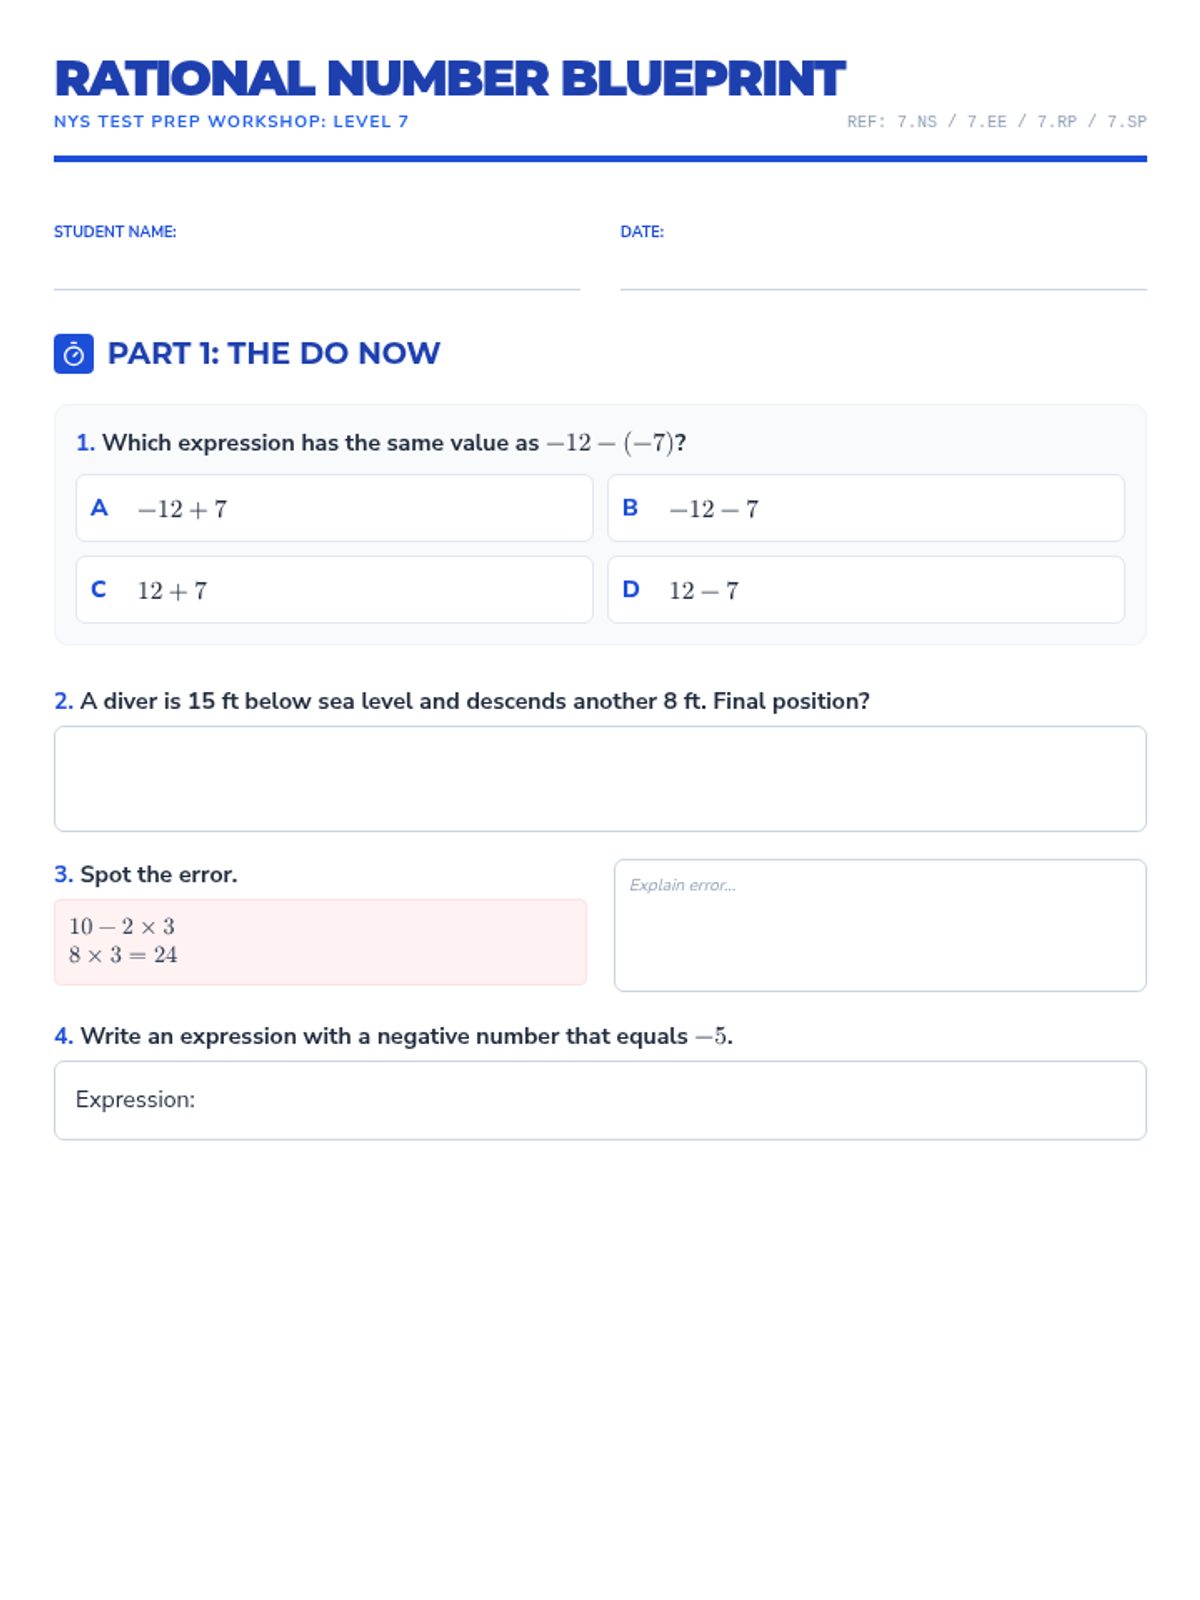
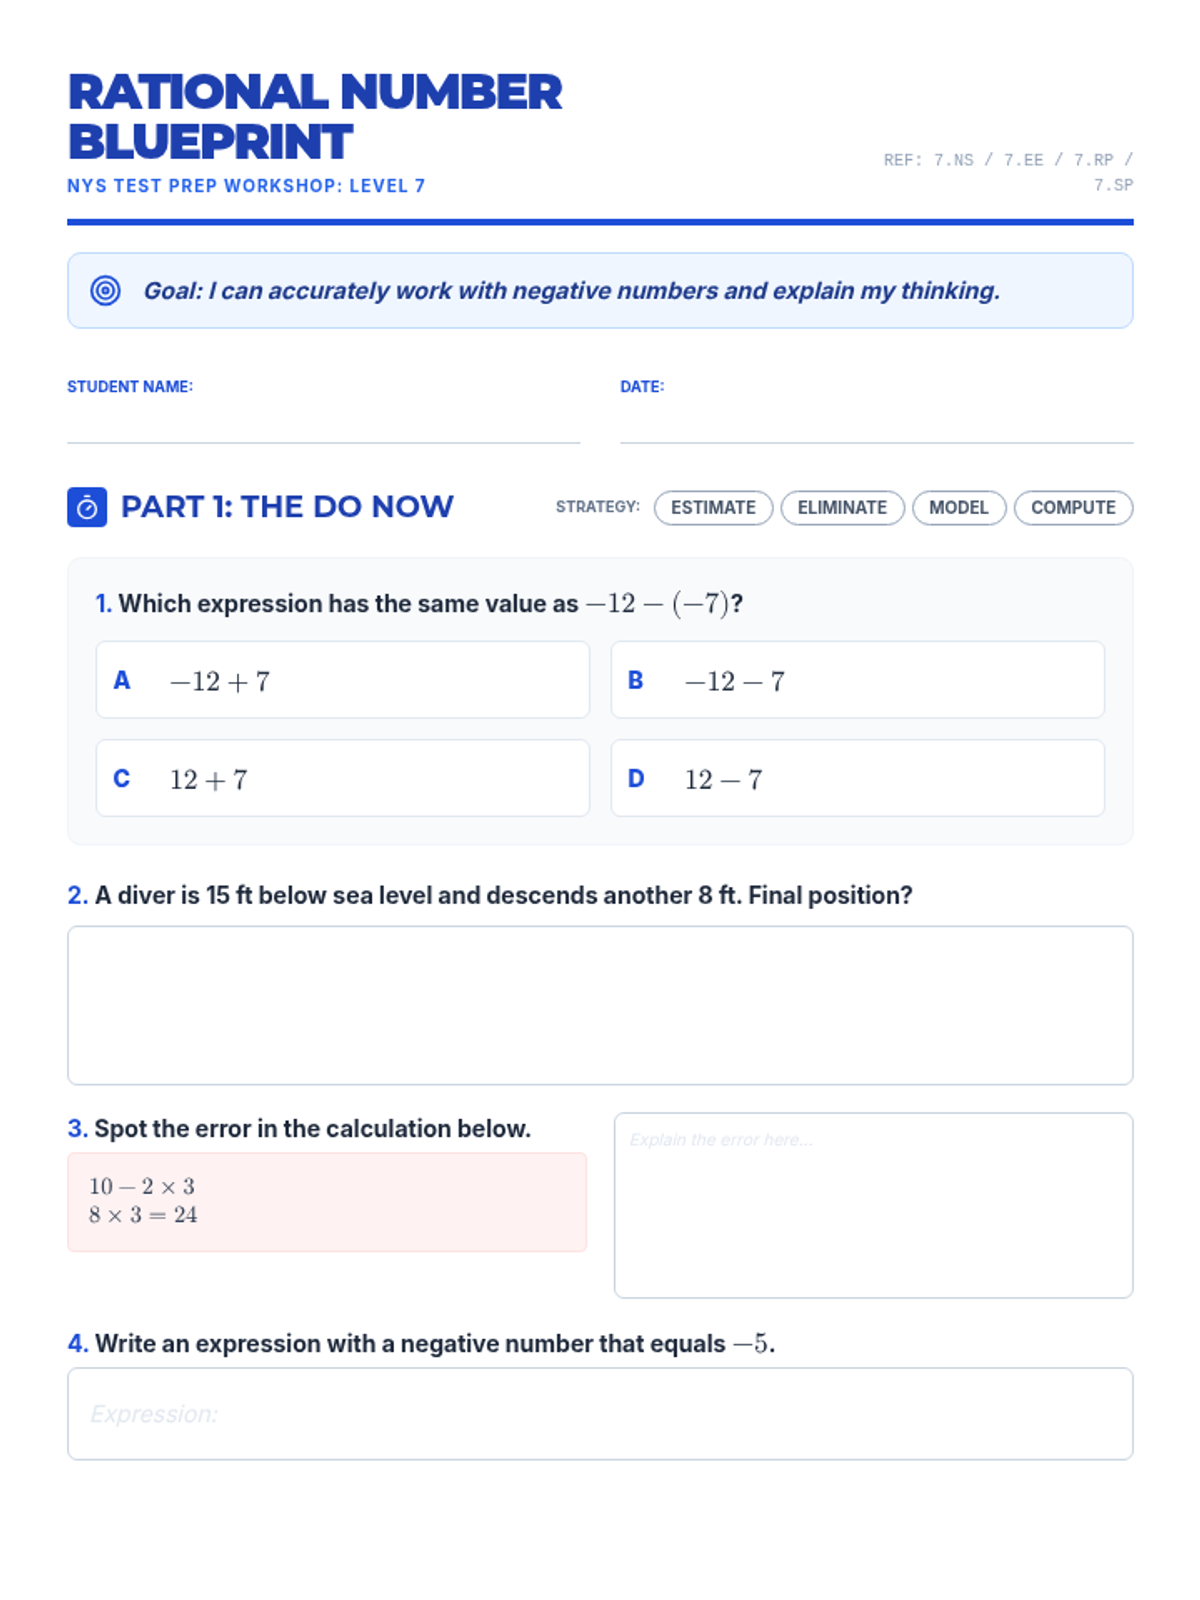
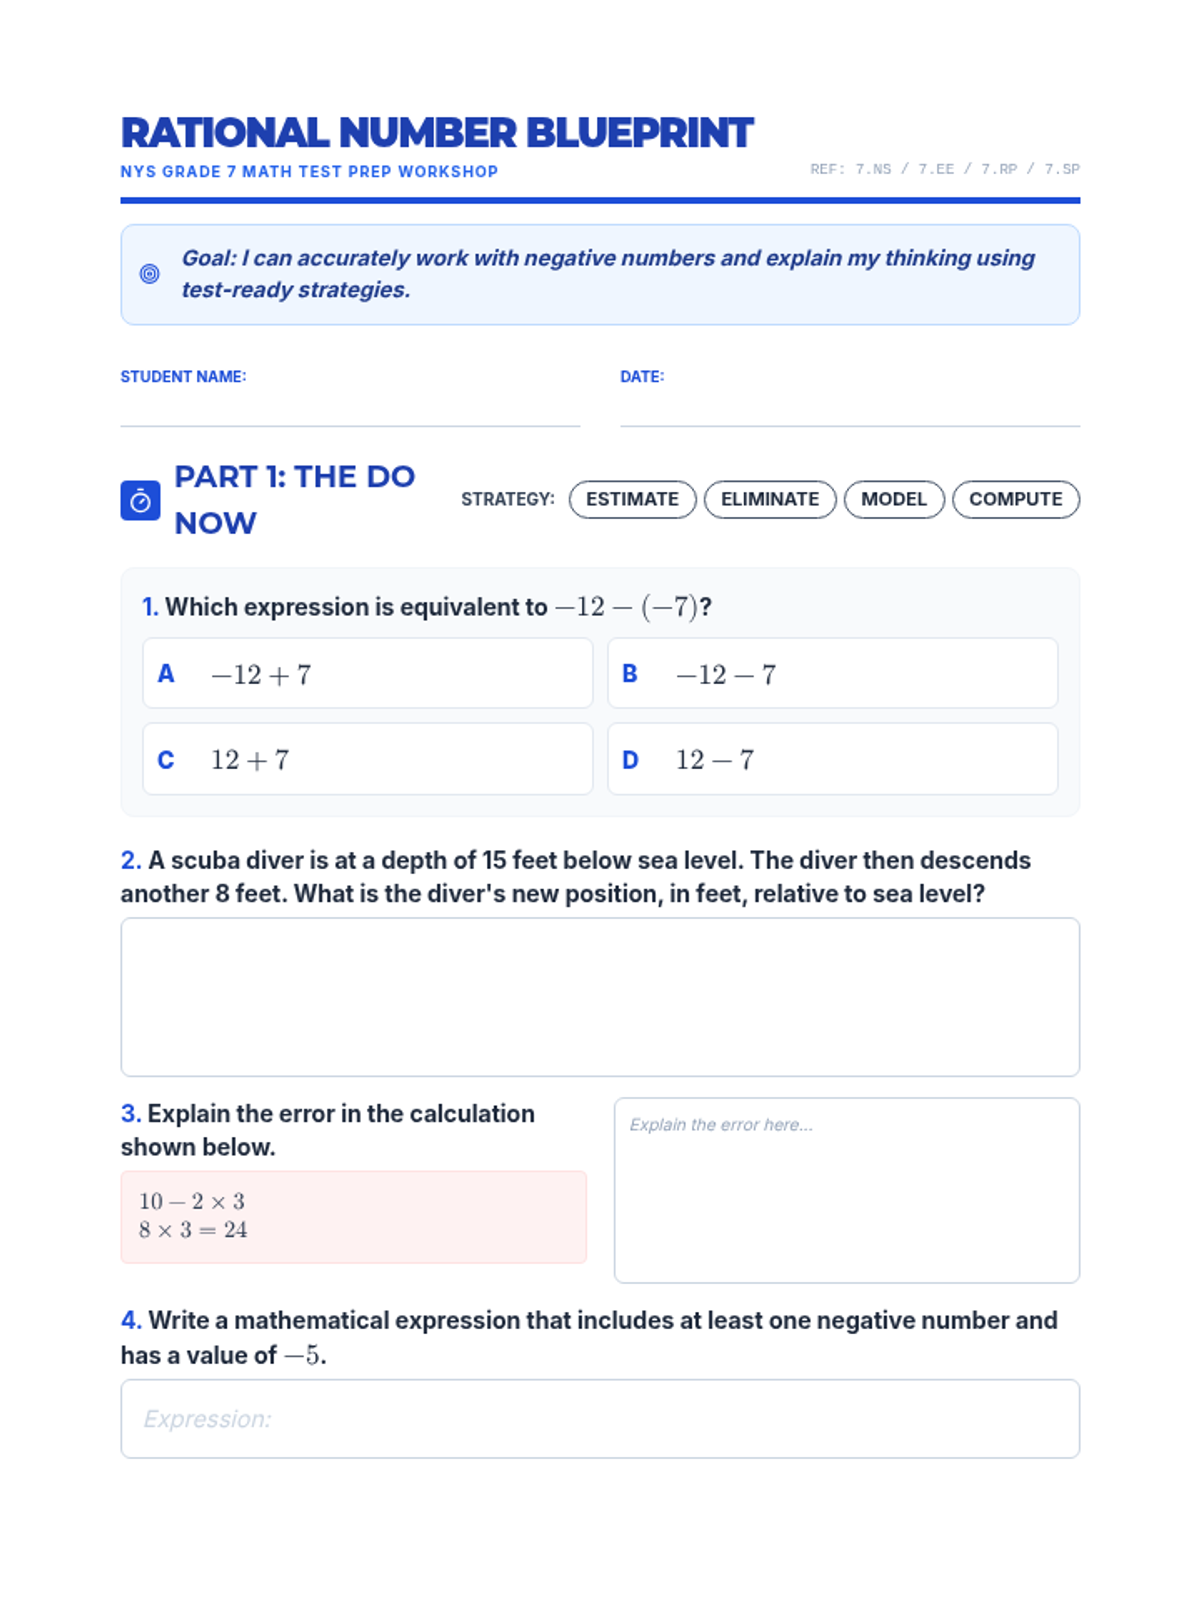
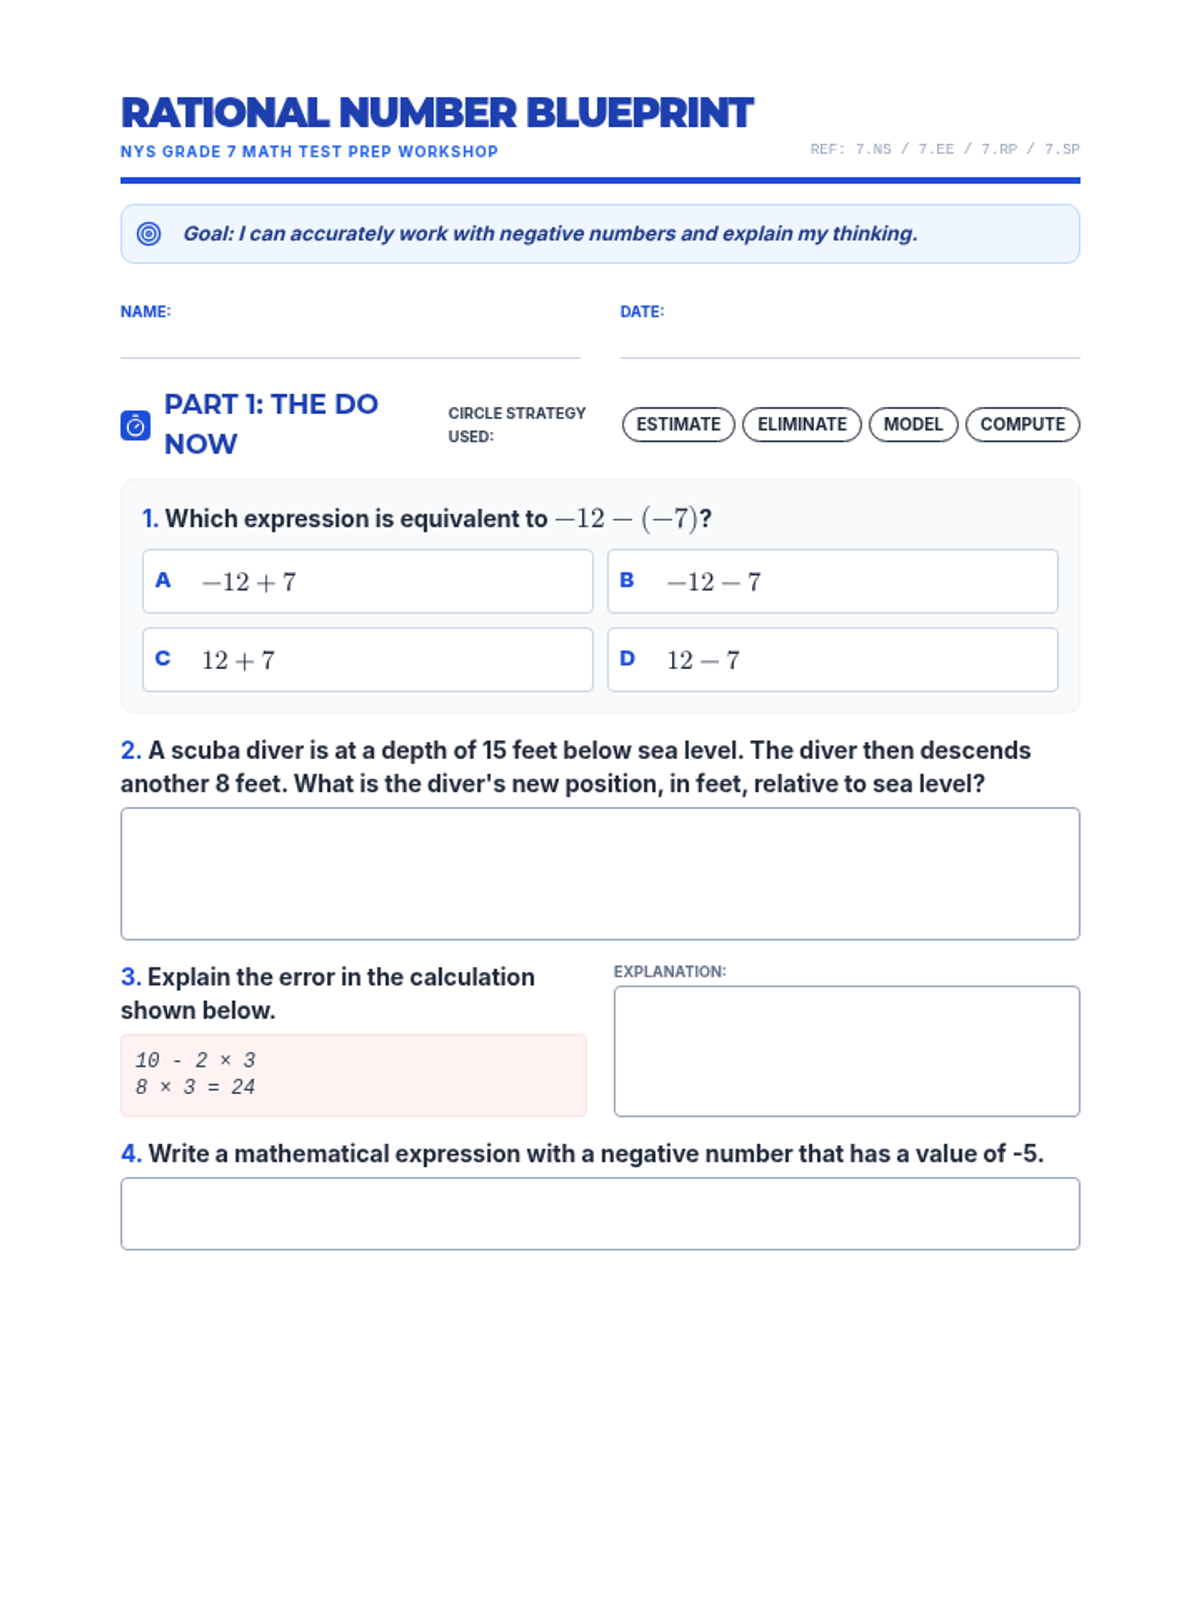
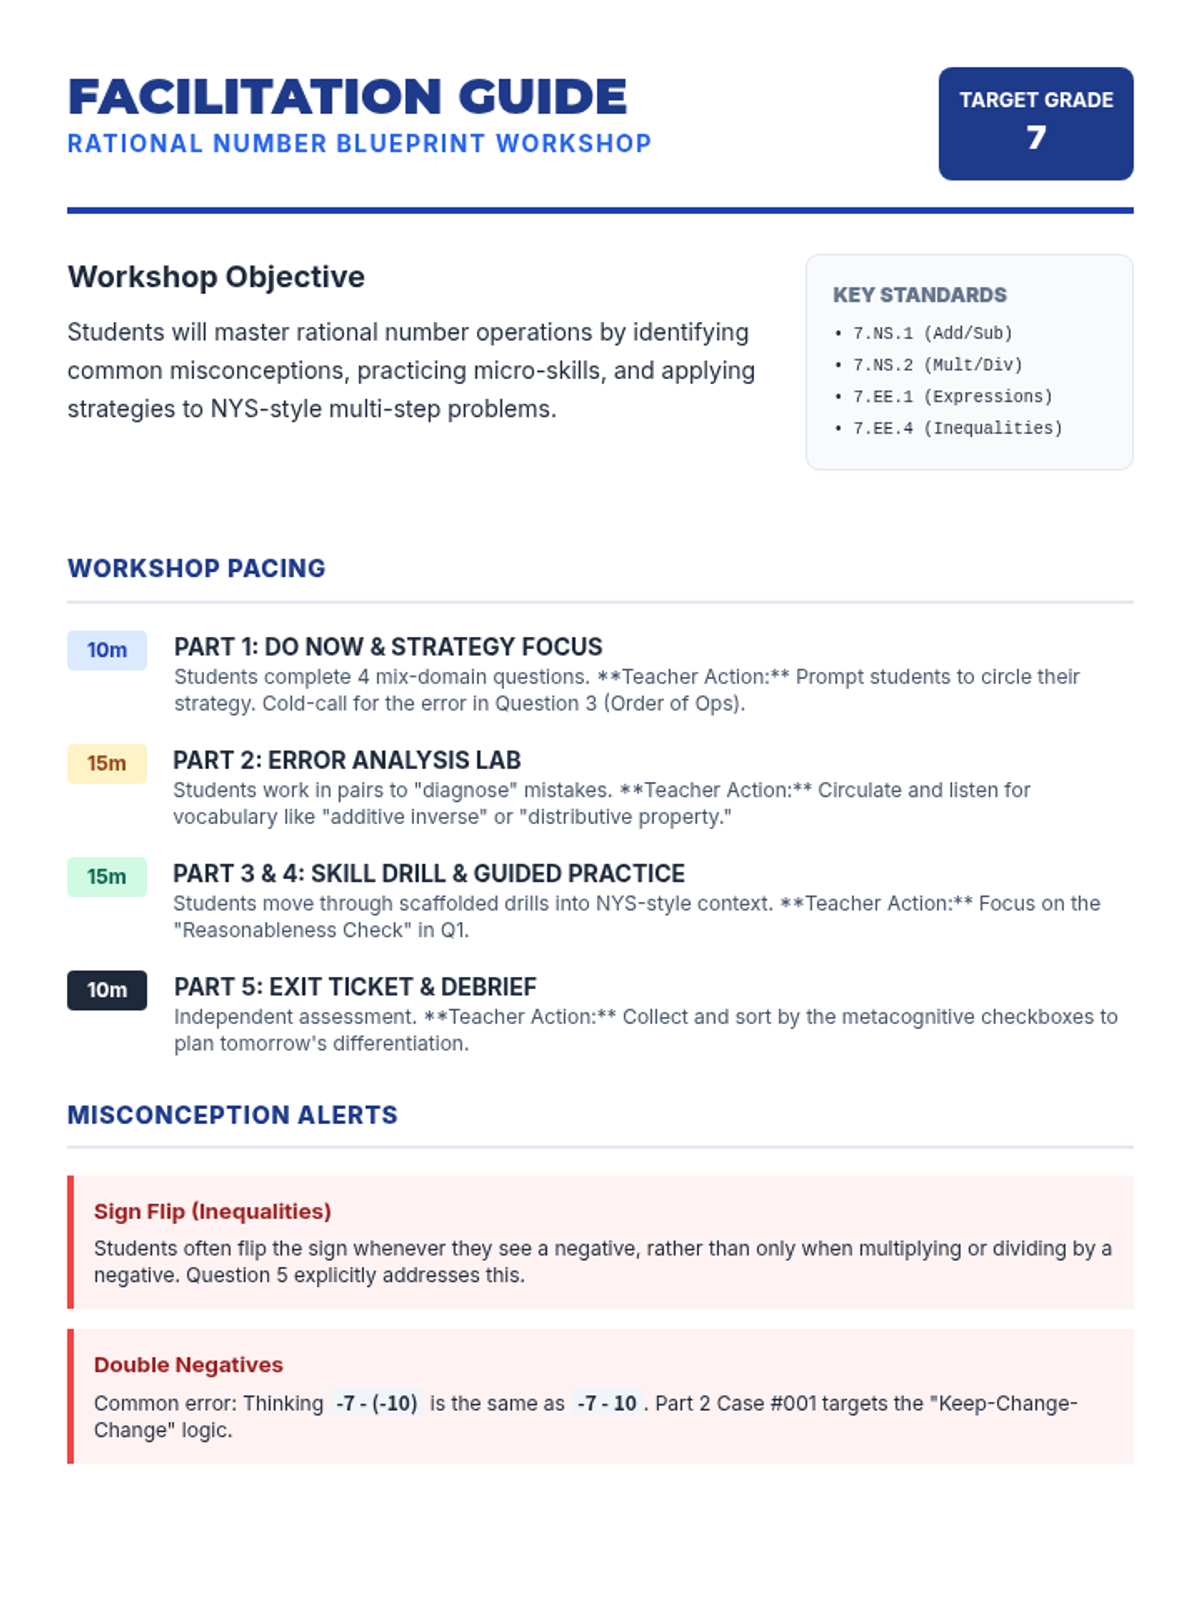
A comprehensive workshop focused on mastering rational number operations and common CCSS 7th grade math misconceptions in preparation for the NYS test.
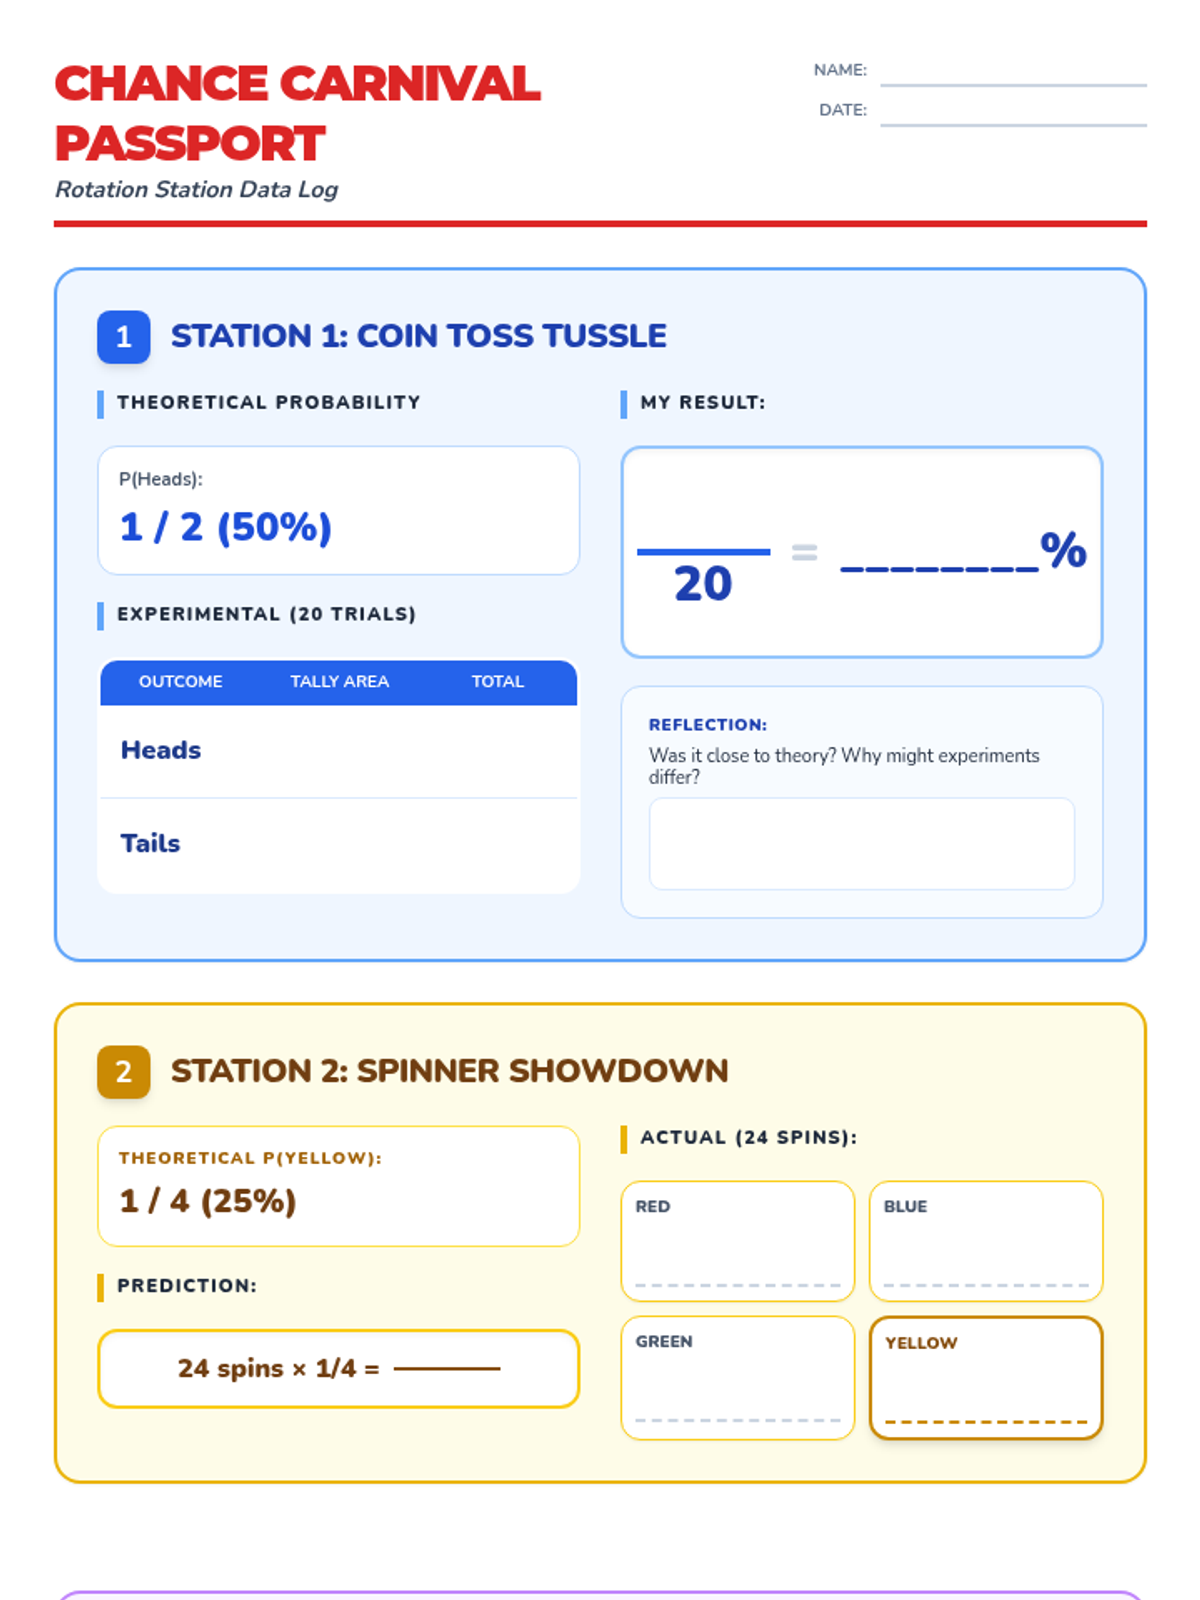
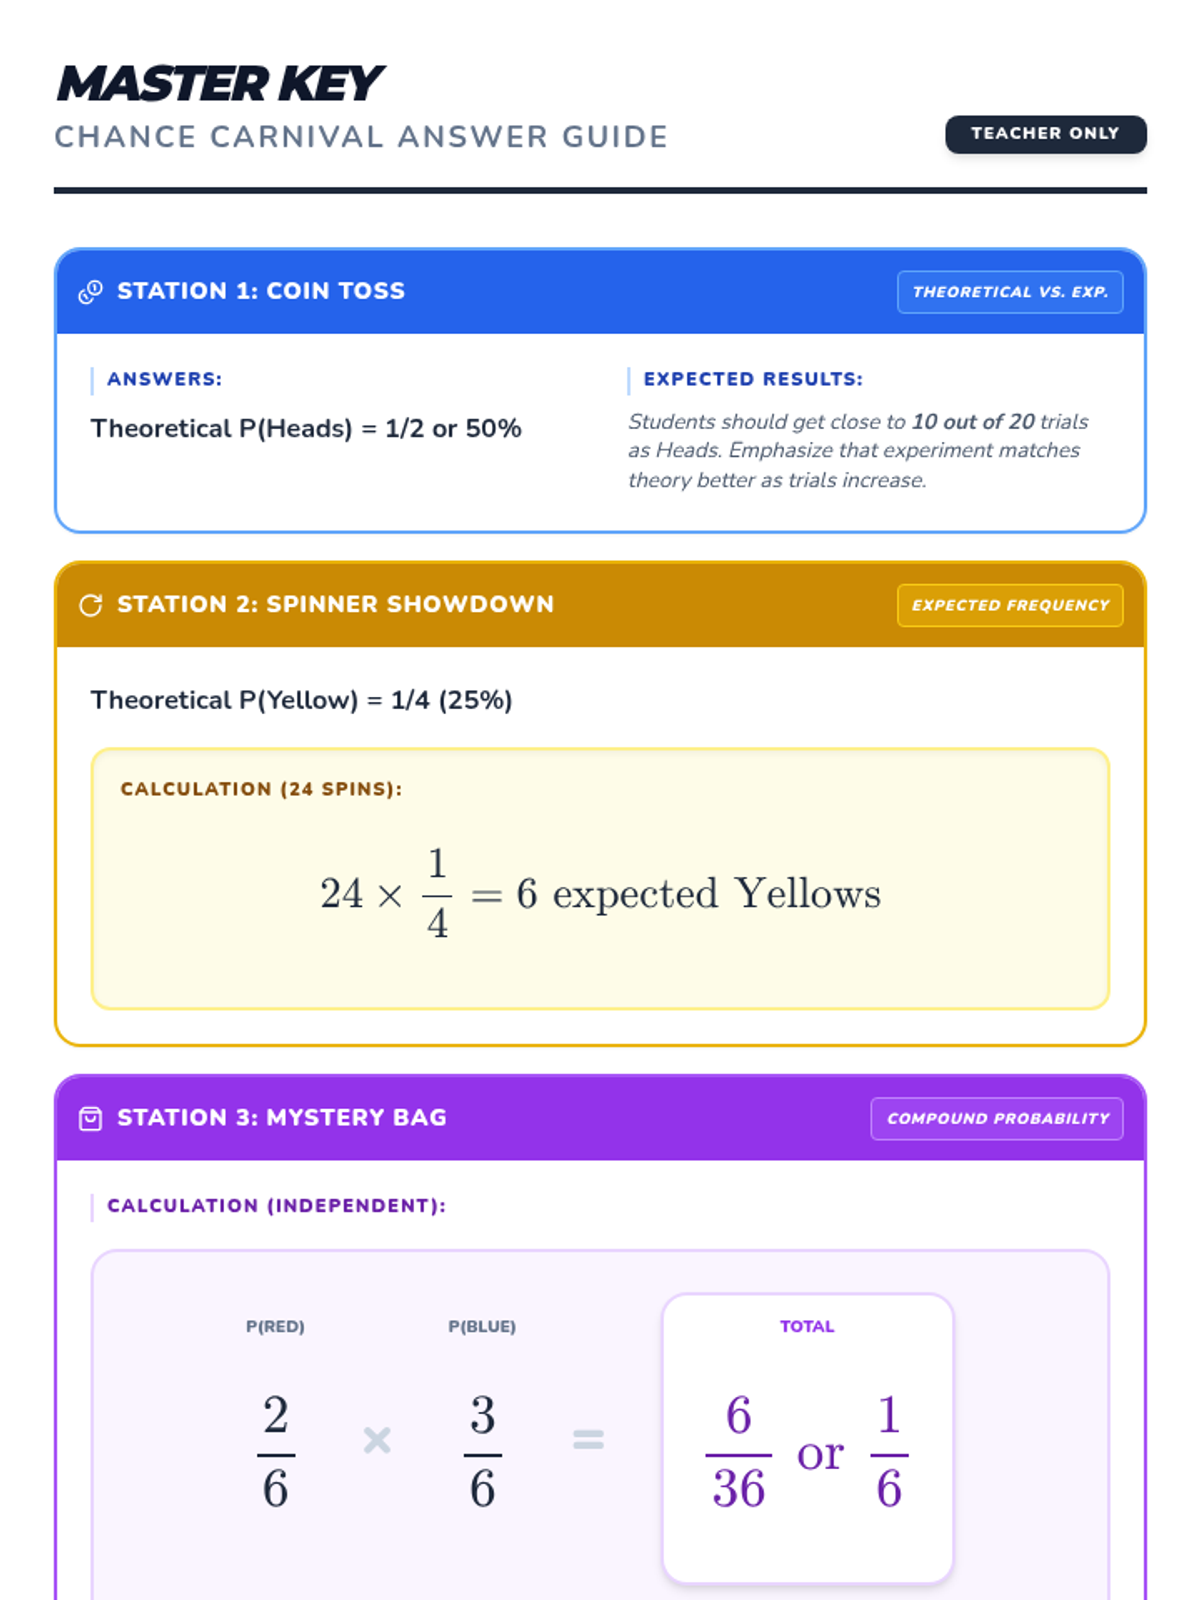
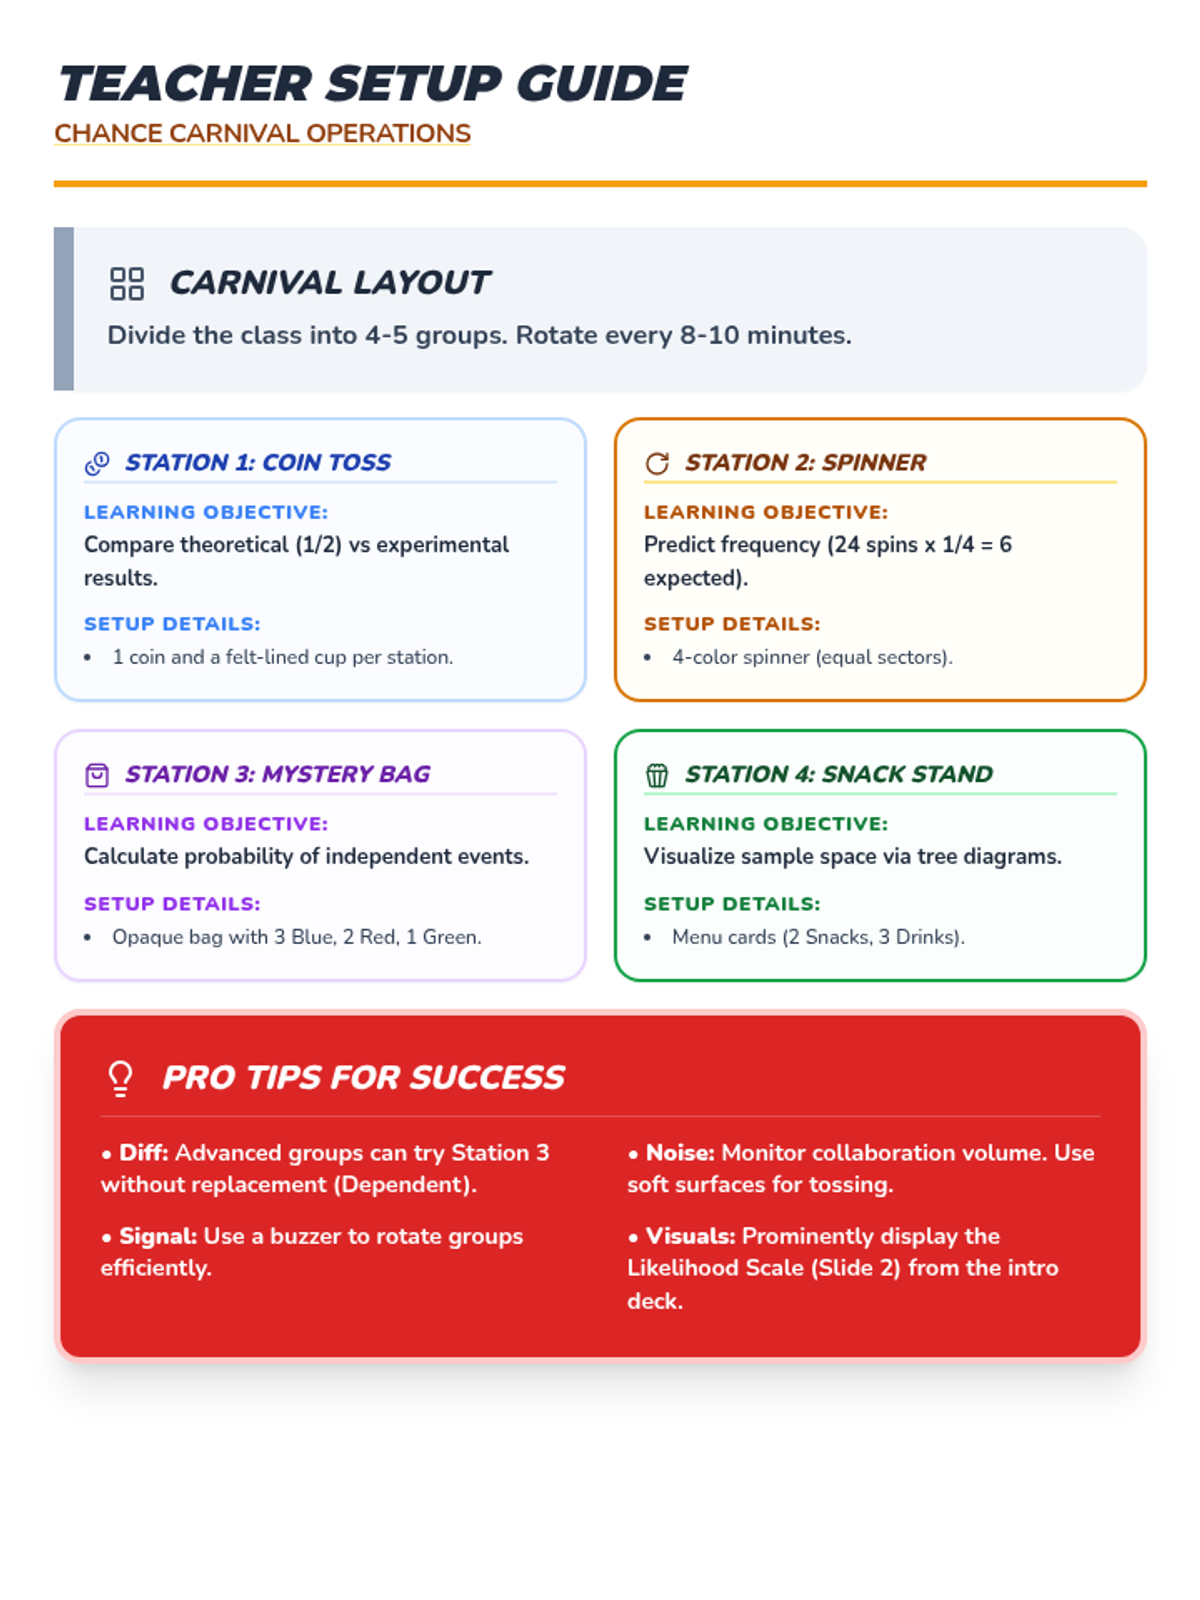
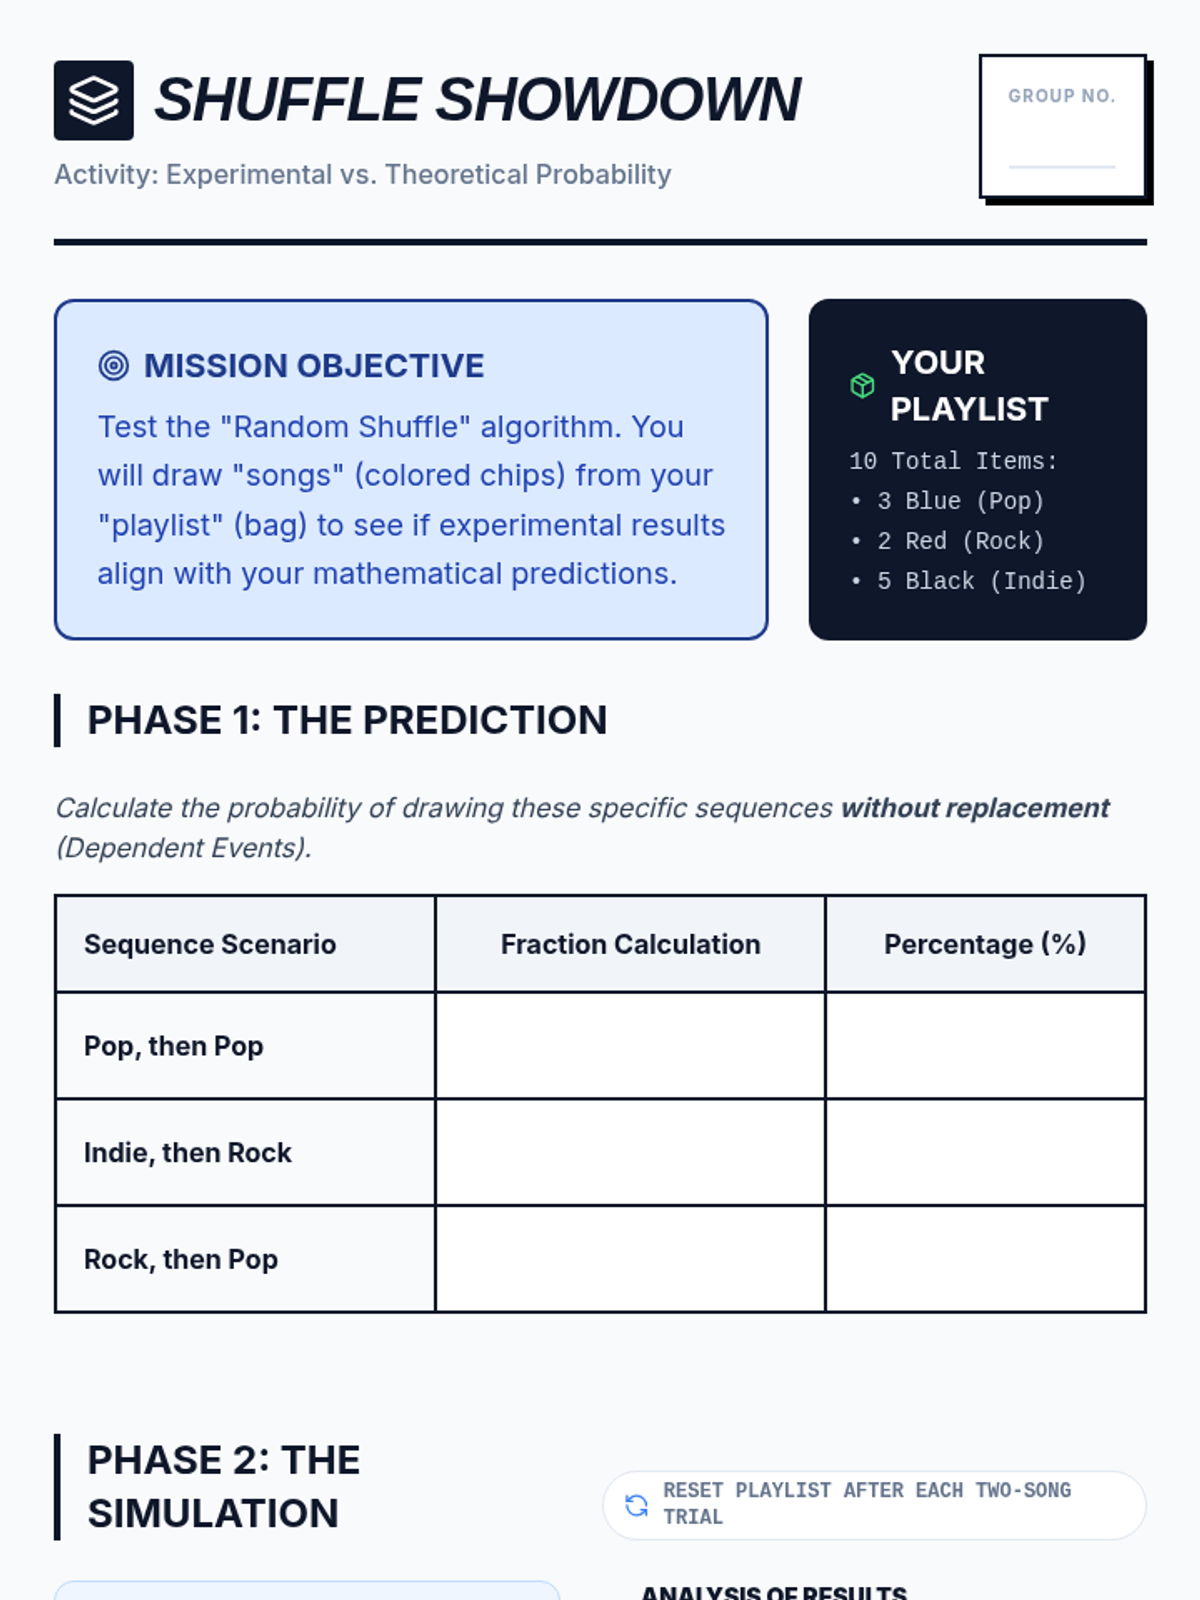
A hands-on probability lab where students rotate through various 'carnival' stations to explore theoretical and experimental probability, compound events, and tree diagrams.
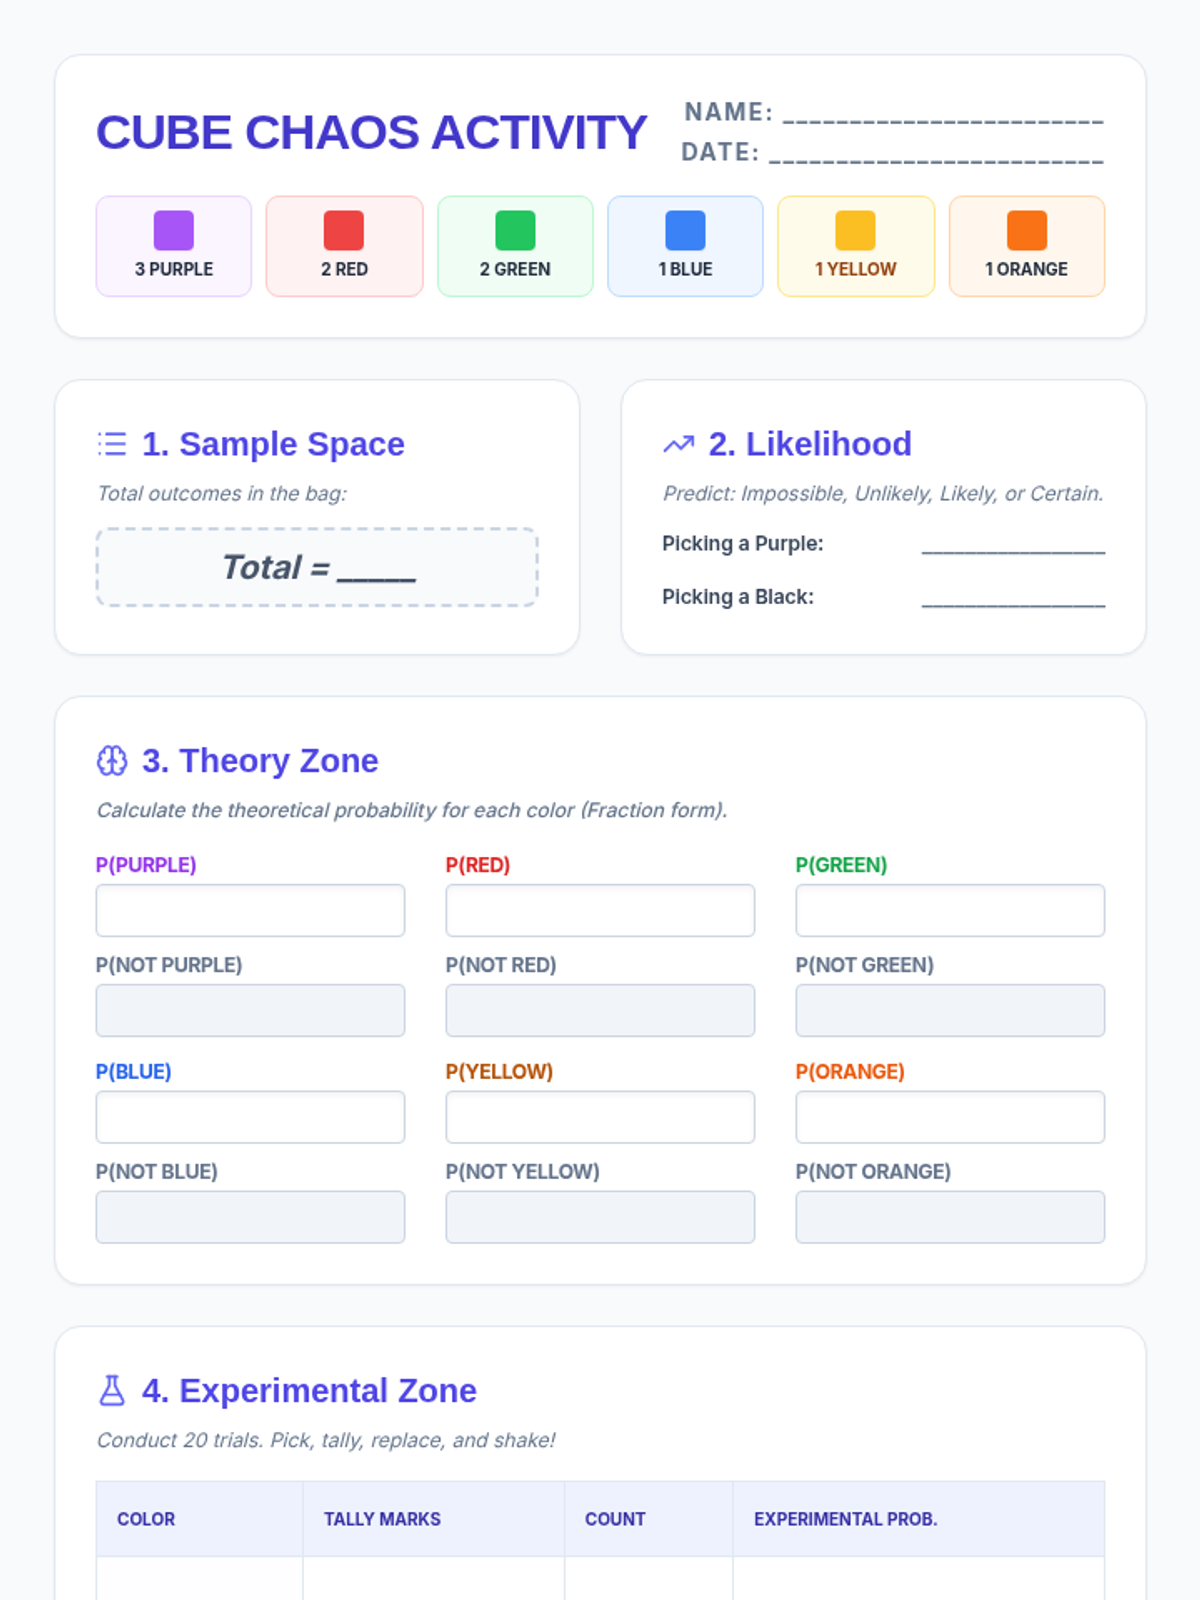
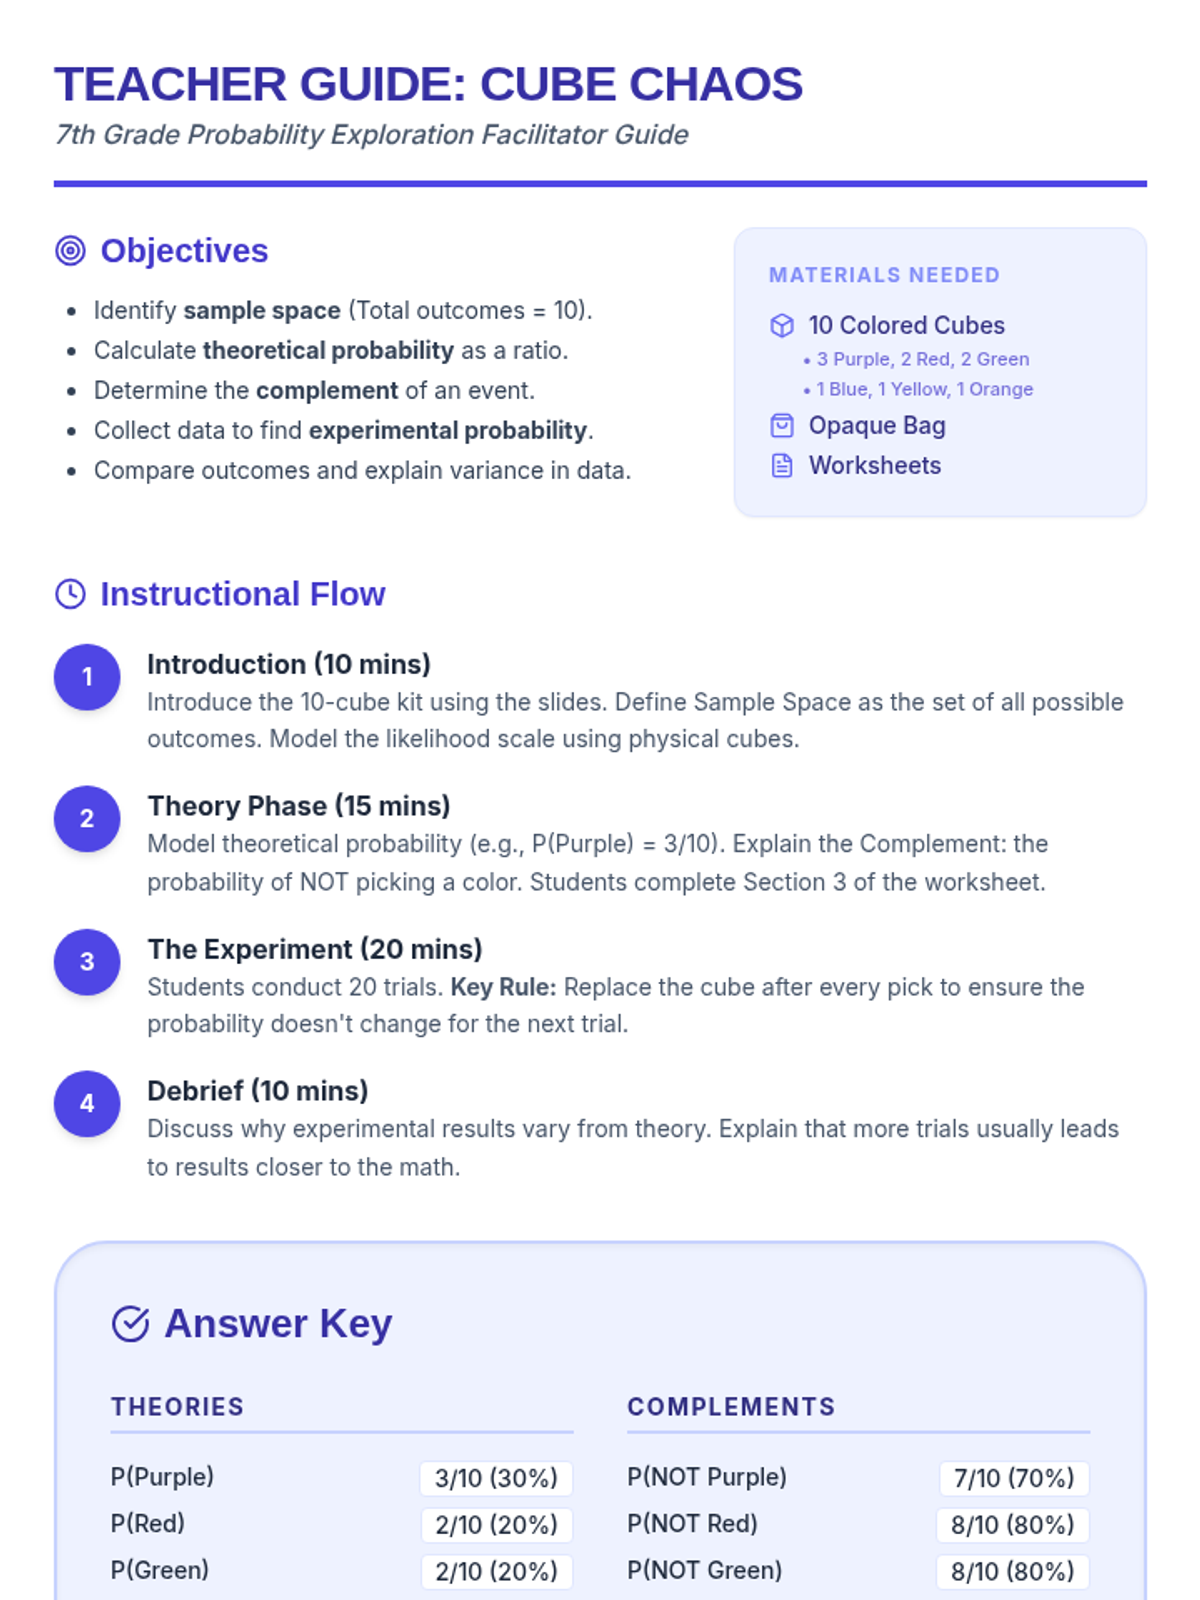
A hands-on exploration of probability concepts using a specific set of 10 colored cubes. Students learn to calculate theoretical and experimental probability, identify sample spaces, and understand complements.
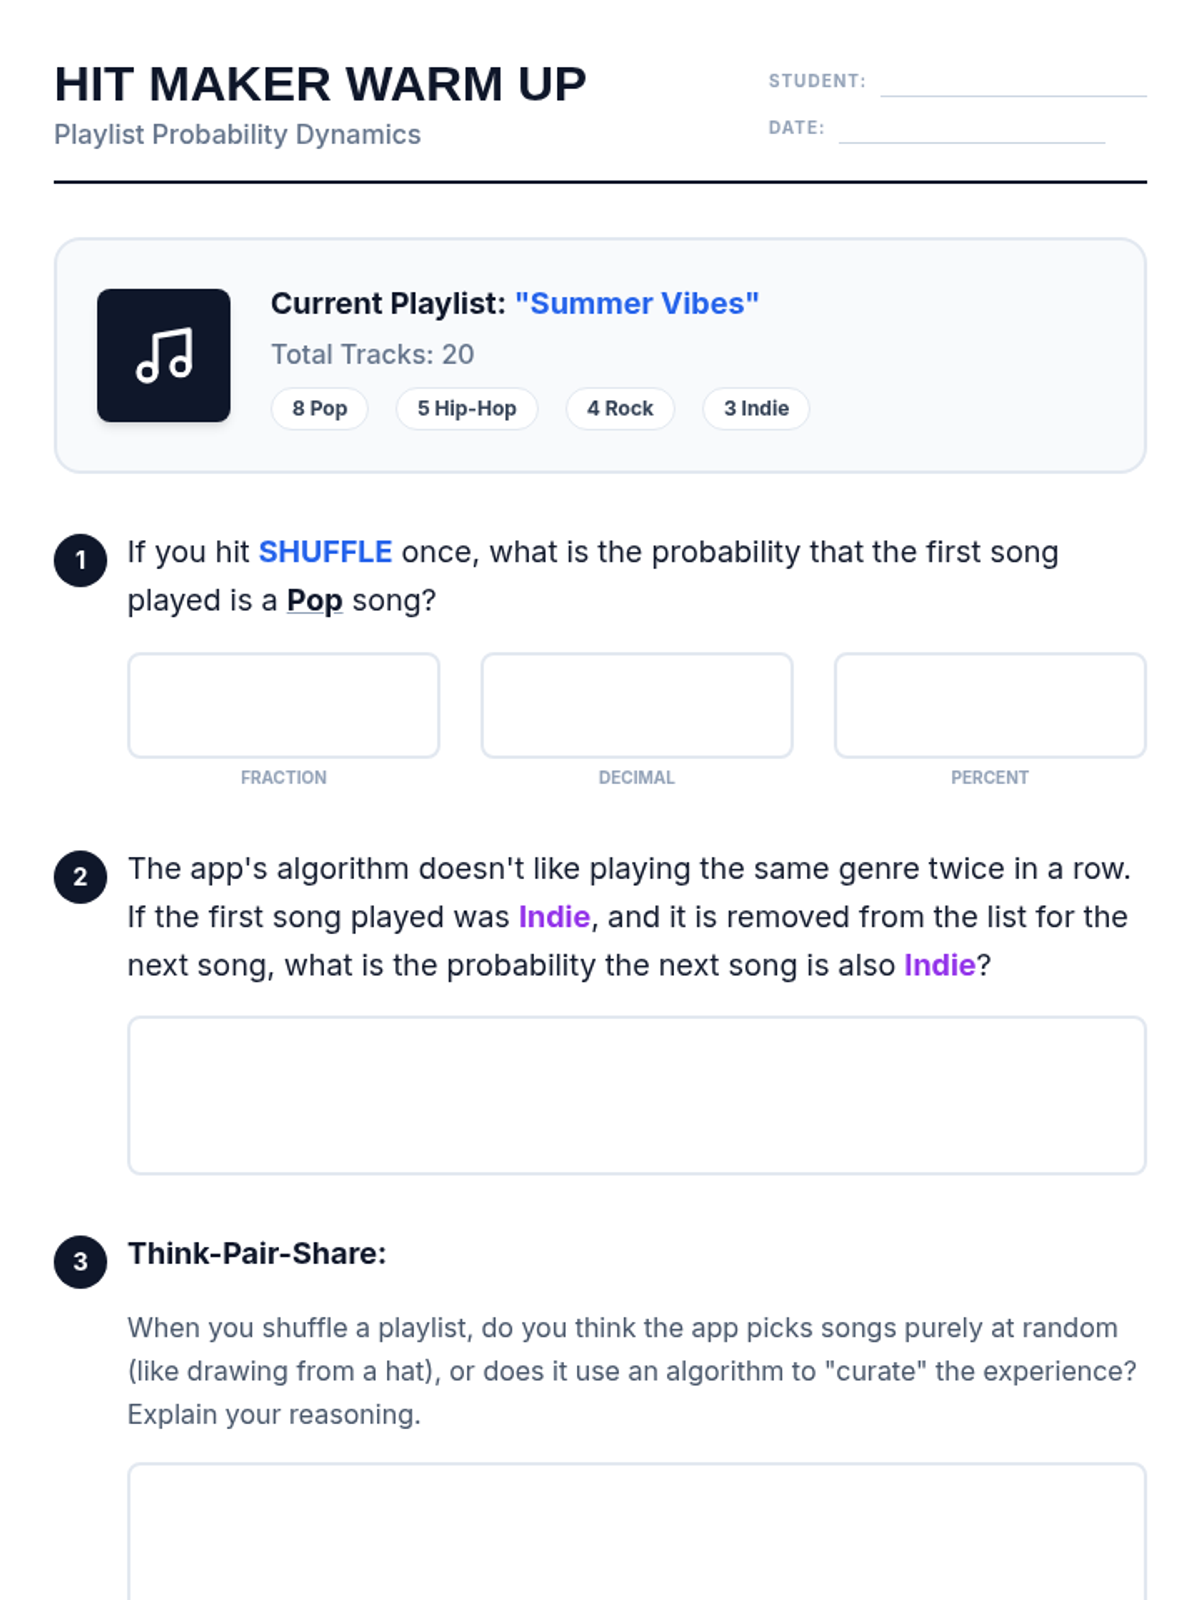
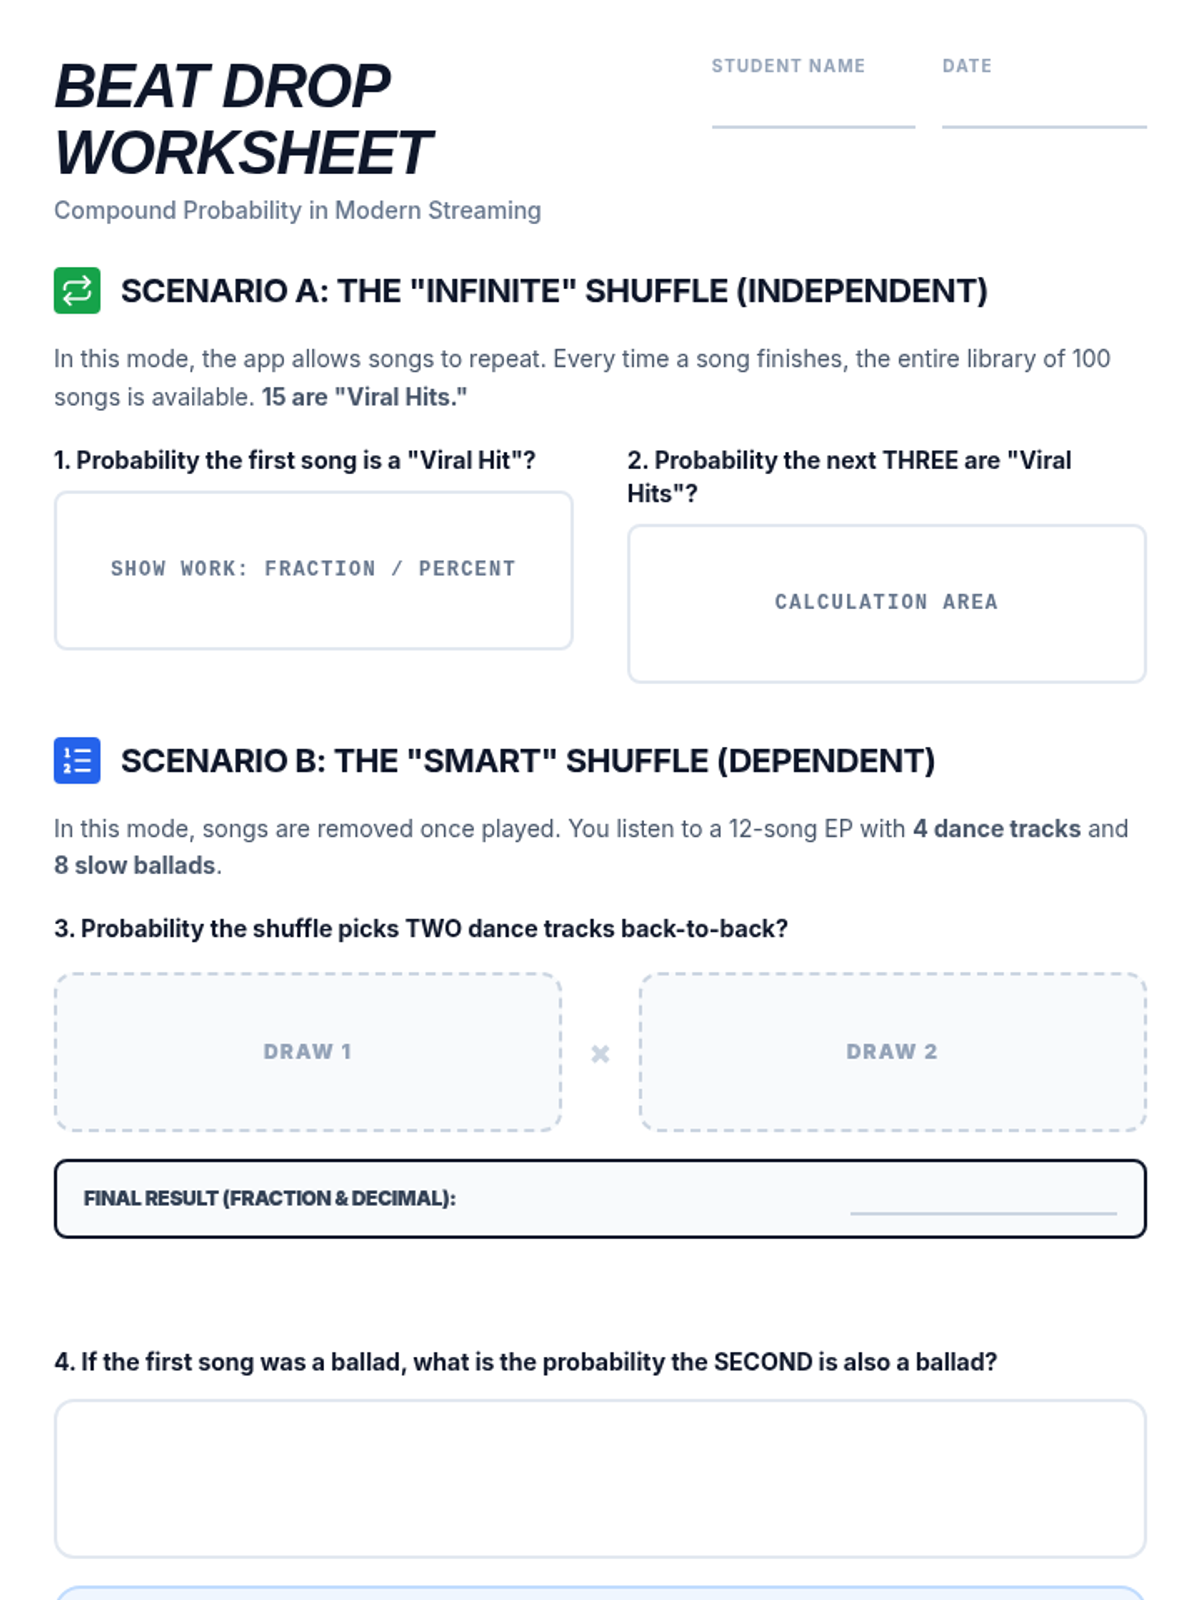
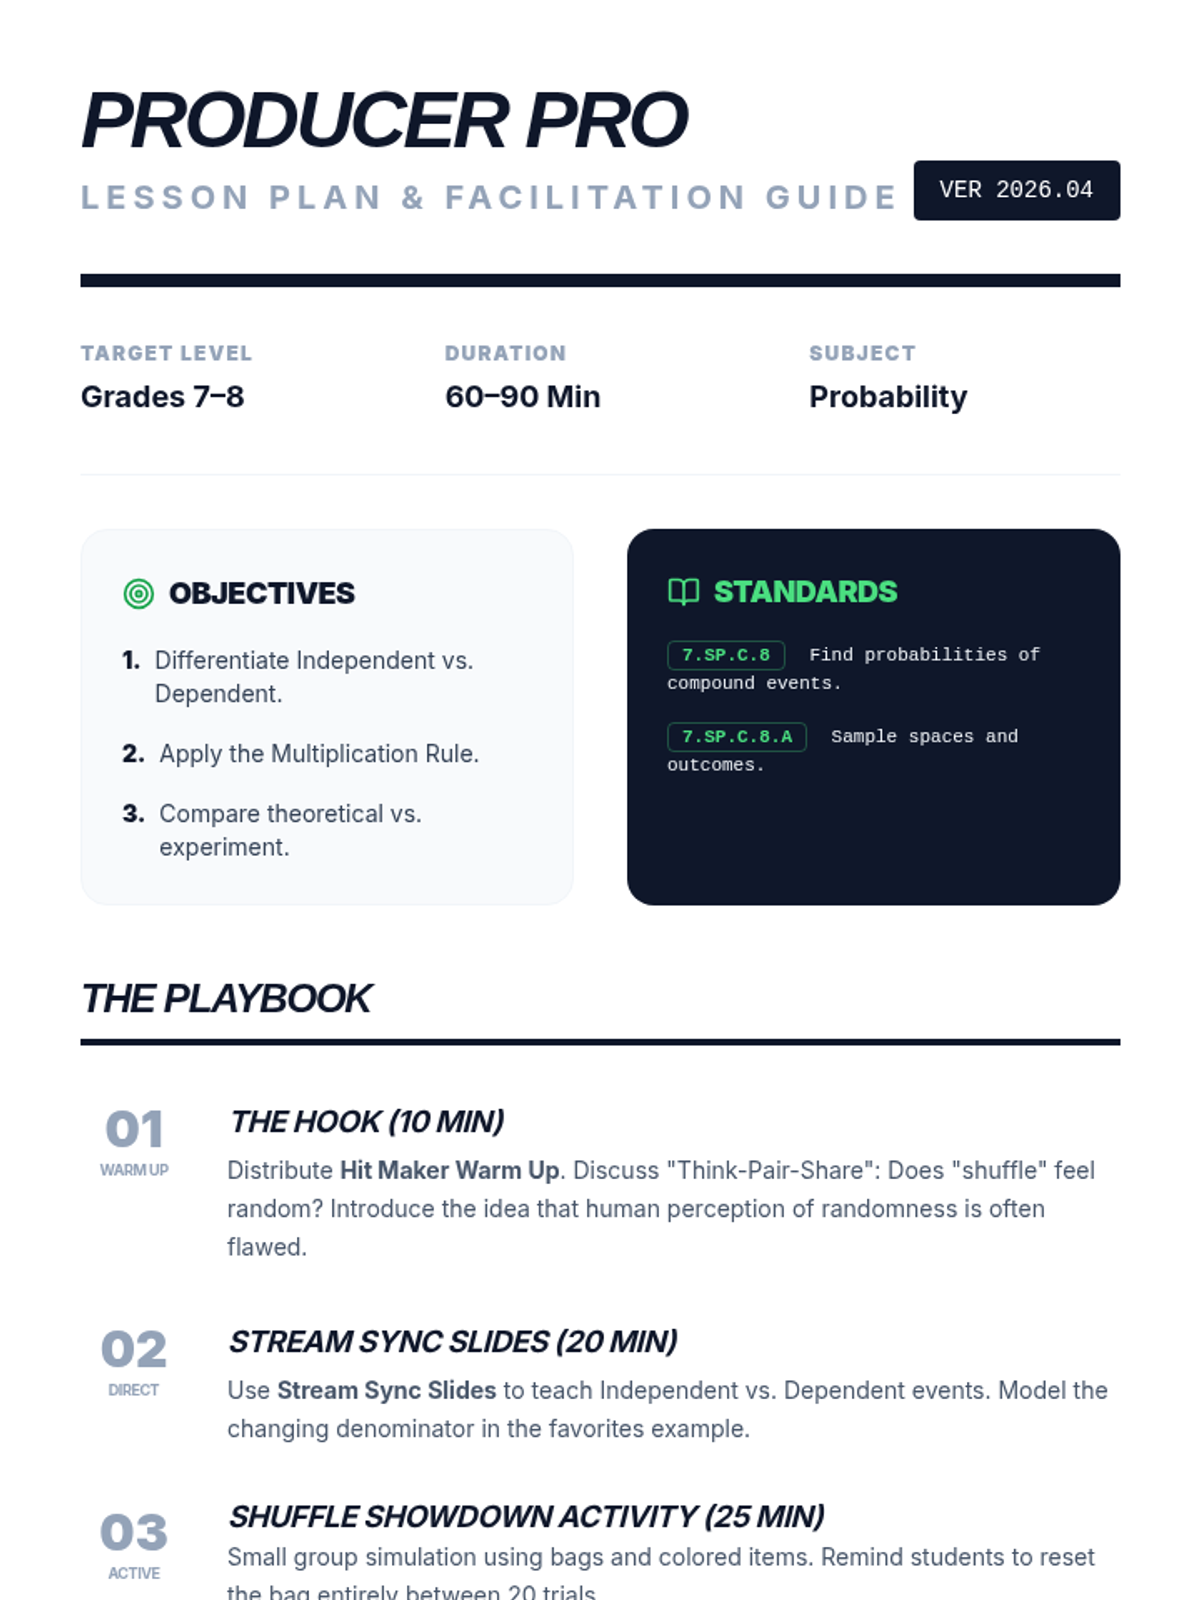
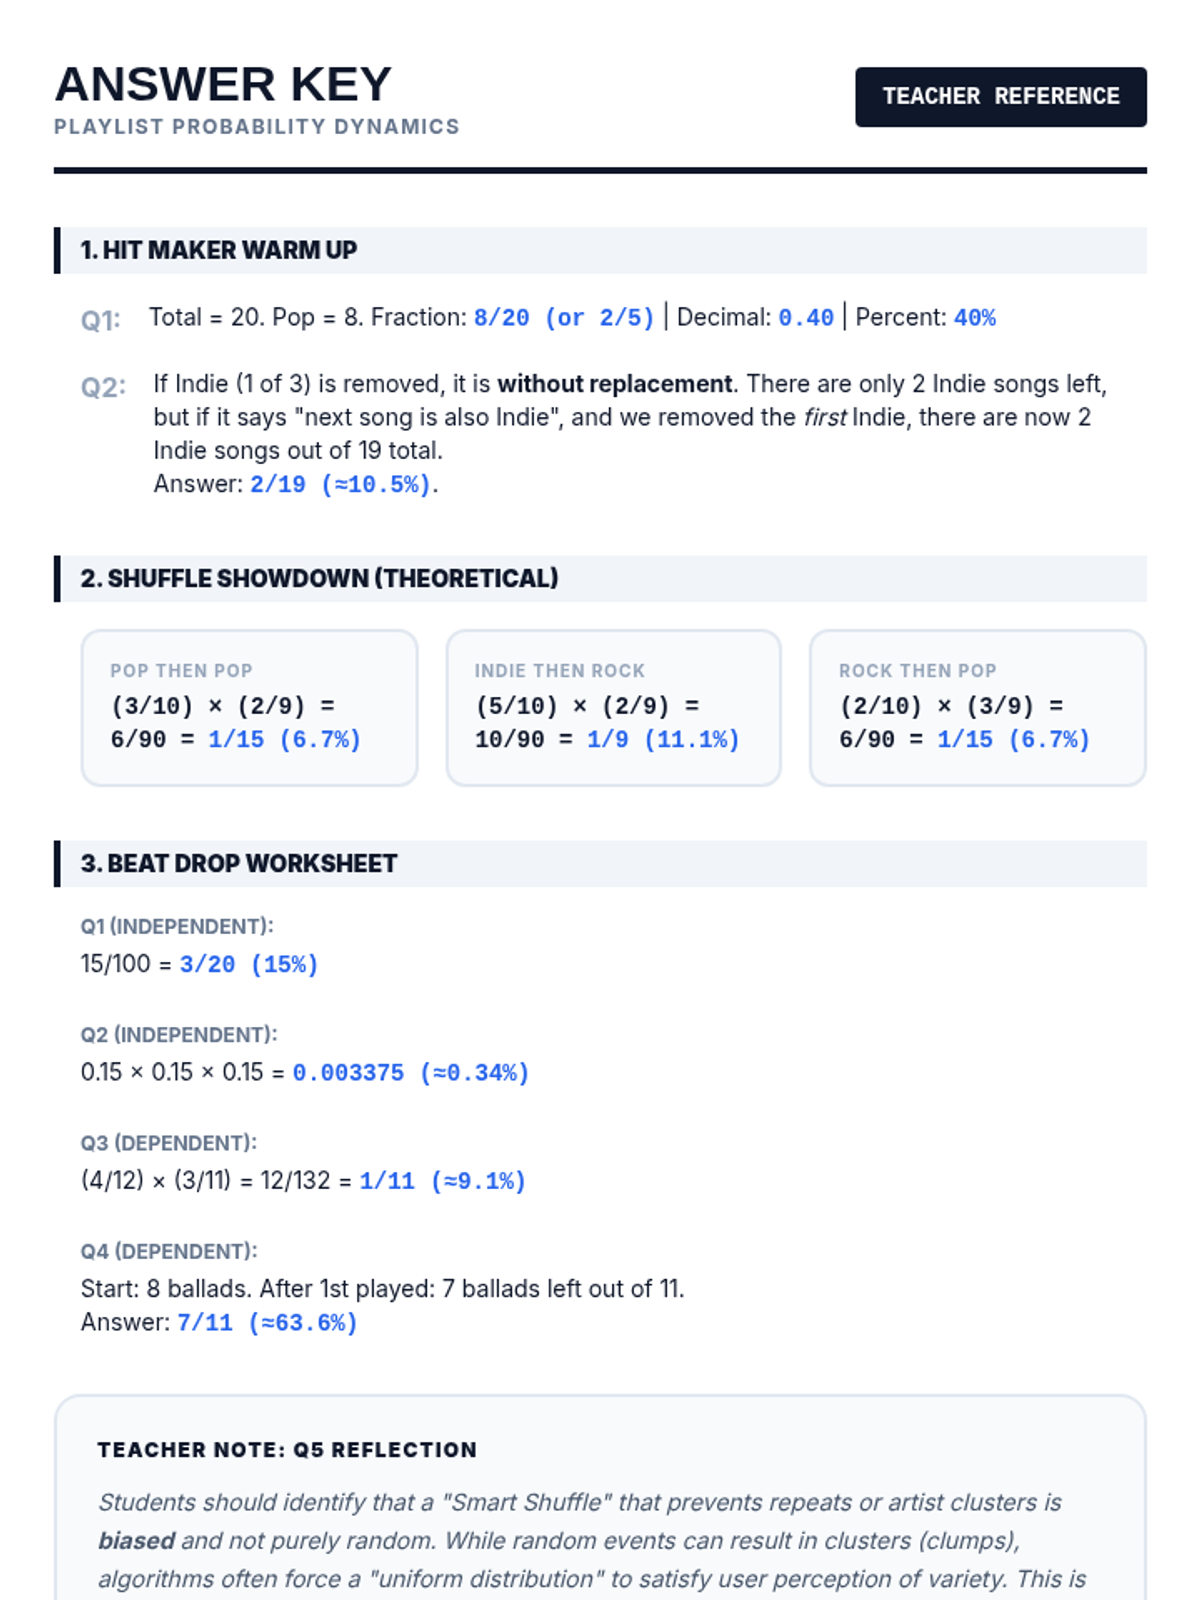
Students explore compound probability and shuffle algorithms by analyzing song frequencies and streaming data to determine the likelihood of hearing their favorite tracks.
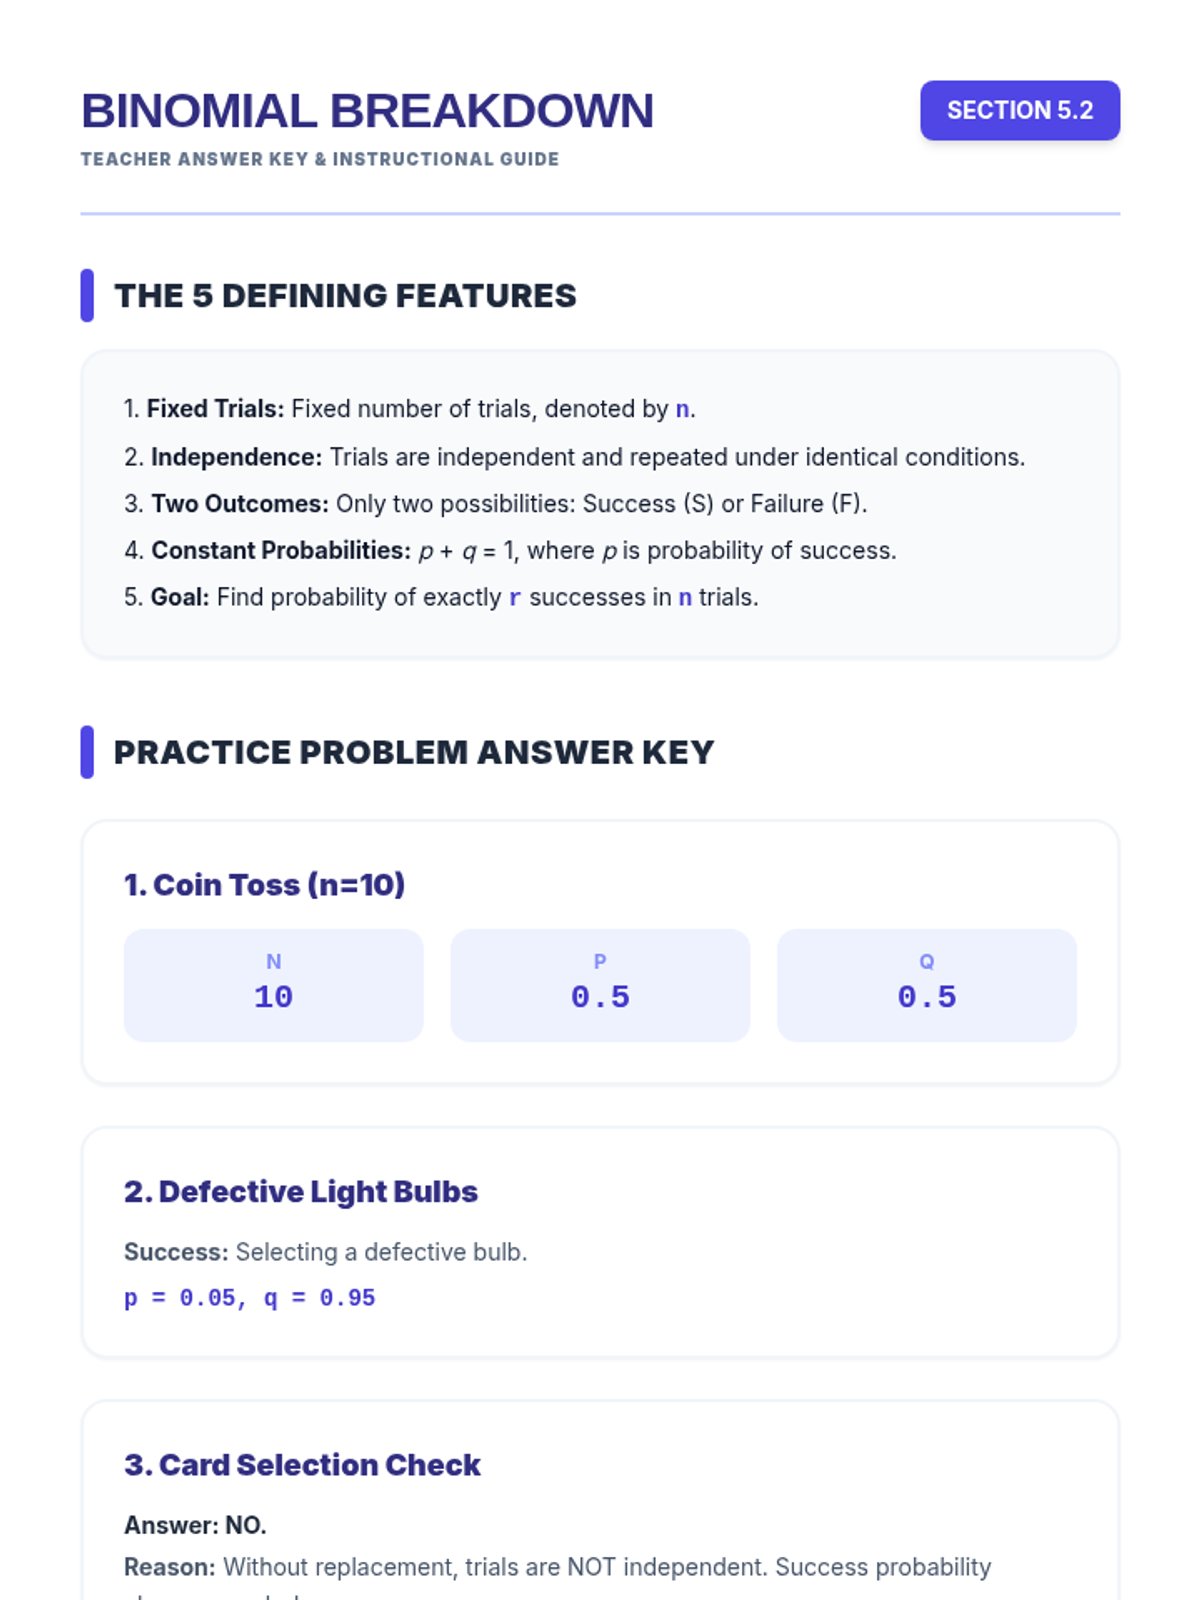
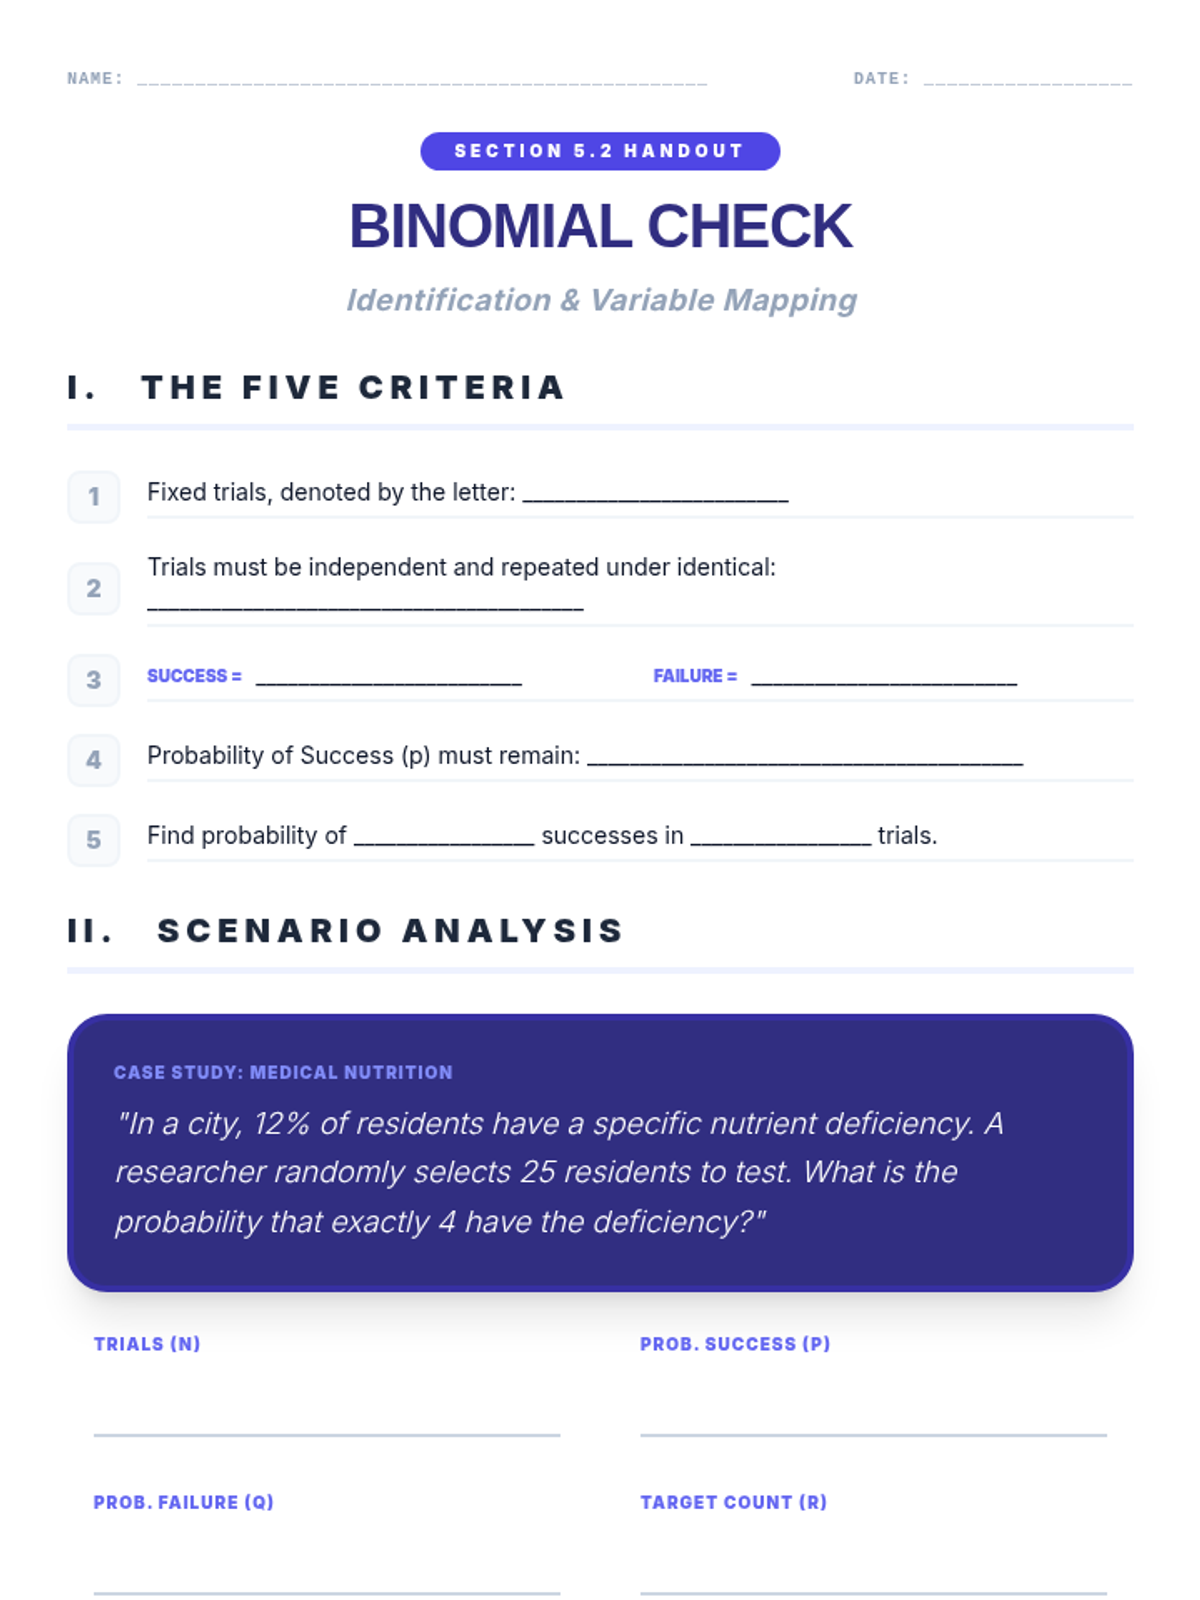
A comprehensive introduction to binomial experiments, covering the five core criteria, Bernoulli trials, and practical probability examples.
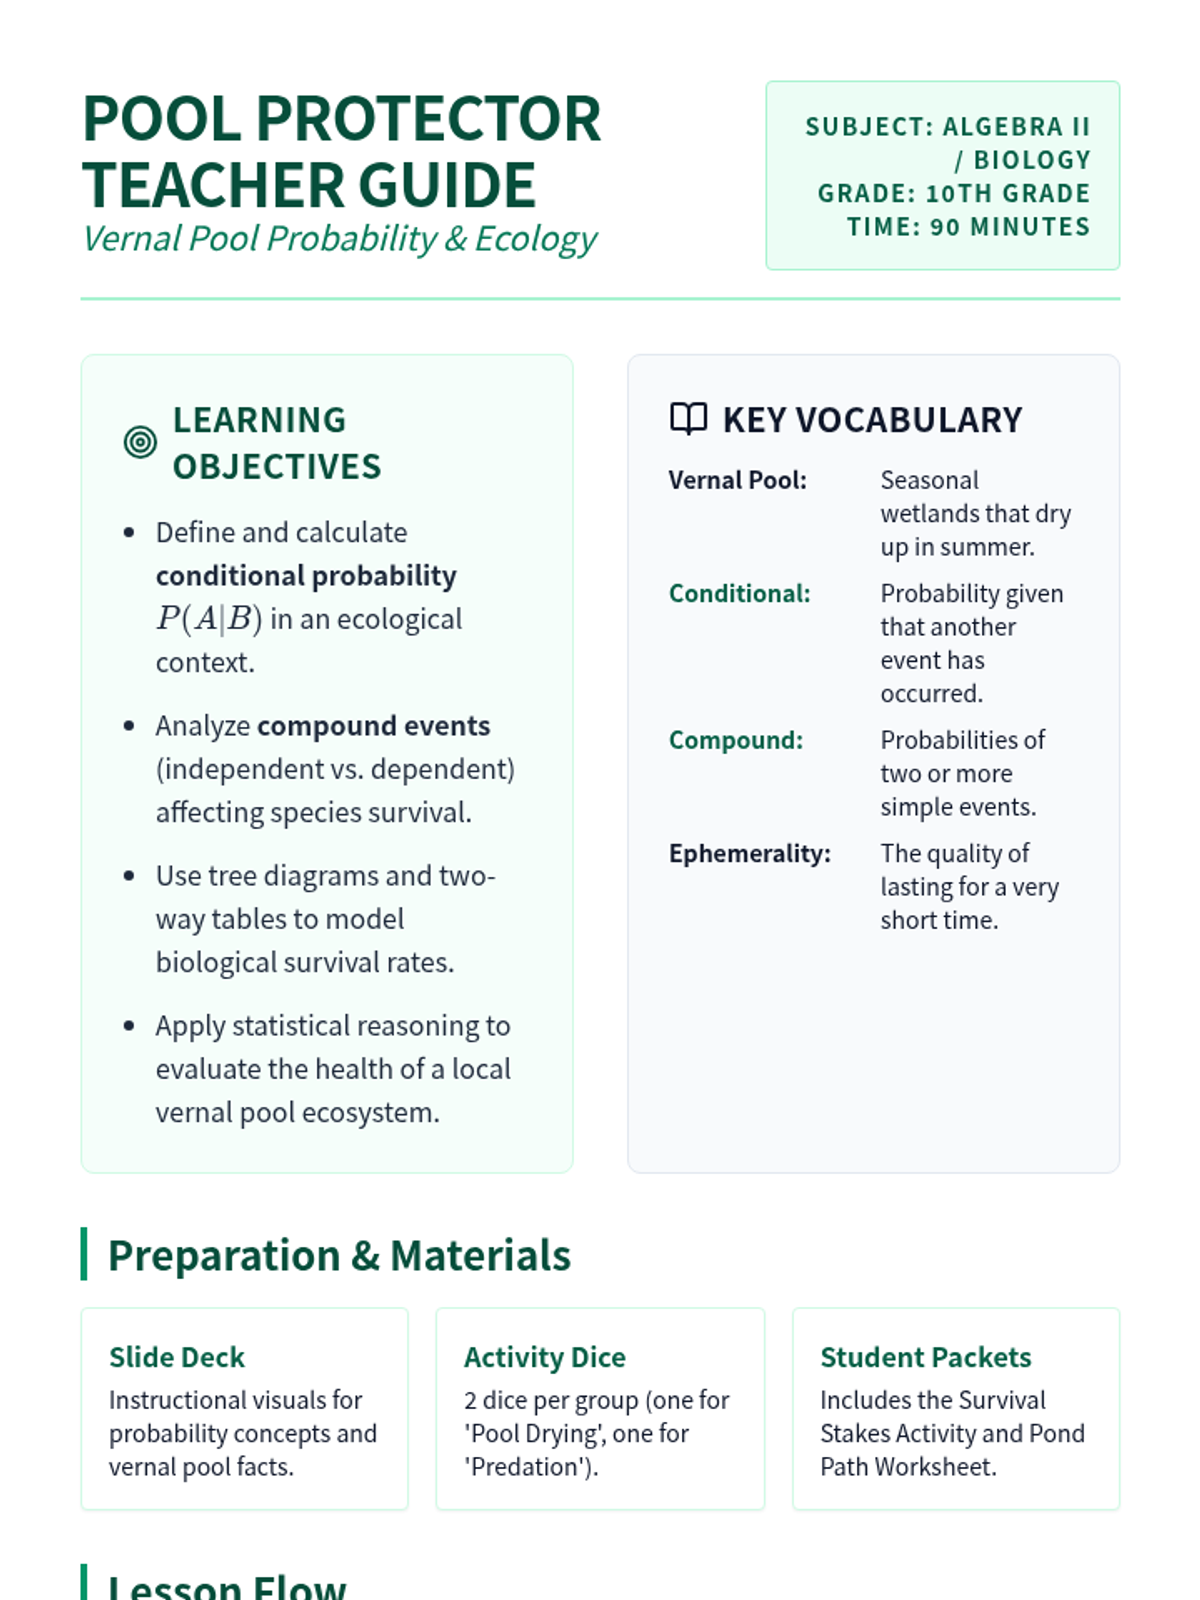
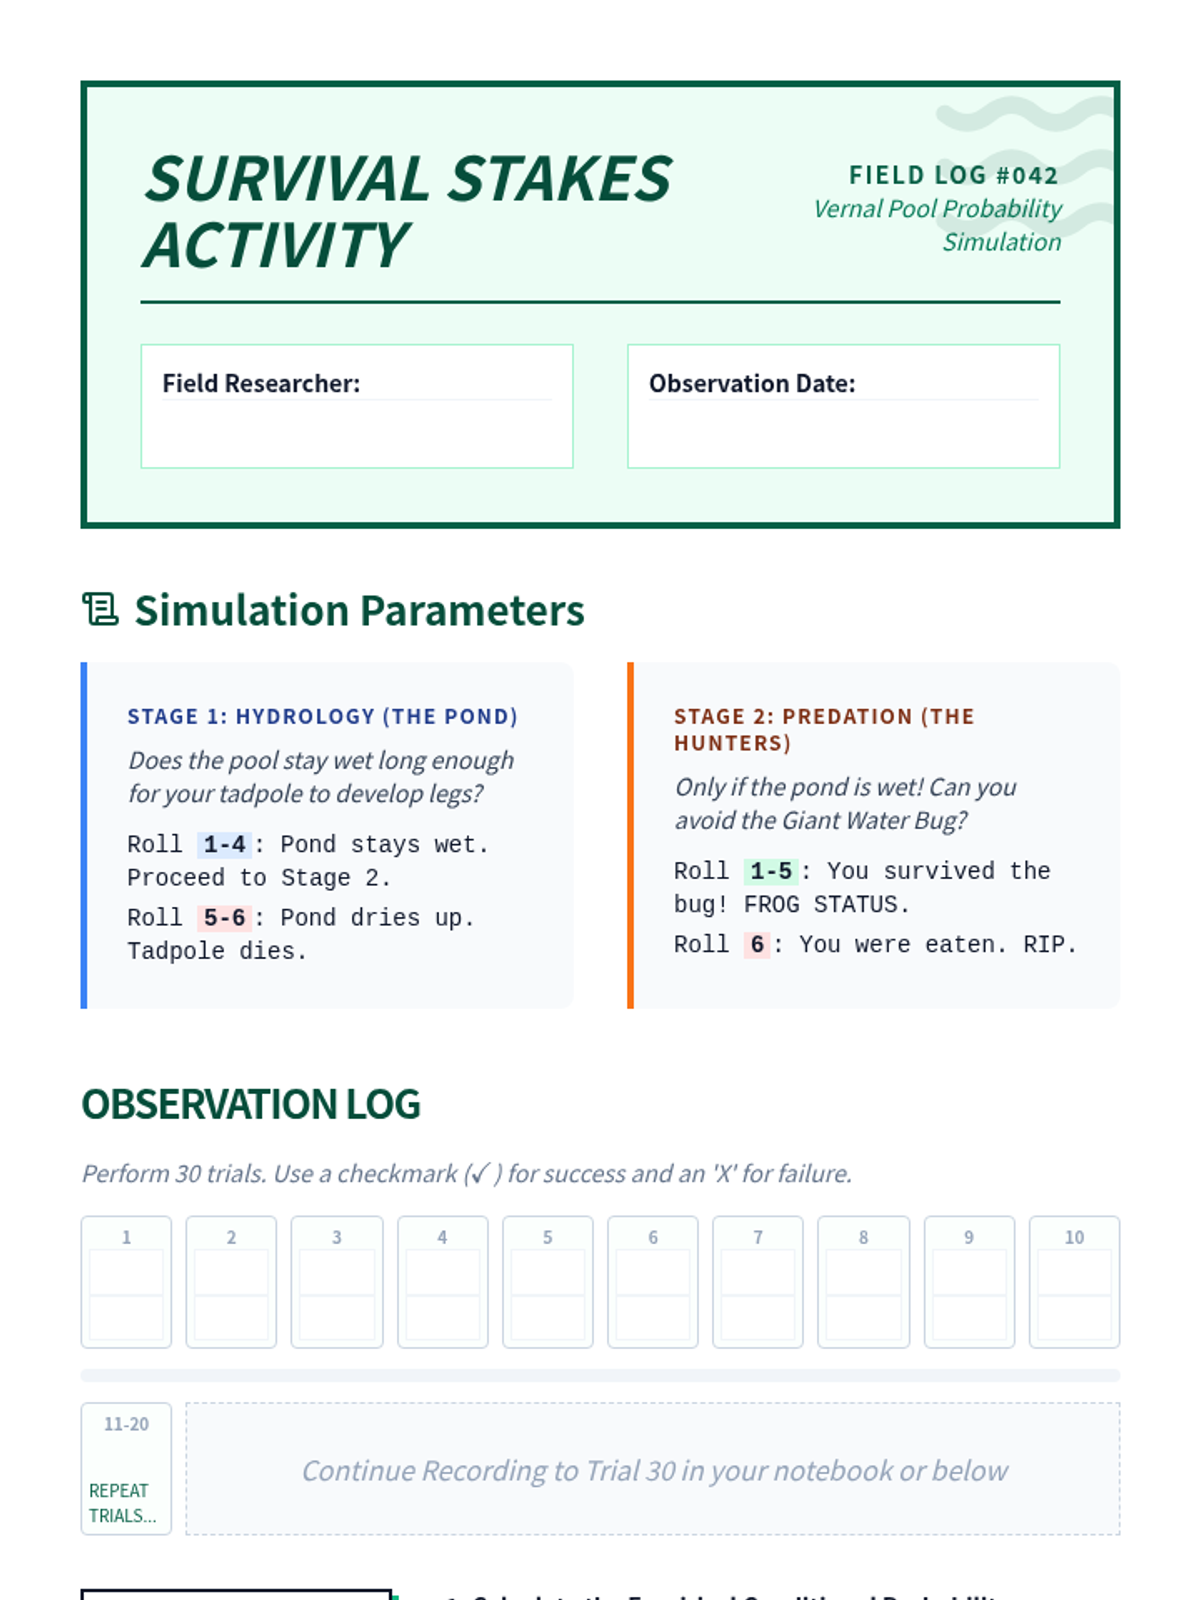
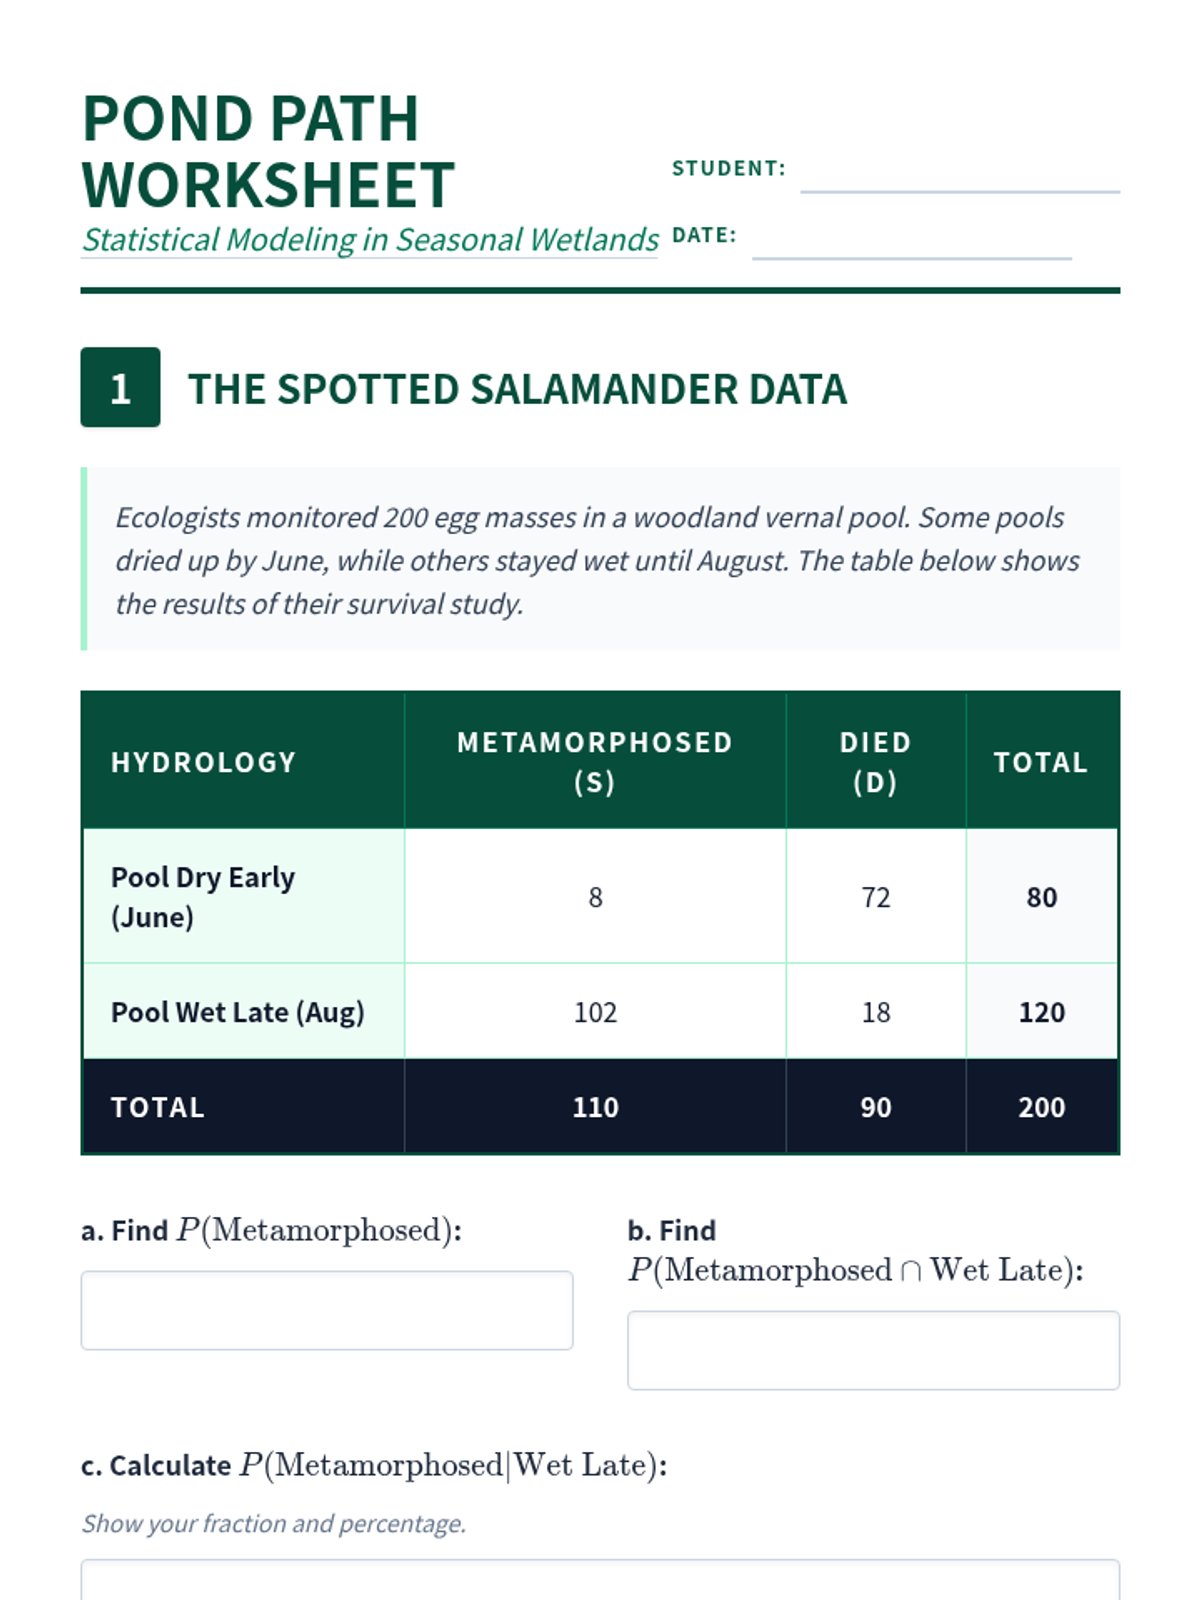
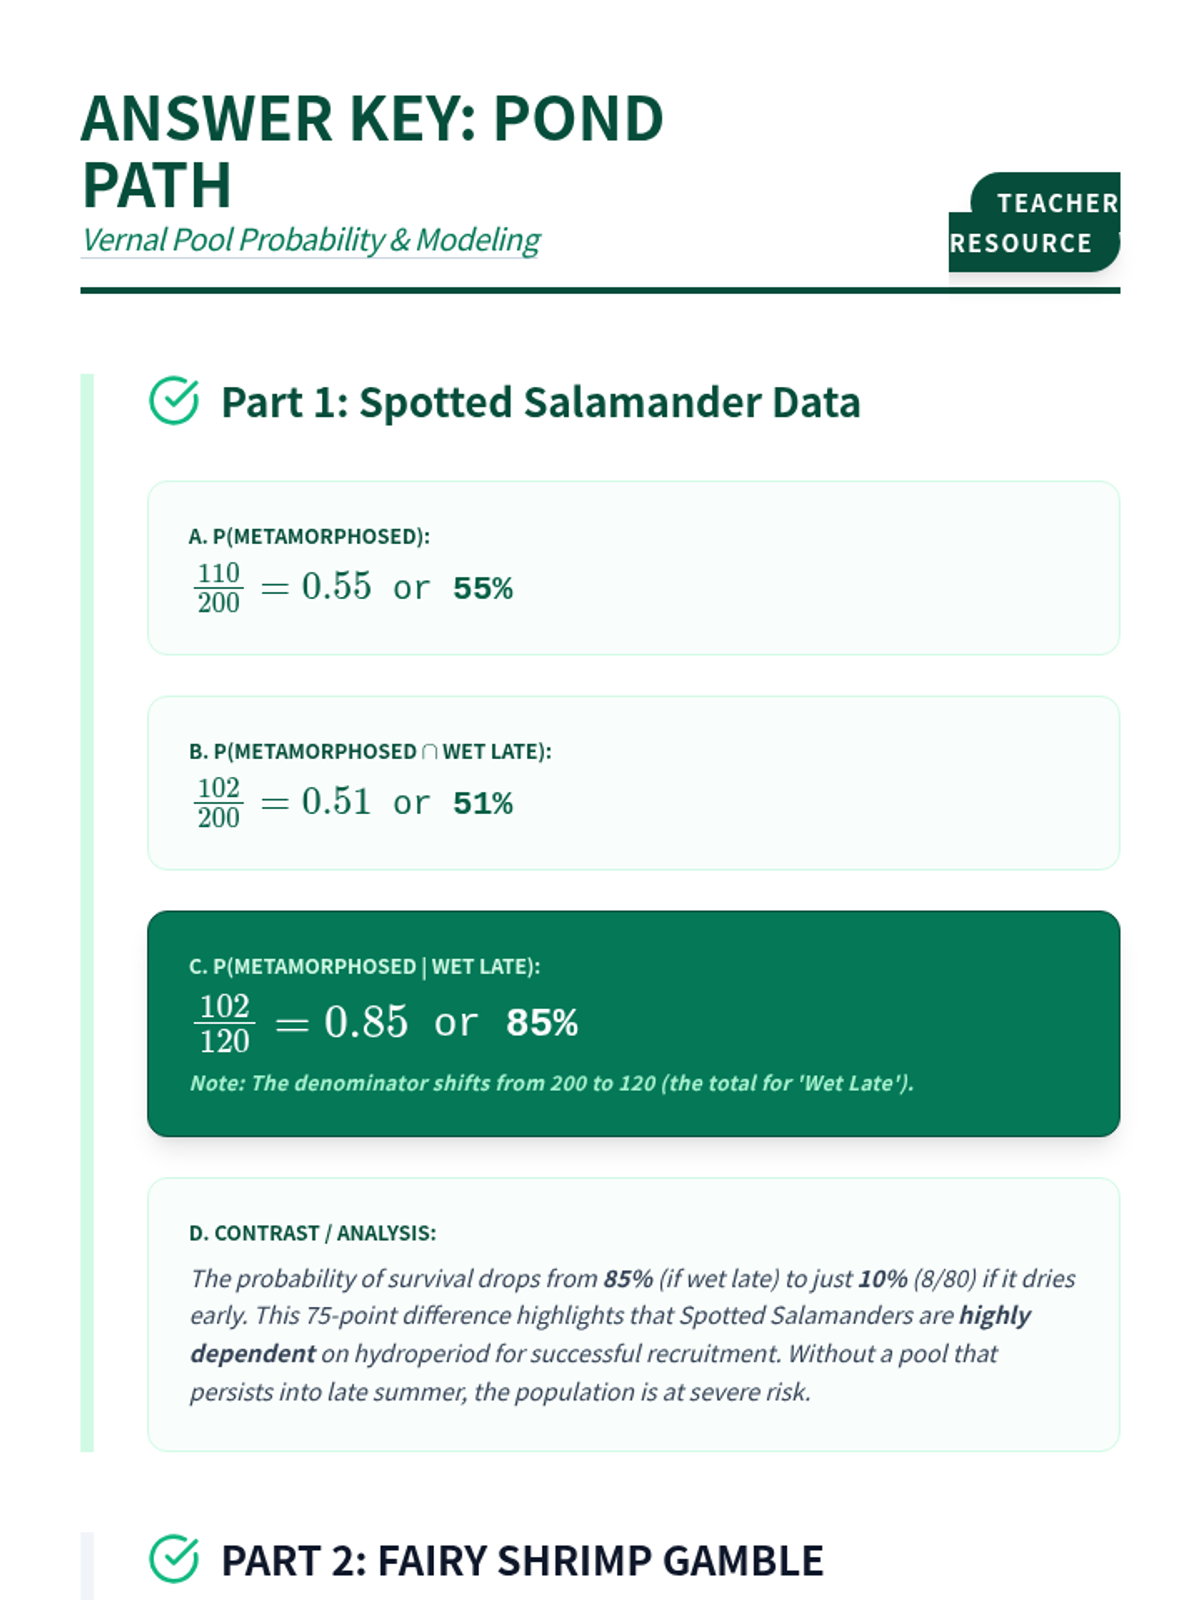
Students apply conditional probability and compound event analysis to understand the survival dynamics of species in vernal pools, bridging biology and statistical reasoning.
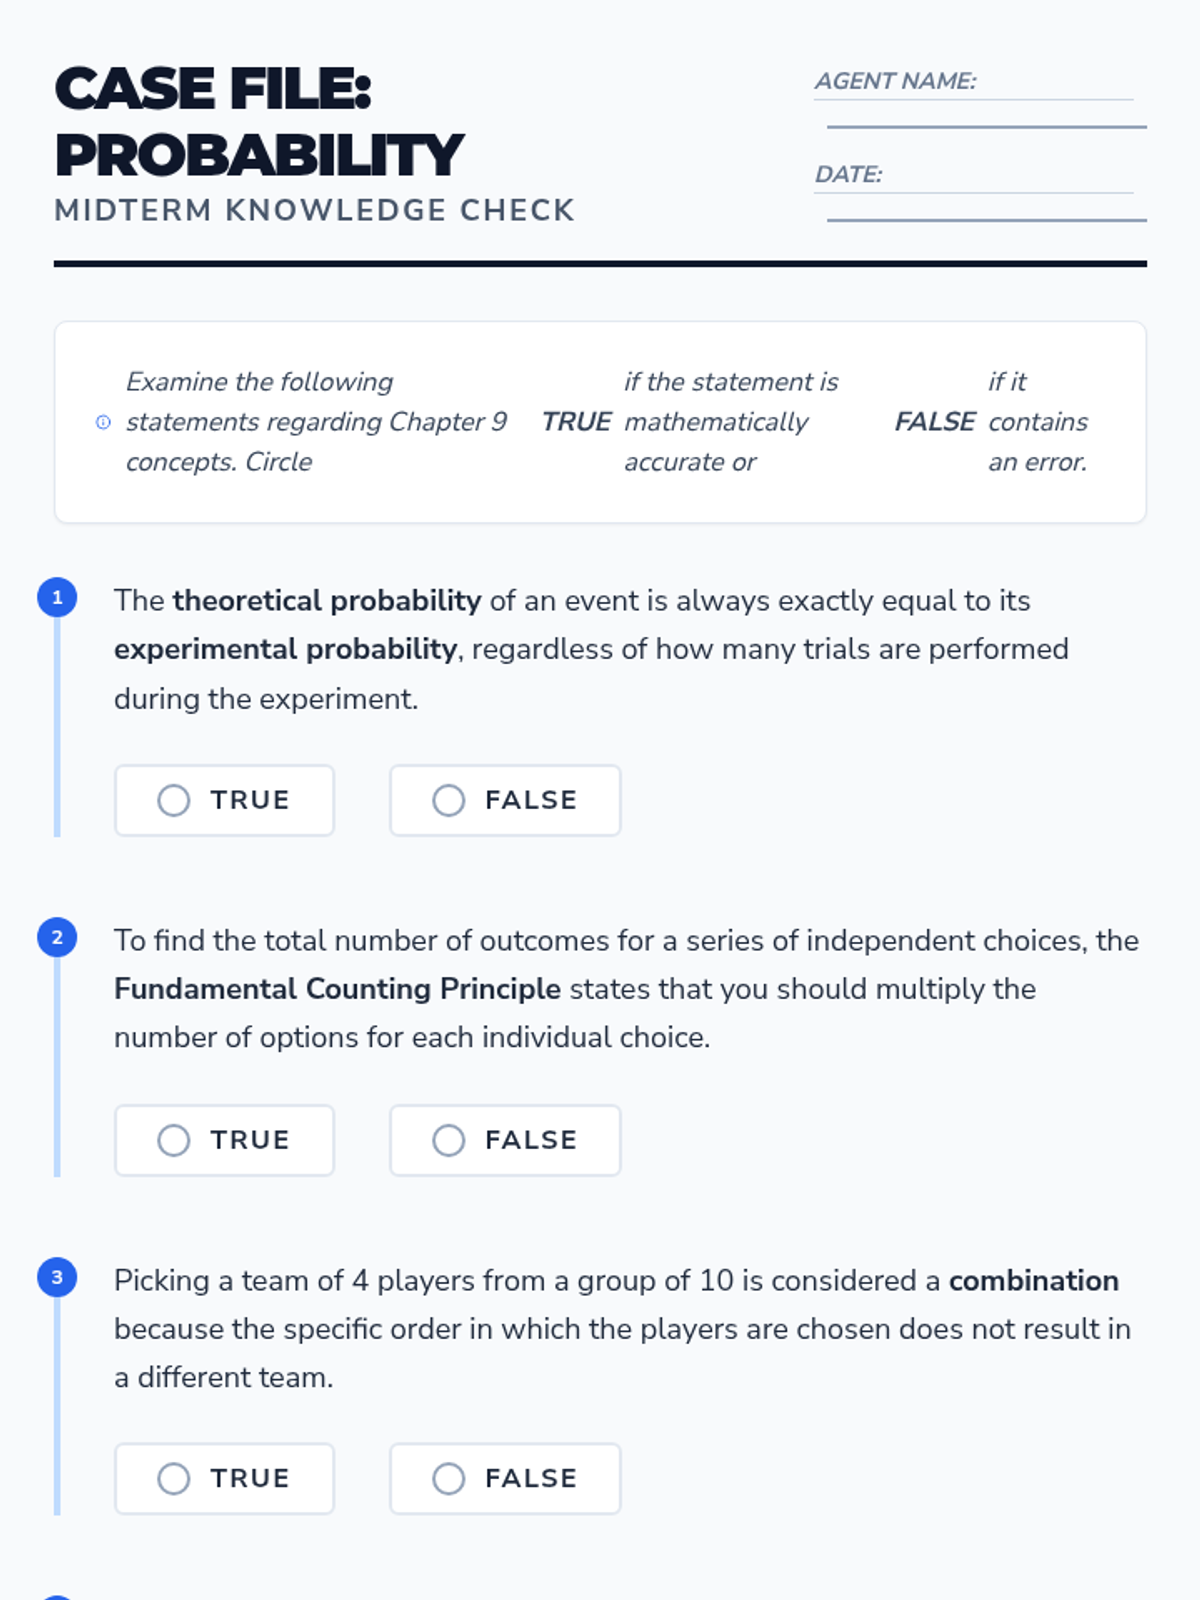
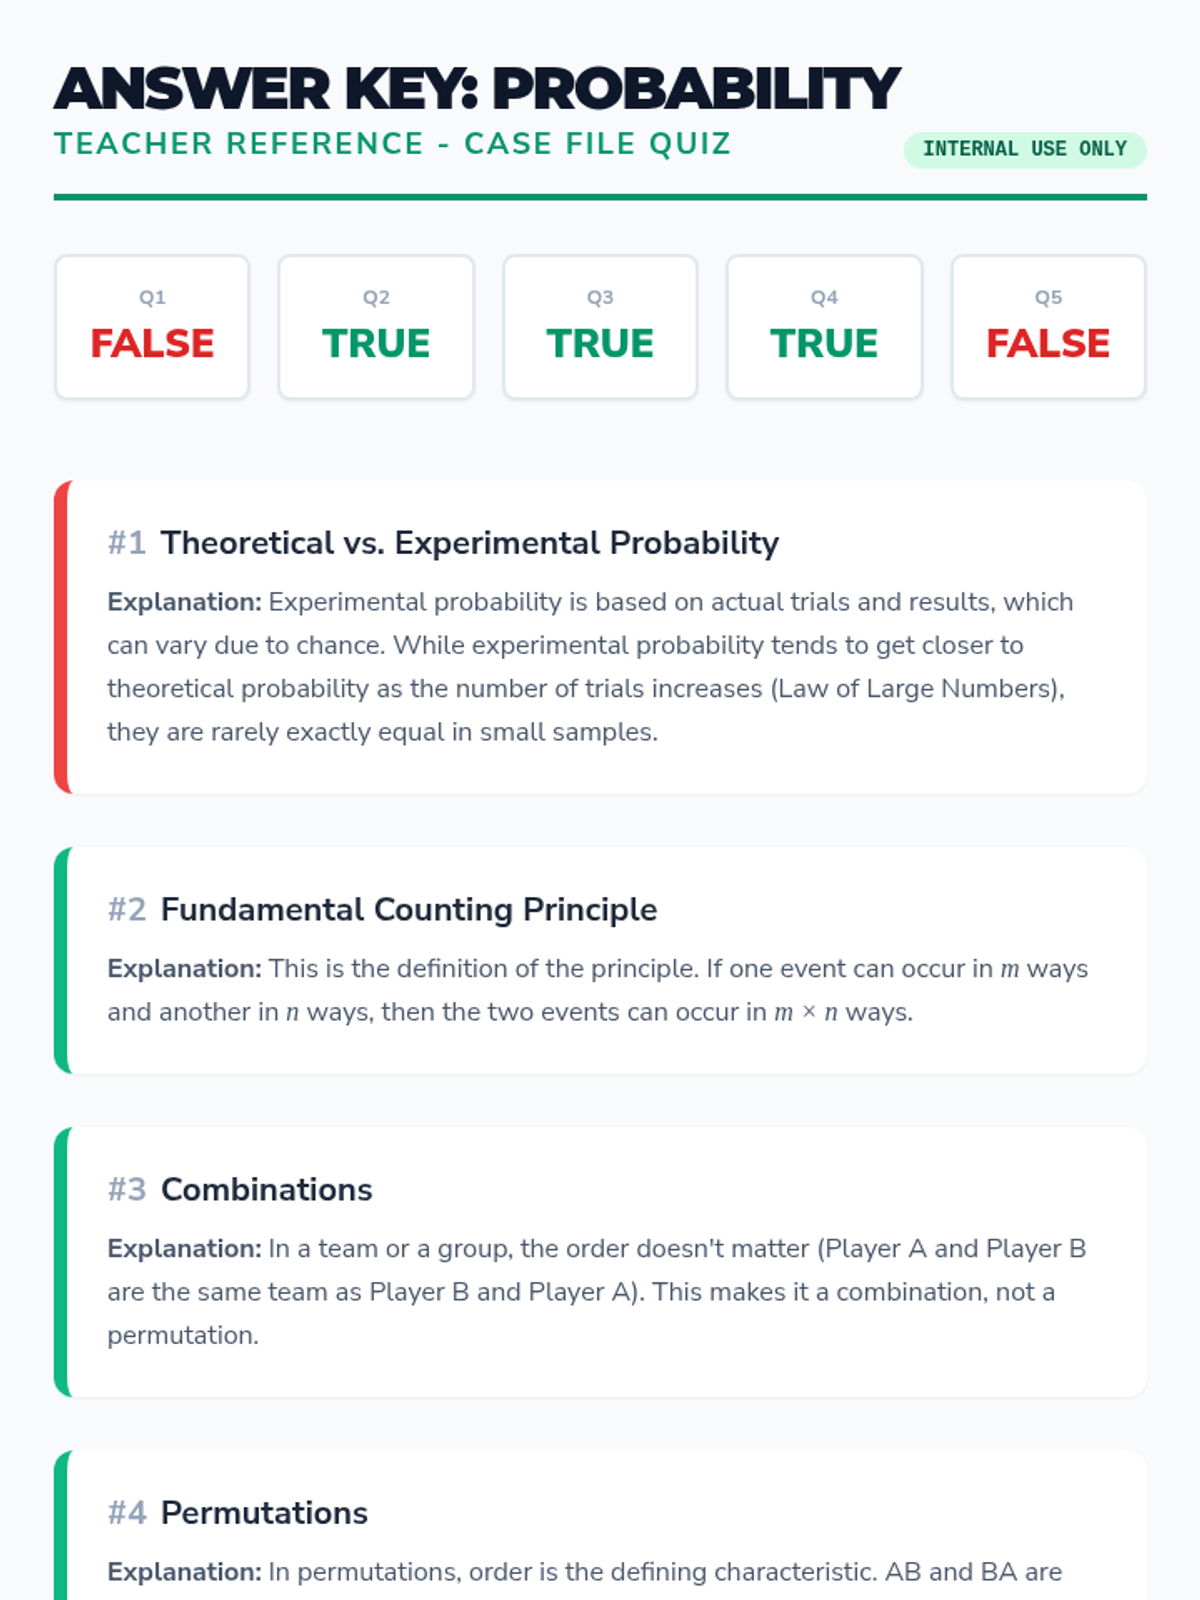
A focused review lesson covering the core concepts of probability, counting principles, and event types from Pre-Algebra Chapter 9.
A comprehensive assessment covering descriptive statistics, data distributions, measures of variation, and basic probability theory including tree diagrams.
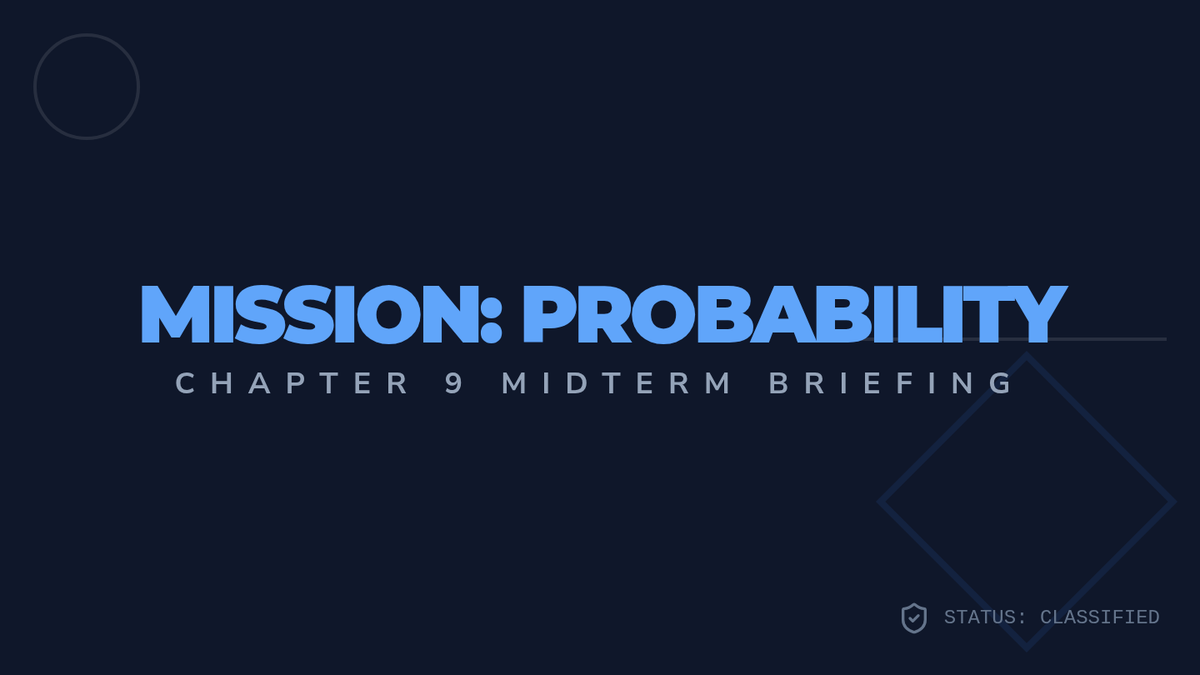
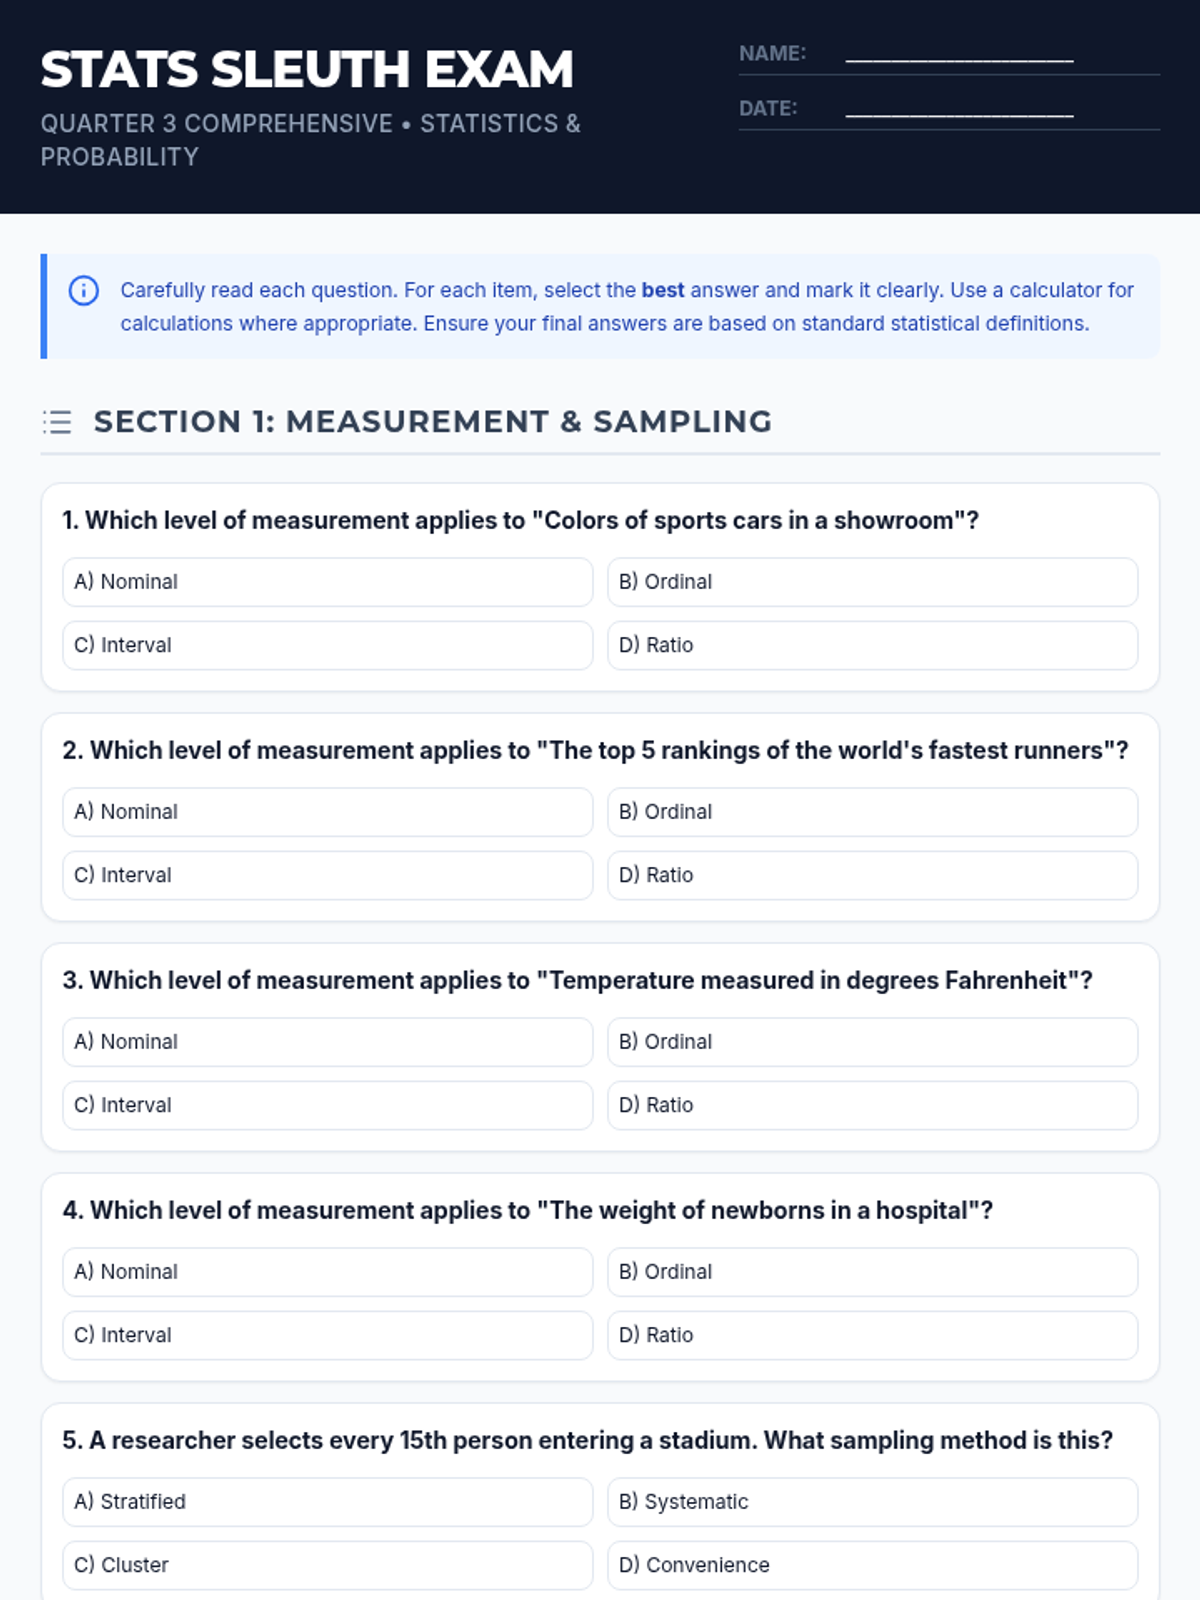
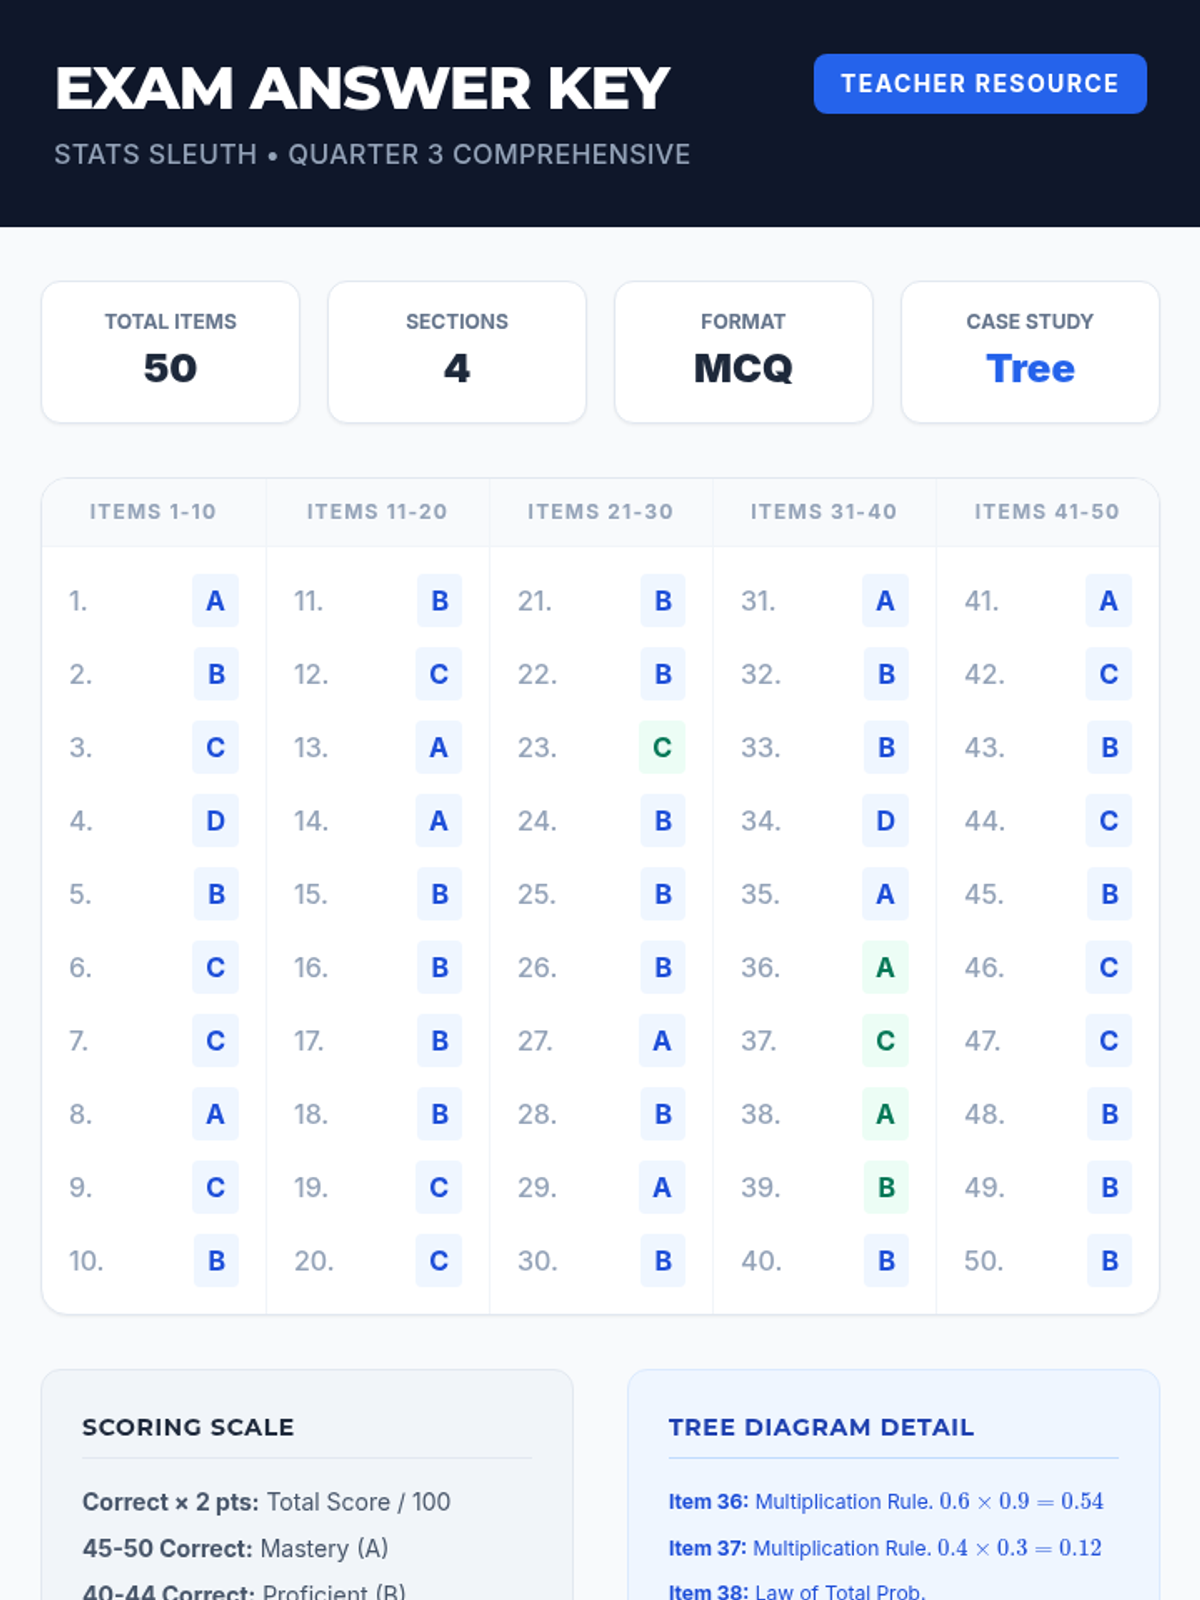
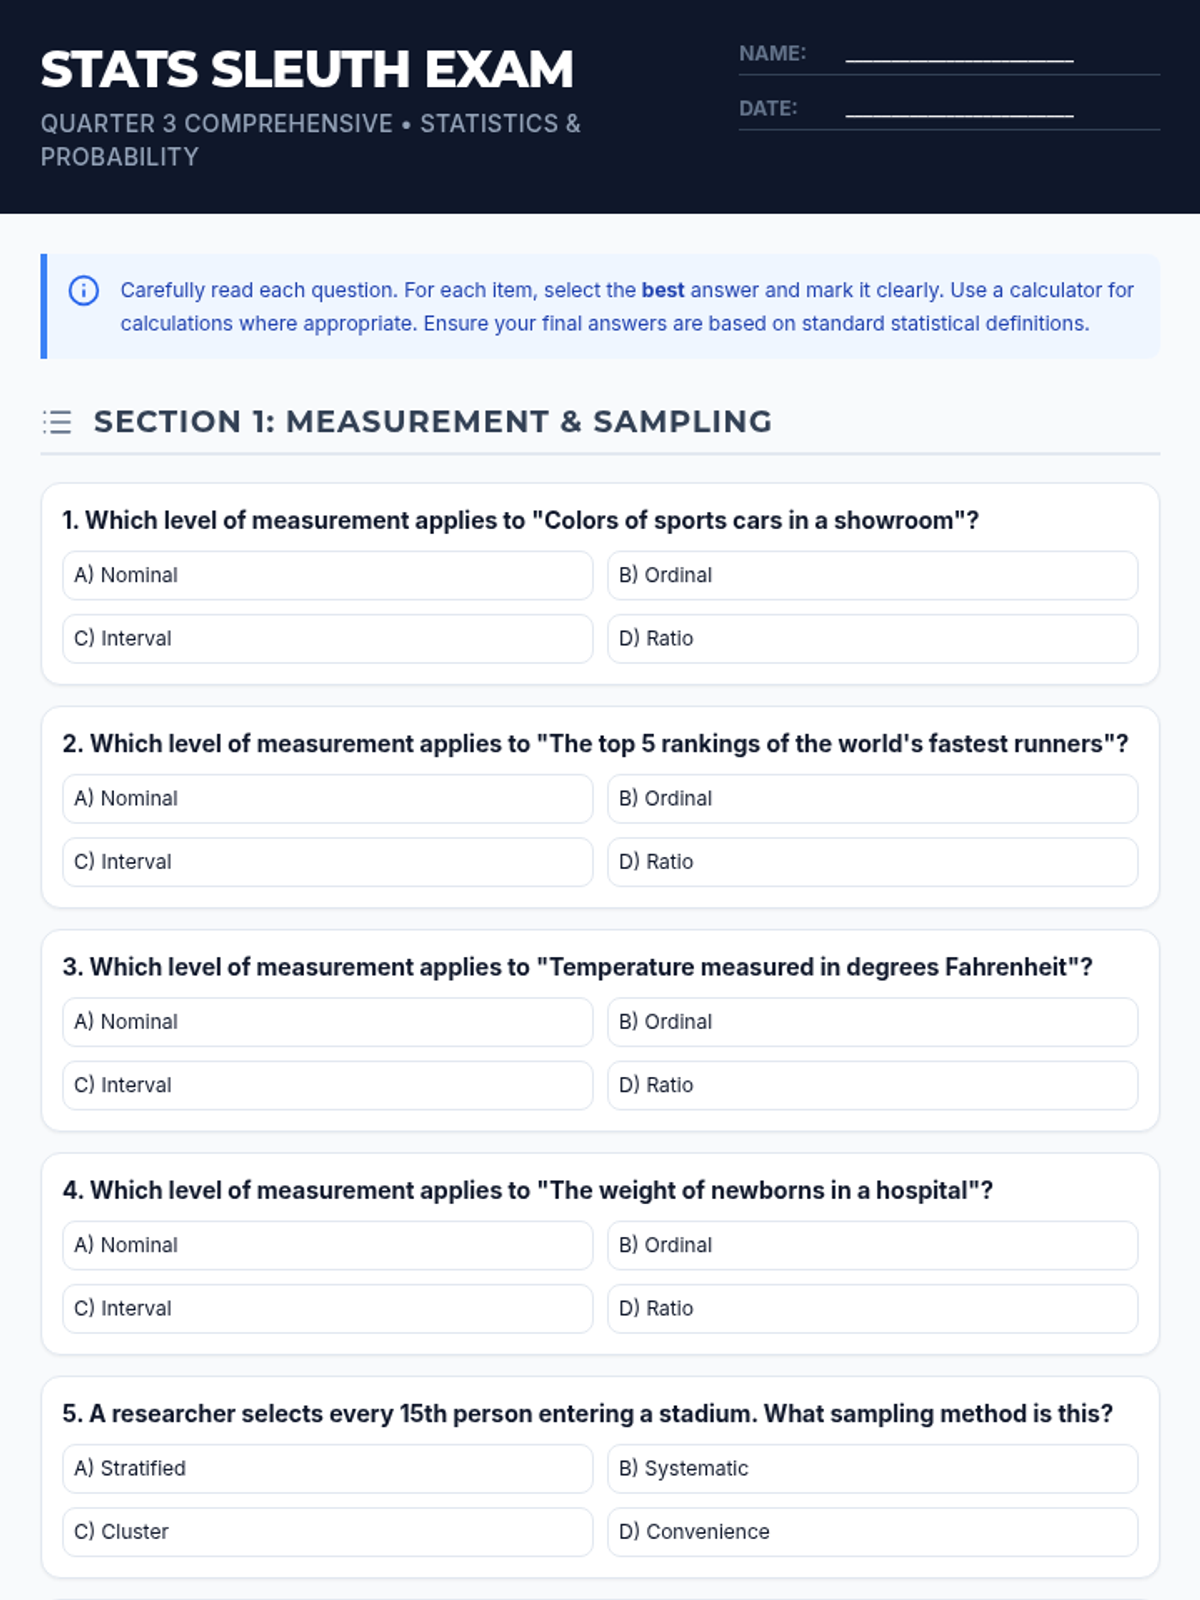
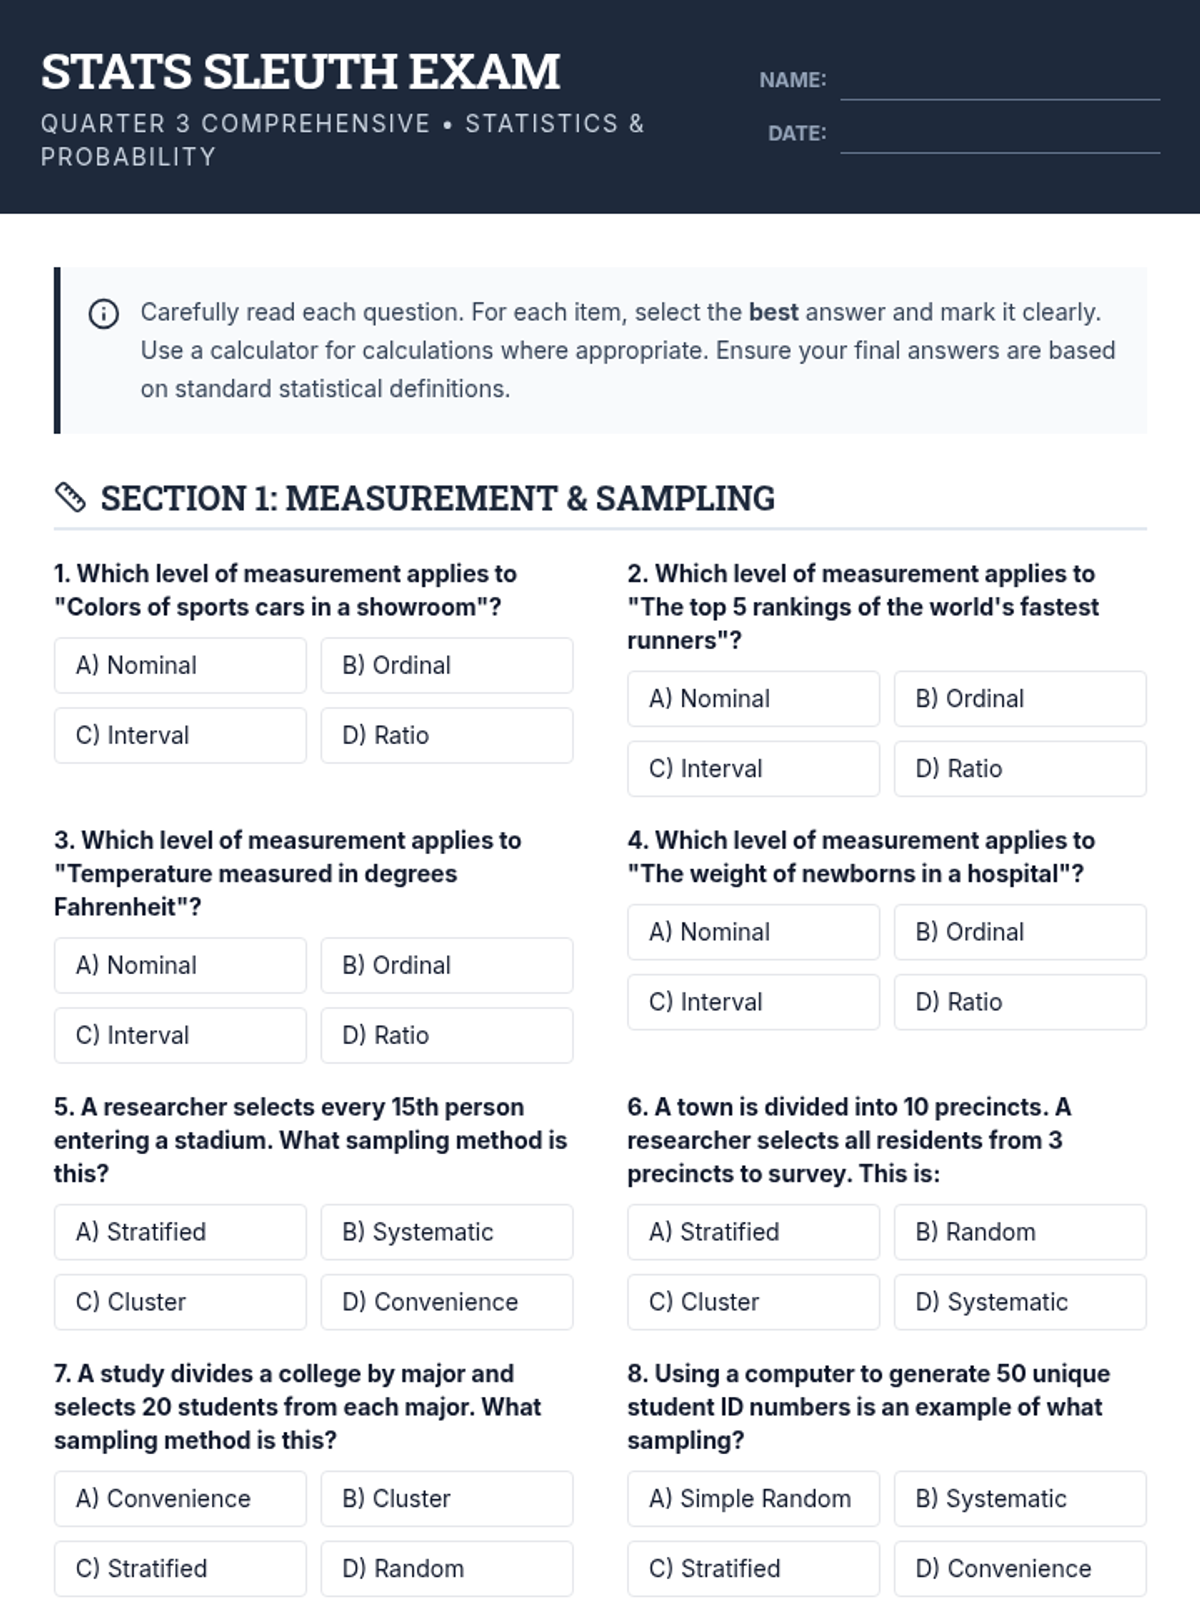
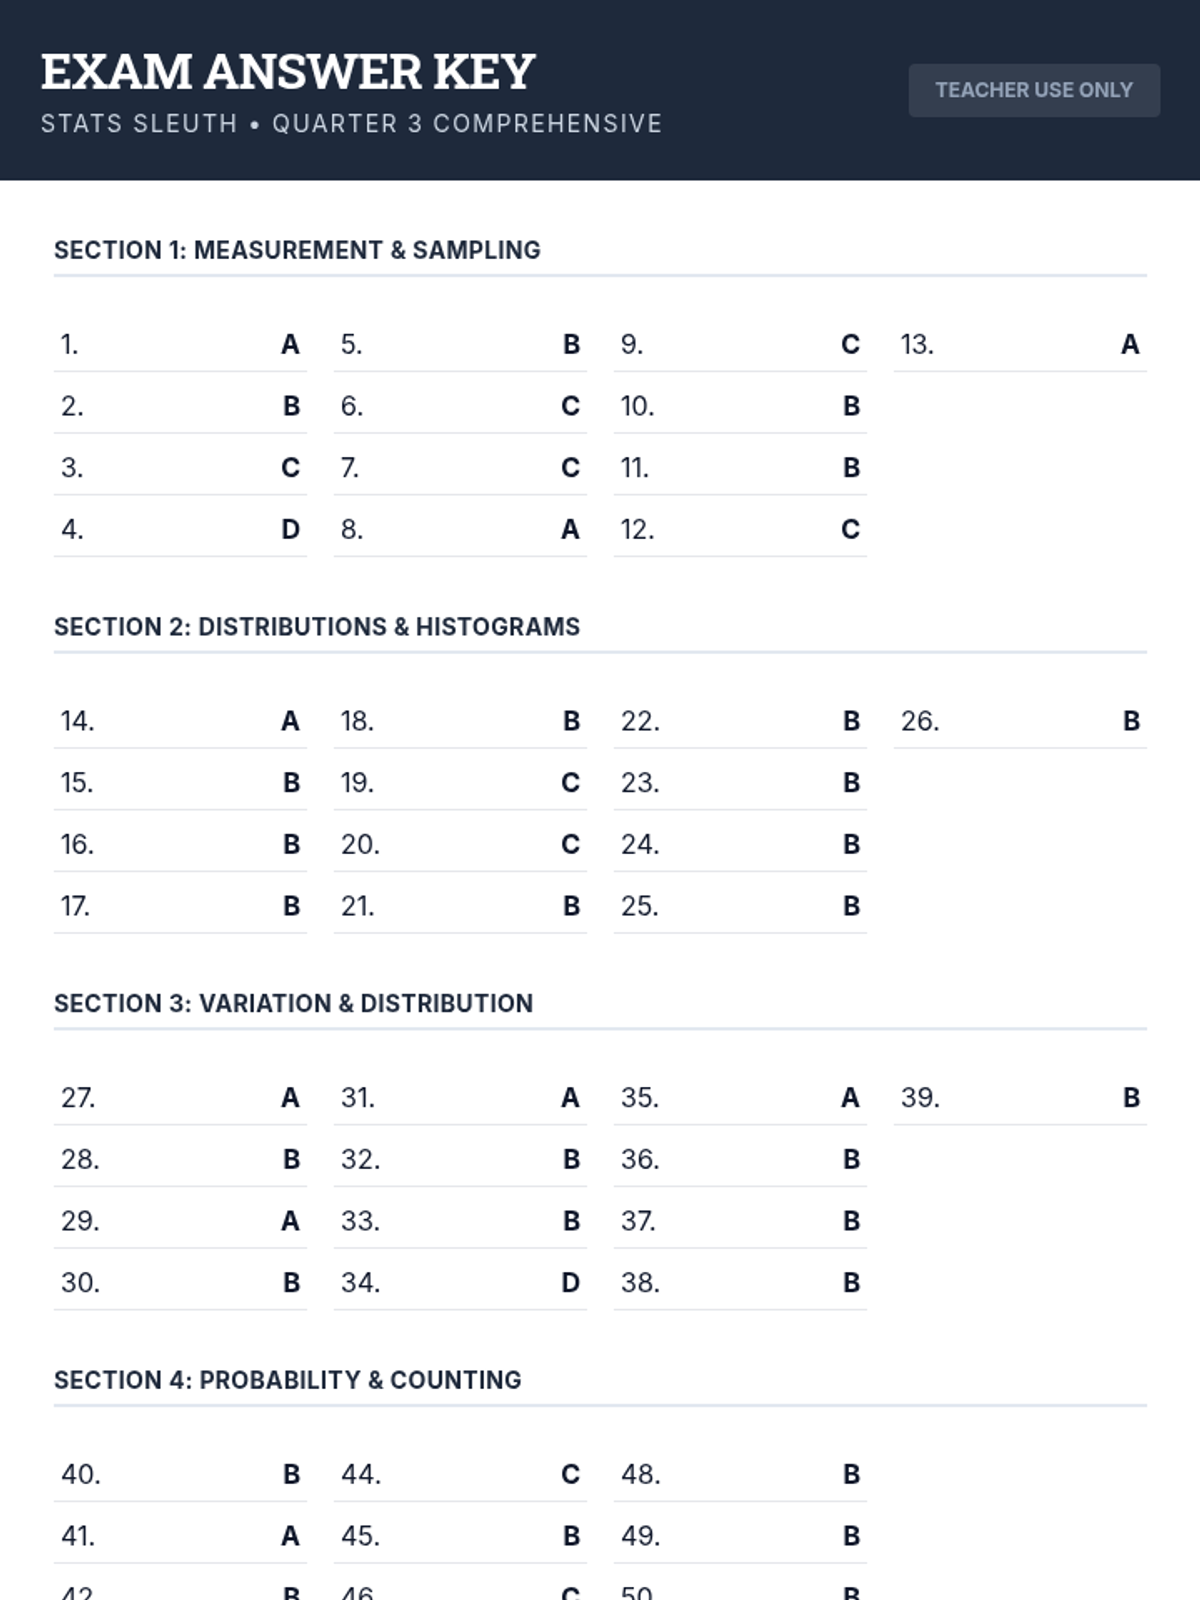
A comprehensive 3rd-quarter statistics assessment combining data interpretation, central tendency, variation, probability, and counting techniques. Students analyze real-world scenarios including justice system data, tax polls, and probability models.
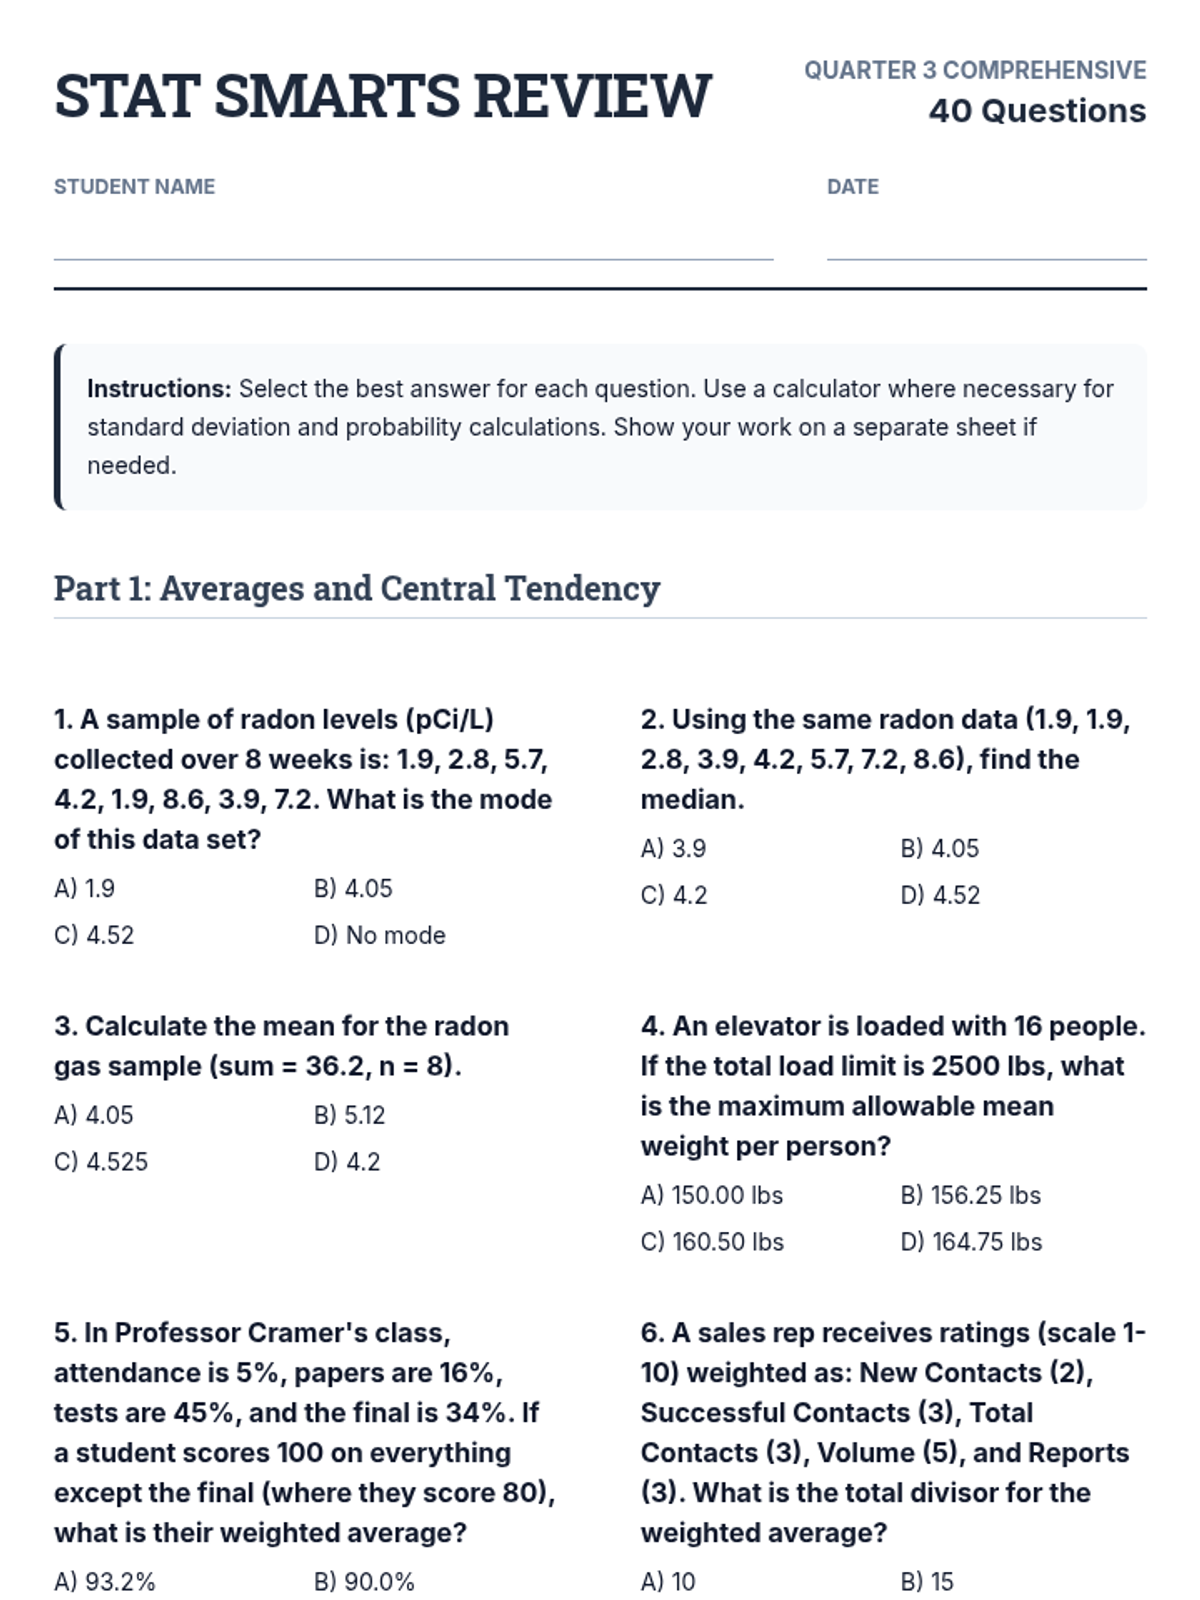
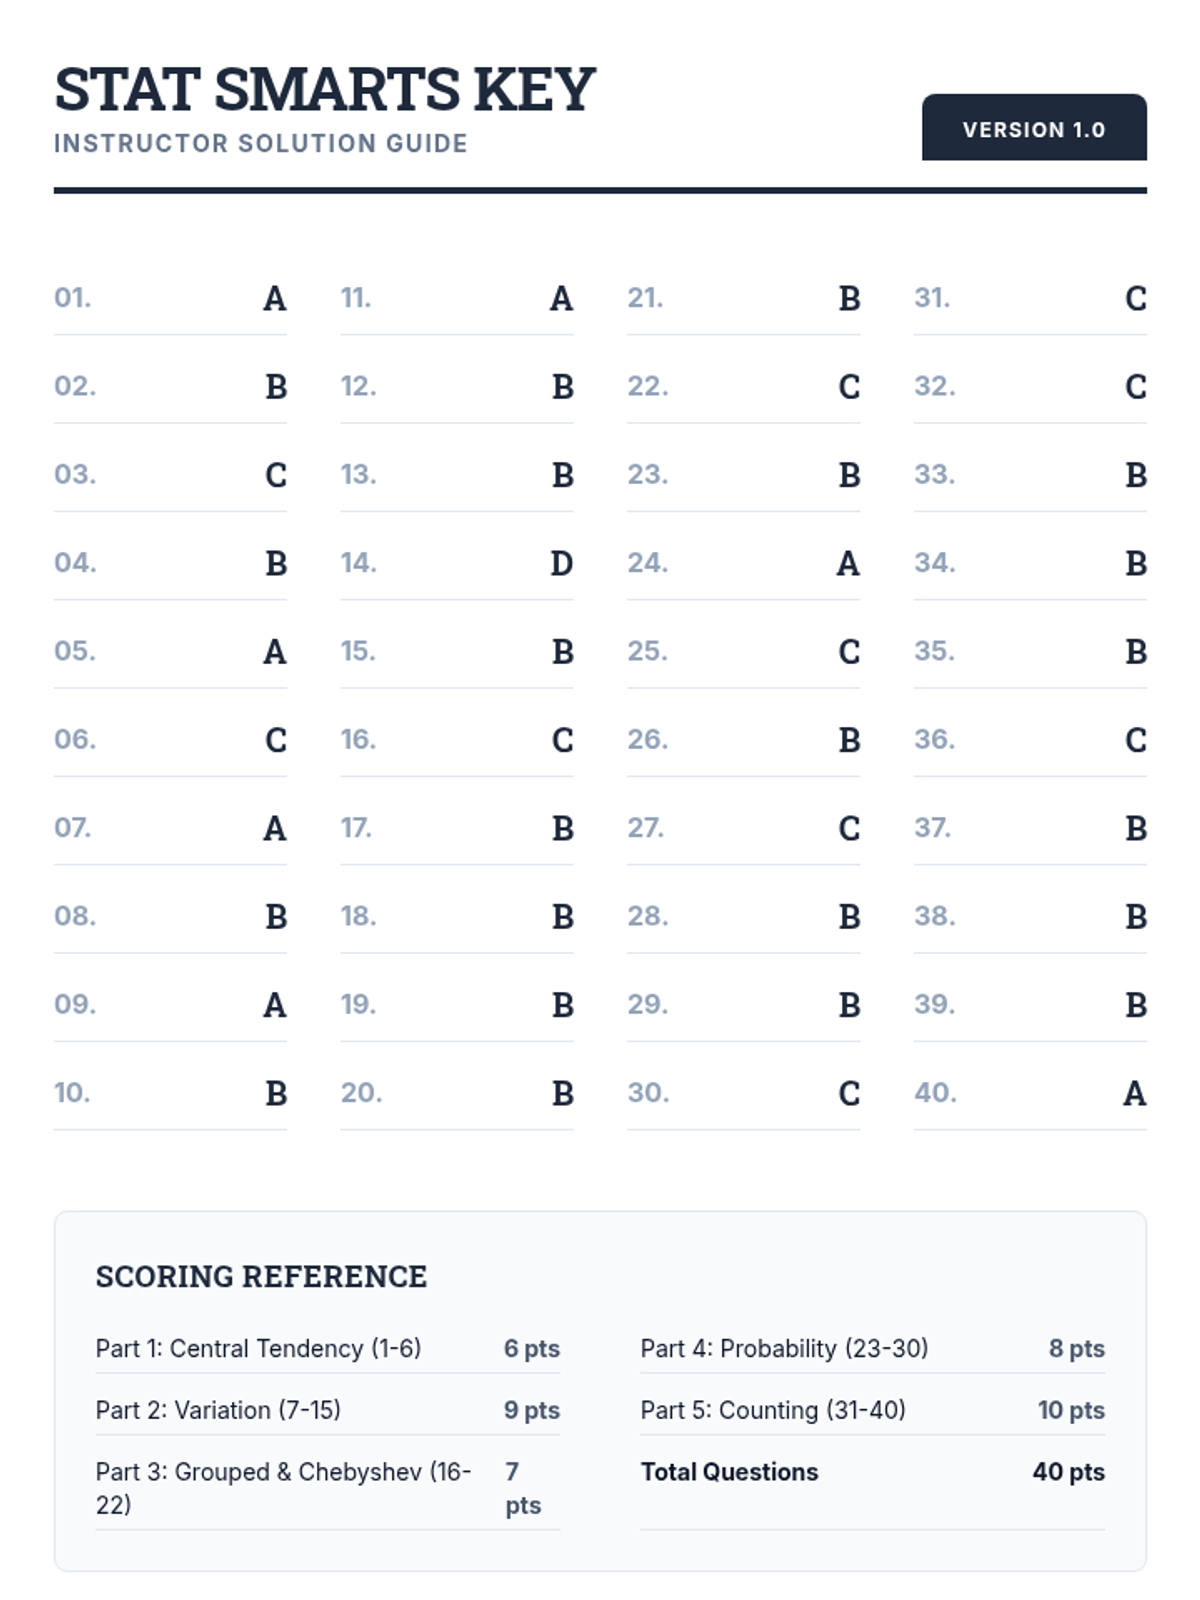
A comprehensive 40-question review covering descriptive statistics, elementary probability, and counting techniques based on Algebra 1 and Statistics curriculum.
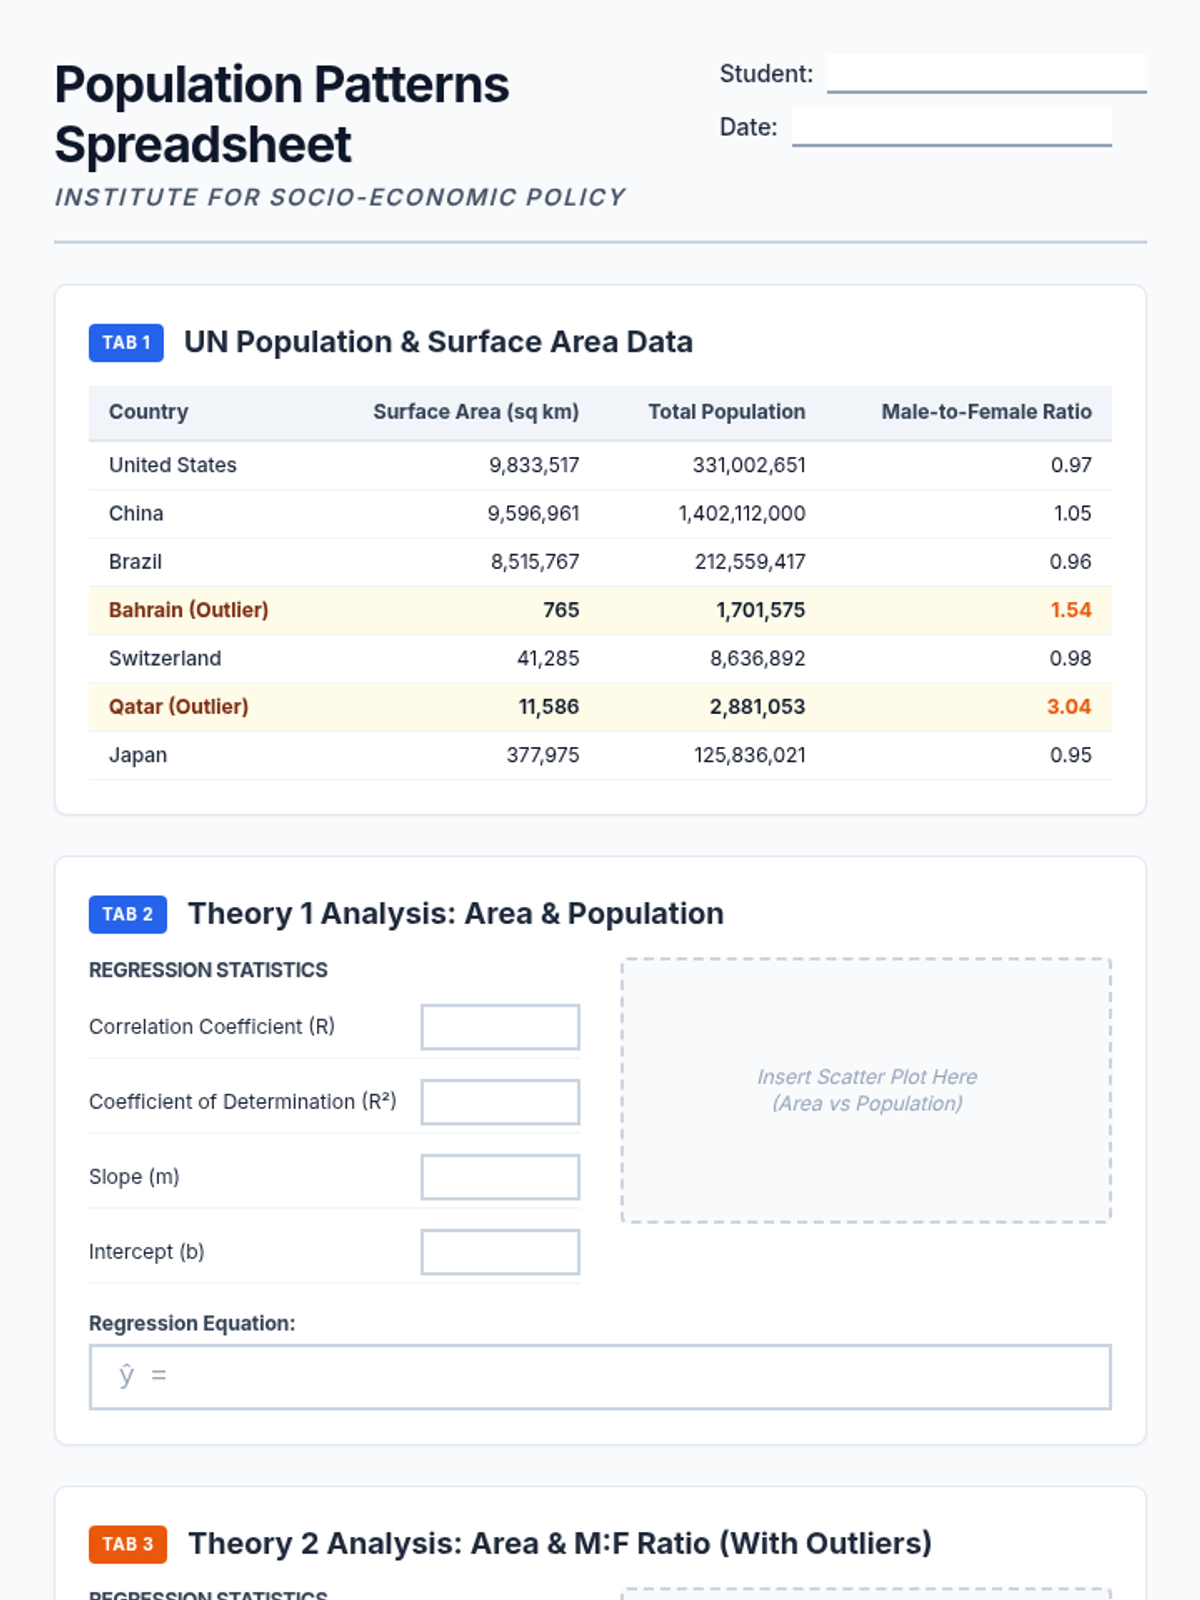
A project-based lesson on performing linear regression analysis using United Nations population and surface area data to test socio-economic theories.
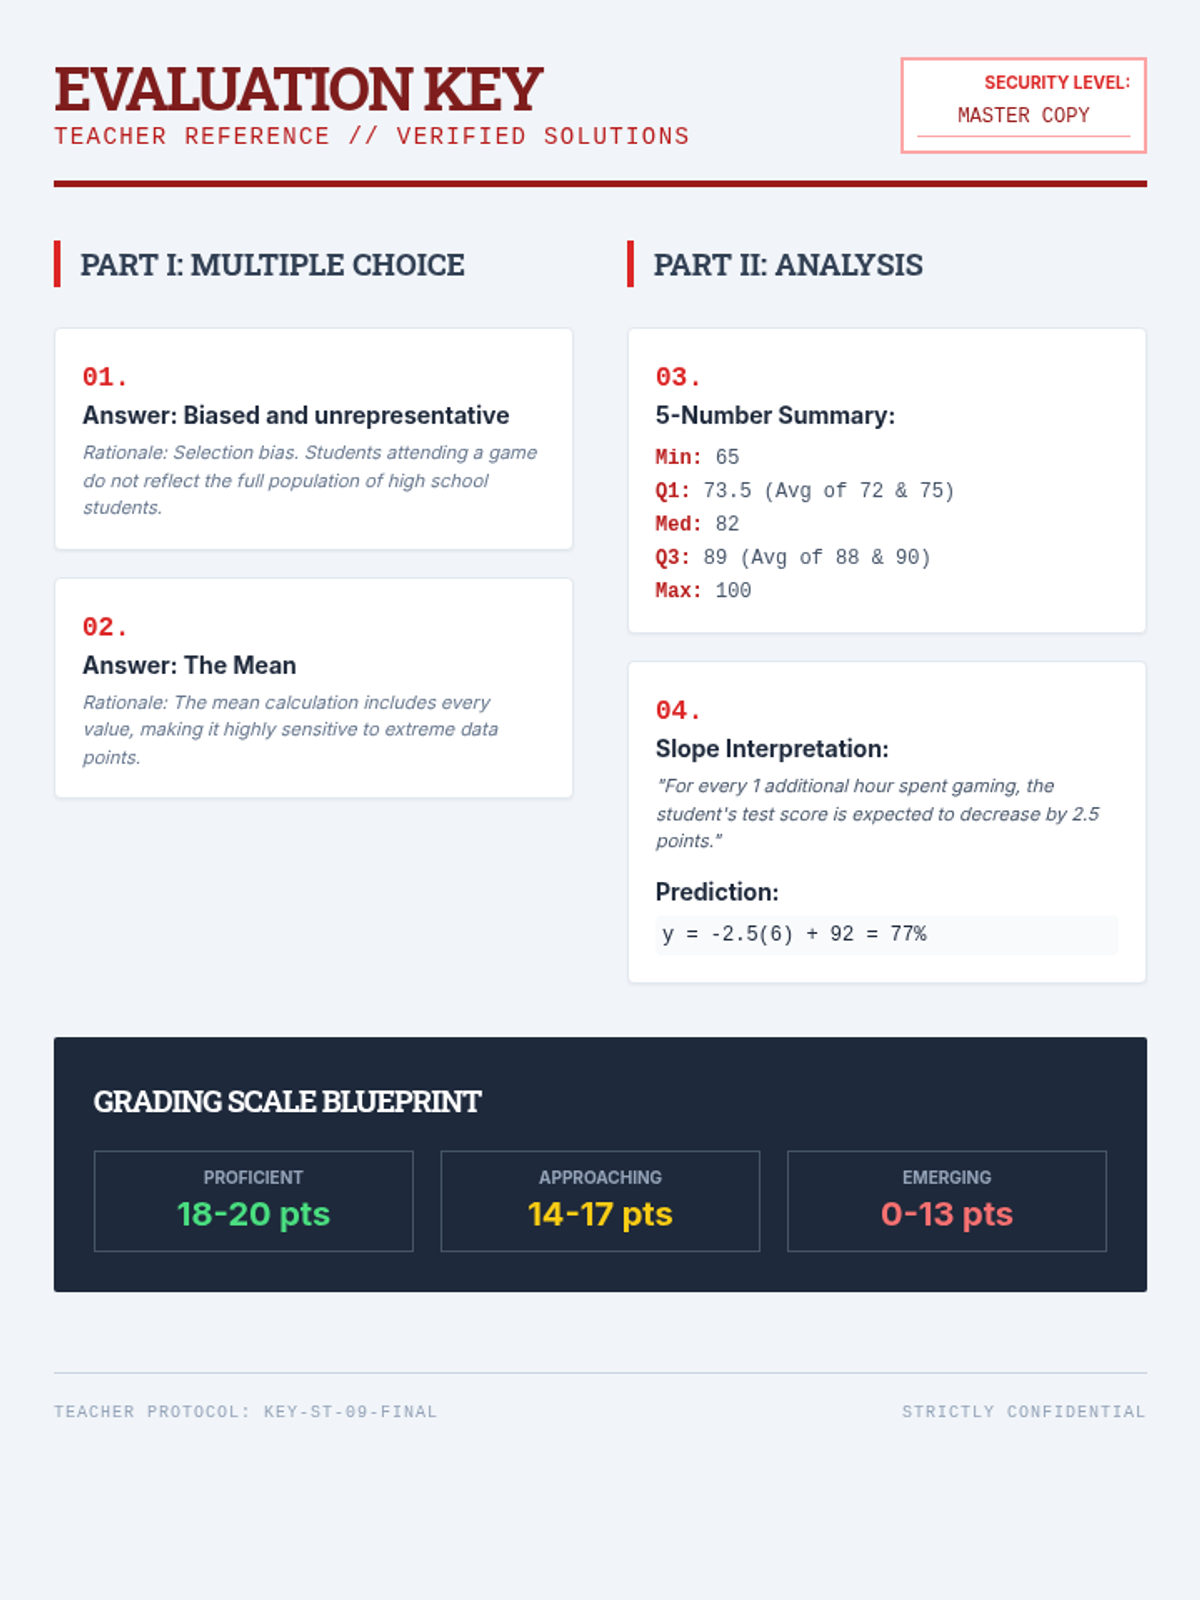
A comprehensive assessment lesson for 9th-grade statistics, covering central tendency, data visualization, sampling, and correlation through a blueprint-themed instructional arc.
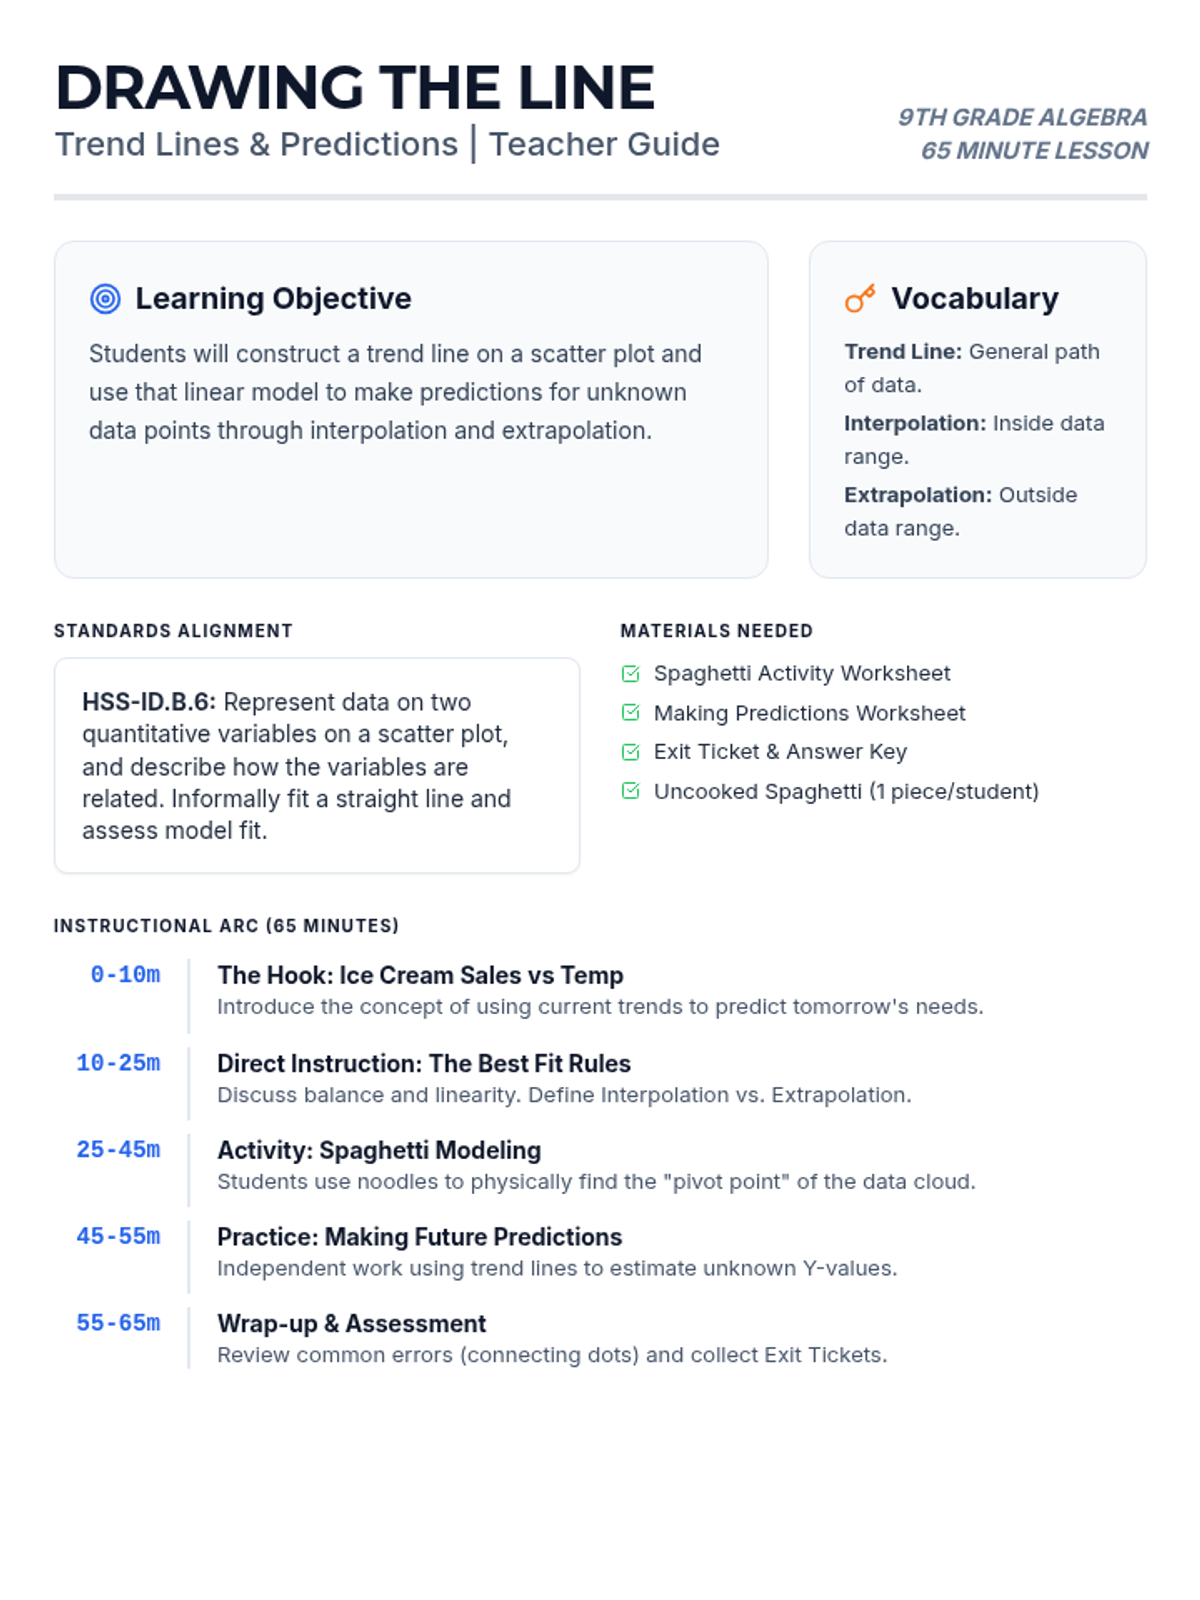
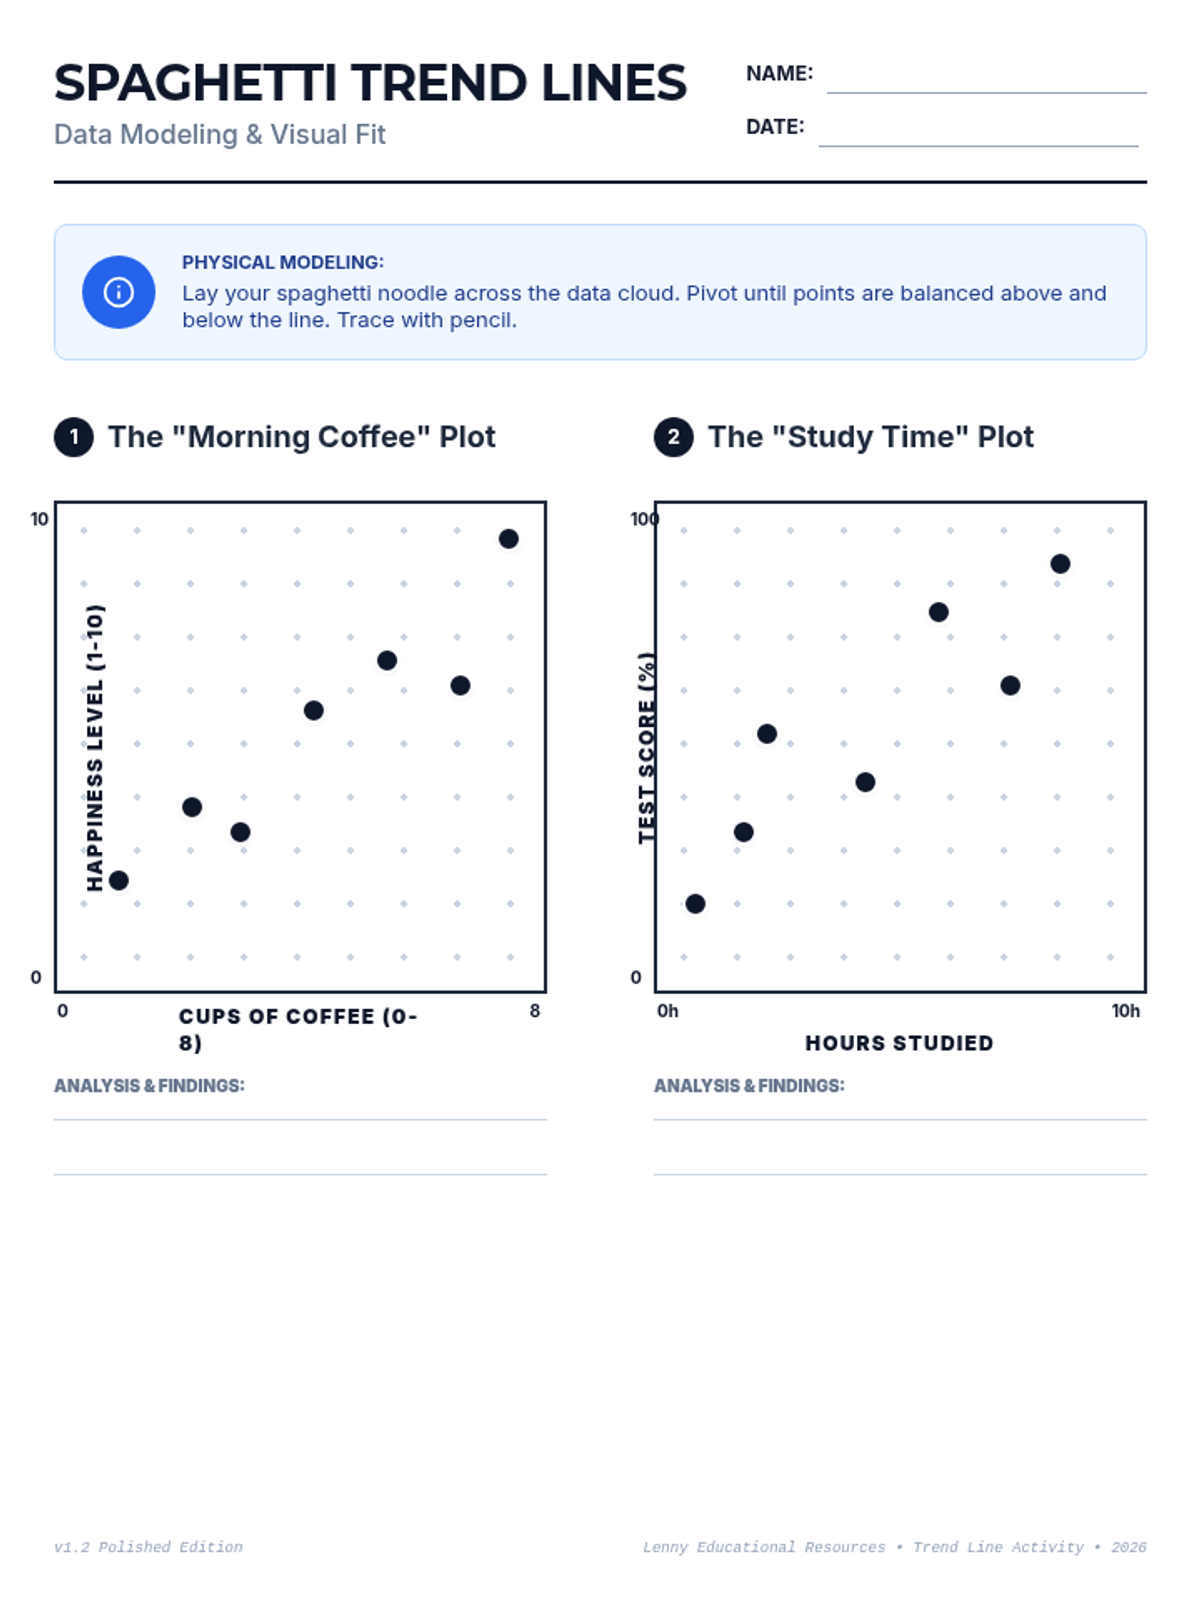
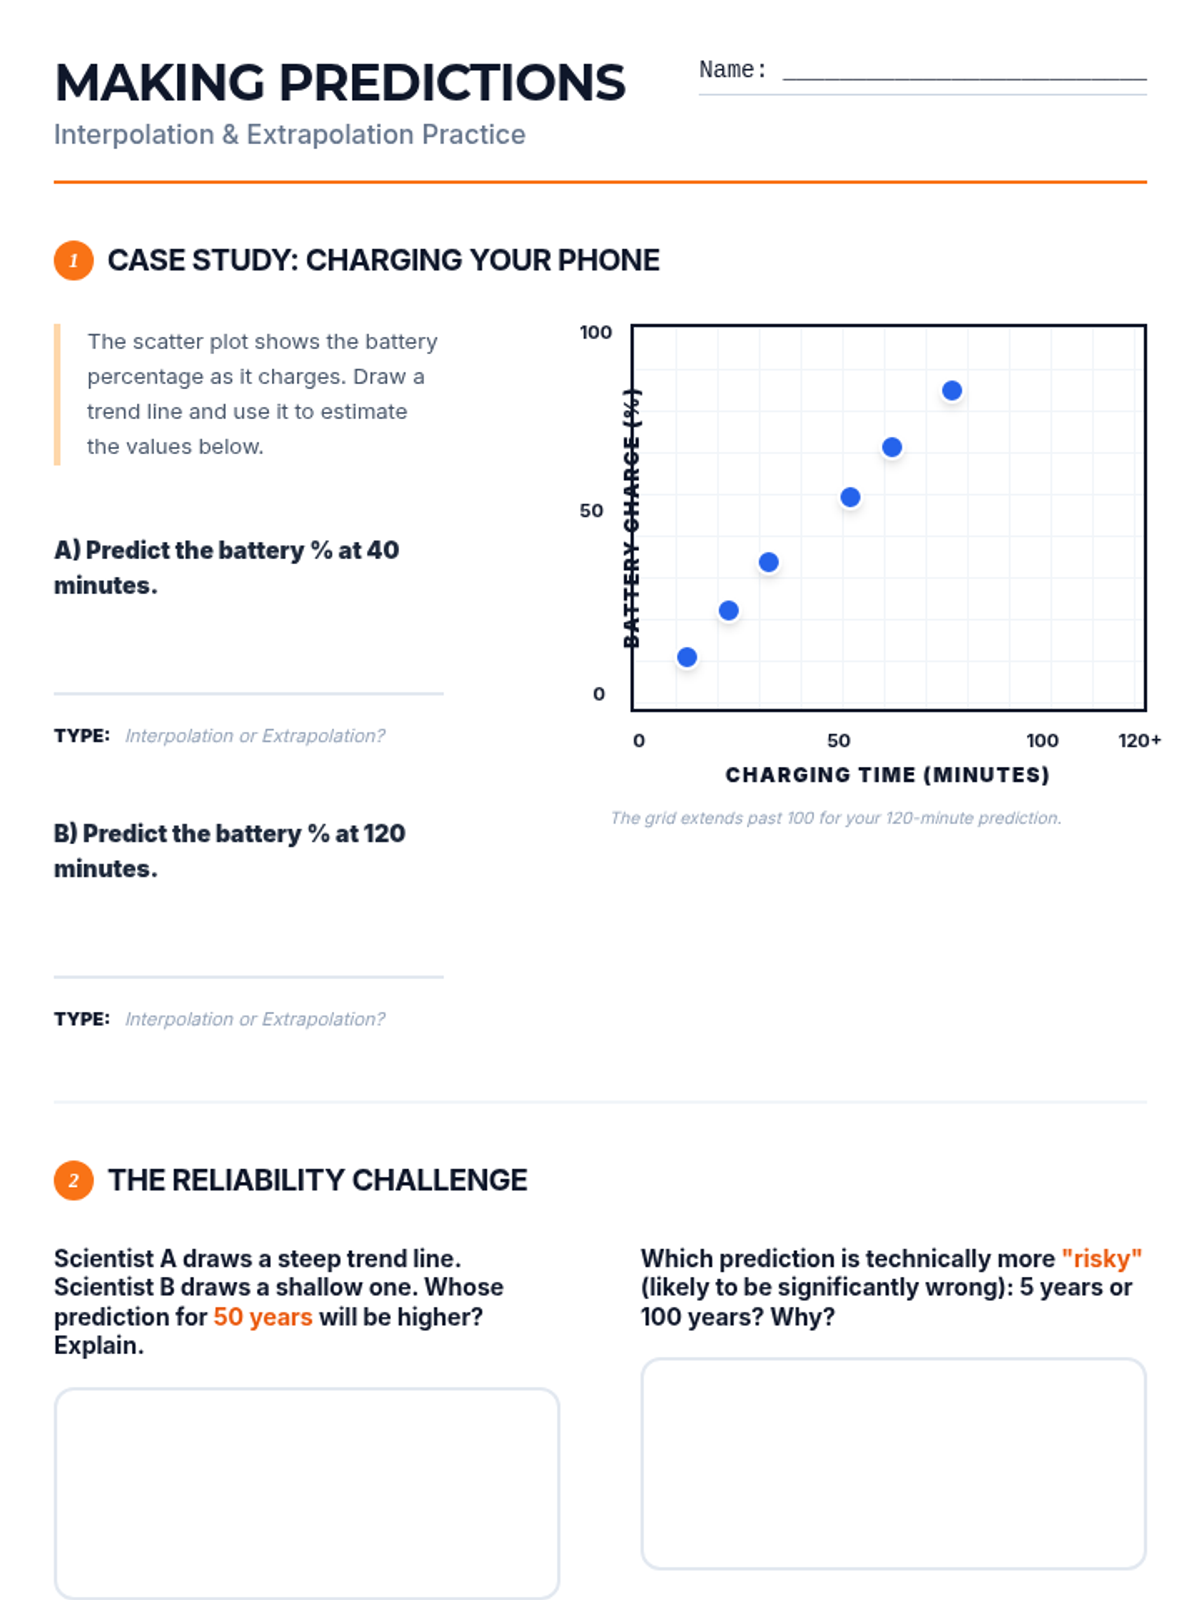
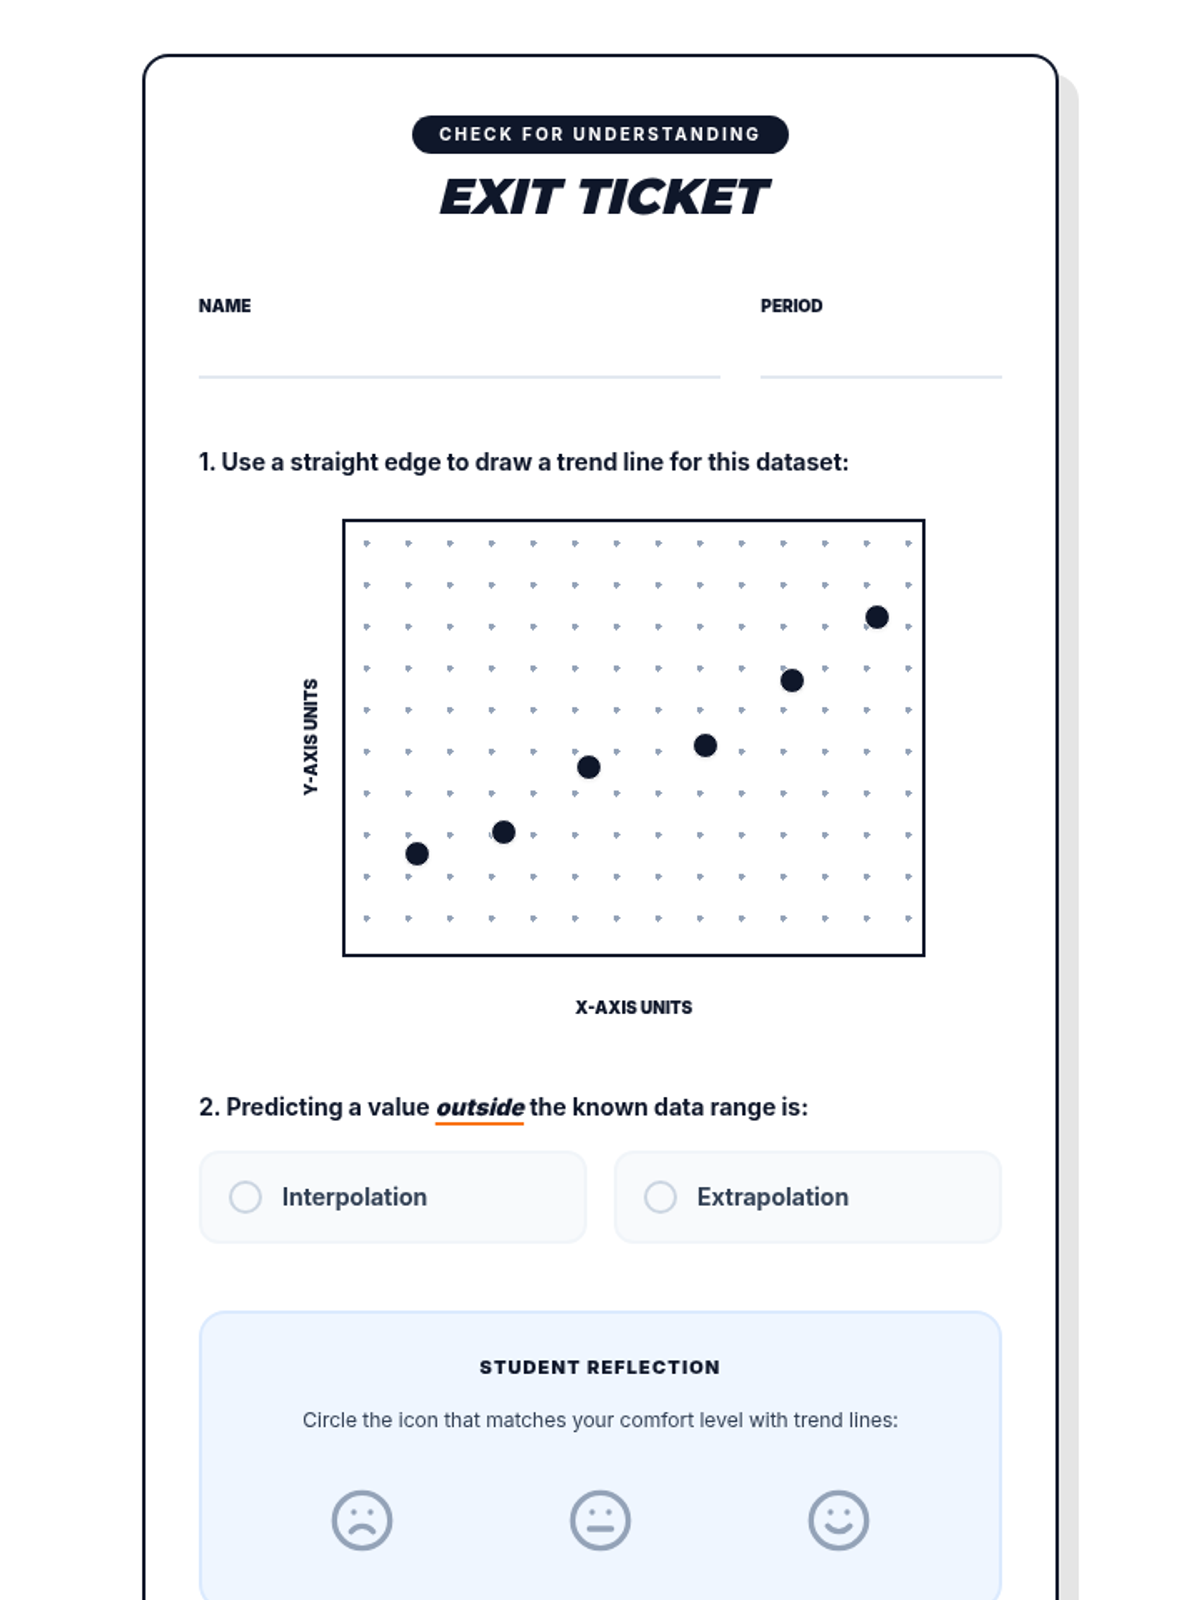
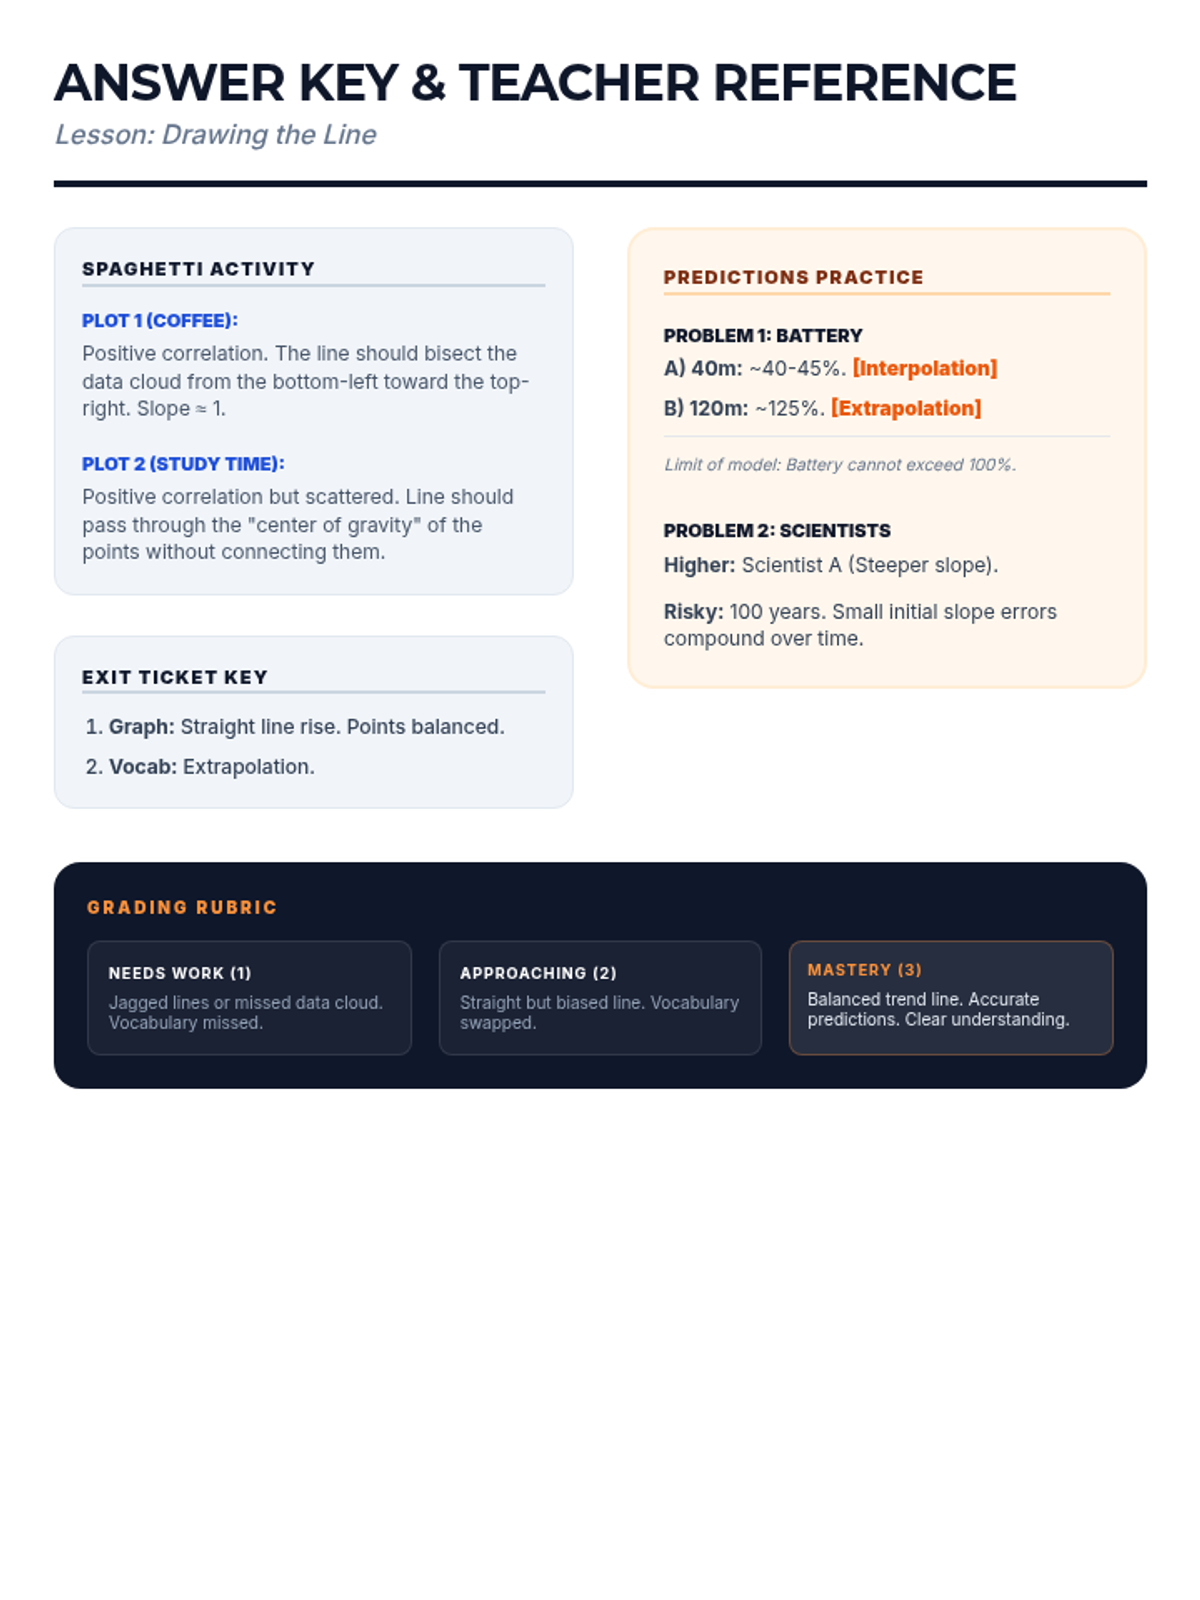
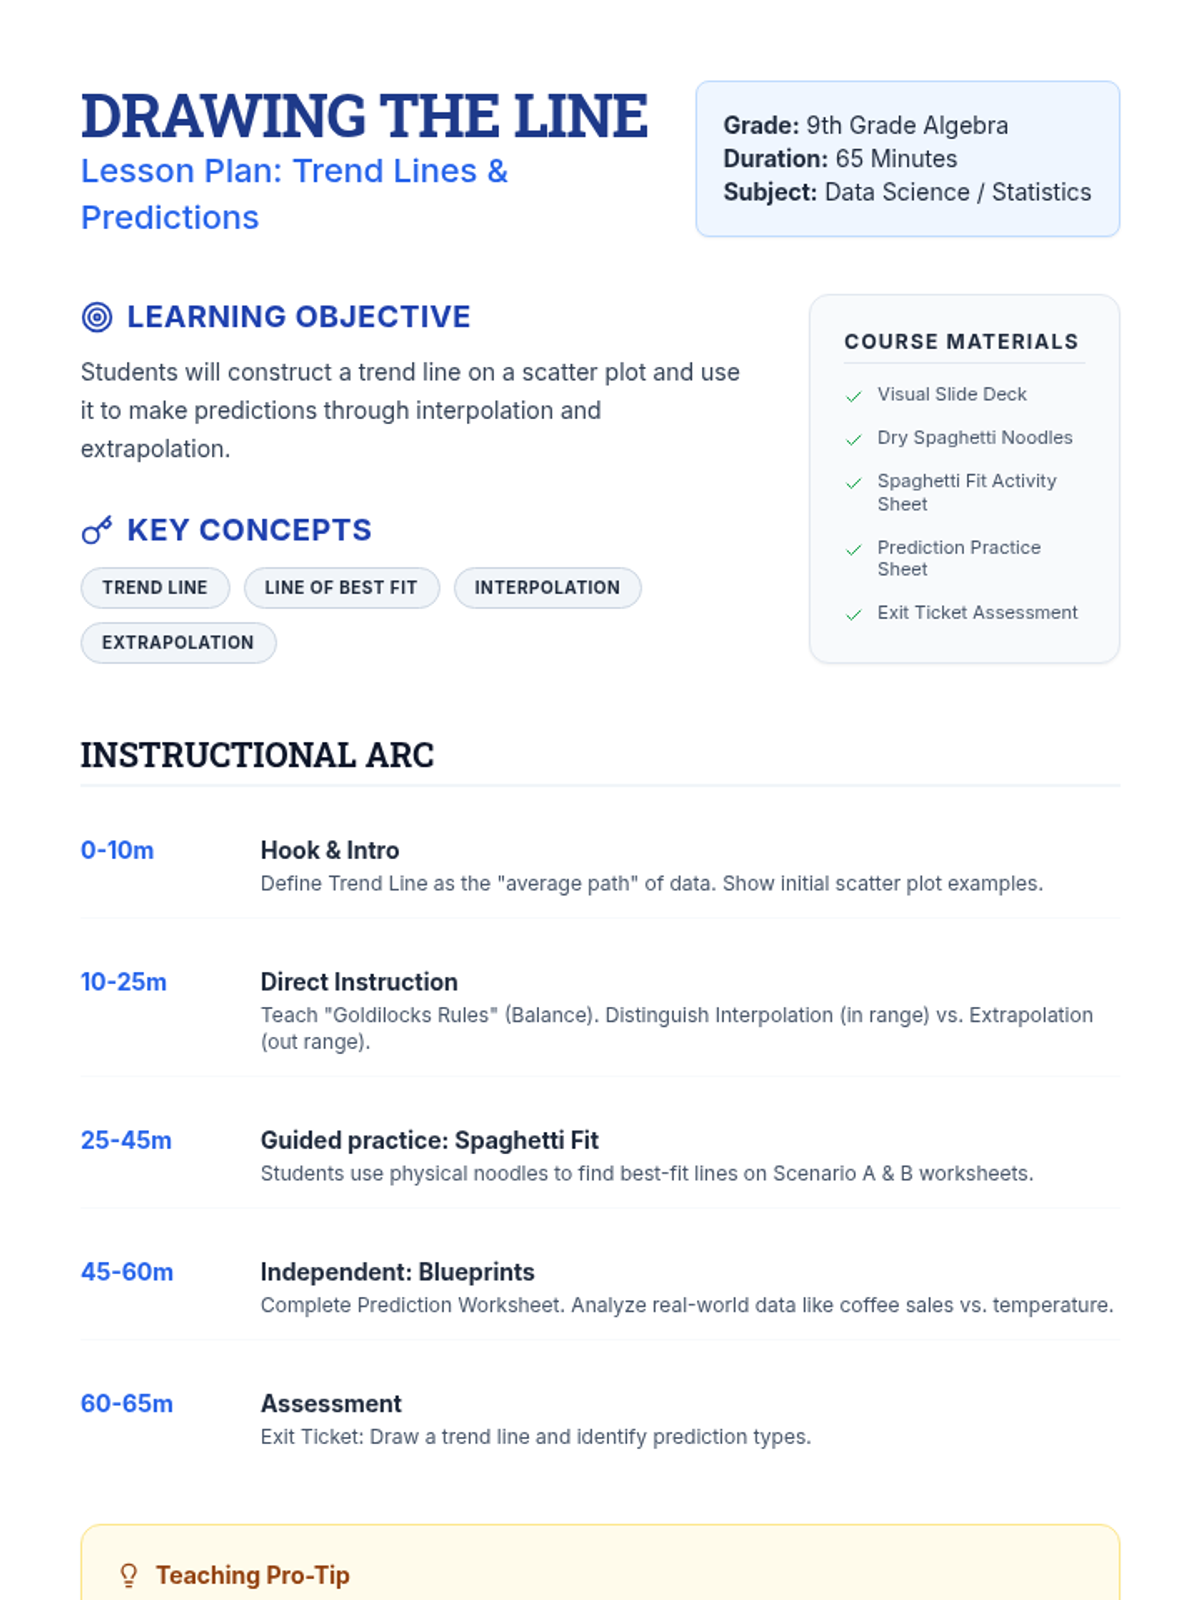
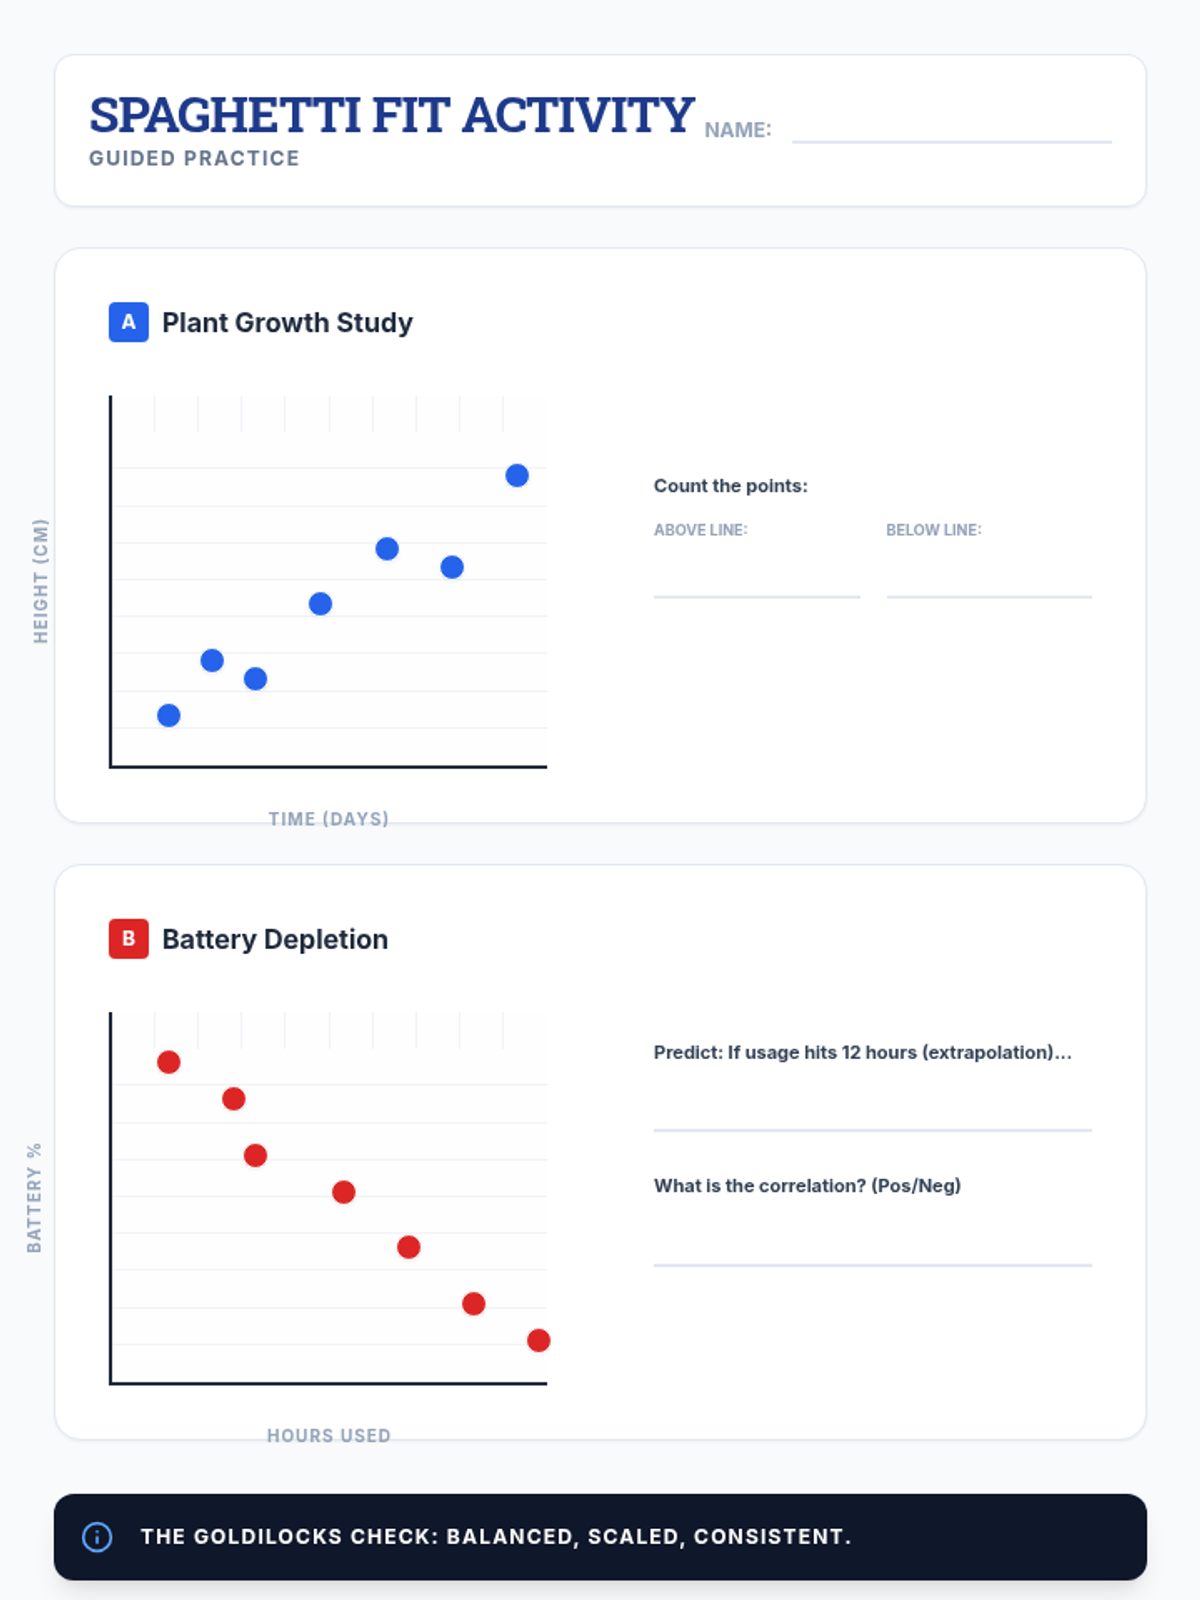
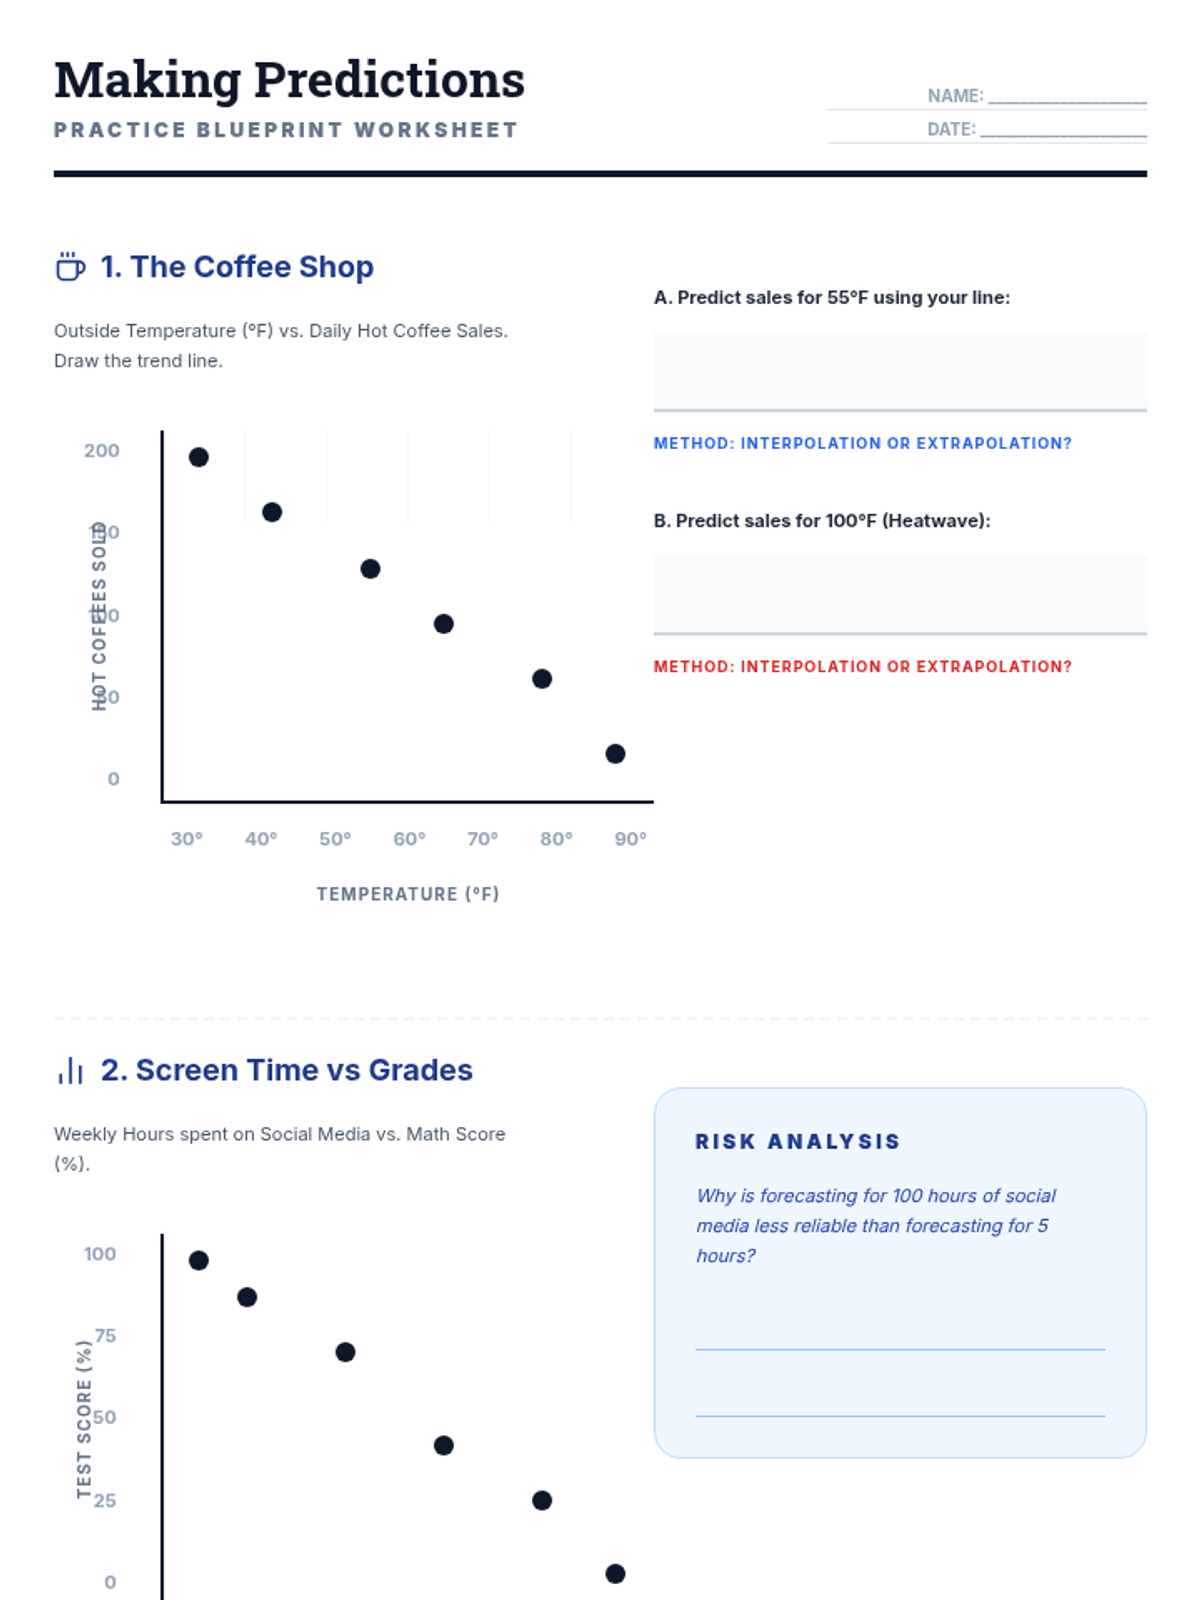
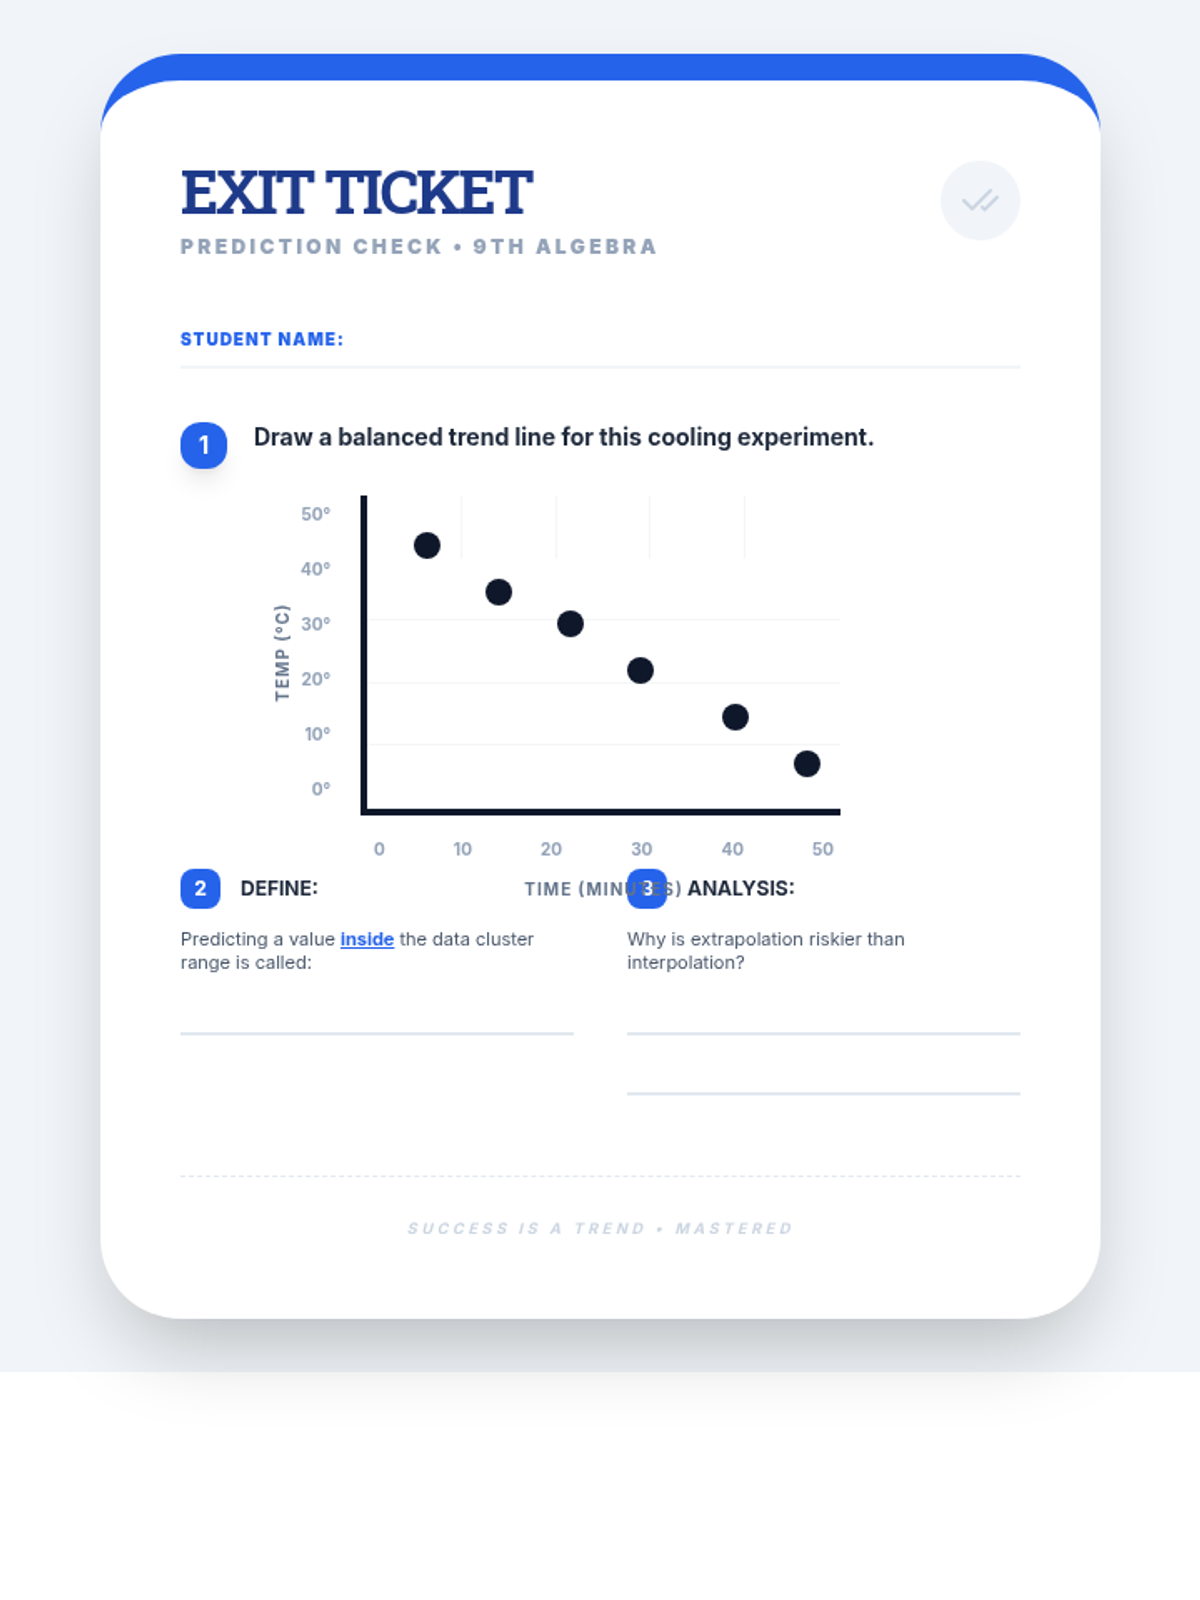
A 65-minute 9th-grade algebra lesson where students master drawing lines of best fit on scatter plots and using them to make mathematical predictions through interpolation and extrapolation.
A 9th-grade algebra lesson where students master drawing trend lines on scatter plots and using them to make real-world predictions through interpolation and extrapolation.