Mapping relationships through notation, algebraic representations, and growth rate comparisons. Equips learners to transform functions, model contextual data, and solve exponential equations.
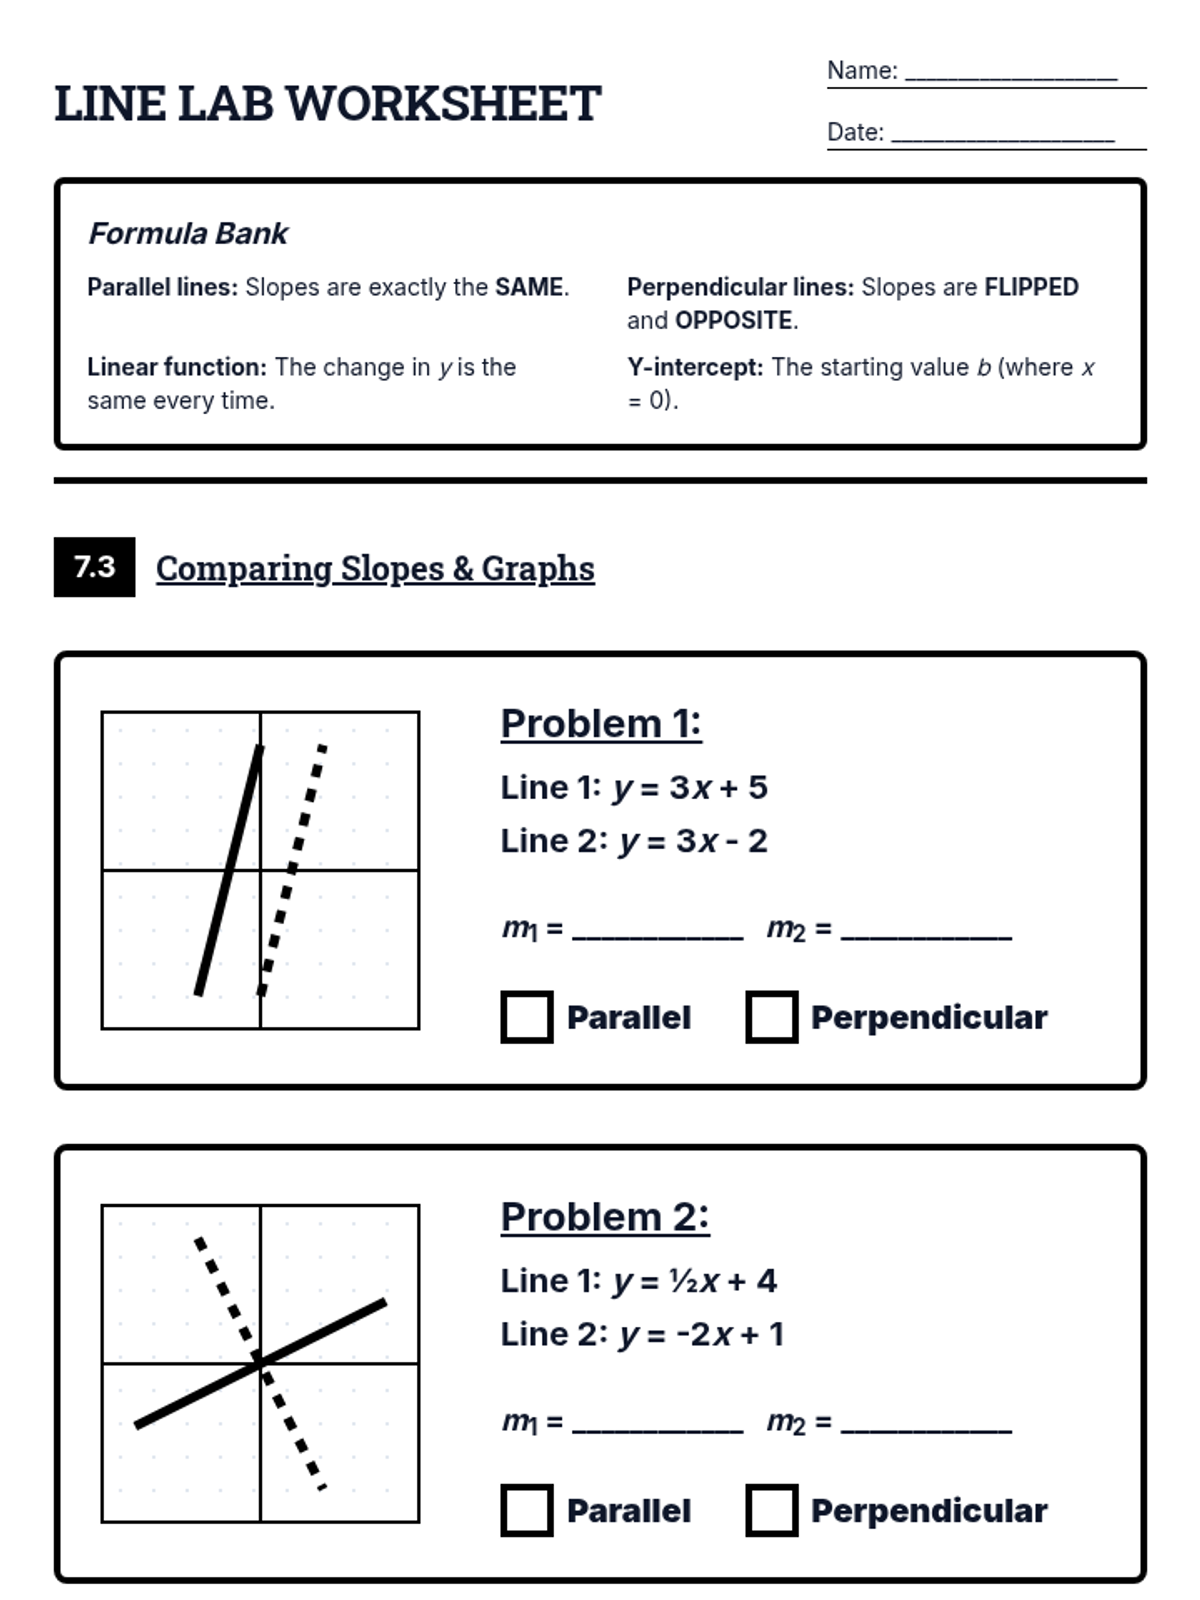
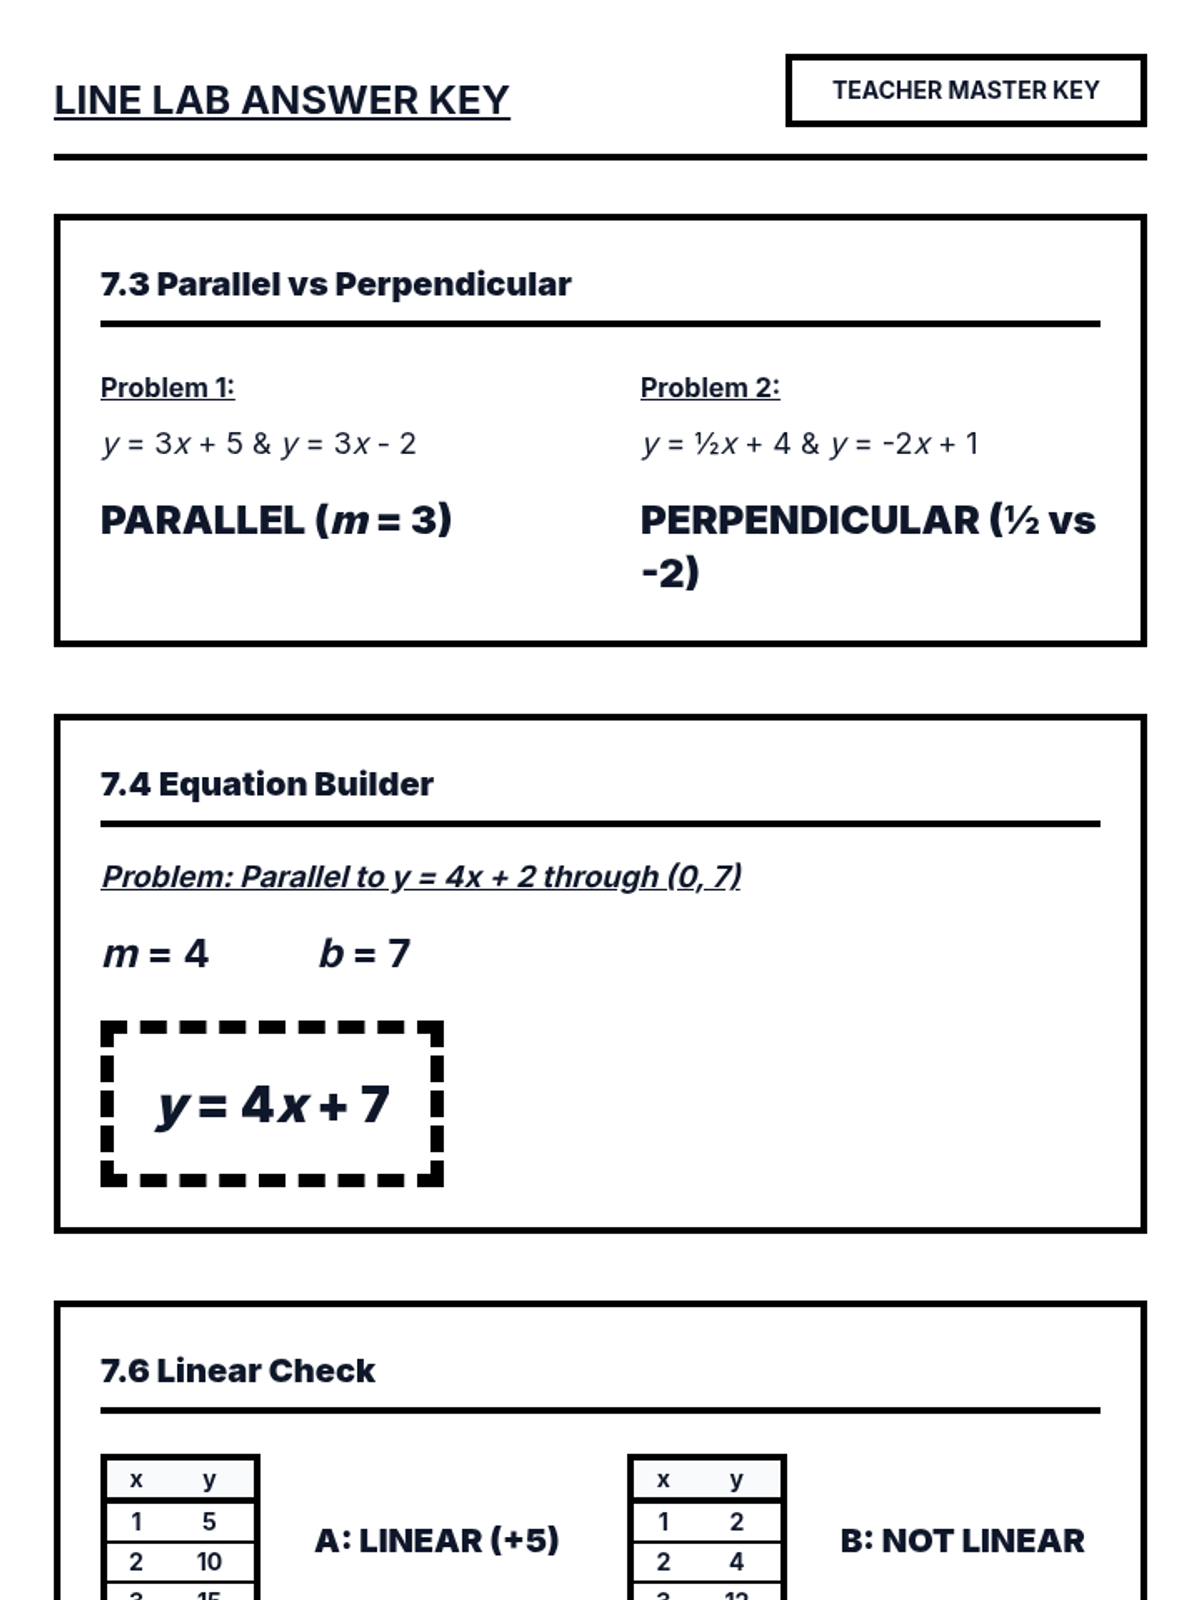
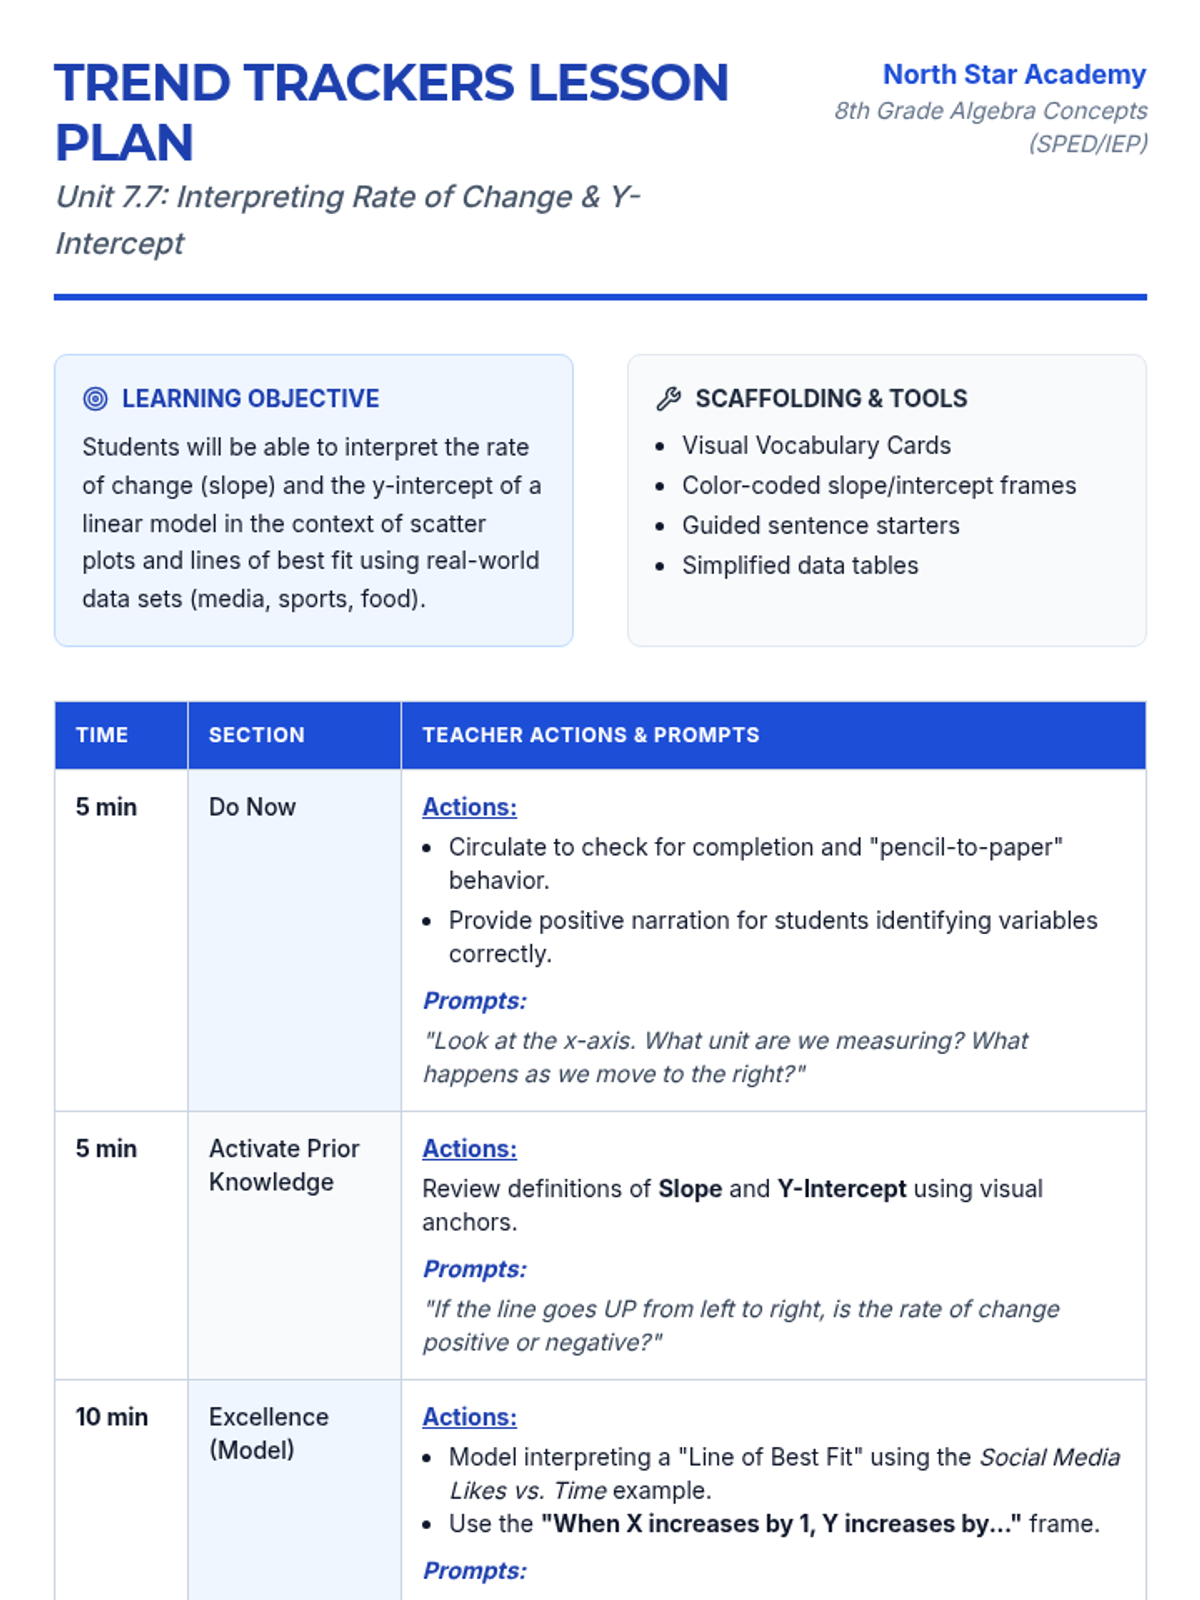
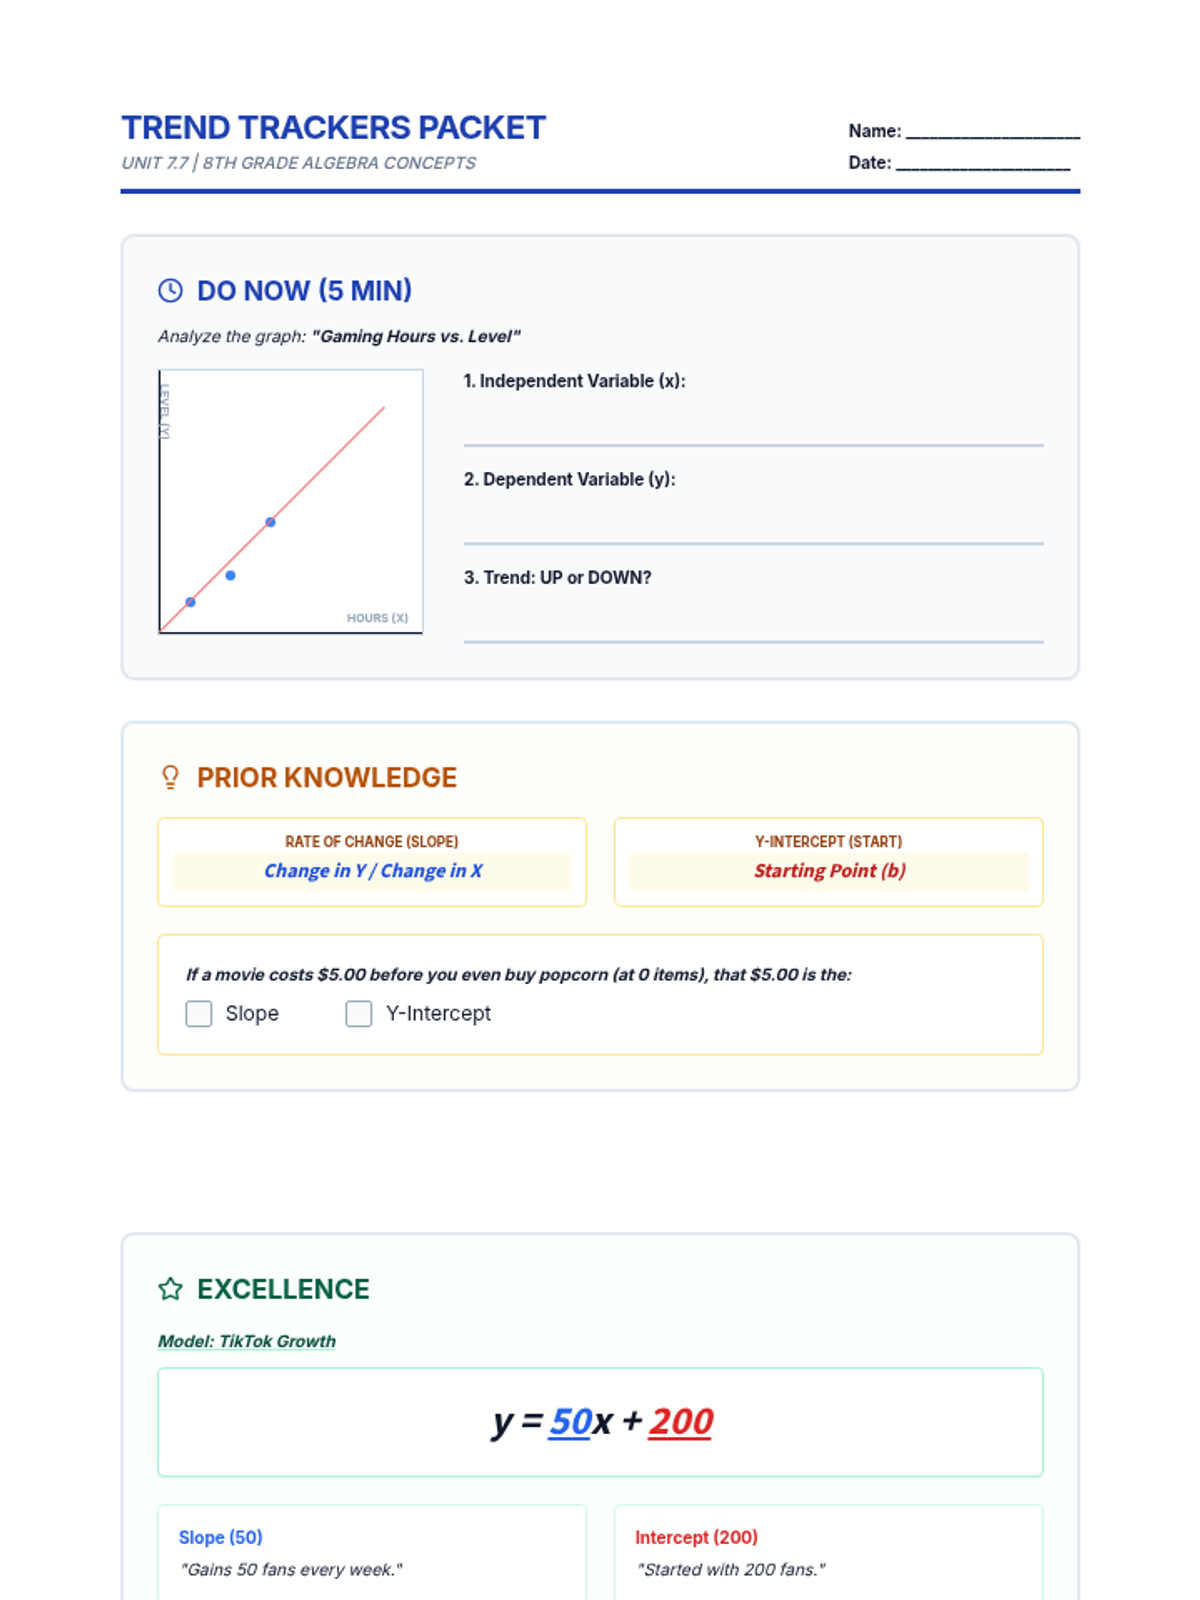
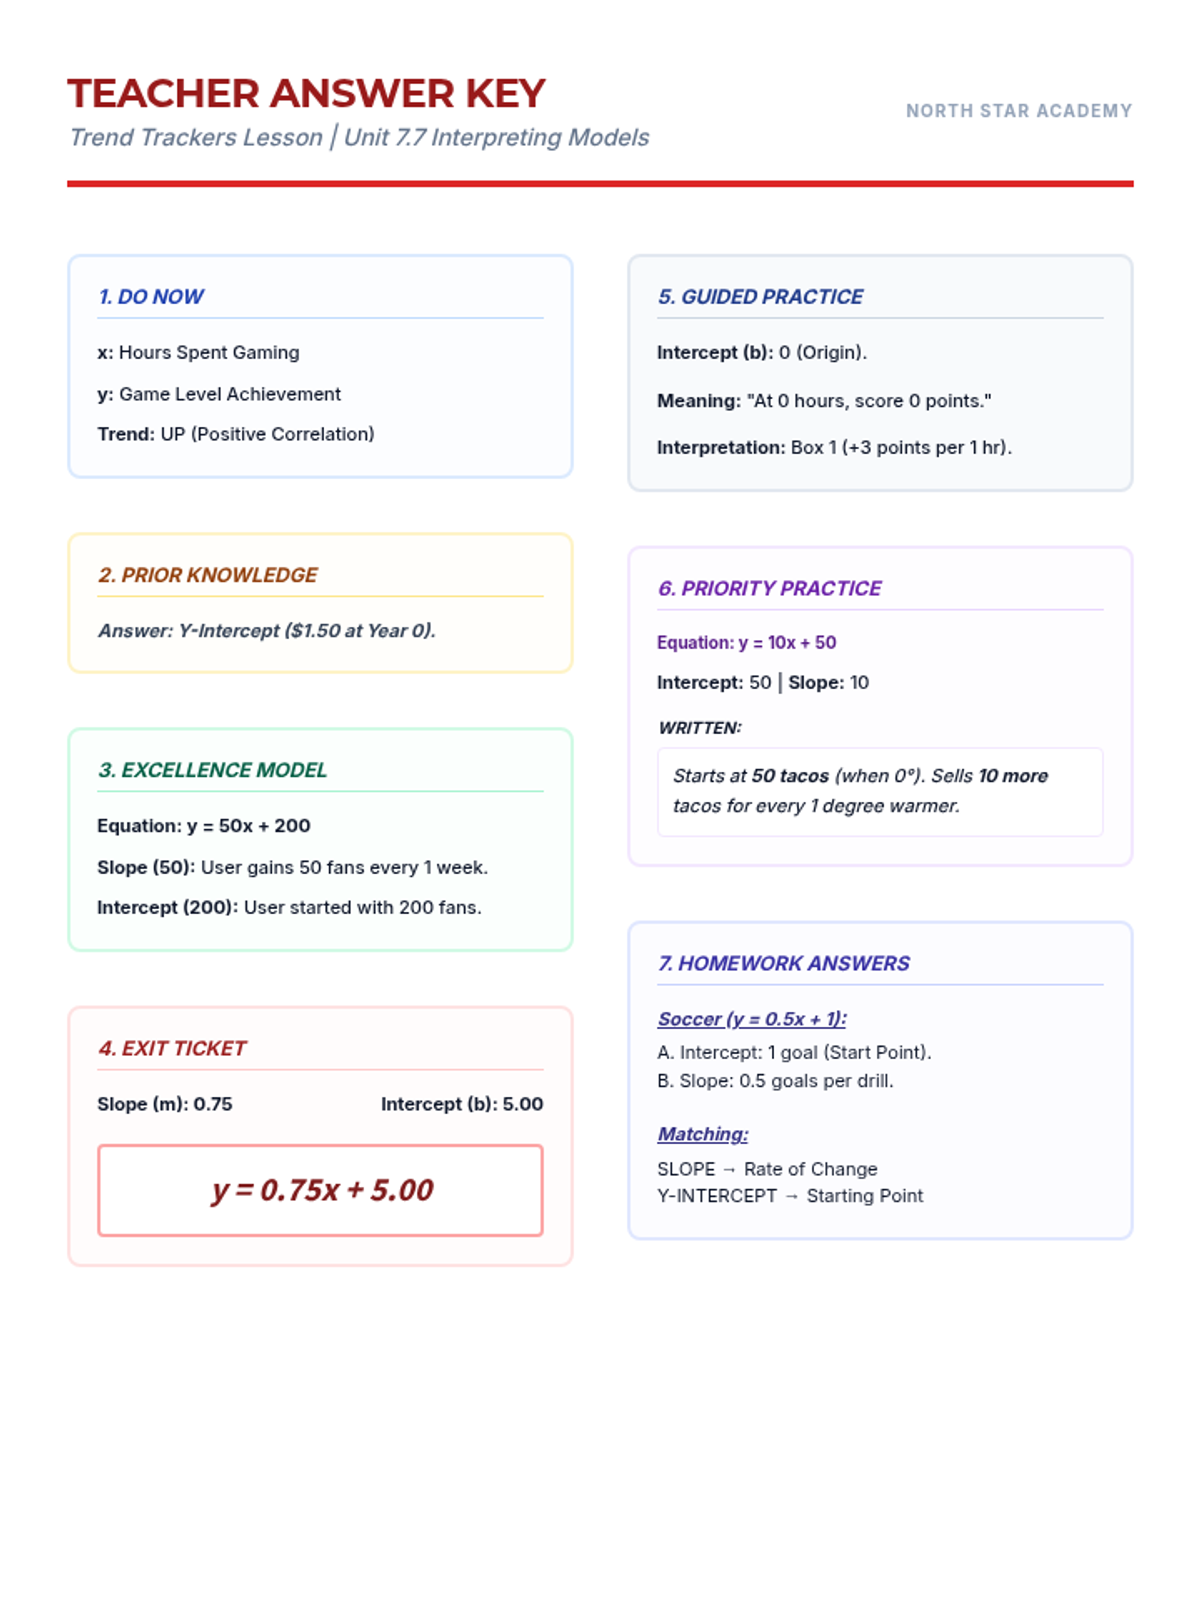
A comprehensive lesson on linear relationships, covering parallel and perpendicular lines, writing equations, and interpreting linear models in real-world contexts, specifically scaffolded for students with IEPs.
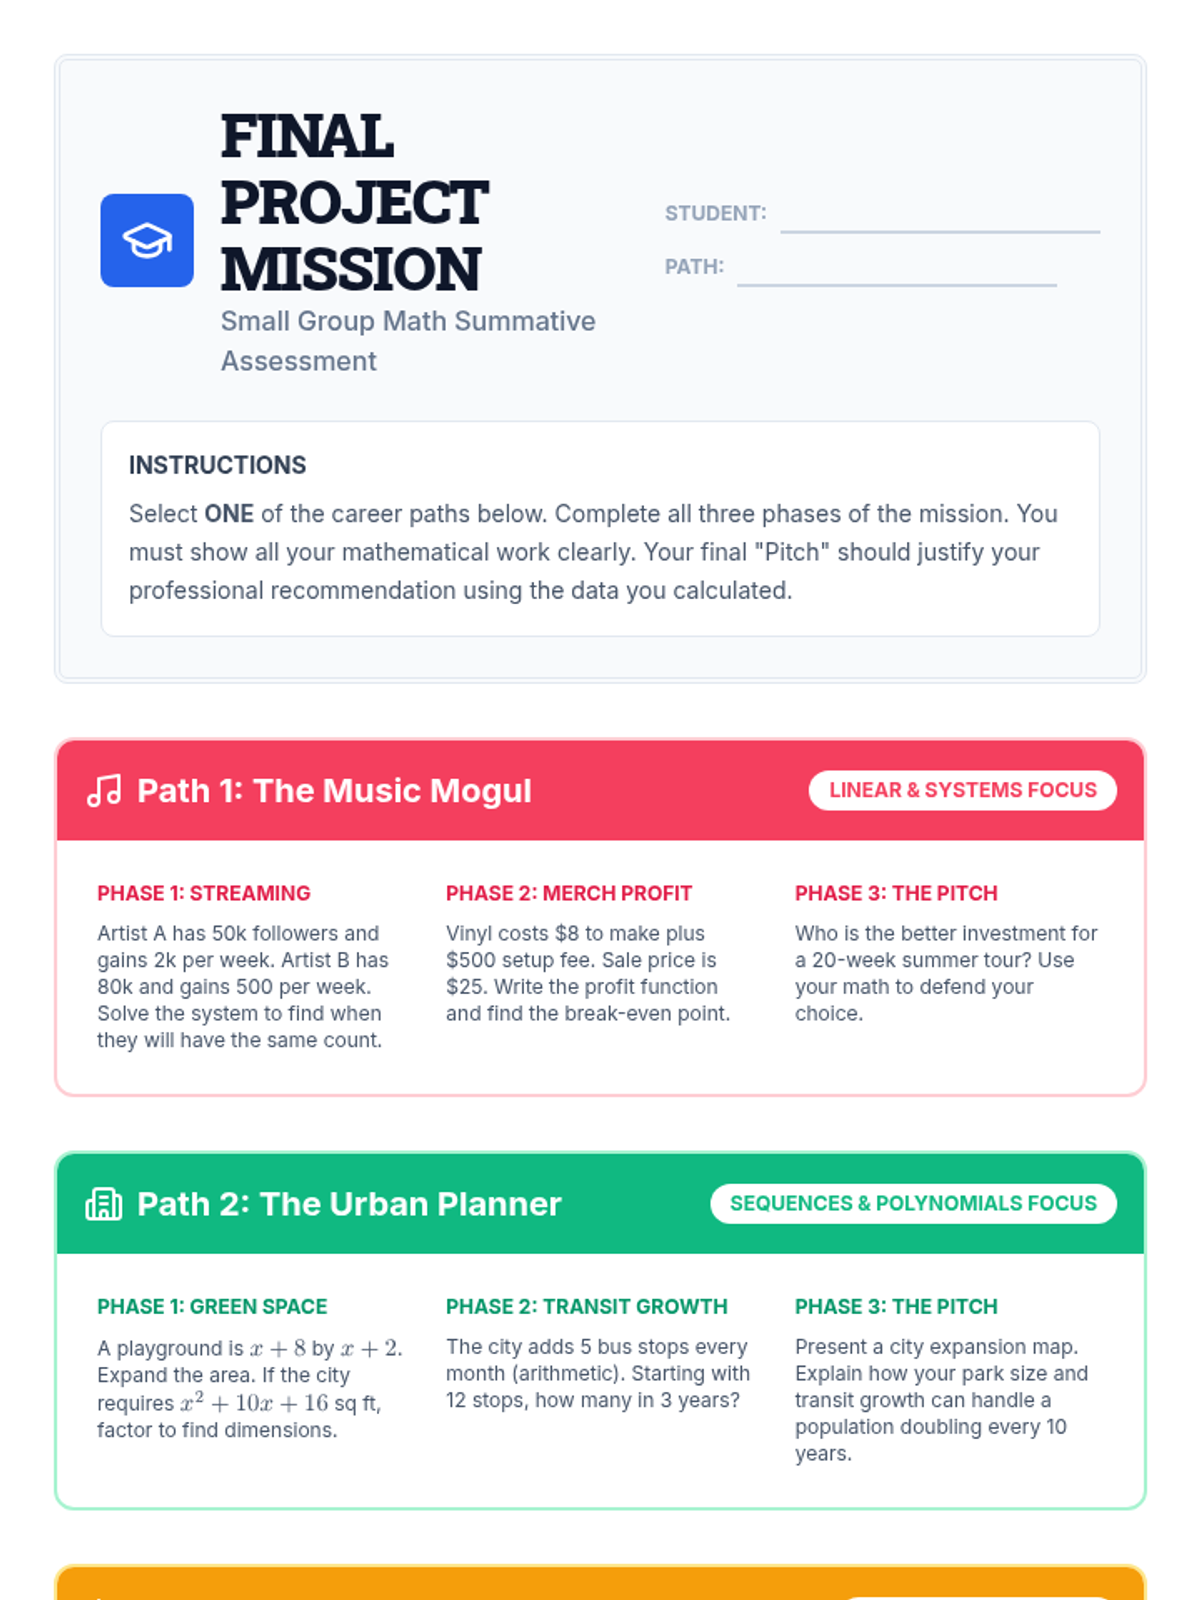
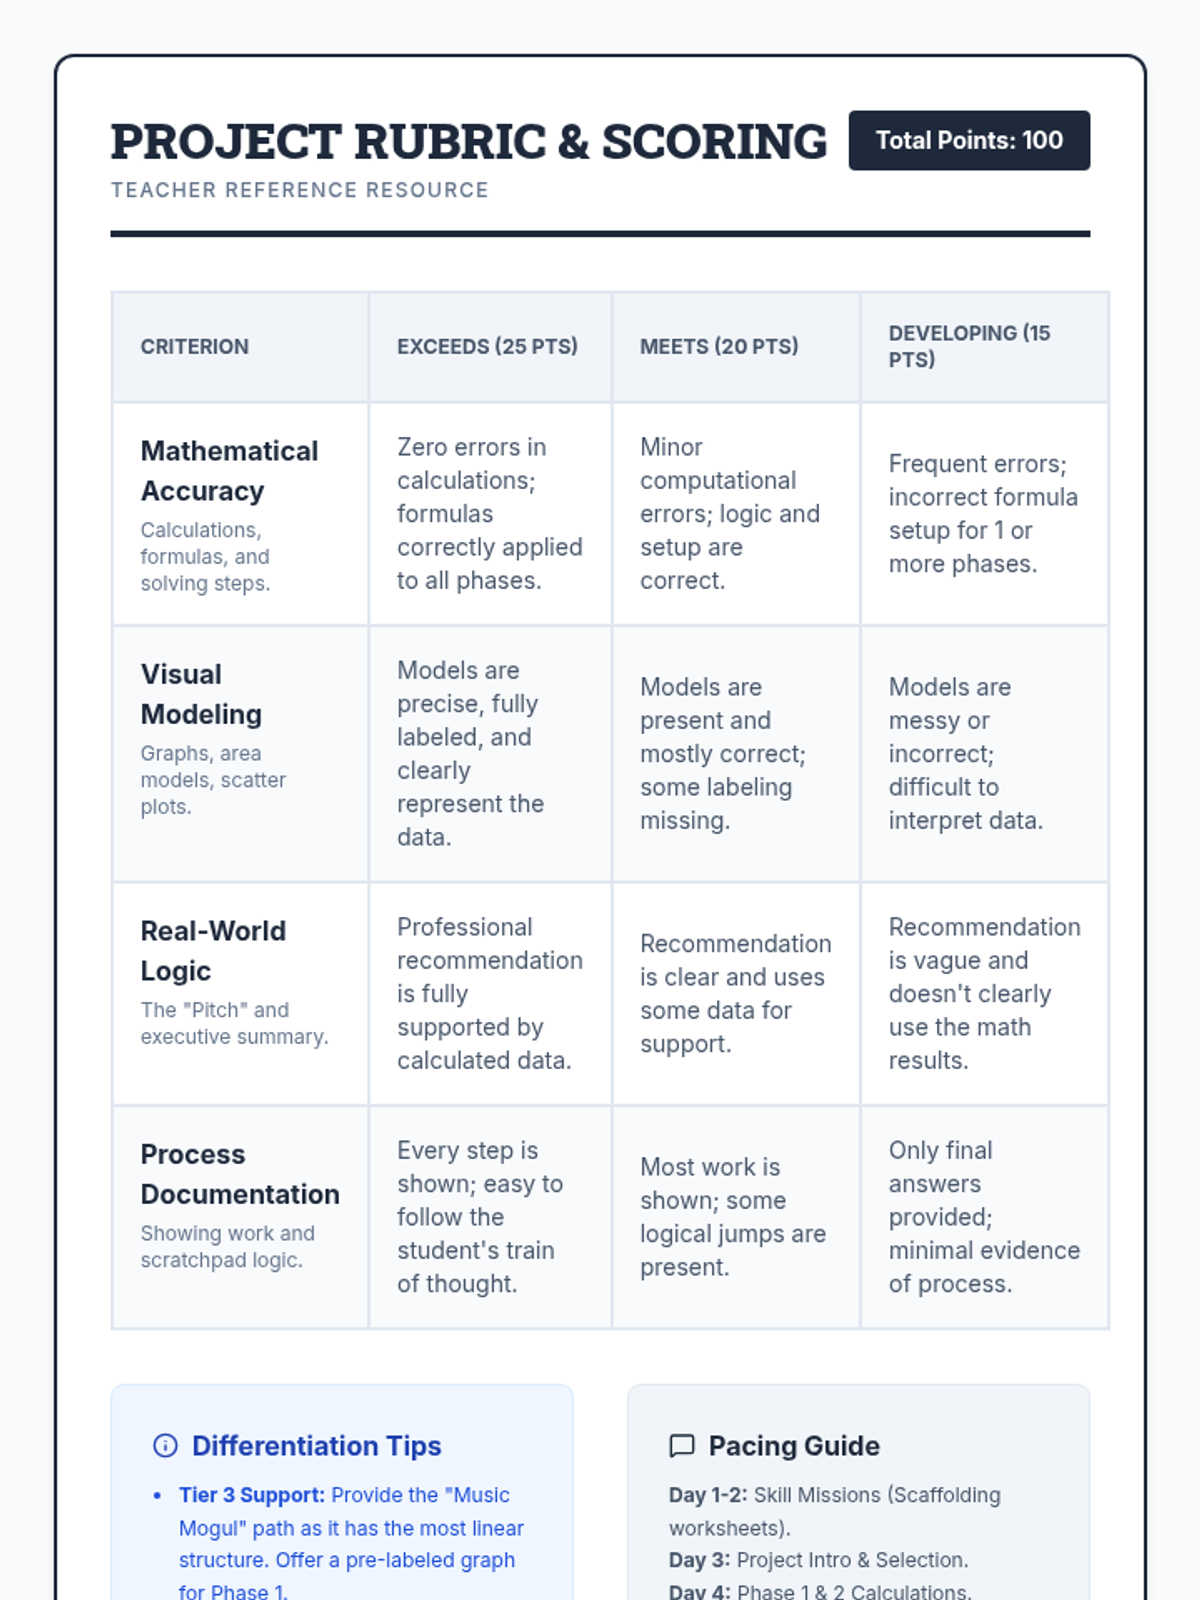
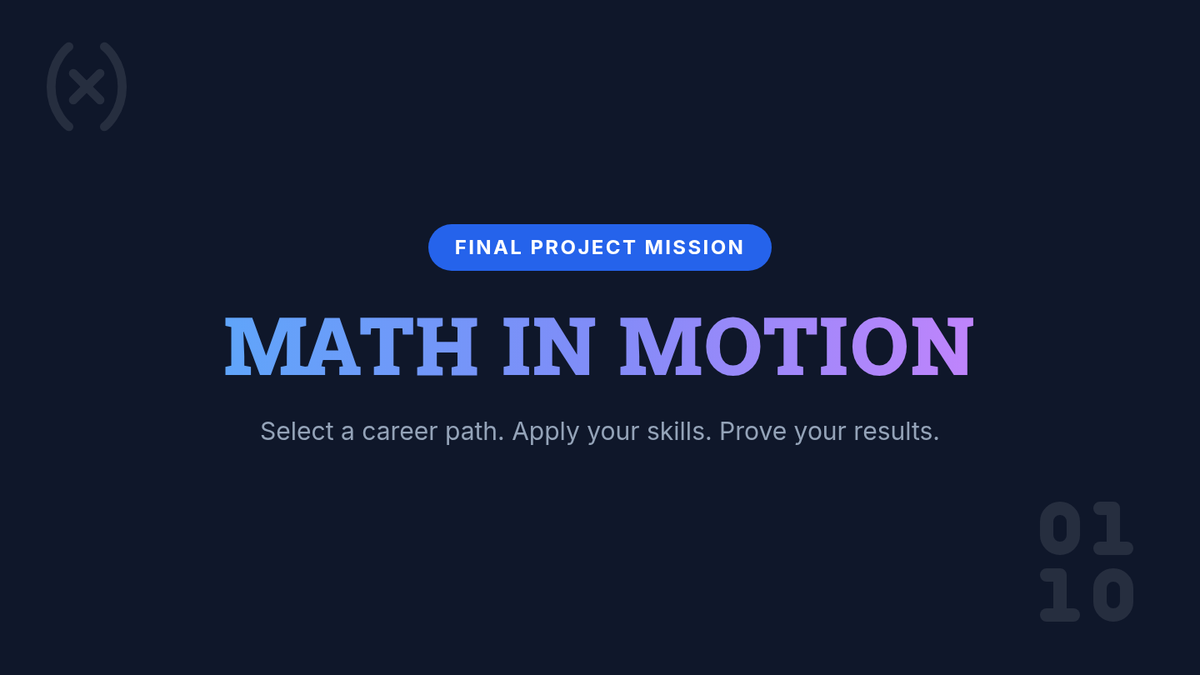
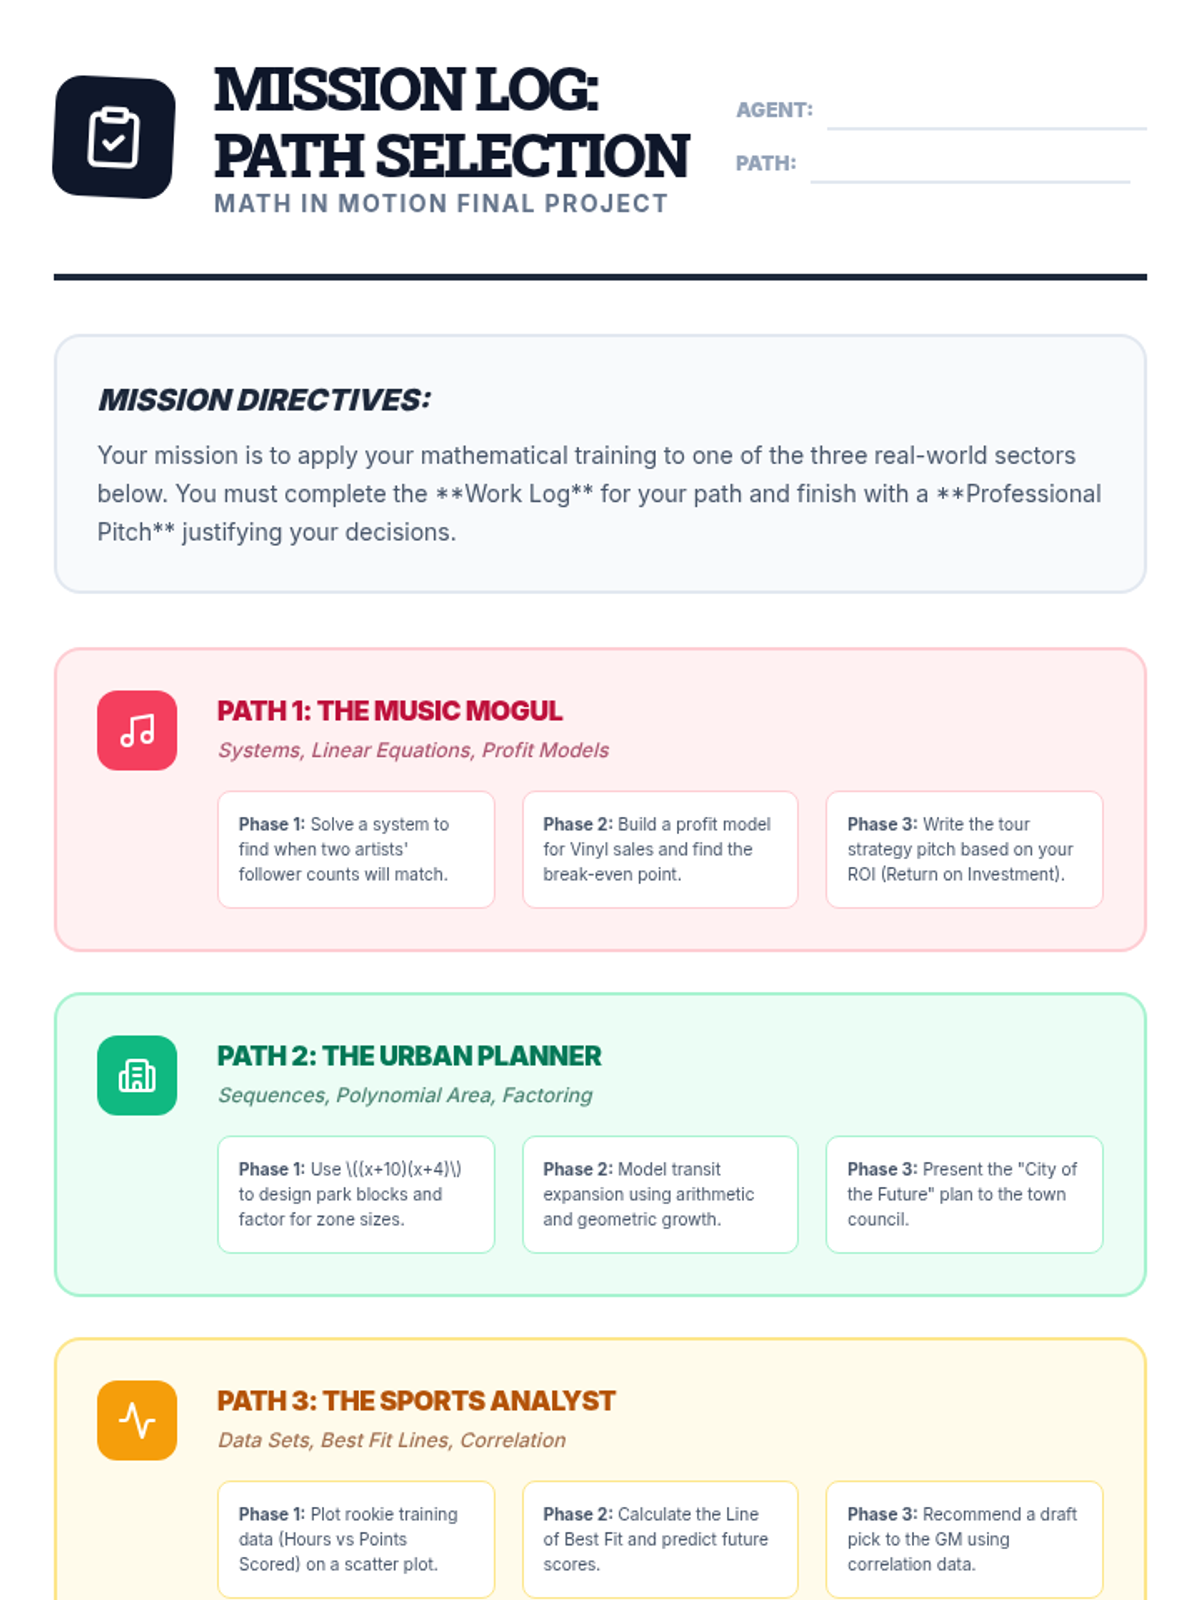
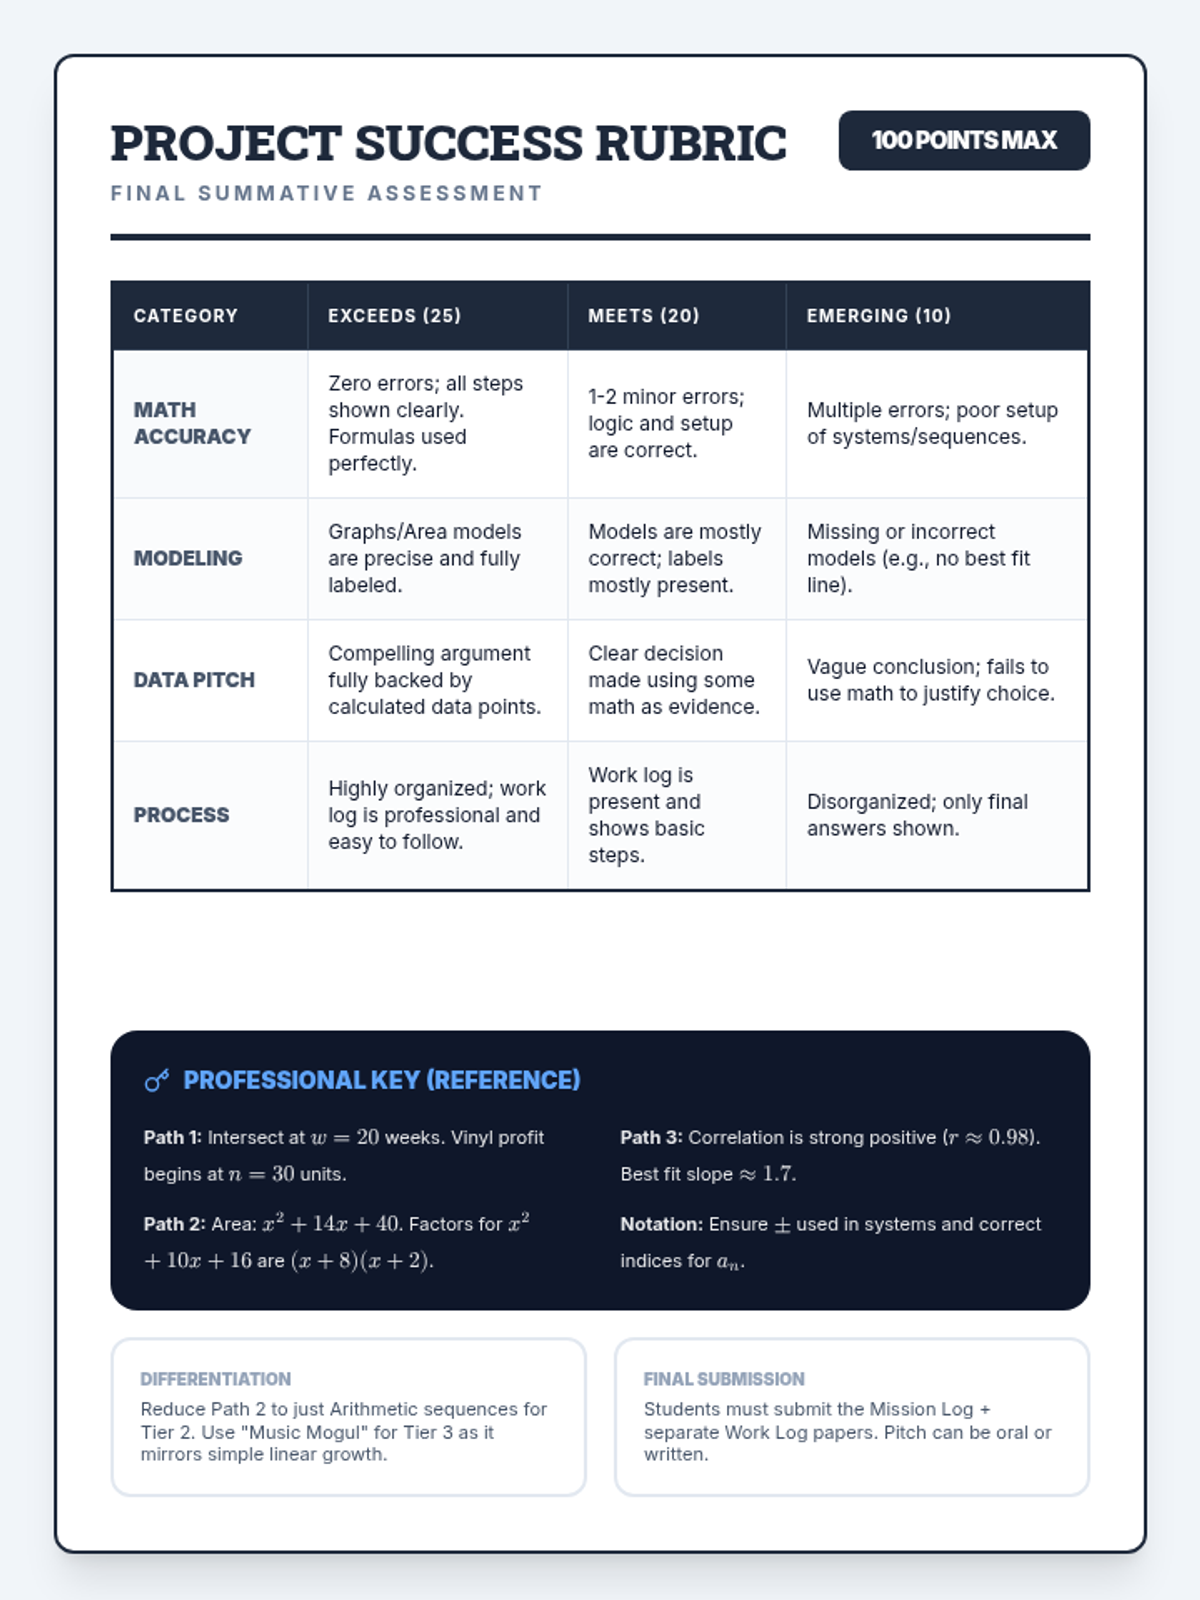
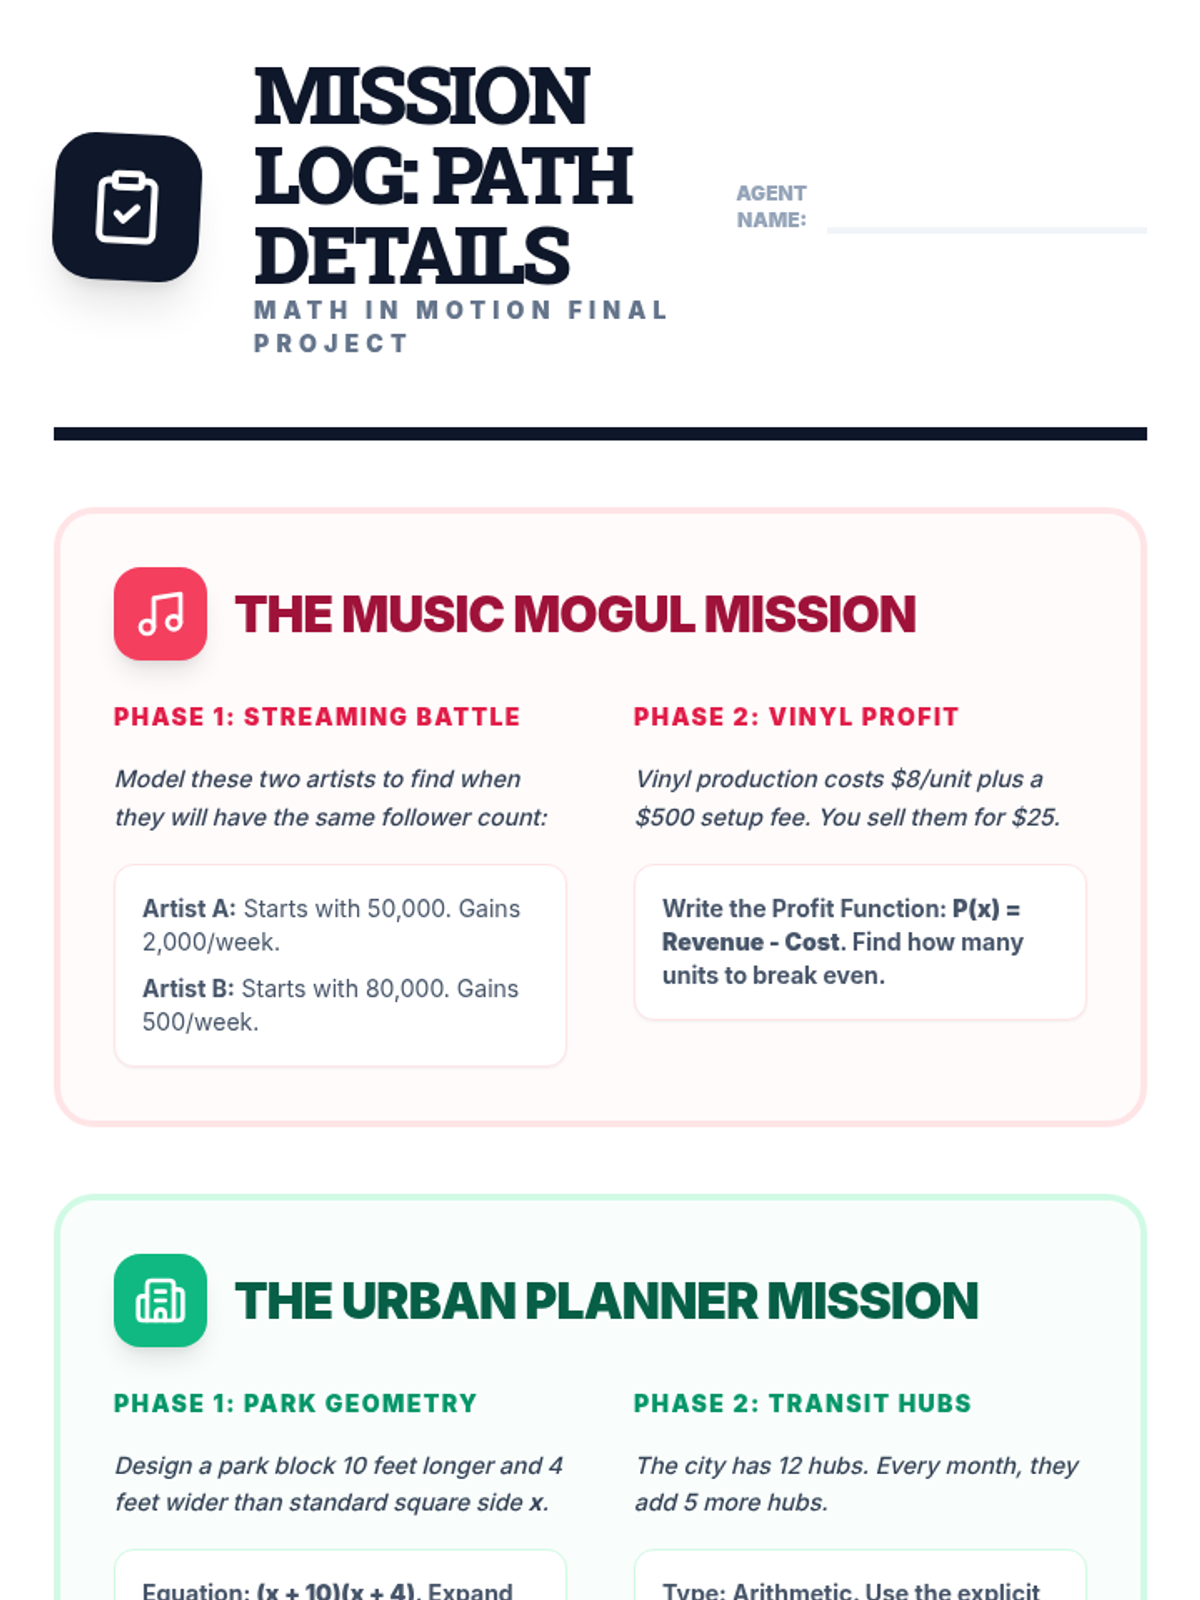
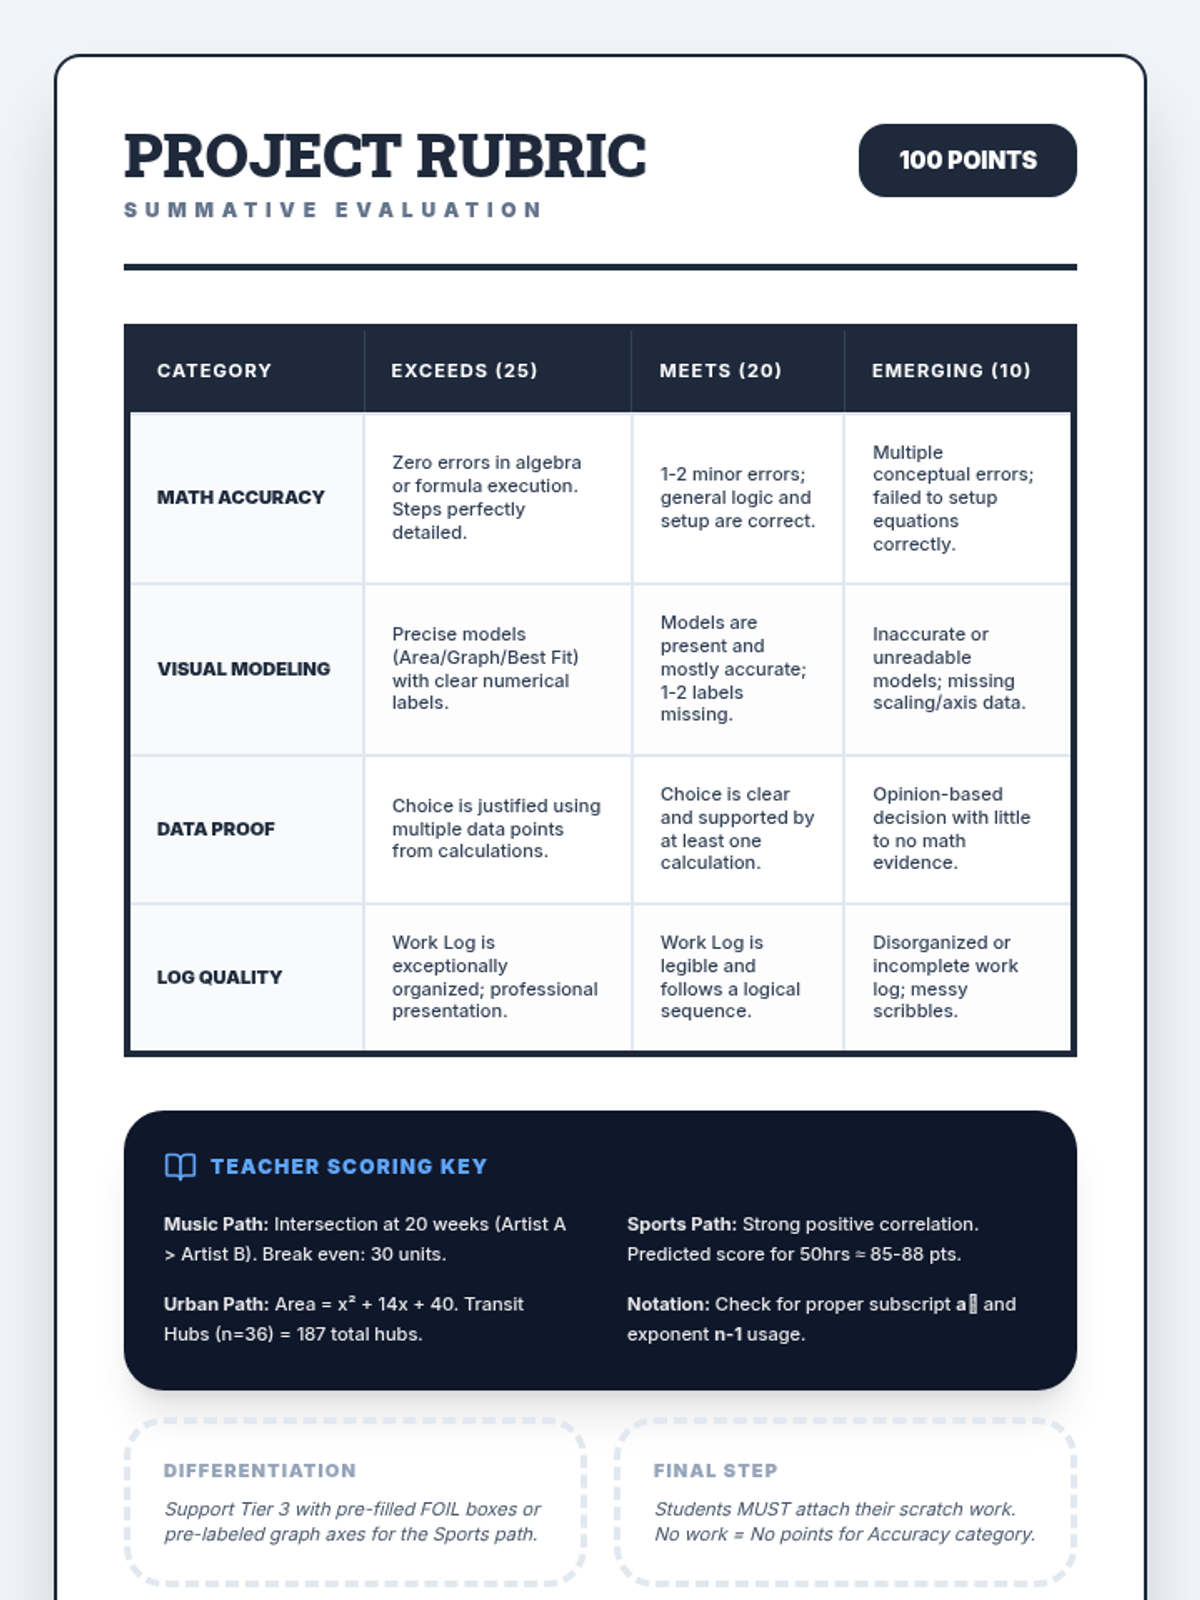
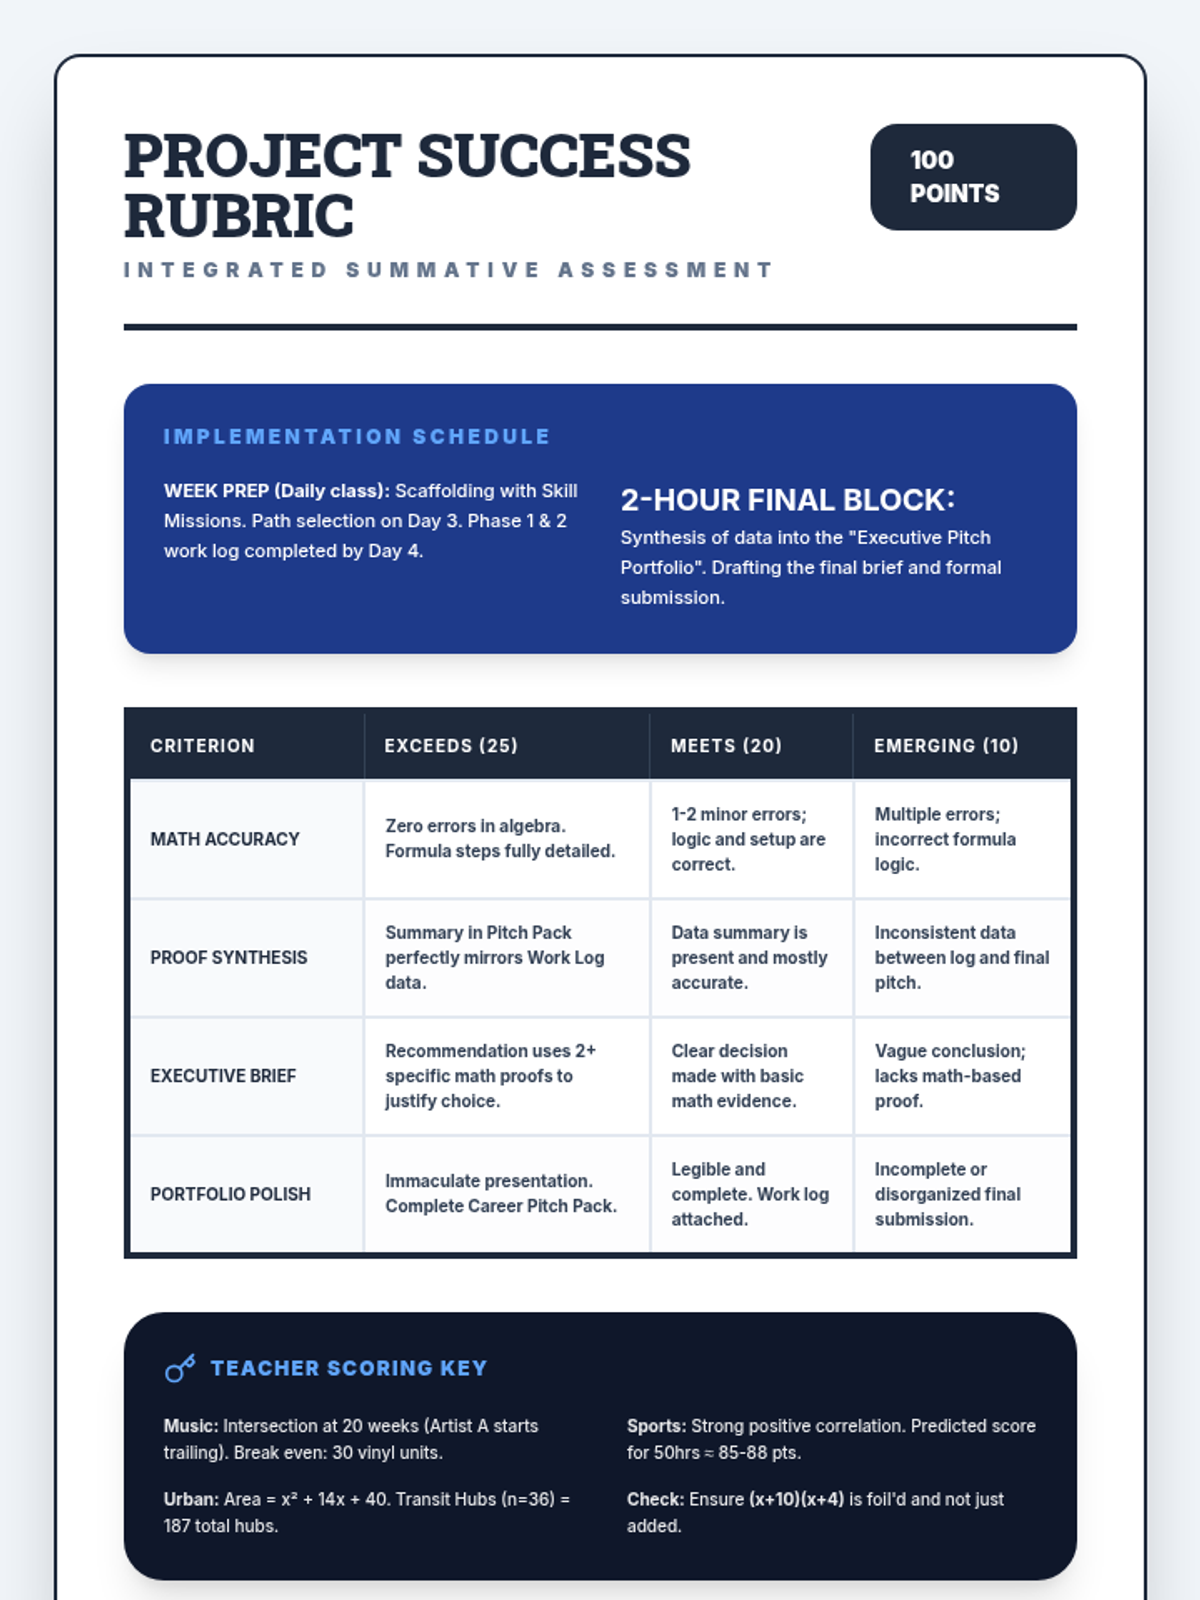
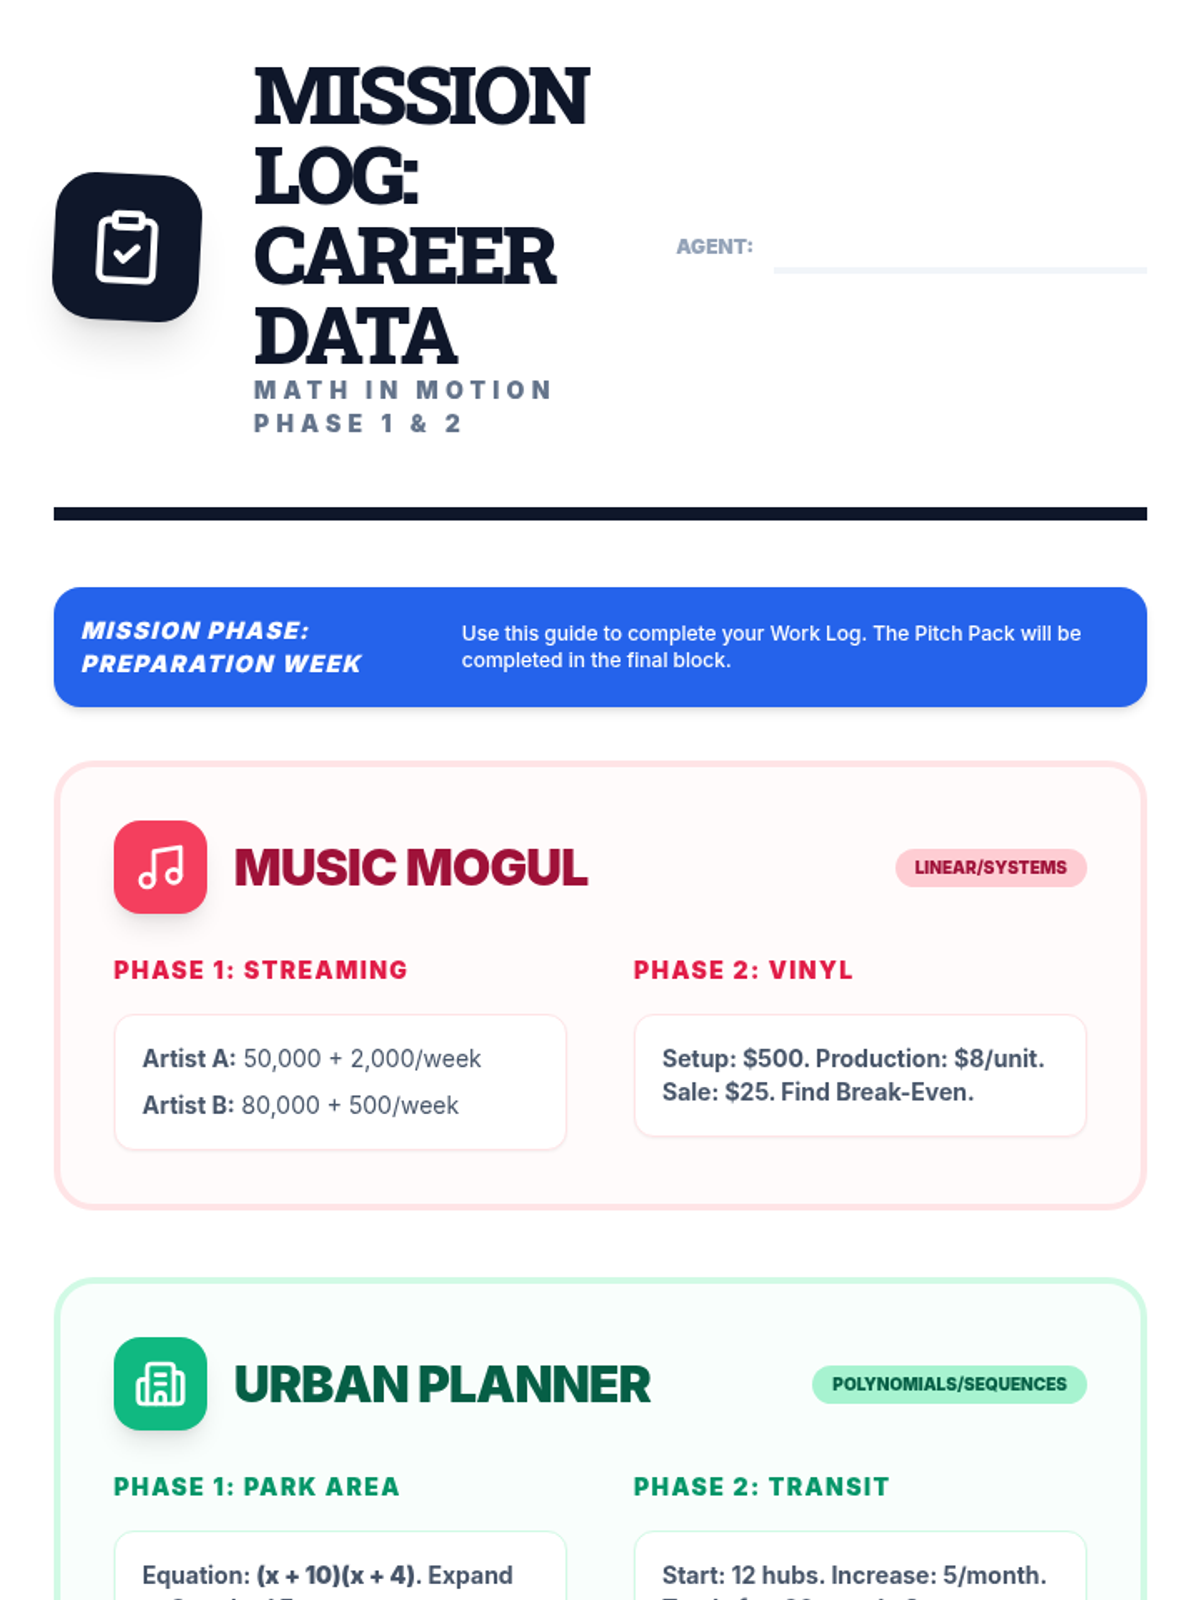
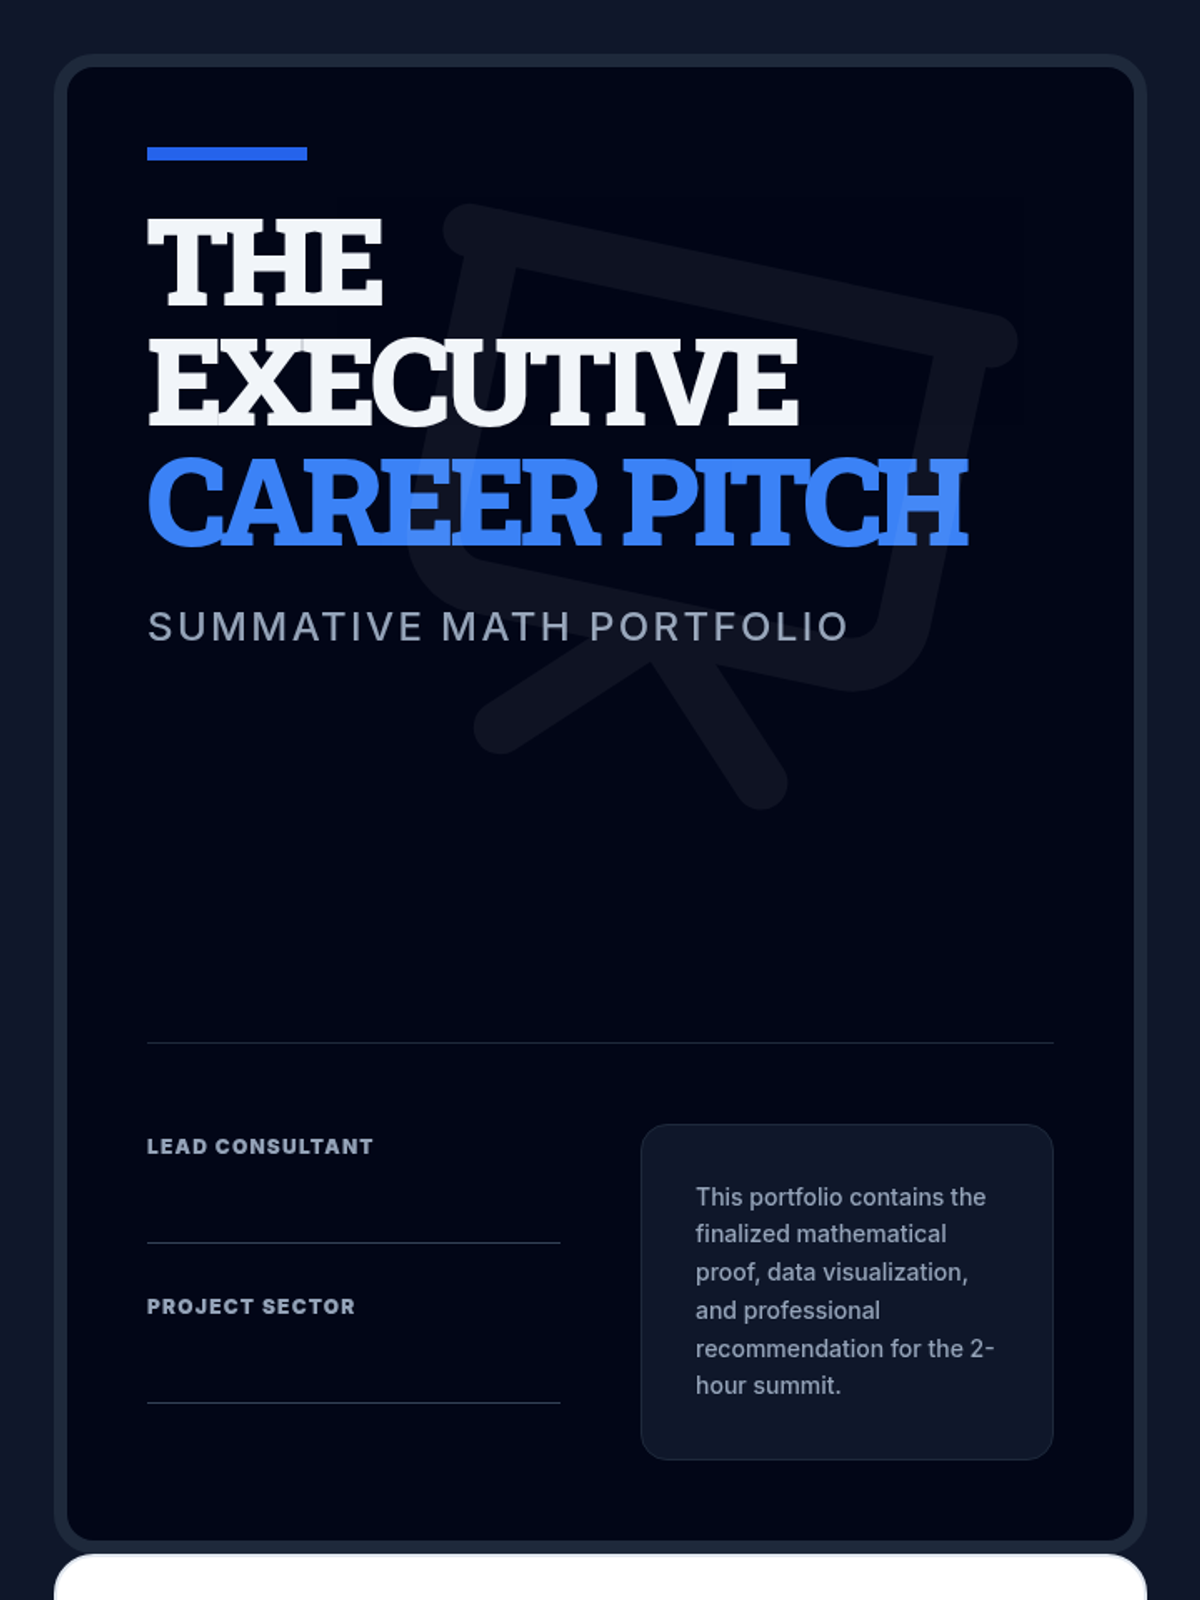
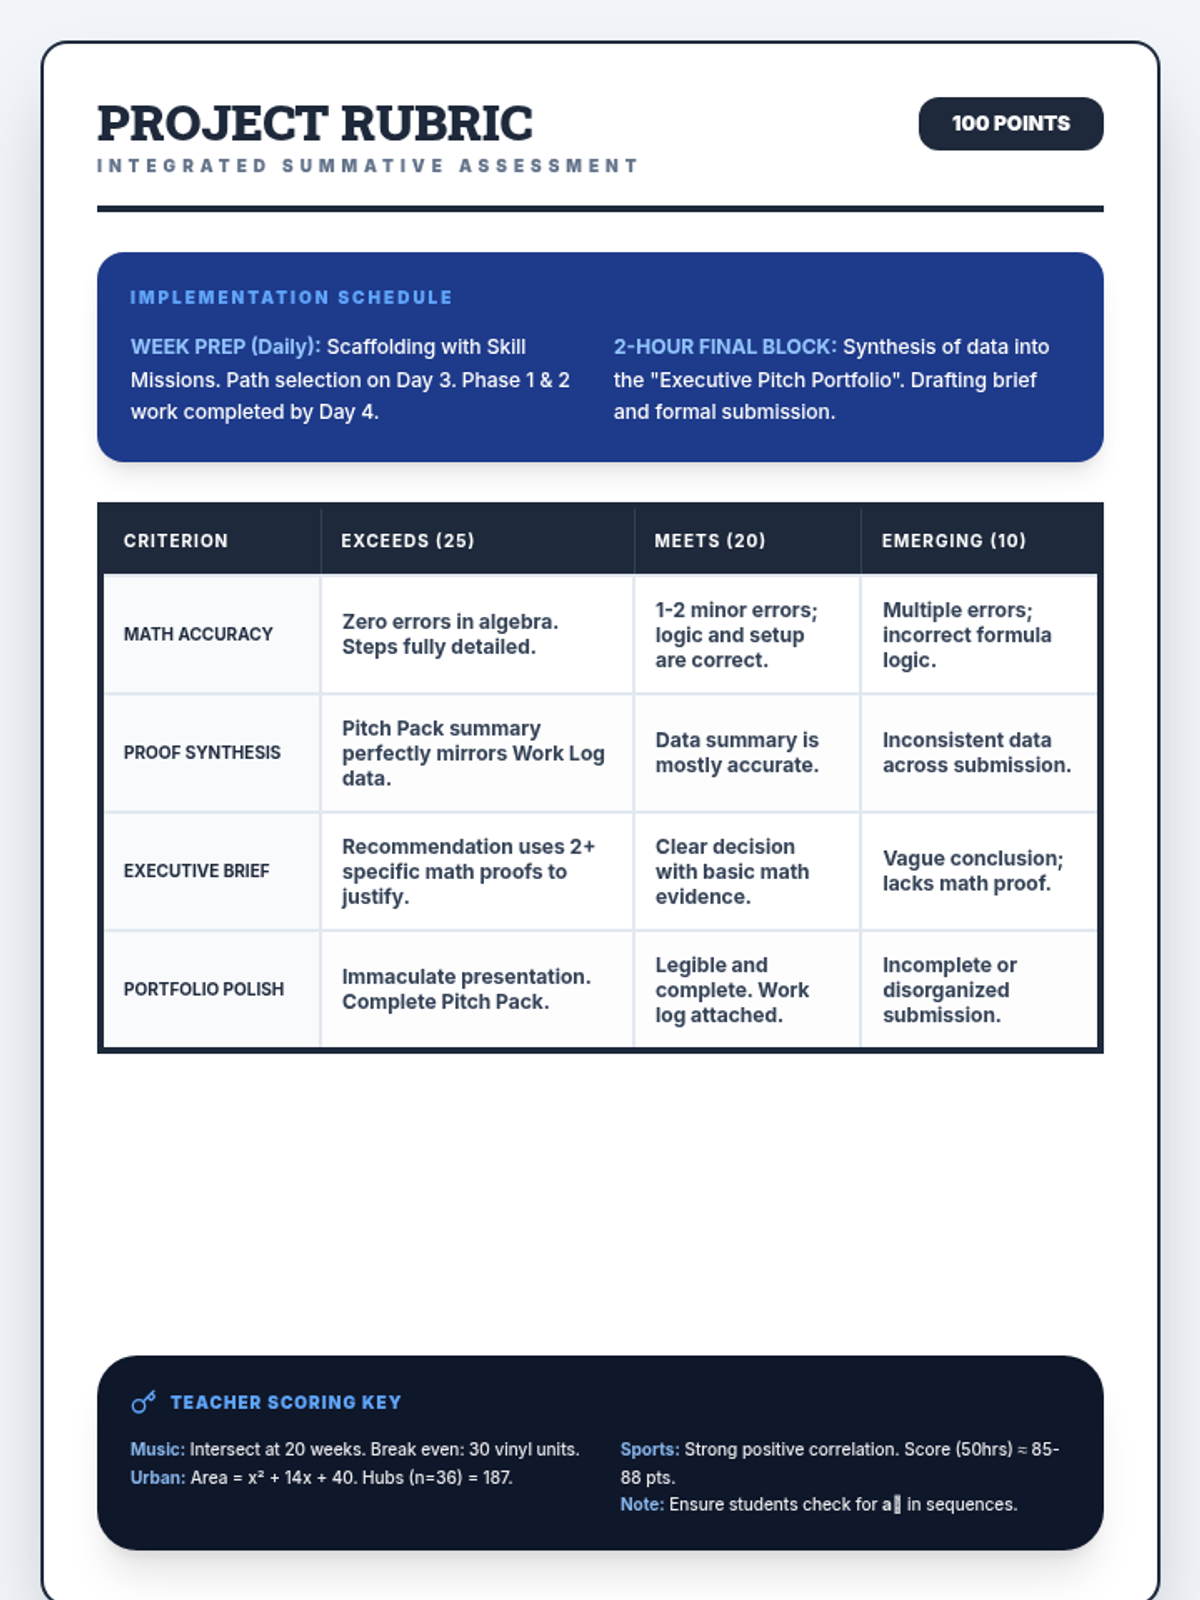
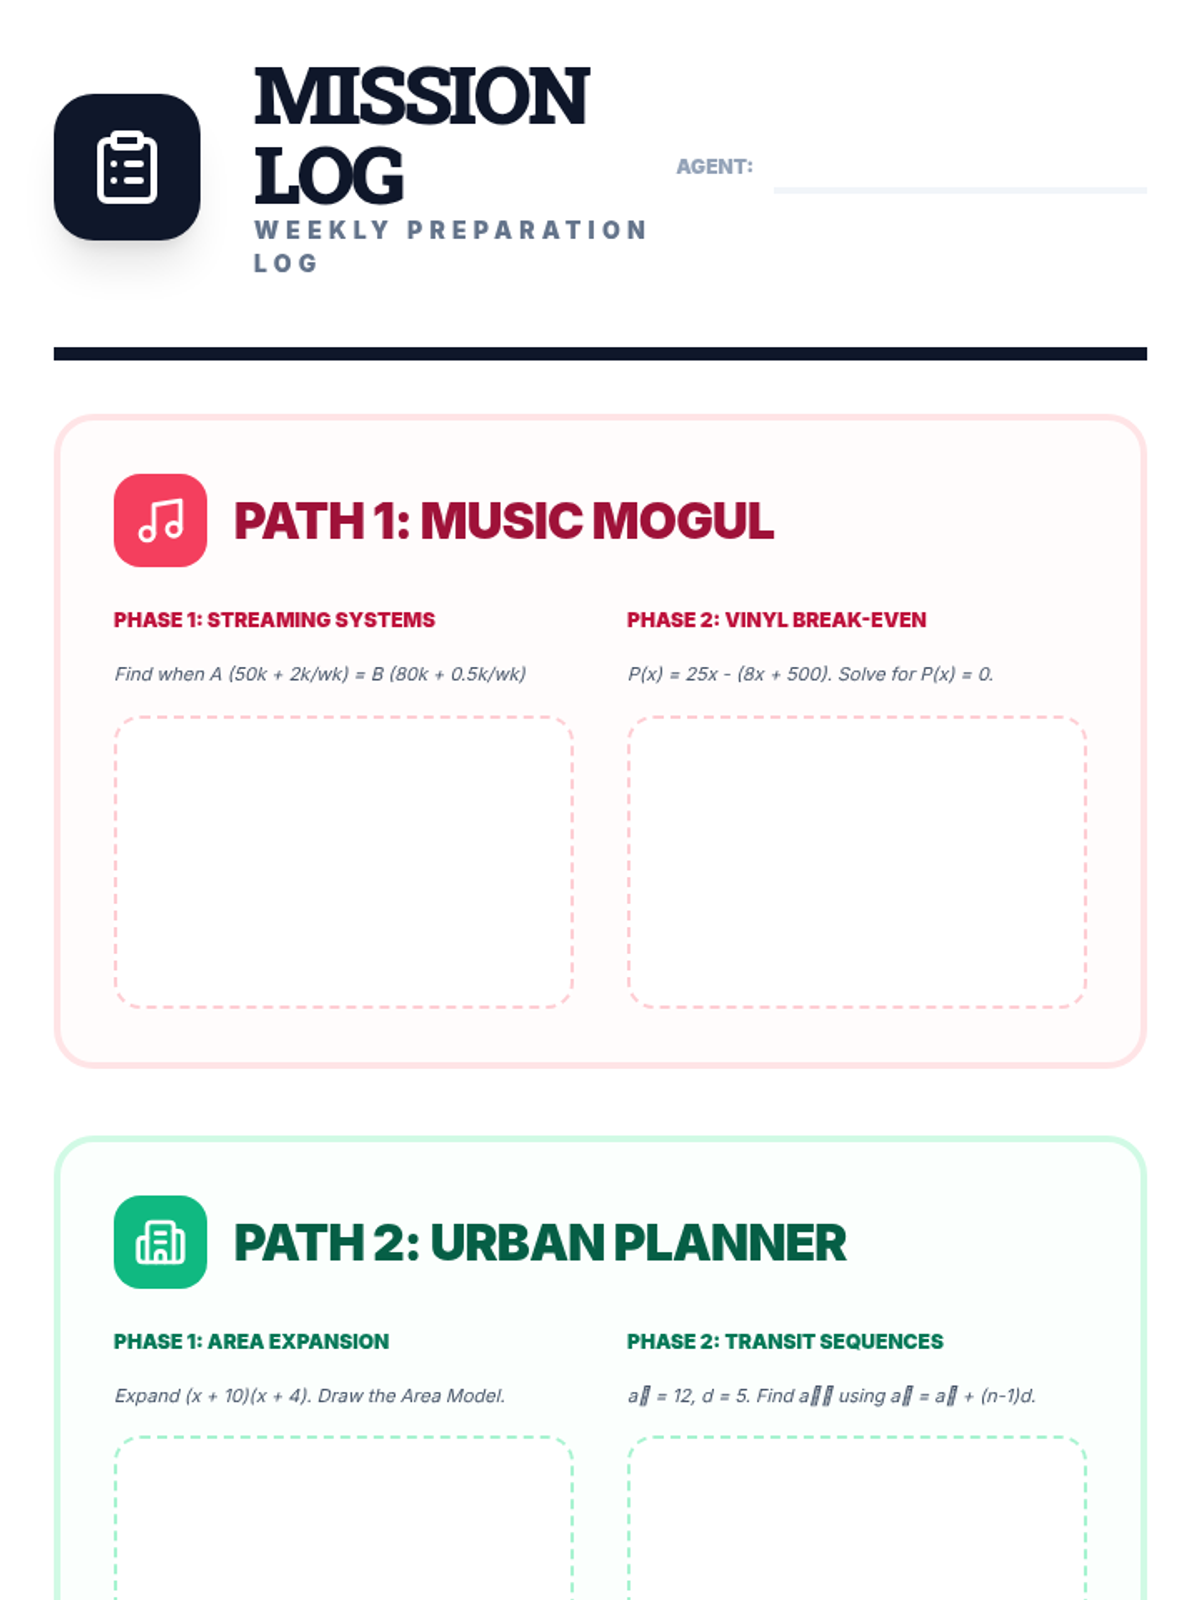
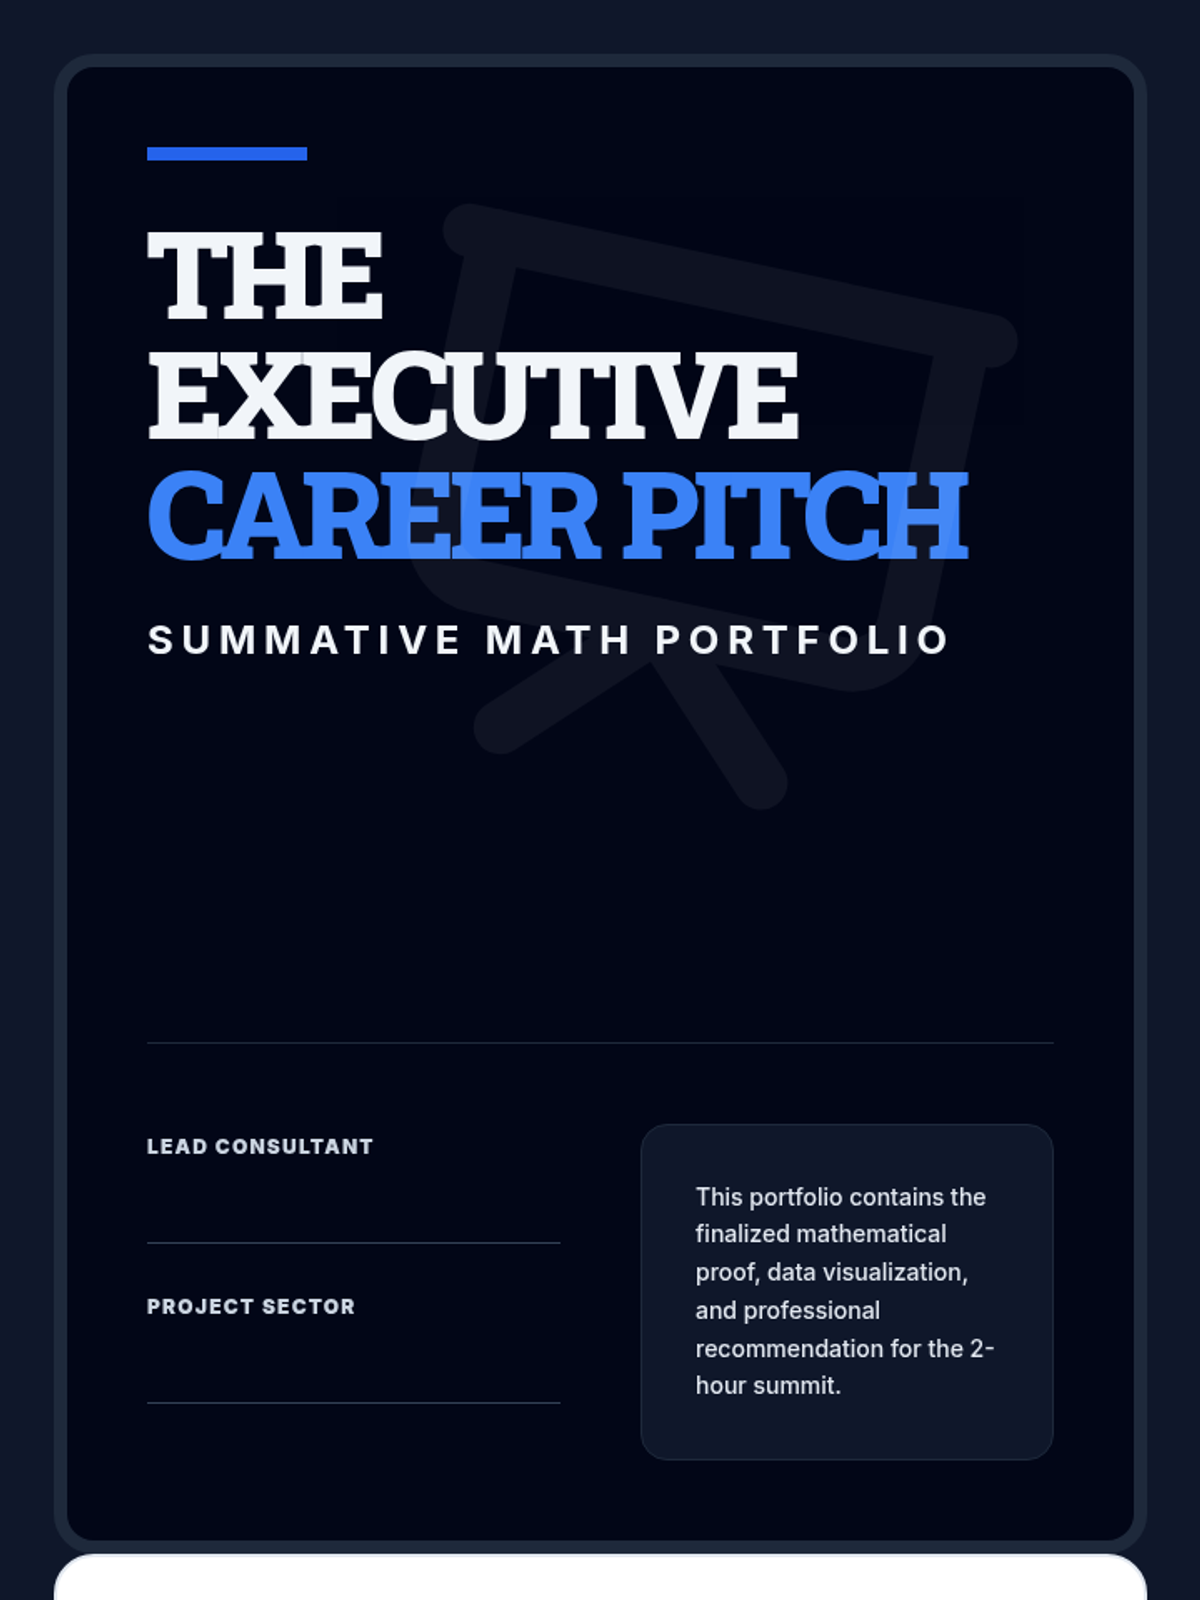
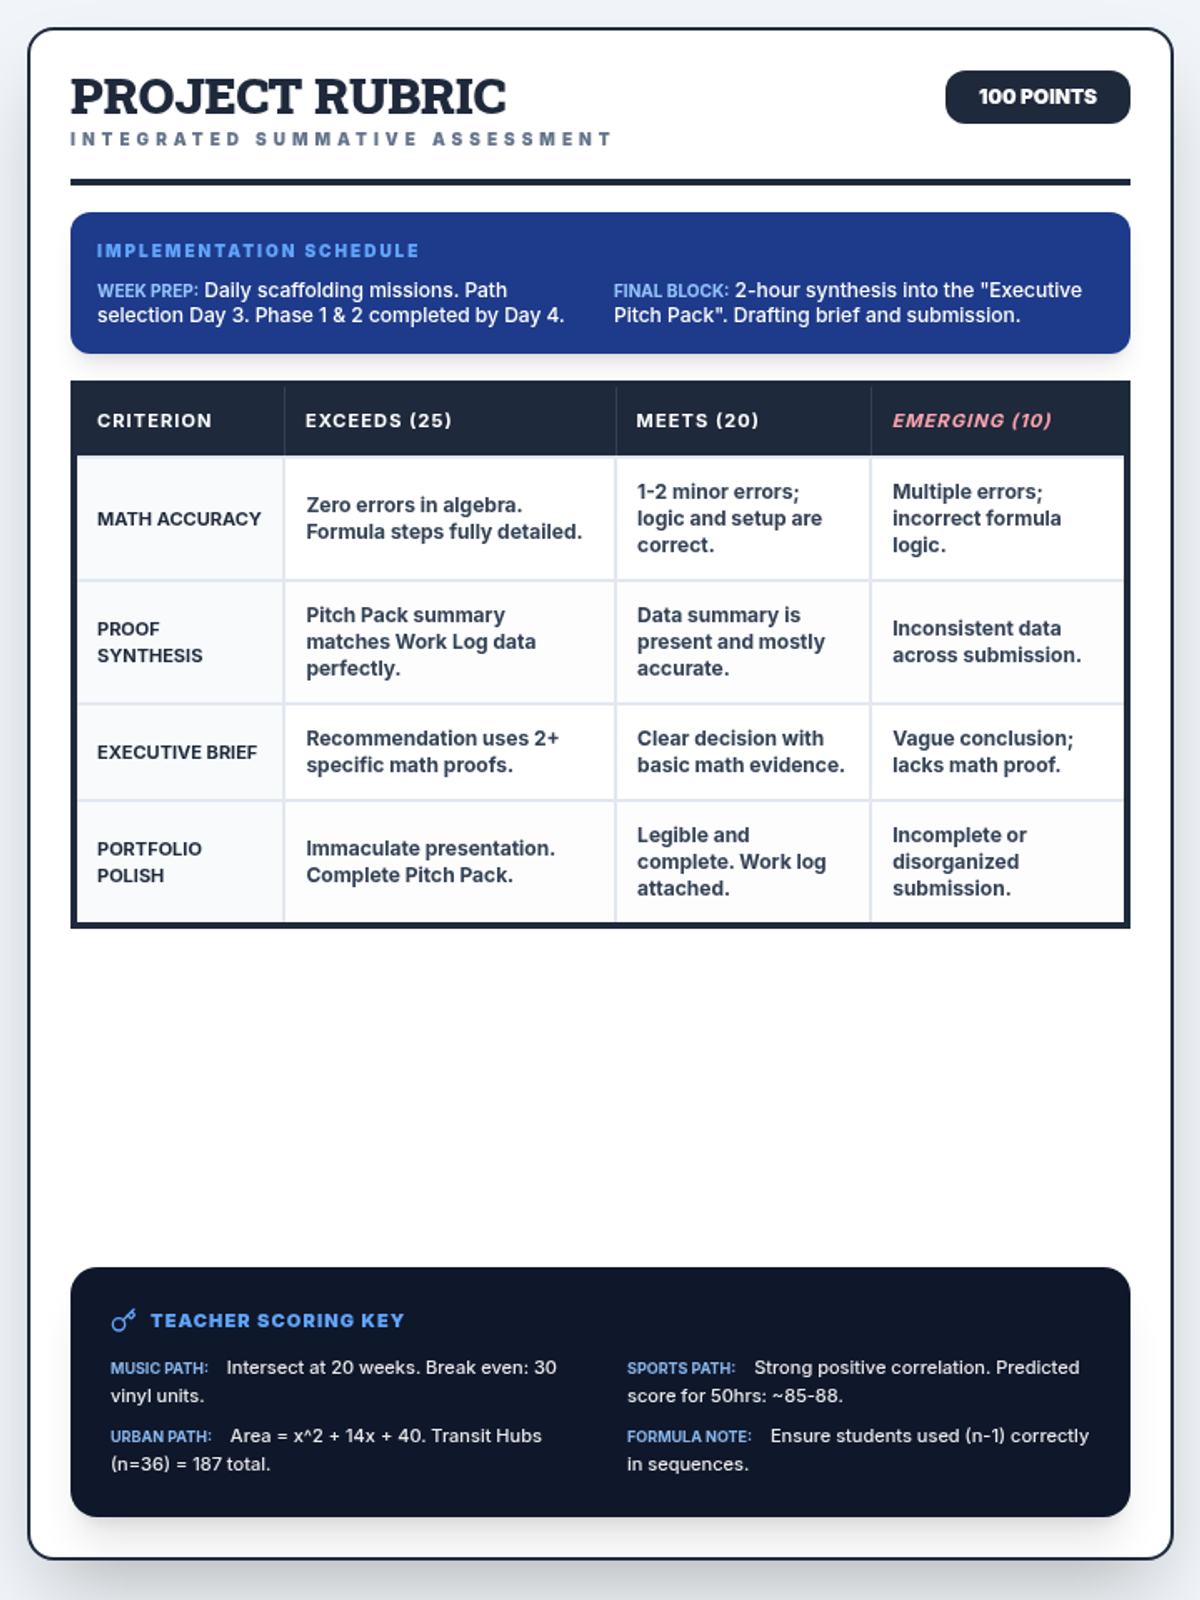
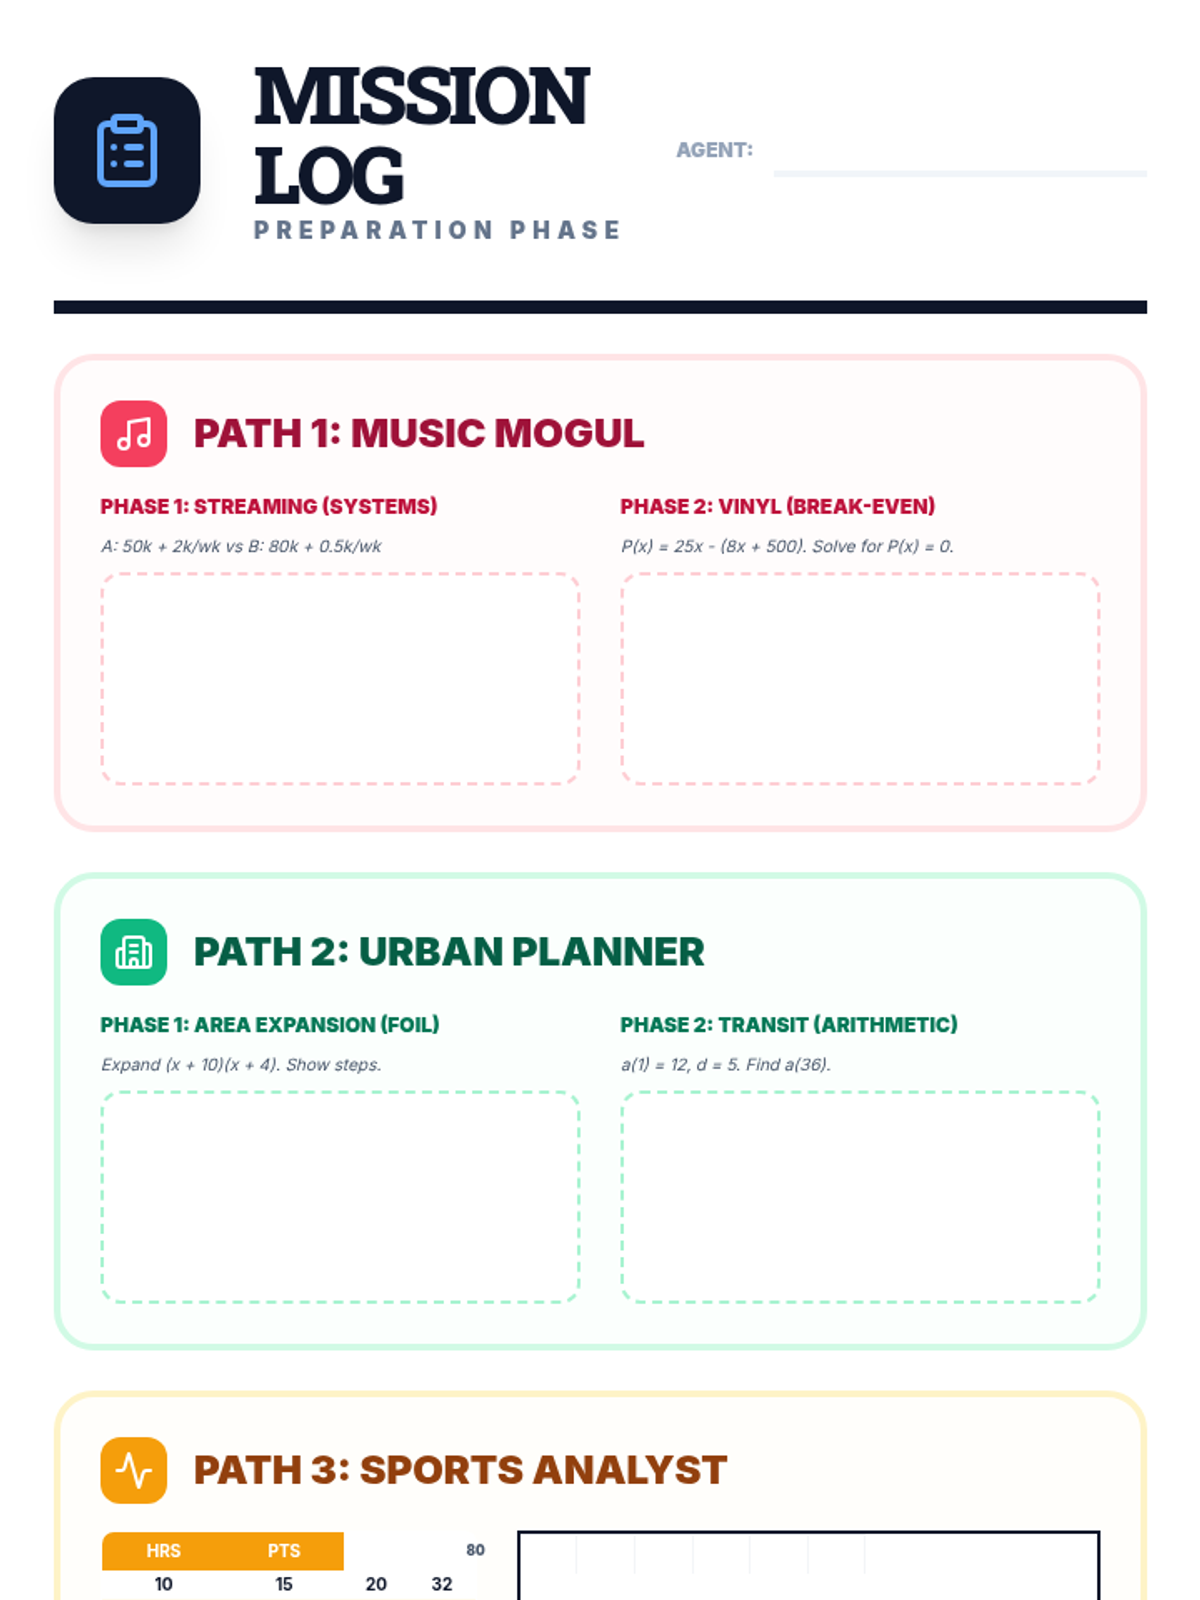
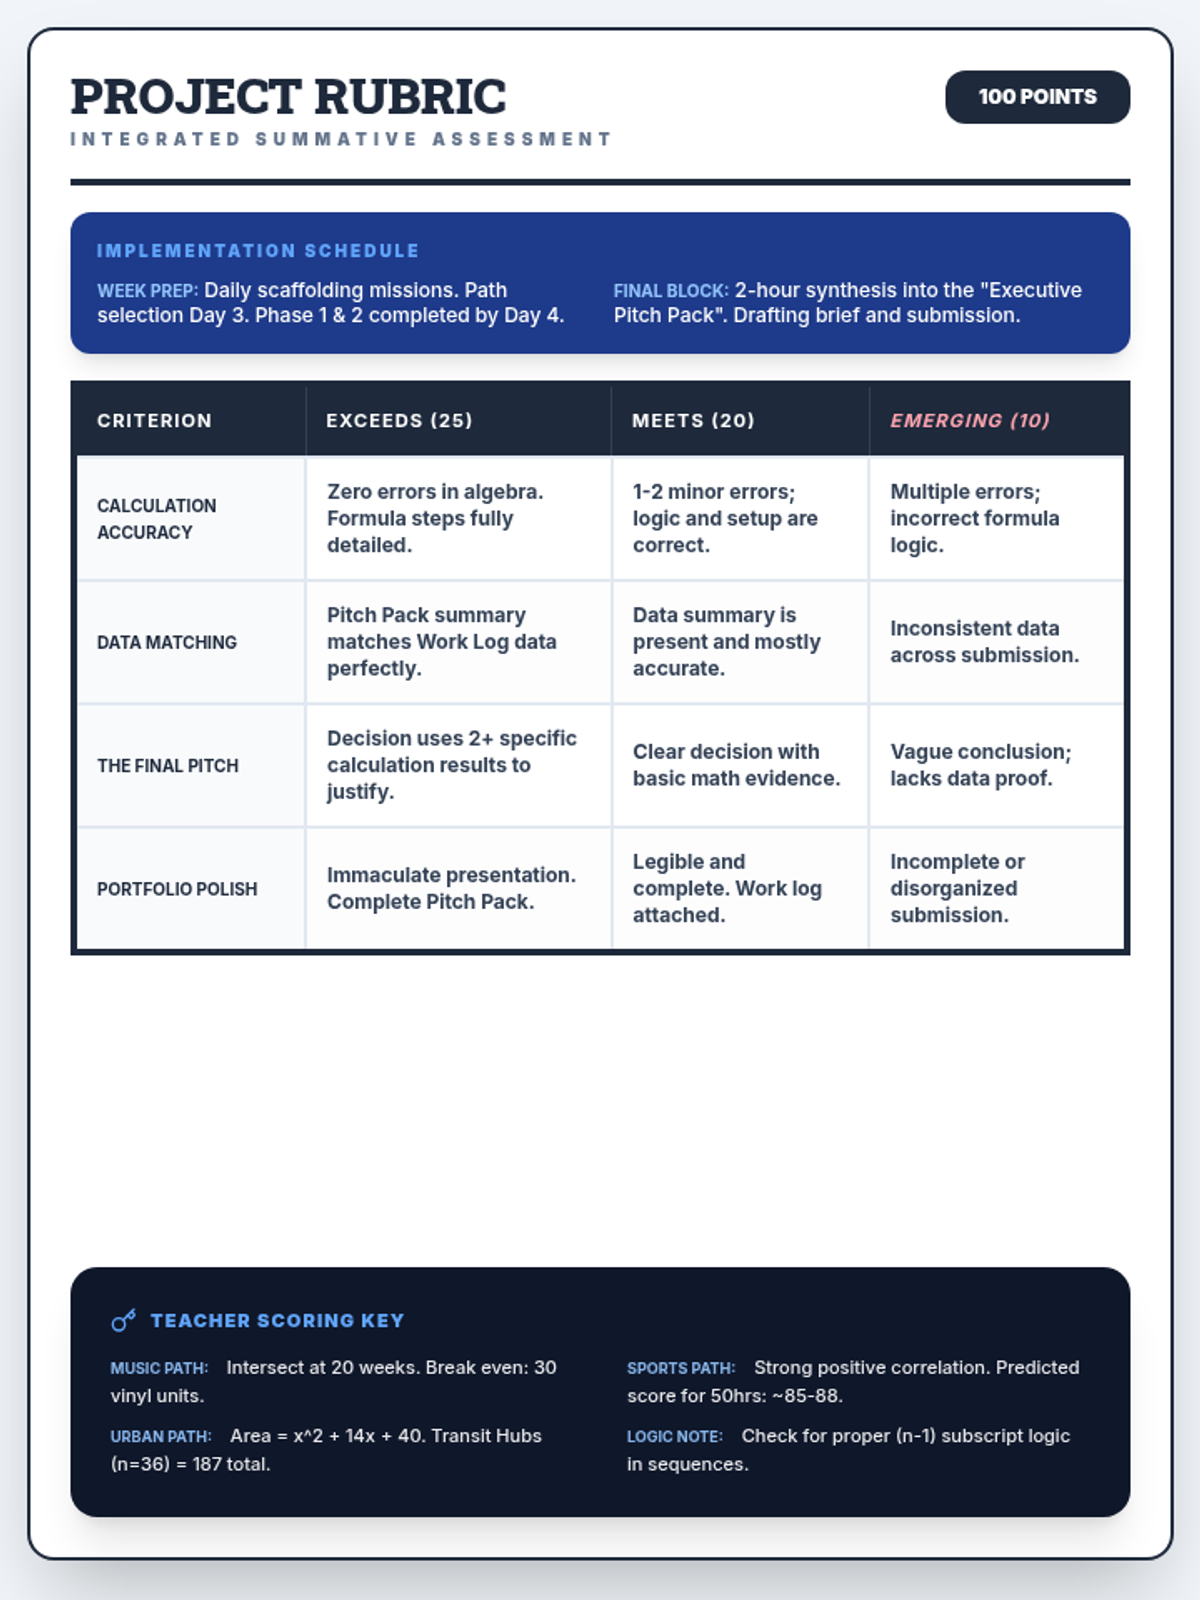
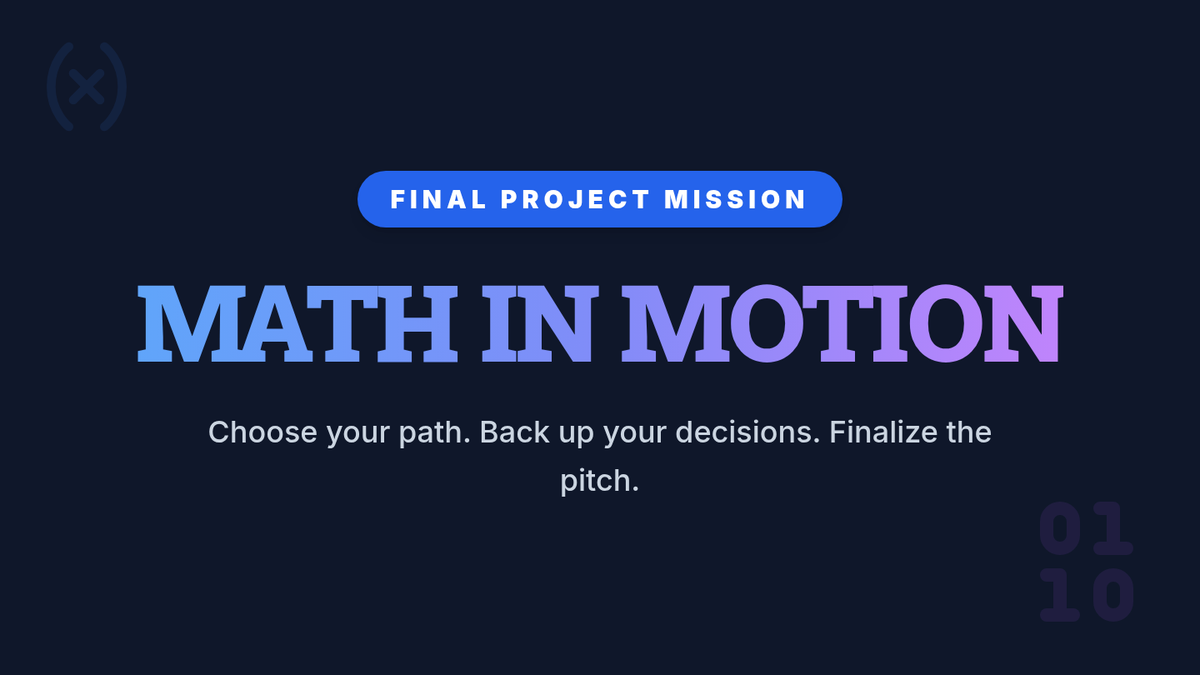
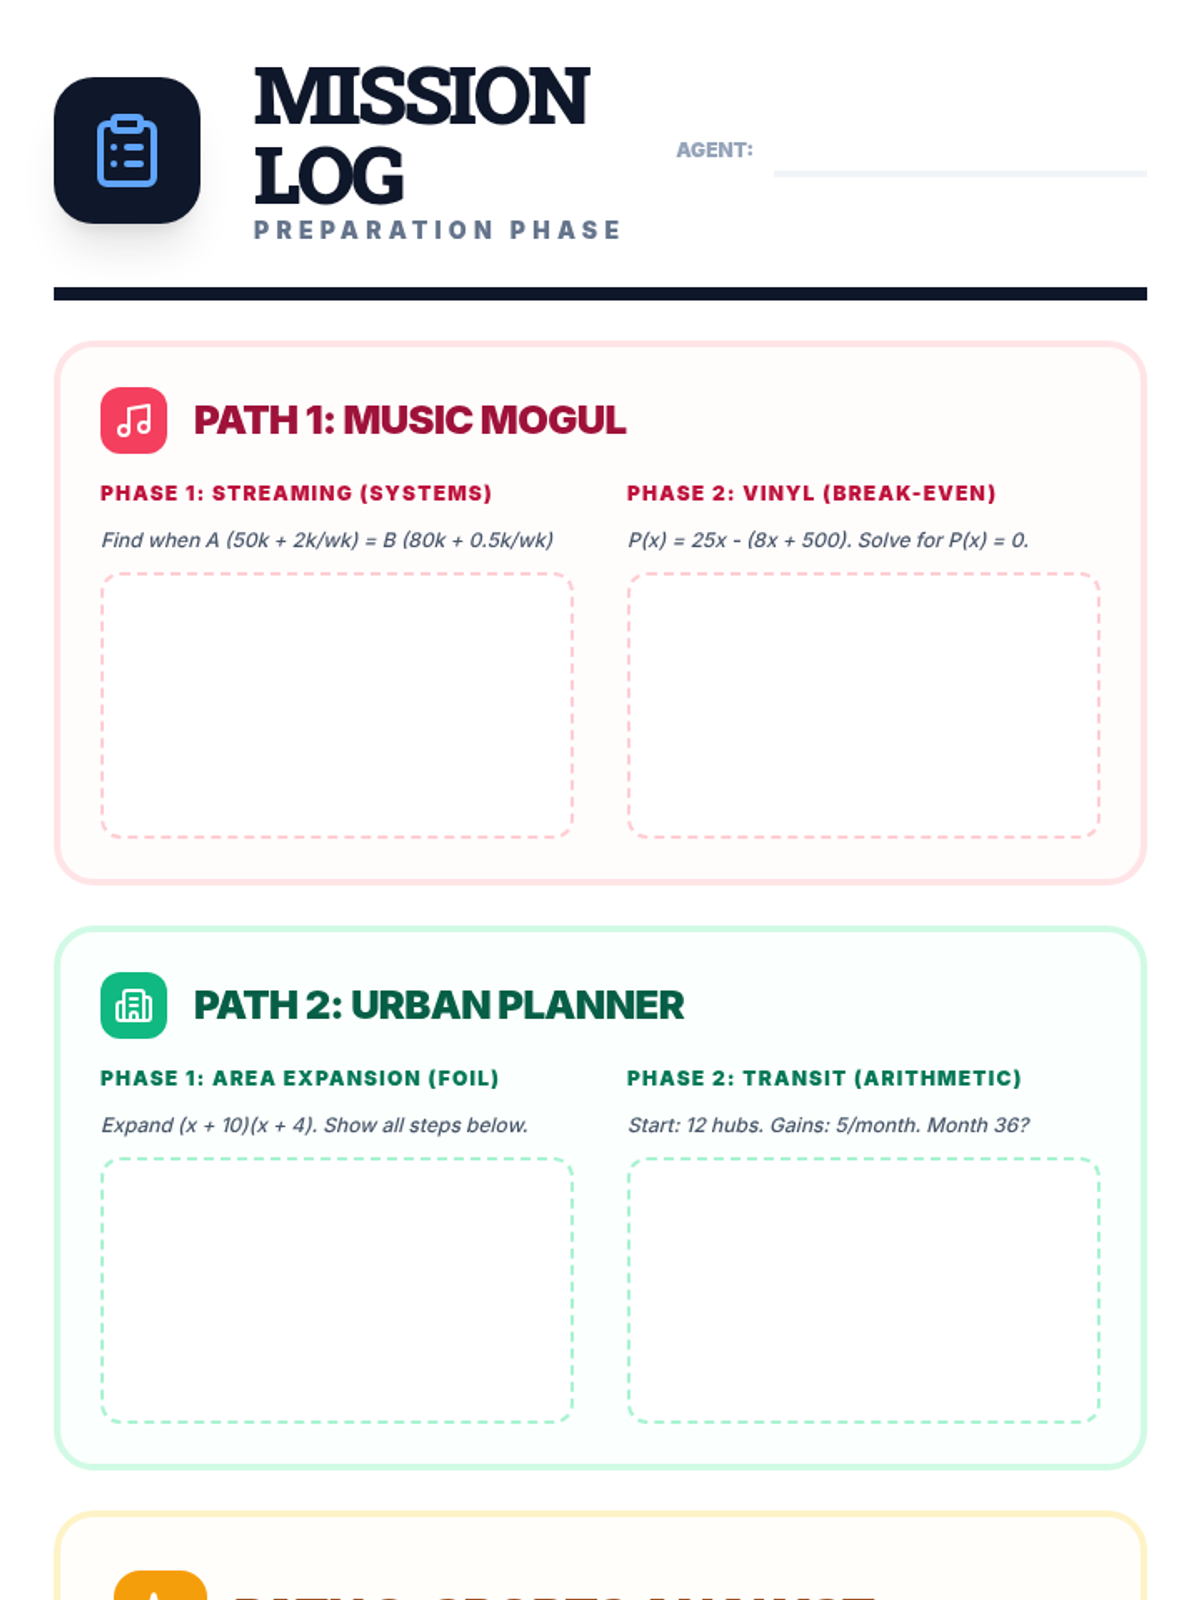
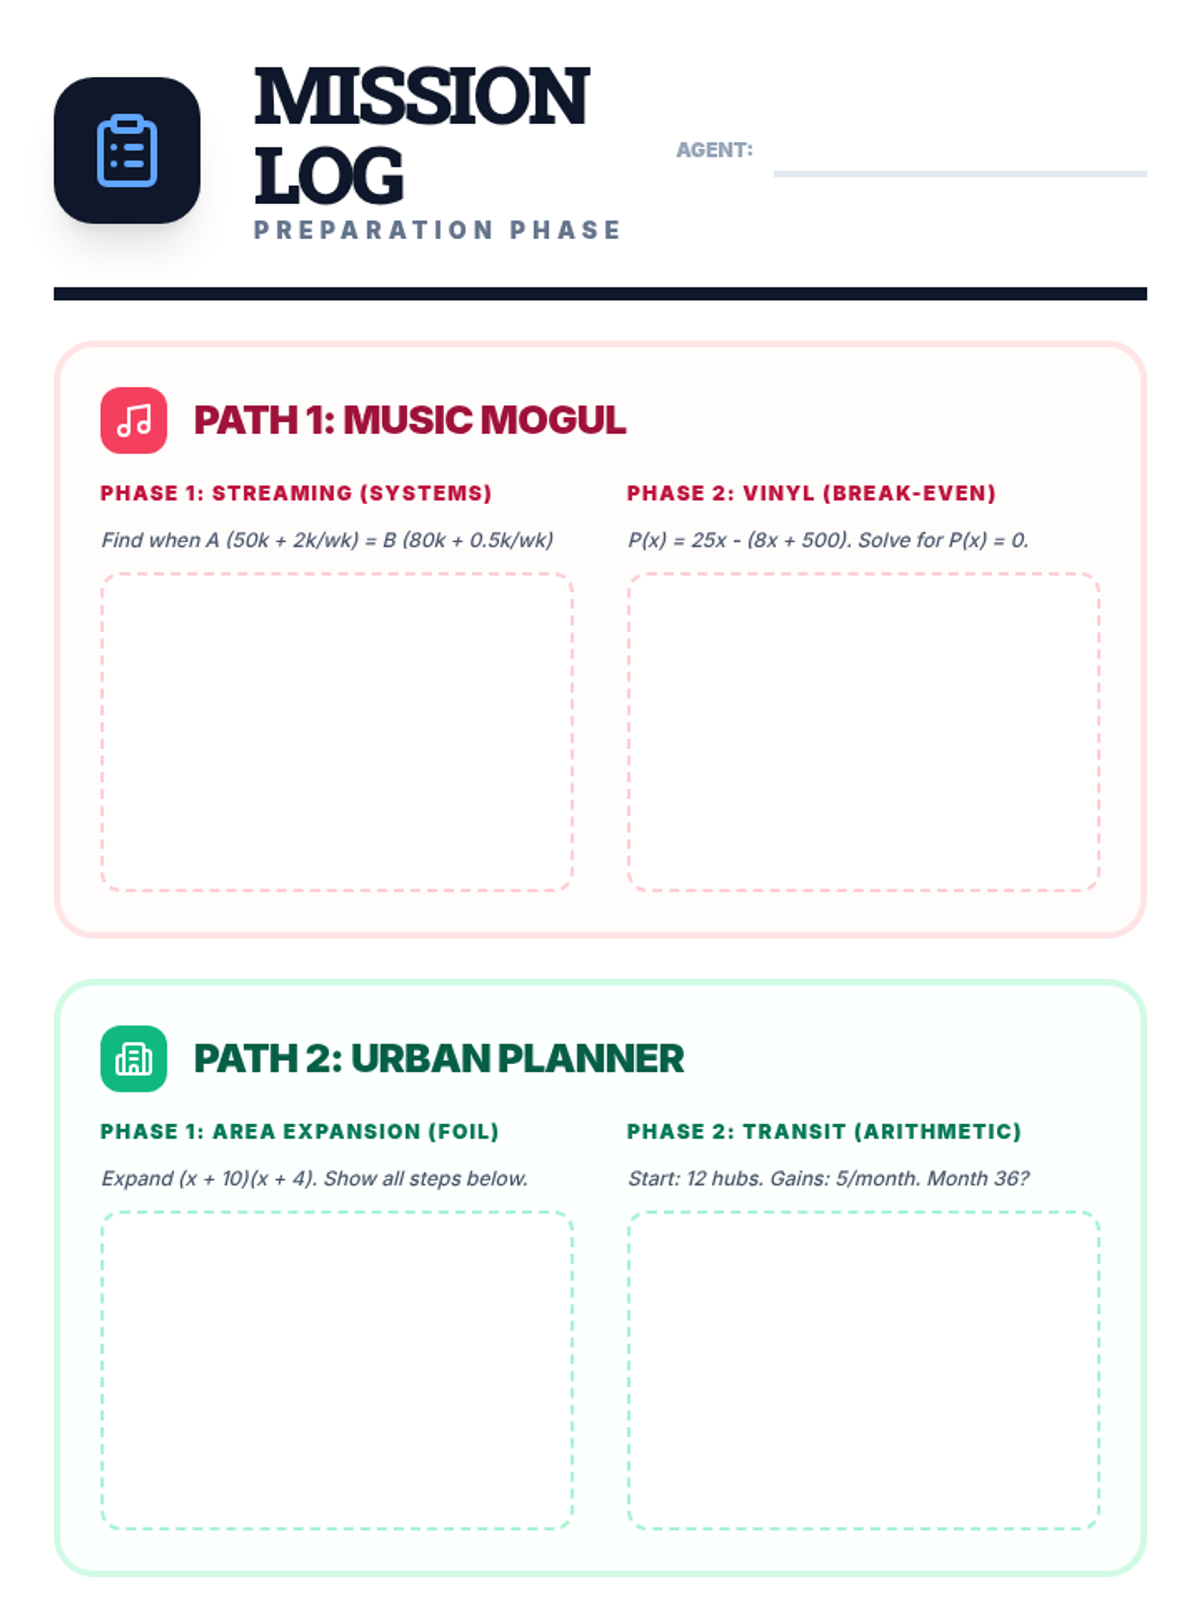
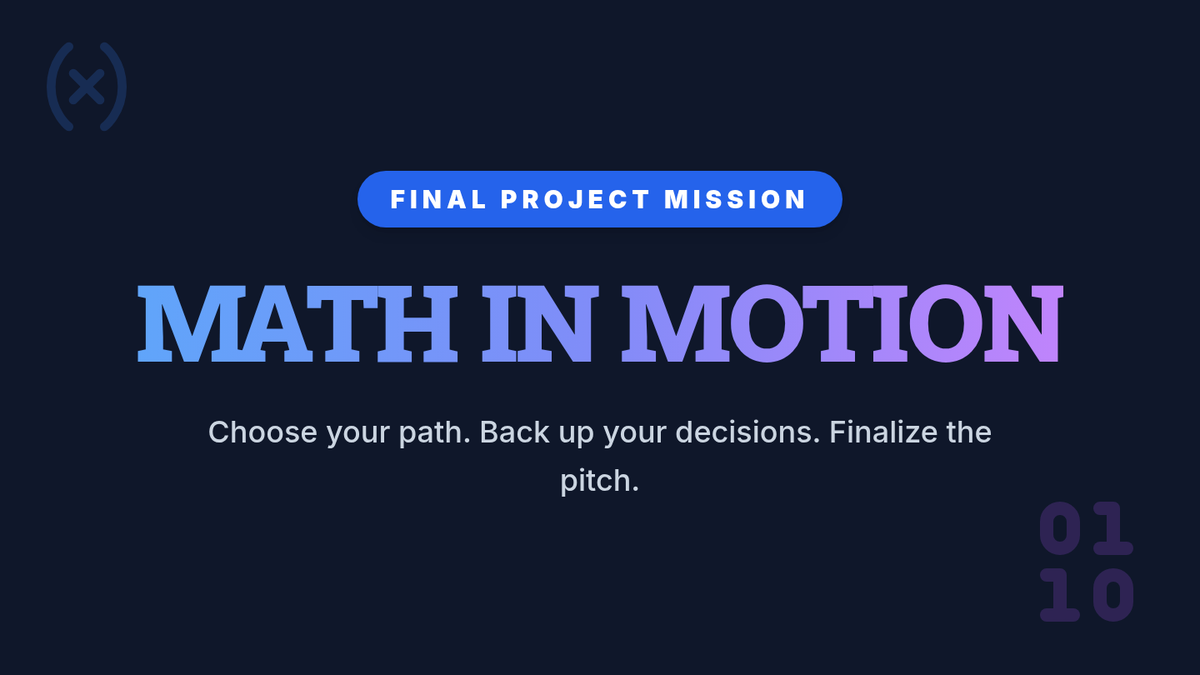
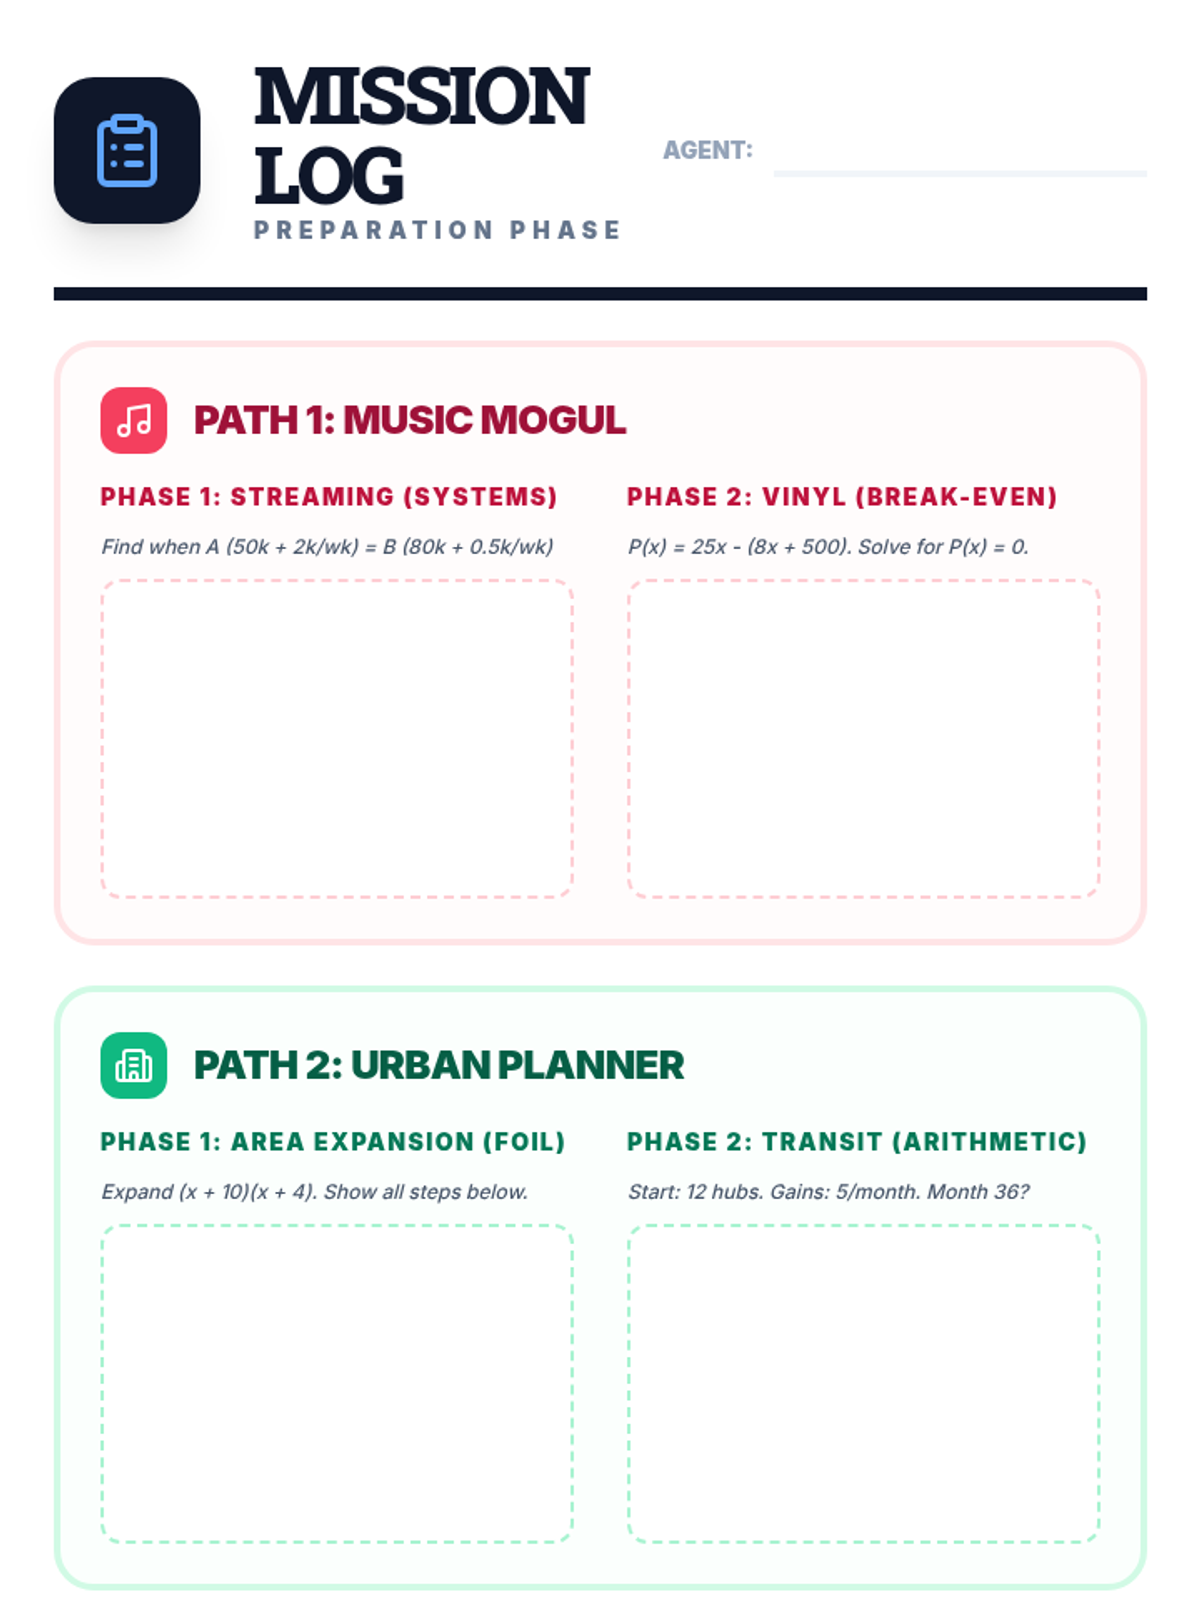
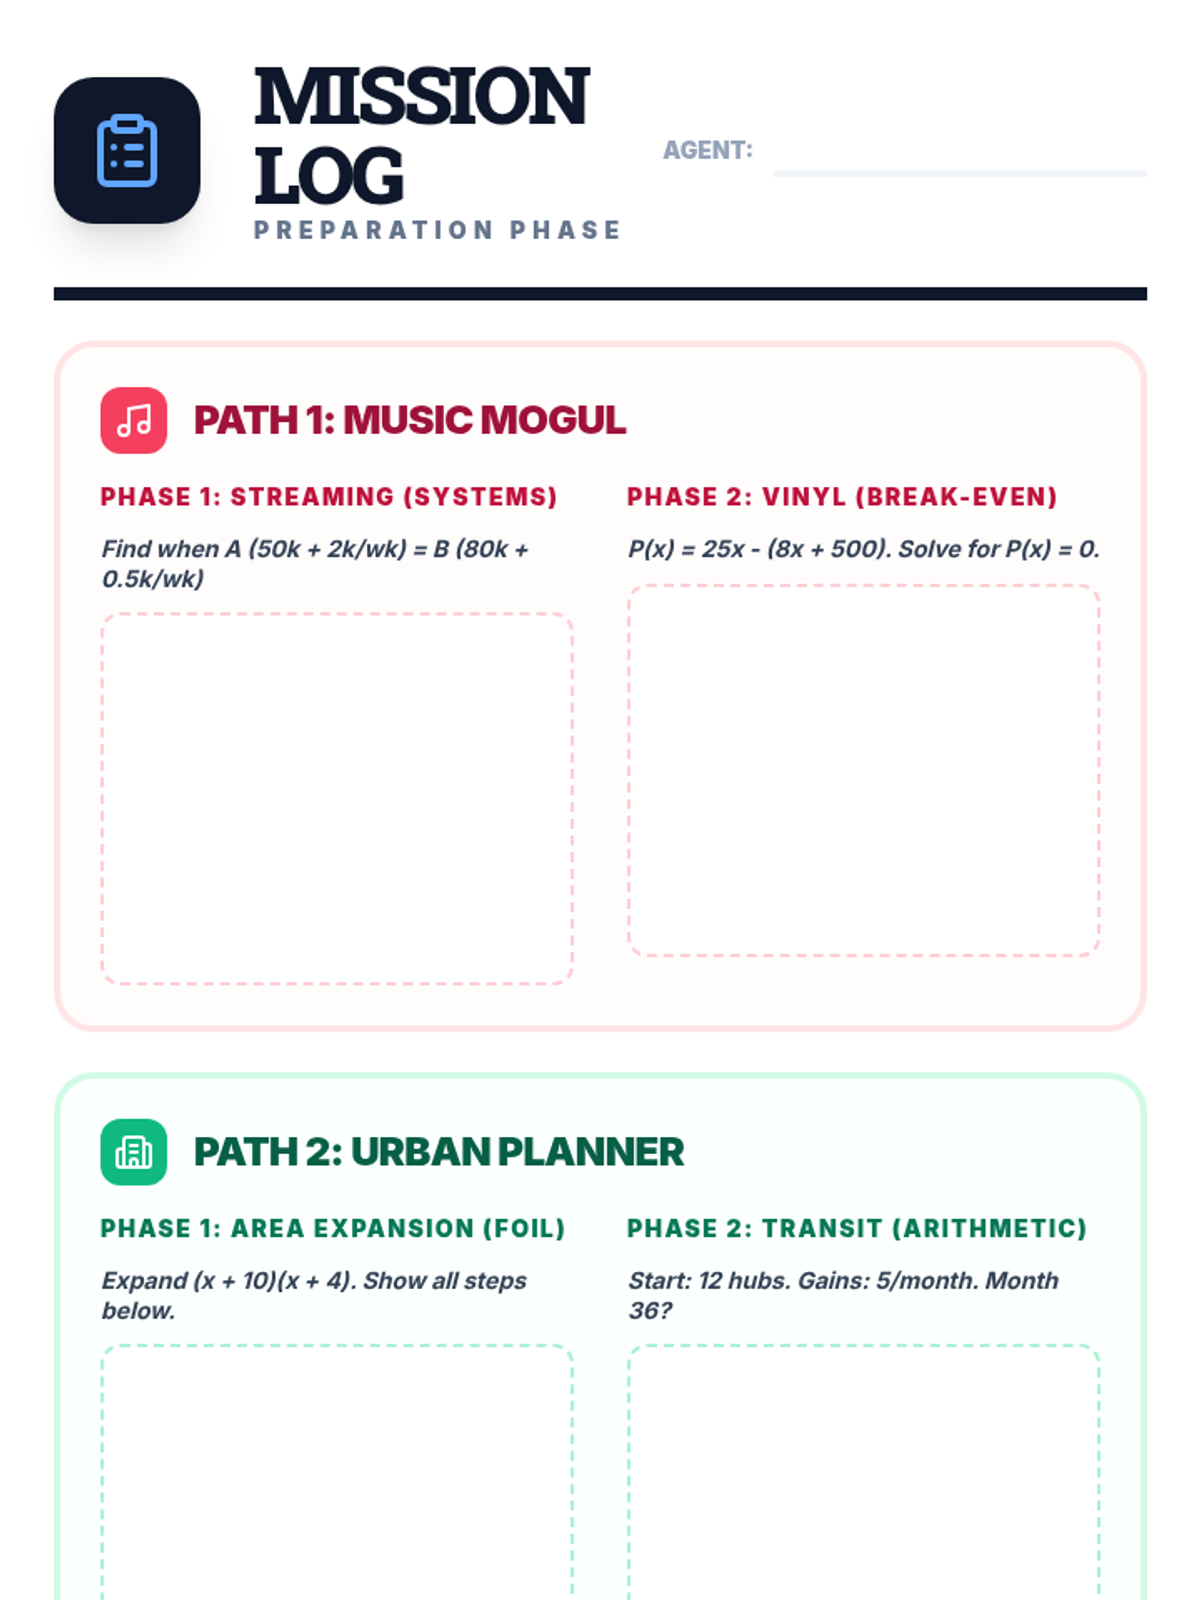
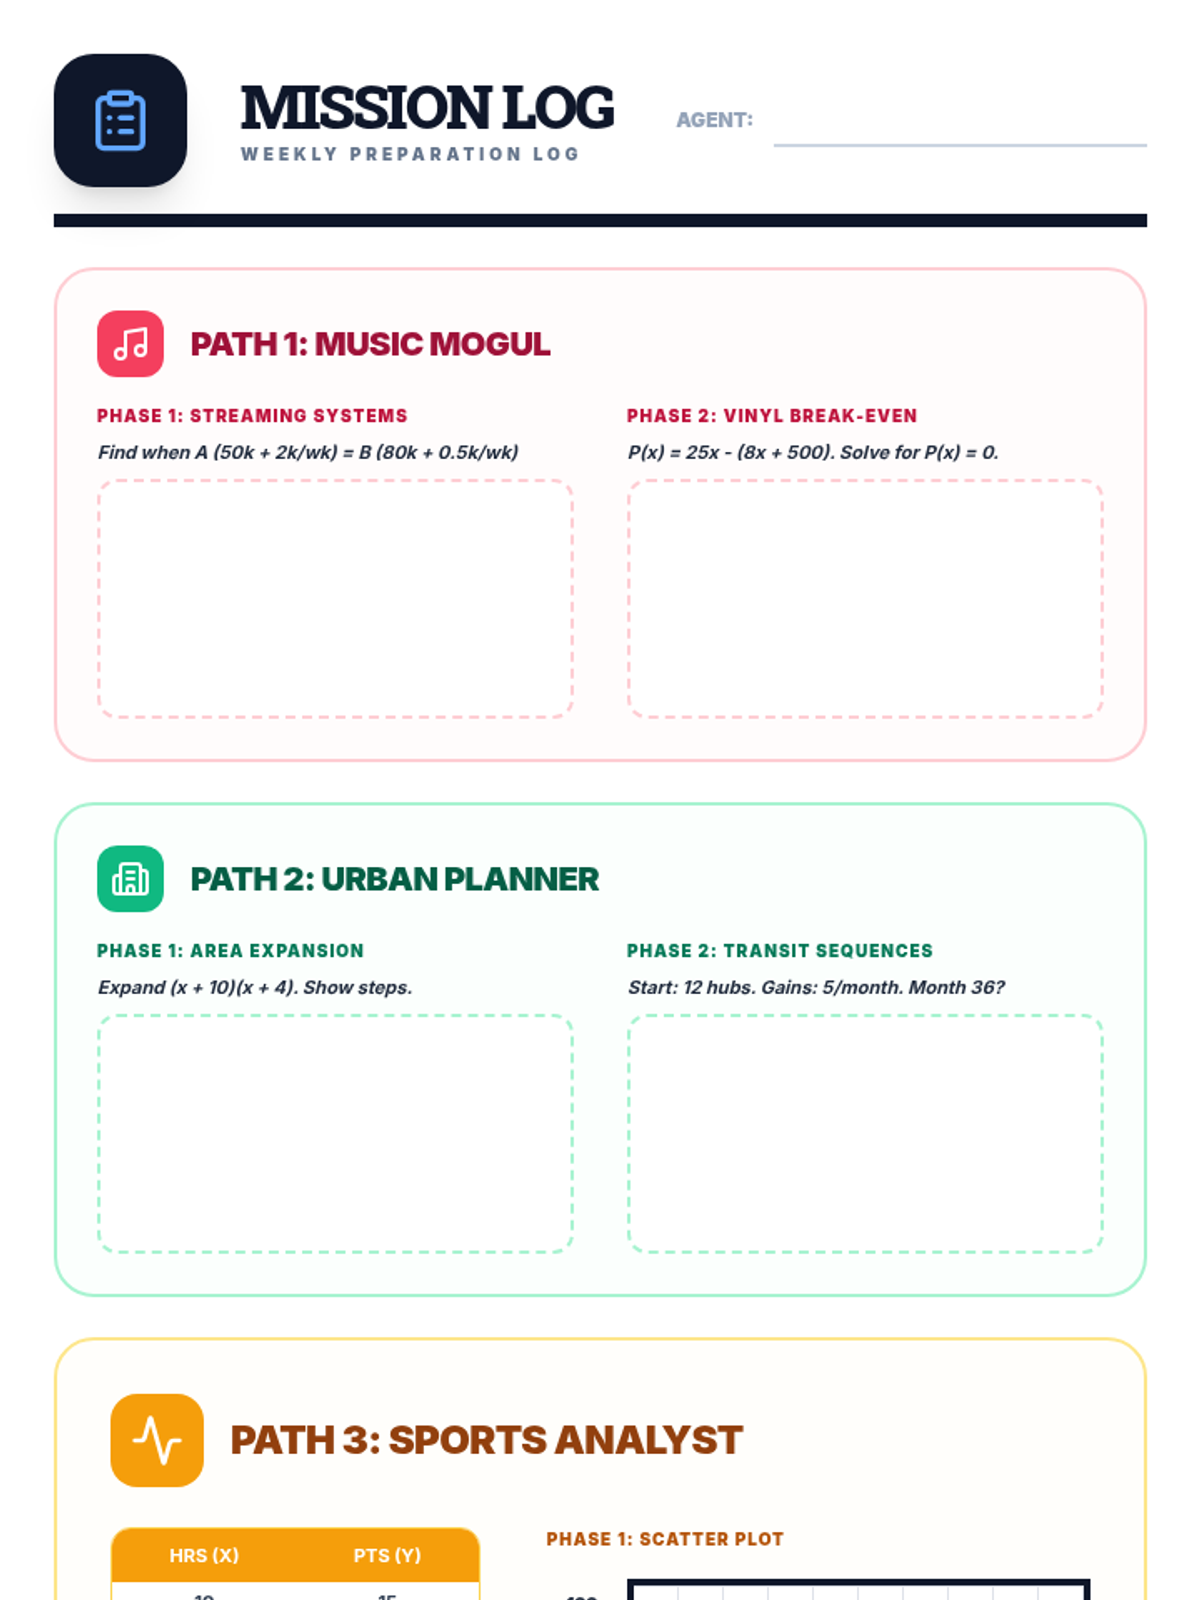
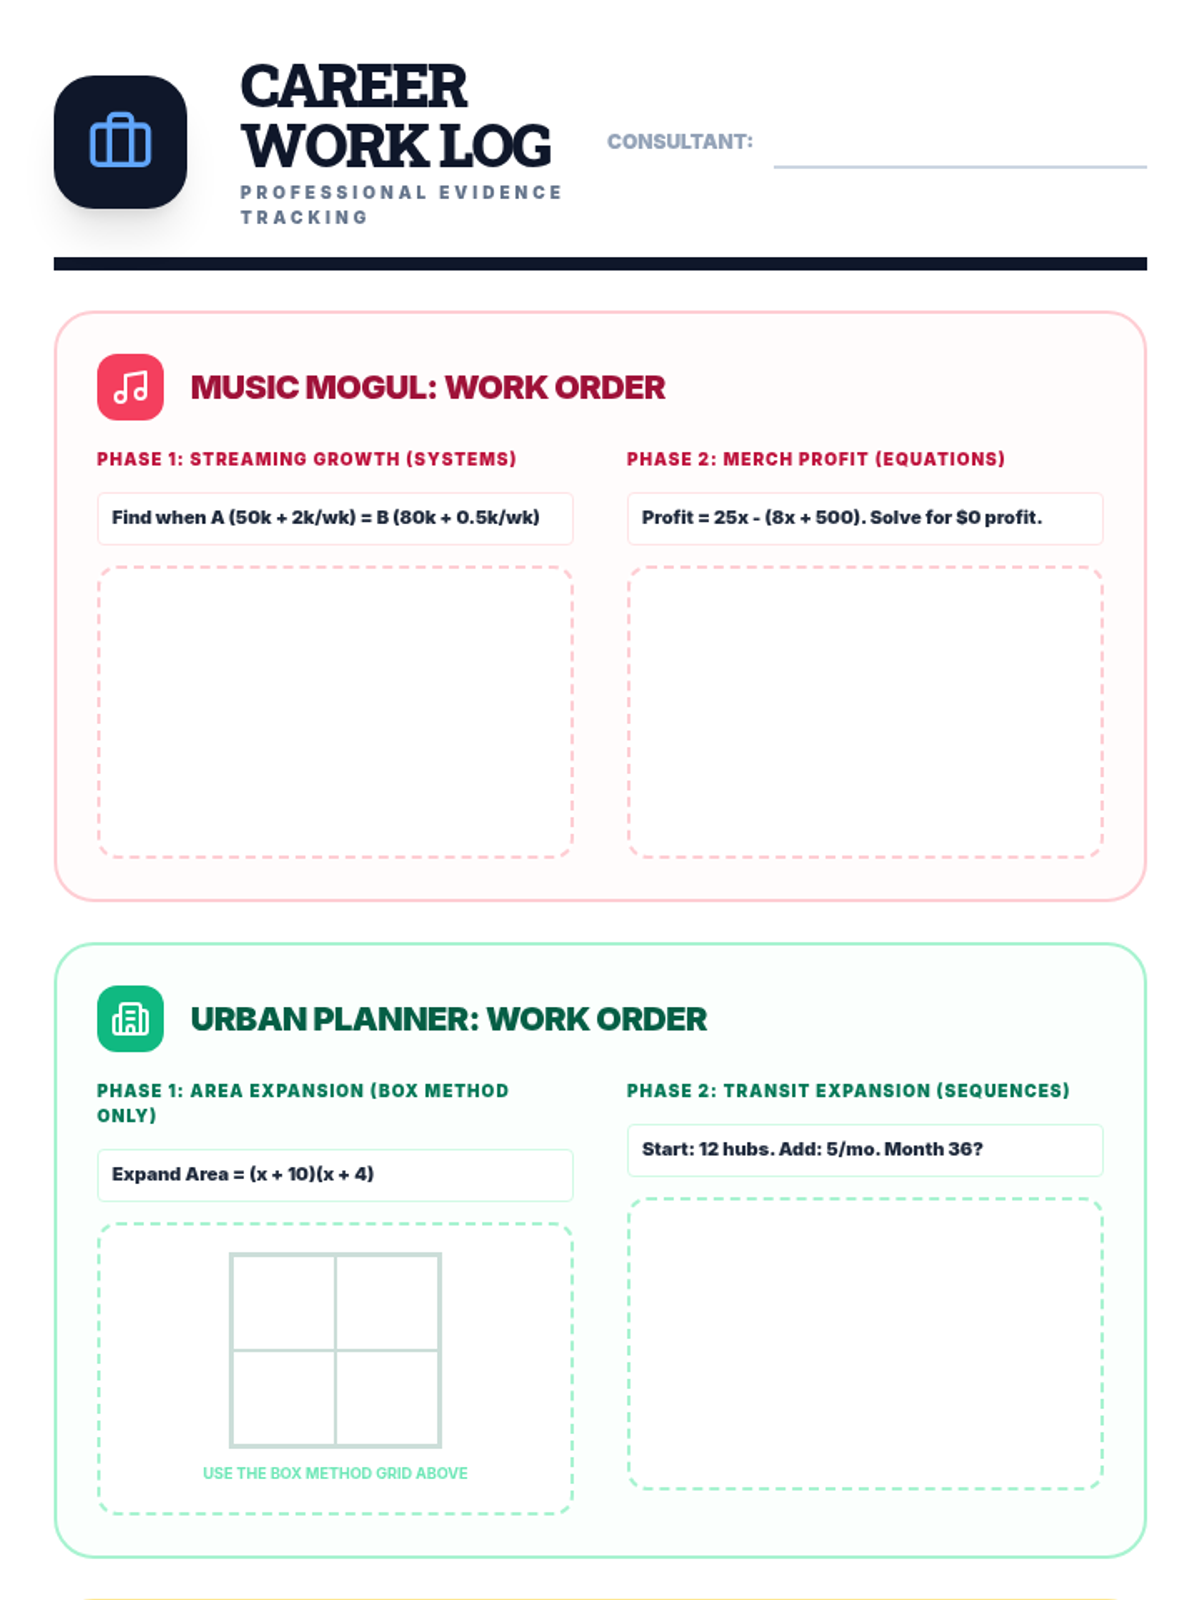
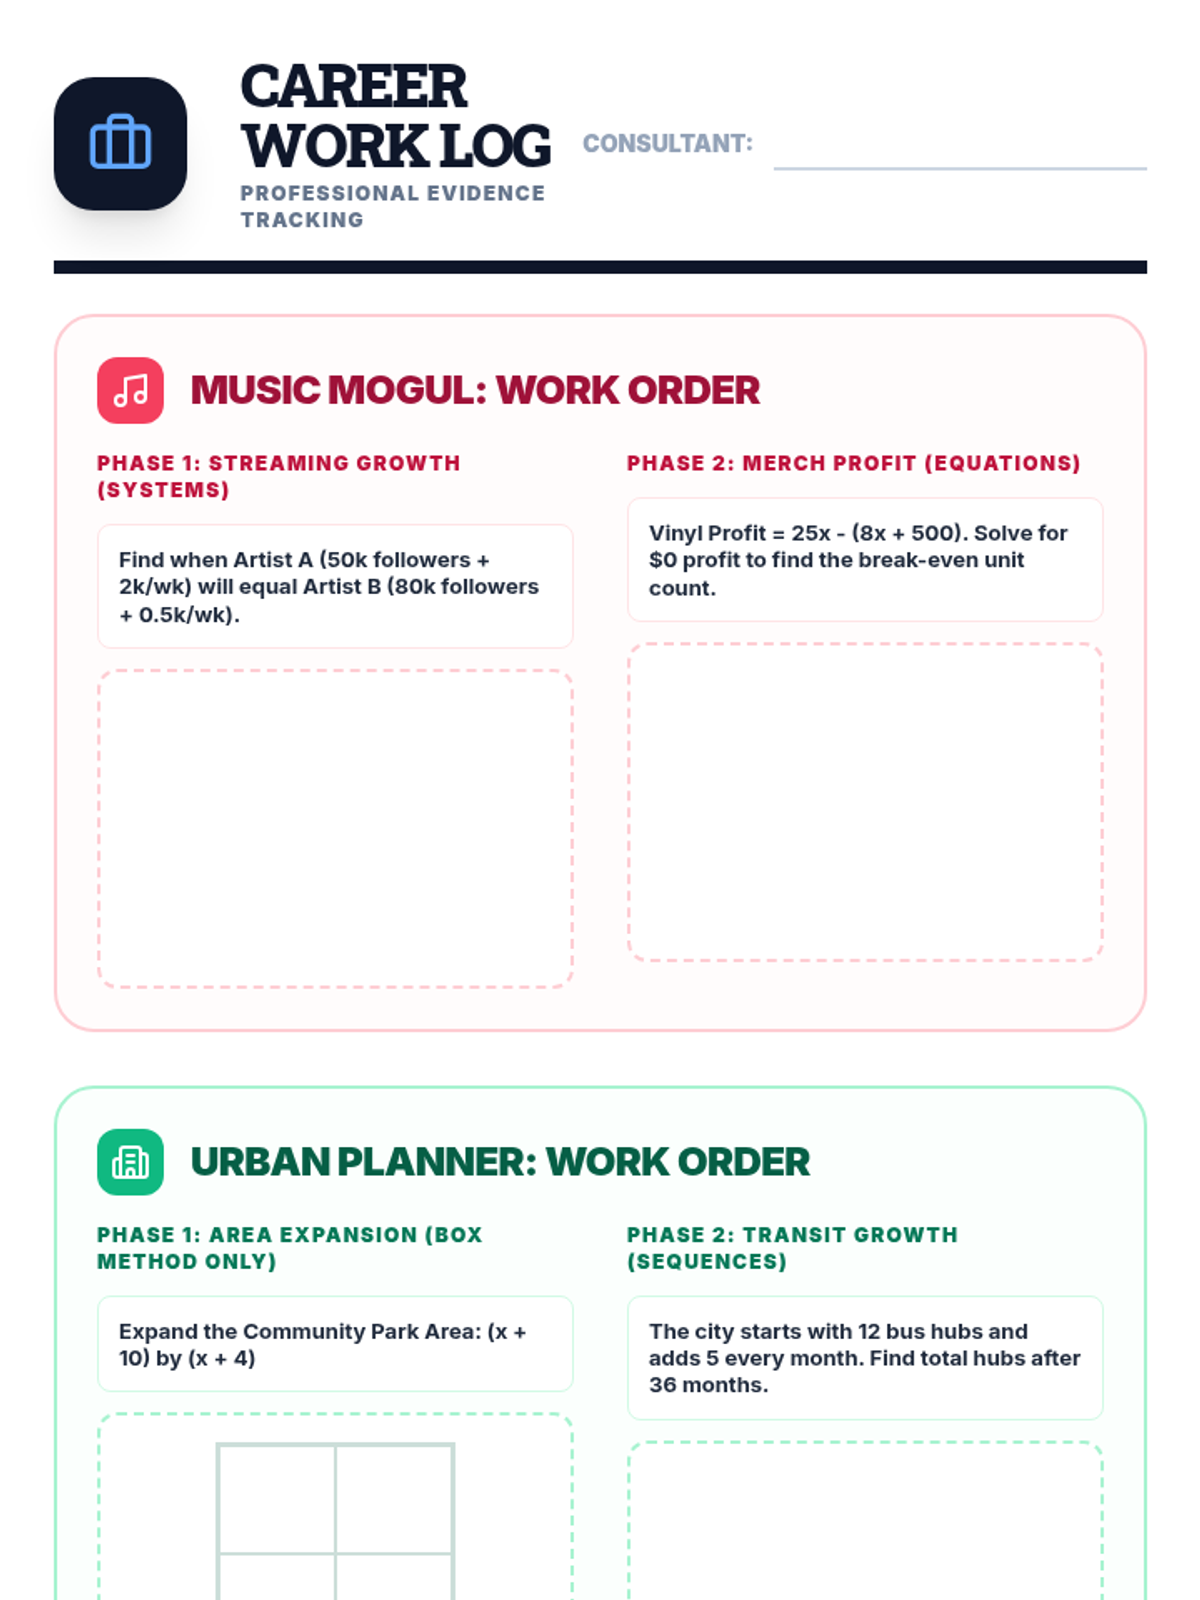
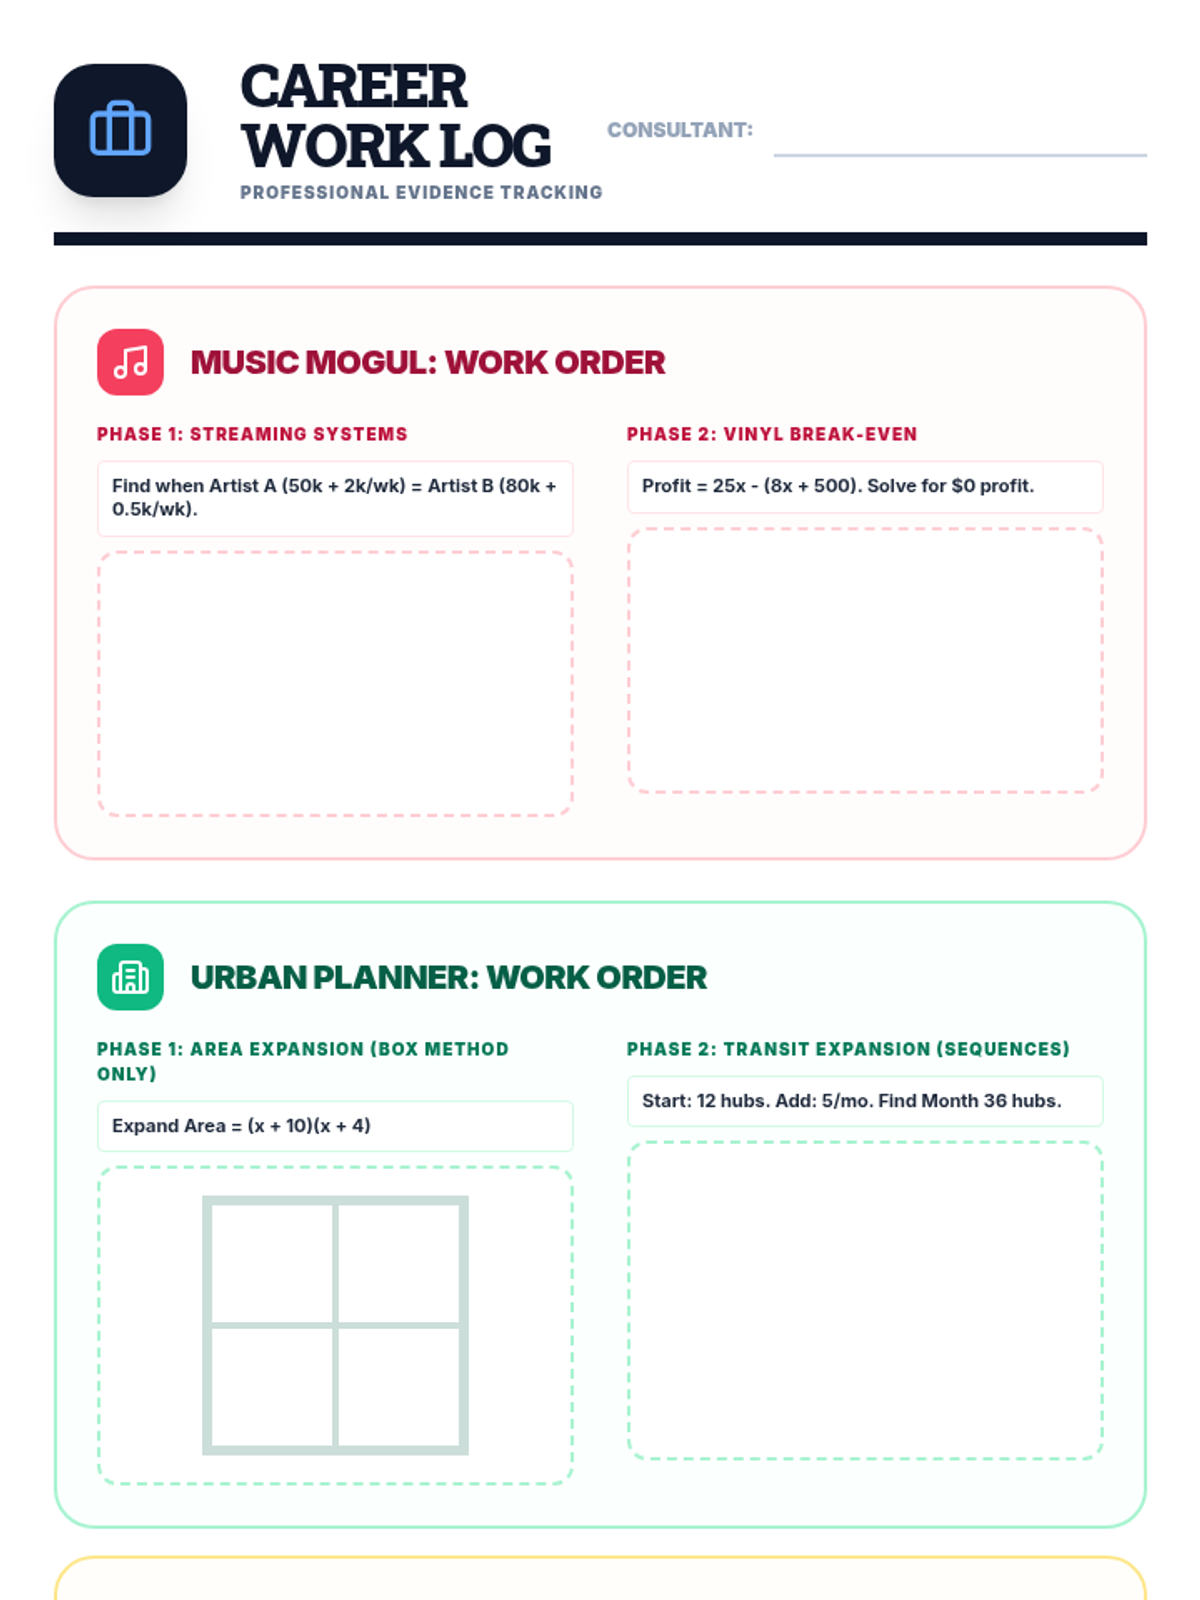
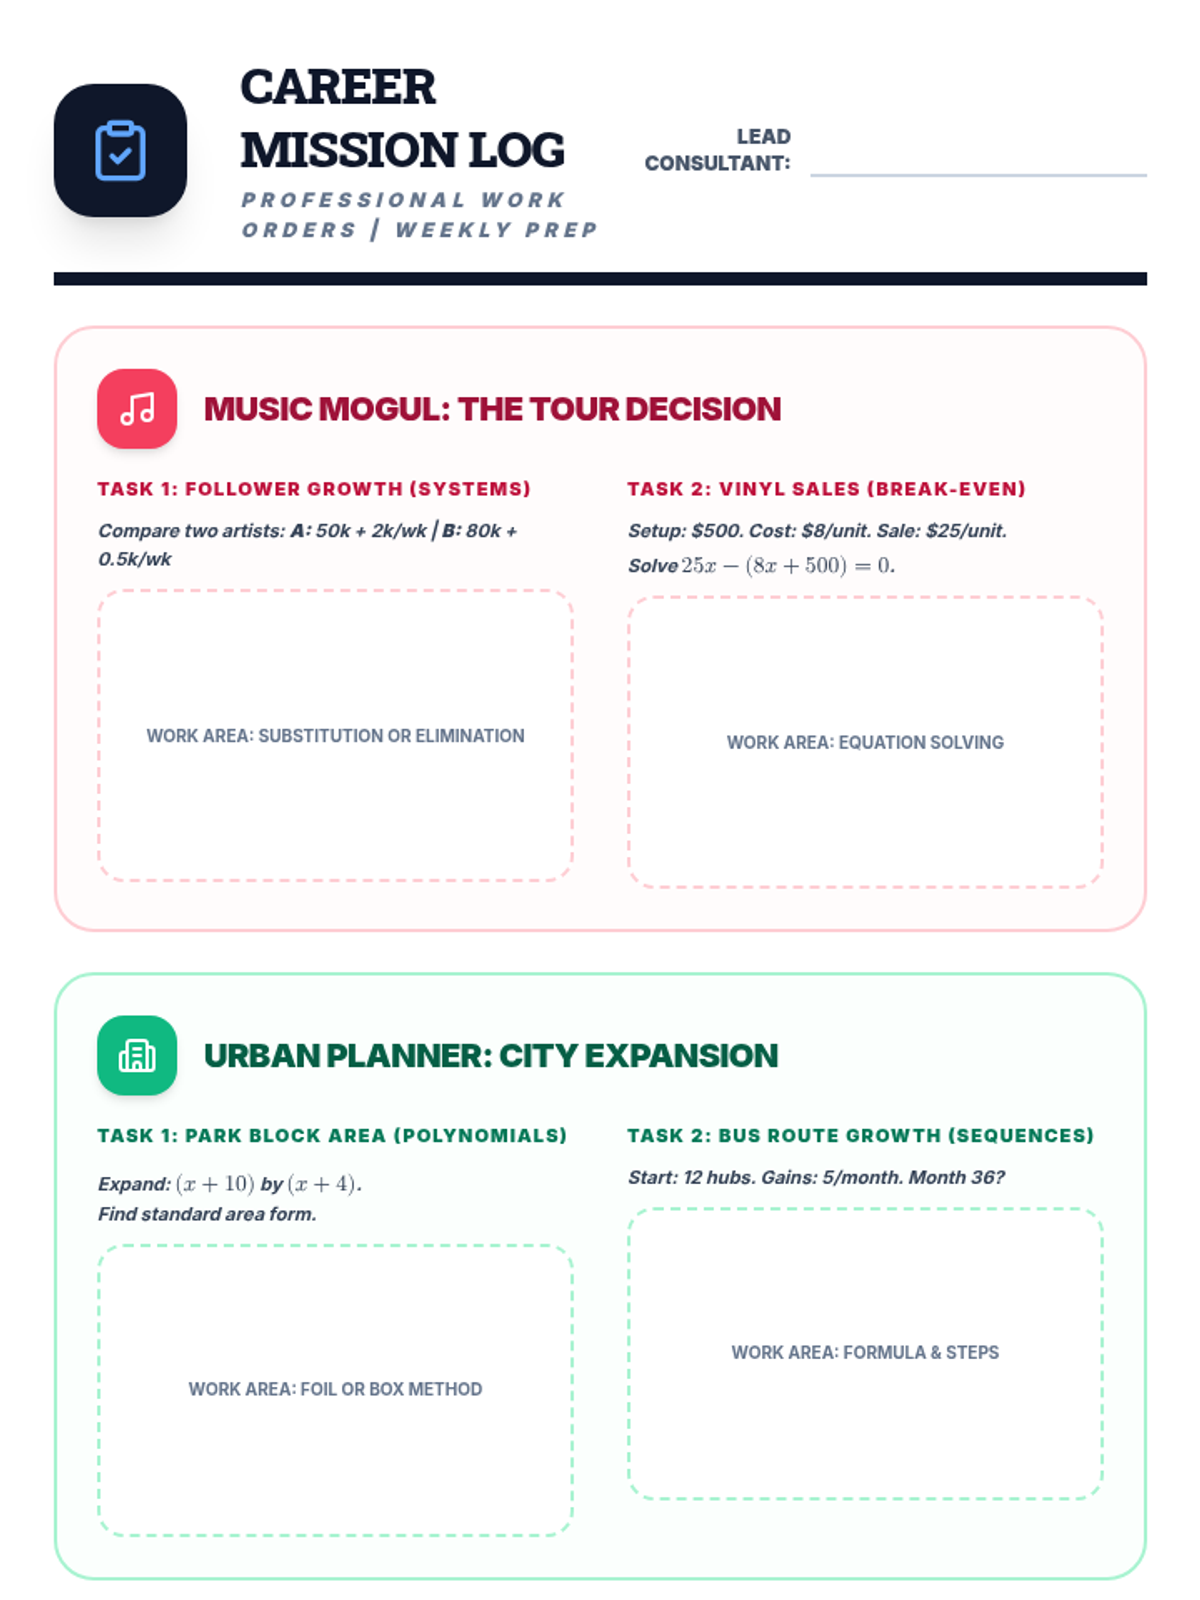
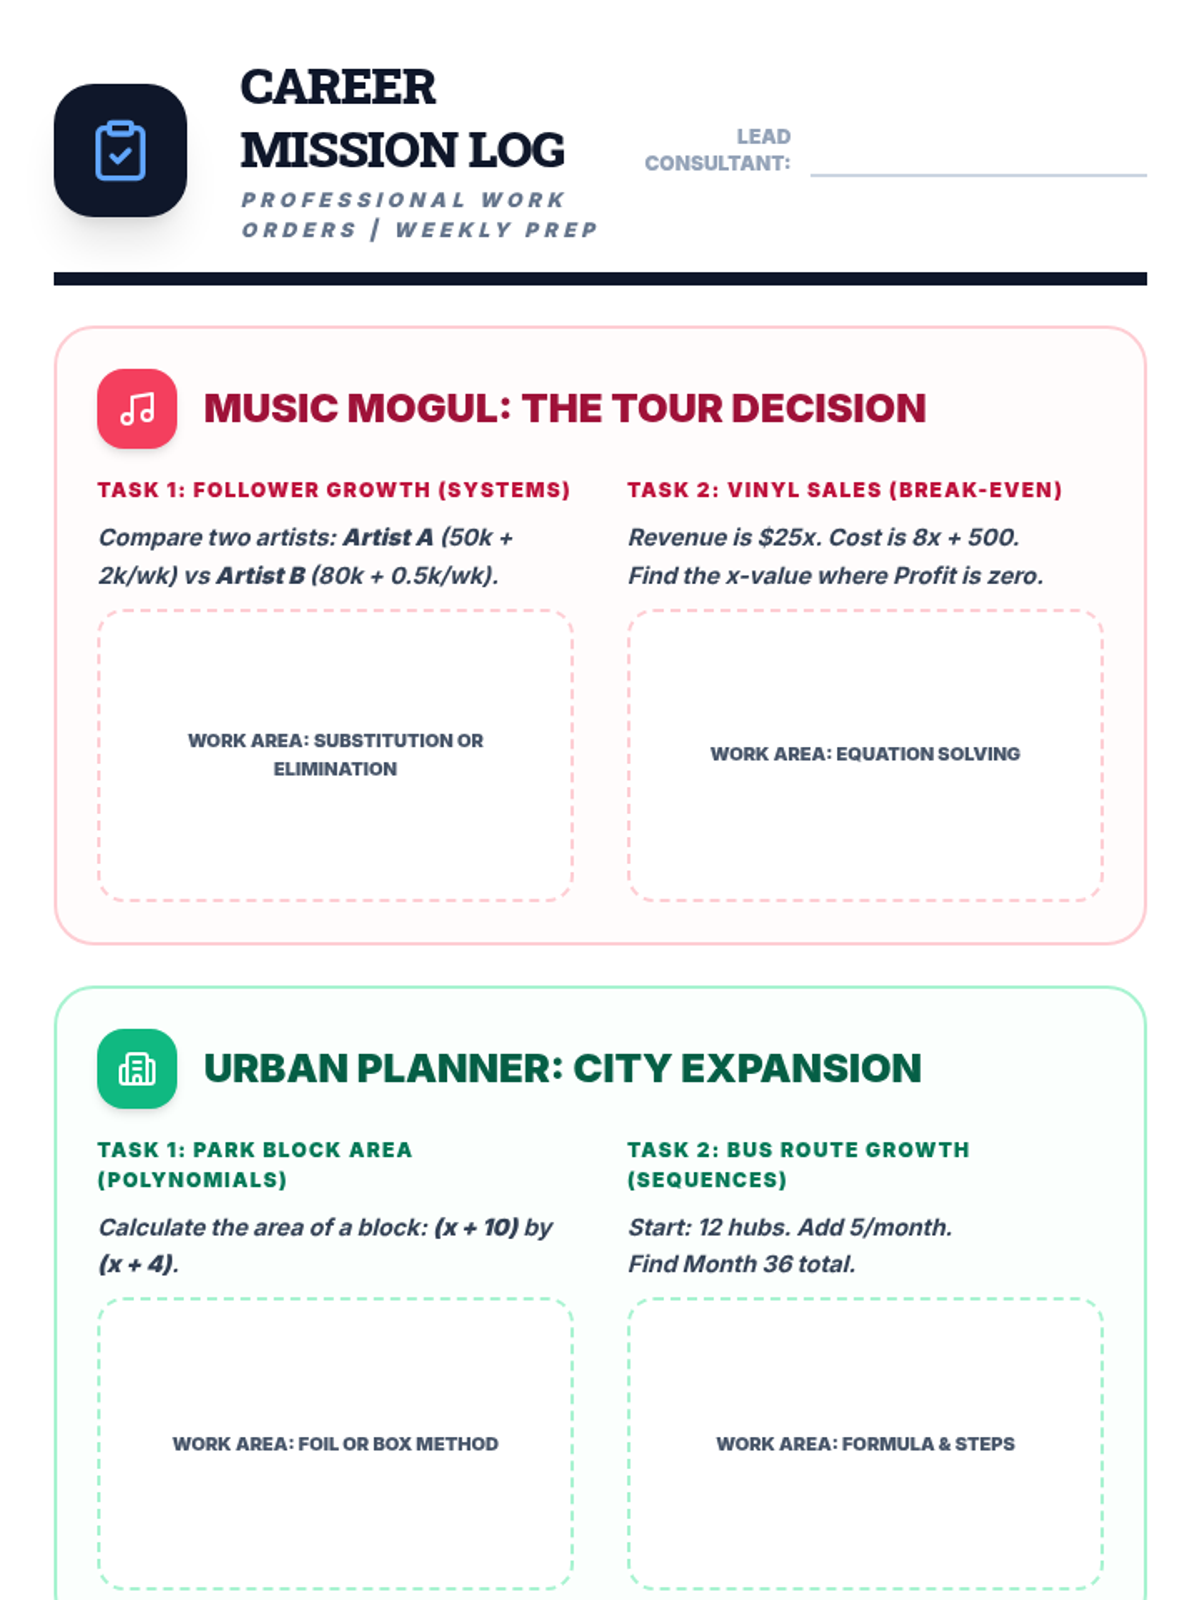
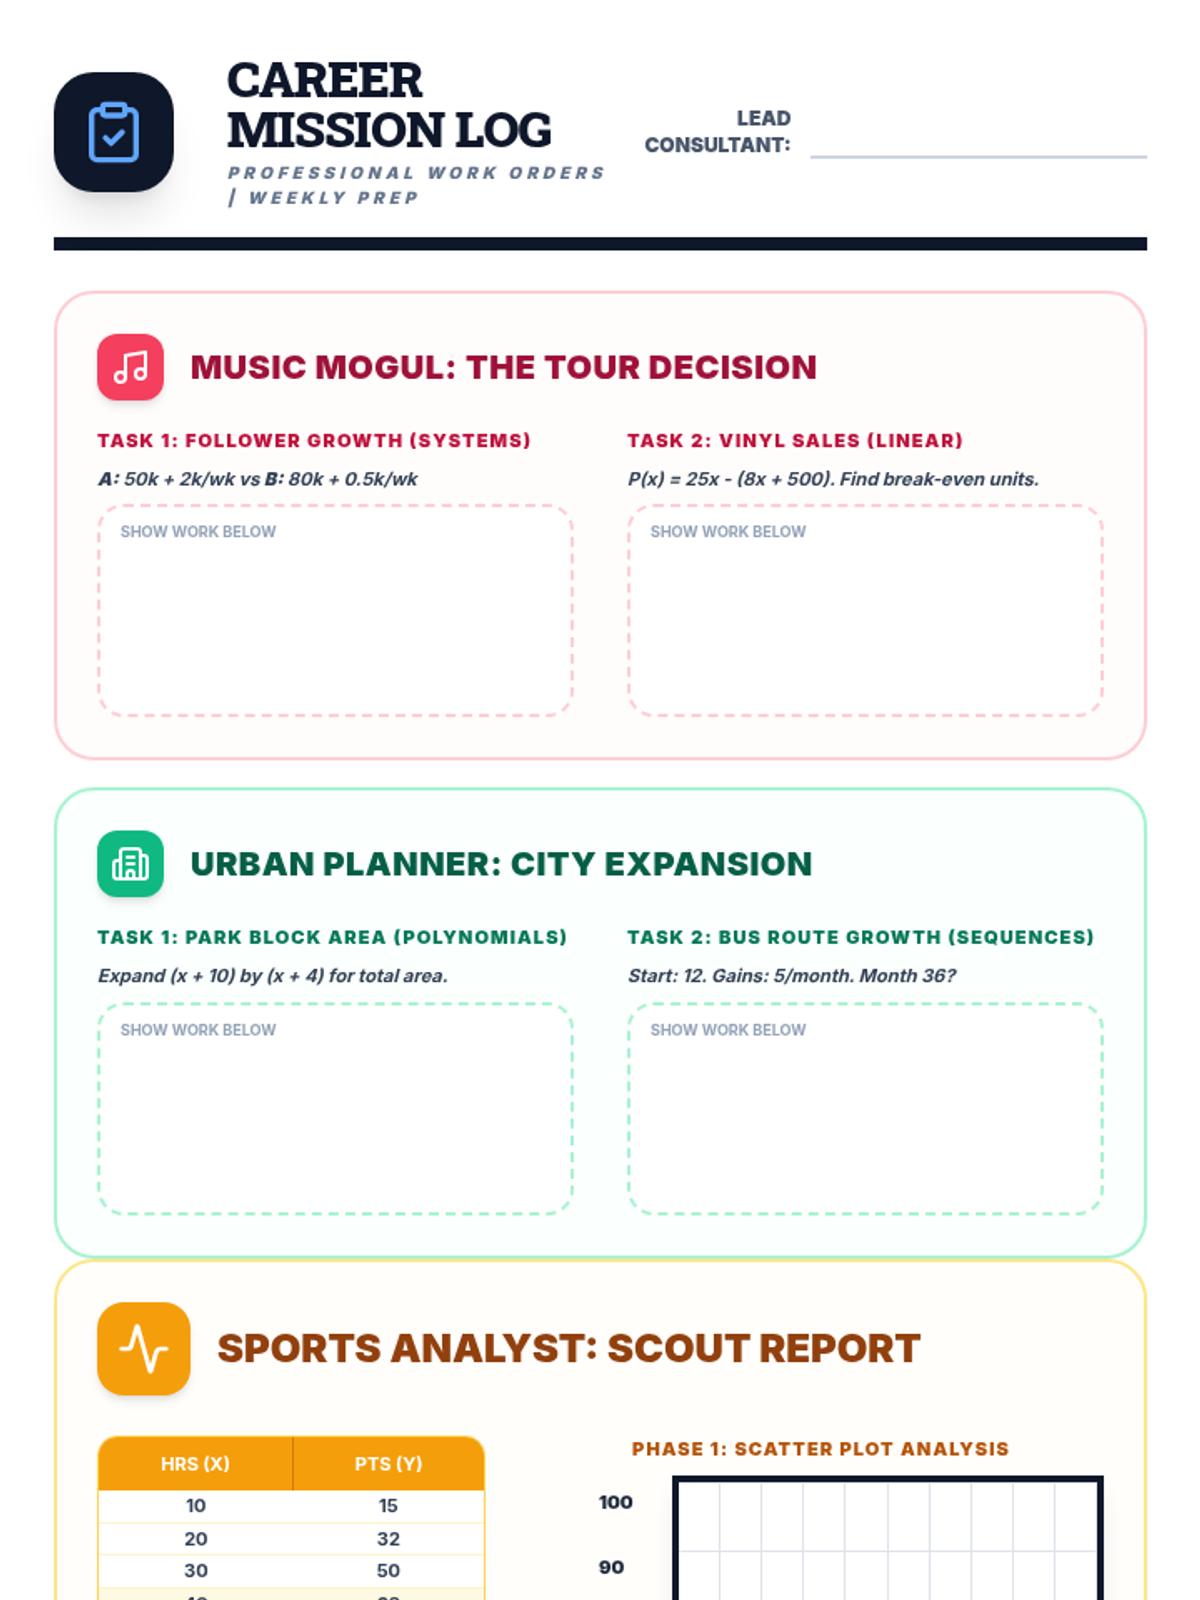
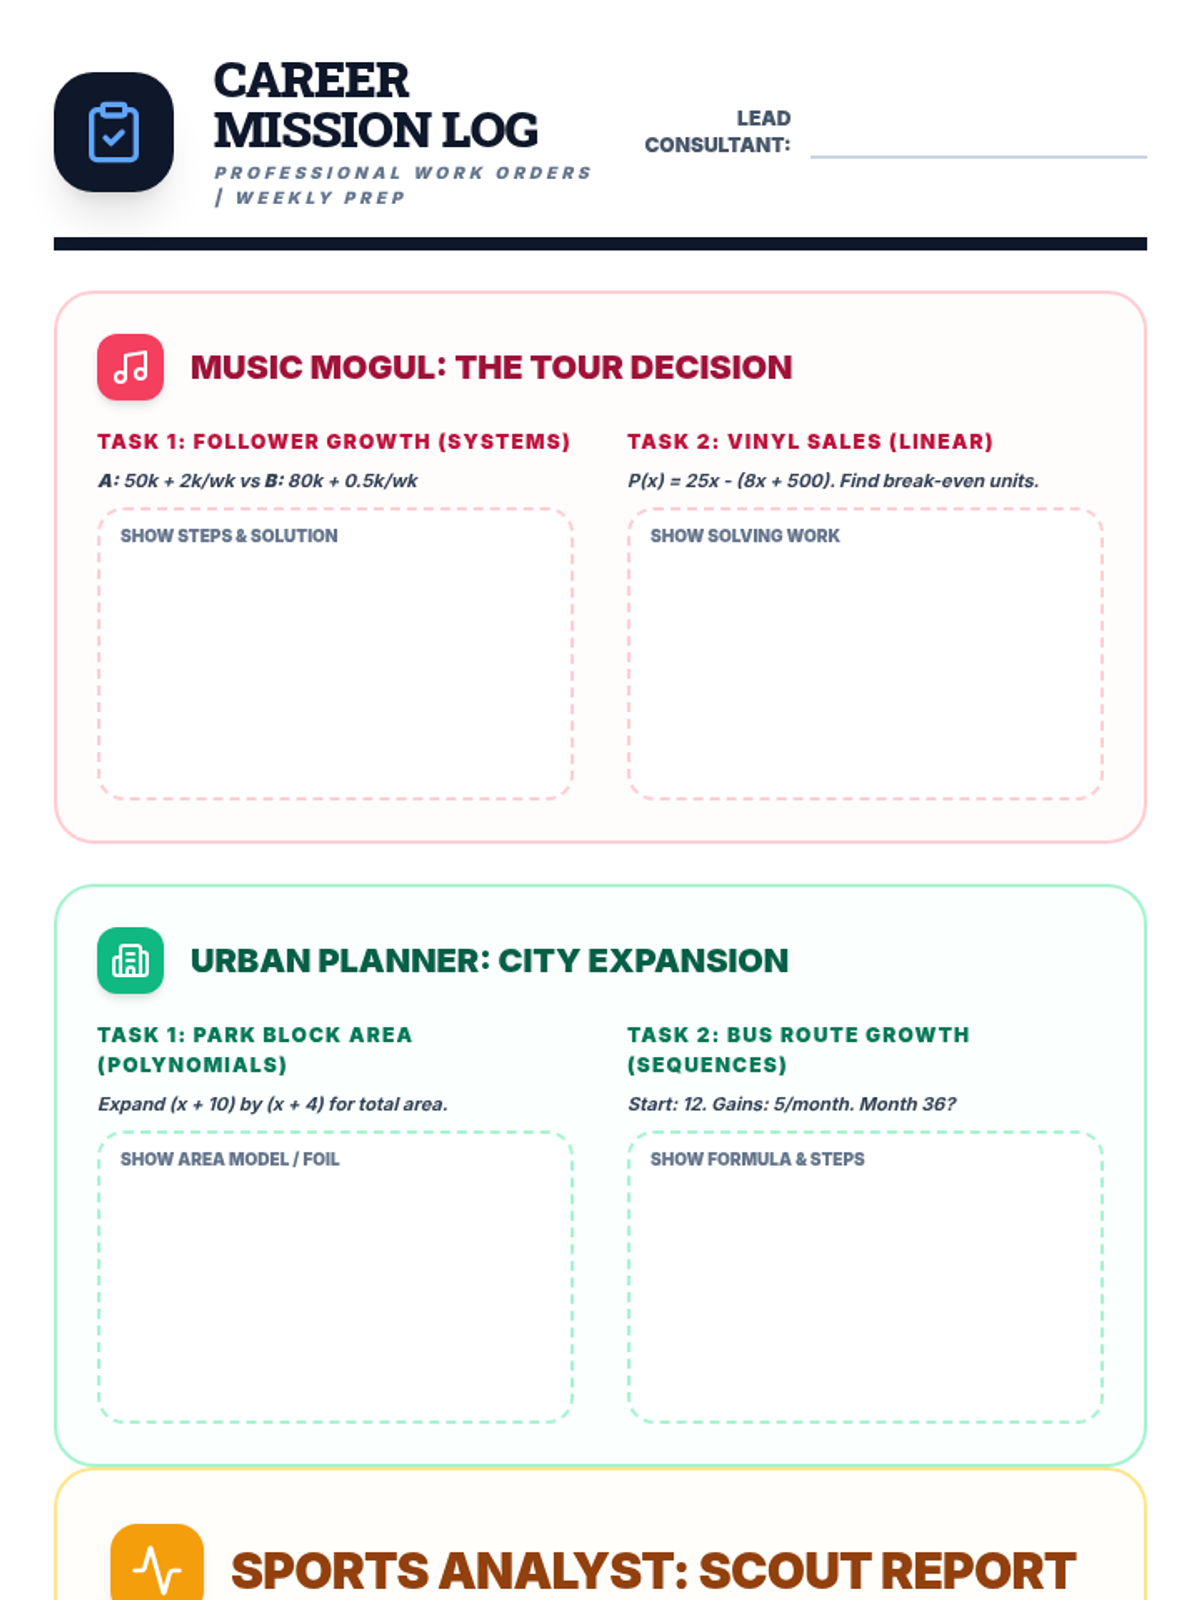
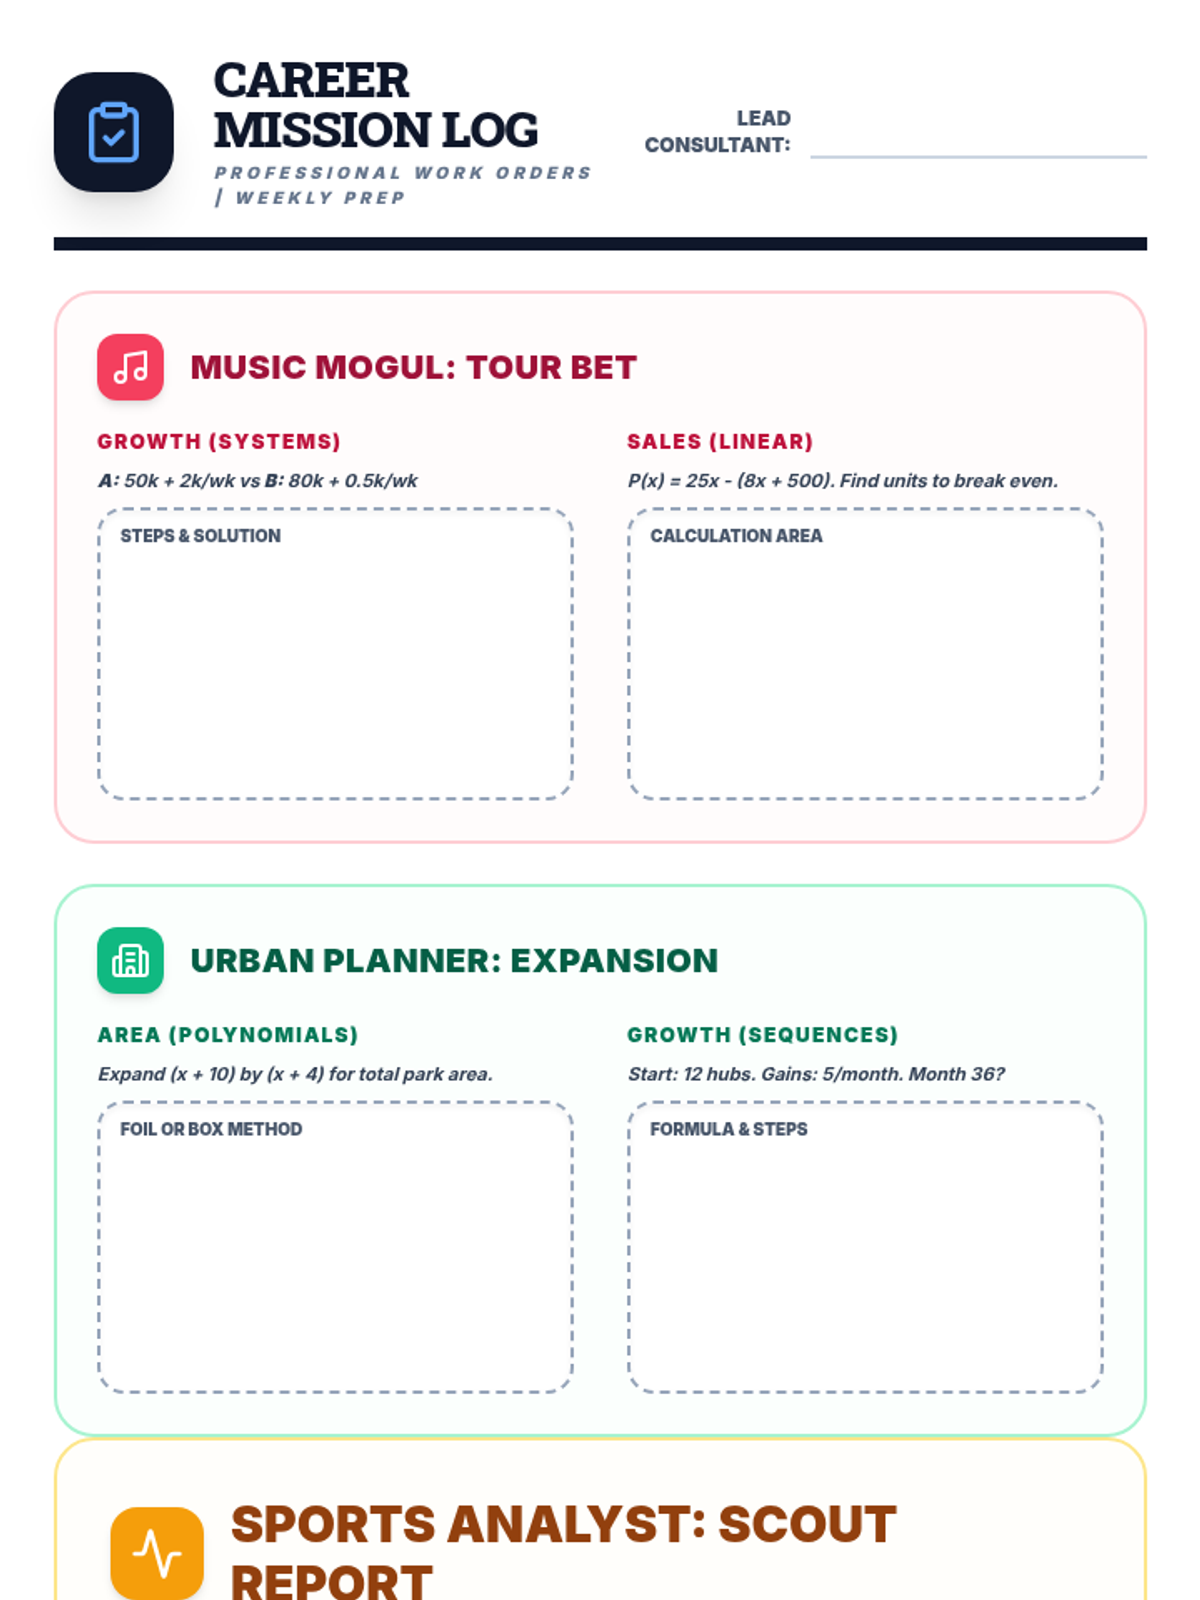
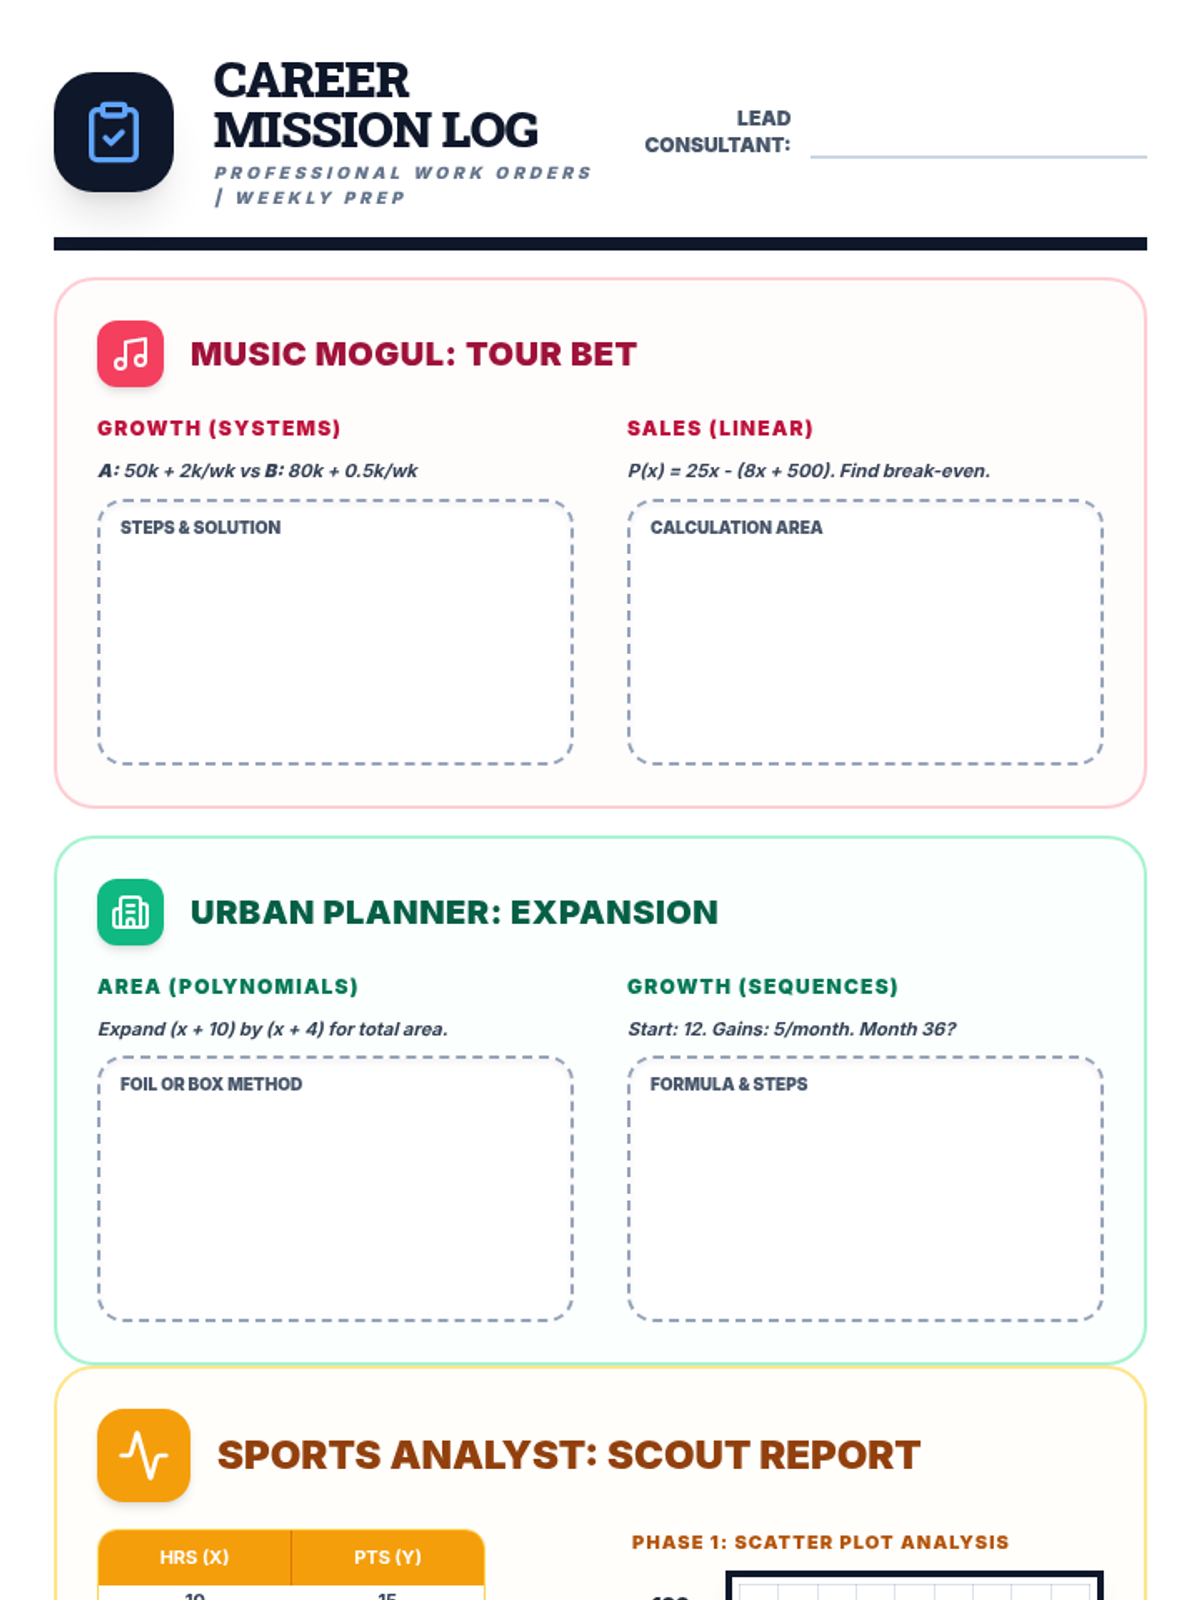
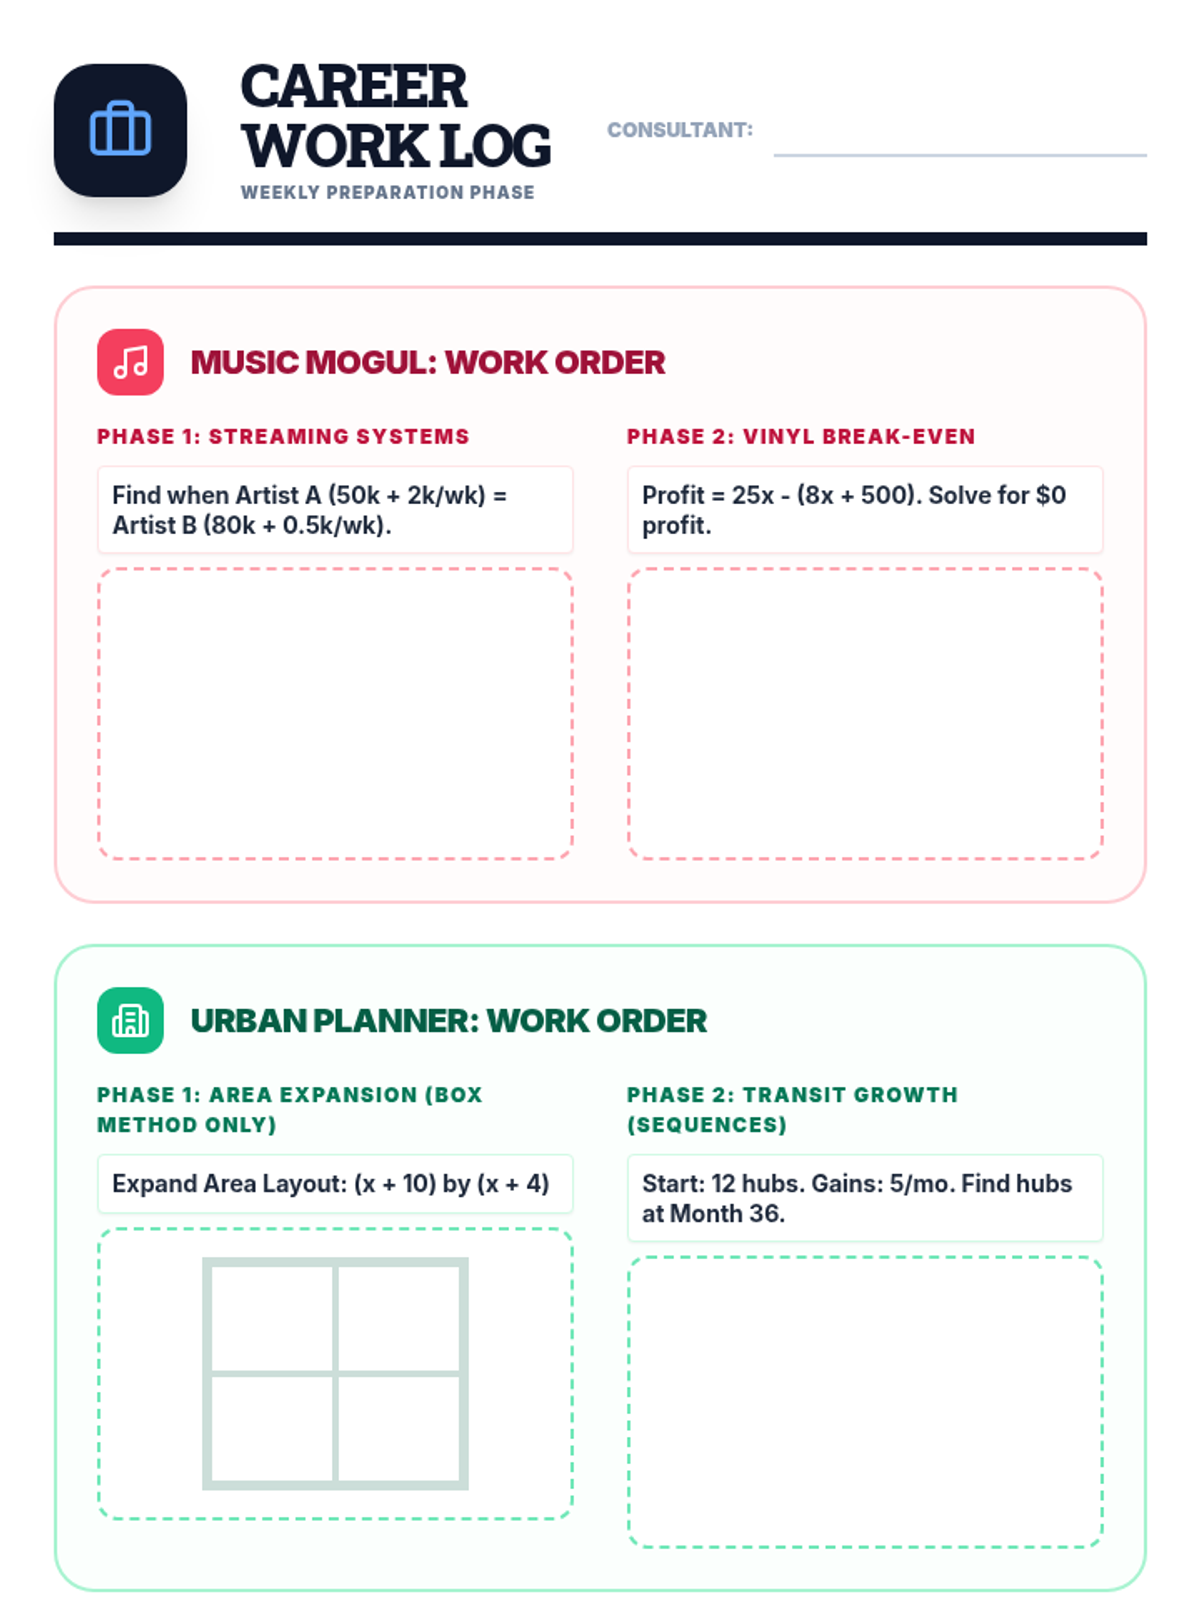
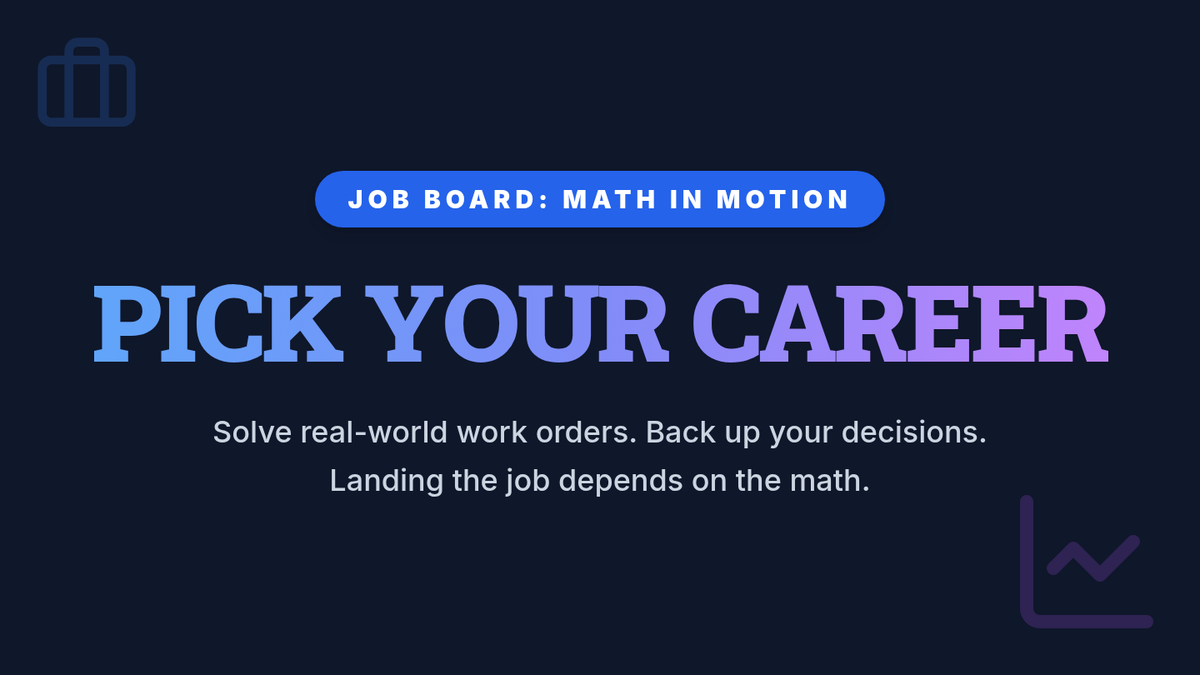
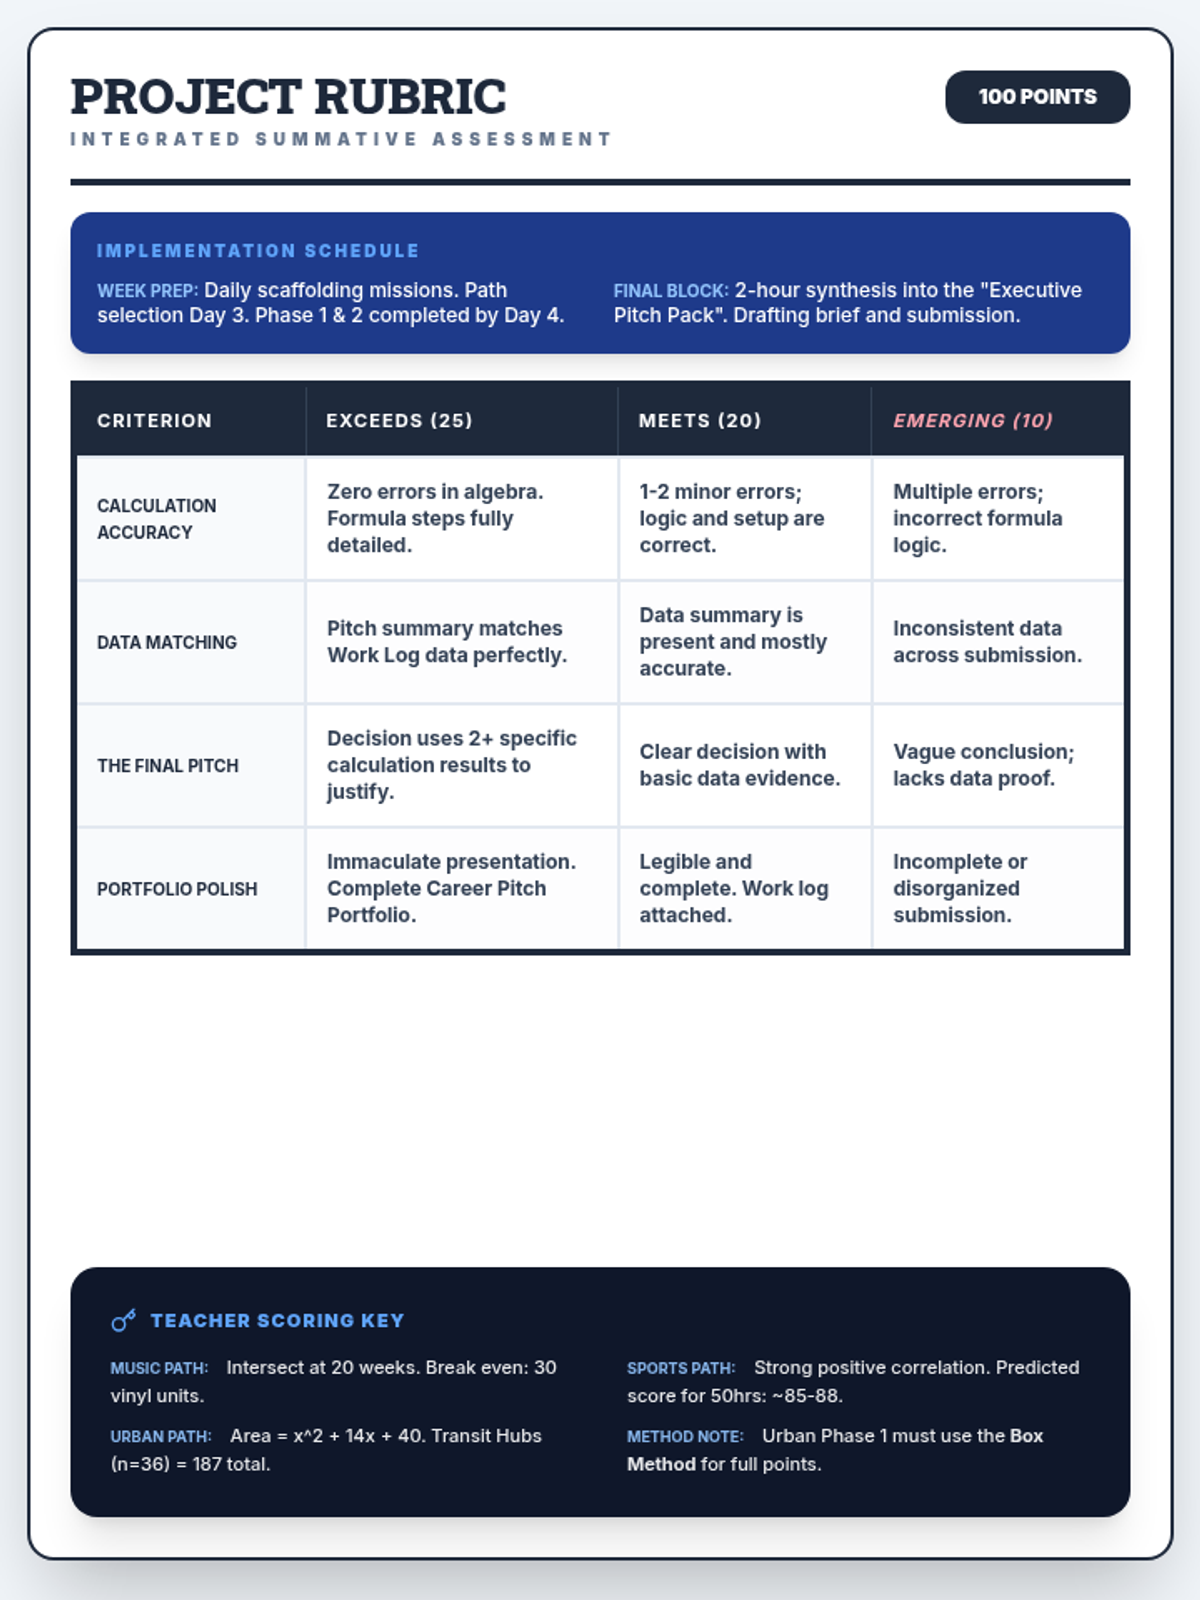
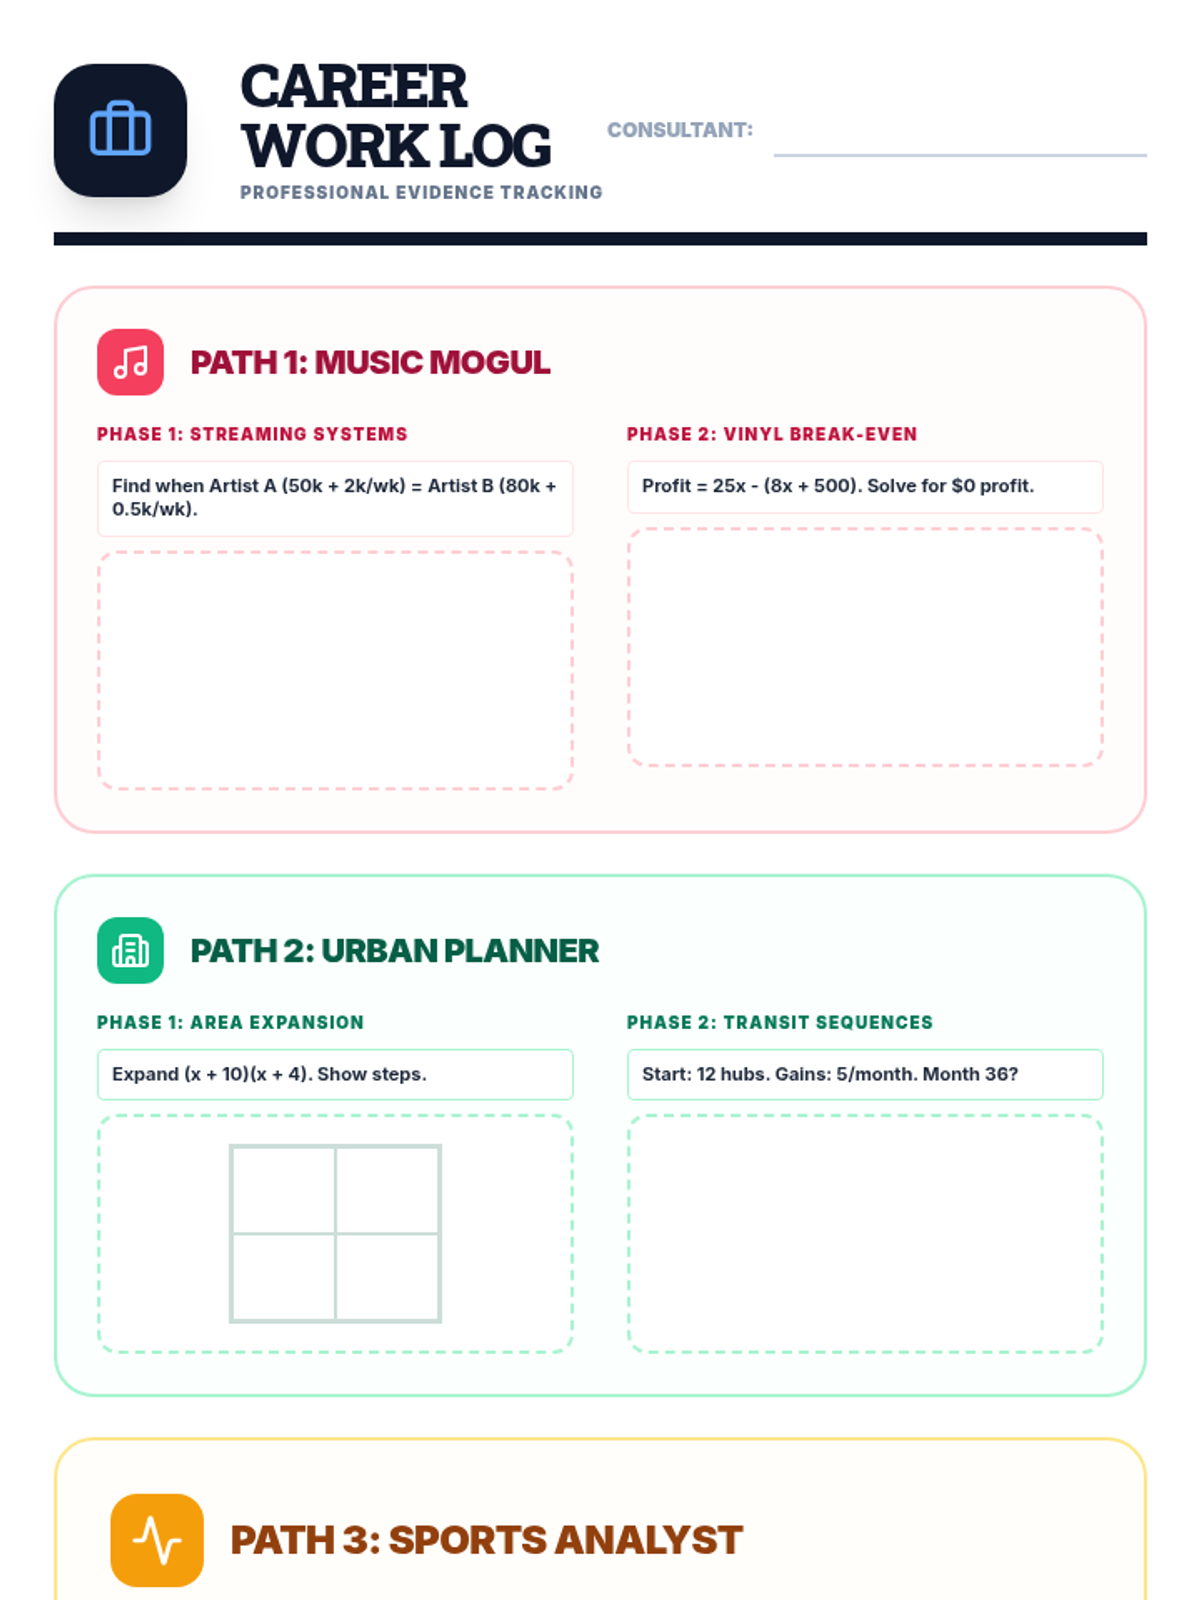
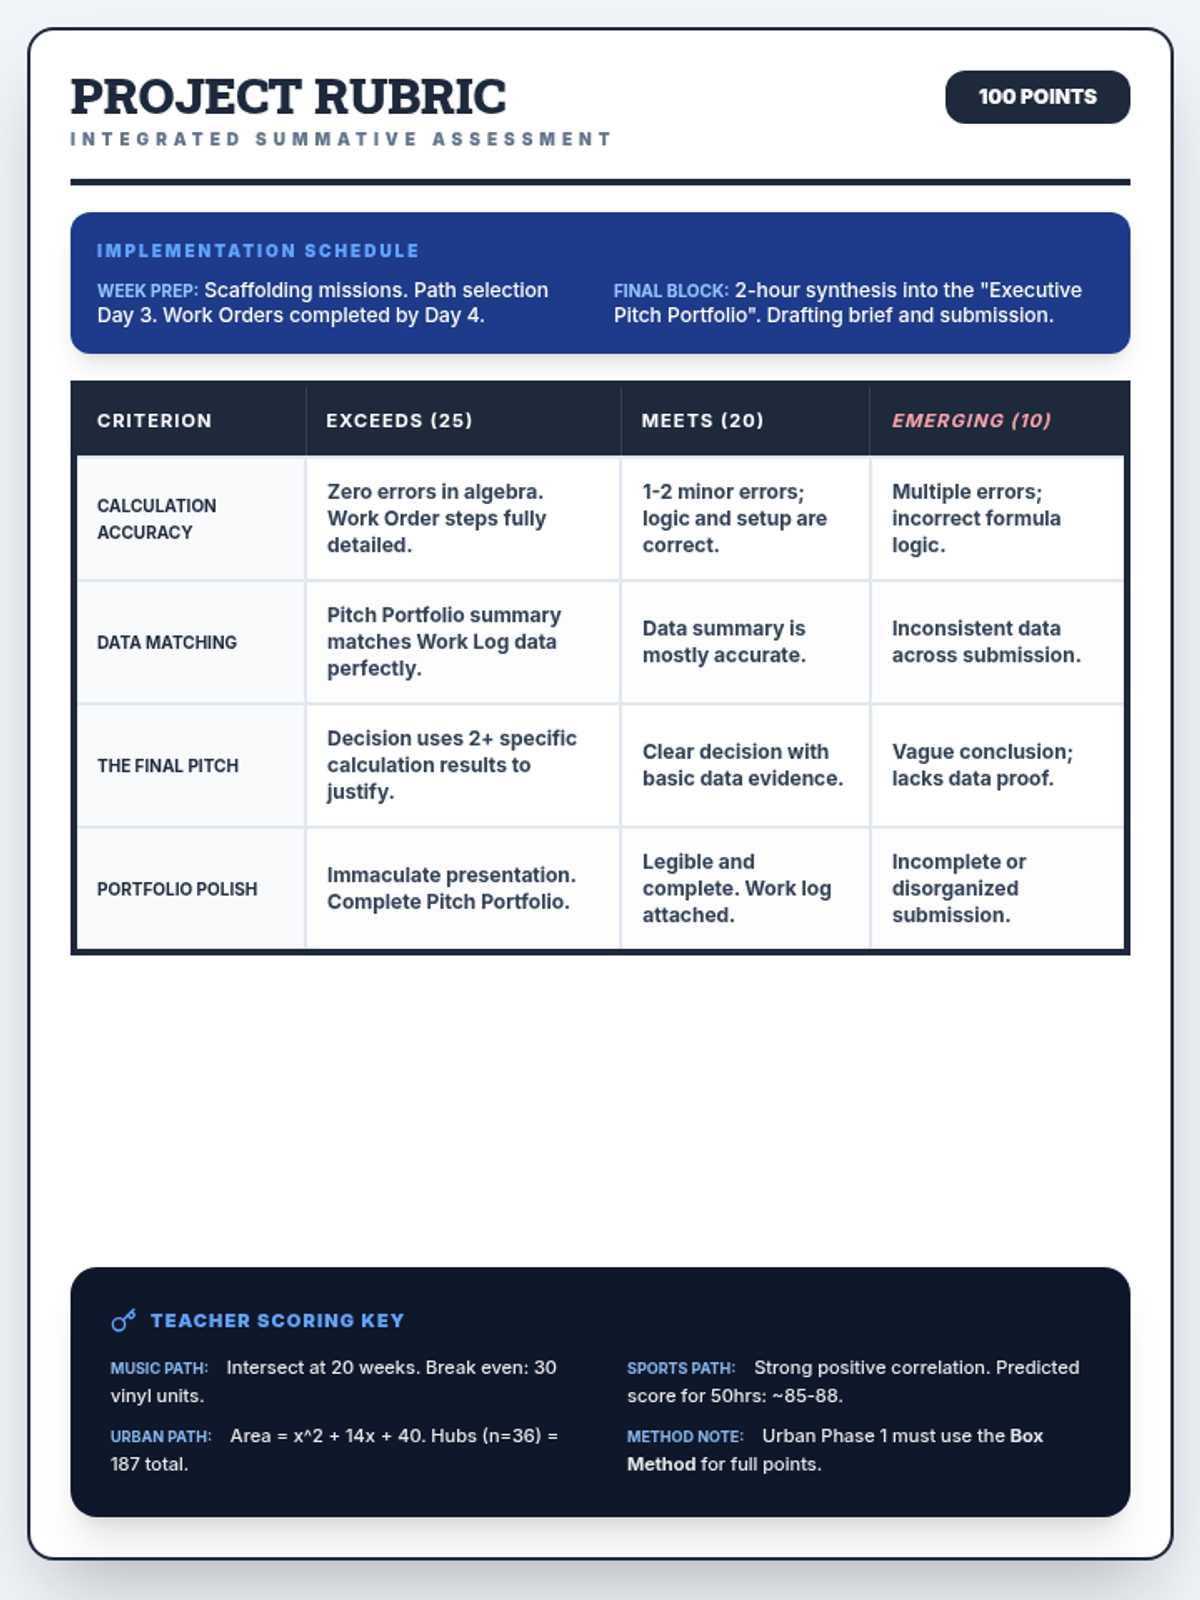
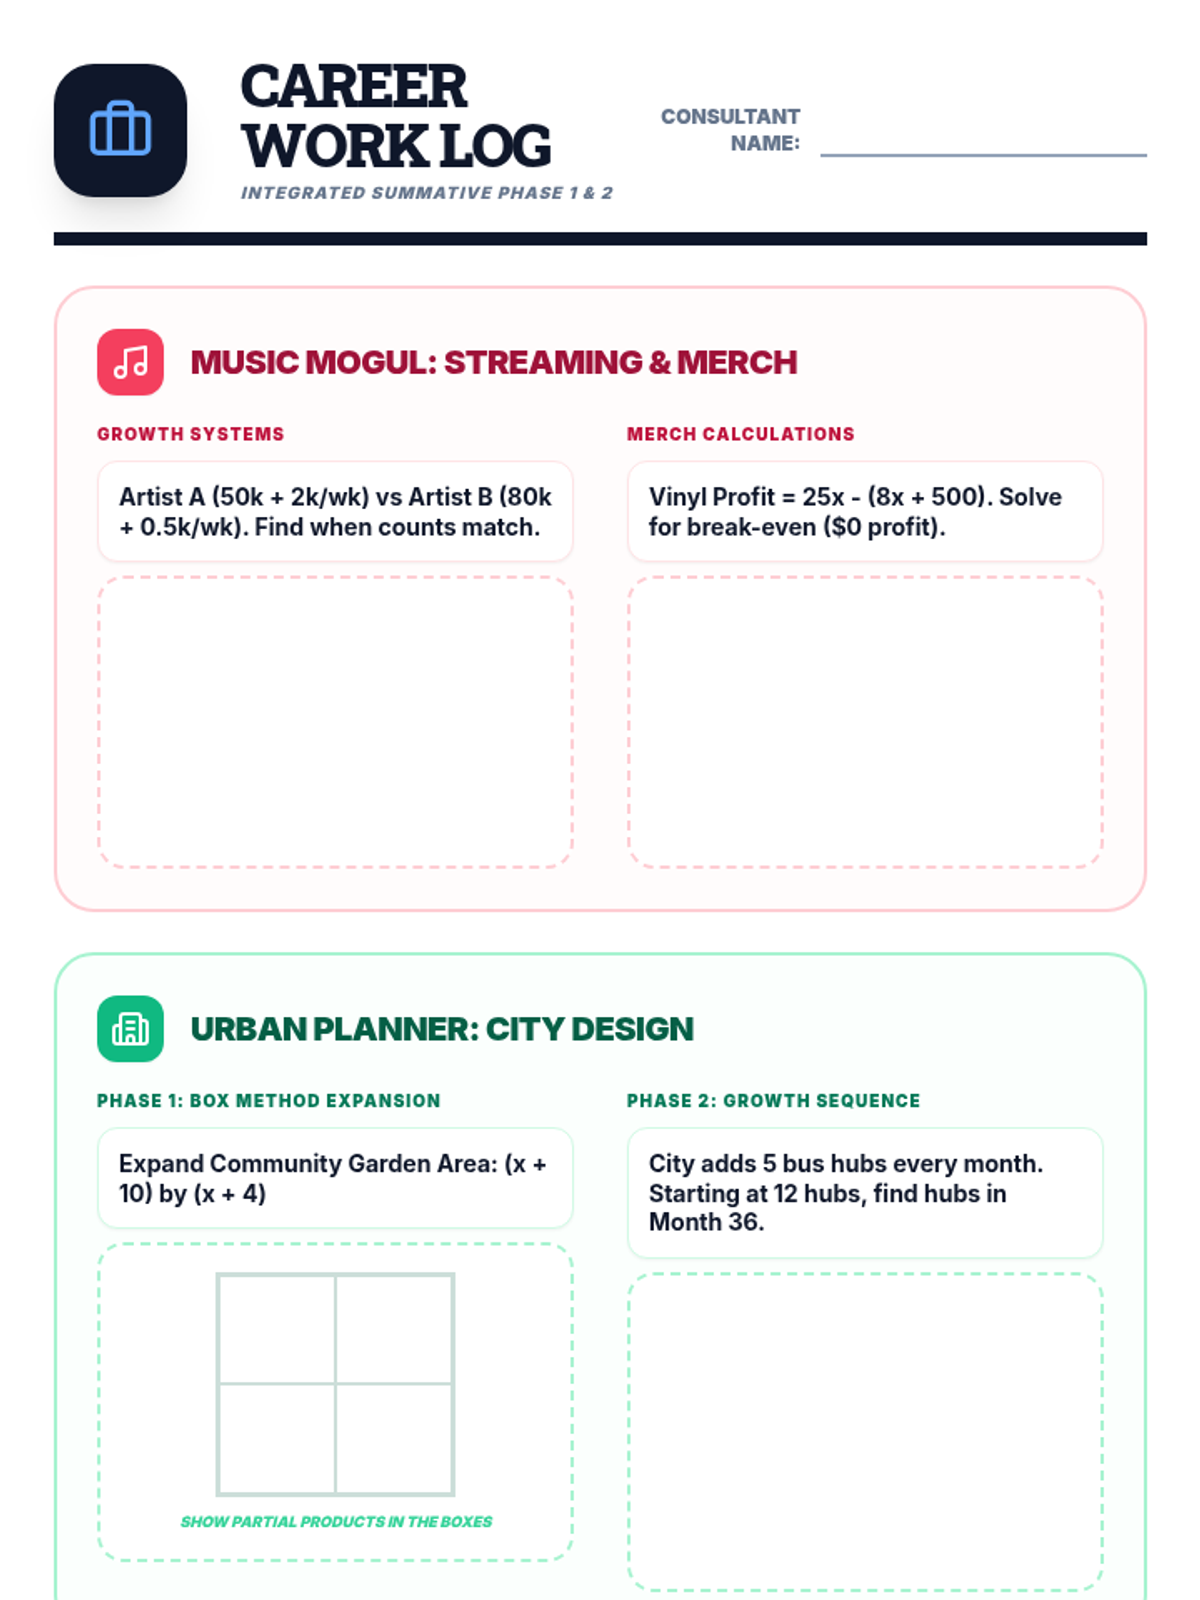
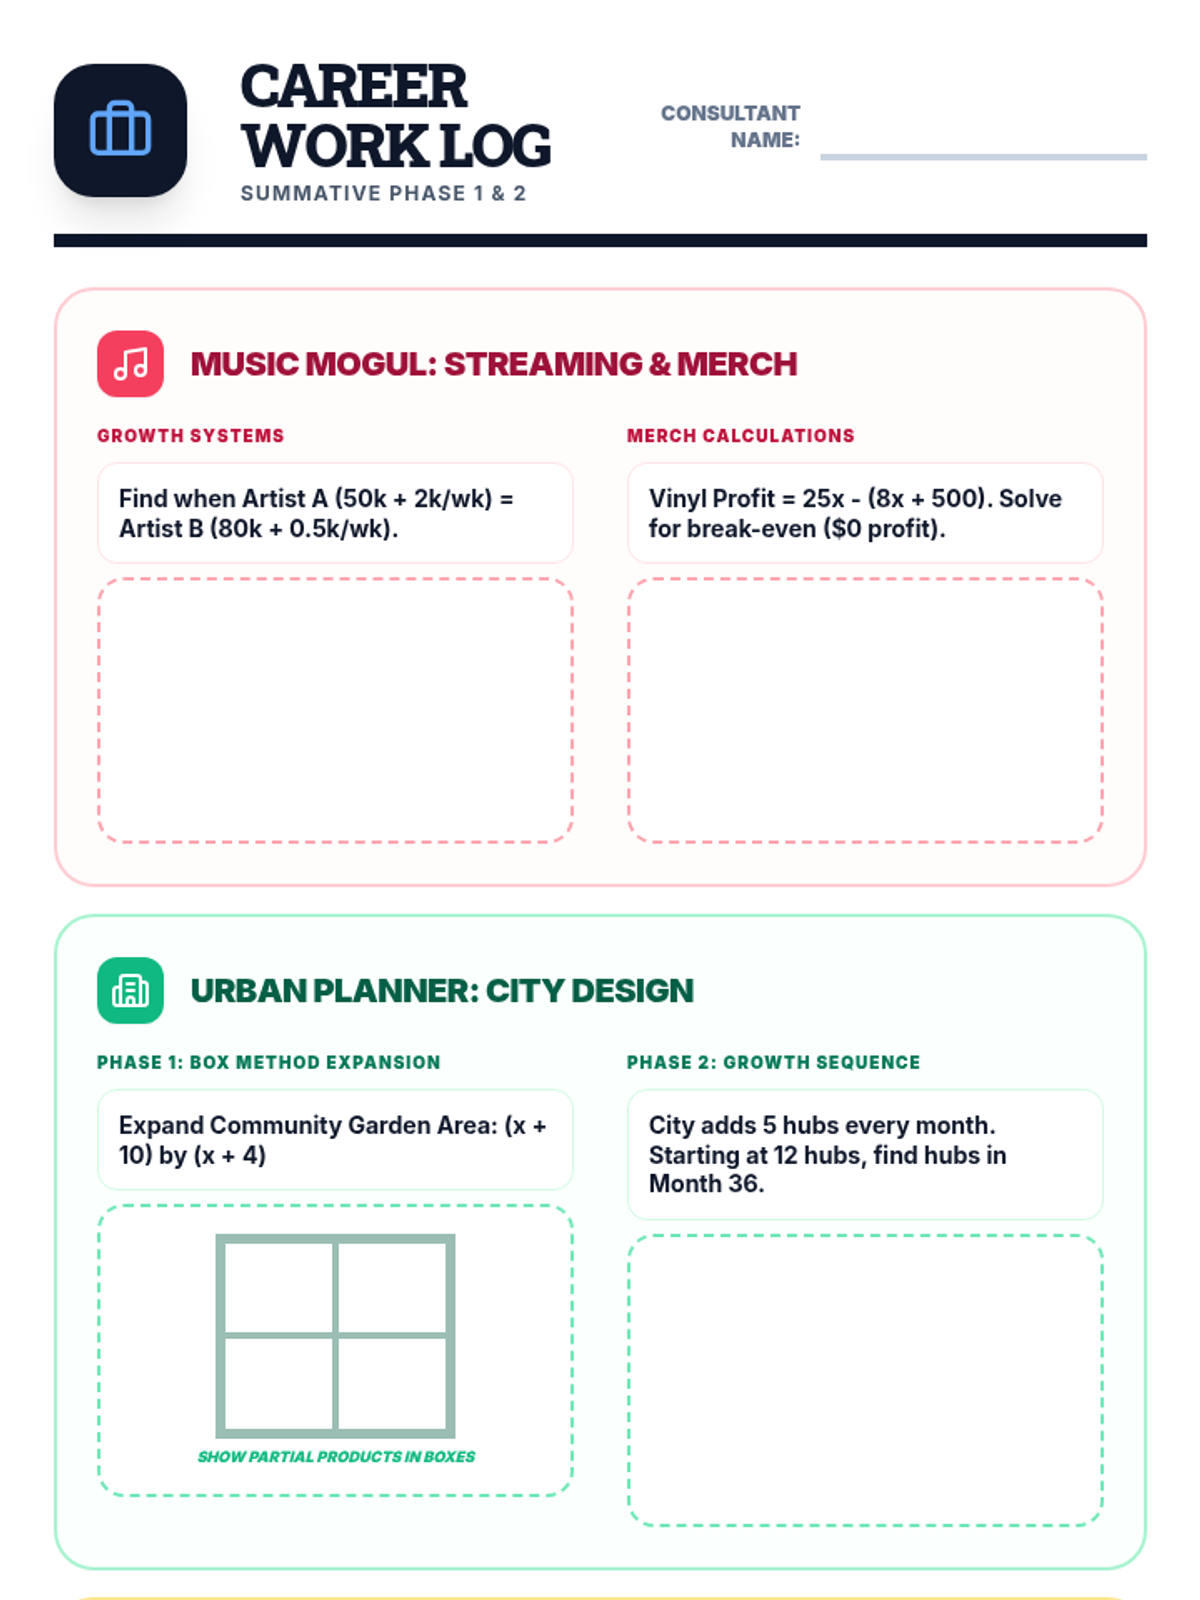
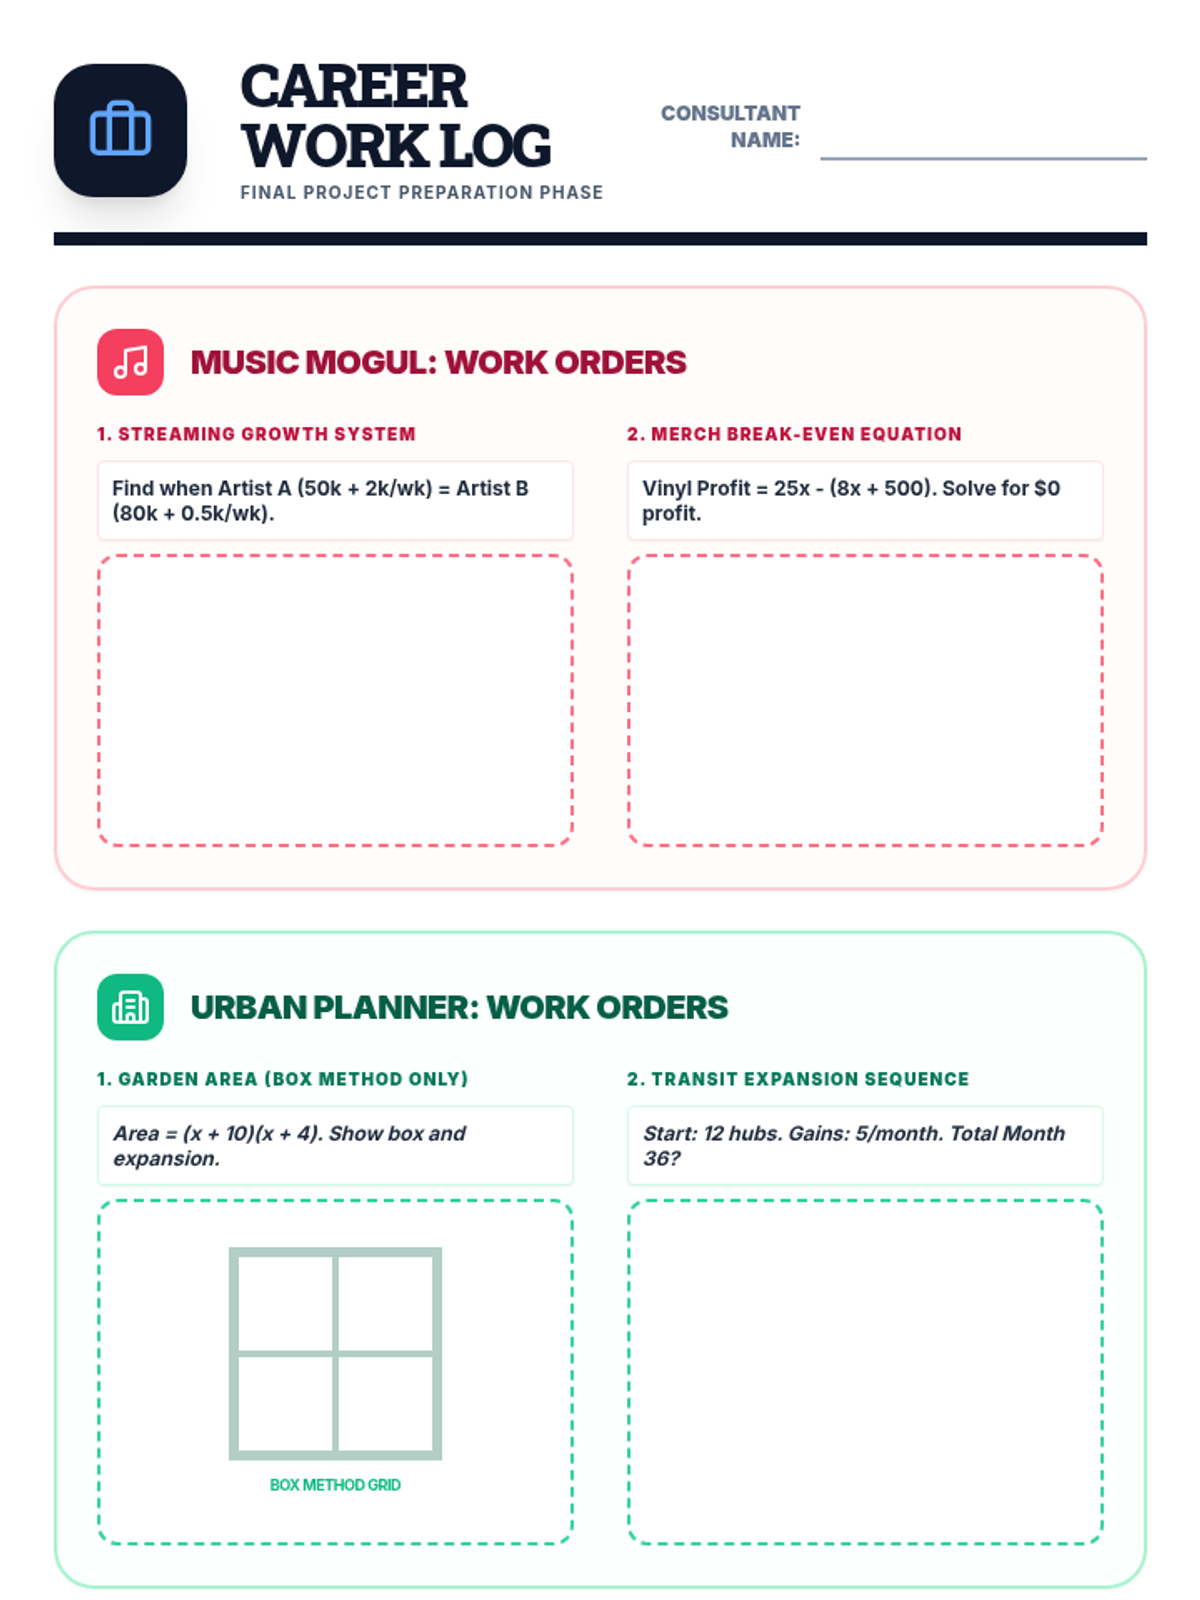
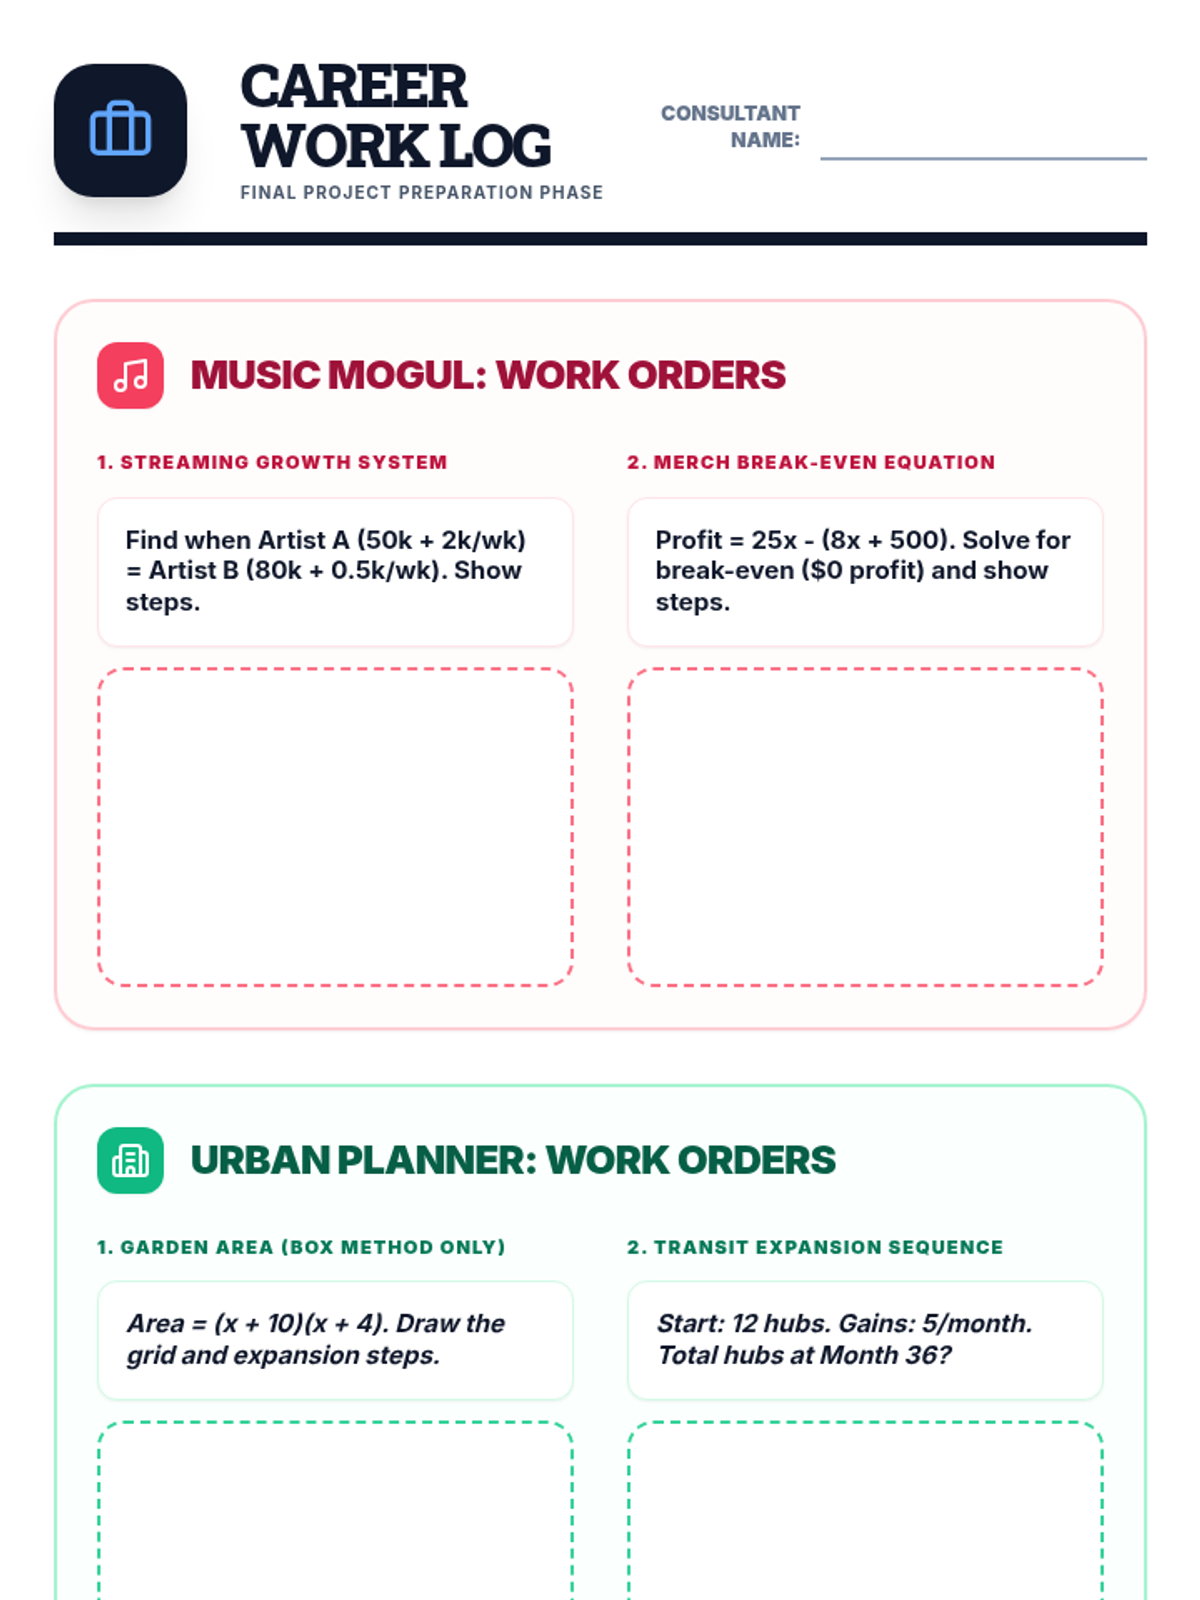
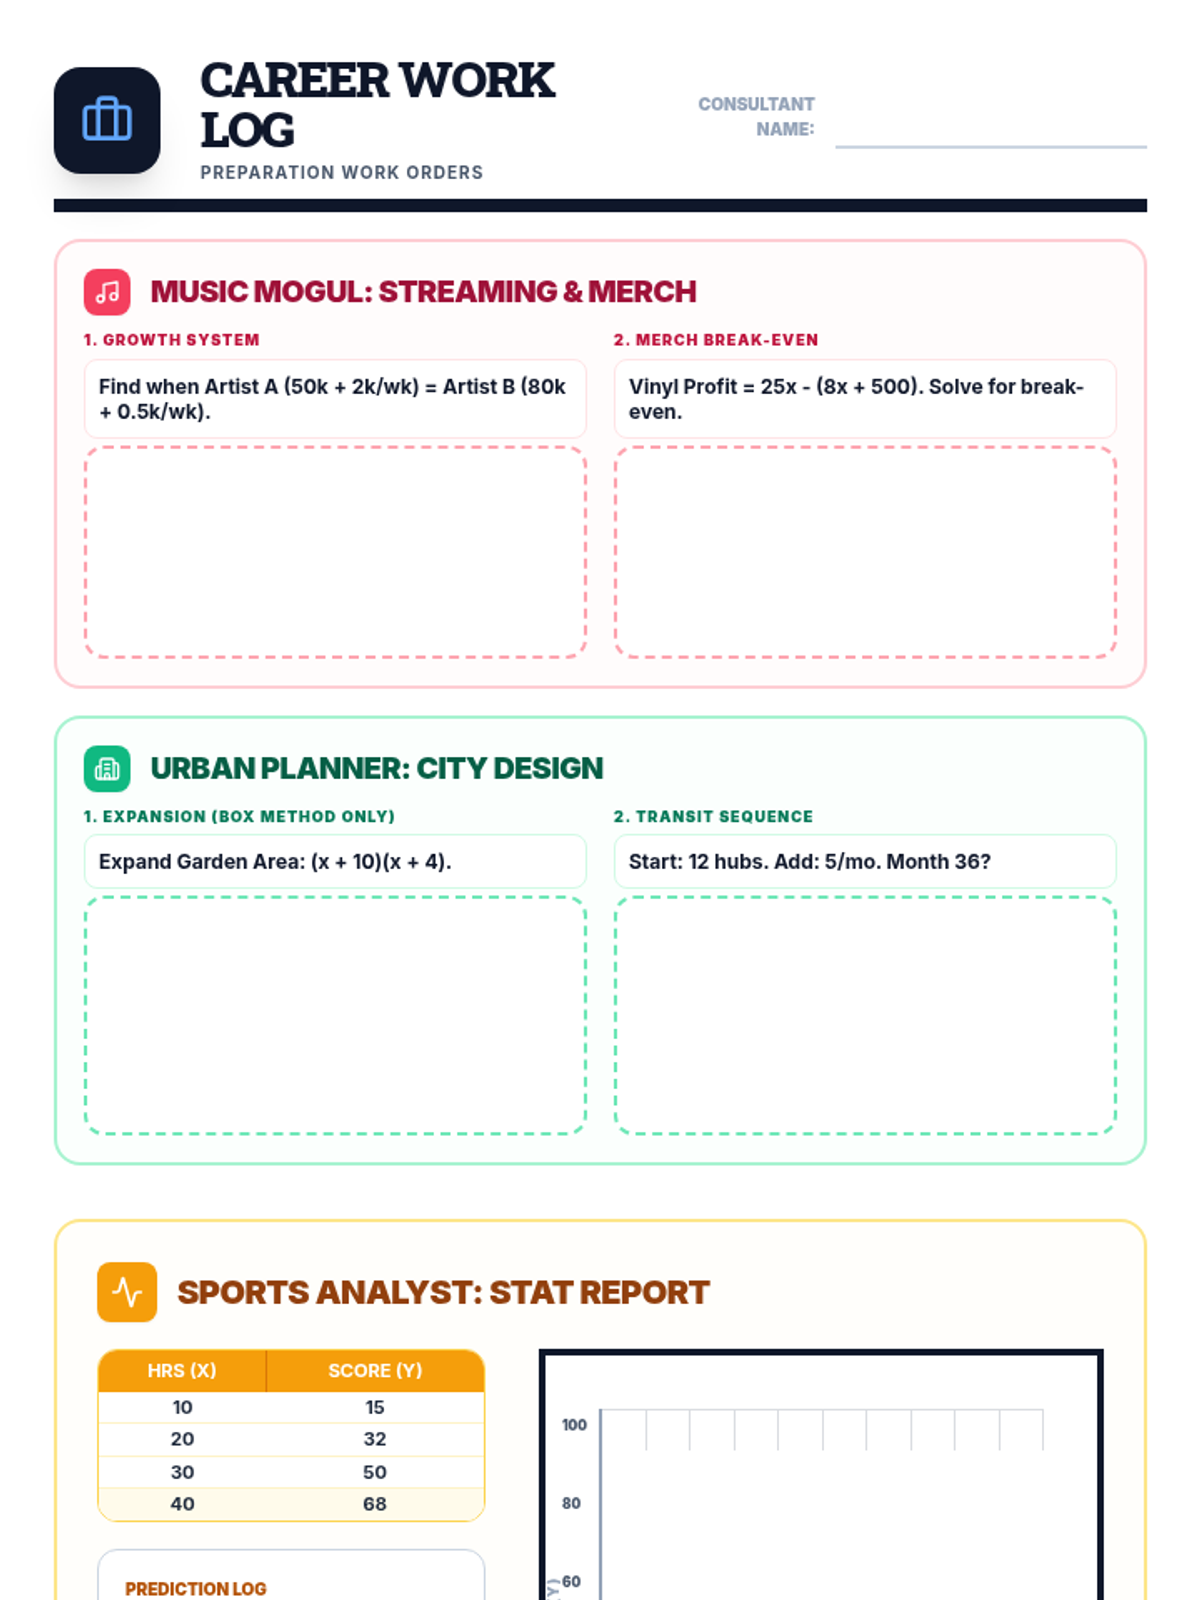
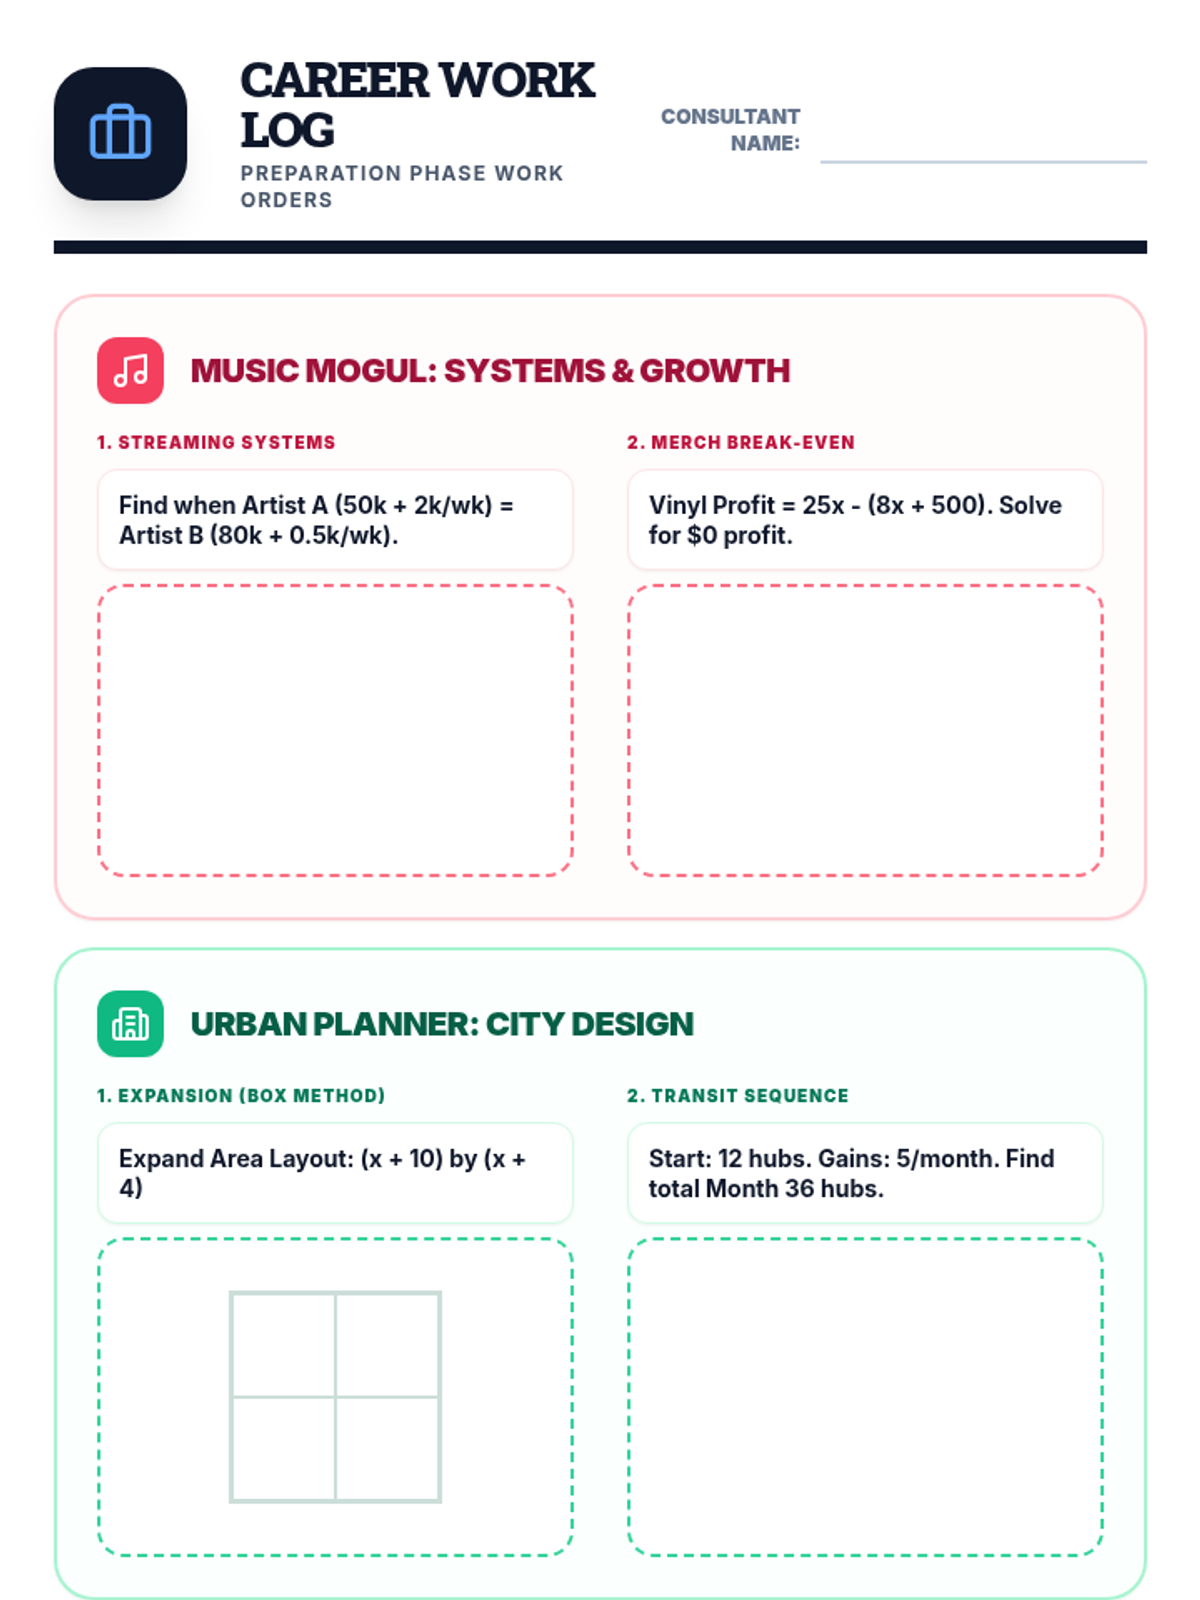
The final project phase where students select one of three real-world career paths (Music Mogul, Urban Planner, or Sports Analyst) to apply their mathematical knowledge in a summative assessment.
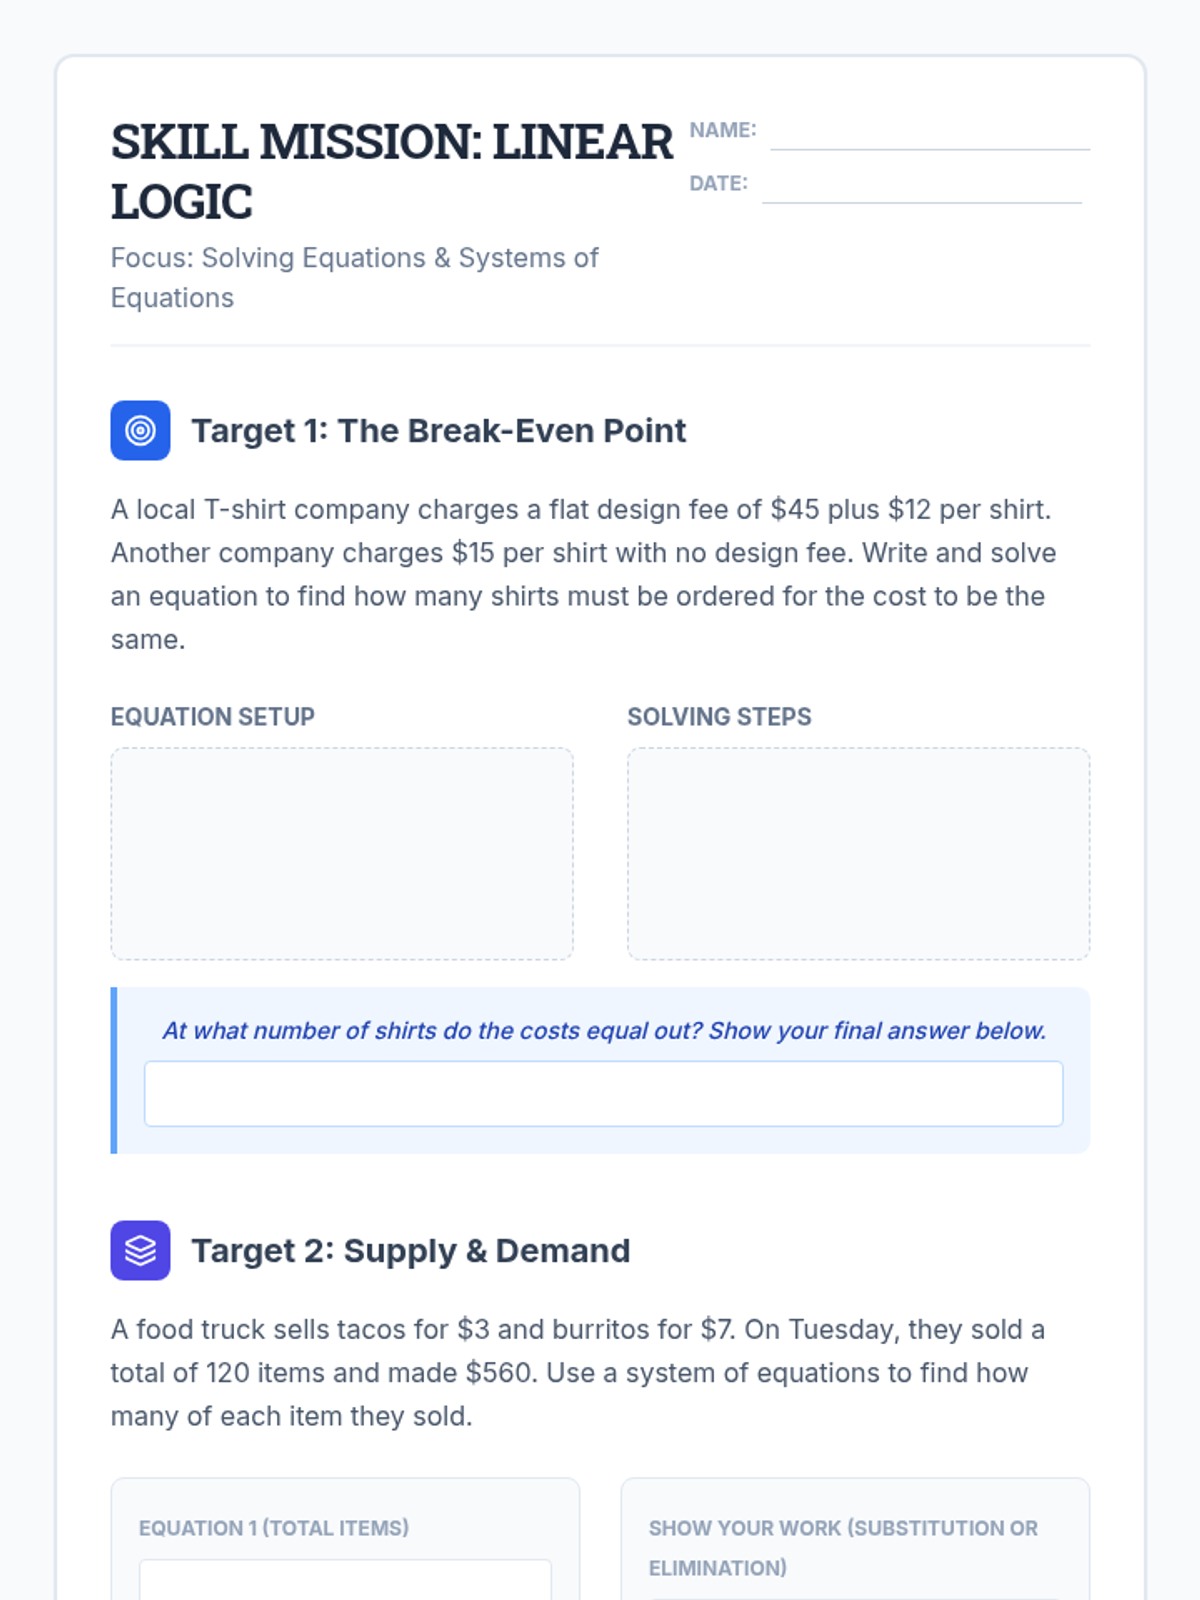
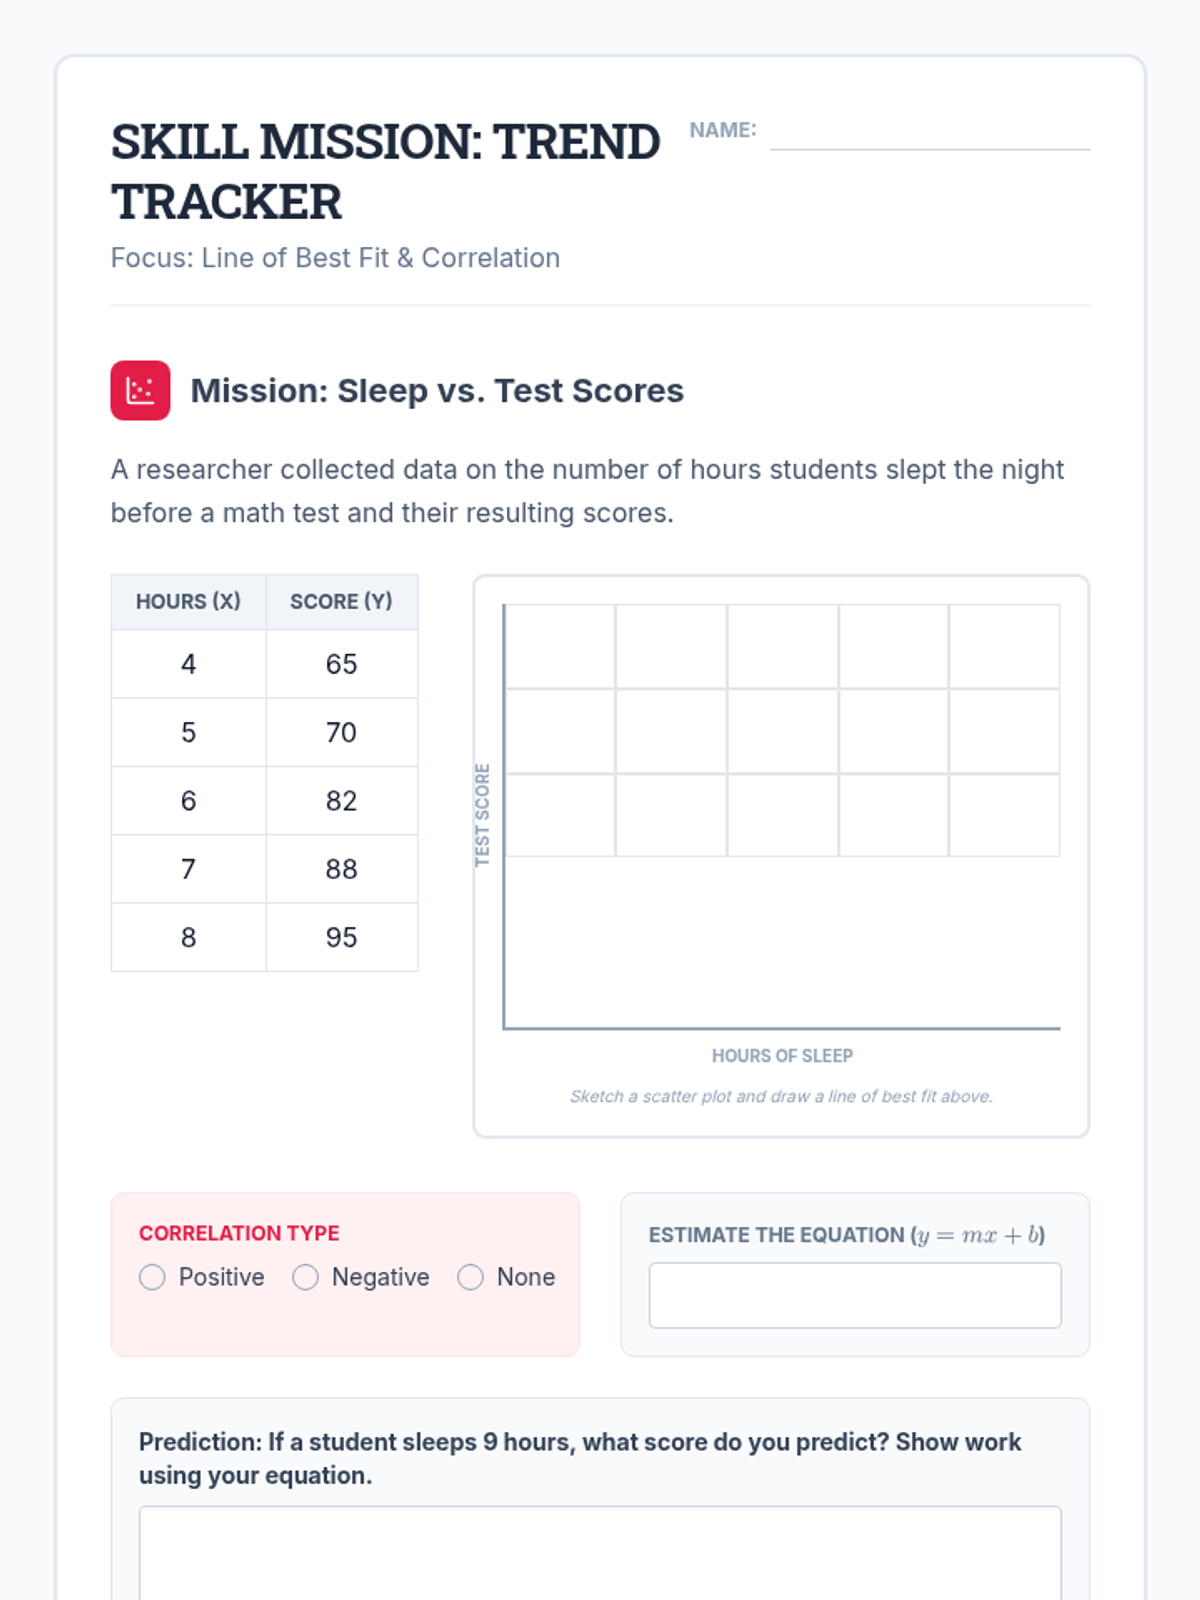
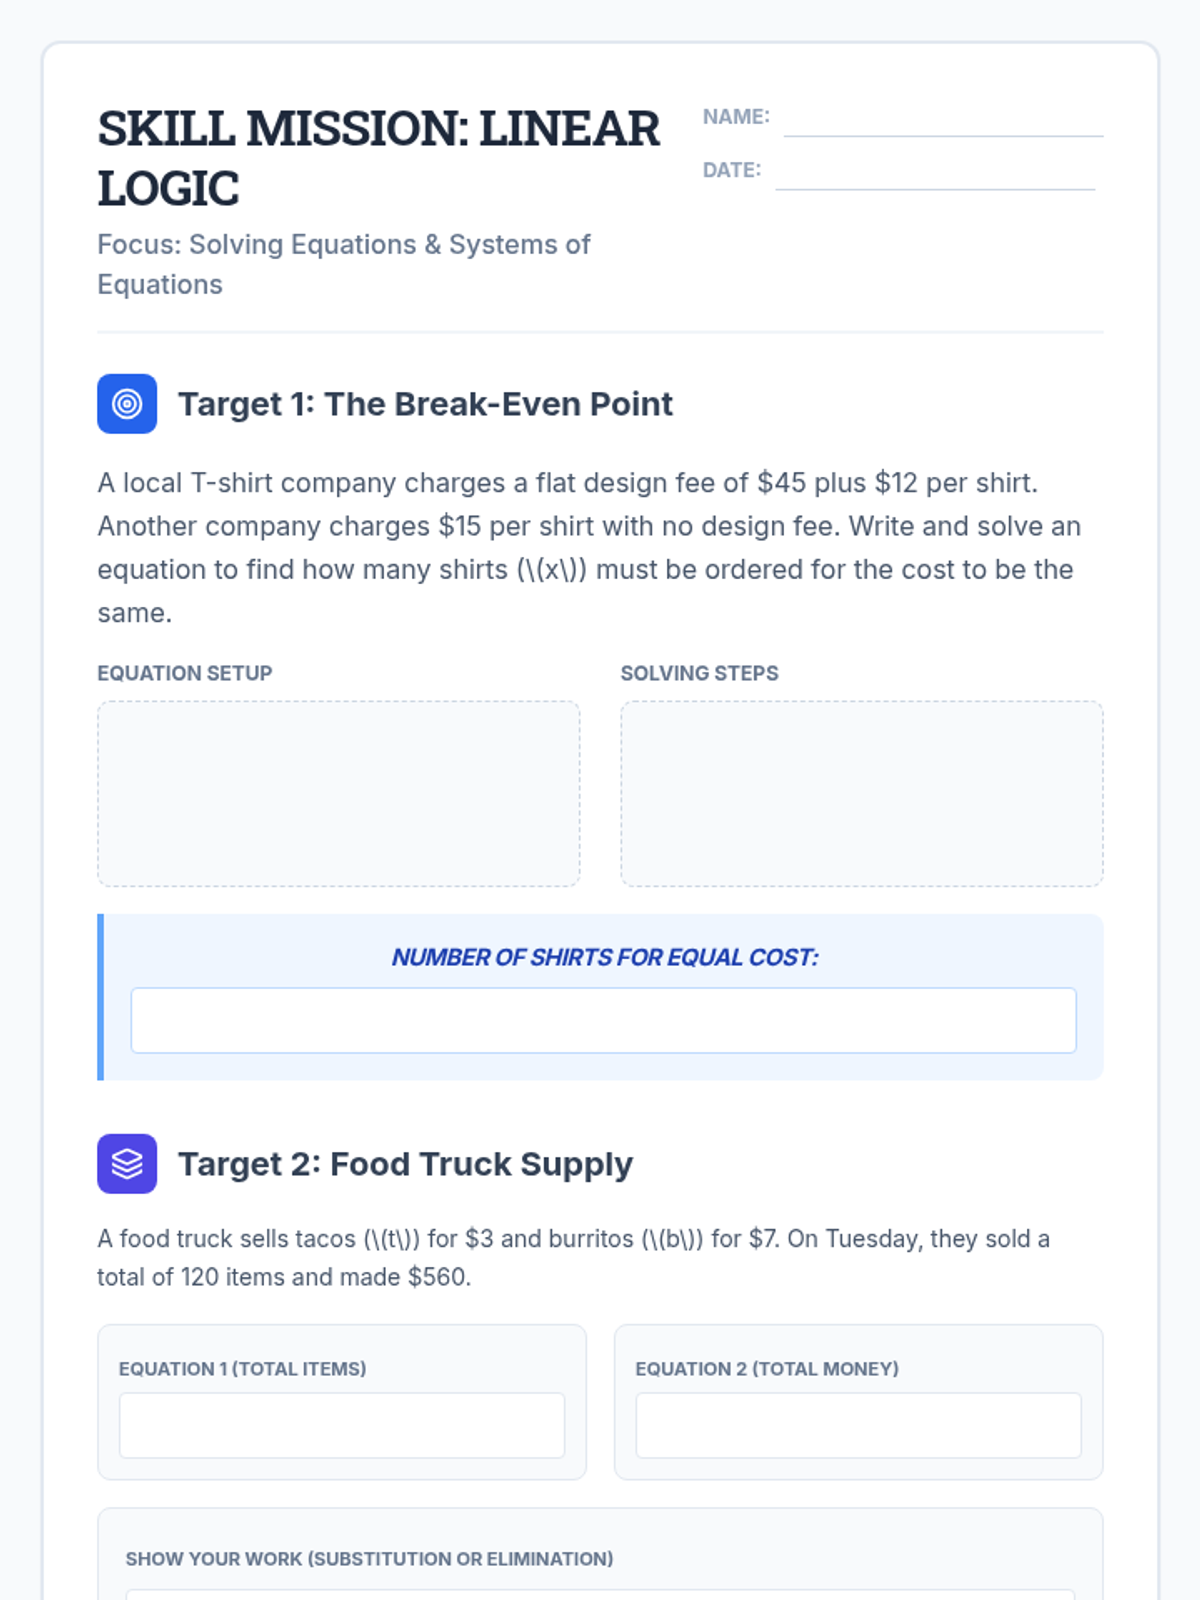
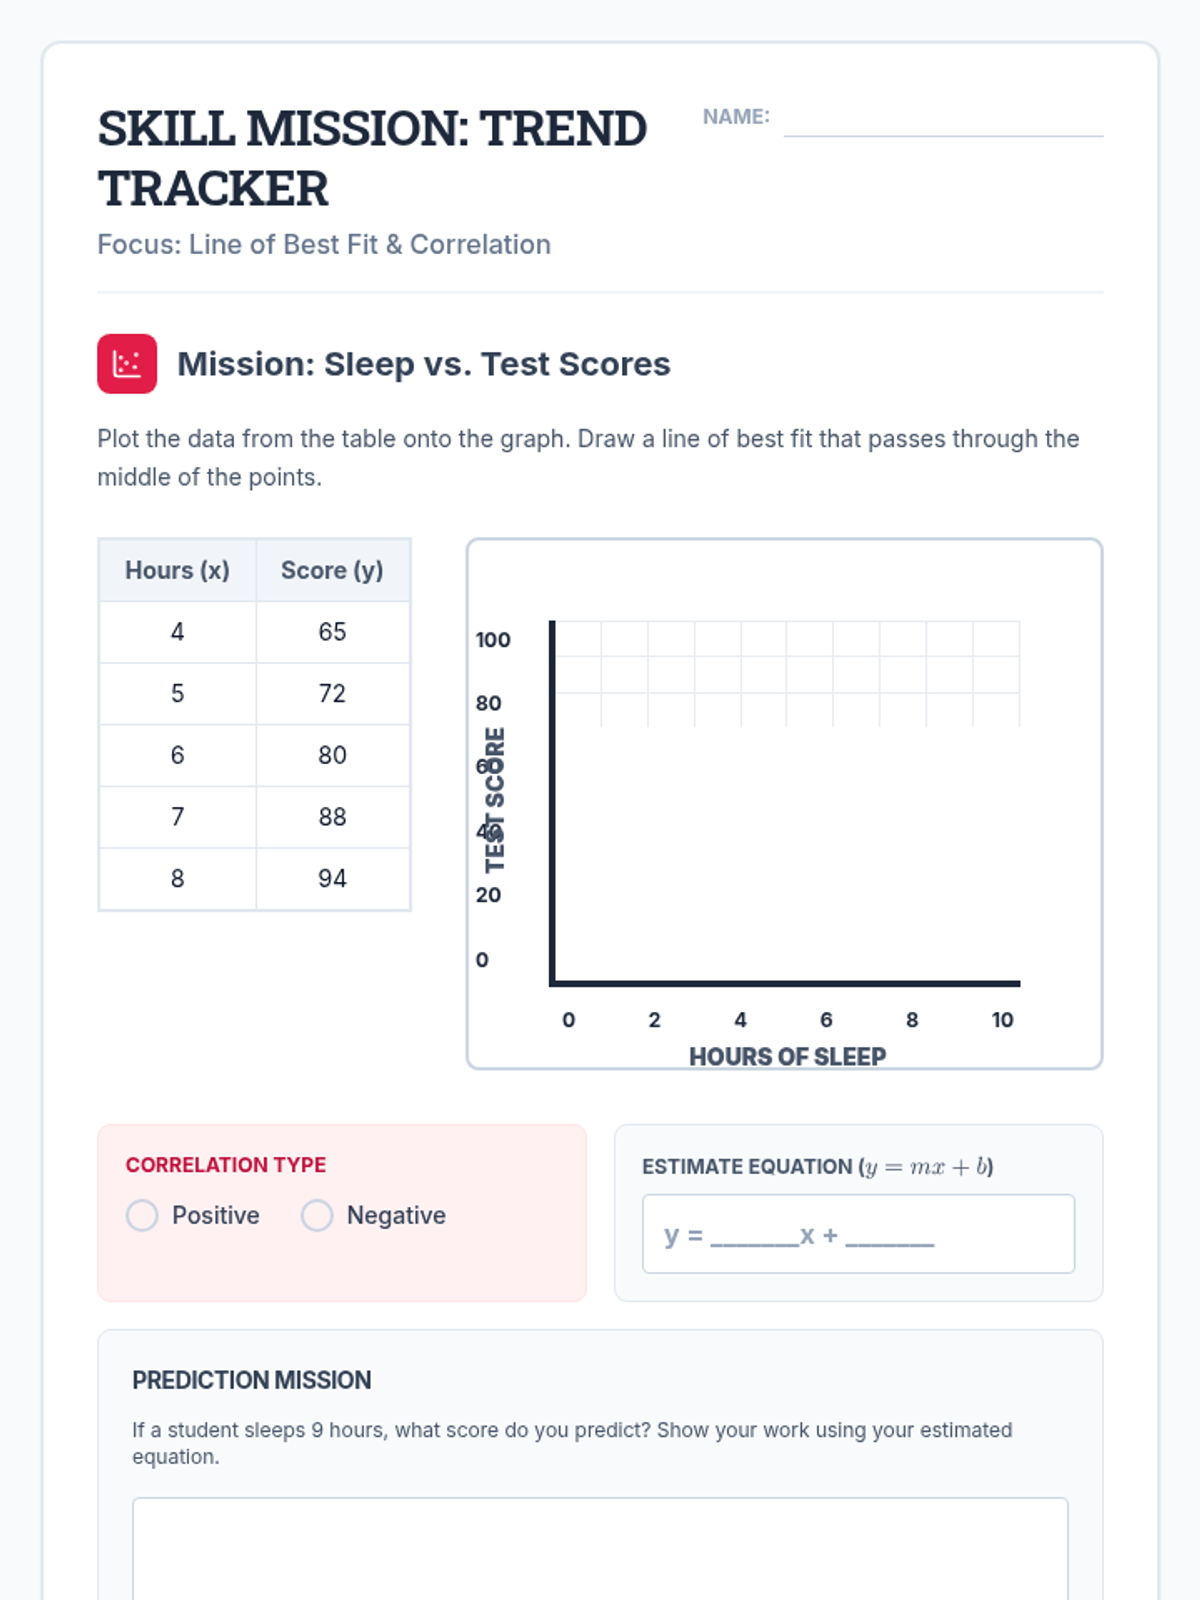
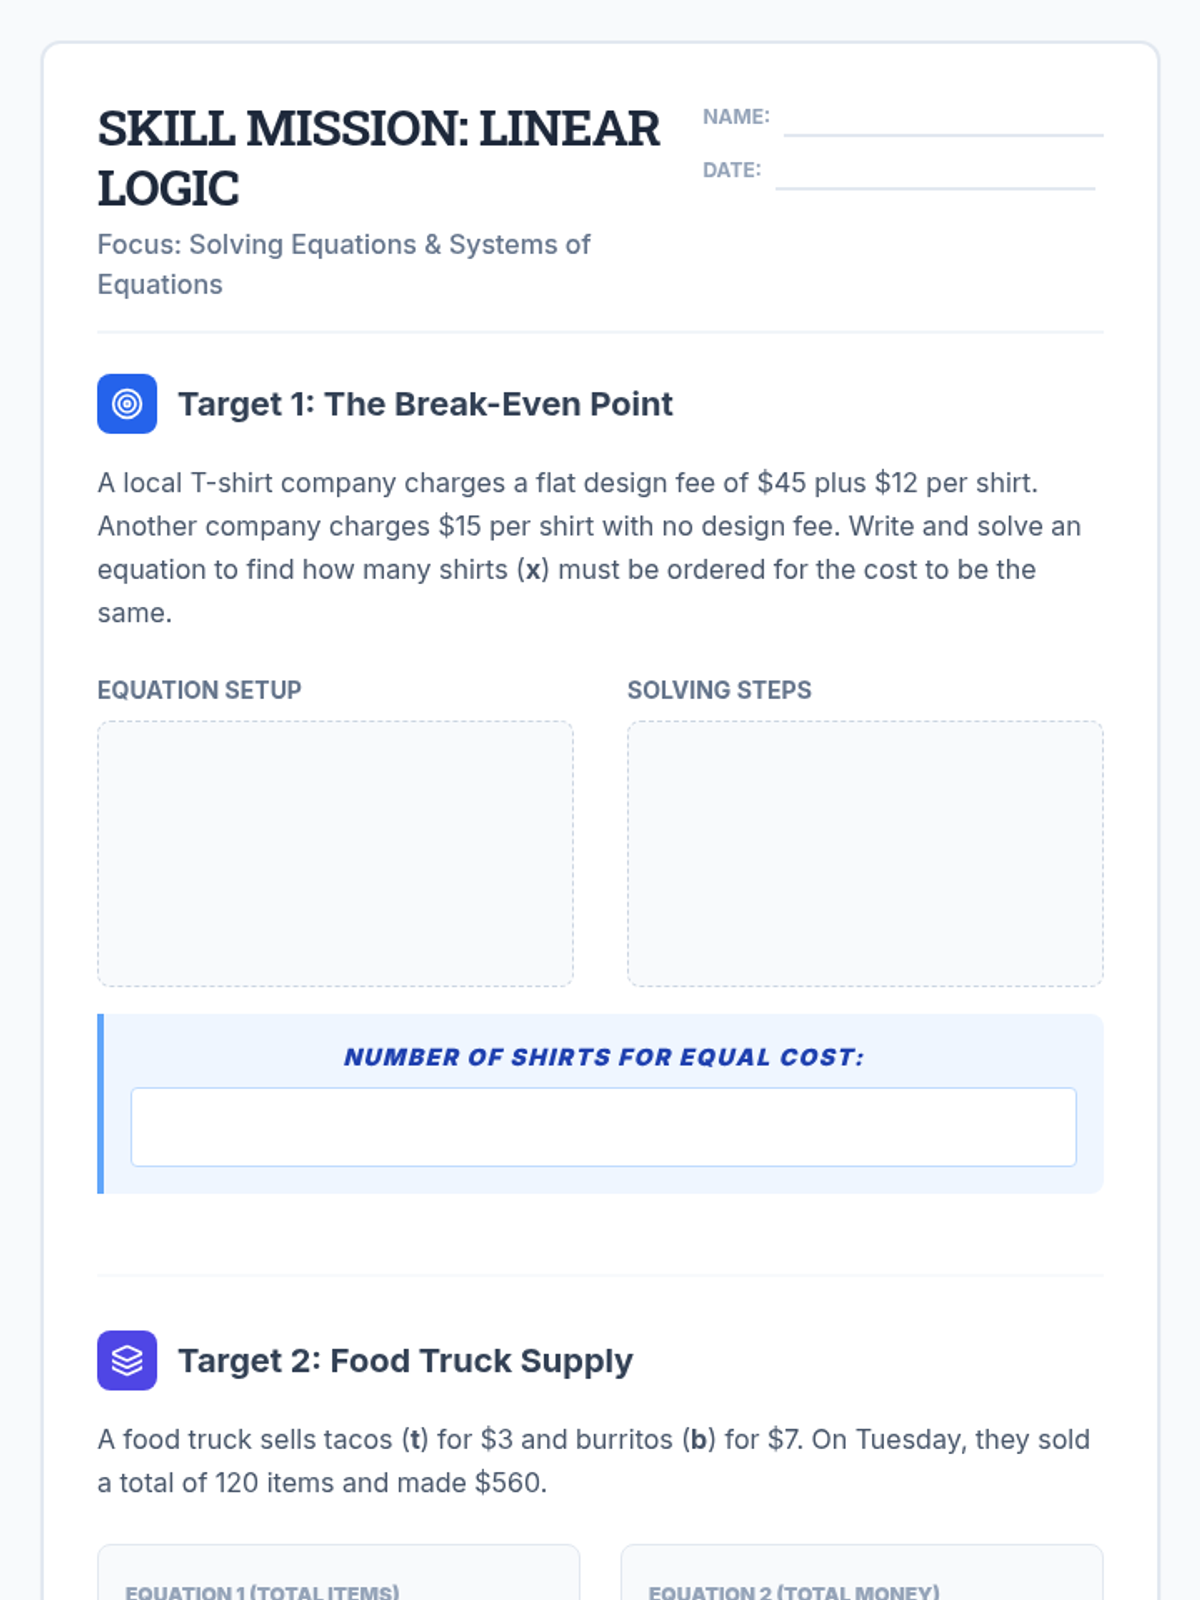
Scaffolded practice activities ('Skill Missions') that review key concepts: linear equations, systems, sequences, lines of best fit, and factoring. These activities ensure students have the foundational skills needed for their final project.
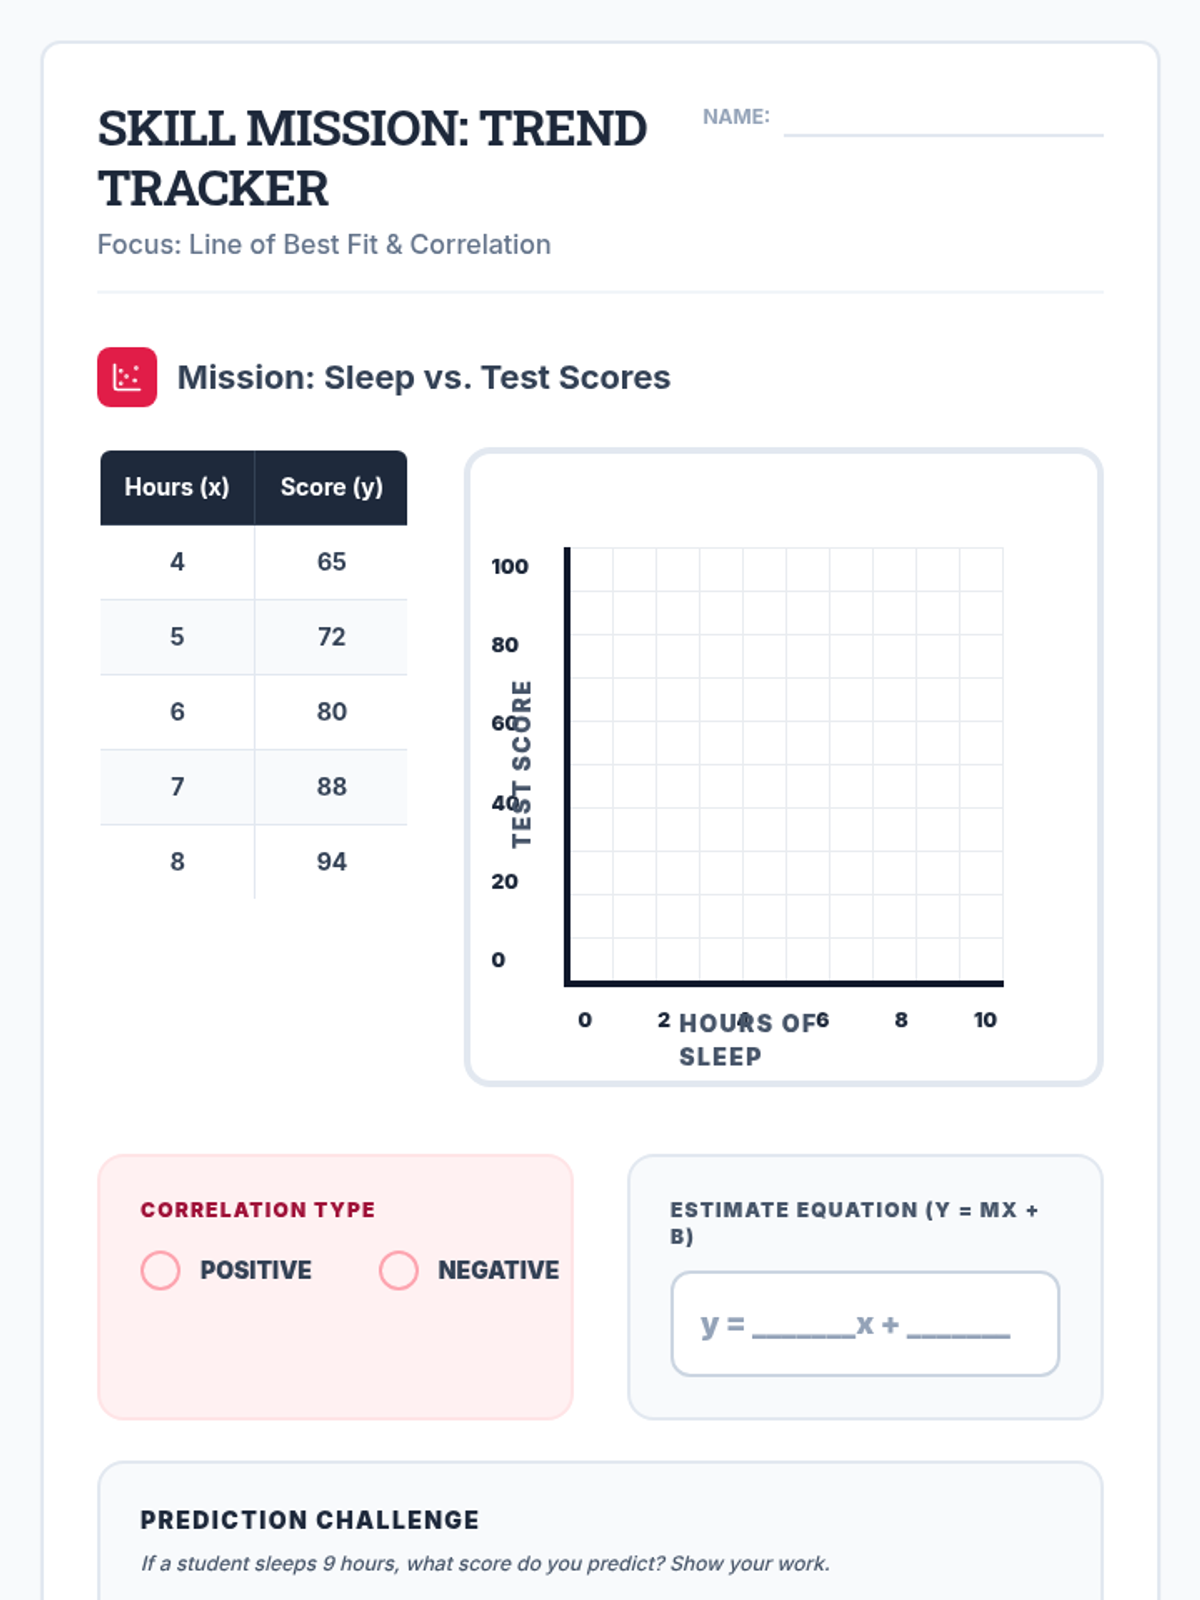
An 8th grade Algebra lesson focused on interpreting slope and y-intercept in the context of scatter plots and lines of best fit, specifically designed for Special Education students with IEP supports.
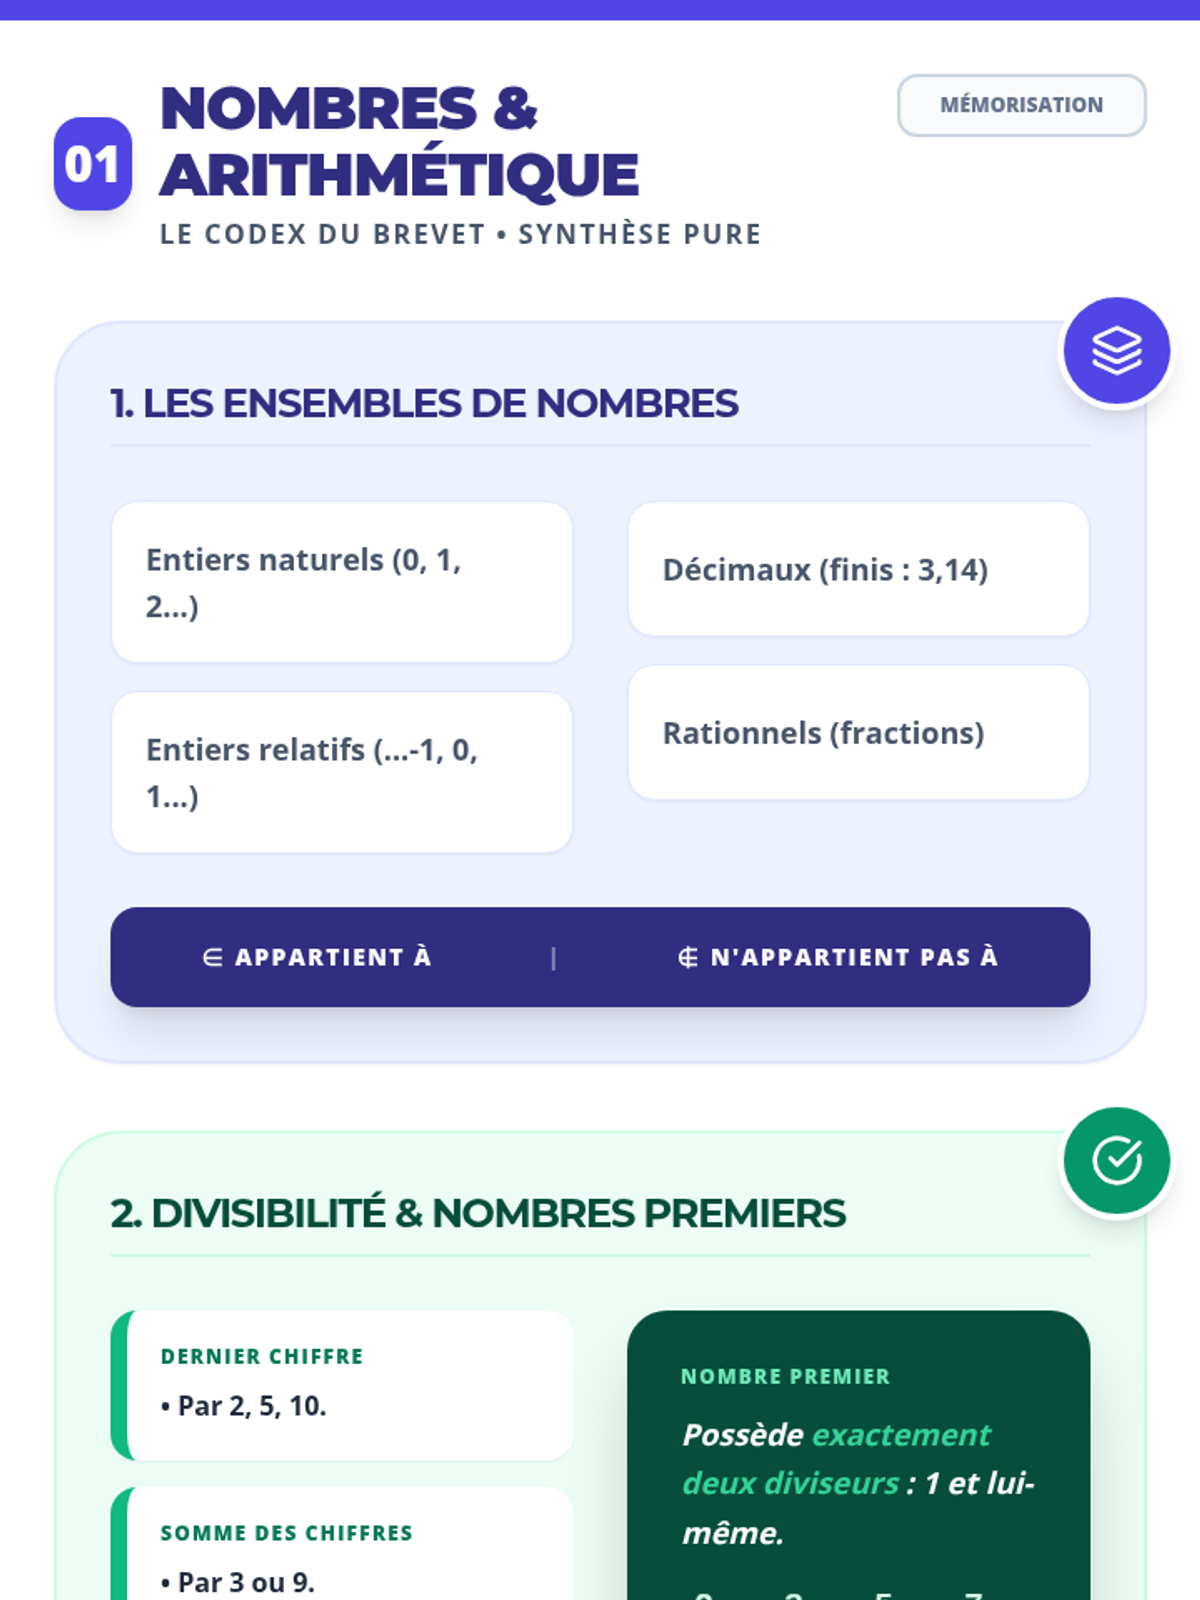
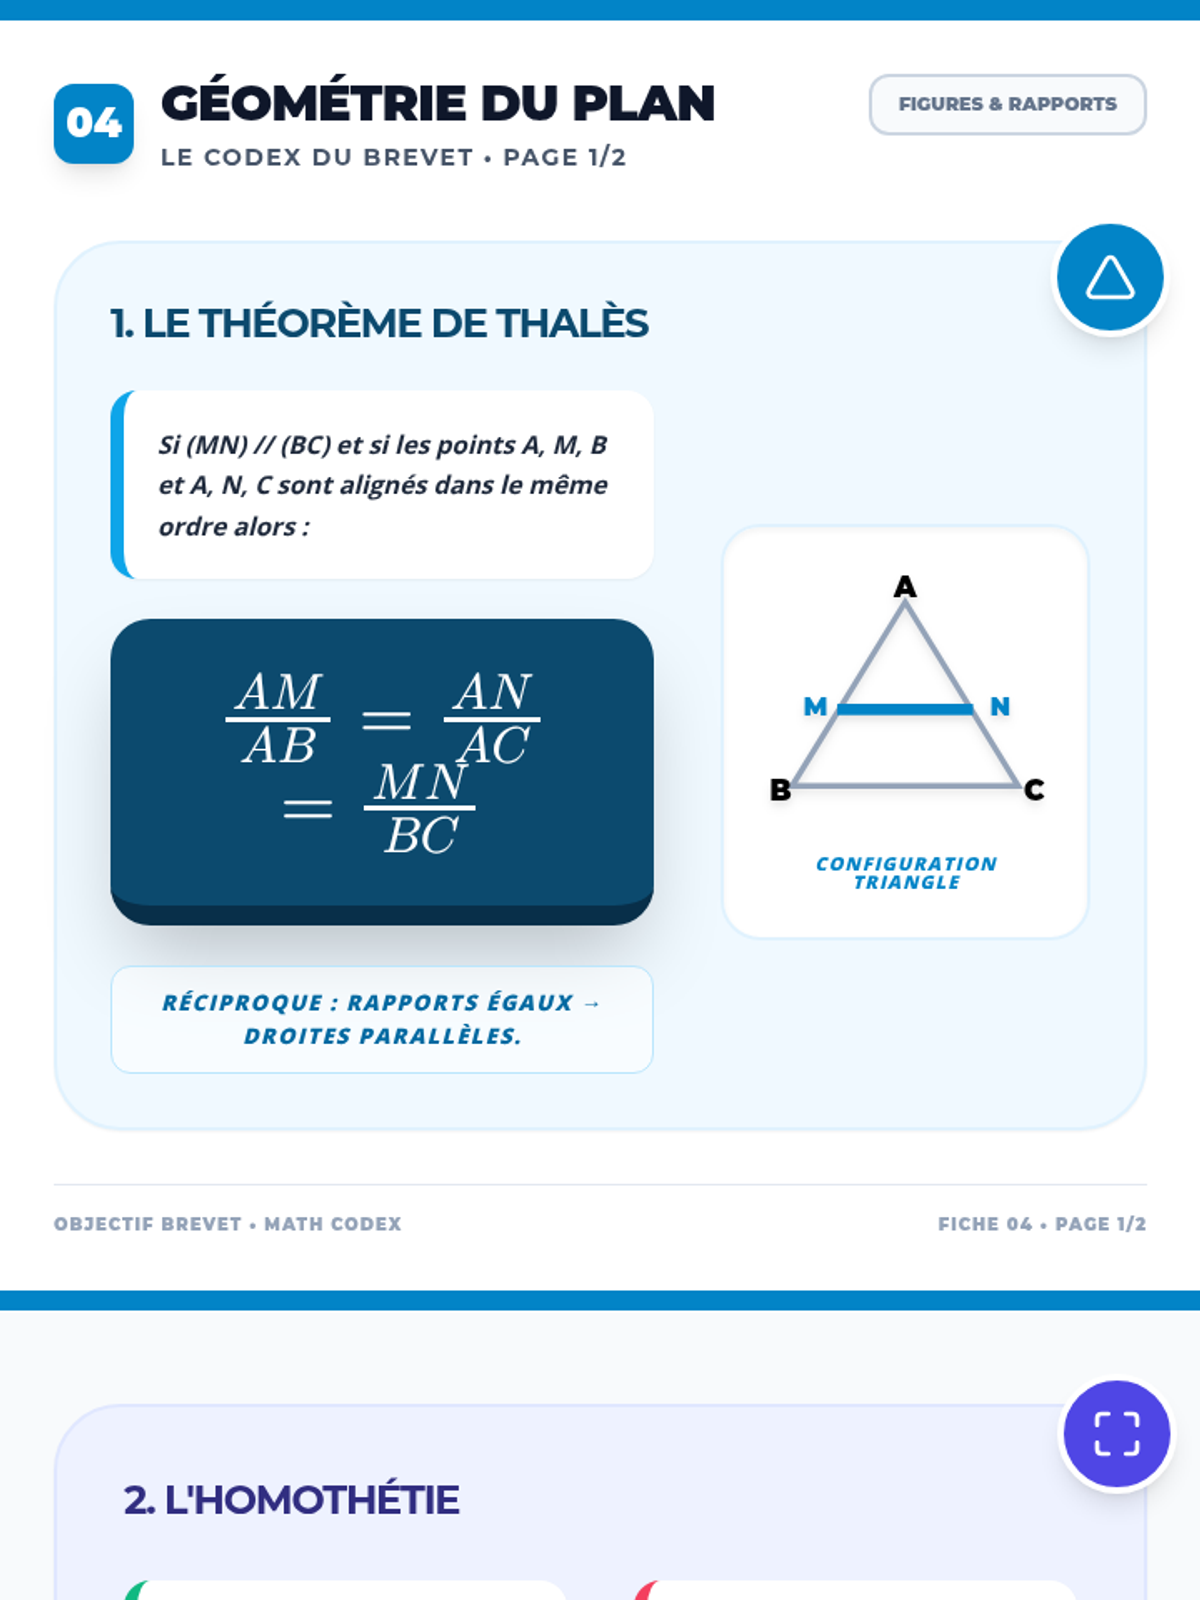
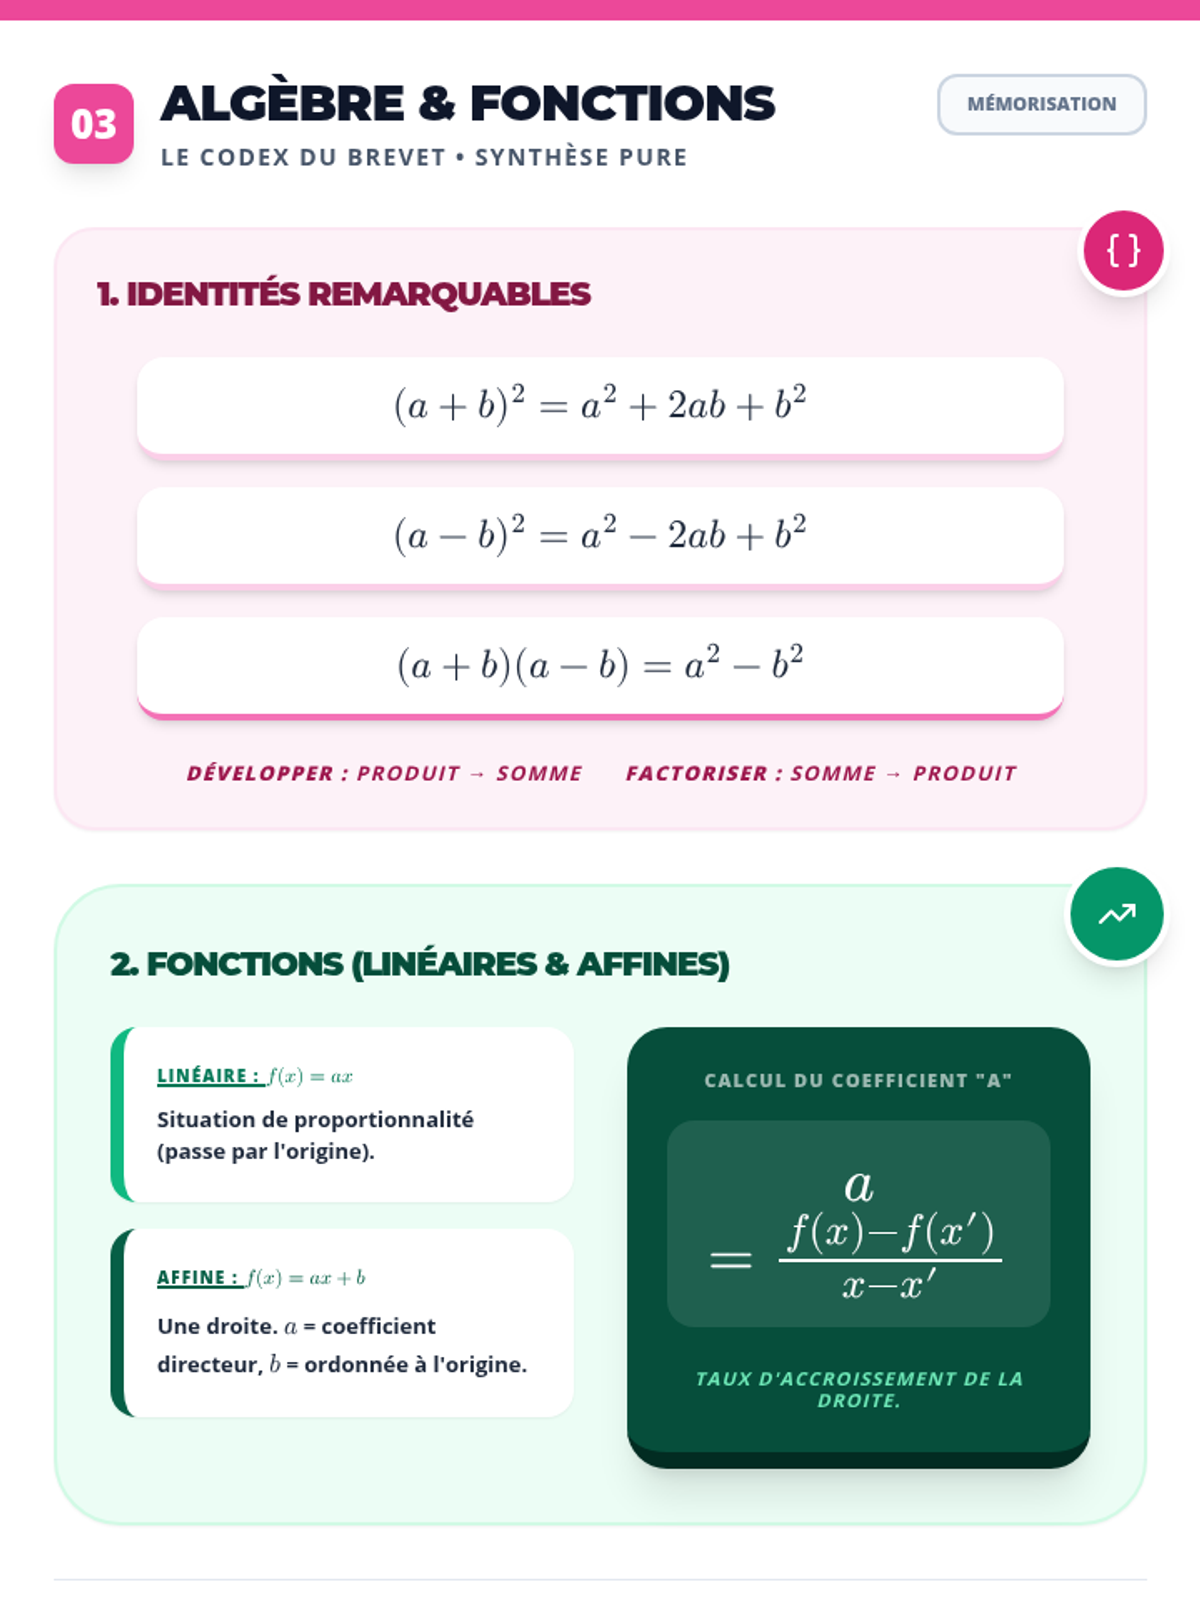
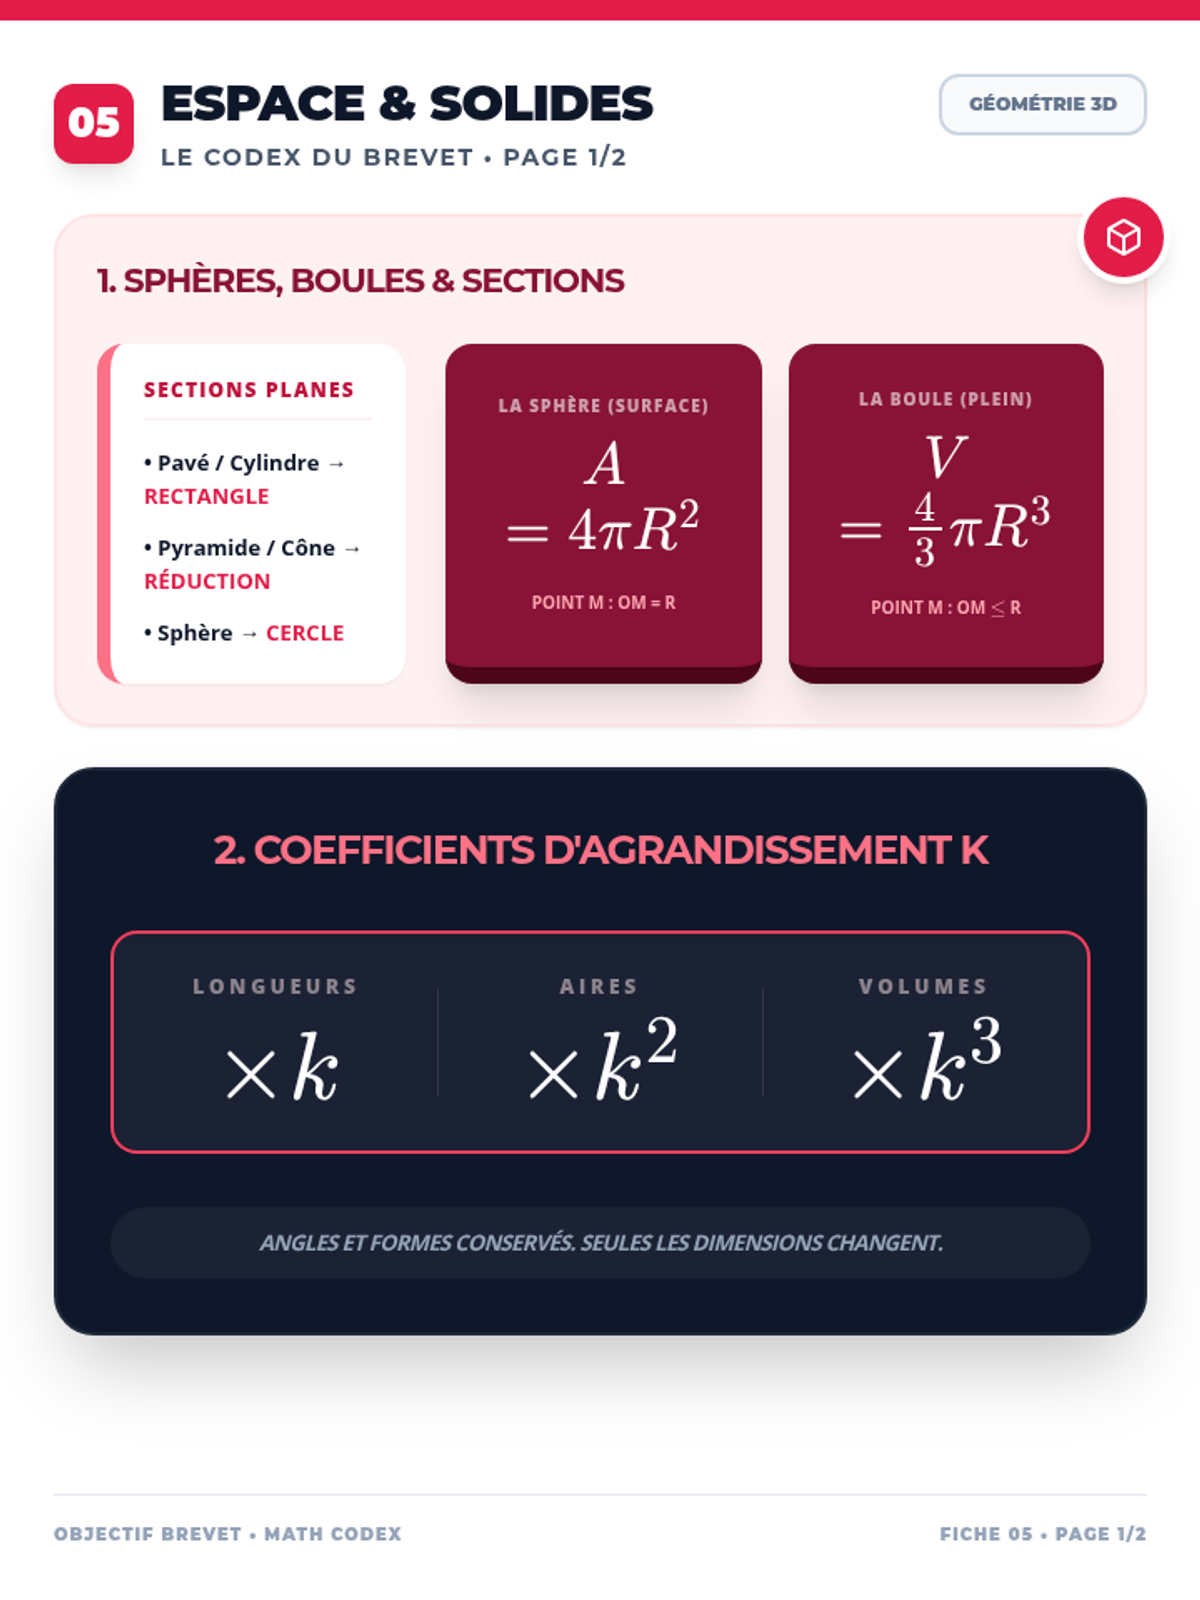
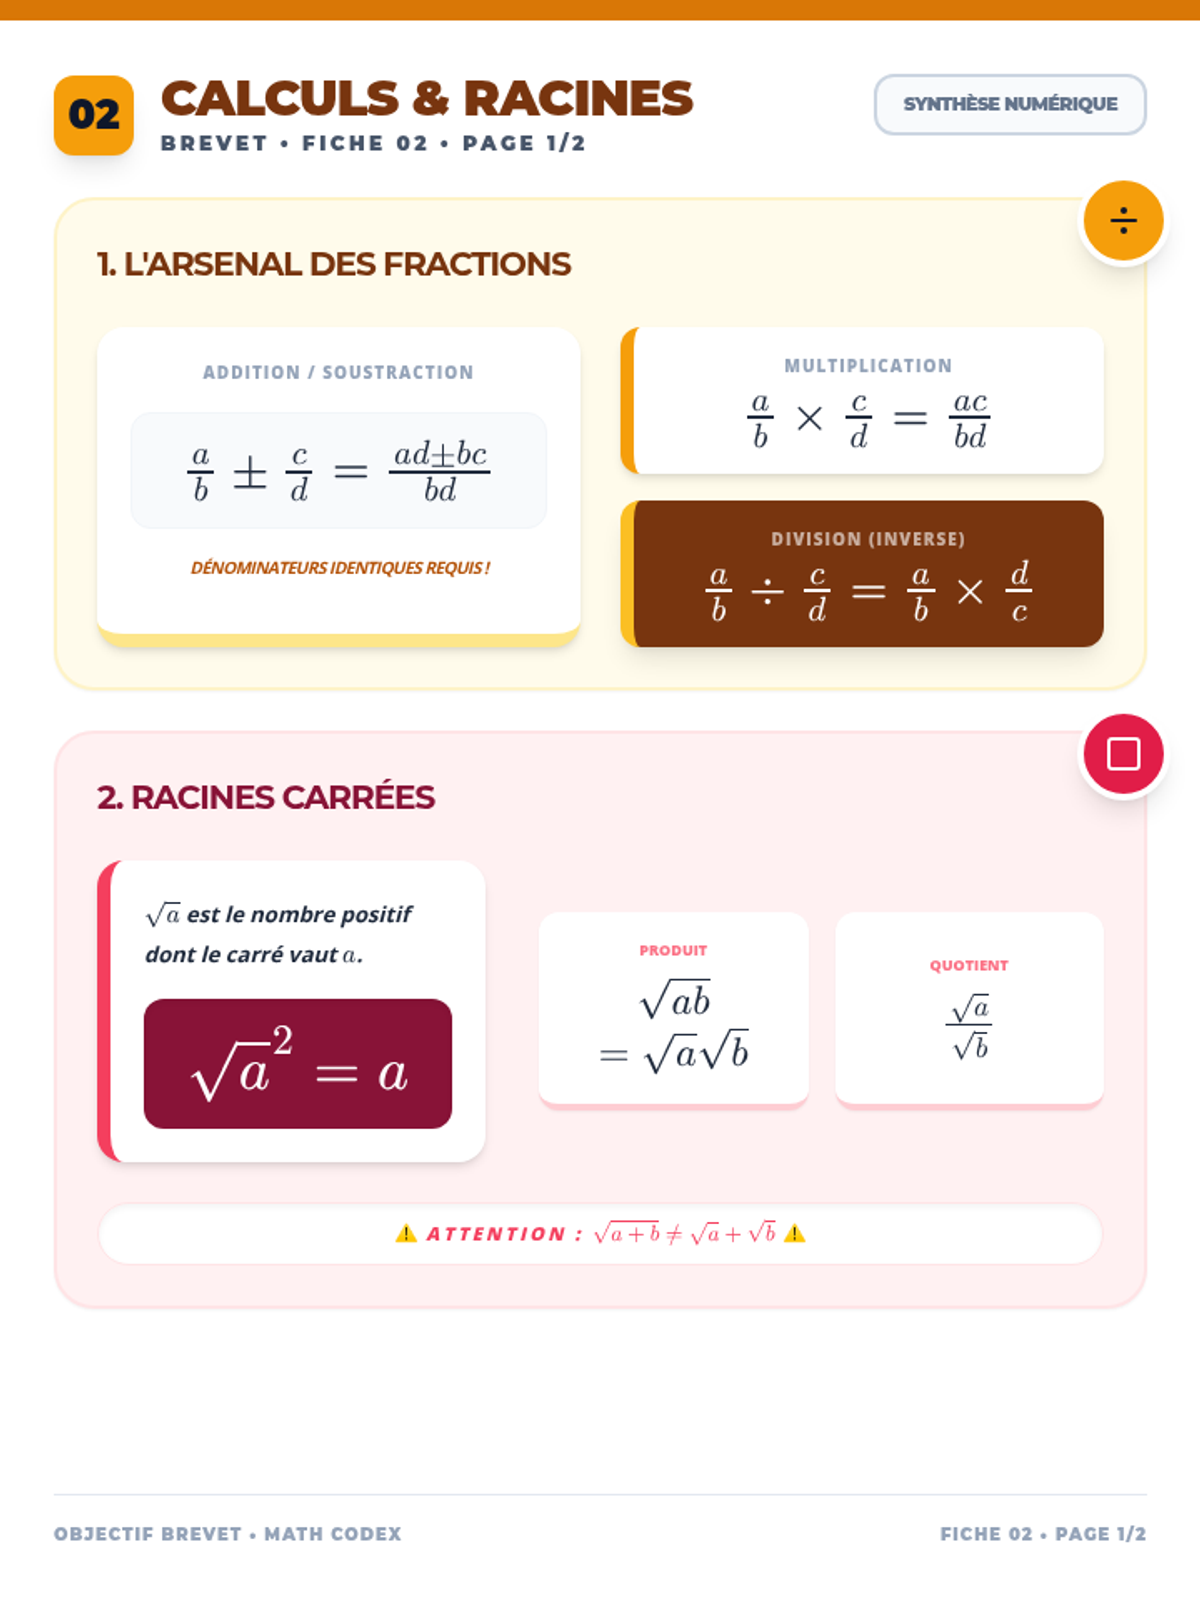
Une collection complète de fiches de révision et un diaporama dynamique pour maîtriser le programme de mathématiques de 3ème. Couvre l'arithmétique, l'algèbre, la géométrie et la trigonométrie avec des visuels clairs et modernes.
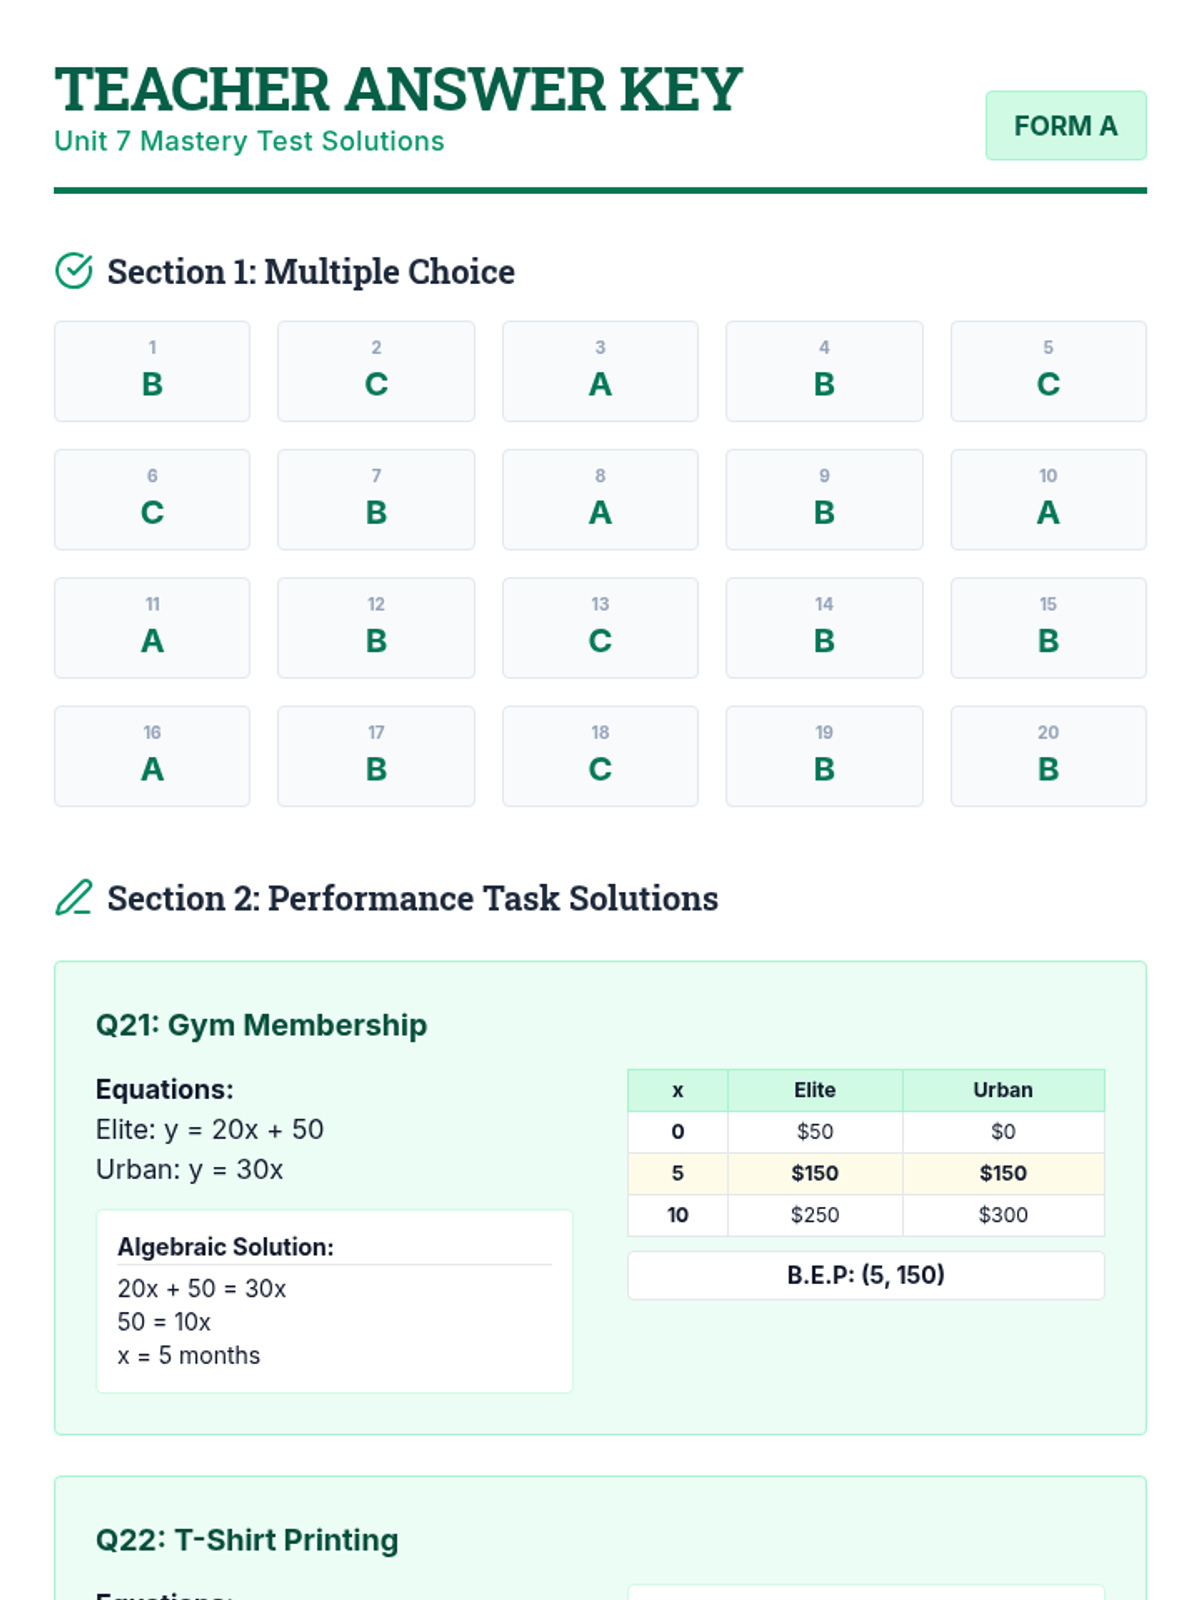
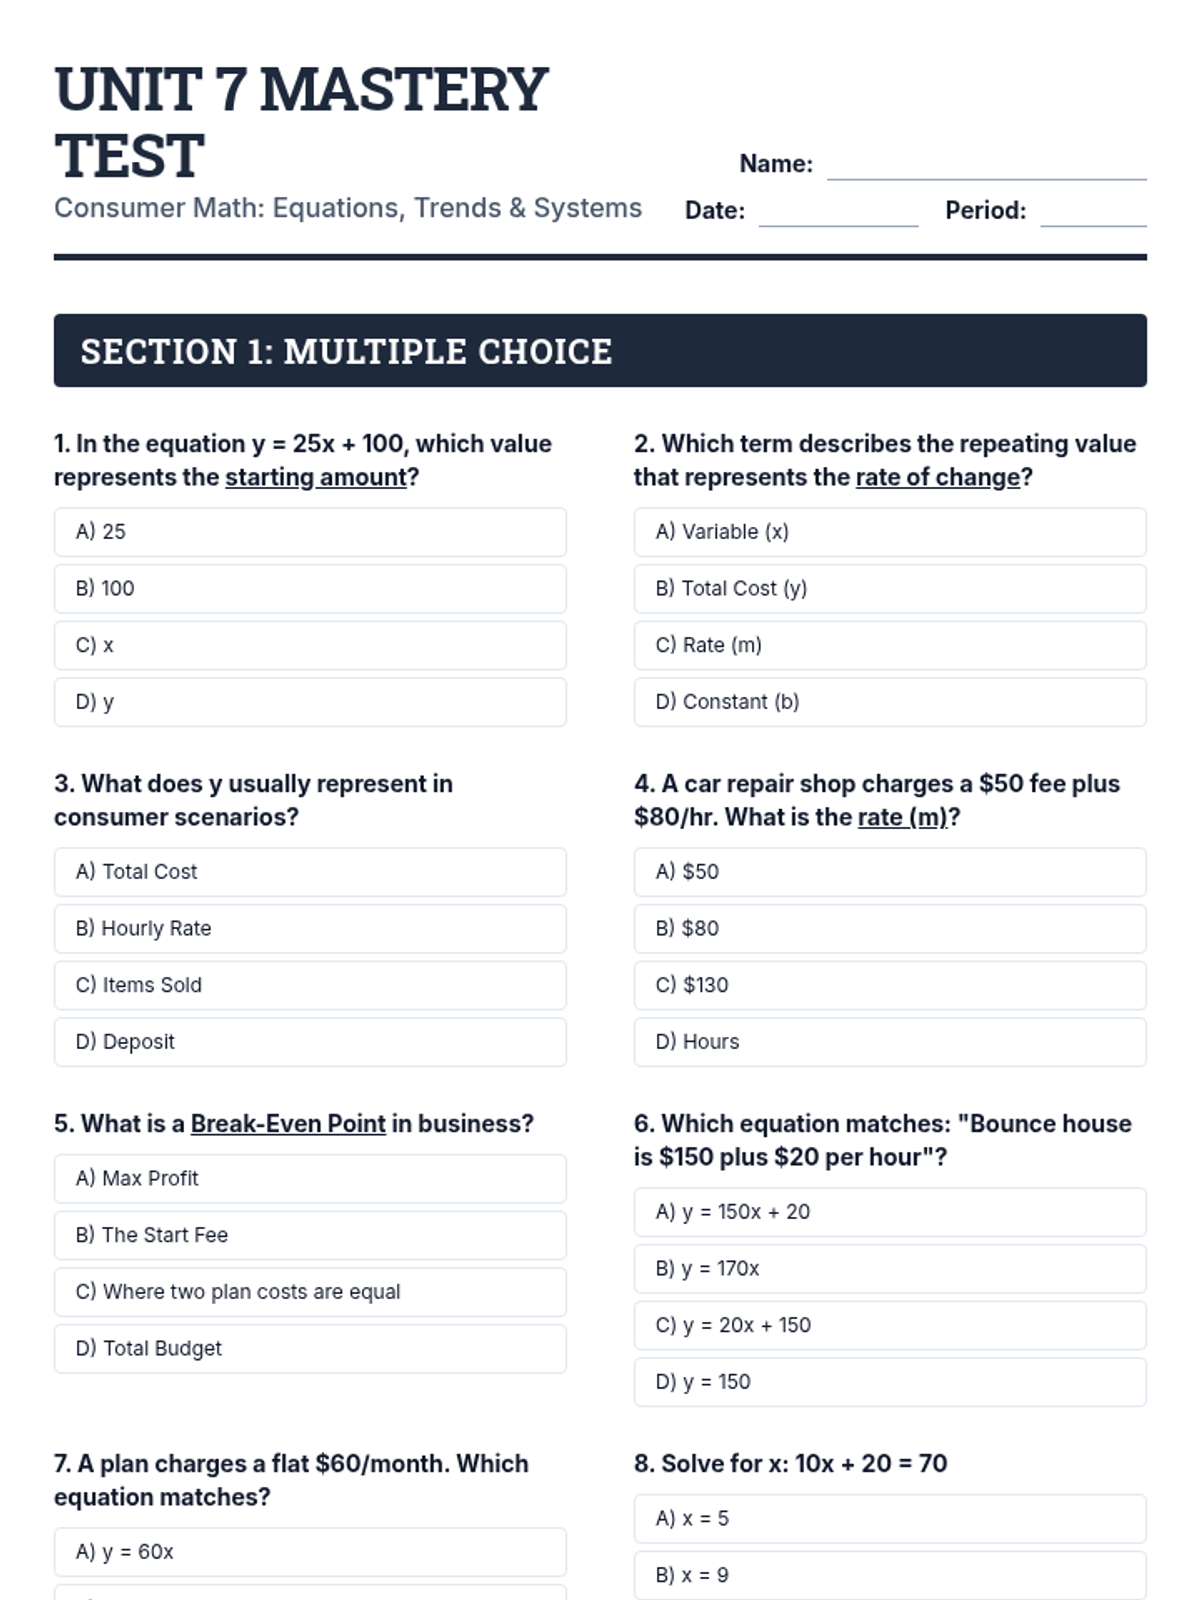
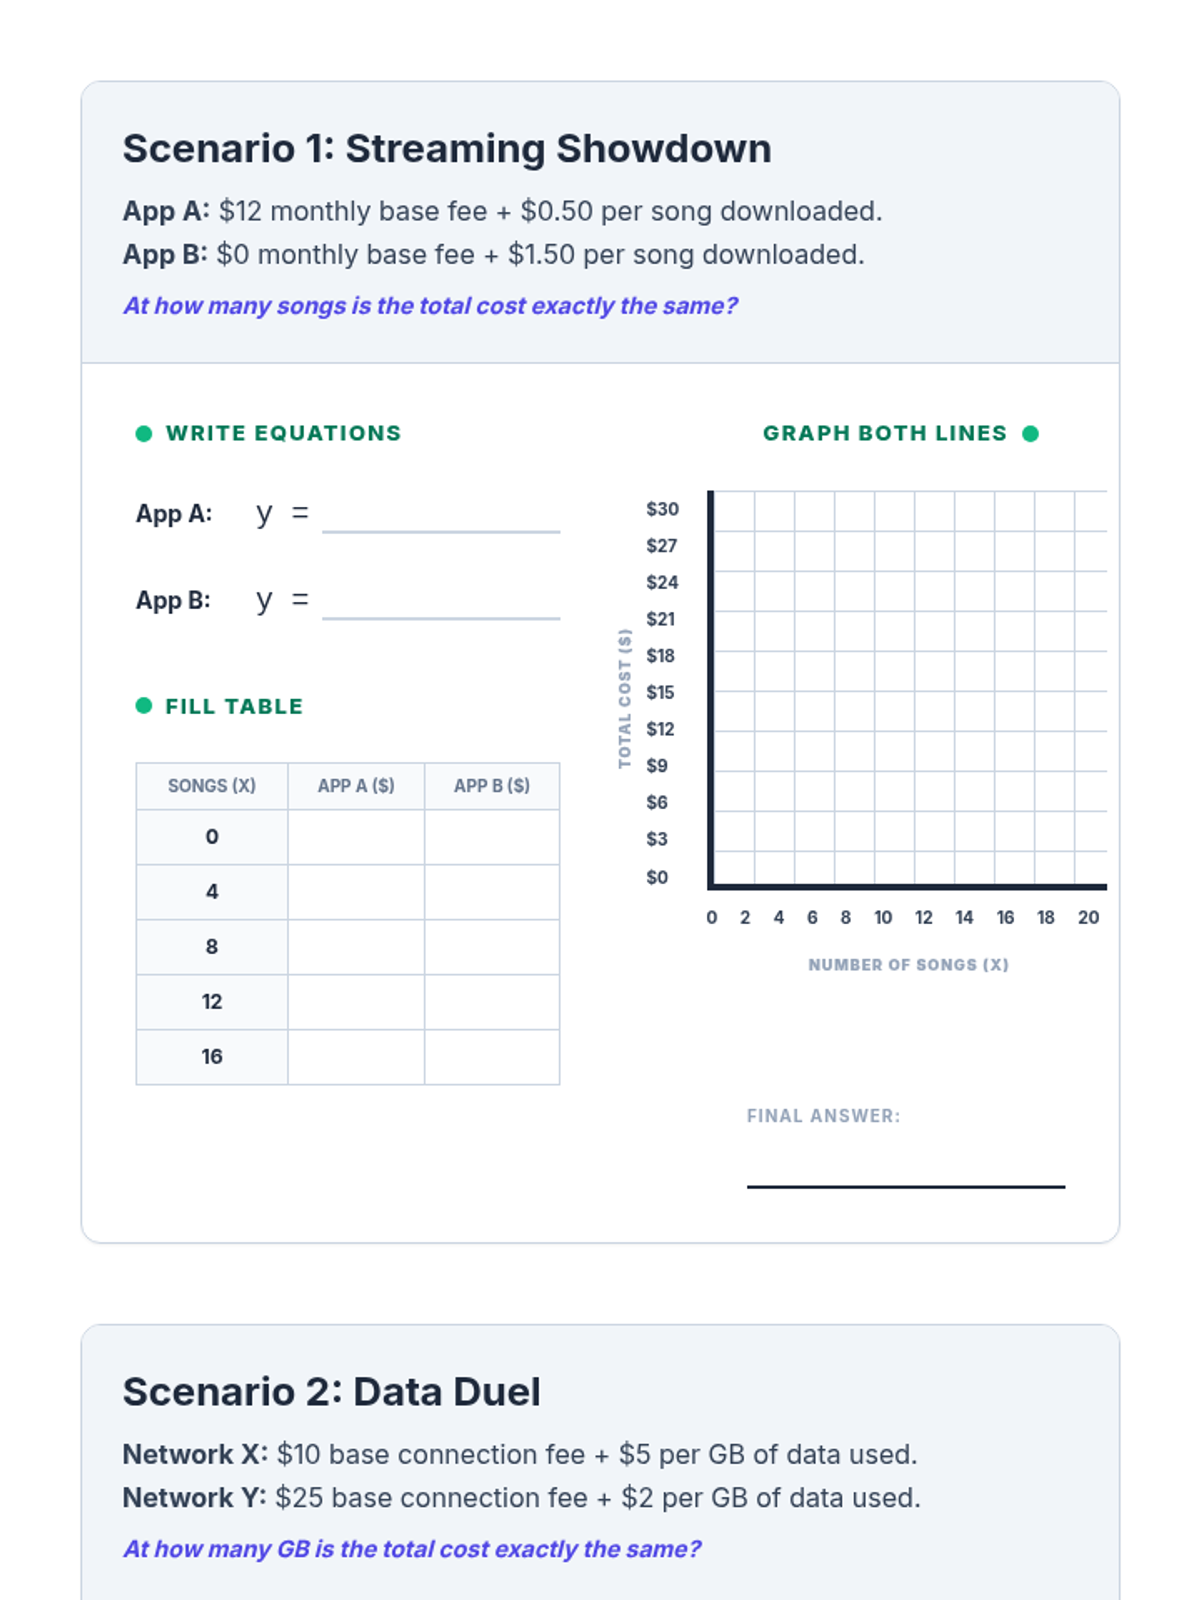
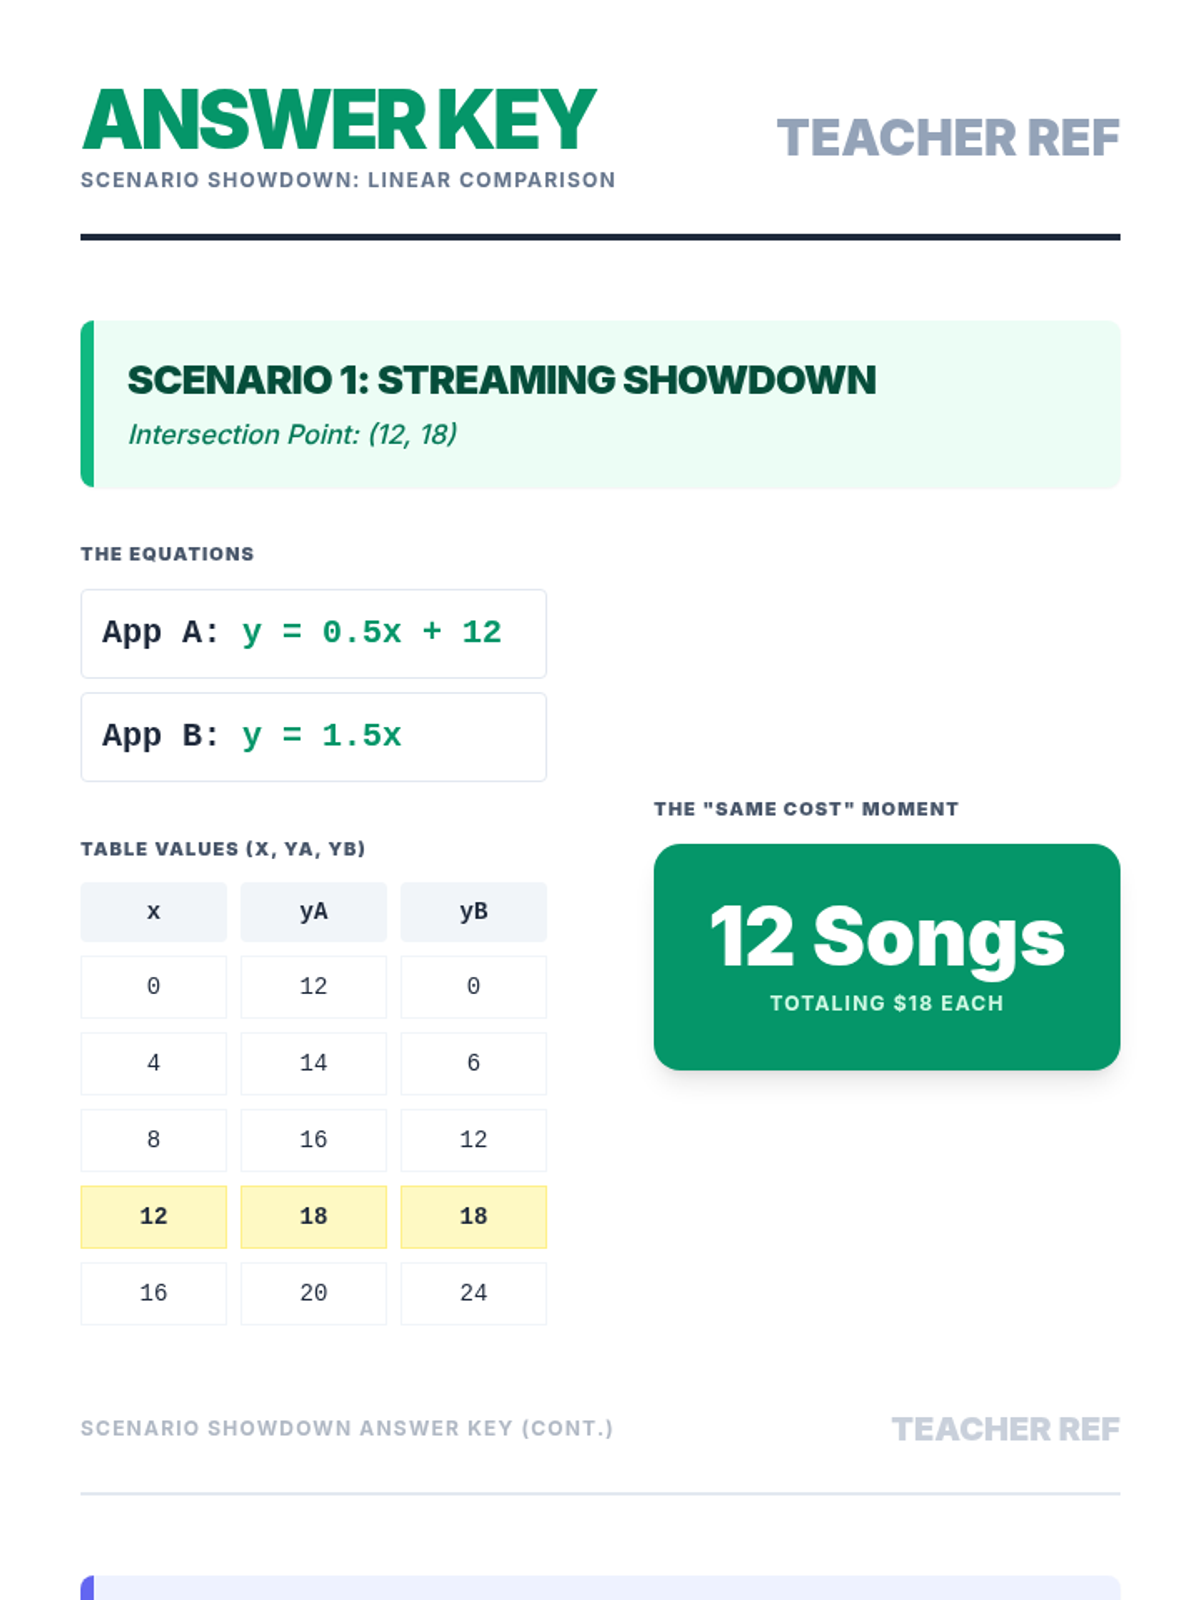
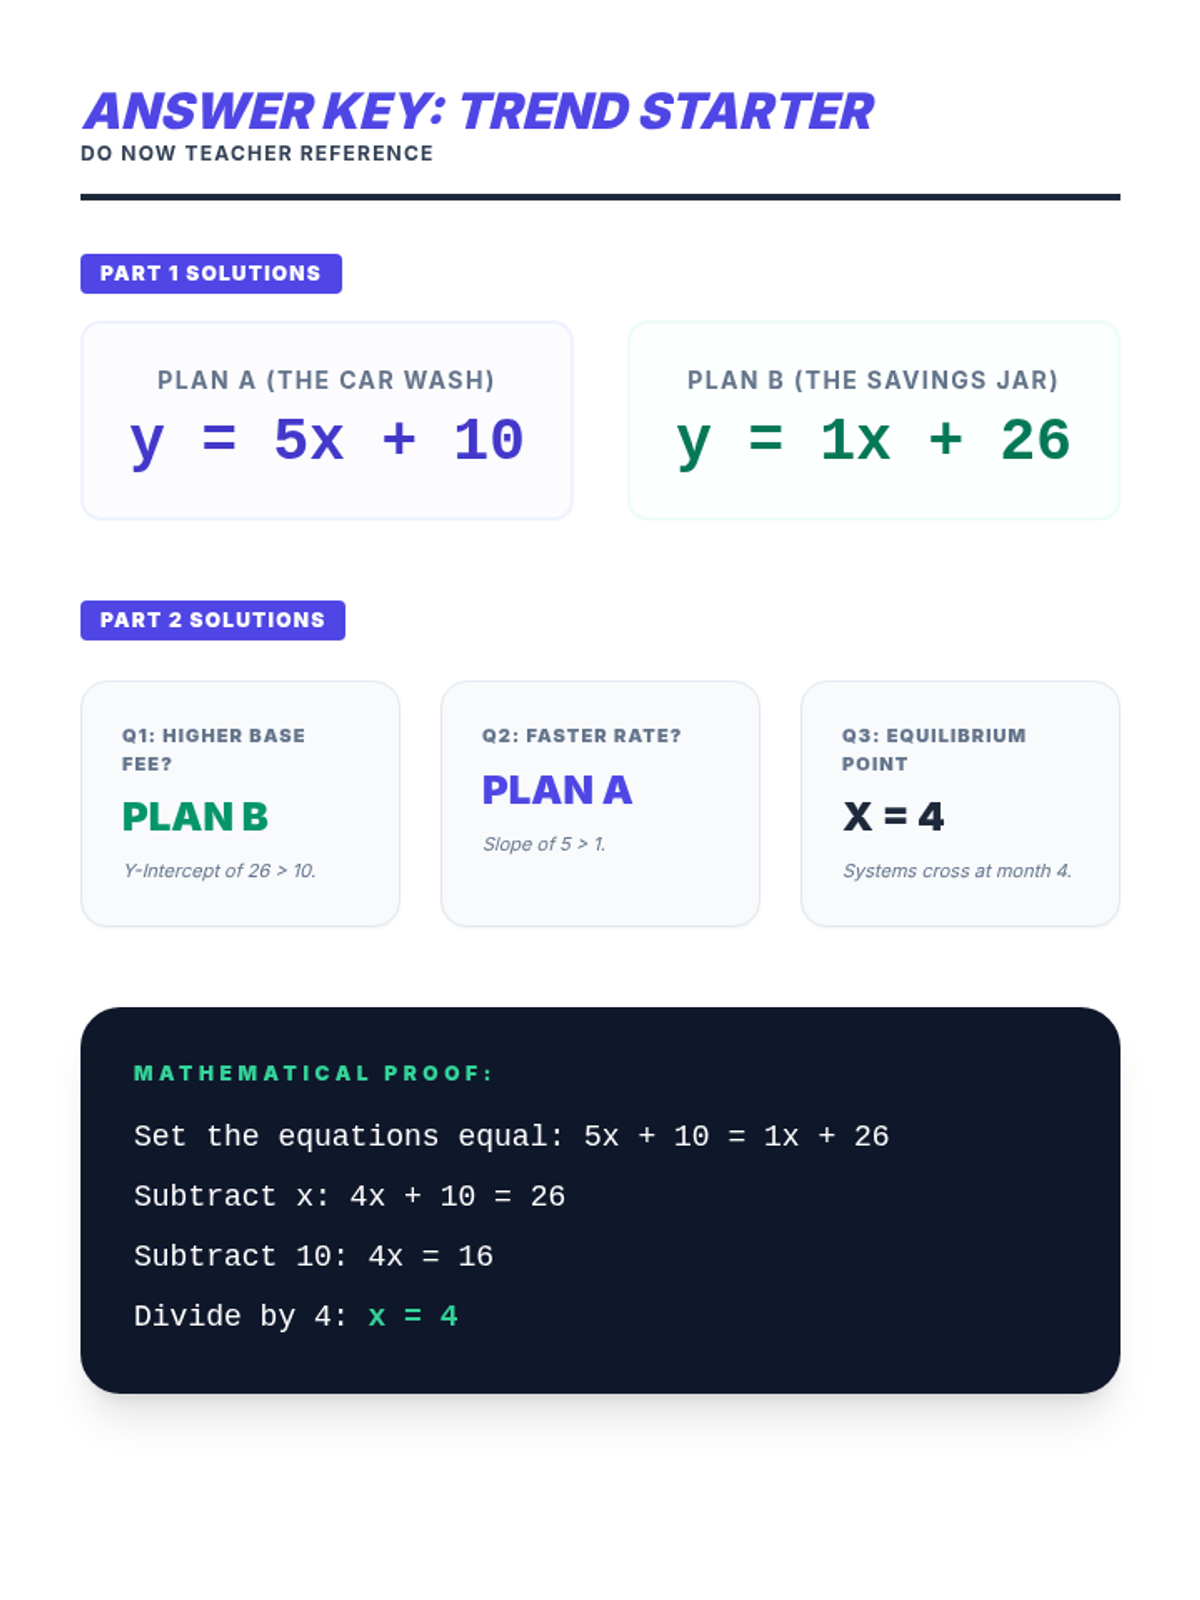
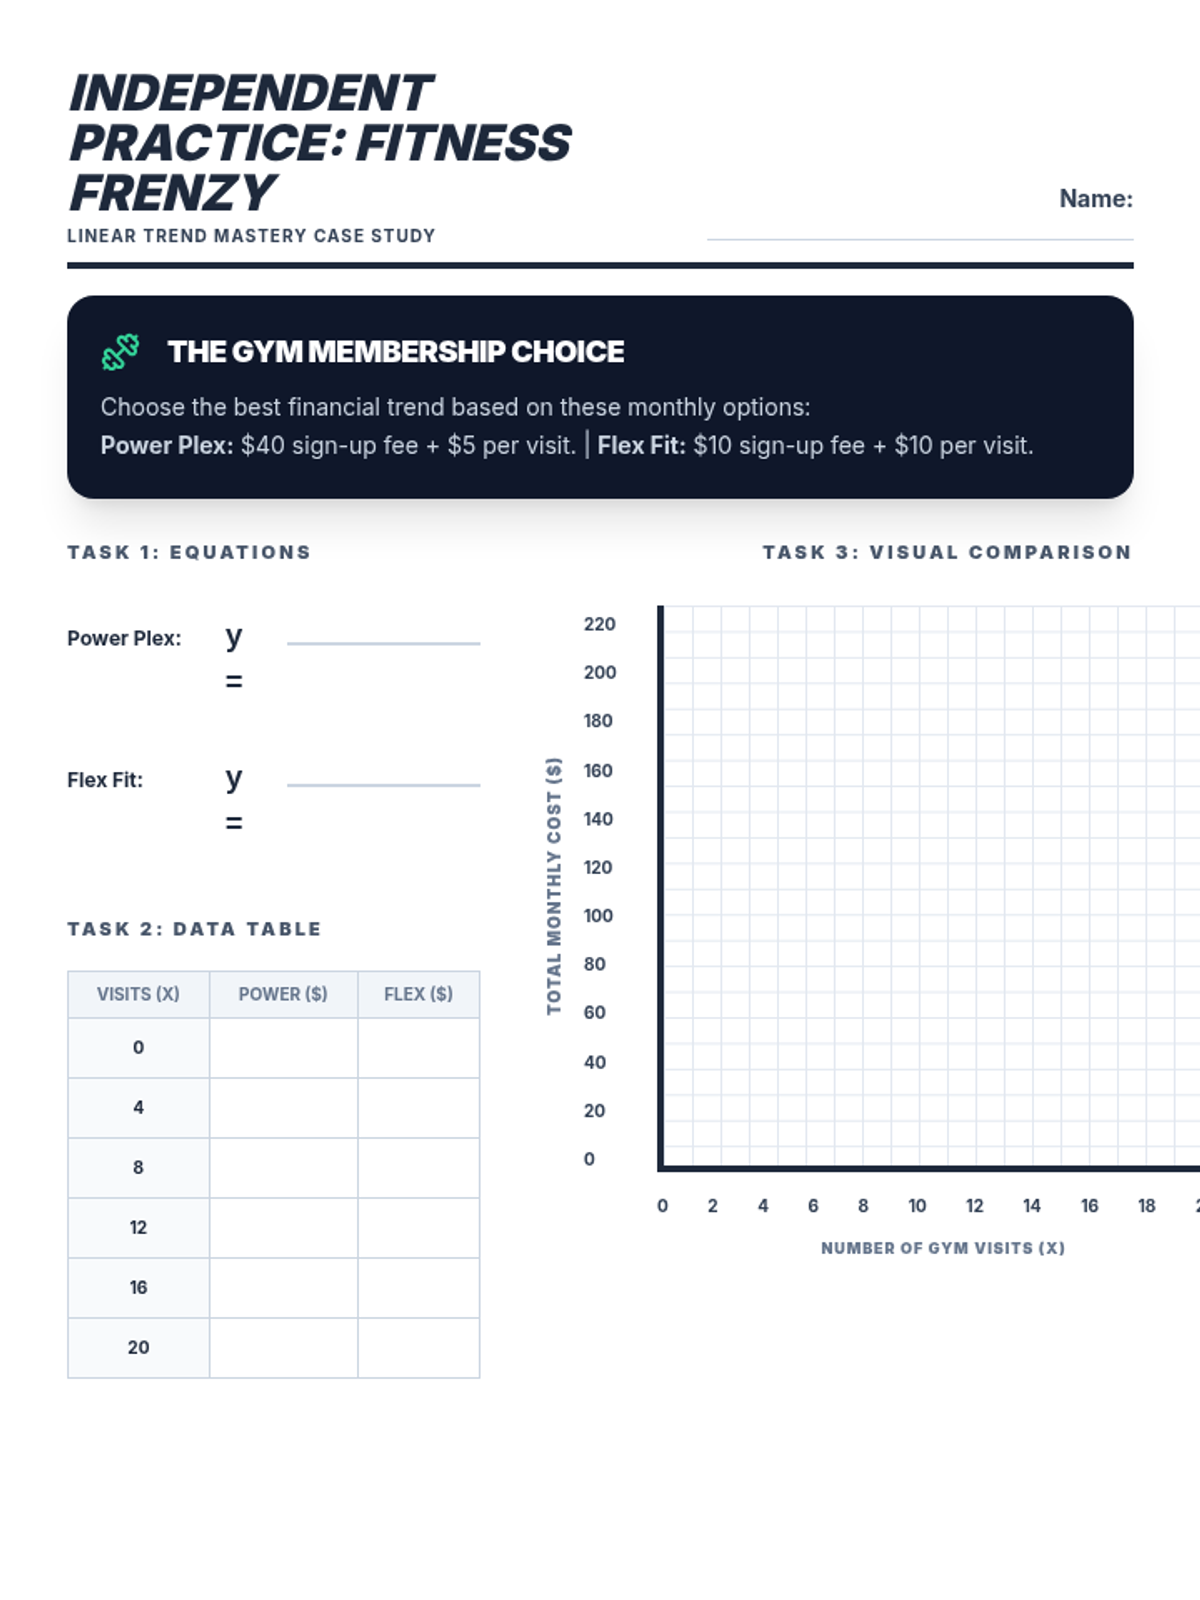
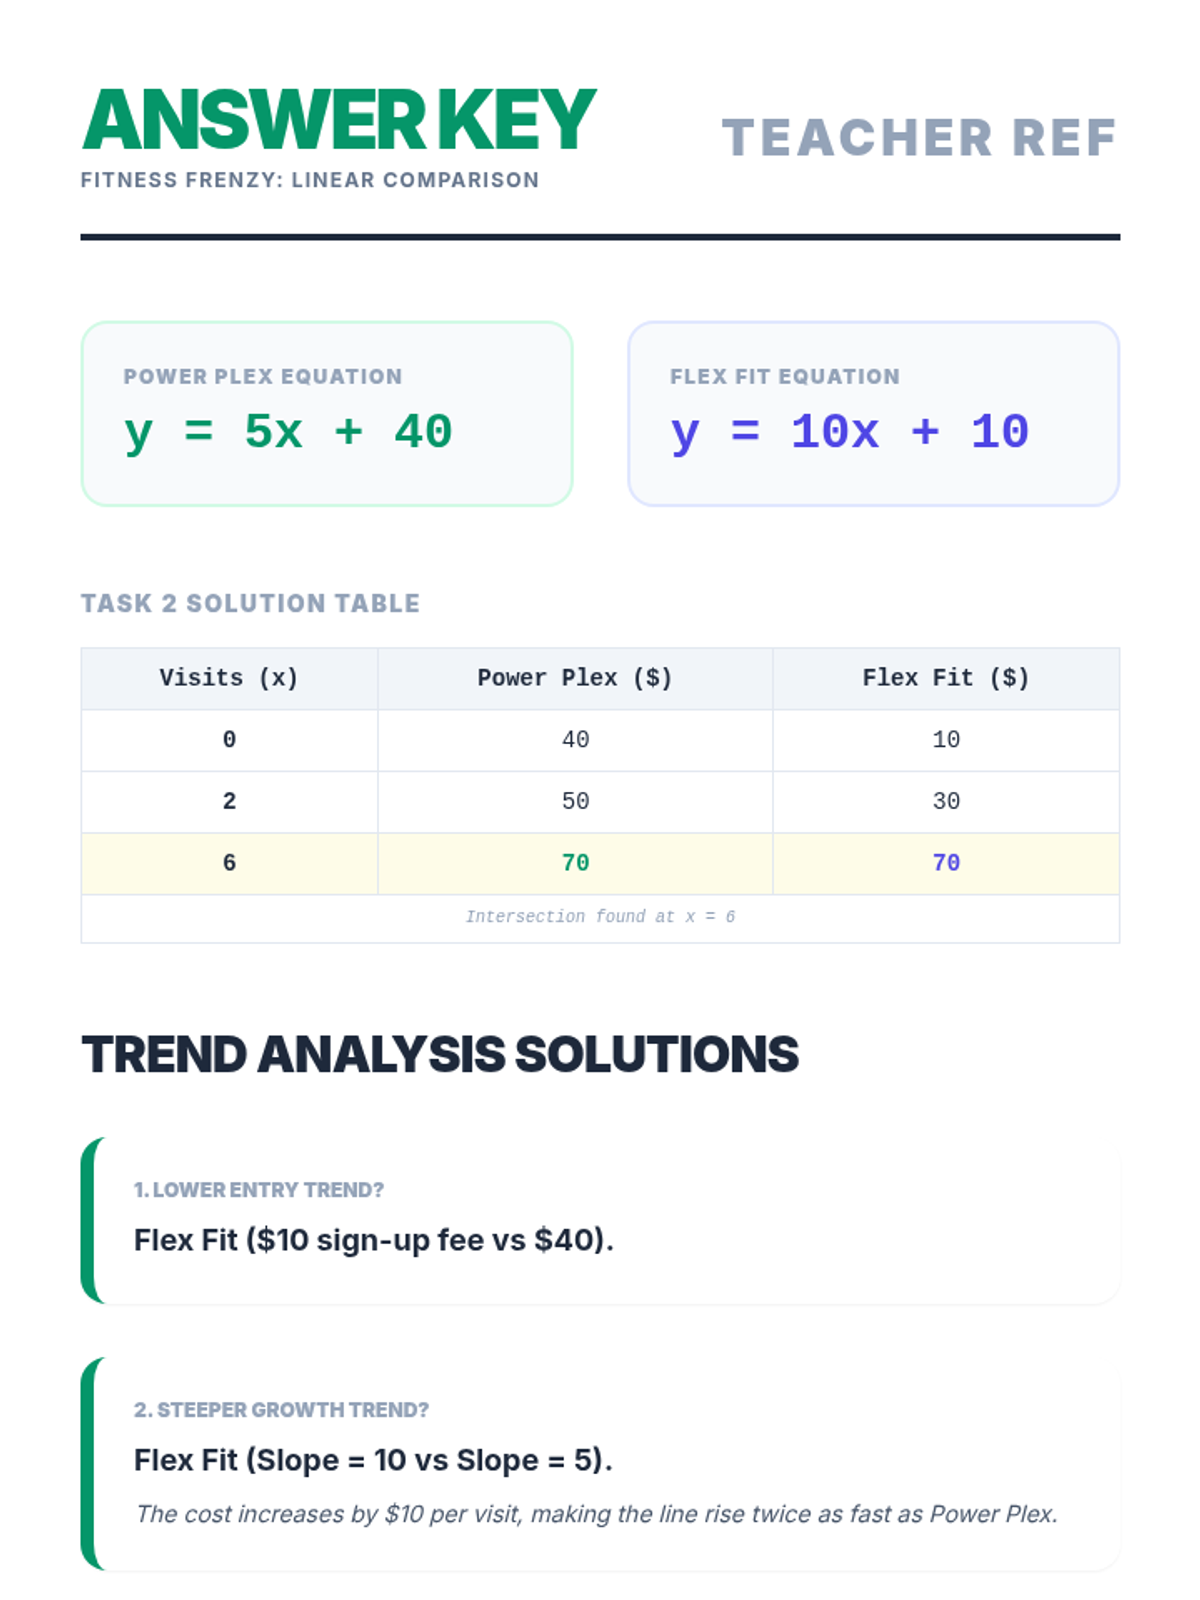
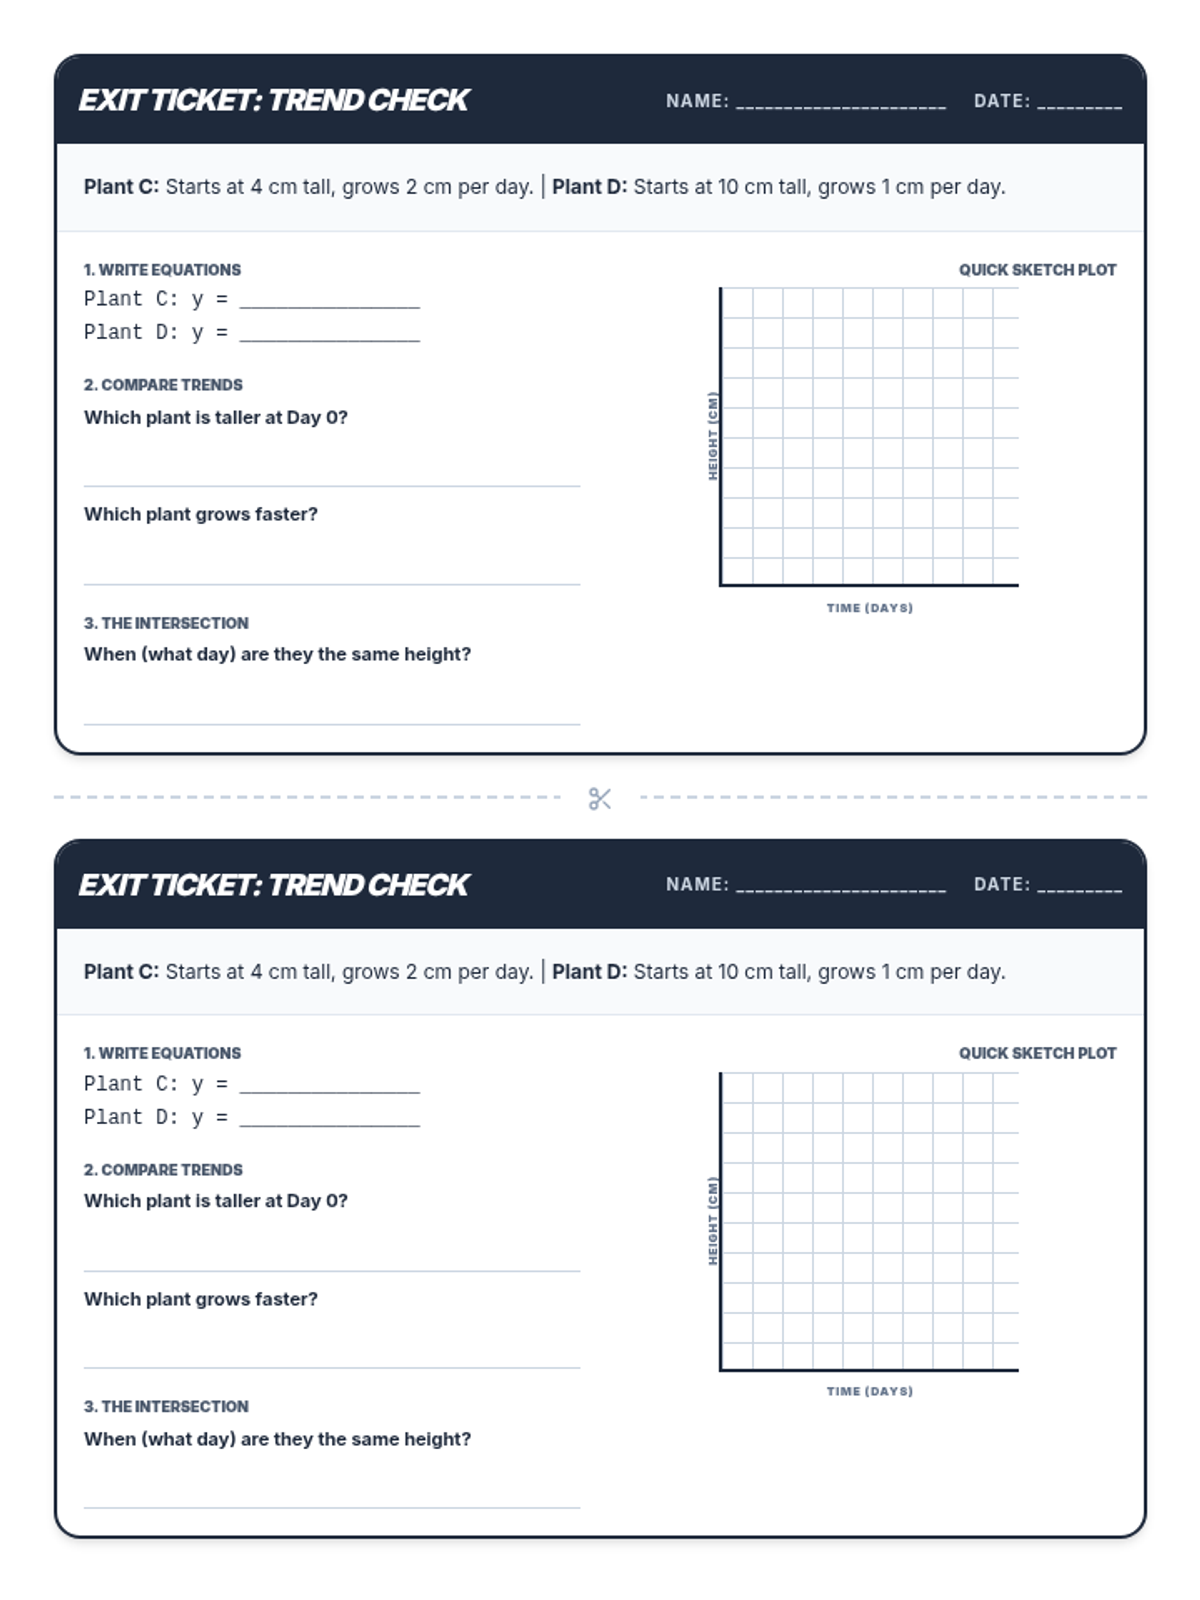
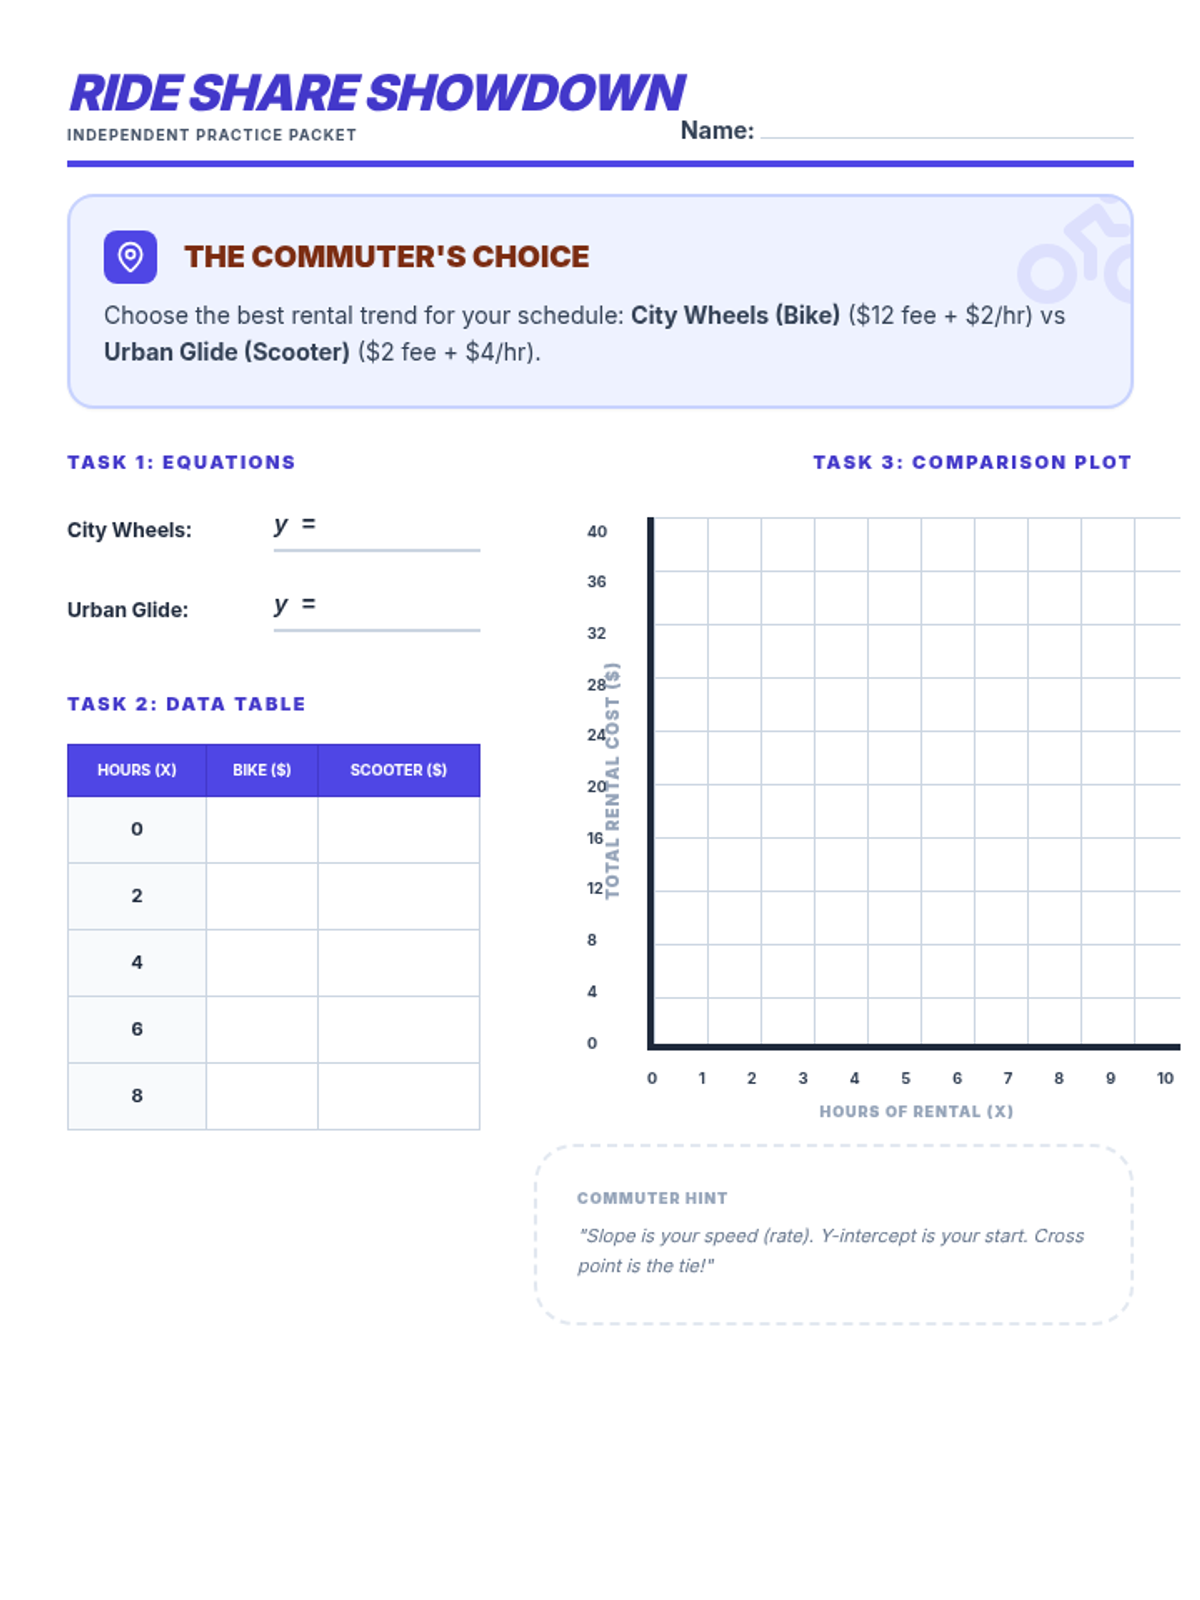
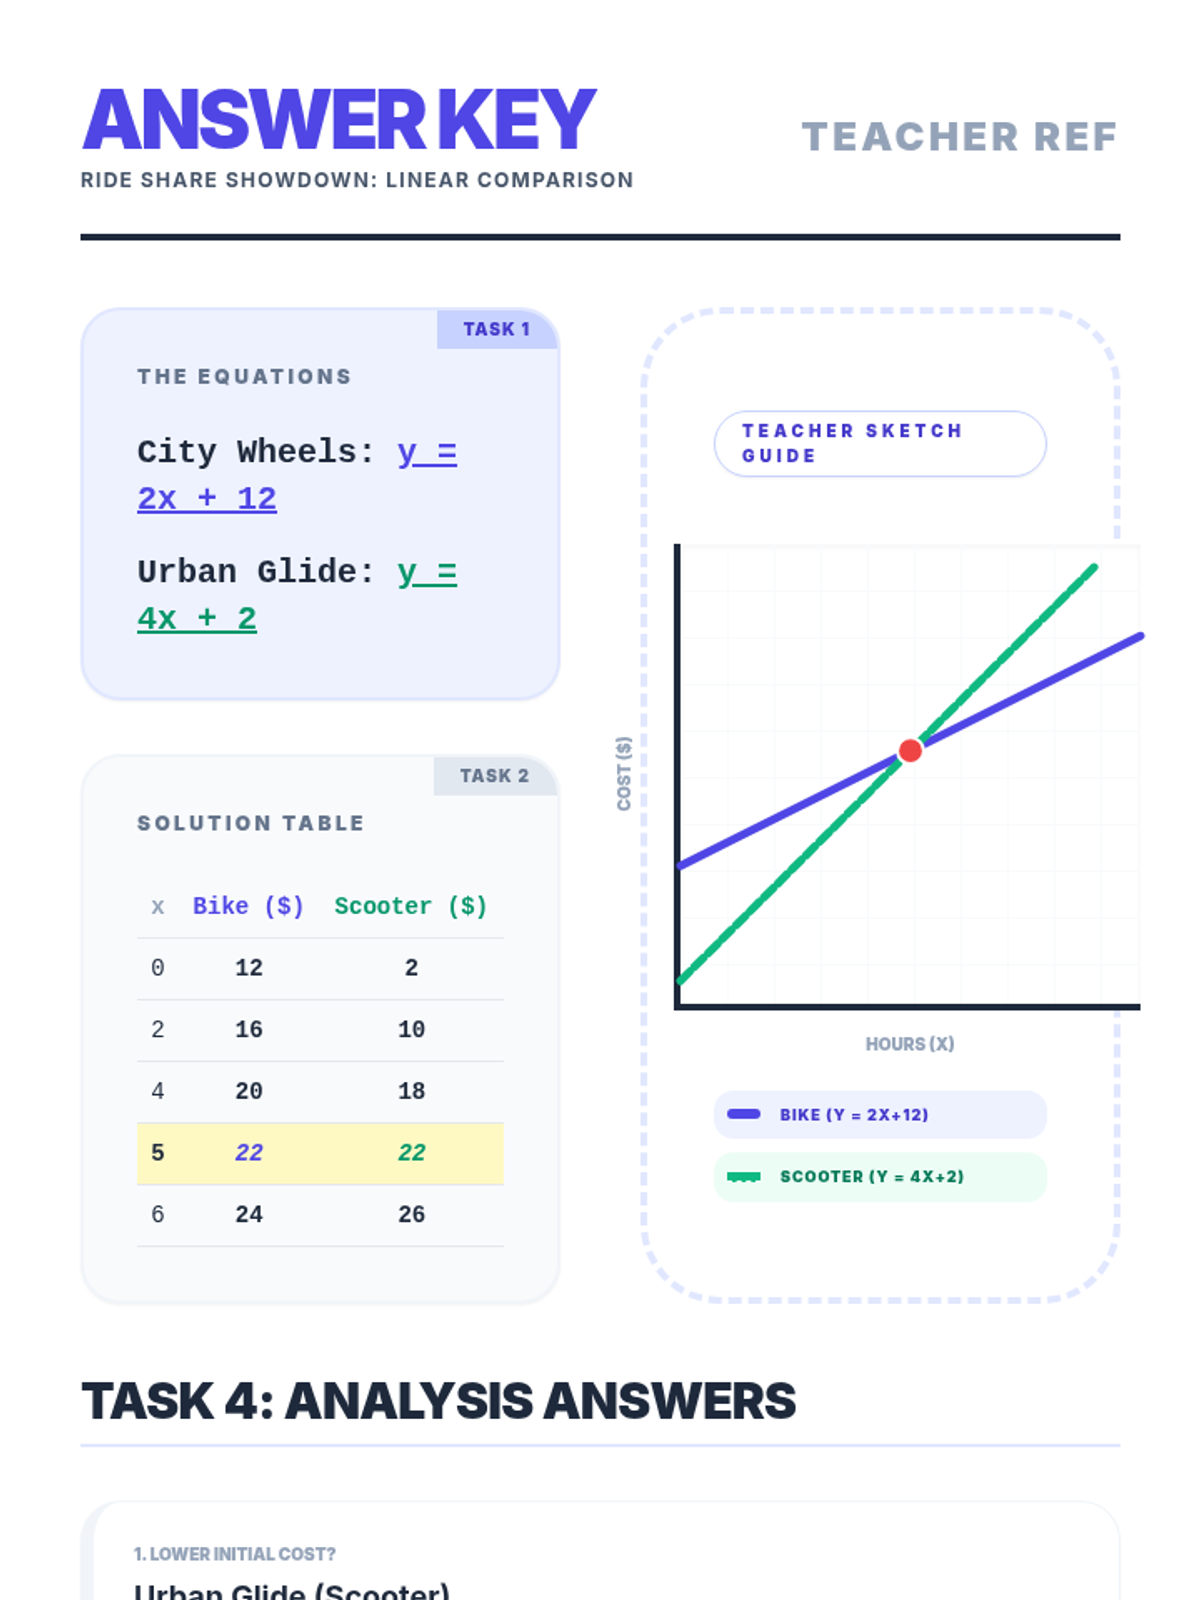
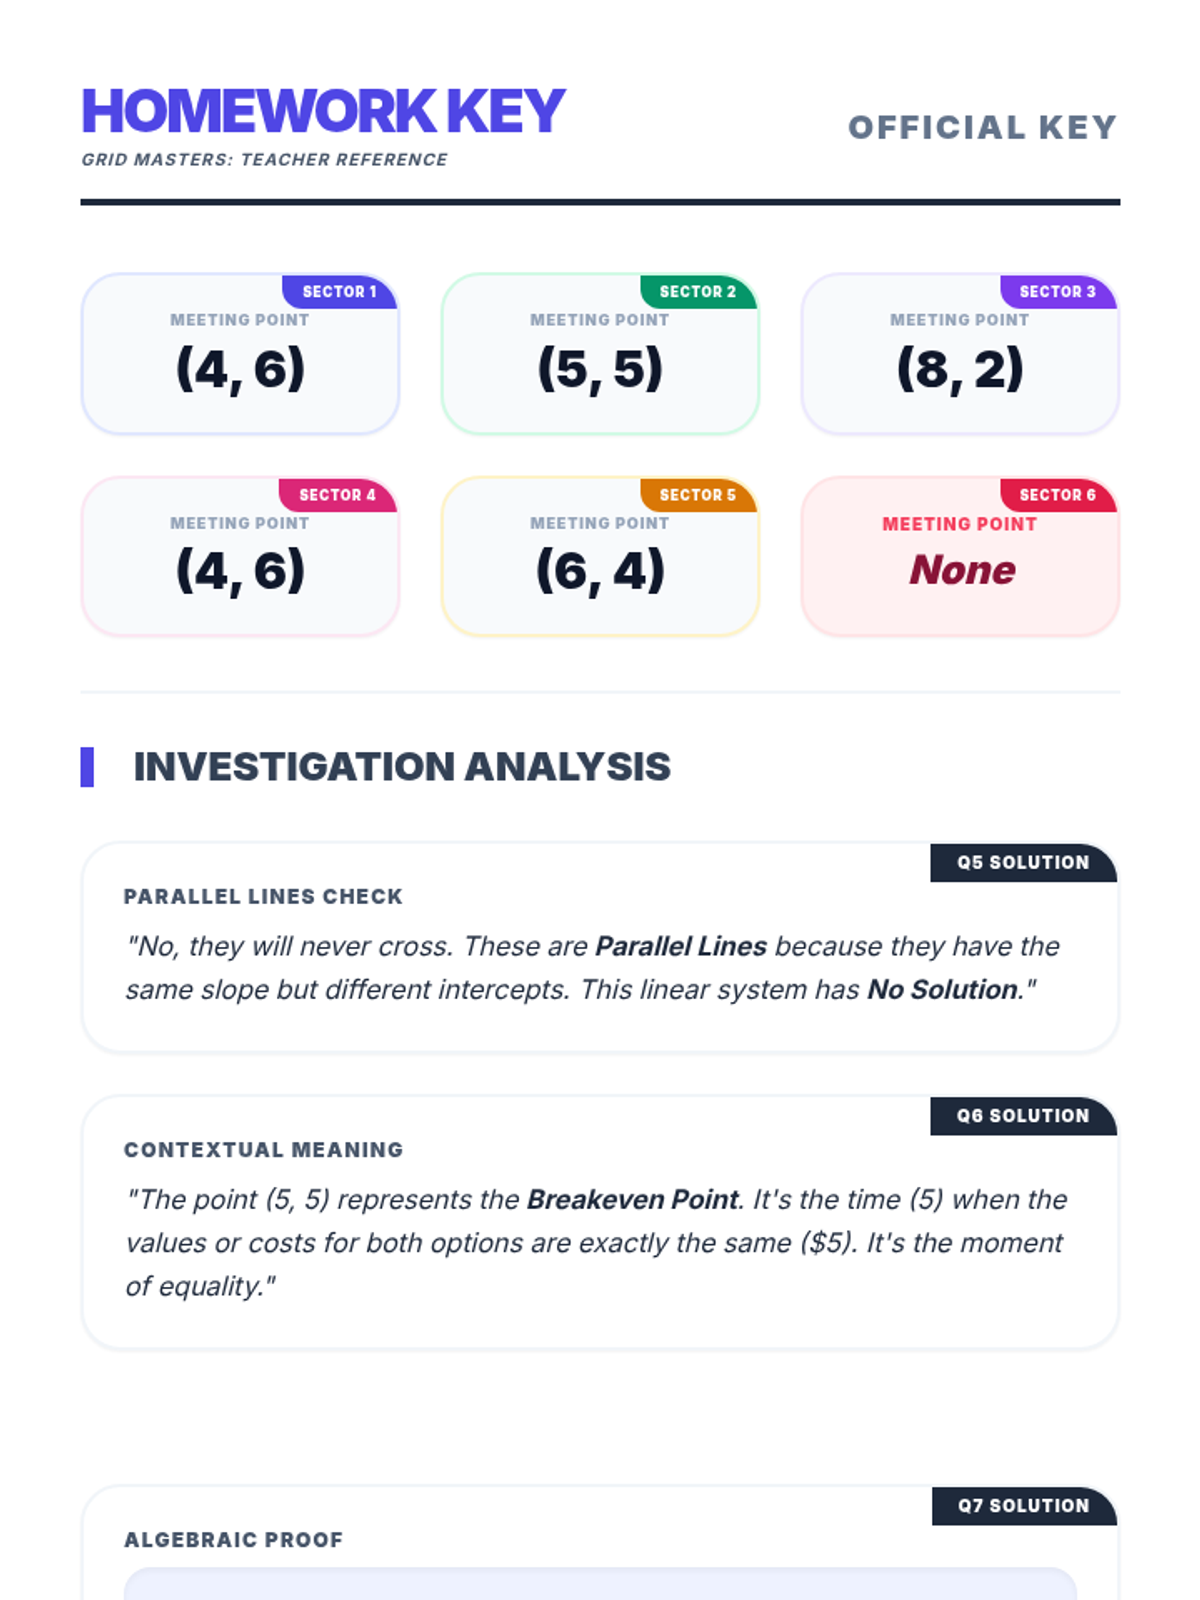
The final summative assessment for the Unit 7 Consumer Math curriculum, covering linear equation translation, table completion, graphing systems, and identifying break-even points.
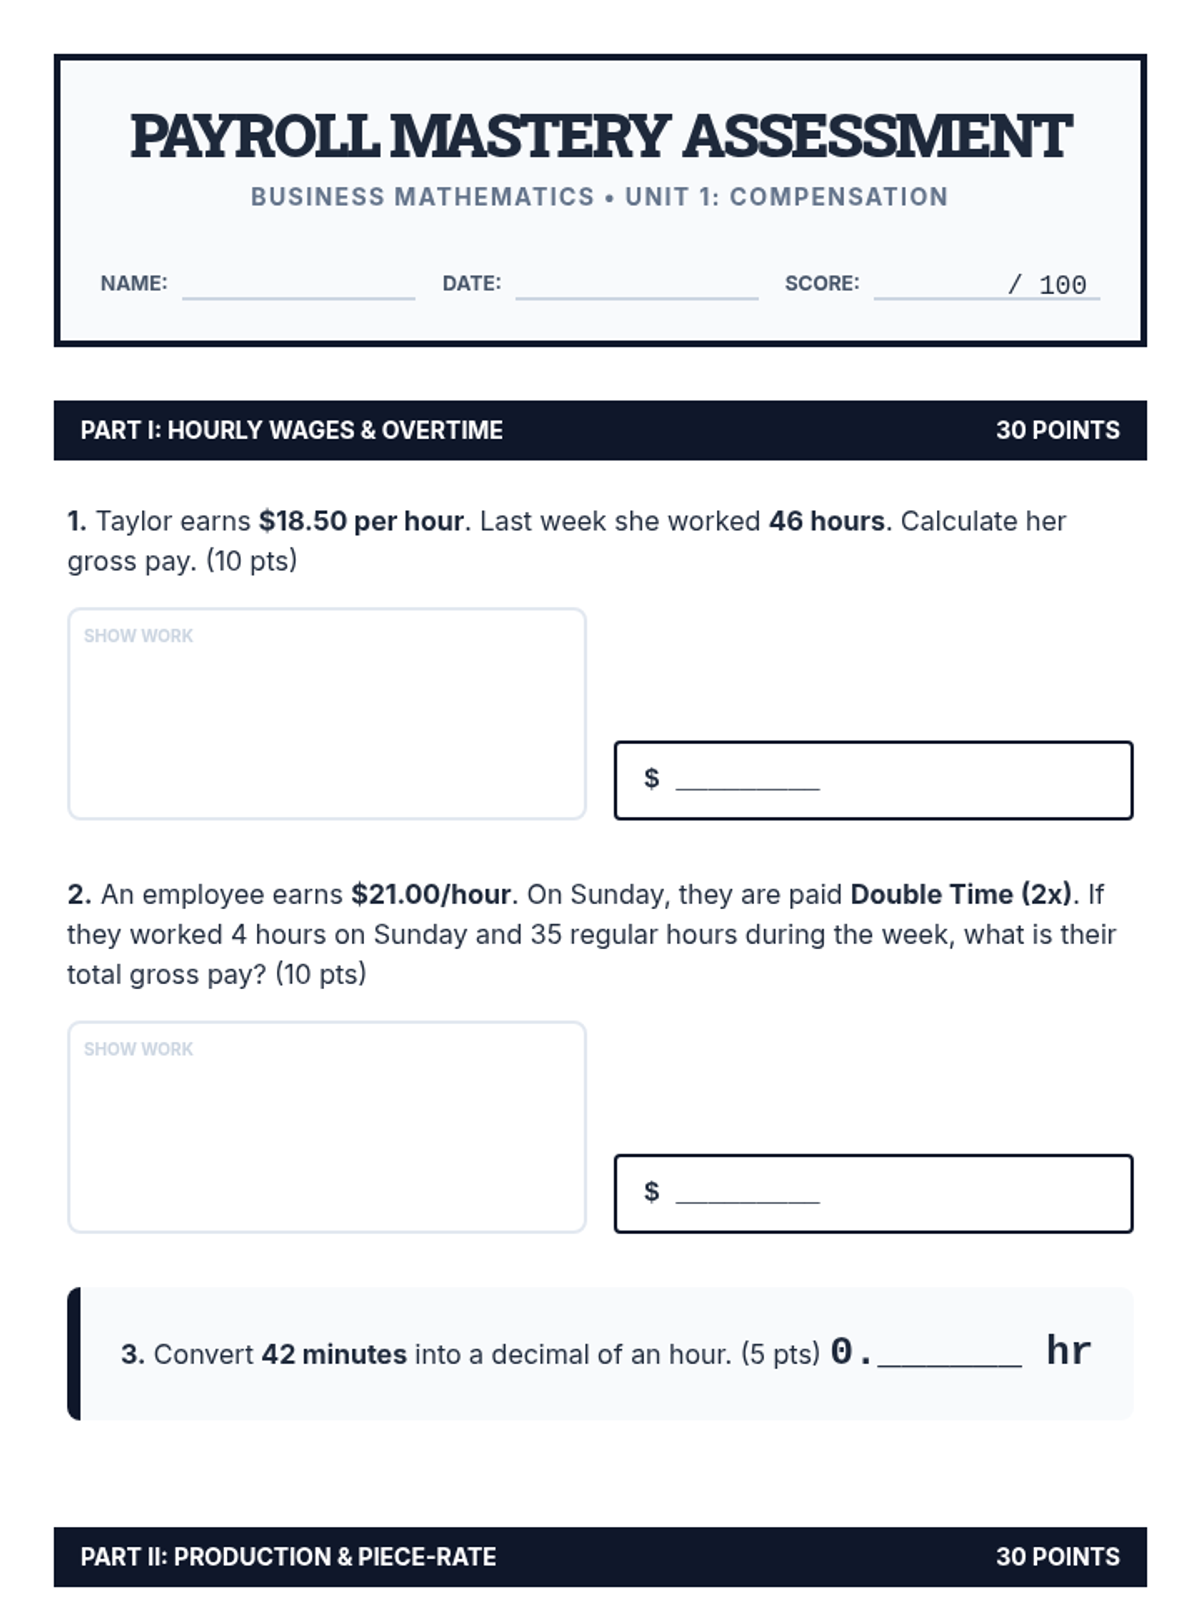
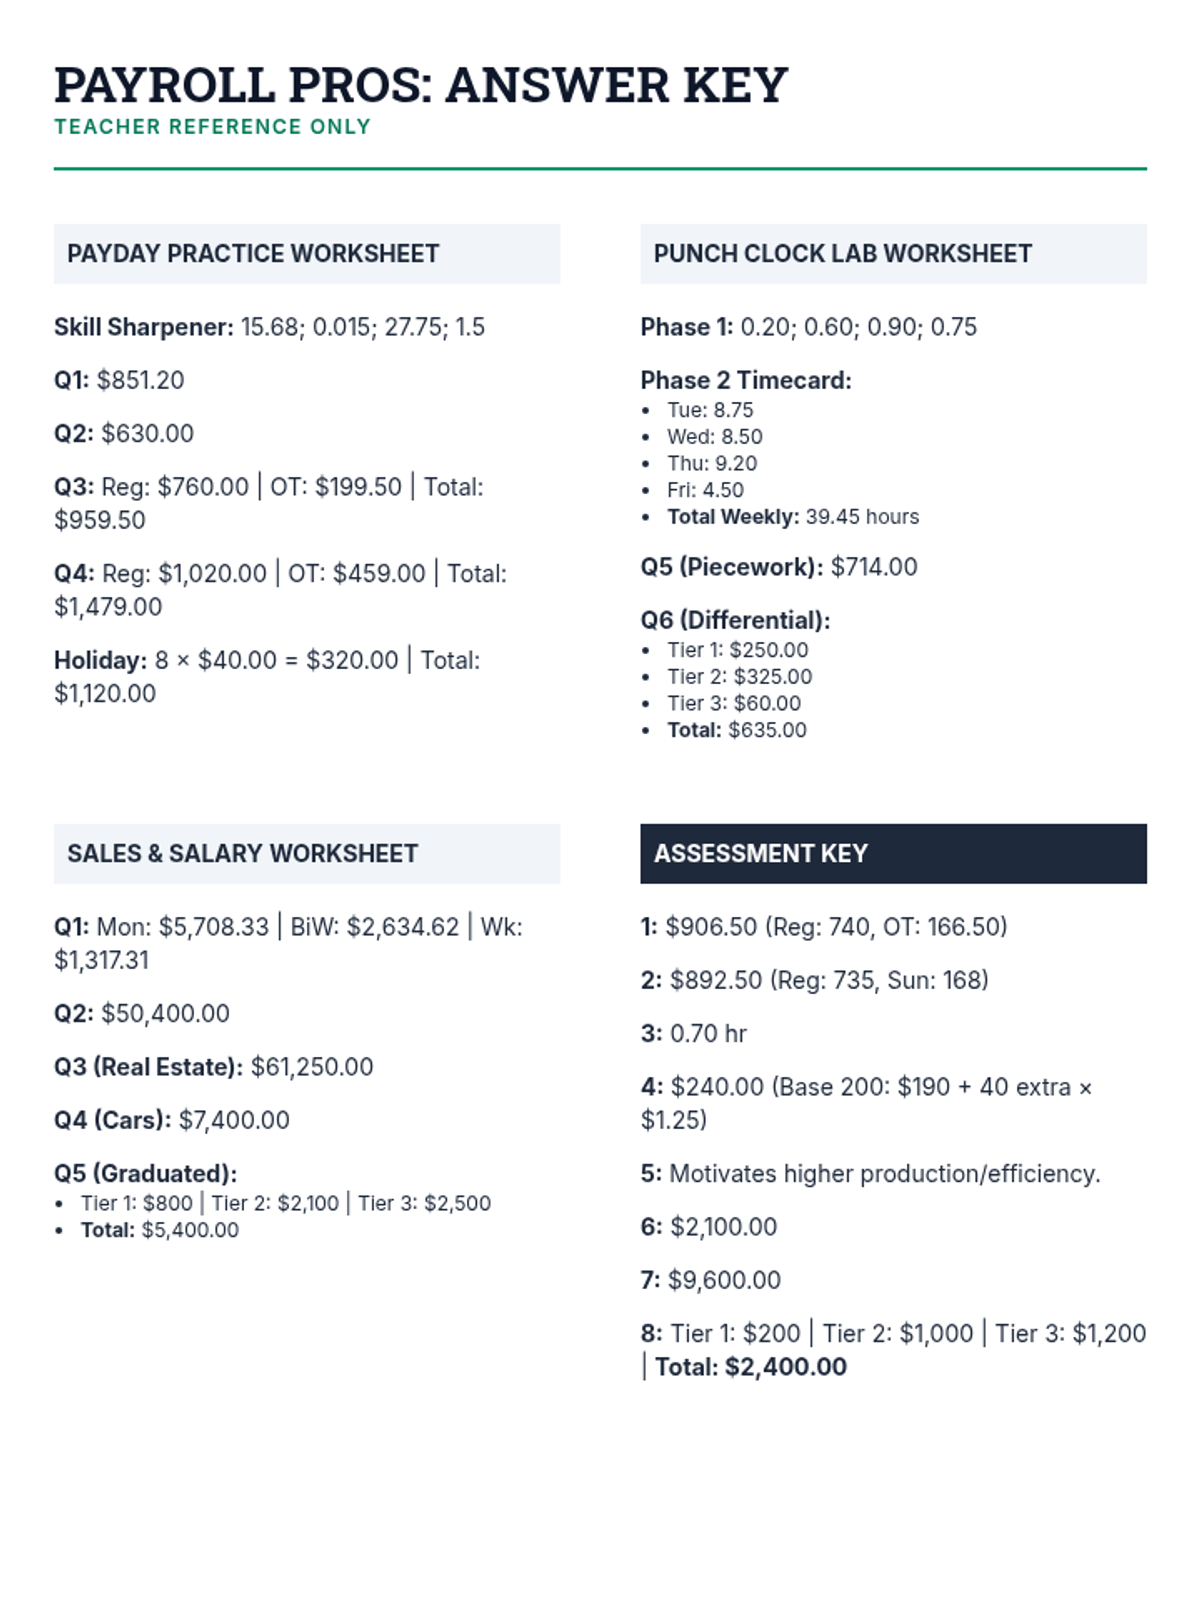
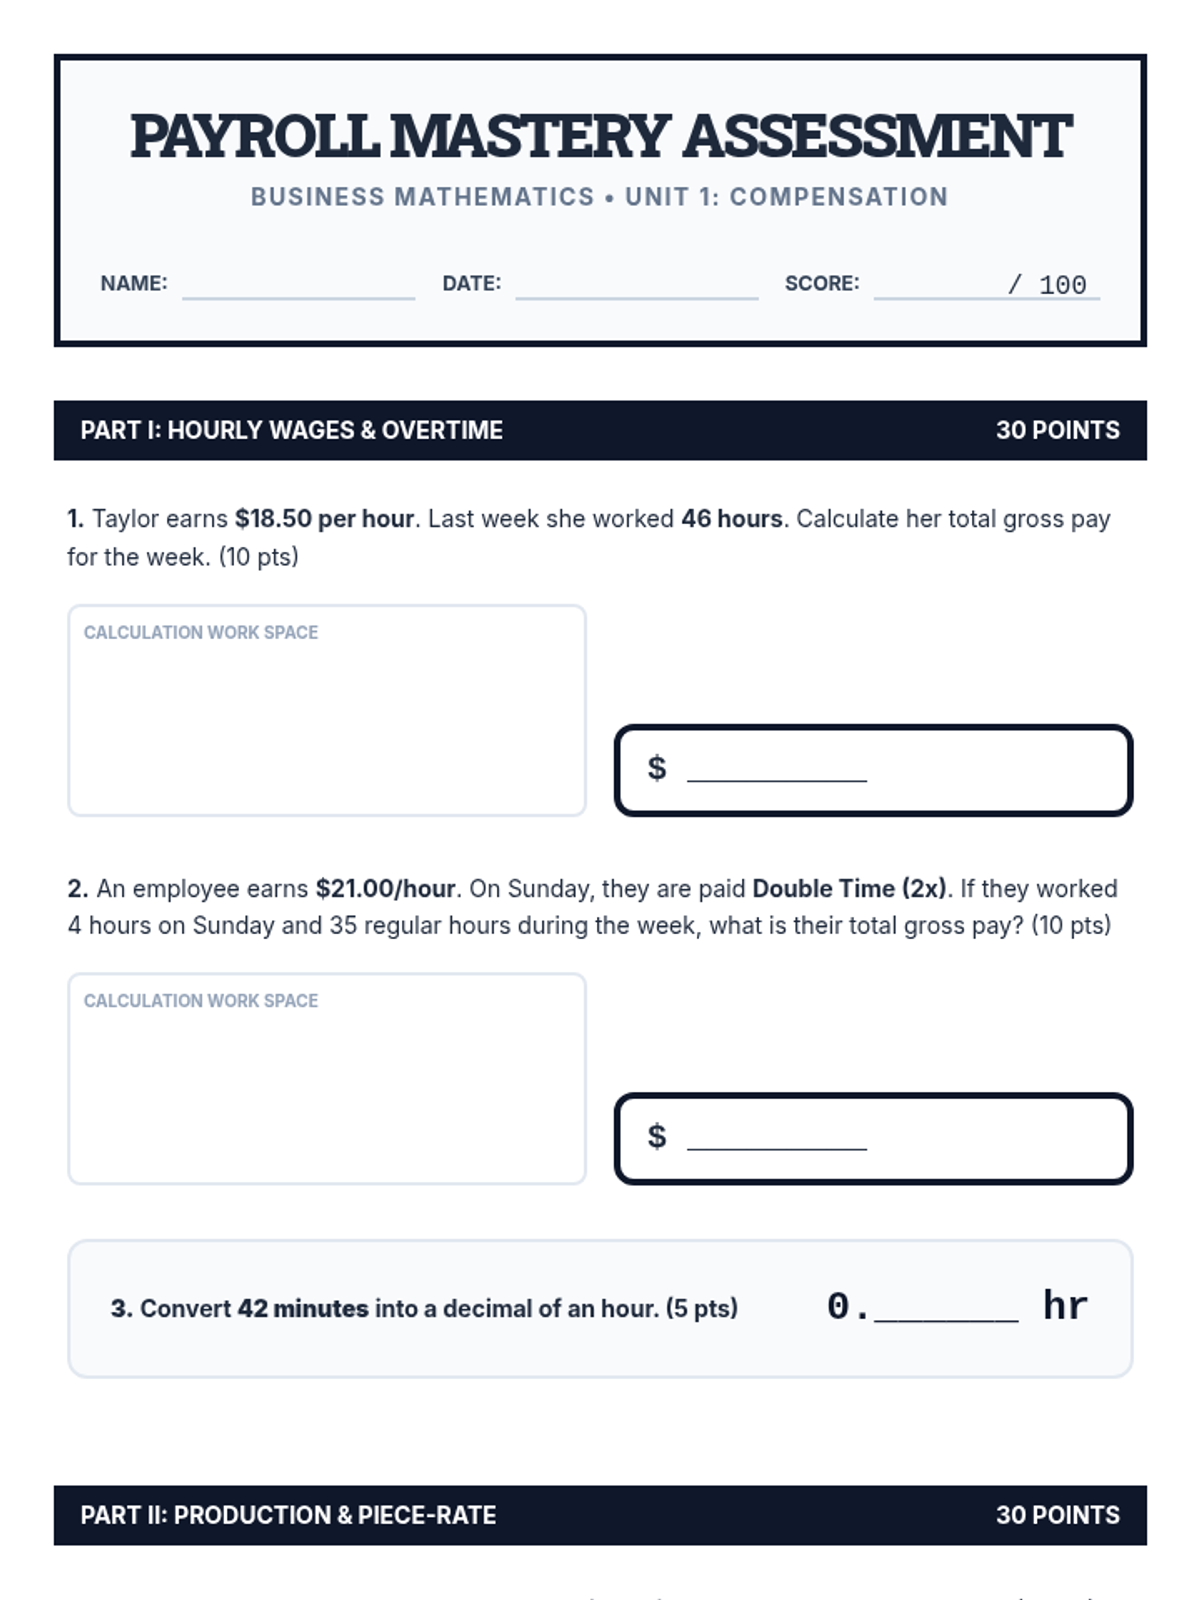
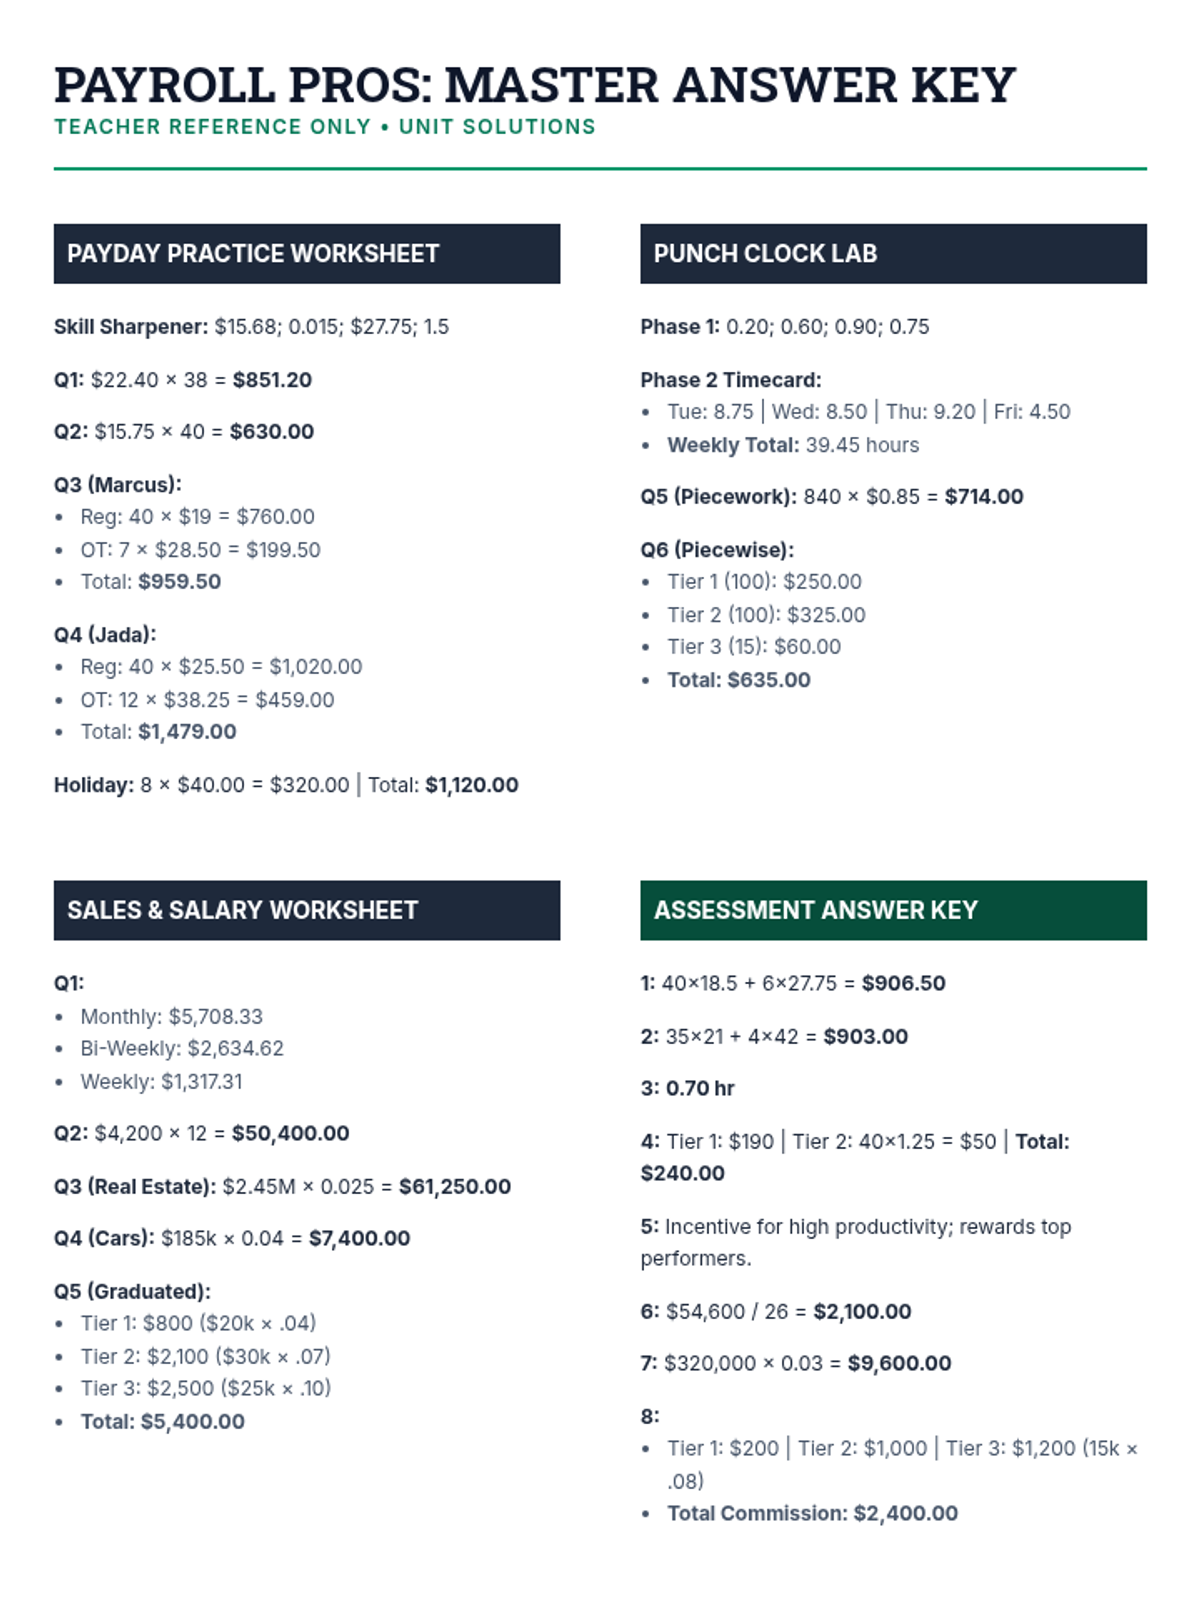
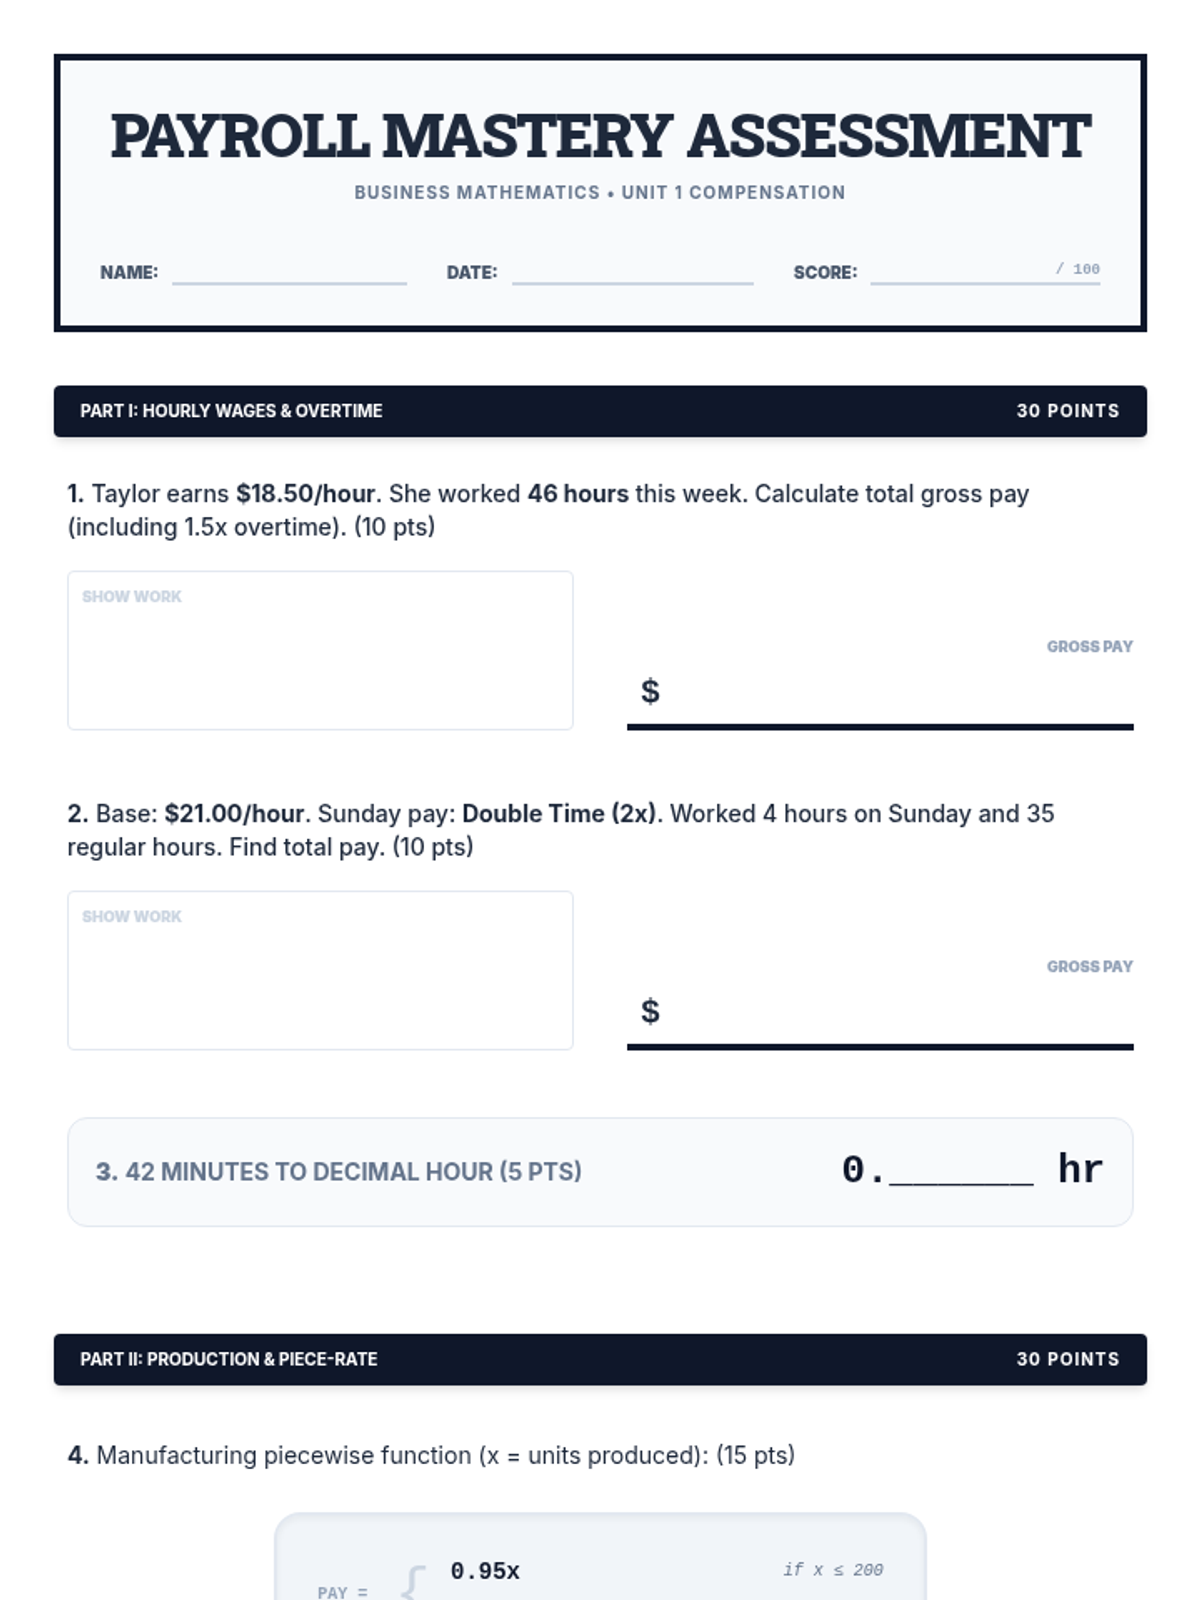
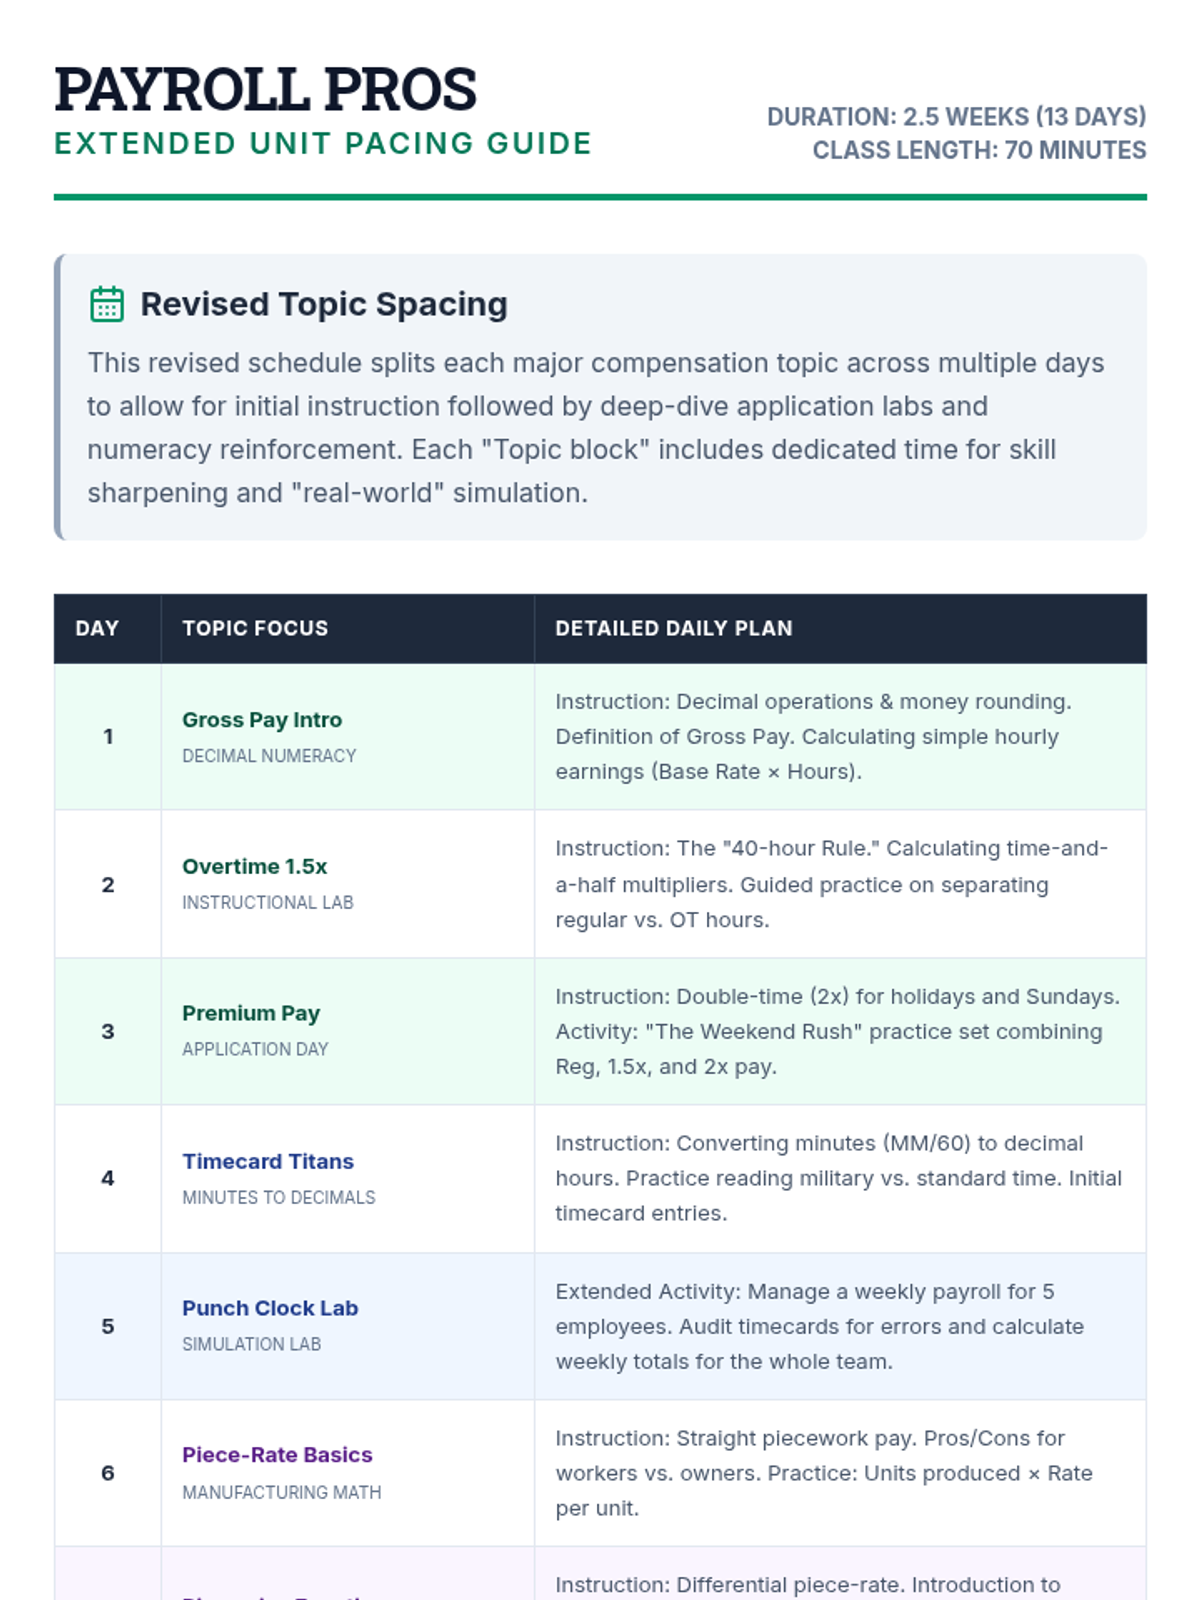
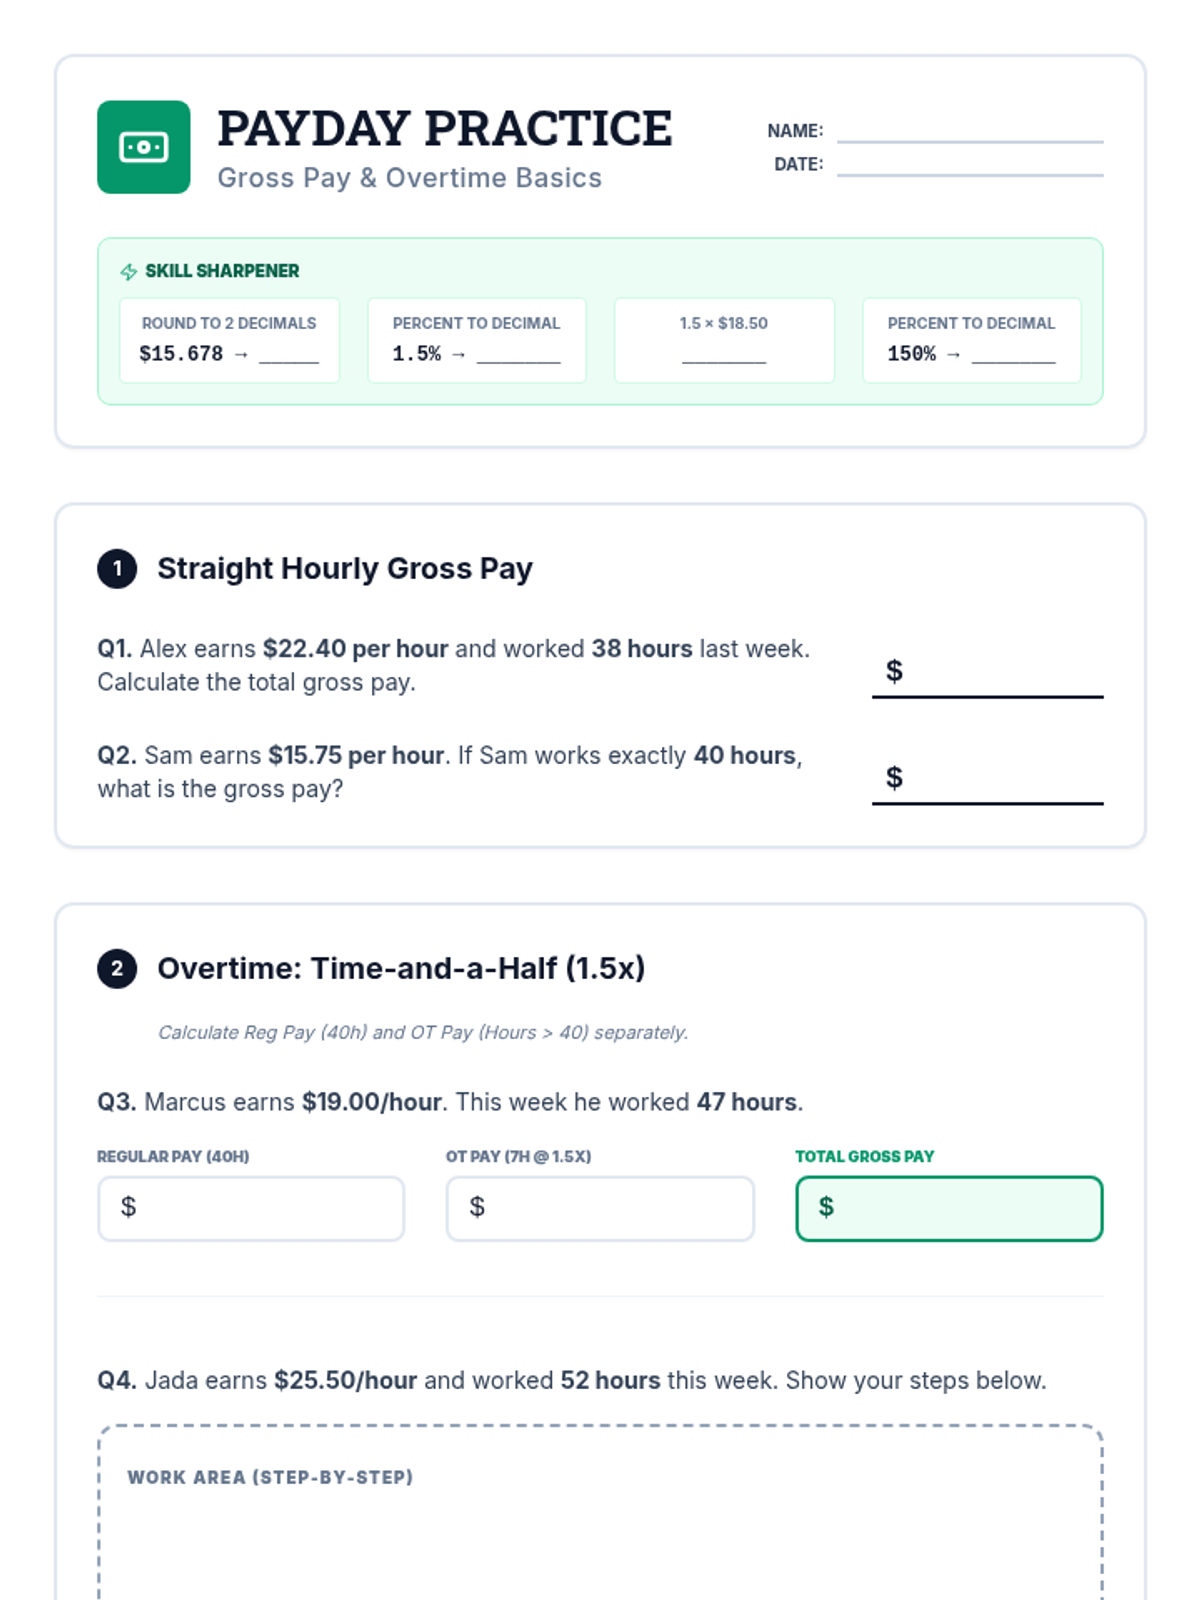
A cumulative review and final assessment covering all pay structures and business math skills taught in the unit.
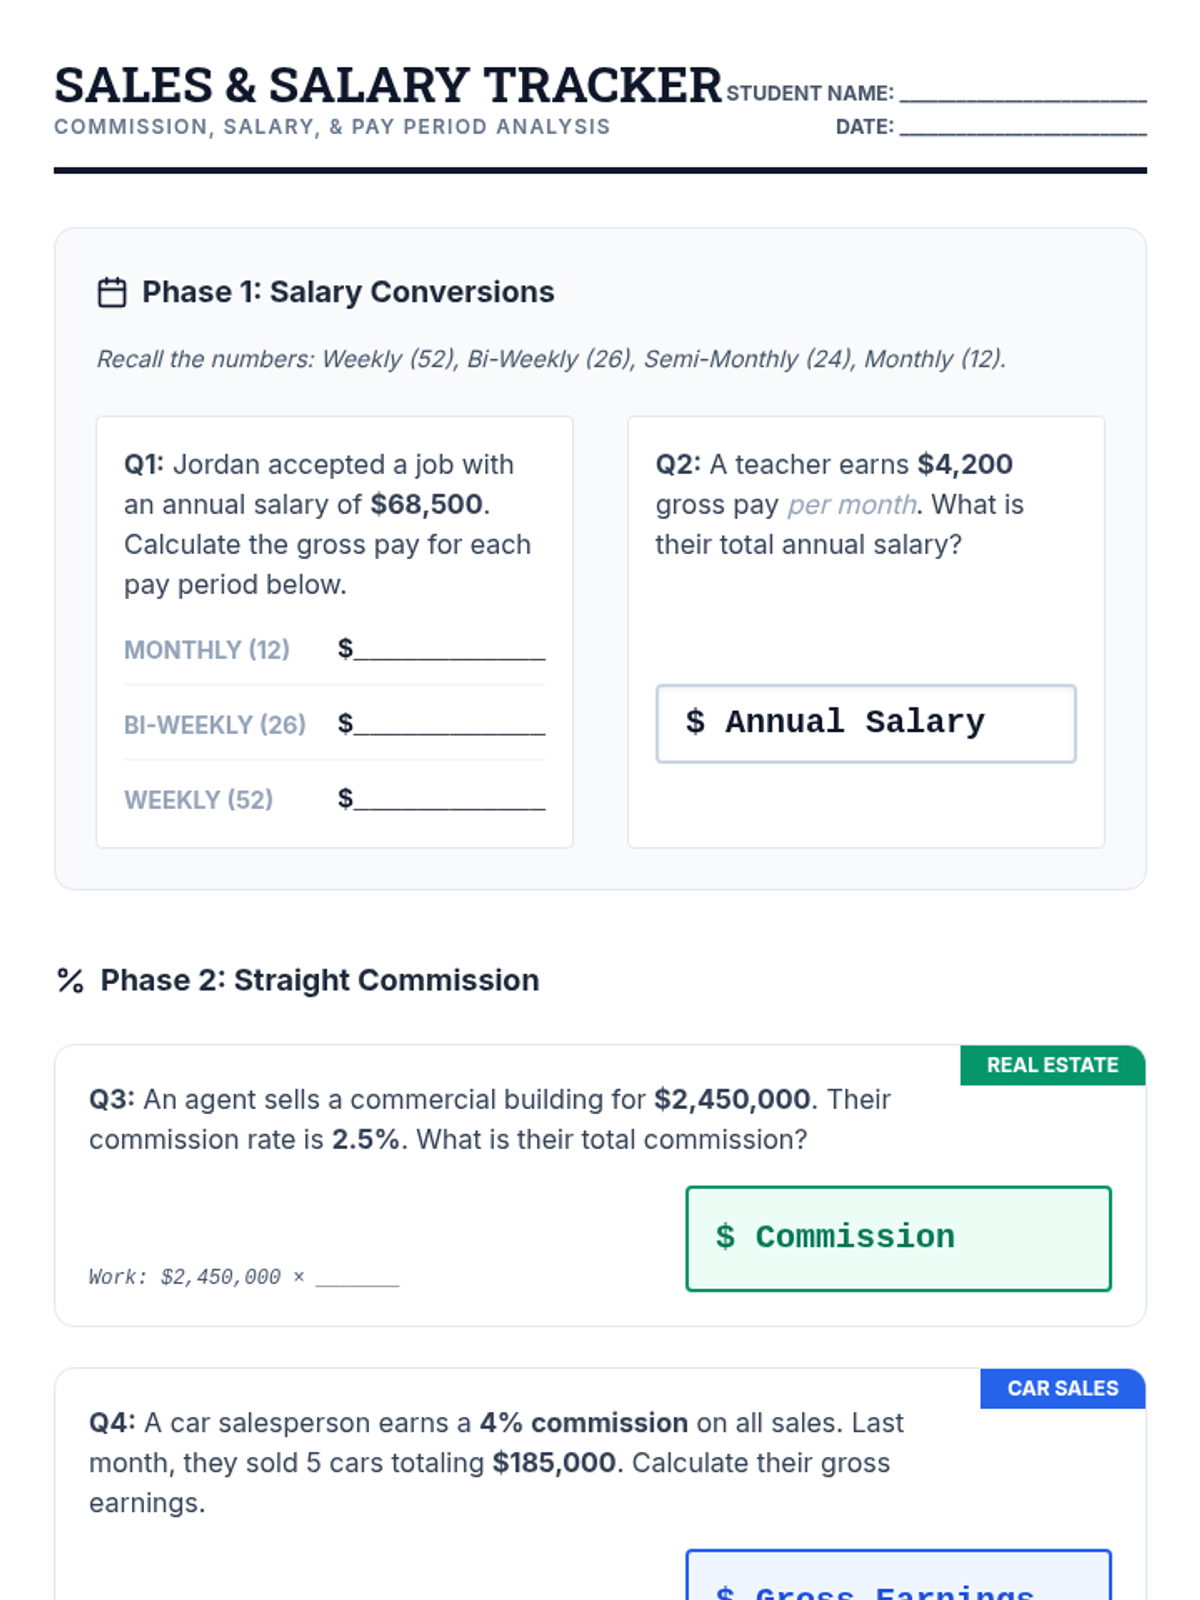
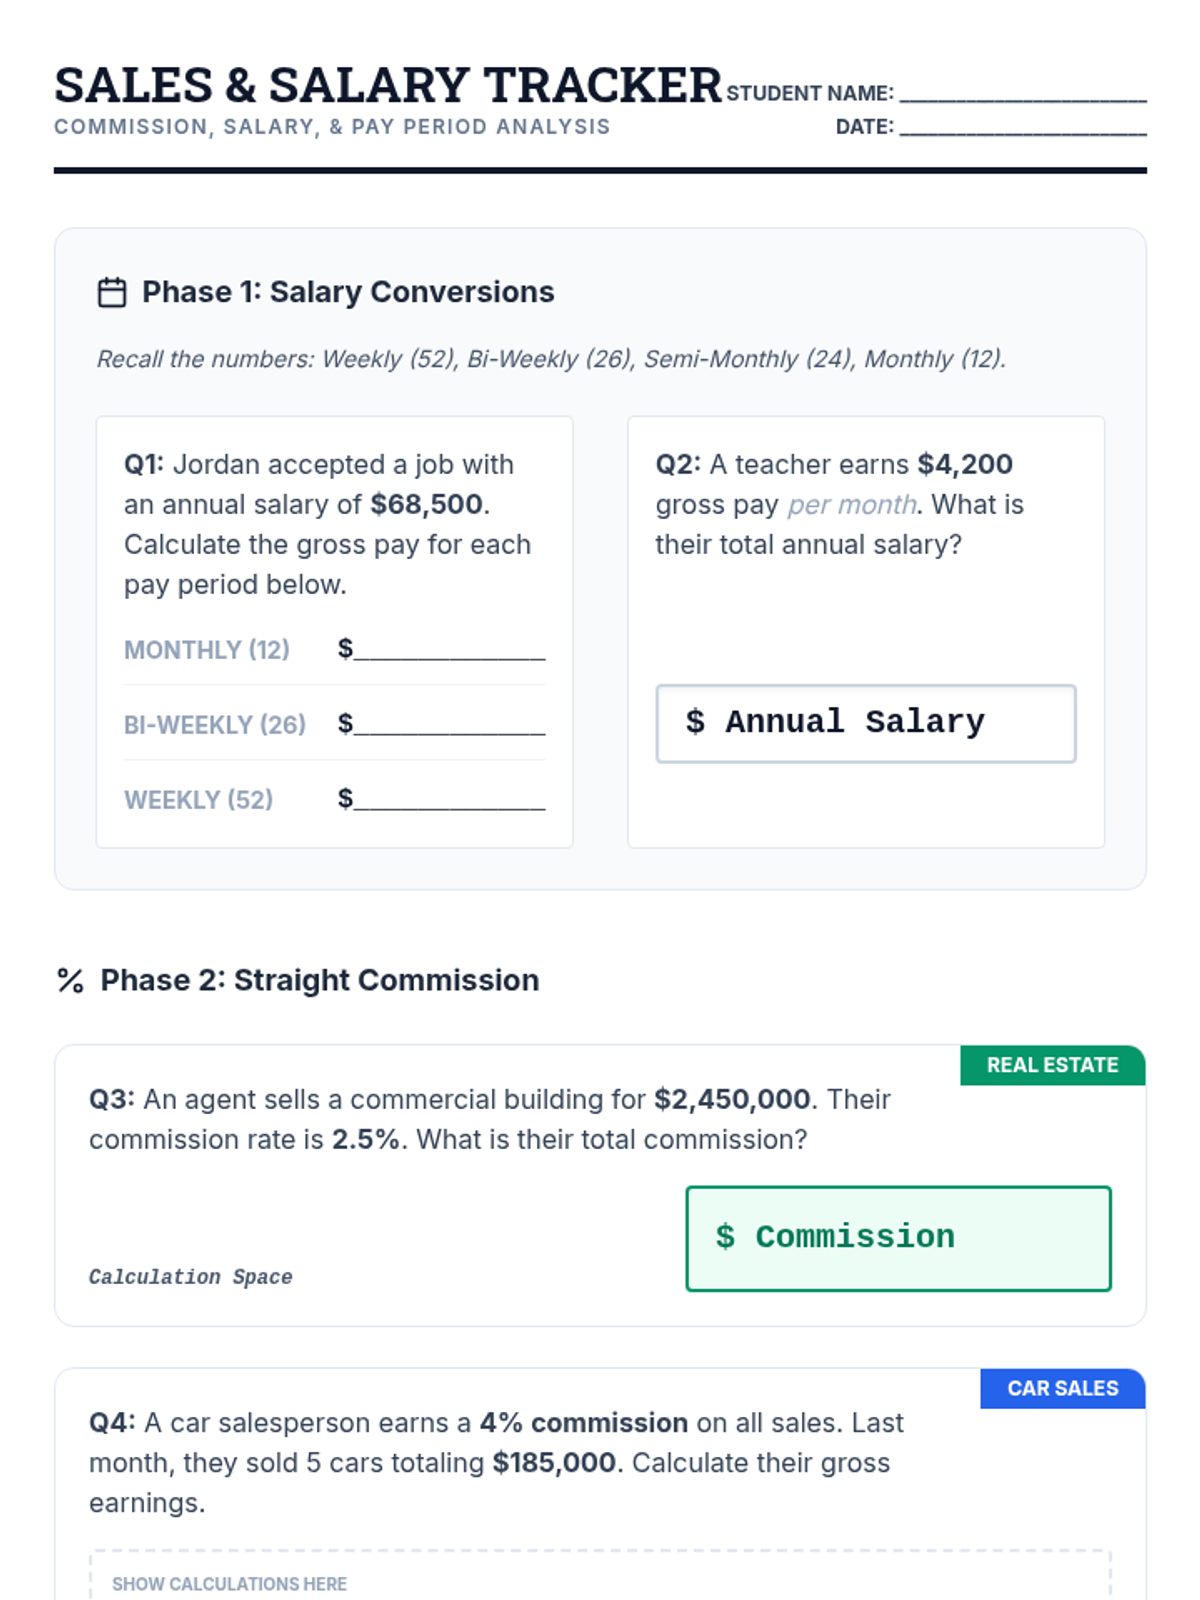
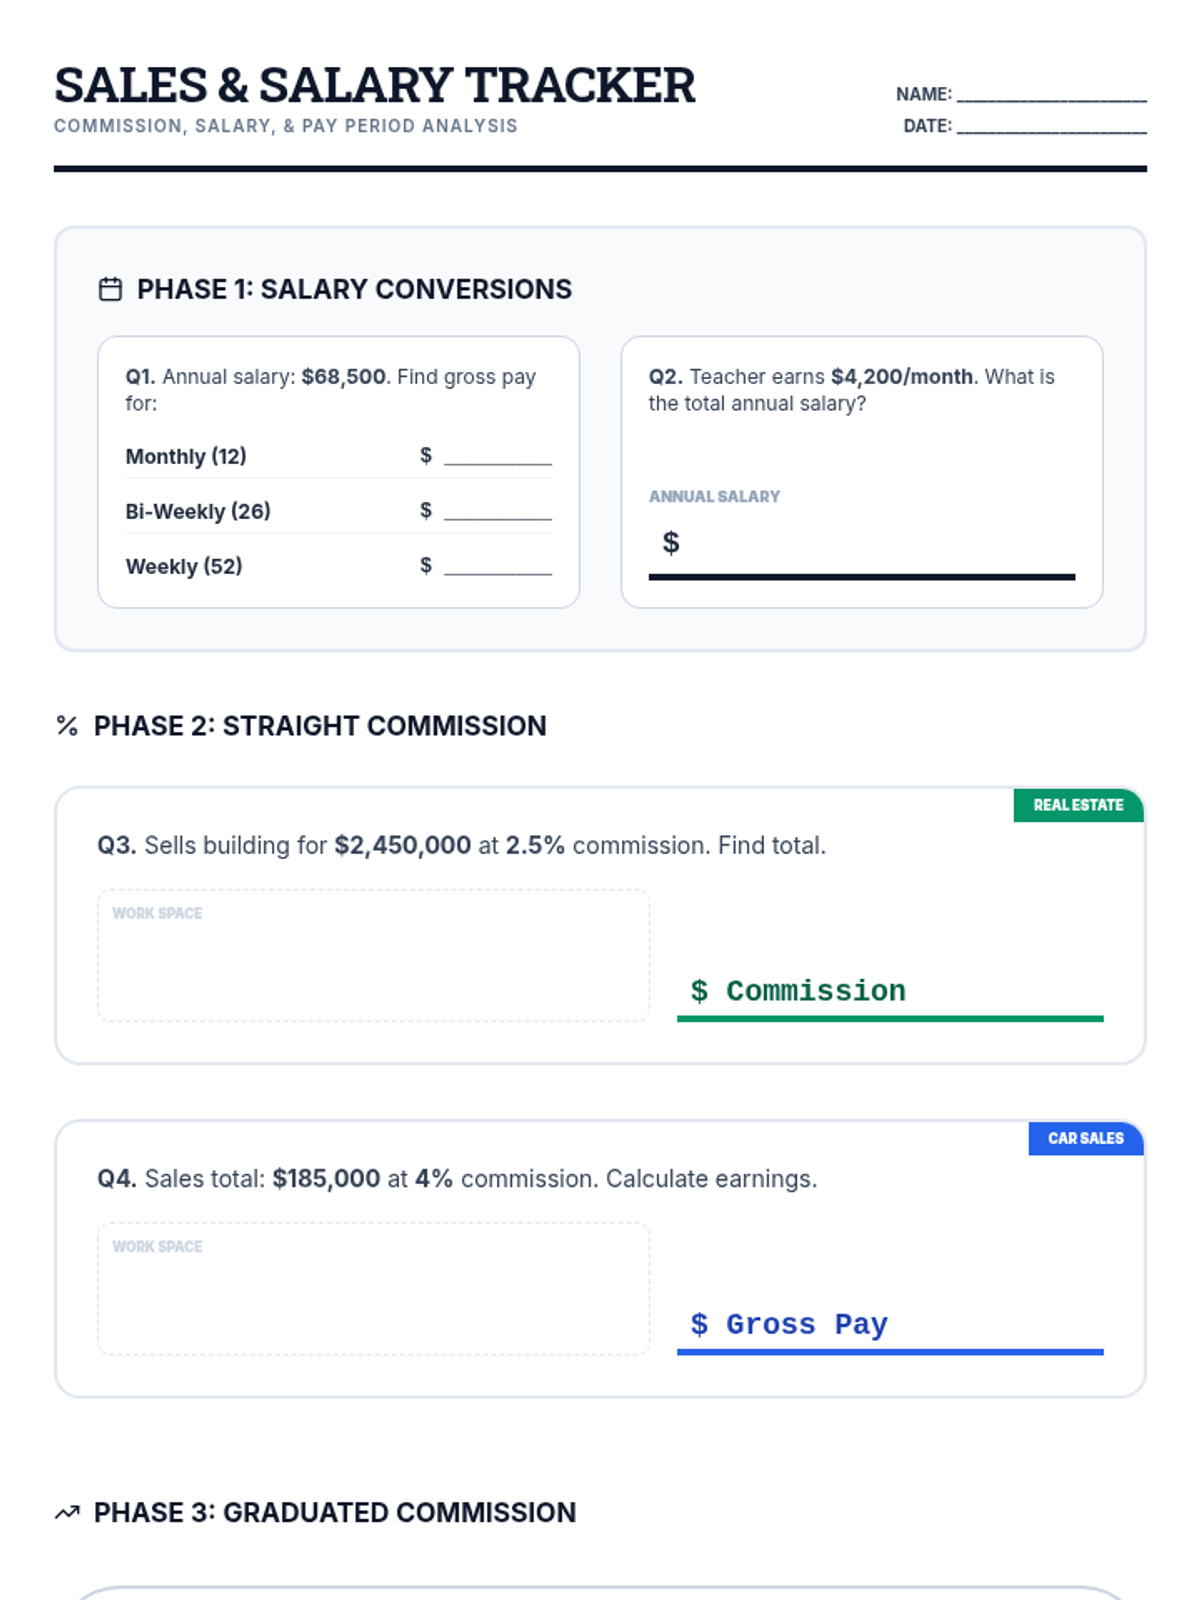
Covers commission-based earnings and salary structures, including a review of fractions as they relate to pay periods and partial earnings.
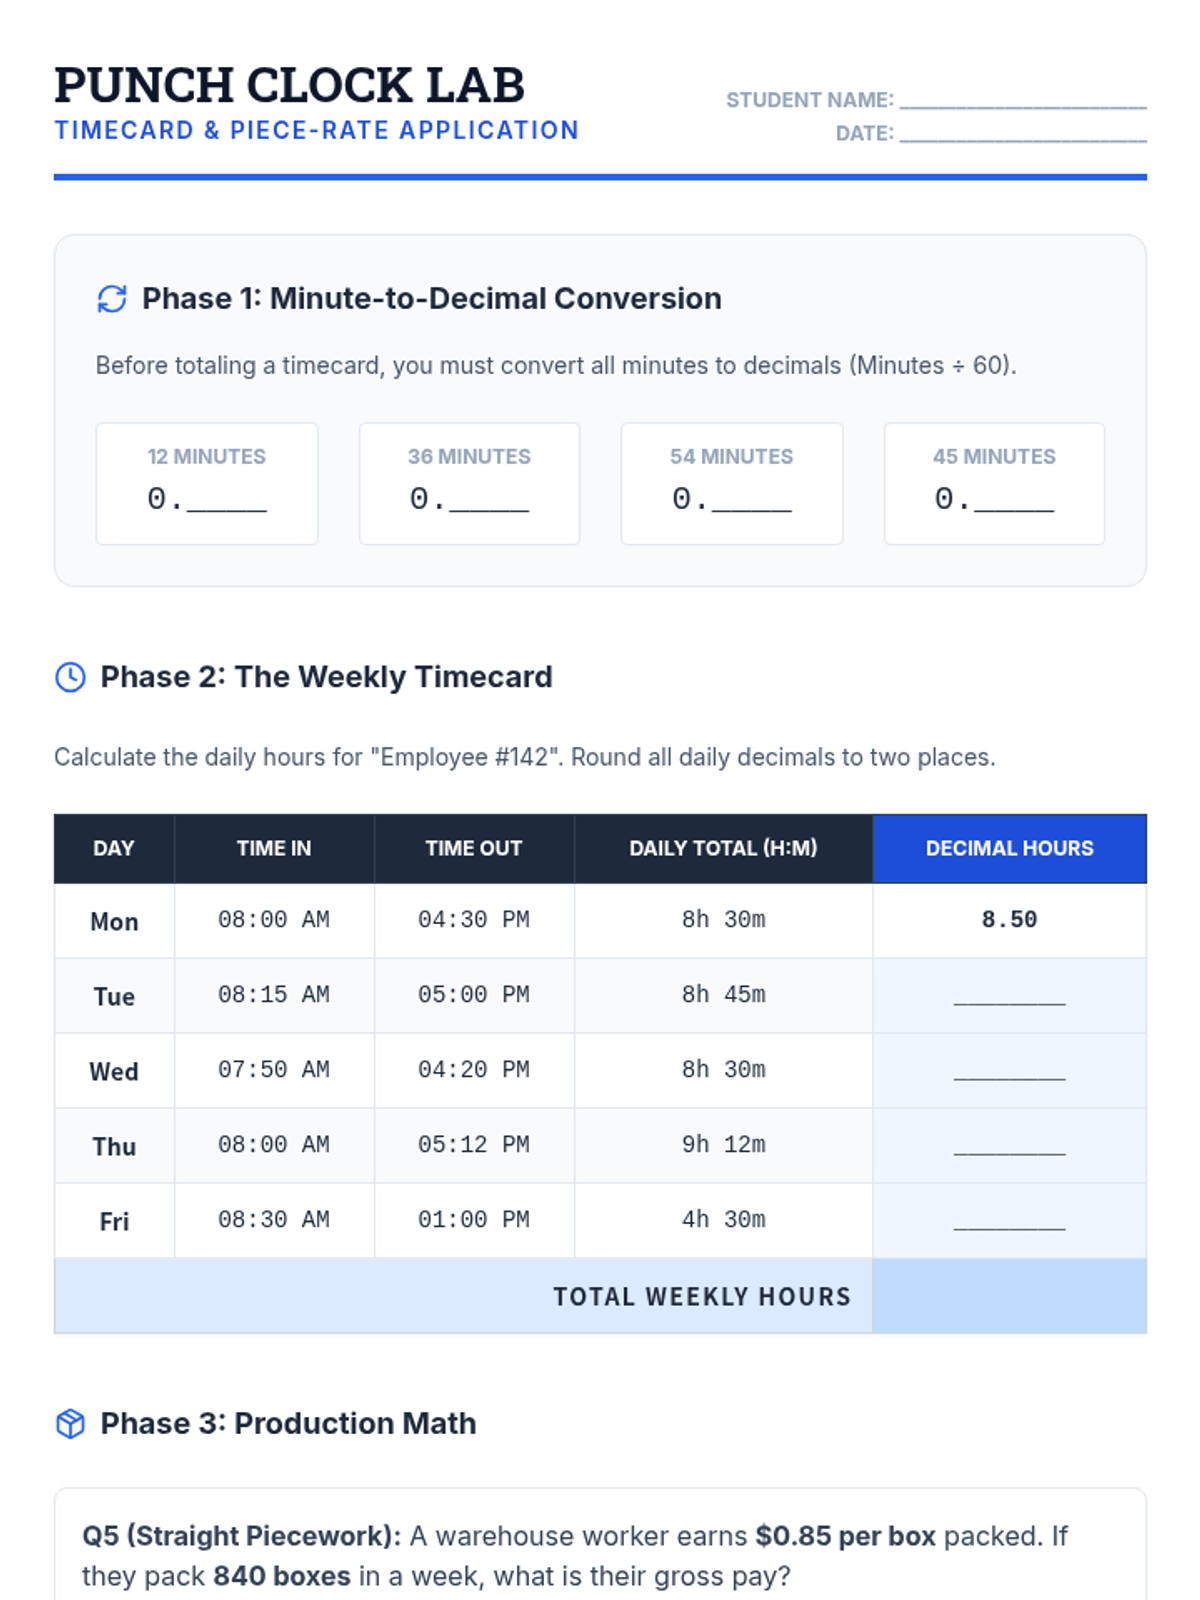
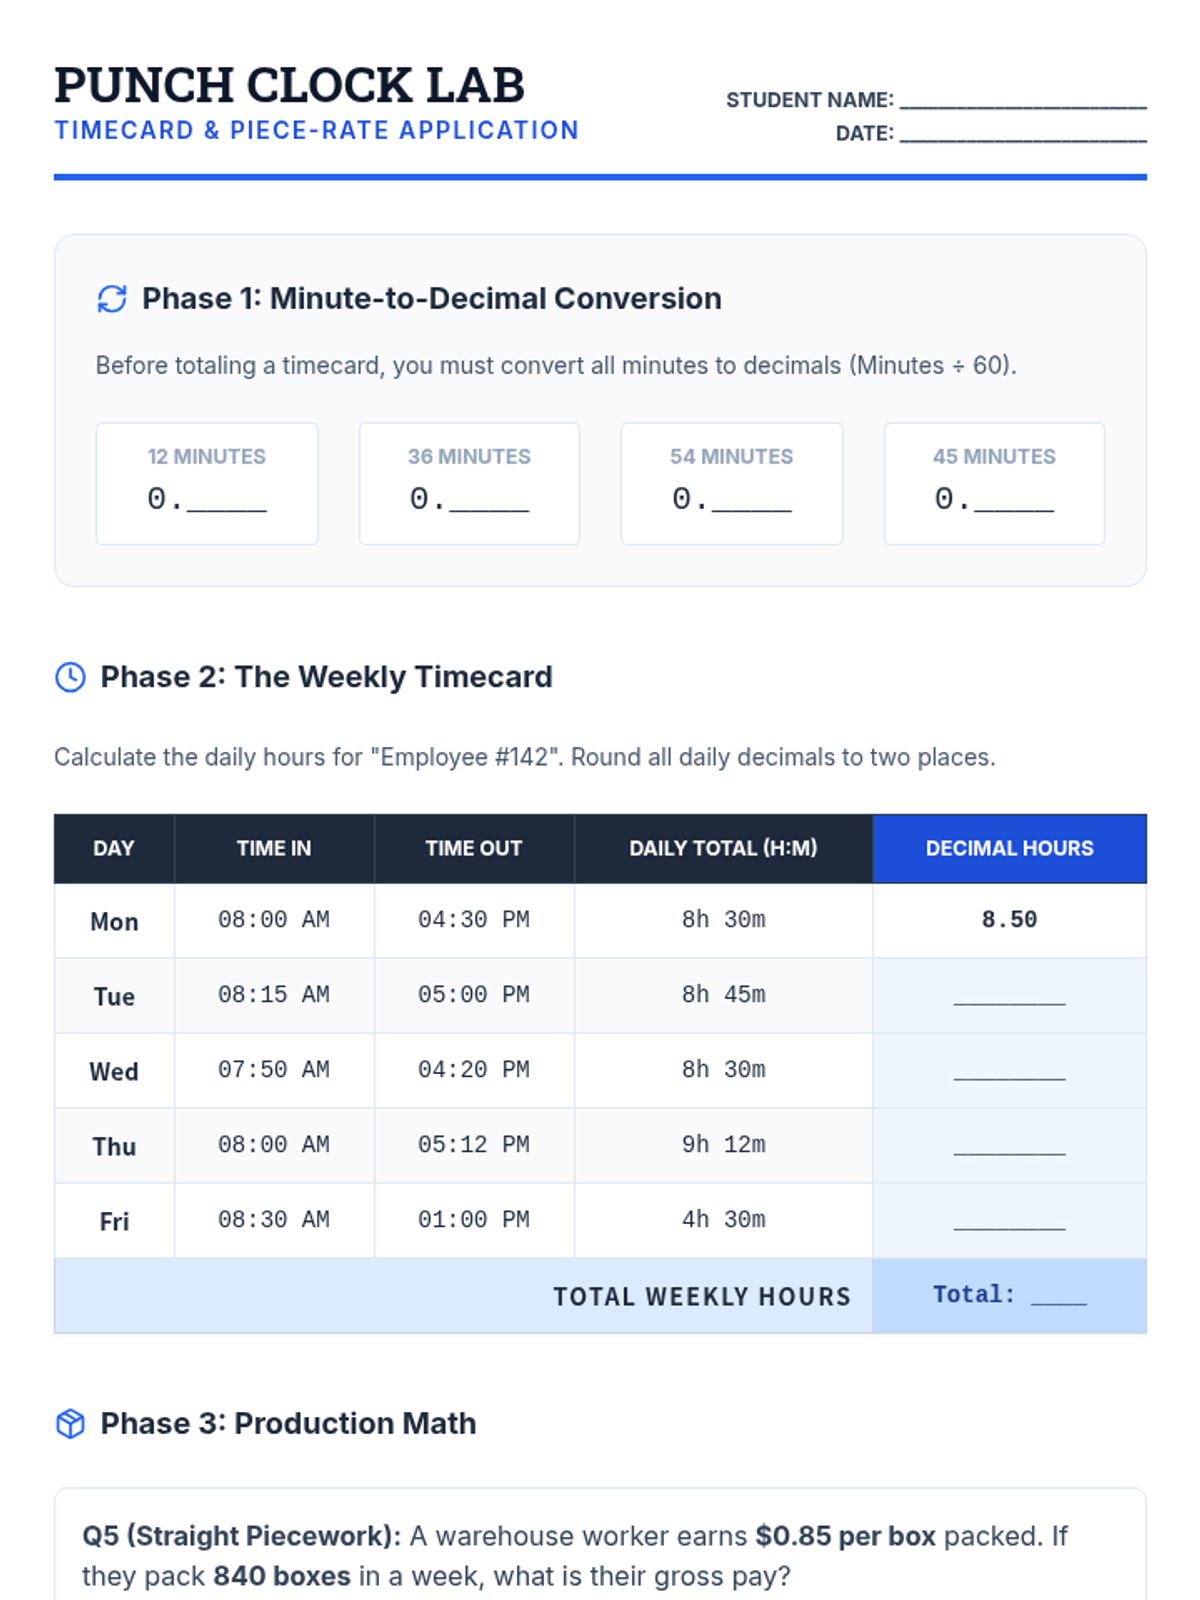
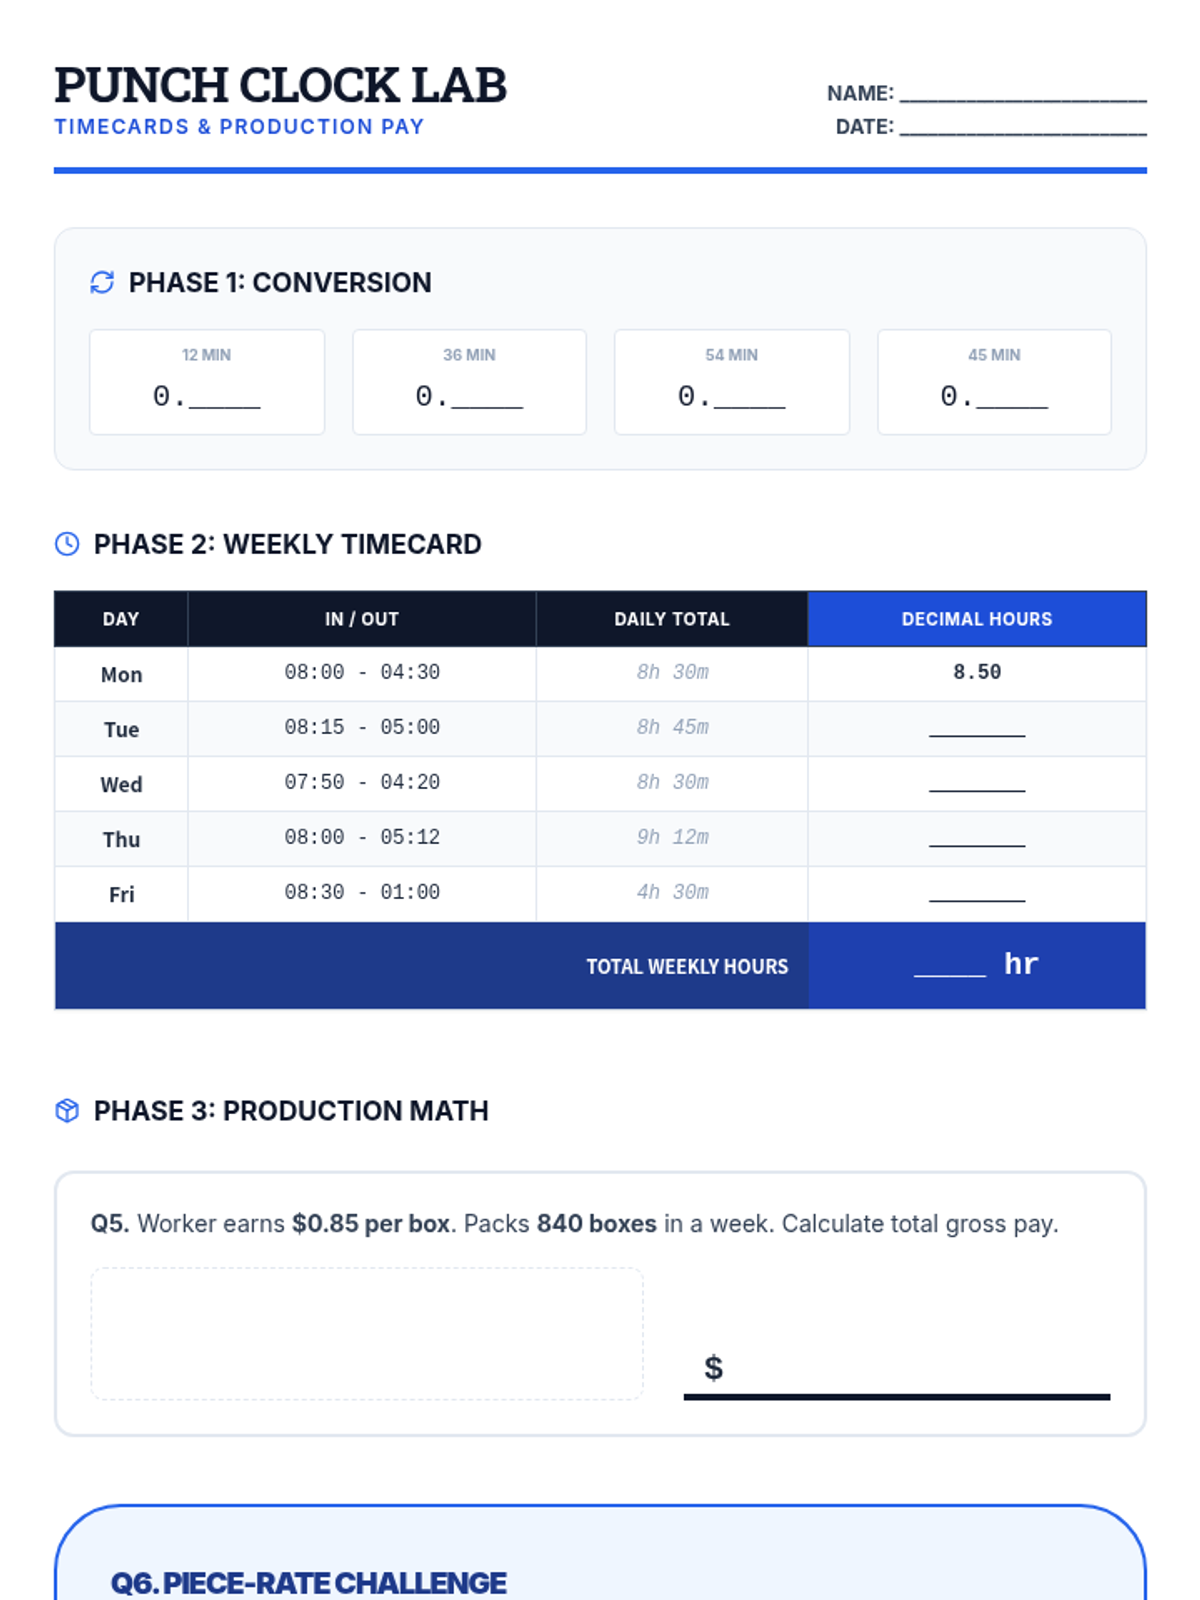
Focuses on tracking work hours through timecards and understanding production-based pay through piecework and piecewise functions.
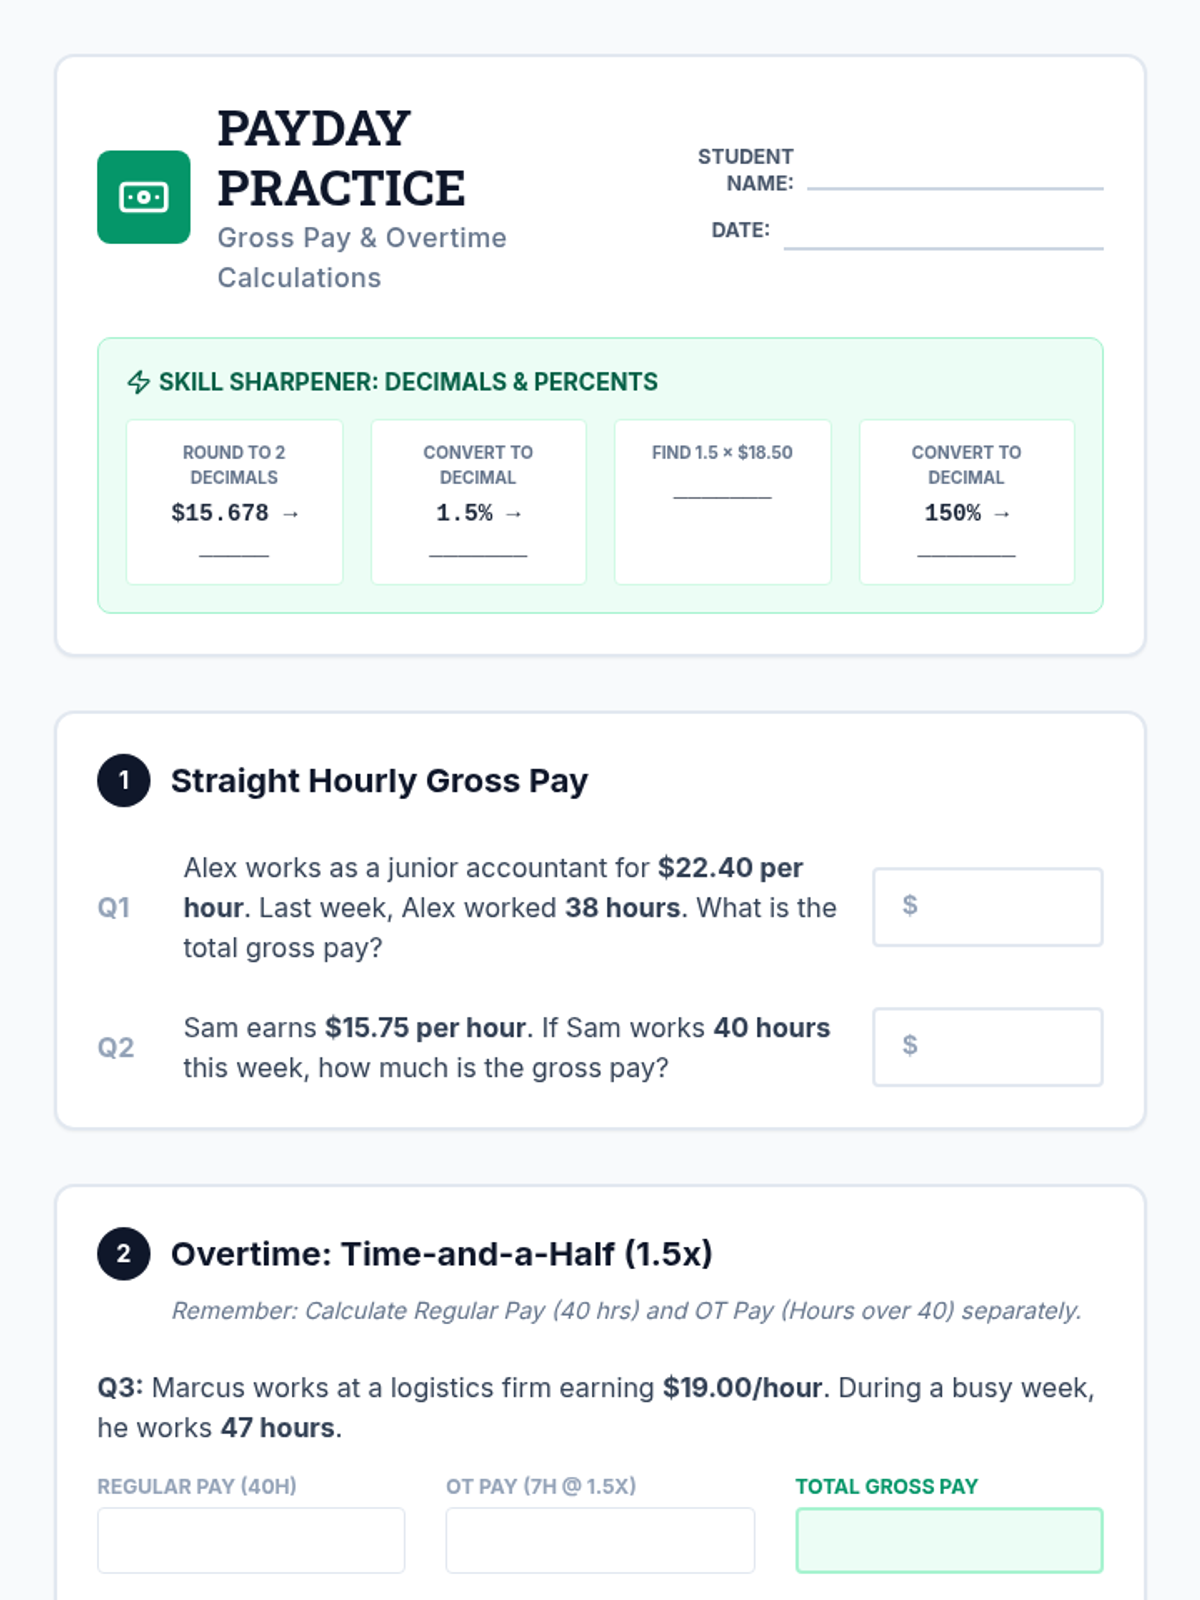
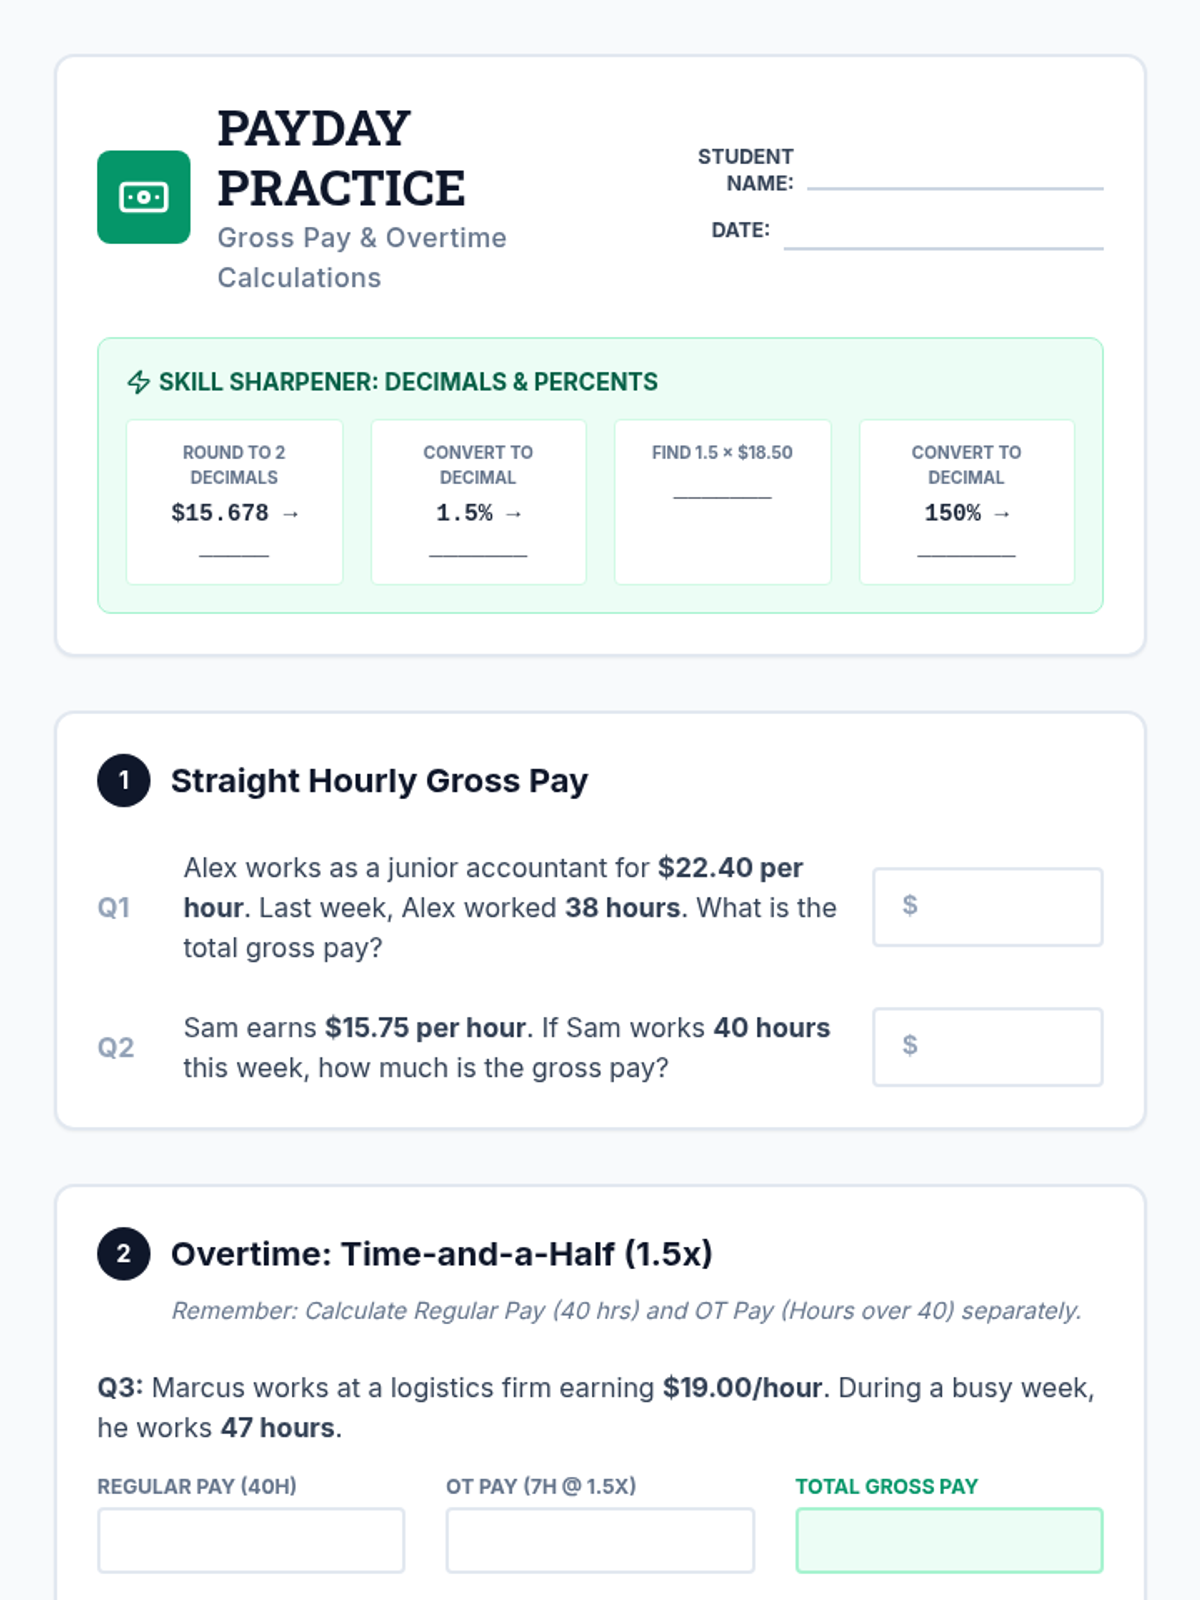
Introduction to gross pay, hourly wages, and overtime calculations, including a review of decimals and percentages for business applications.
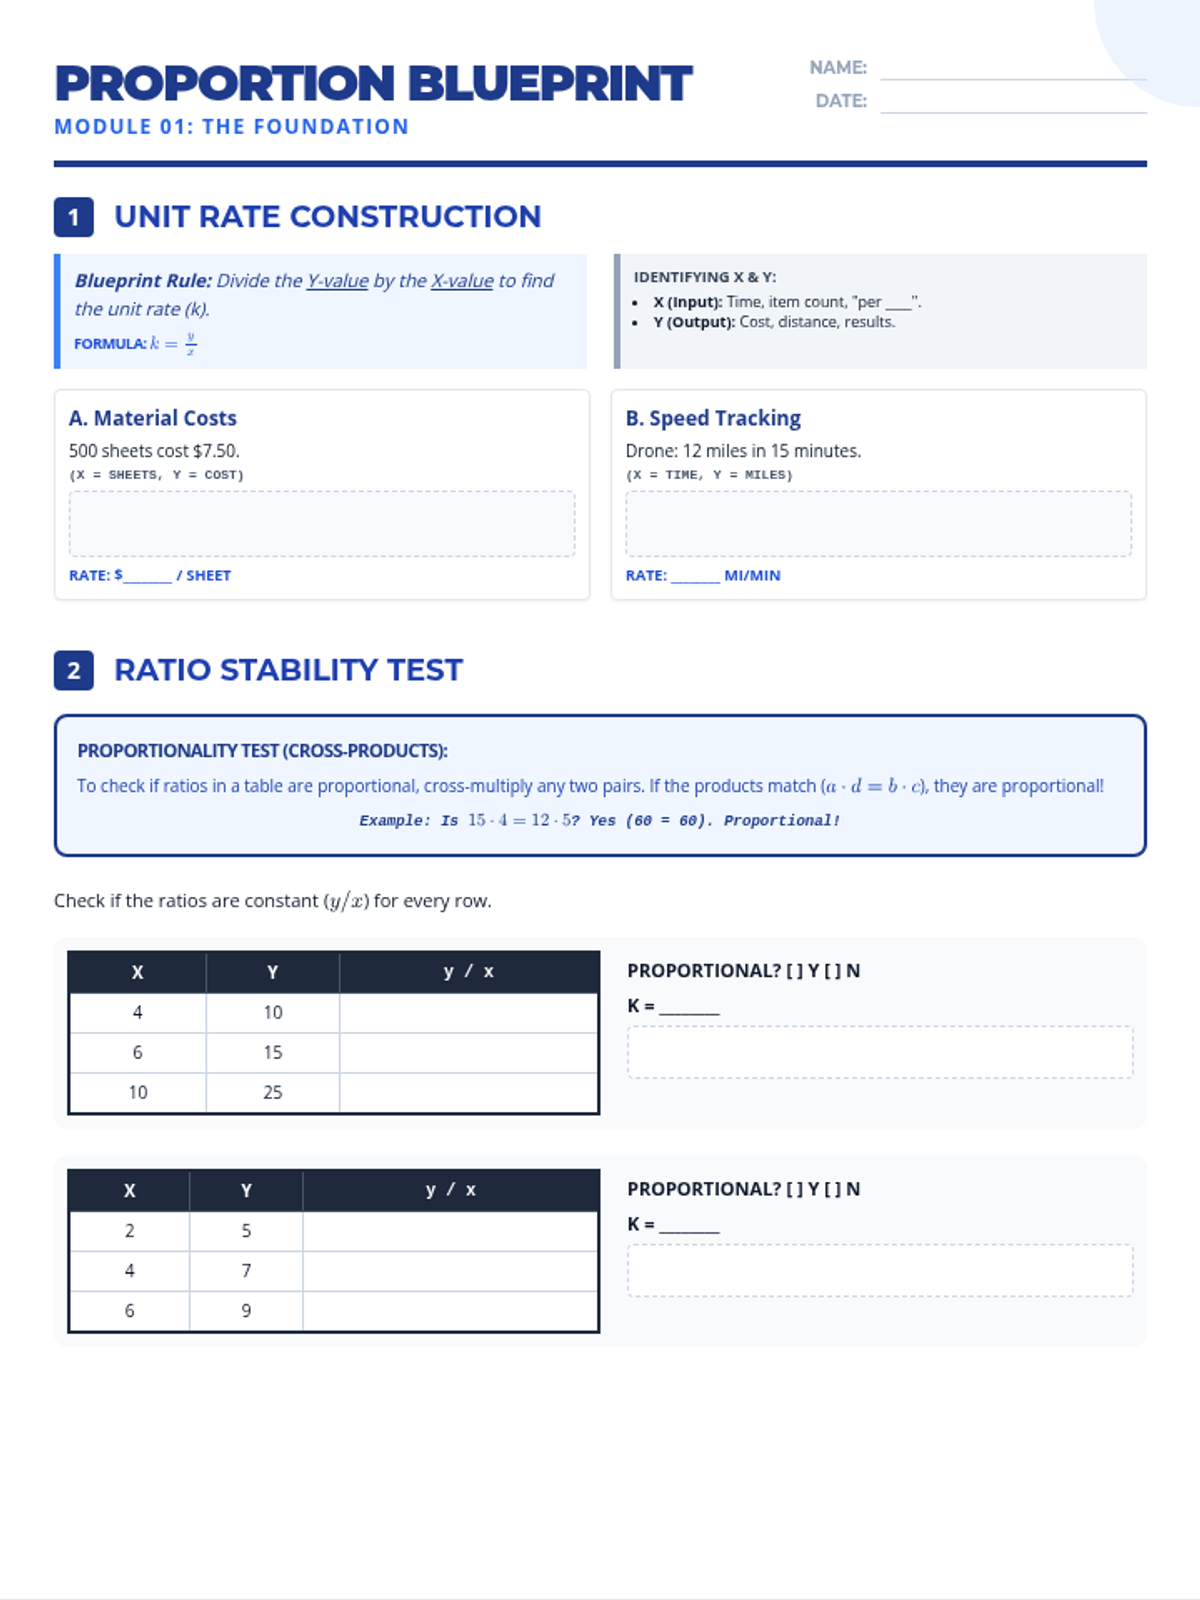
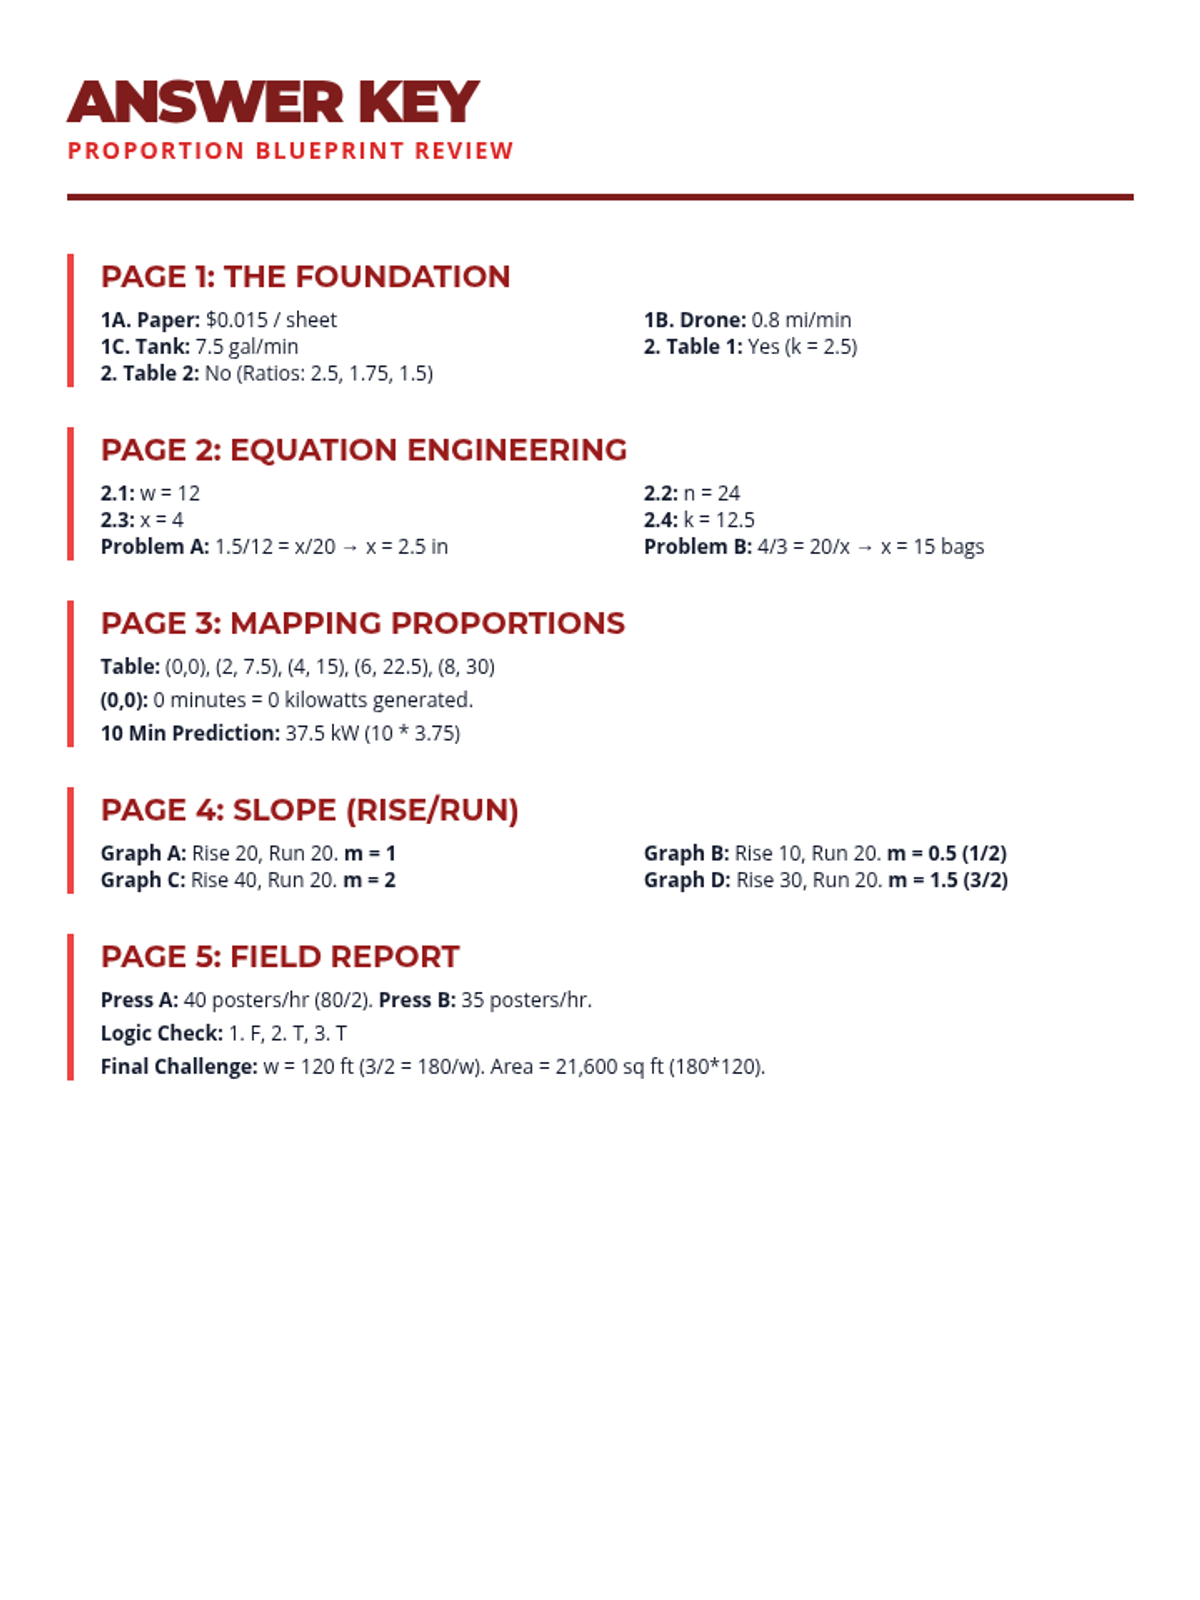
A comprehensive 5-page review packet covering 7th-grade proportional relationship standards through scaffolding and visual modeling. Students move from unit rates to solving complex word problems and interpreting graphs.
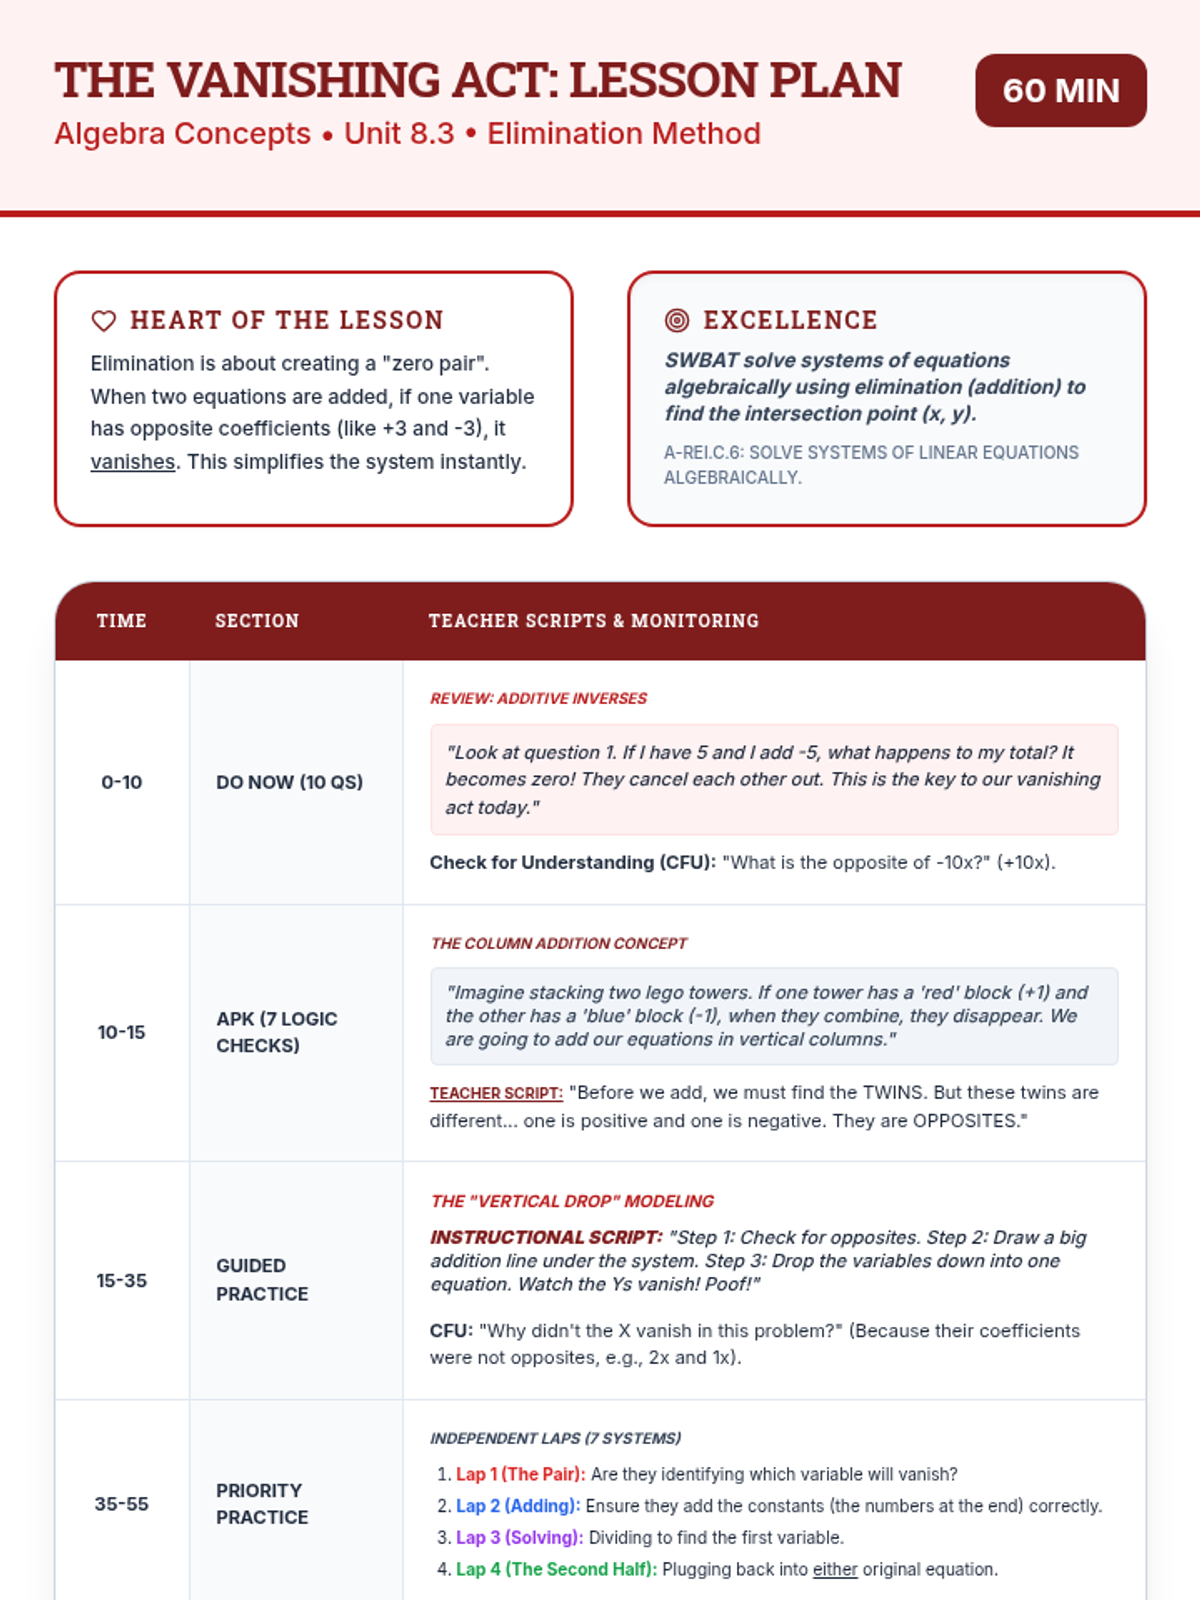
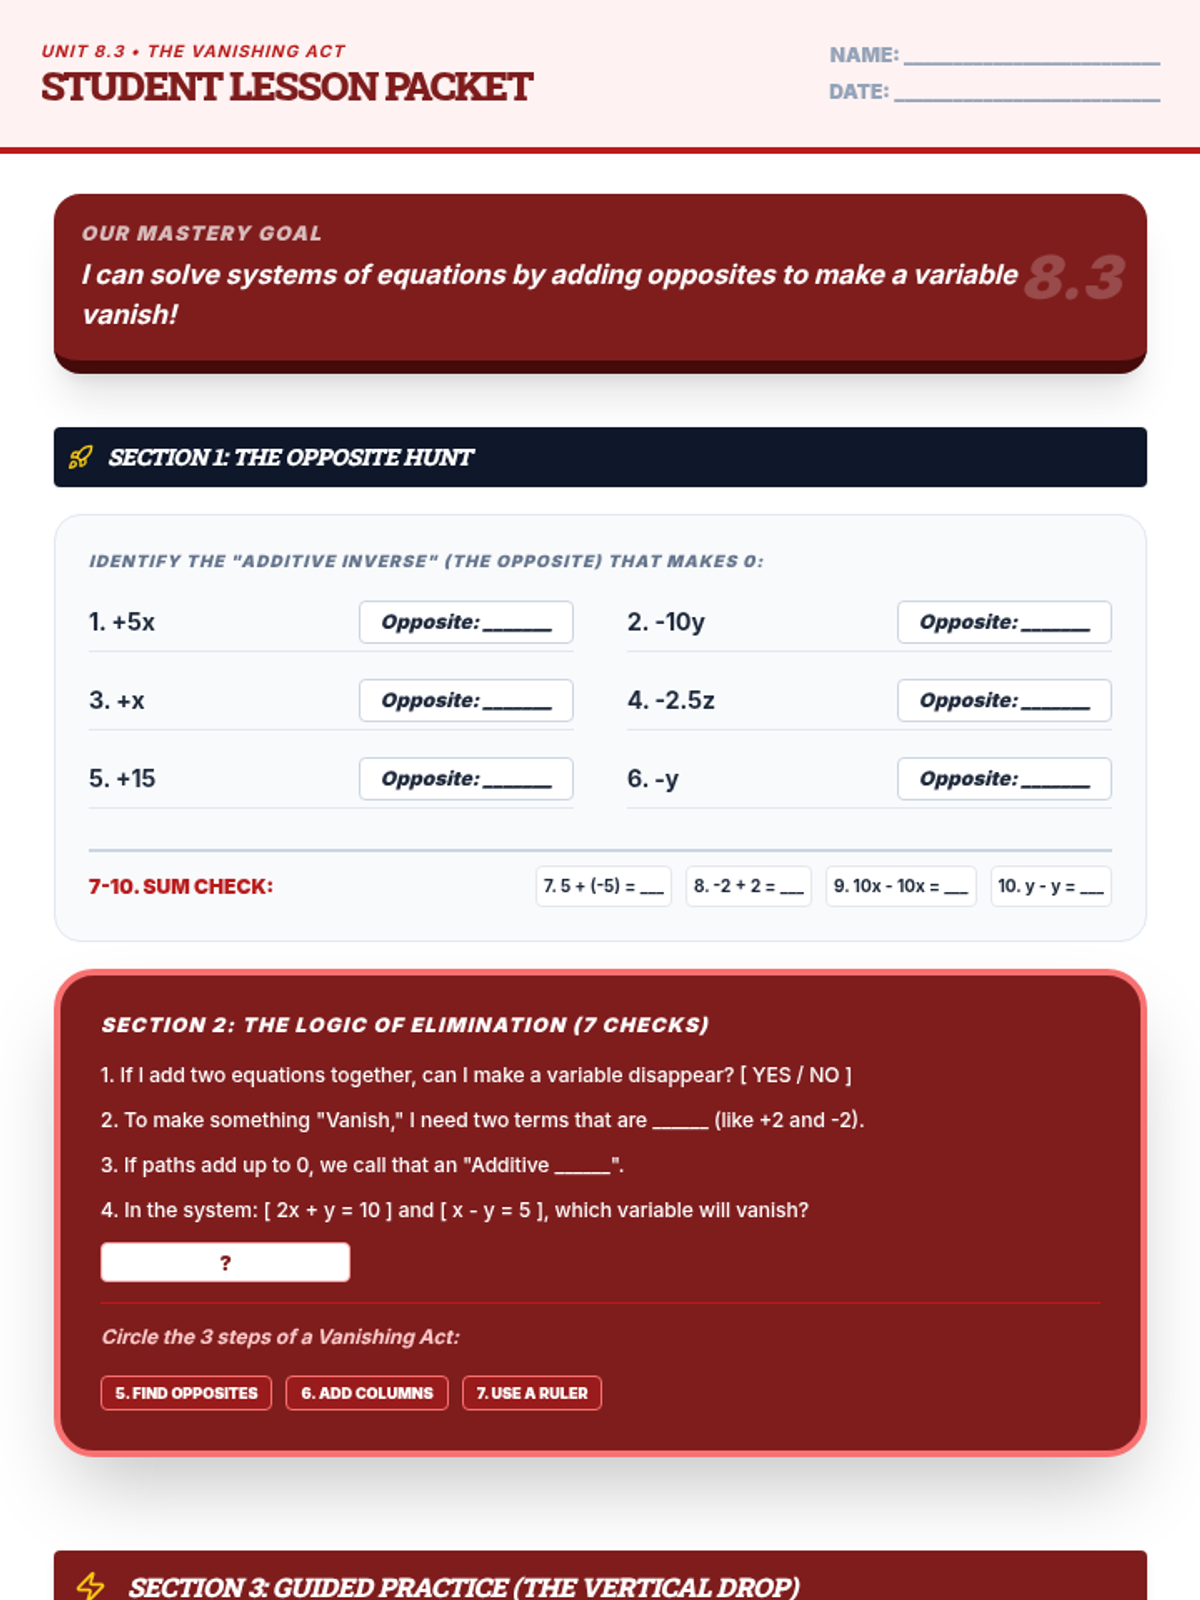
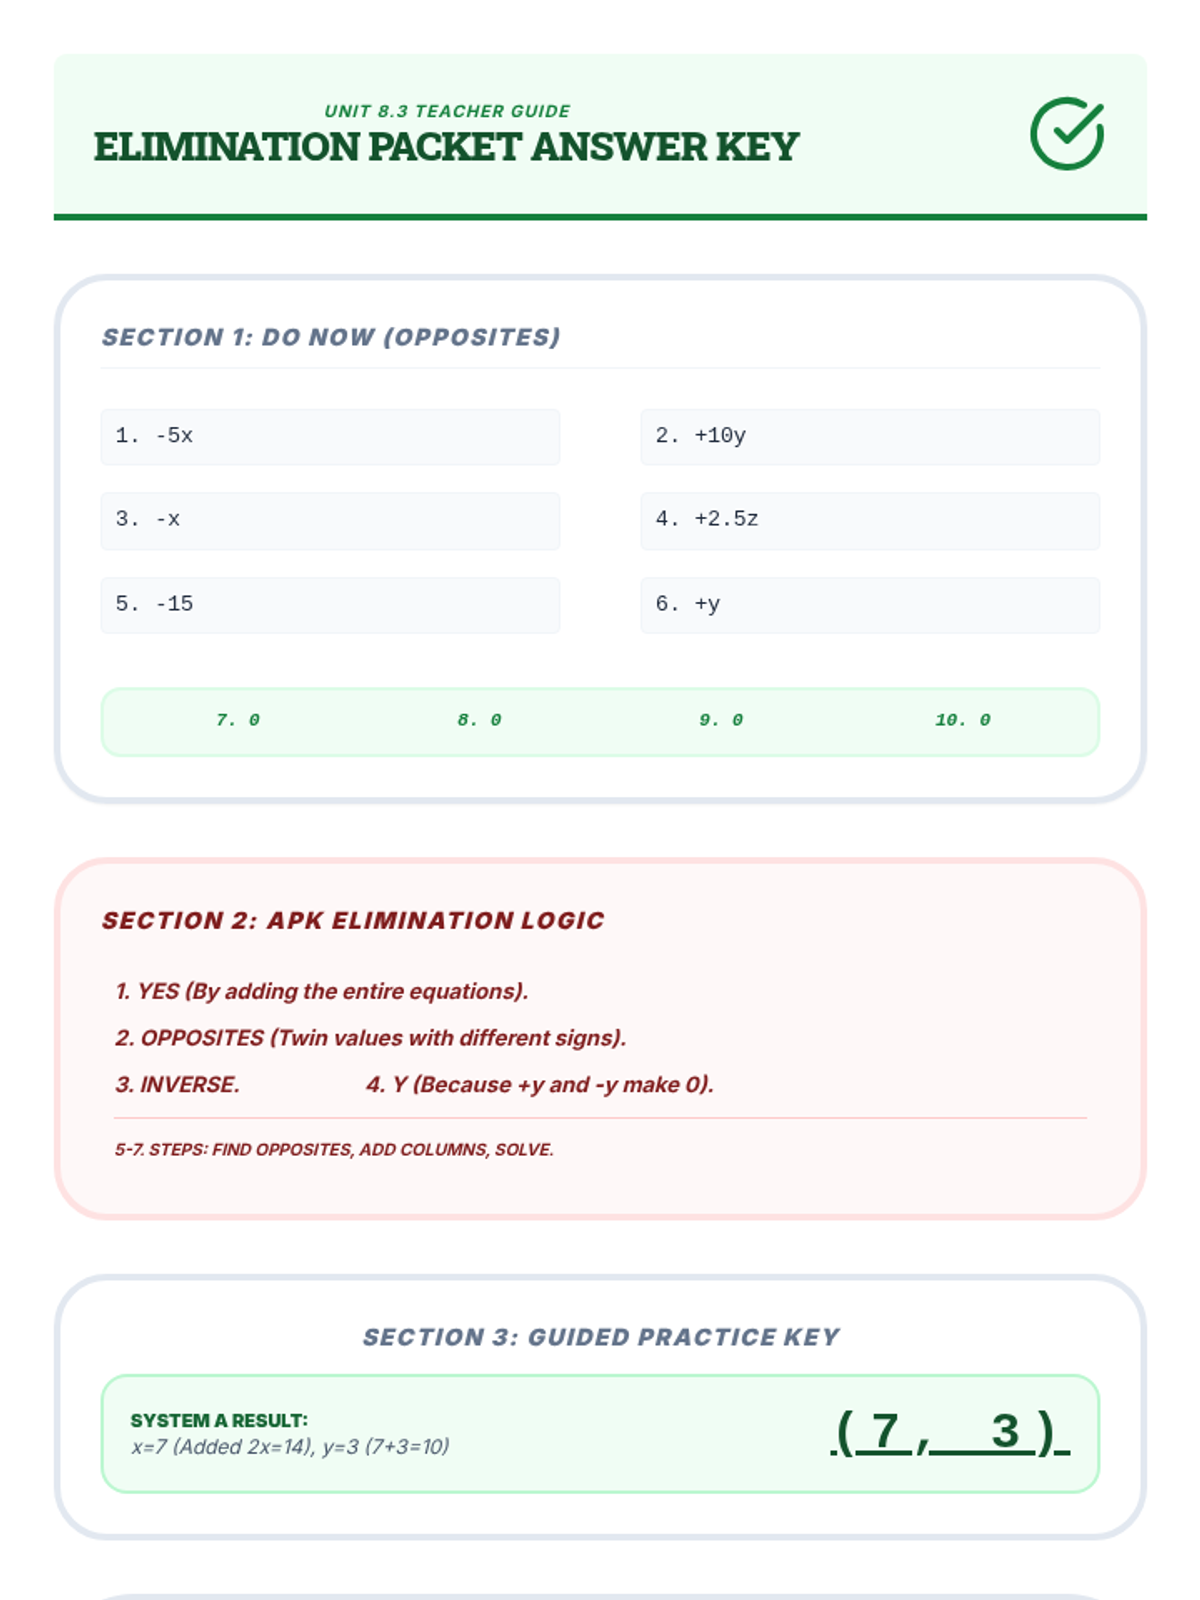
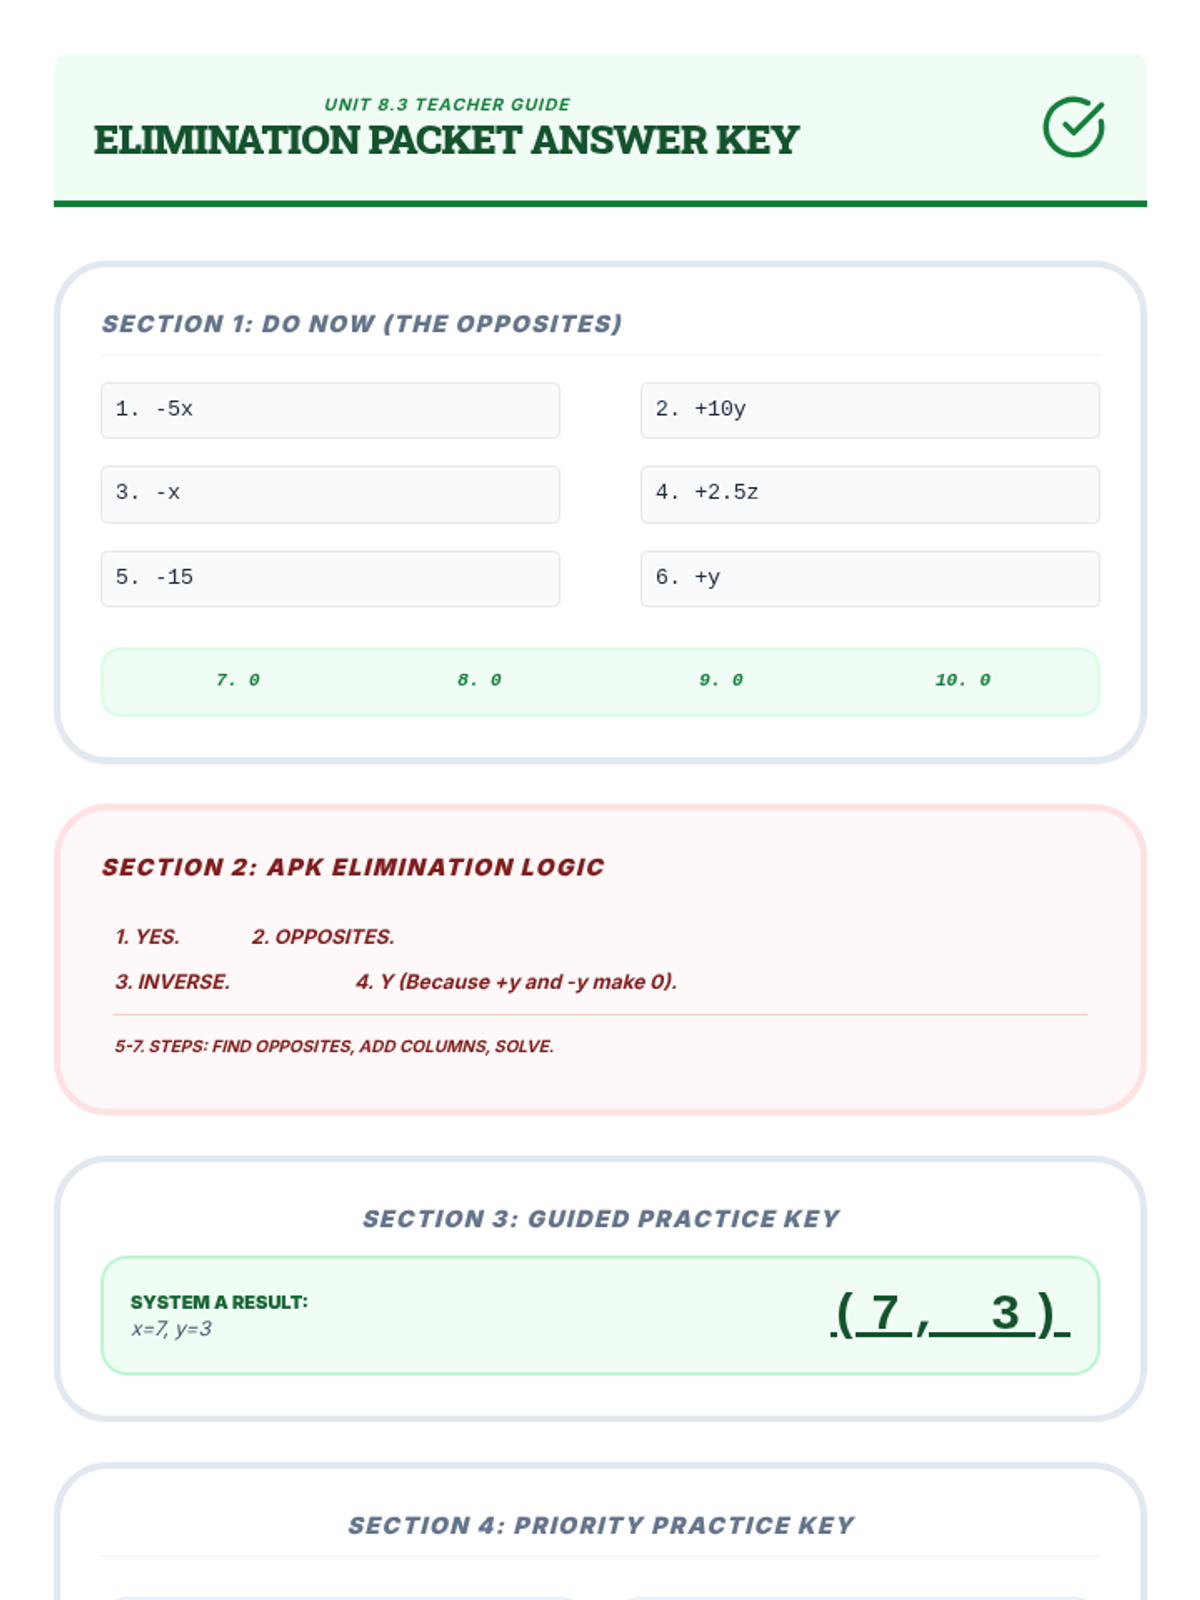
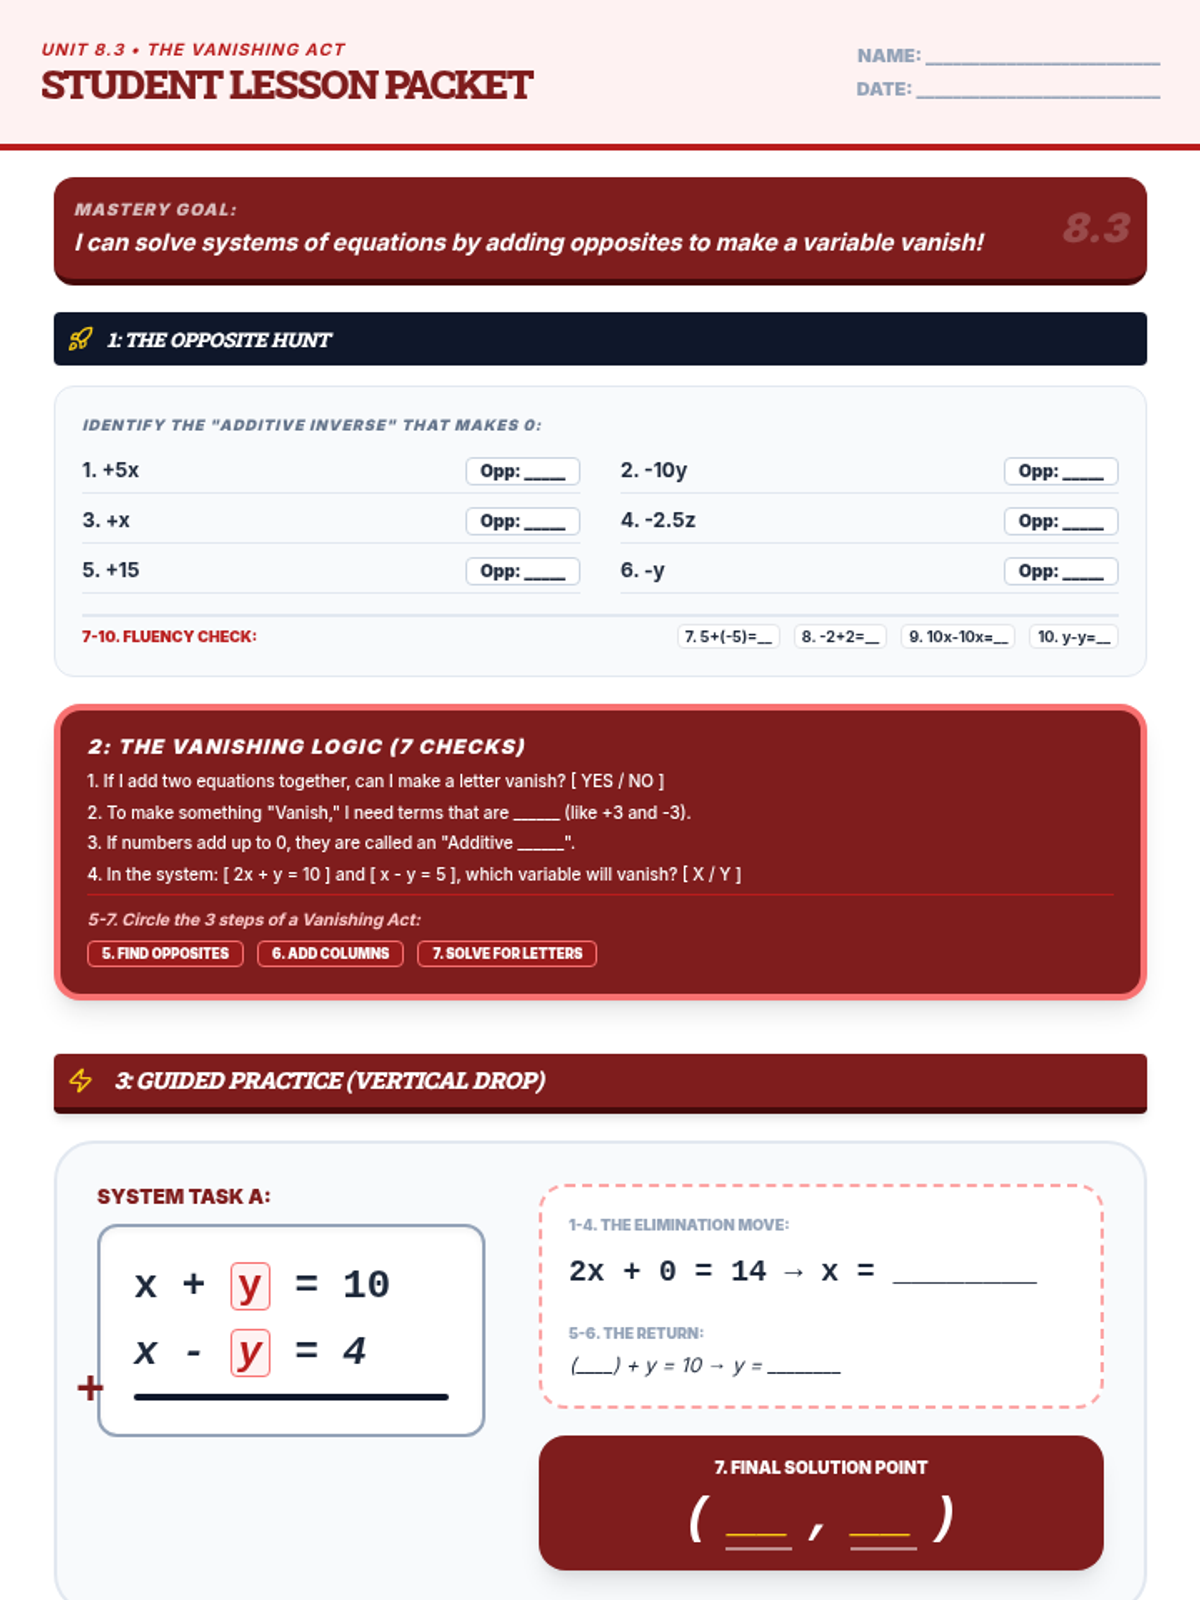
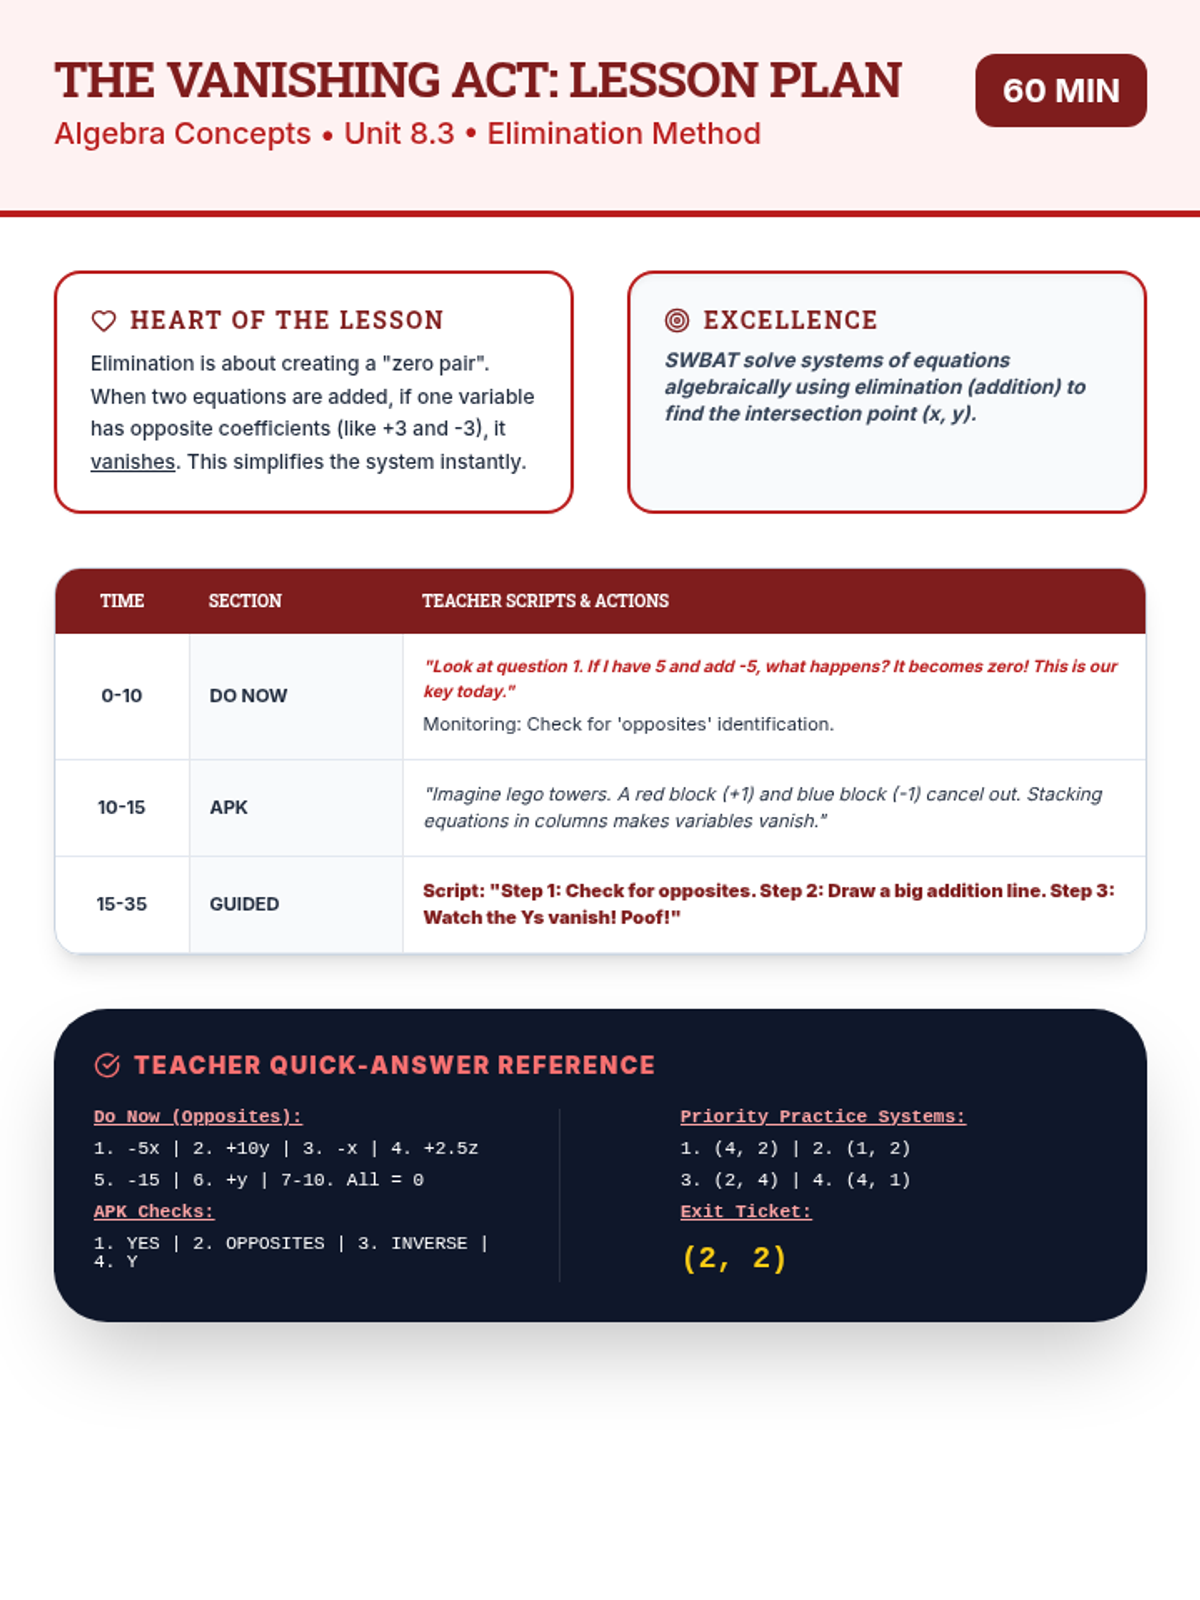
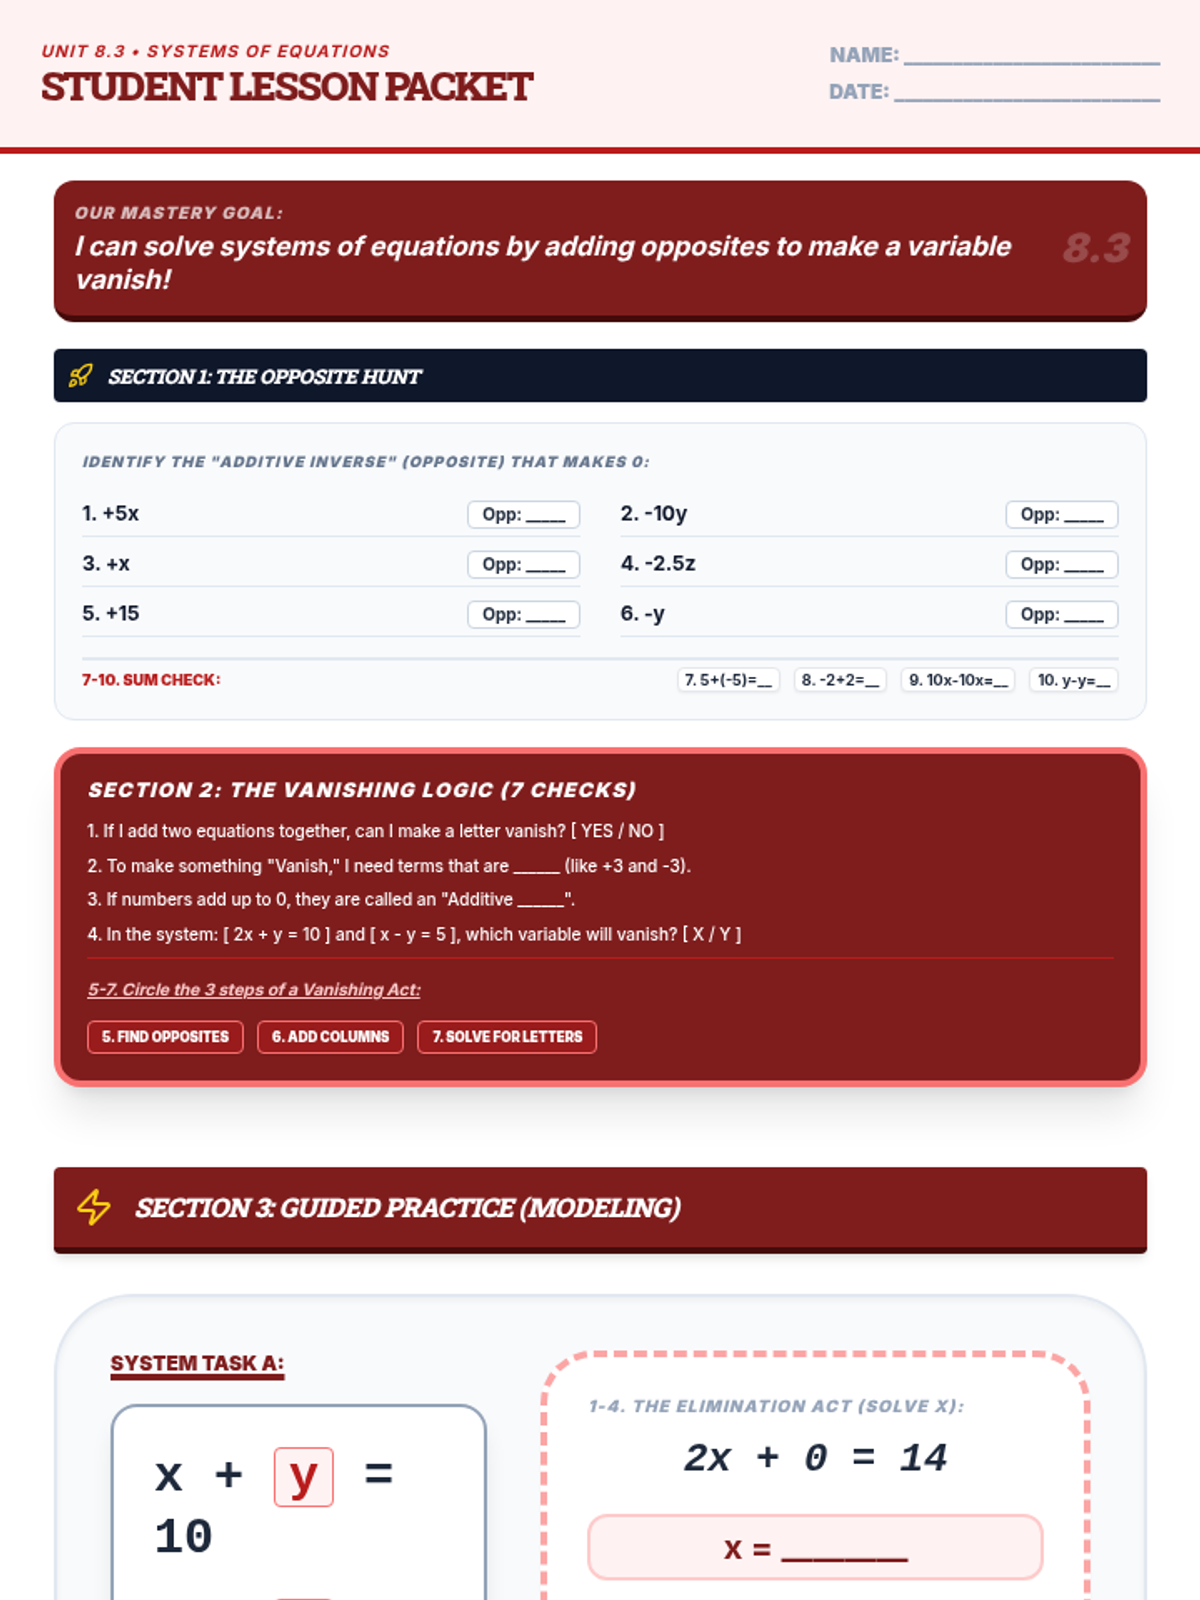
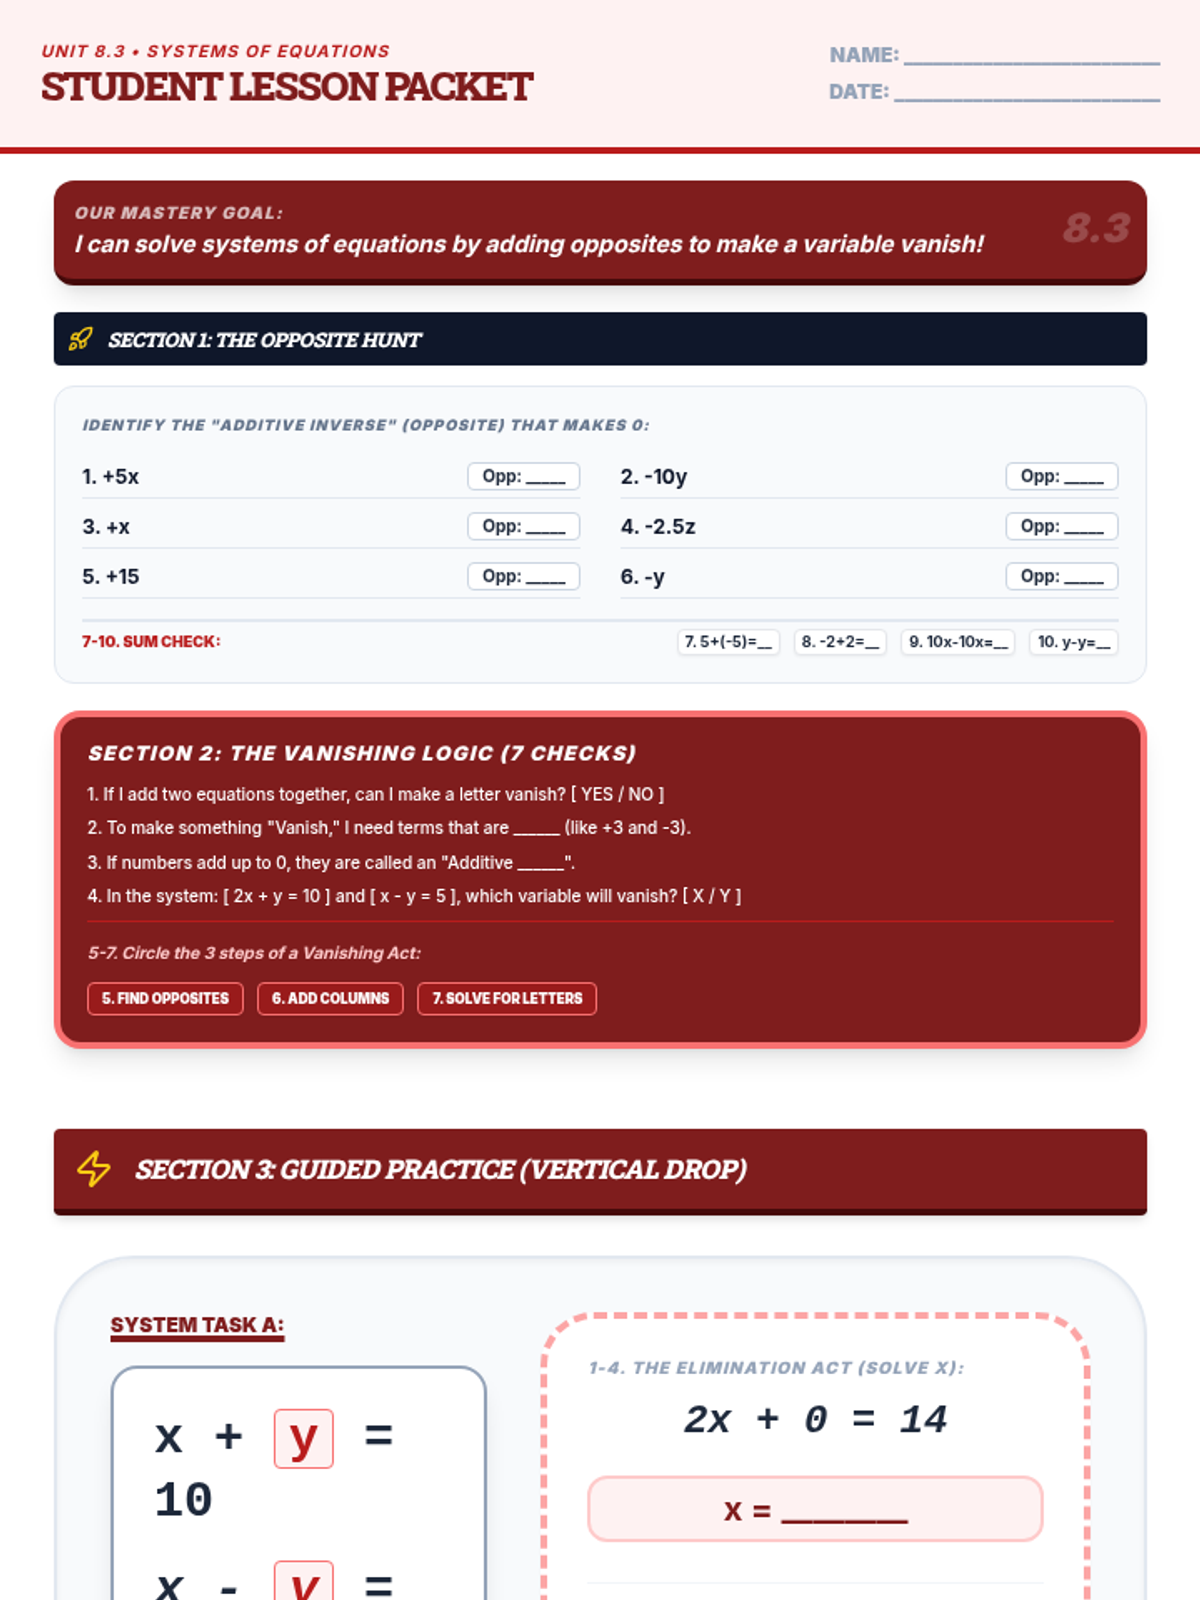
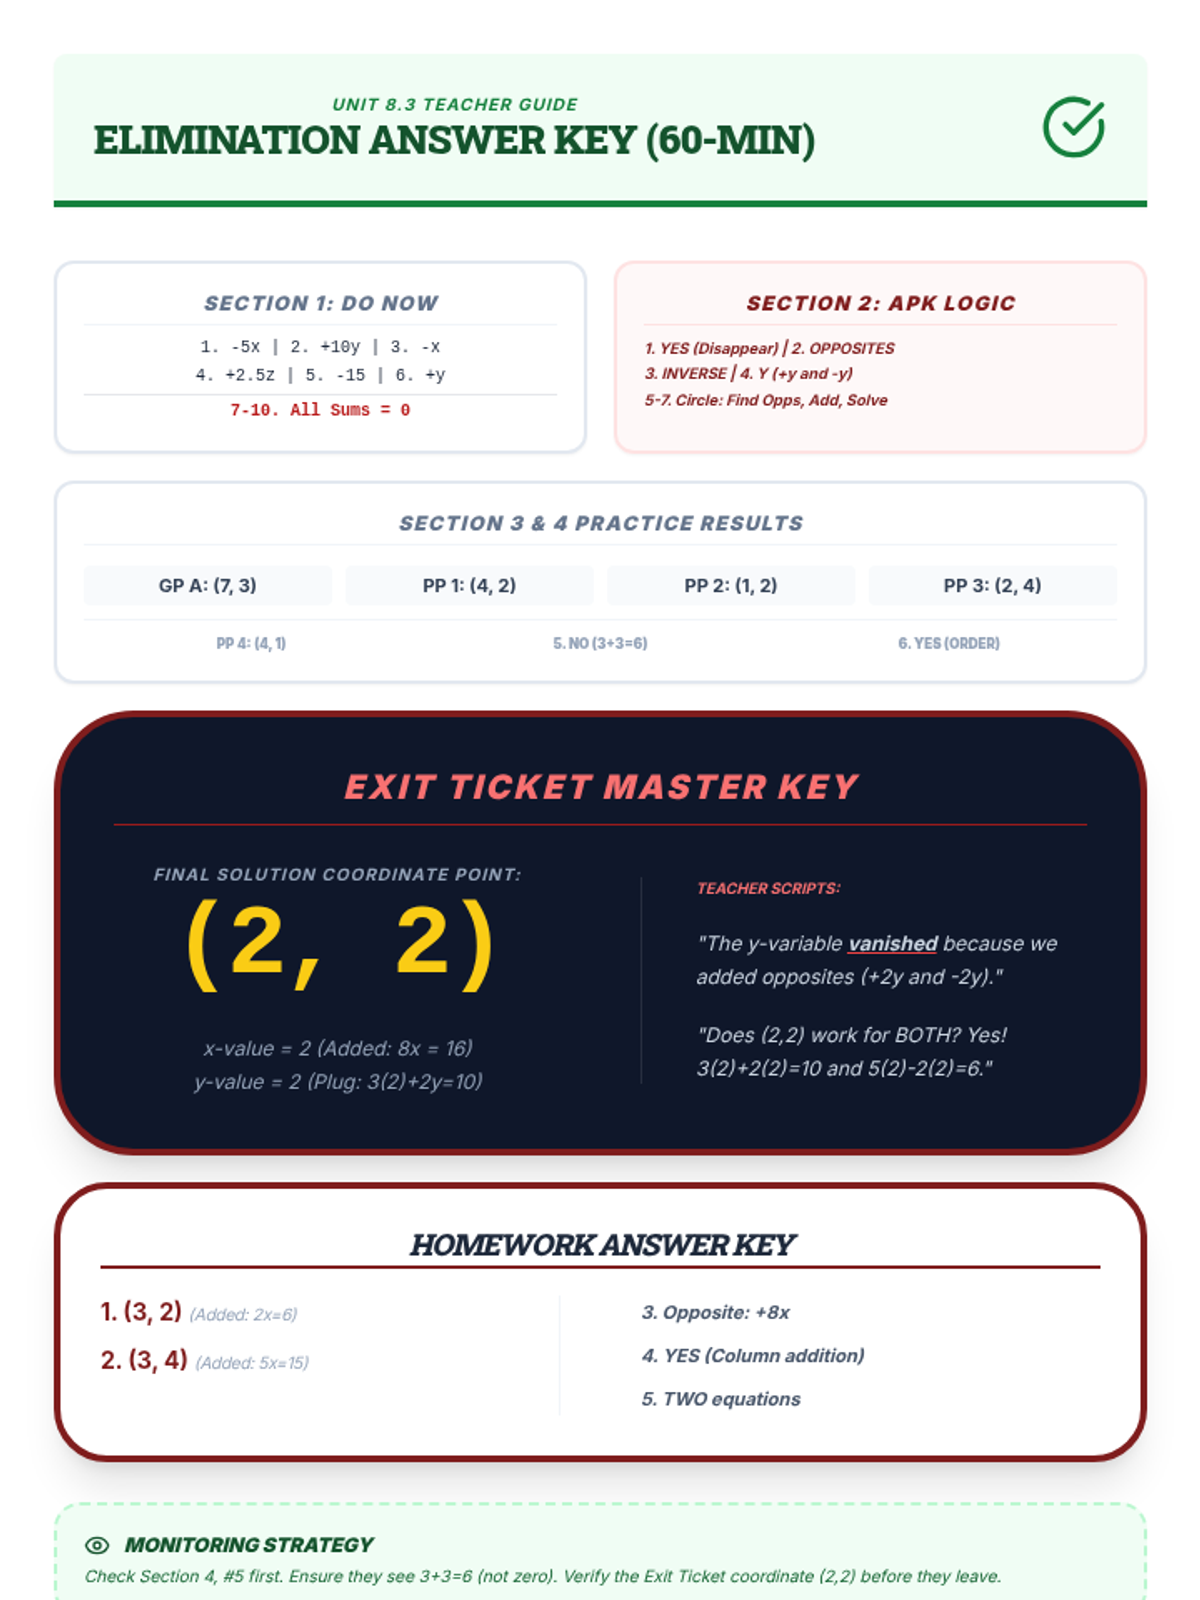
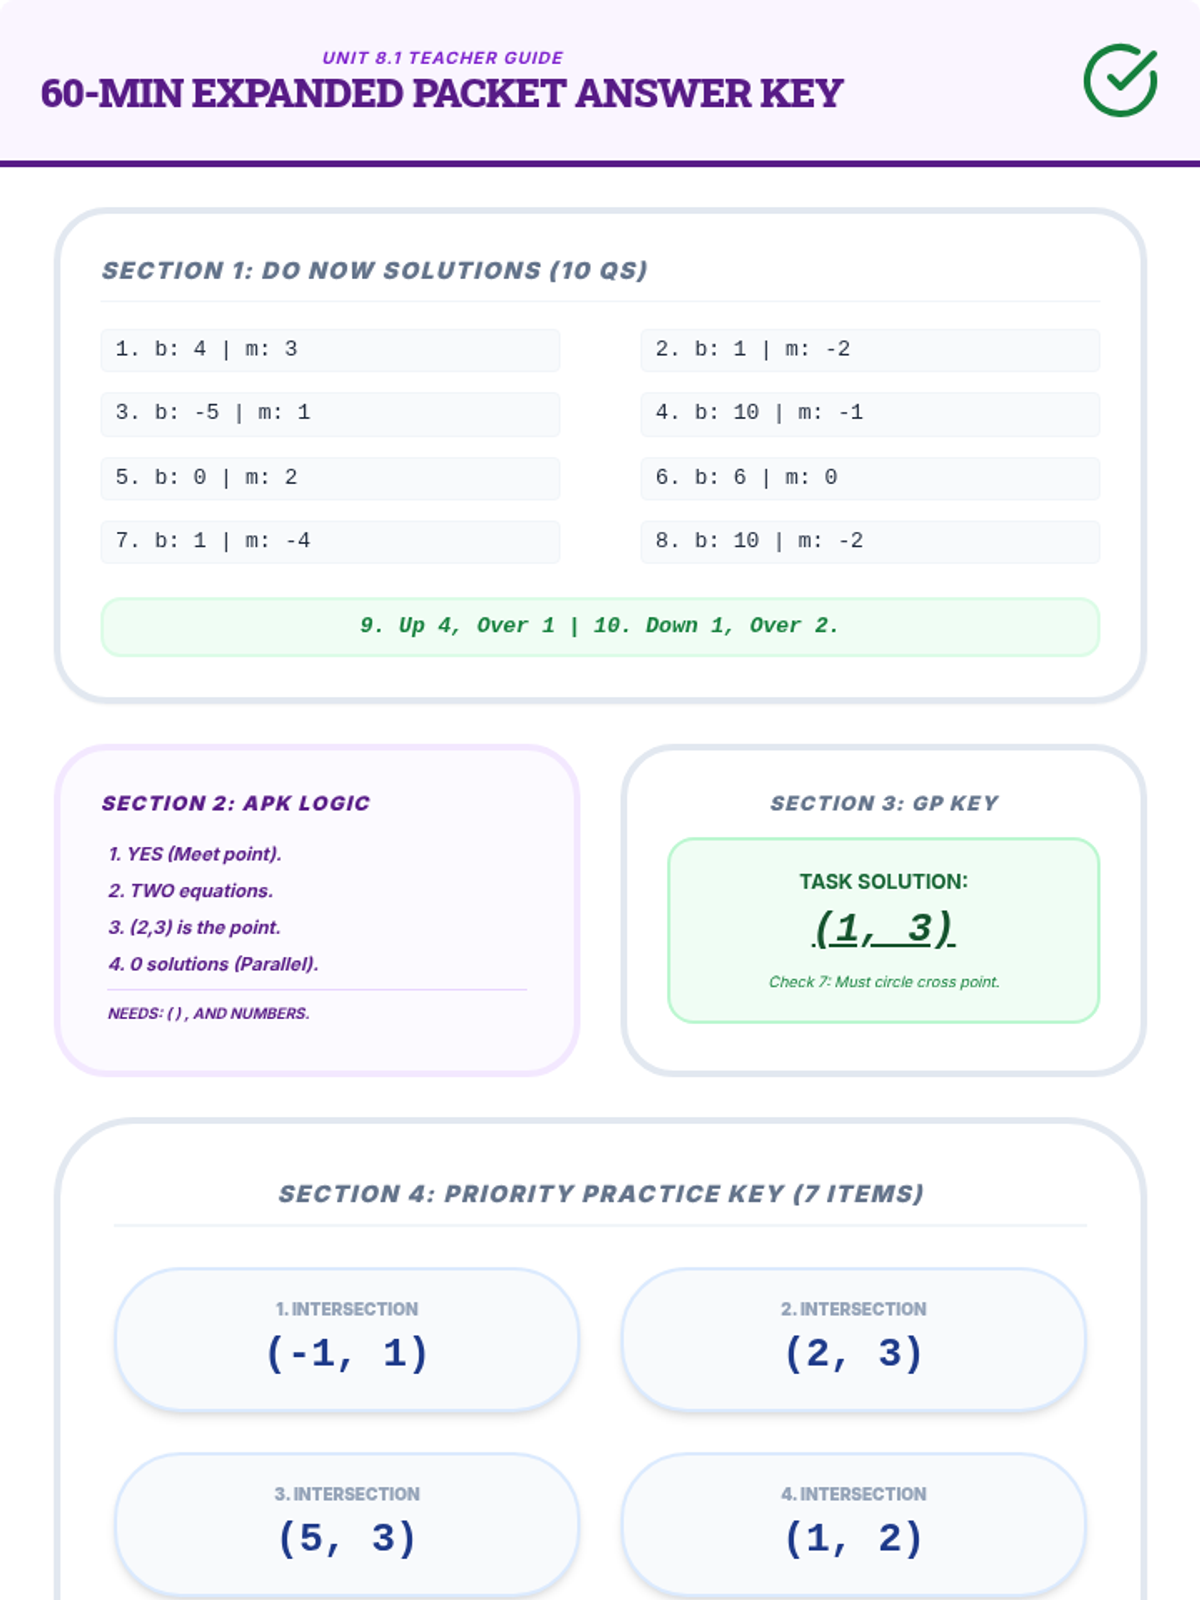
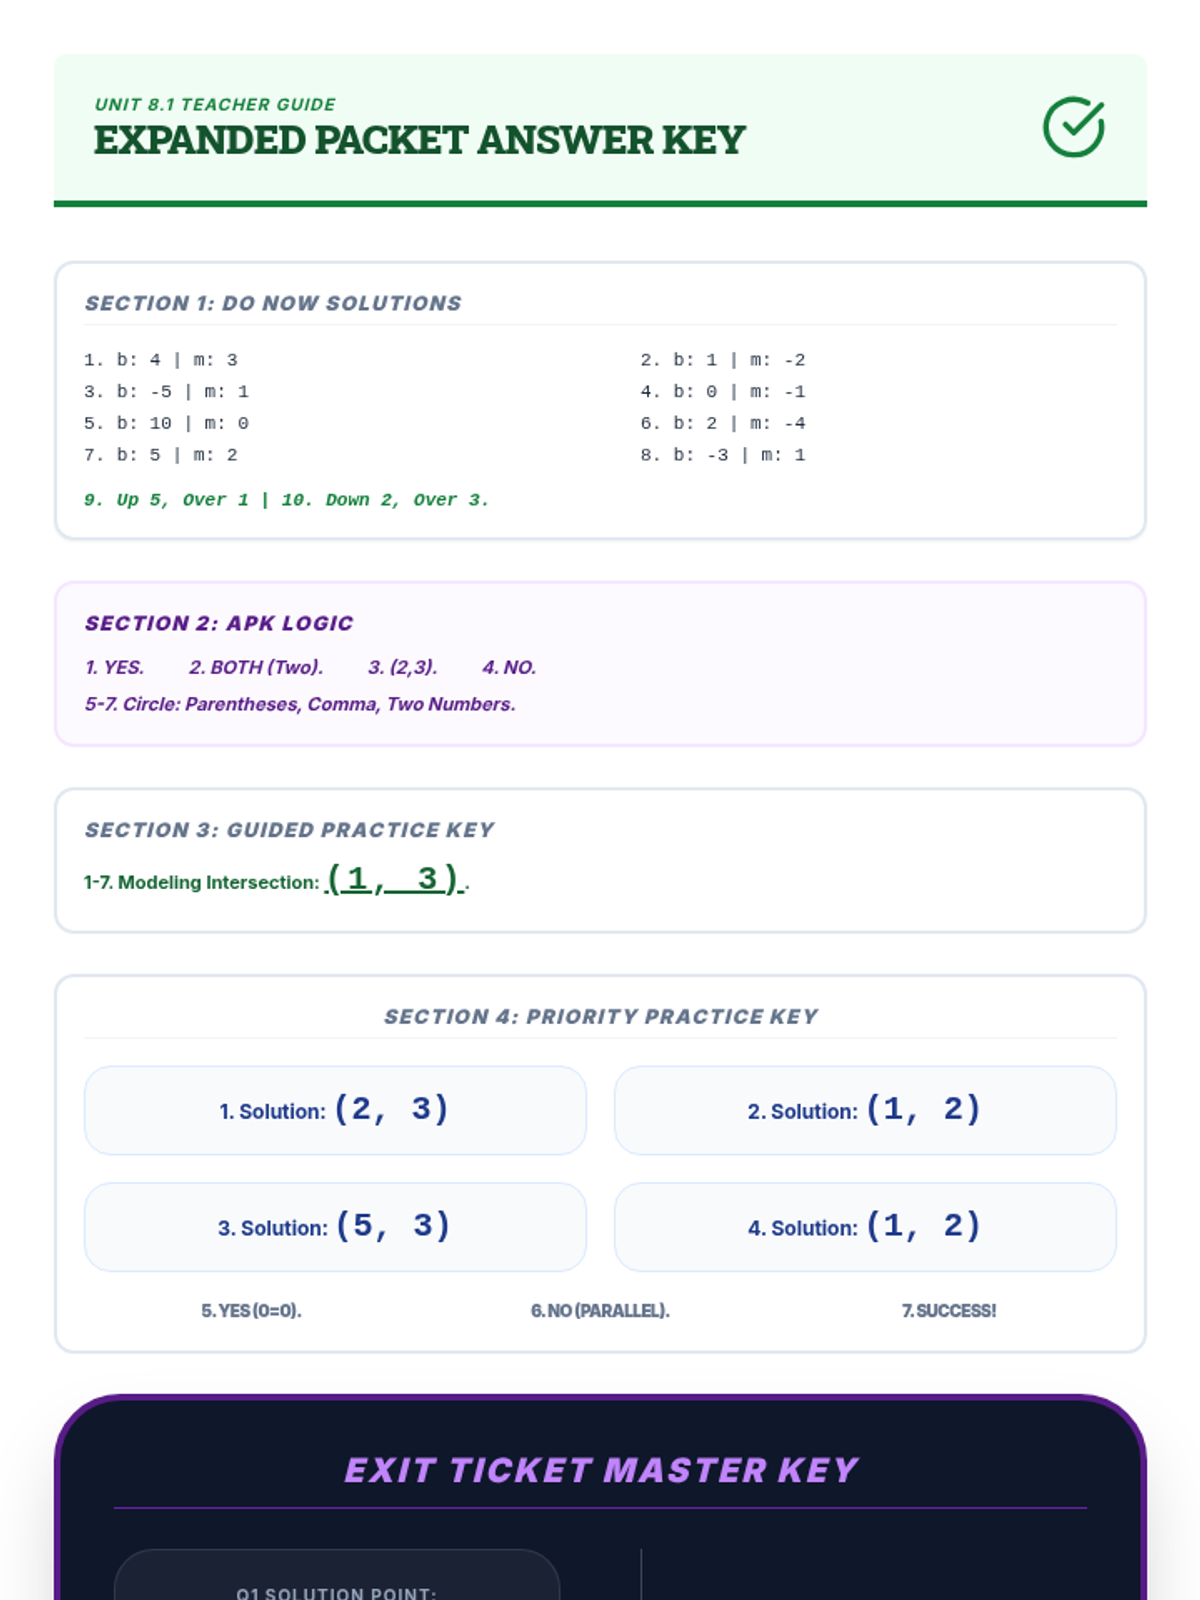
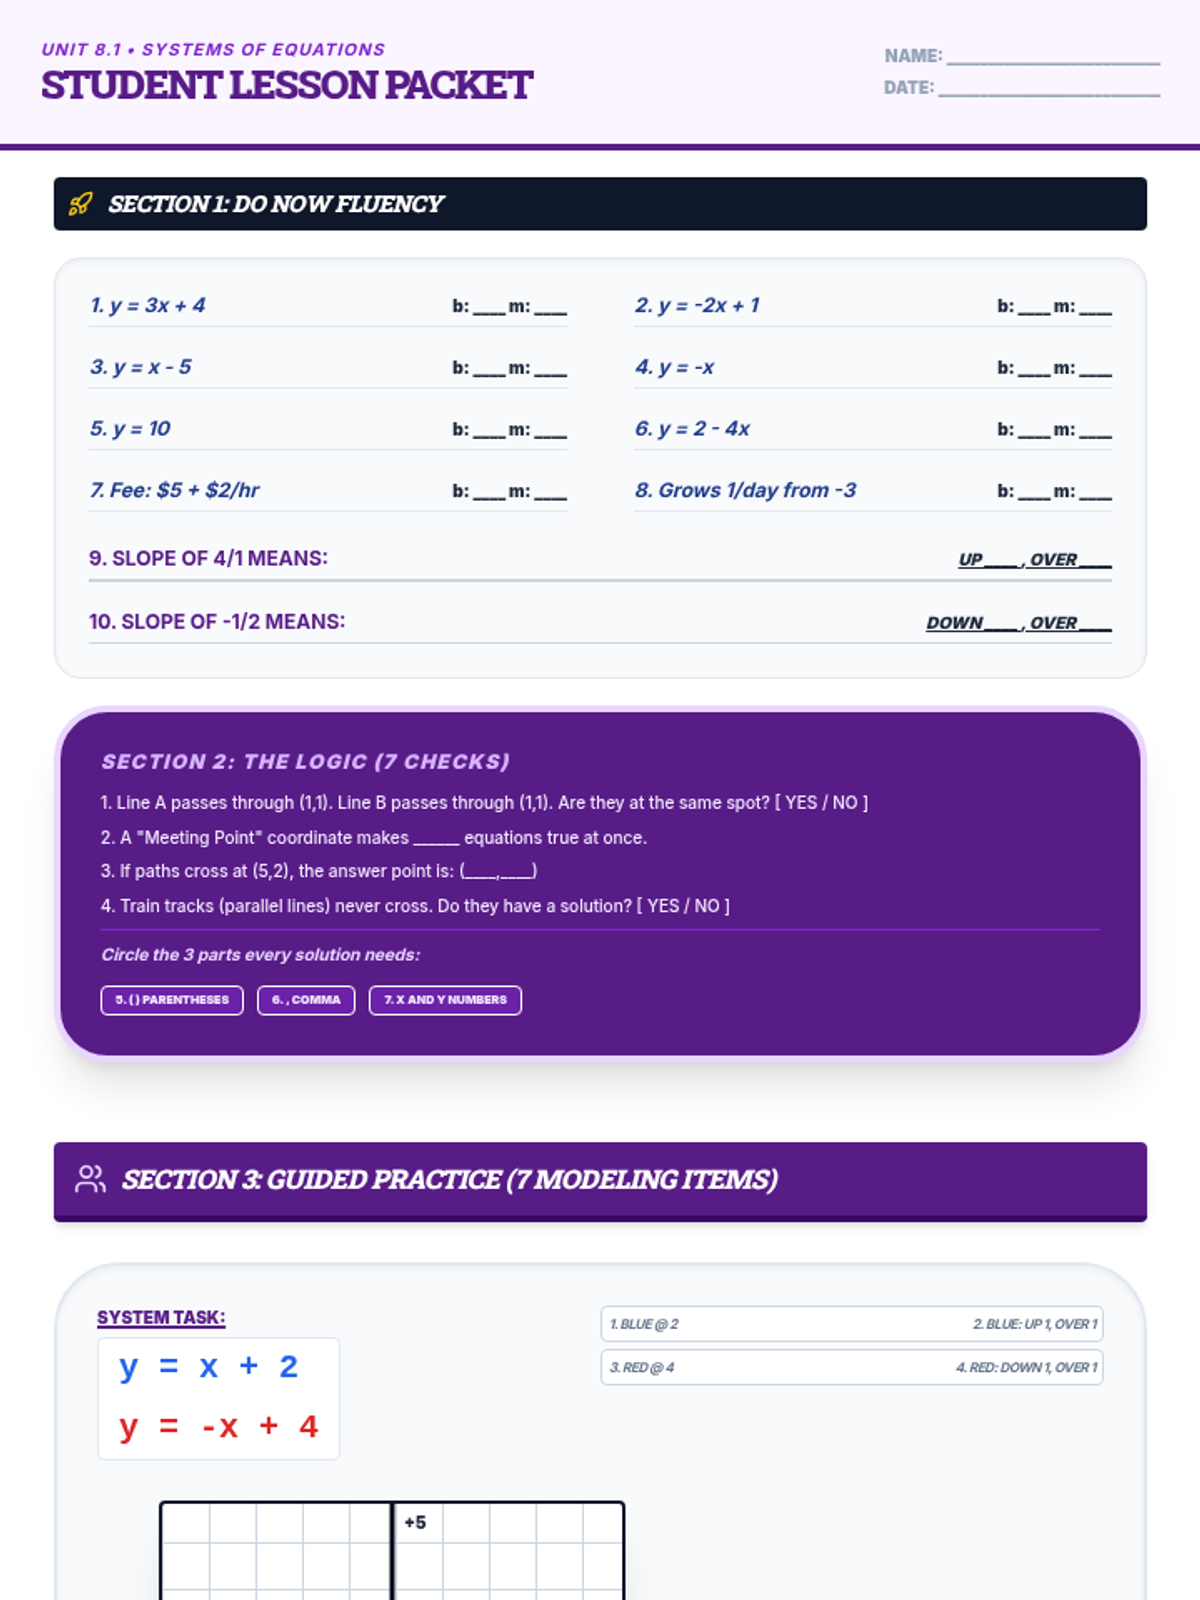
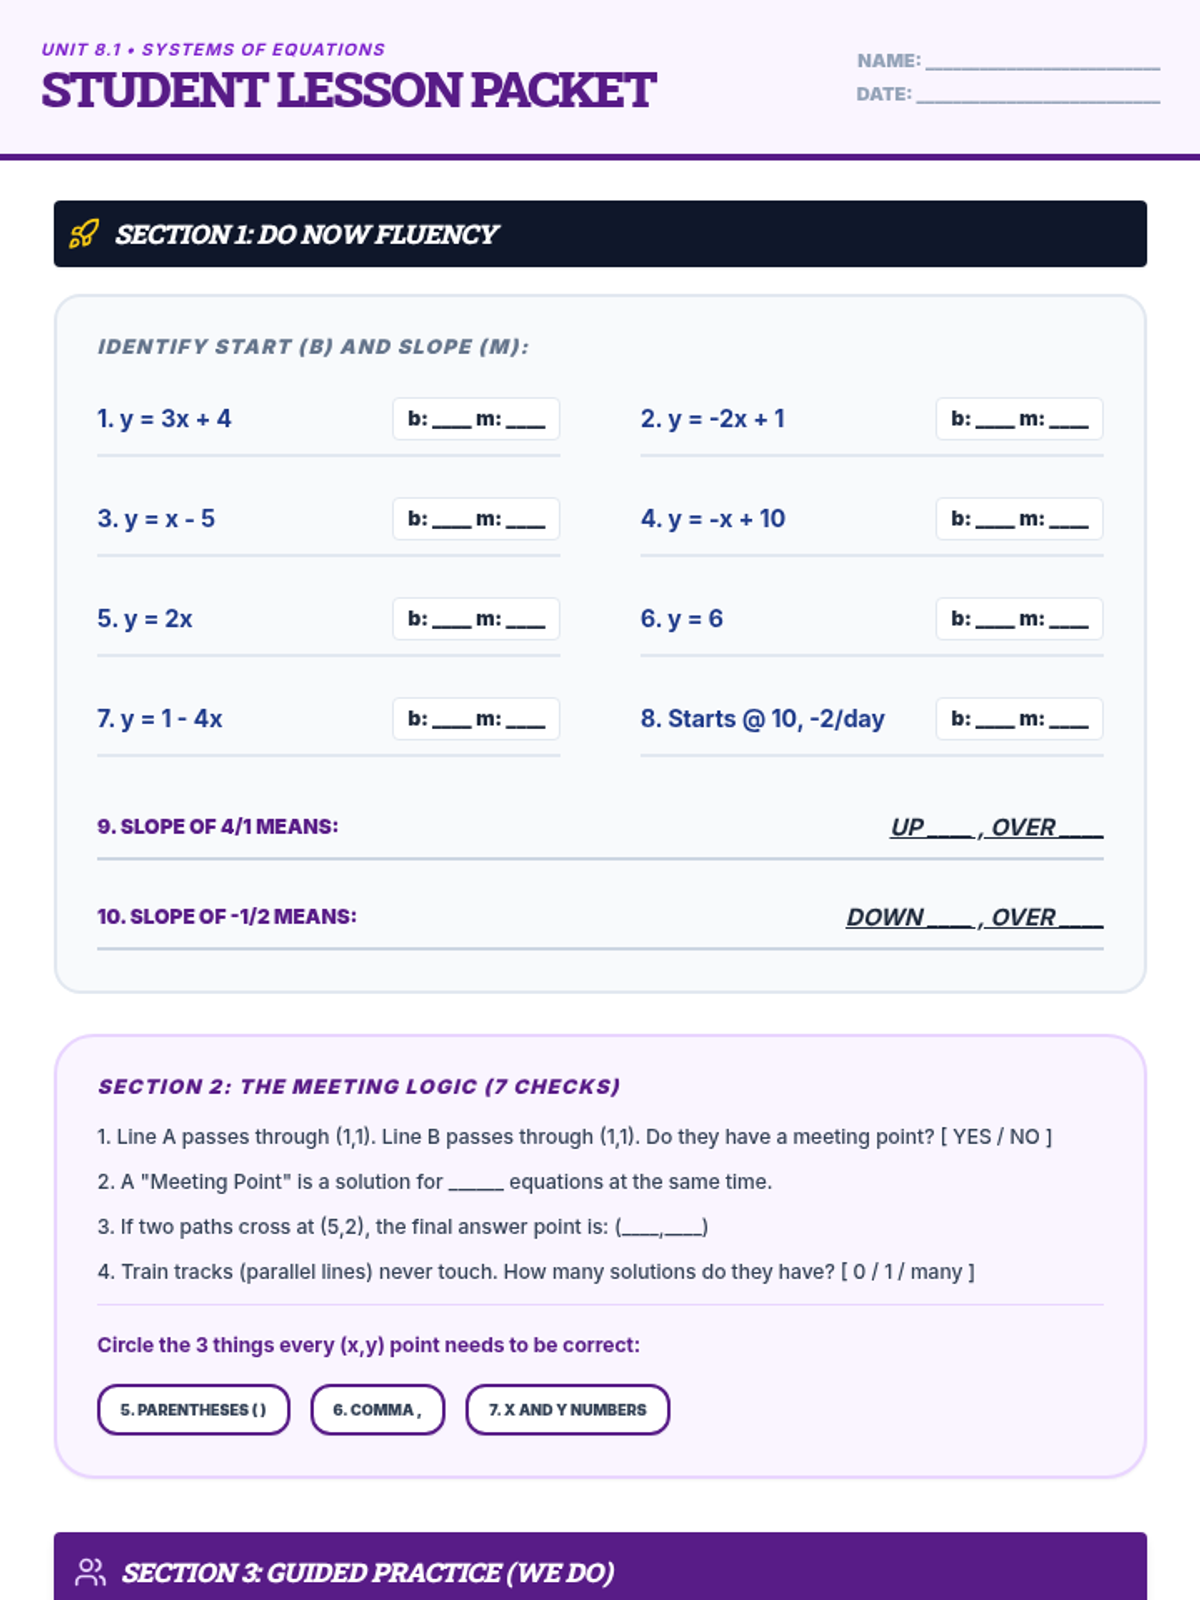
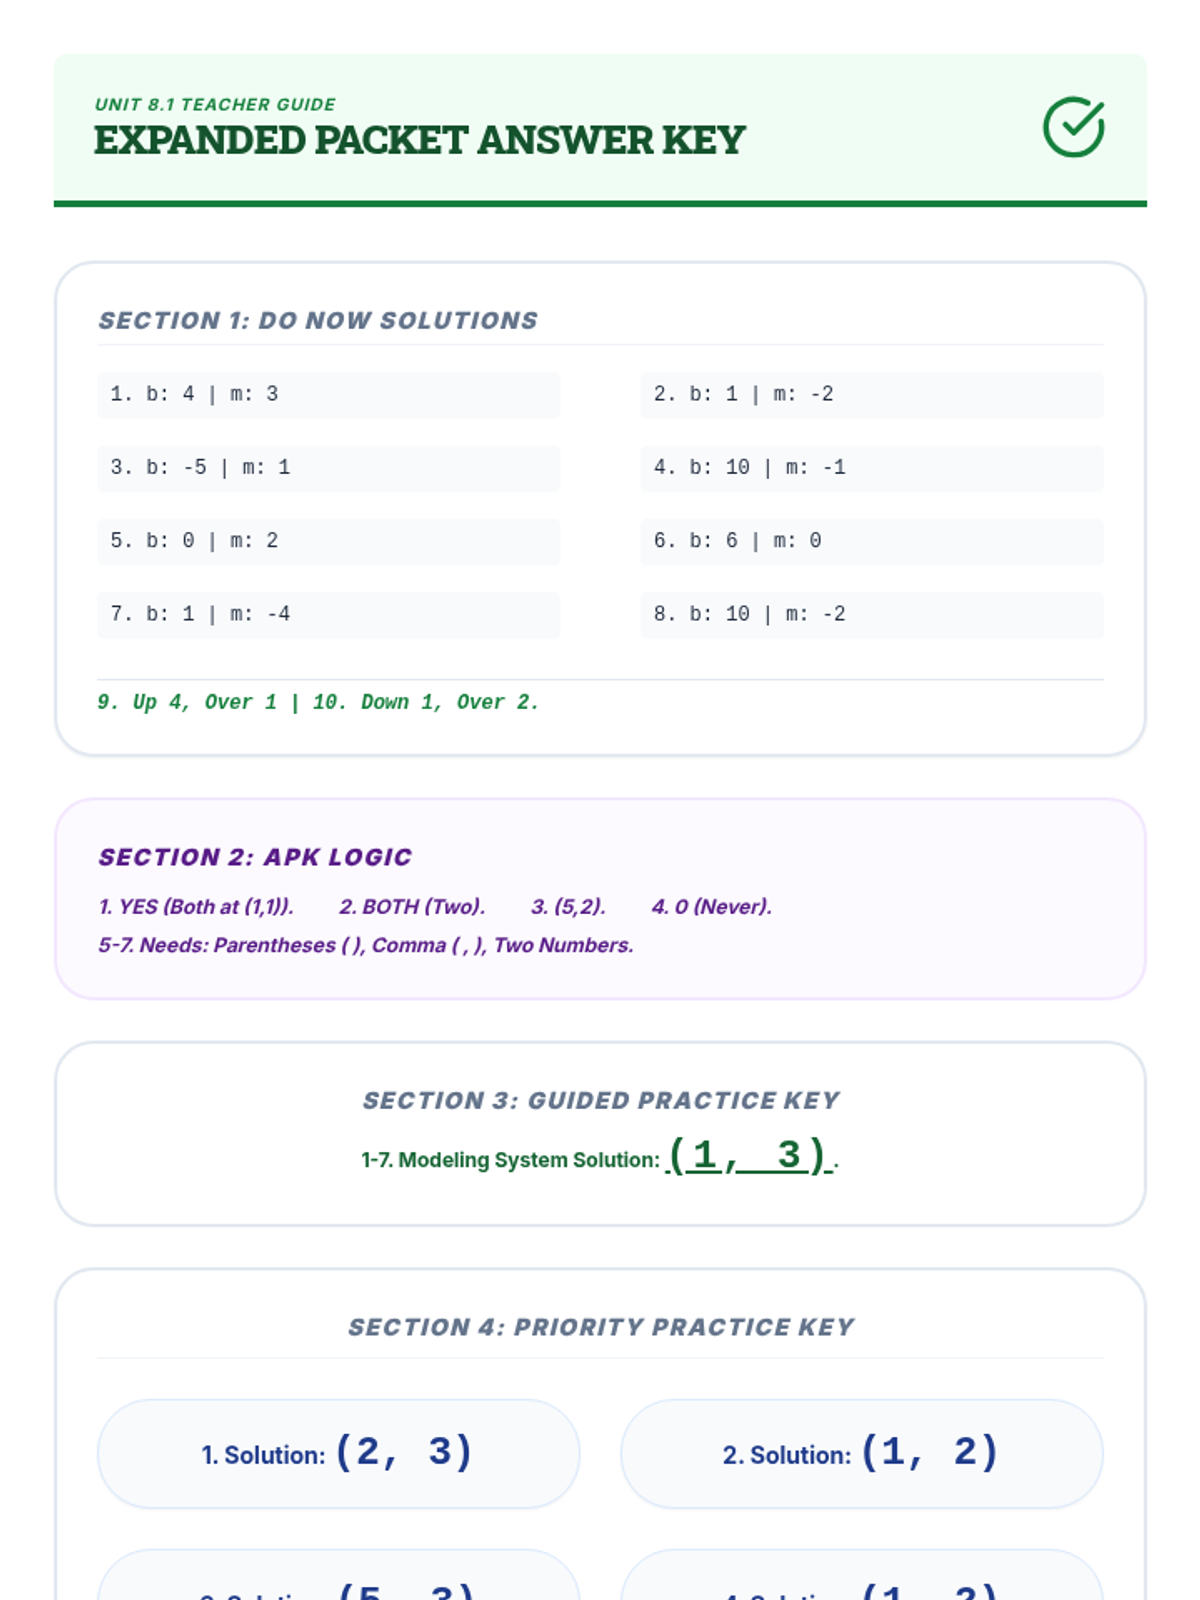
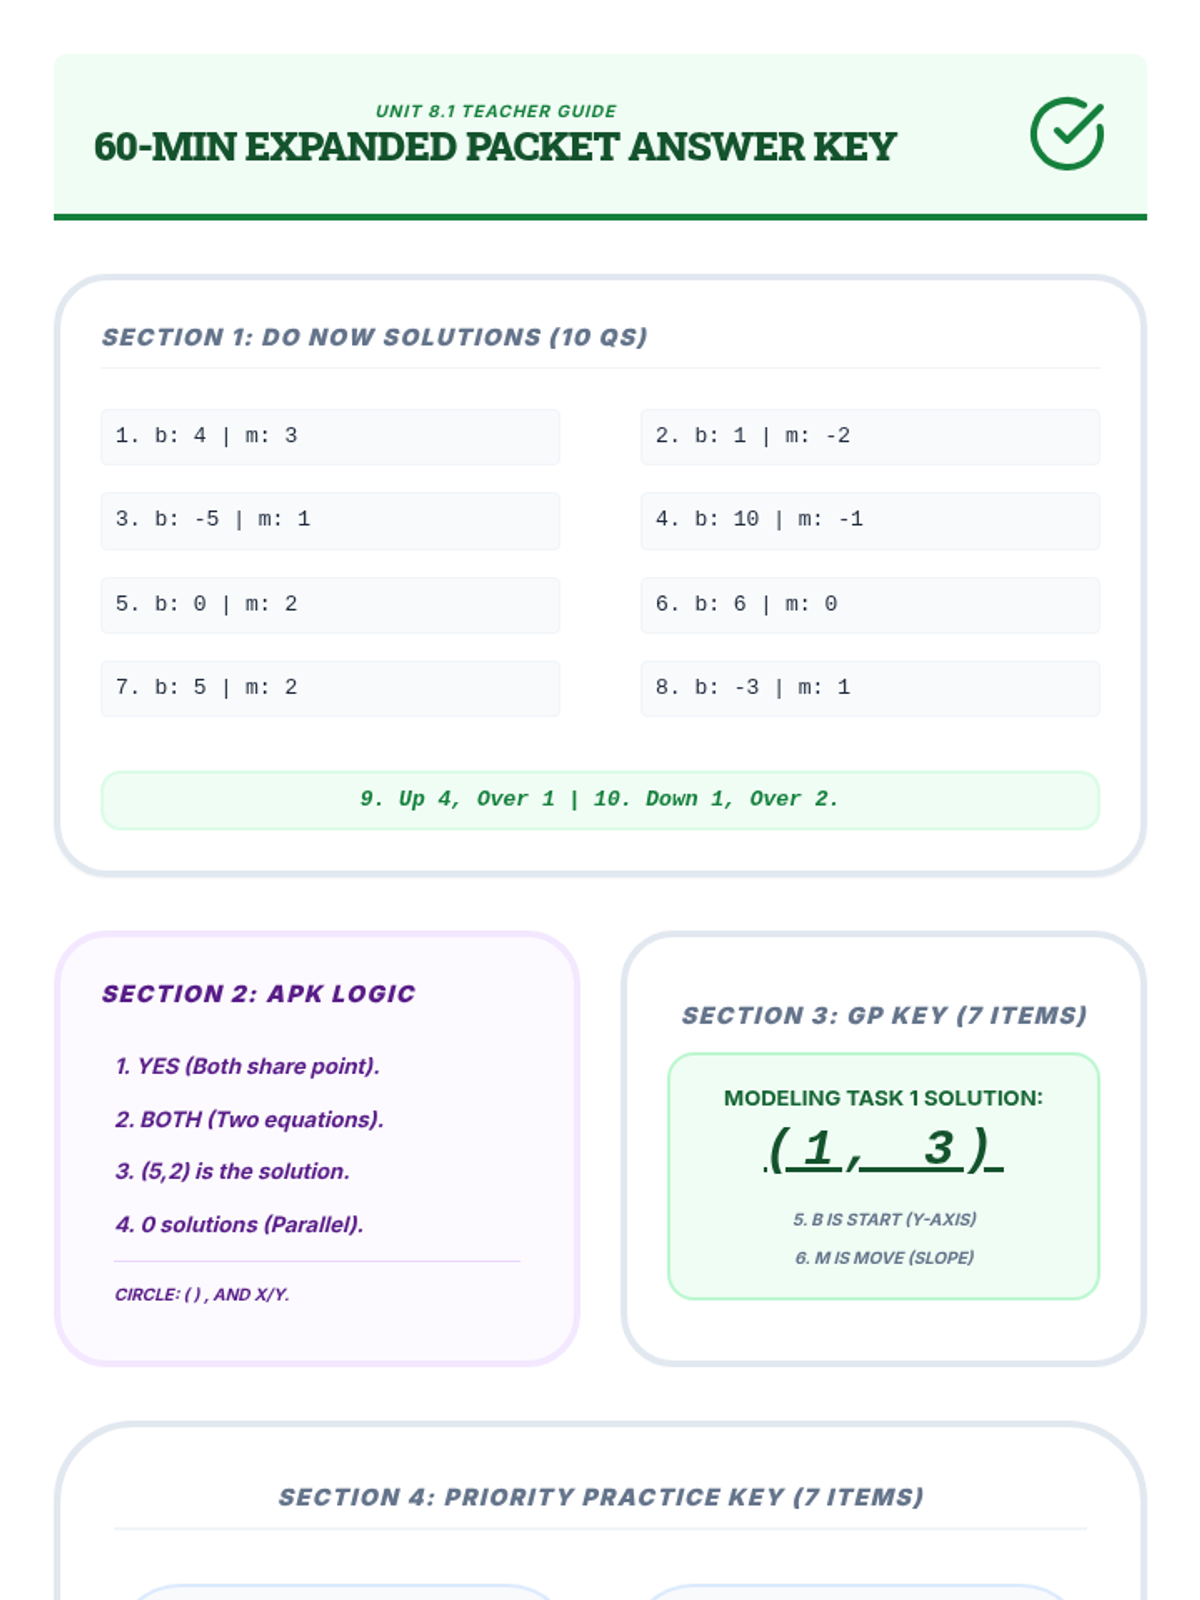
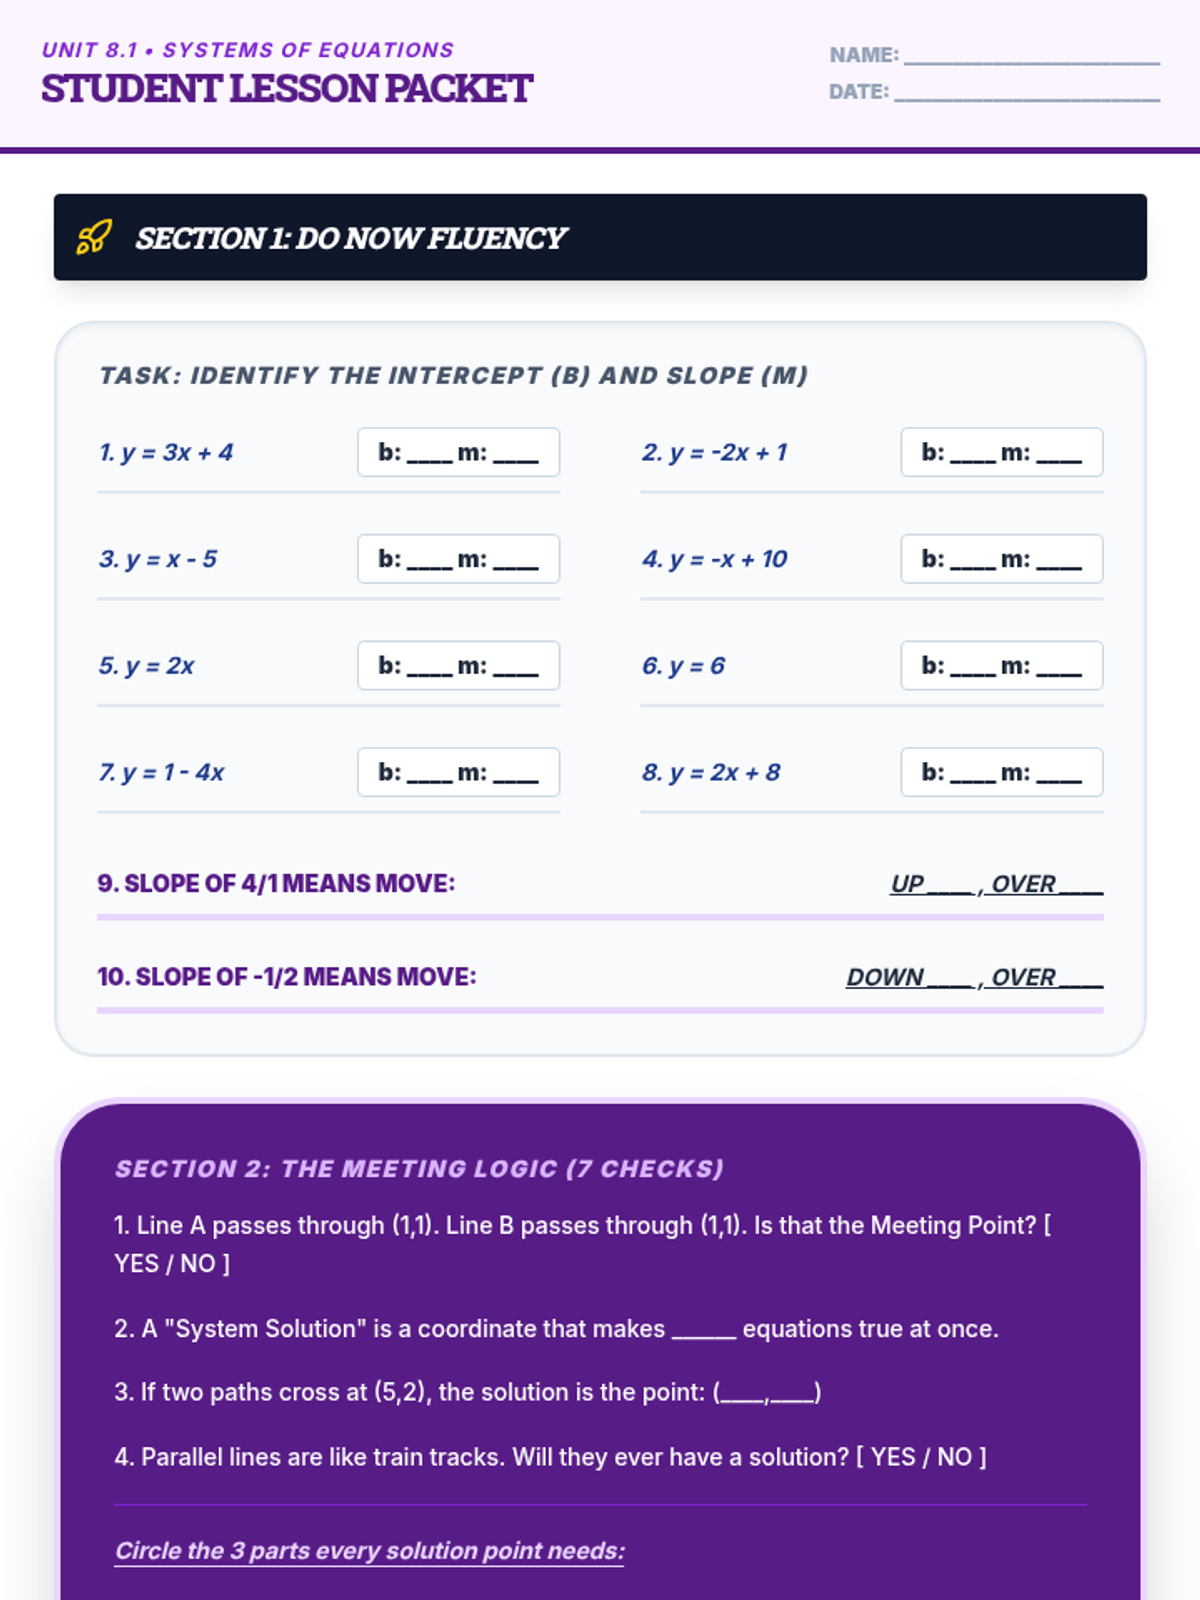
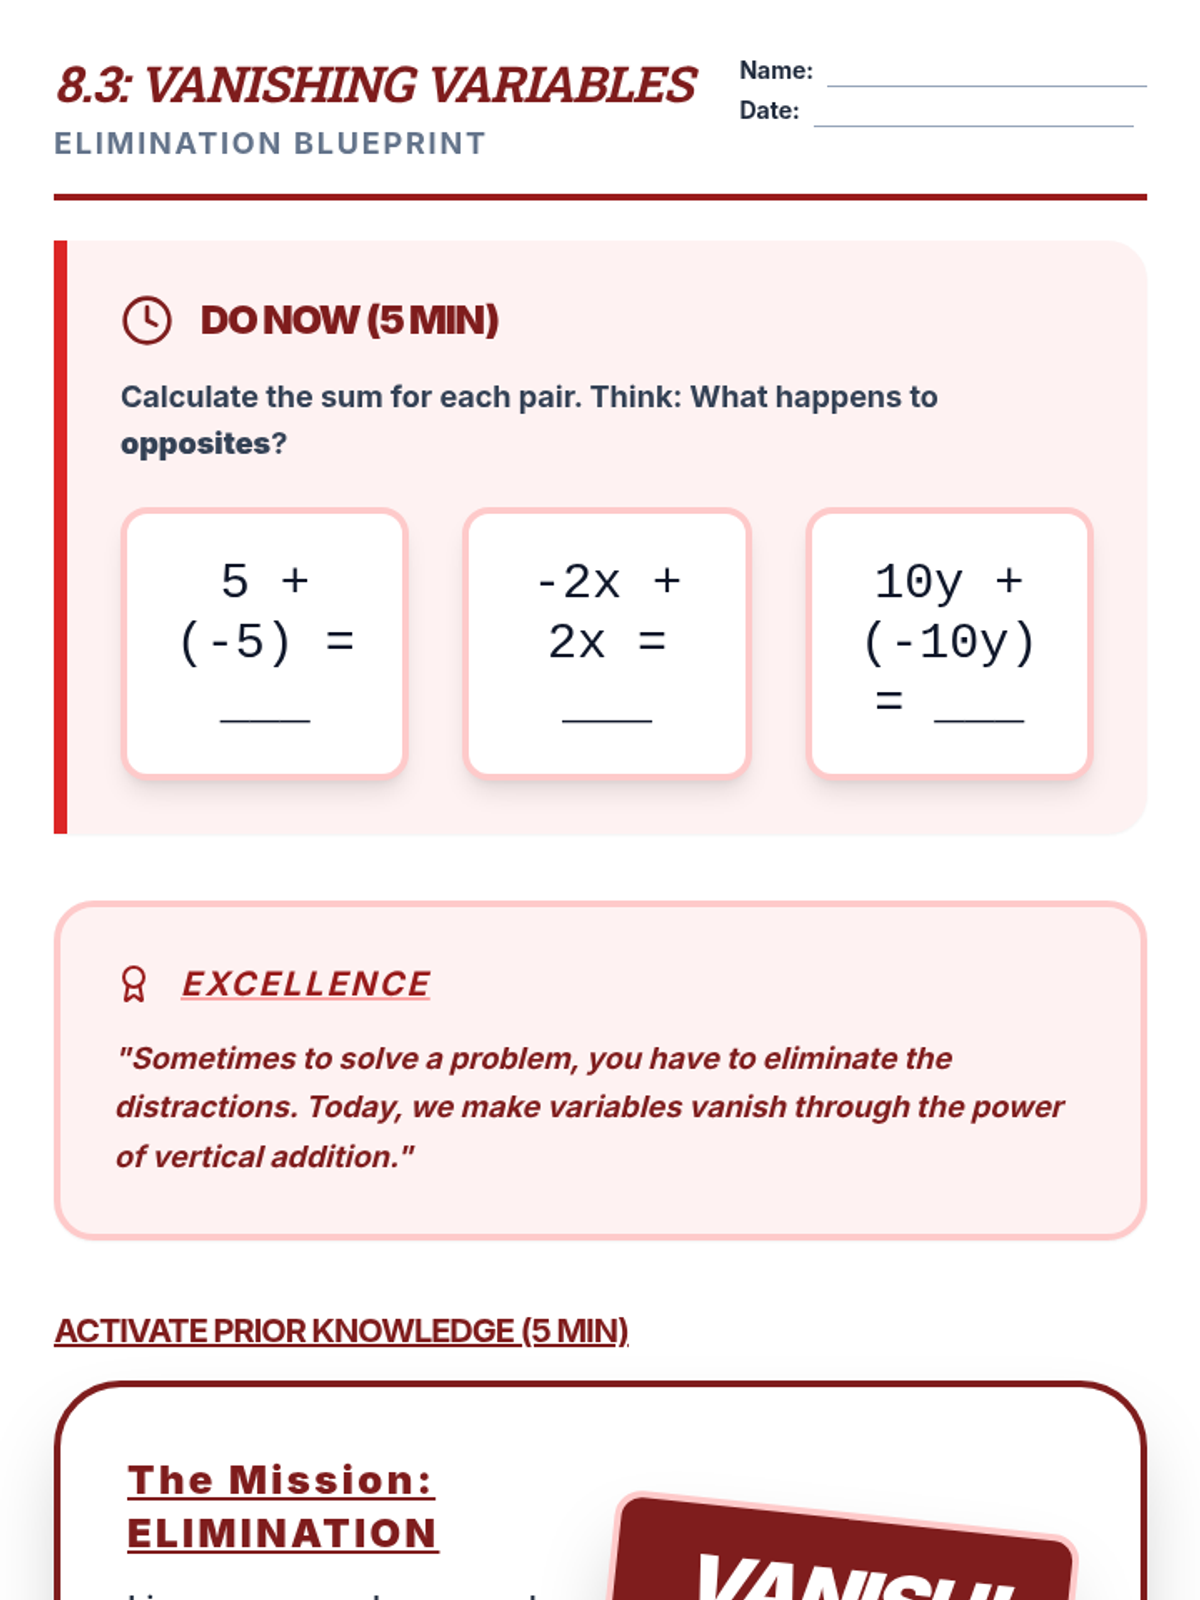
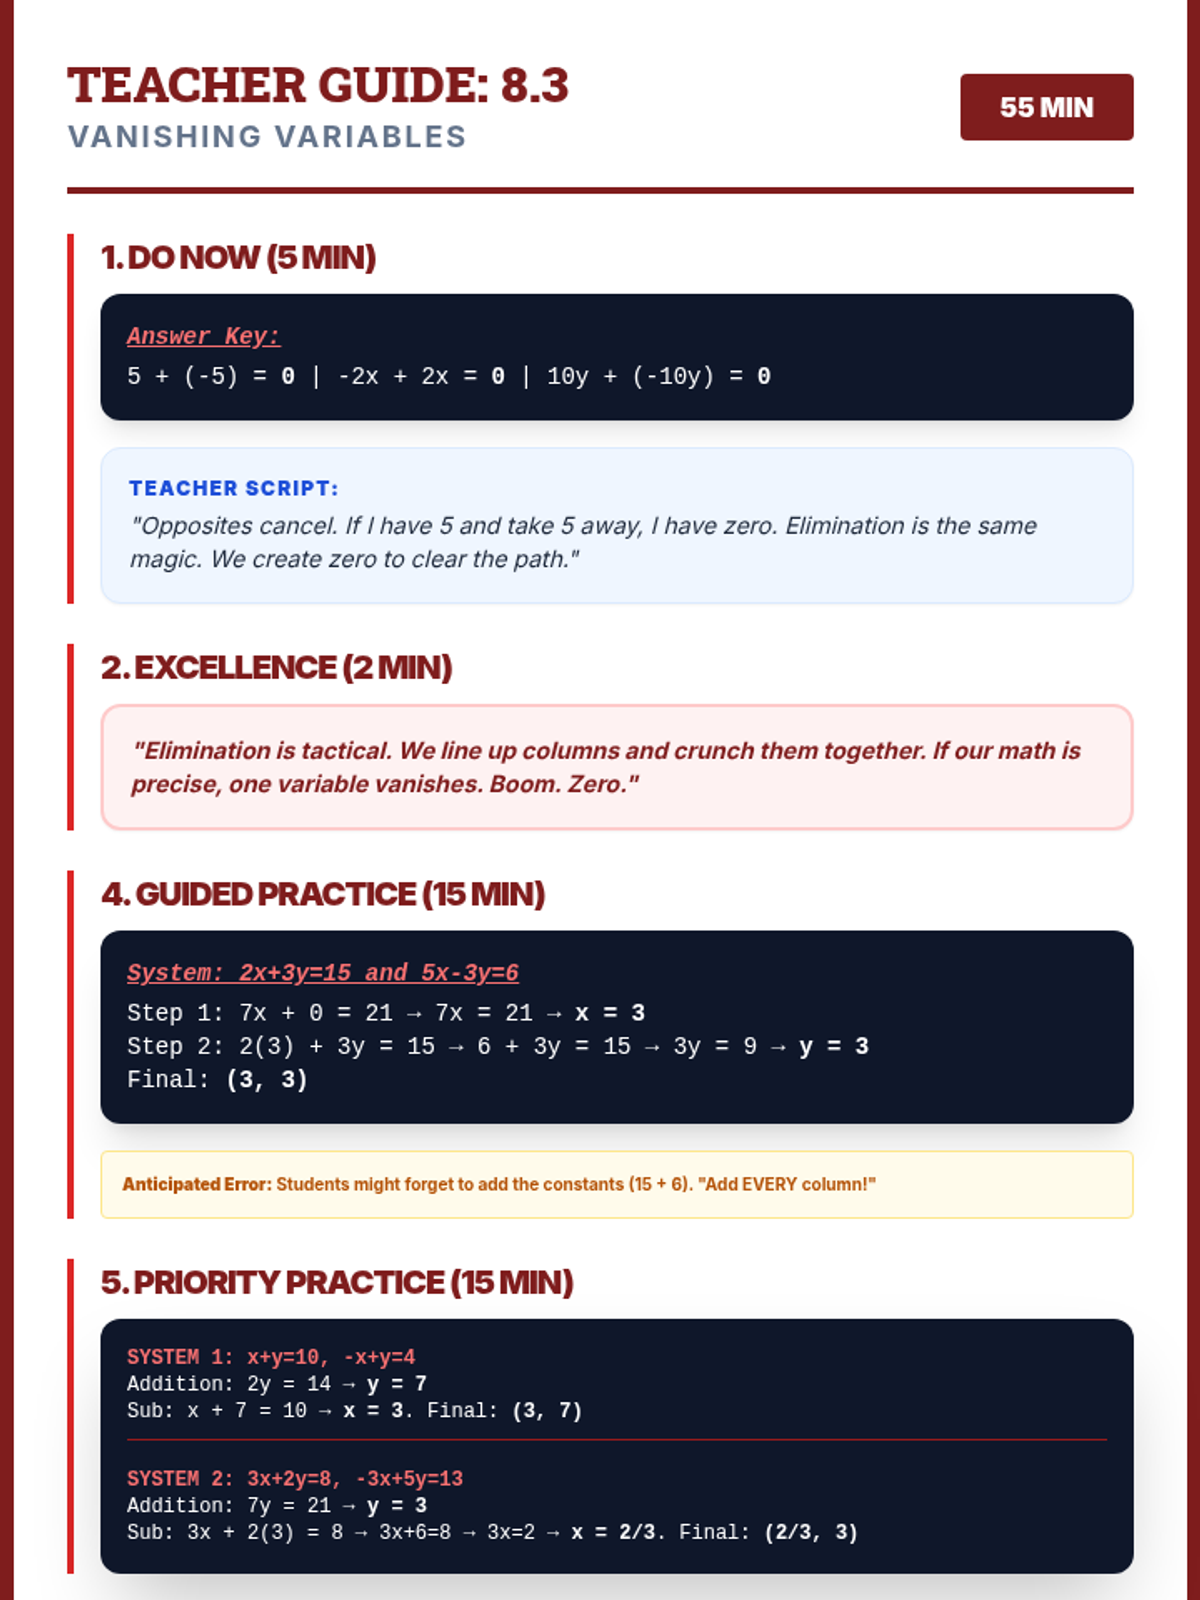
A 60-minute Algebra lesson for 9th-grade IEP students focused on solving systems of linear equations using the elimination method. Features 'The Vanishing Act' metaphor, explicit teacher sentences, and structured student practice to master the concept of additive inverses.
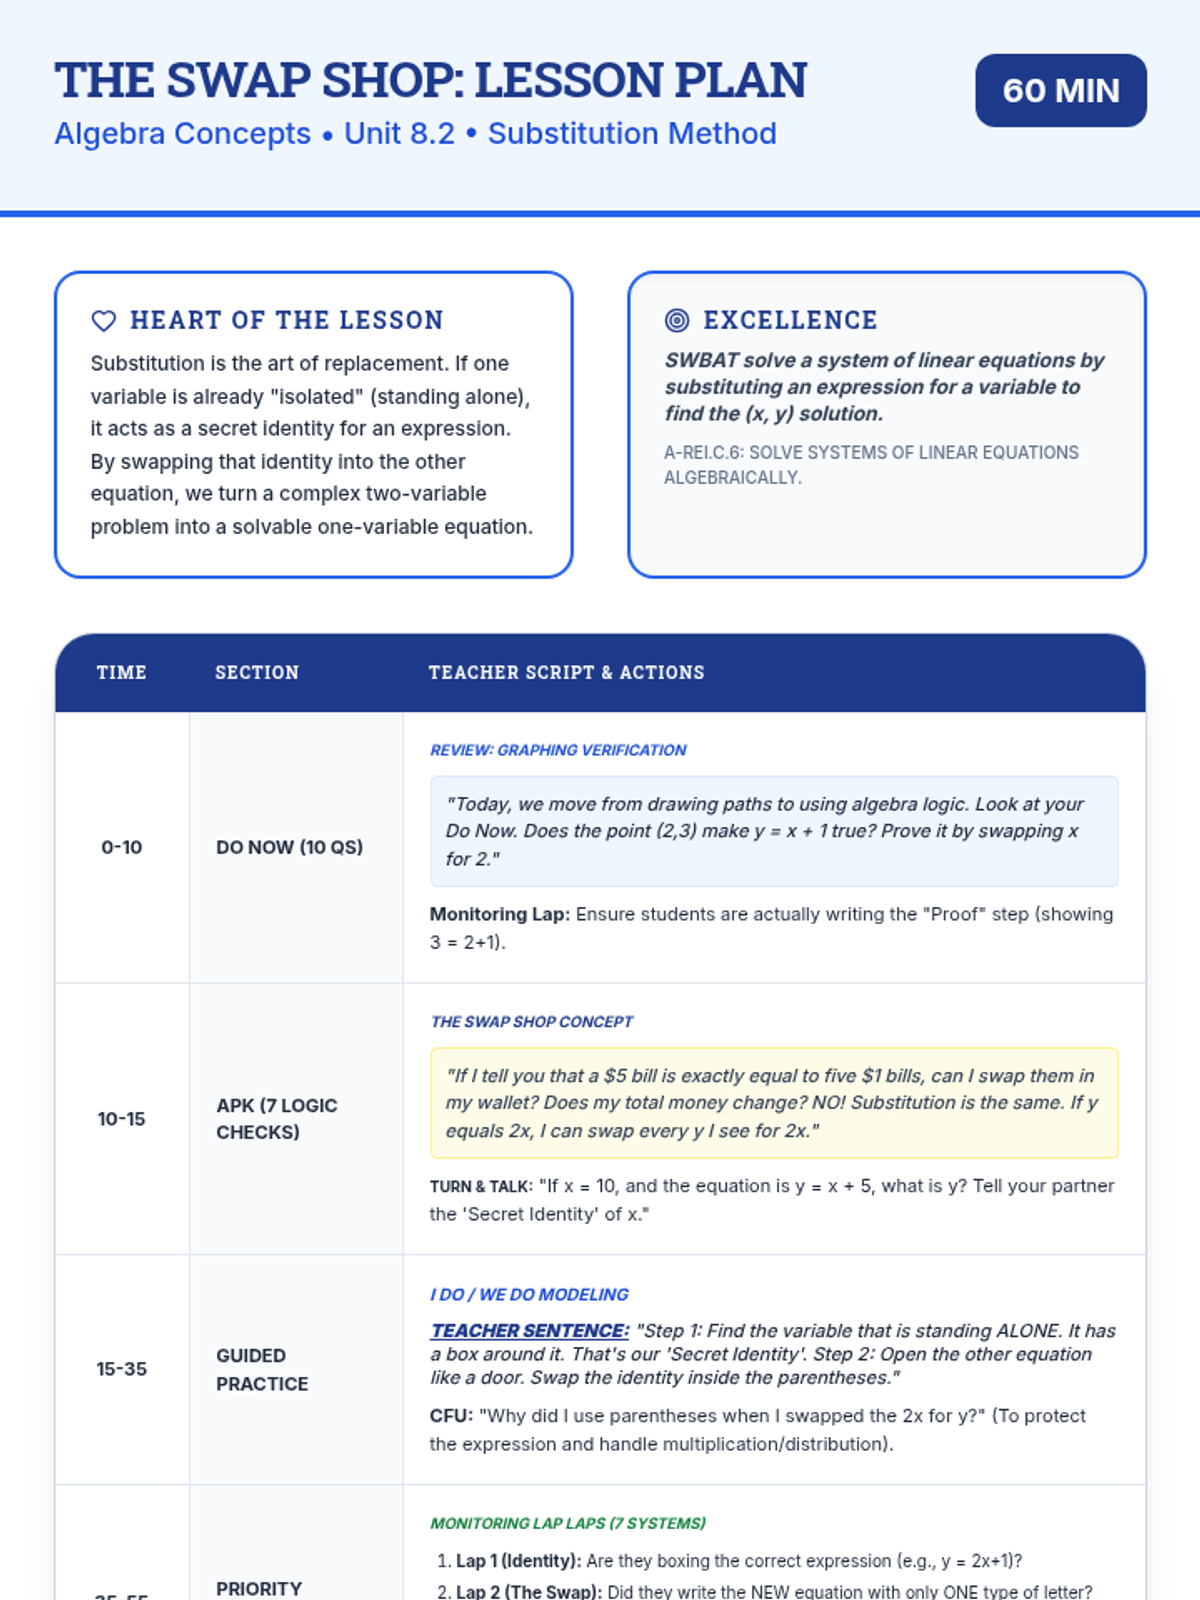
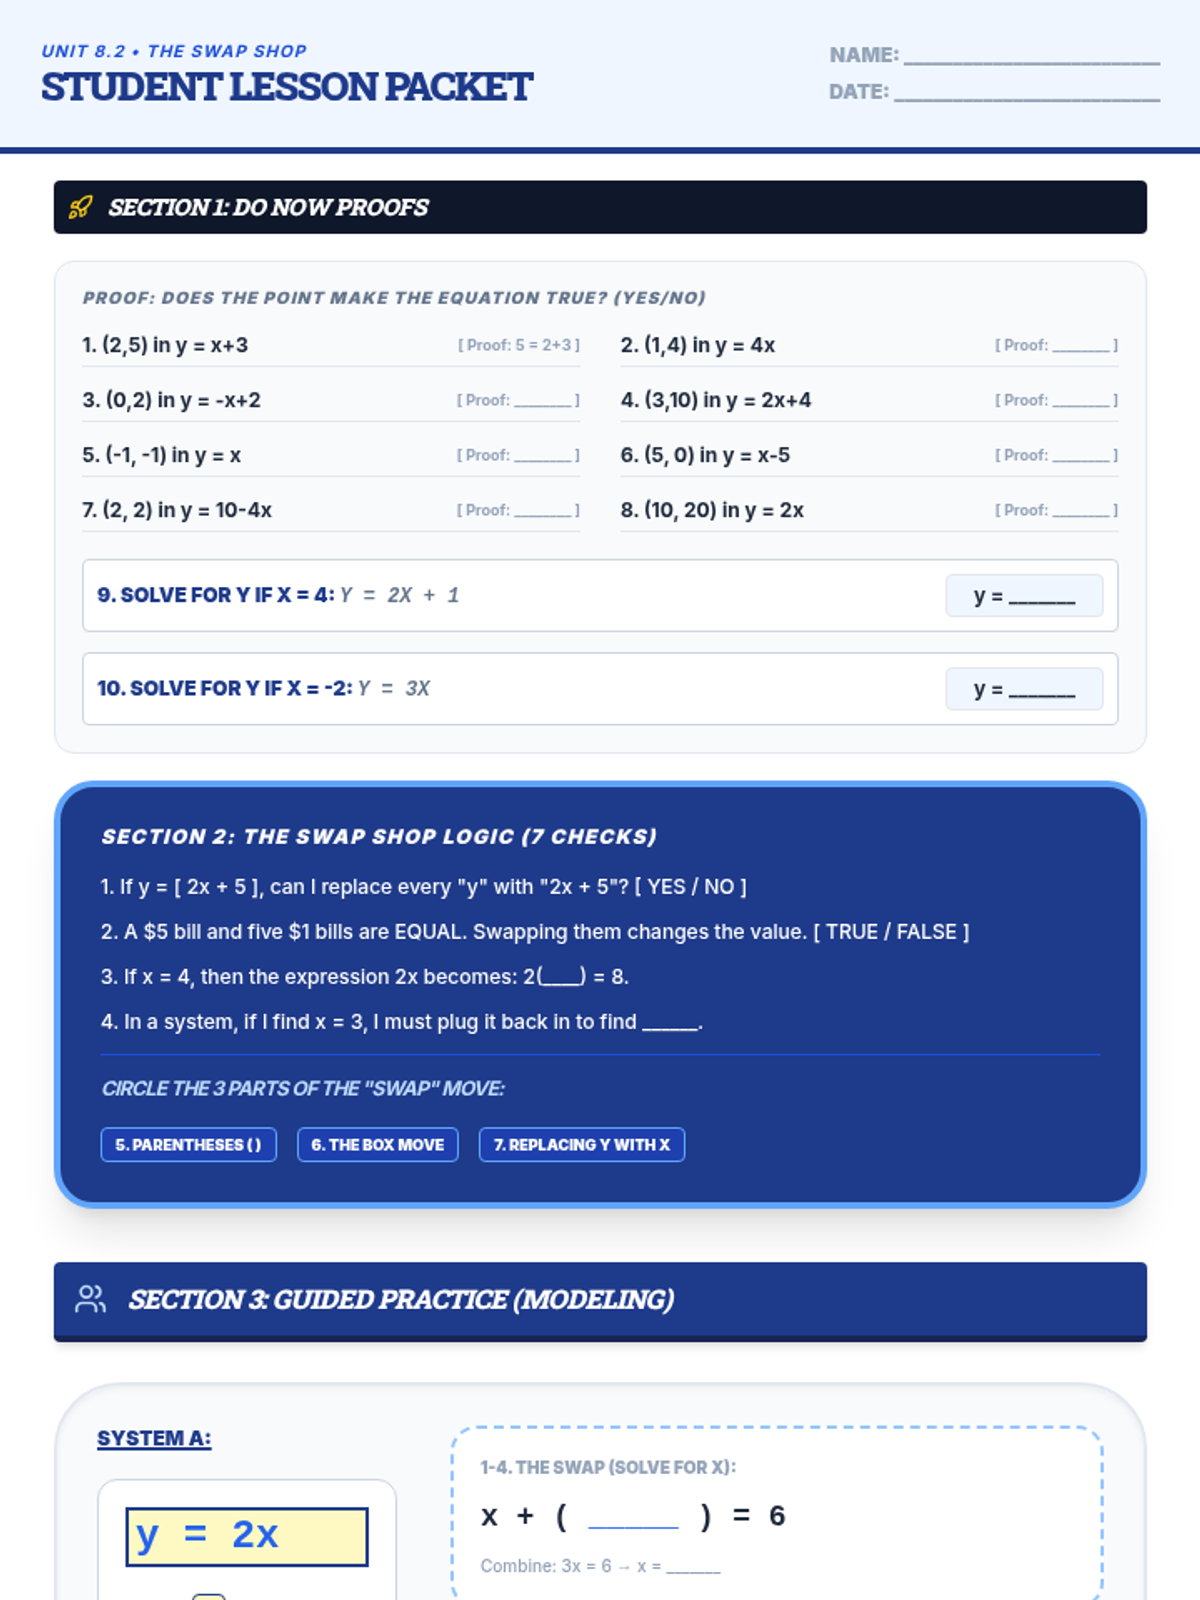
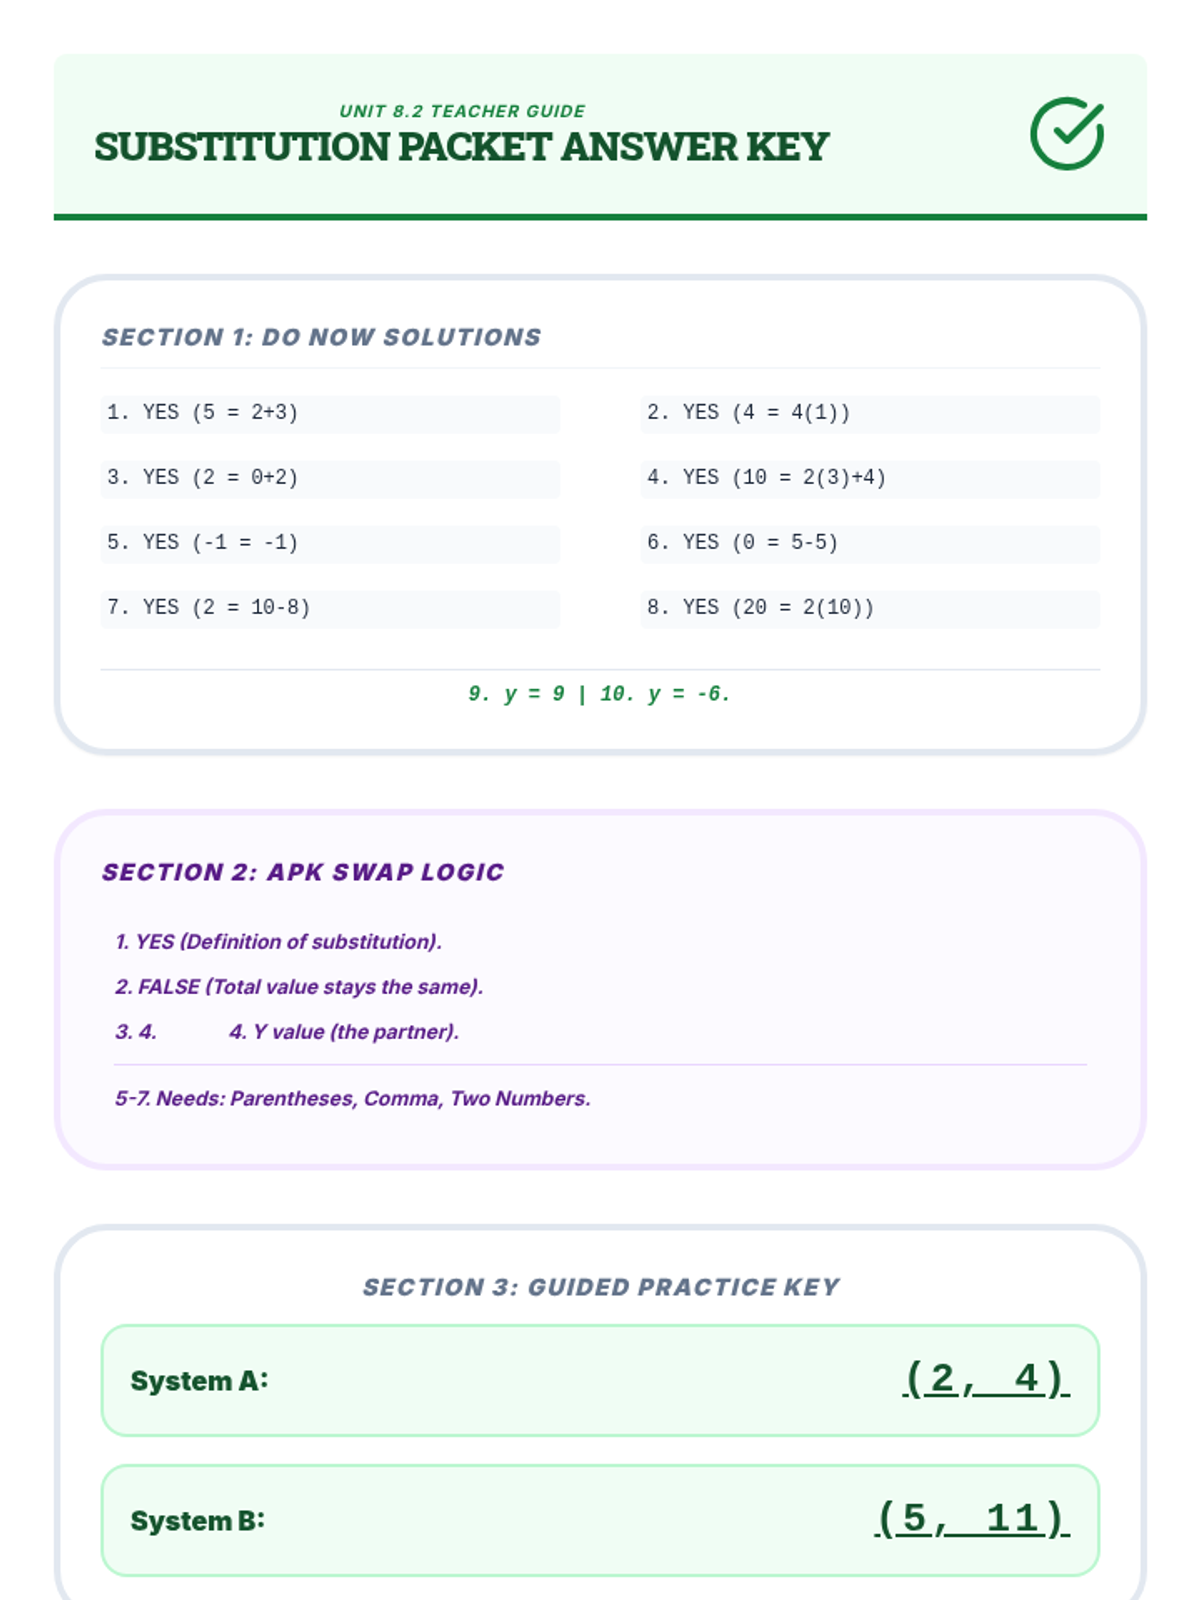
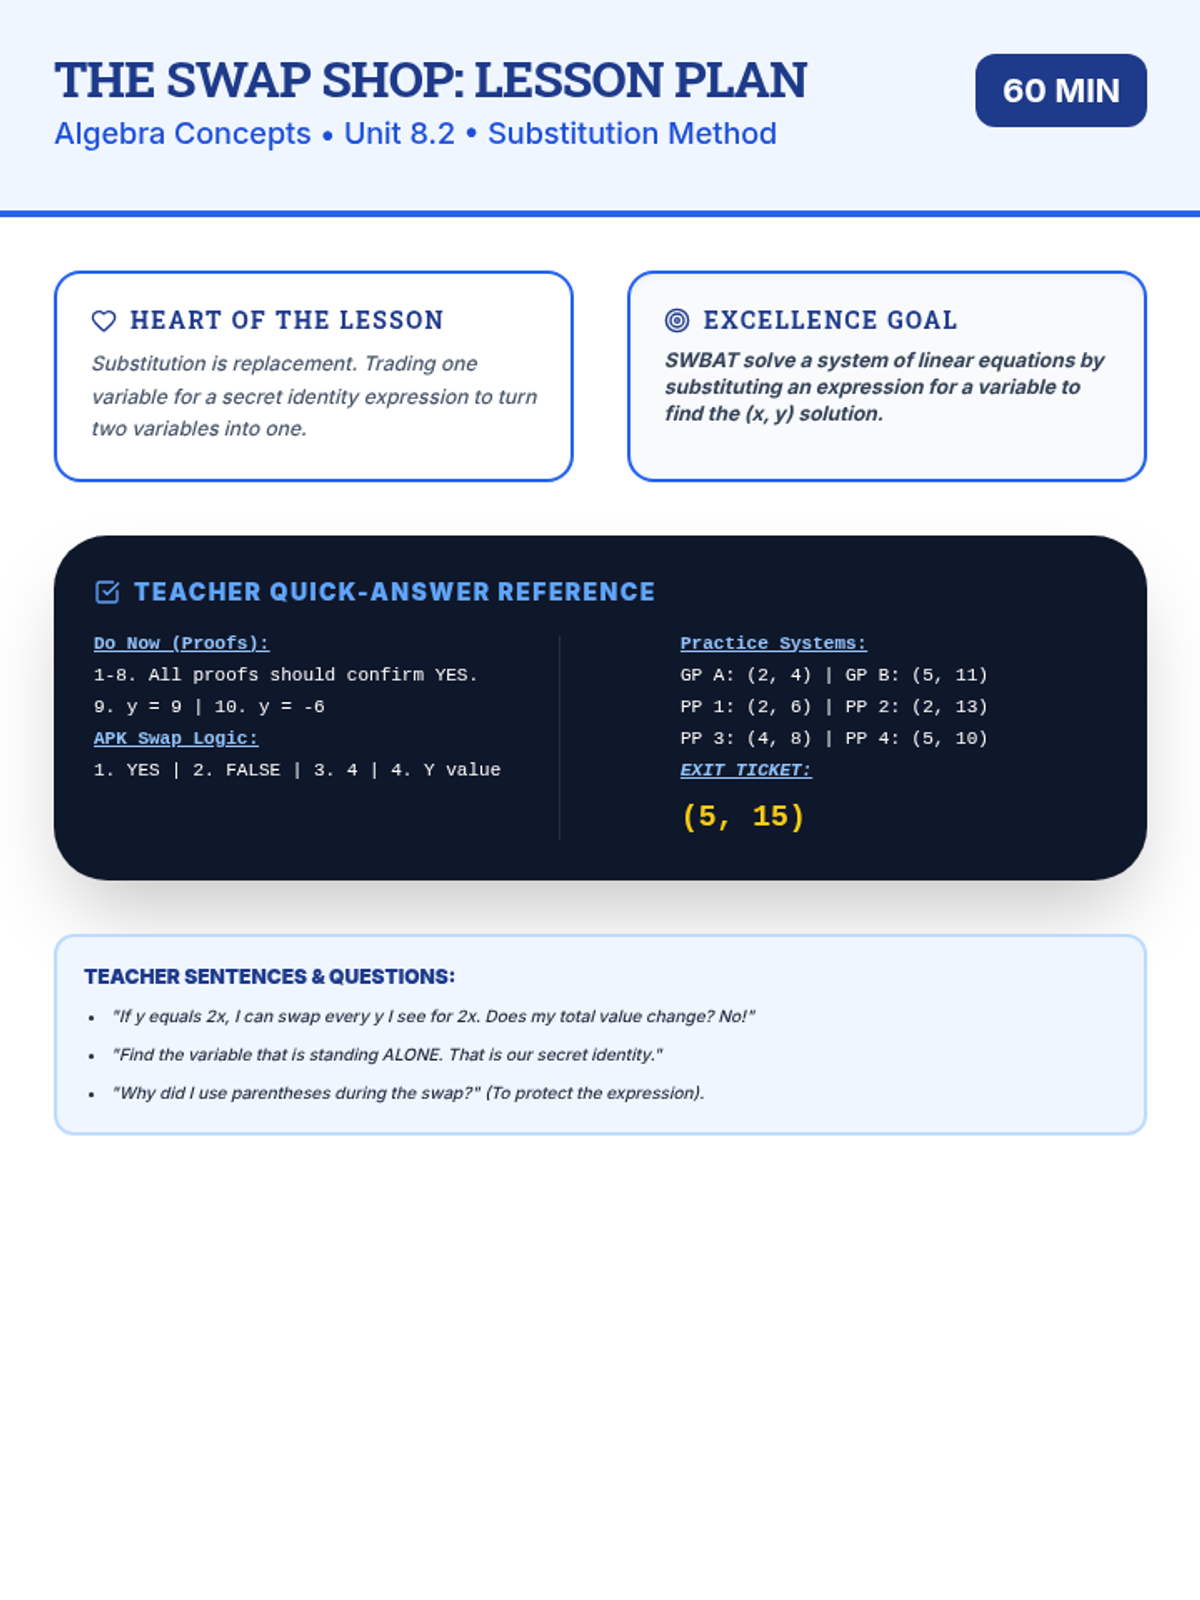
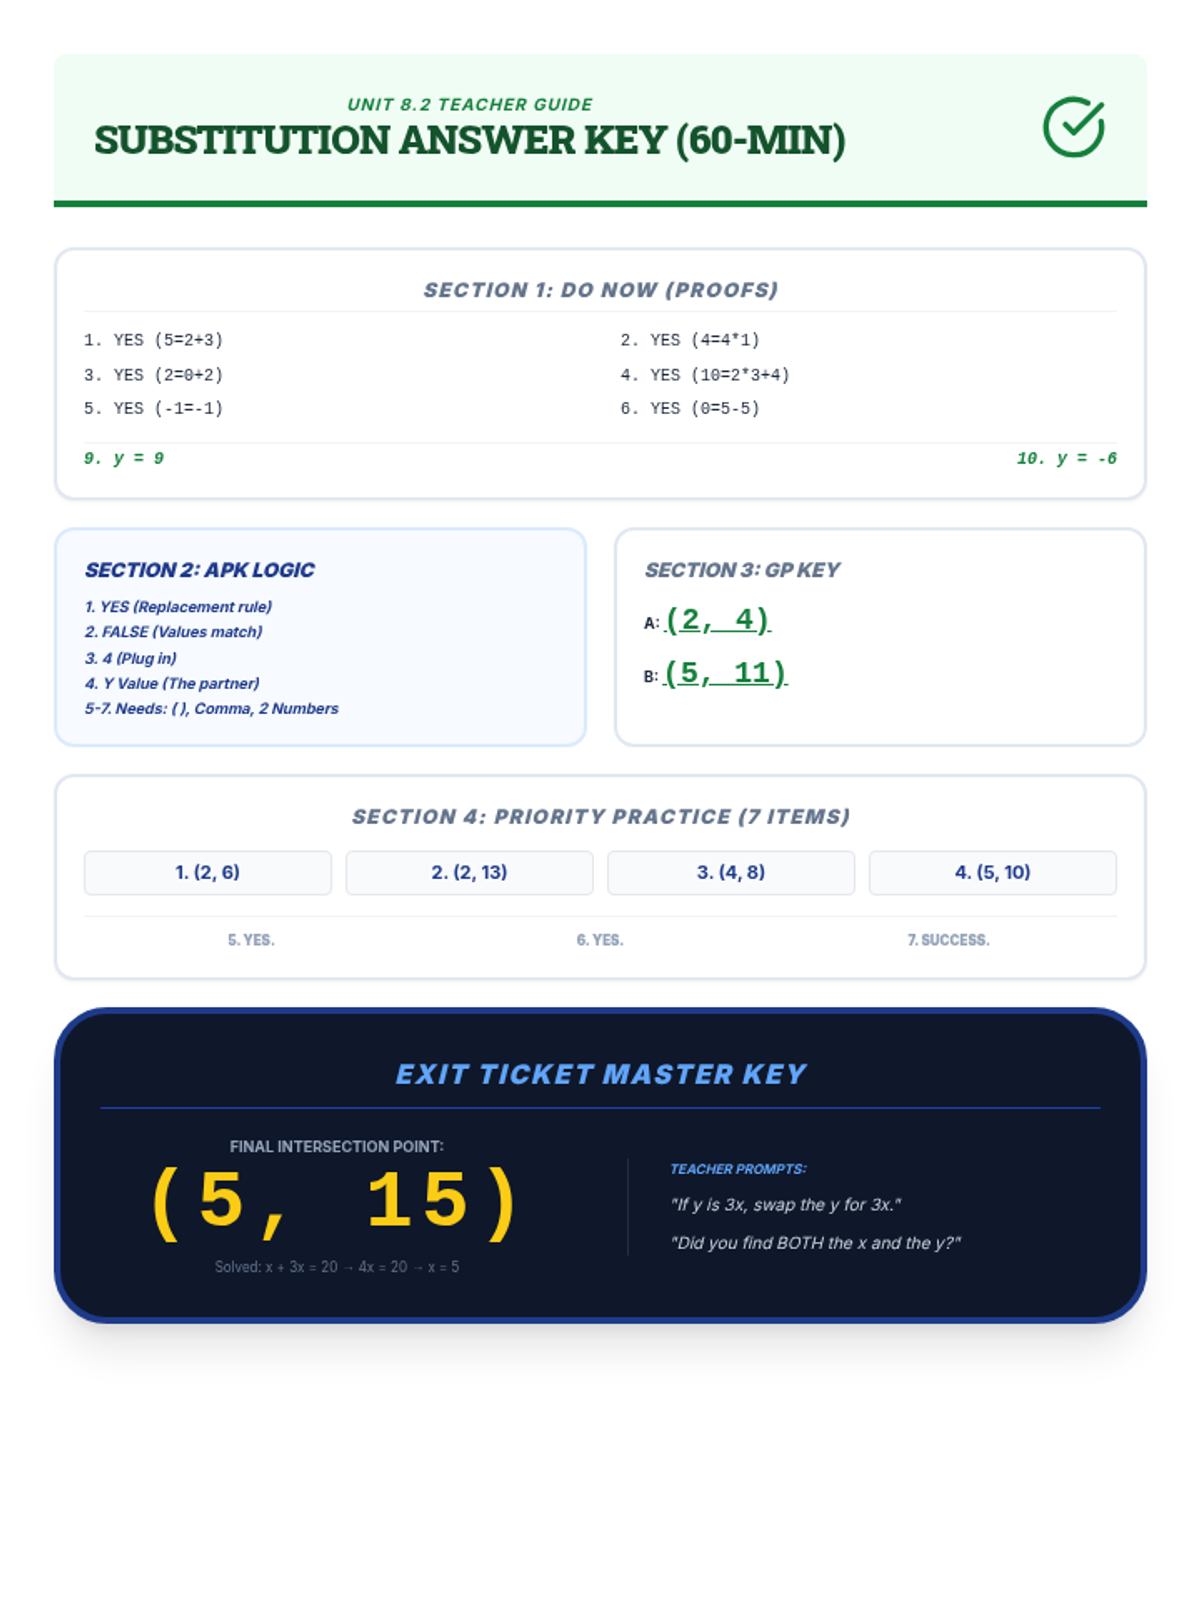
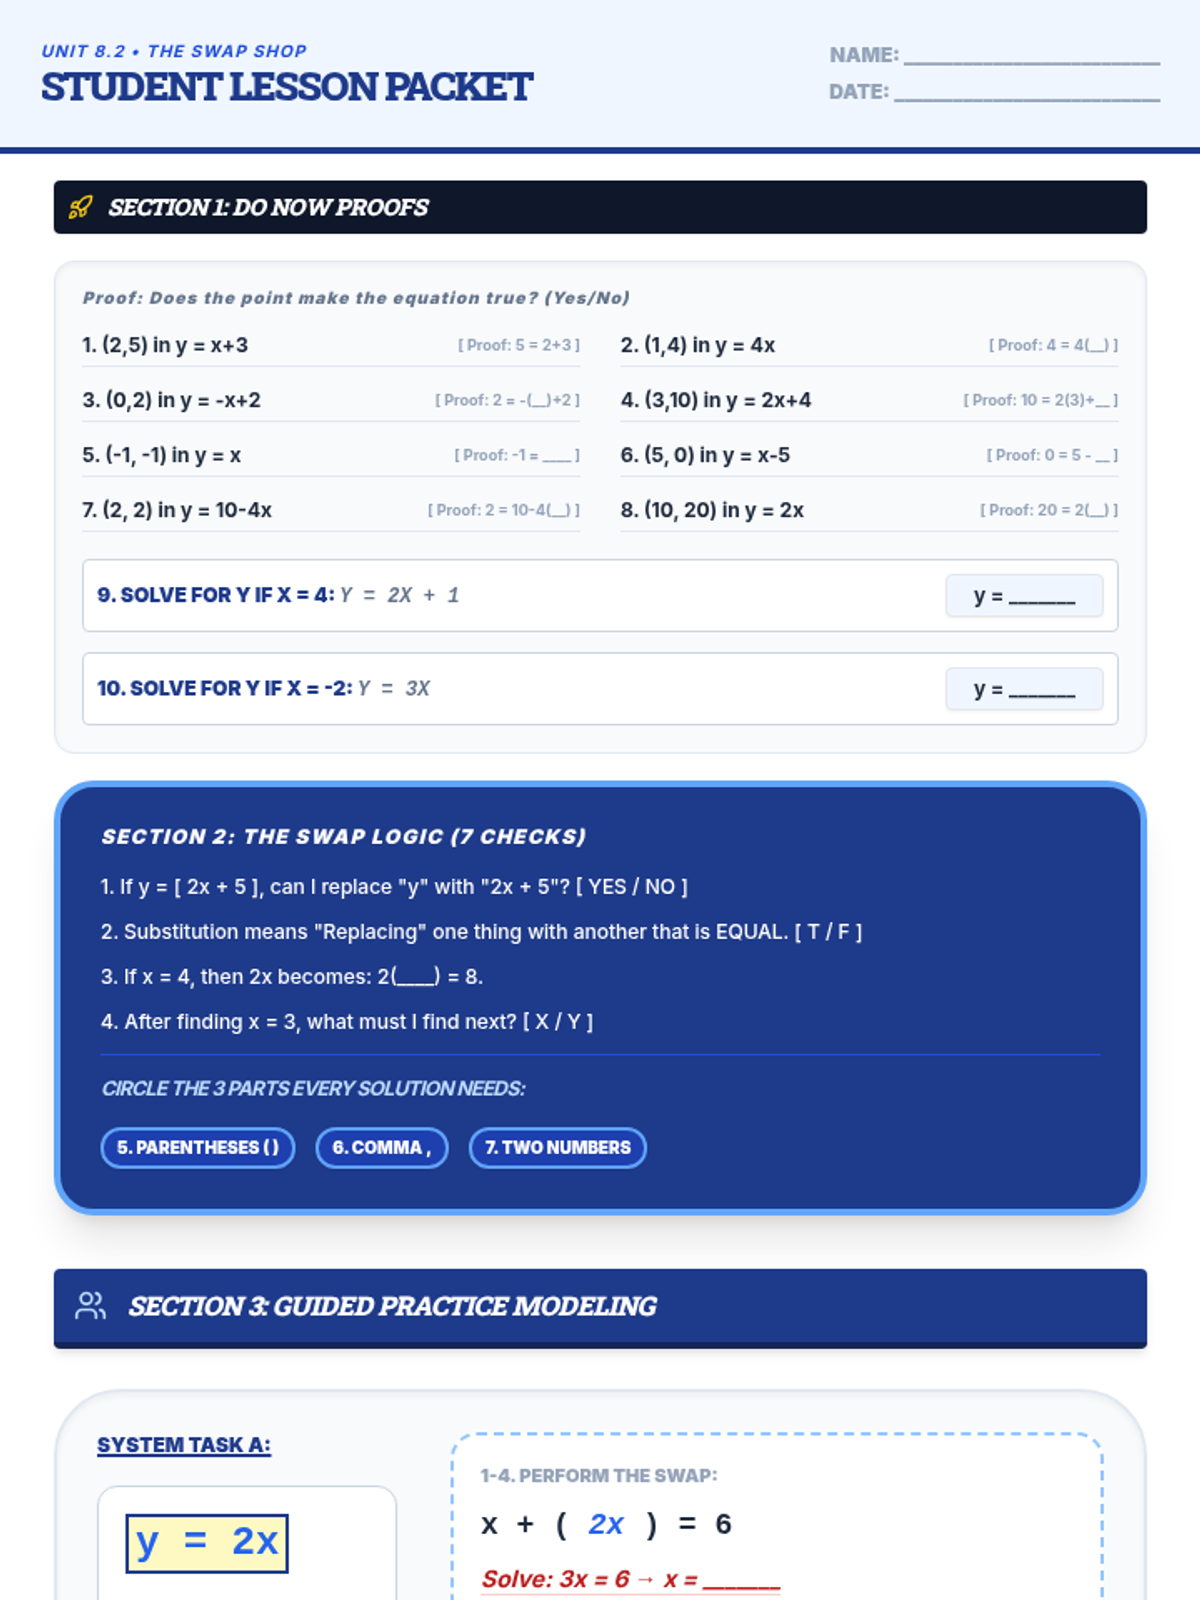
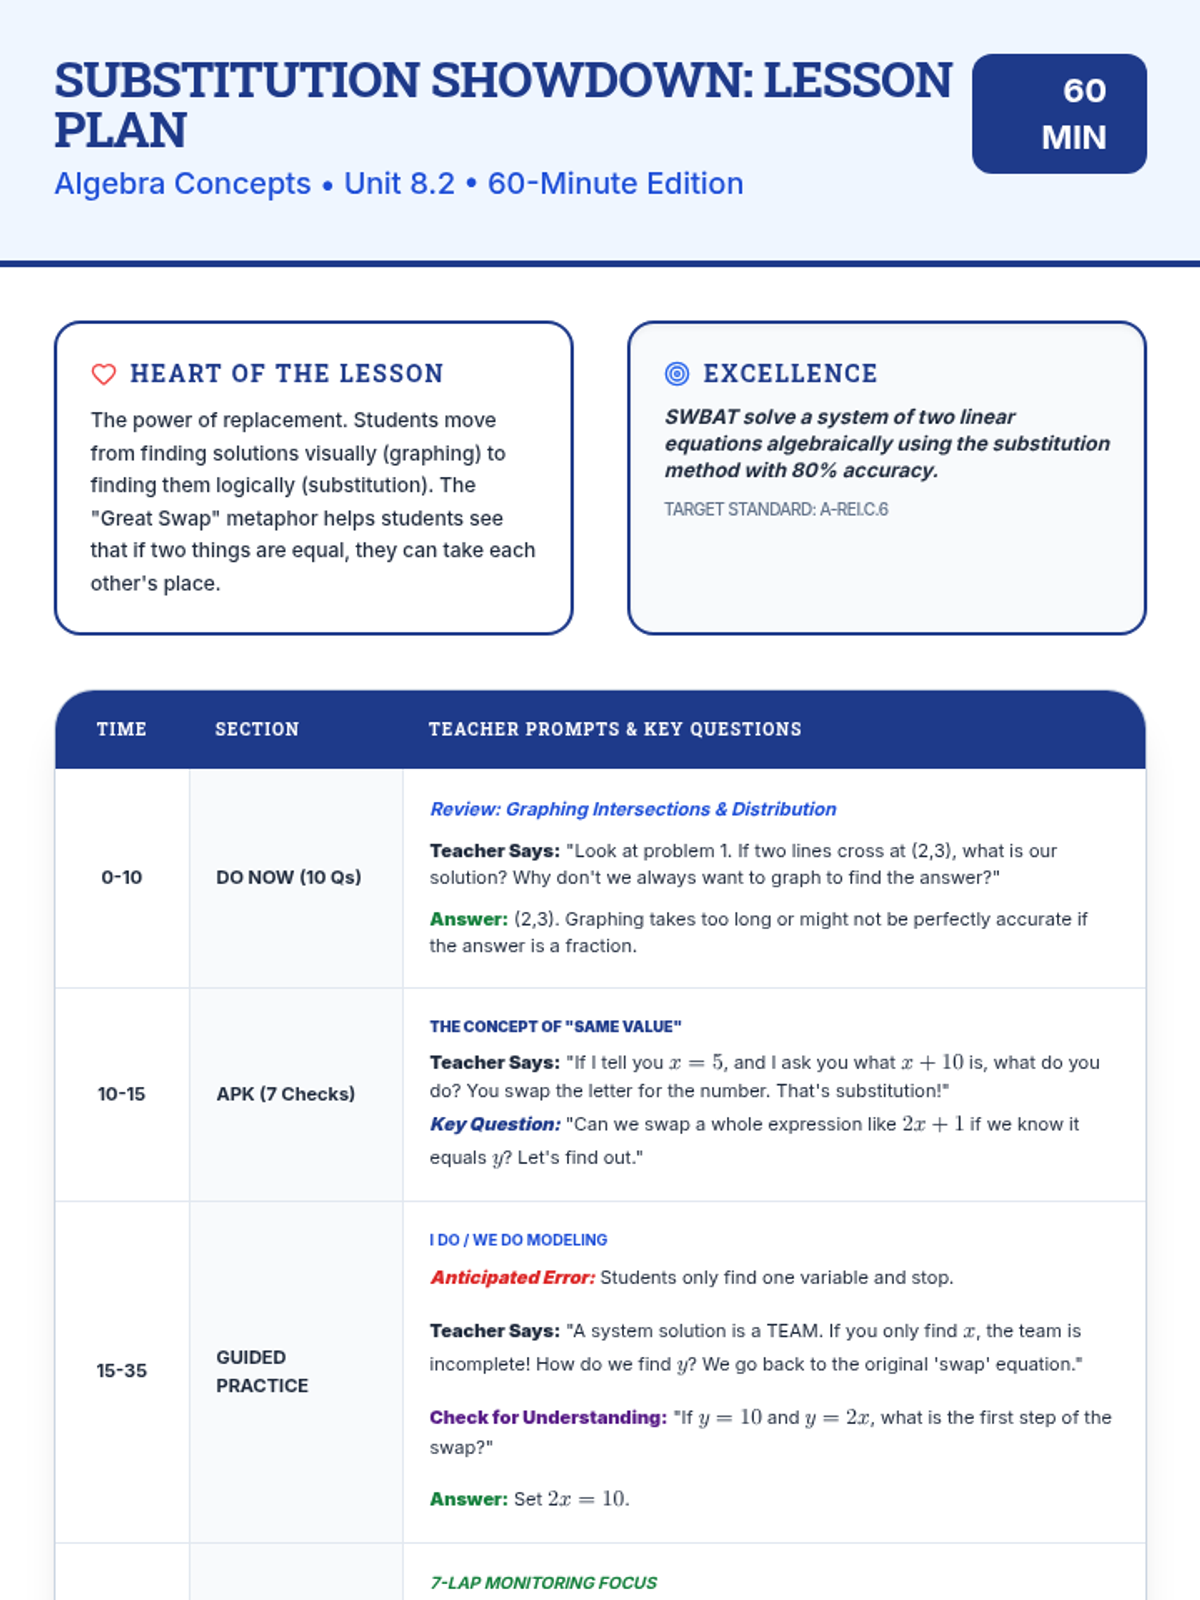
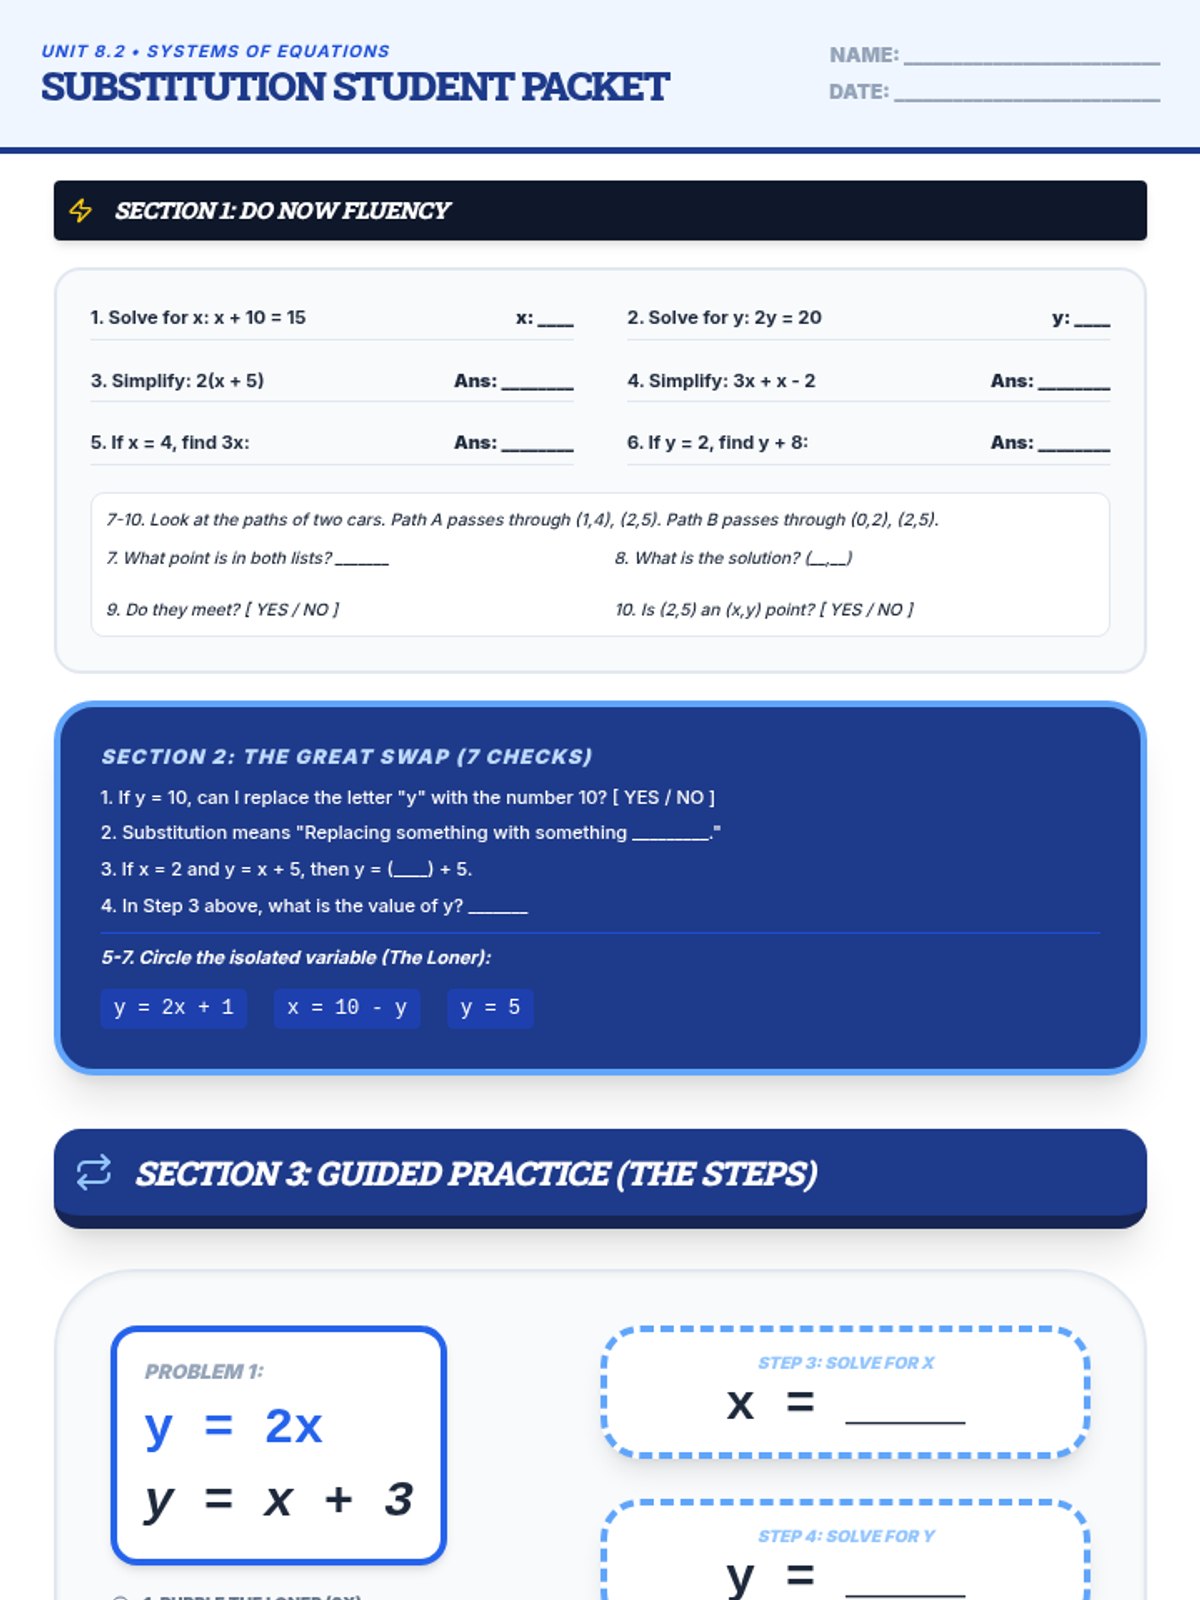
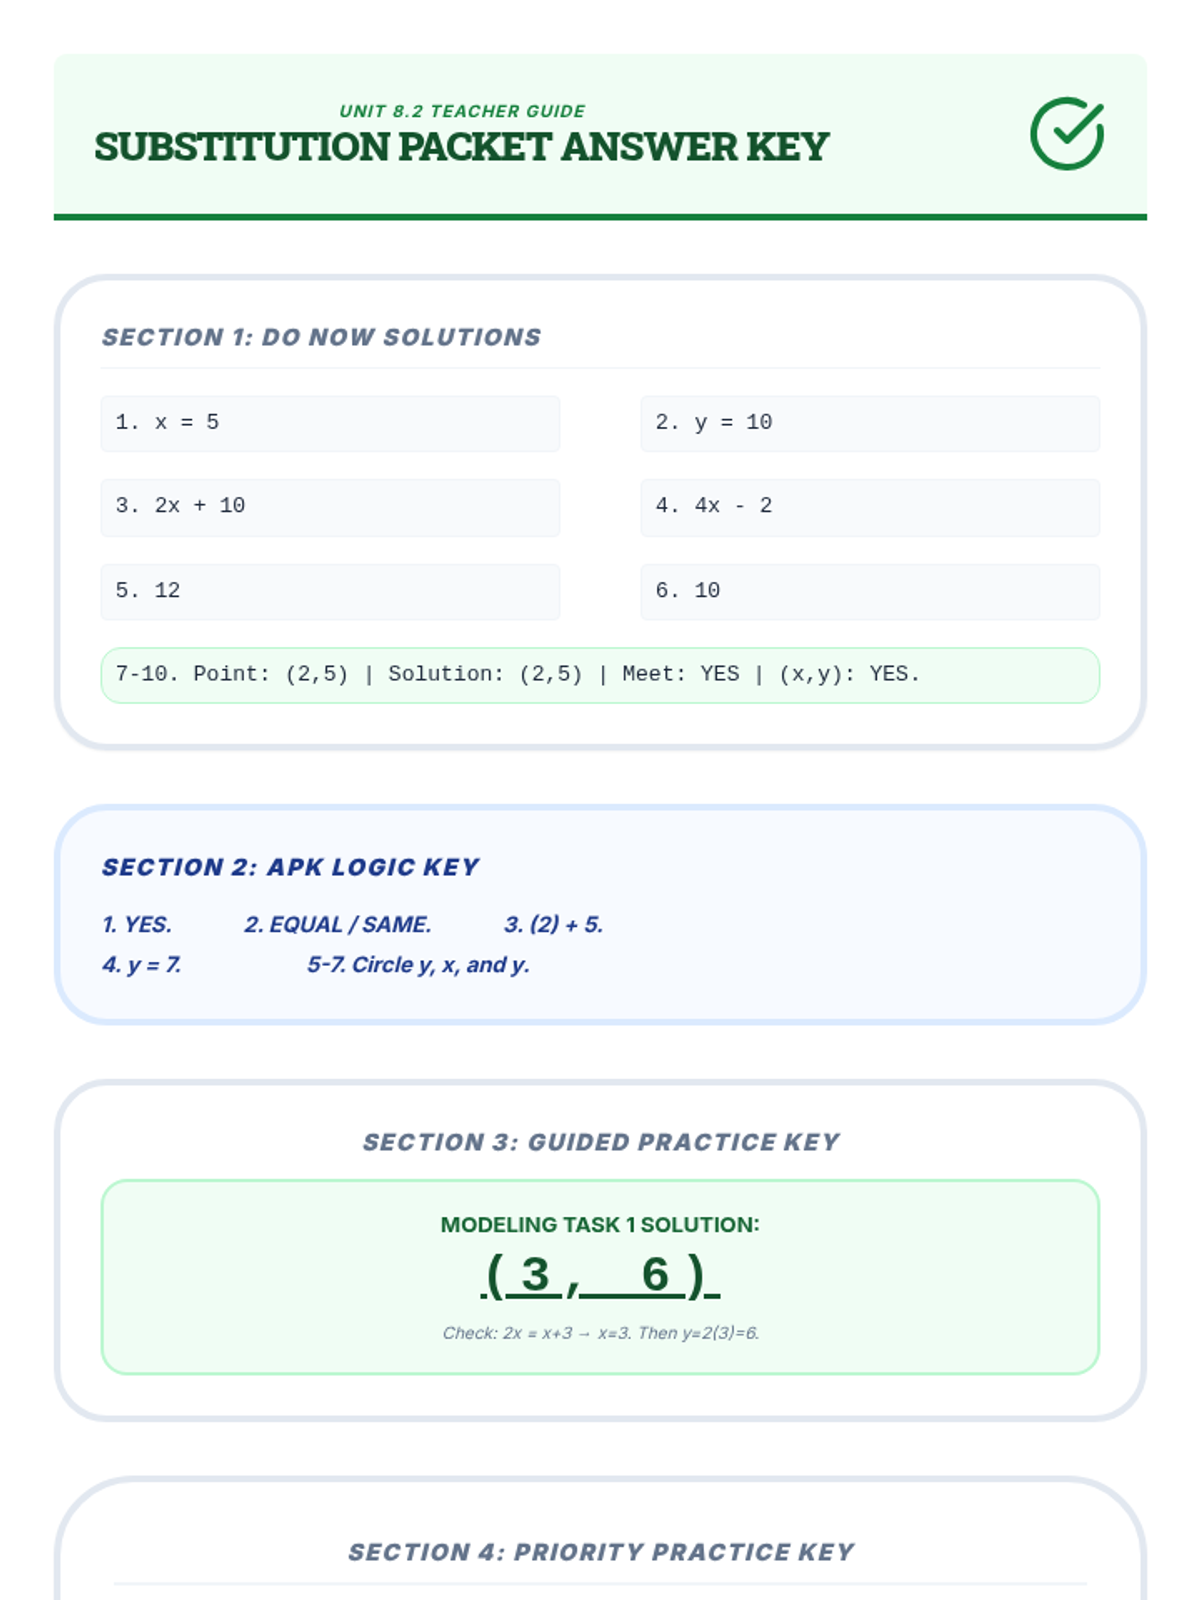
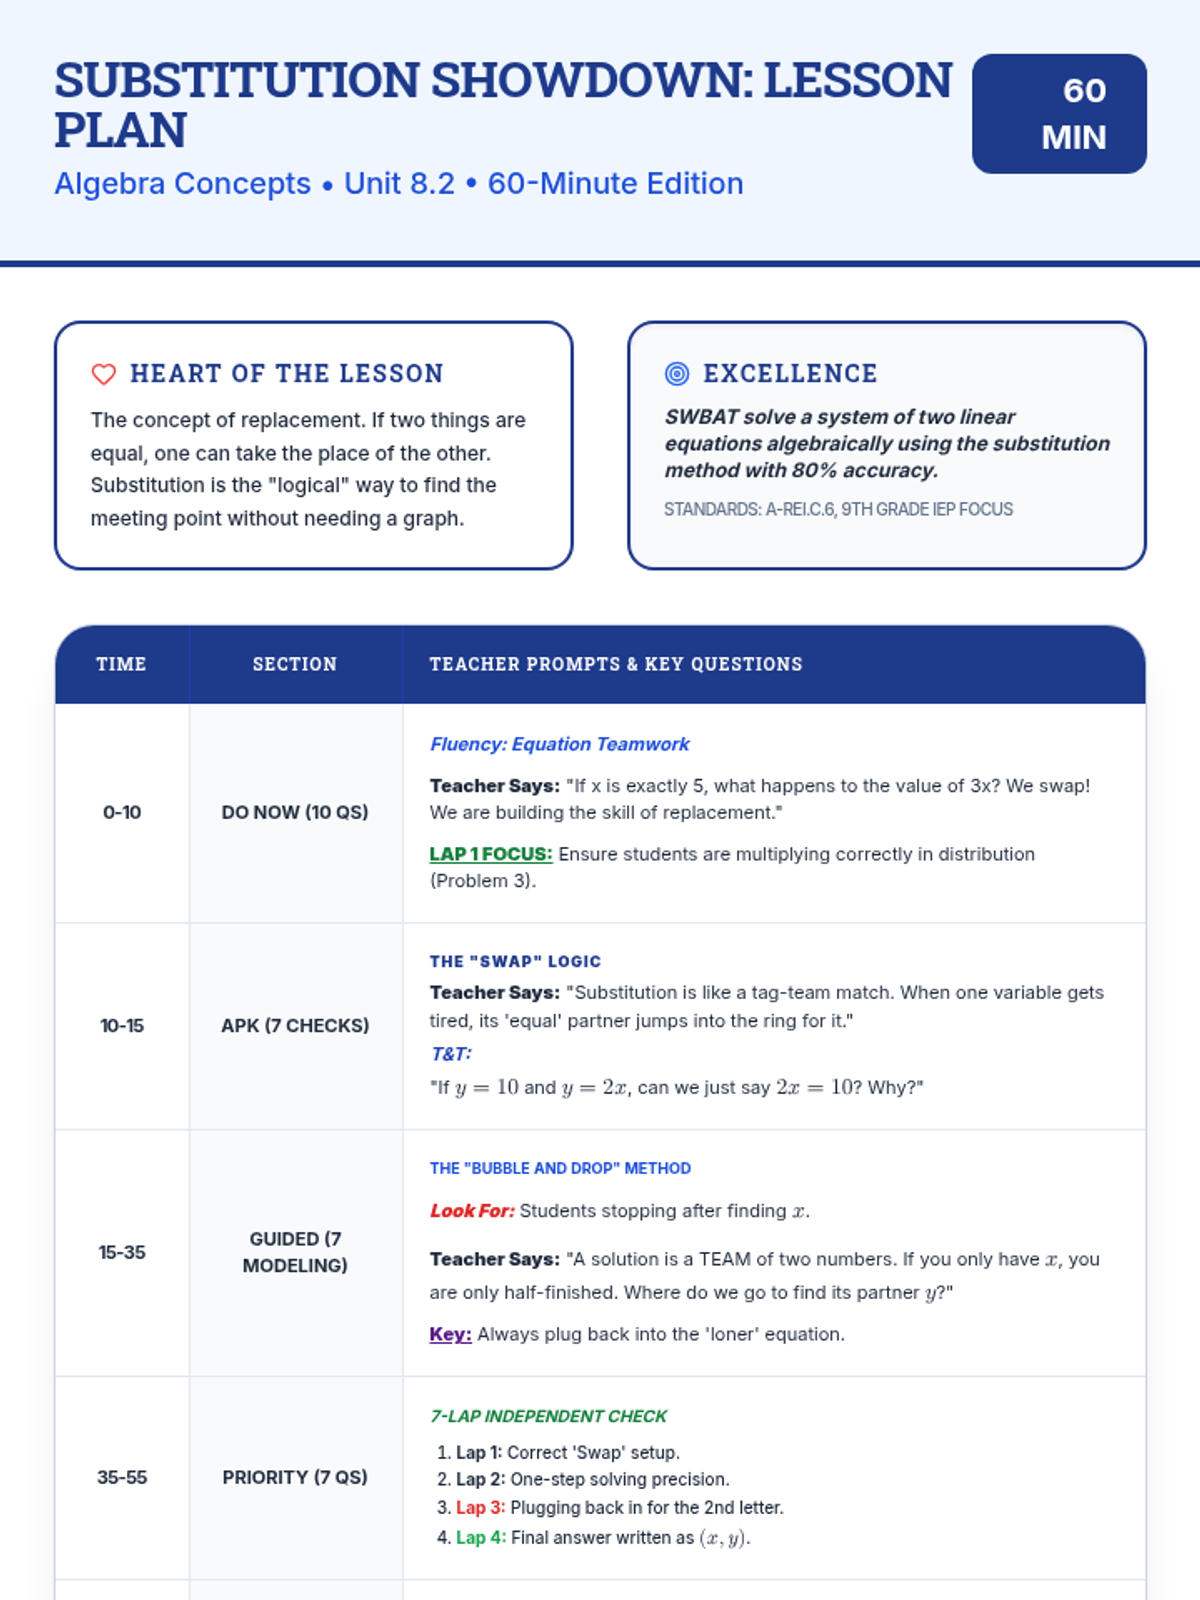
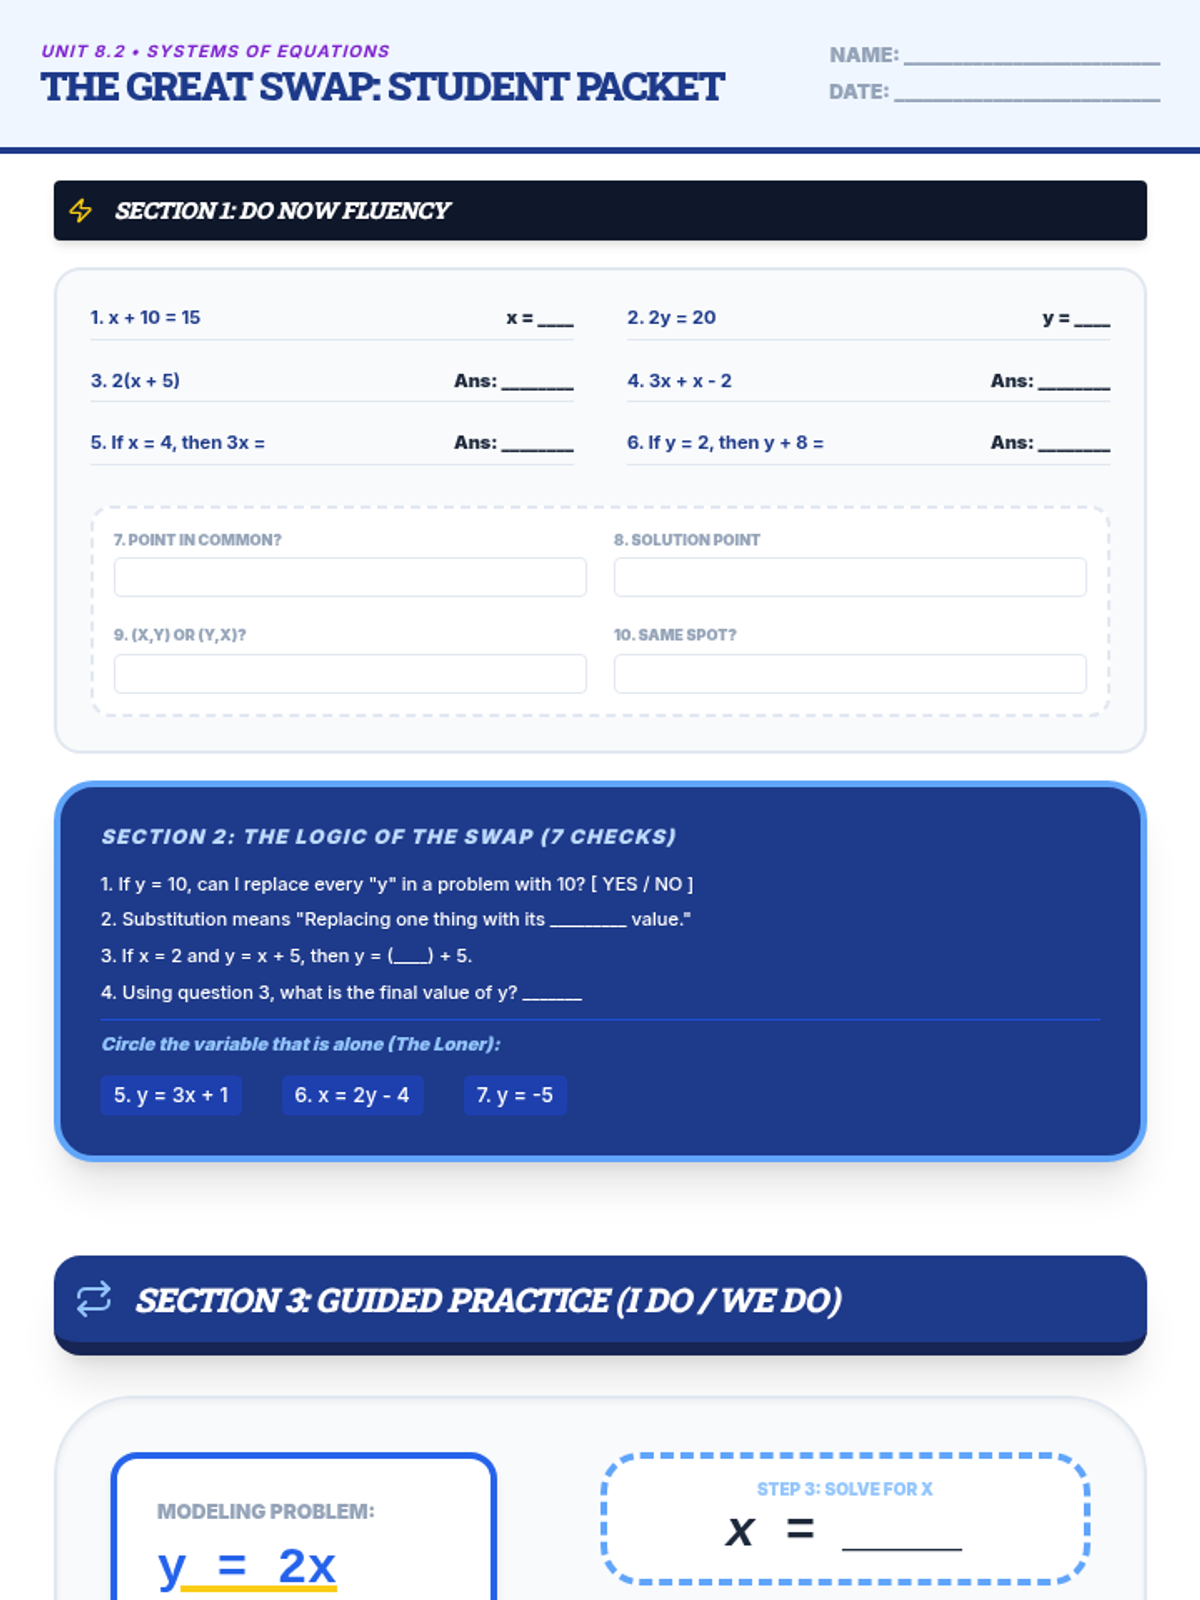
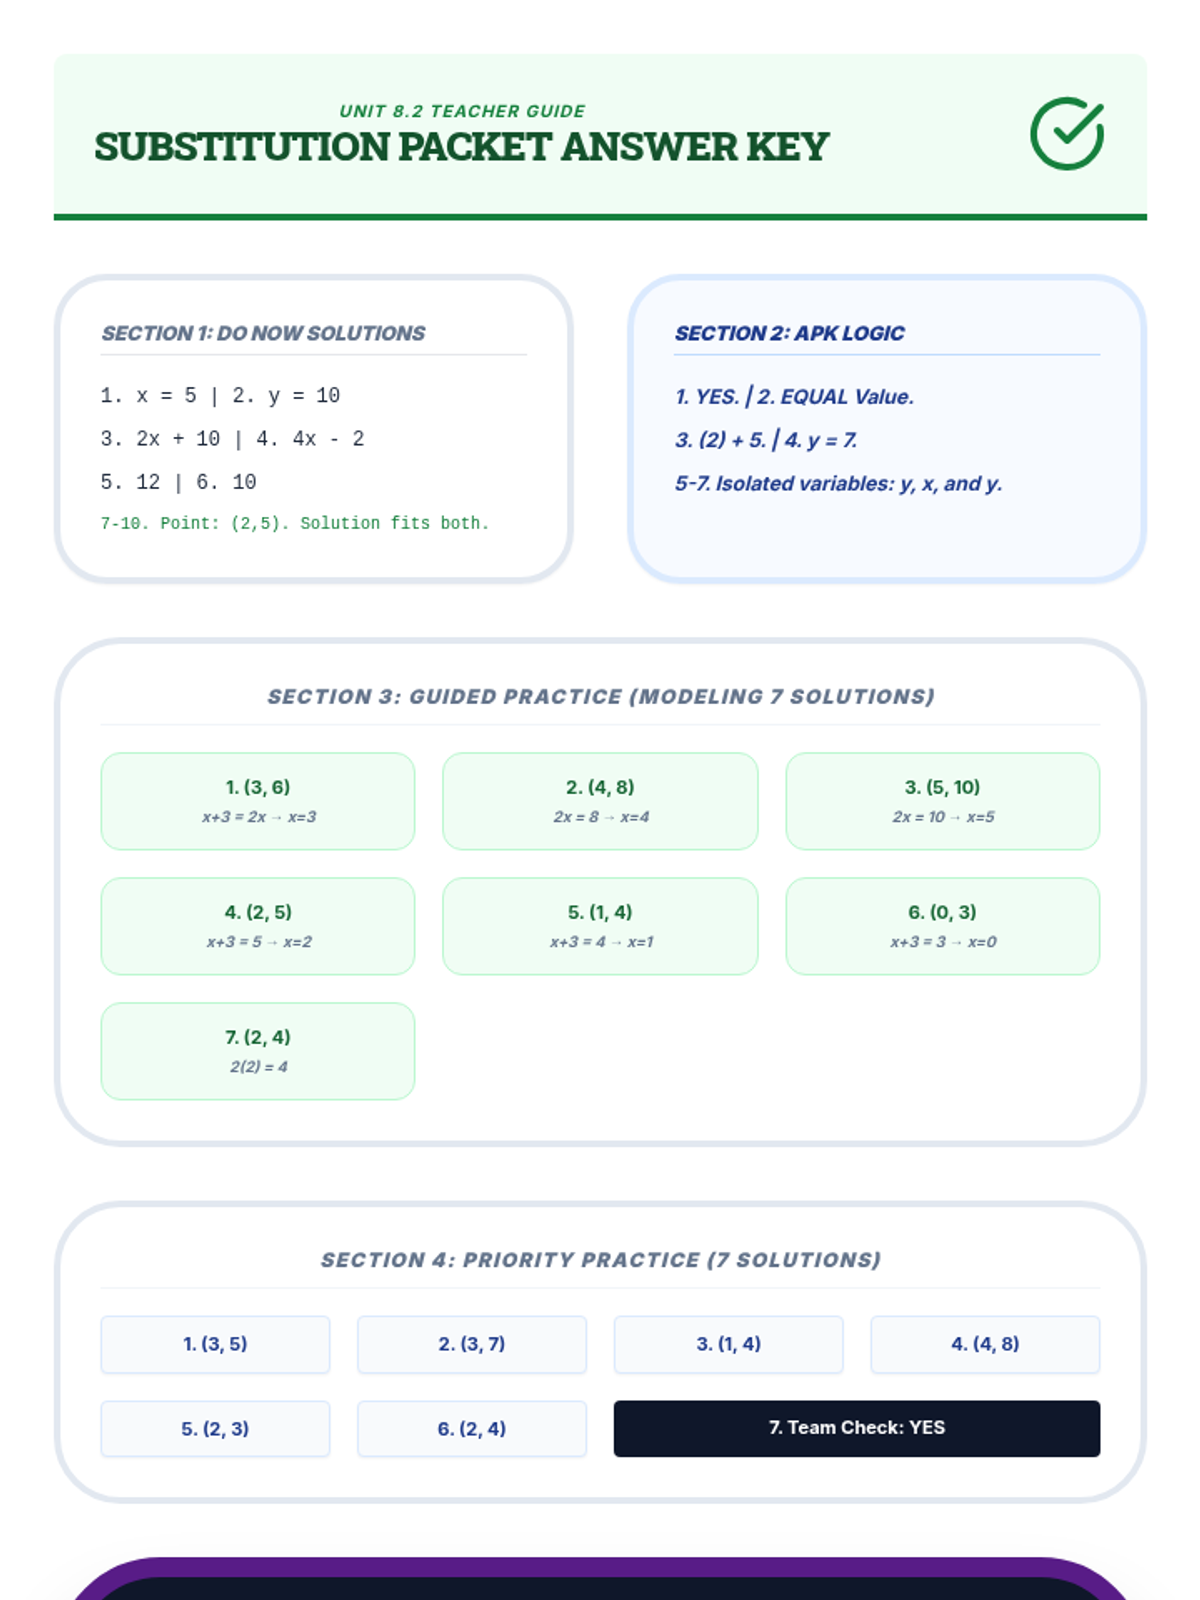
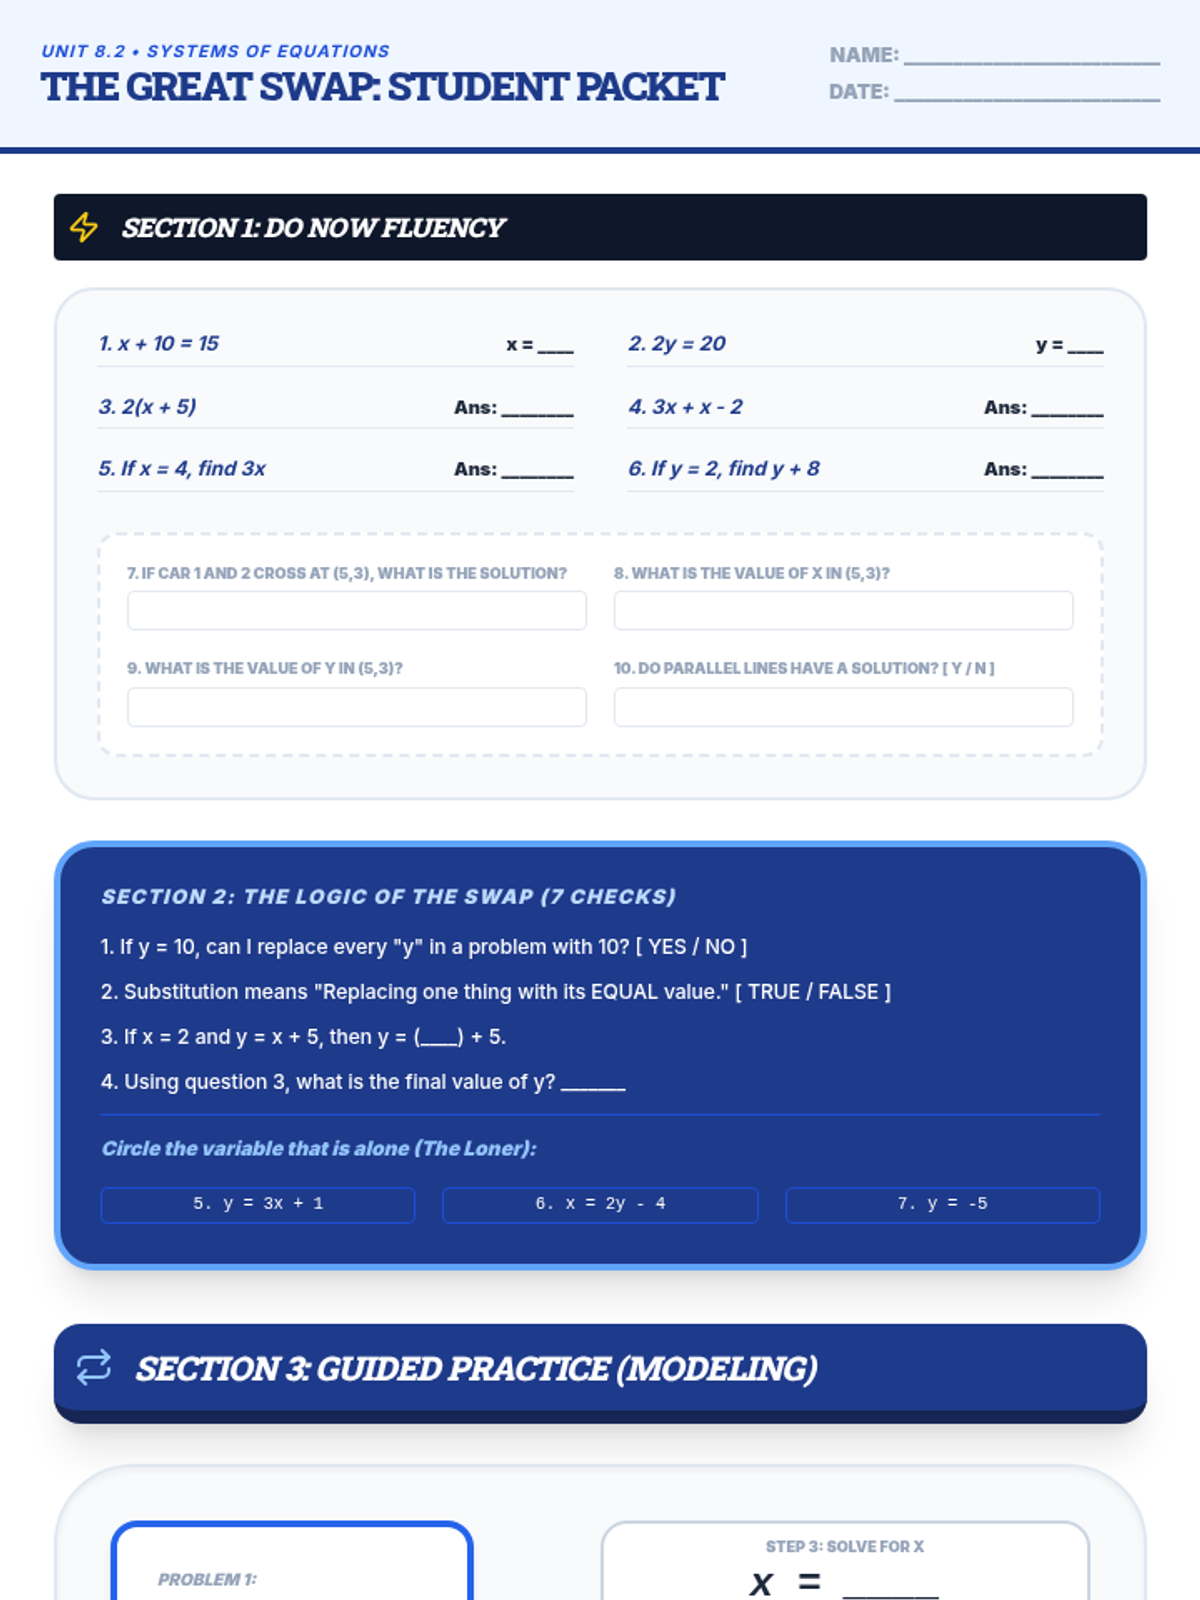
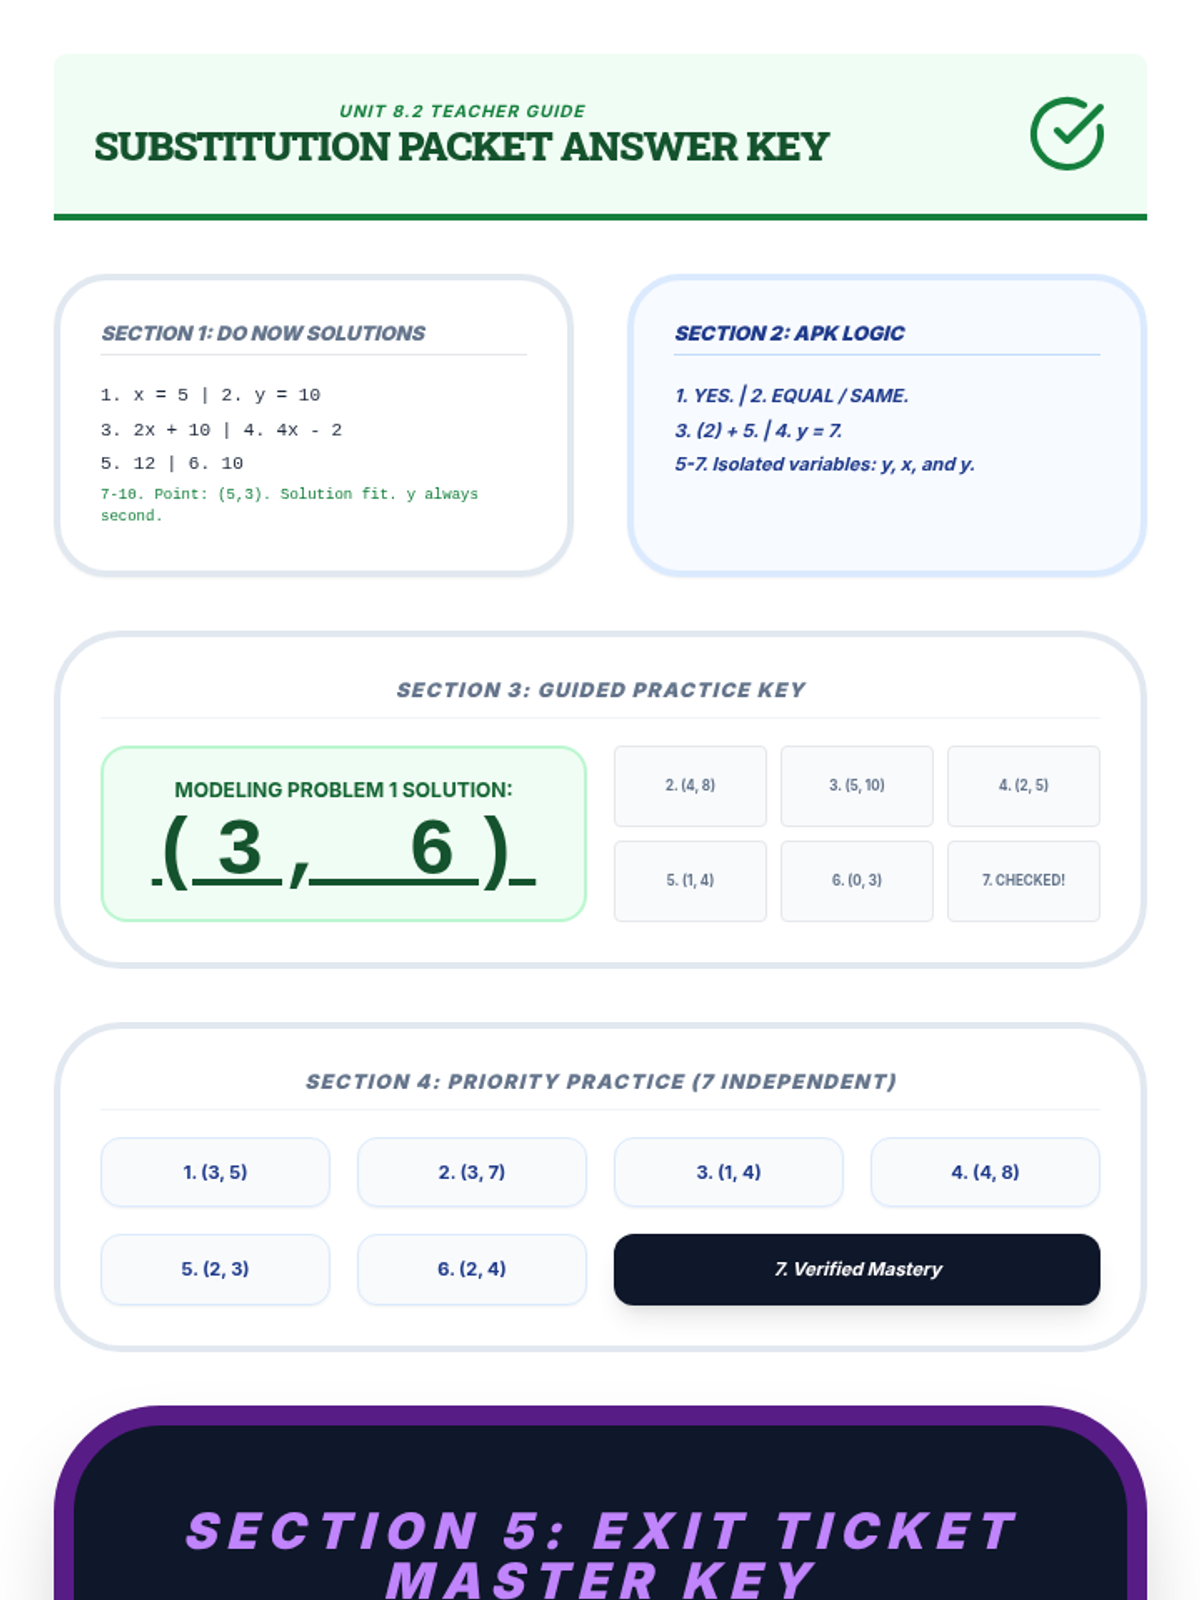
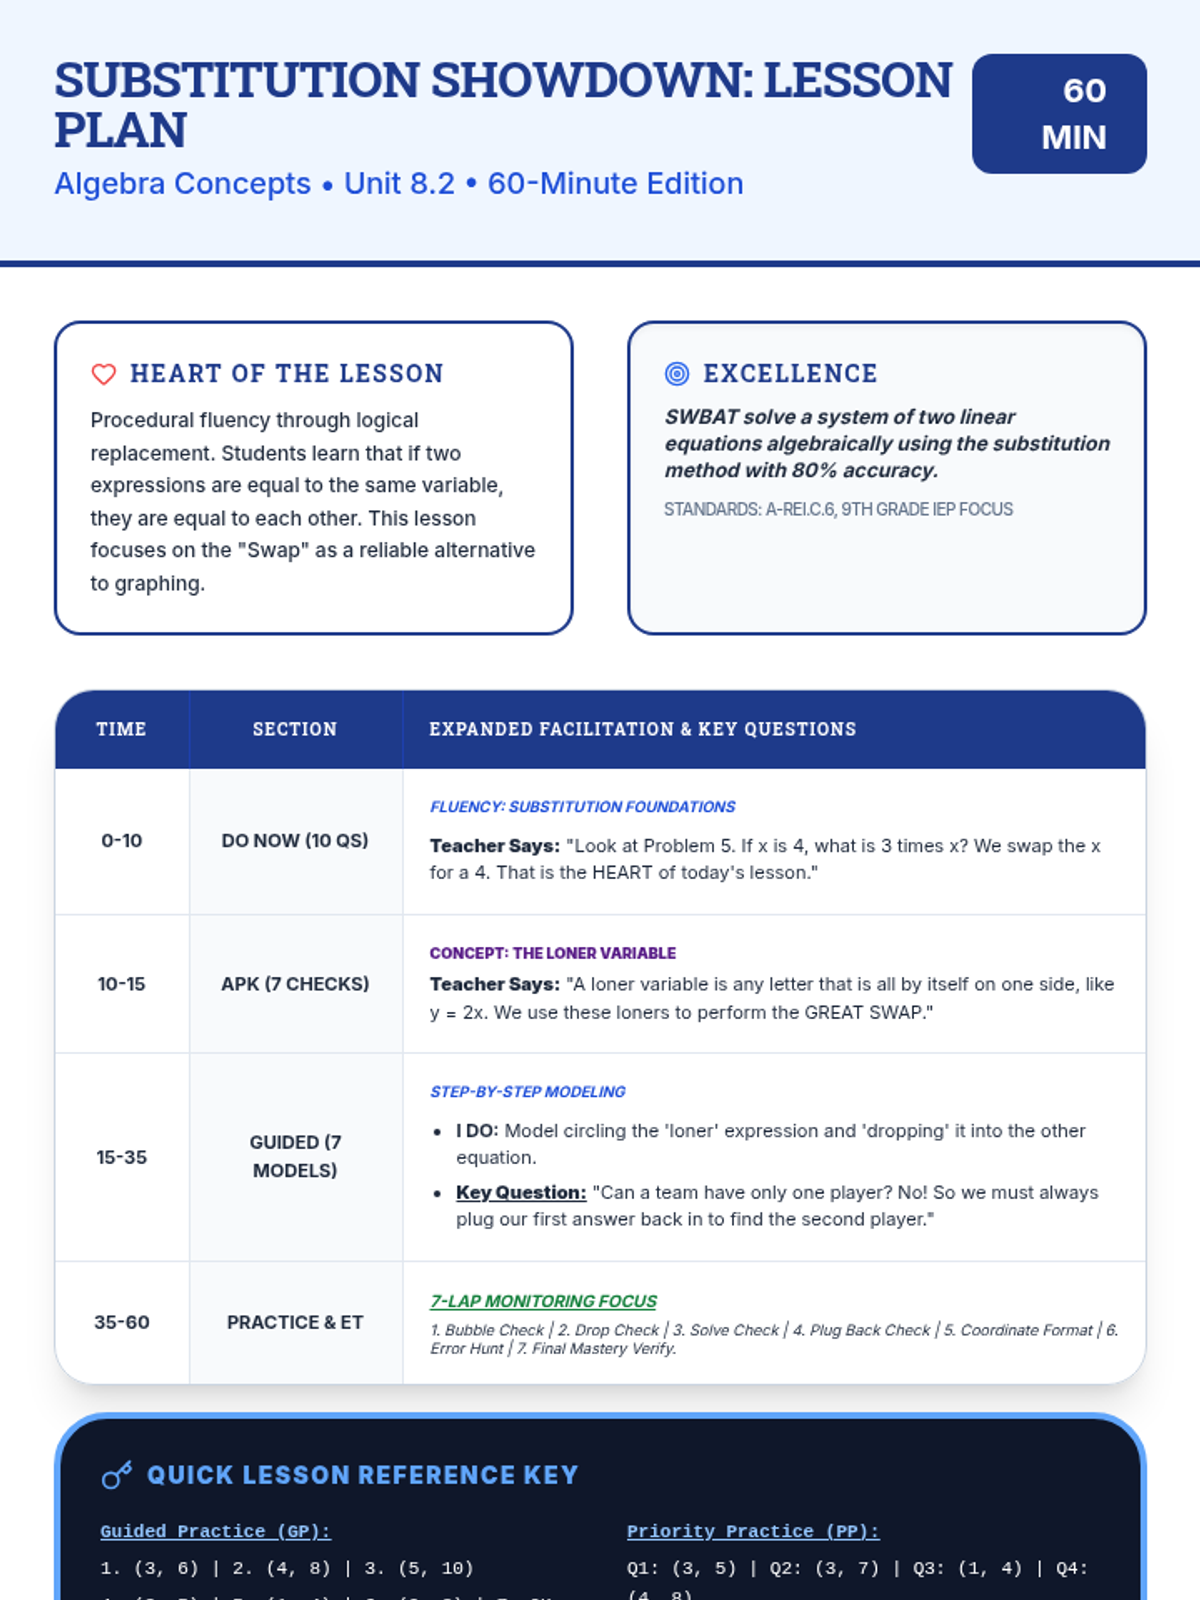
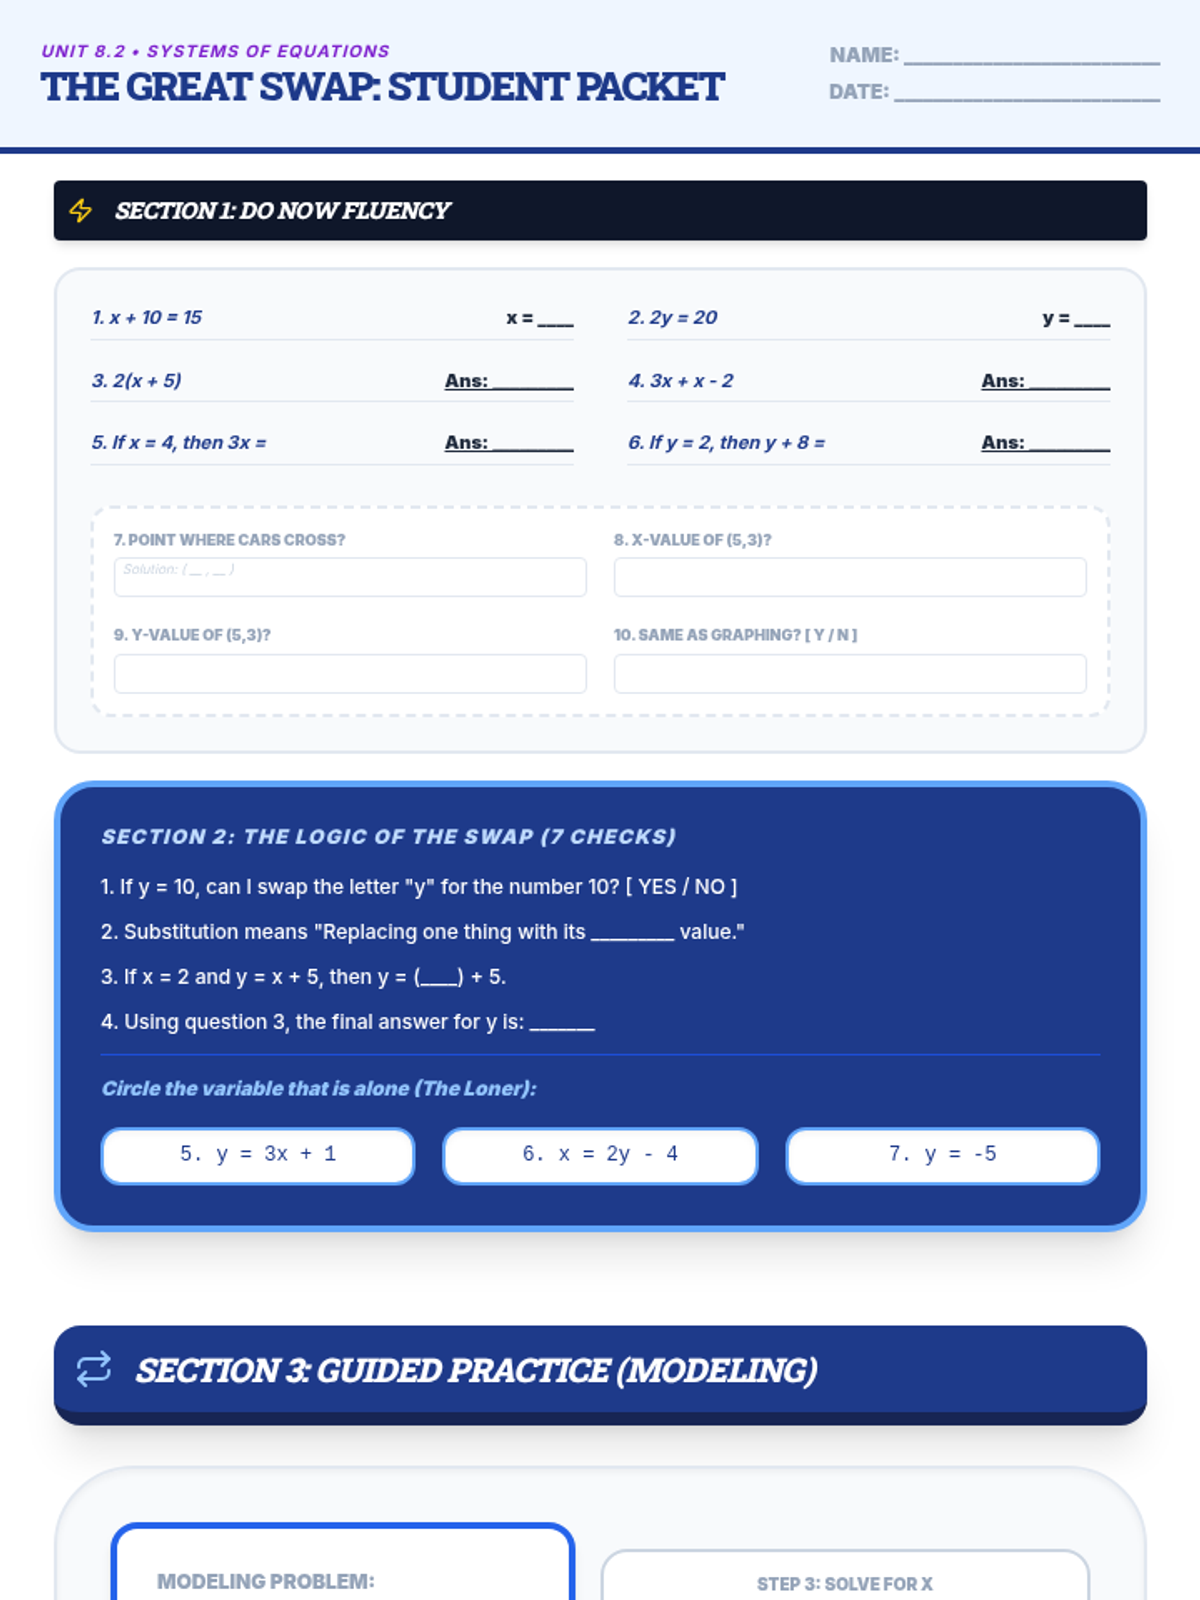
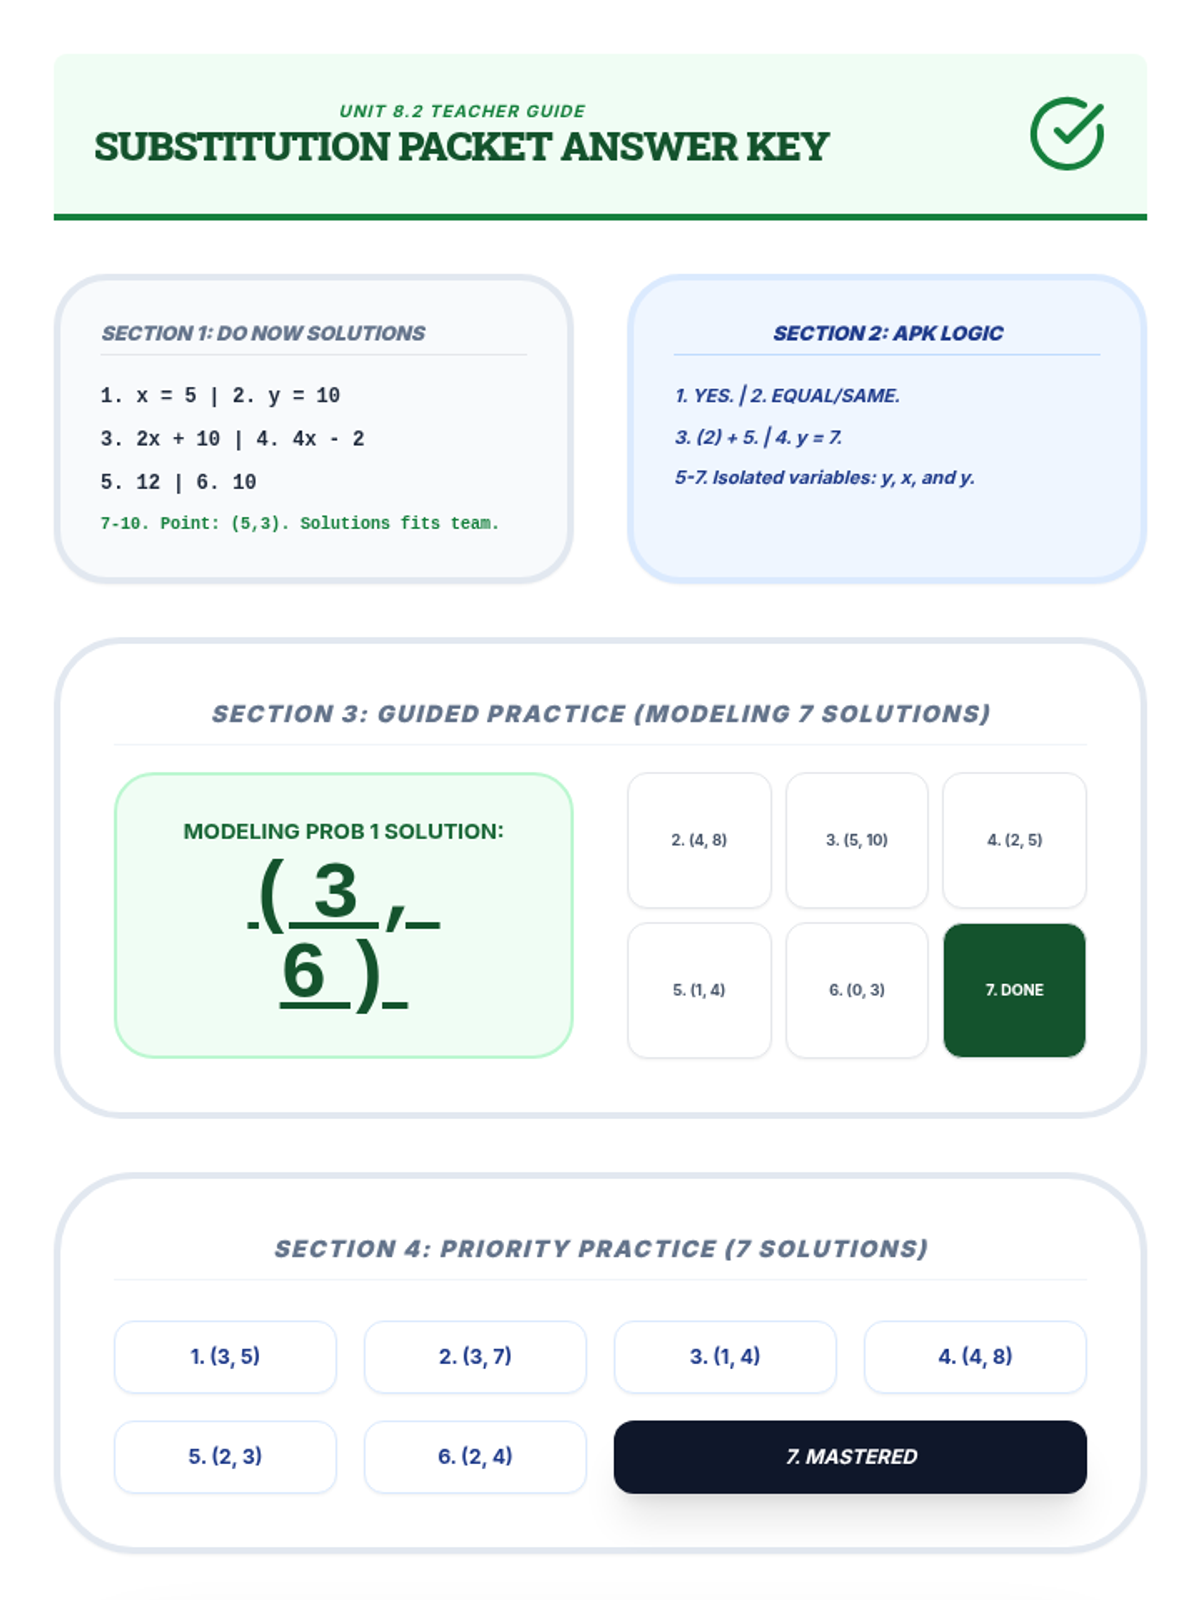
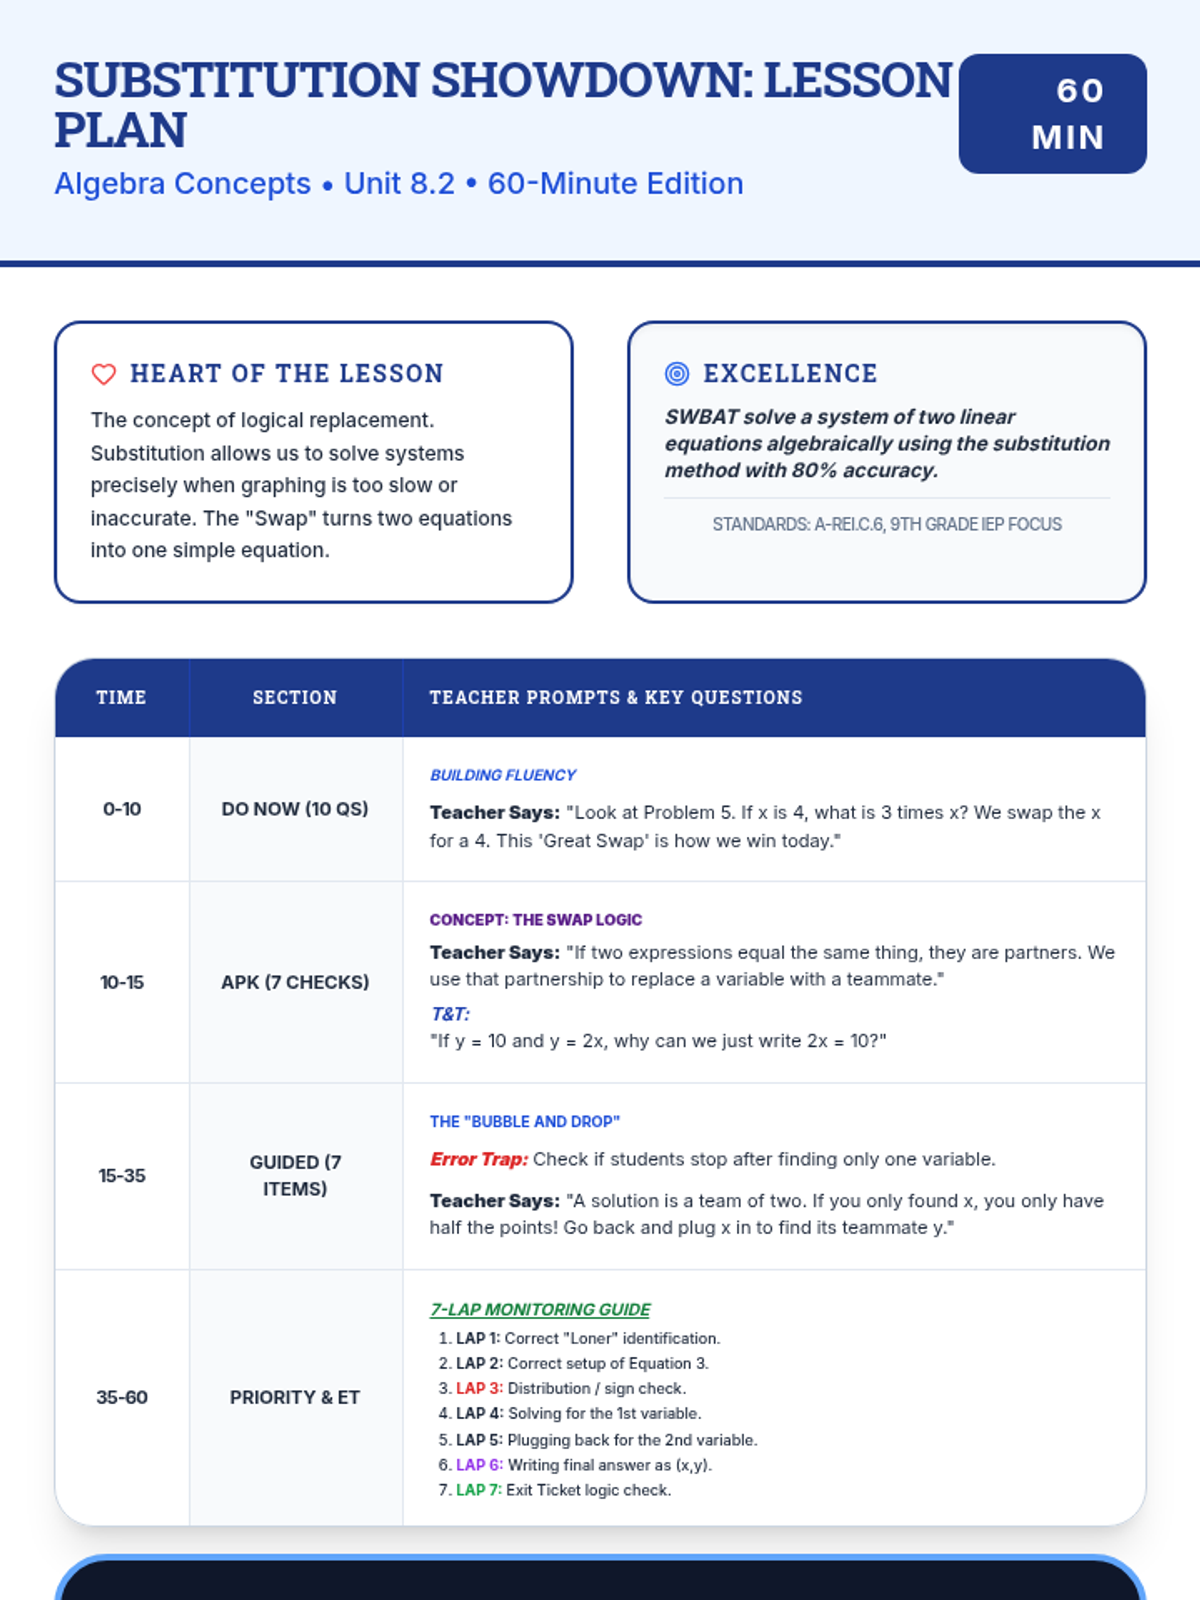
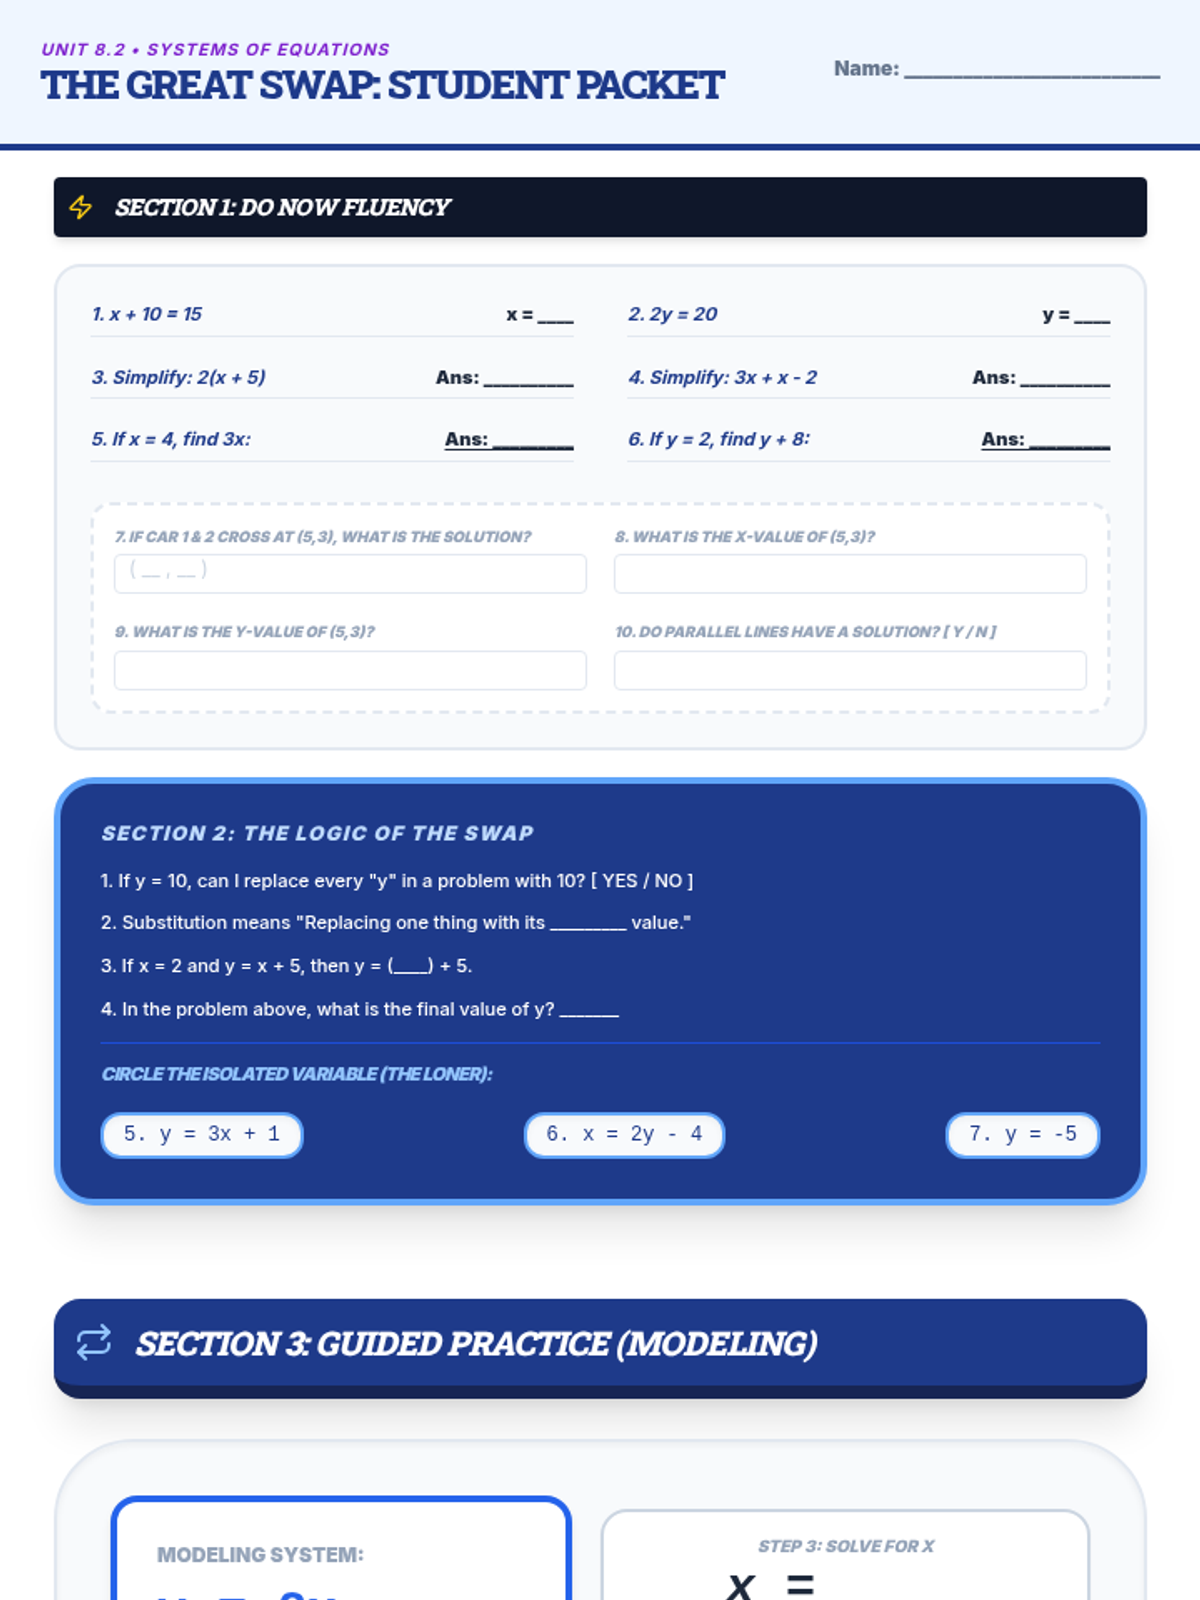
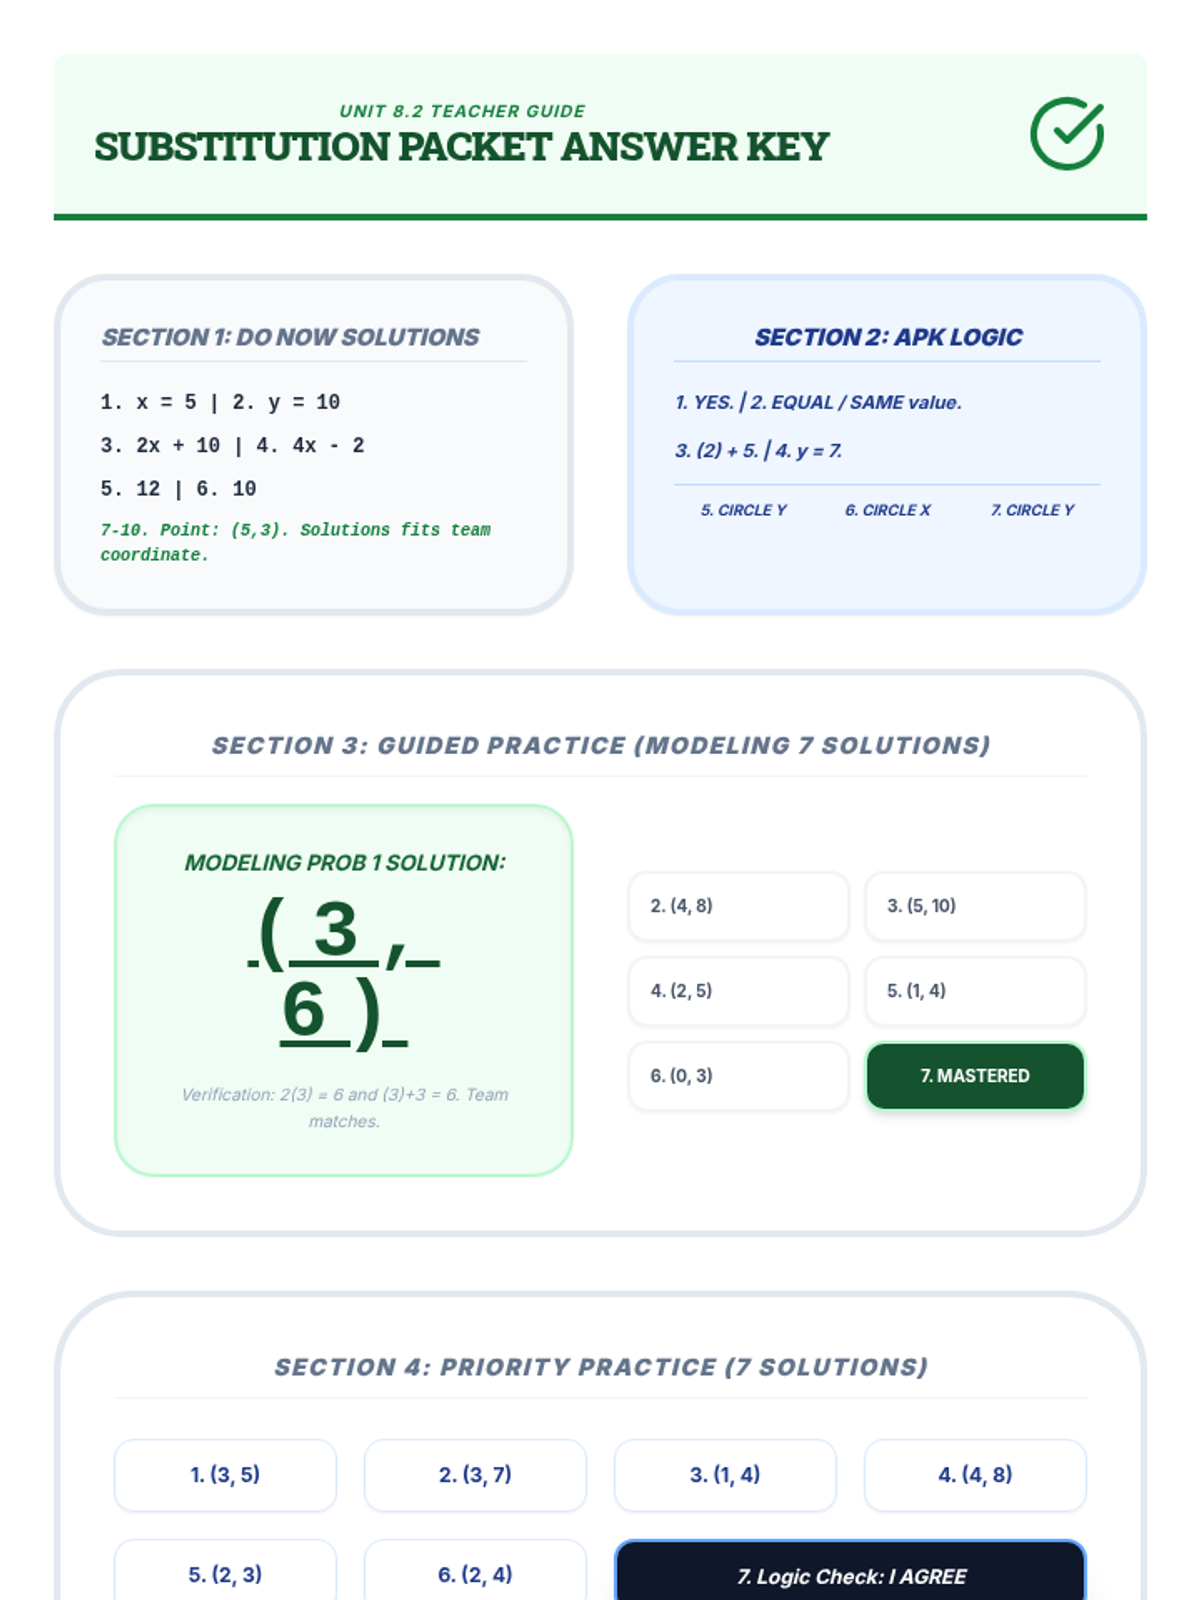
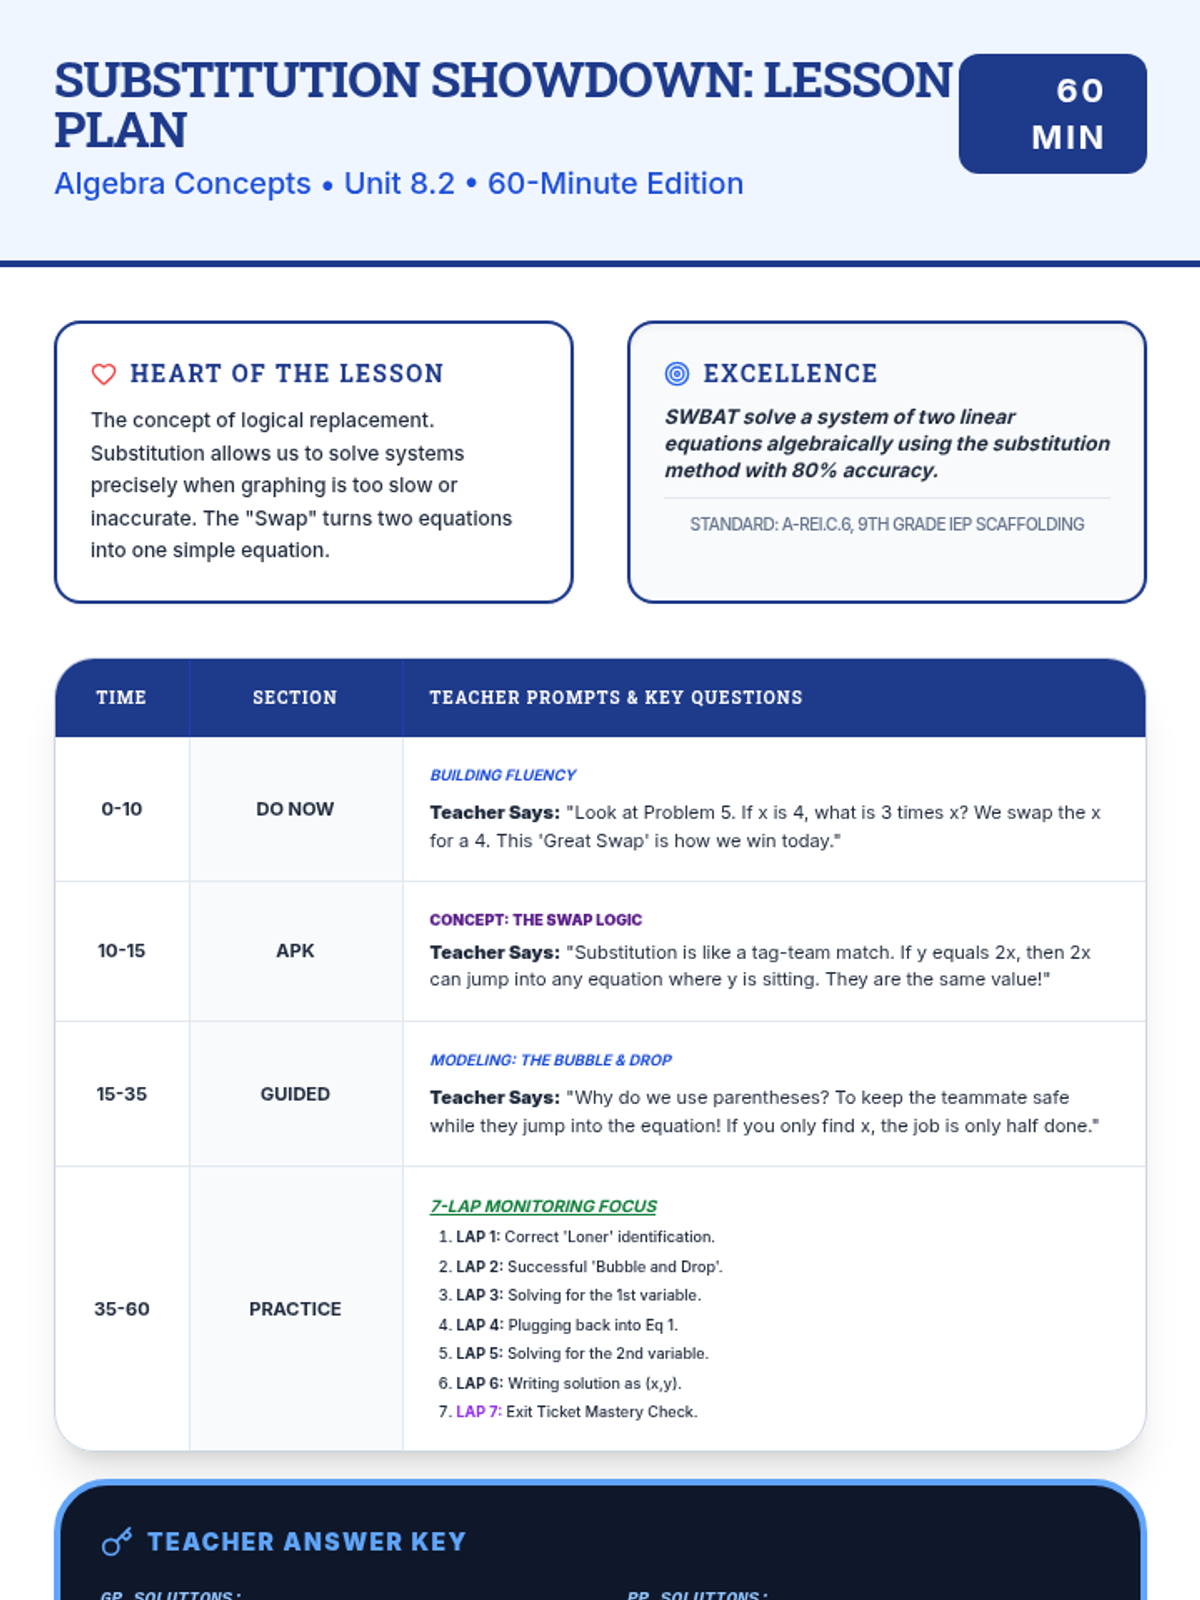
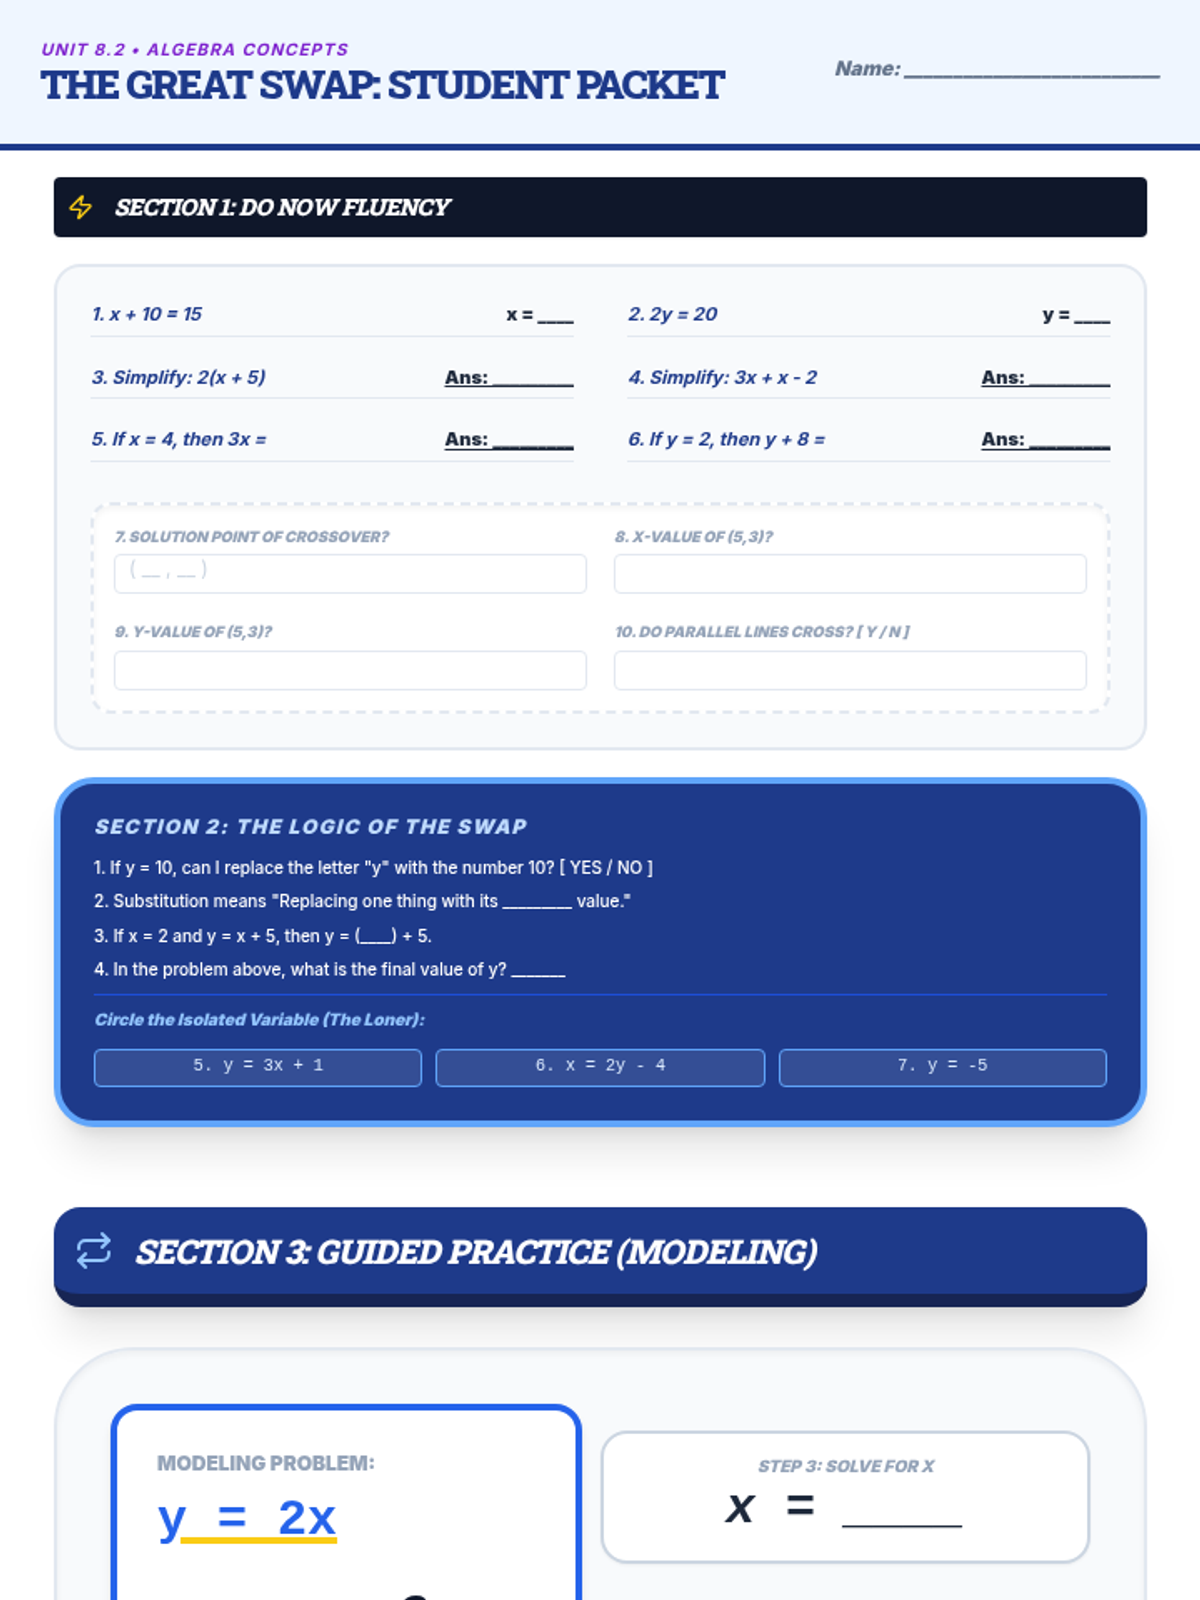
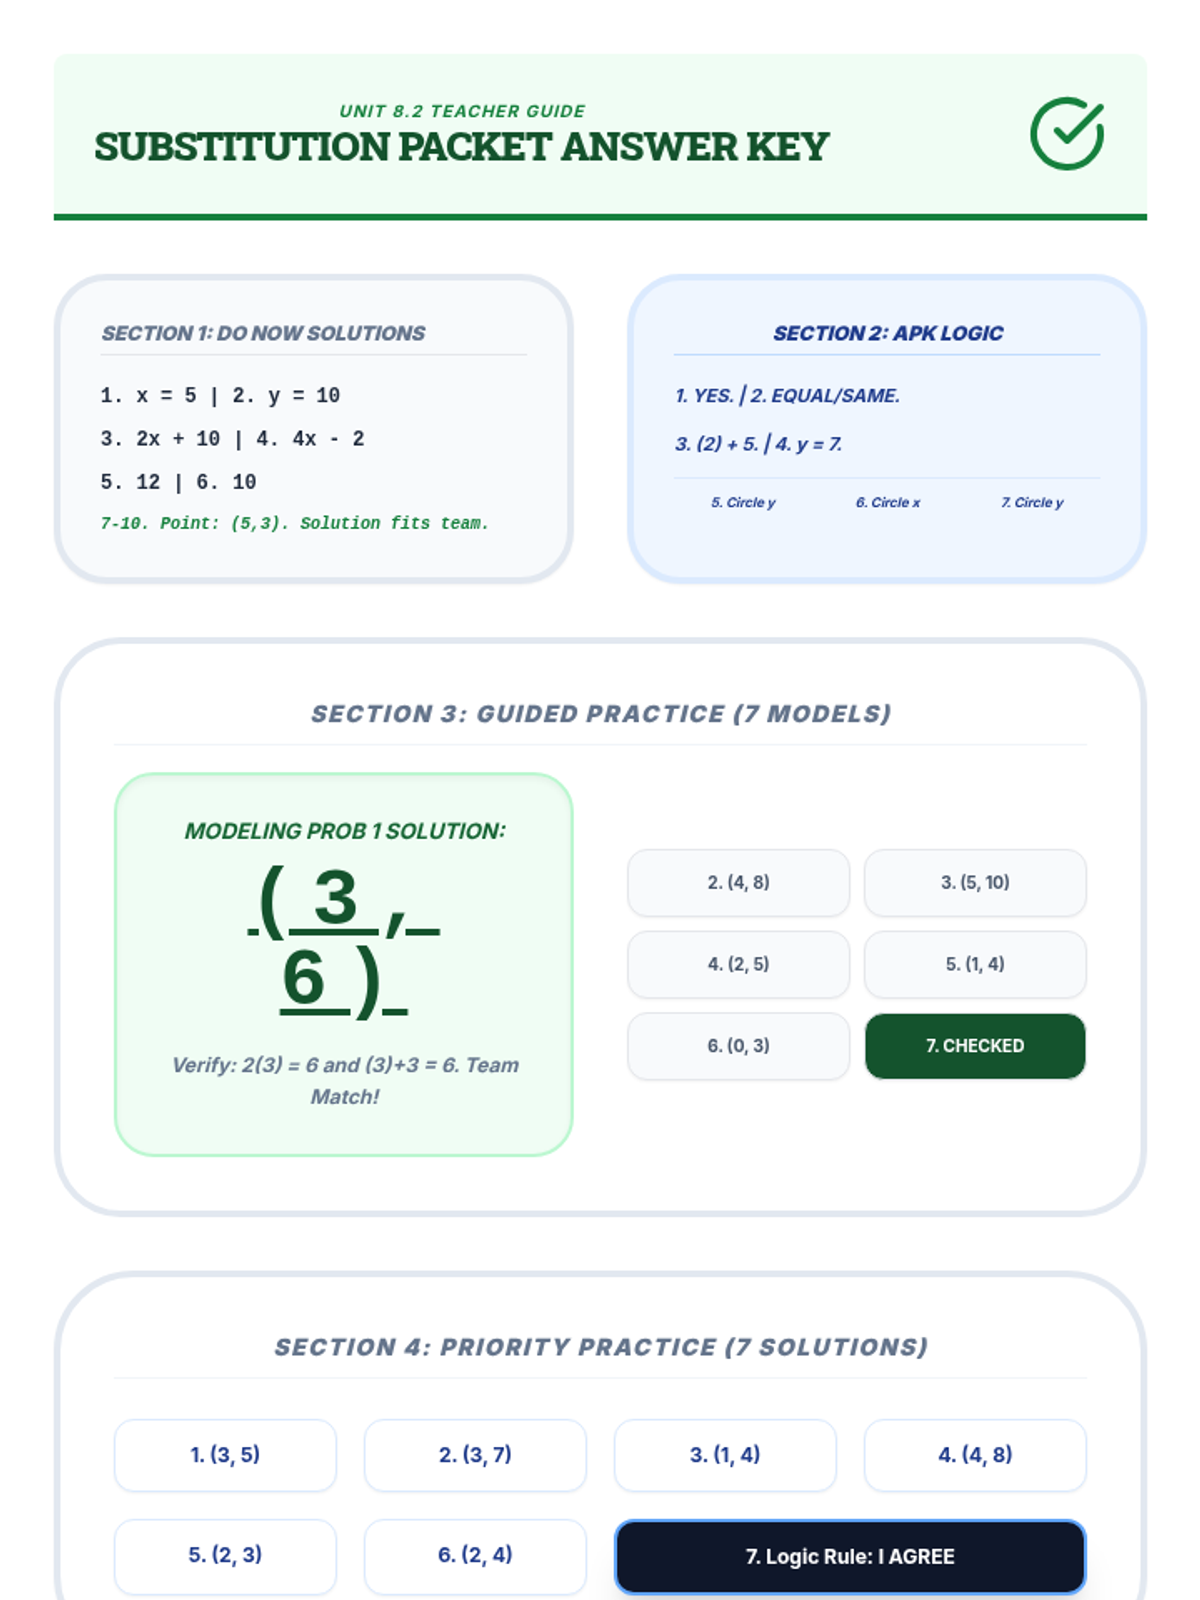
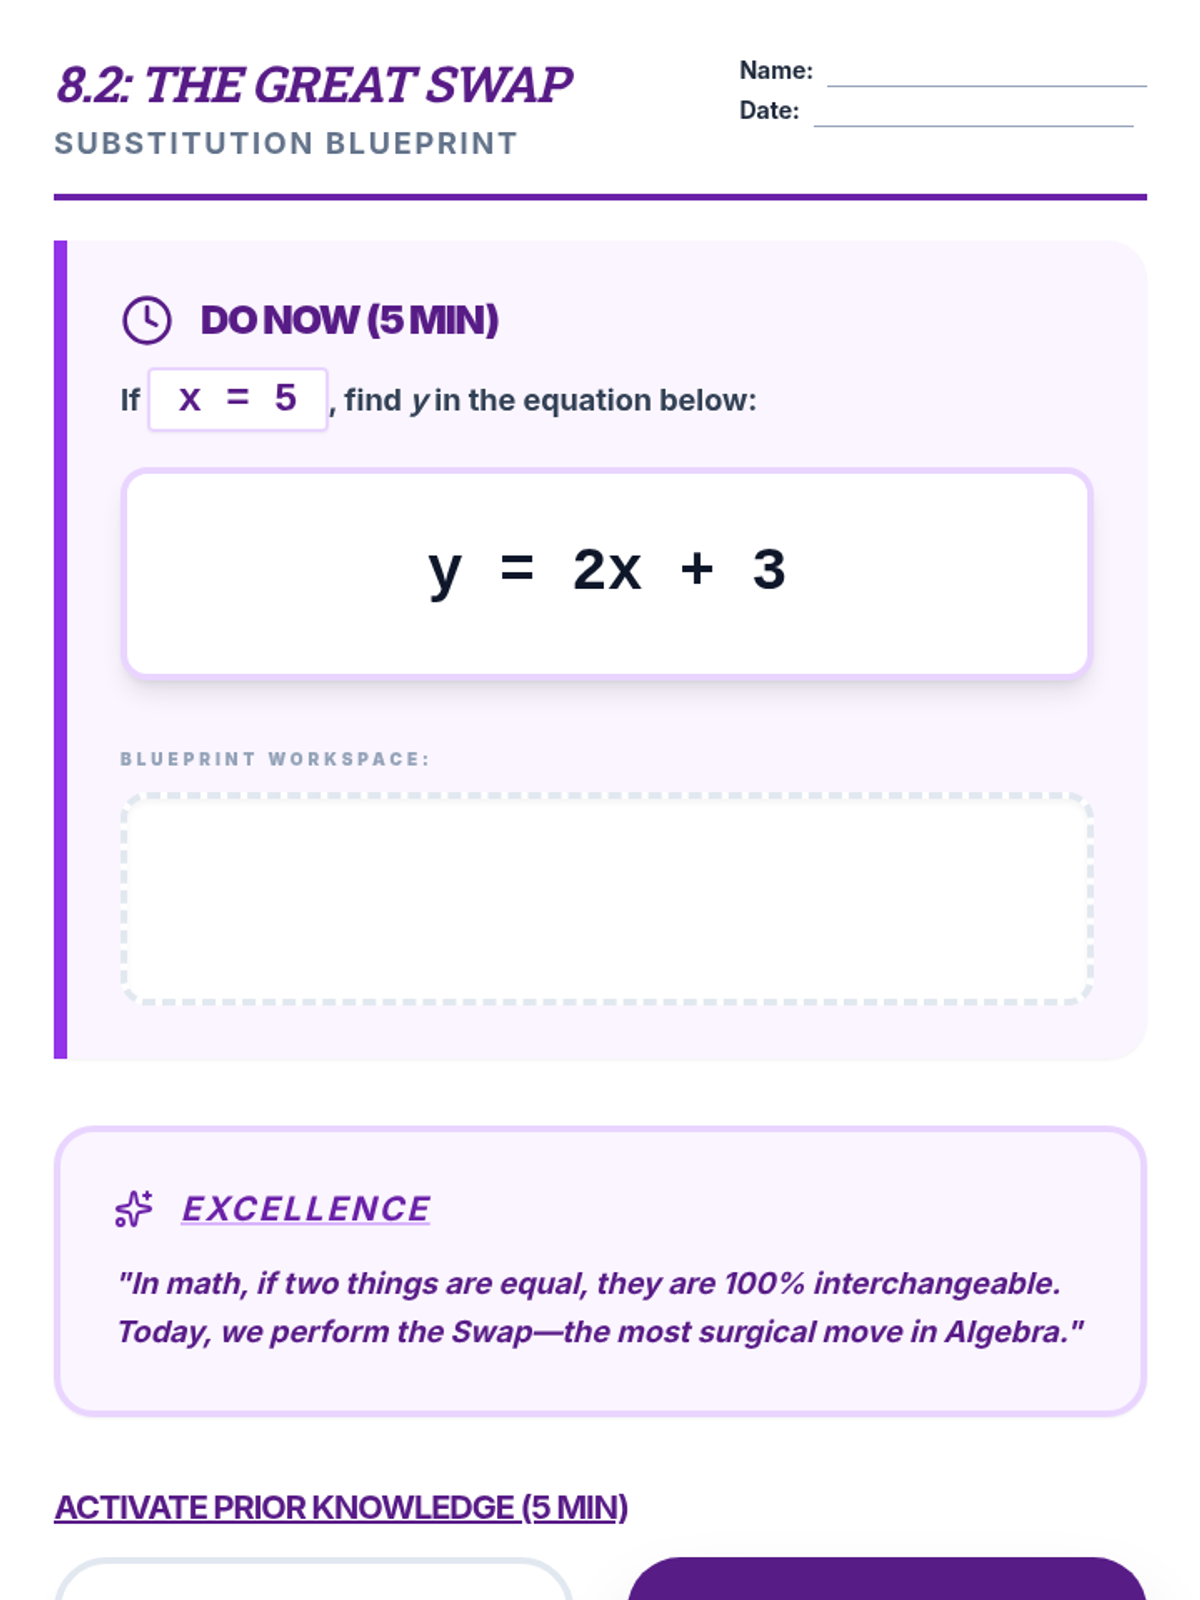
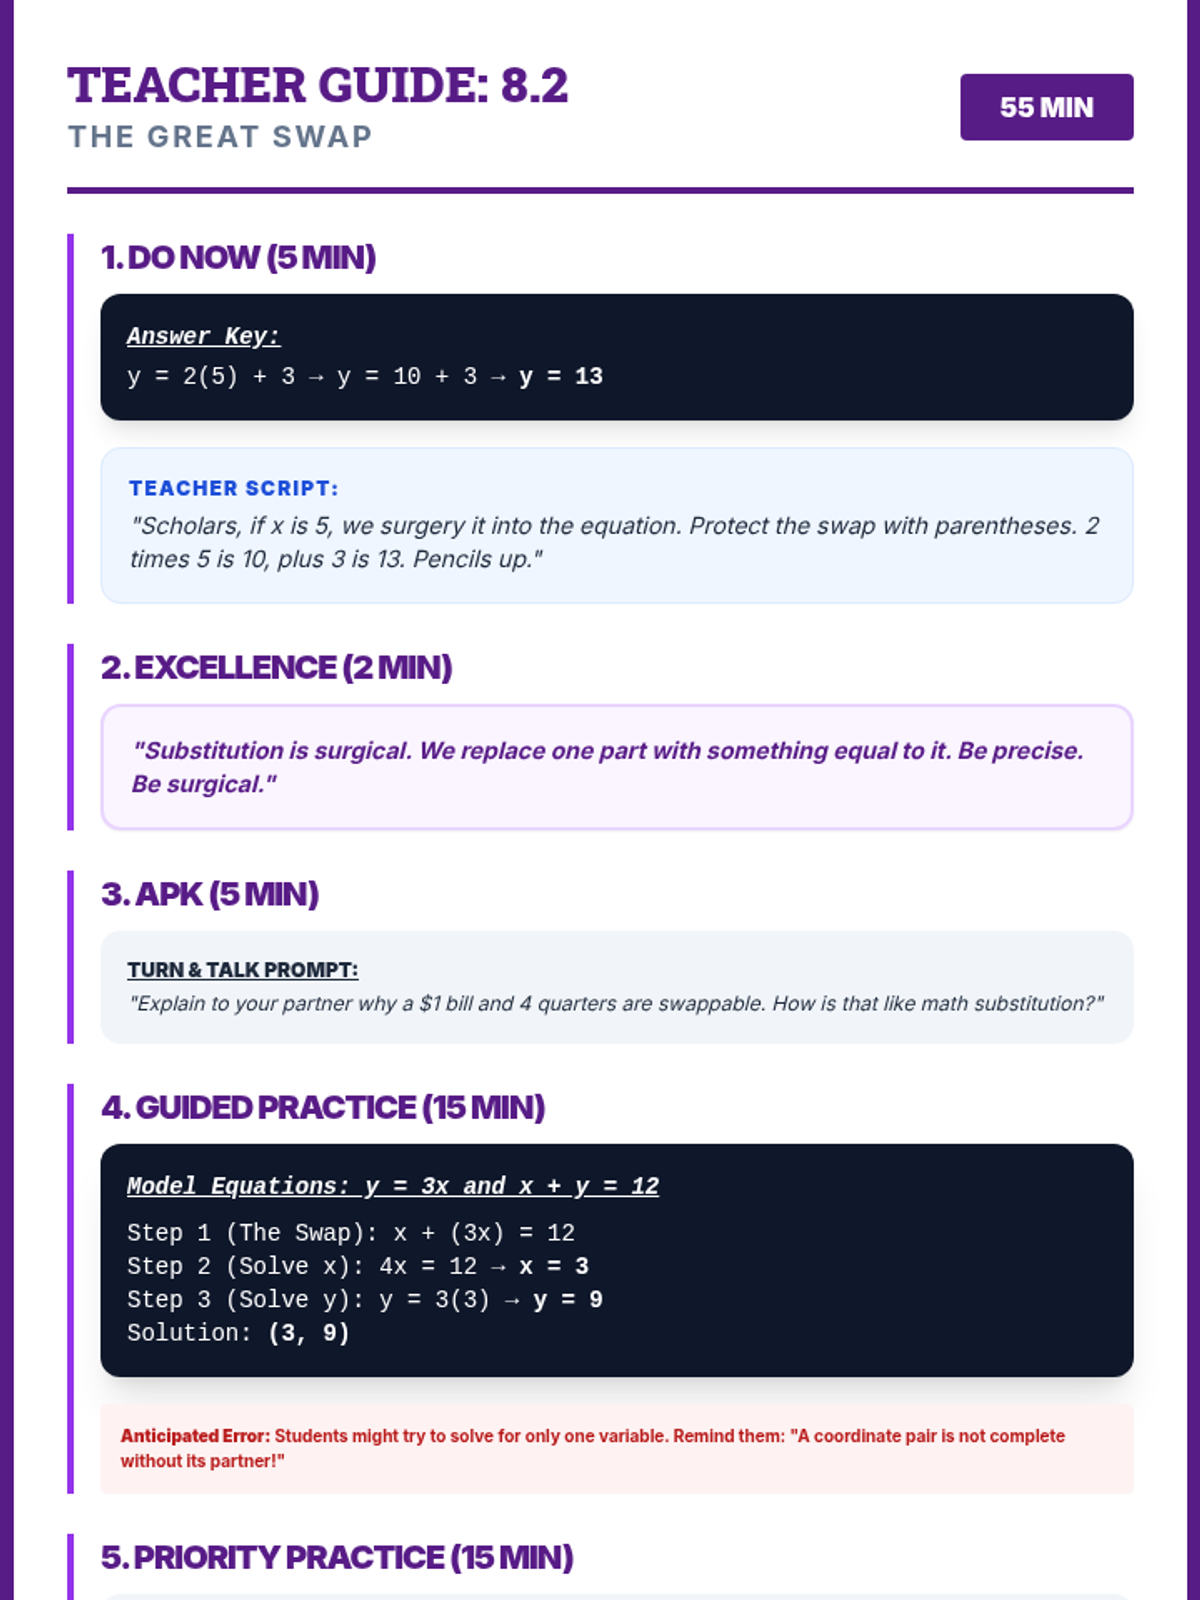
A 60-minute Algebra lesson for 9th-grade IEP students focused on solving systems of linear equations using the substitution method. Features 'The Swap Shop' metaphor, step-by-step visual organizers, and explicit teacher scripts to support instructional delivery.
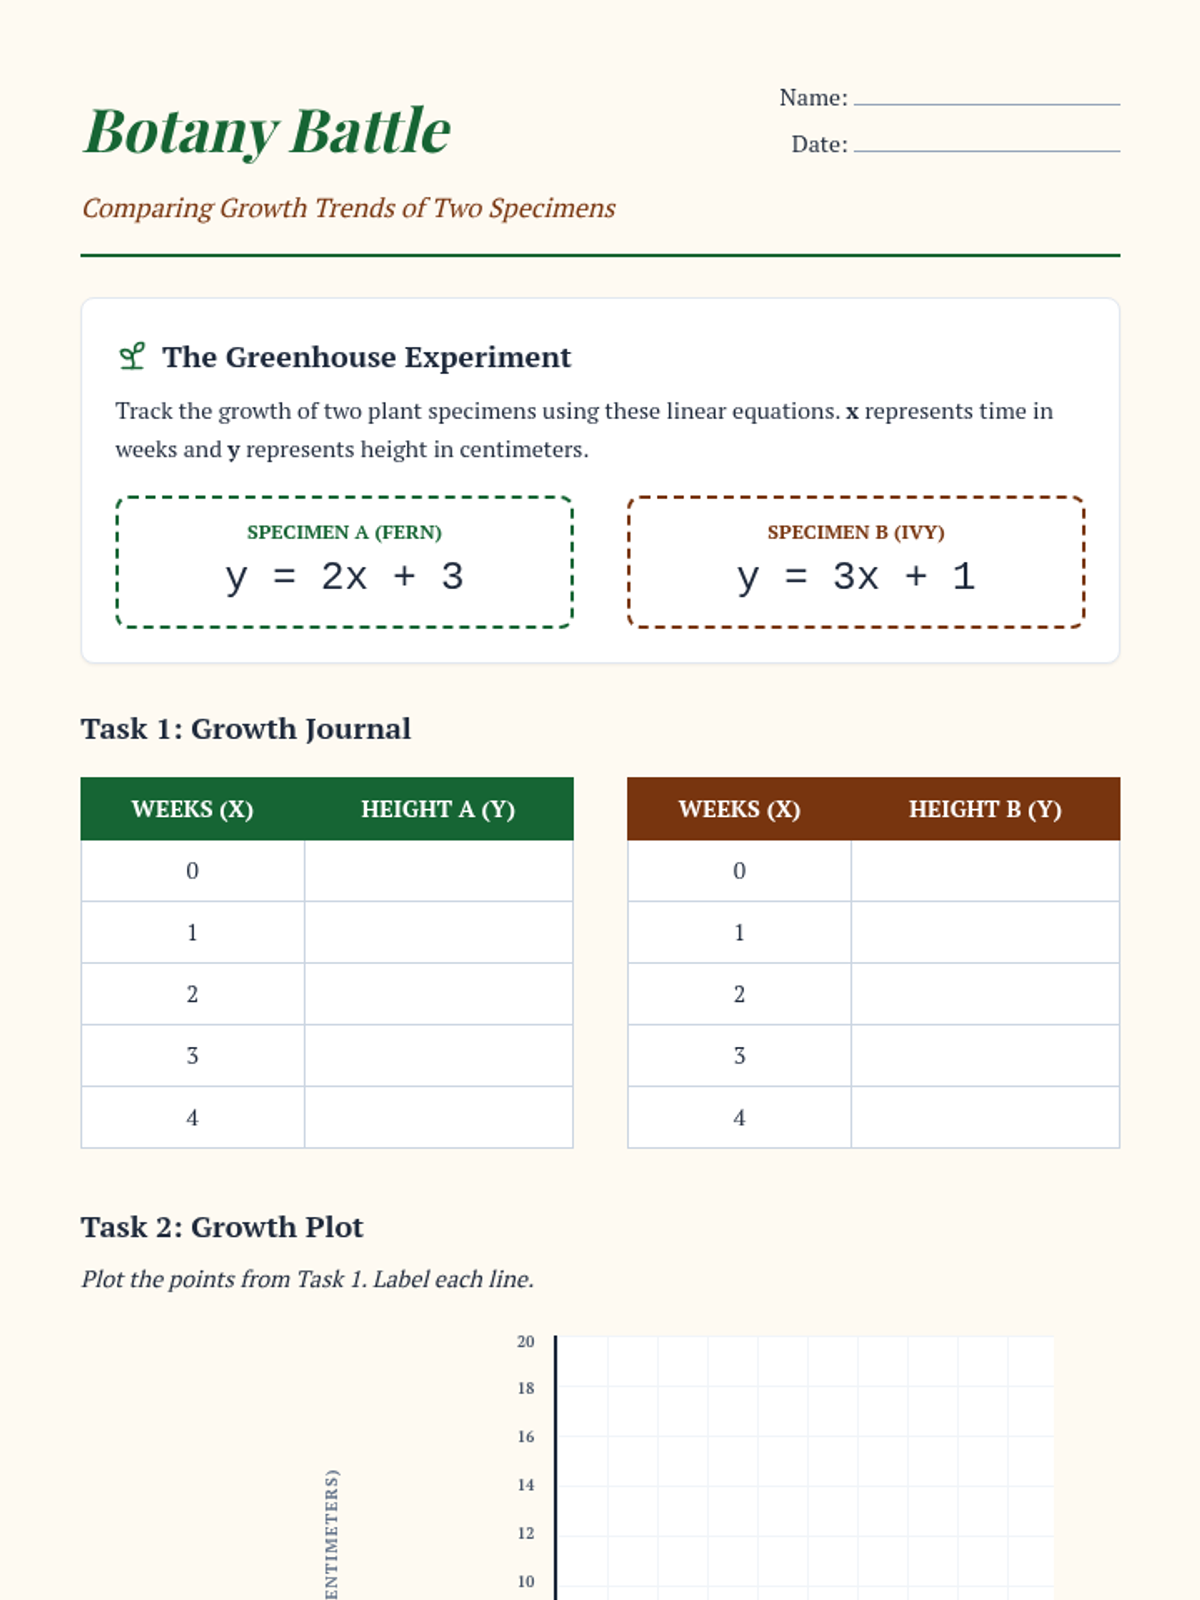
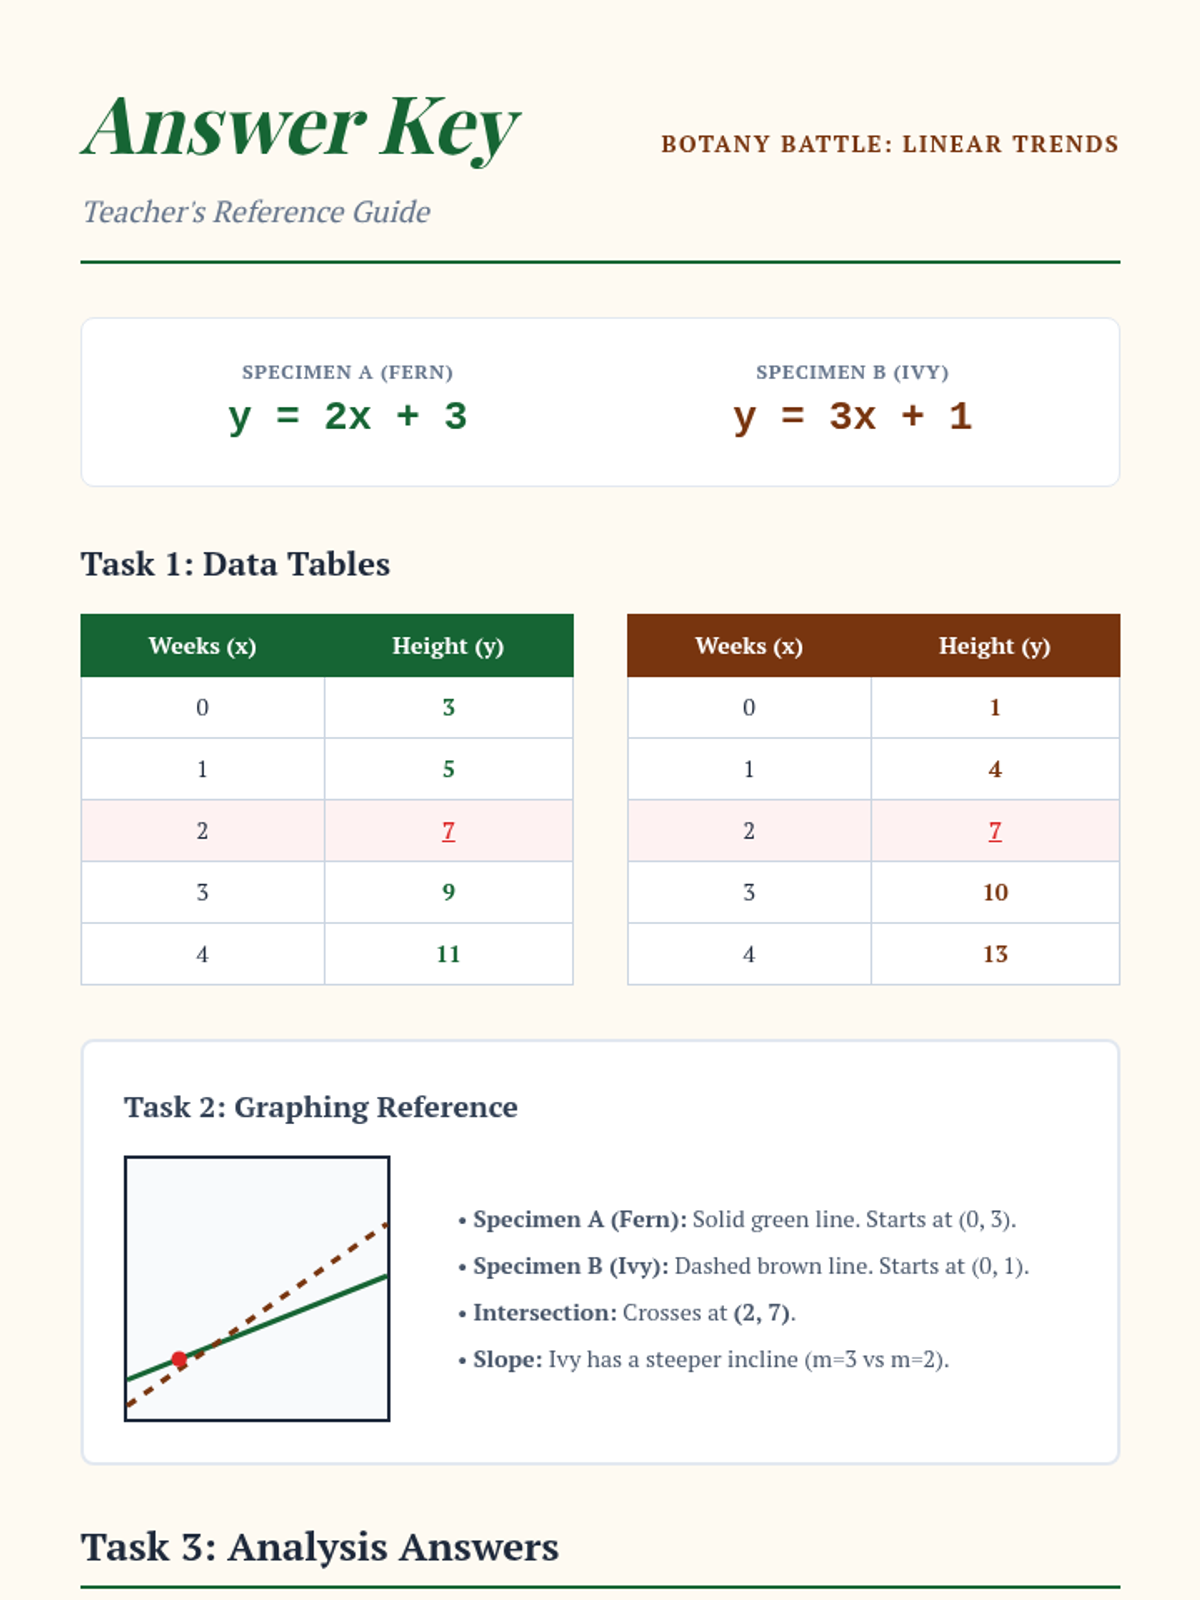
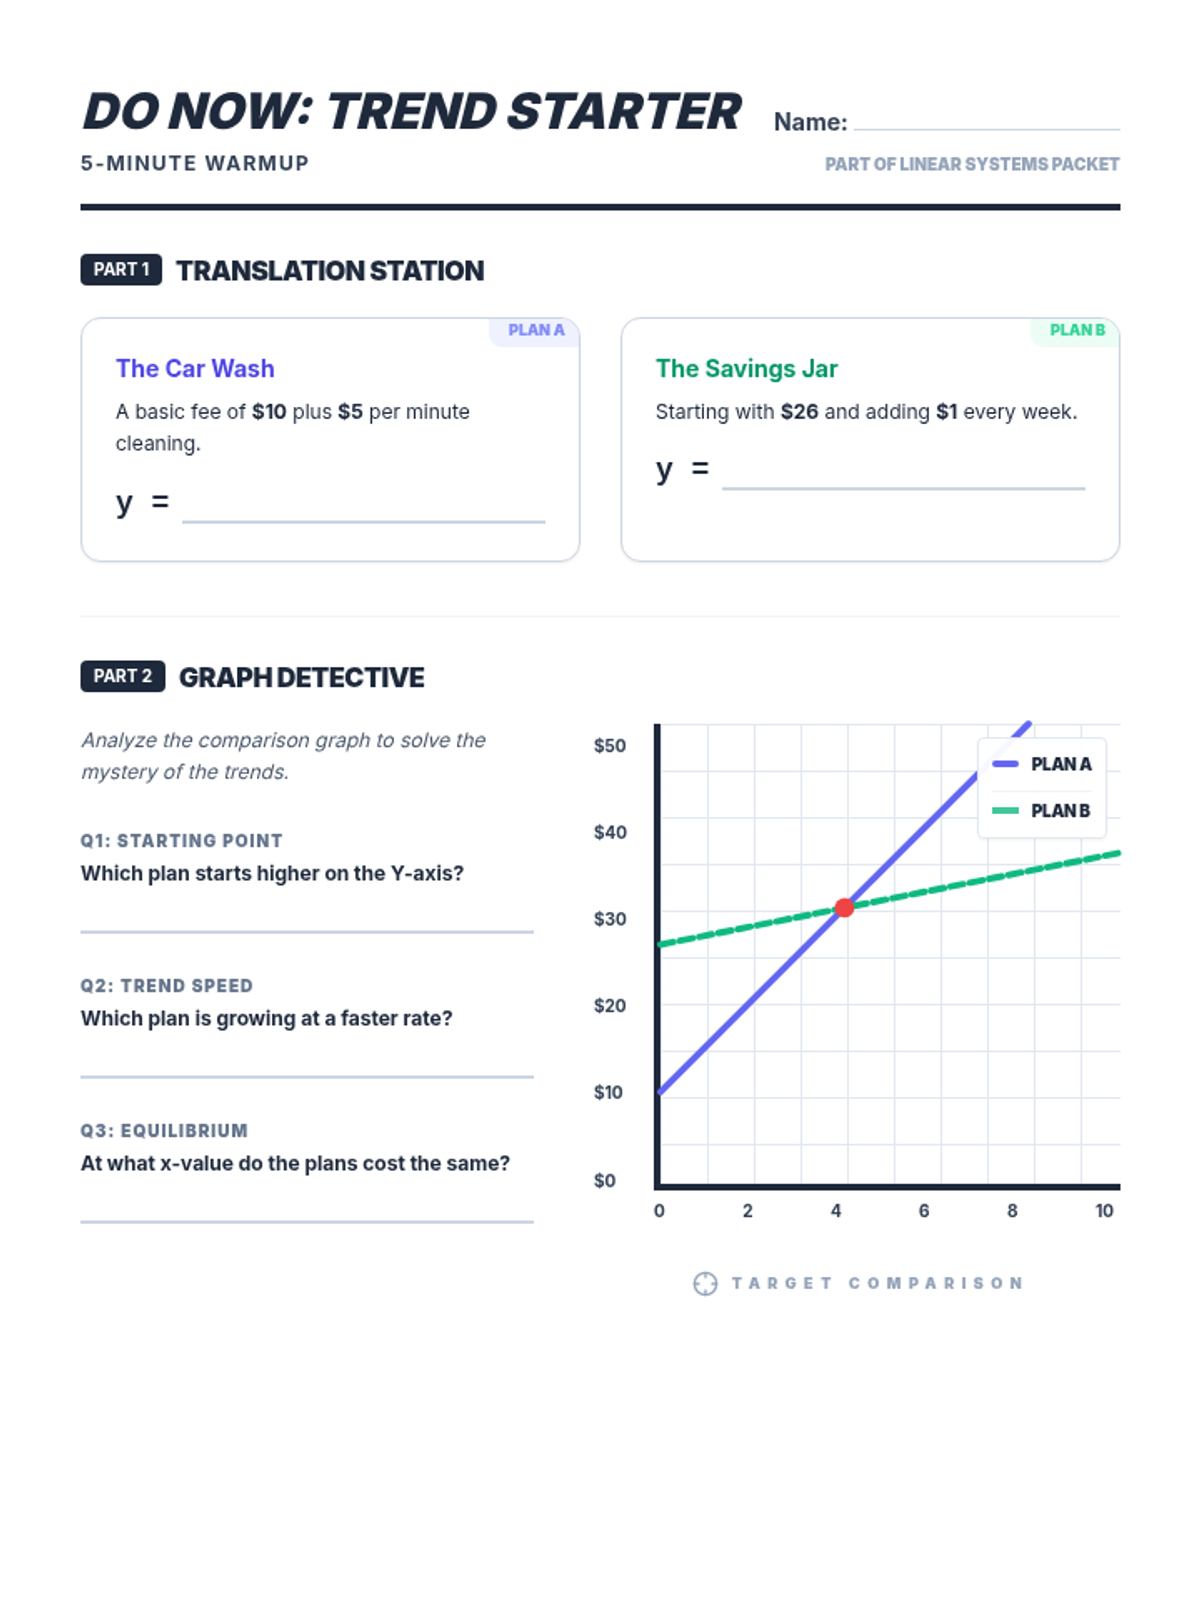
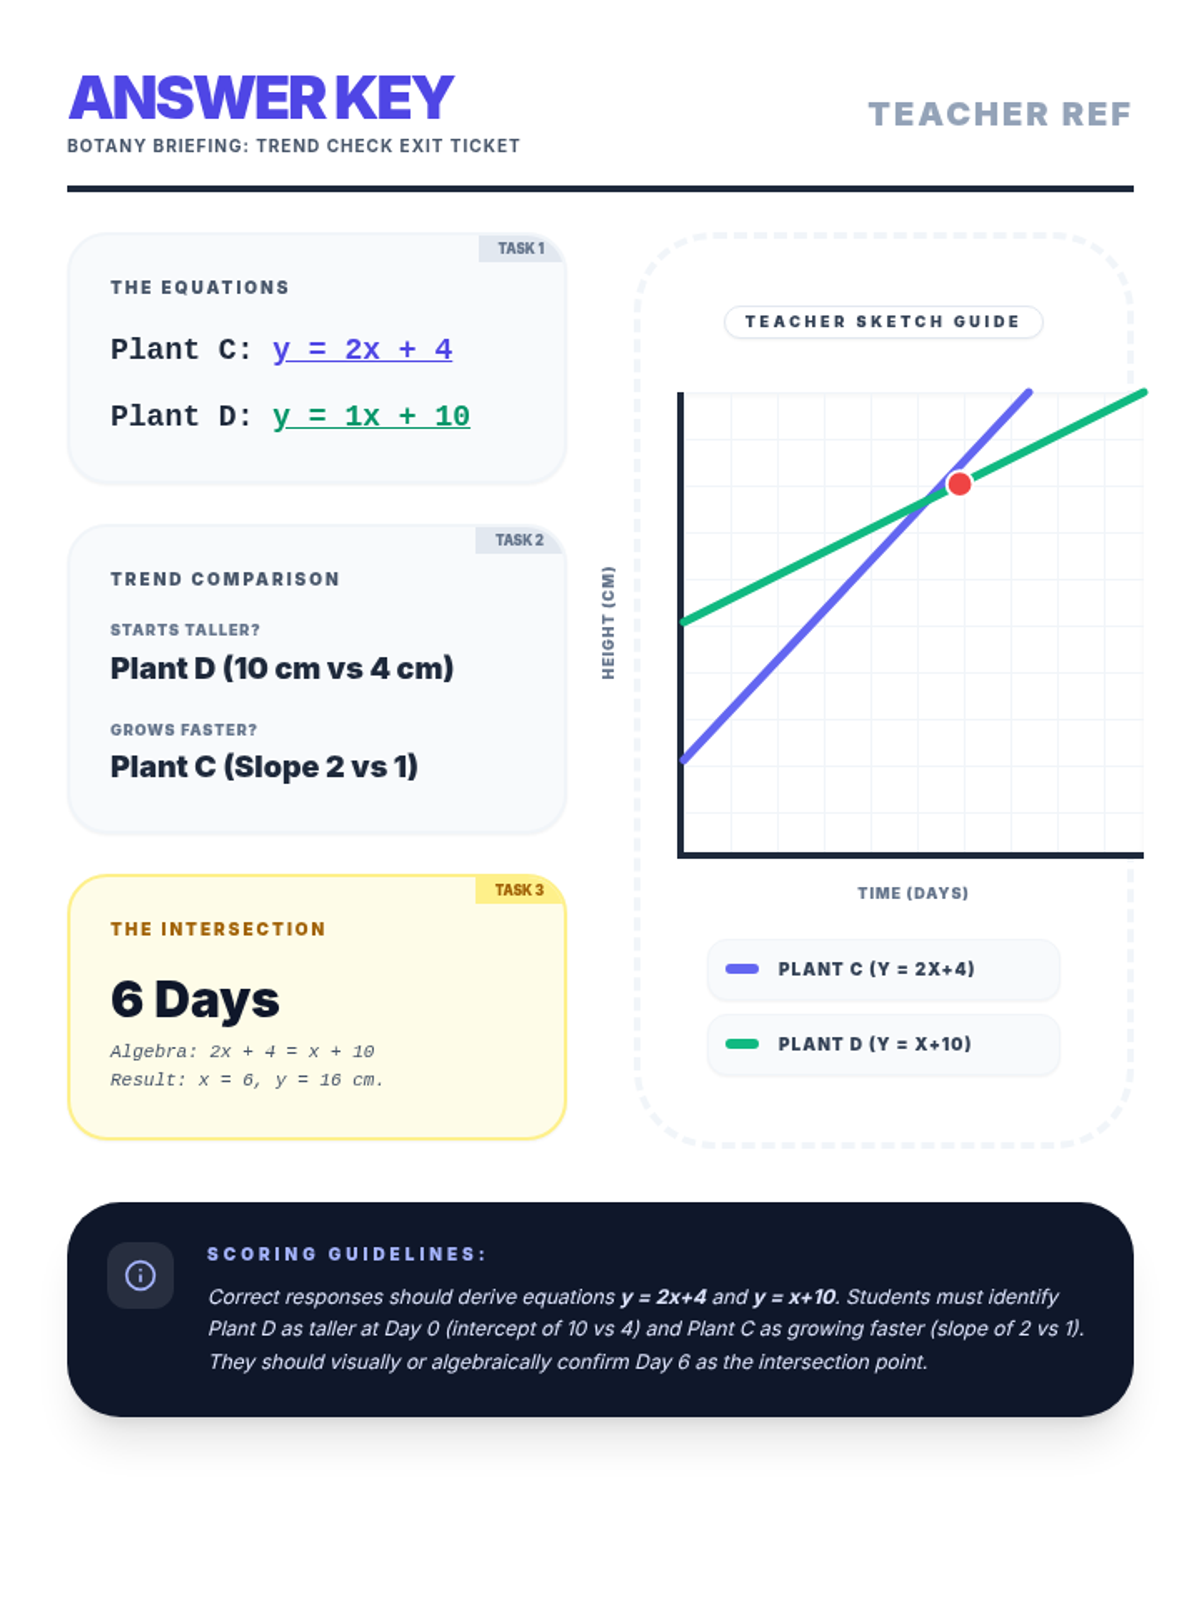
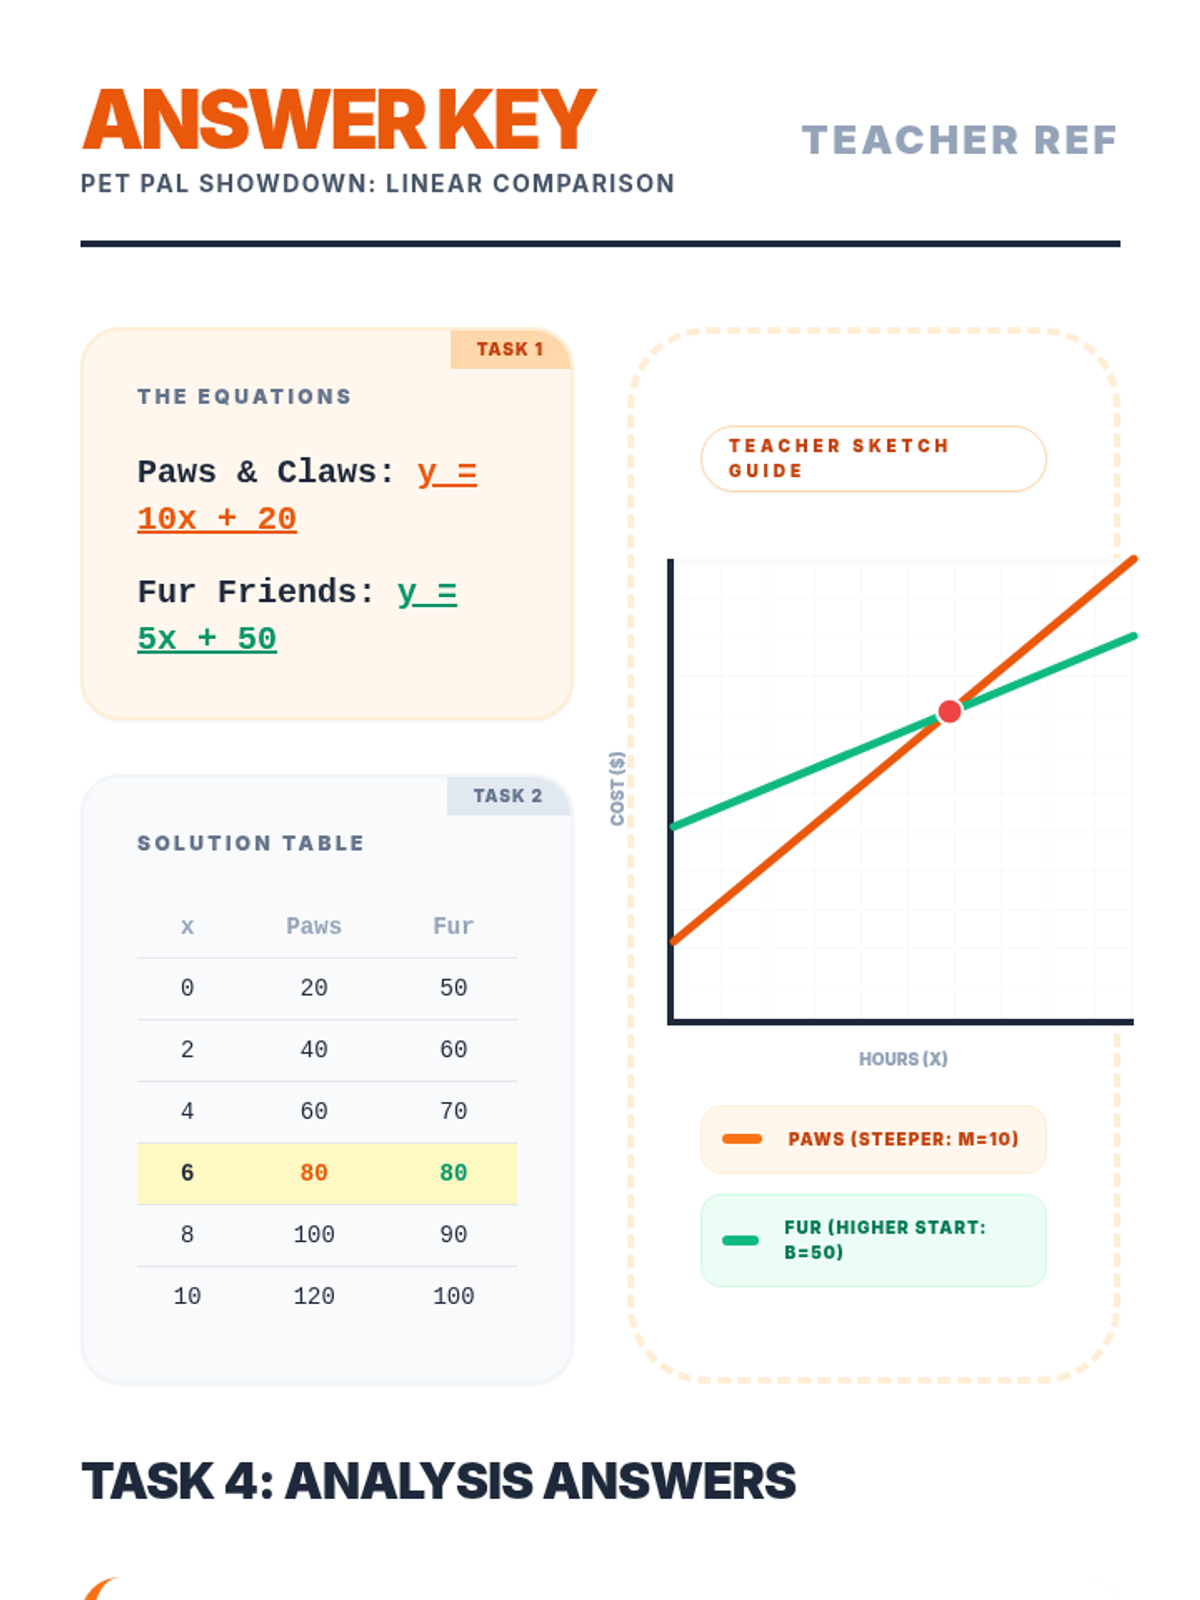
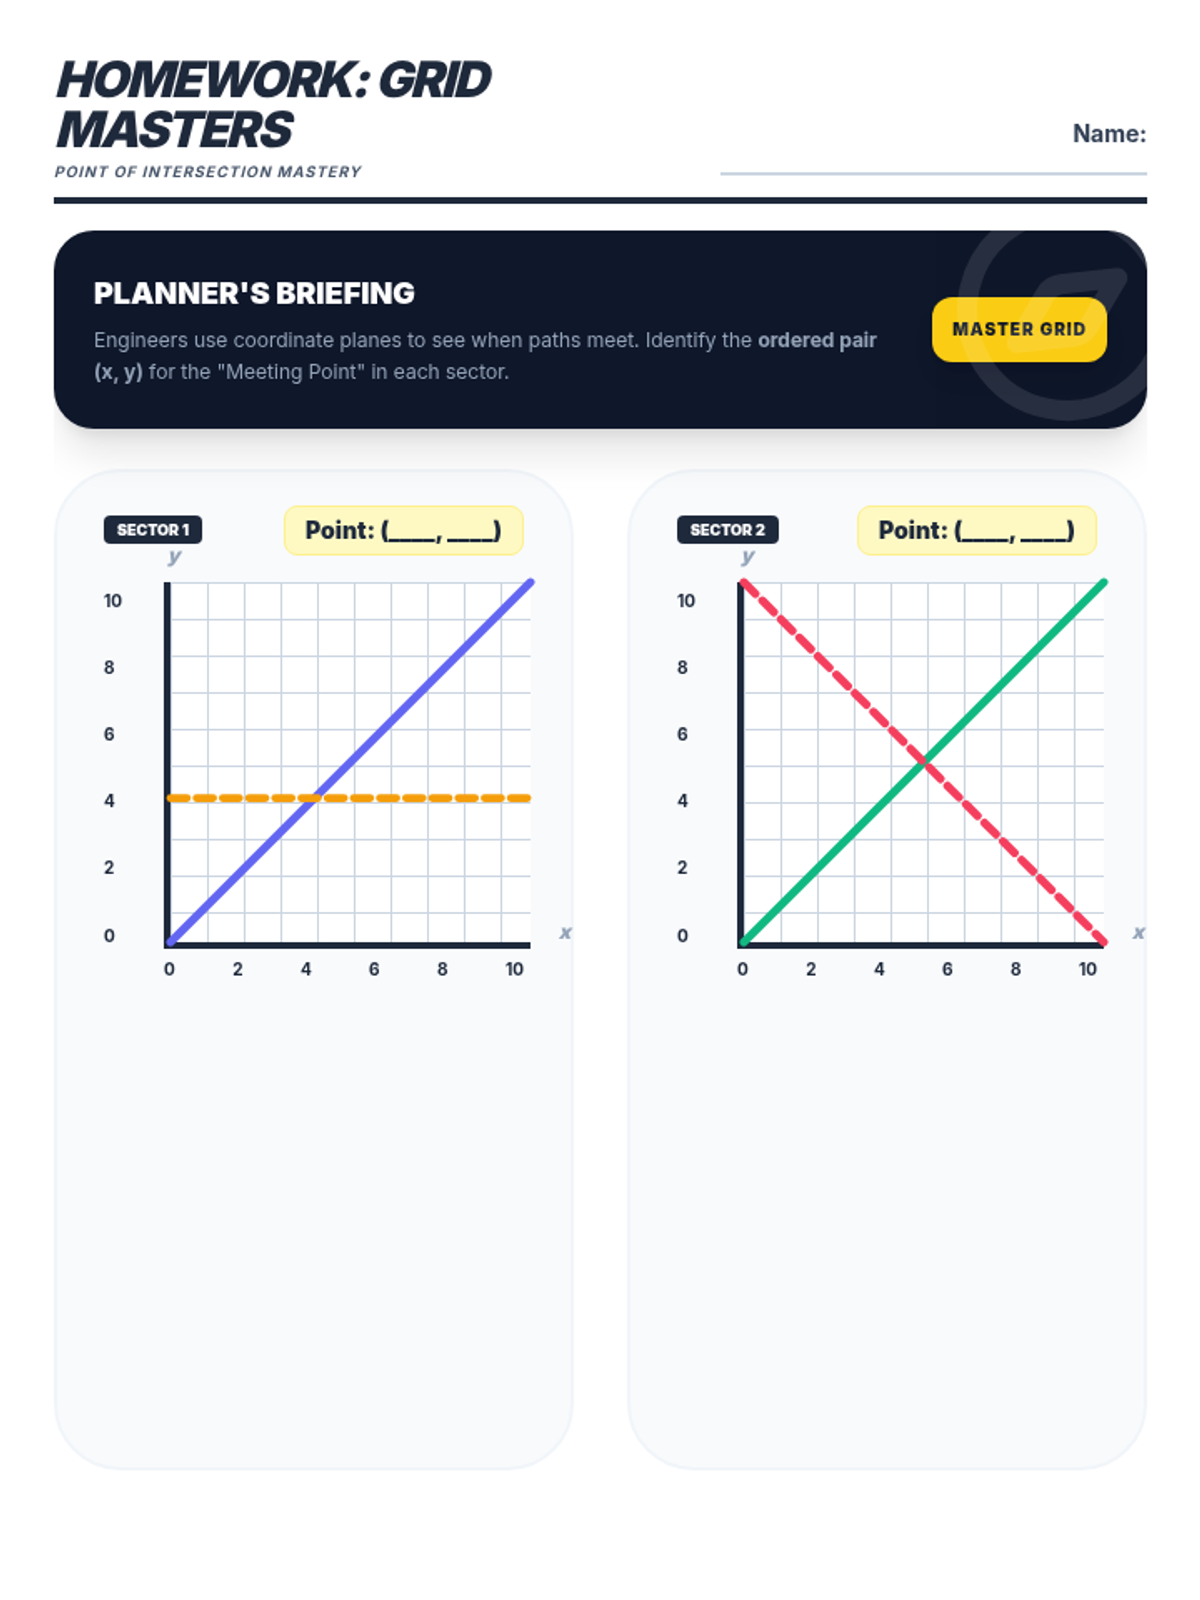
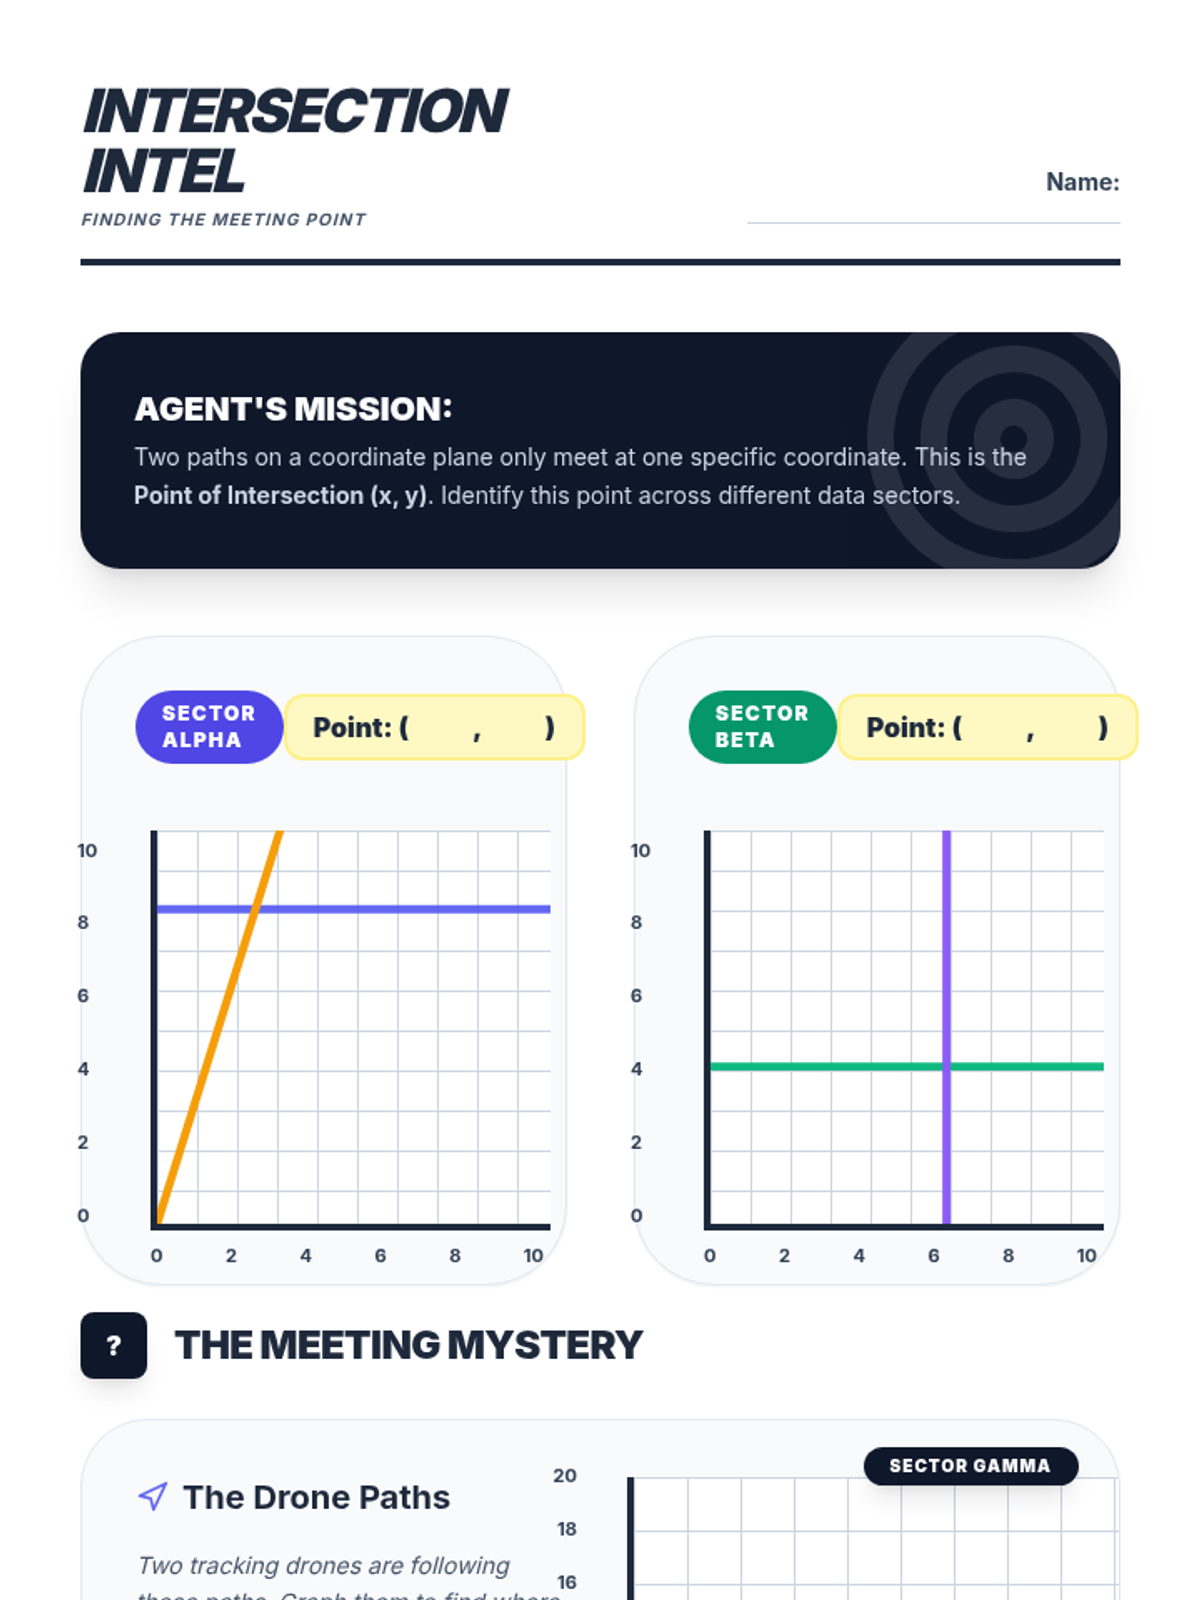
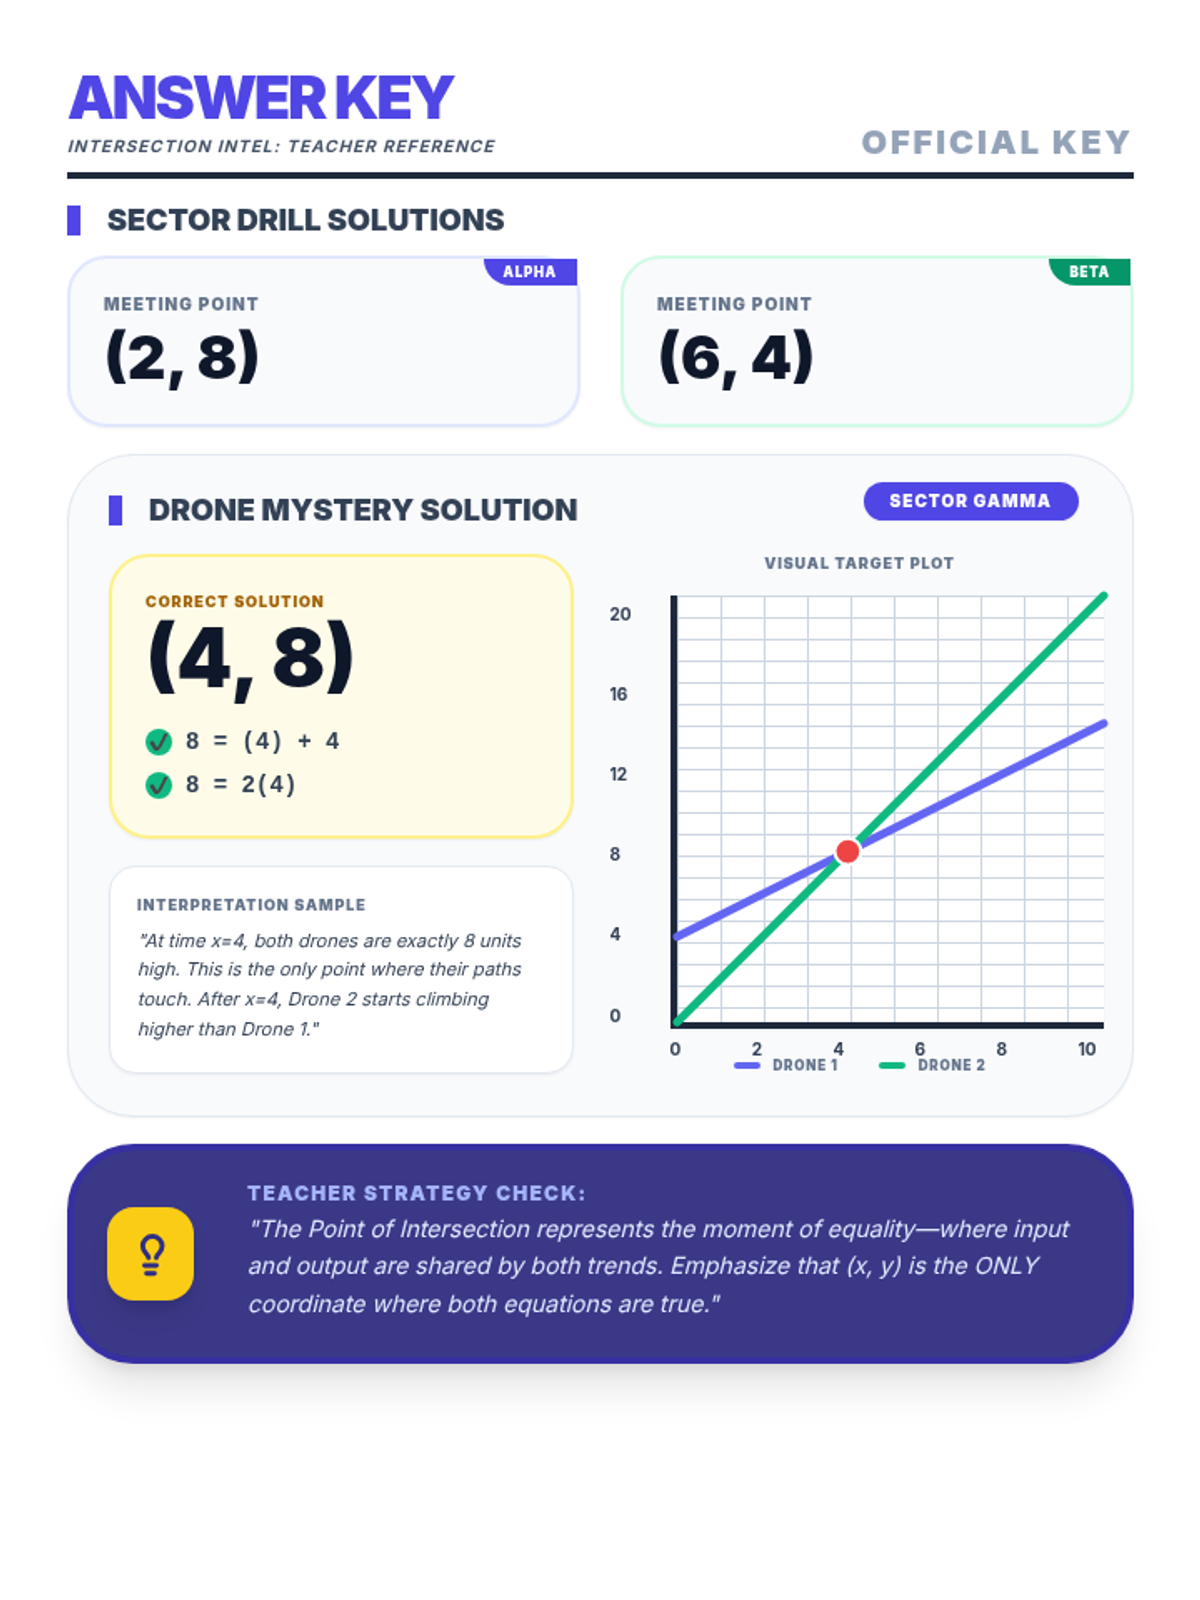
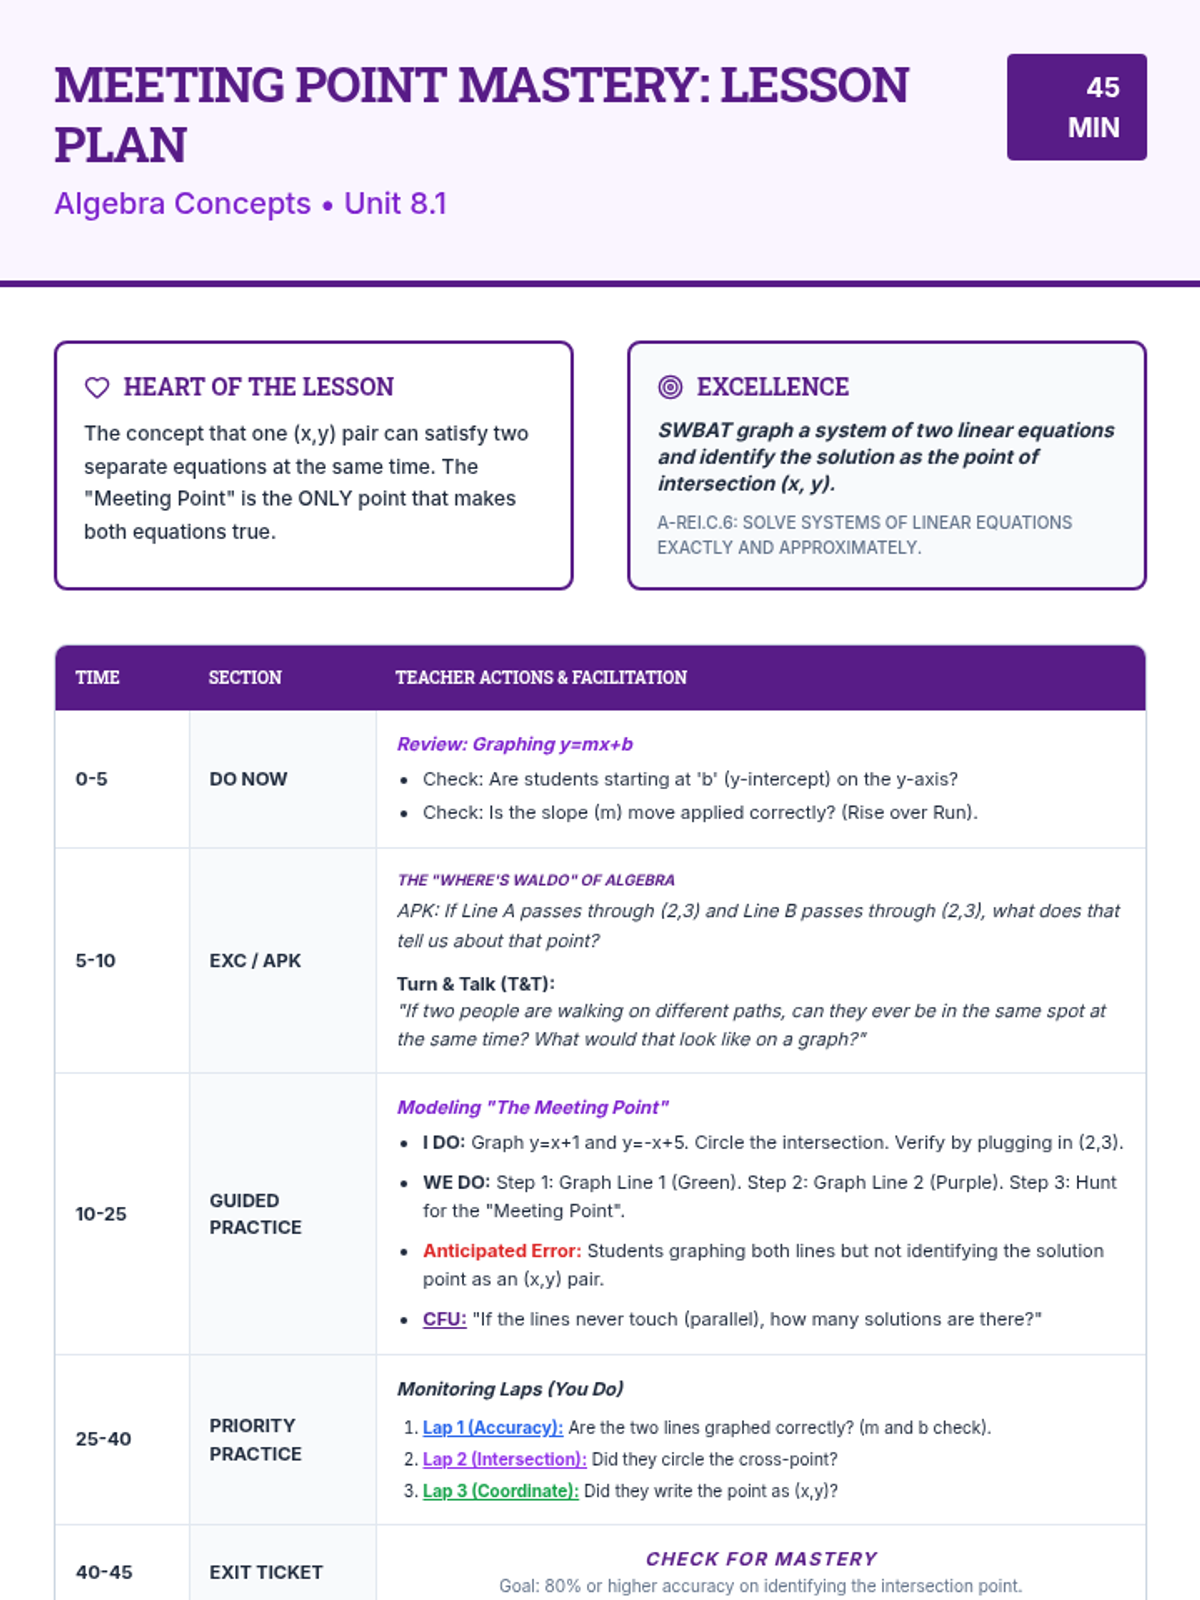
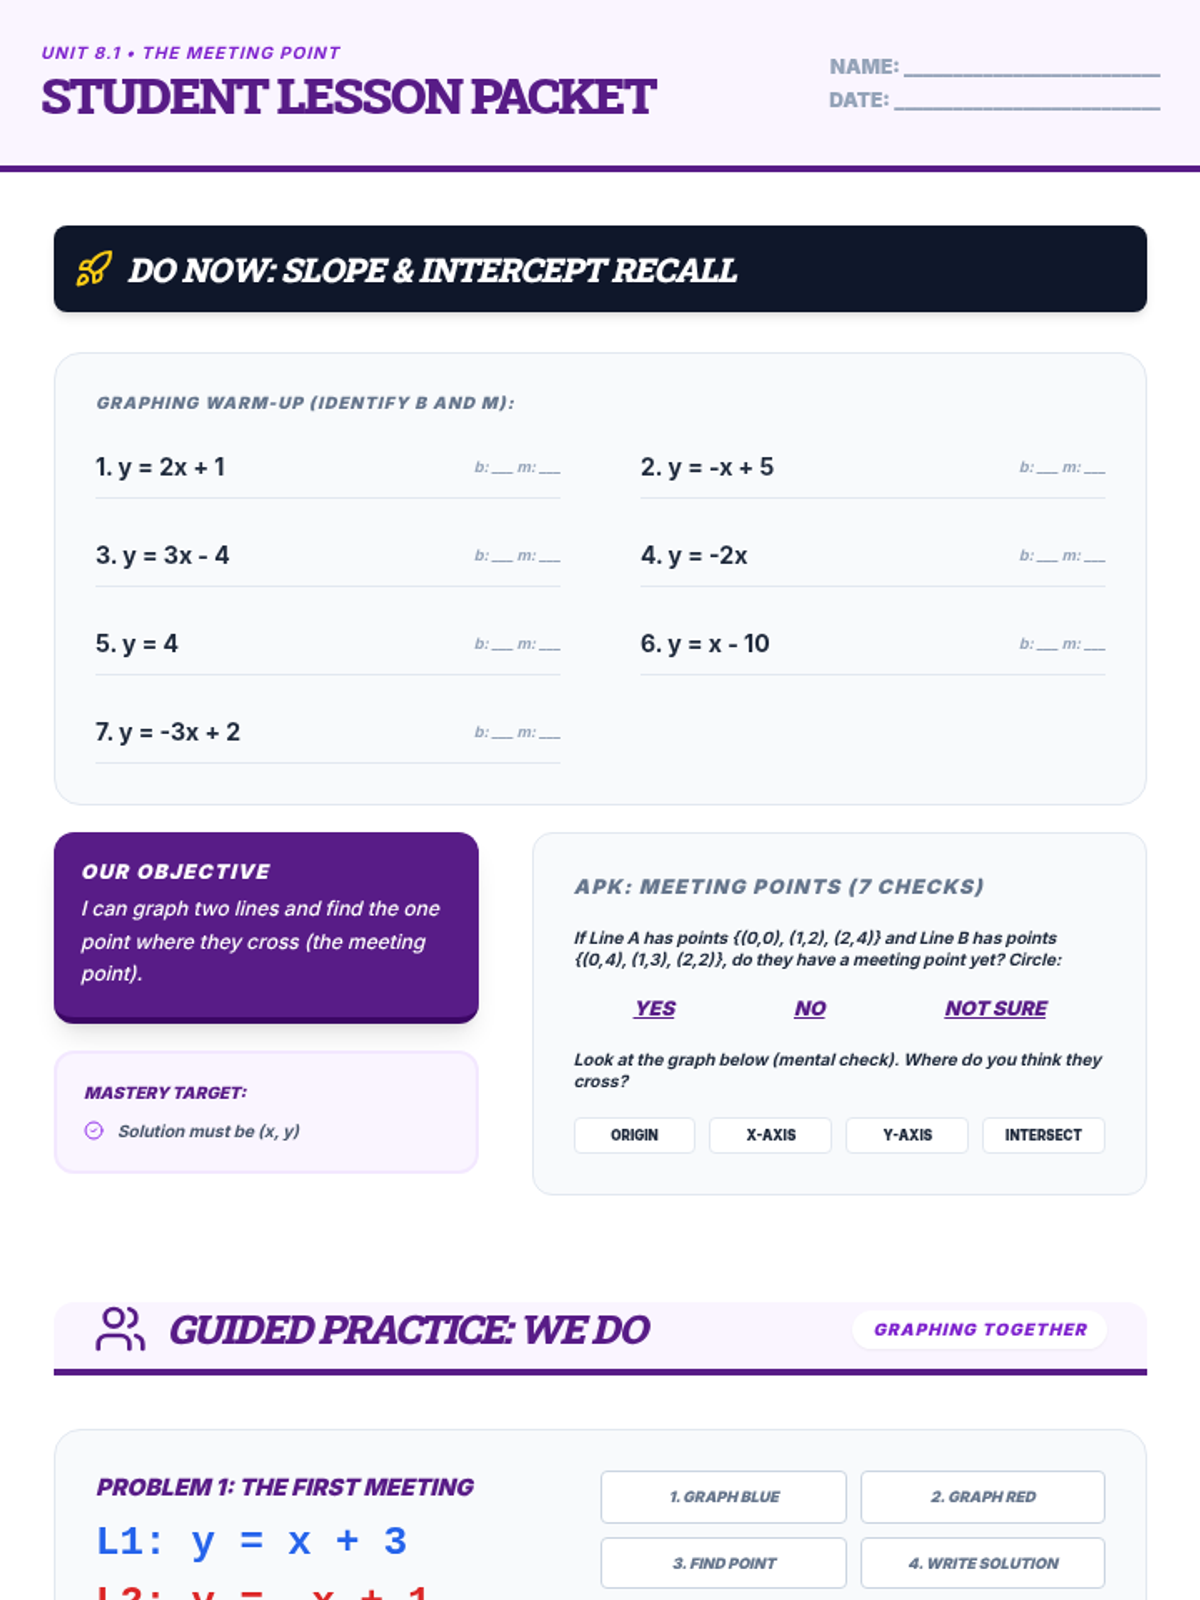
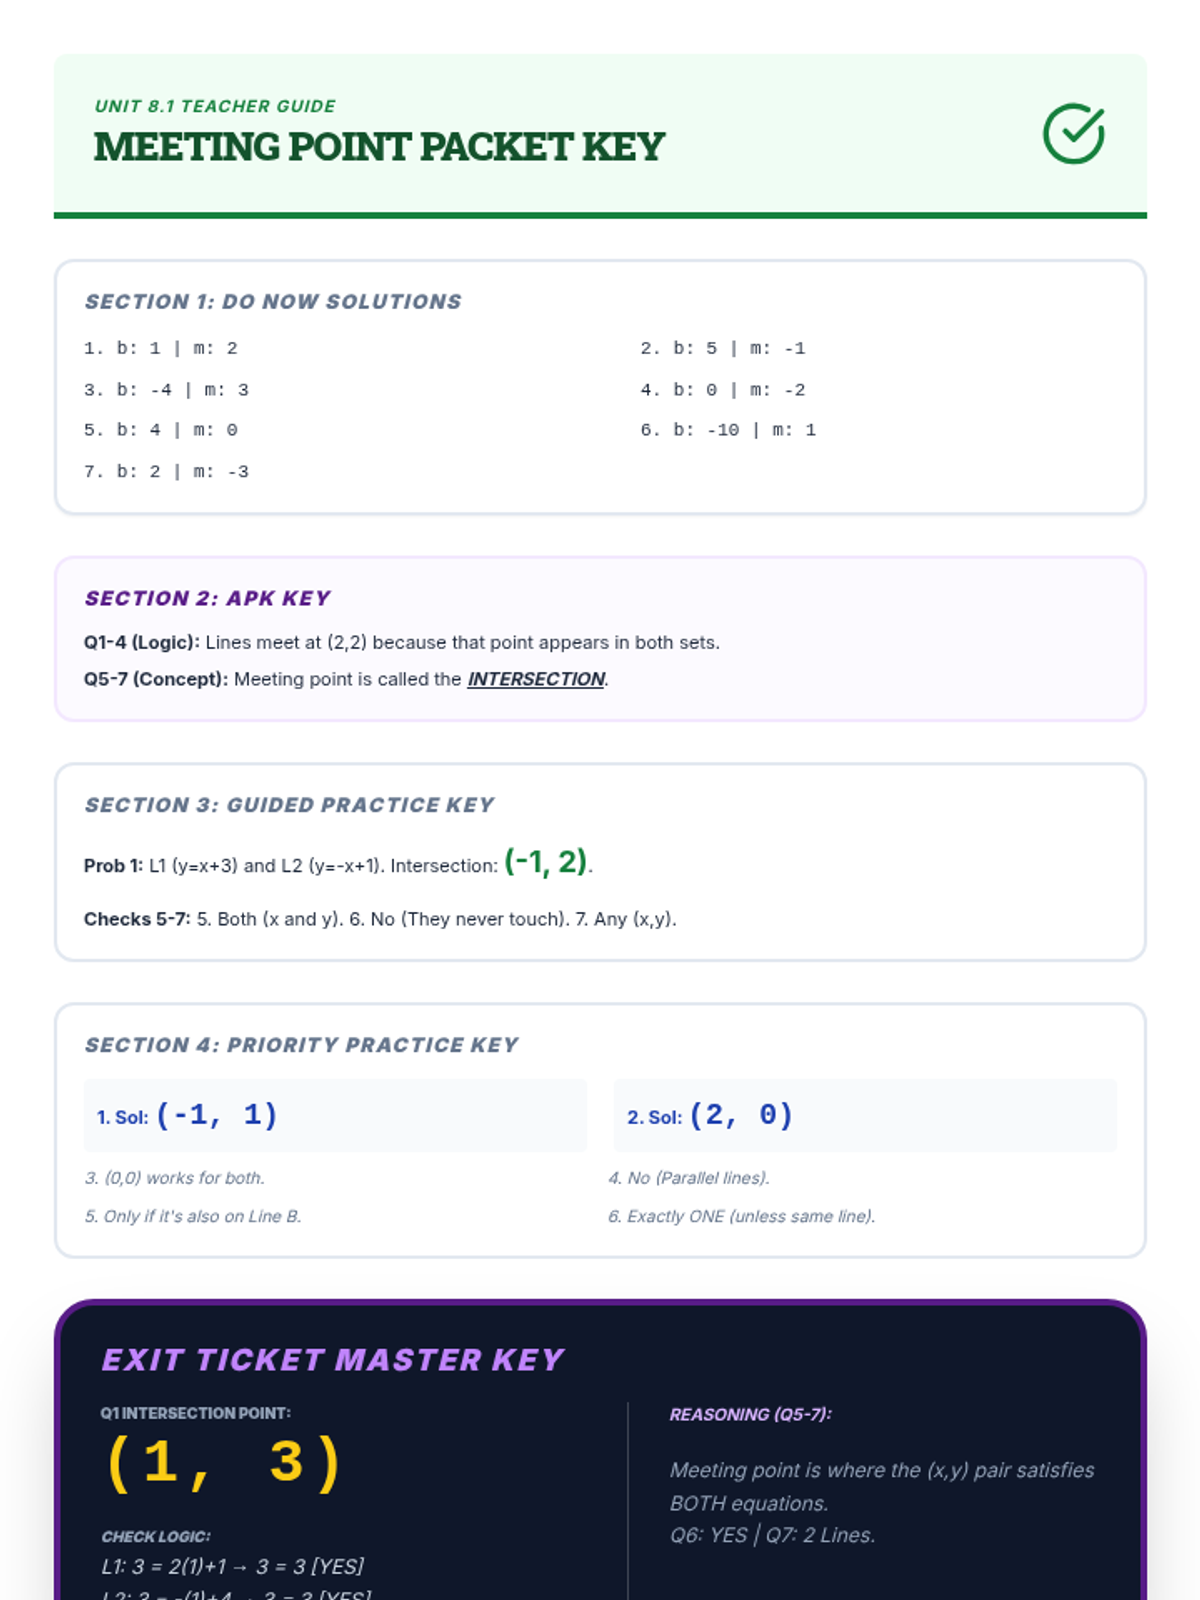
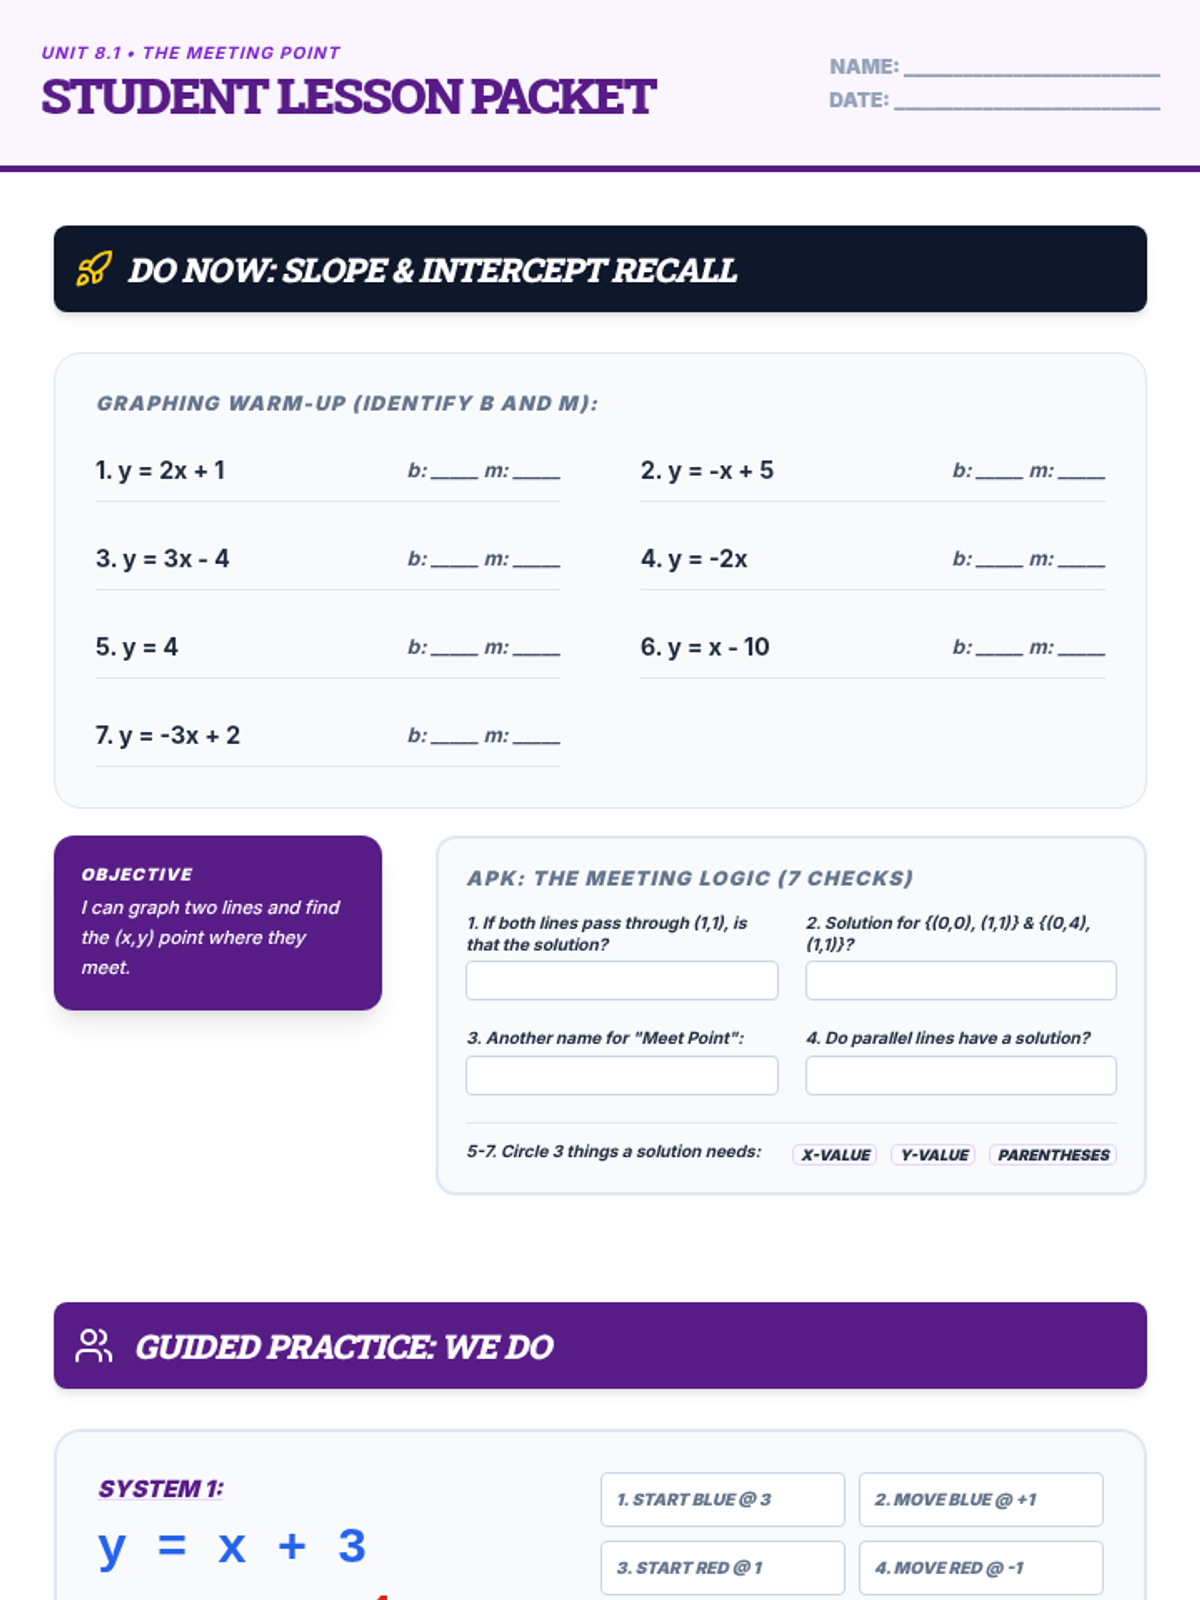
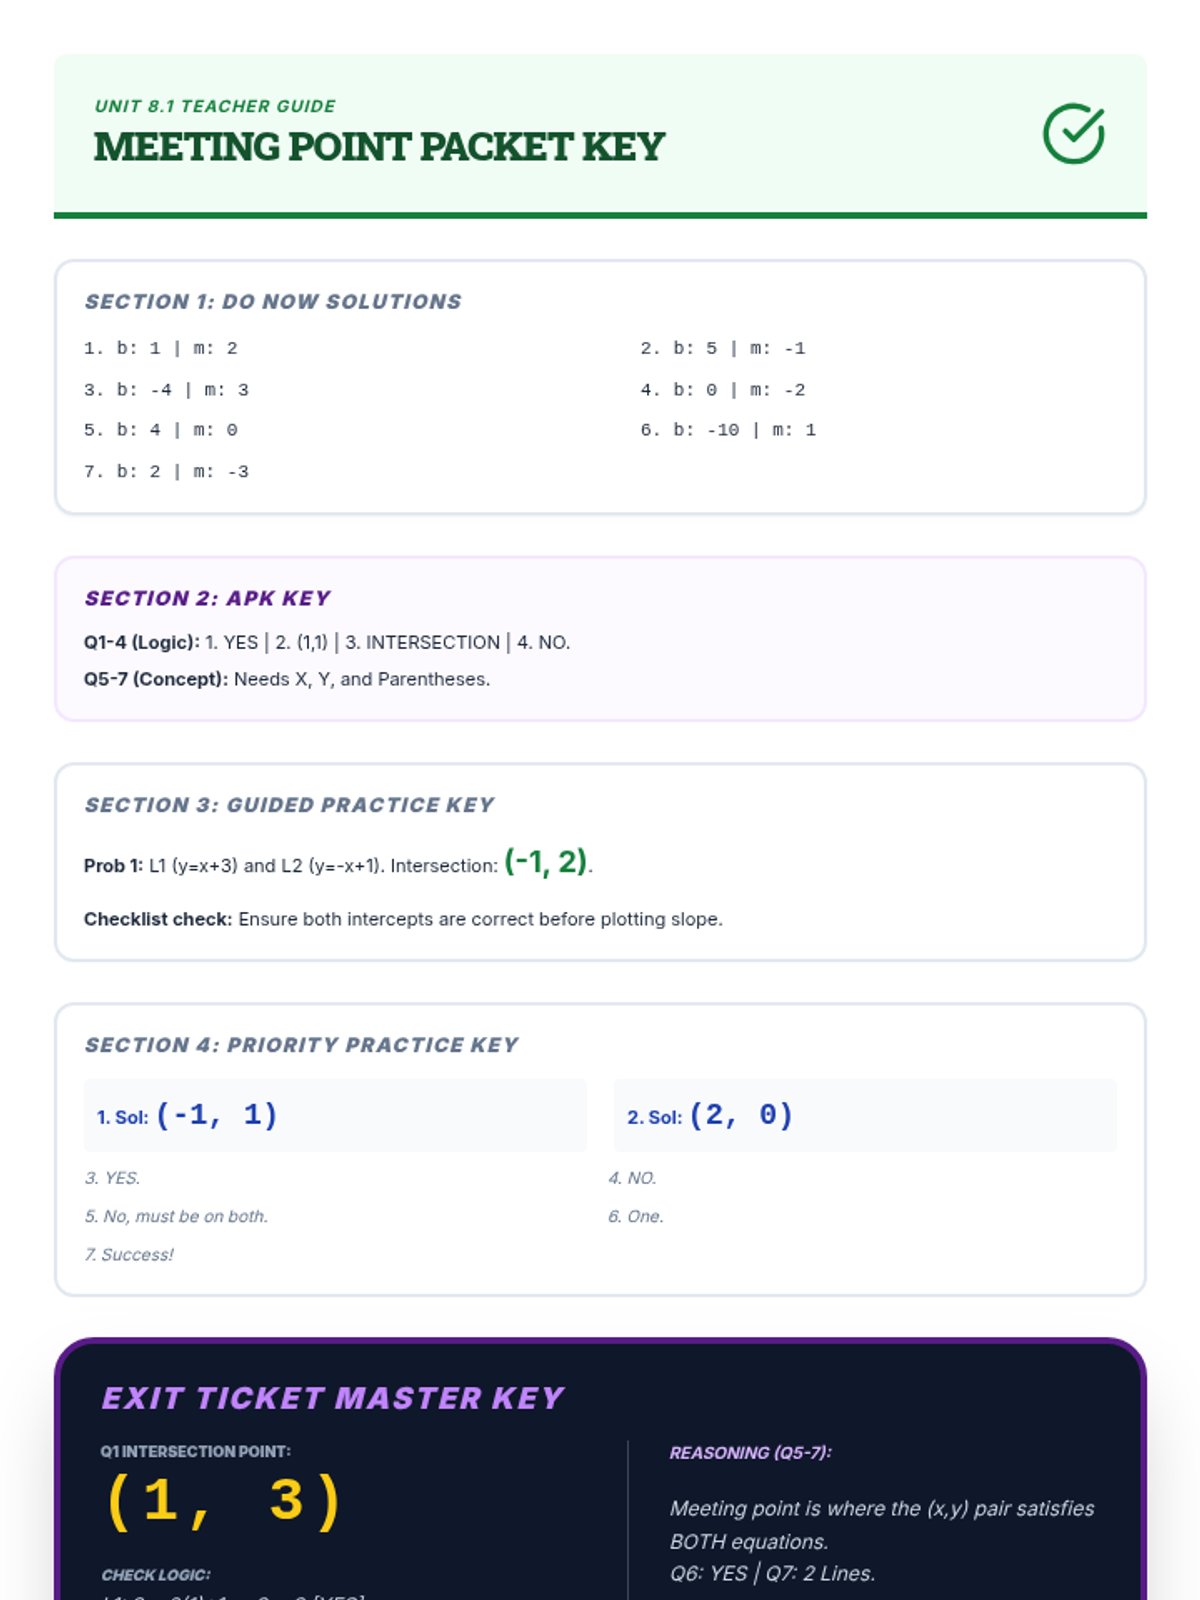
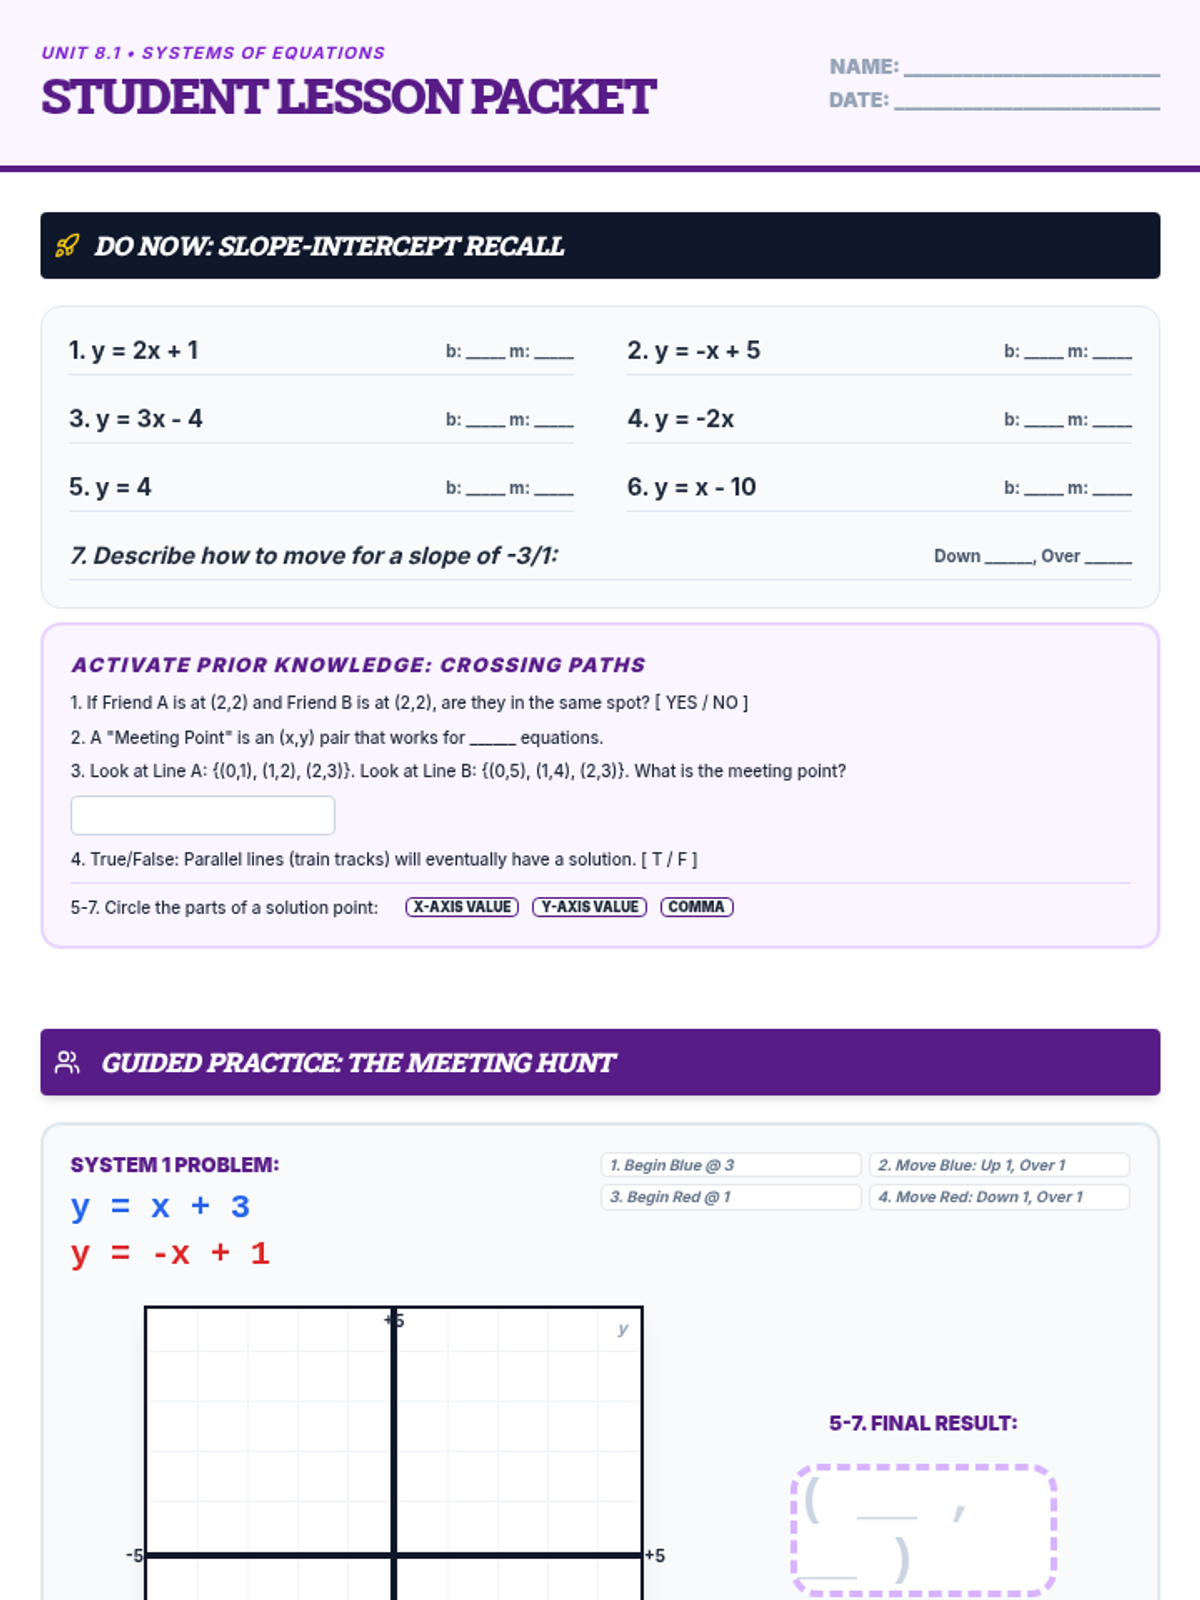
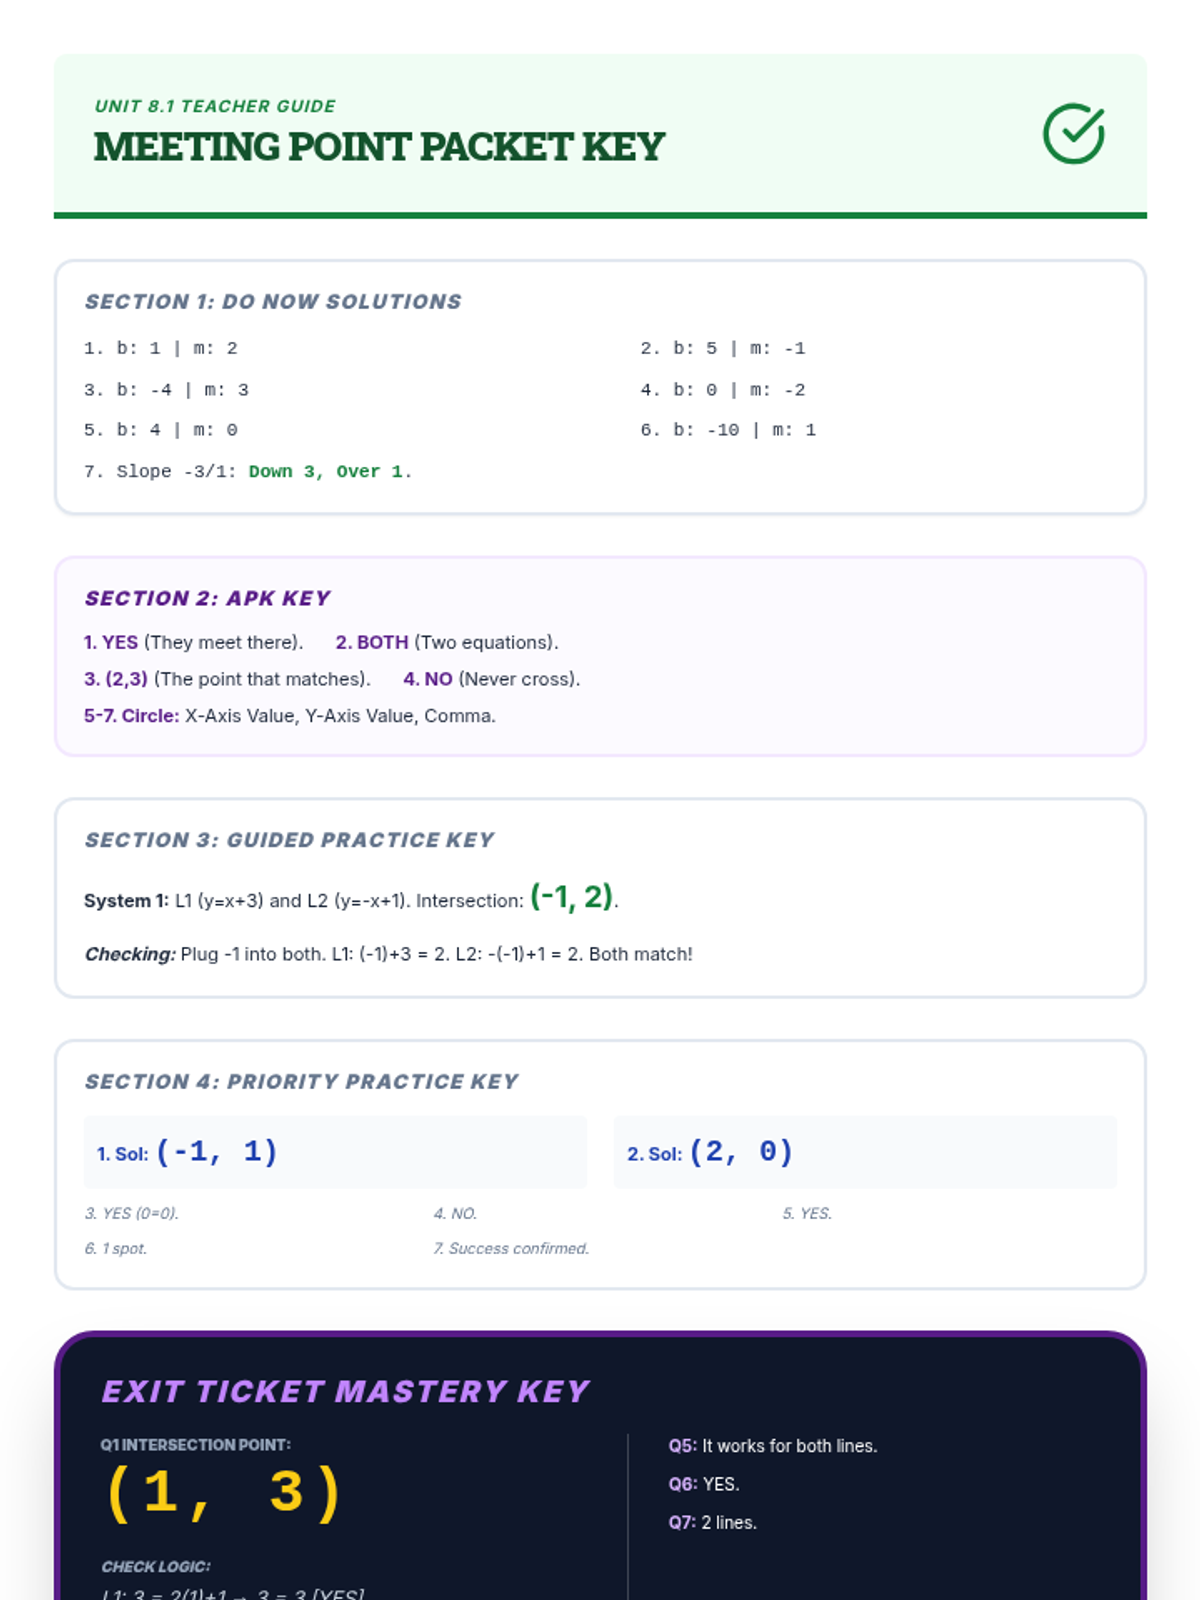
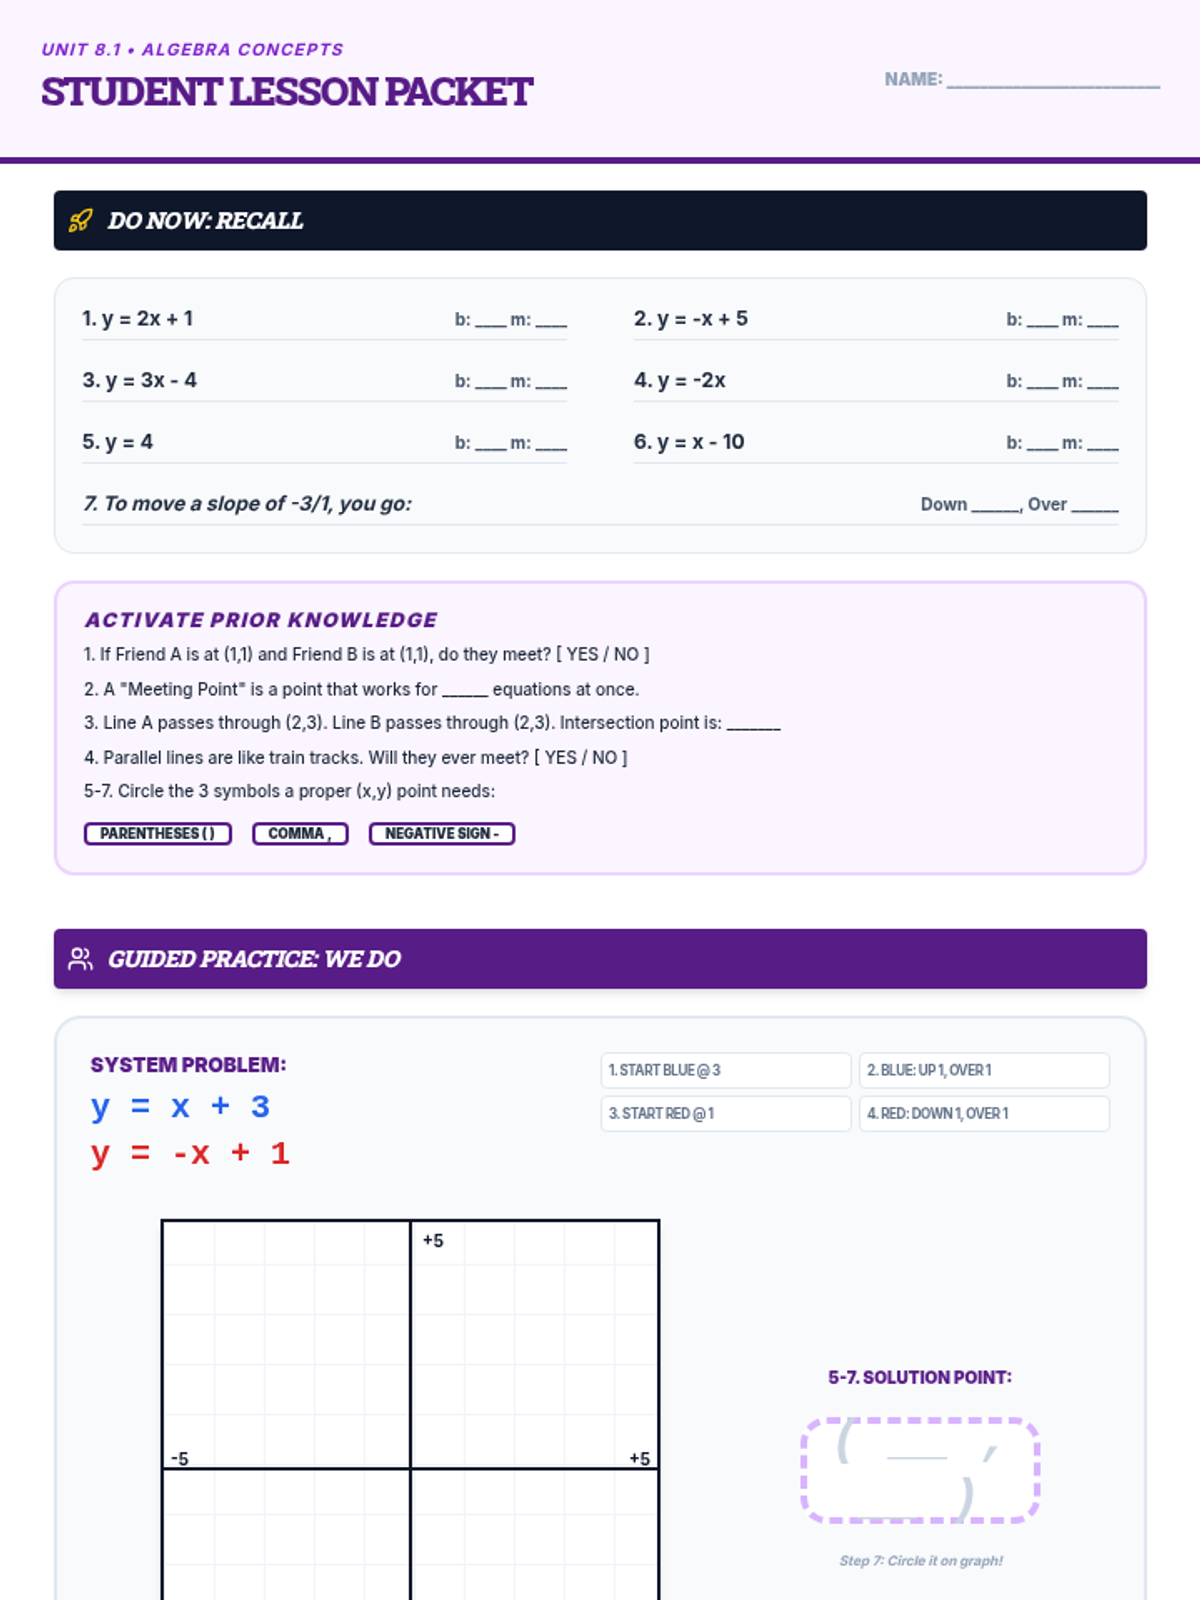
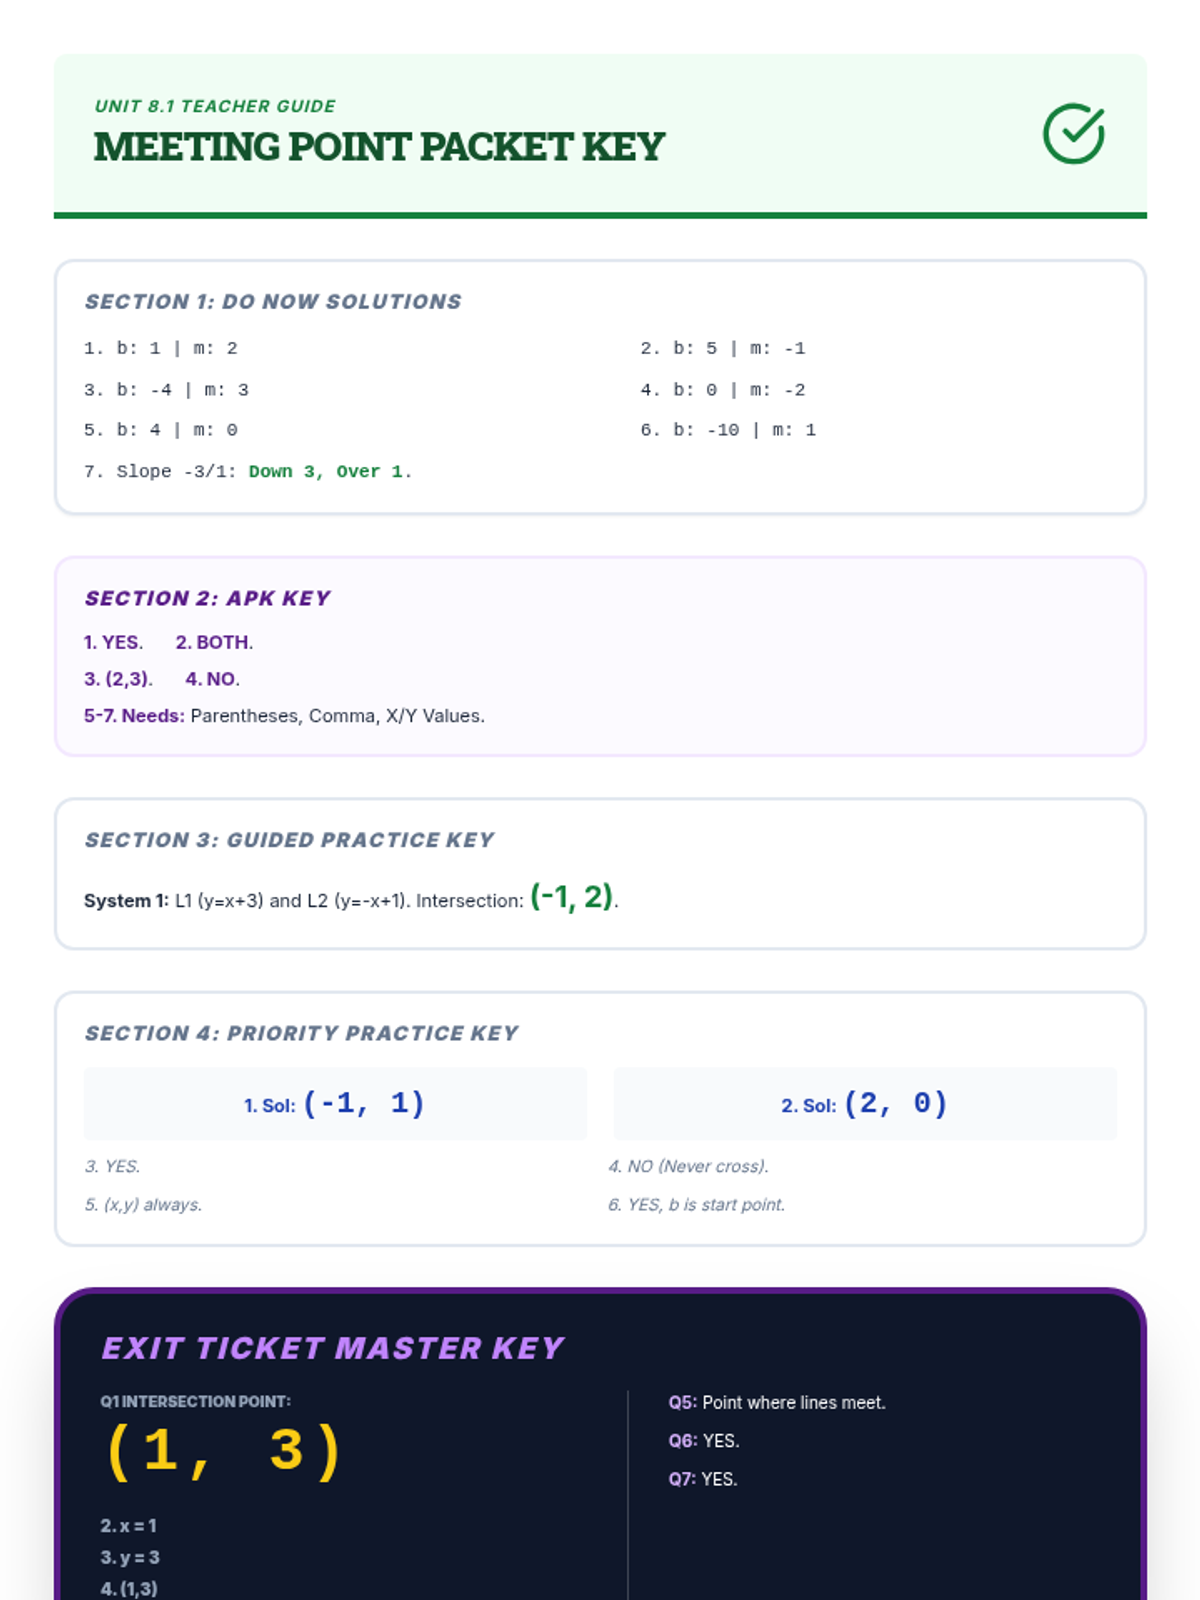
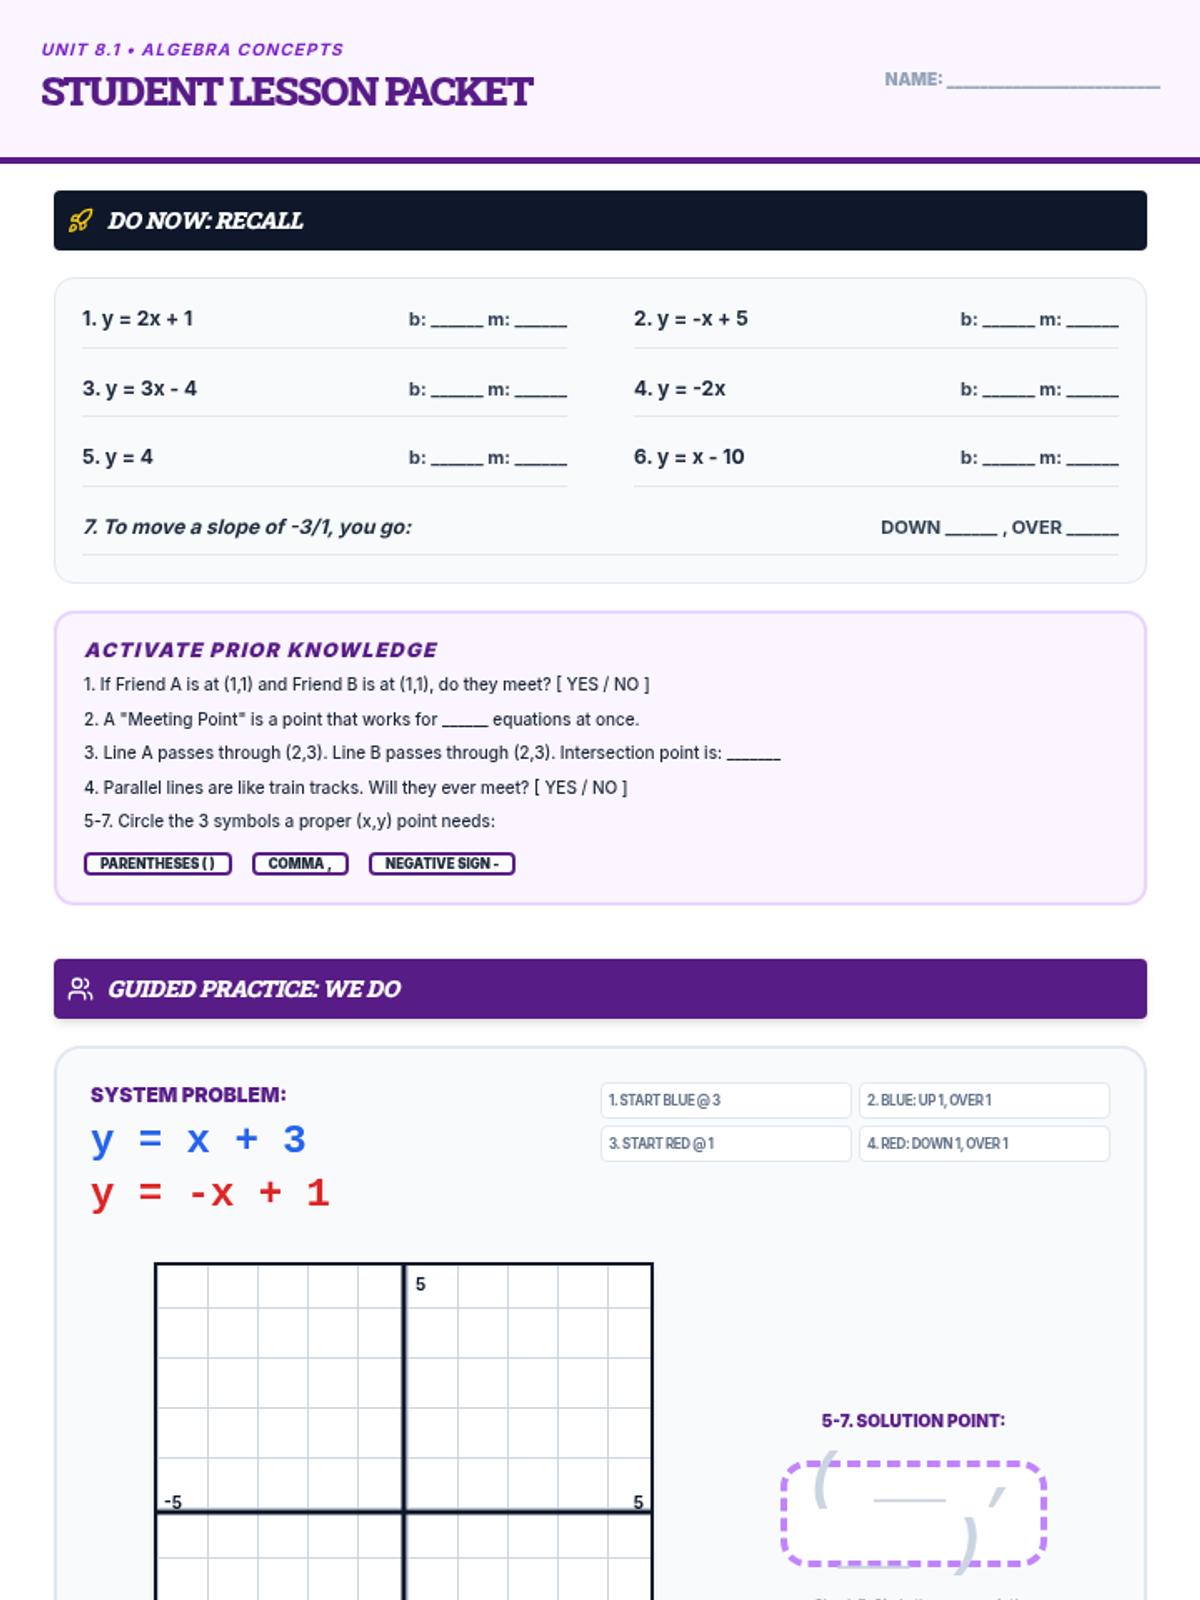
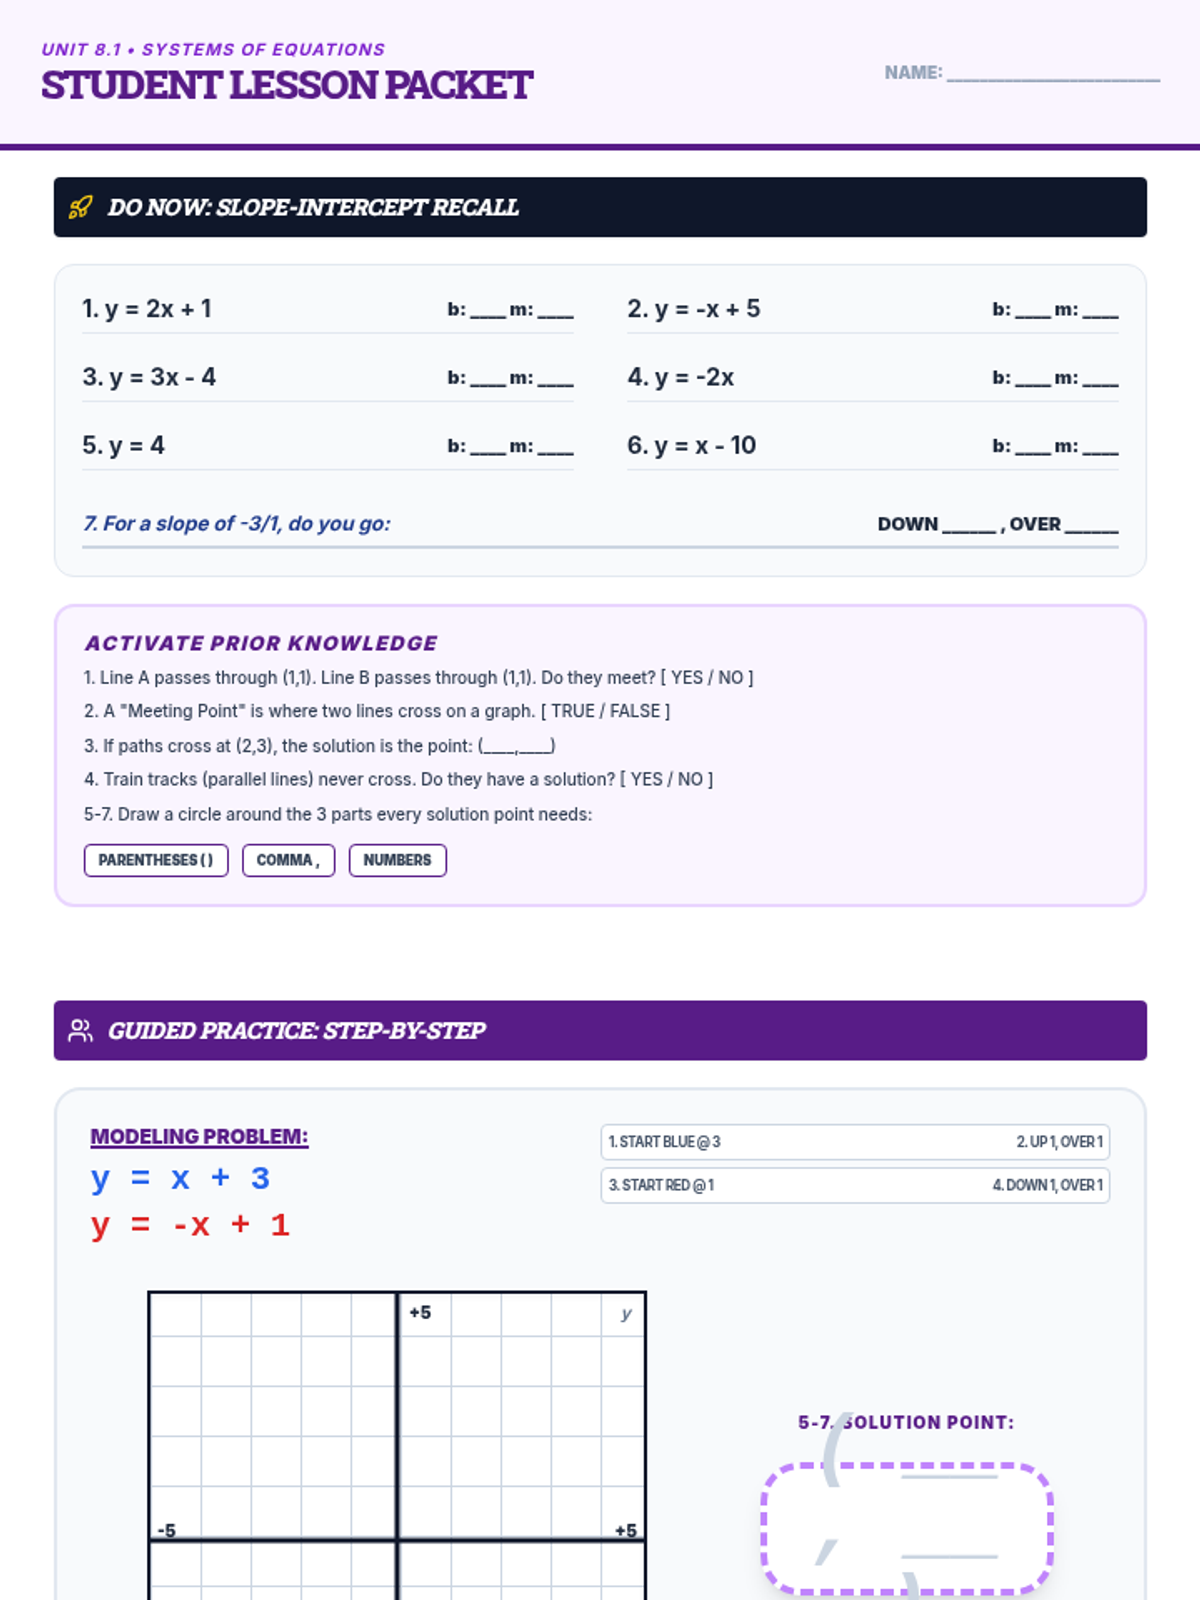
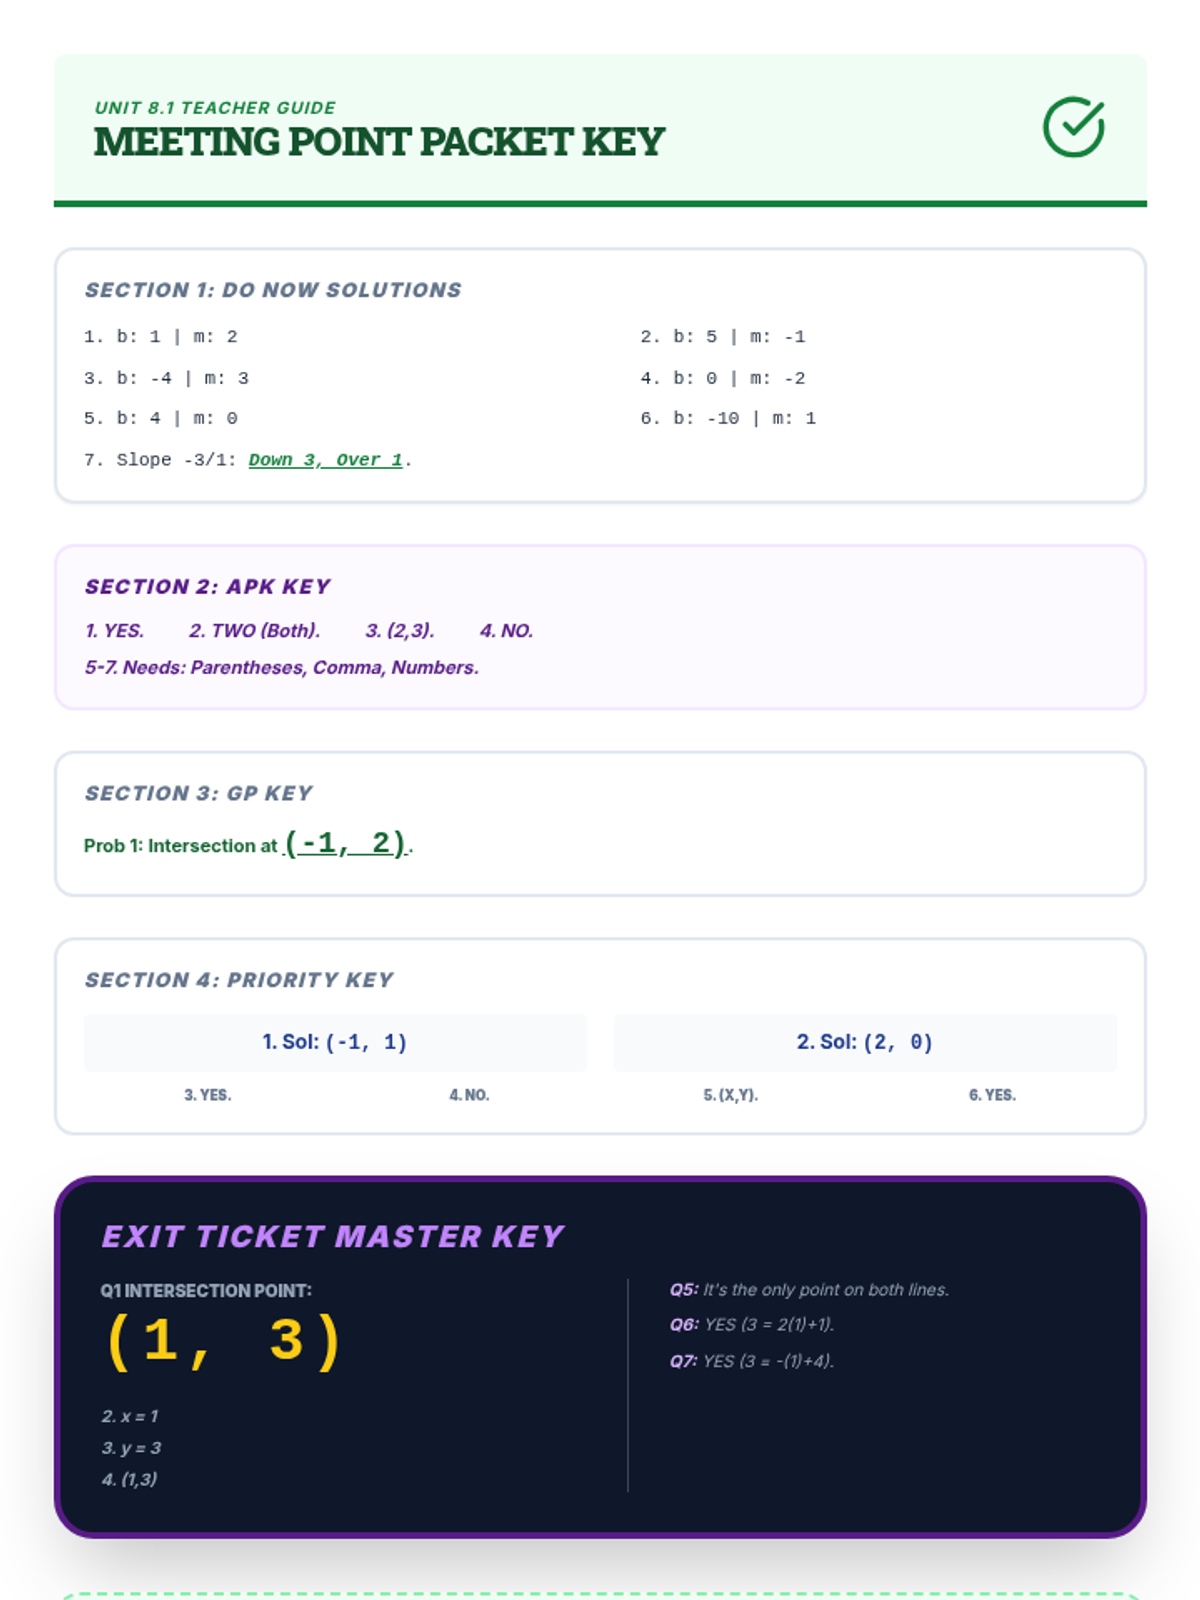
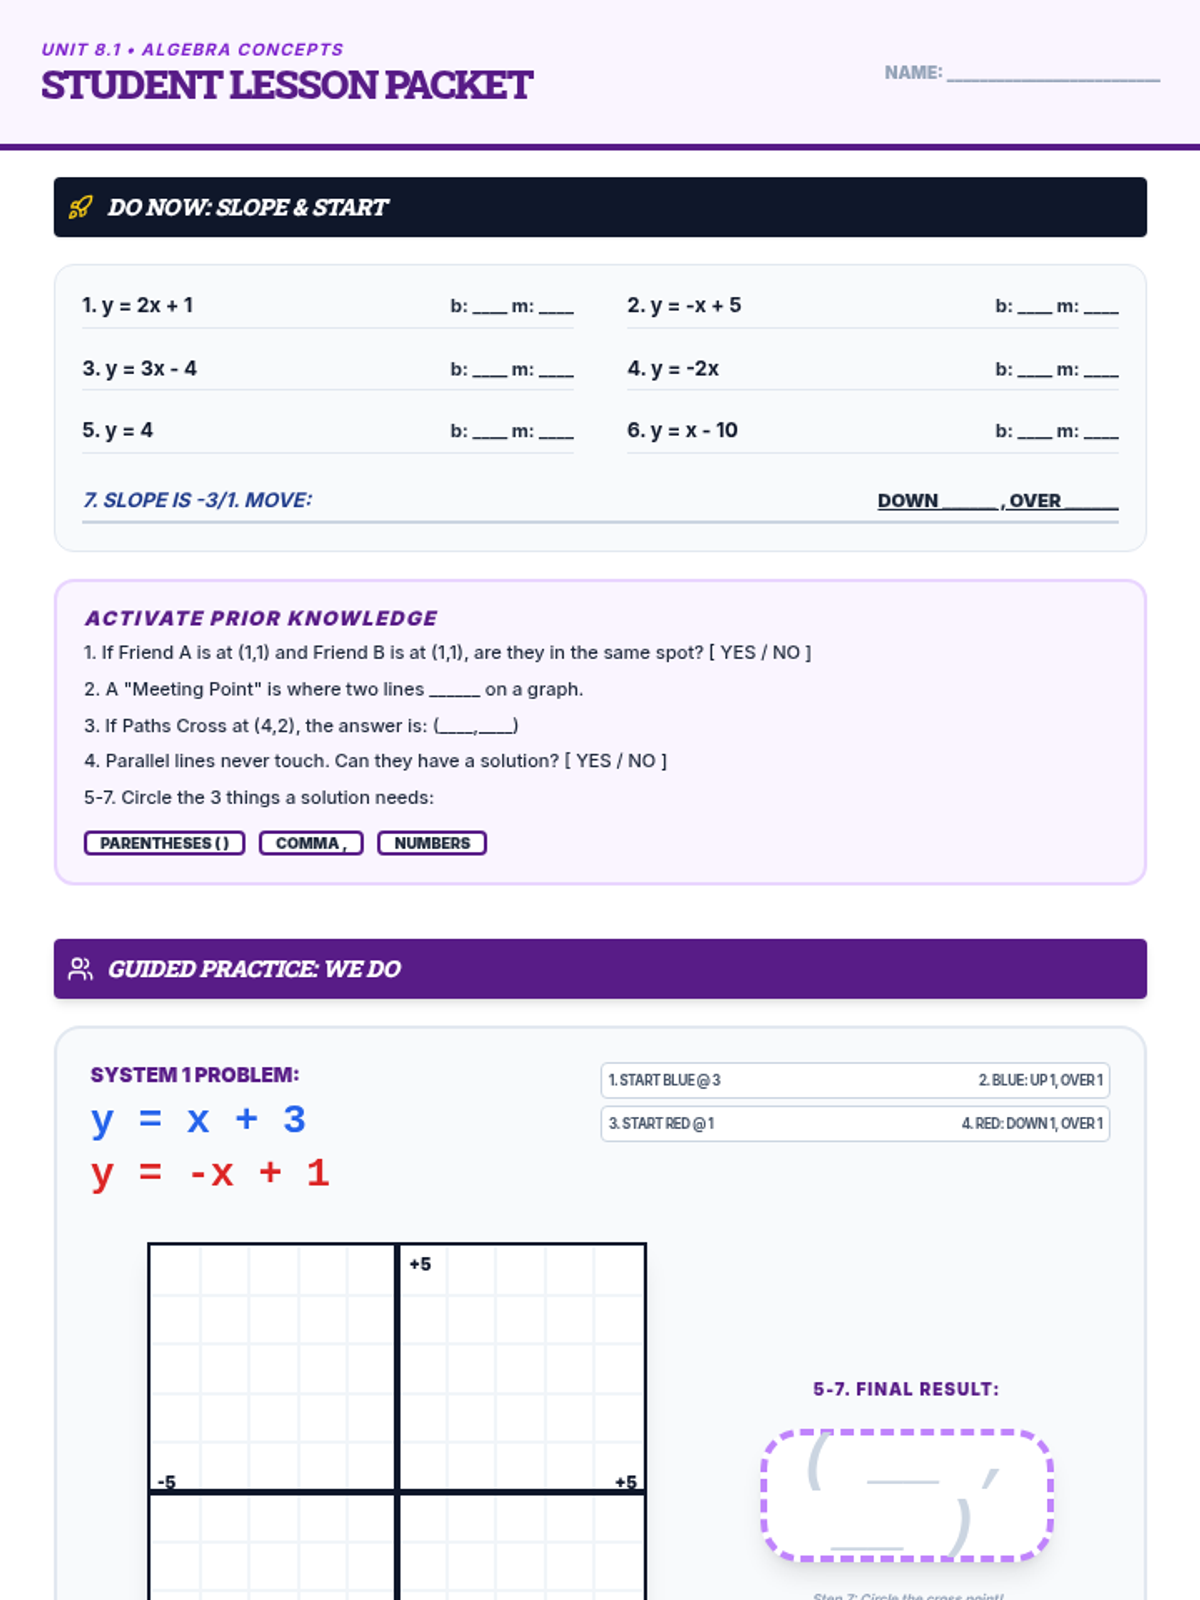
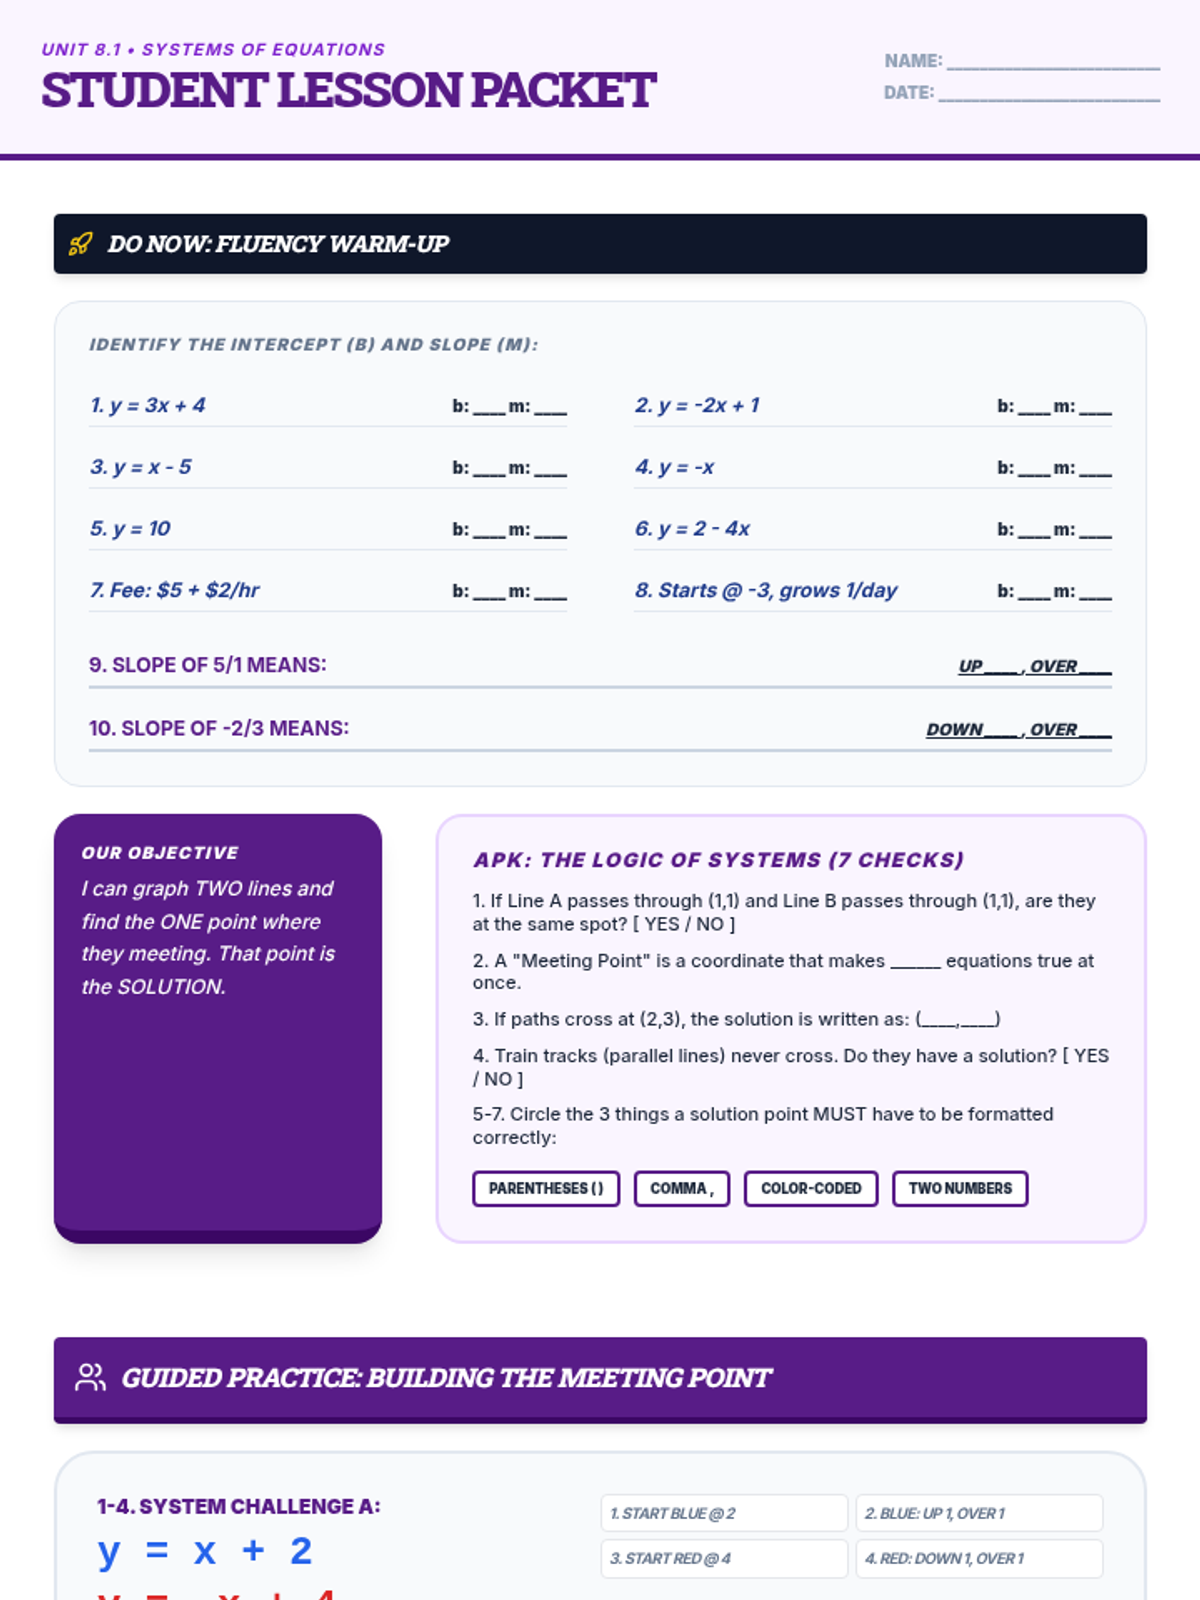
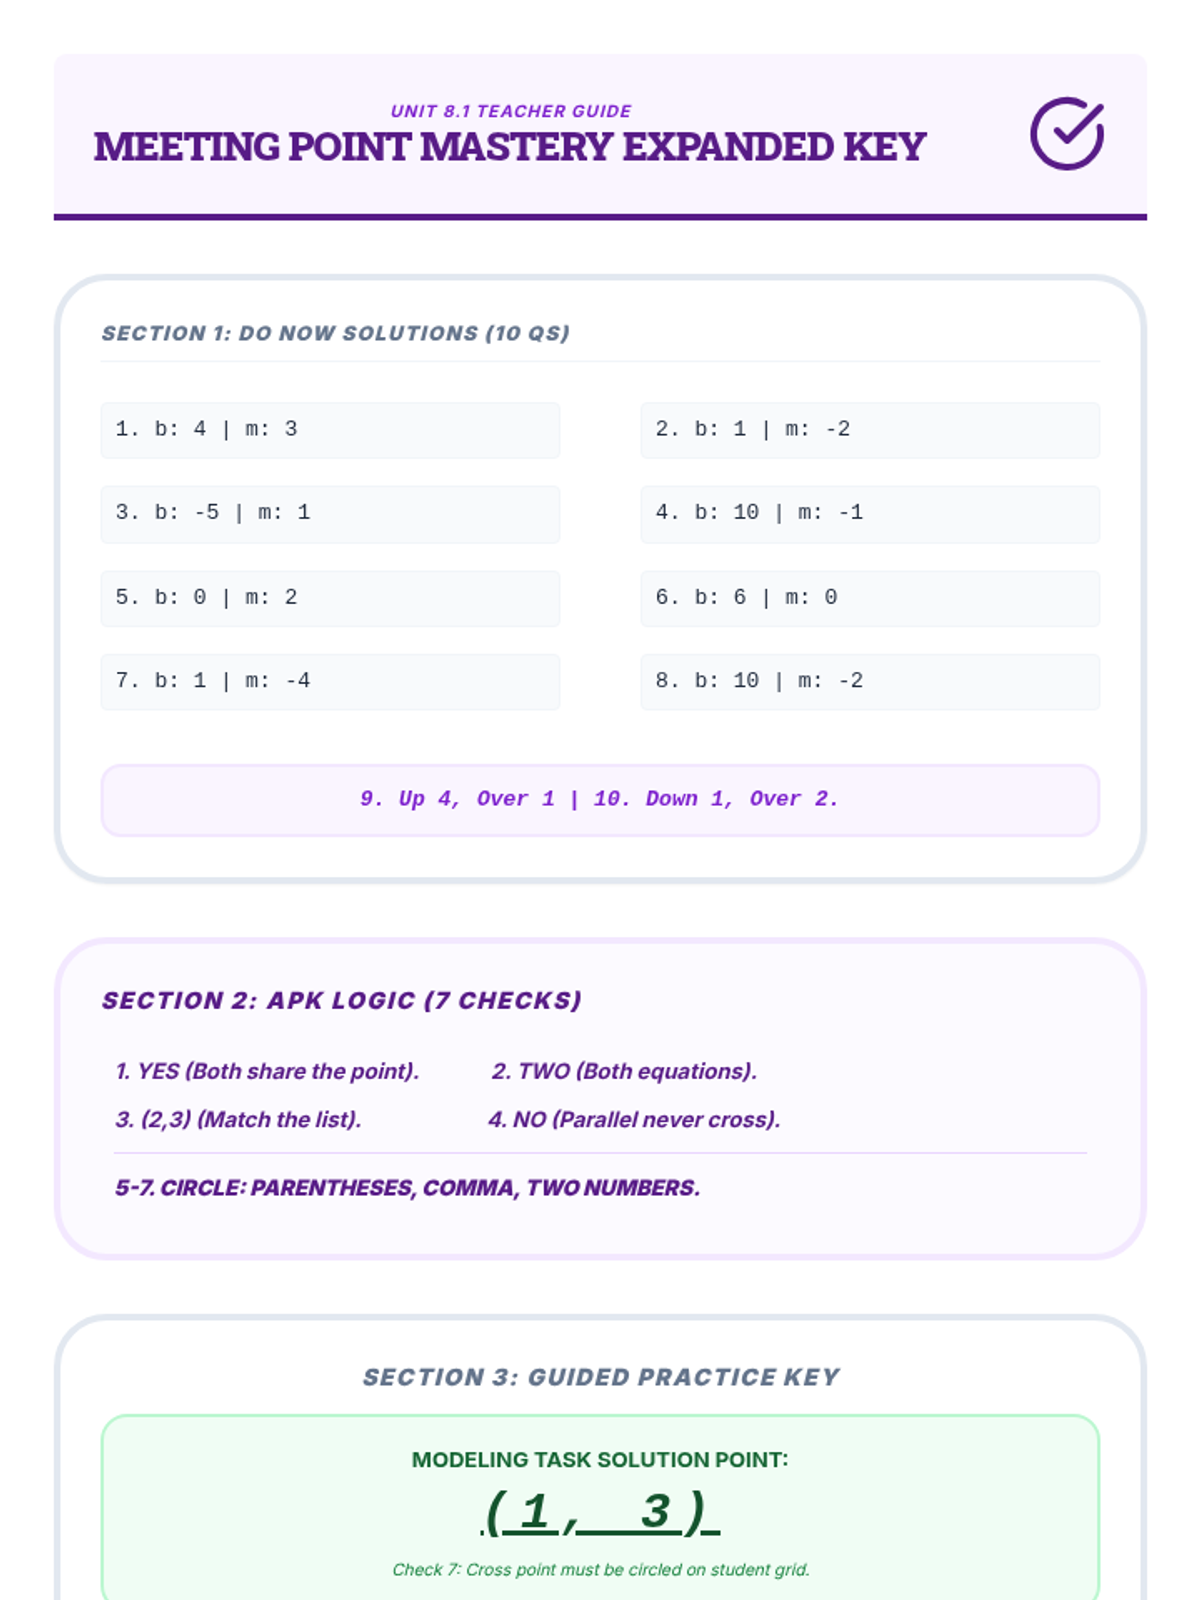
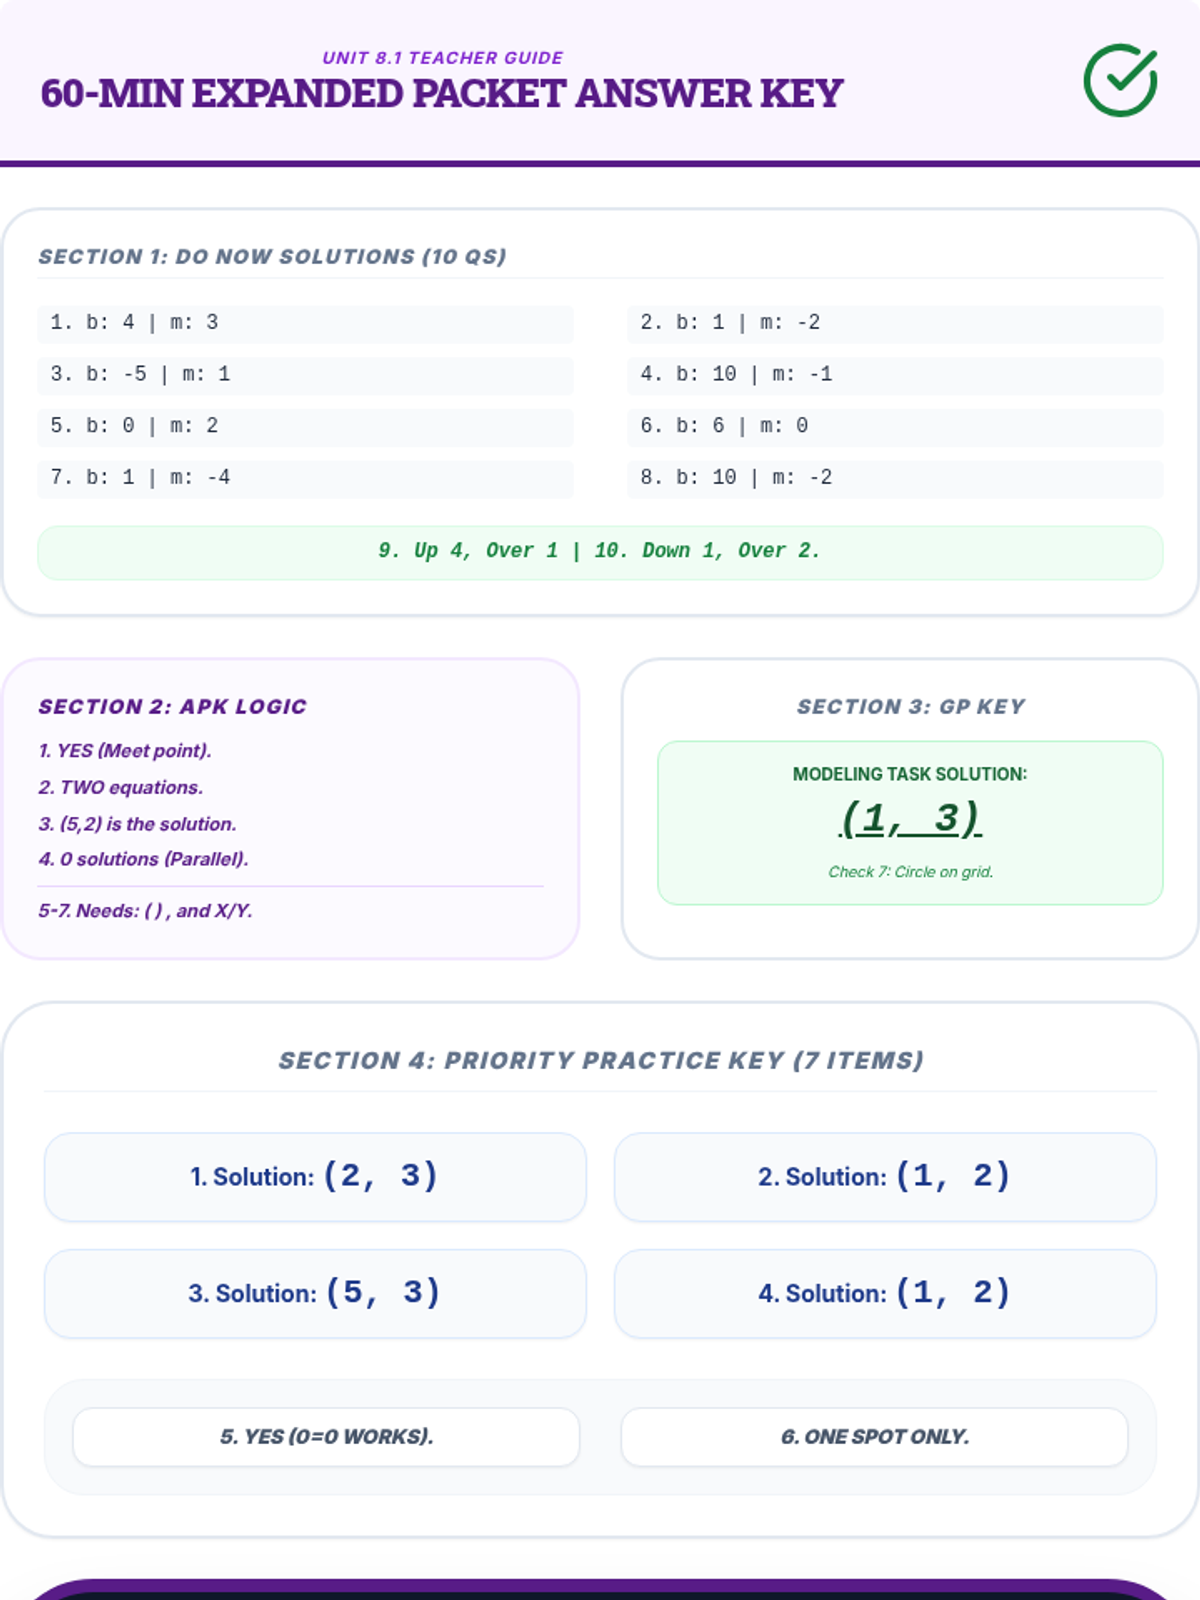
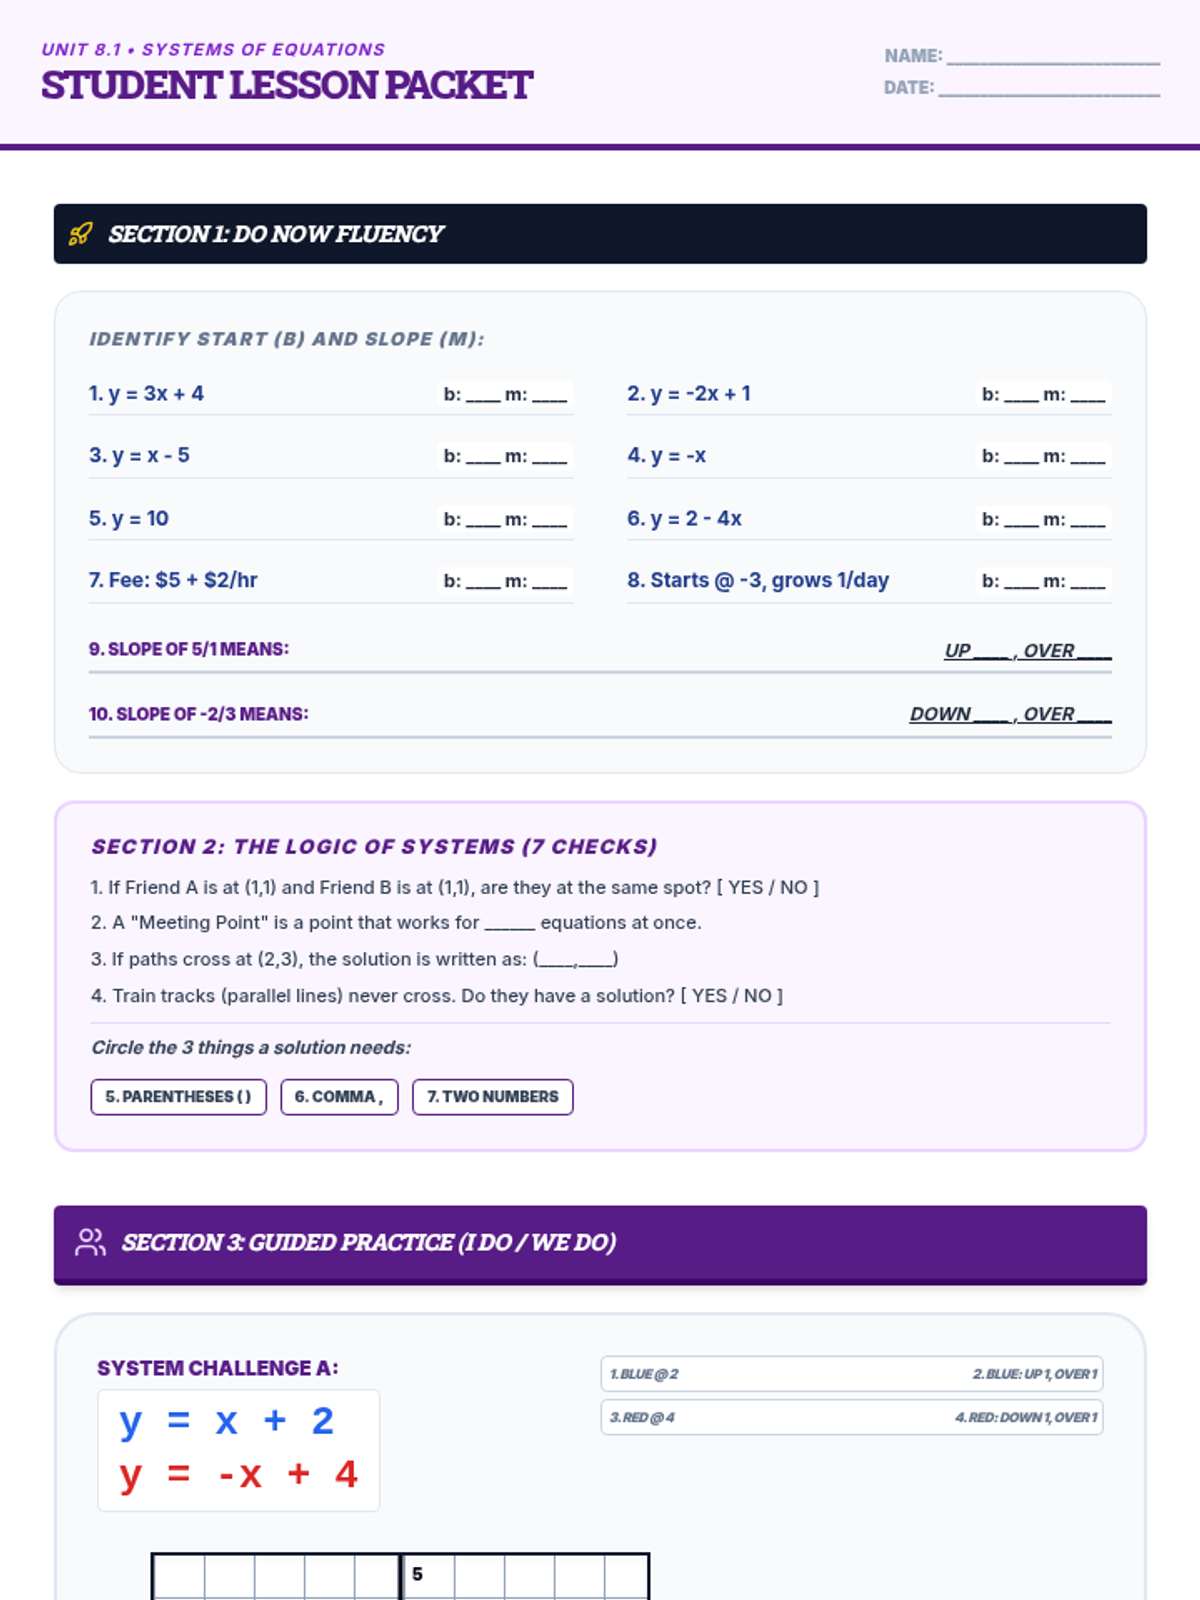
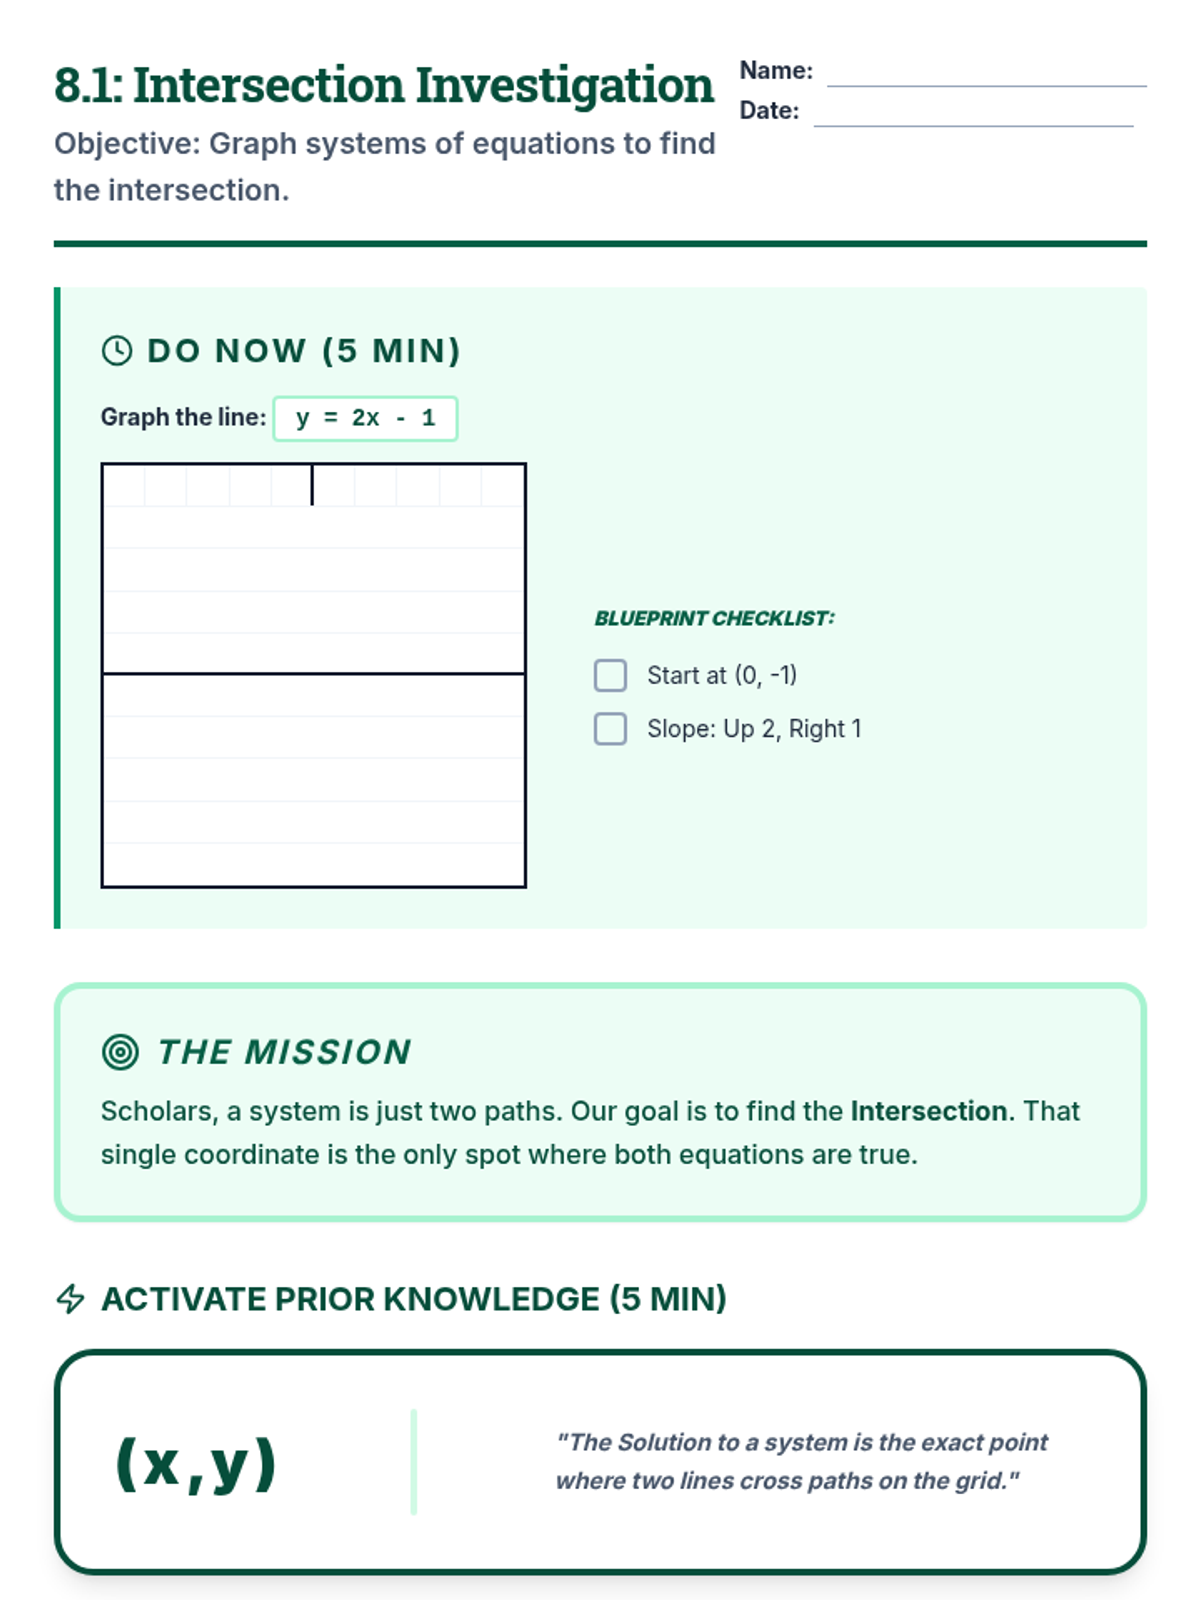
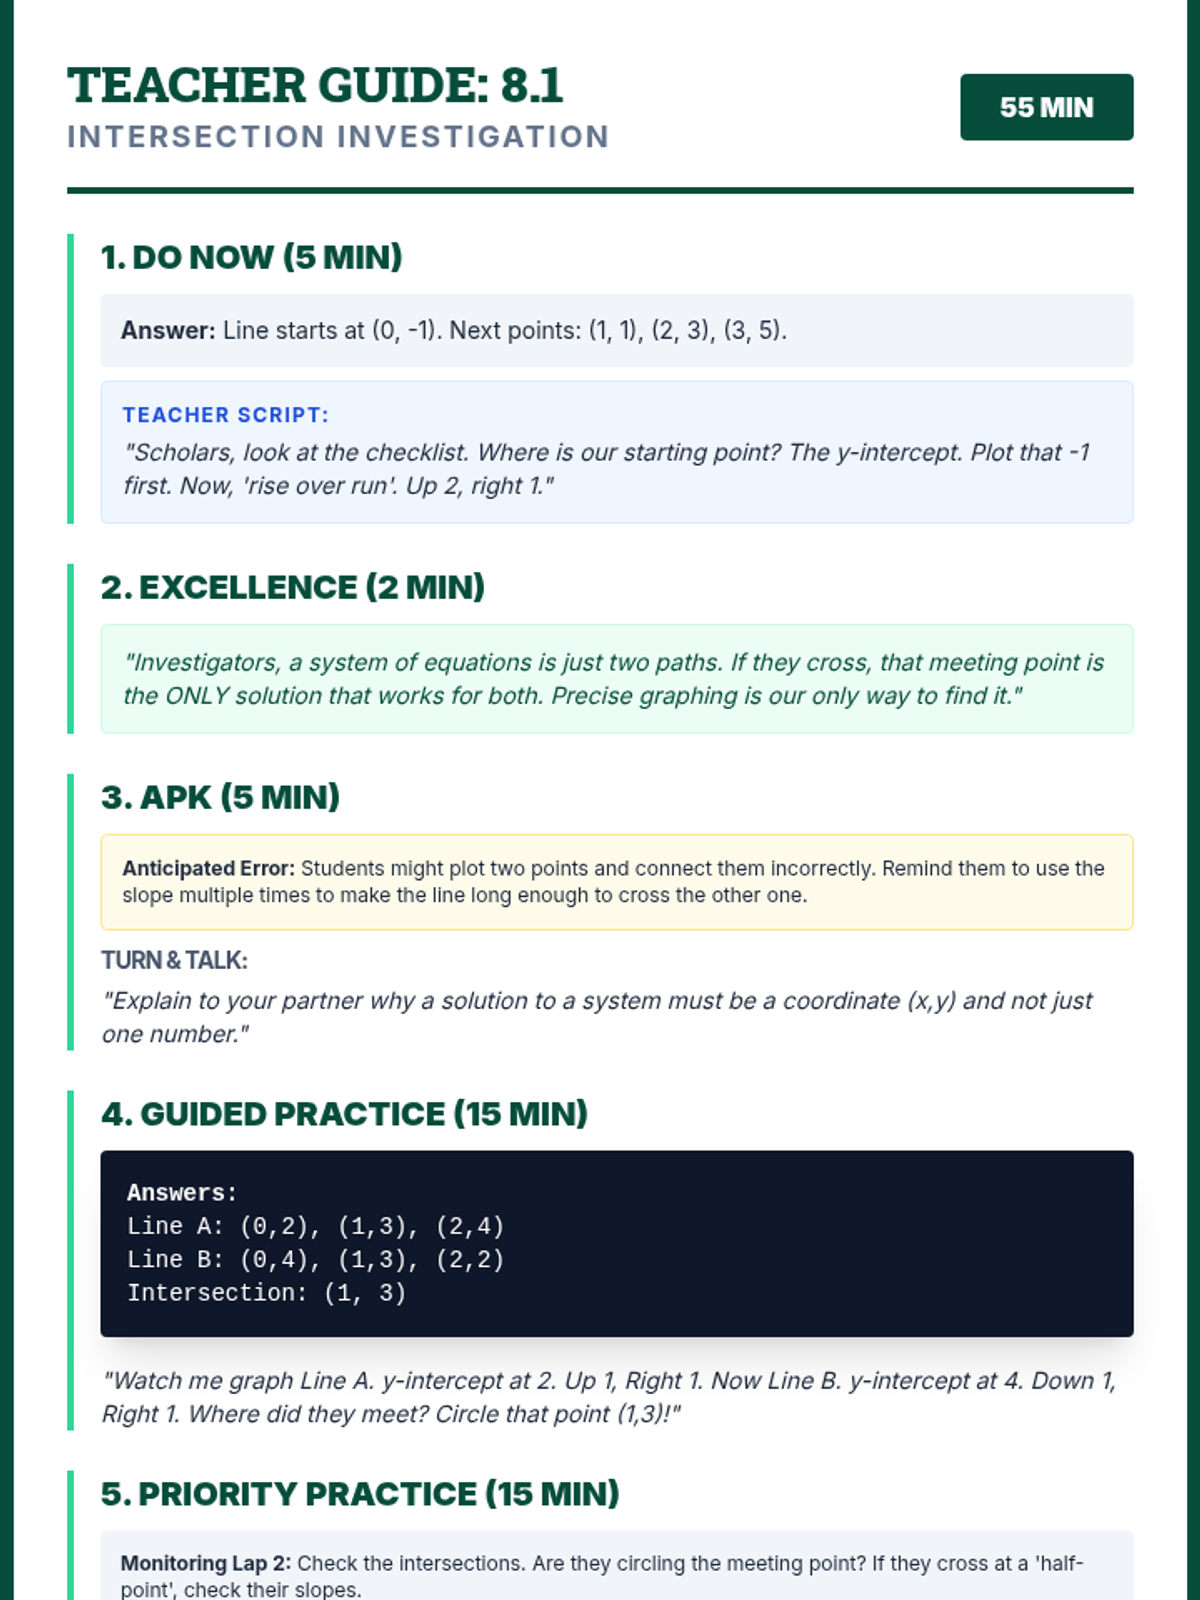
A lesson focused on graphing two linear equations on the same coordinate plane to compare growth trends over time. Students will identify starting points, rates of growth, and points of intersection.
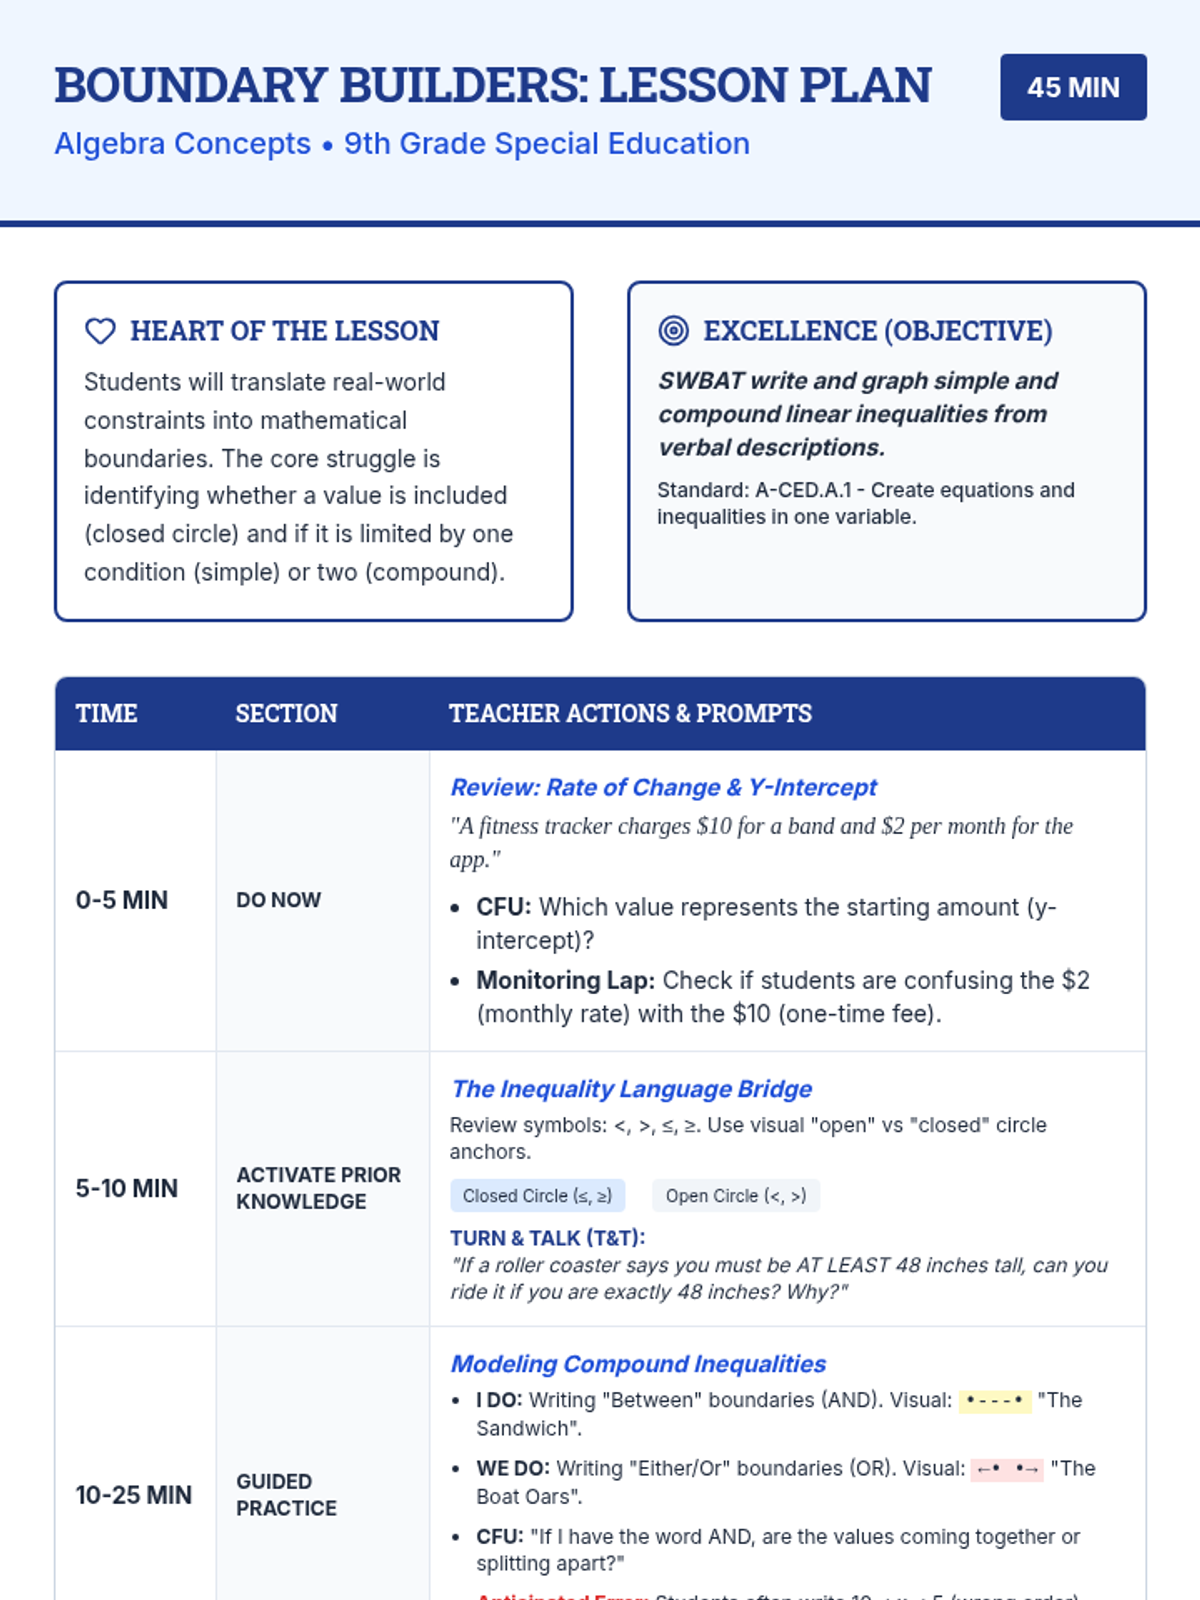
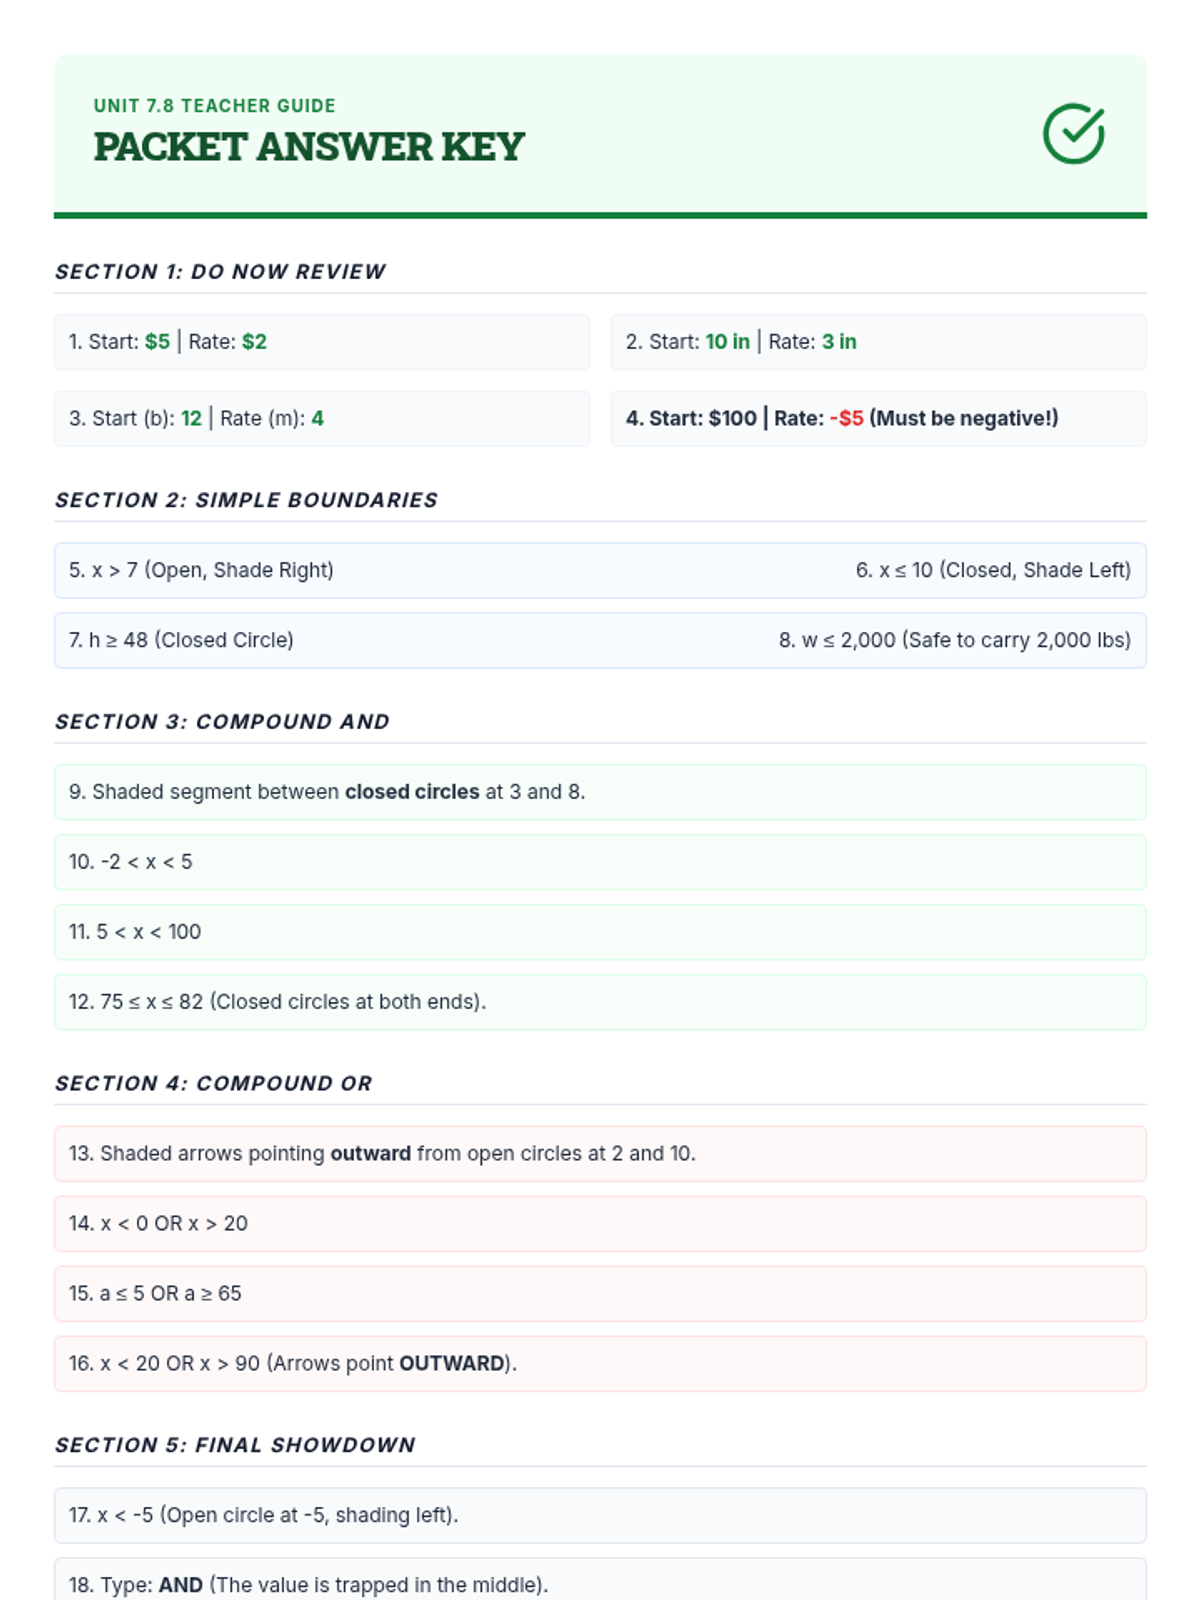
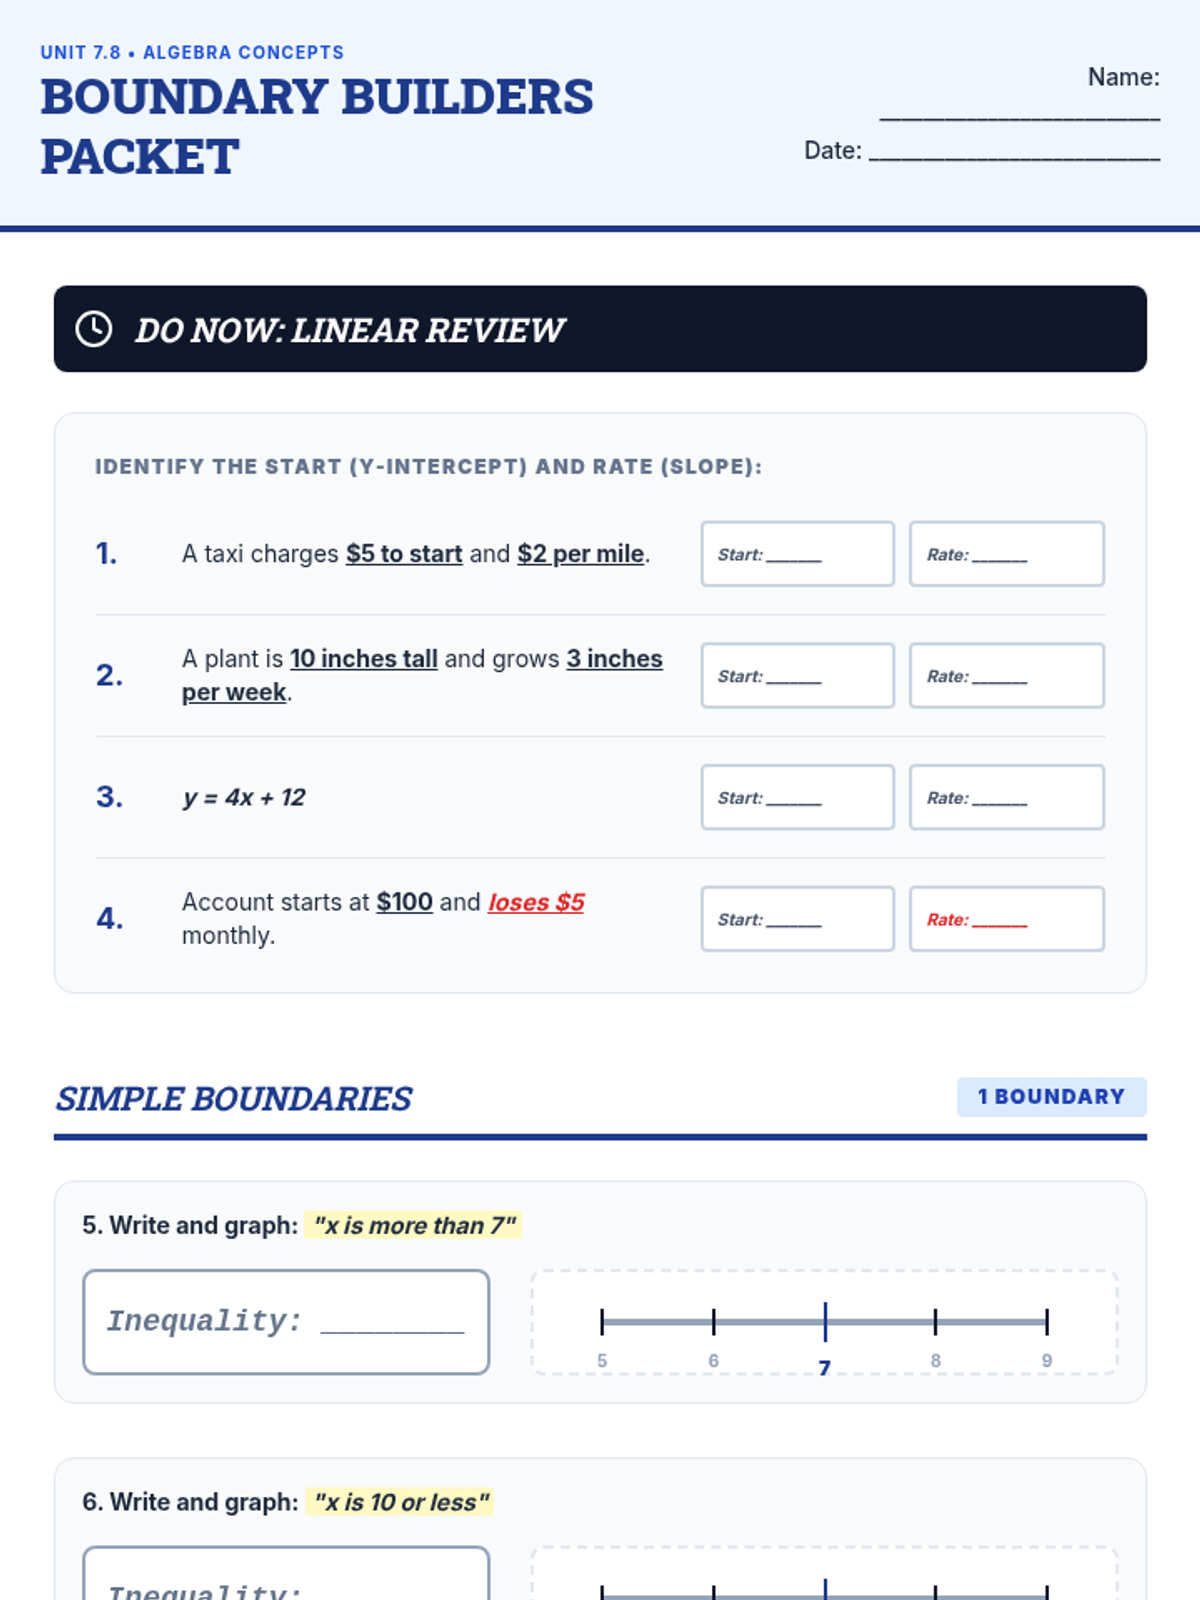
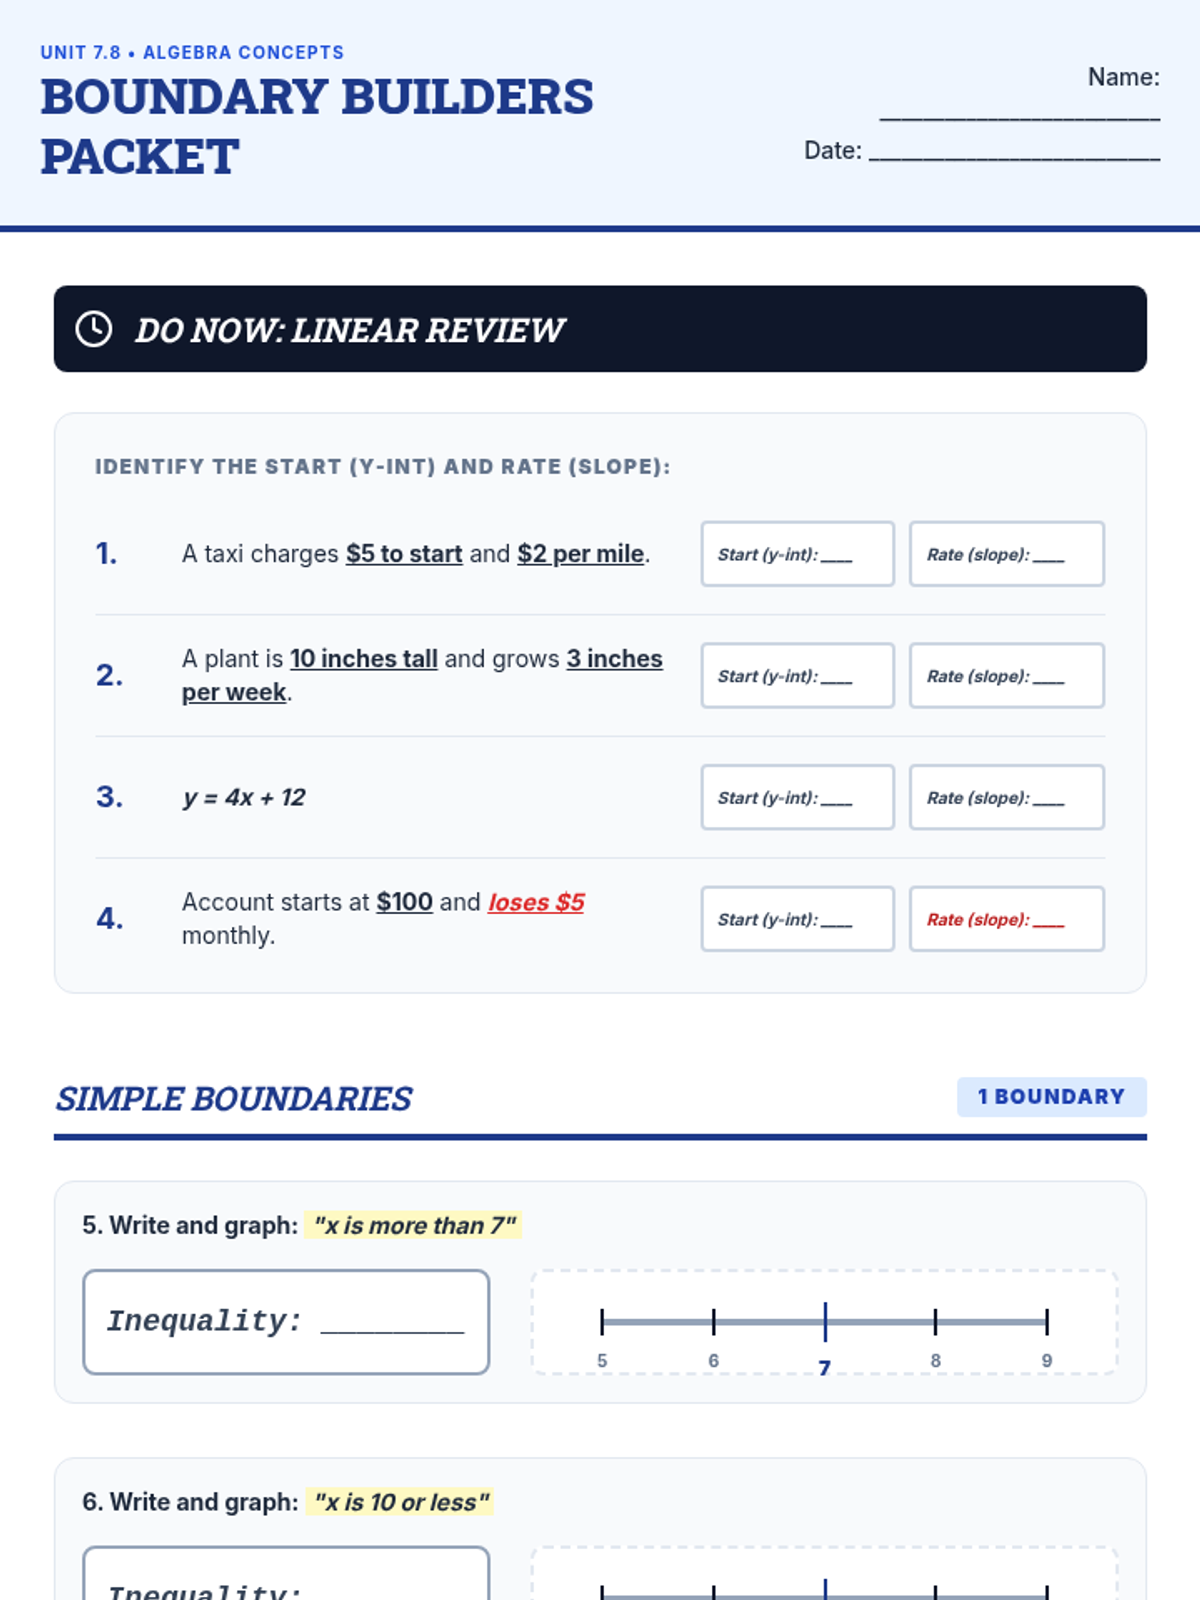
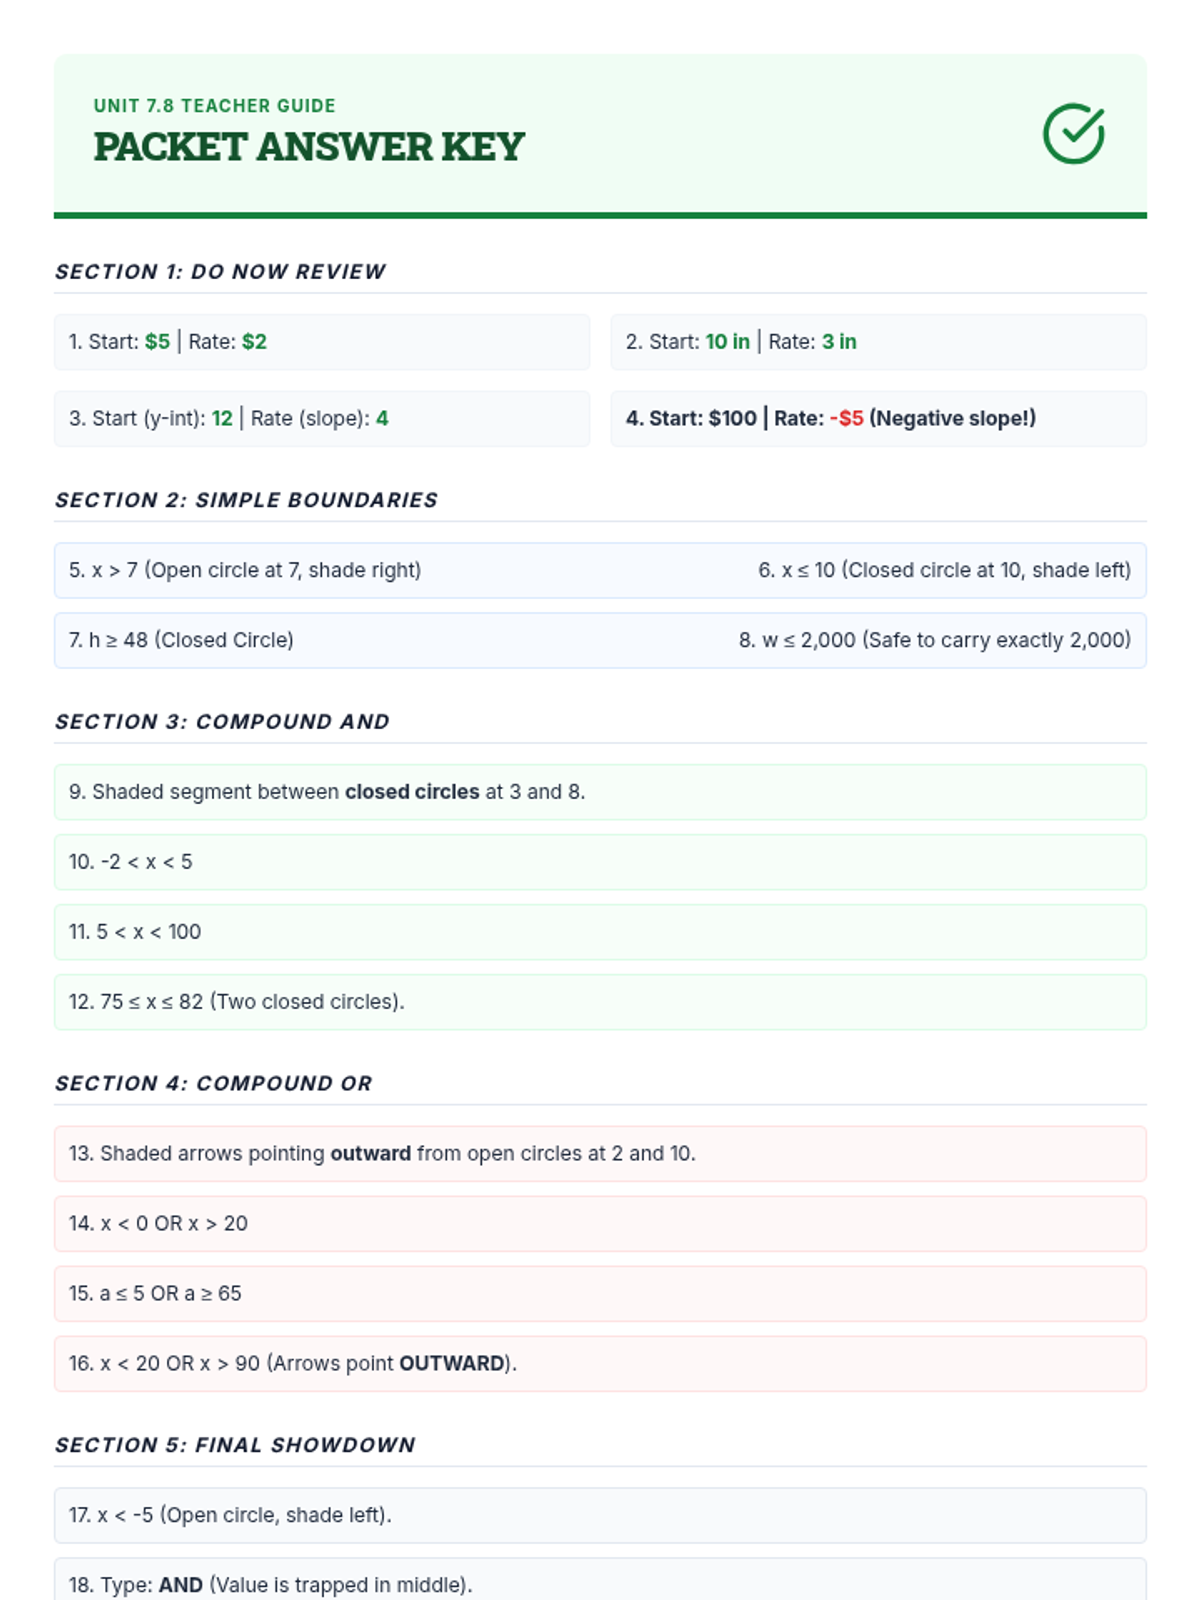
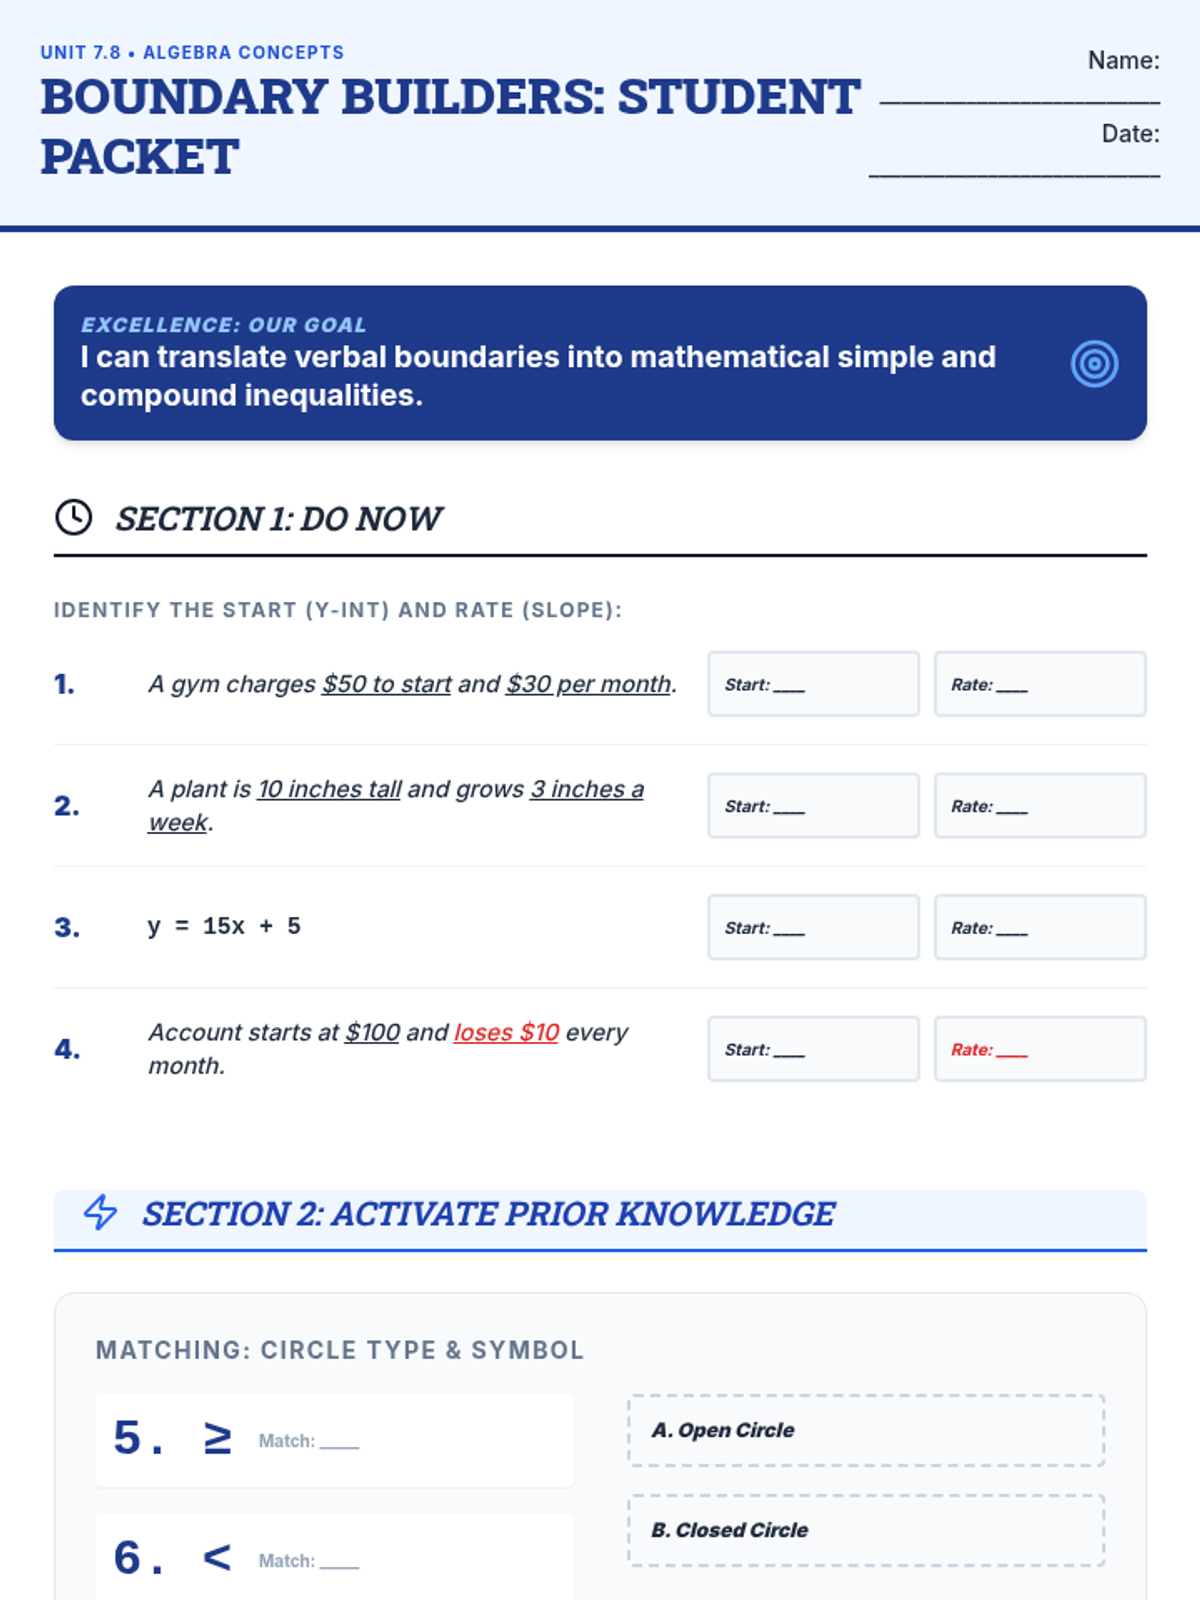
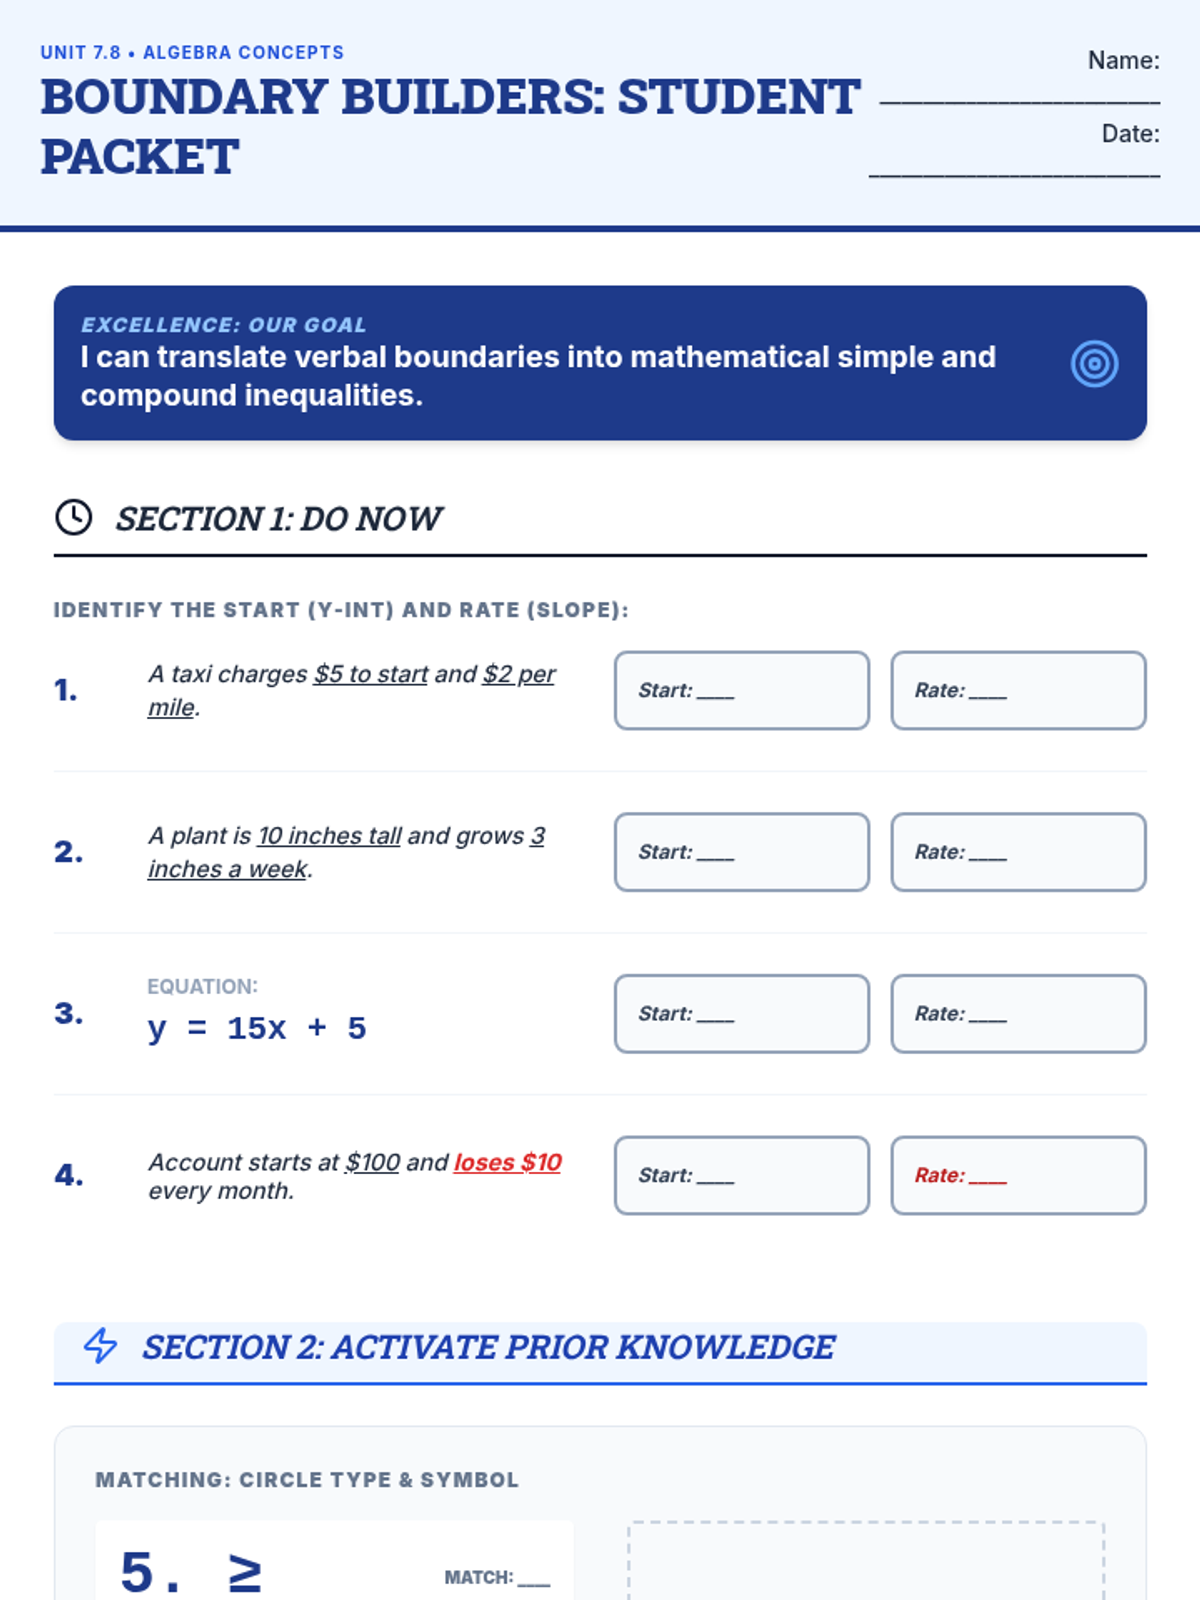
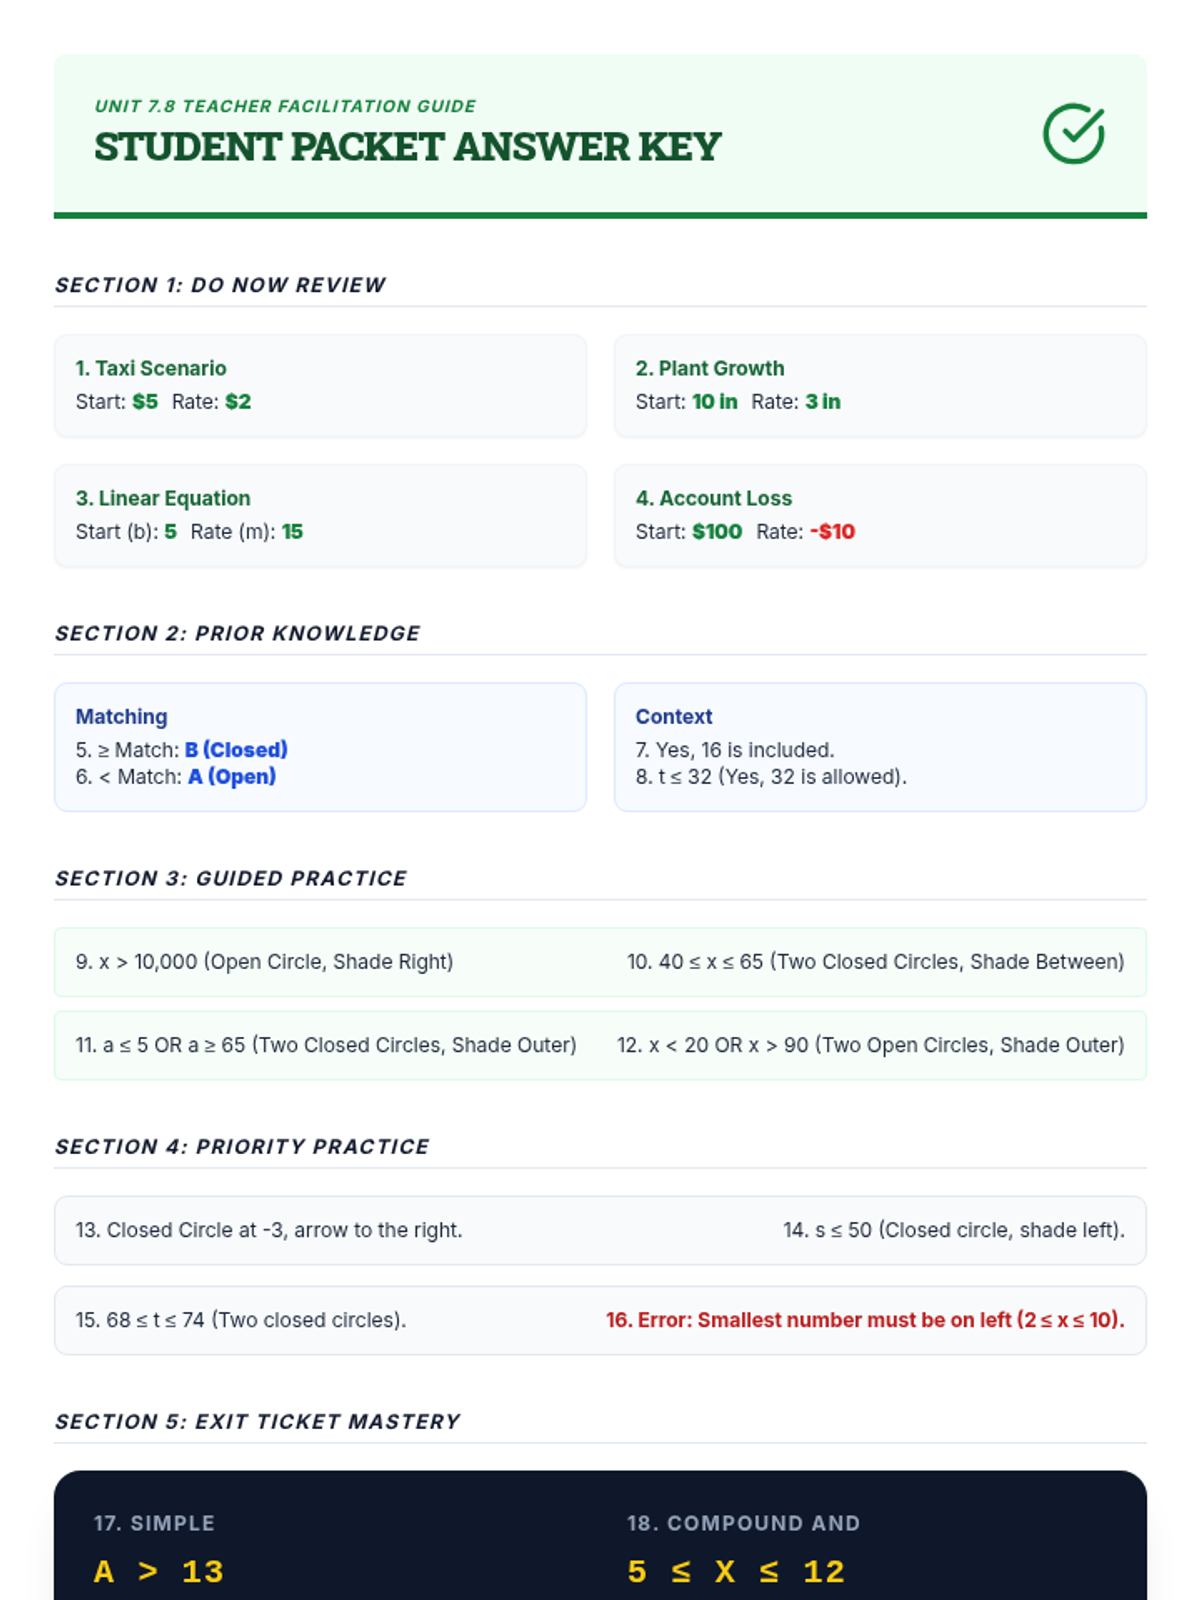
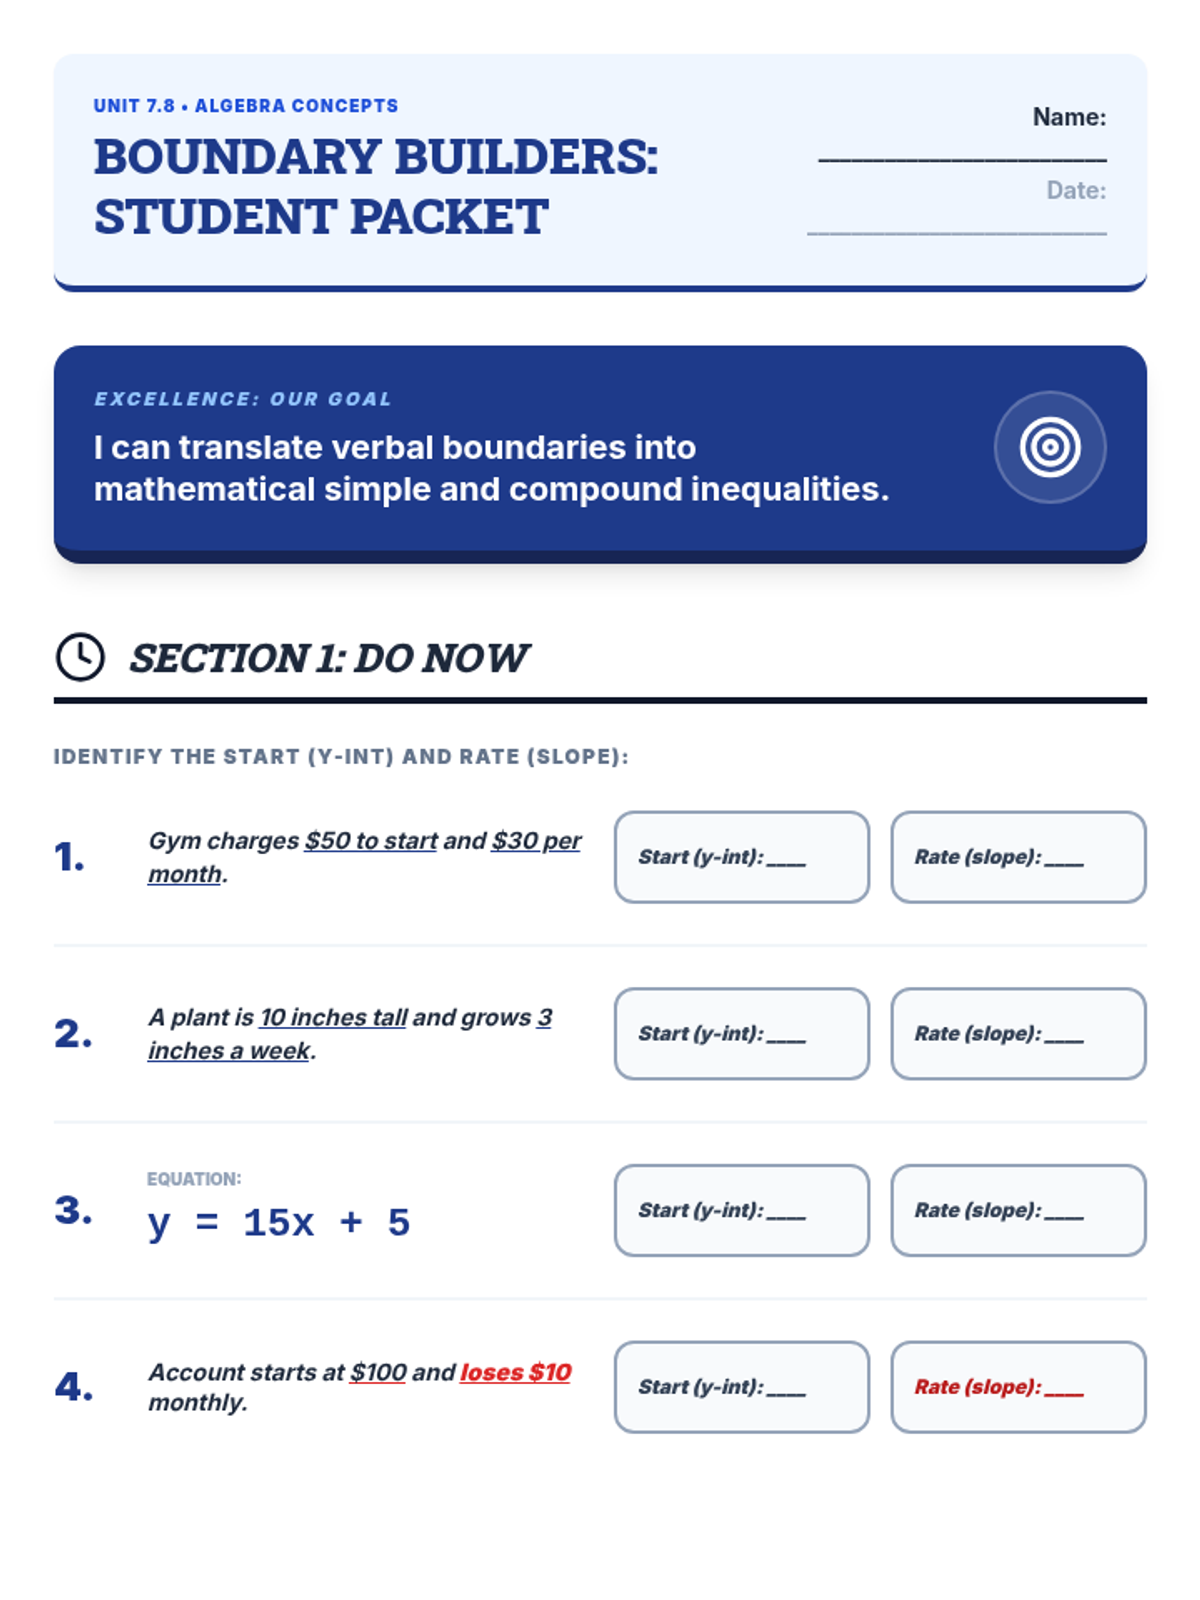
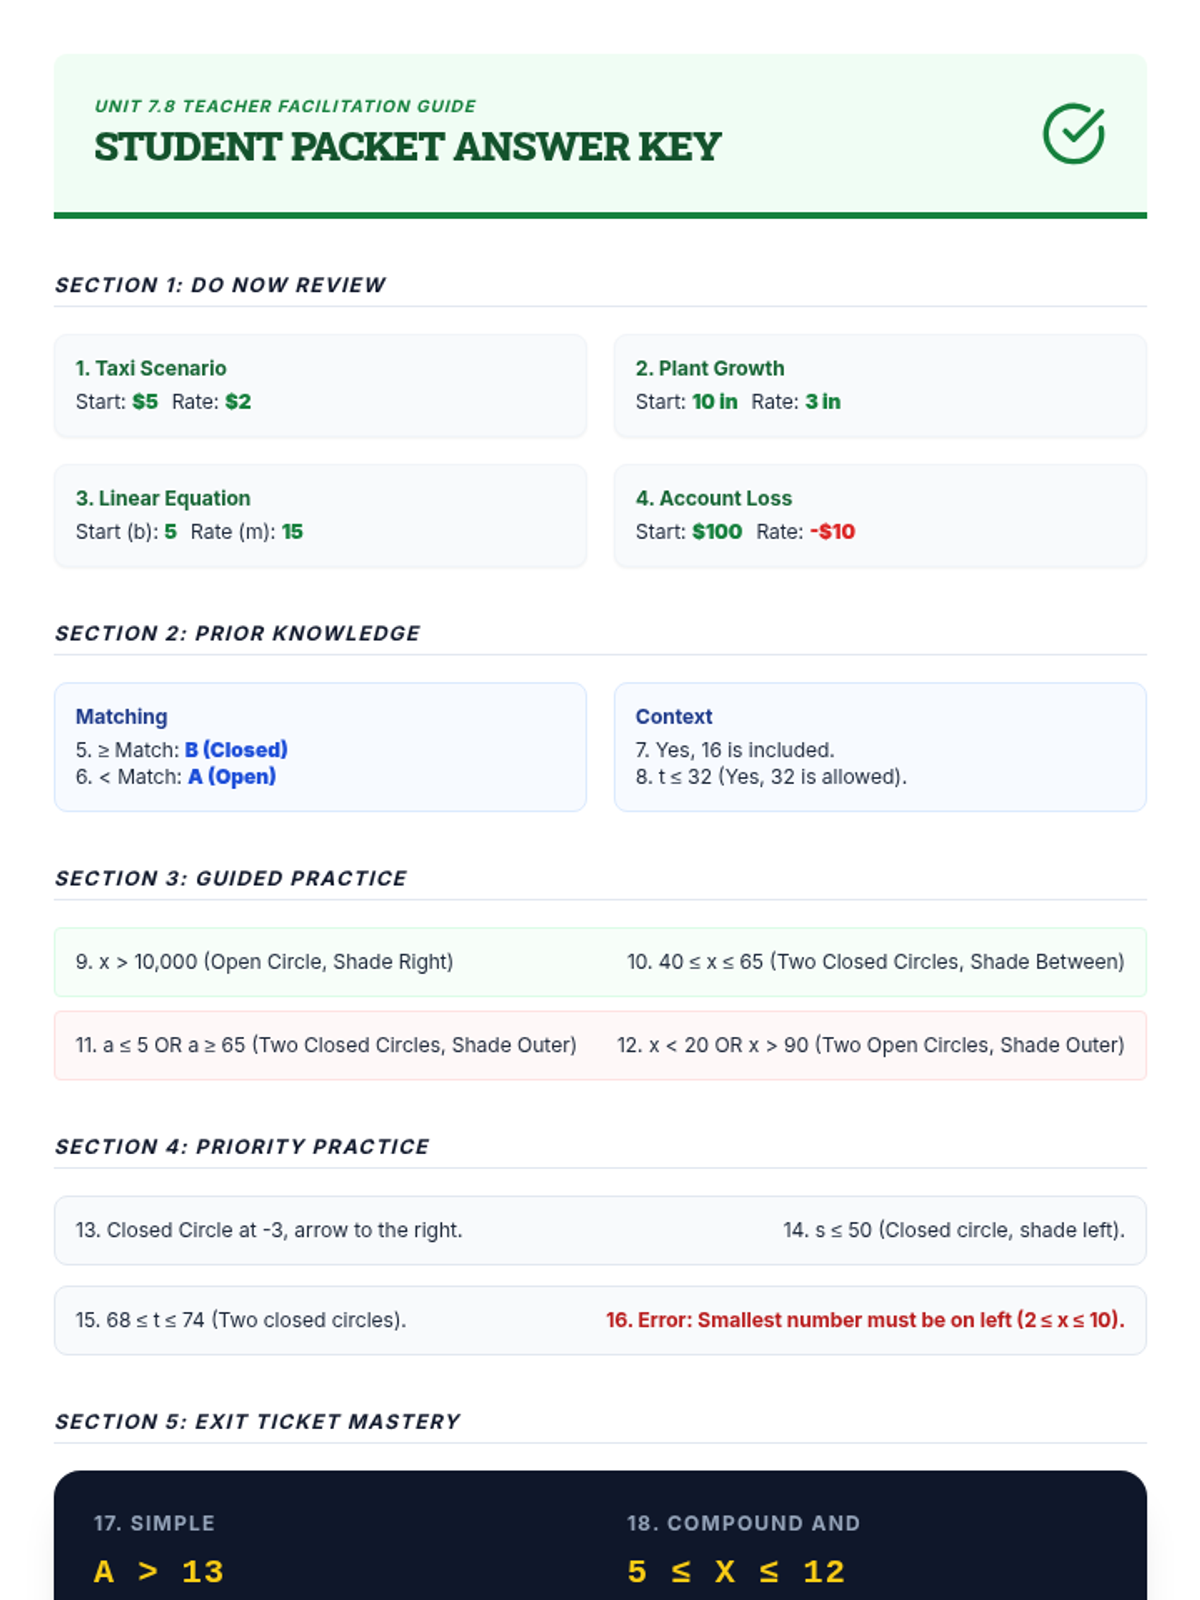
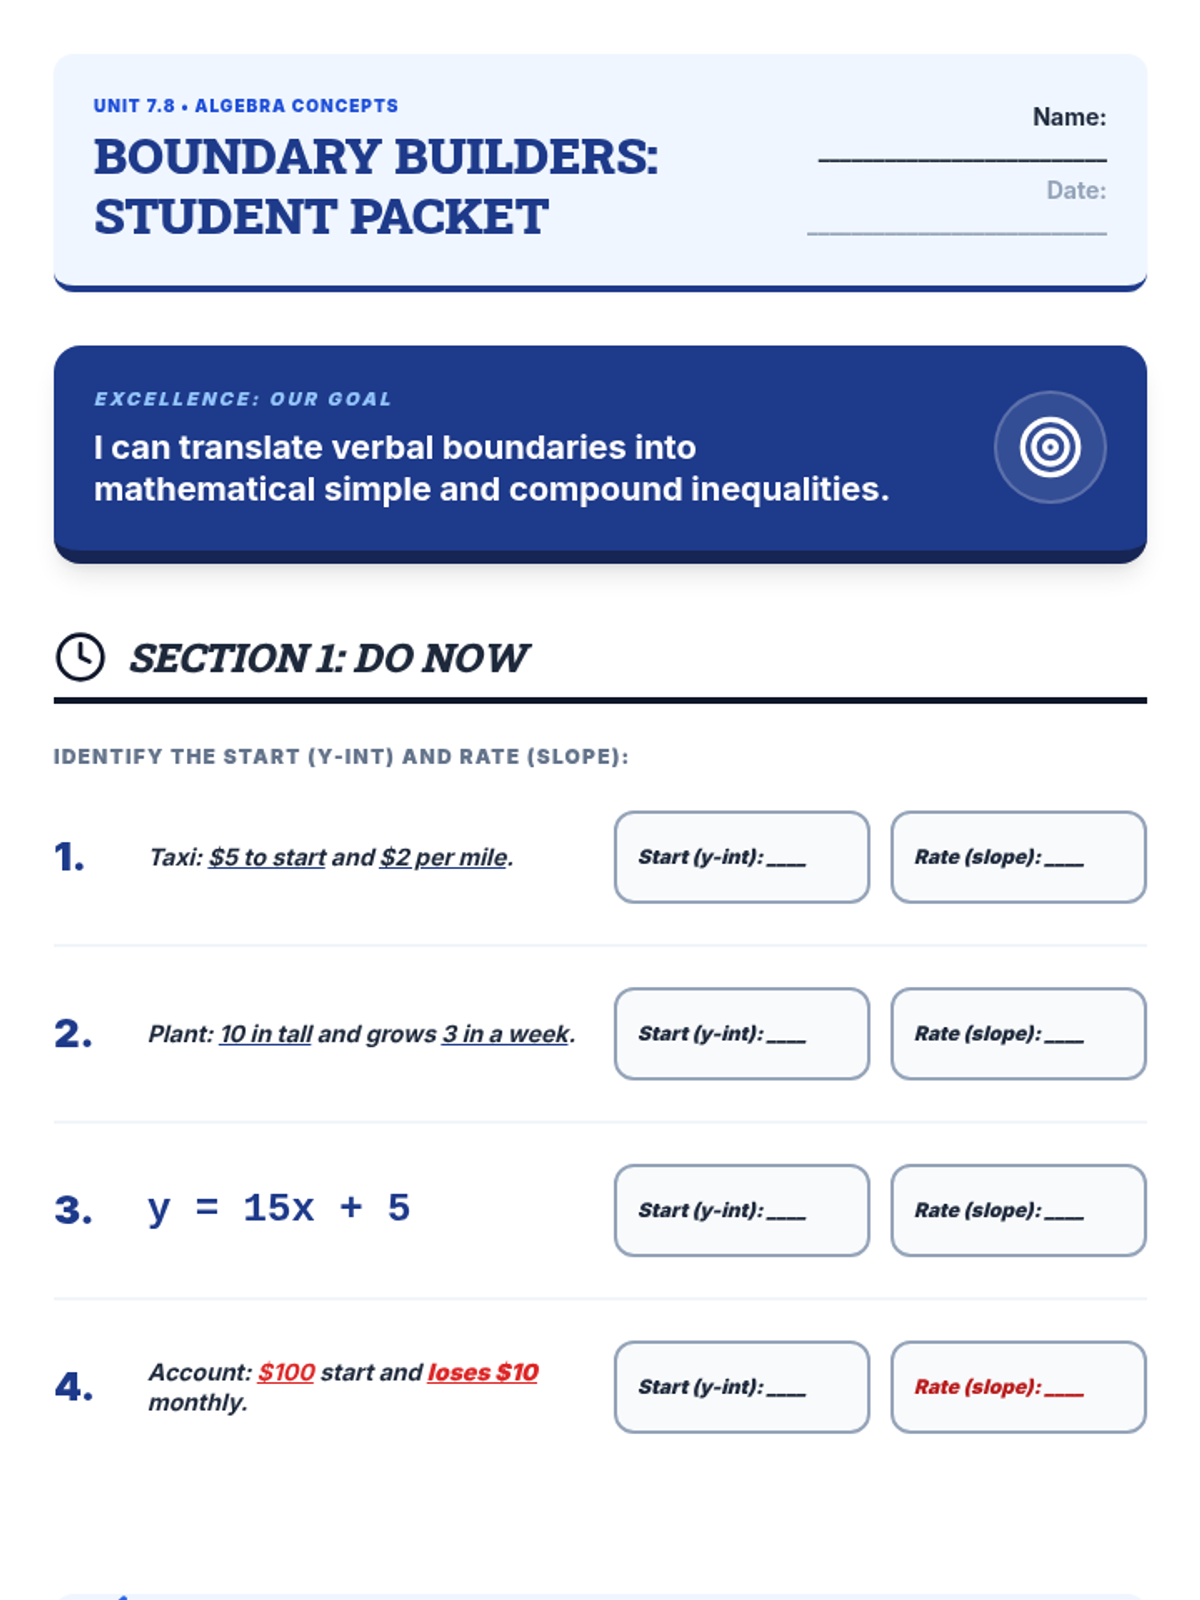
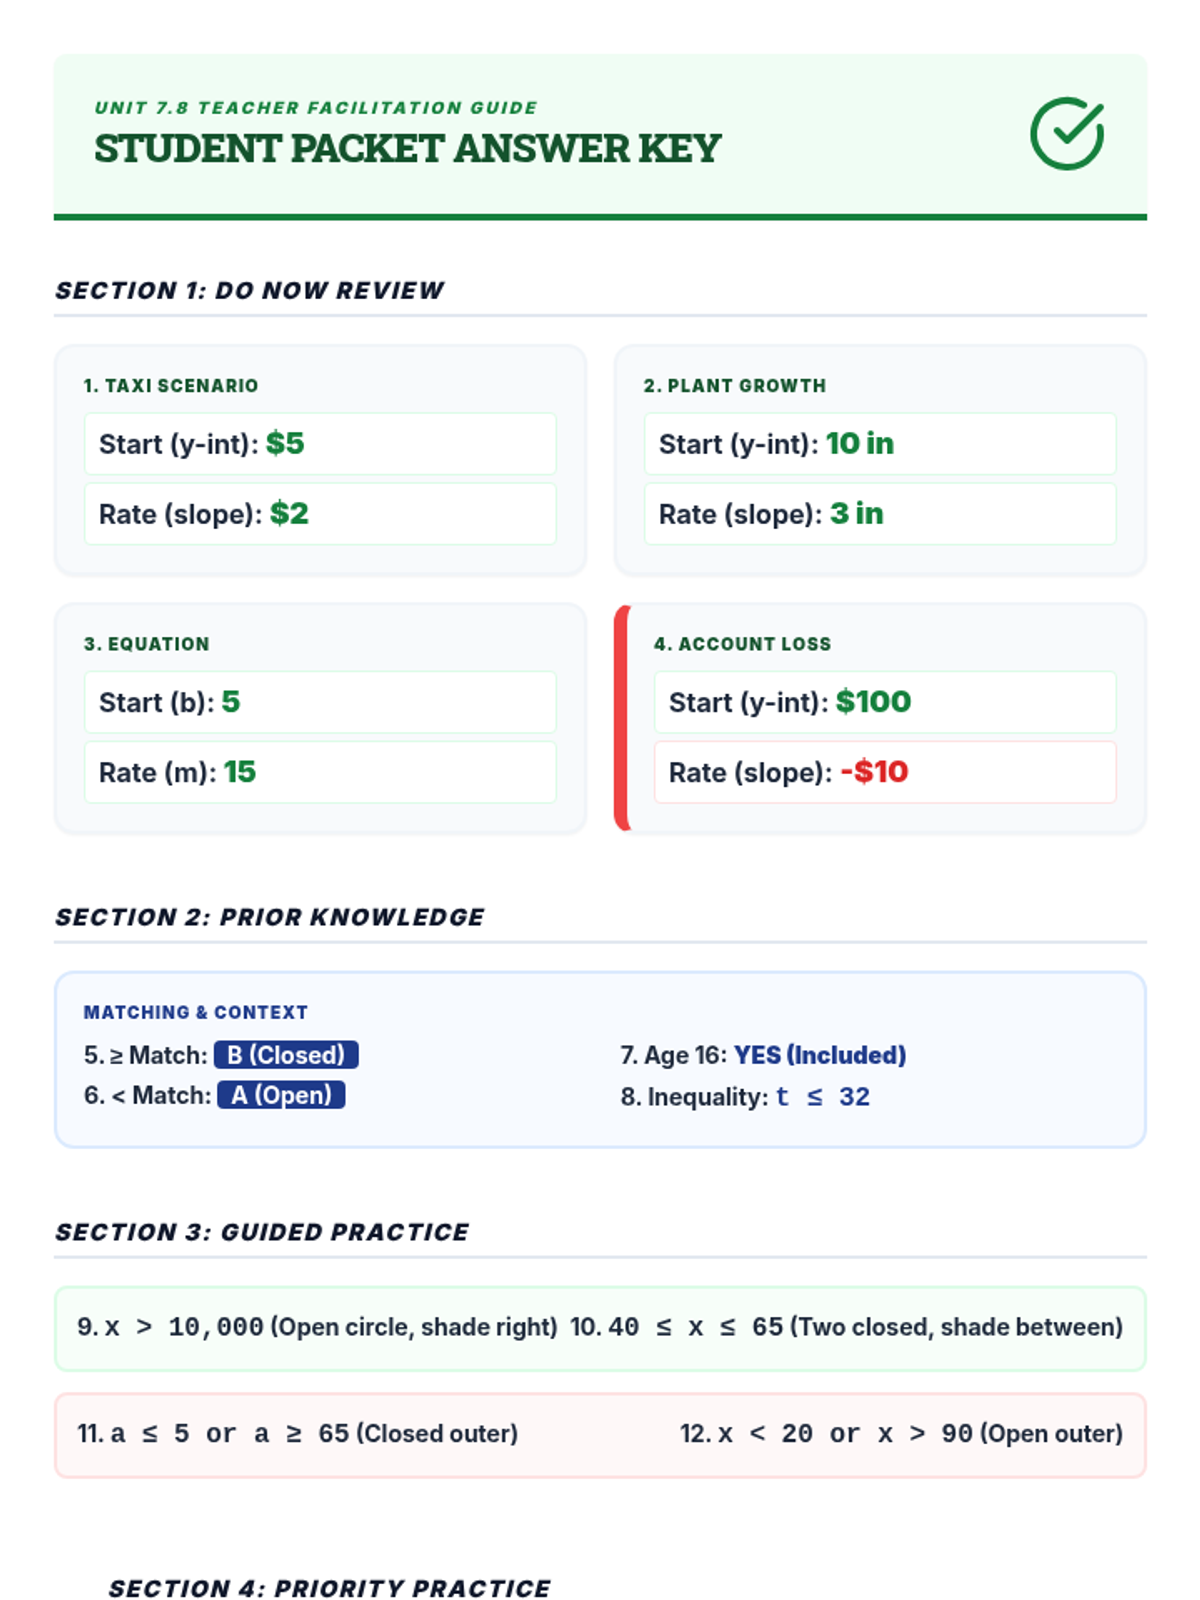
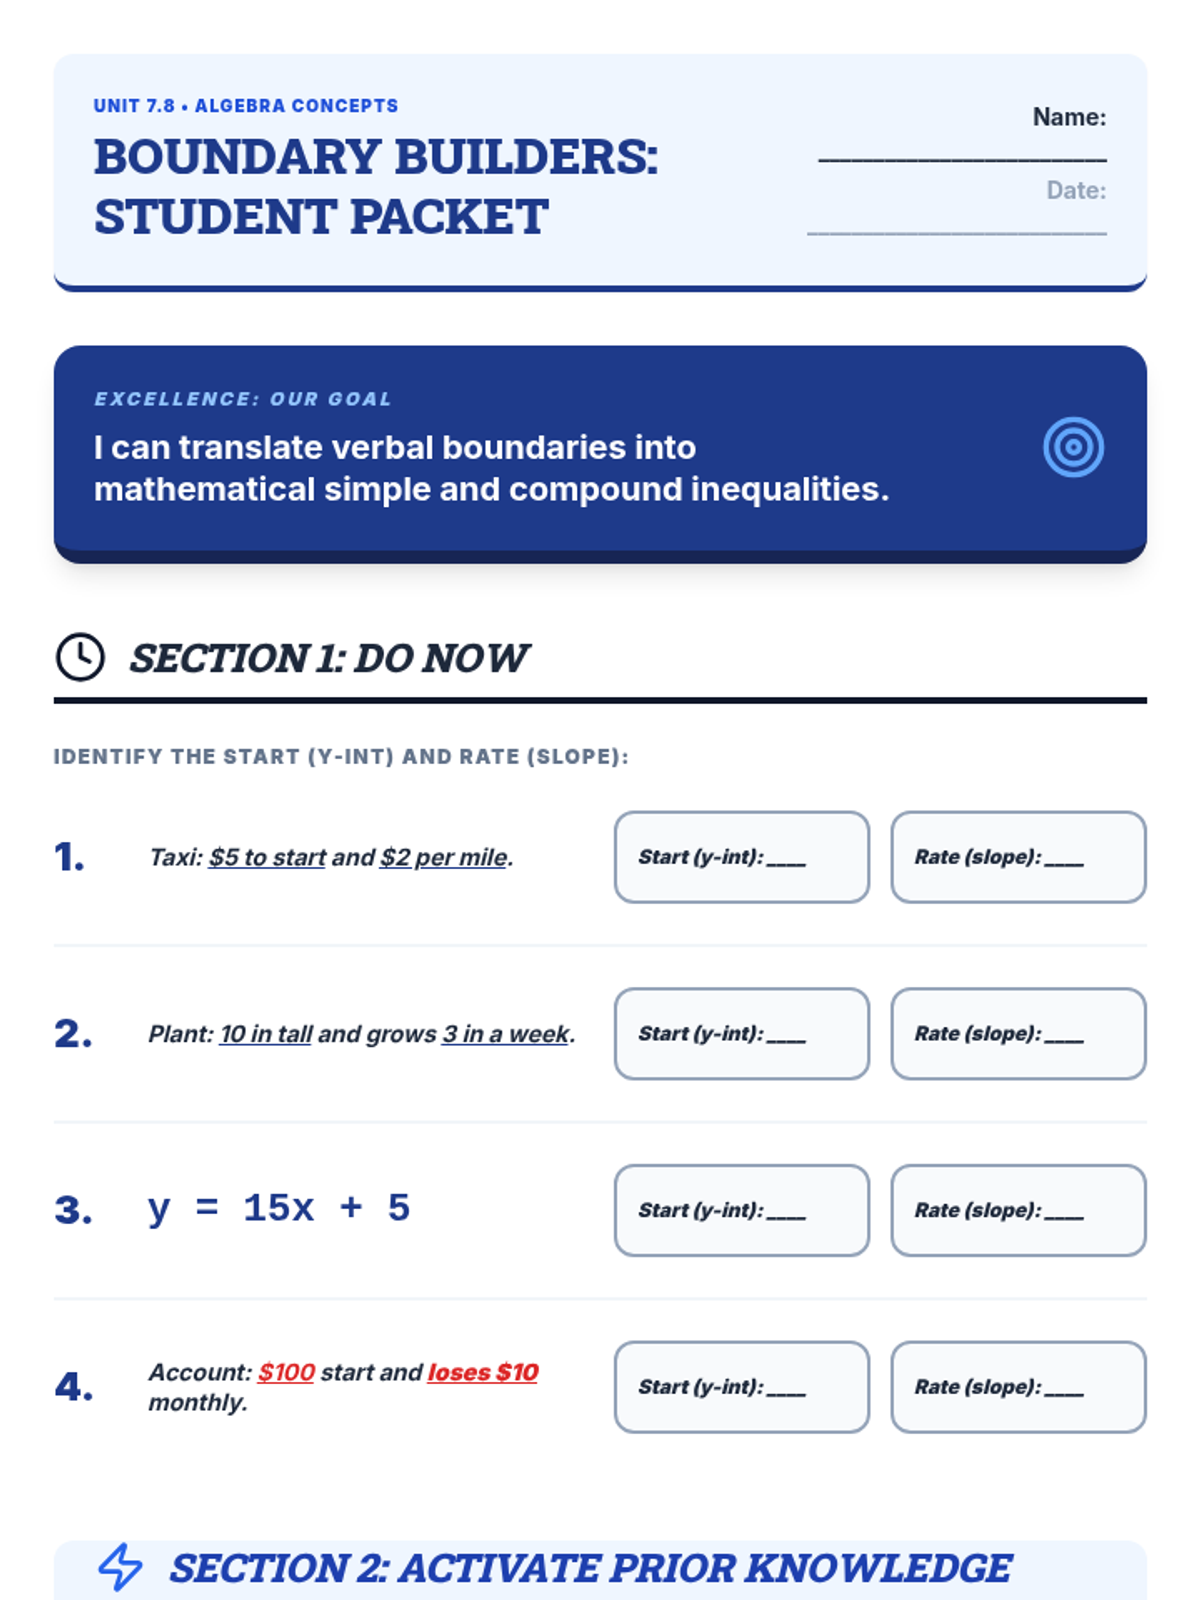
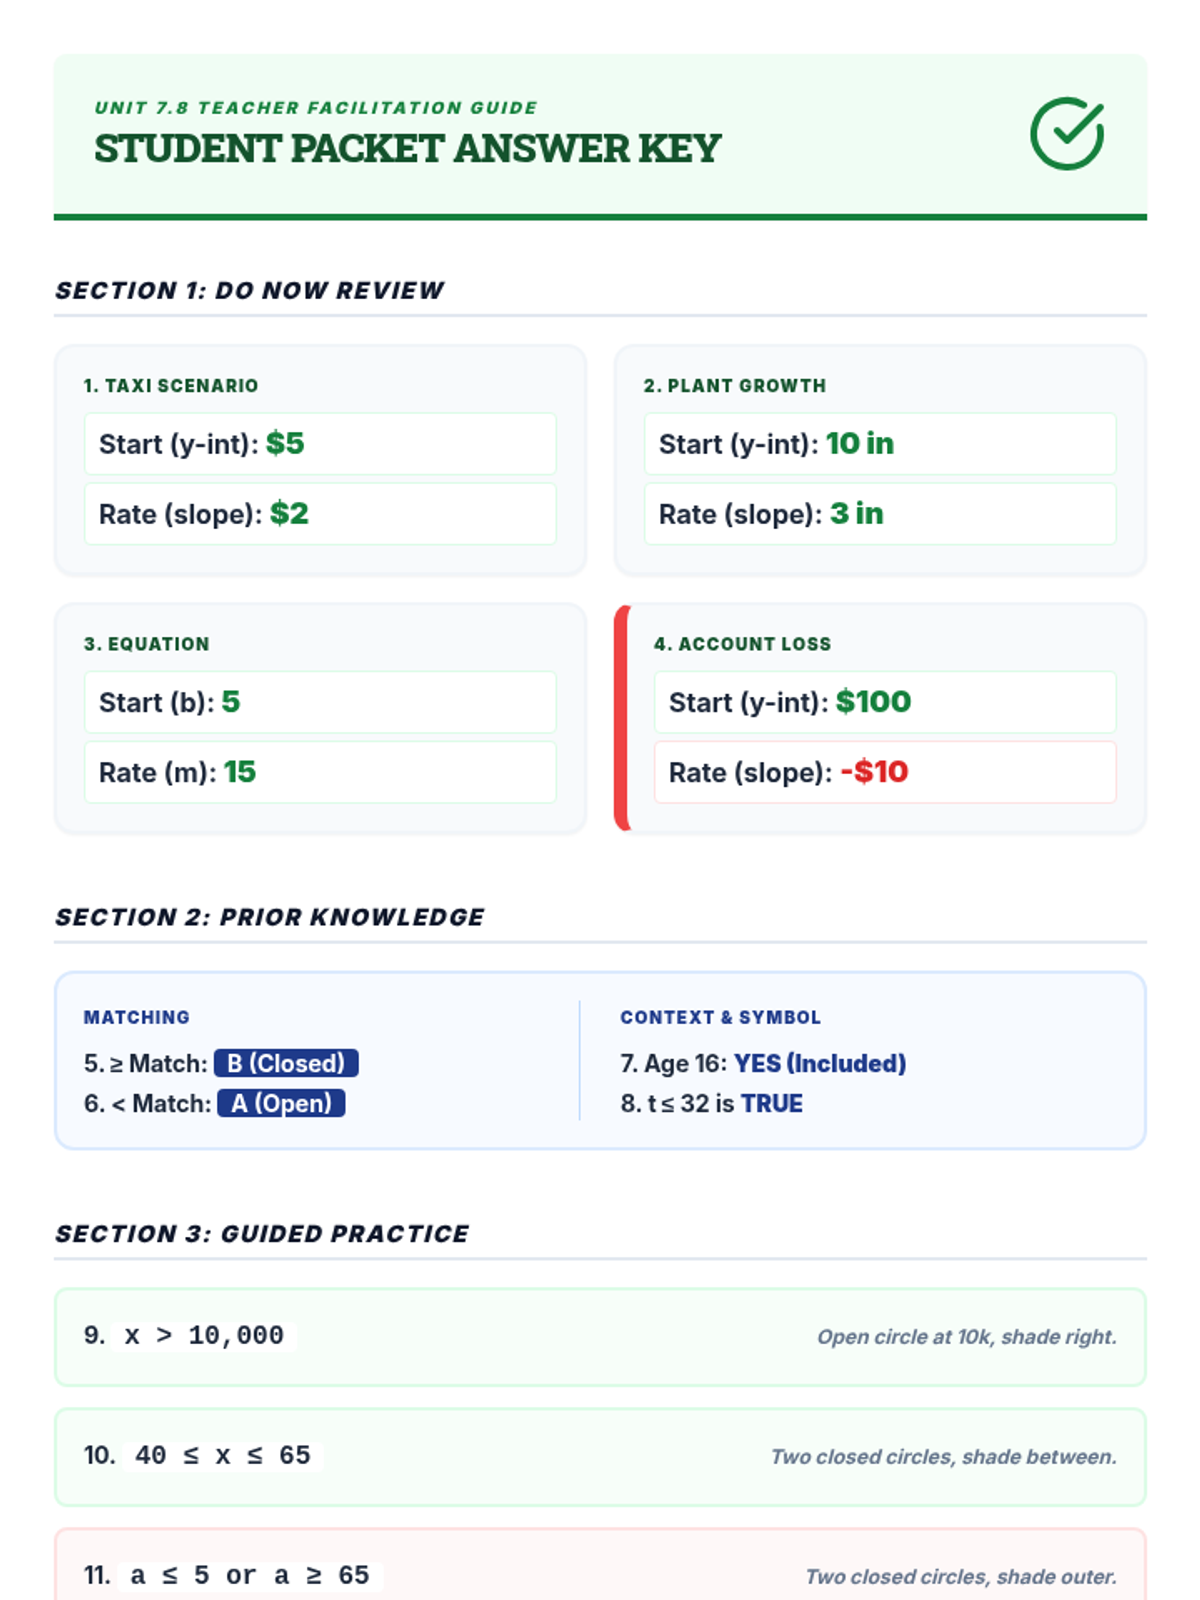
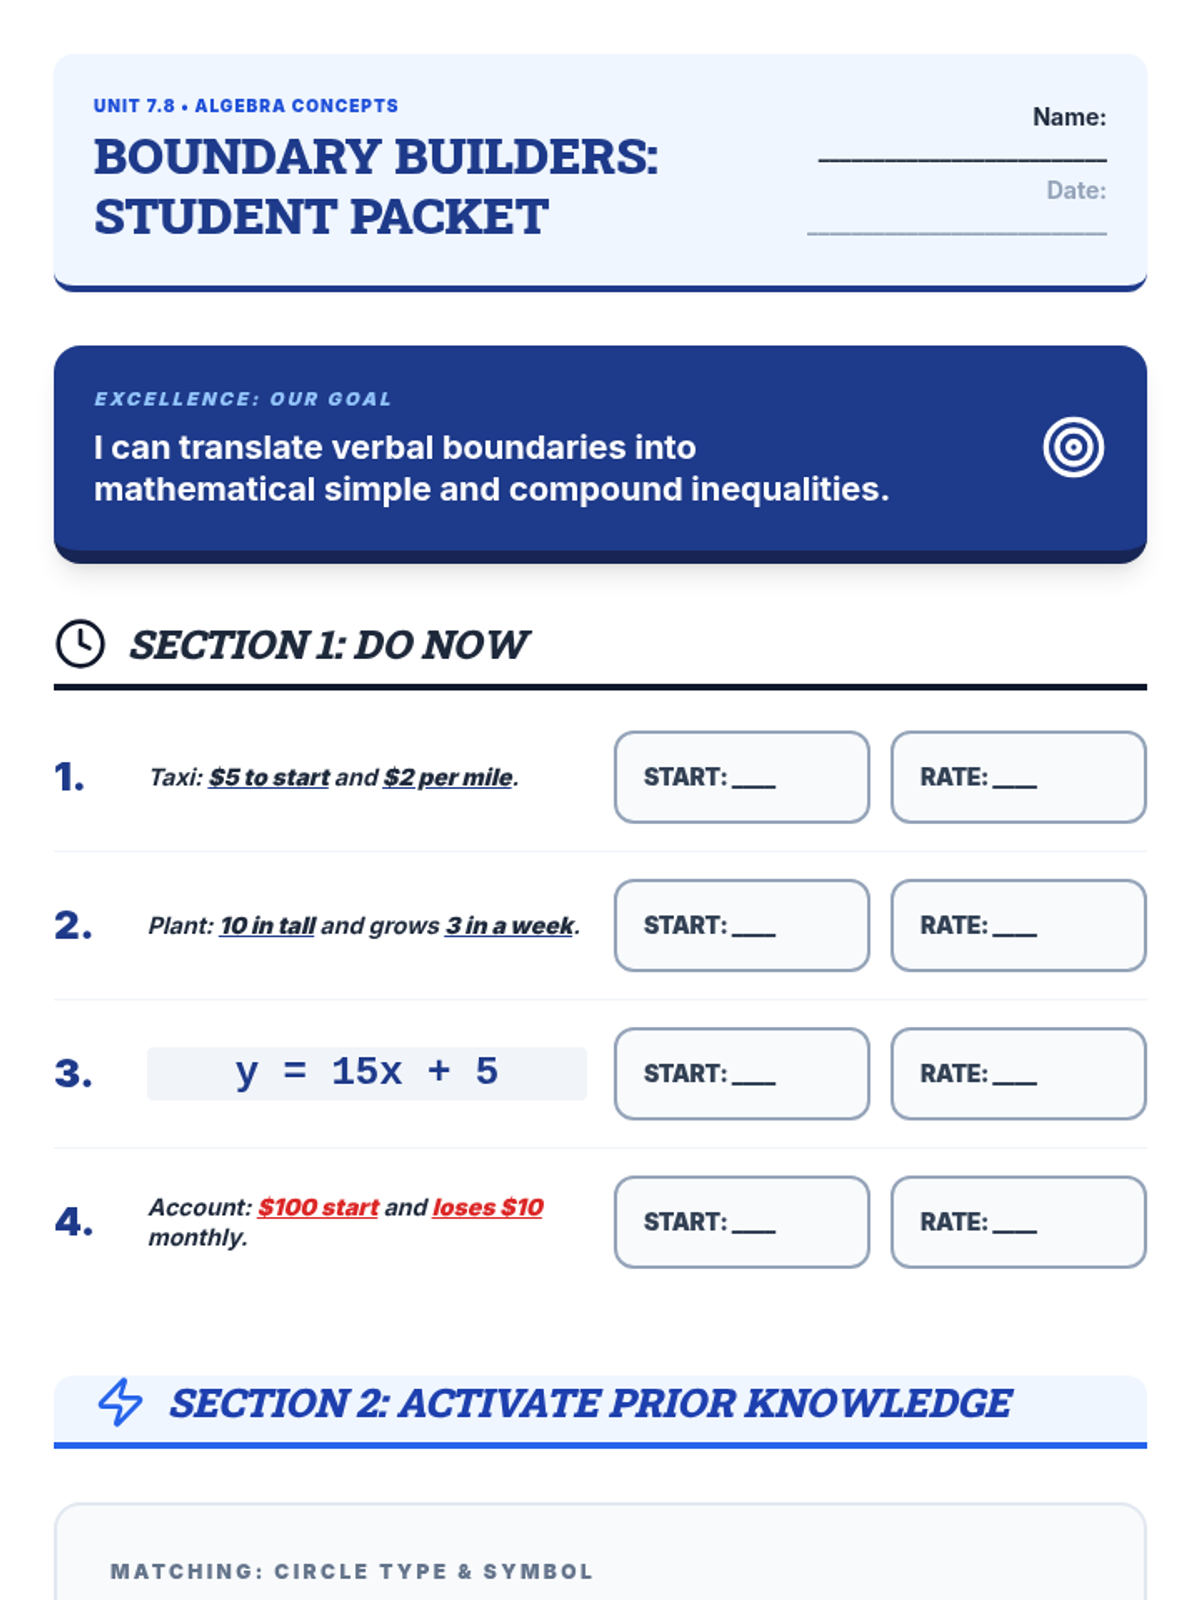
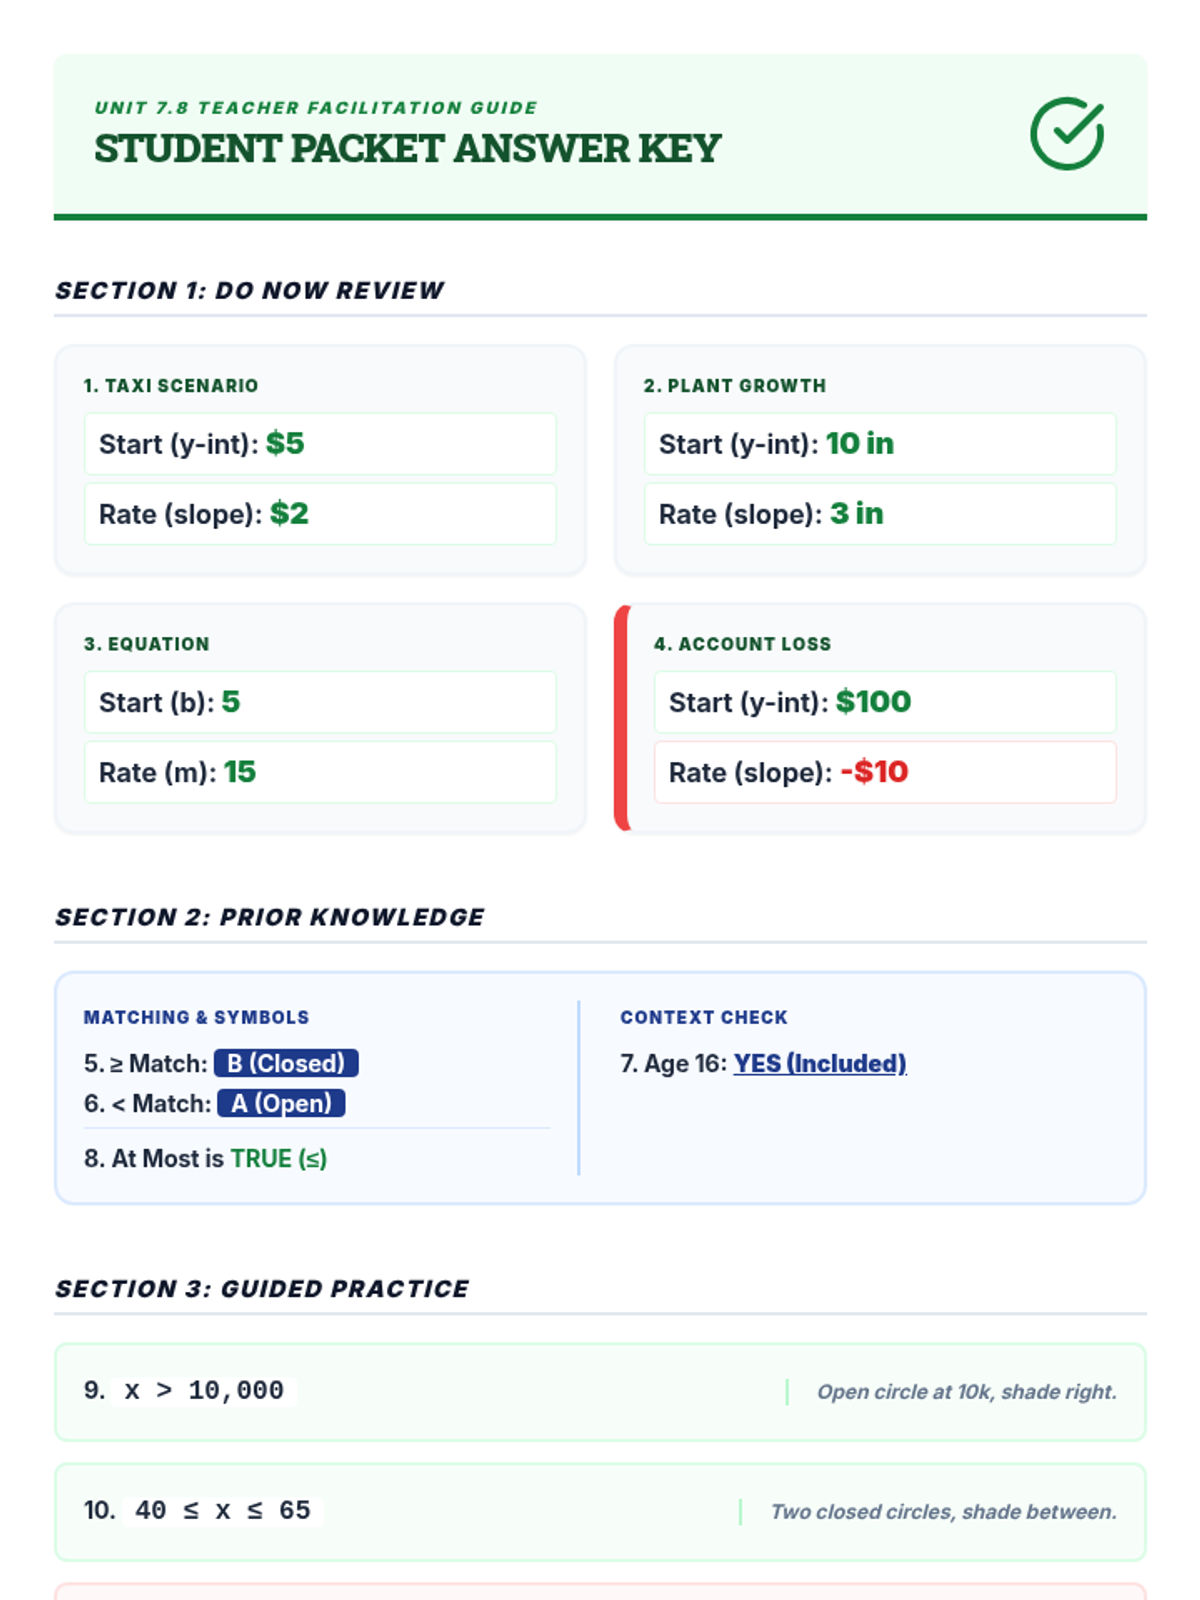
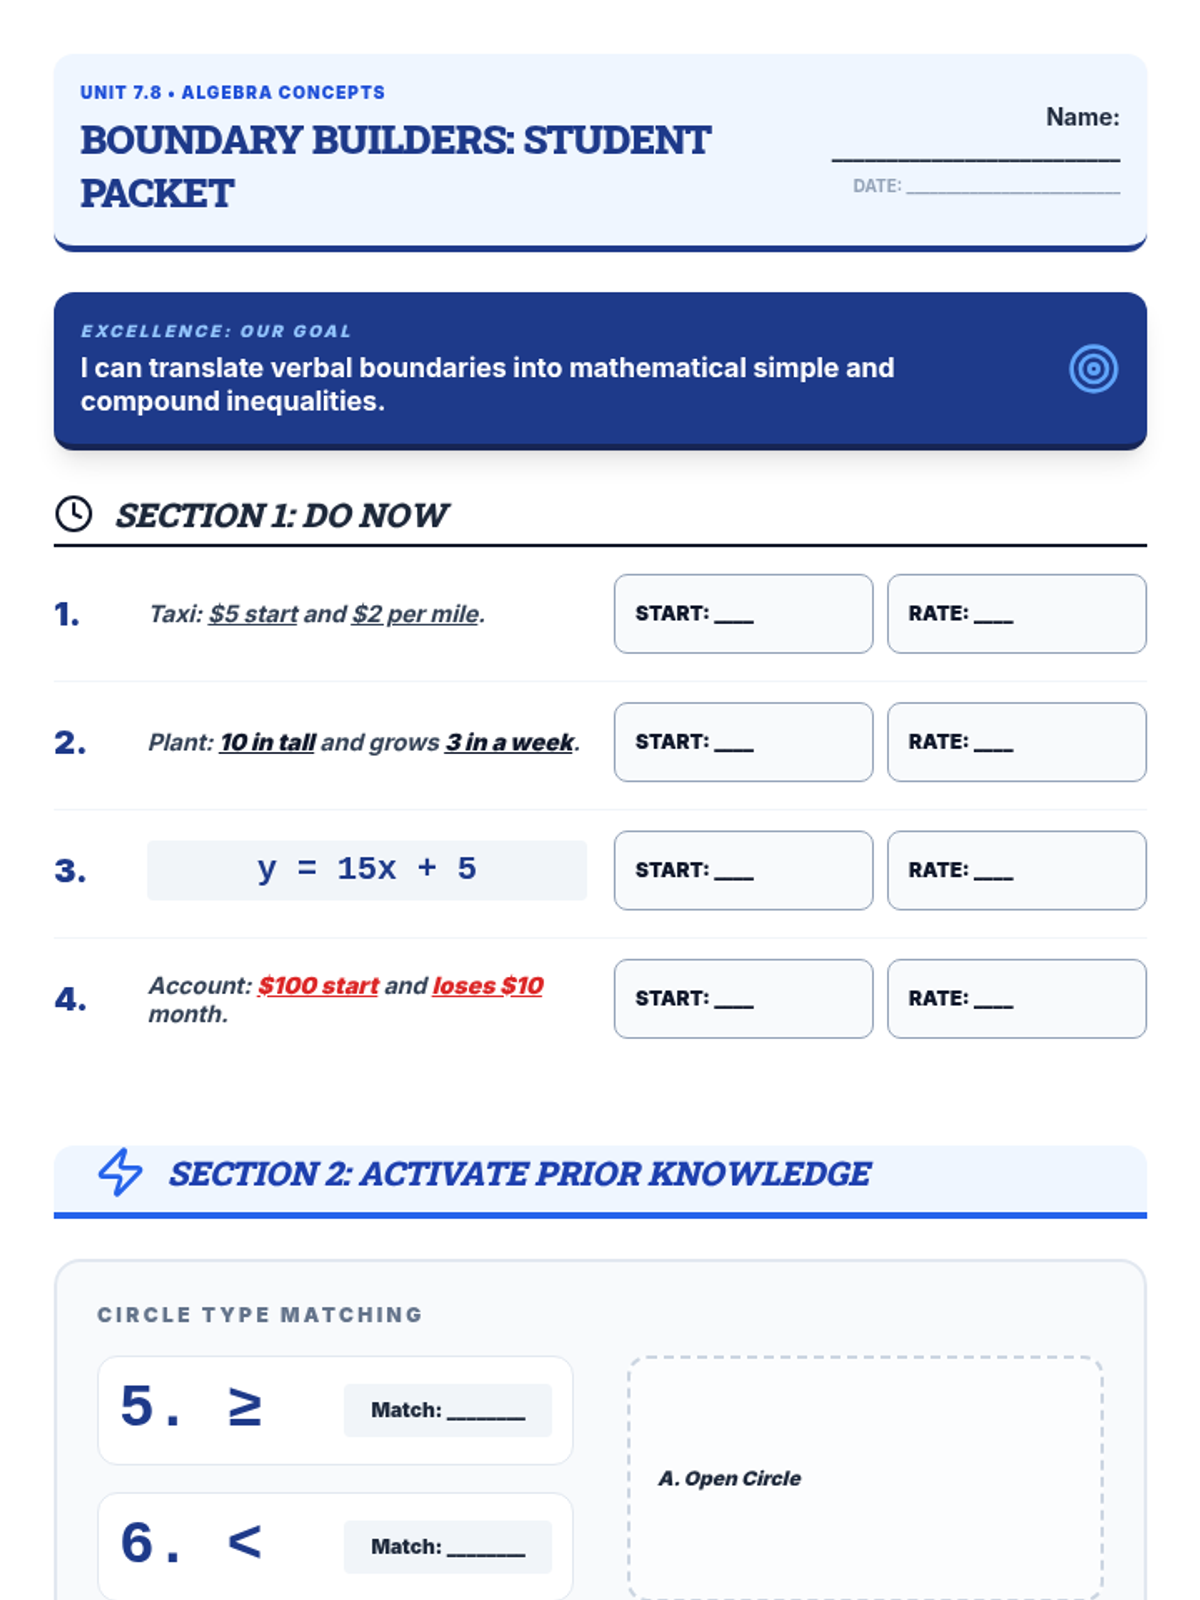
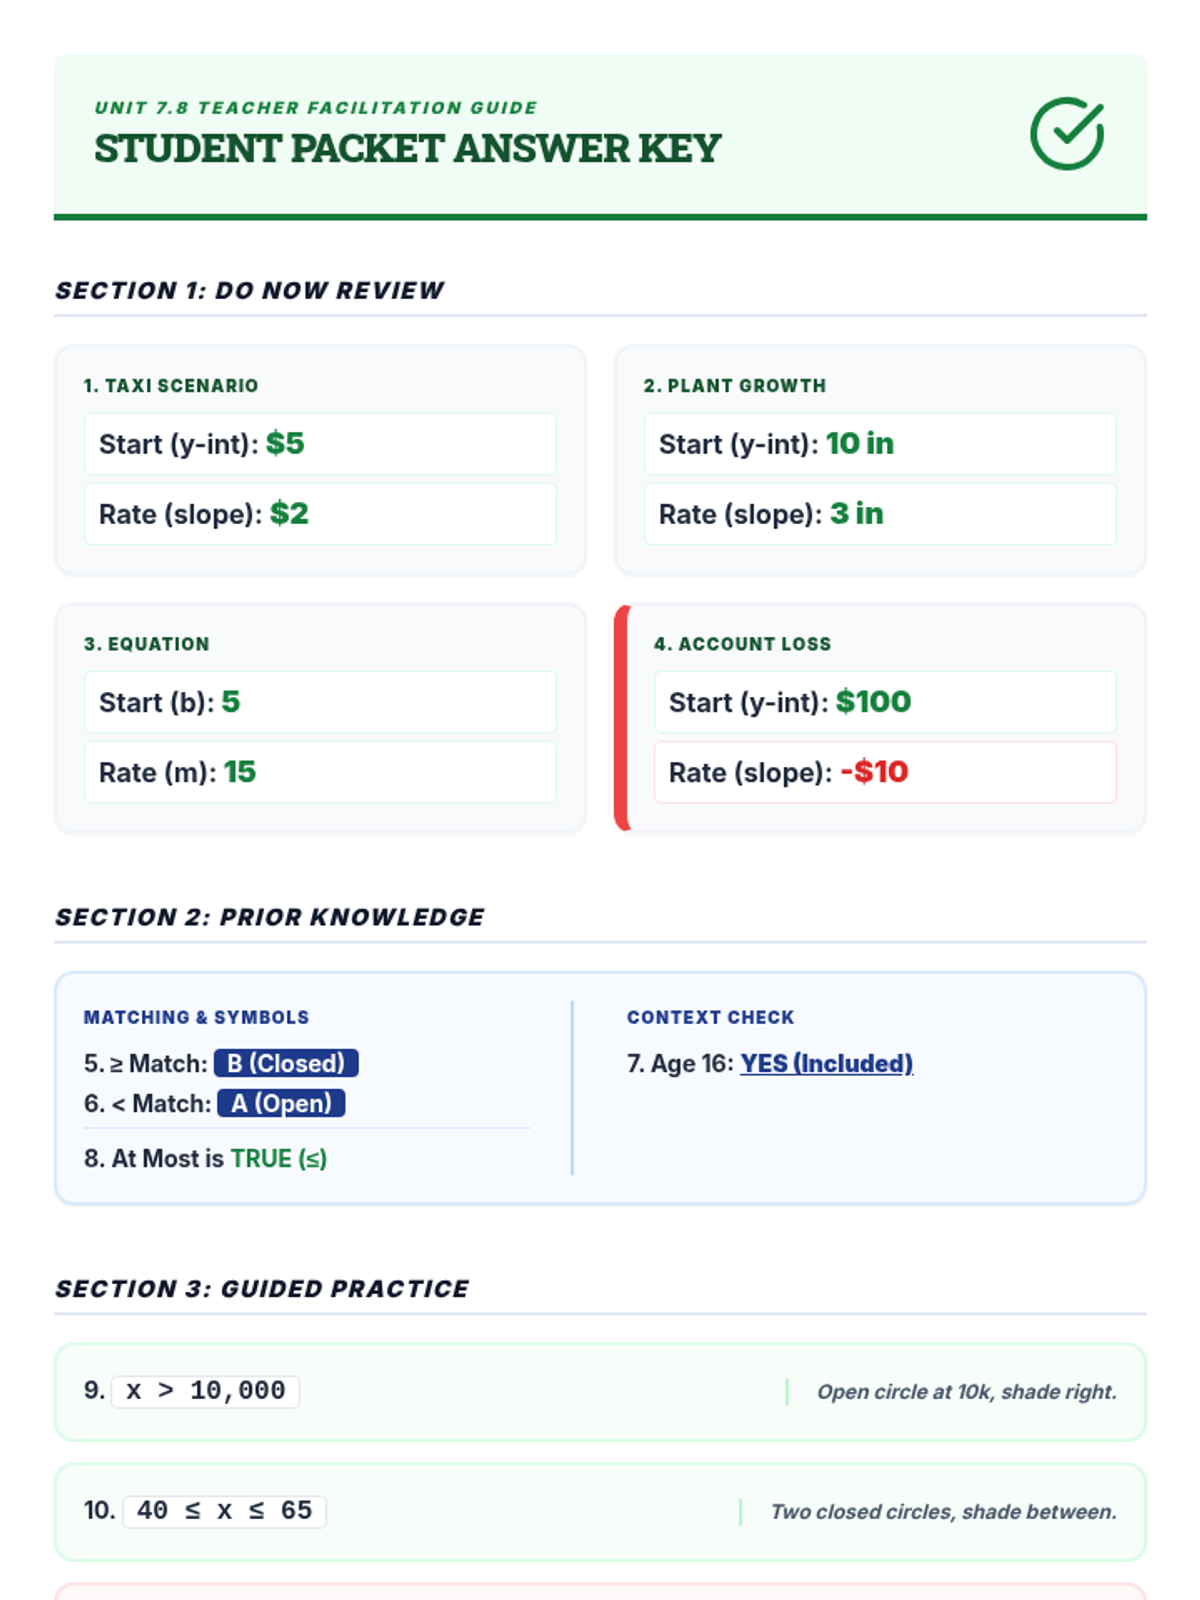
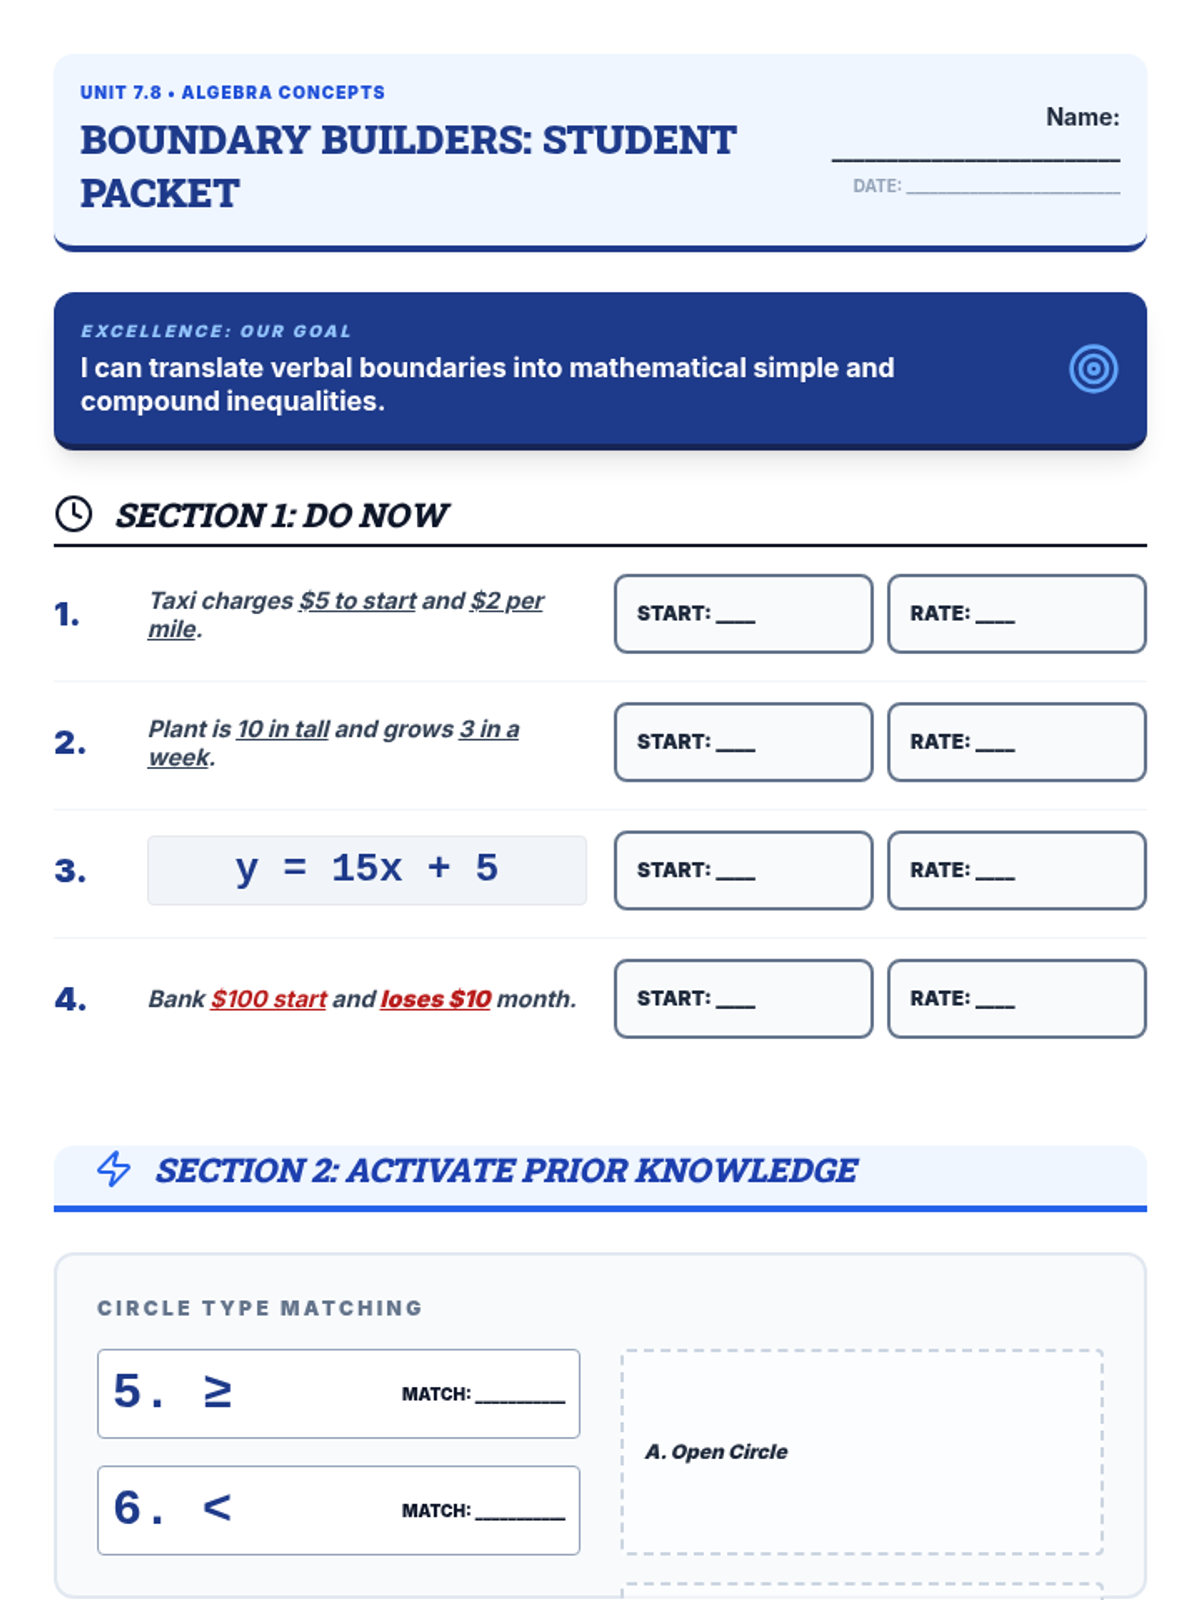
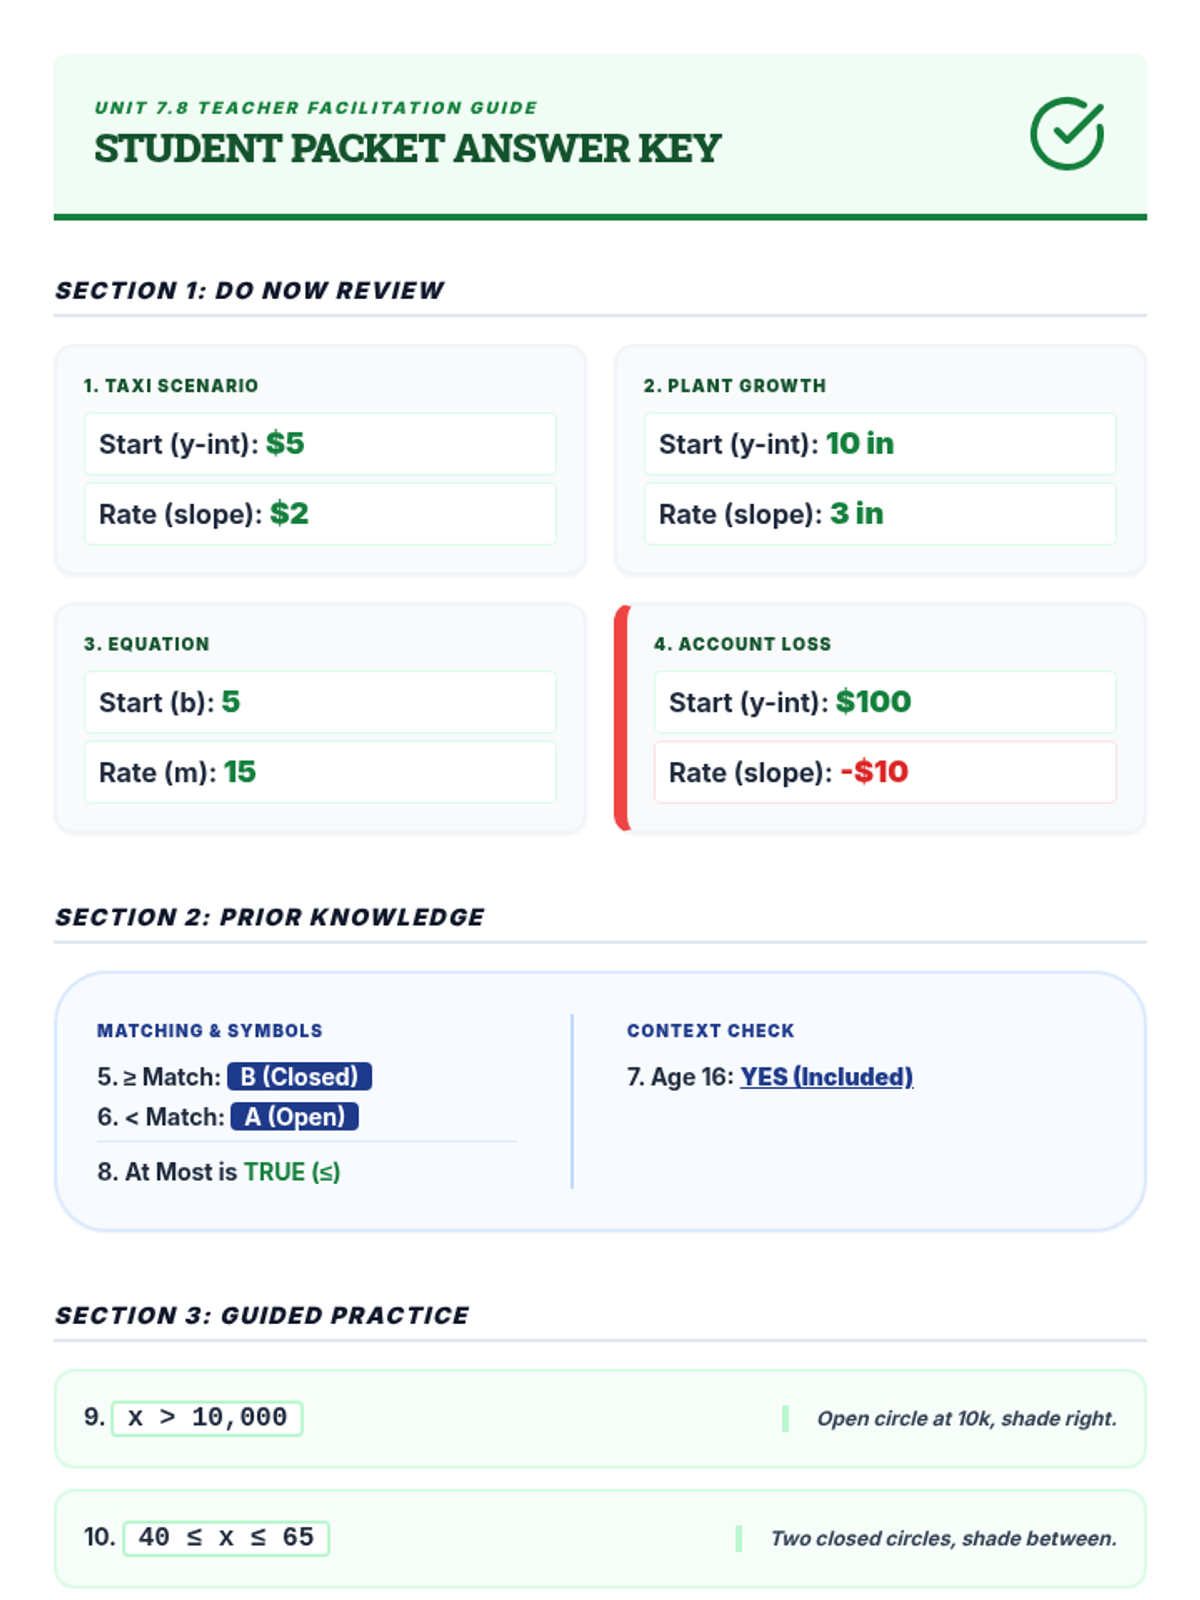
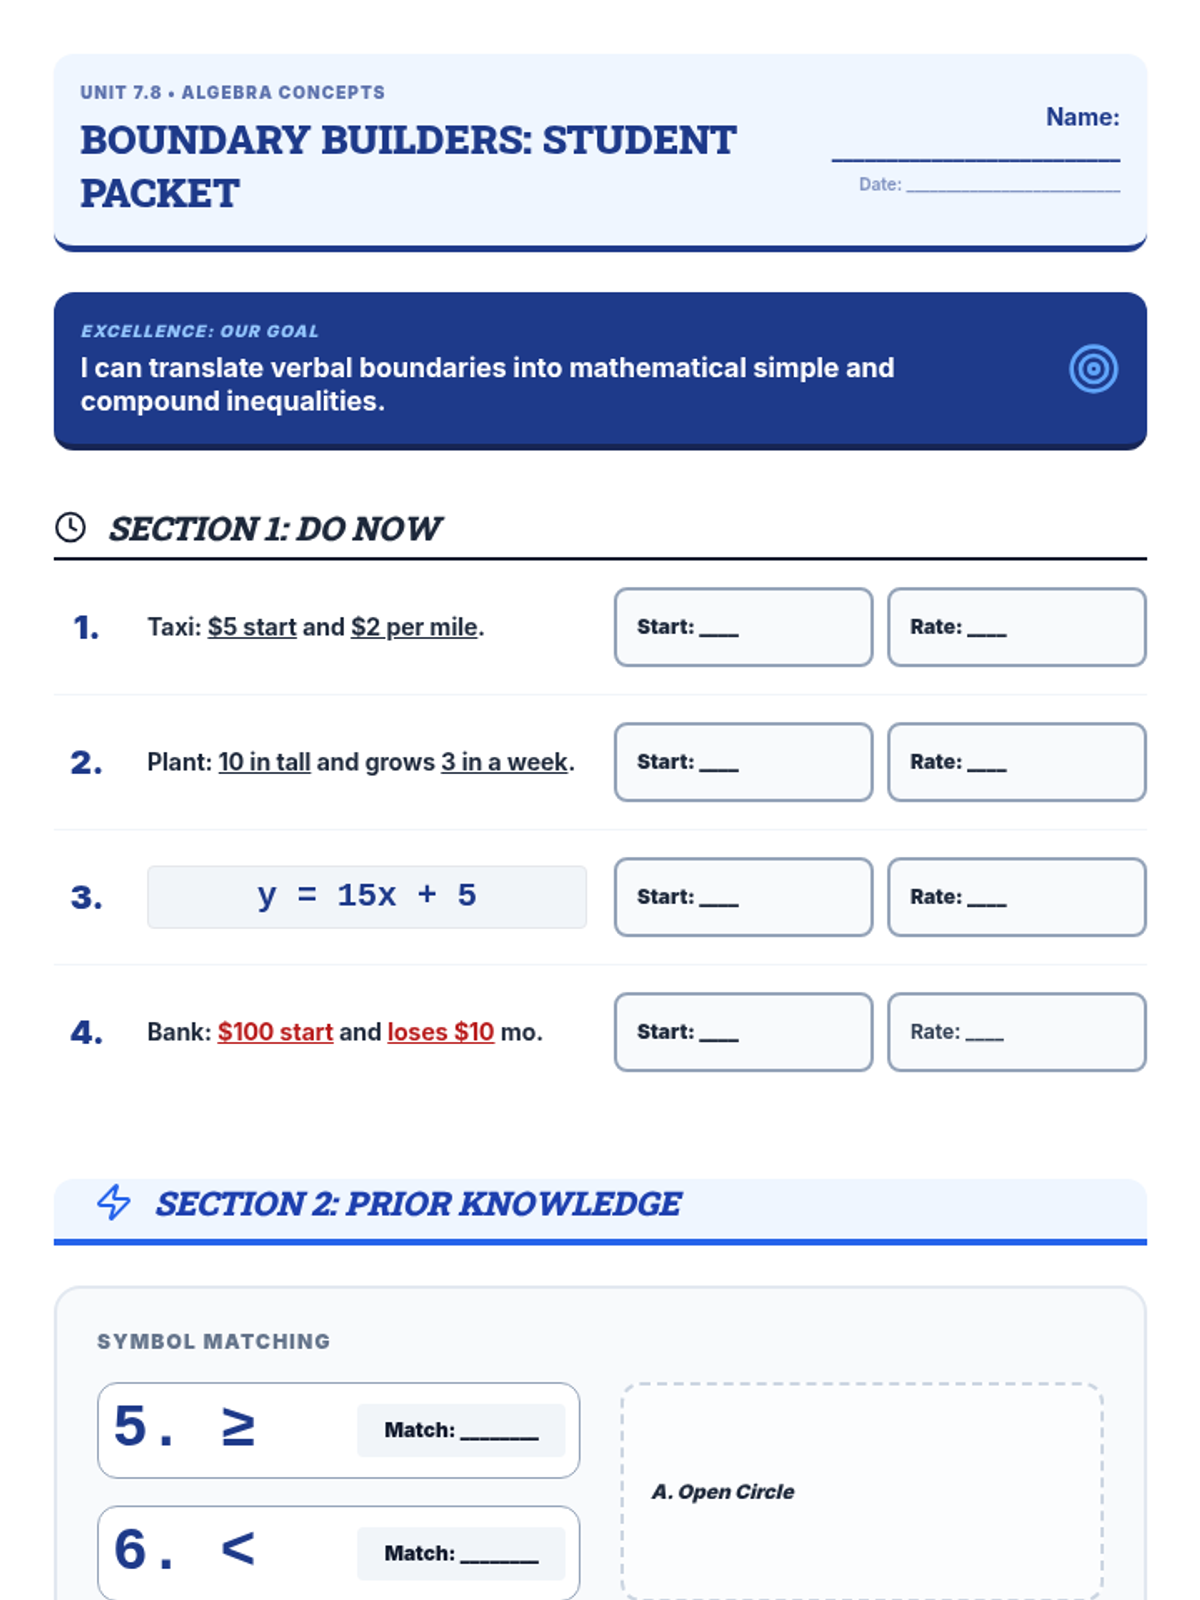
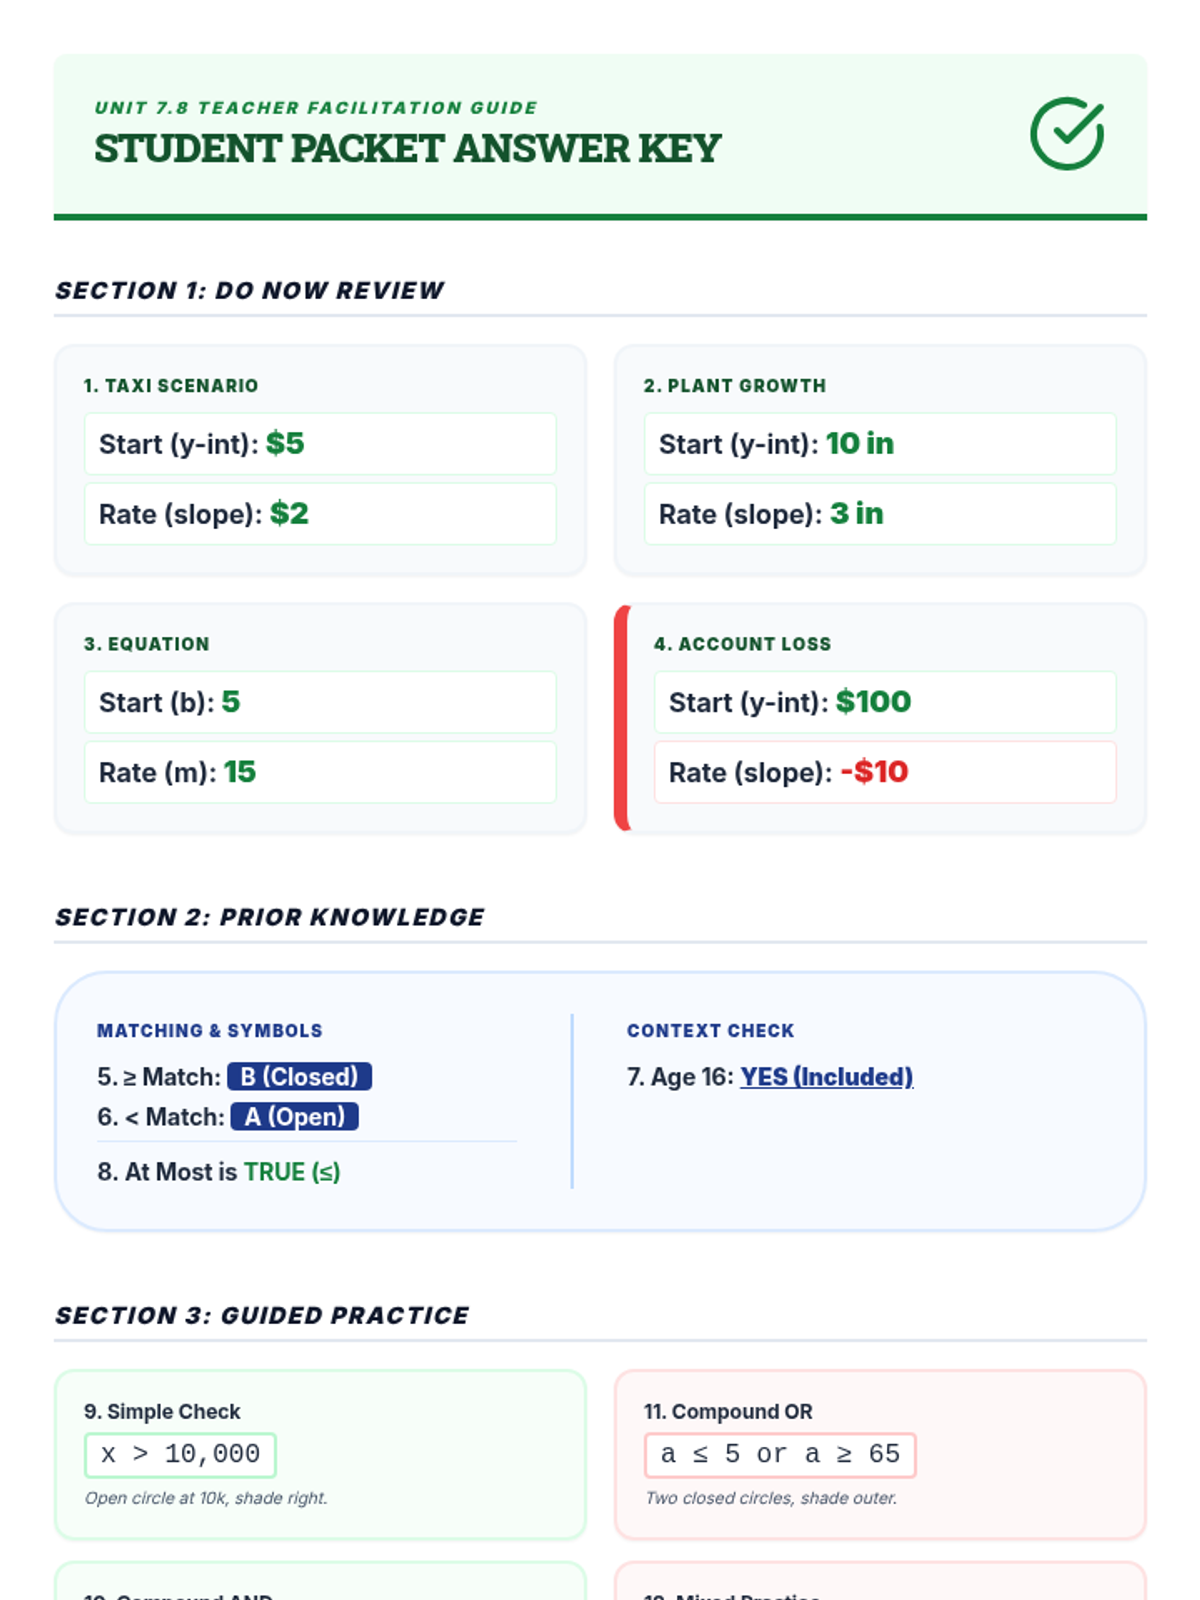
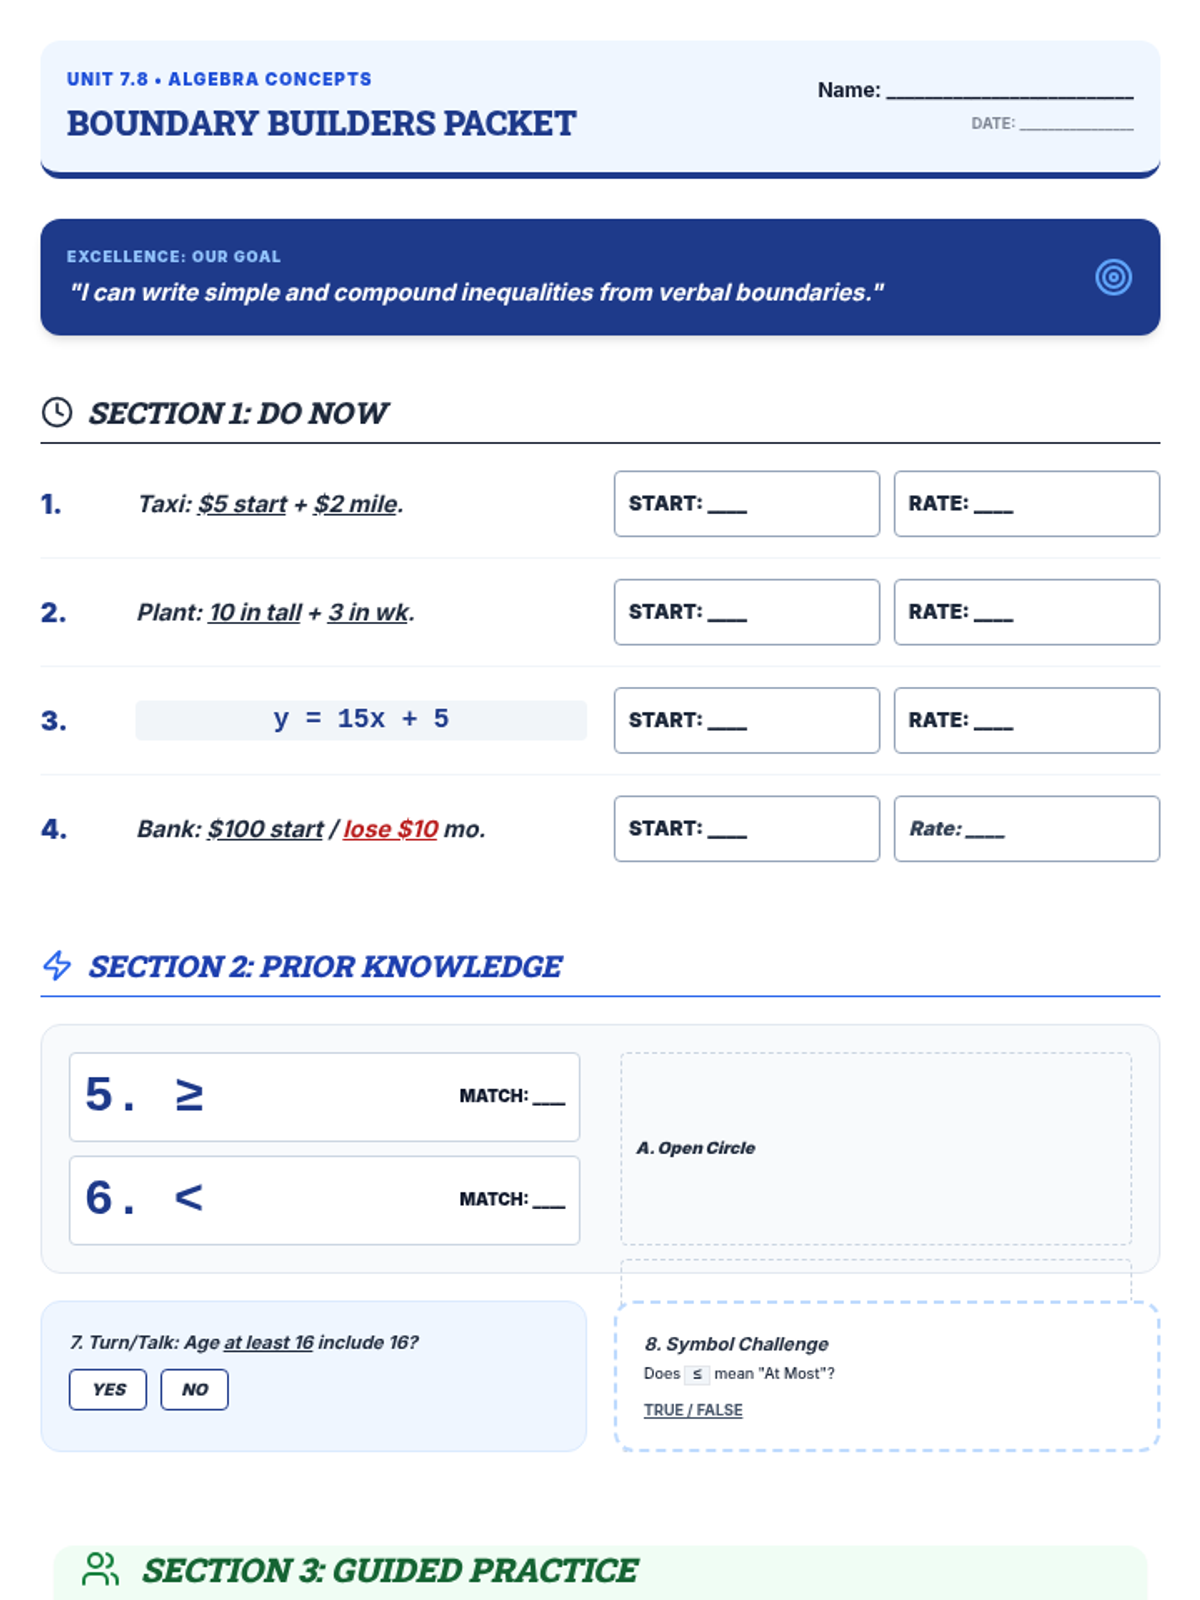
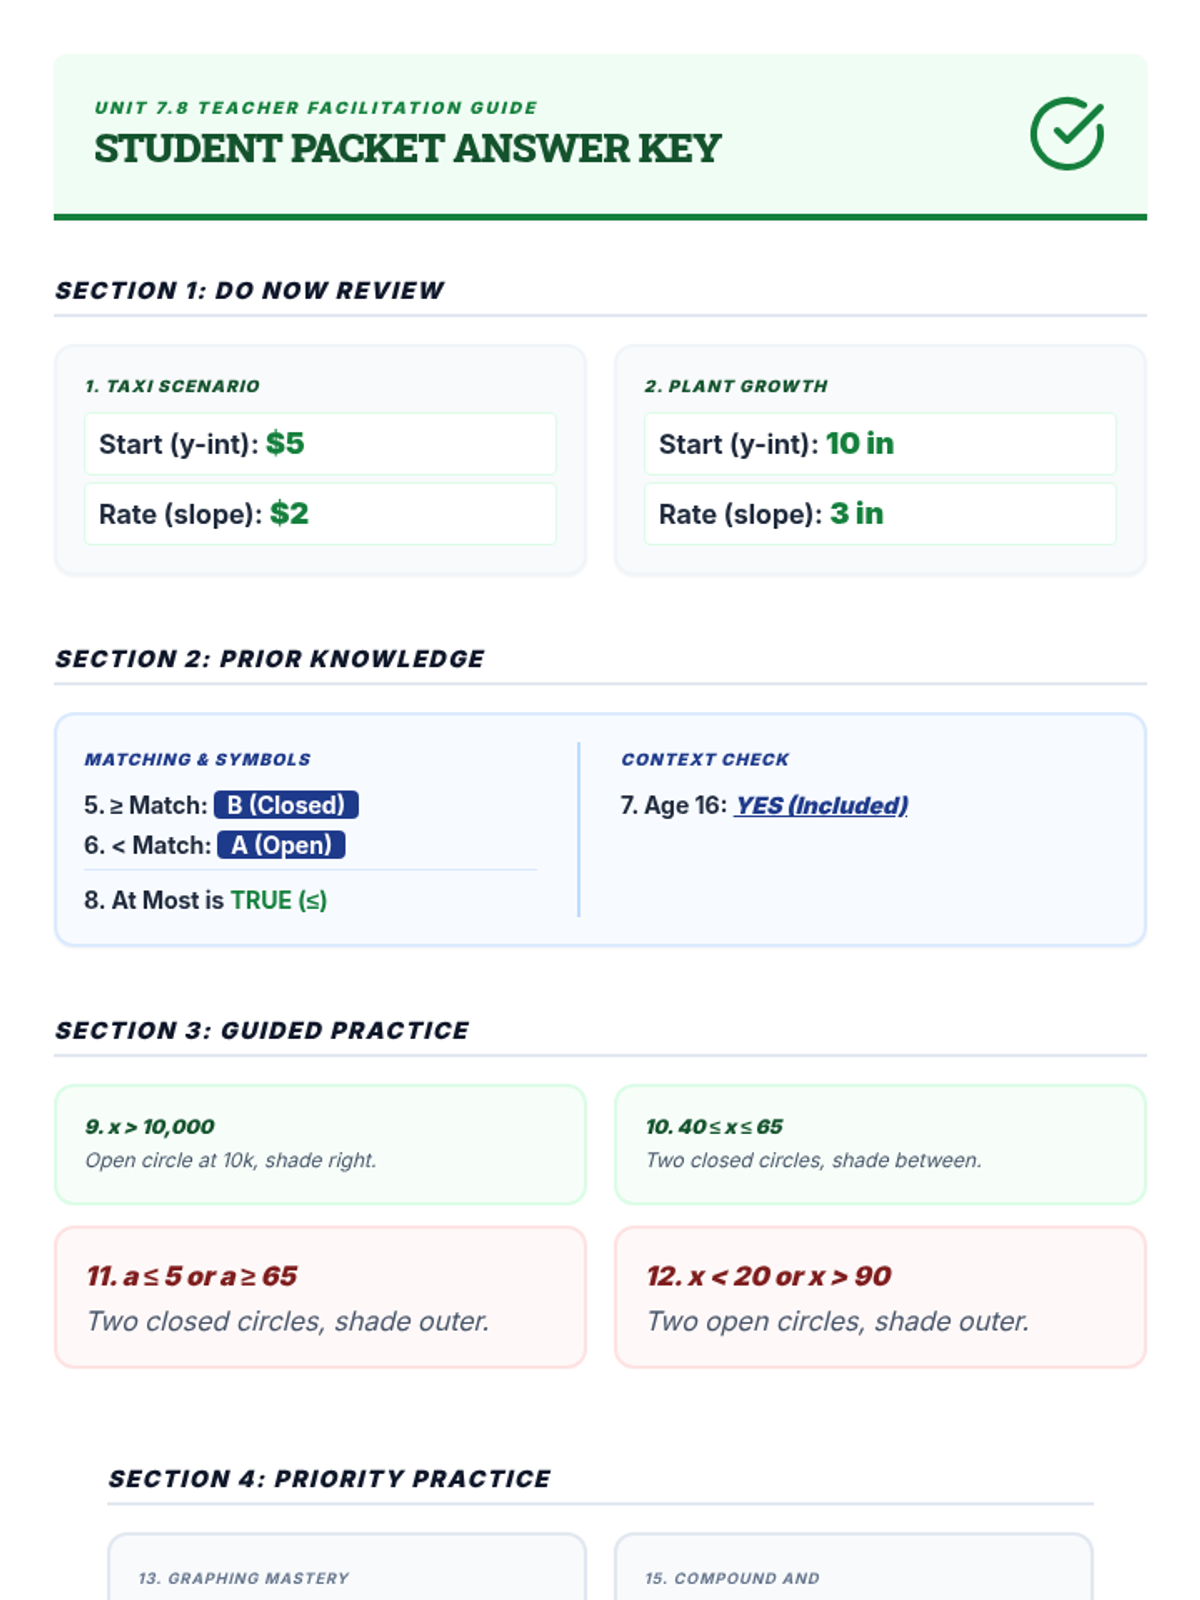
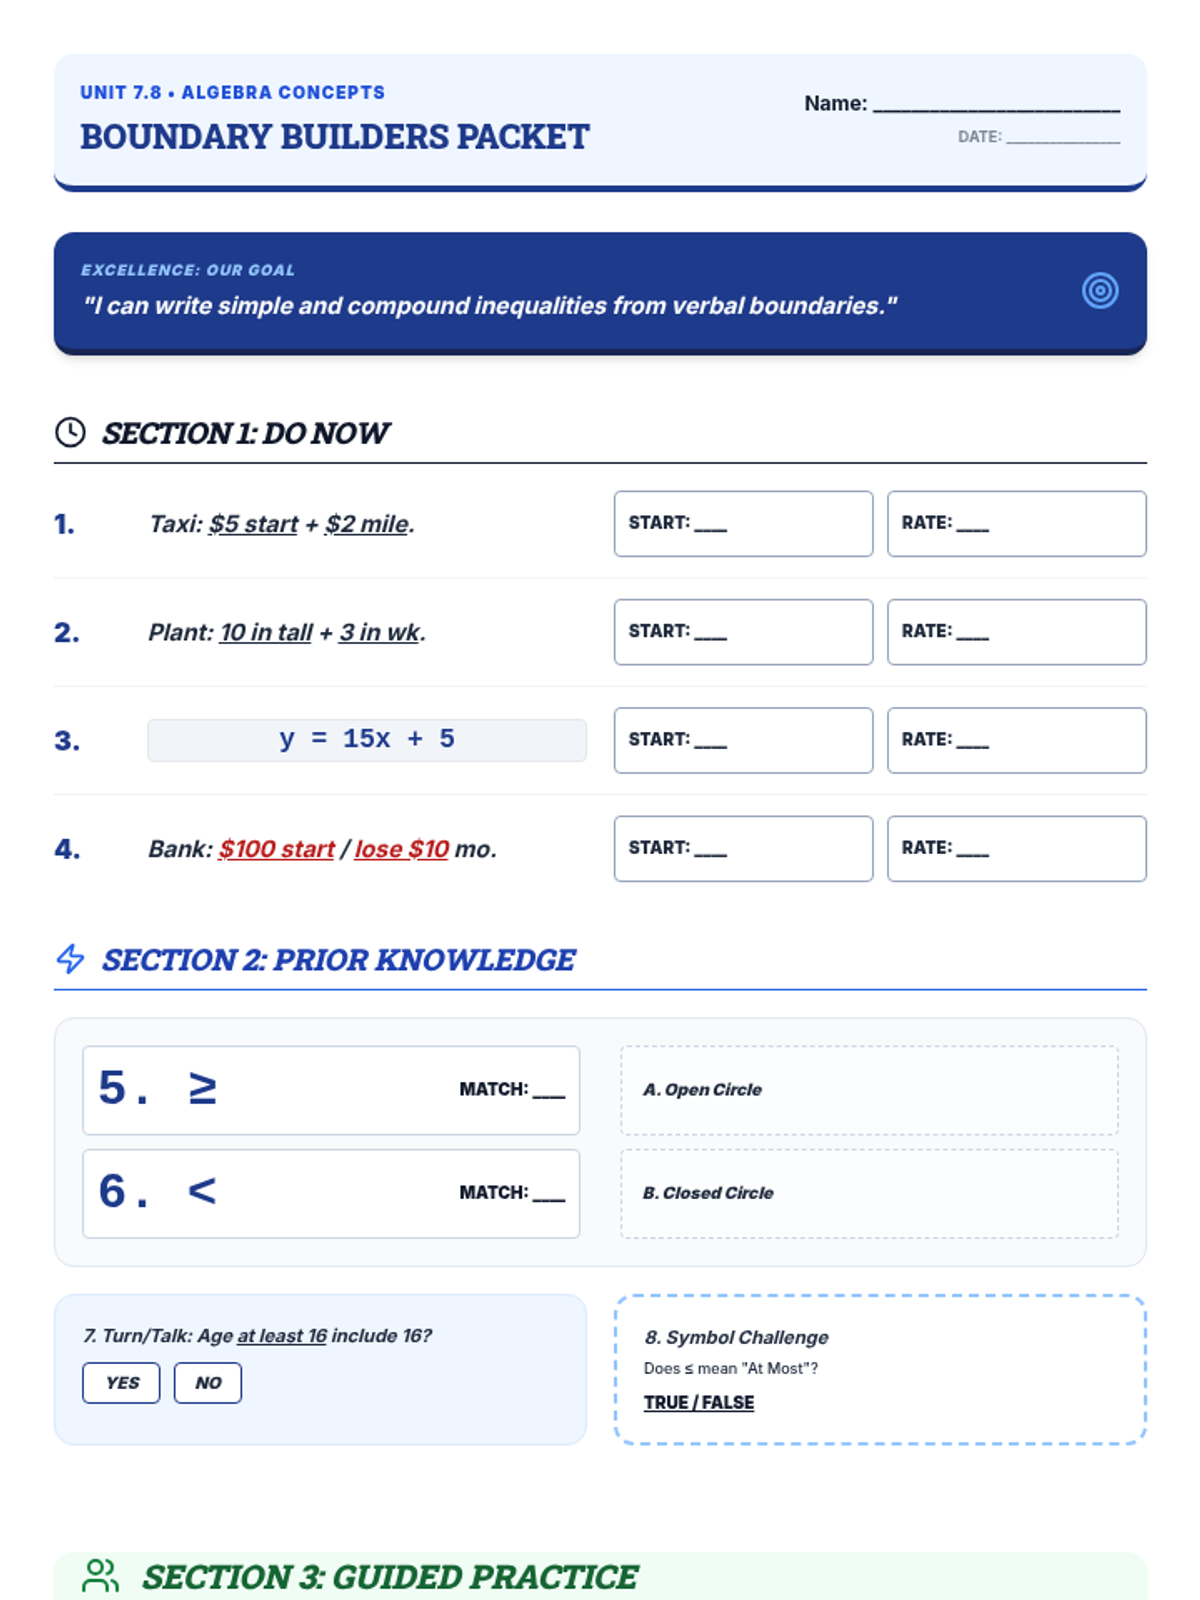
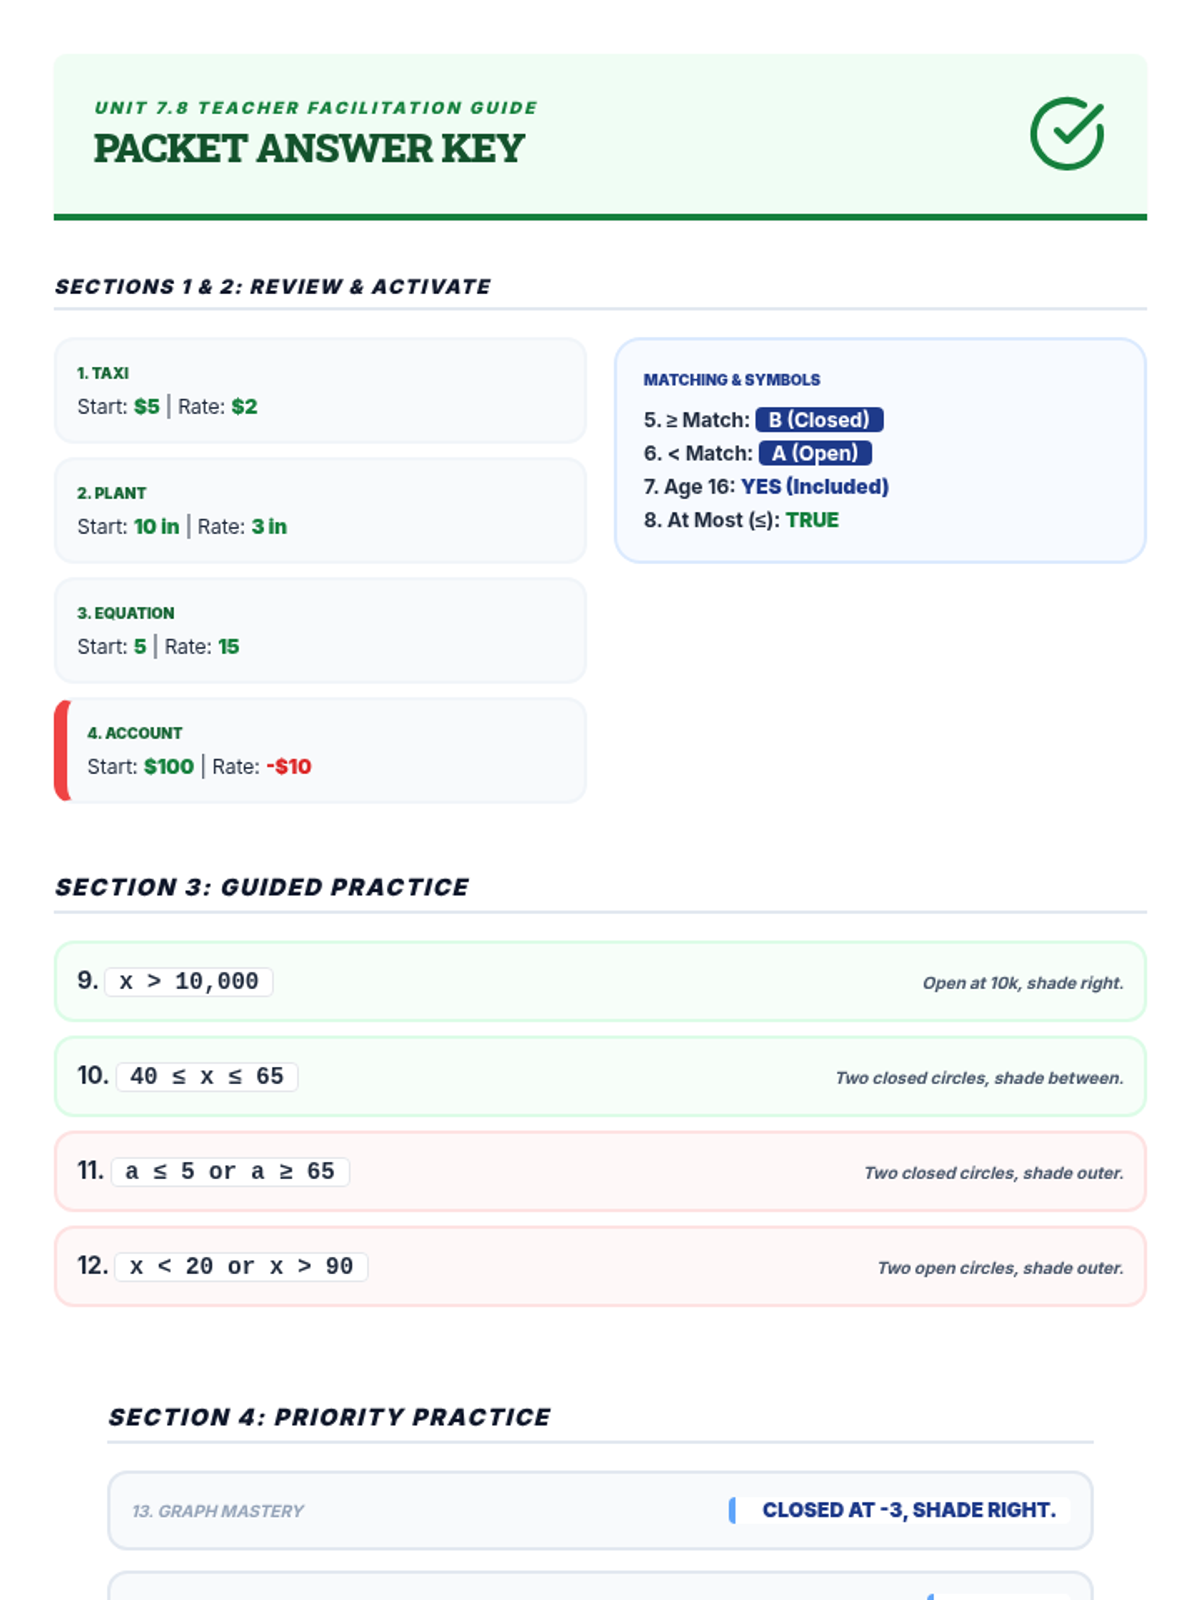
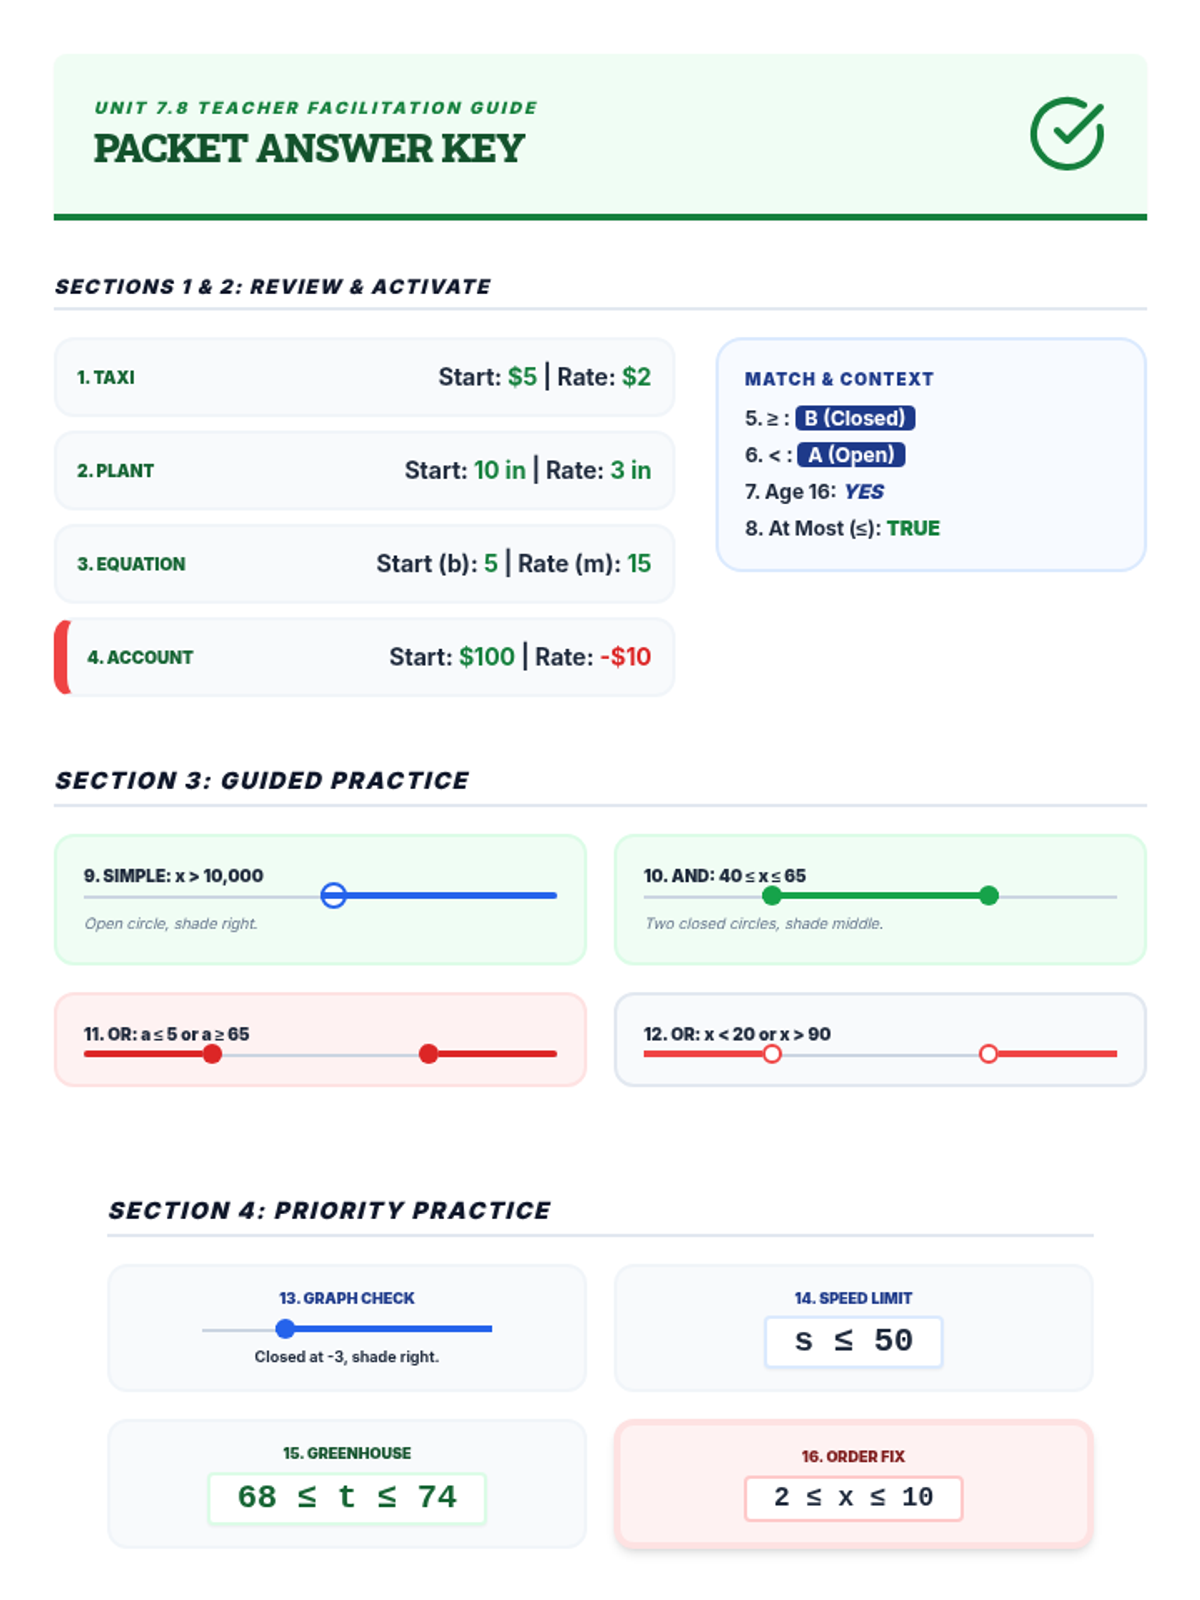
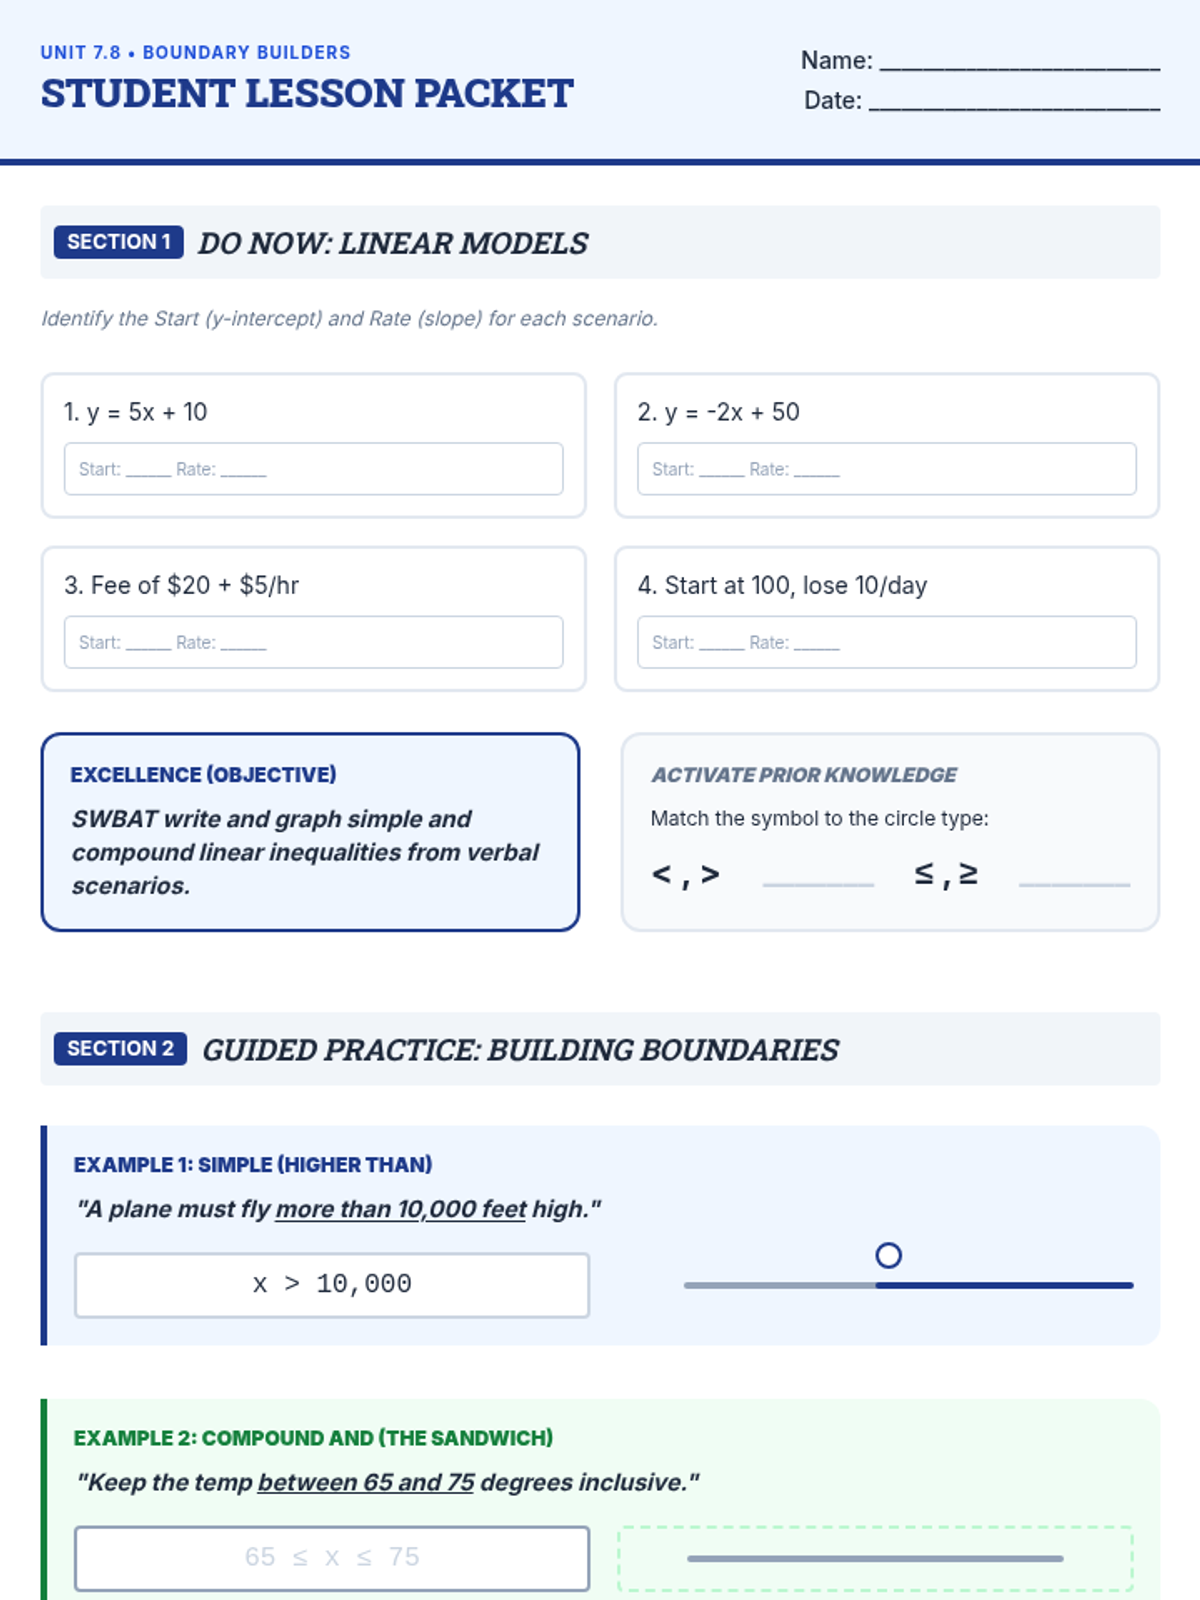
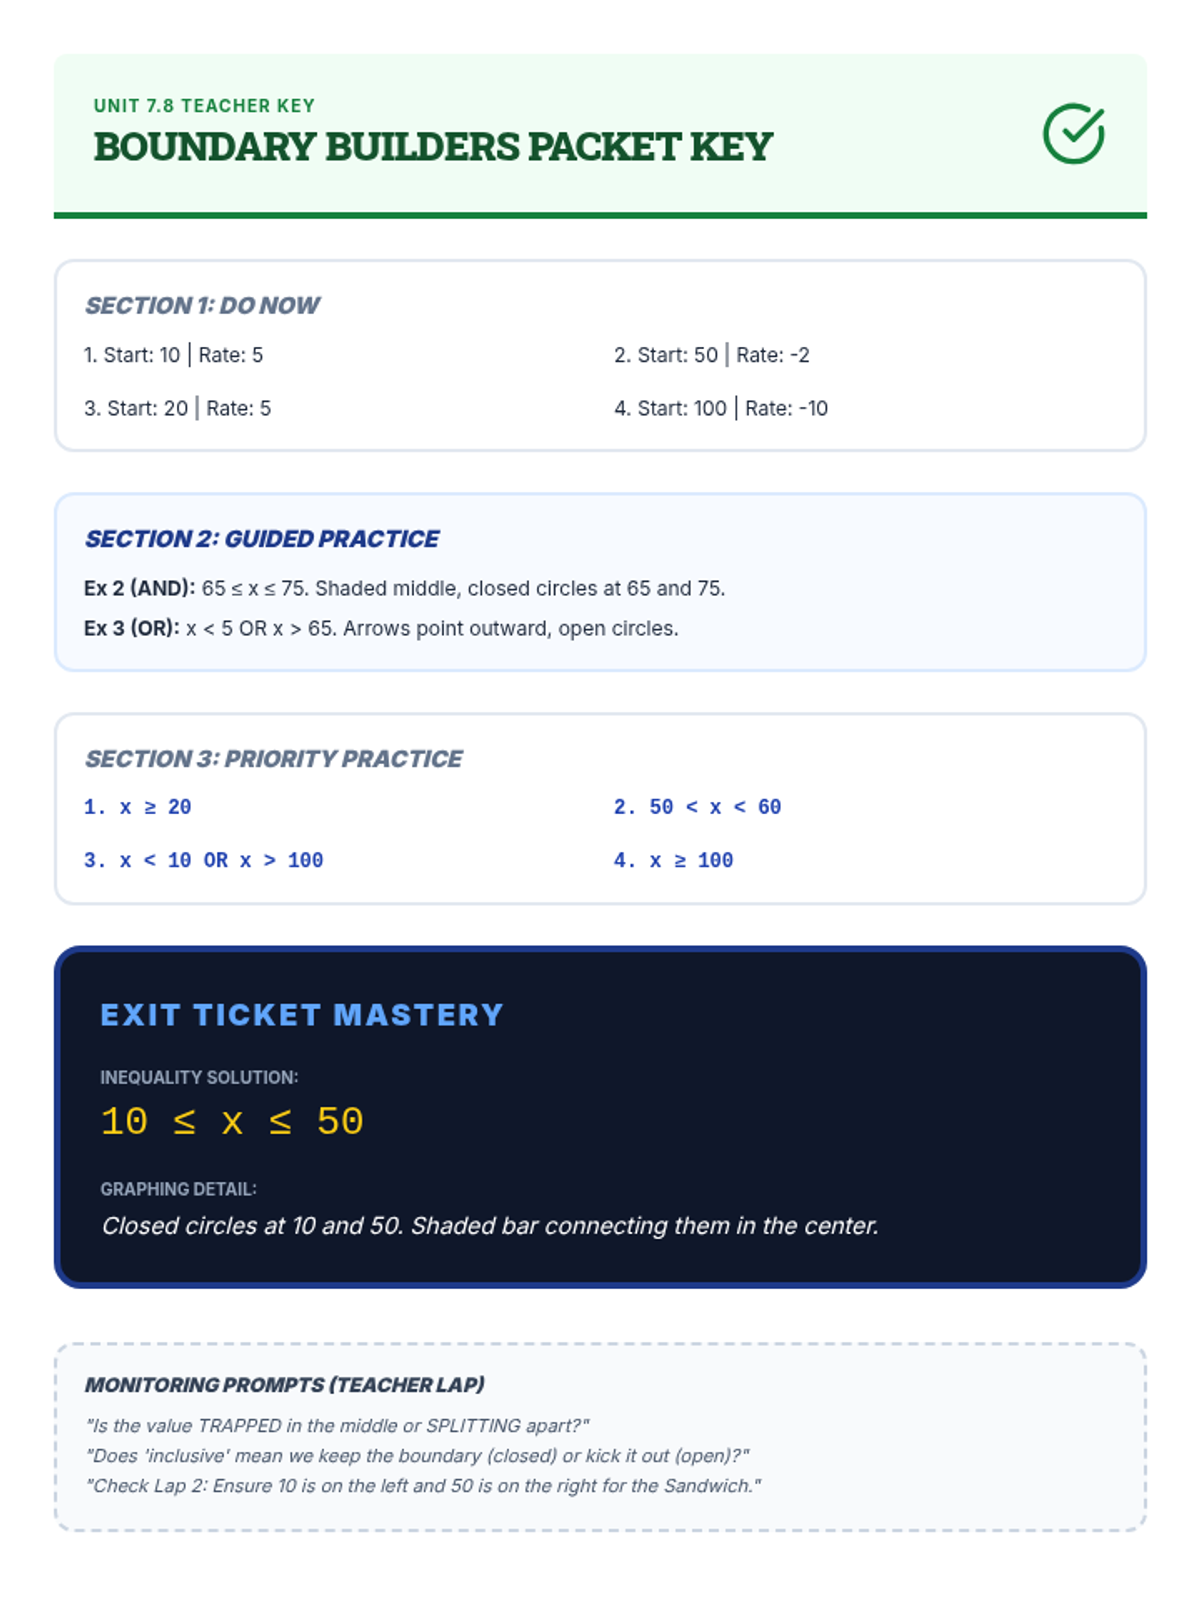
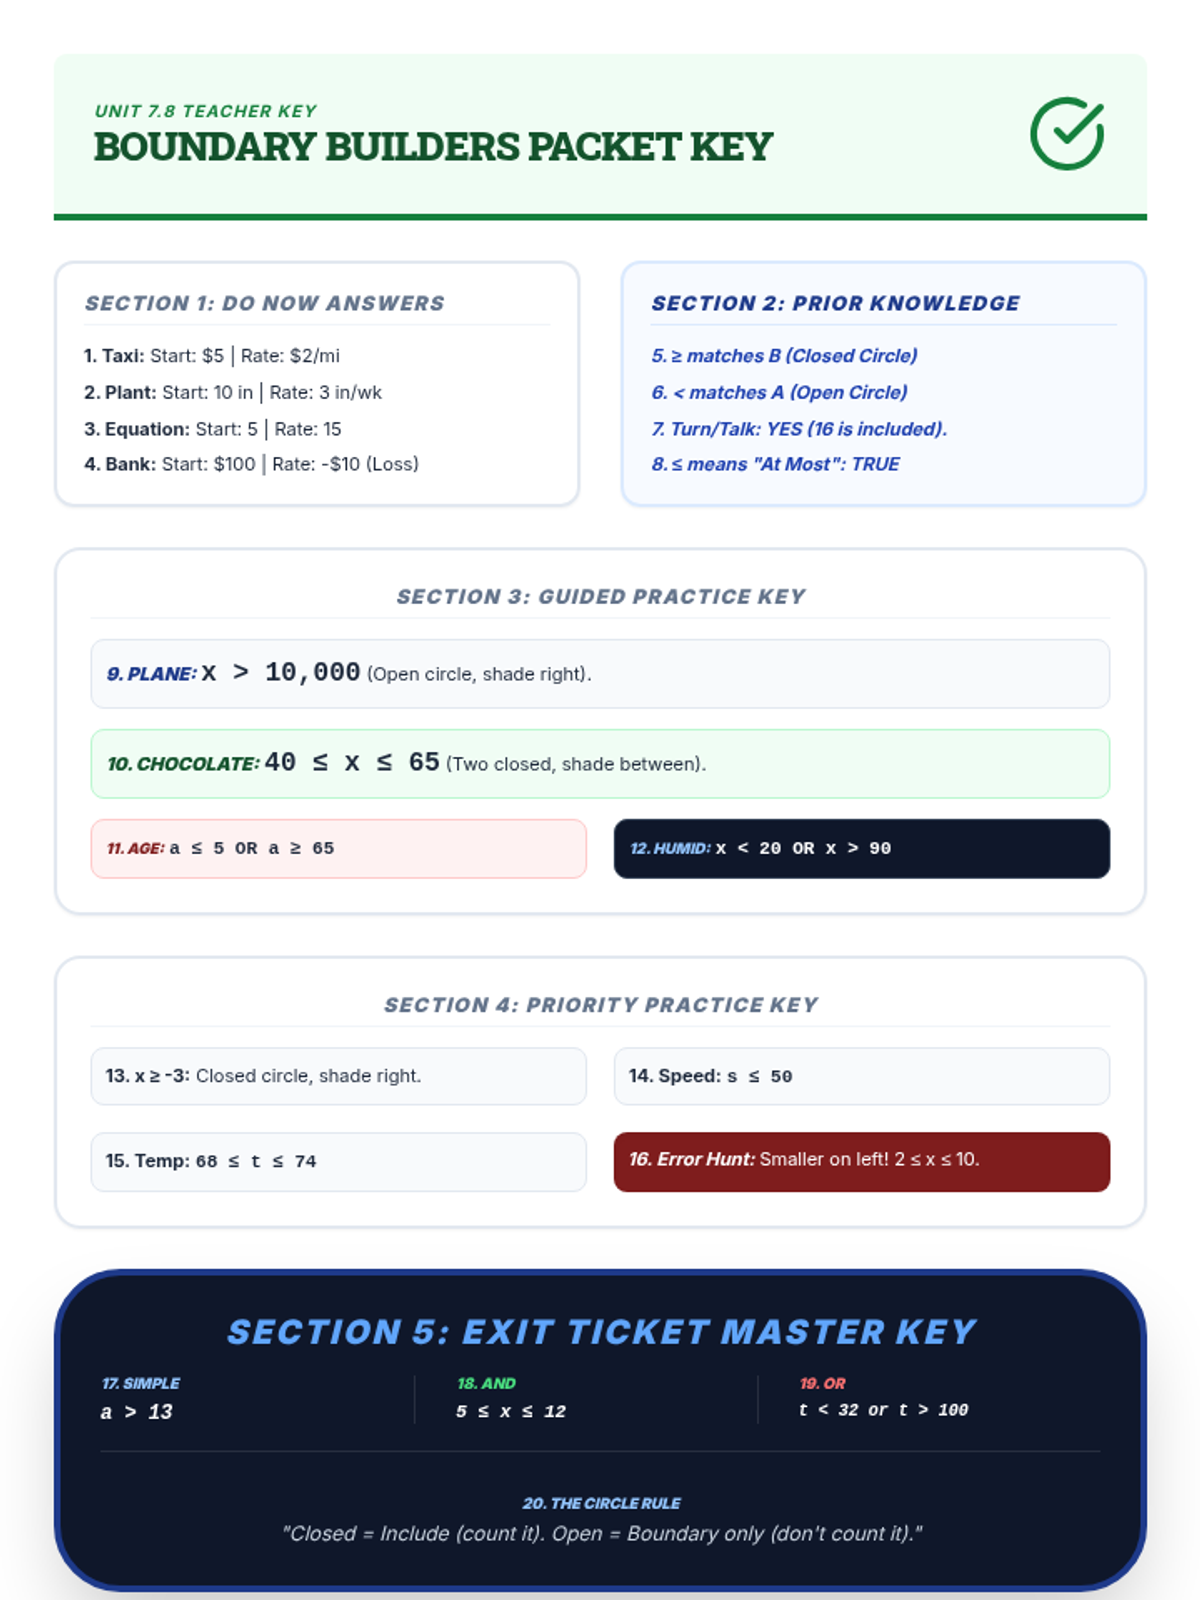
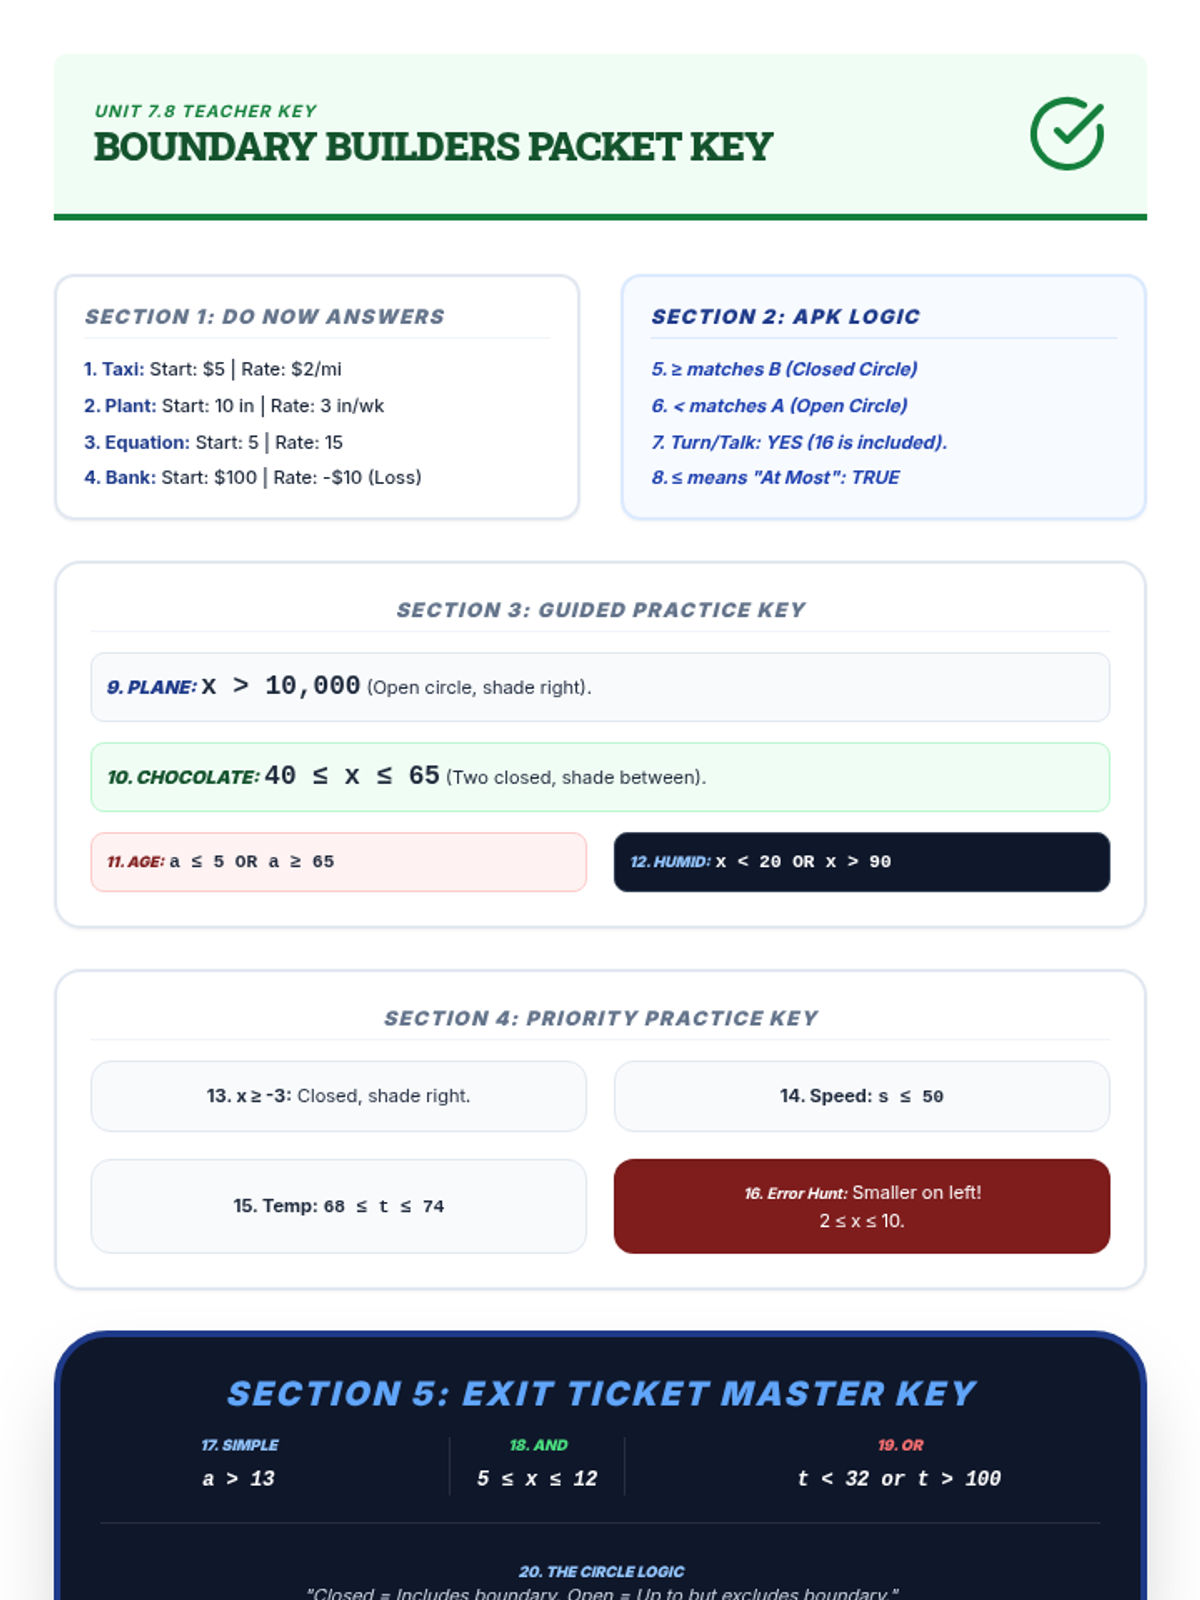
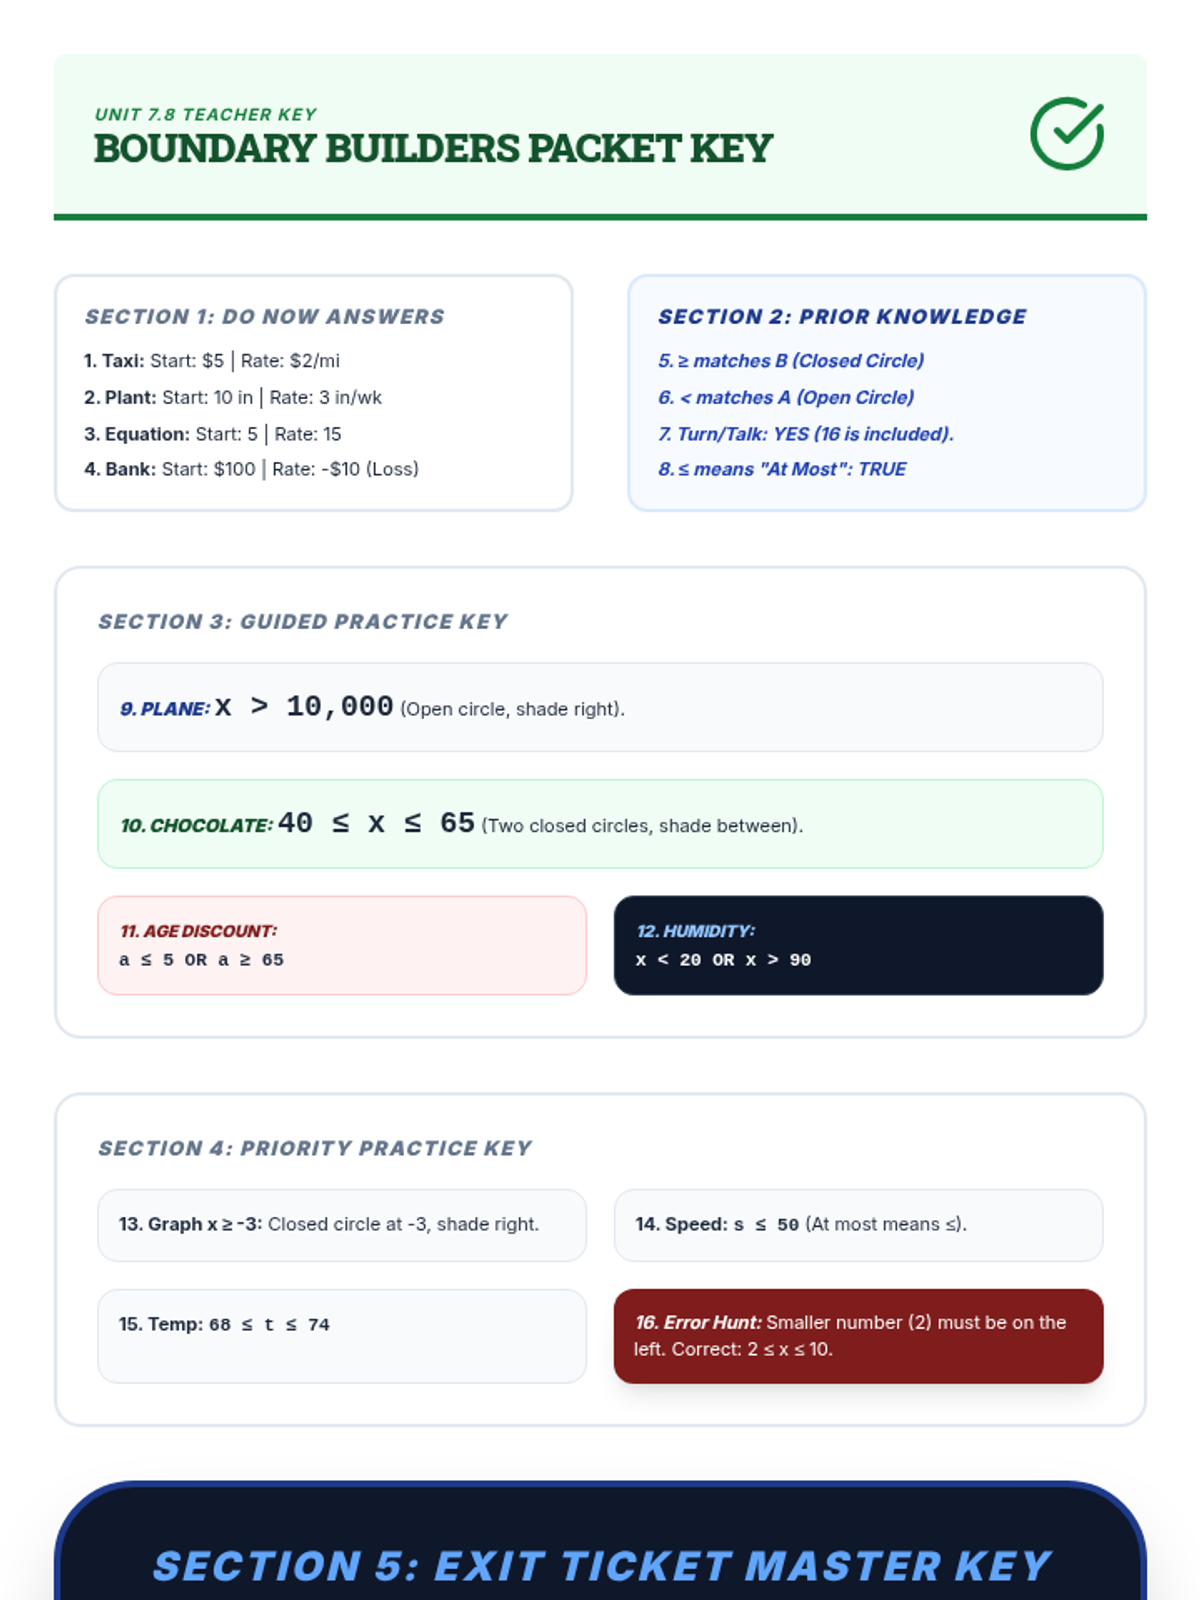
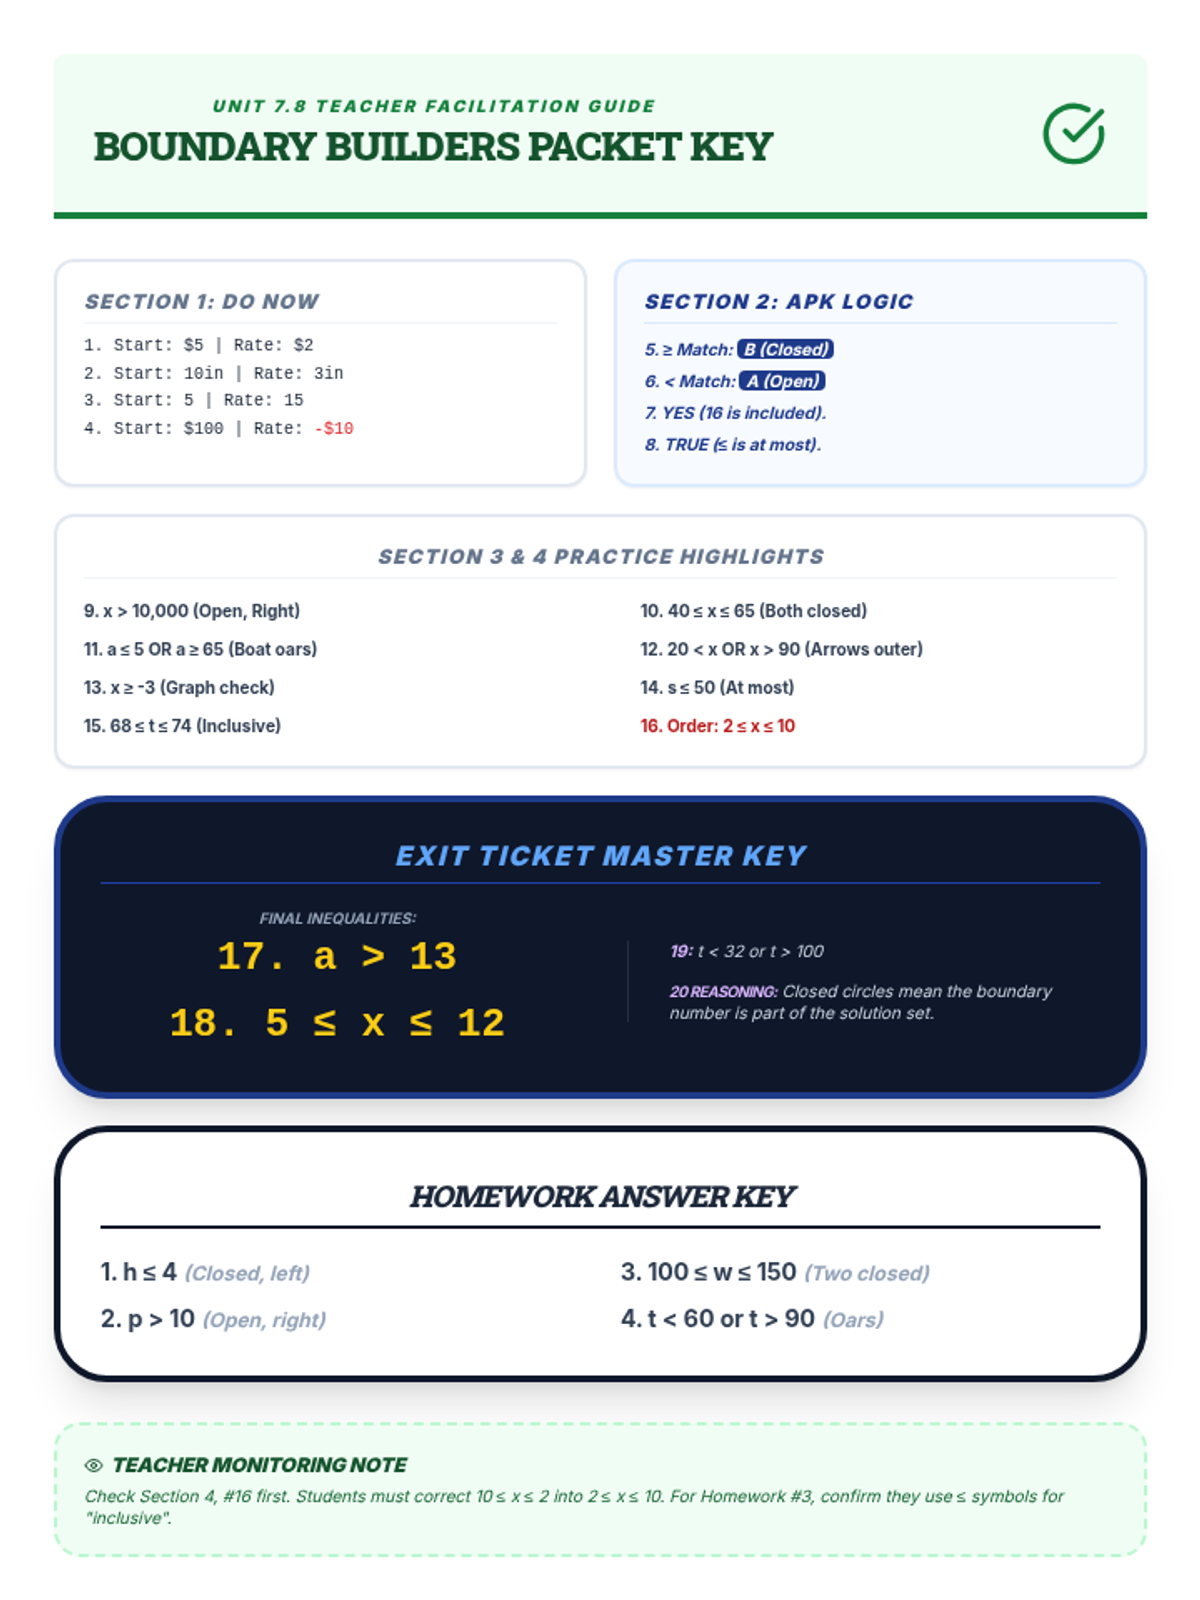
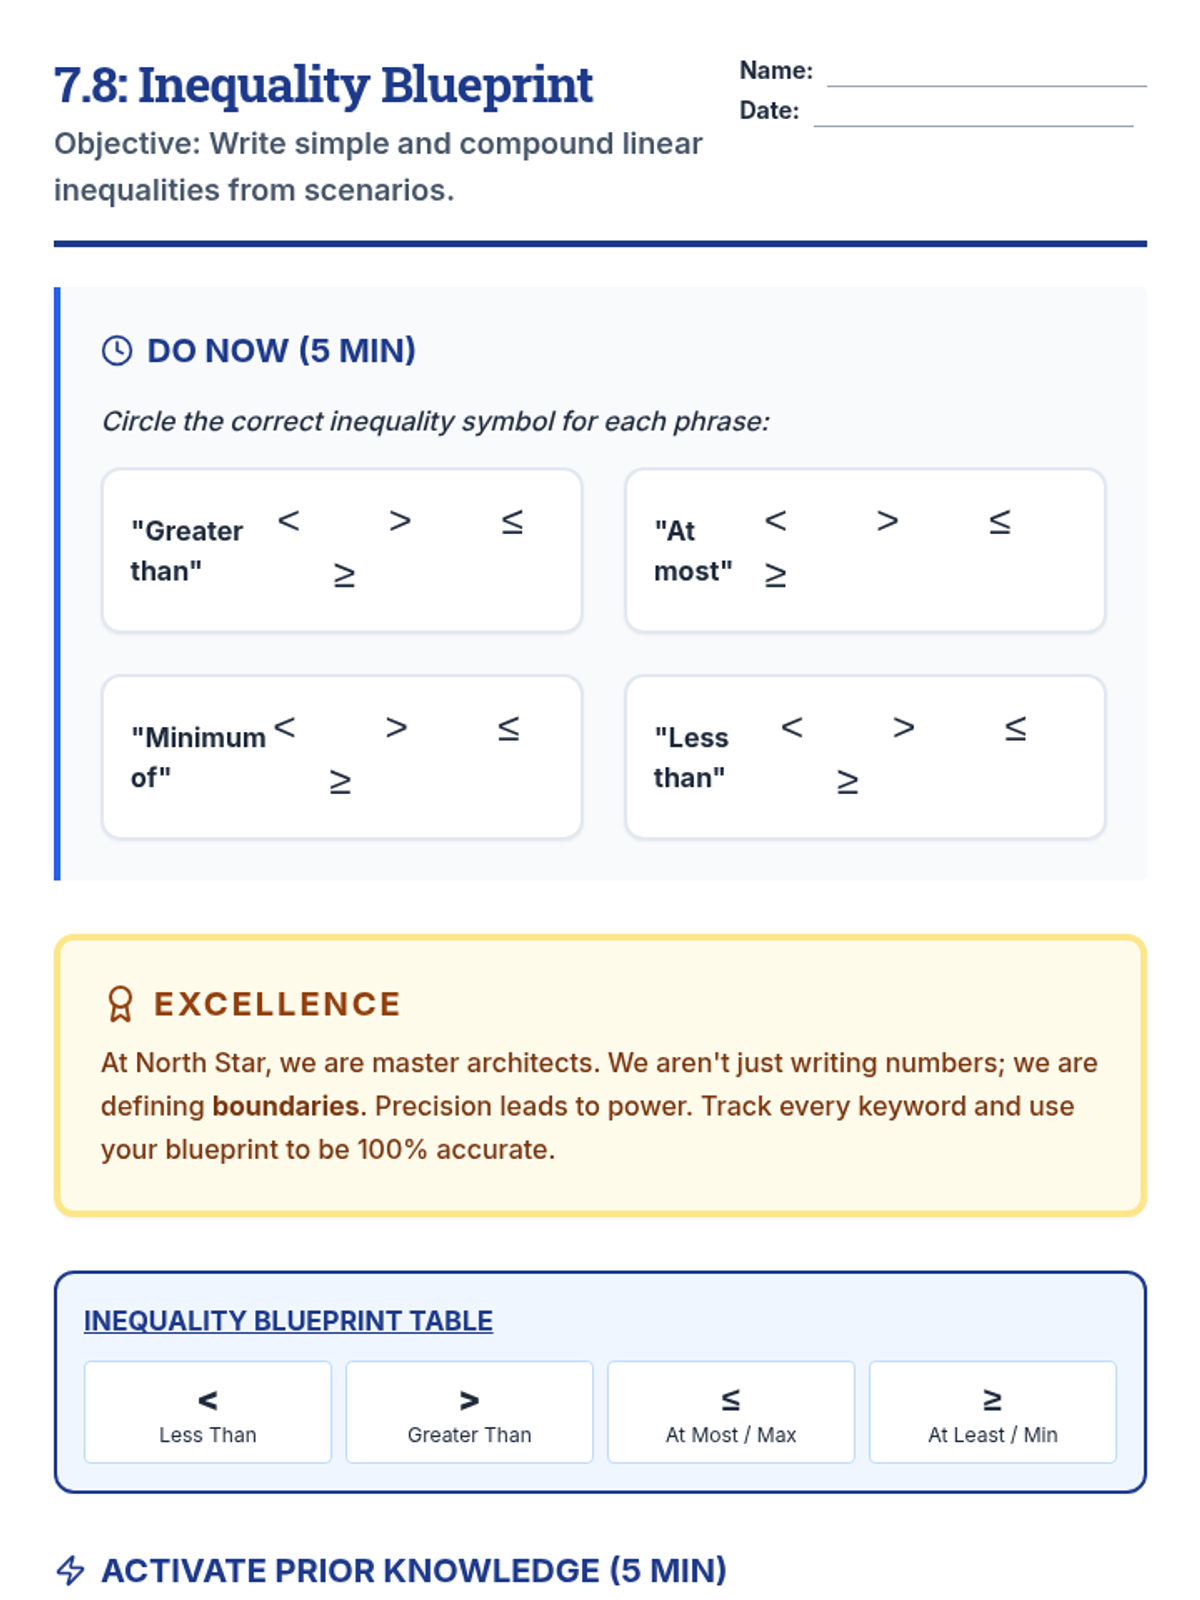
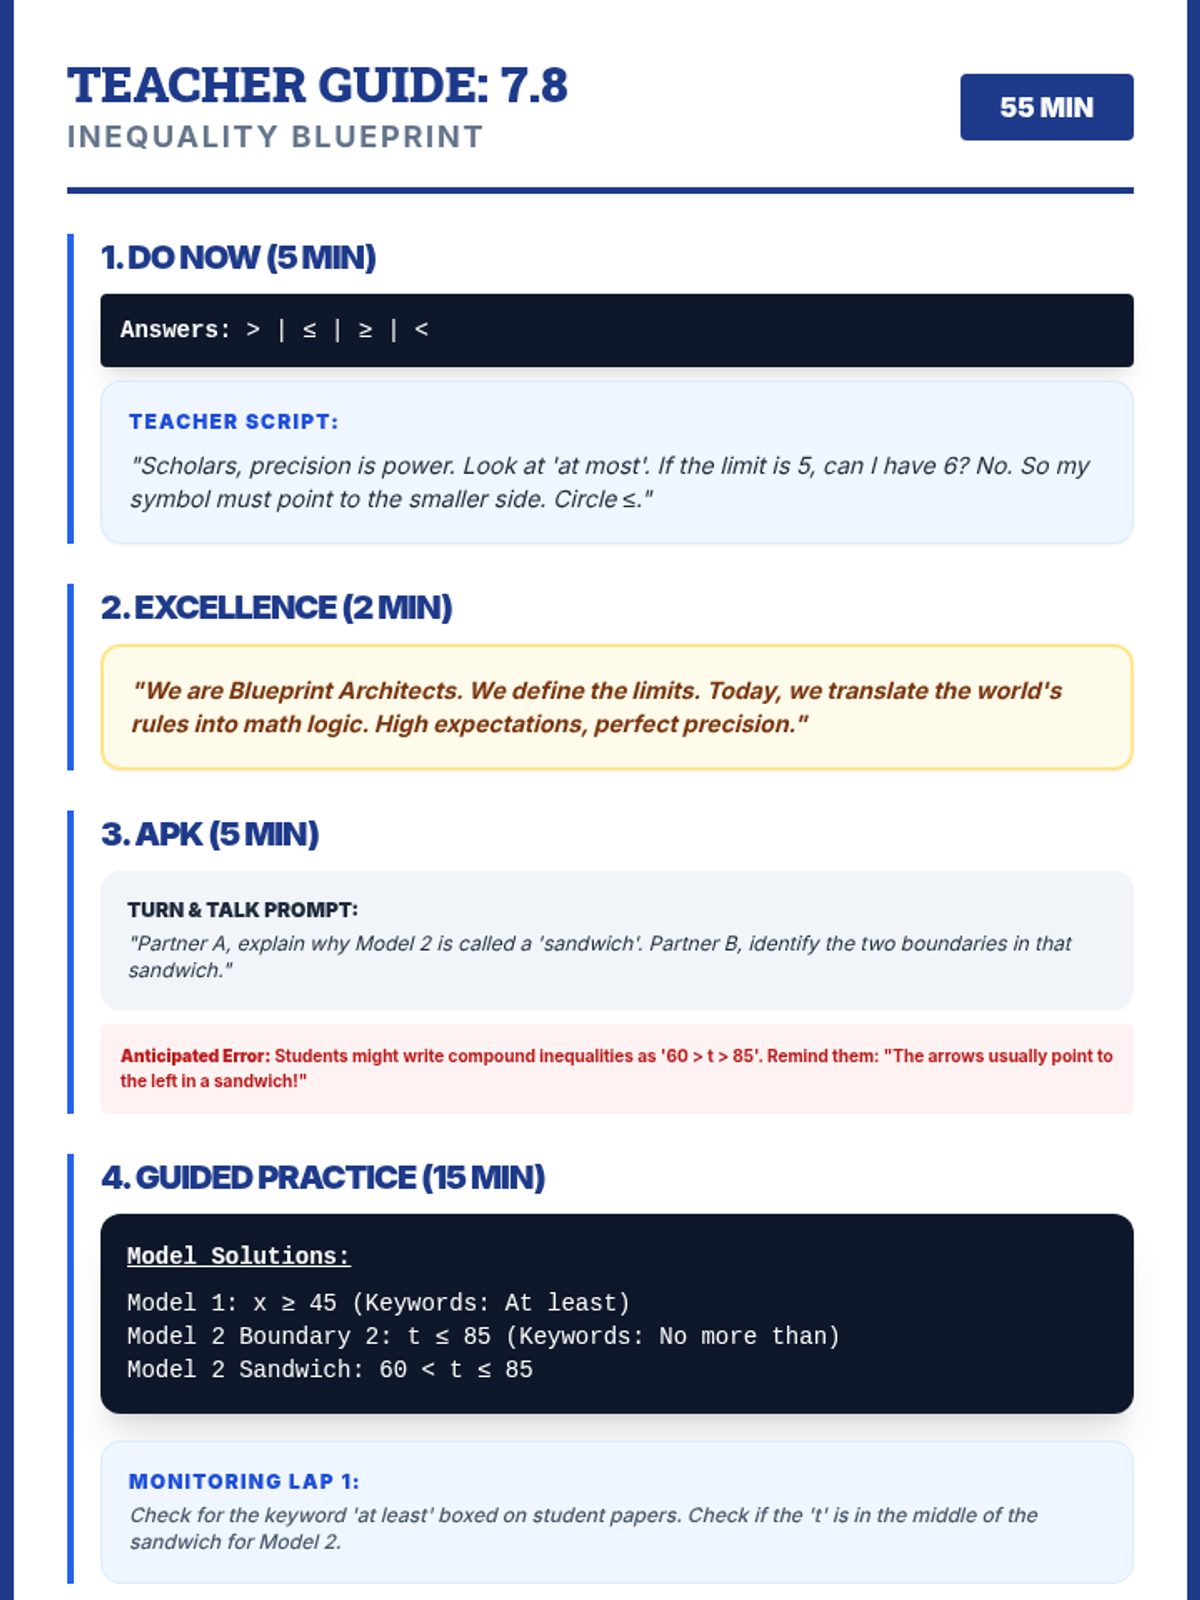
A 45-minute Algebra lesson for 9th-grade IEP students focused on writing simple and compound linear inequalities. This North Star Academy-style lesson uses visual aids and structured scaffolds to help students translate verbal scenarios into mathematical boundaries.
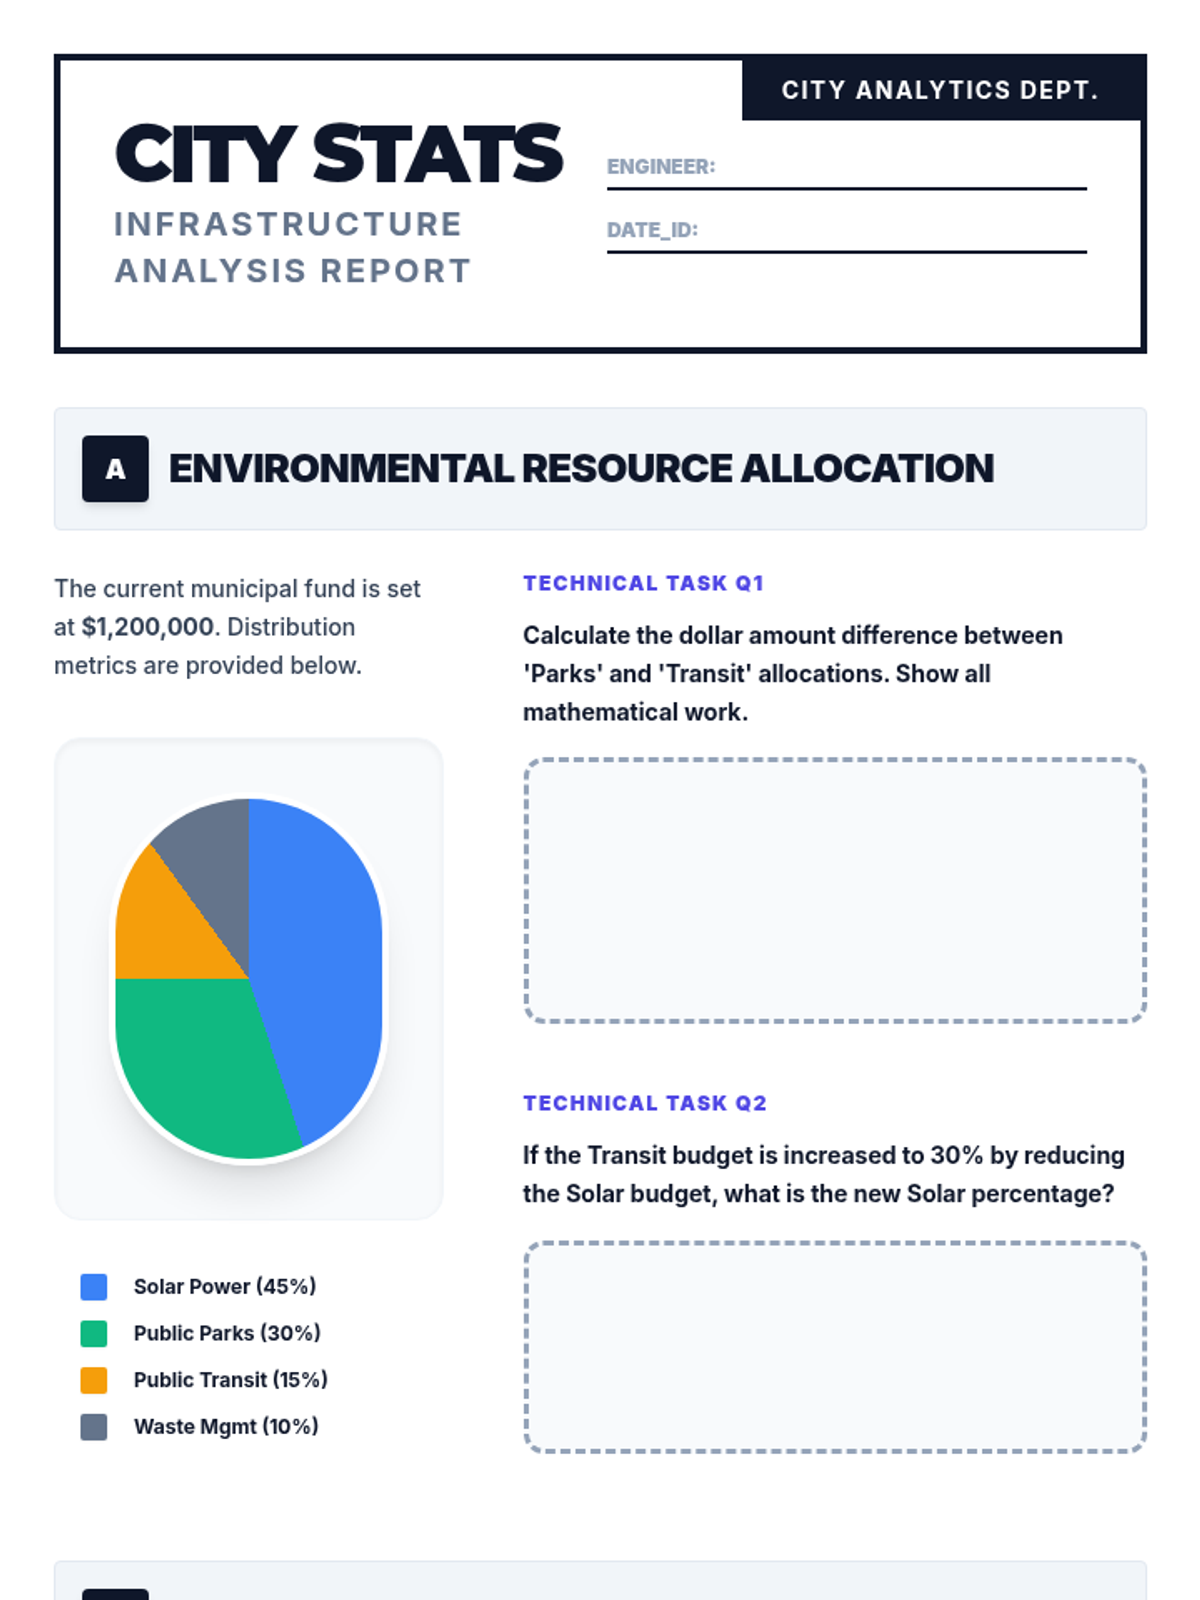
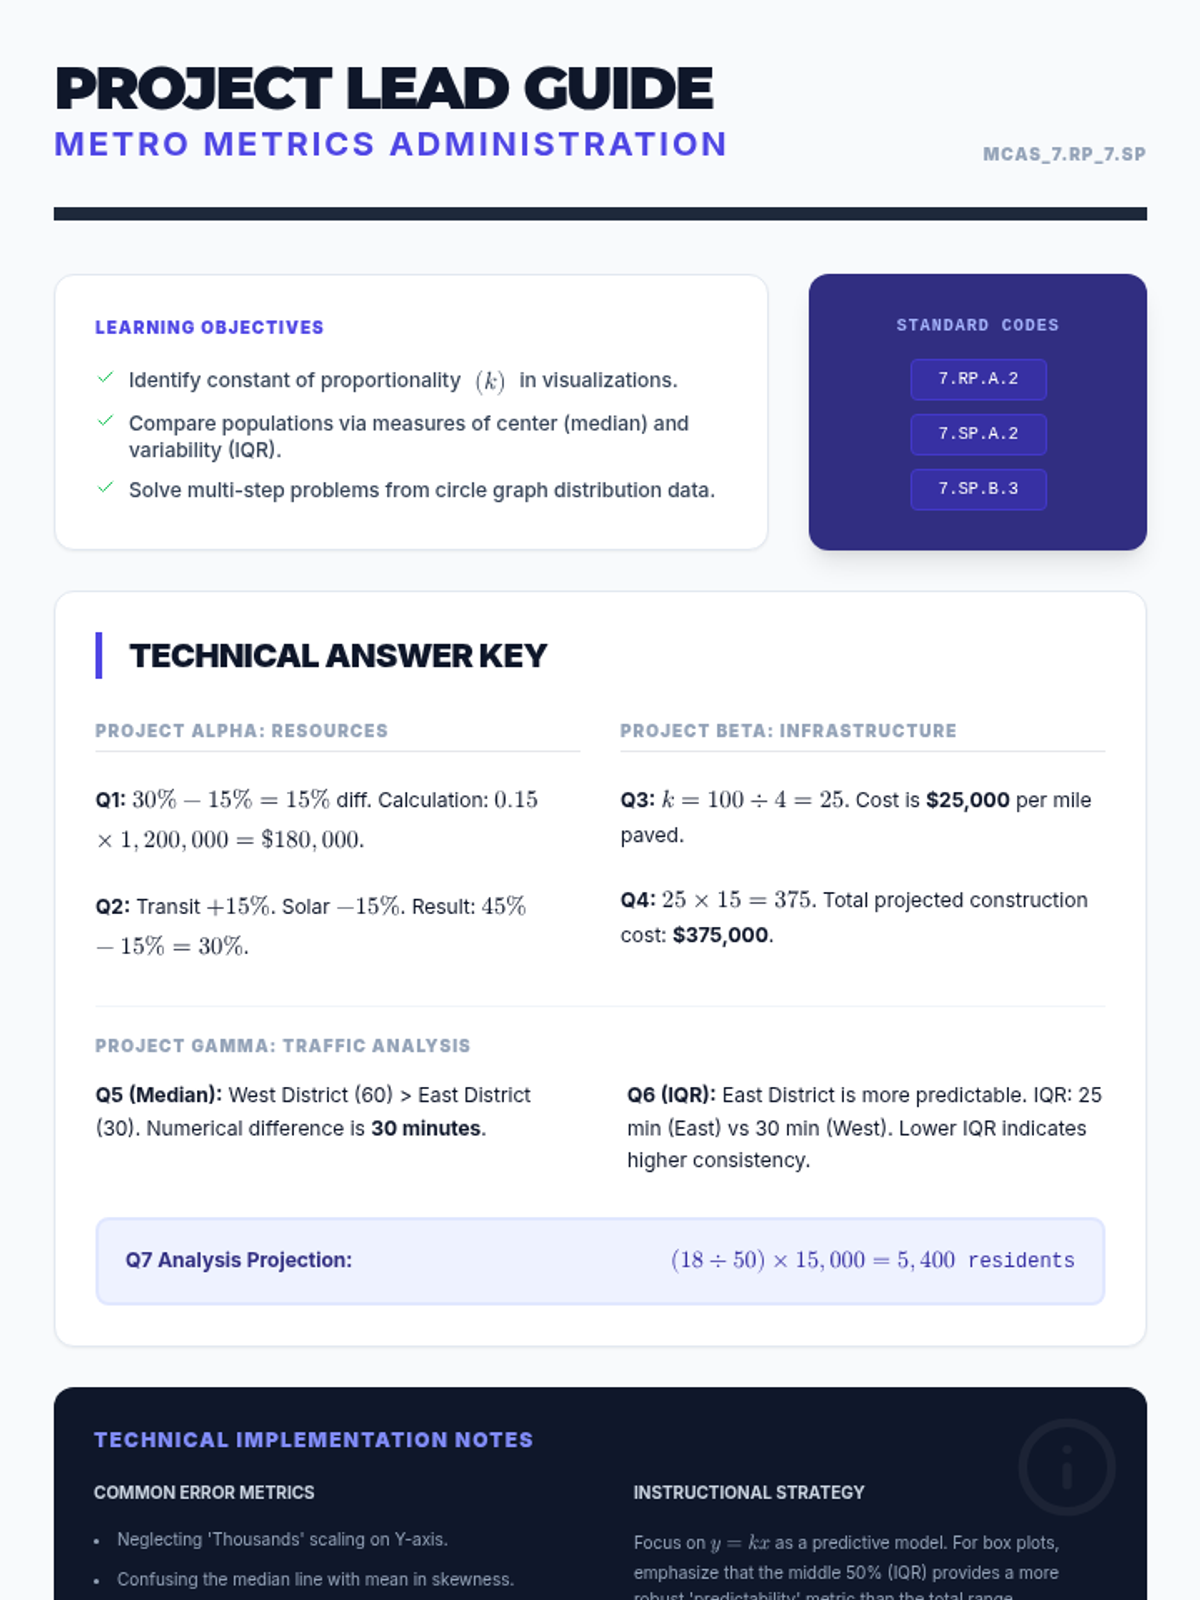
A comprehensive lesson on interpreting circle graphs, box plots, and proportional relationships within a City Engineering context, focused on 7th grade MCAS standards.
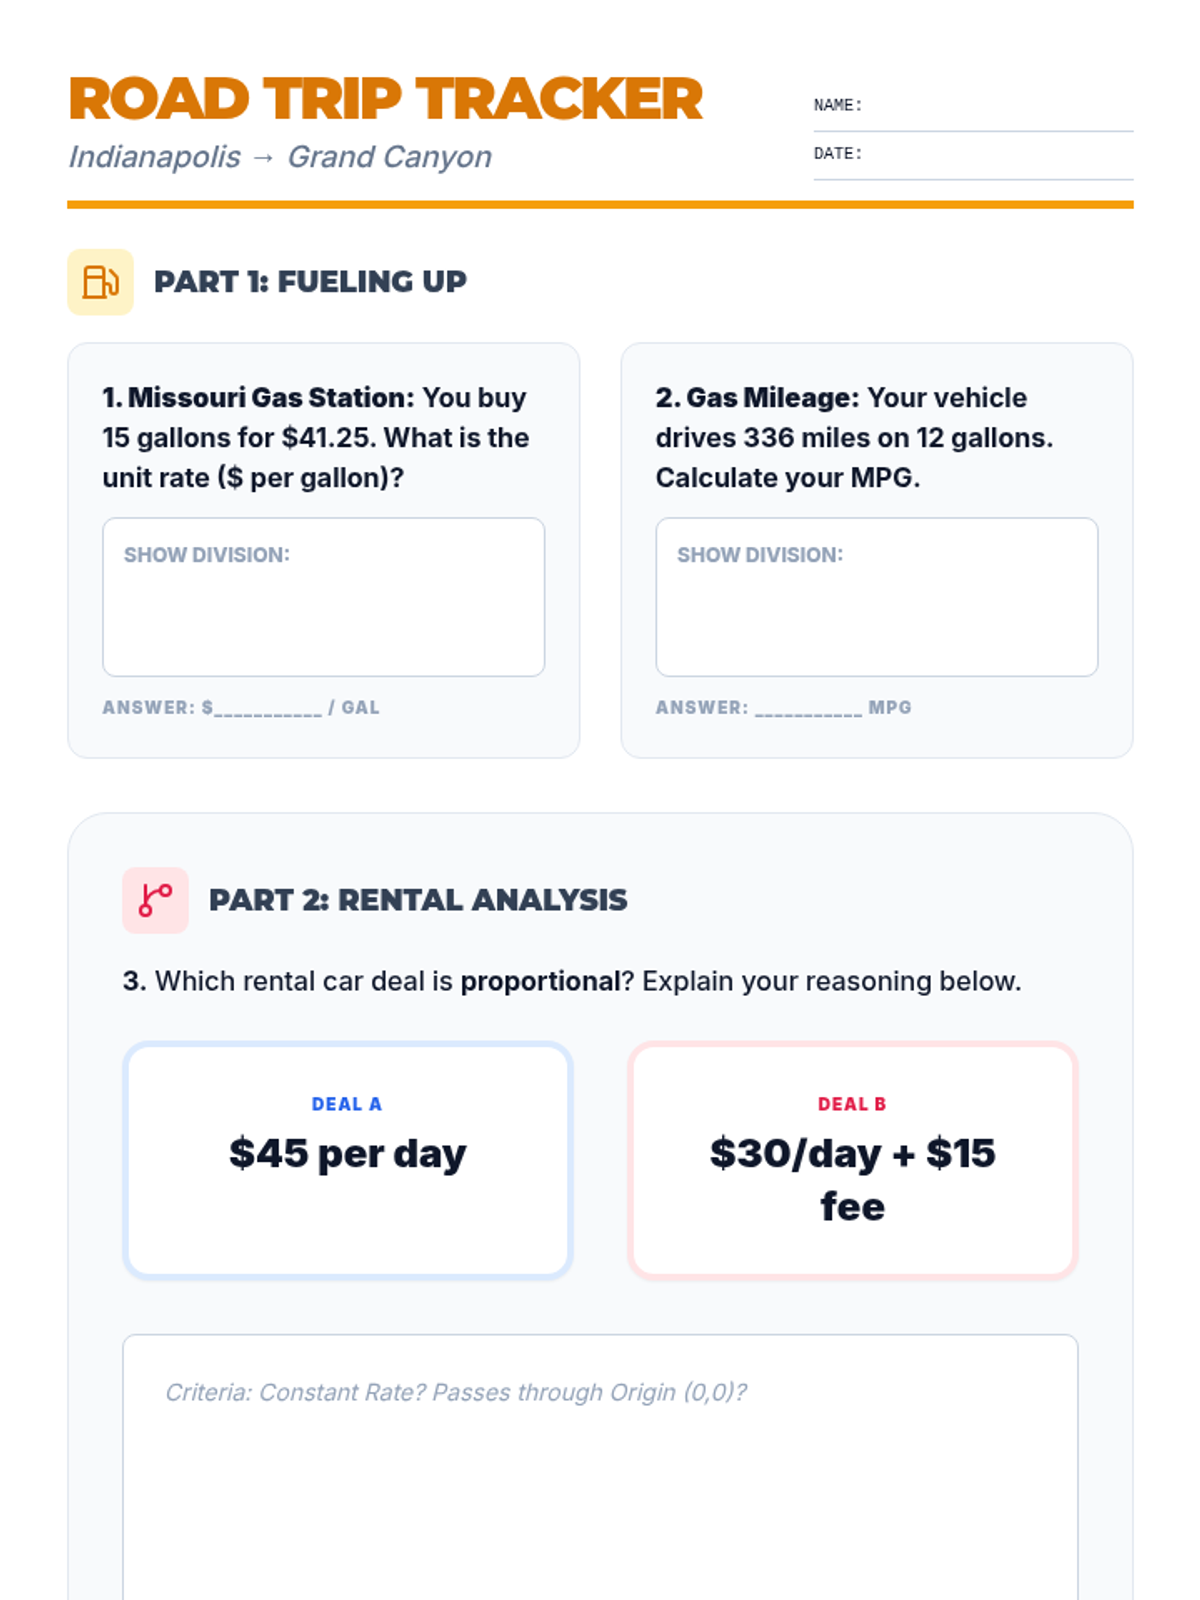
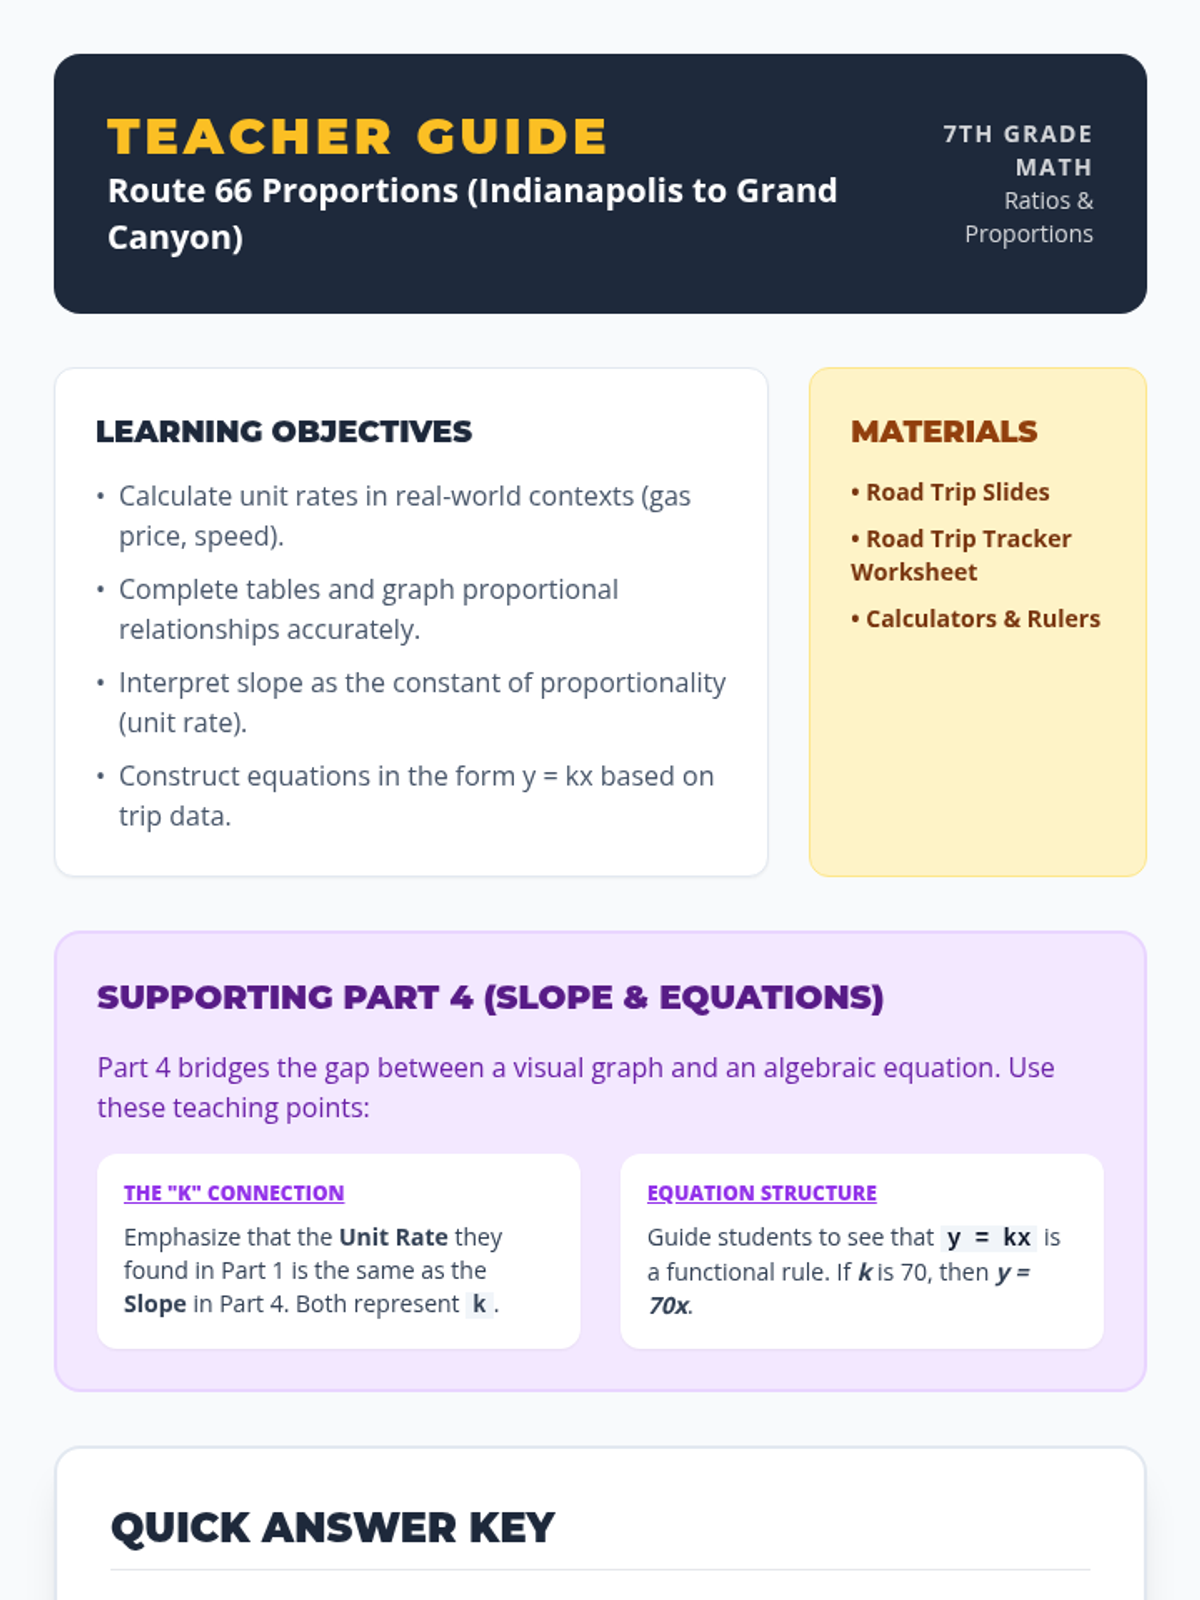
A 7th-grade math lesson that uses a road trip scenario from Indianapolis to the Grand Canyon to explore unit rates, graphing proportional relationships, and solving equations. Students will plan routes, calculate fuel costs, and interpret travel graphs.
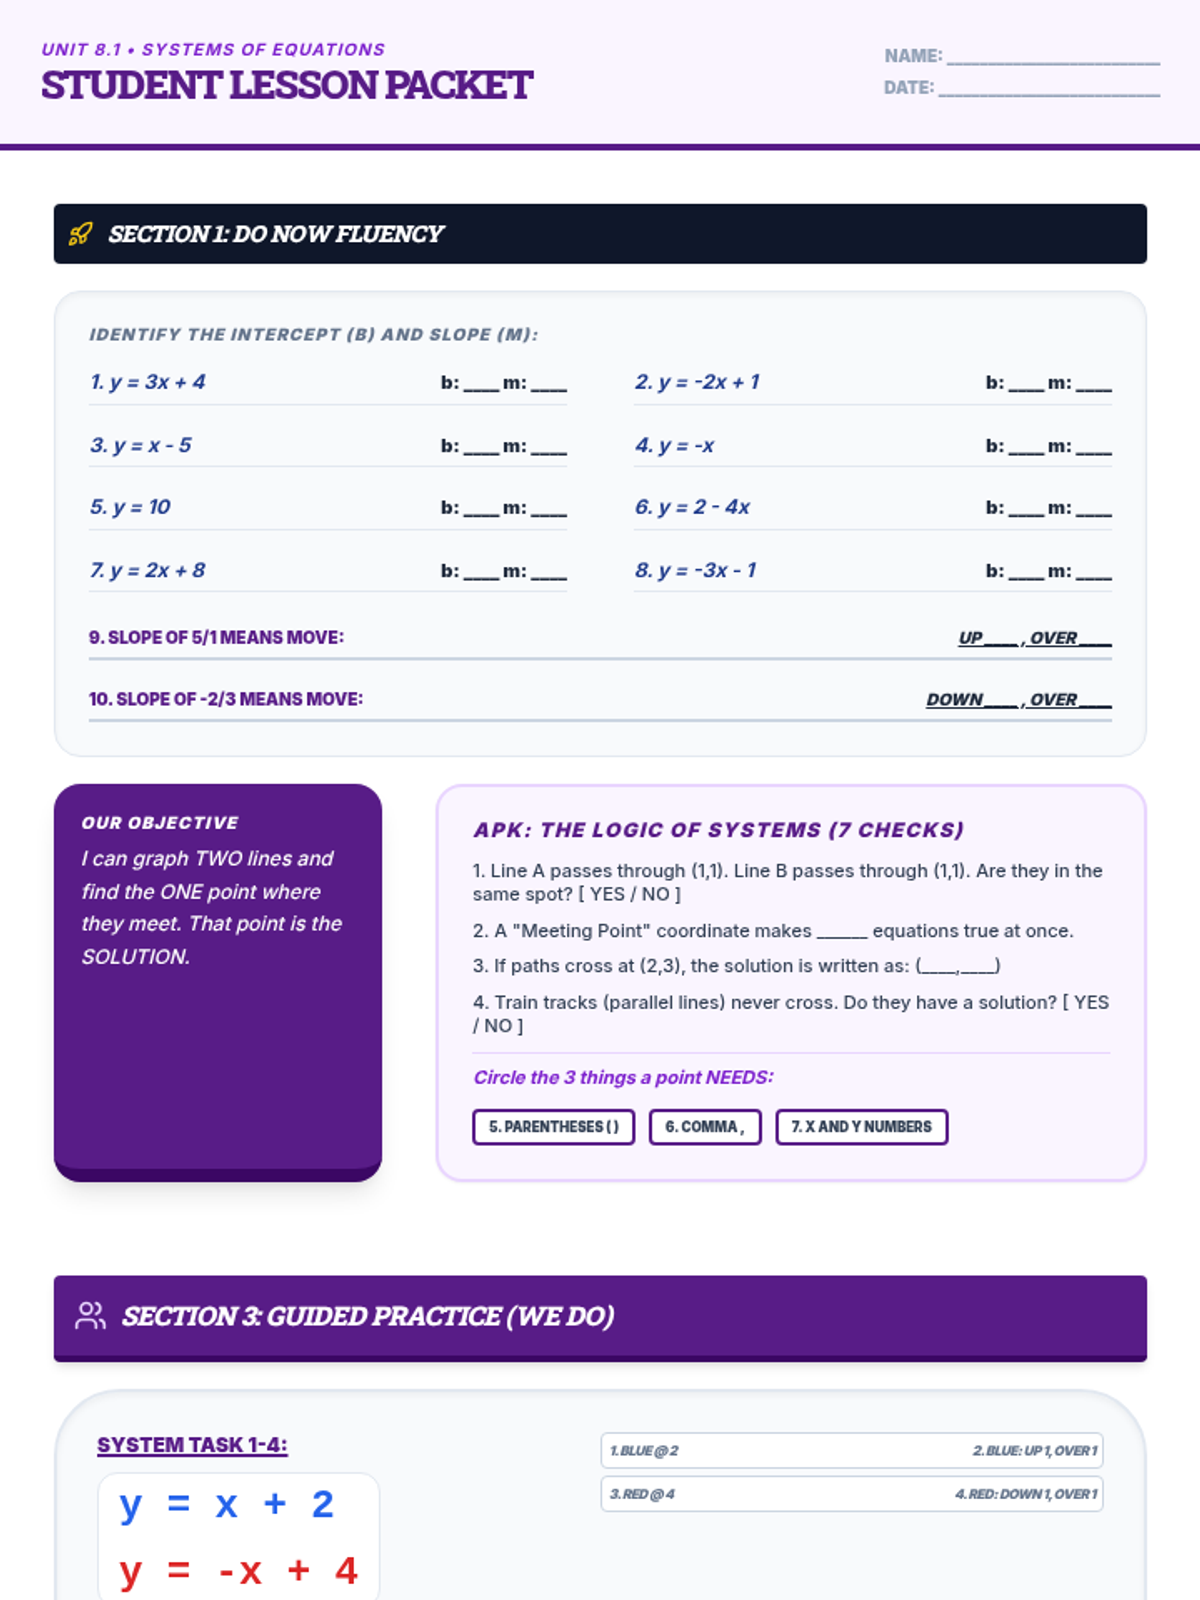
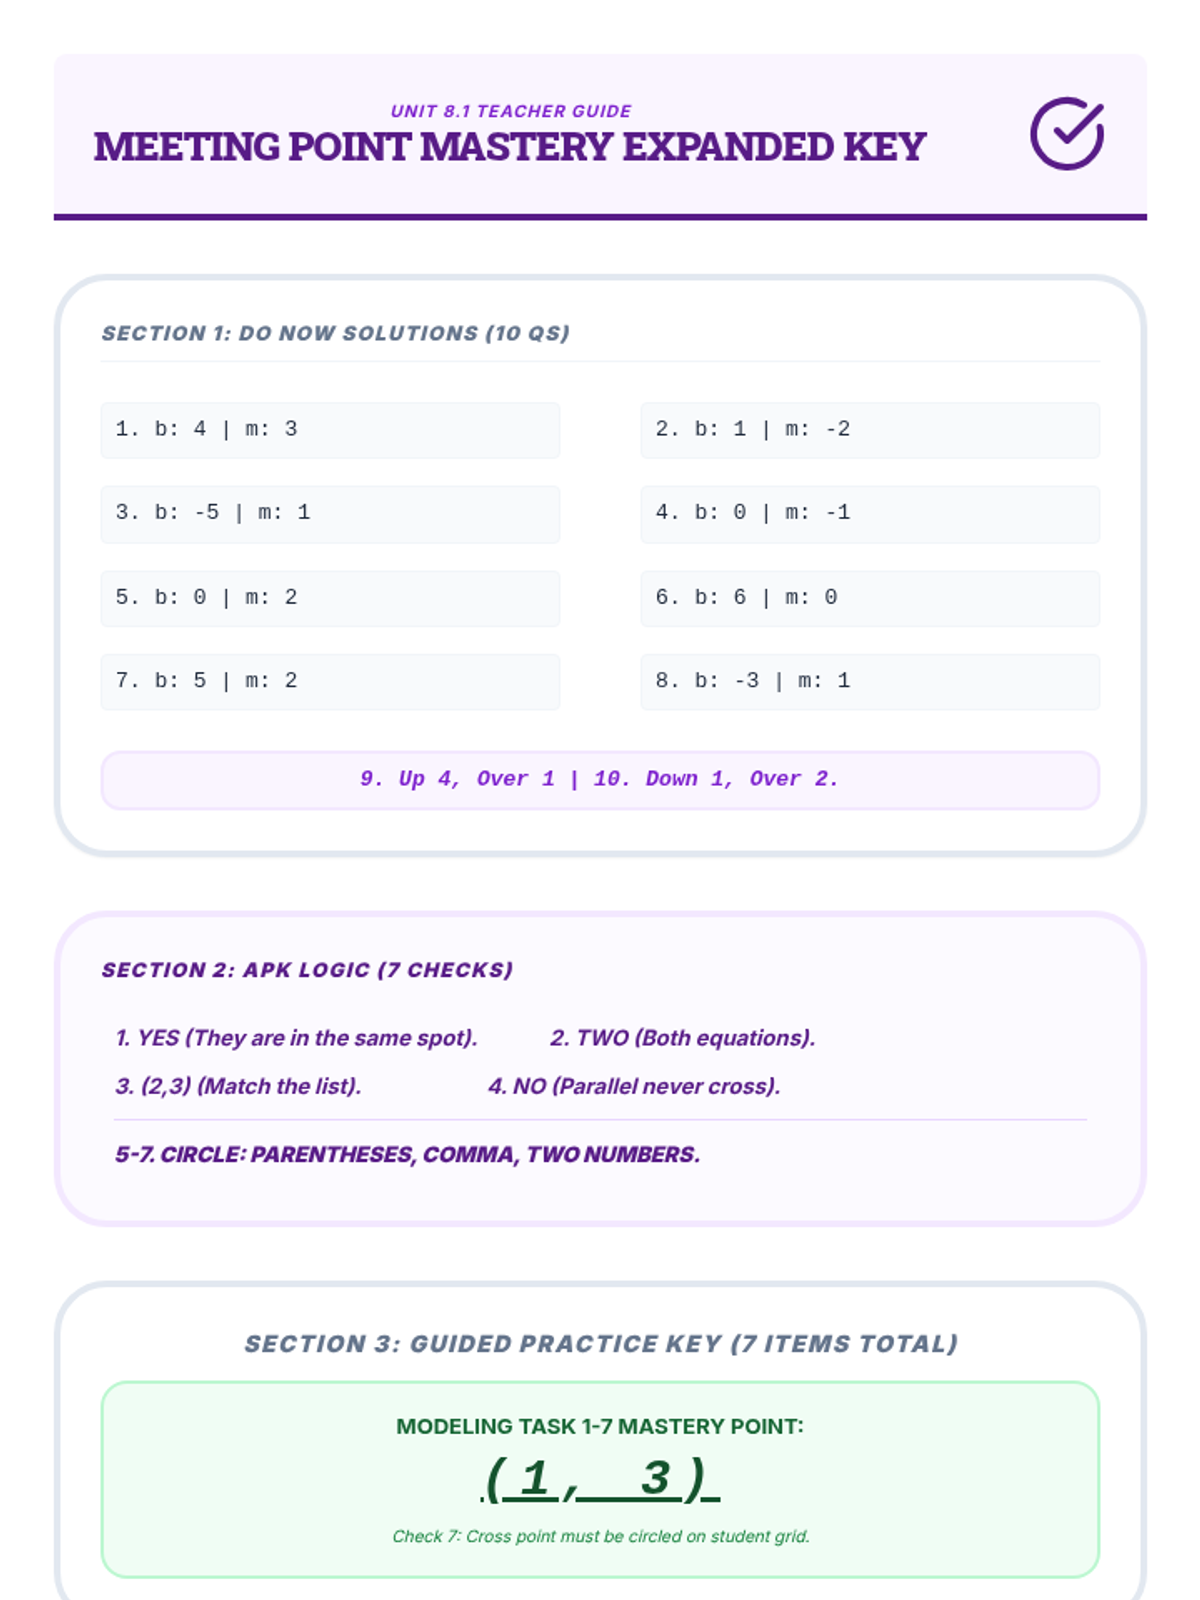
A scaffolded lesson for 9th and 10th-grade special education students to master solving systems of linear equations. The lesson covers graphing to find intersections, substitution, and elimination through structured steps and clear visual aids.
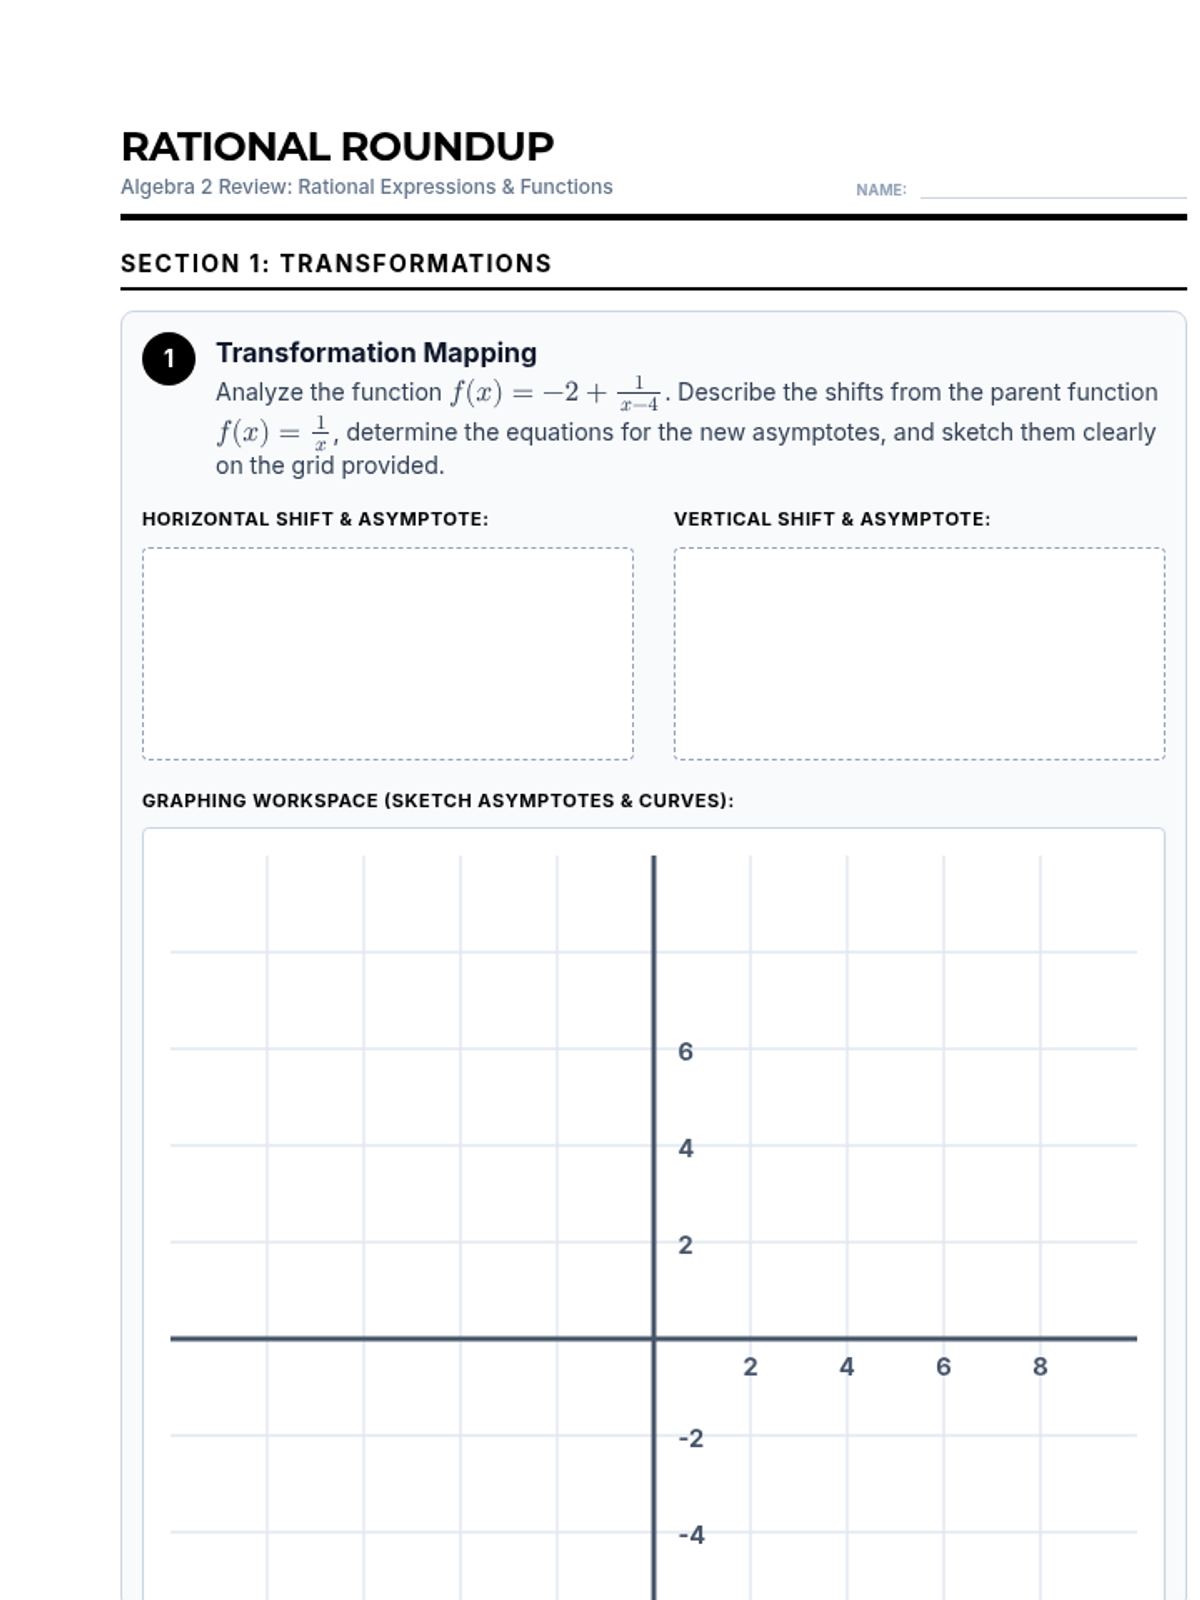
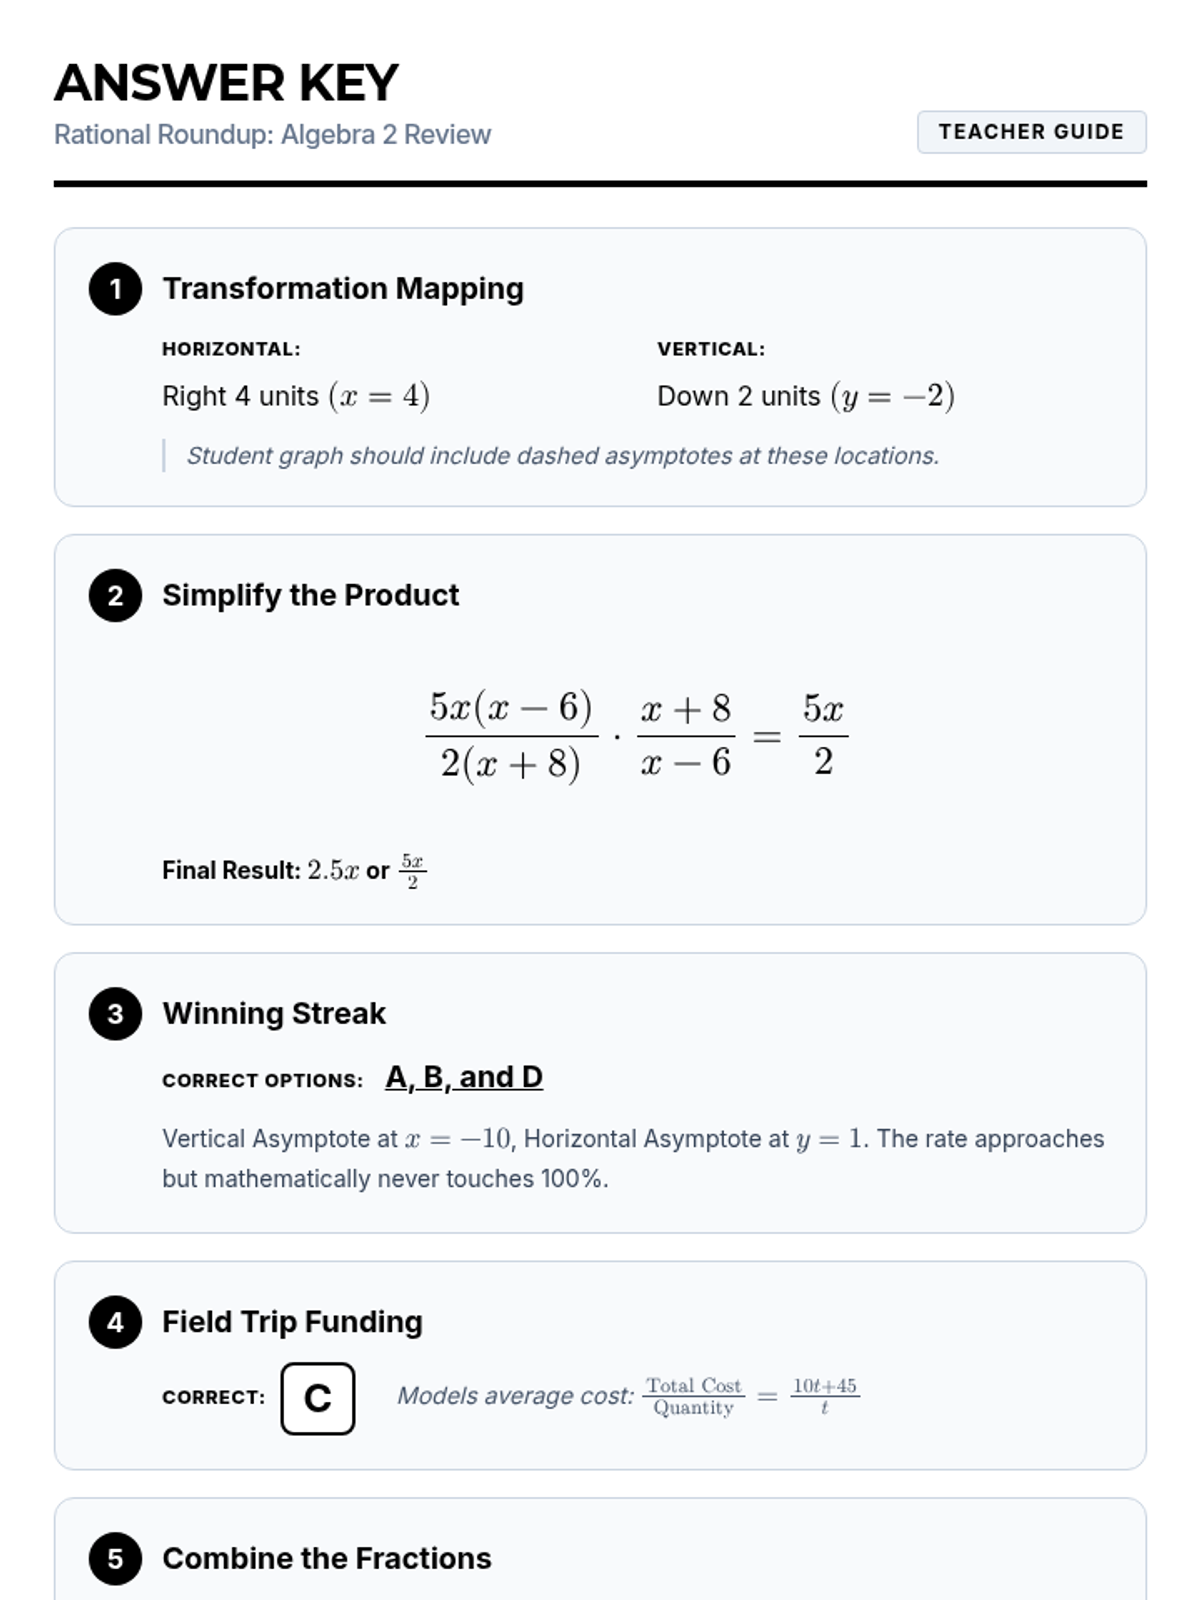
A review lesson focused on transformations, simplifying, adding, and modeling with rational expressions based on district assessment standards.
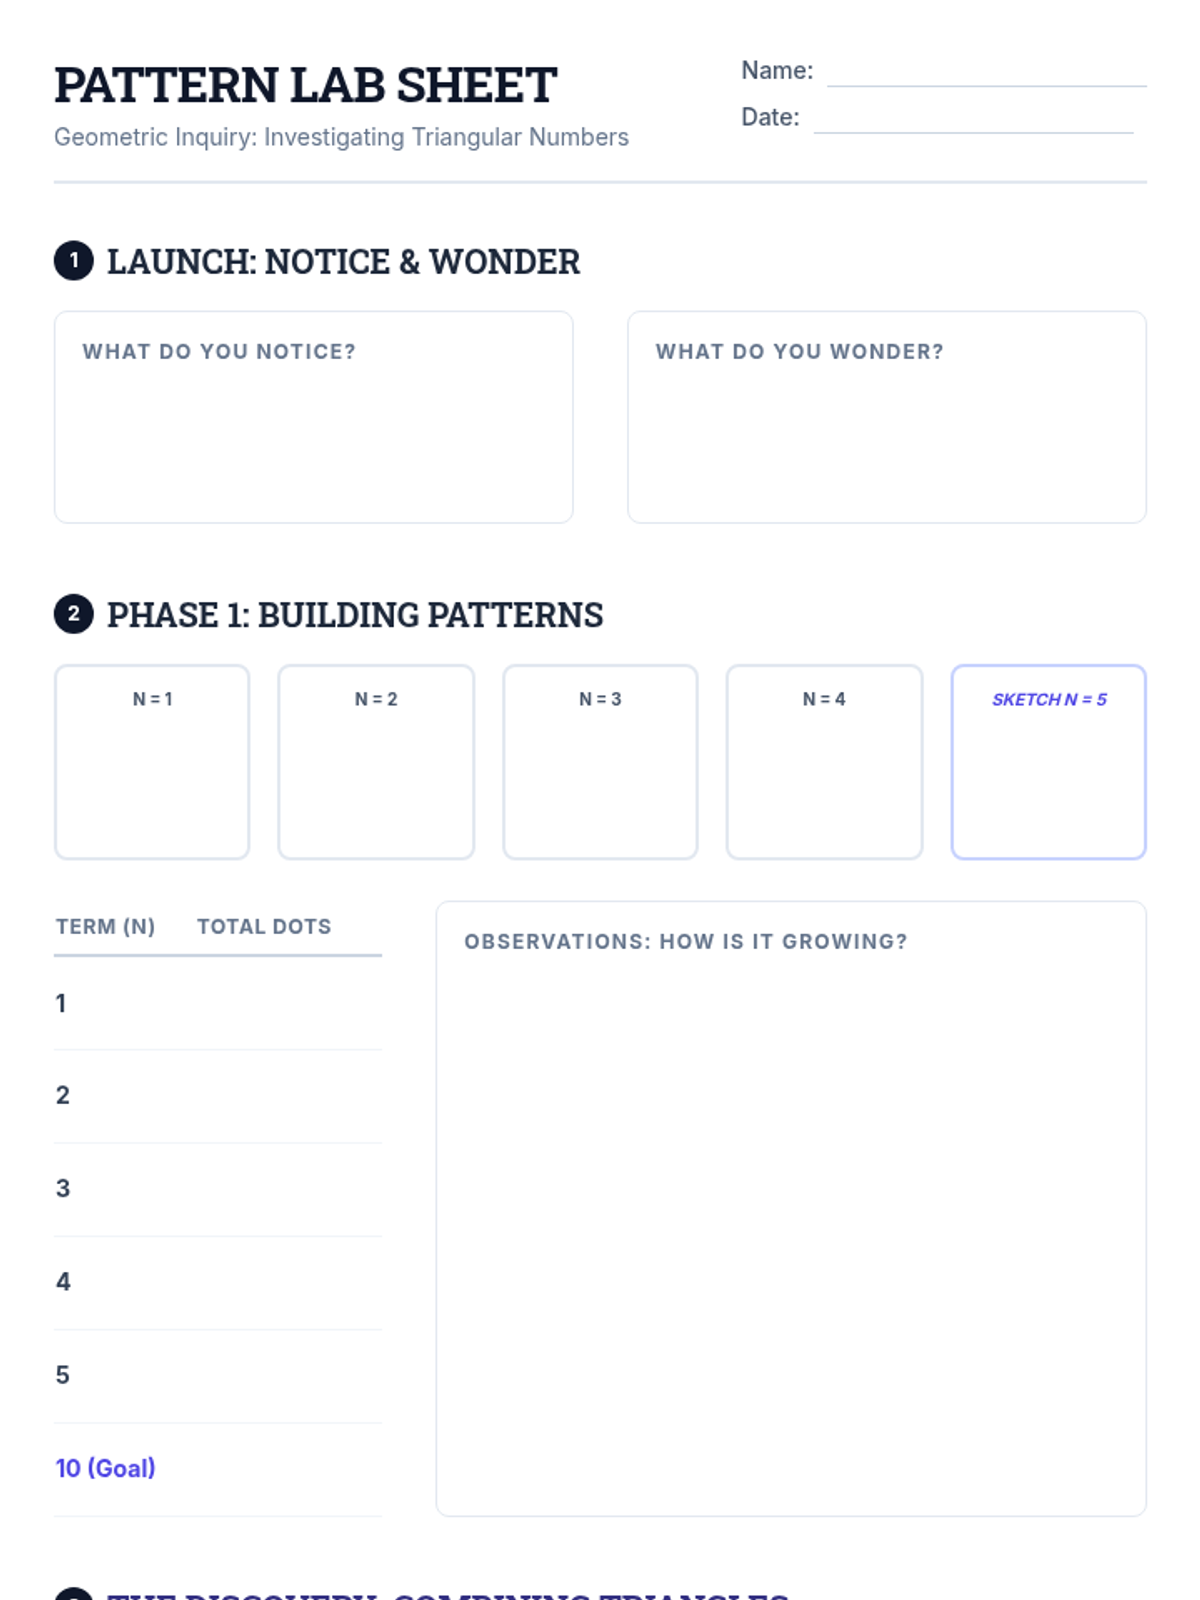
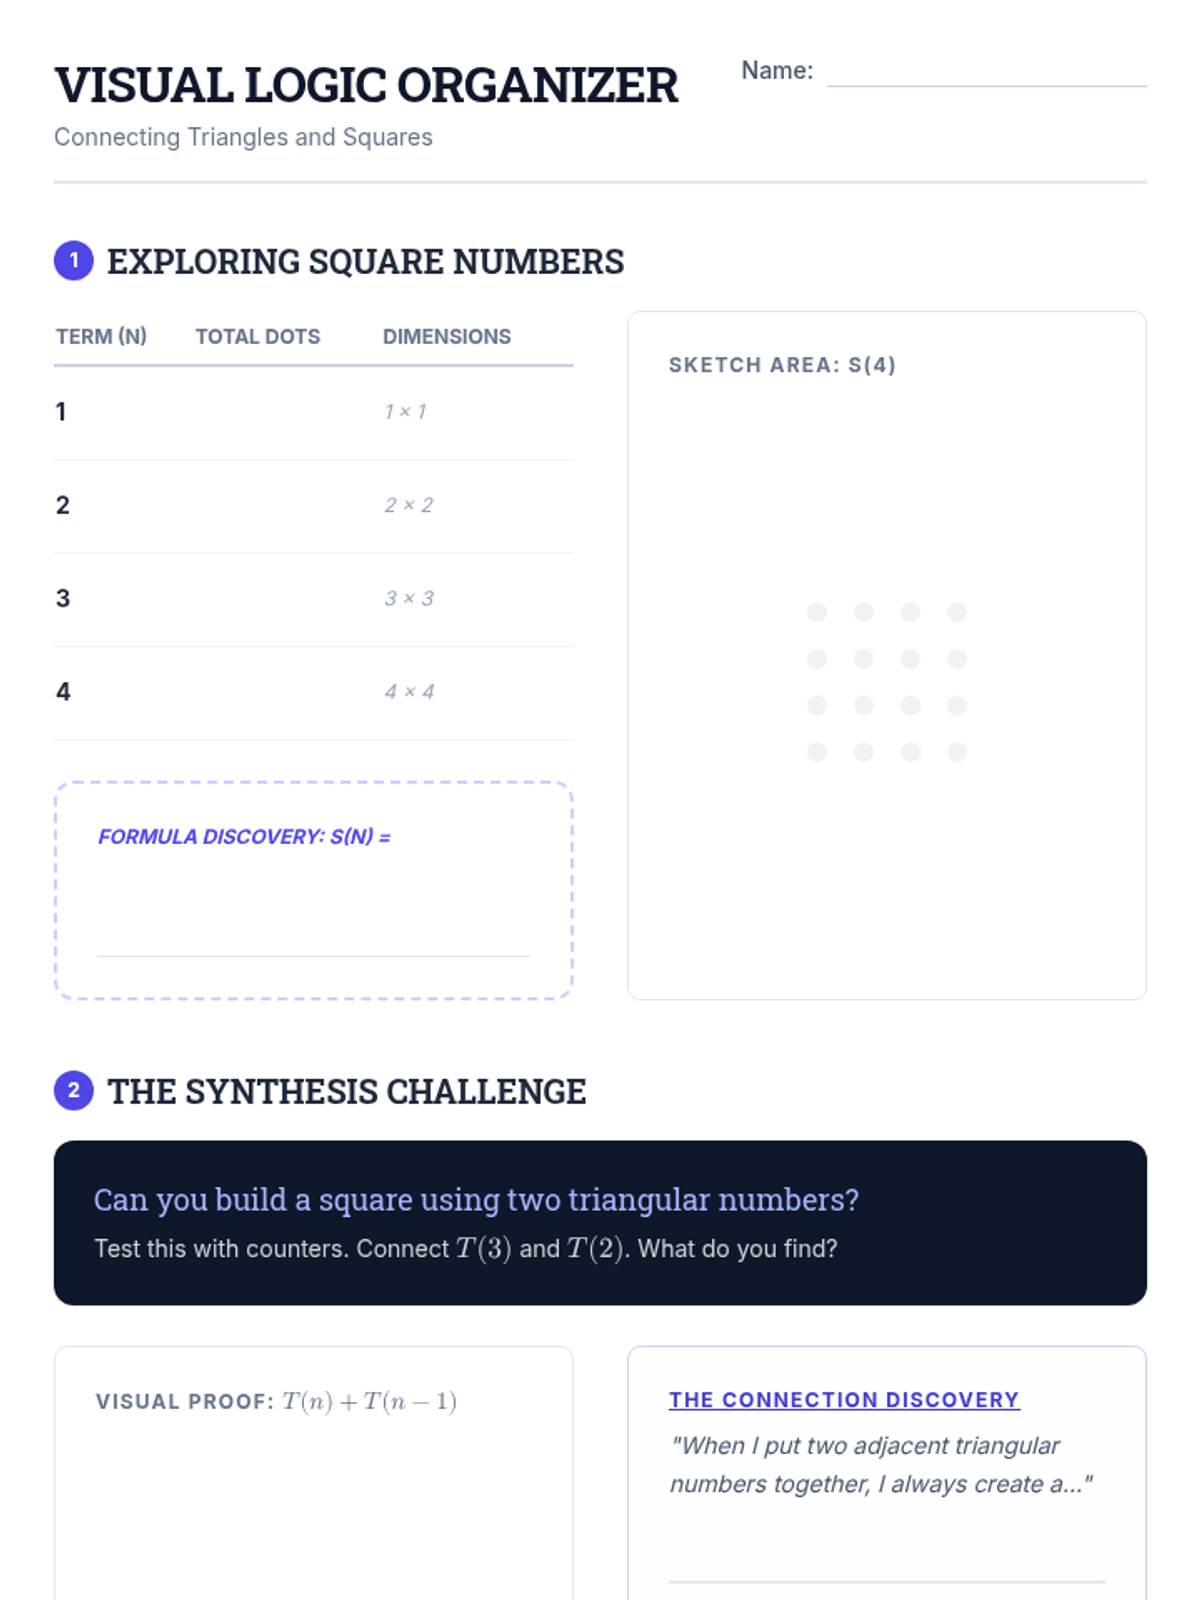
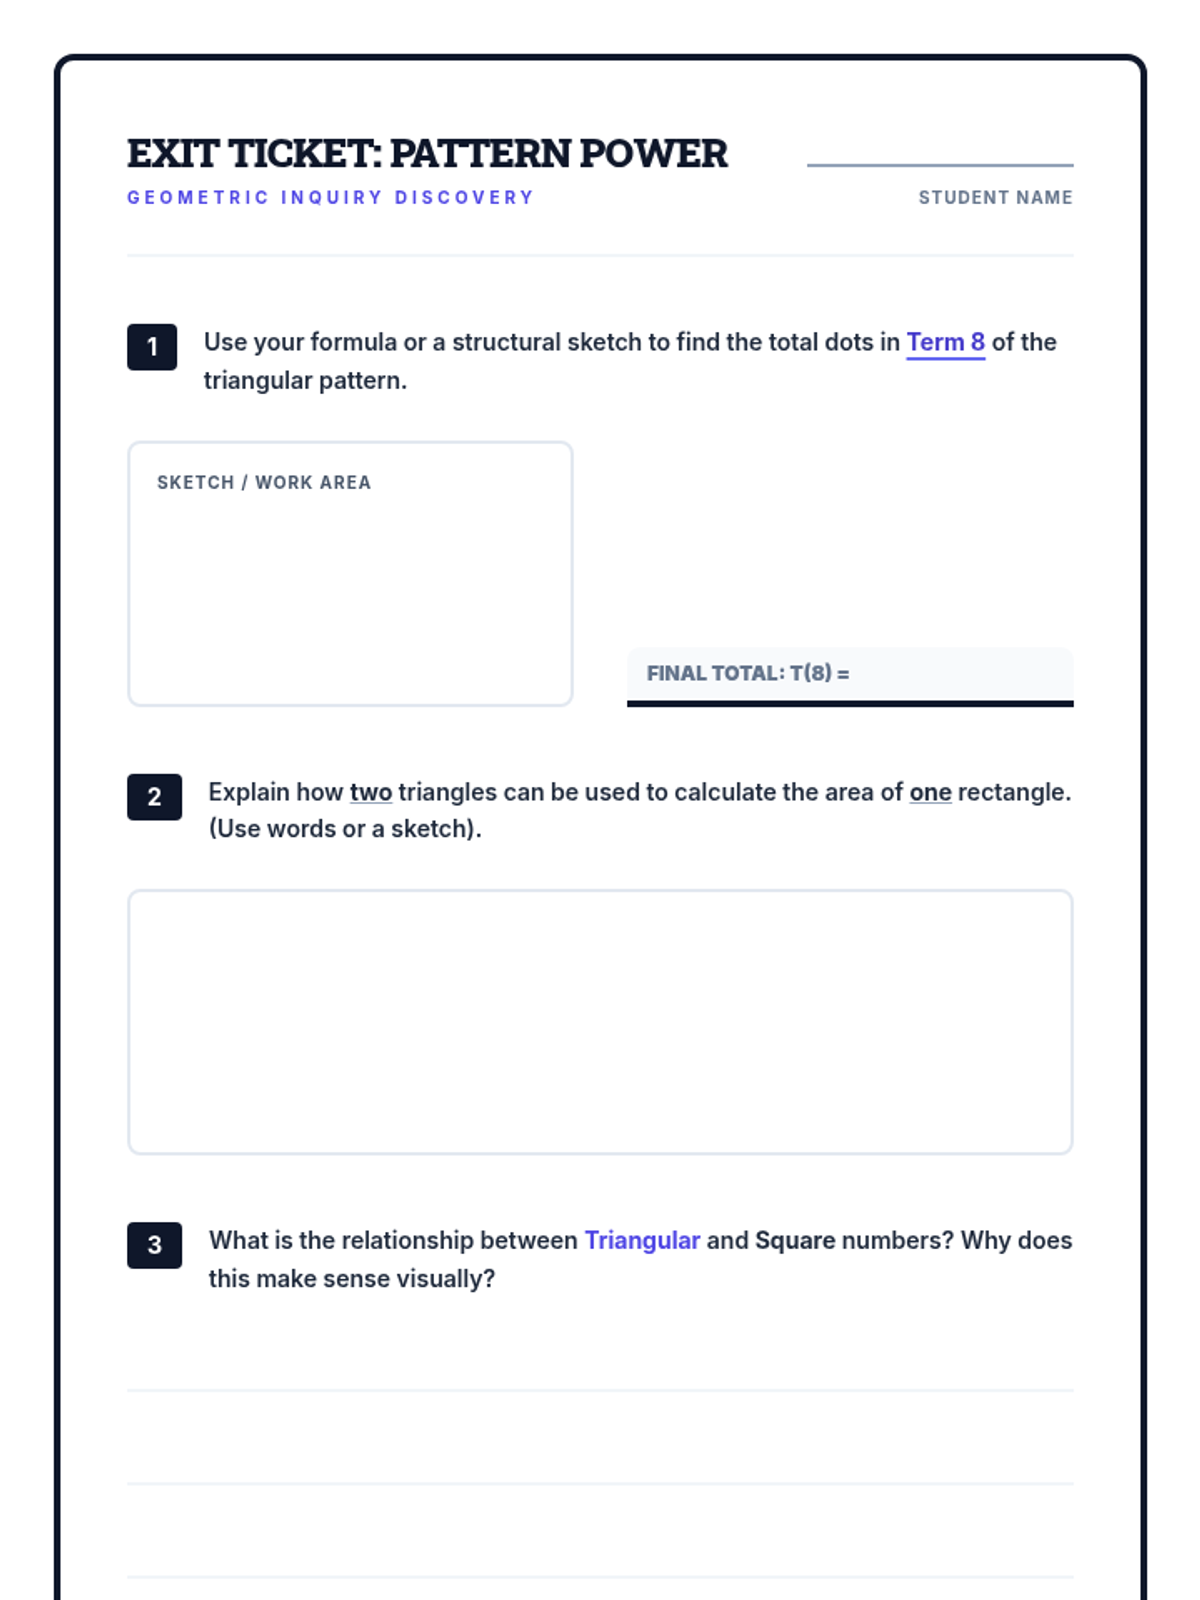
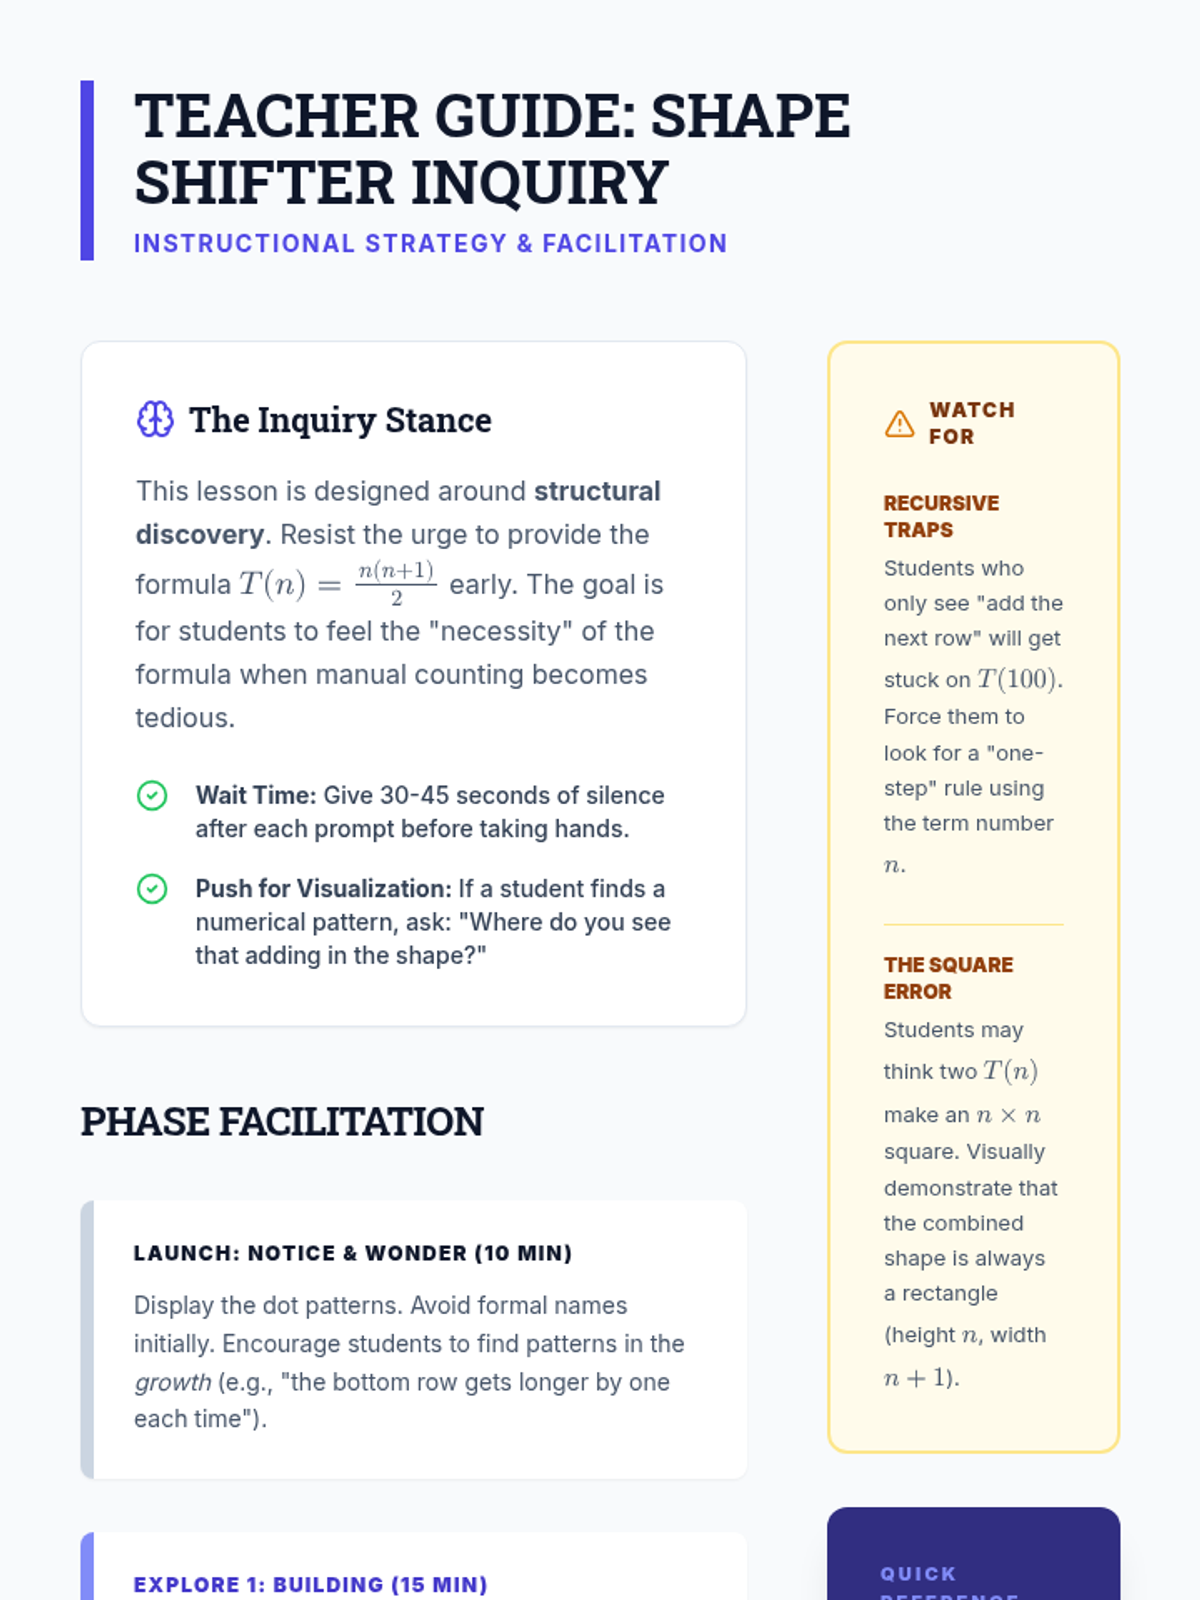
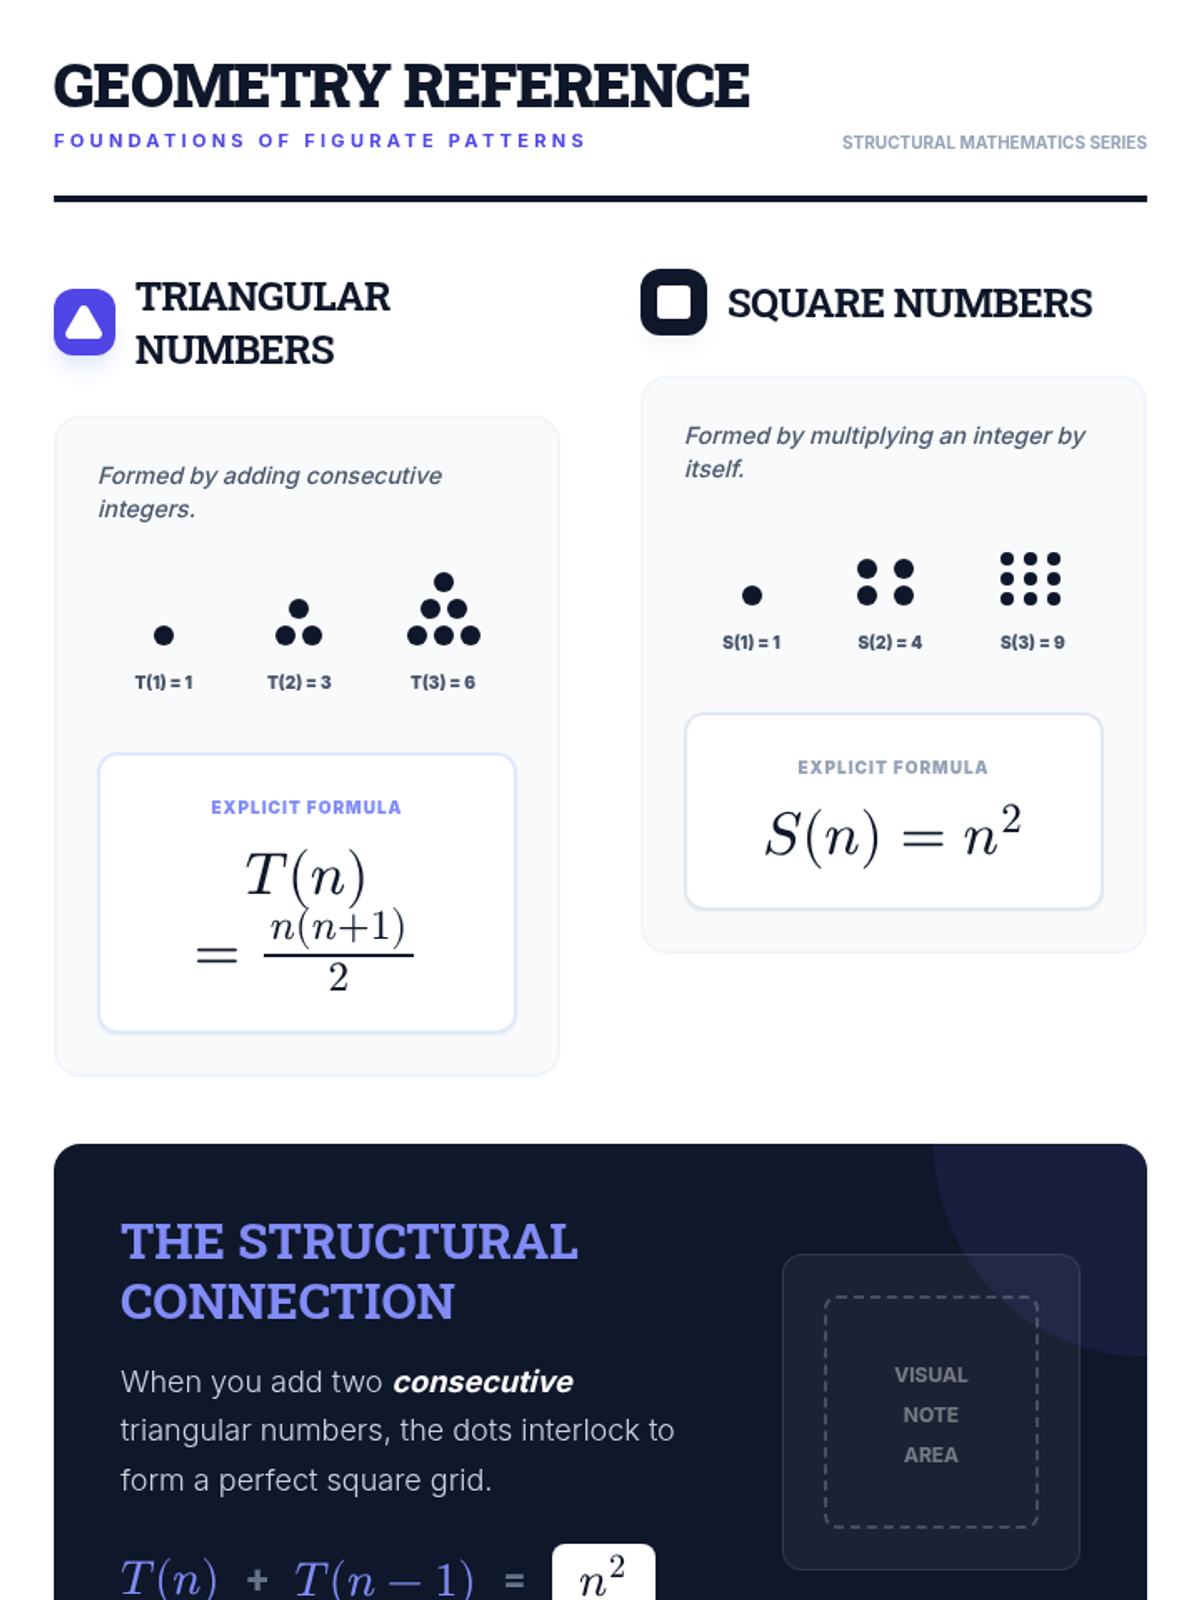
An inquiry-based exploration of triangular and square numbers where students discover formulas through visual manipulation and structural analysis.
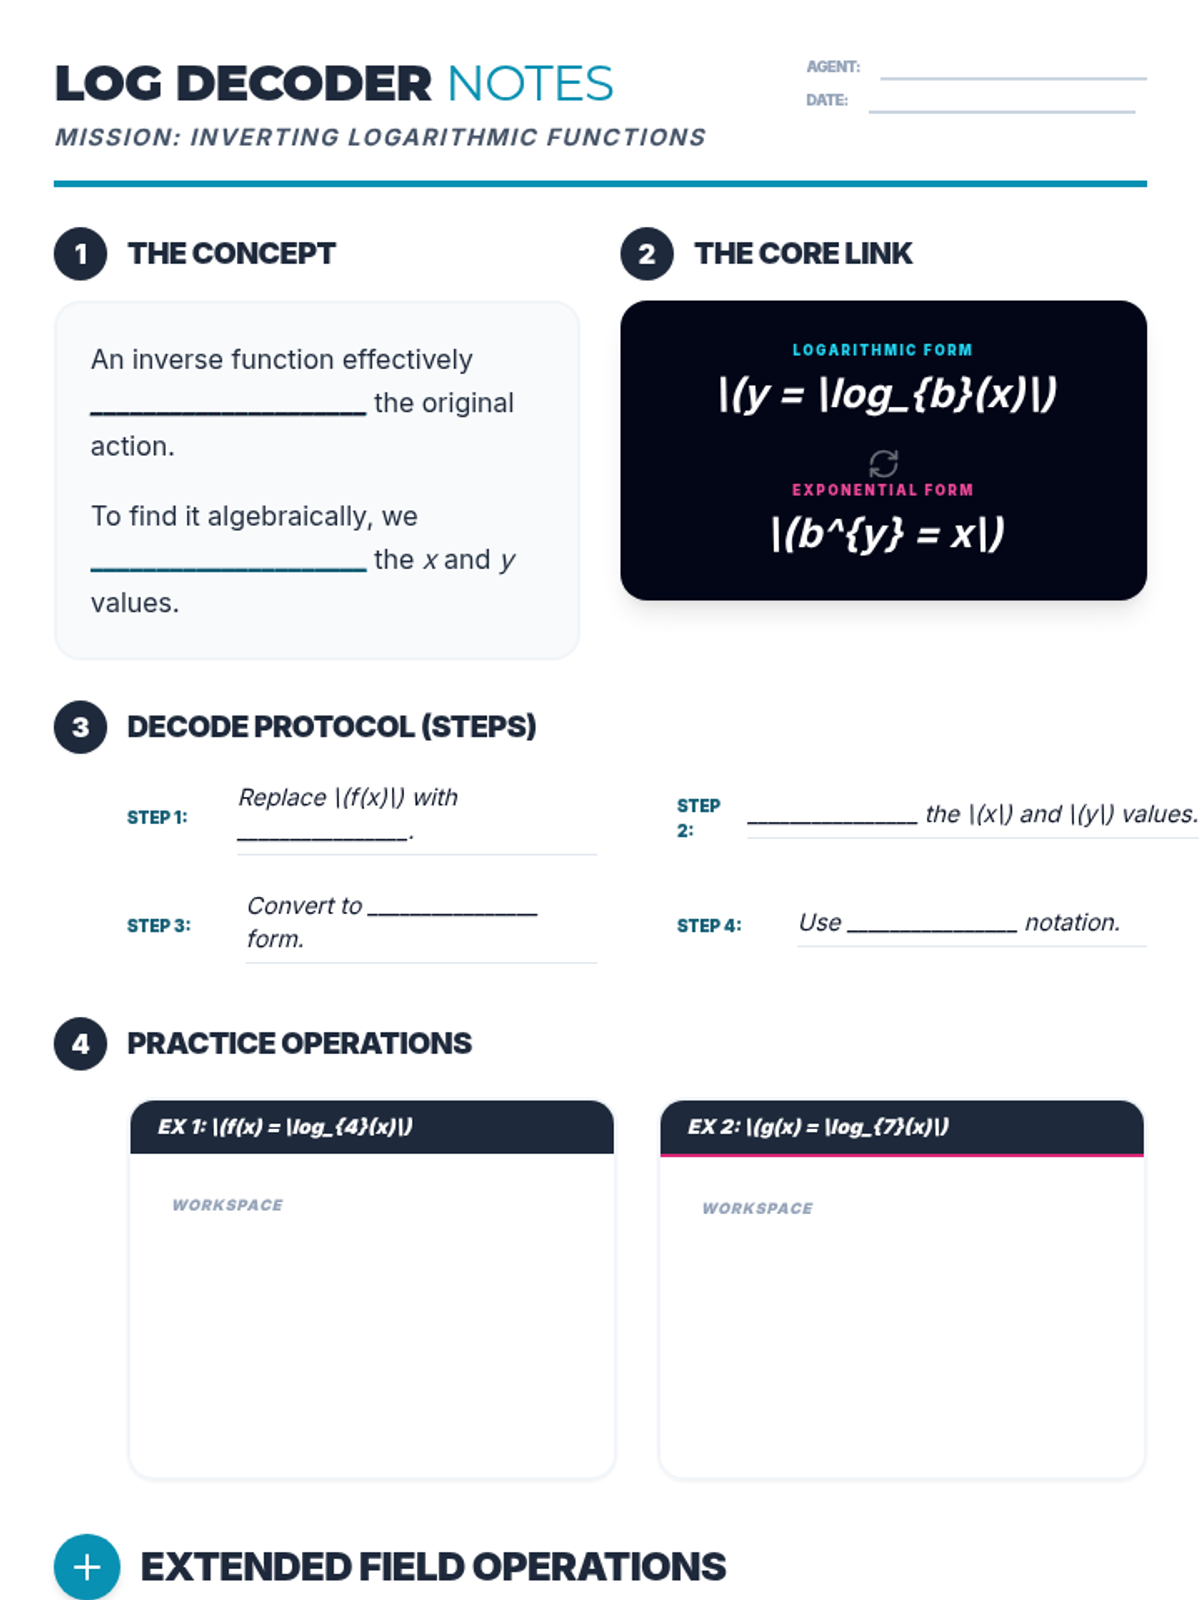
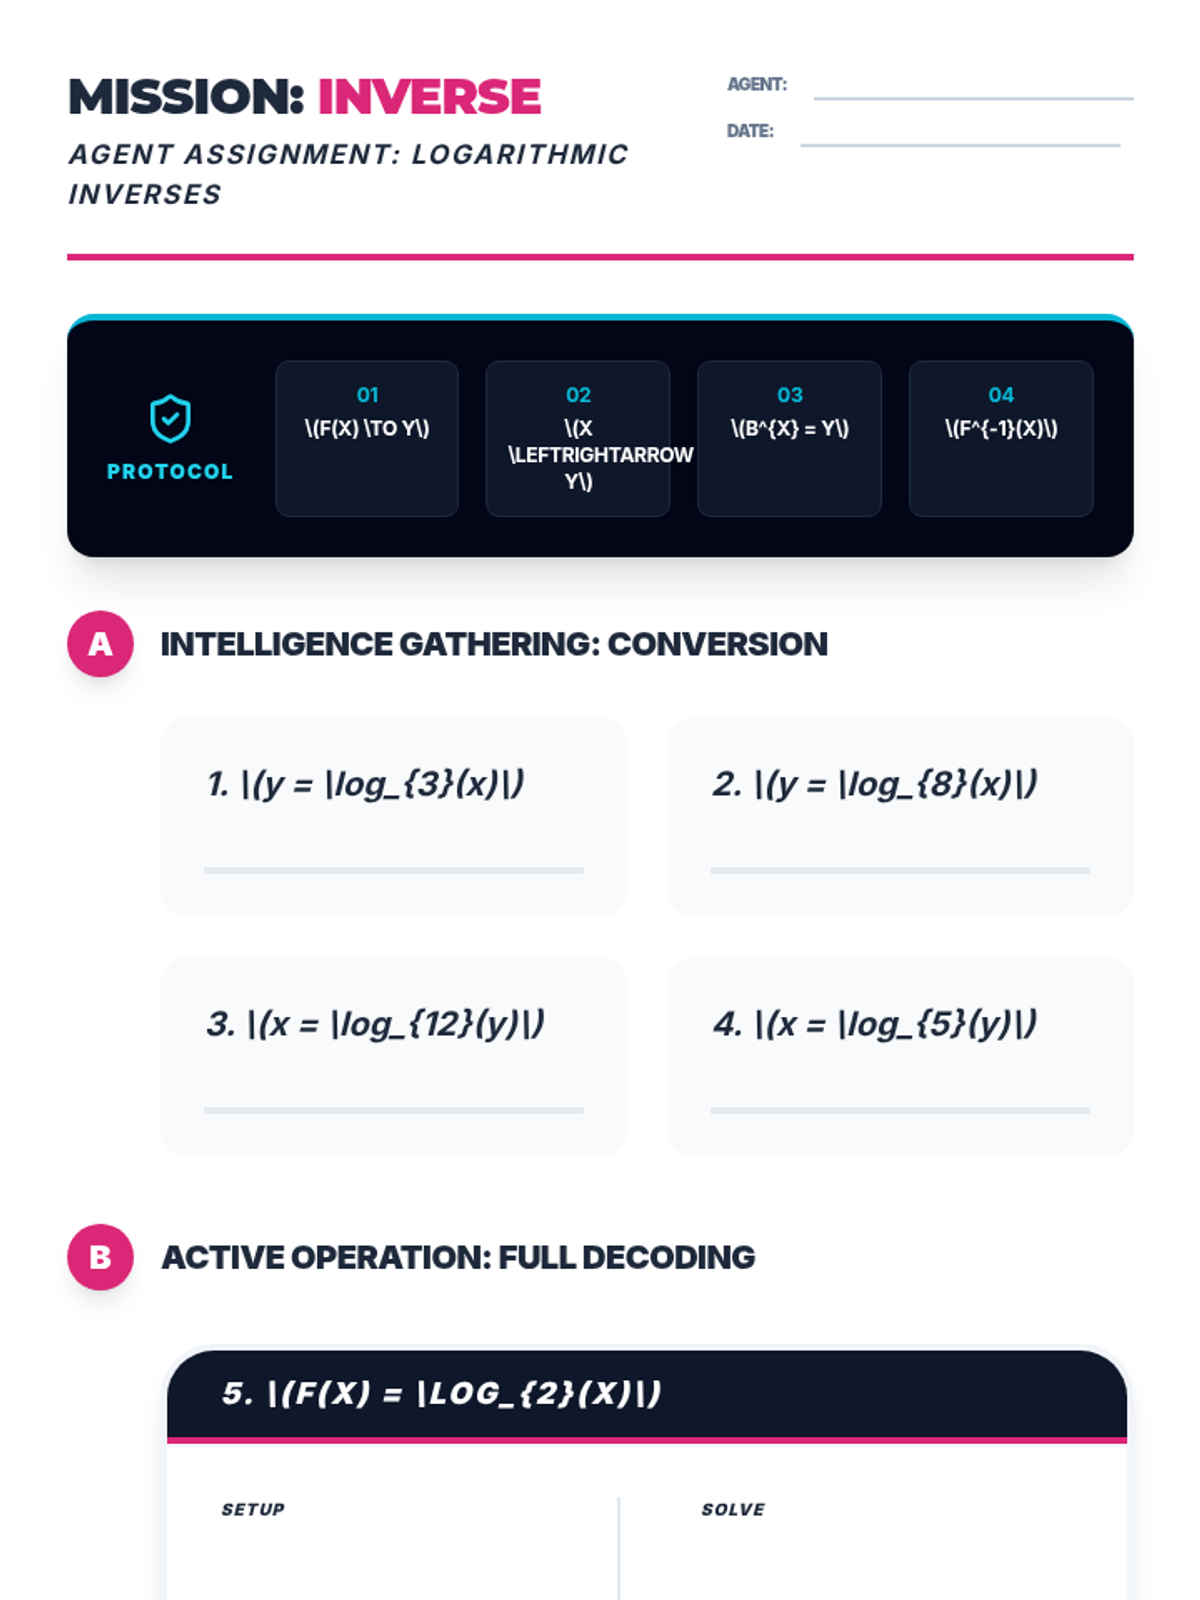
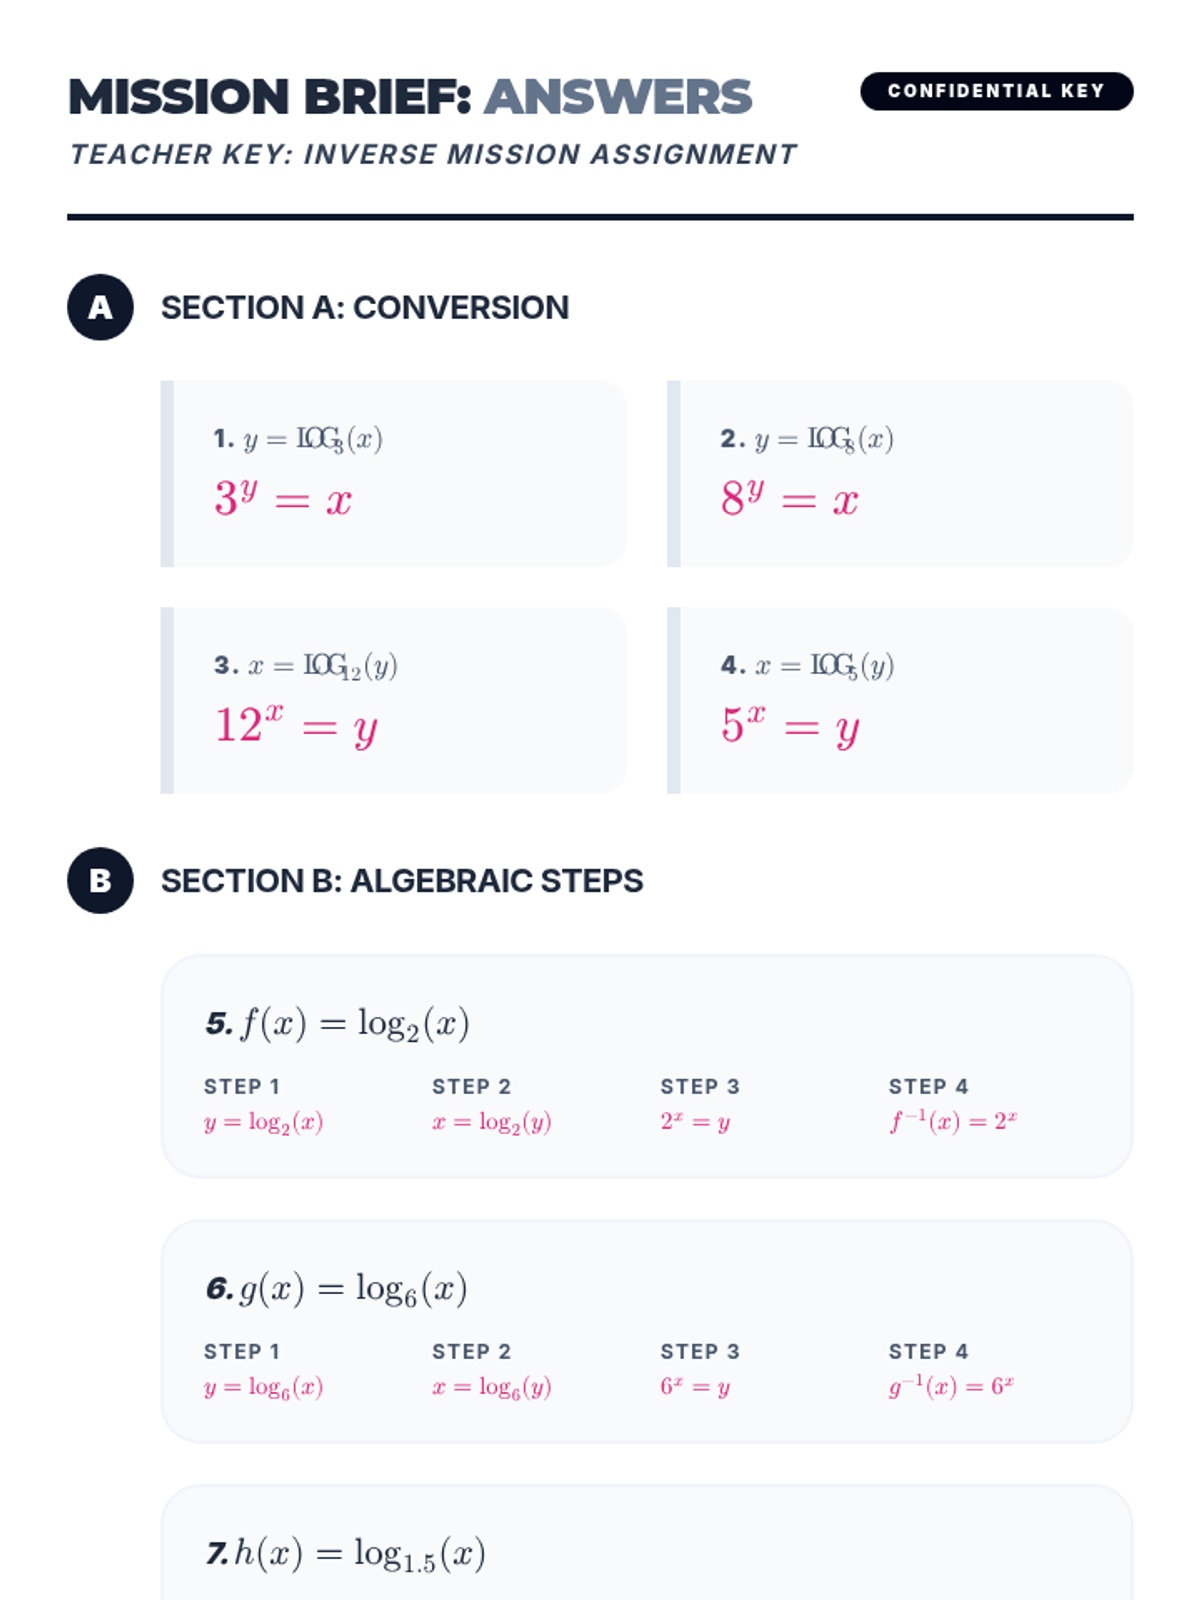
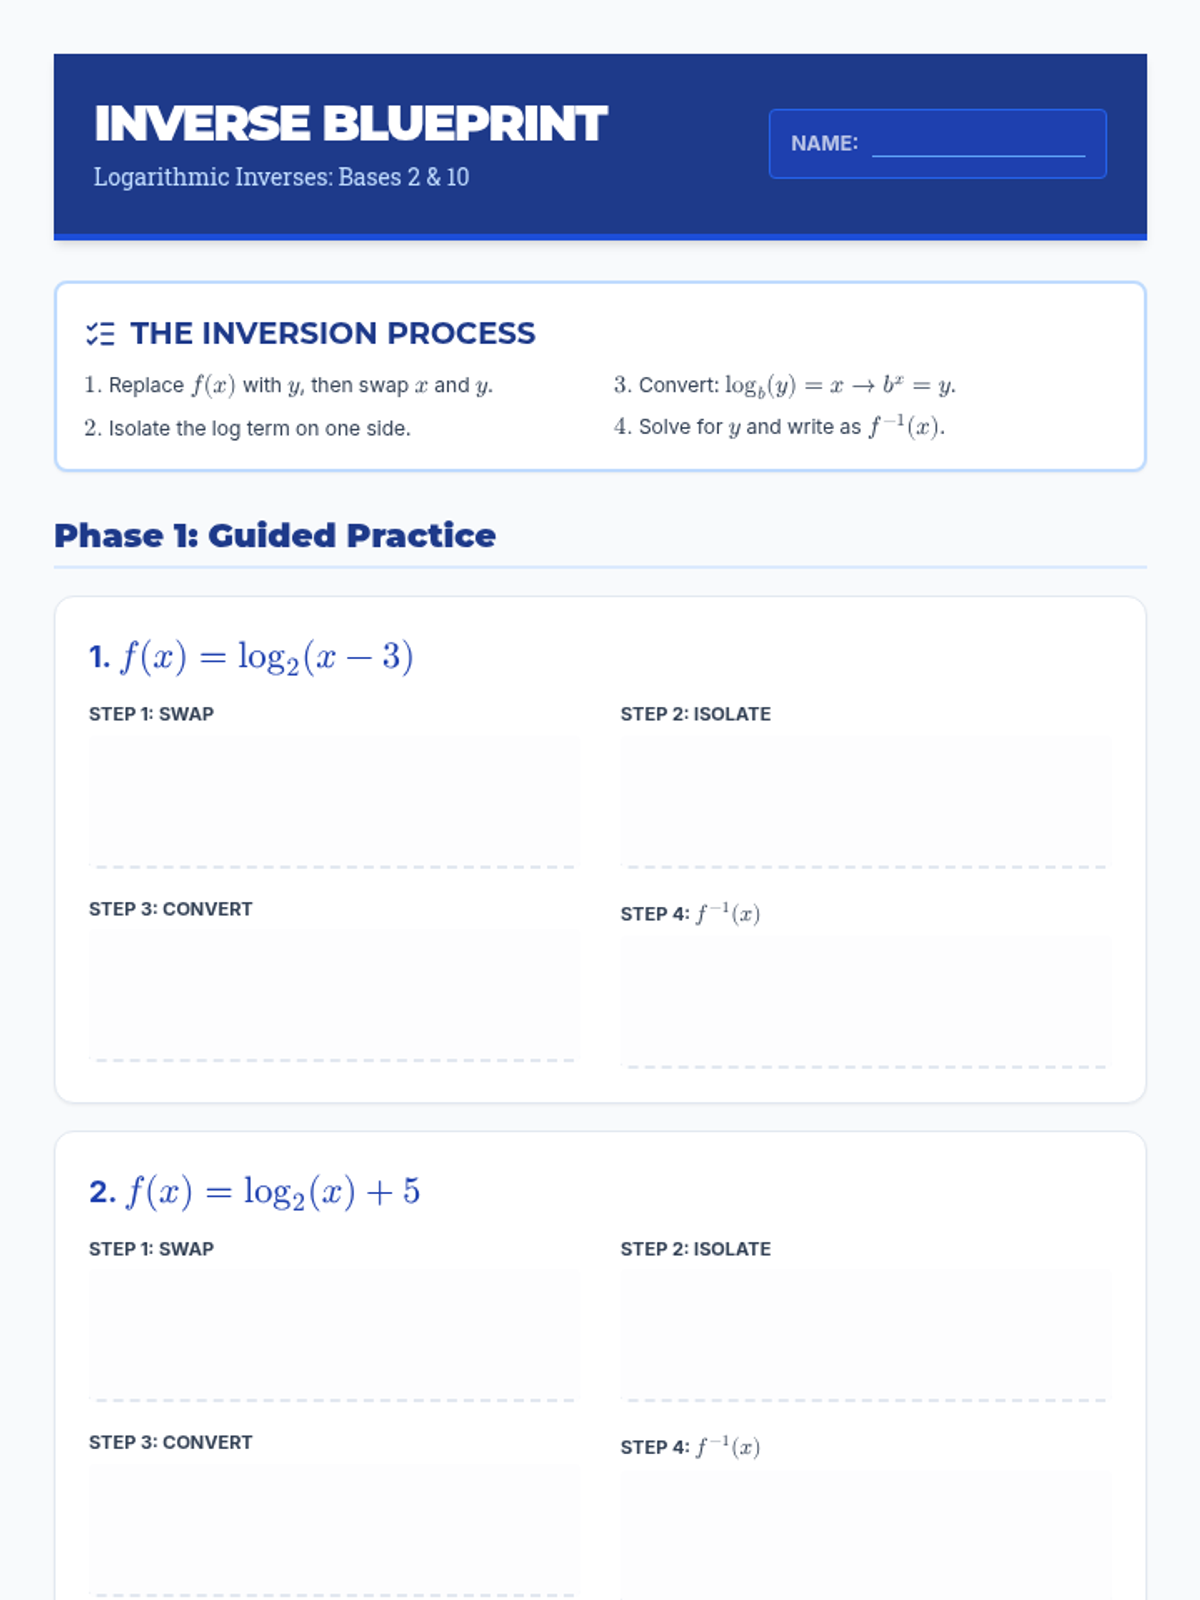
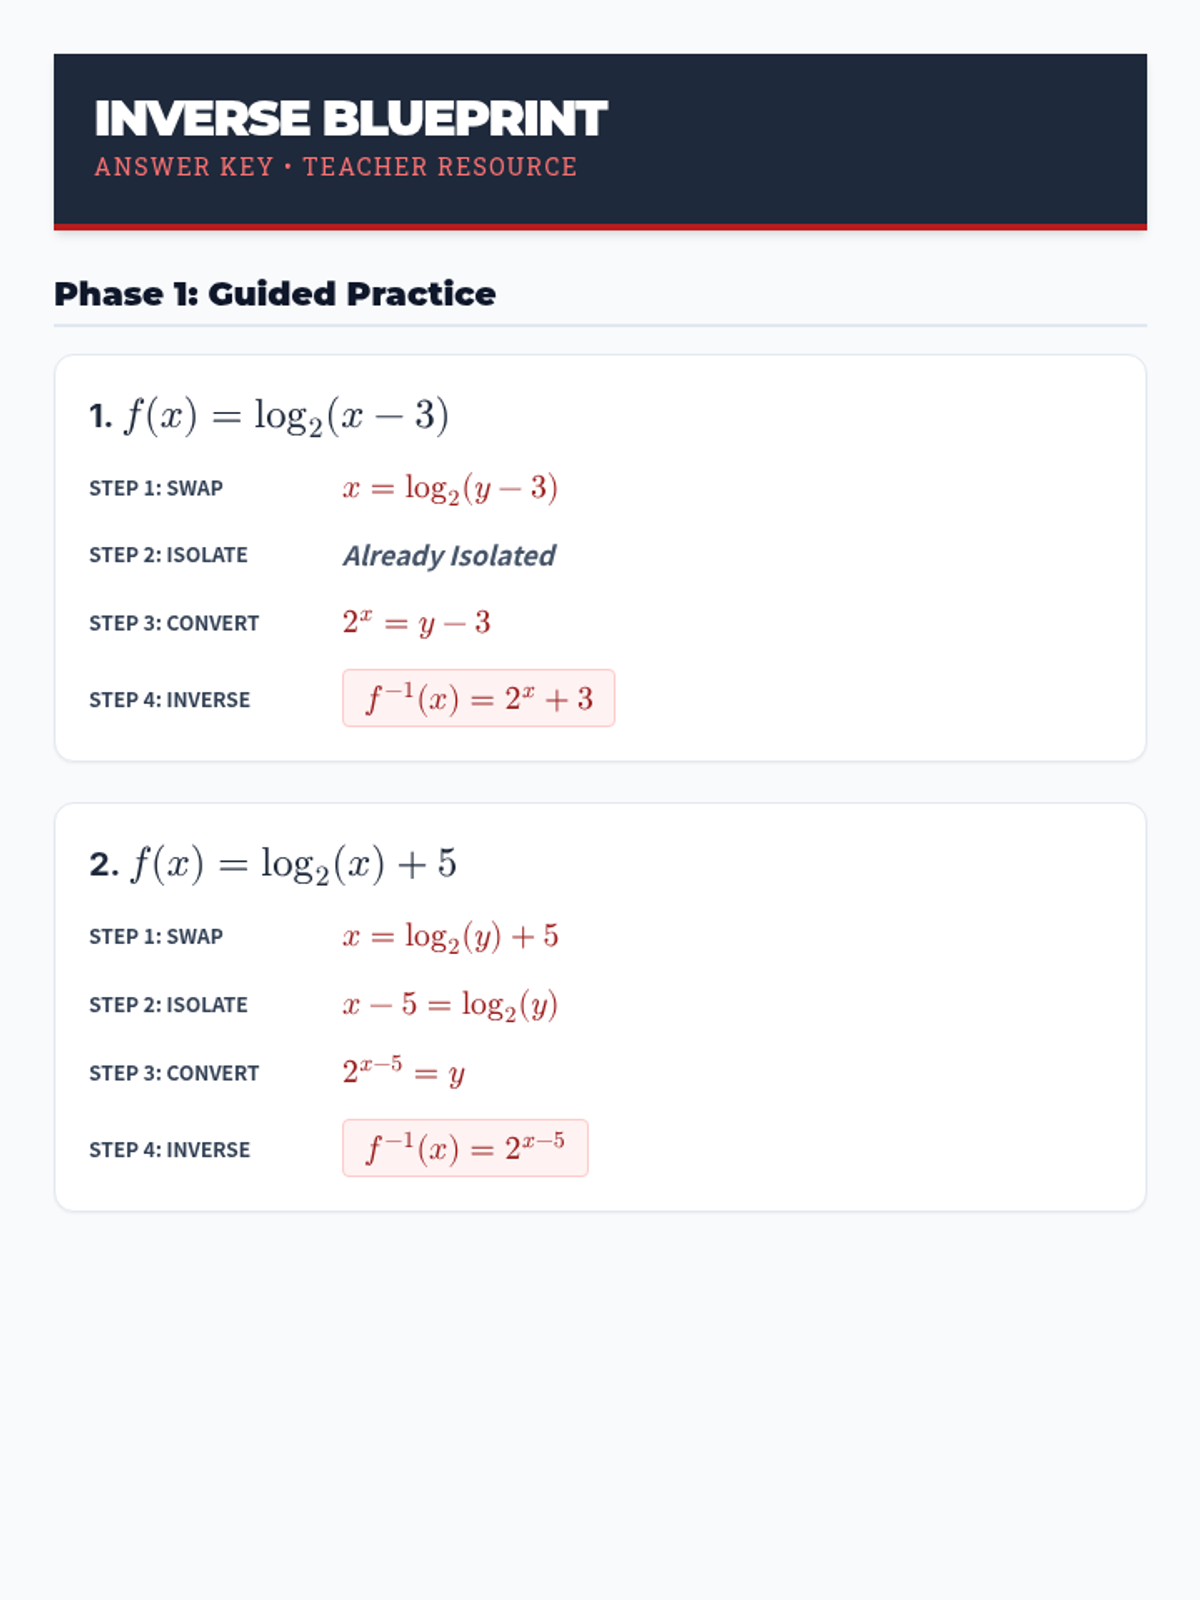
A lesson covering the step-by-step process of finding the algebraic inverse of basic logarithmic functions with various bases.
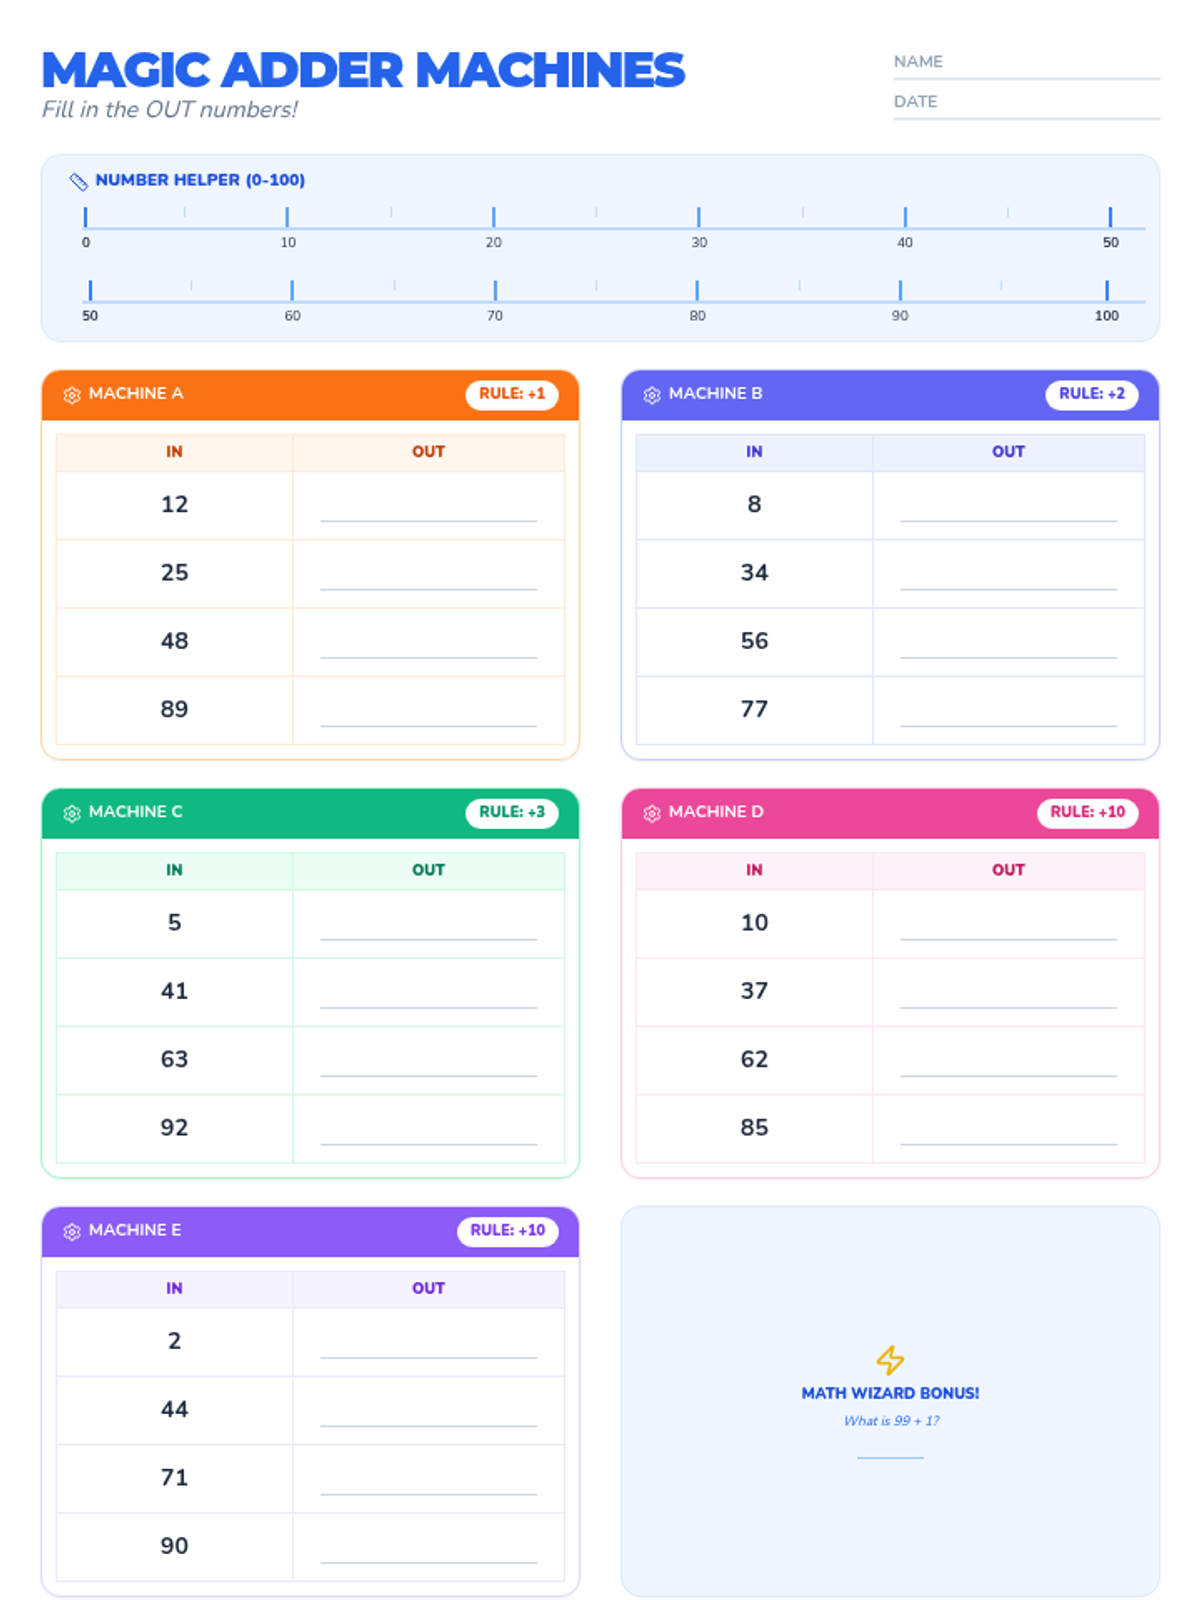
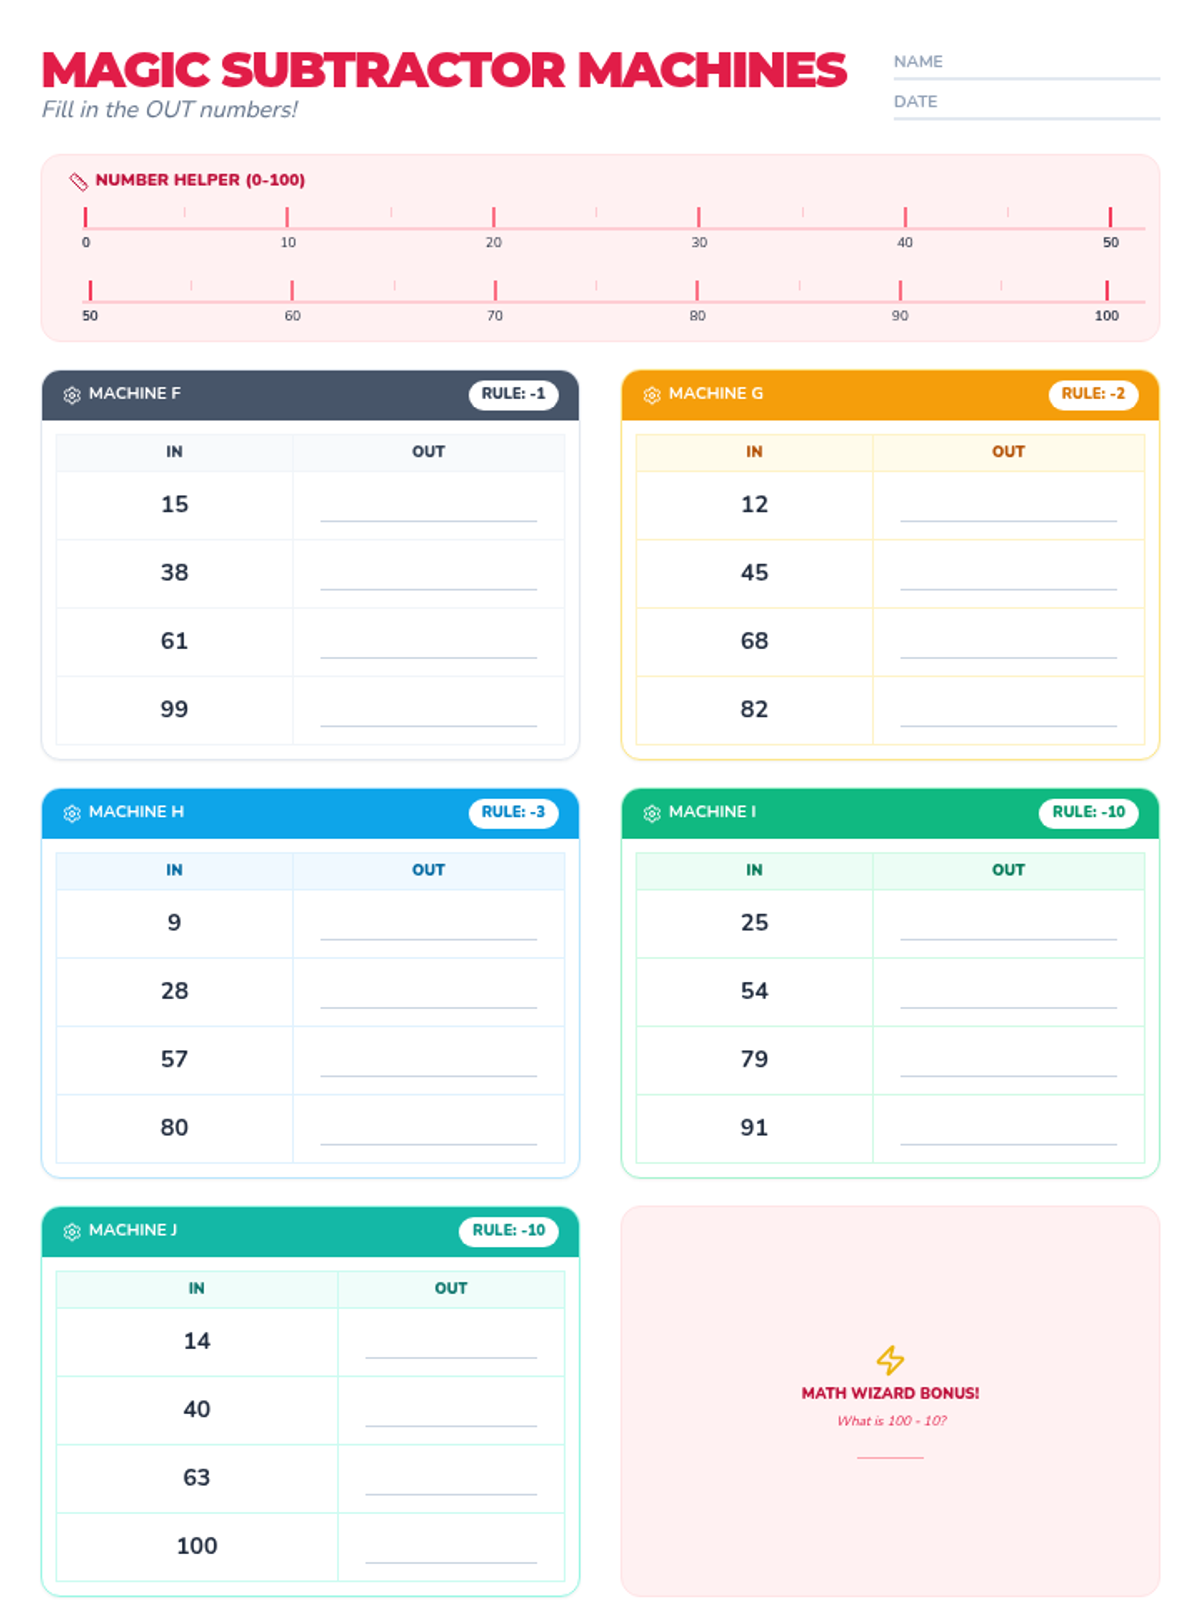
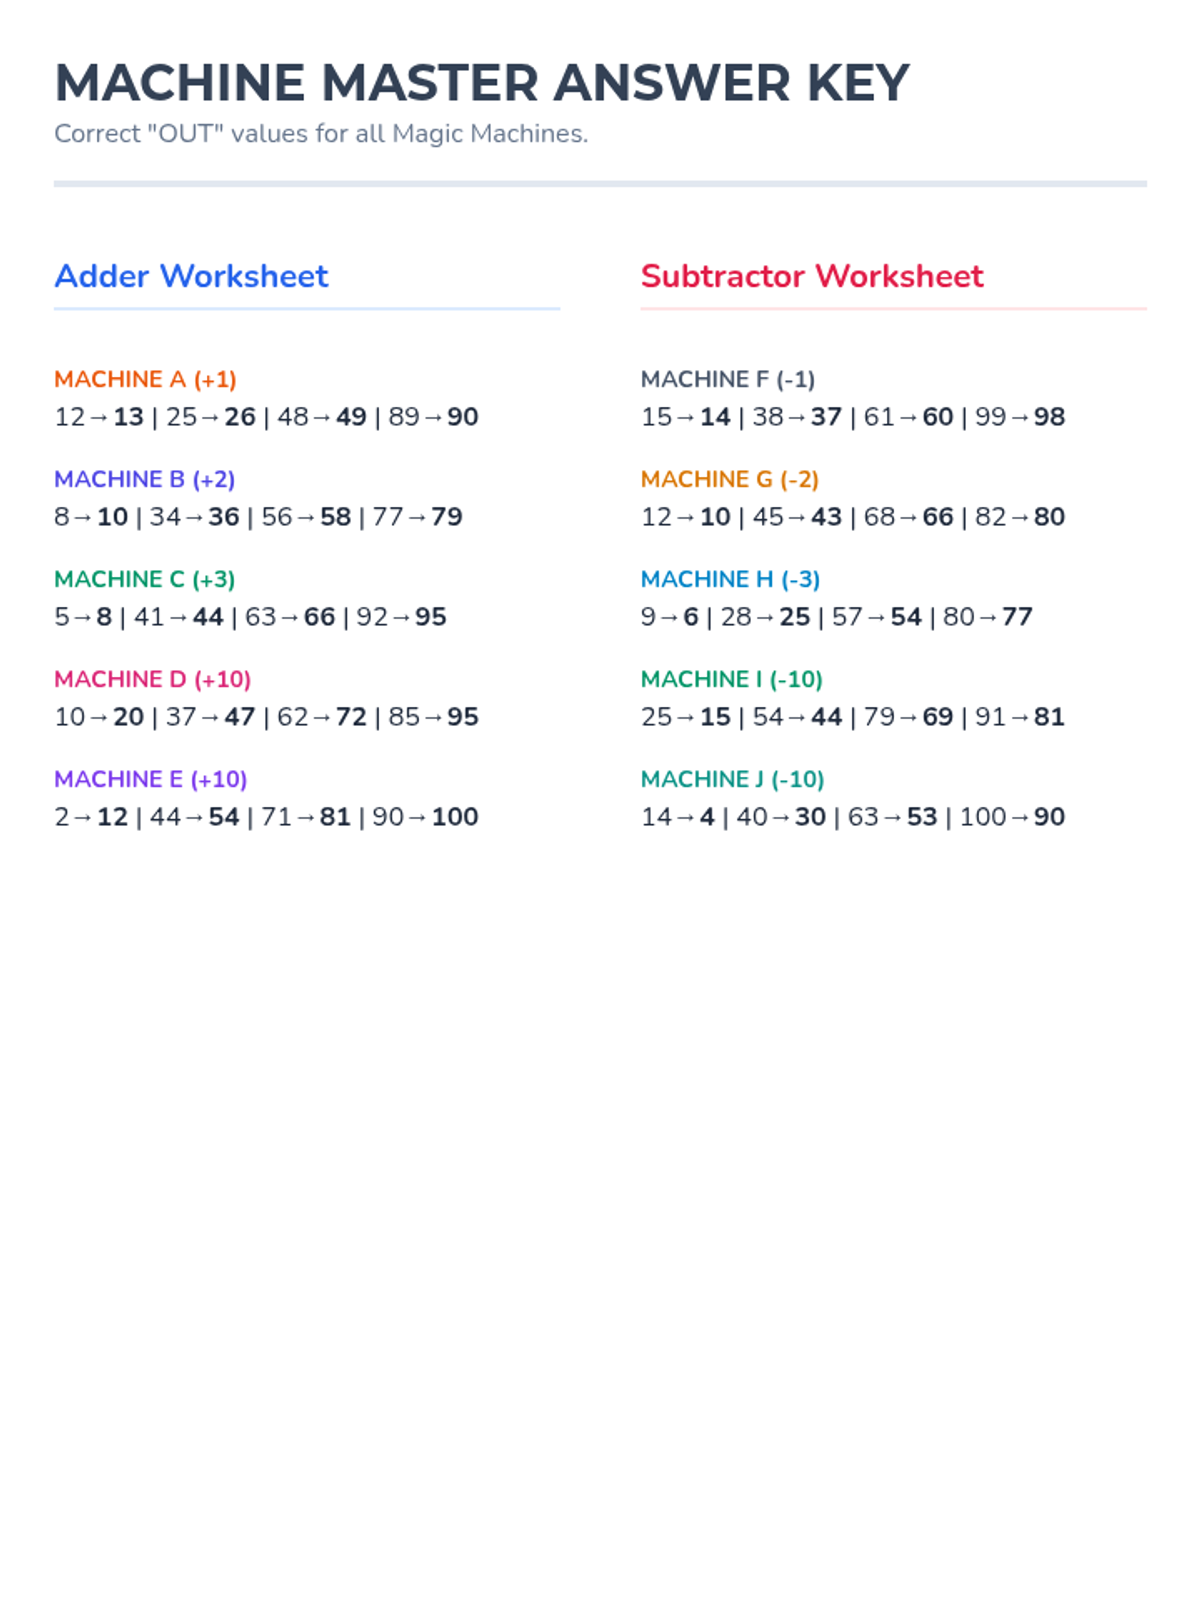
Students master mental math and number patterns by using 'function machines' to add and subtract 1, 2, 3, and 10 with numbers up to 100.
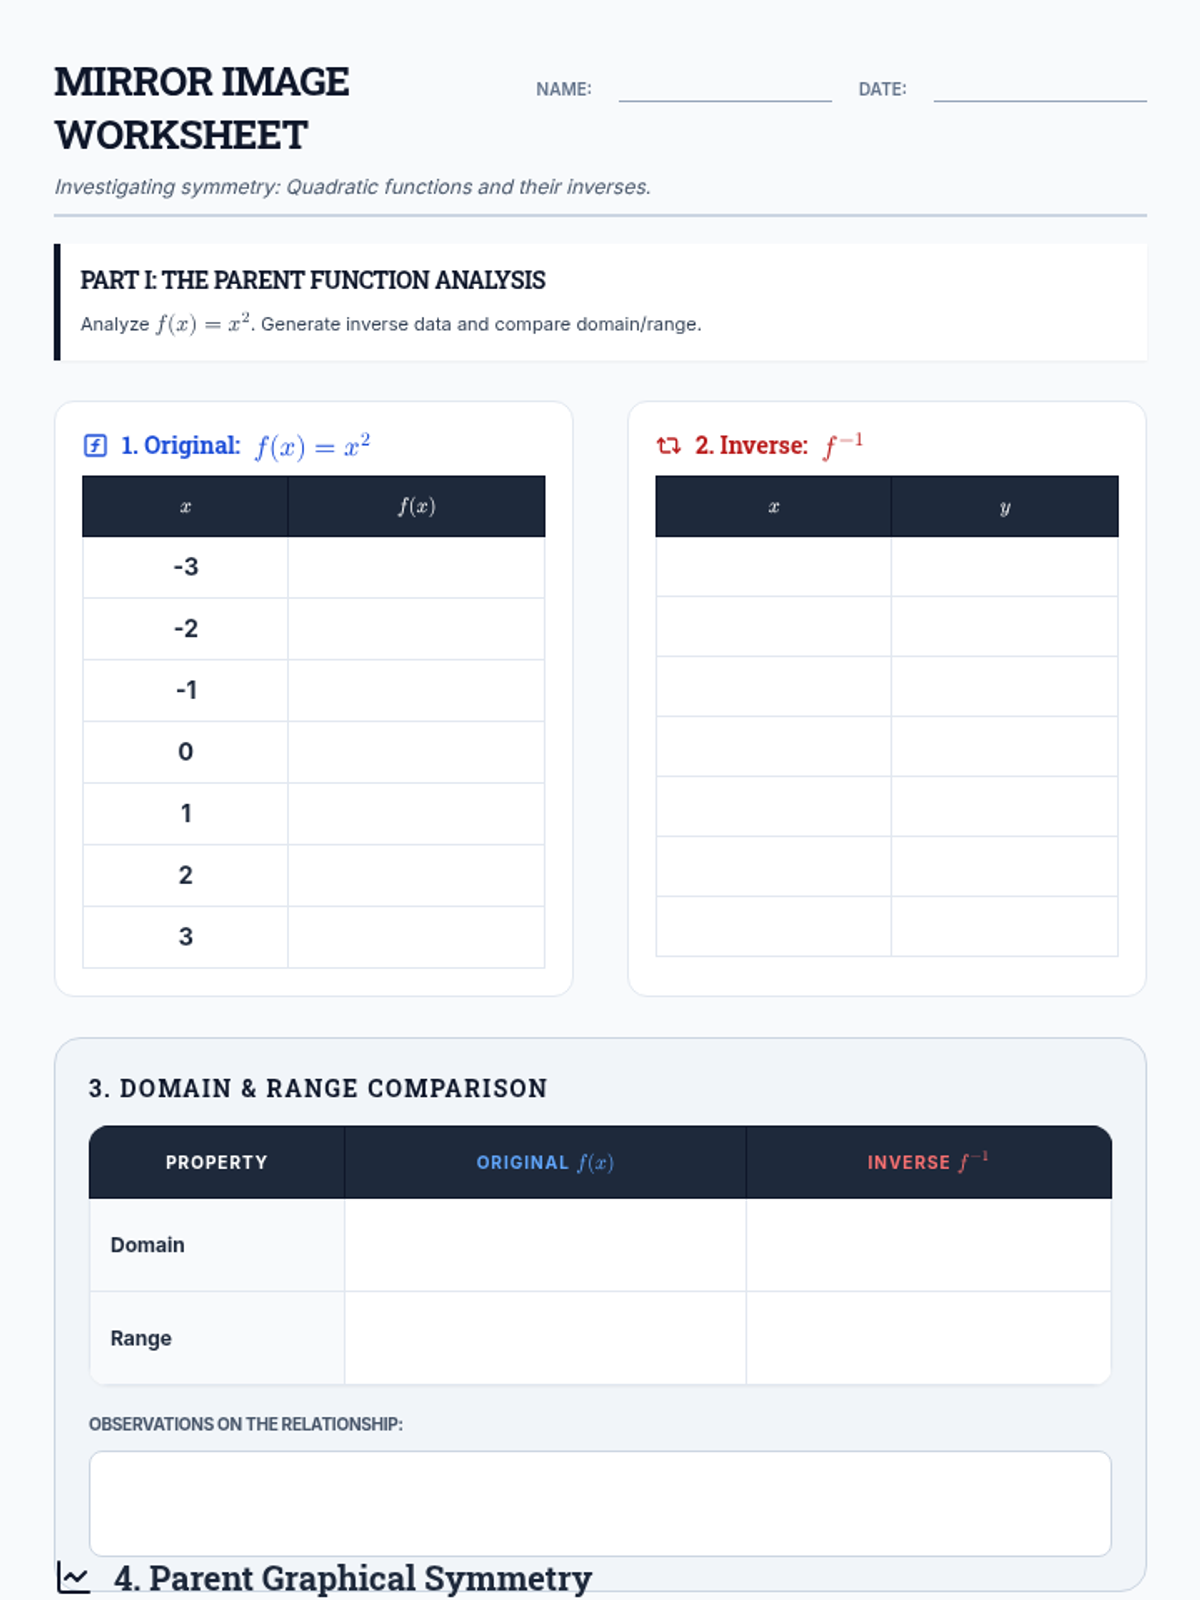
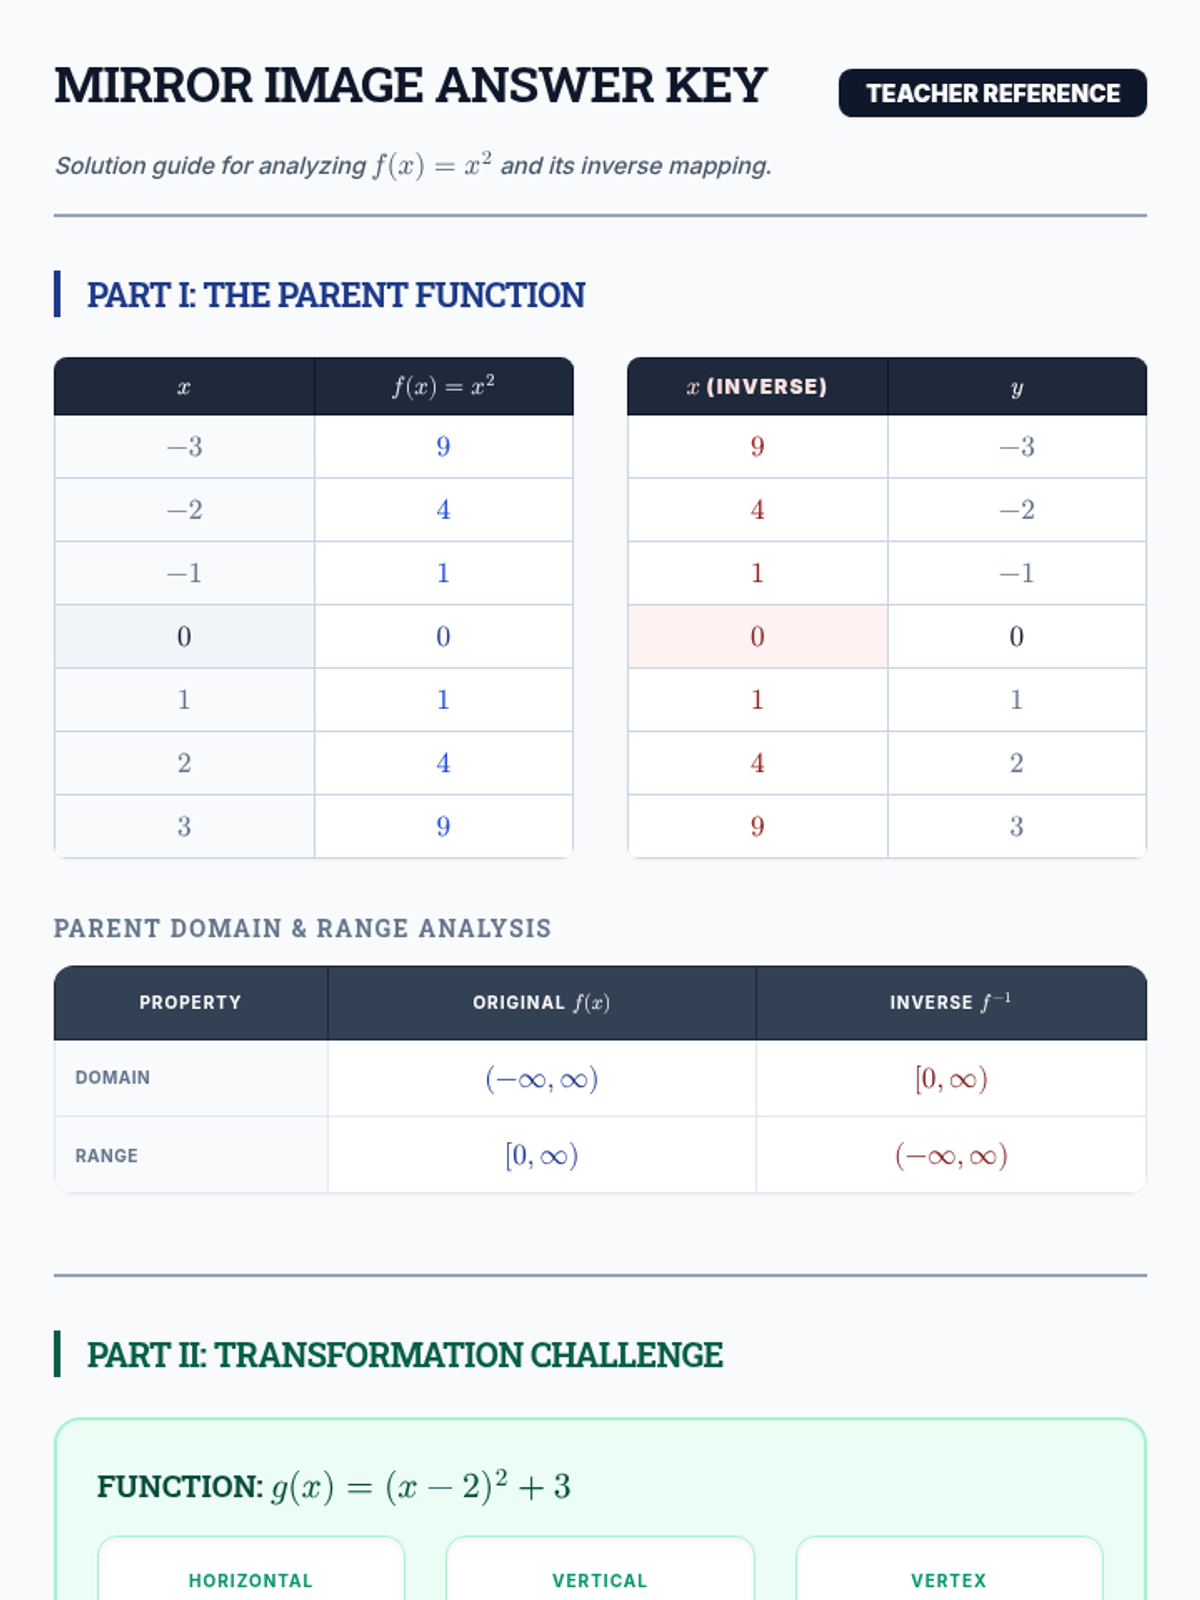
Explore the relationship between a quadratic function and its inverse. Students will graph both, compare domain and range, and determine if the inverse is a function or a relation.
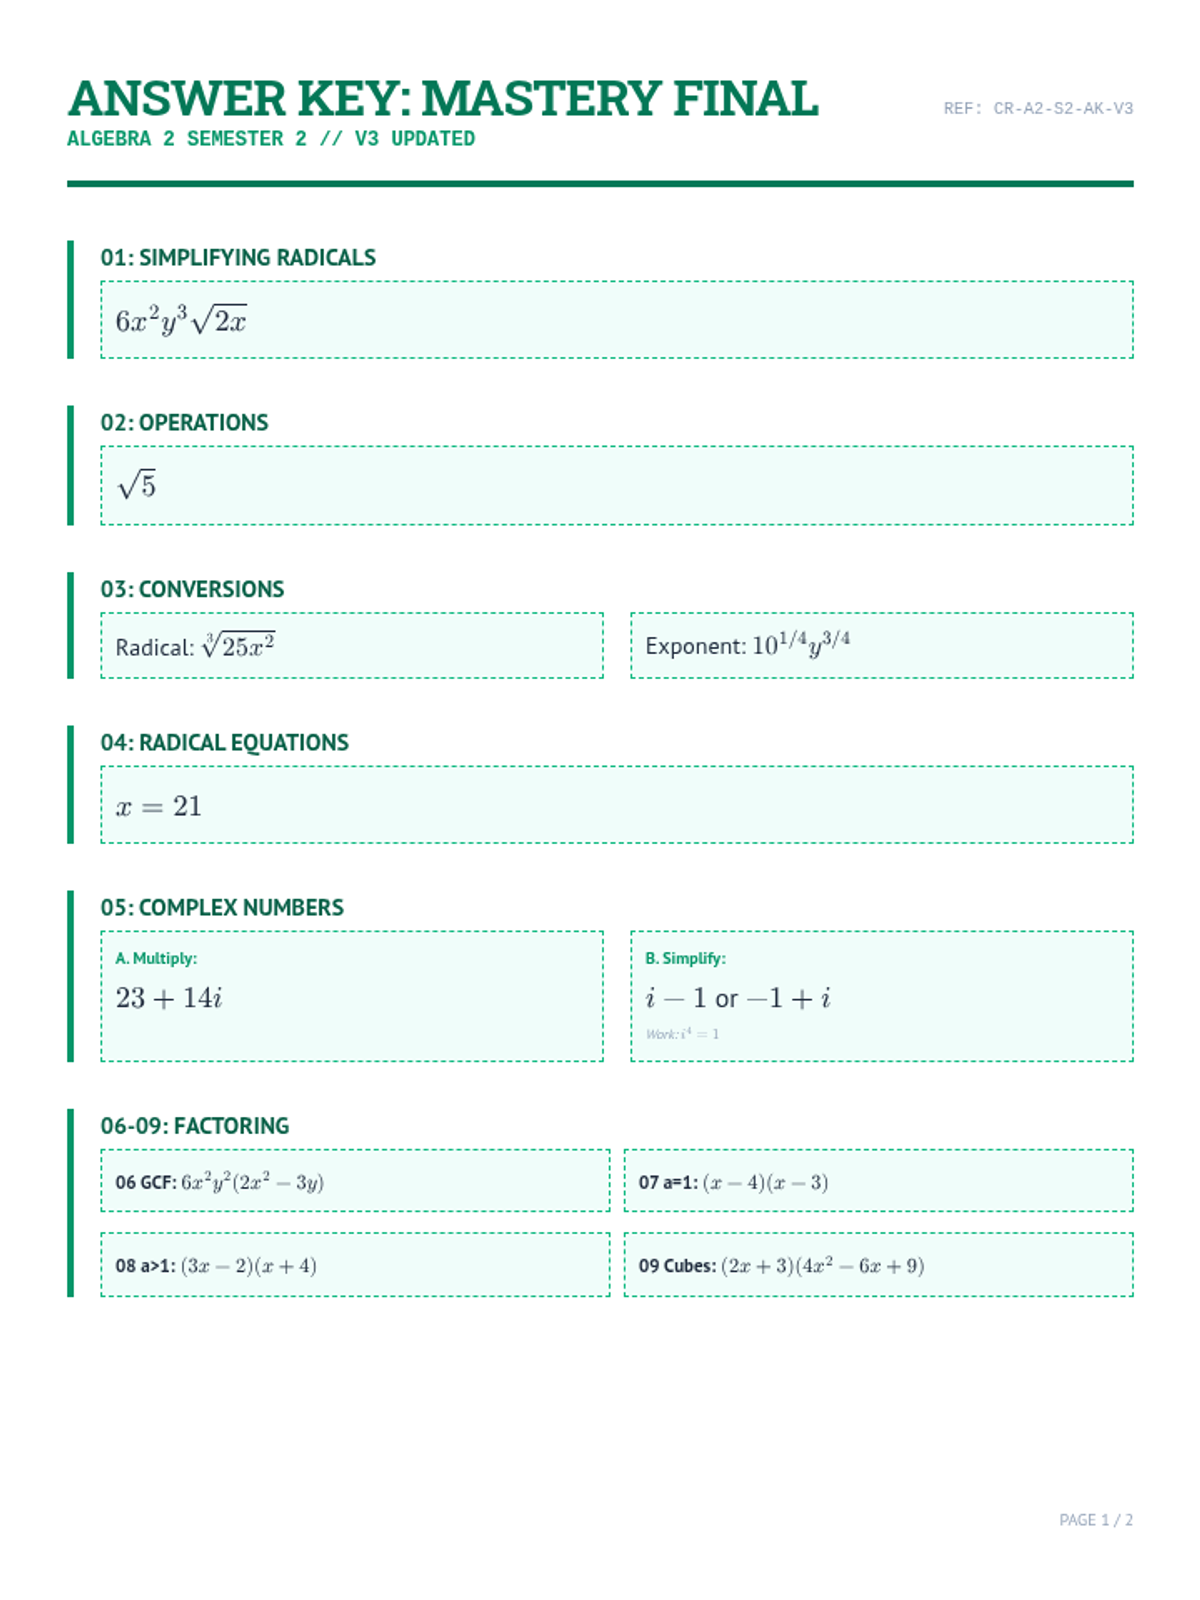
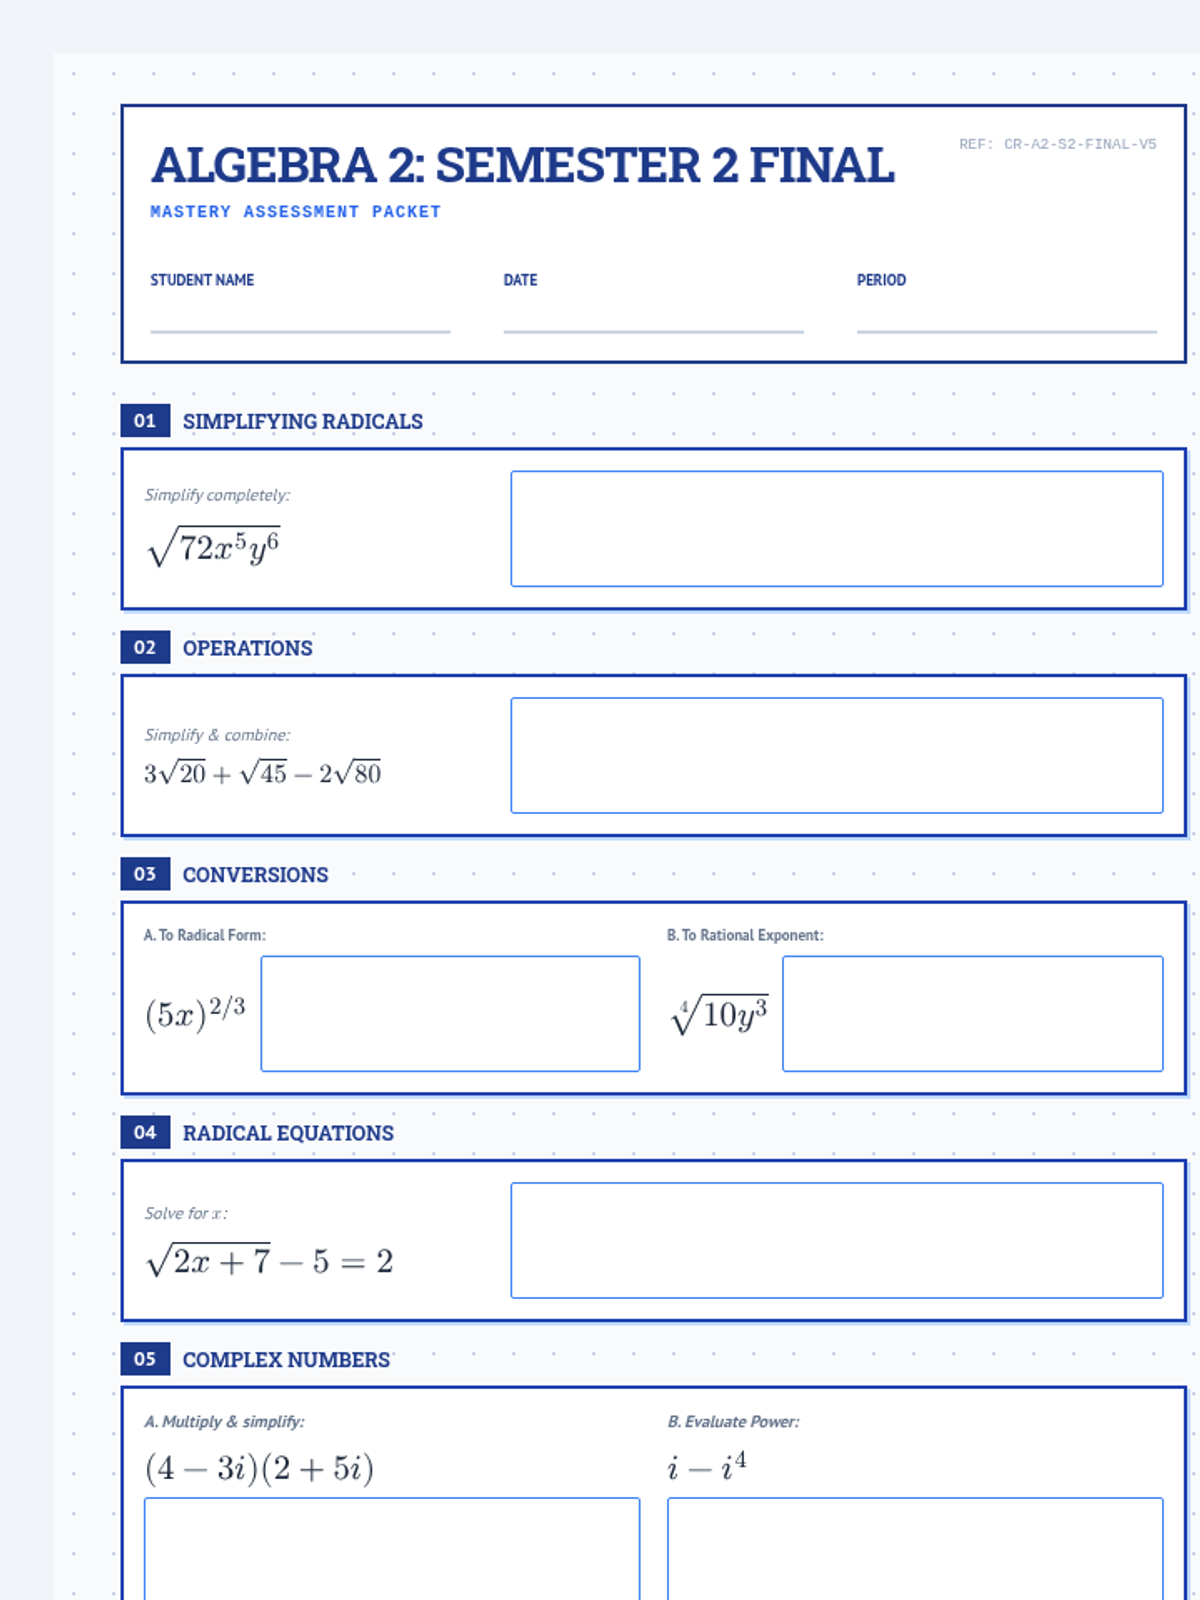
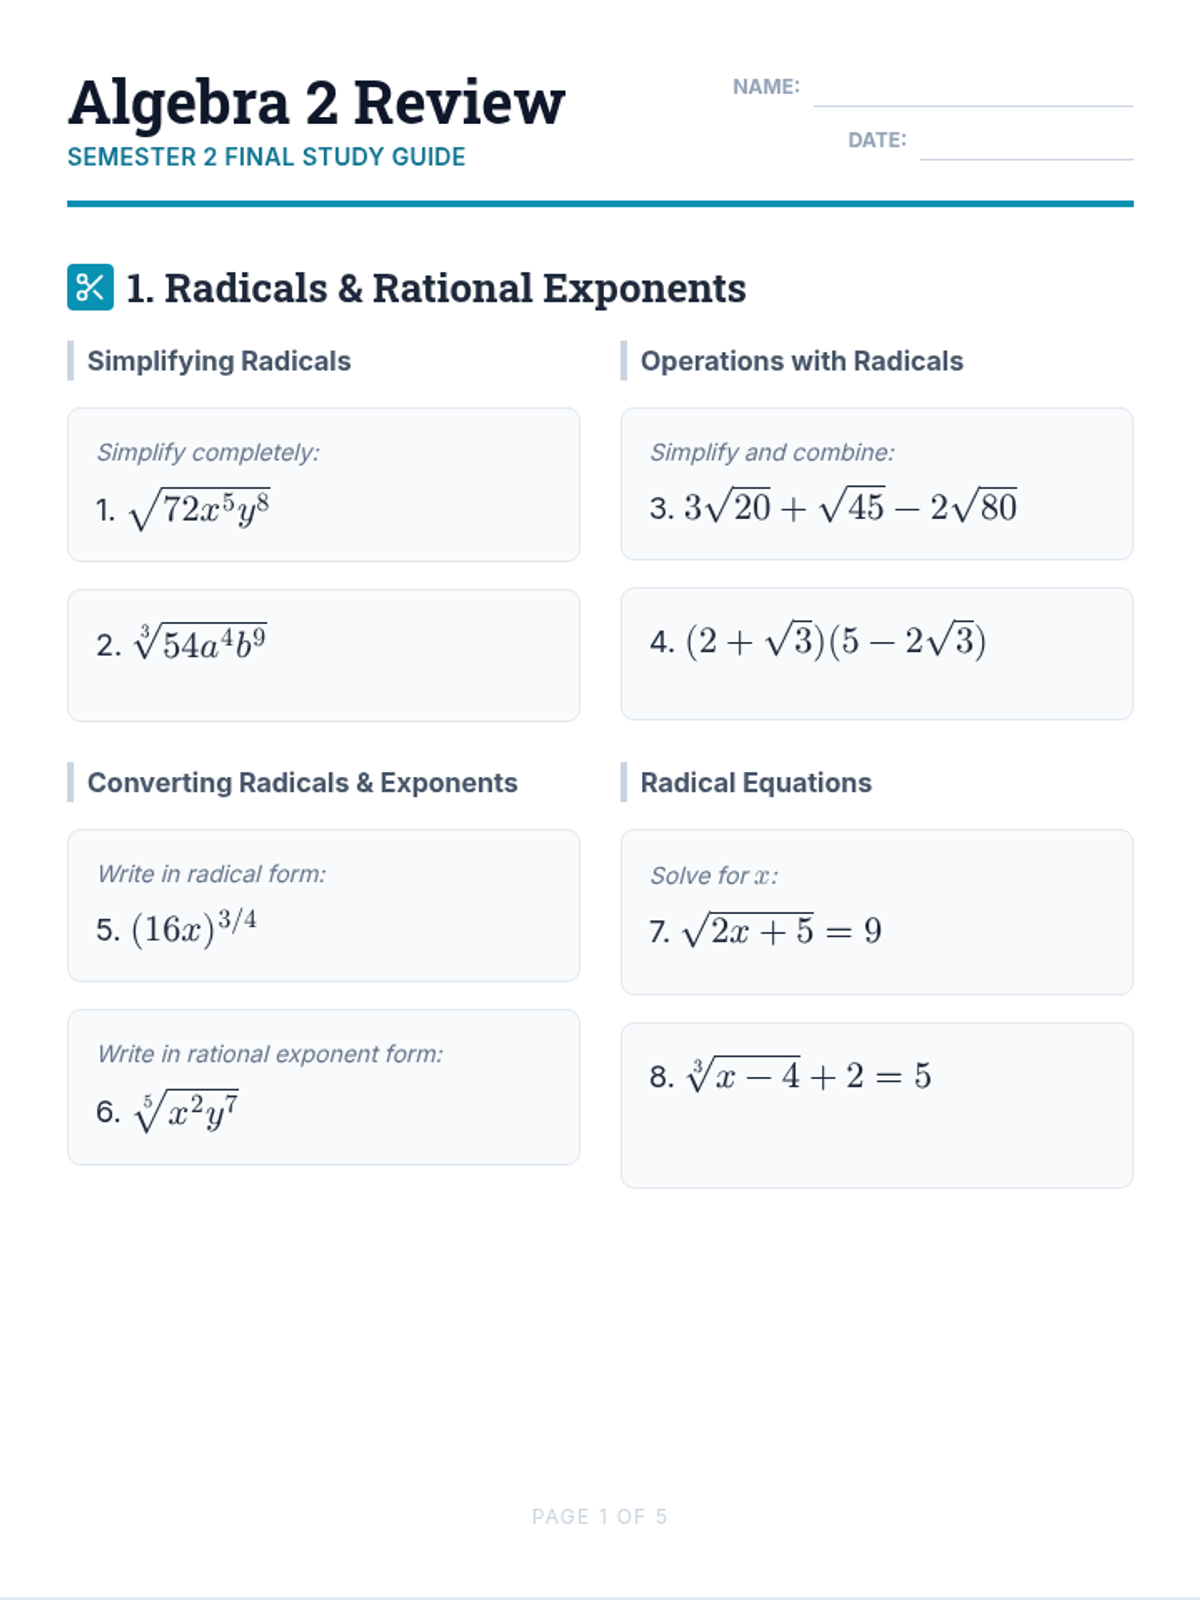
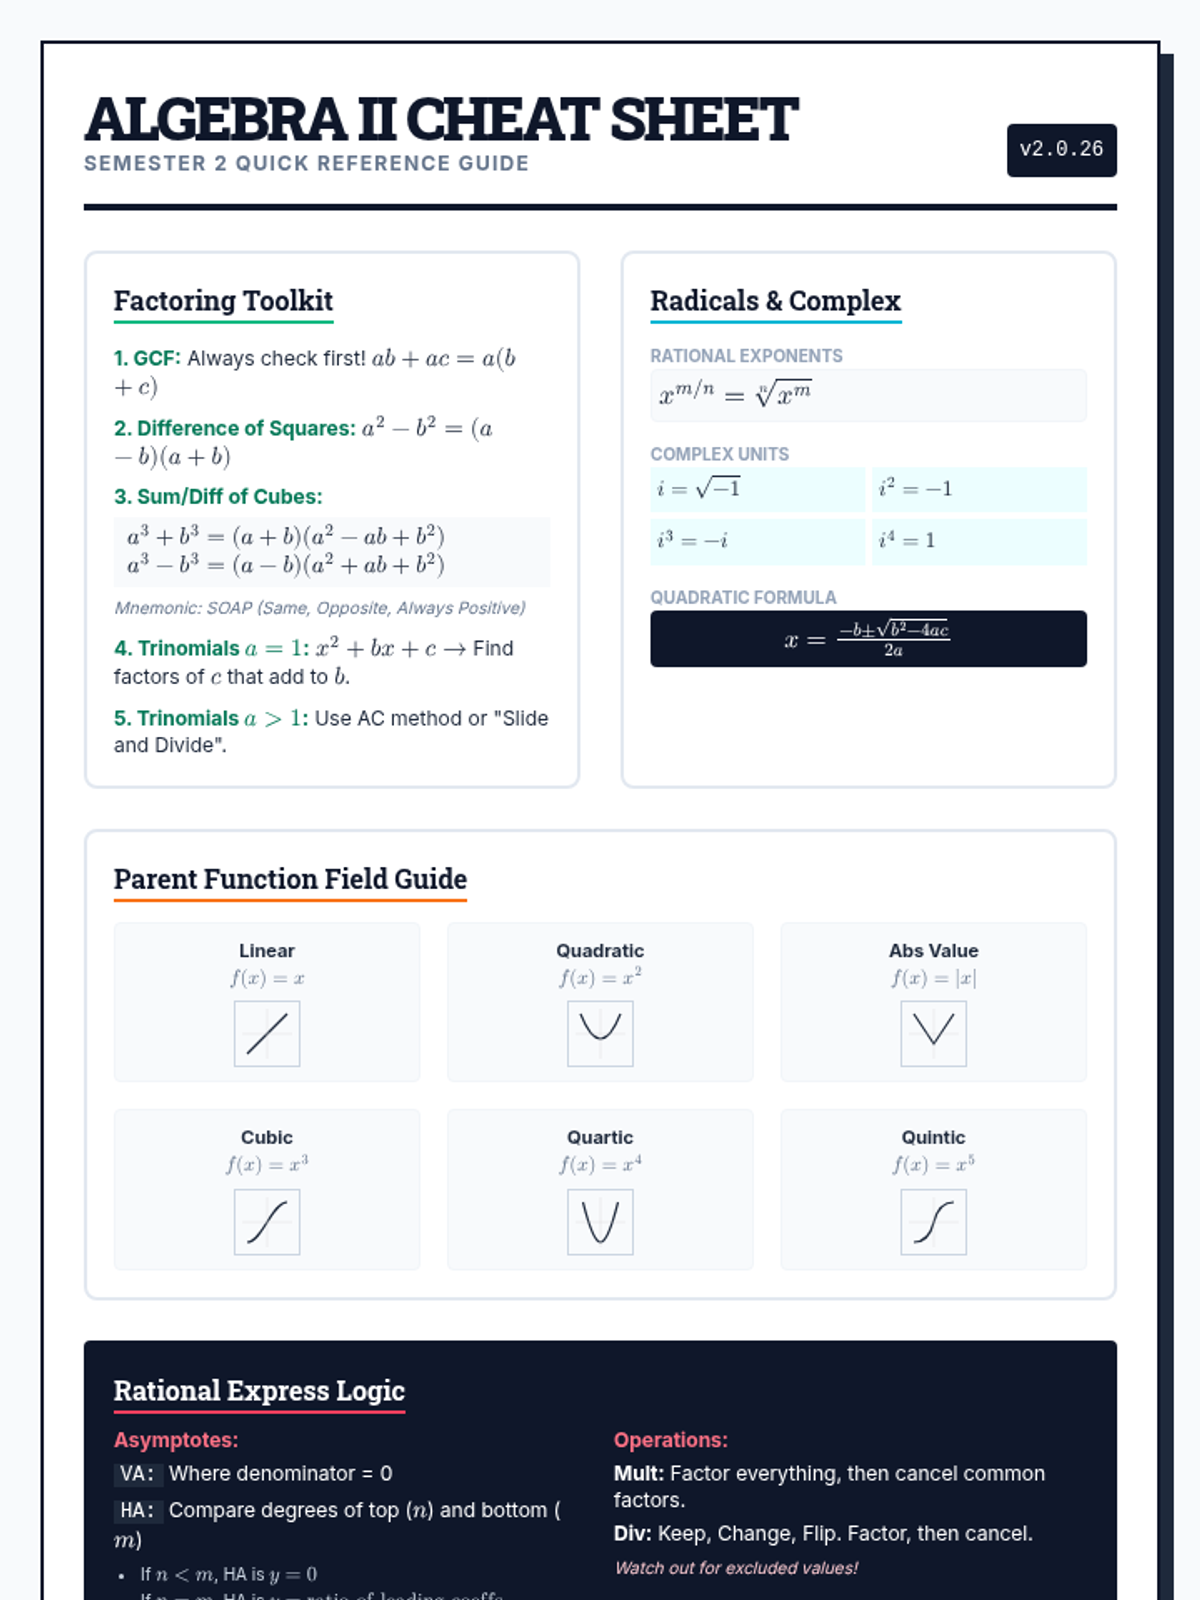
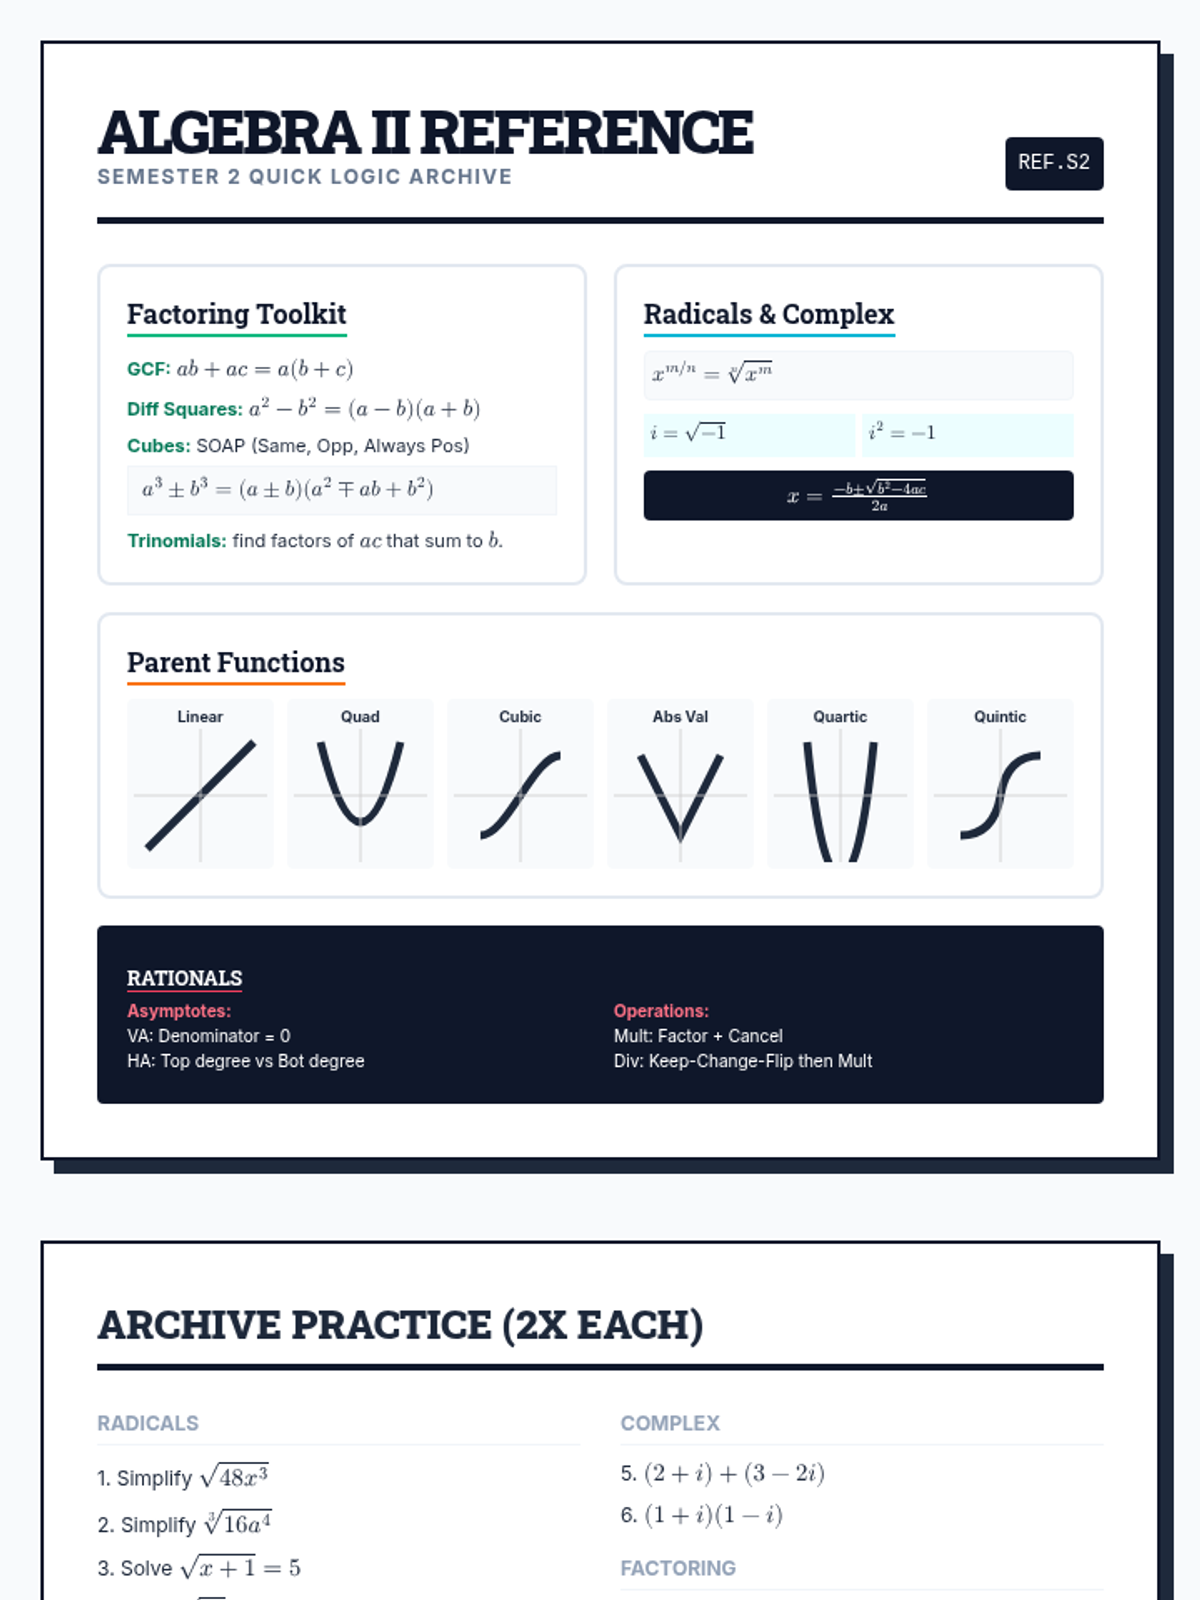
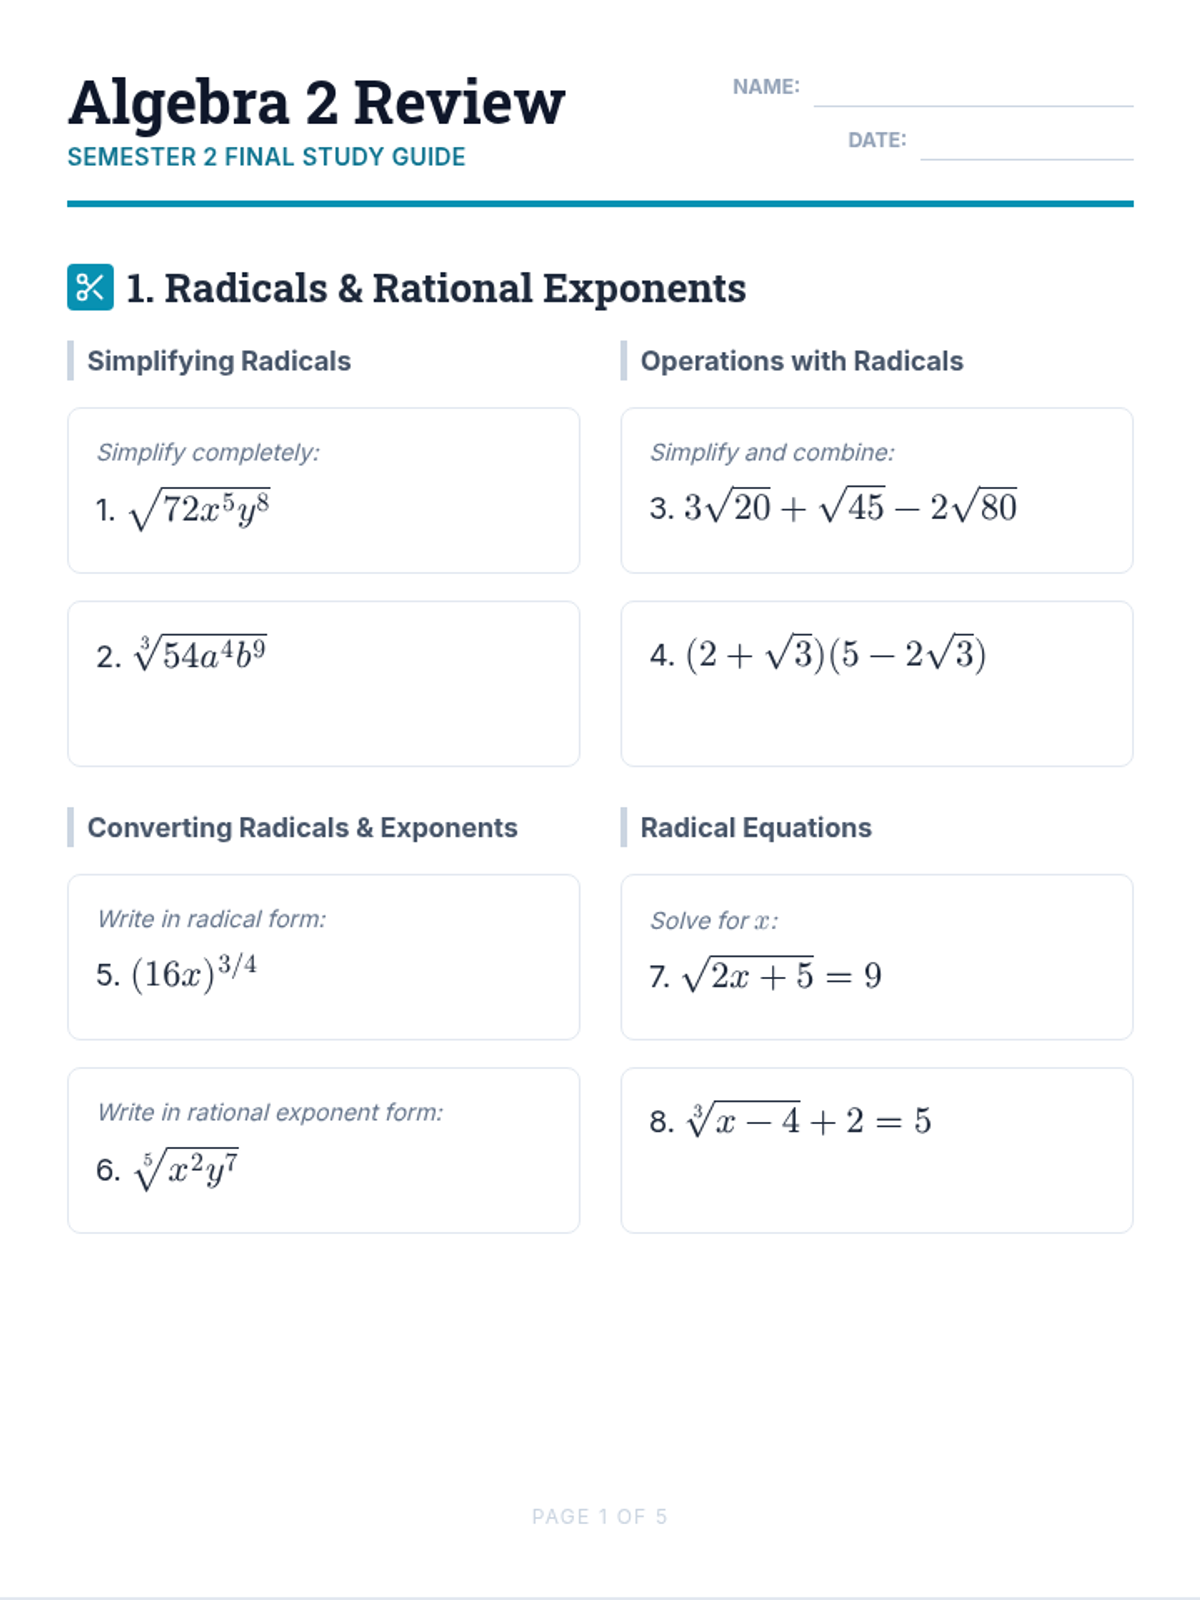
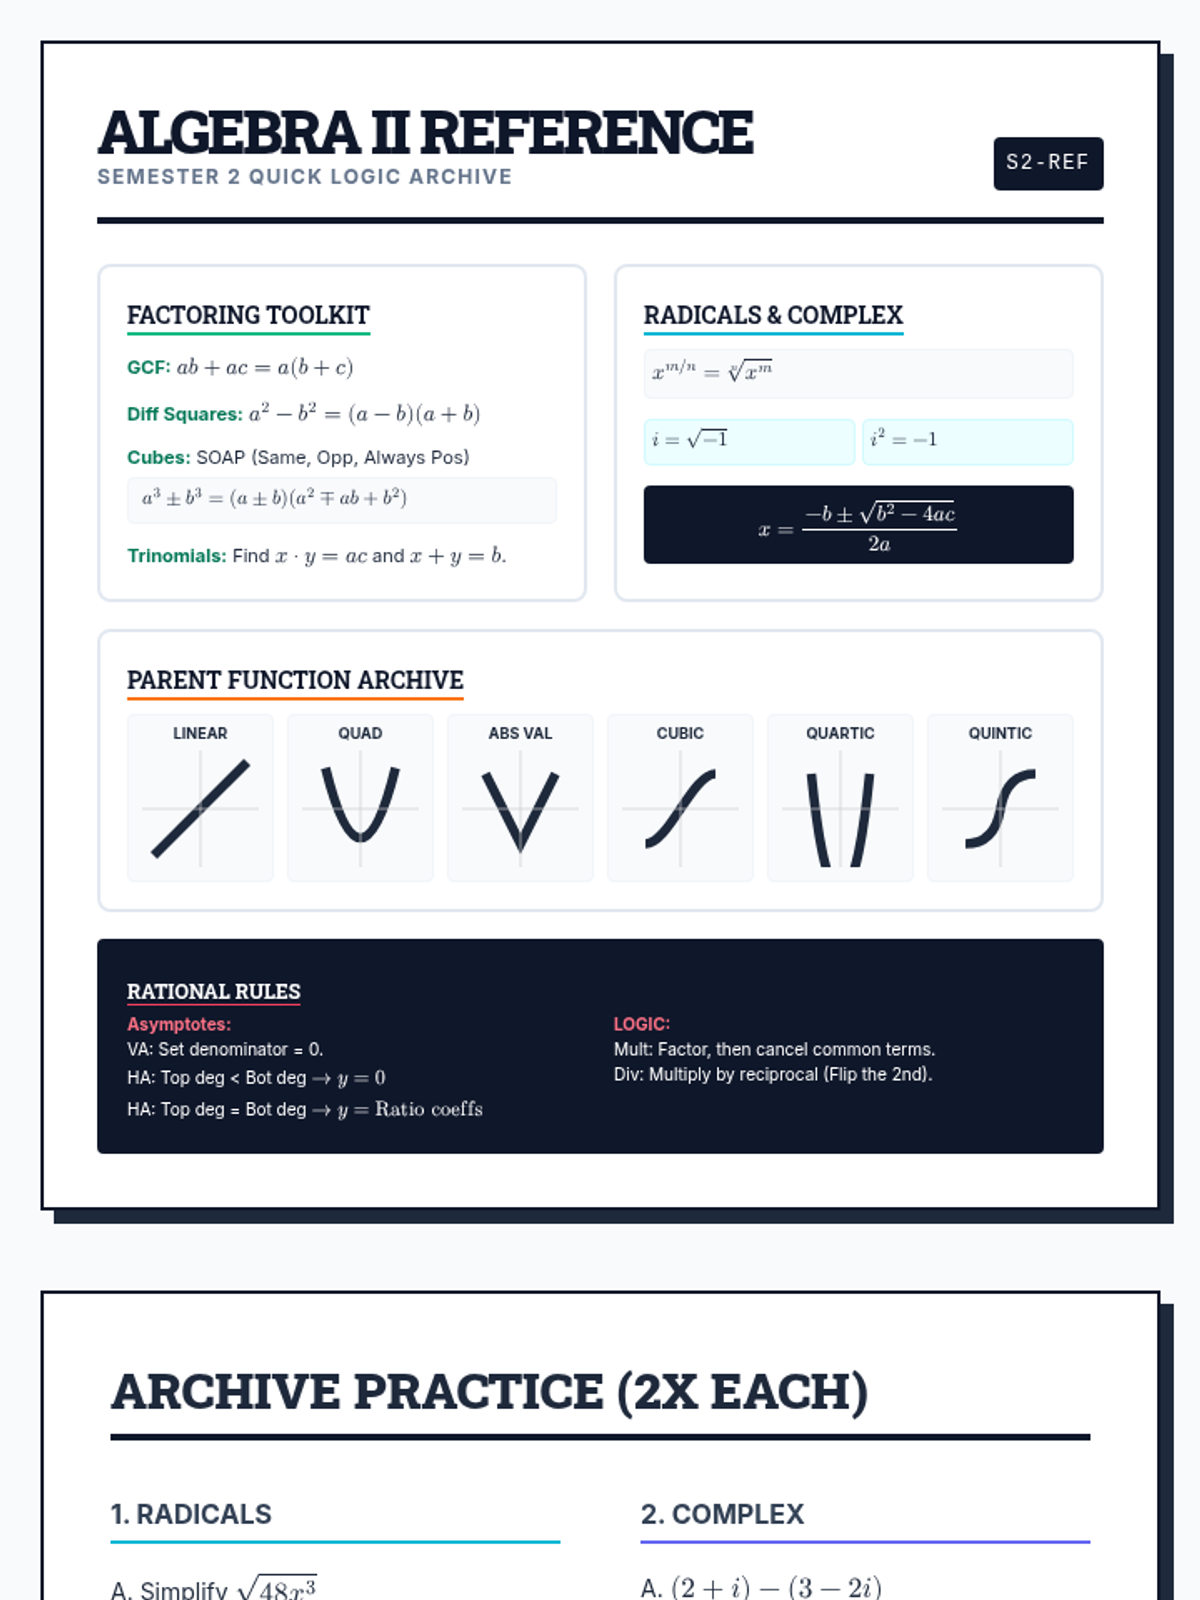
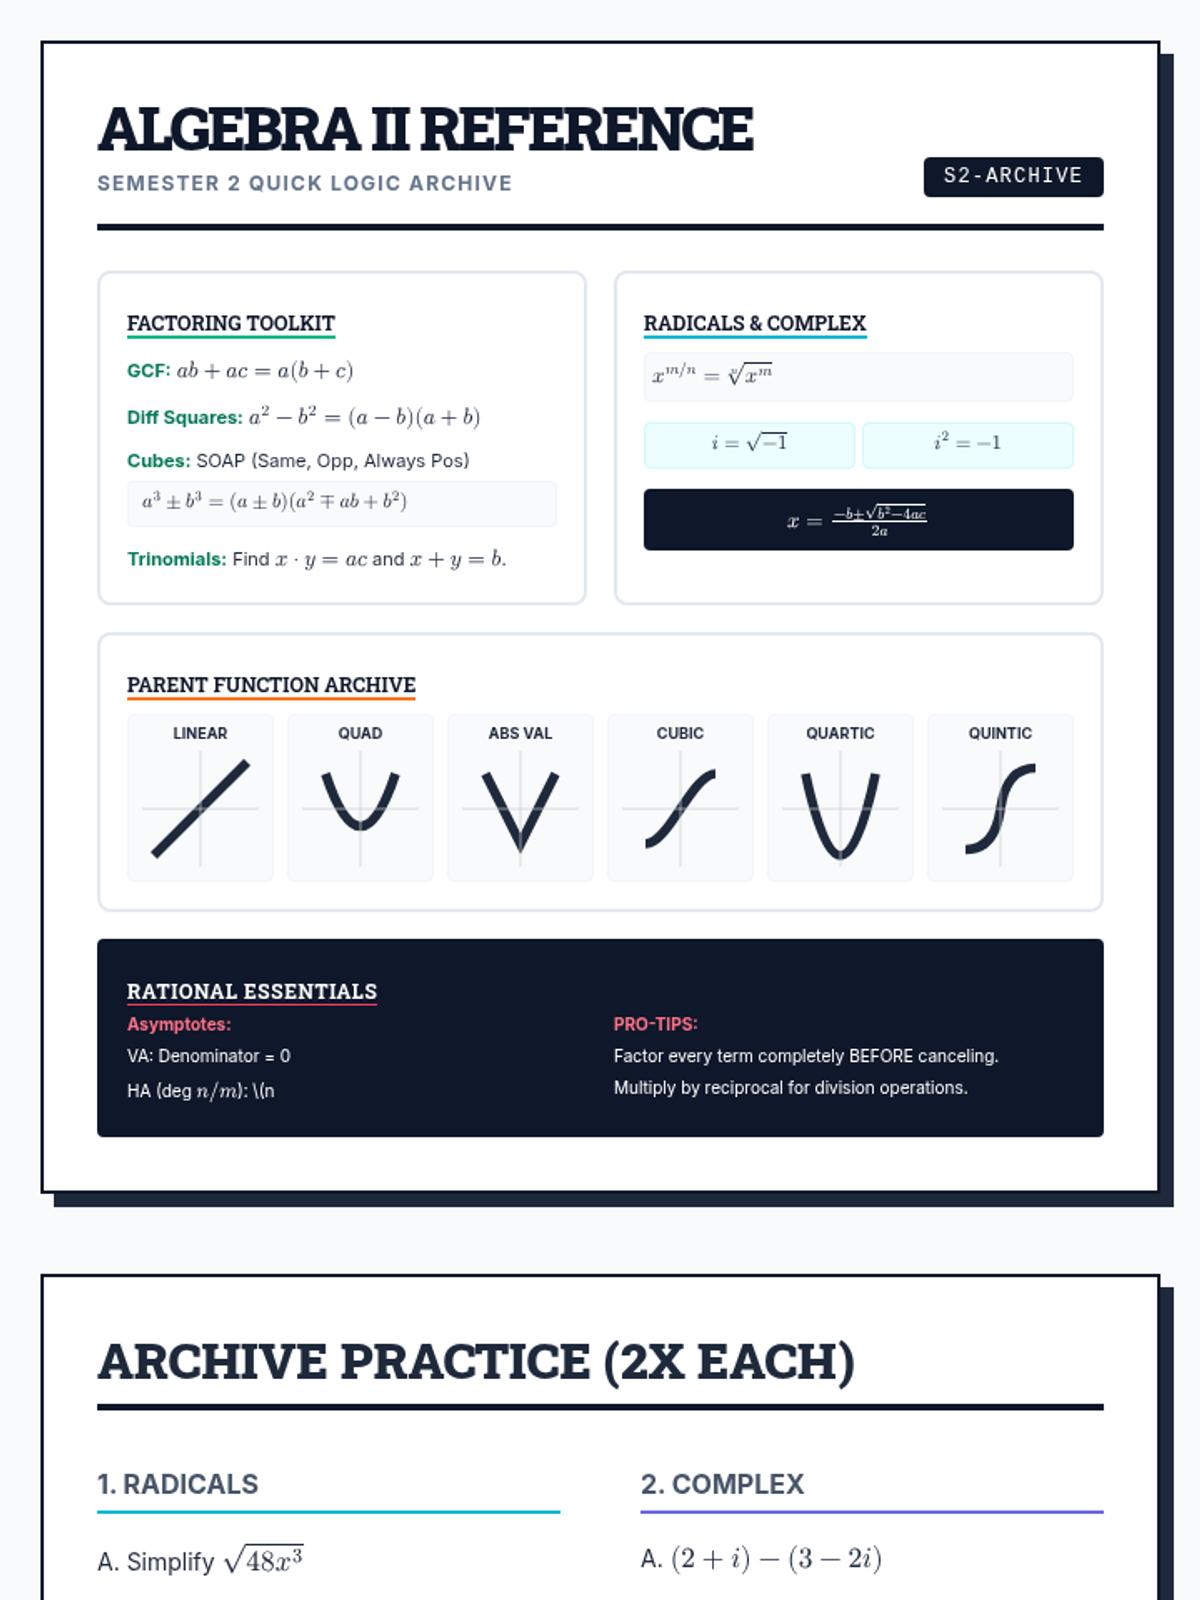
A comprehensive final exam for Semester 2 of Algebra 2 Credit Recovery, covering radicals, factoring, quadratics, and rational functions.
A comprehensive review unit covering radicals, factoring, parent functions, quadratics, and rational expressions to prepare students for the Algebra 2 Semester 2 final exam.
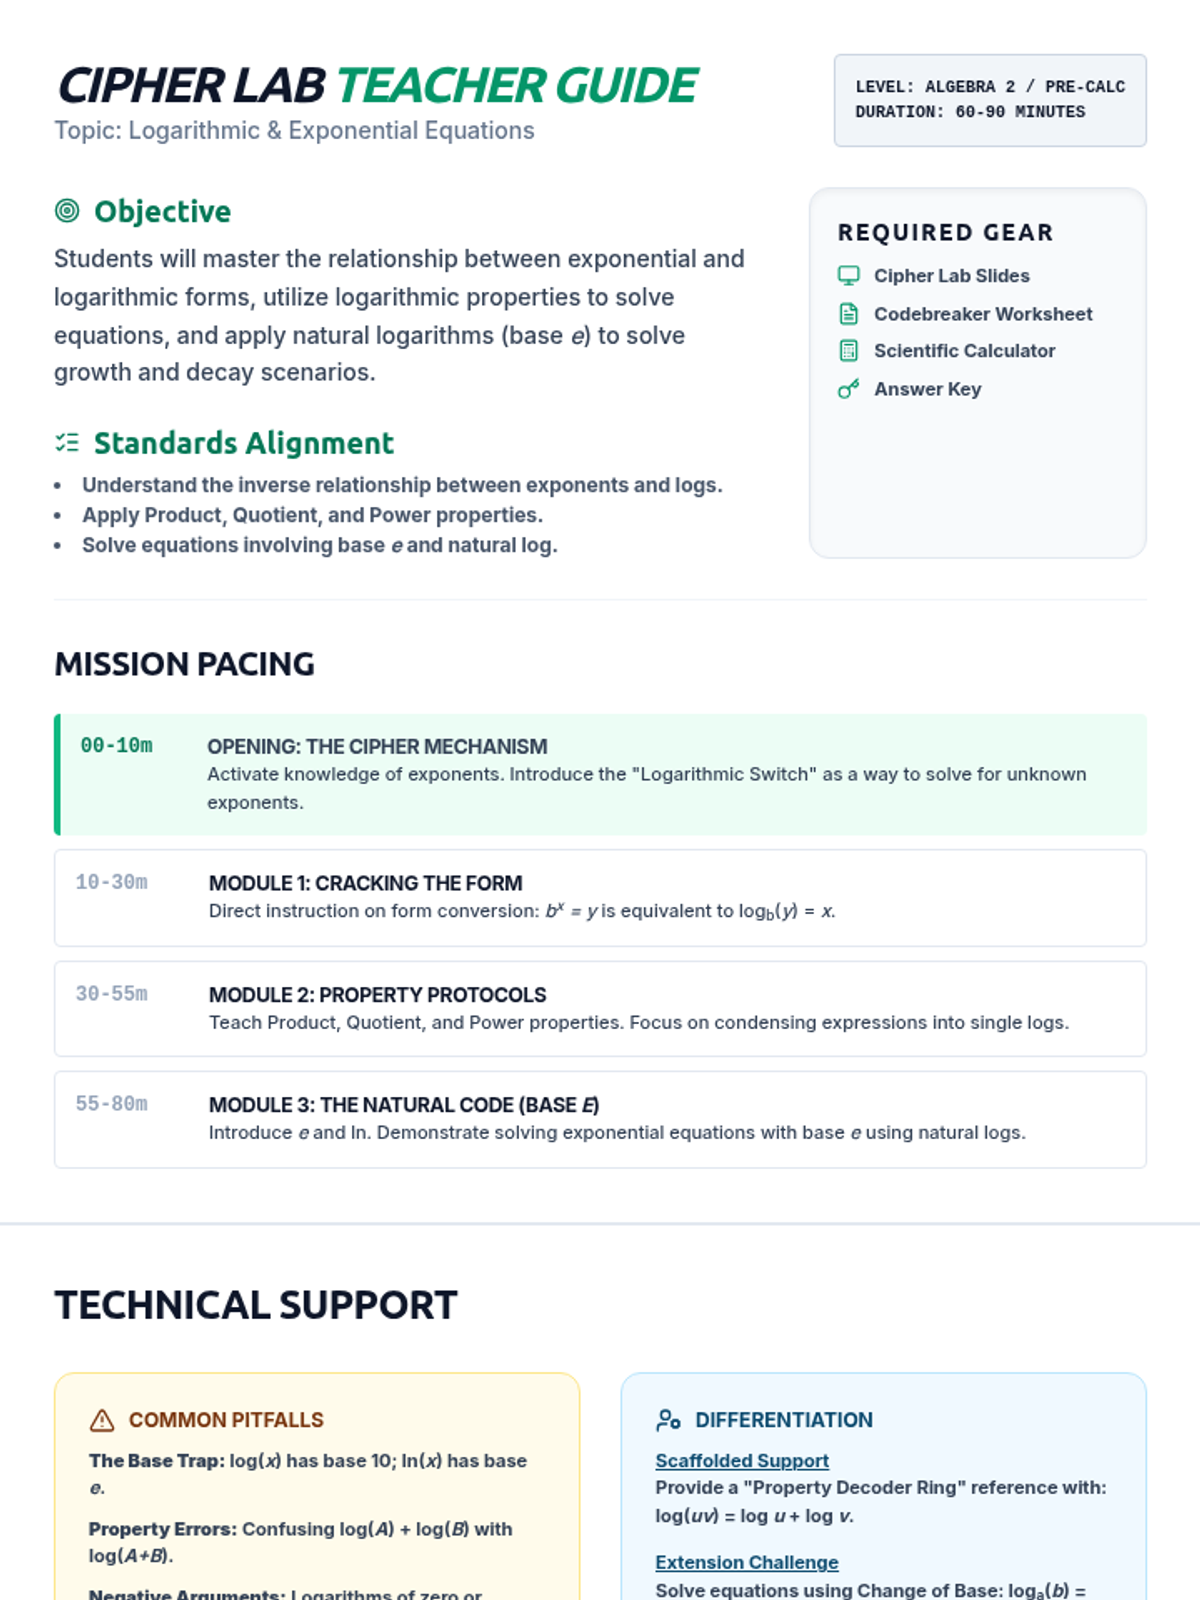
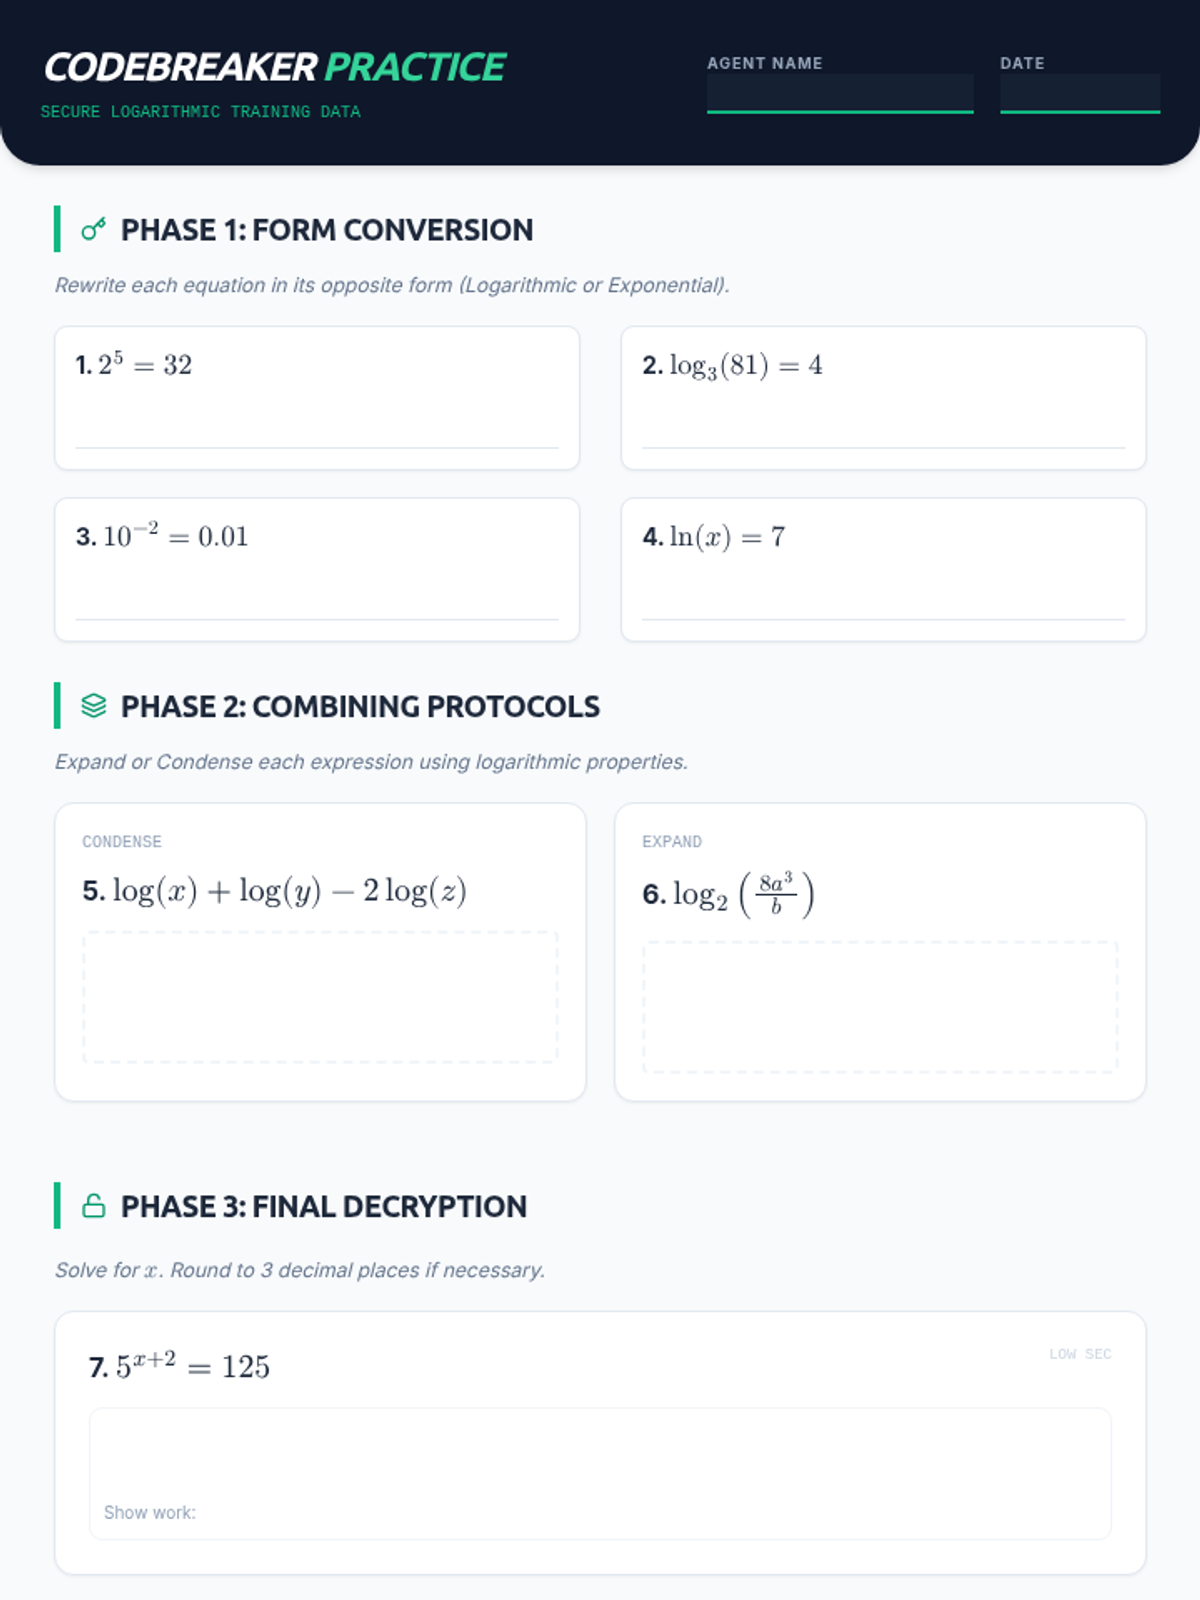
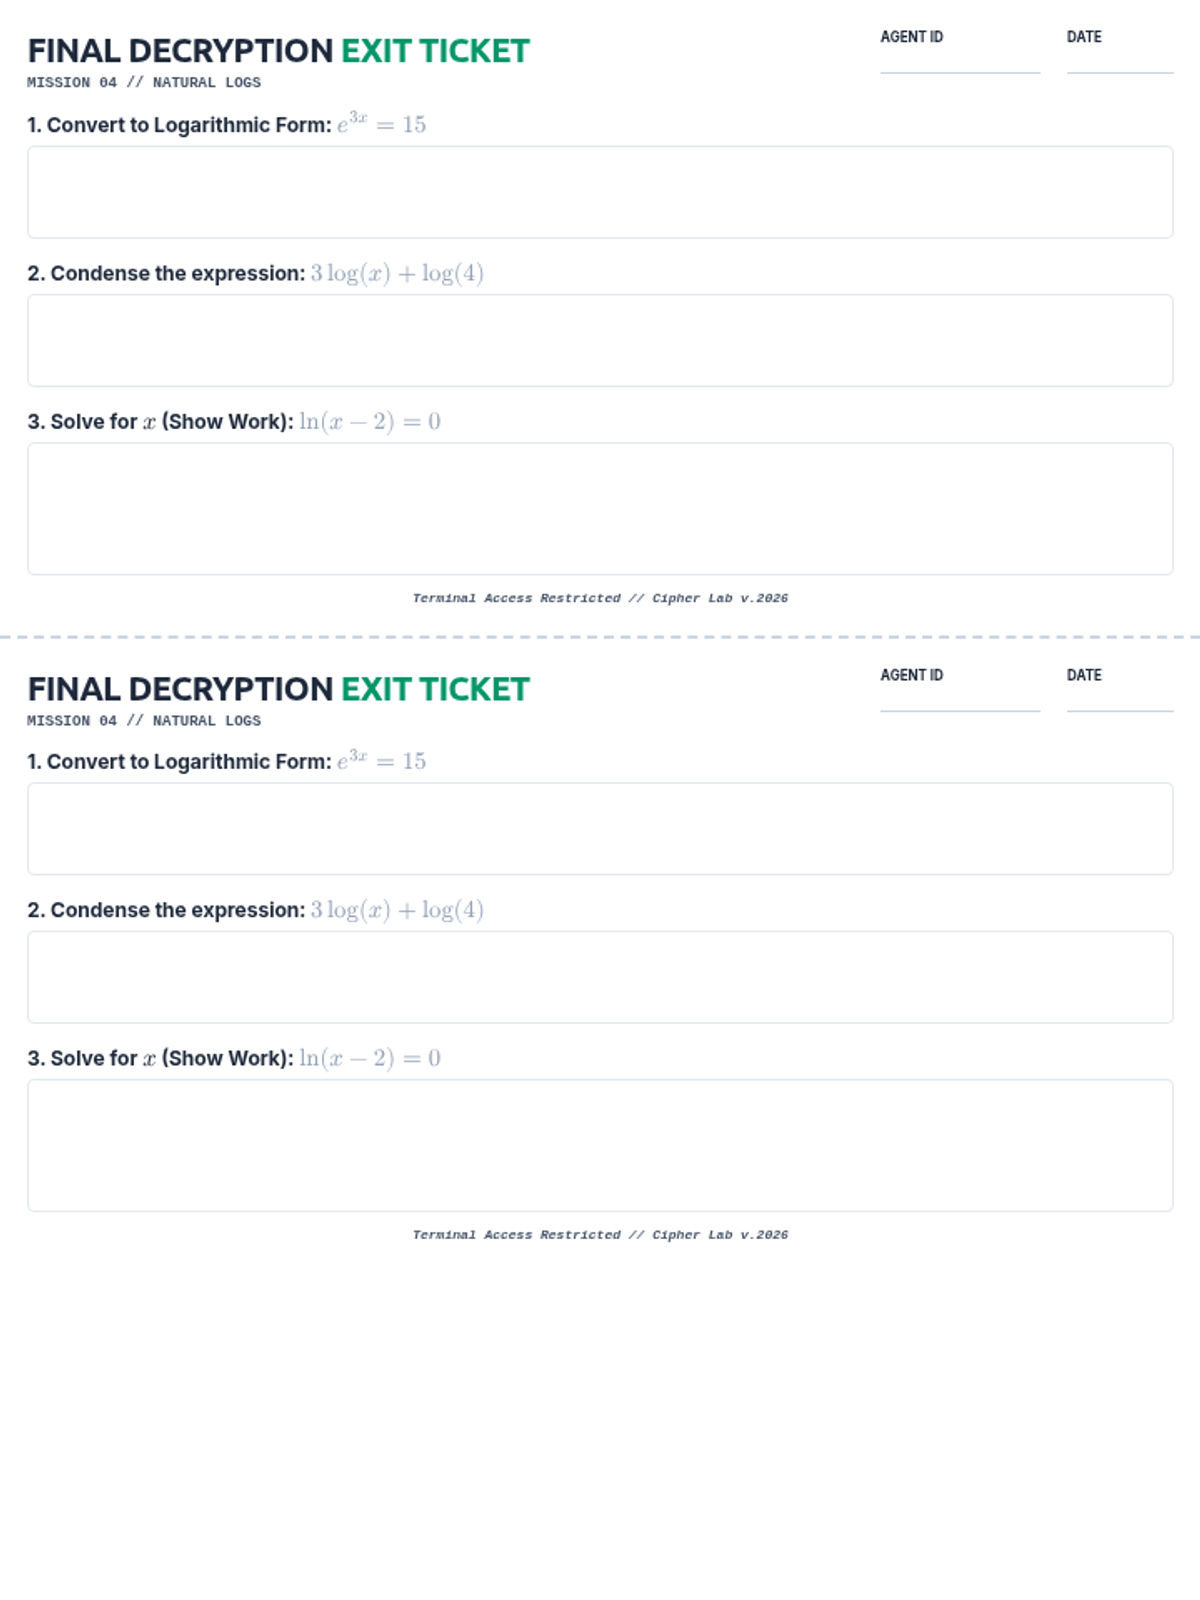
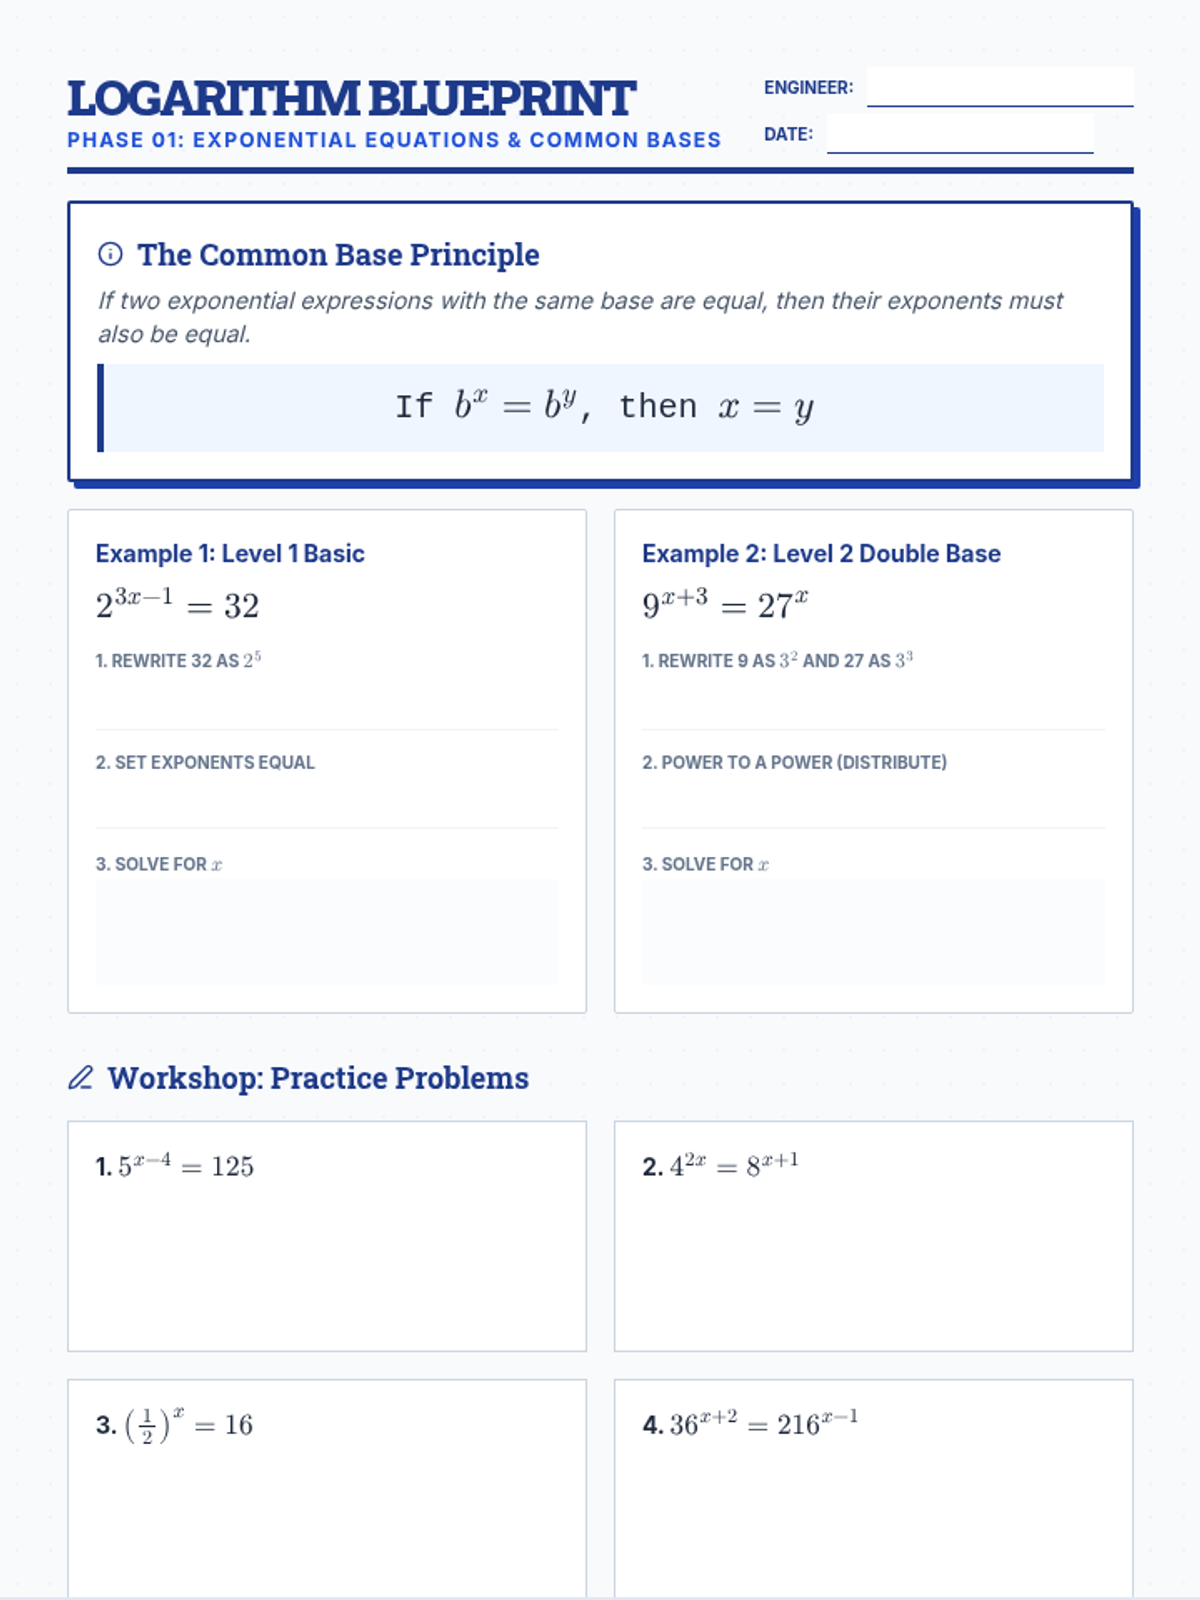
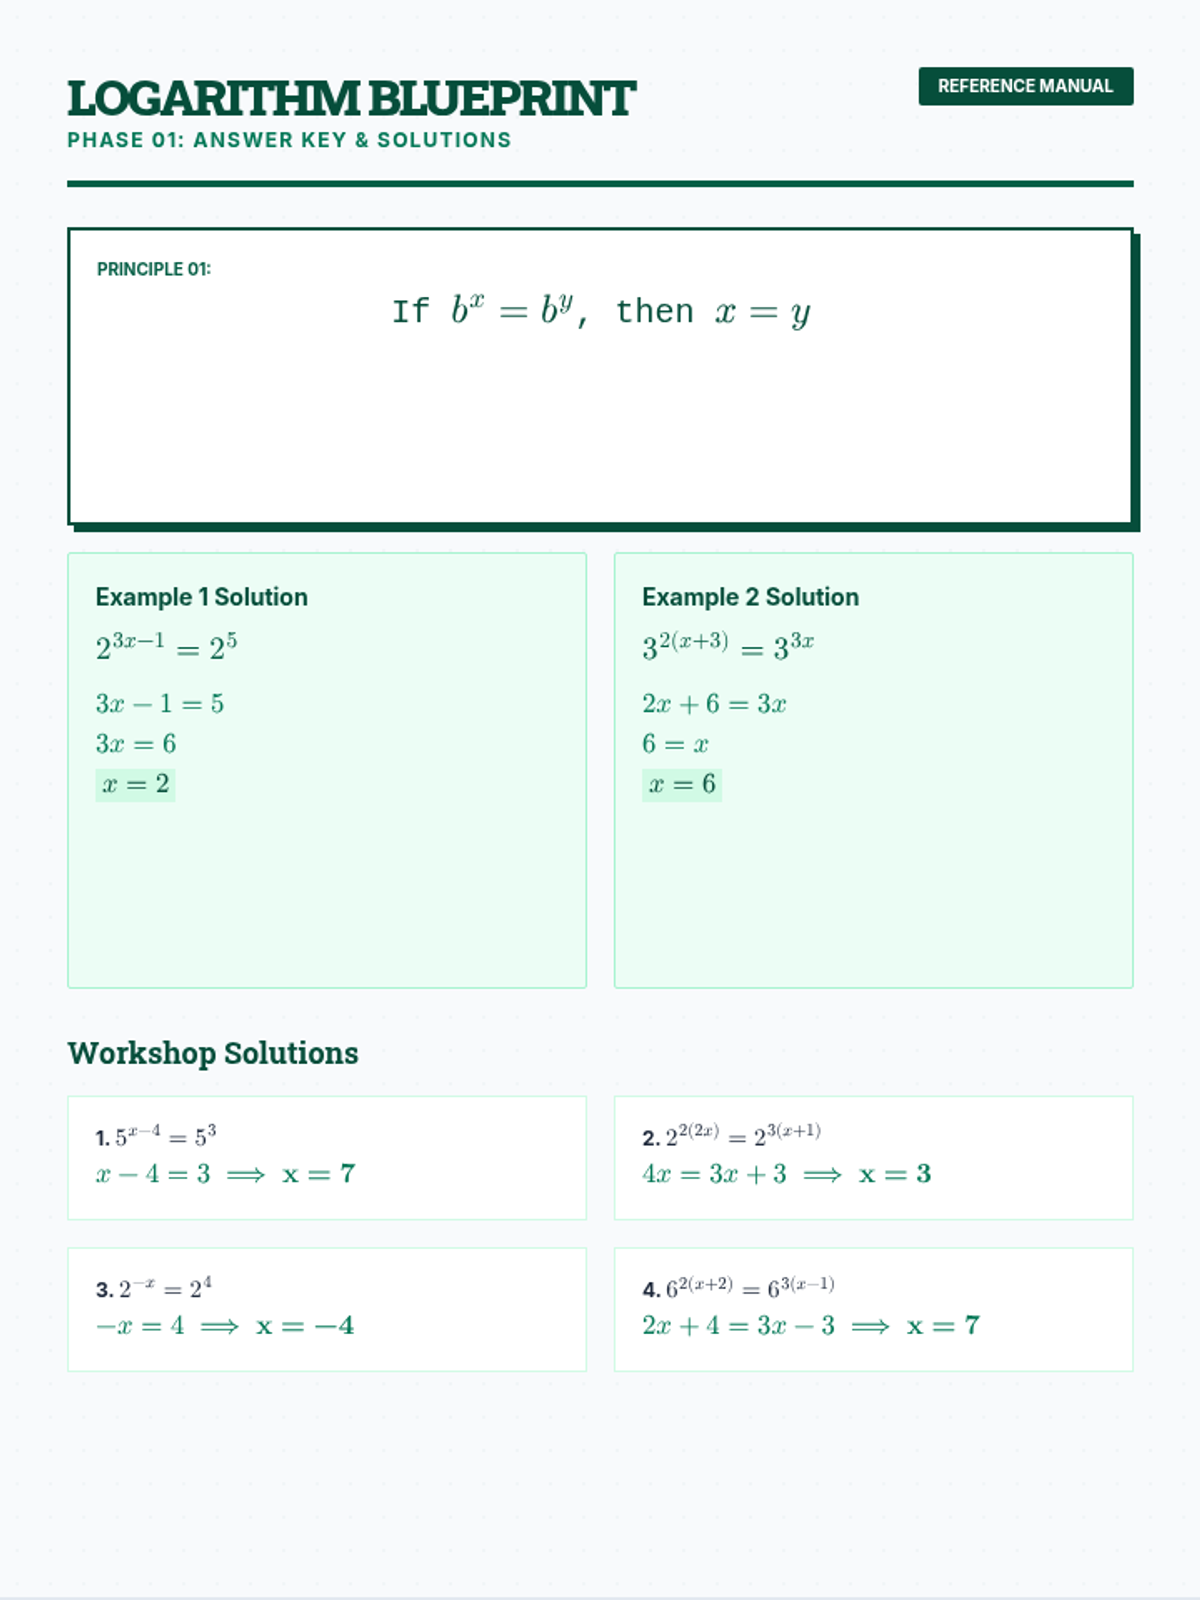
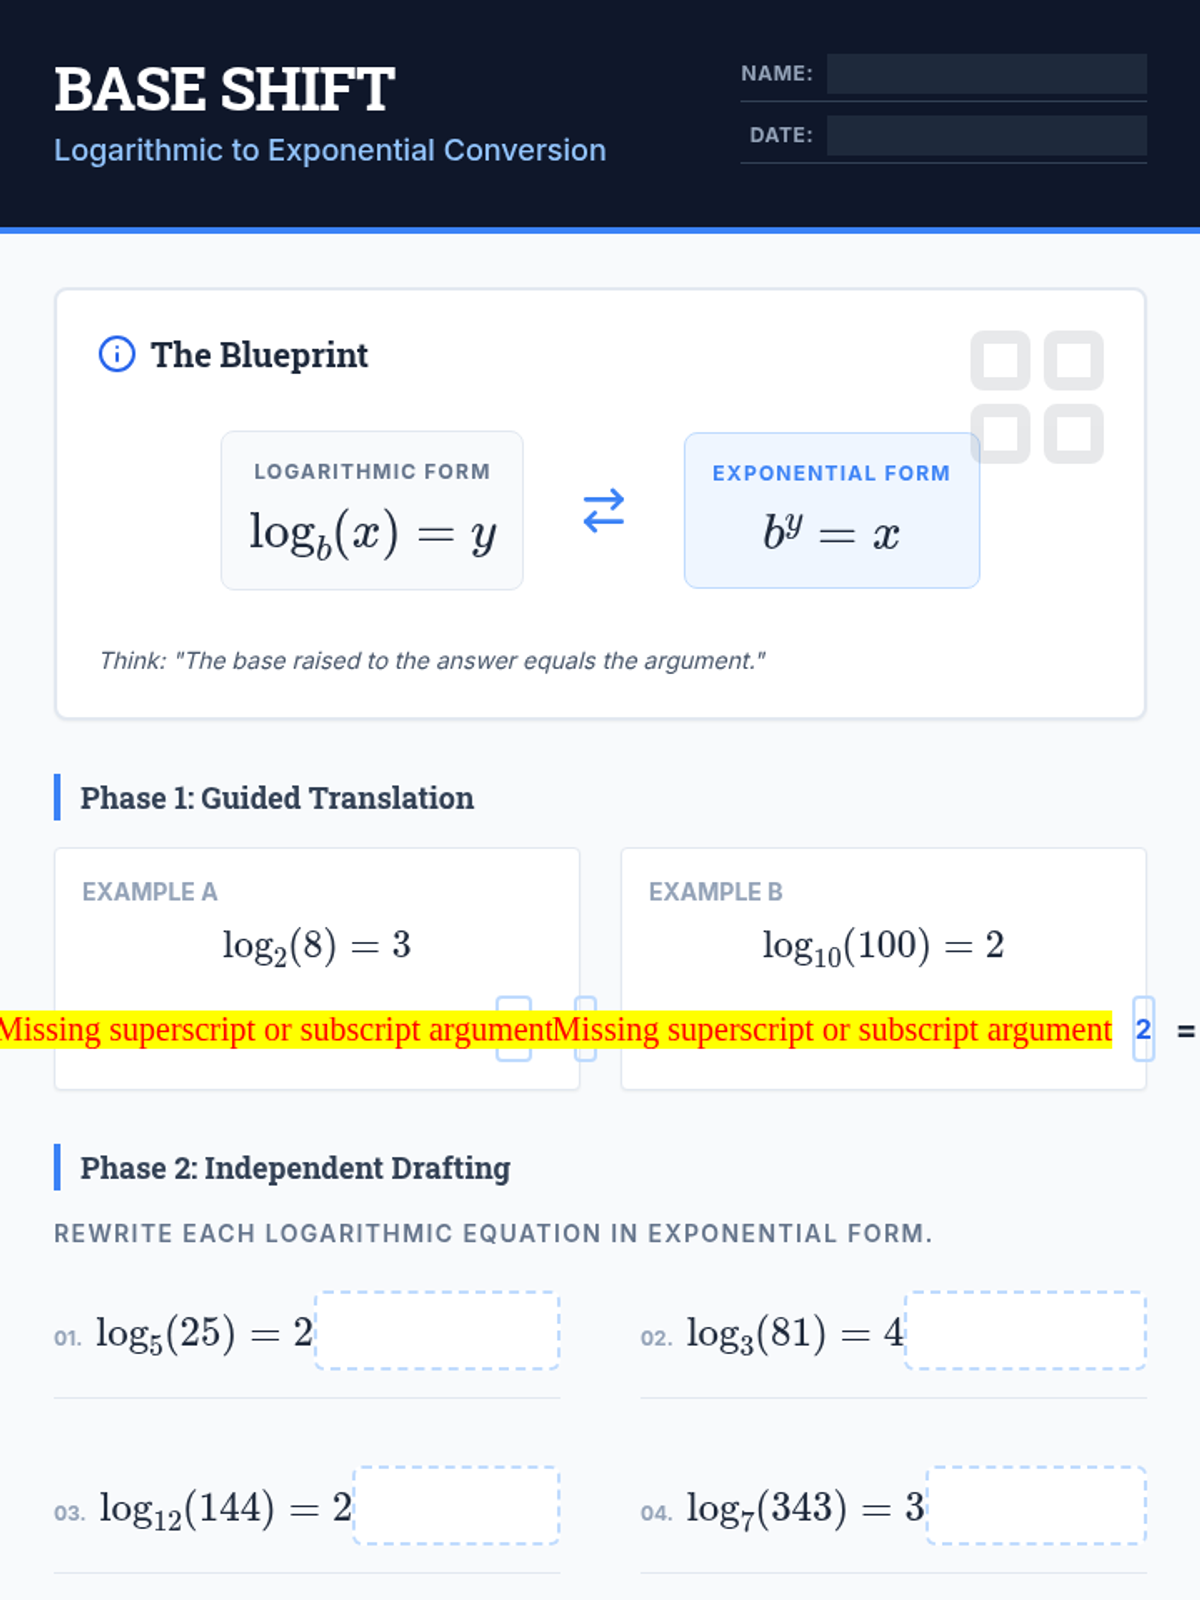
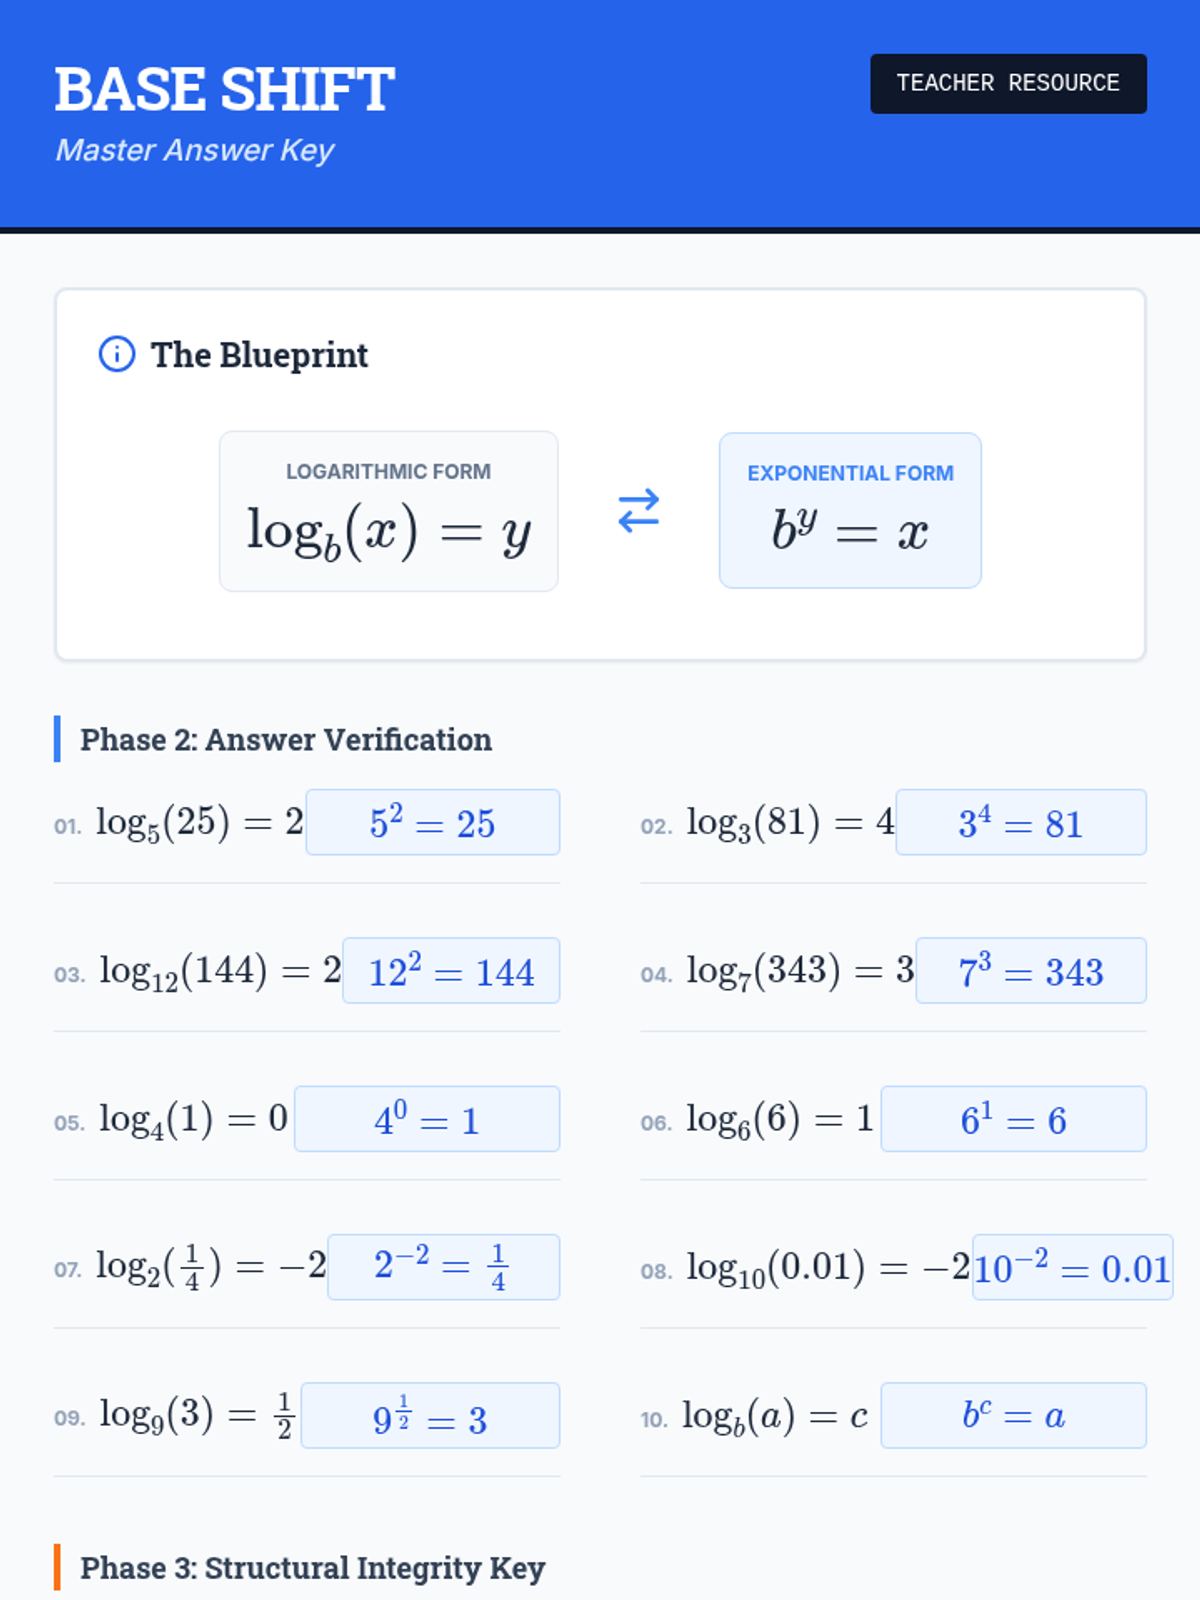
A comprehensive introduction to logarithmic and exponential equations, focusing on form conversion, logarithmic properties, and natural logs using a 'Cipher Lab' theme.
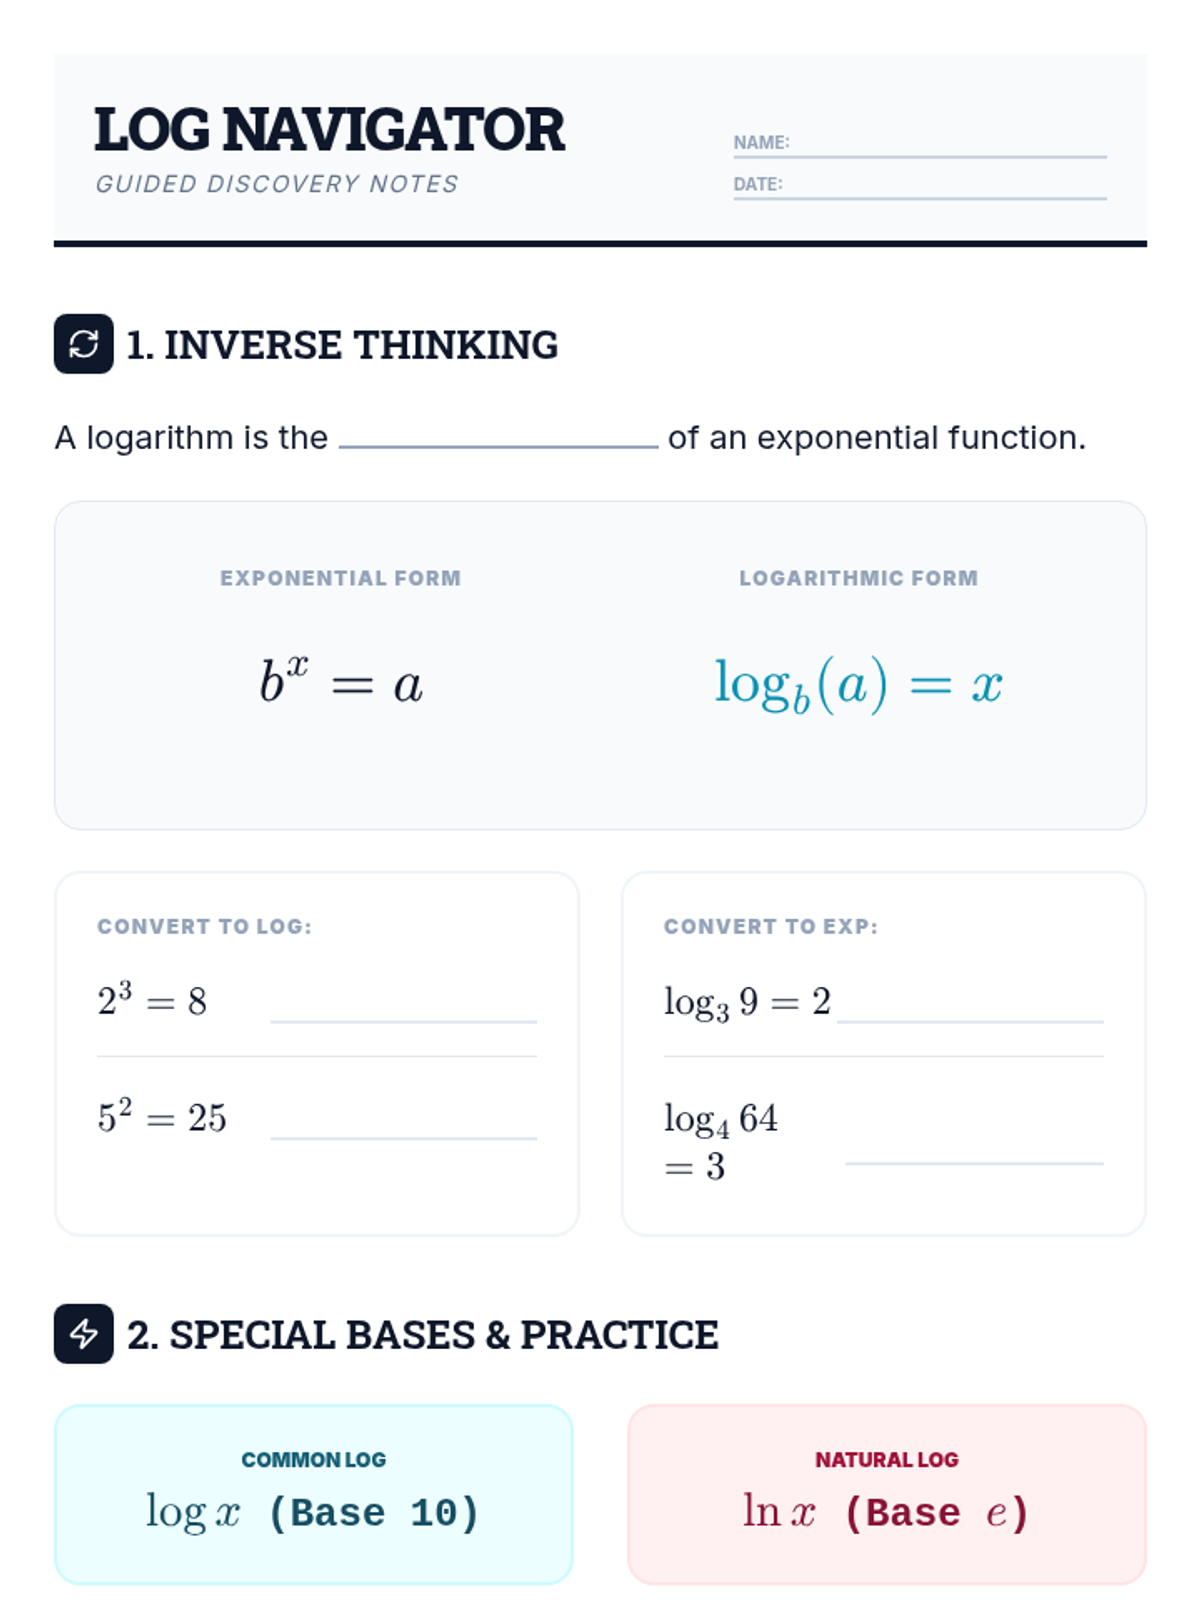
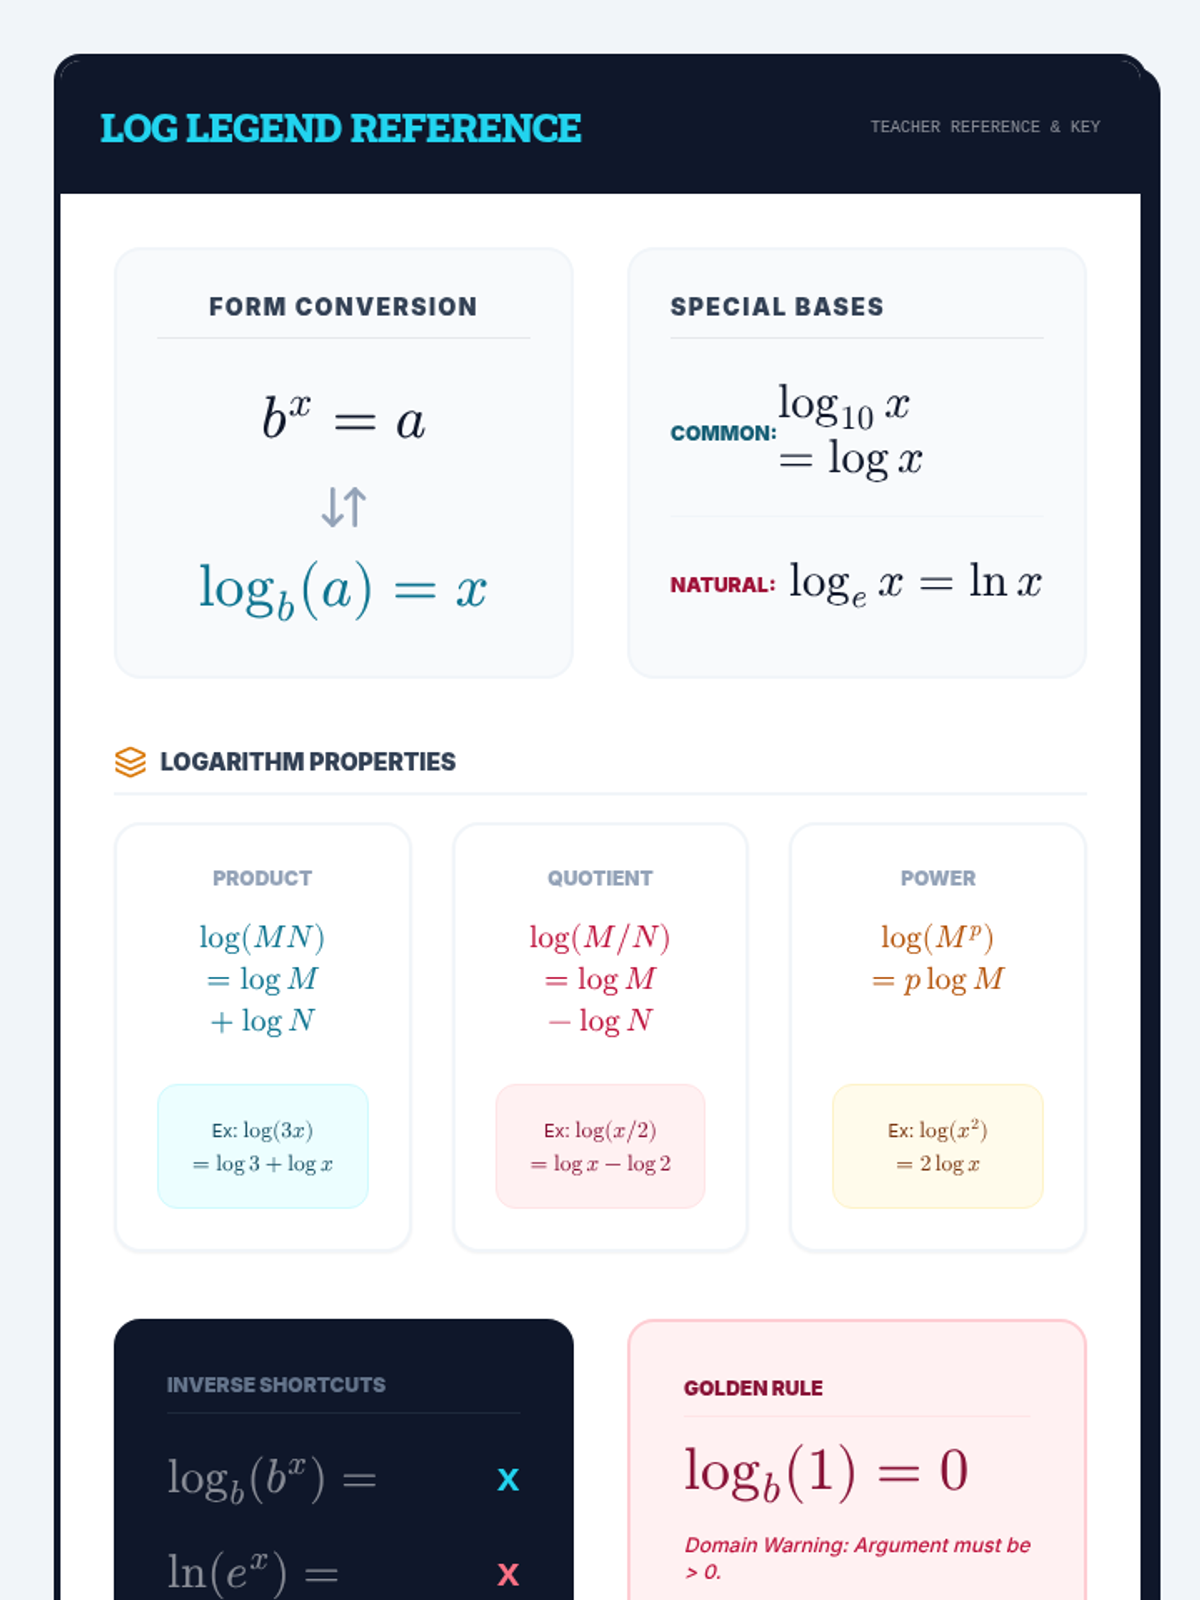
An introductory lesson on logarithmic functions, covering conversion between forms, evaluating basic logs, natural logarithms with 'e', and the fundamental properties of logs.
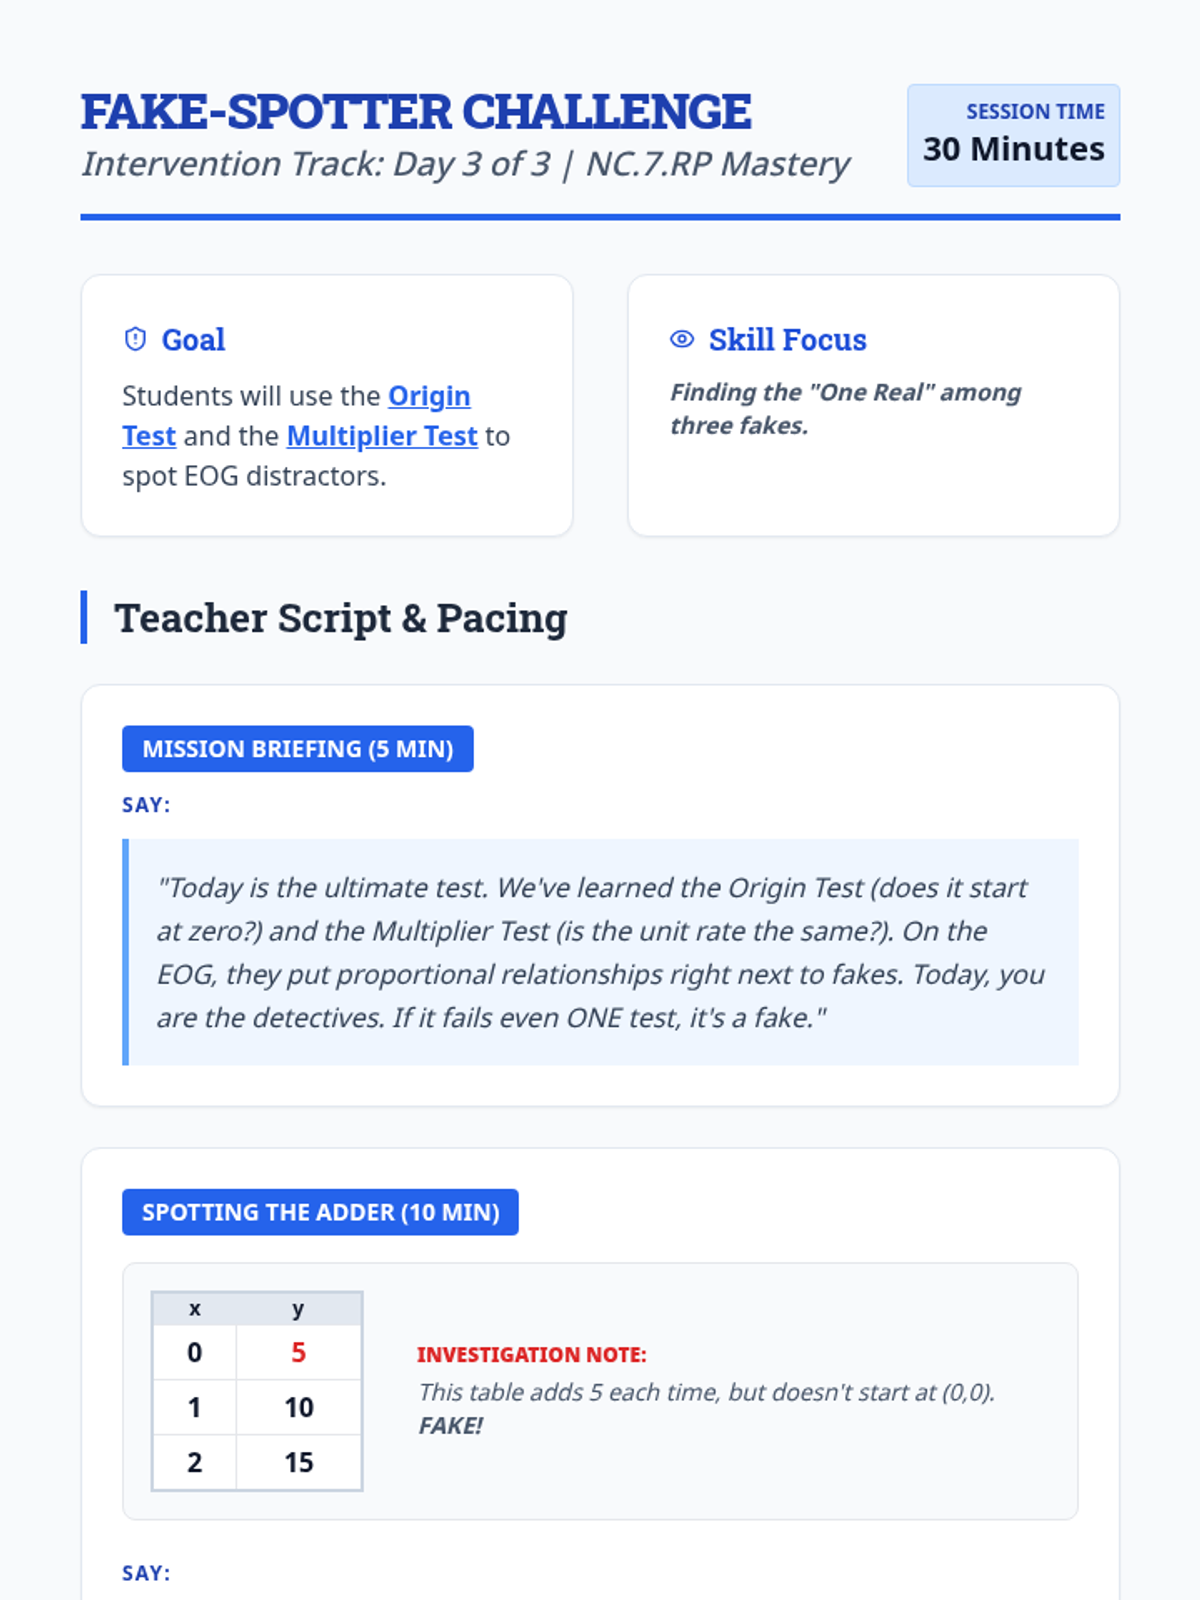
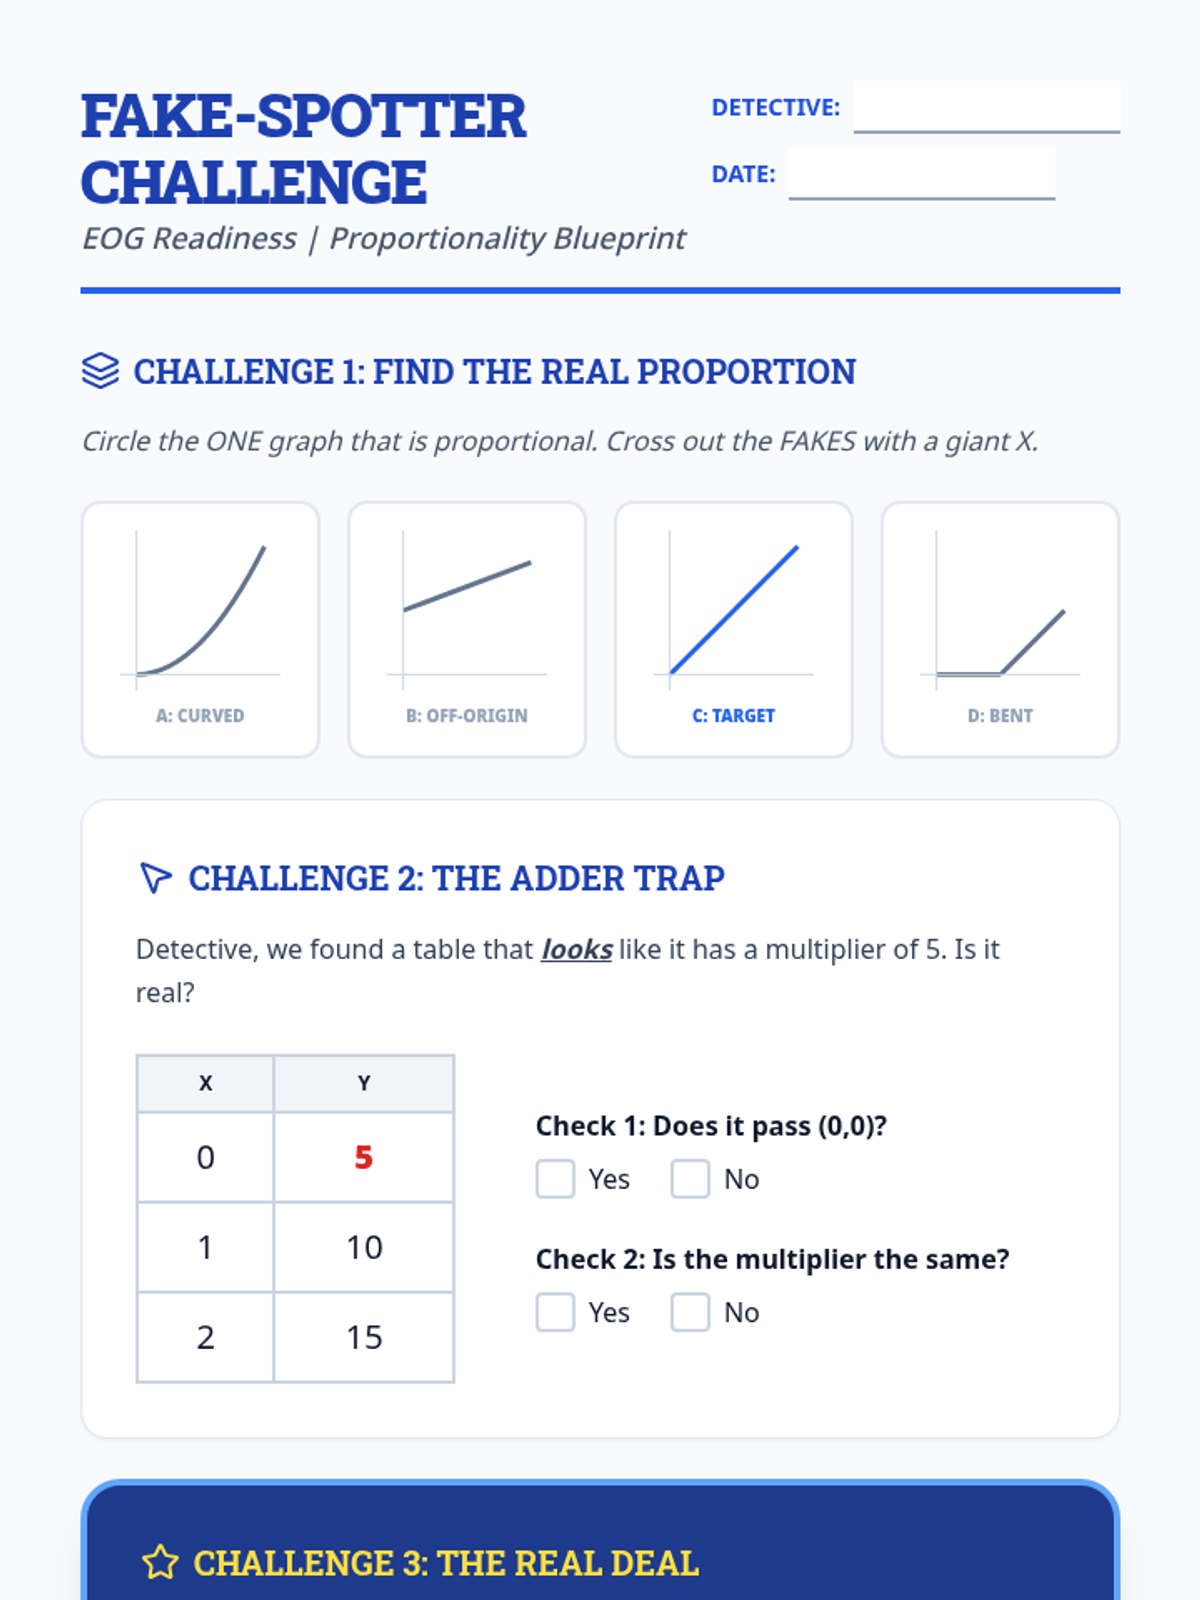
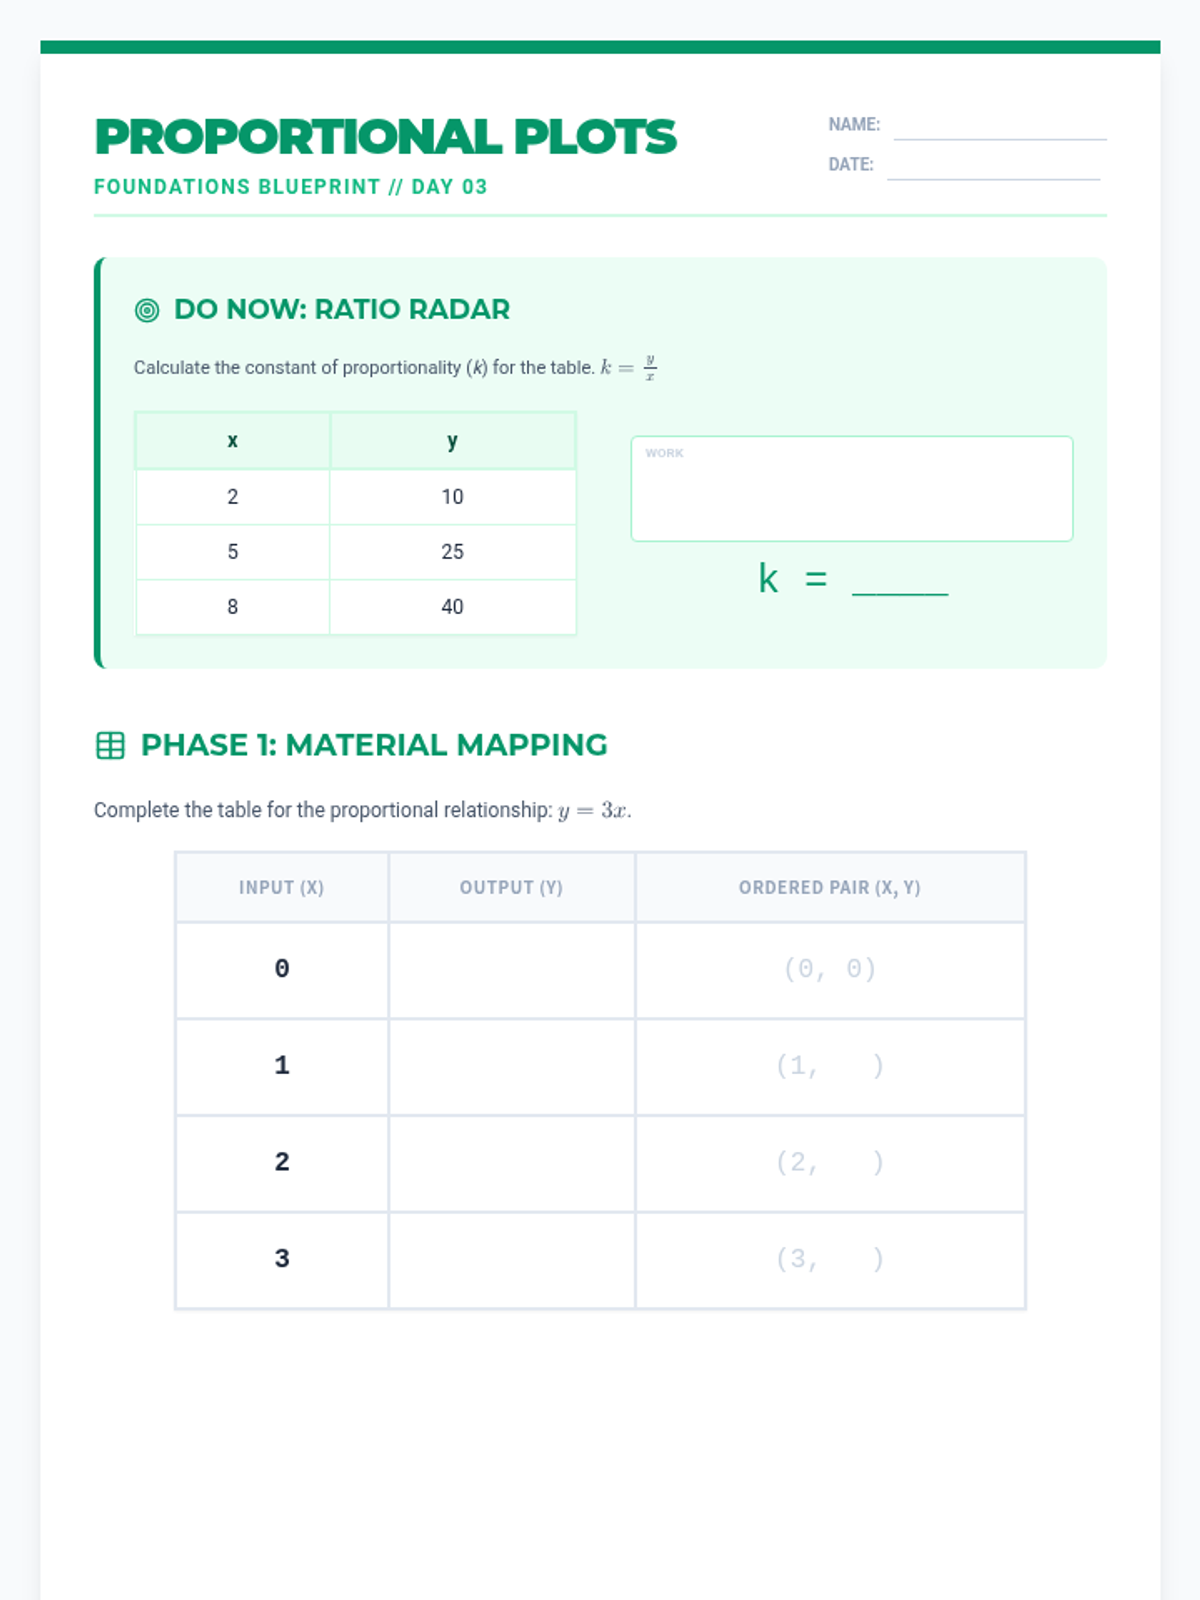
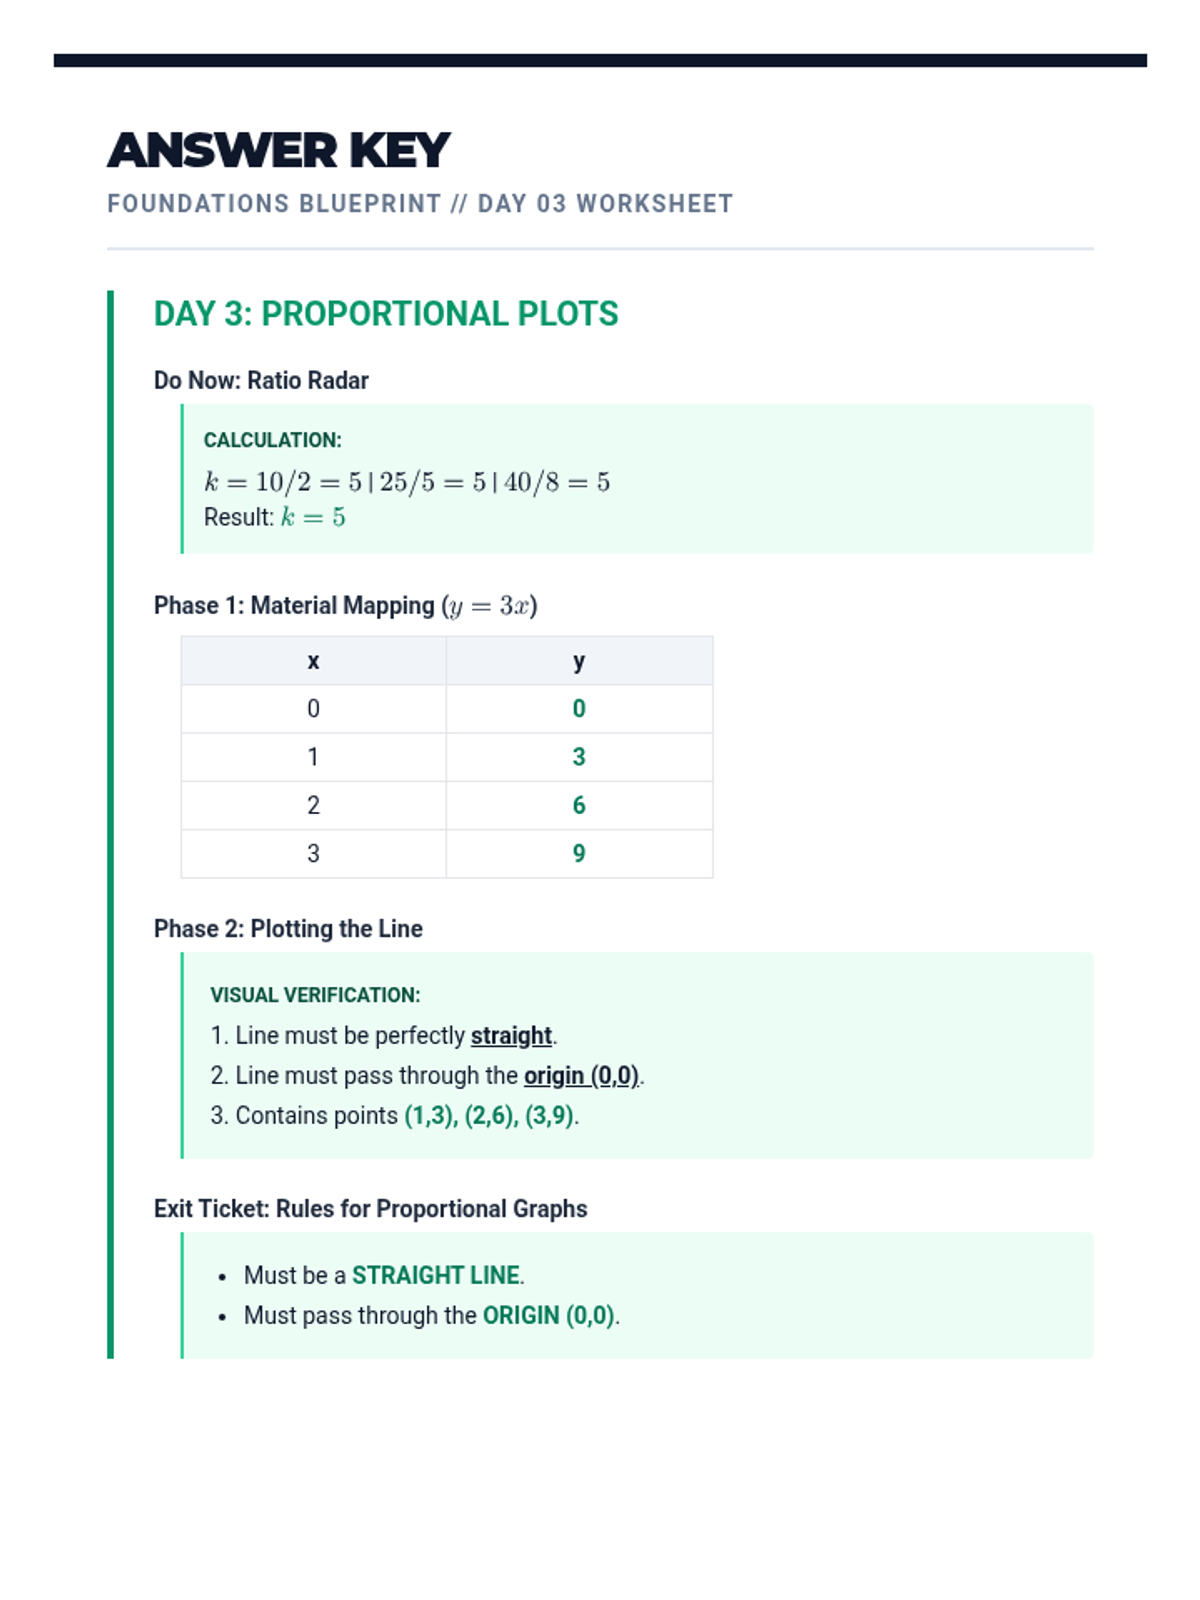
Day 3 of the intervention focusing on identifying EOG-style distractors. Students compare proportional and non-proportional relationships across tables and graphs to build test-taking stamina.
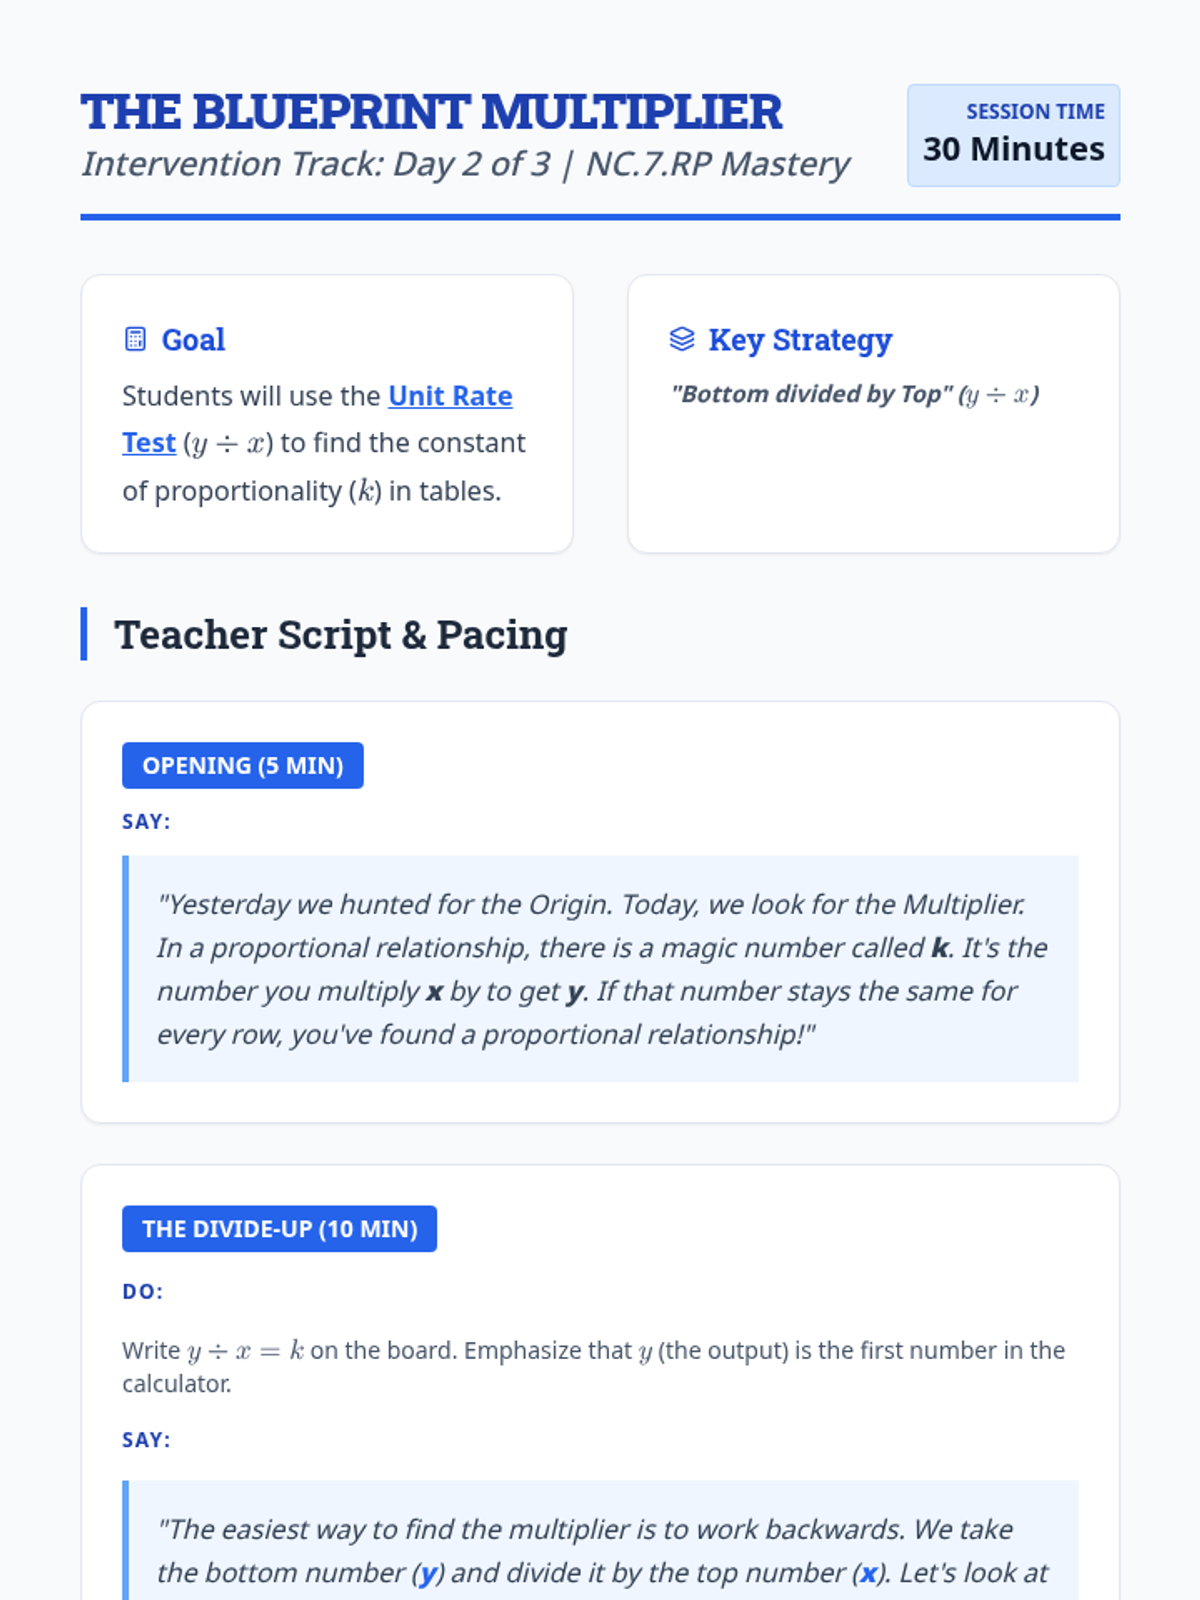
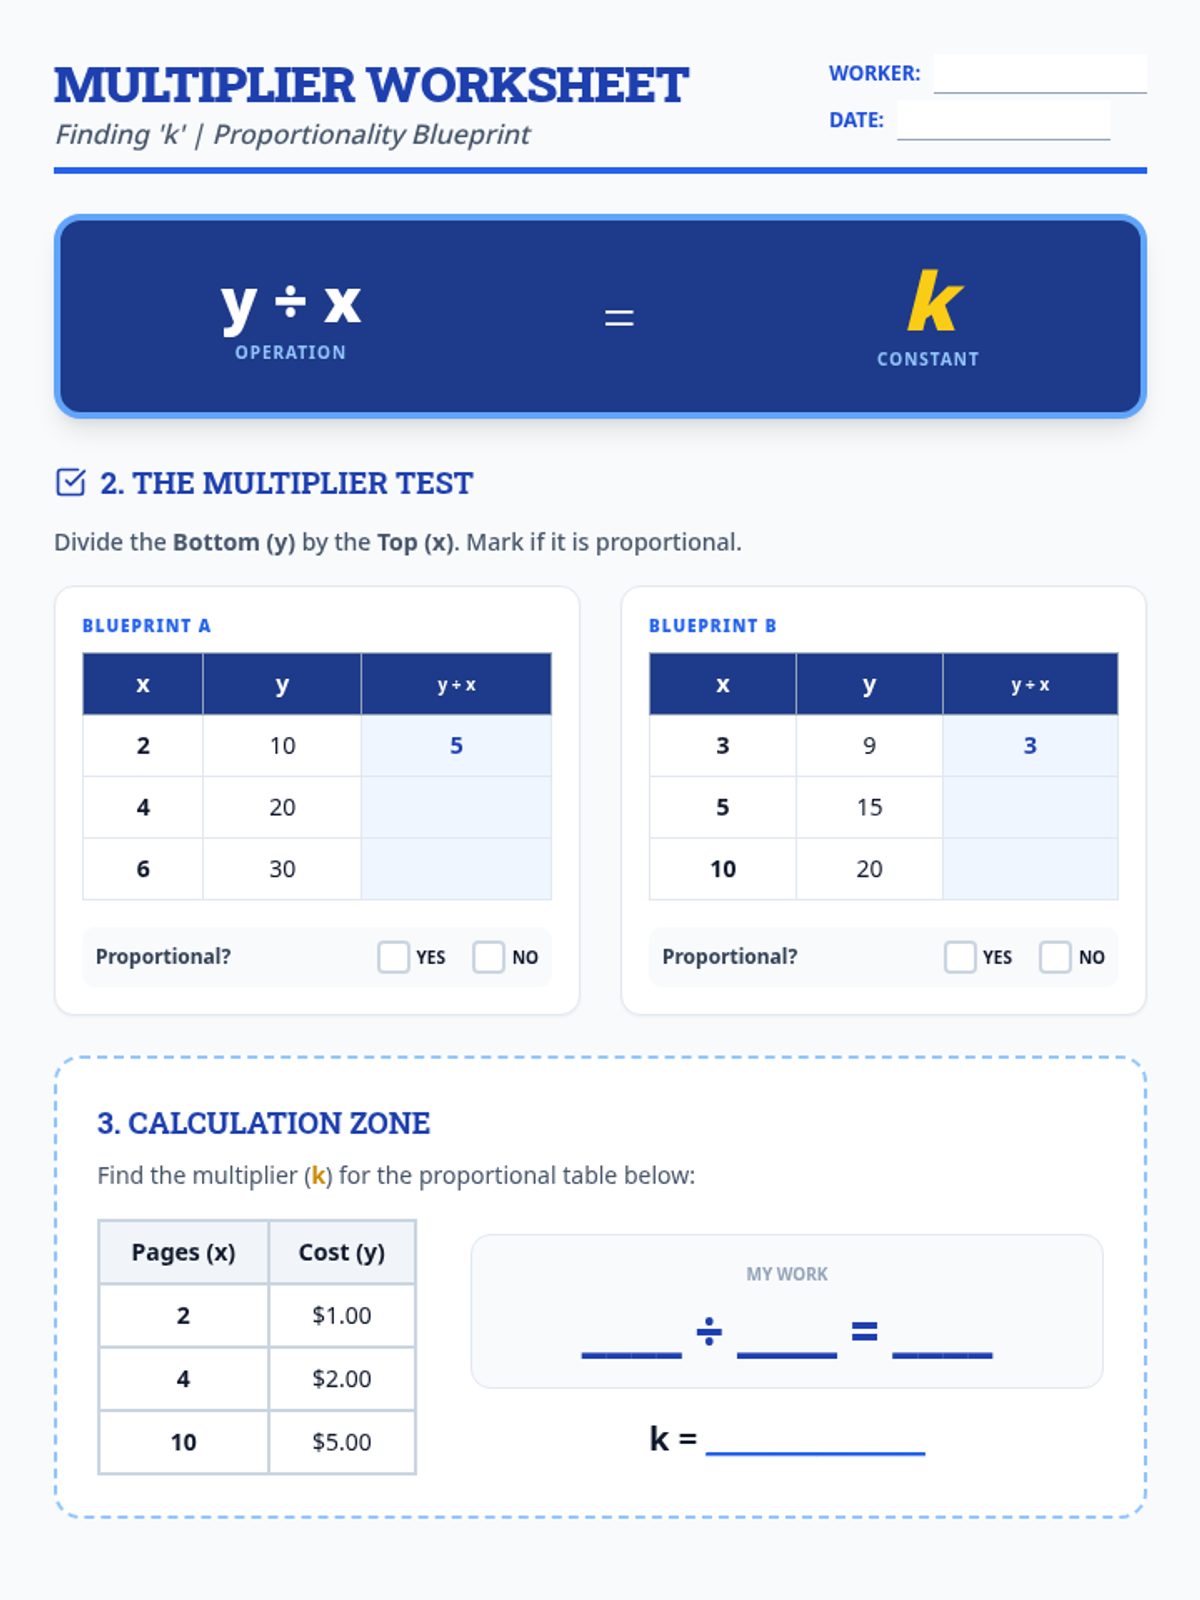
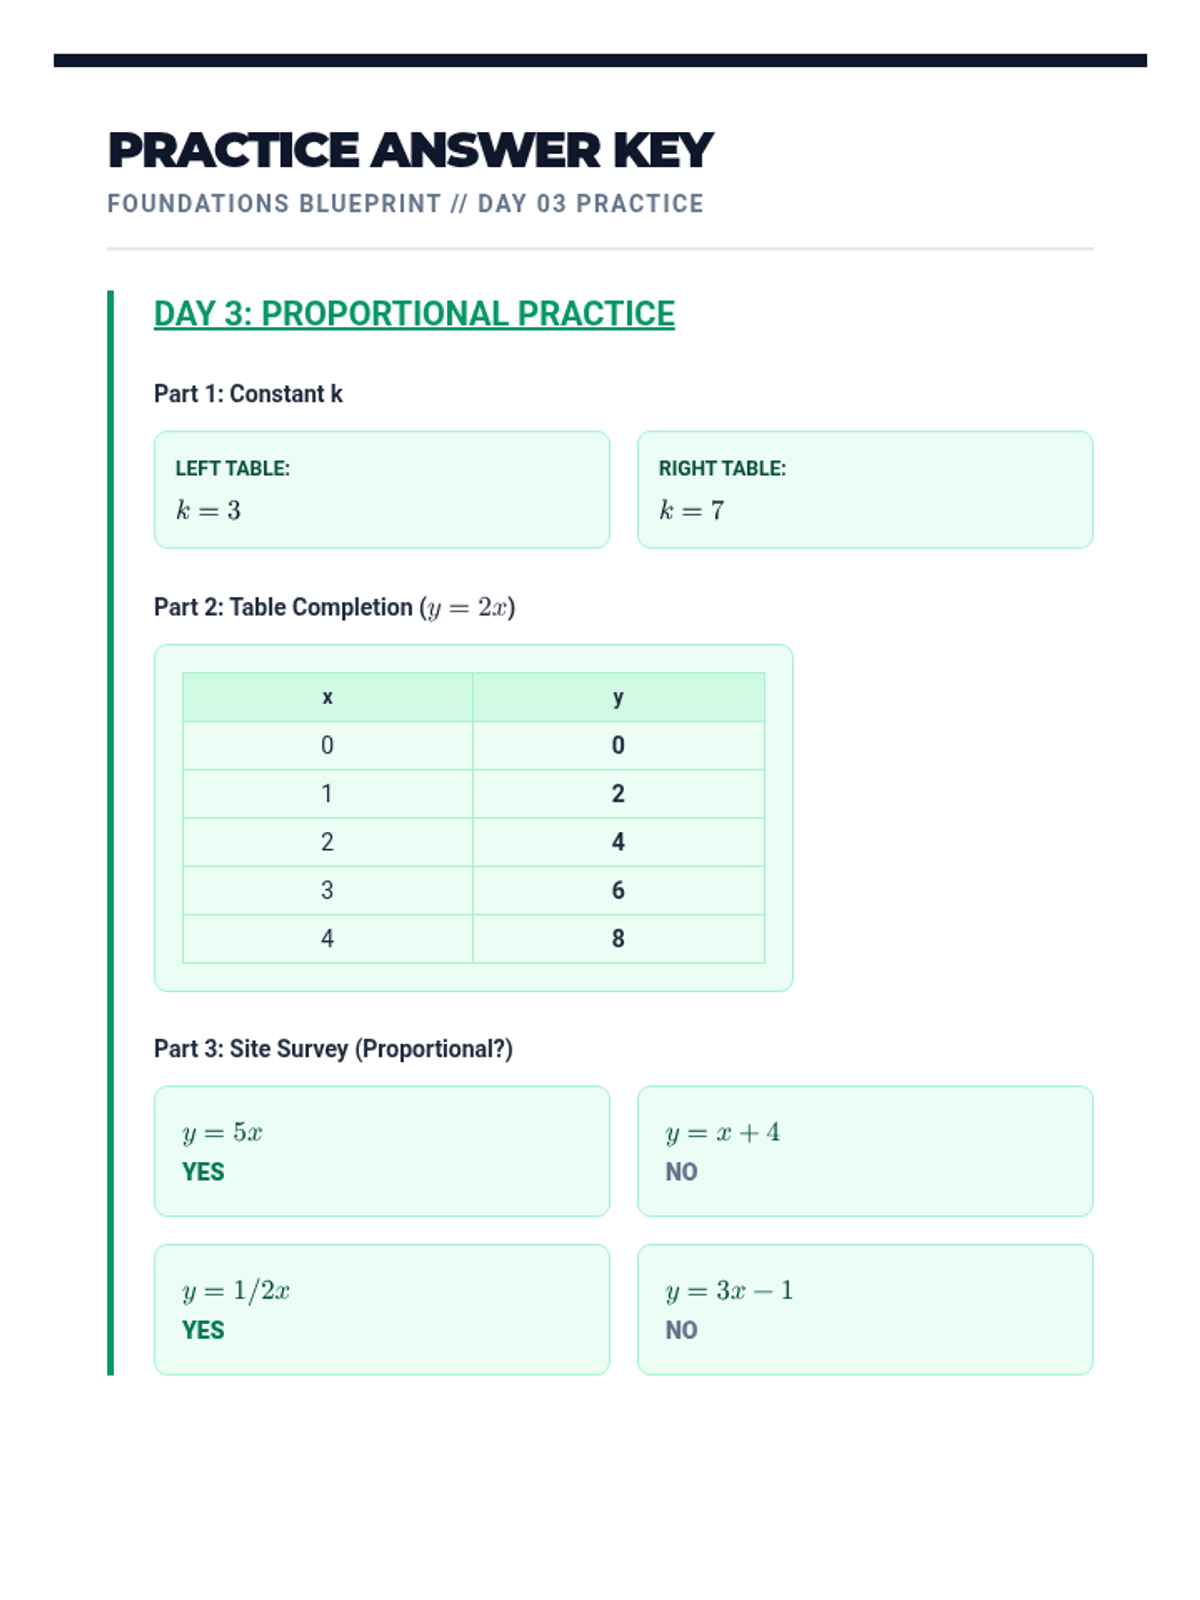
Day 2 of the intervention focusing on the constant of proportionality in tables. Students use the 'Unit Rate Test' to see if a relationship is proportional using simple, friendly numbers.
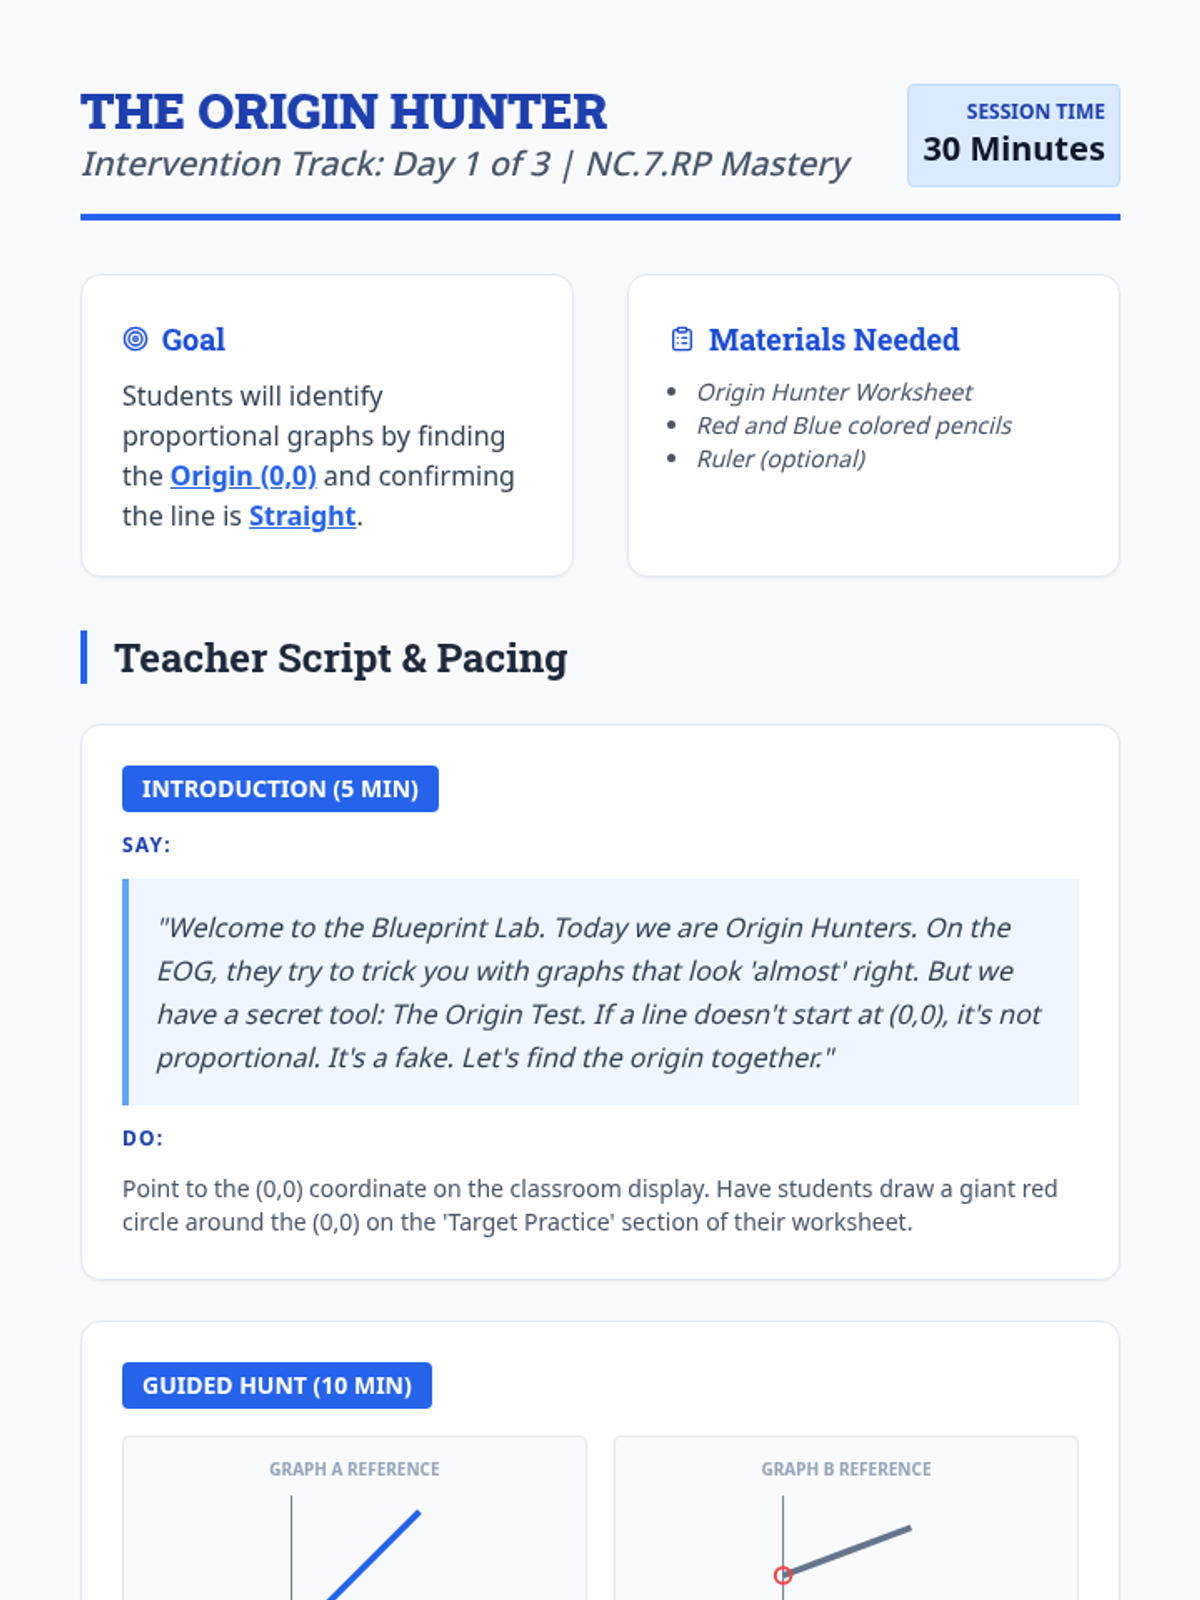
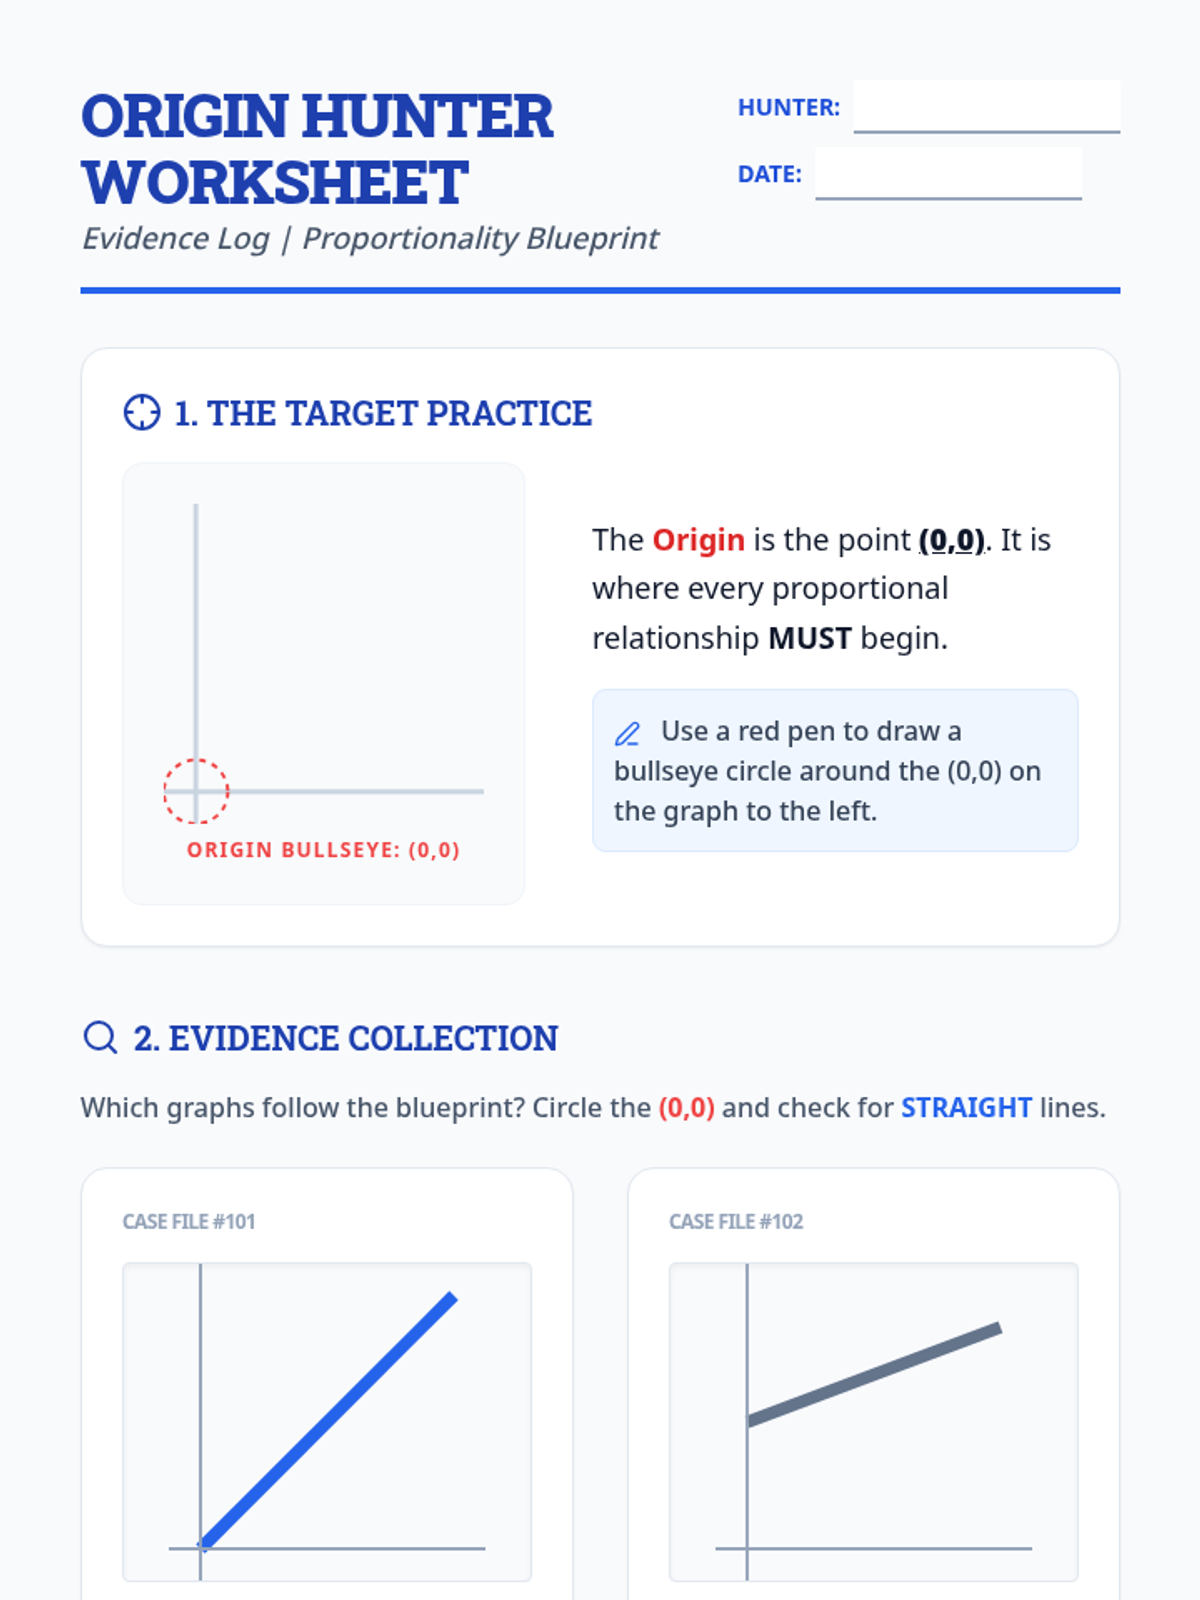
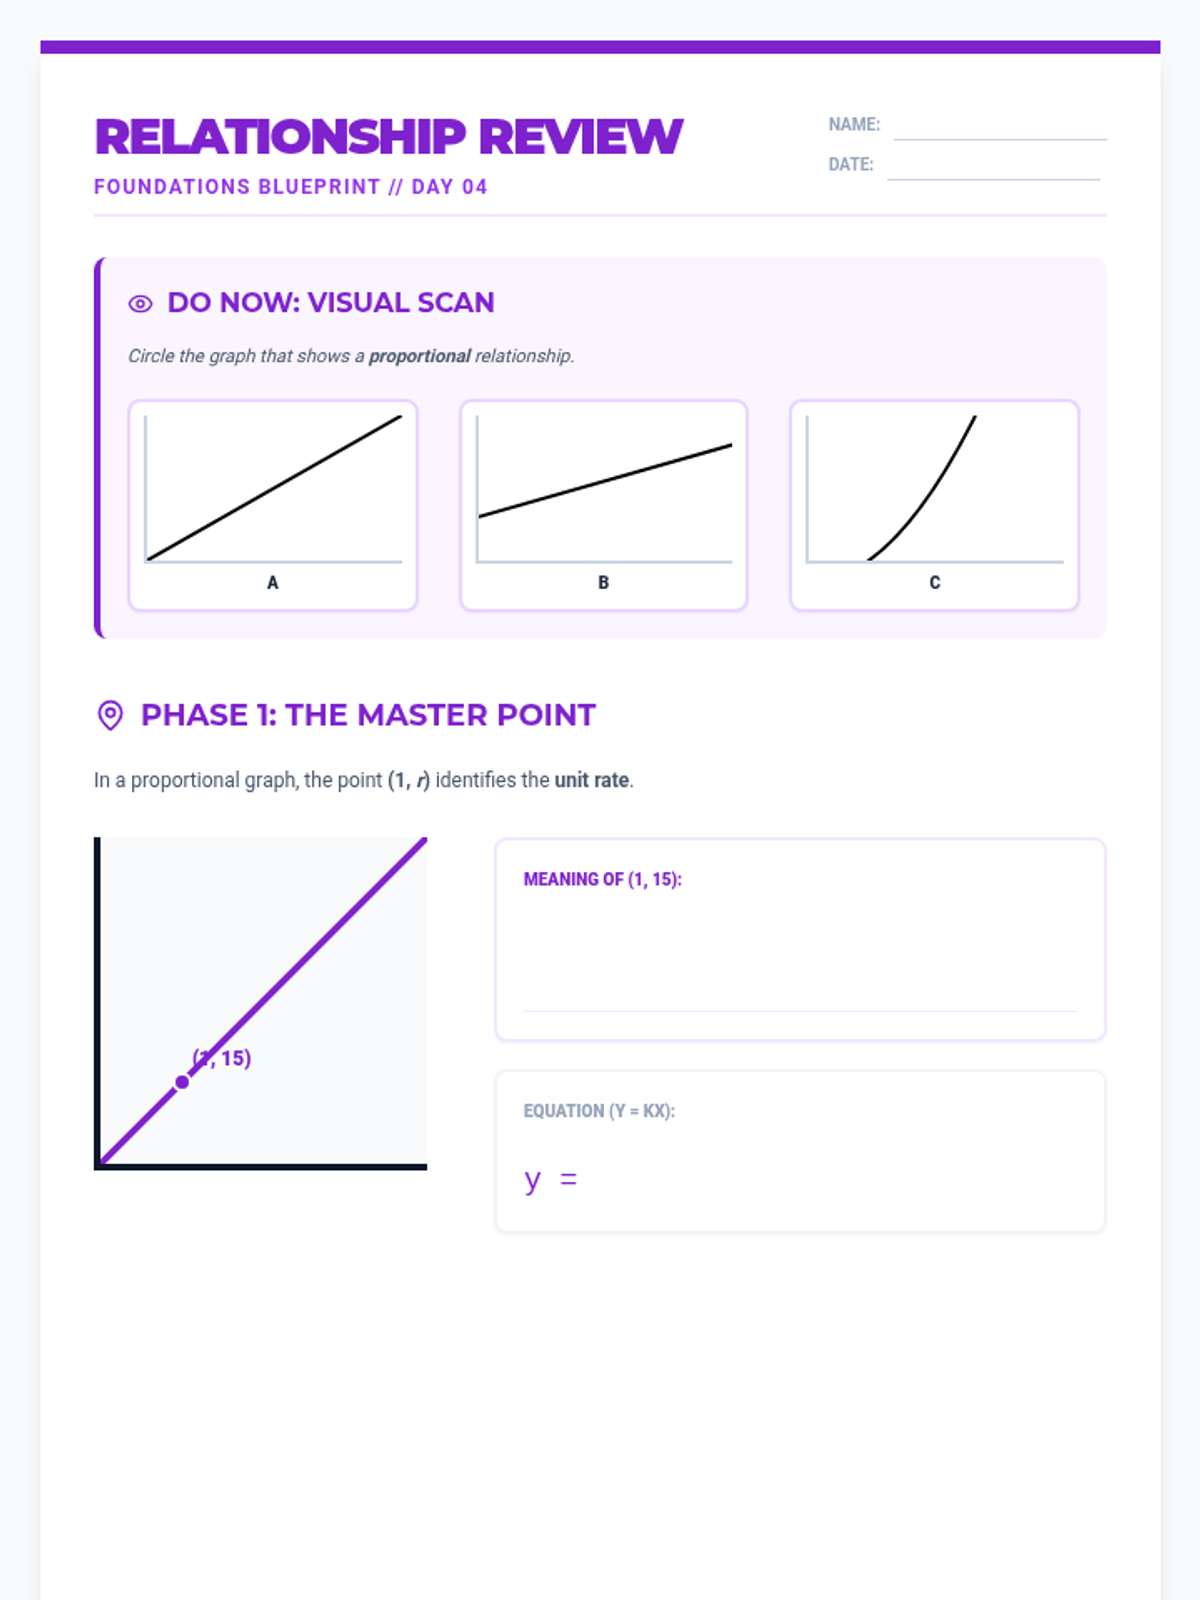
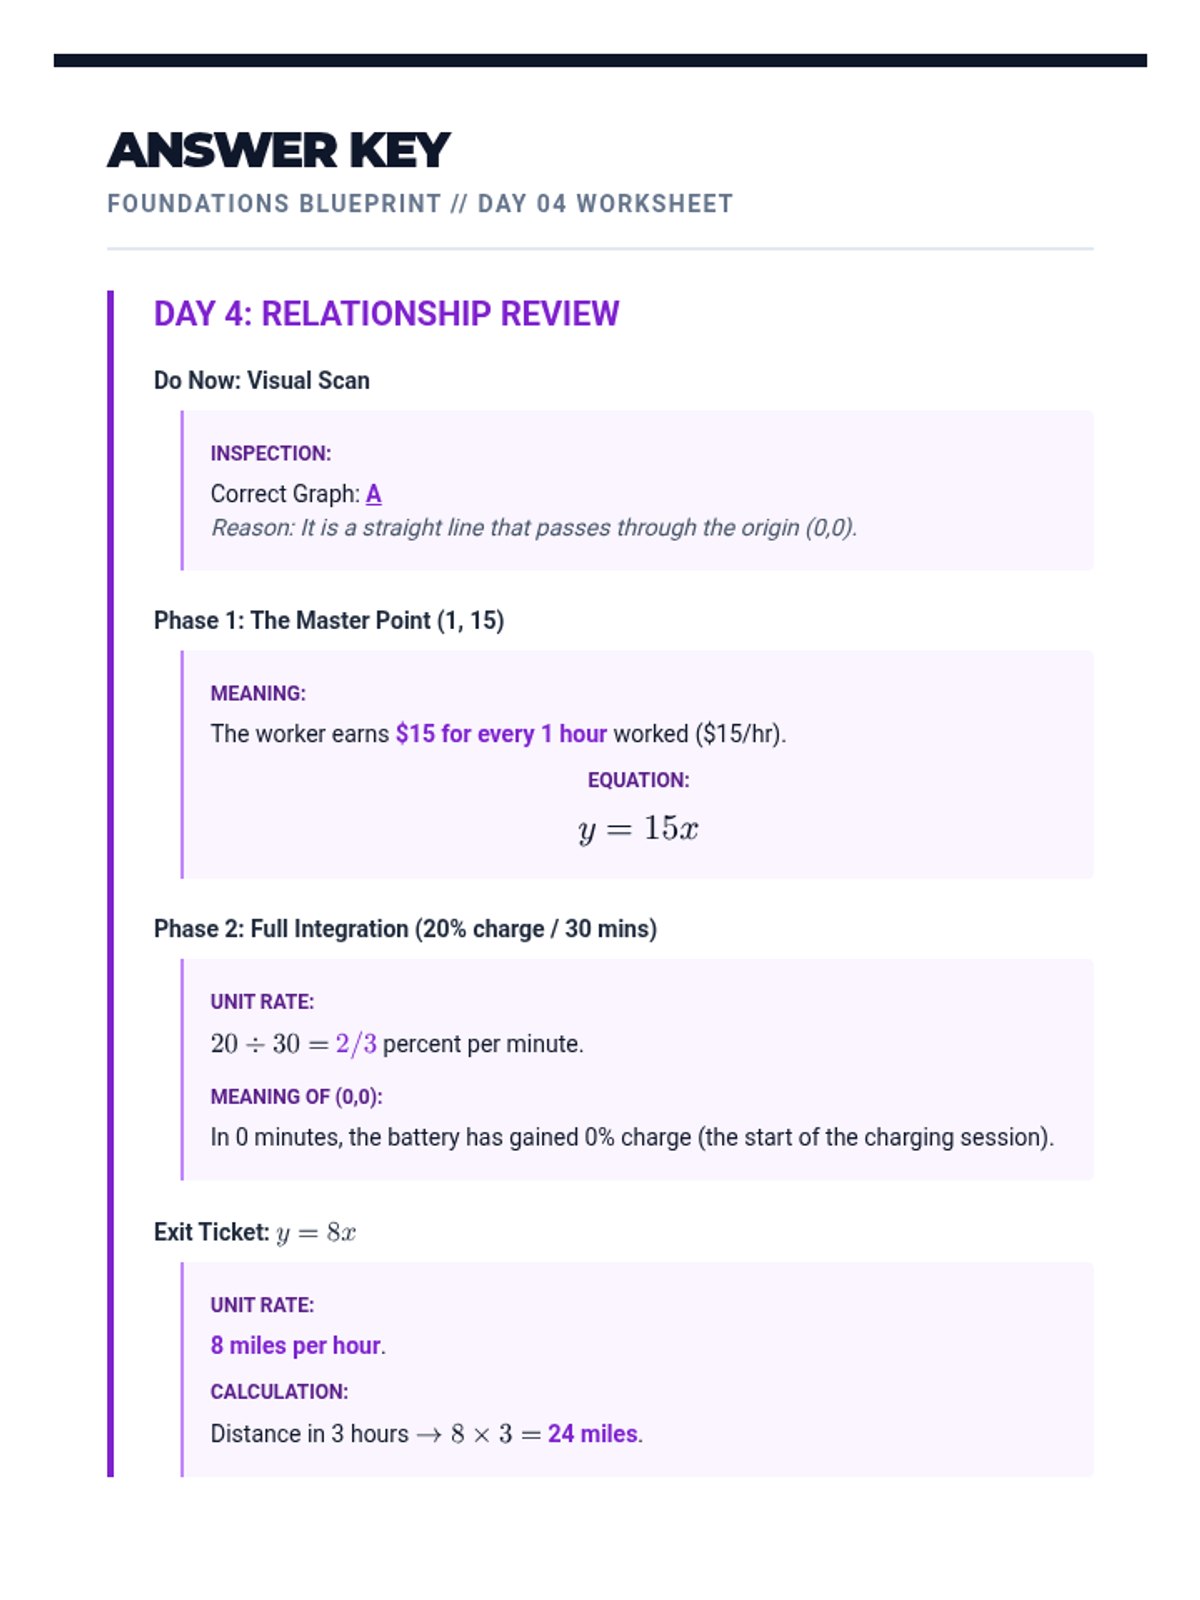
Day 1 of the intervention focusing on the visual 'Origin Test'. Students learn to identify proportional relationships on a graph by checking for a straight line and the (0,0) coordinate.
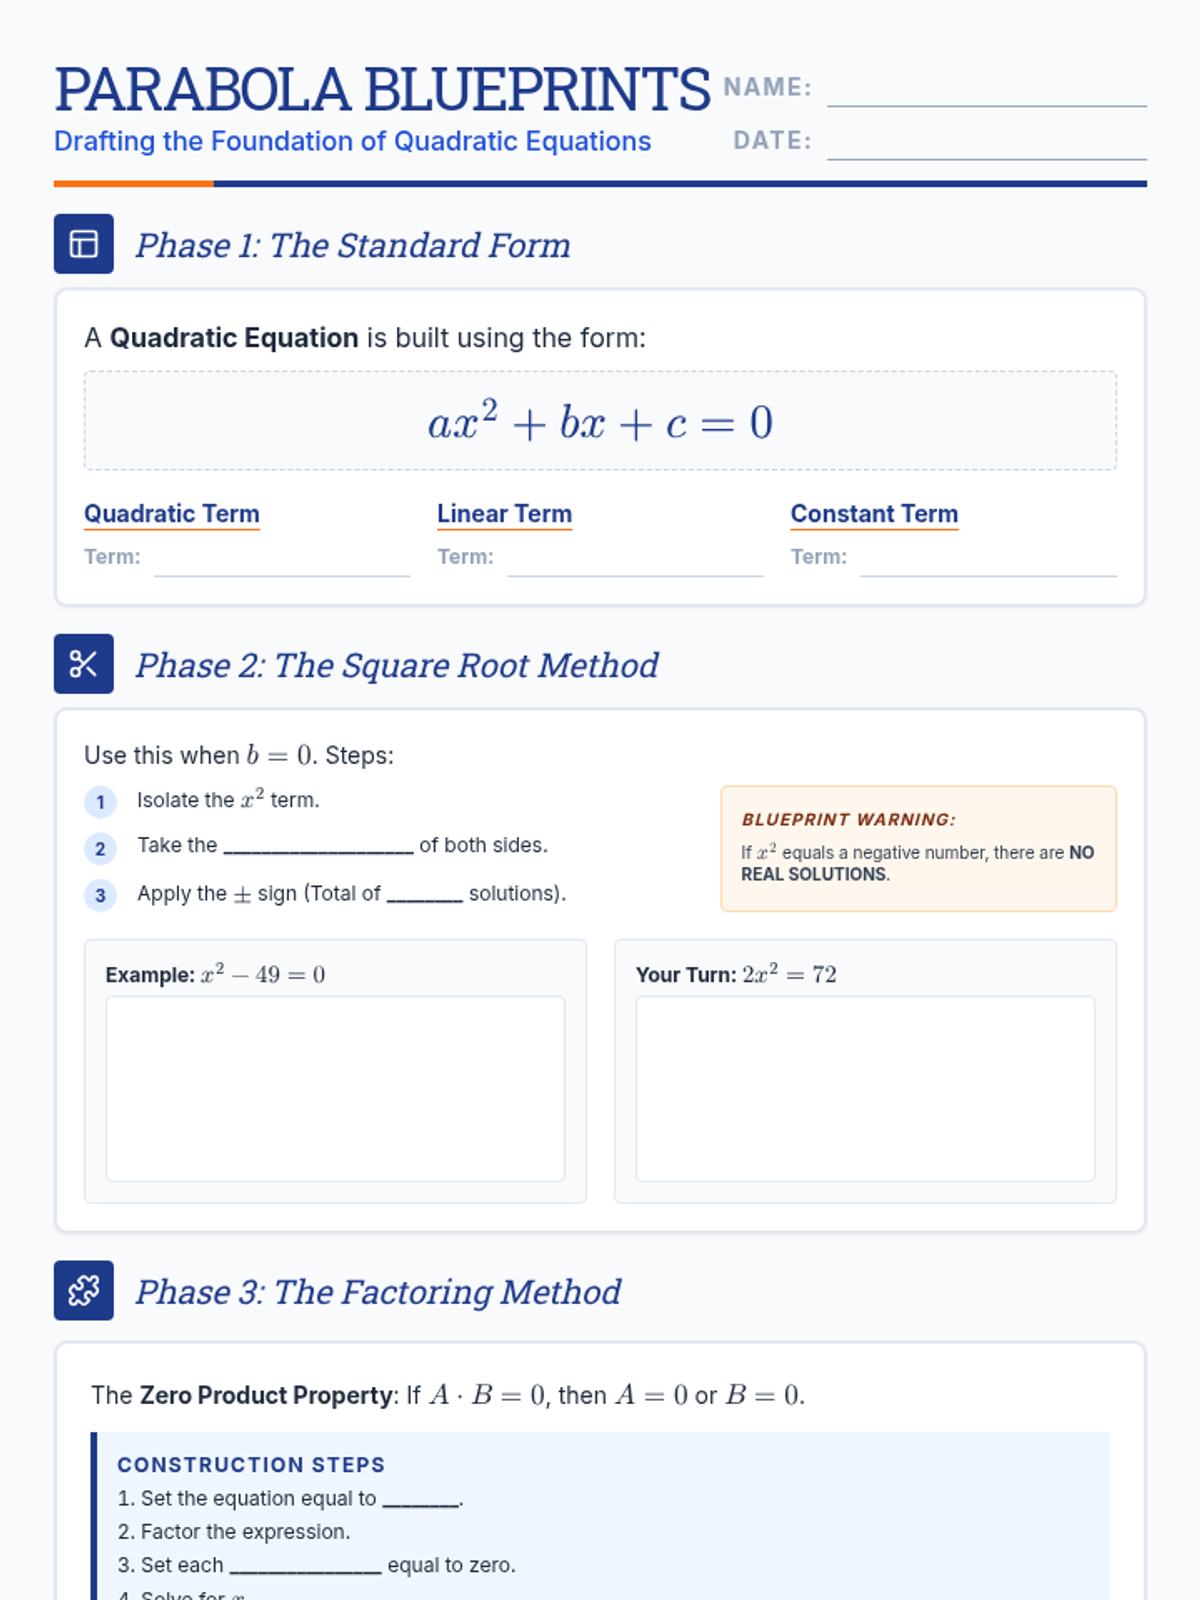
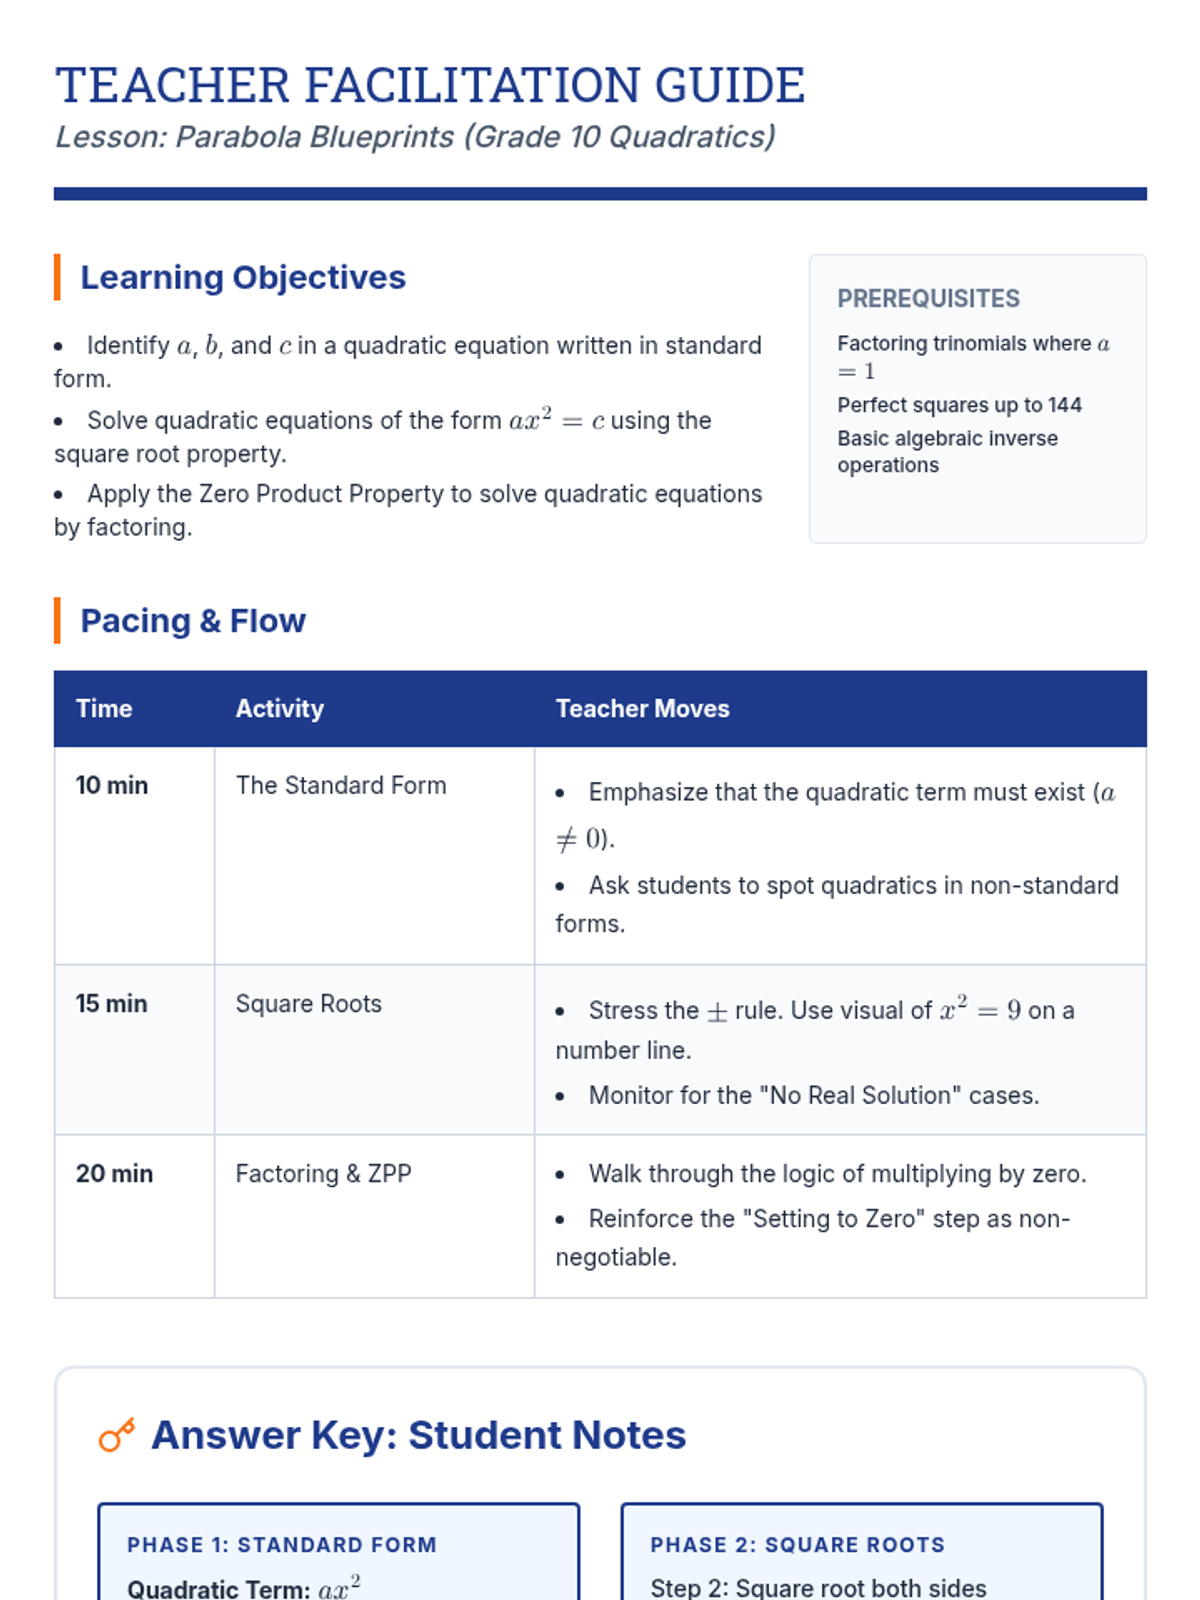
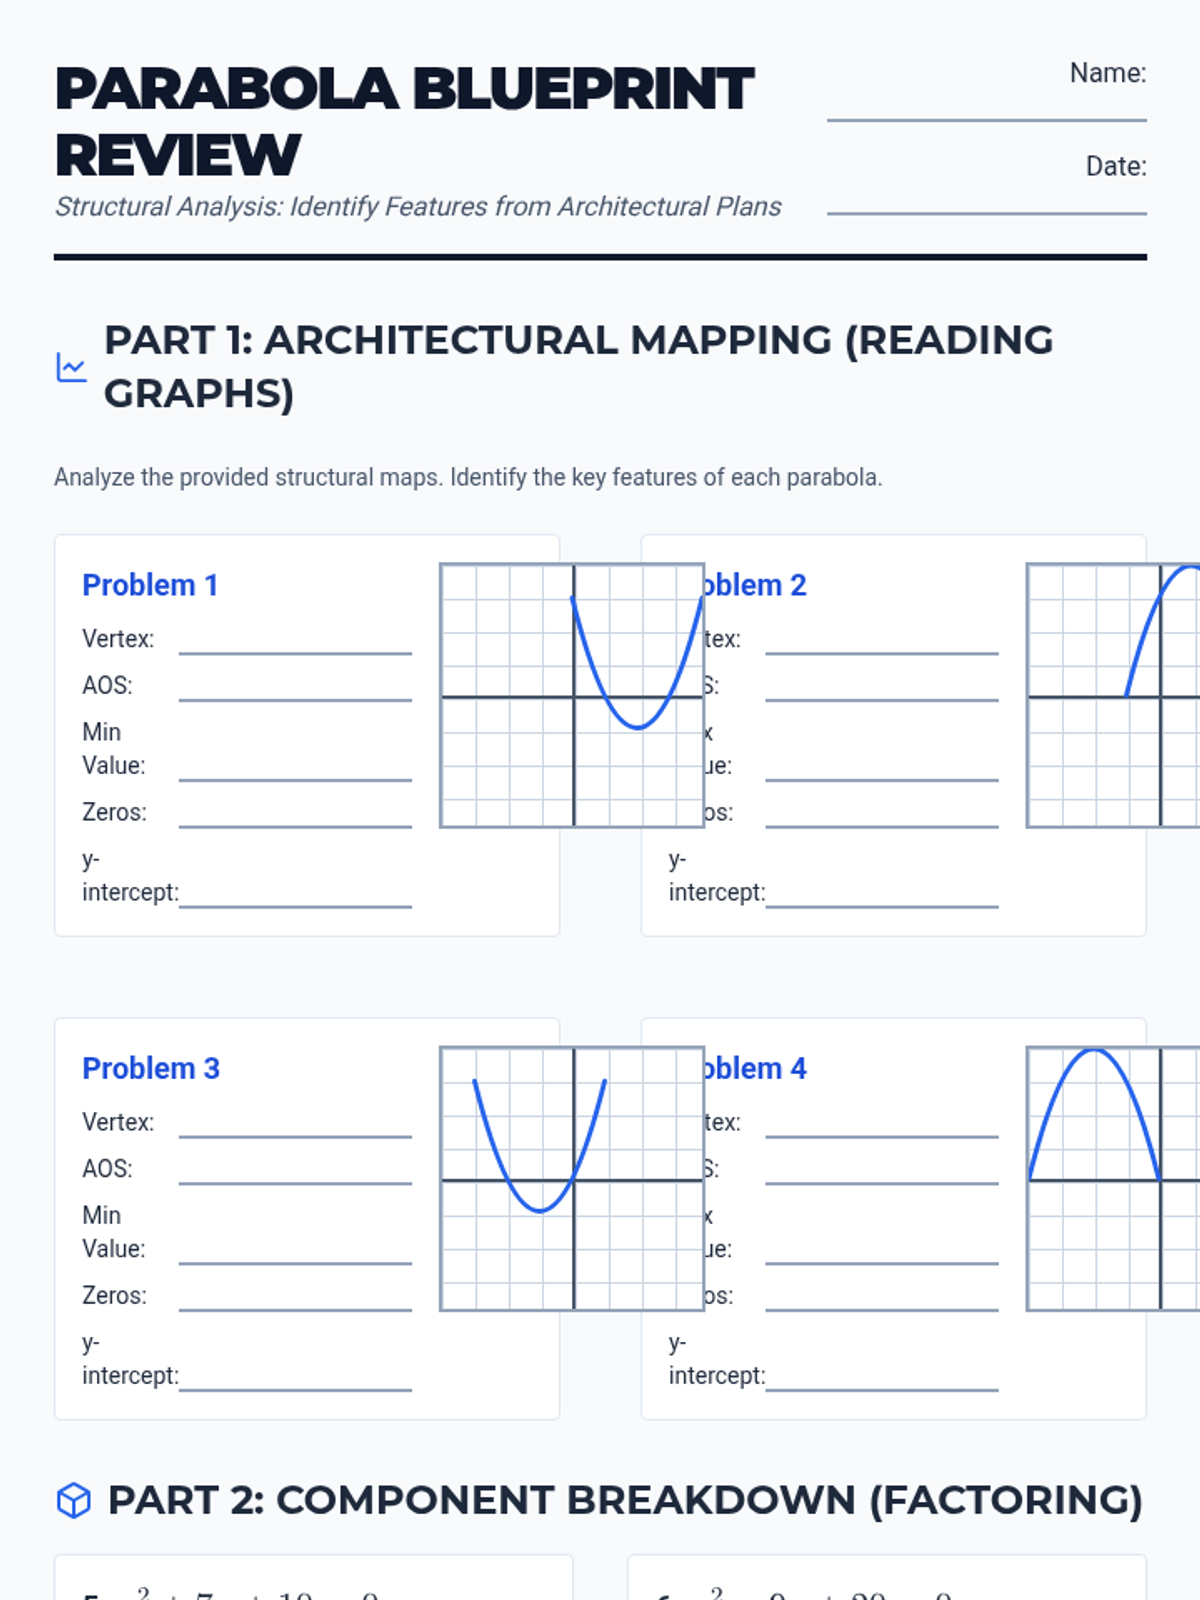
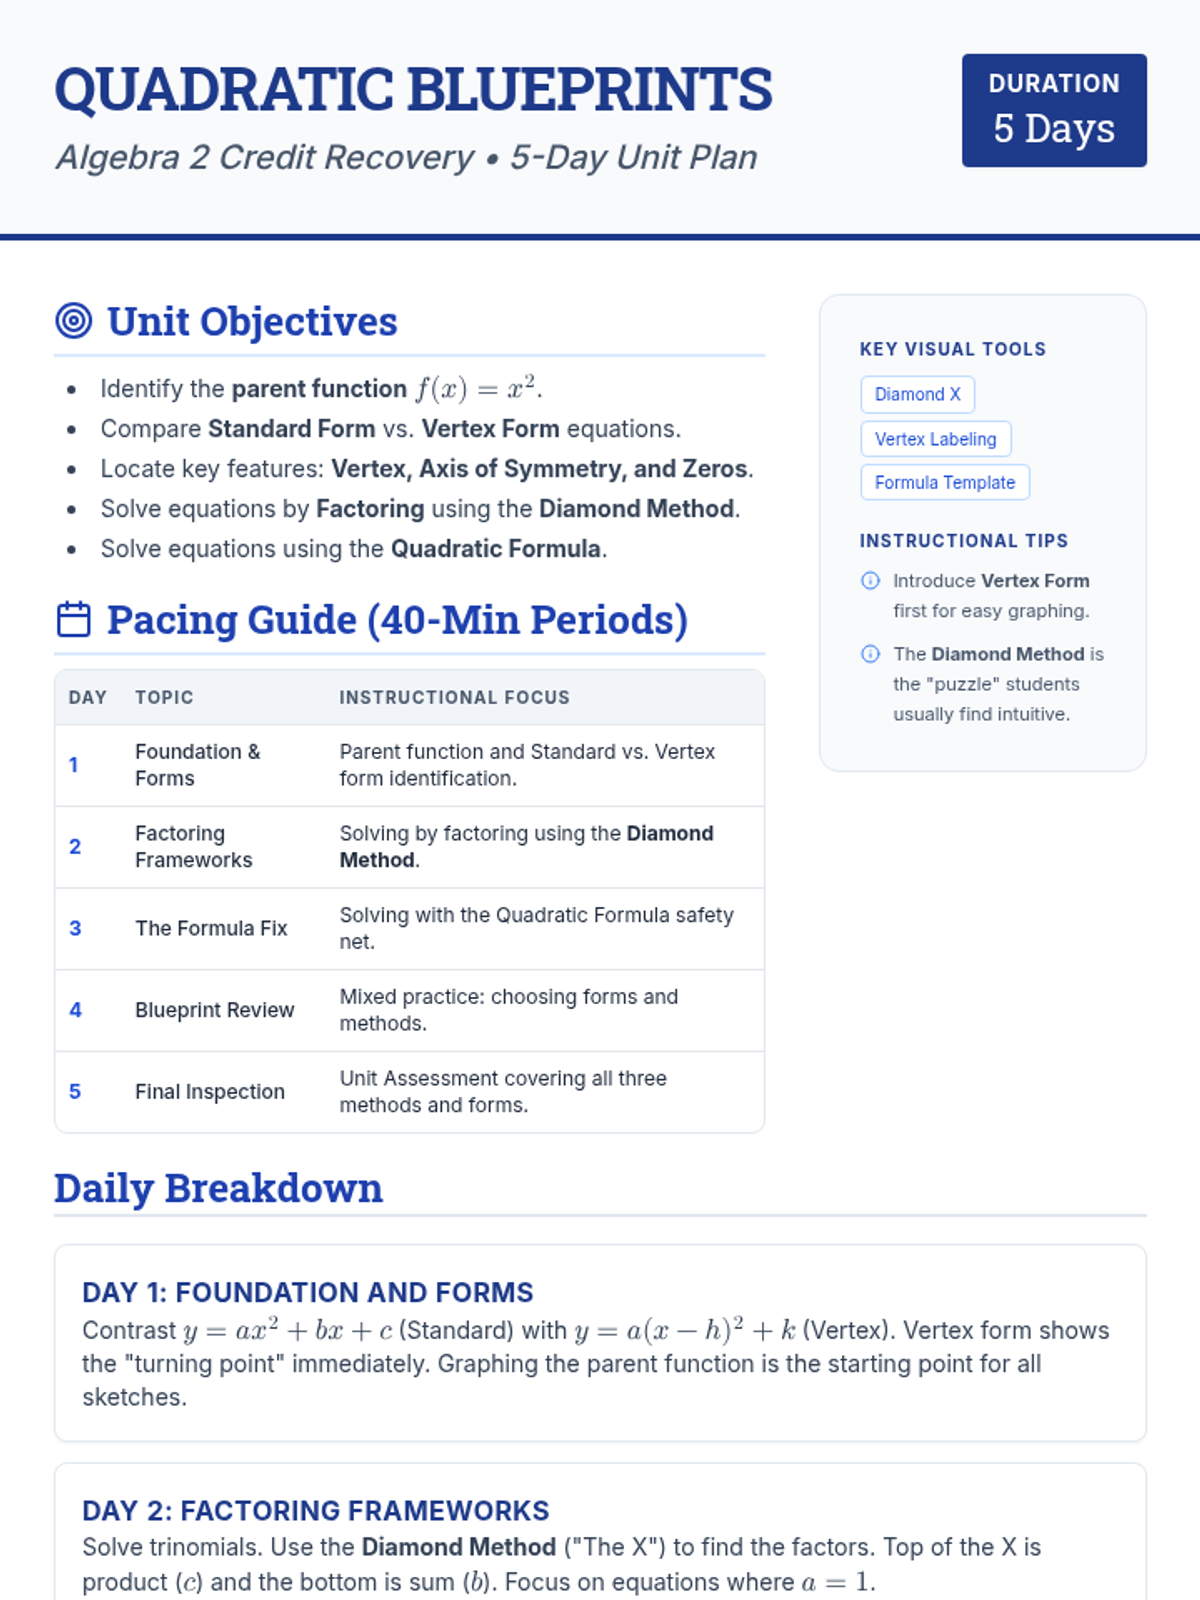
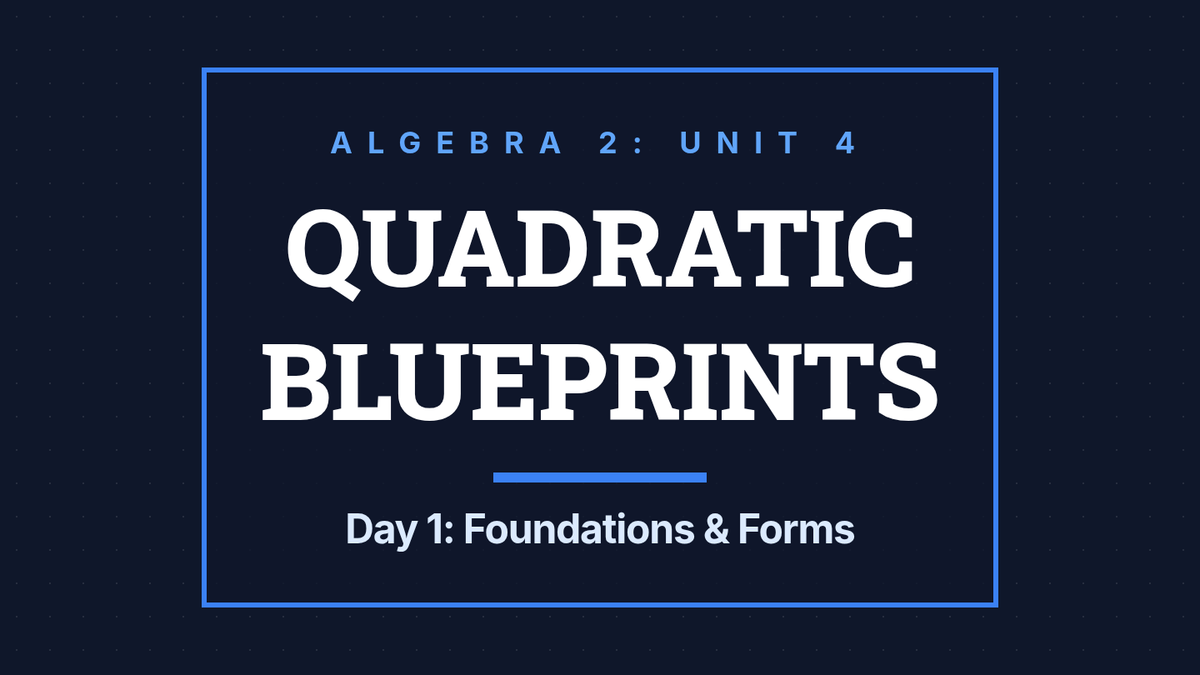
A foundational lesson introducing quadratic equations in standard form and solving them using the square root property and factoring. Students will build a 'blueprint' for understanding these U-shaped functions.
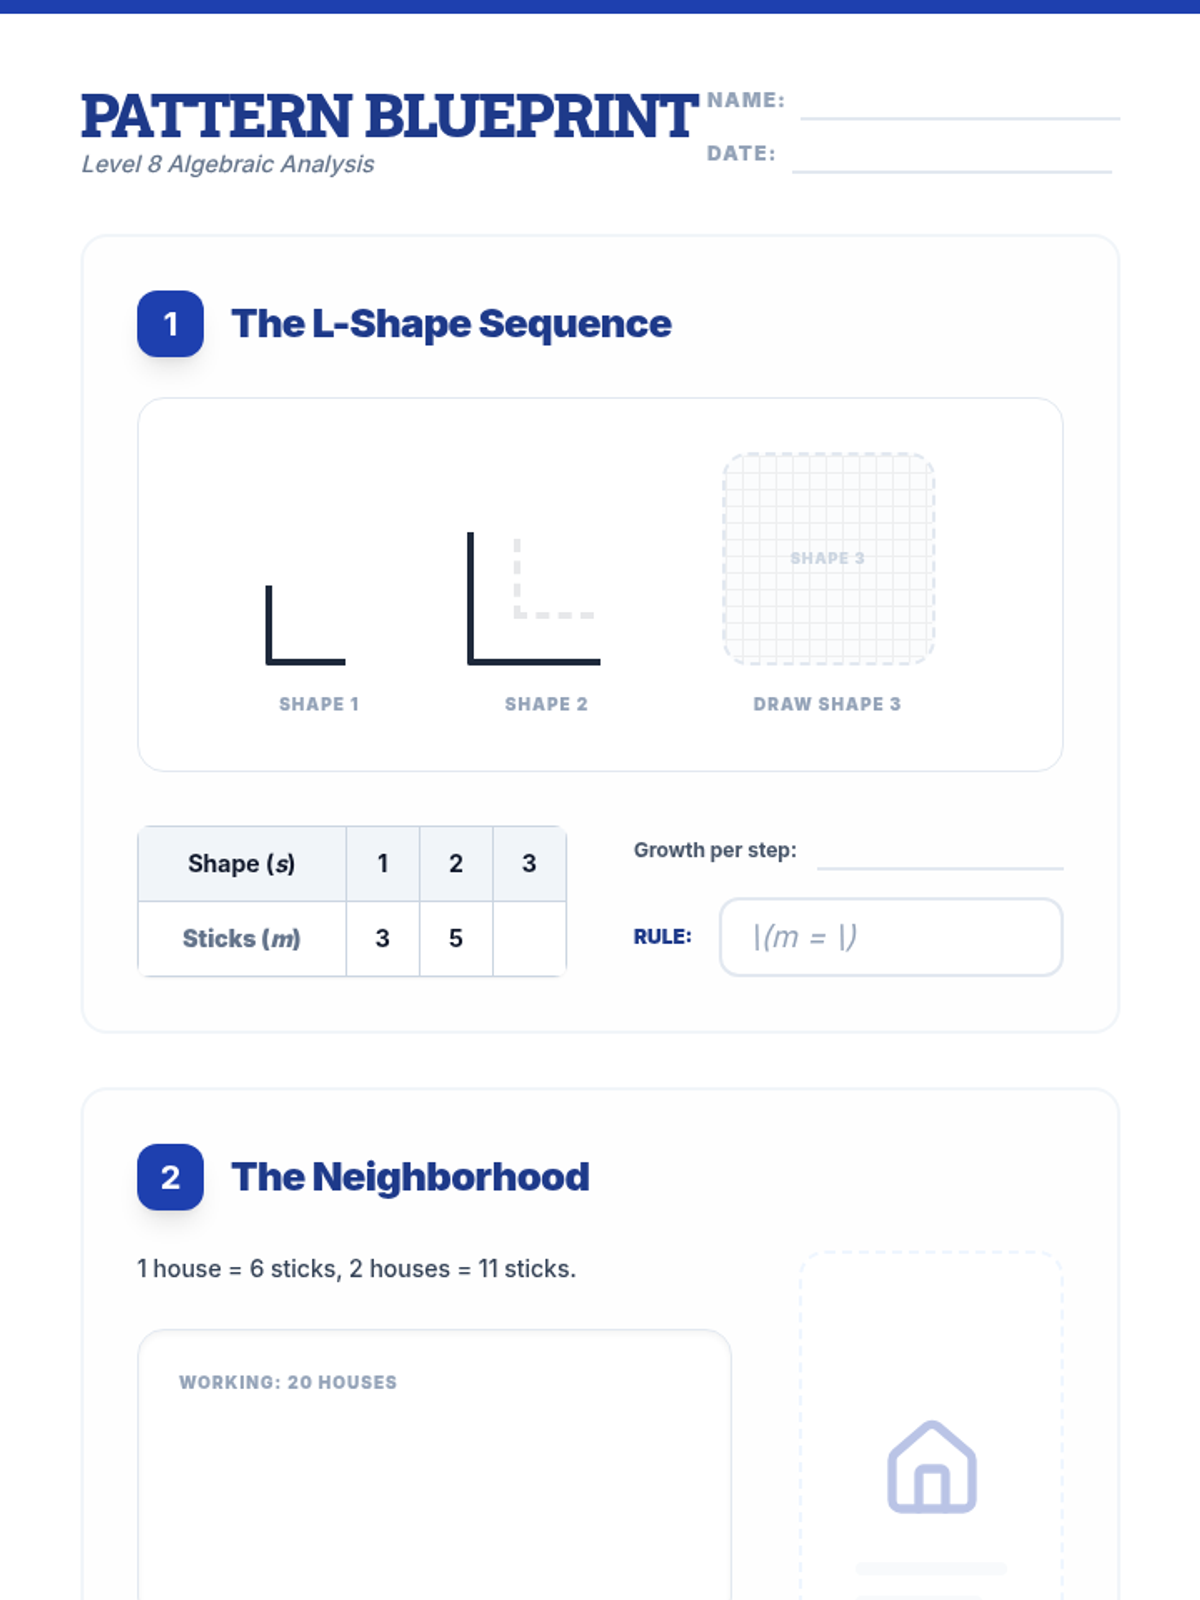
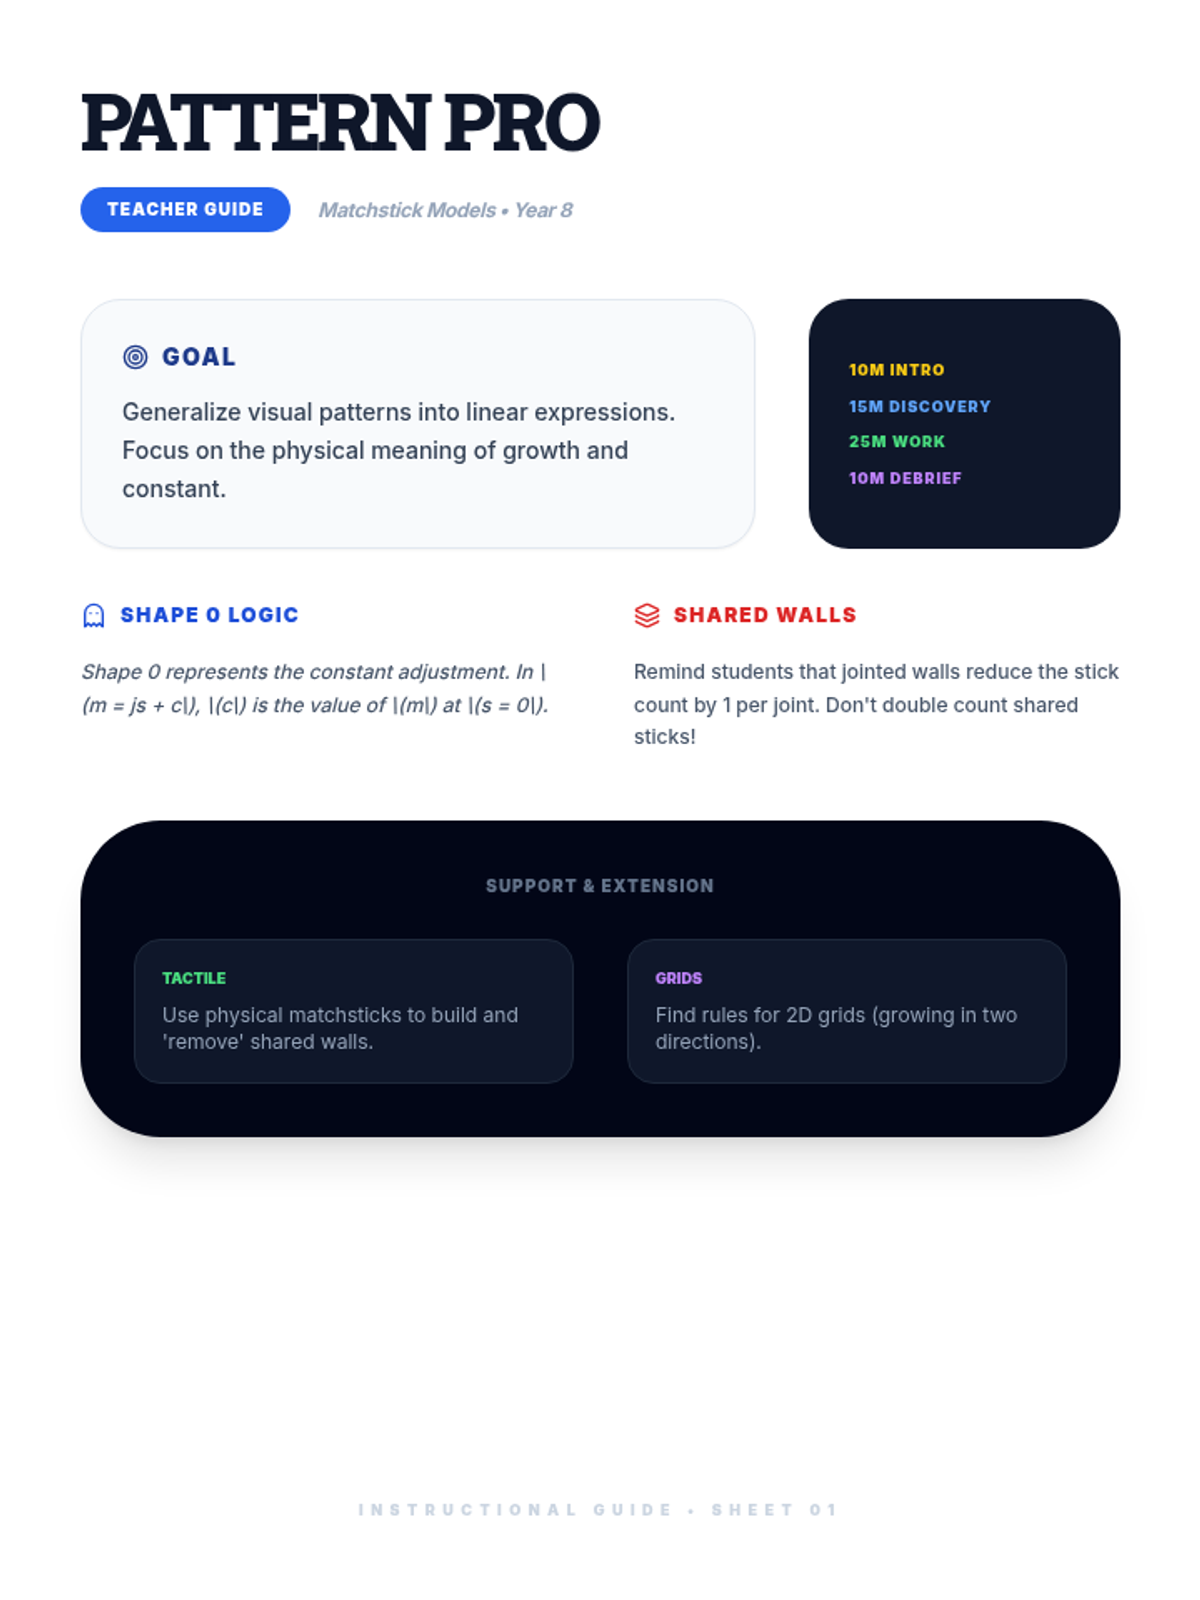
A lesson introducing Year 8 students to algebraic patterns using visual matchstick sequences, focusing on generating rules and expressions.
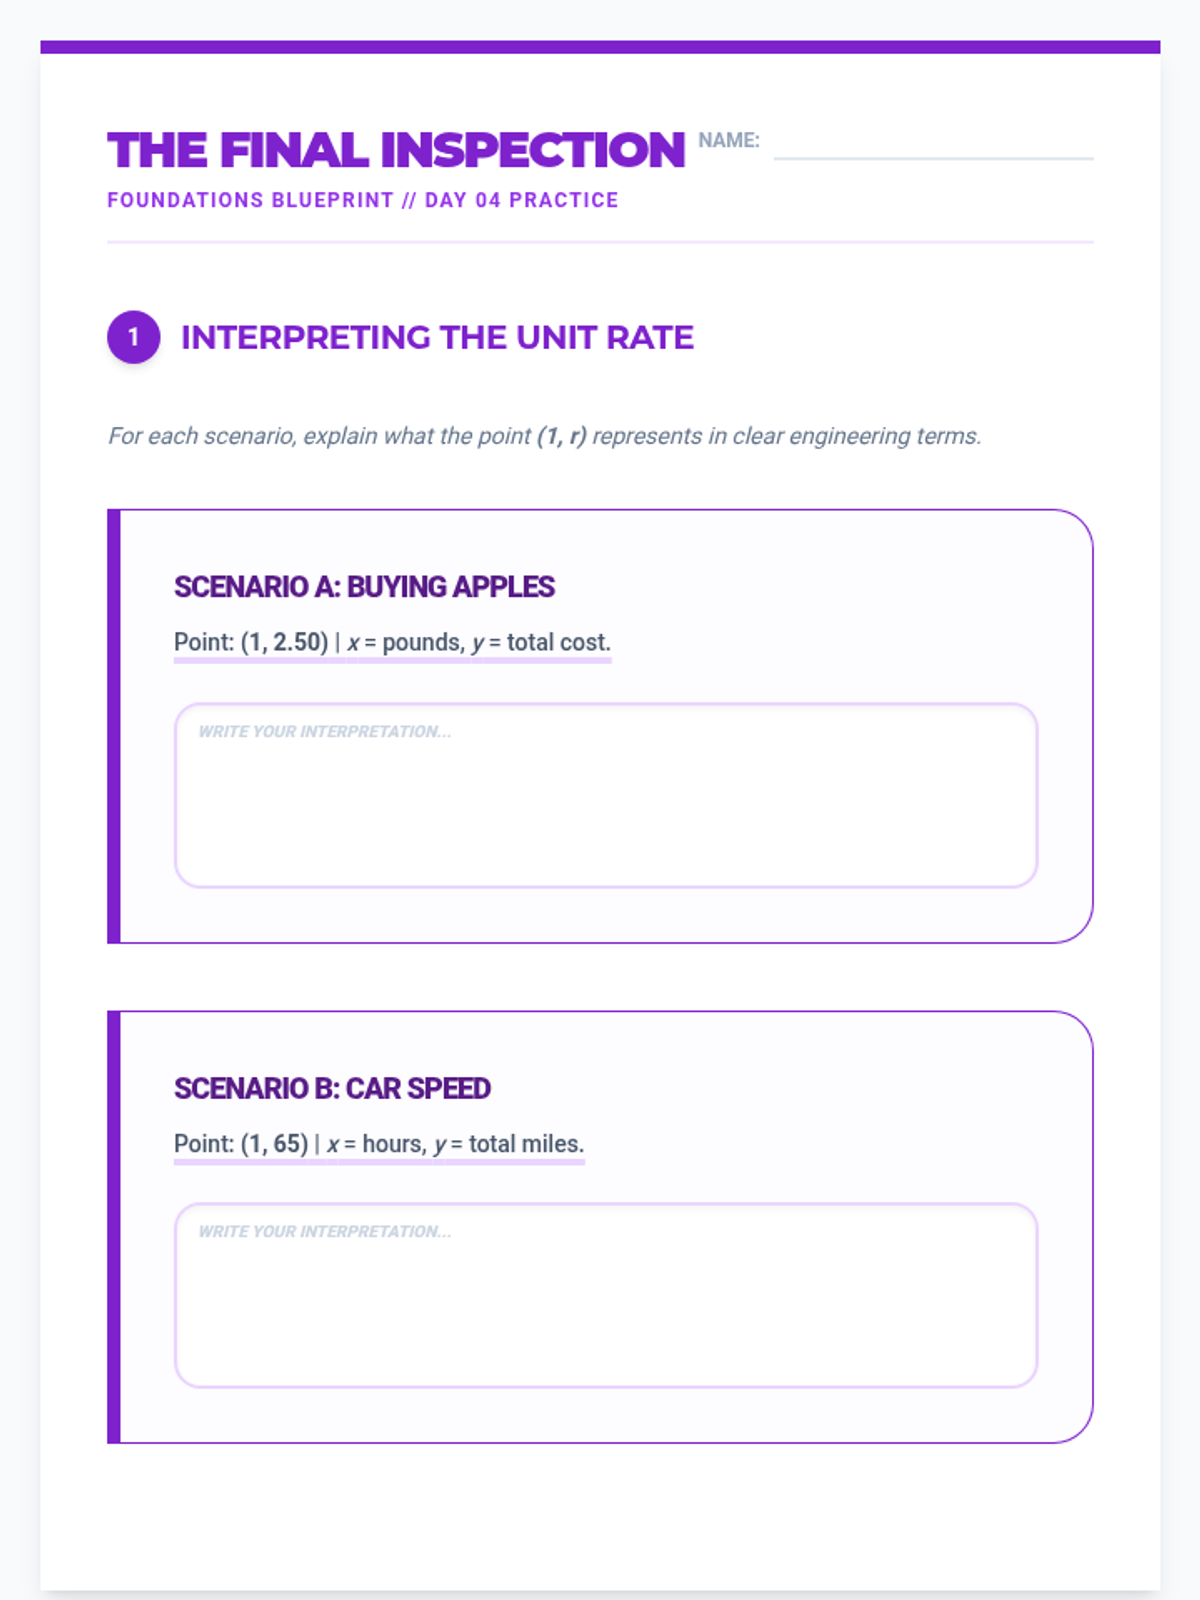
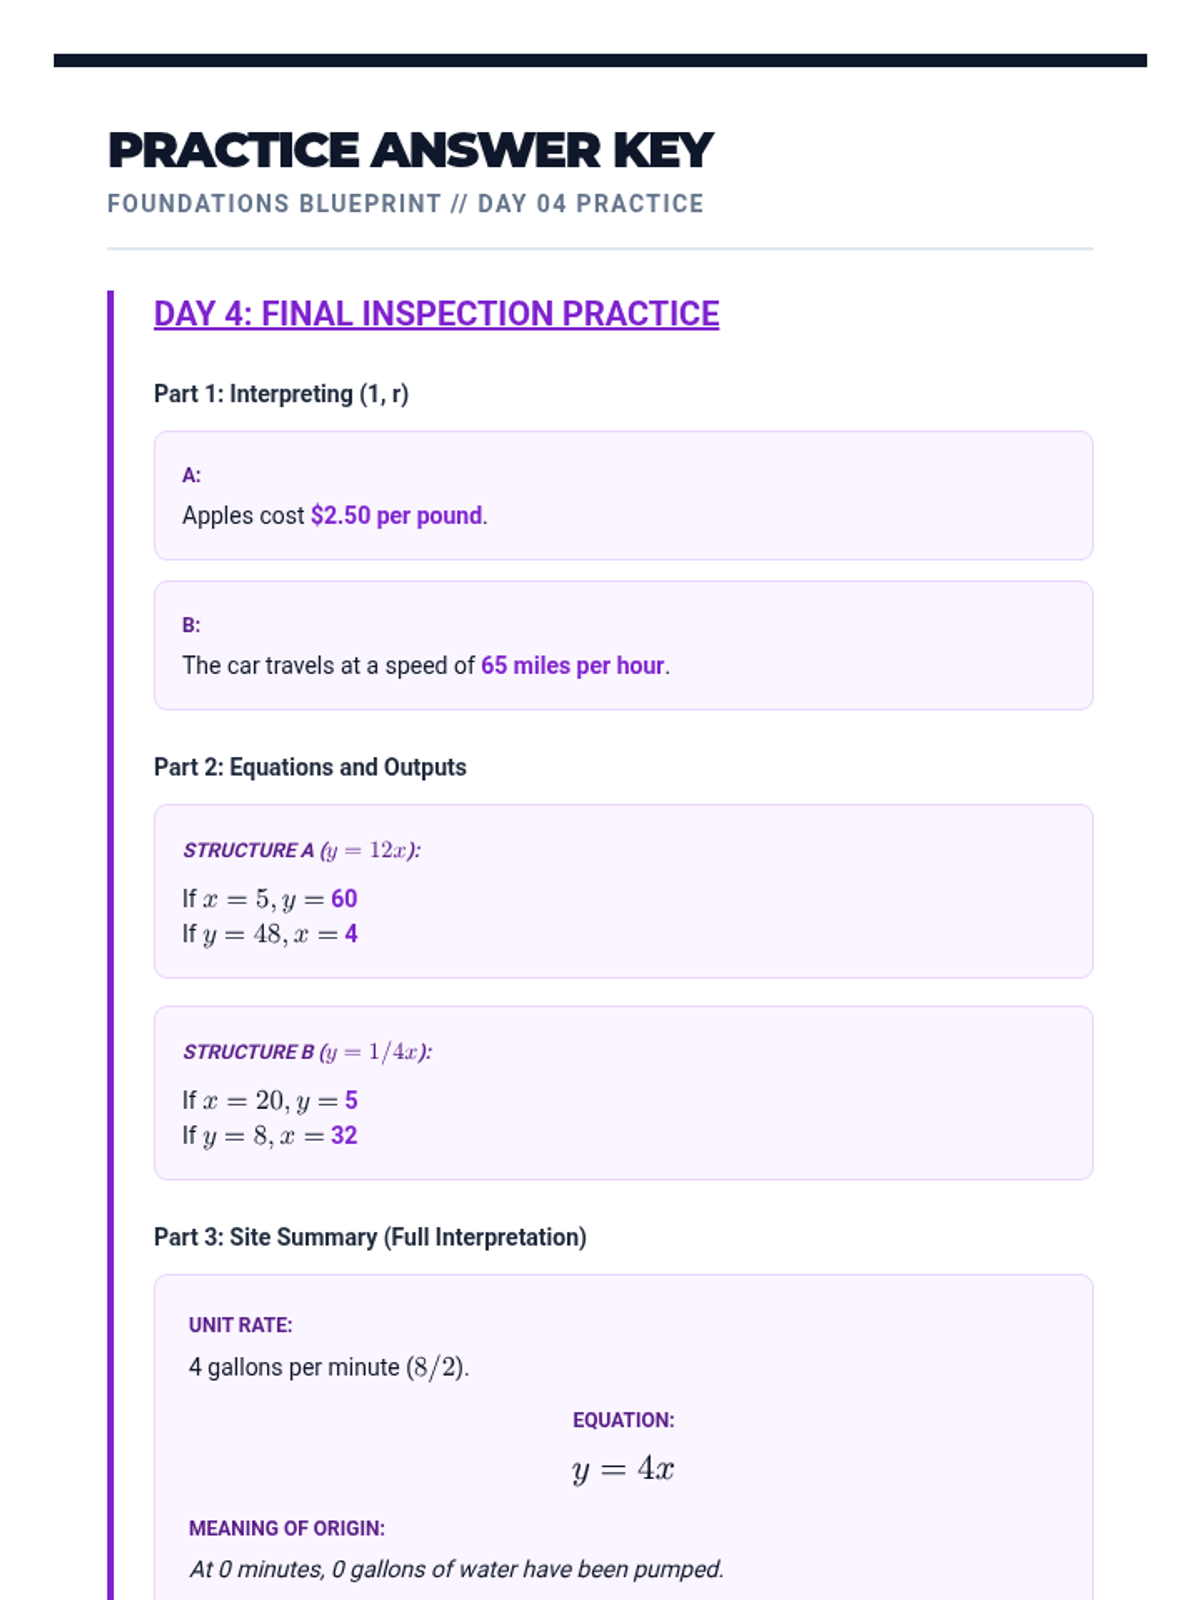
In-depth look at interpreting points on a proportional graph, specifically the unit rate (1, r) and the origin (0, 0).
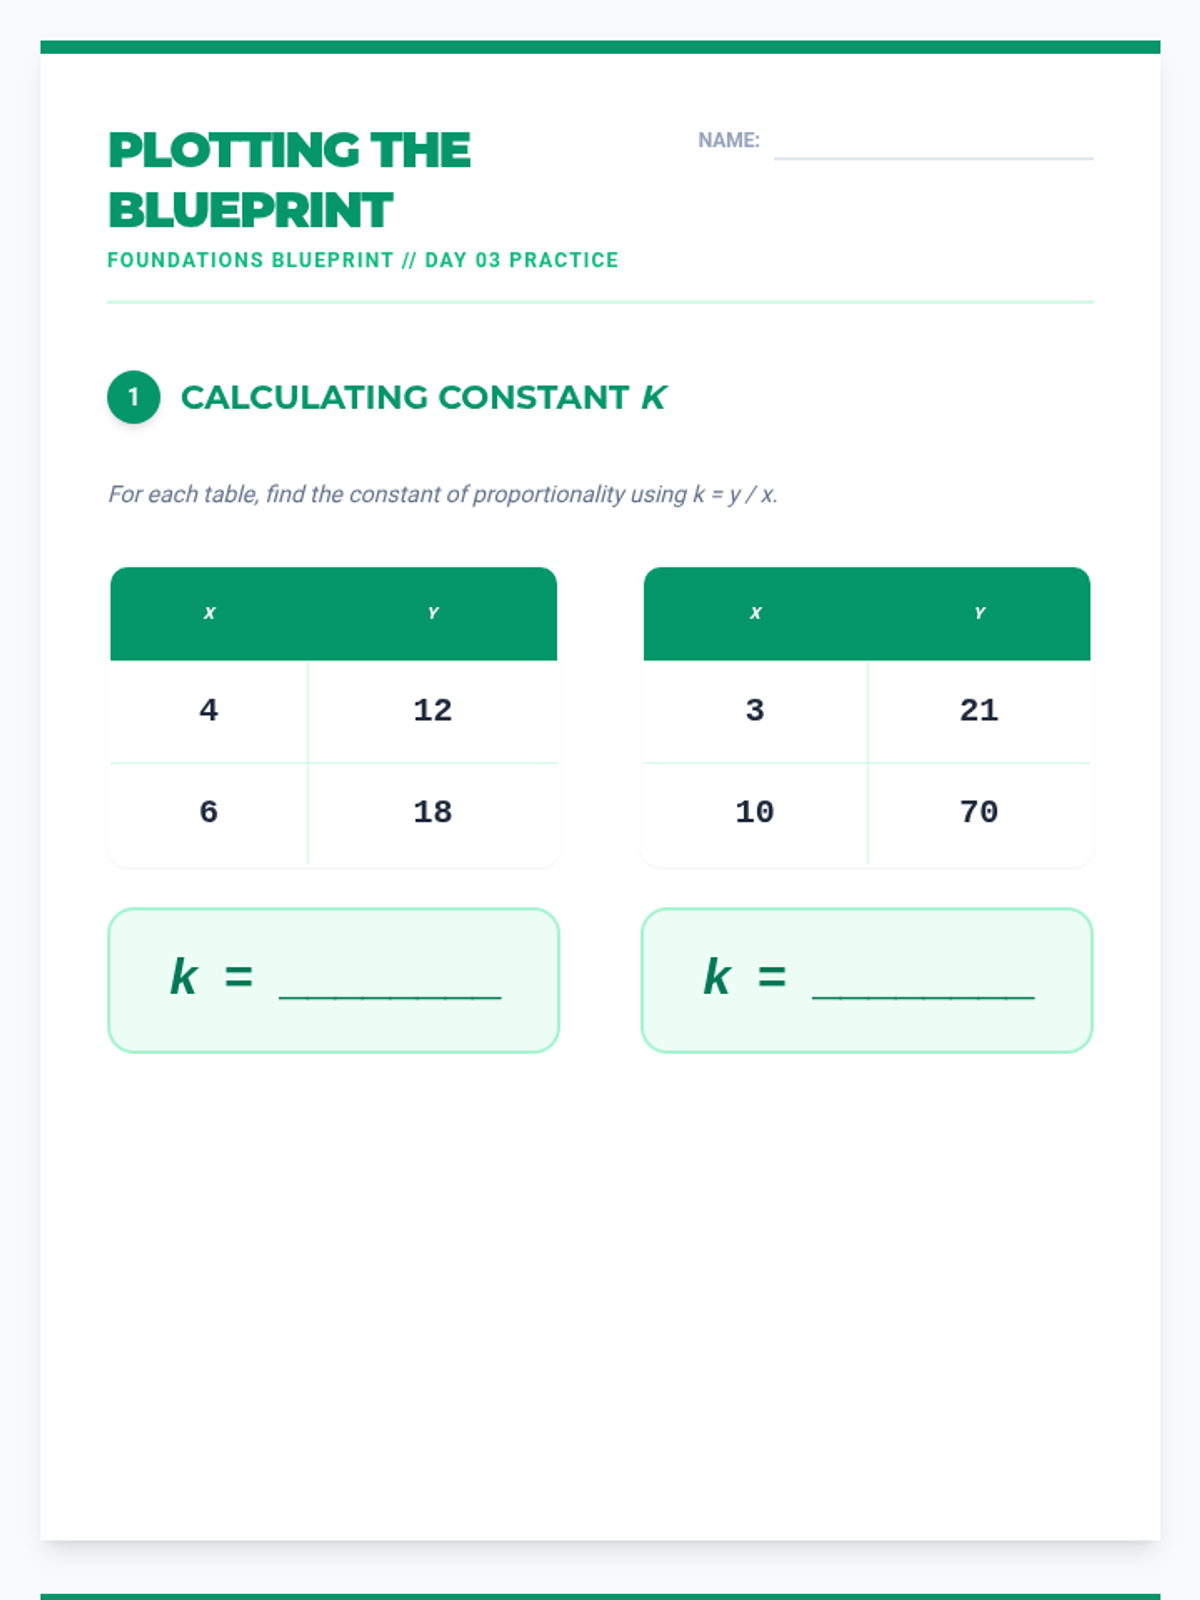
Students identify the constant of proportionality from tables and translate proportional relationships onto coordinate planes.
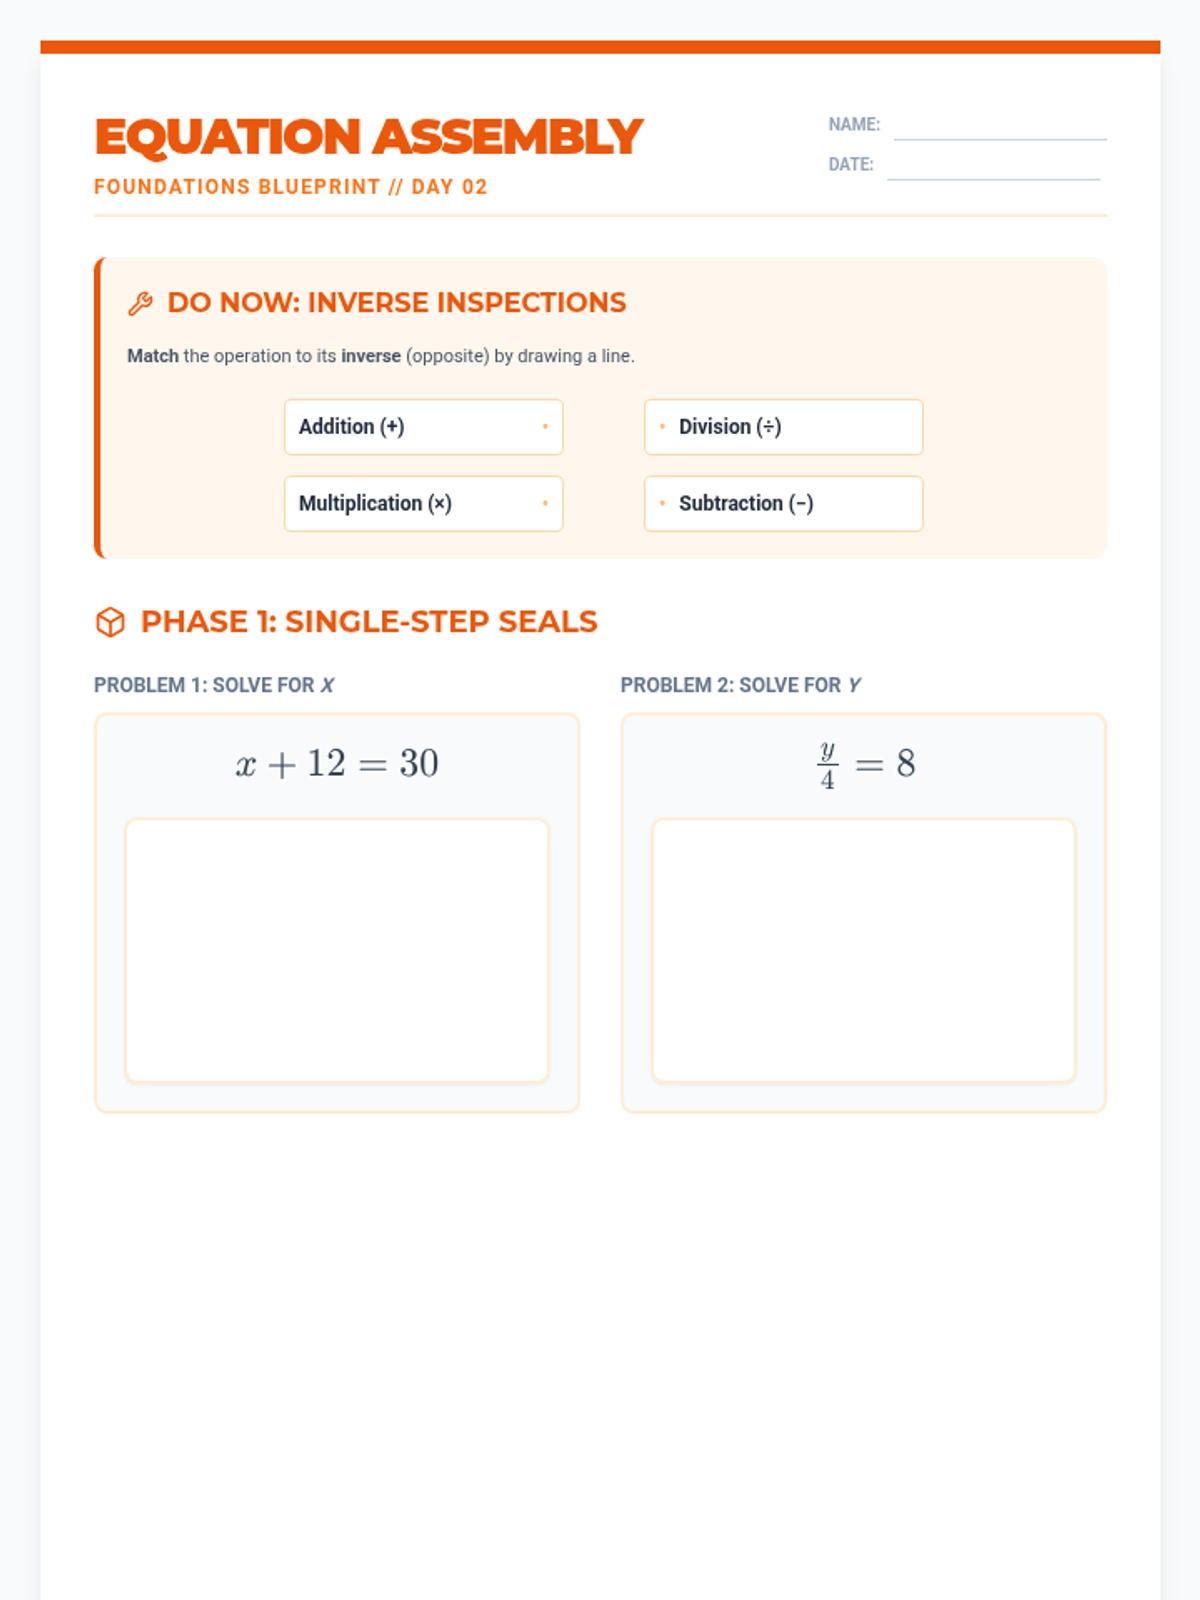
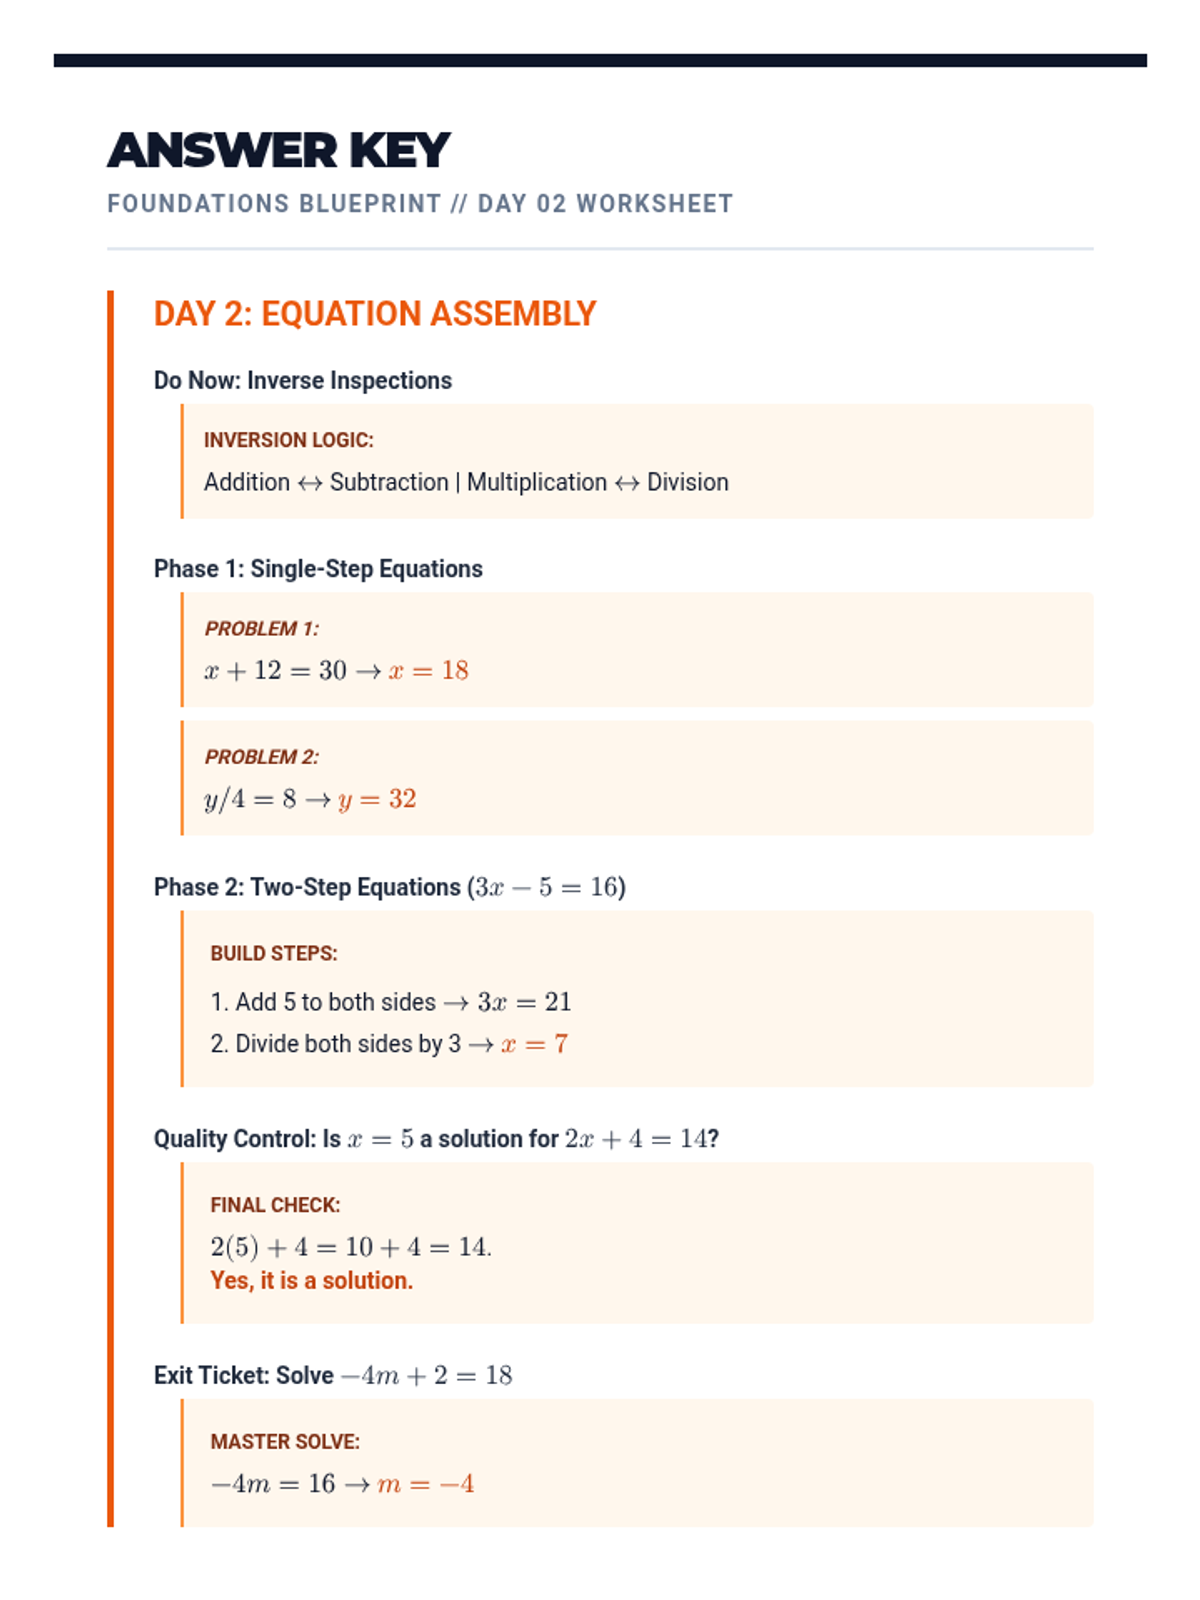
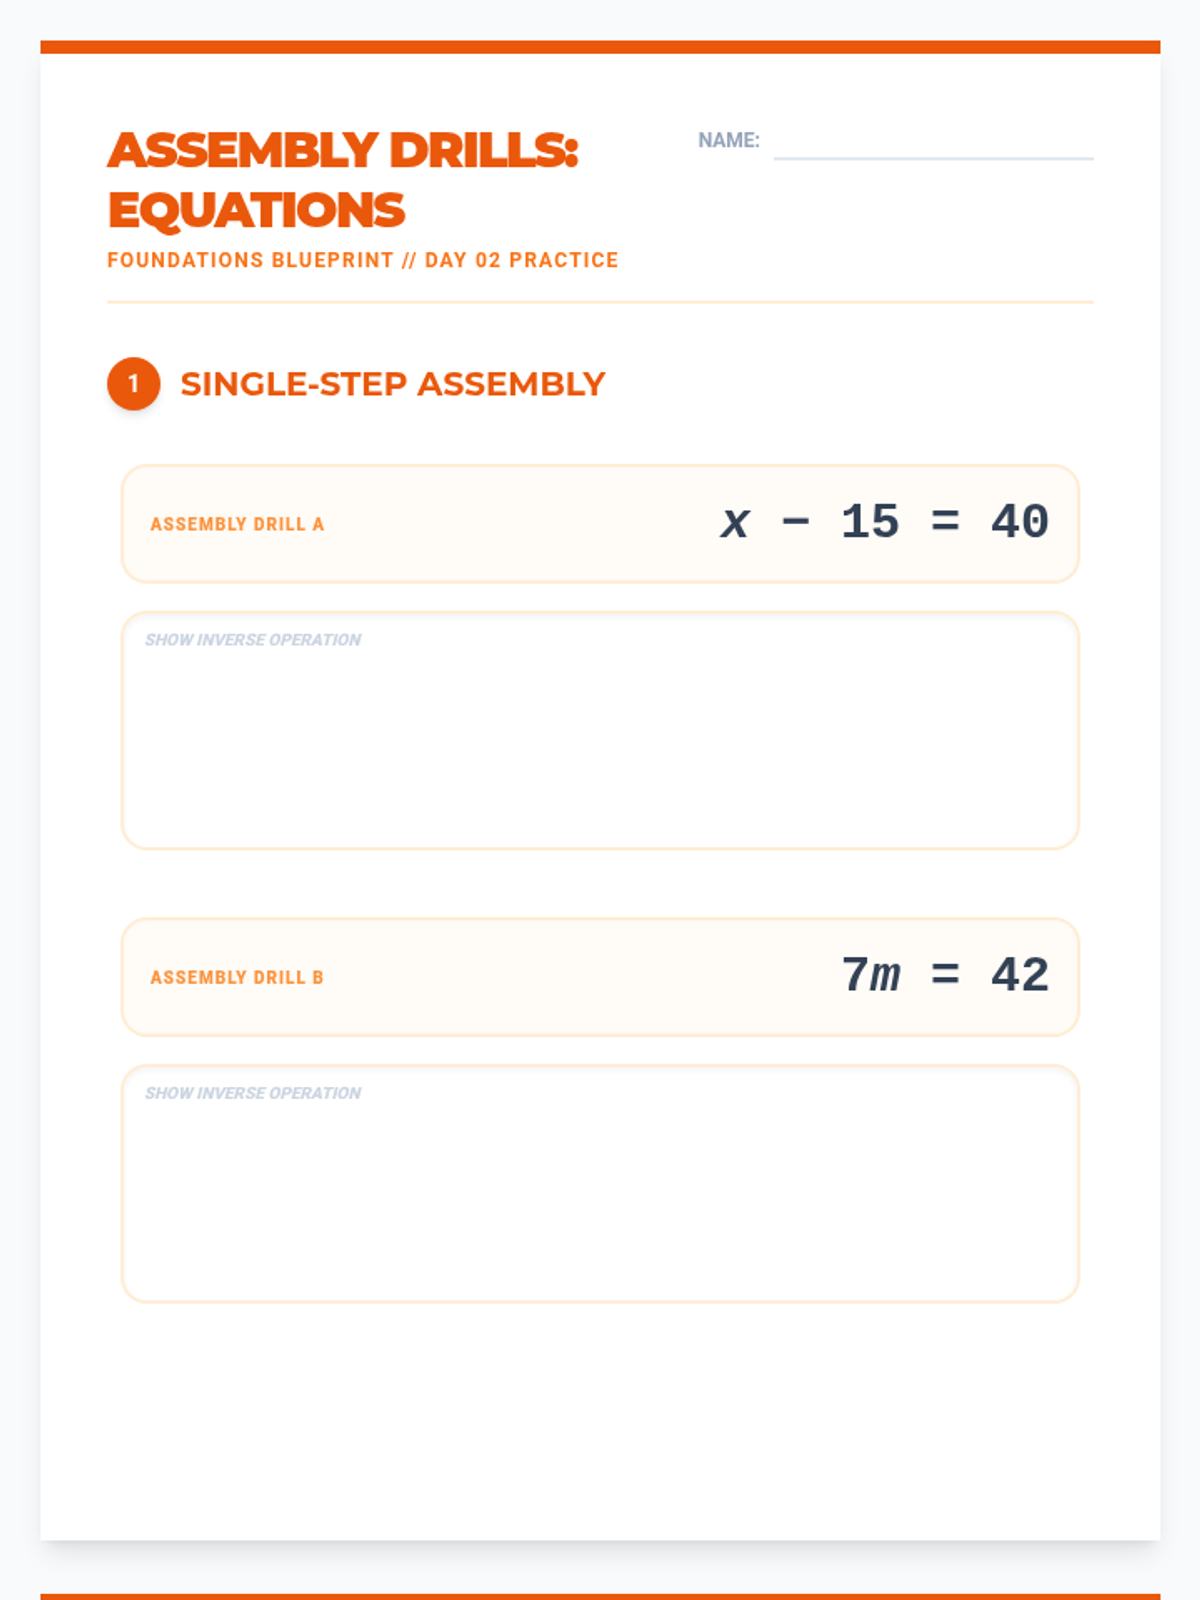
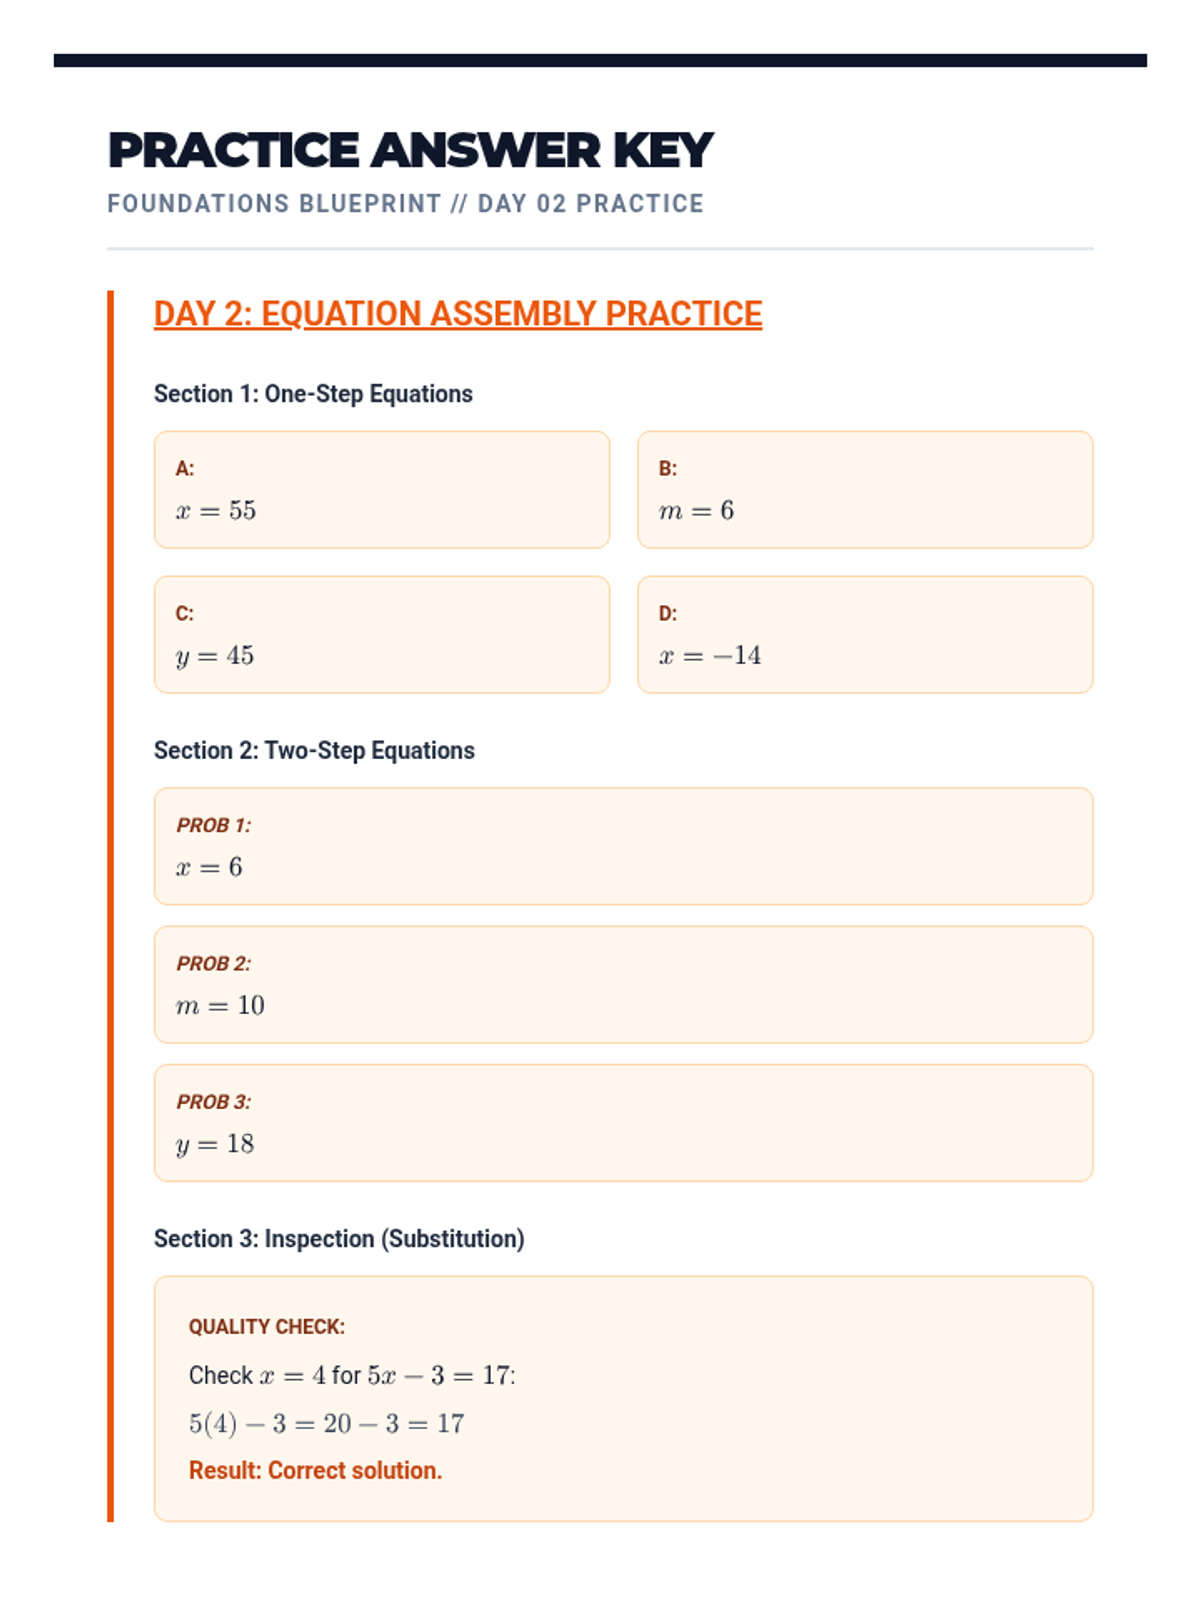
Covers solving one-step and two-step equations using inverse operations and verifying solutions through substitution.
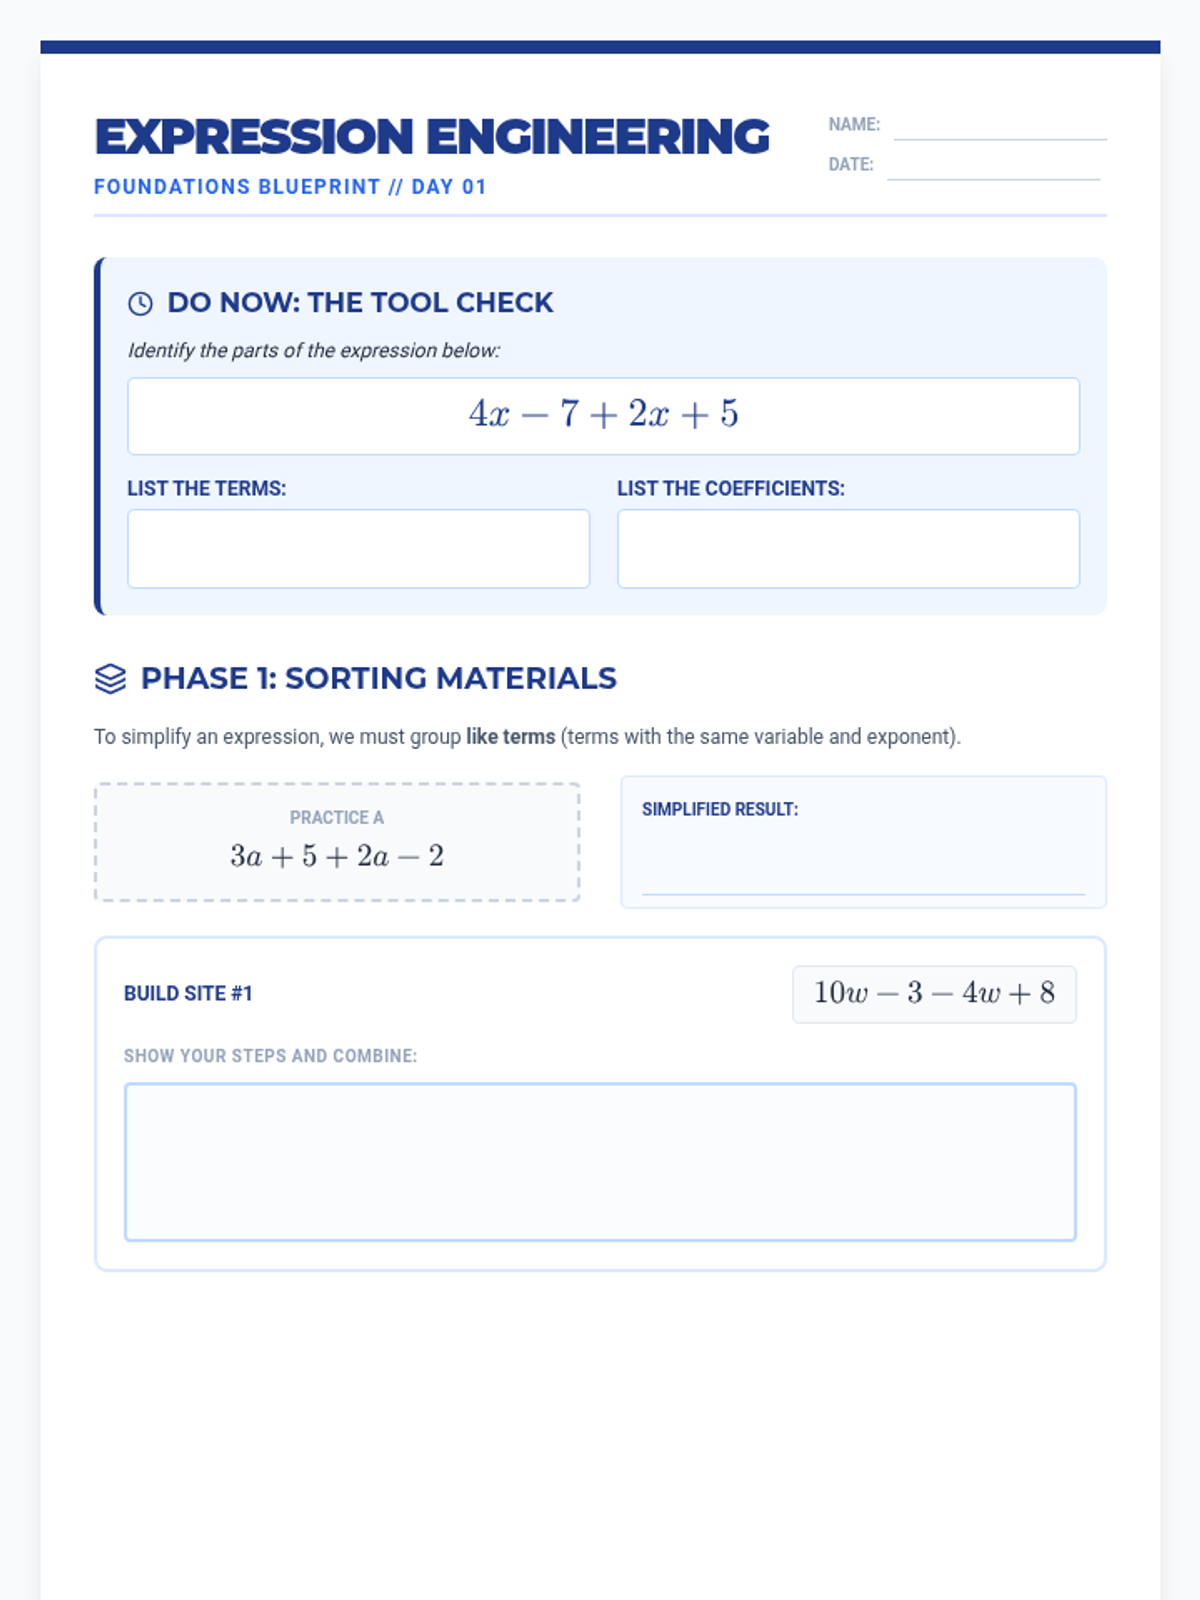
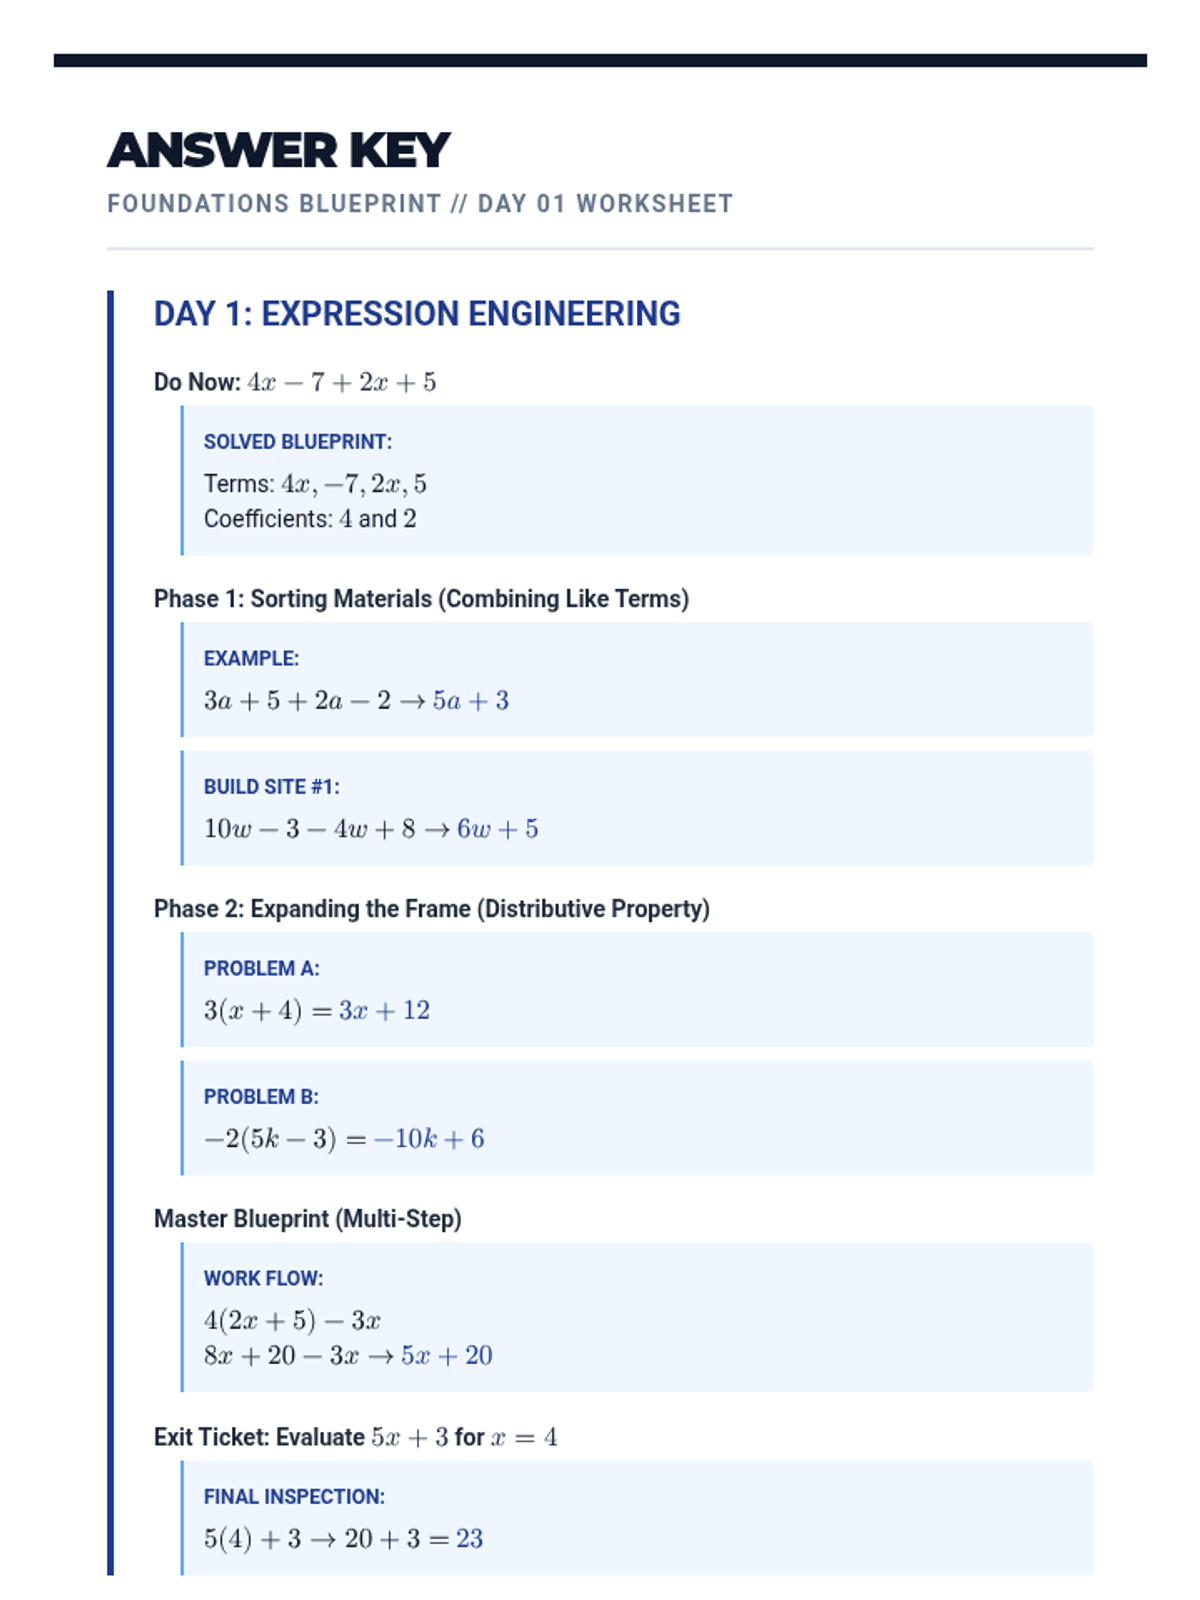
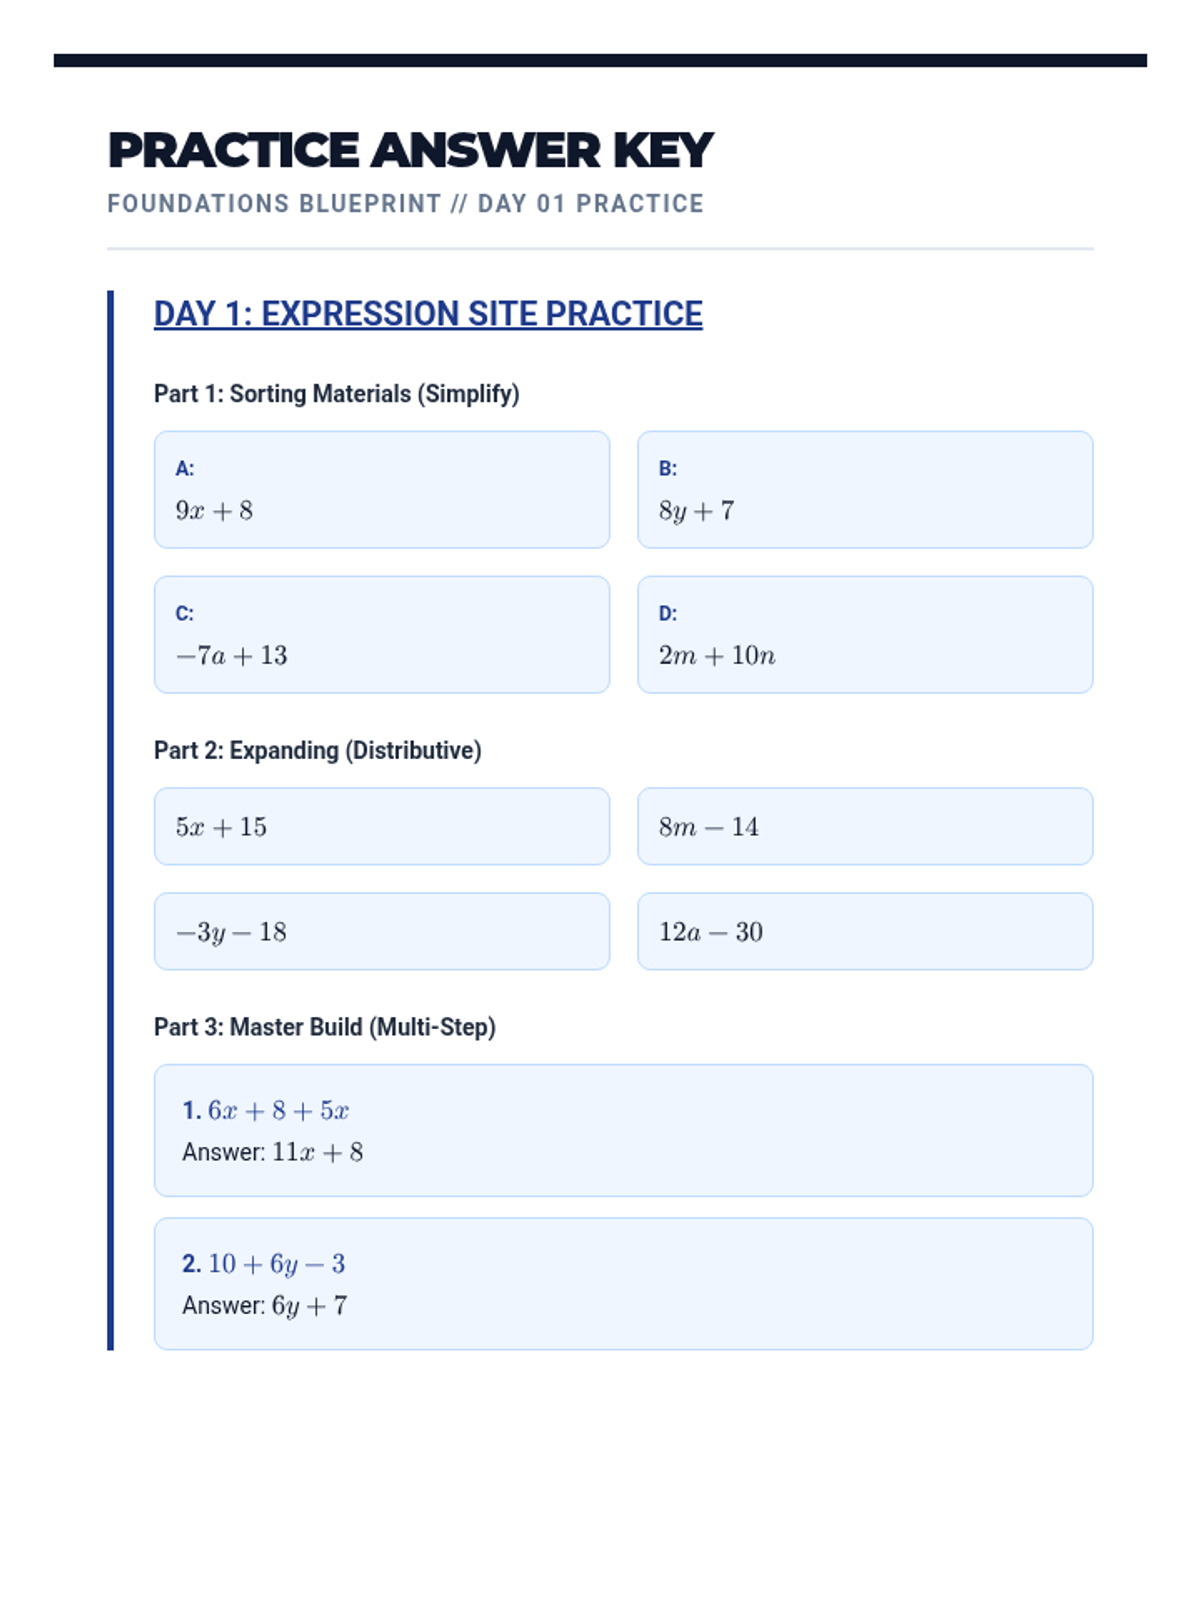
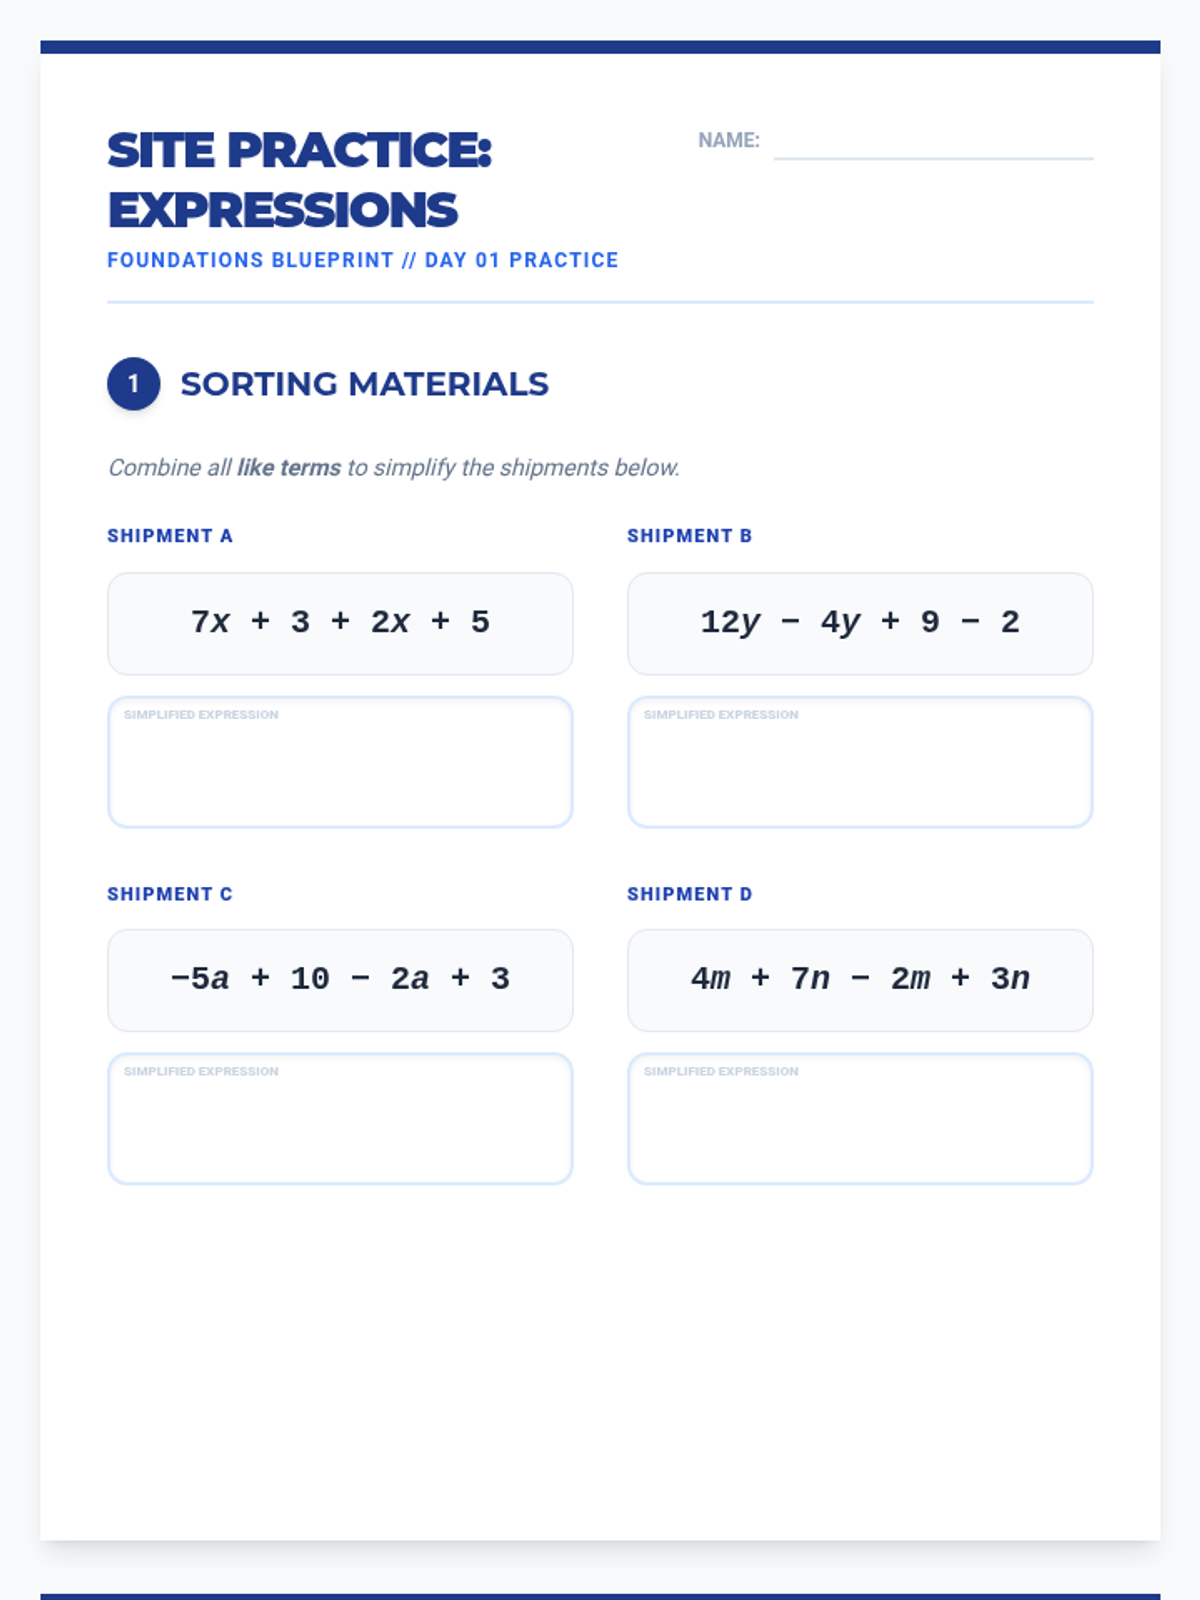
Focuses on identifying terms, combining like terms, and applying the distributive property to simplify algebraic expressions.
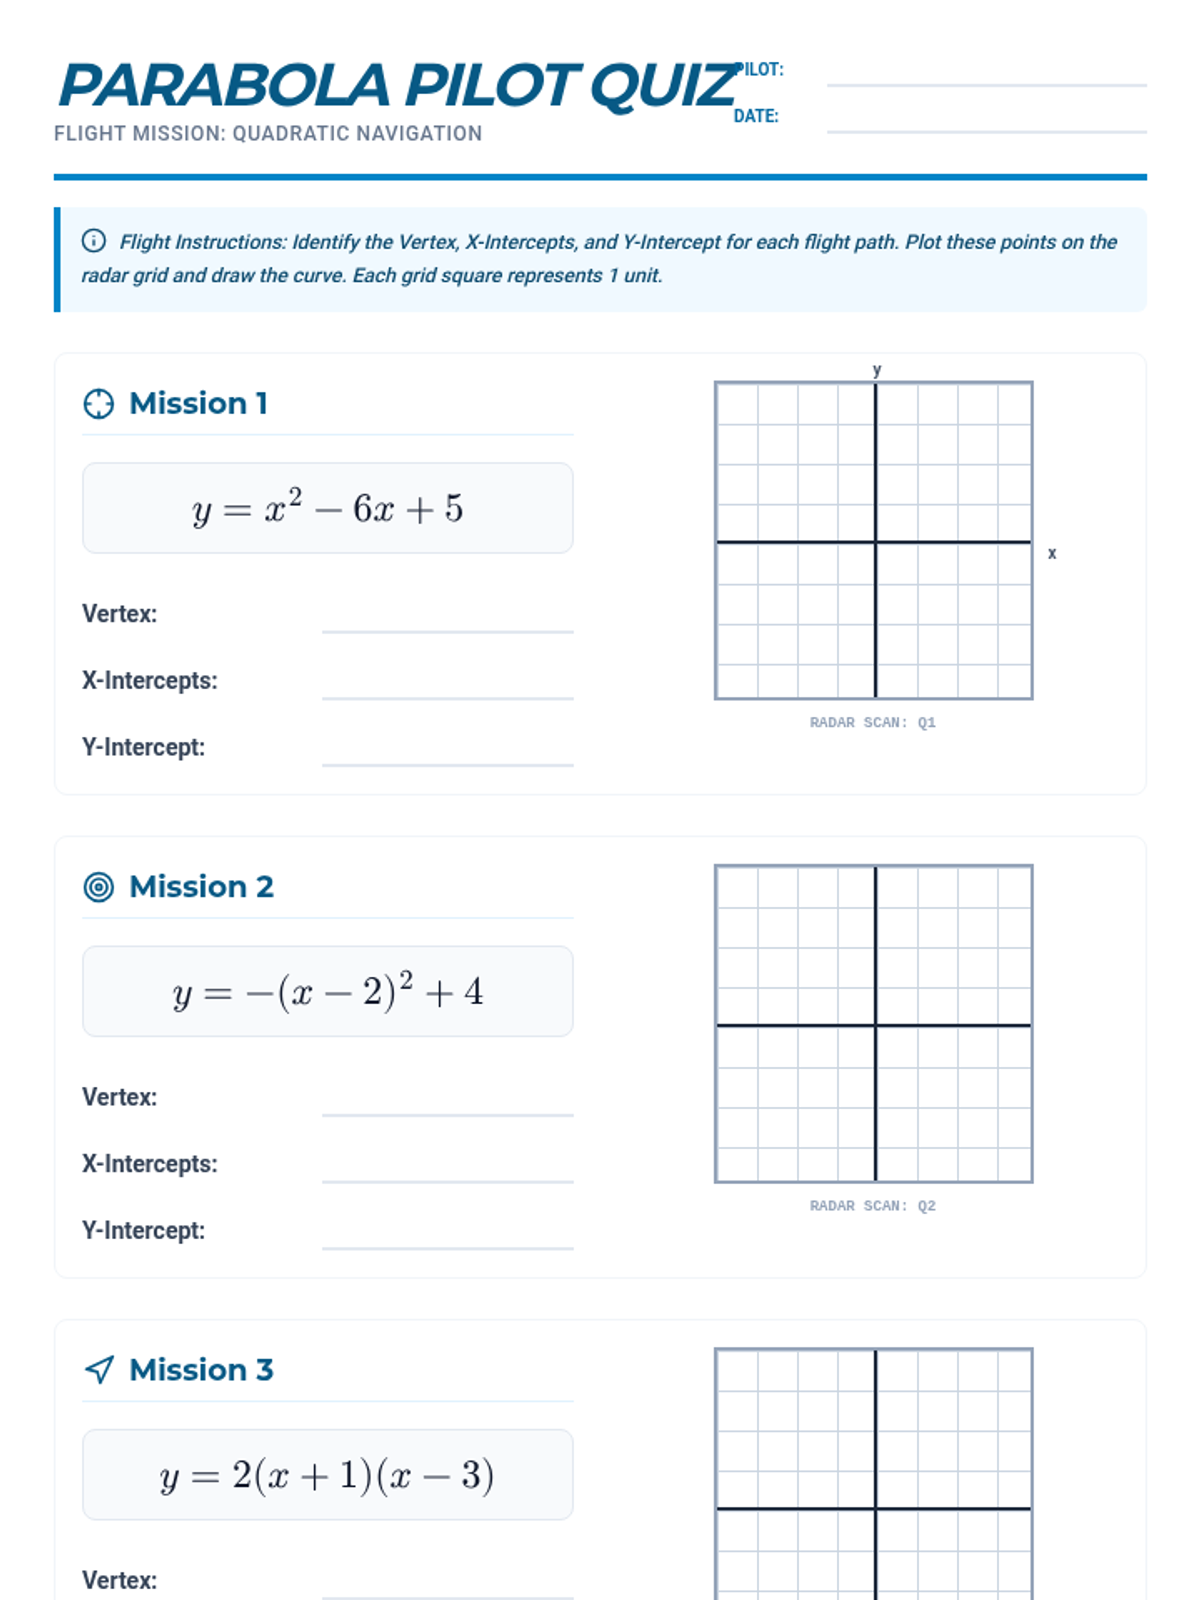
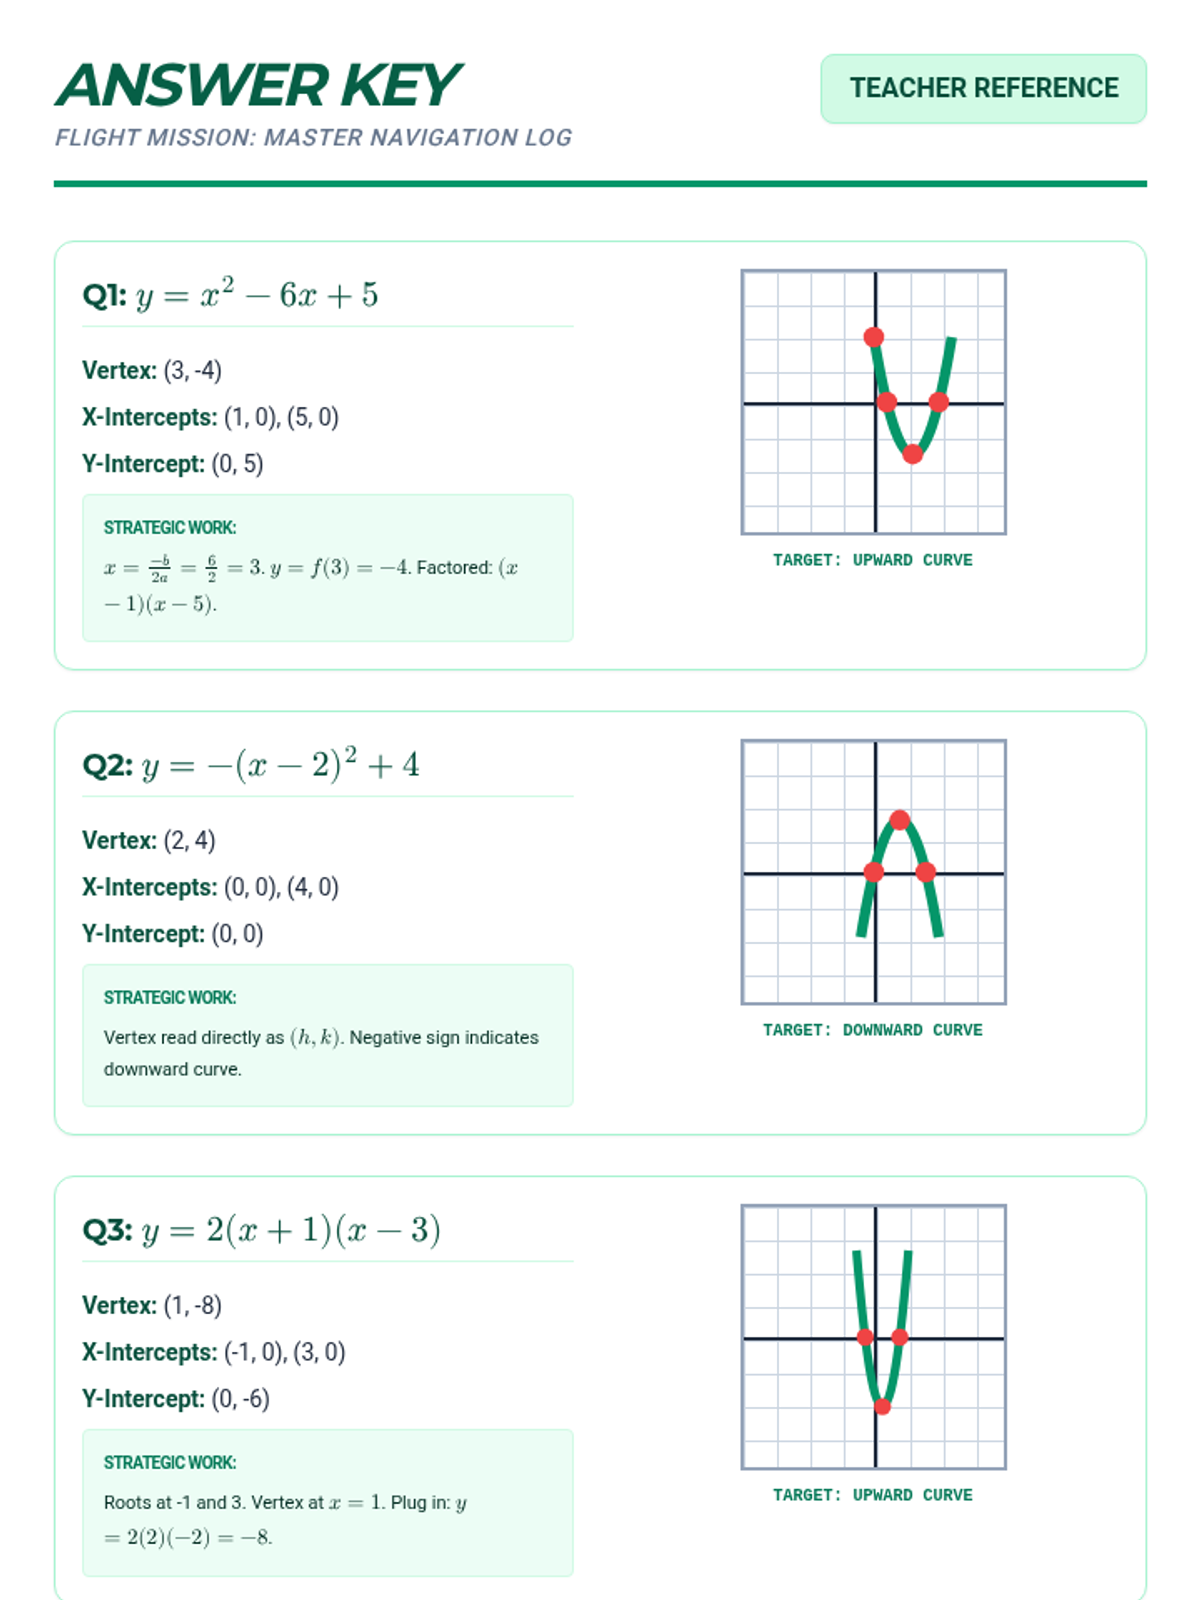
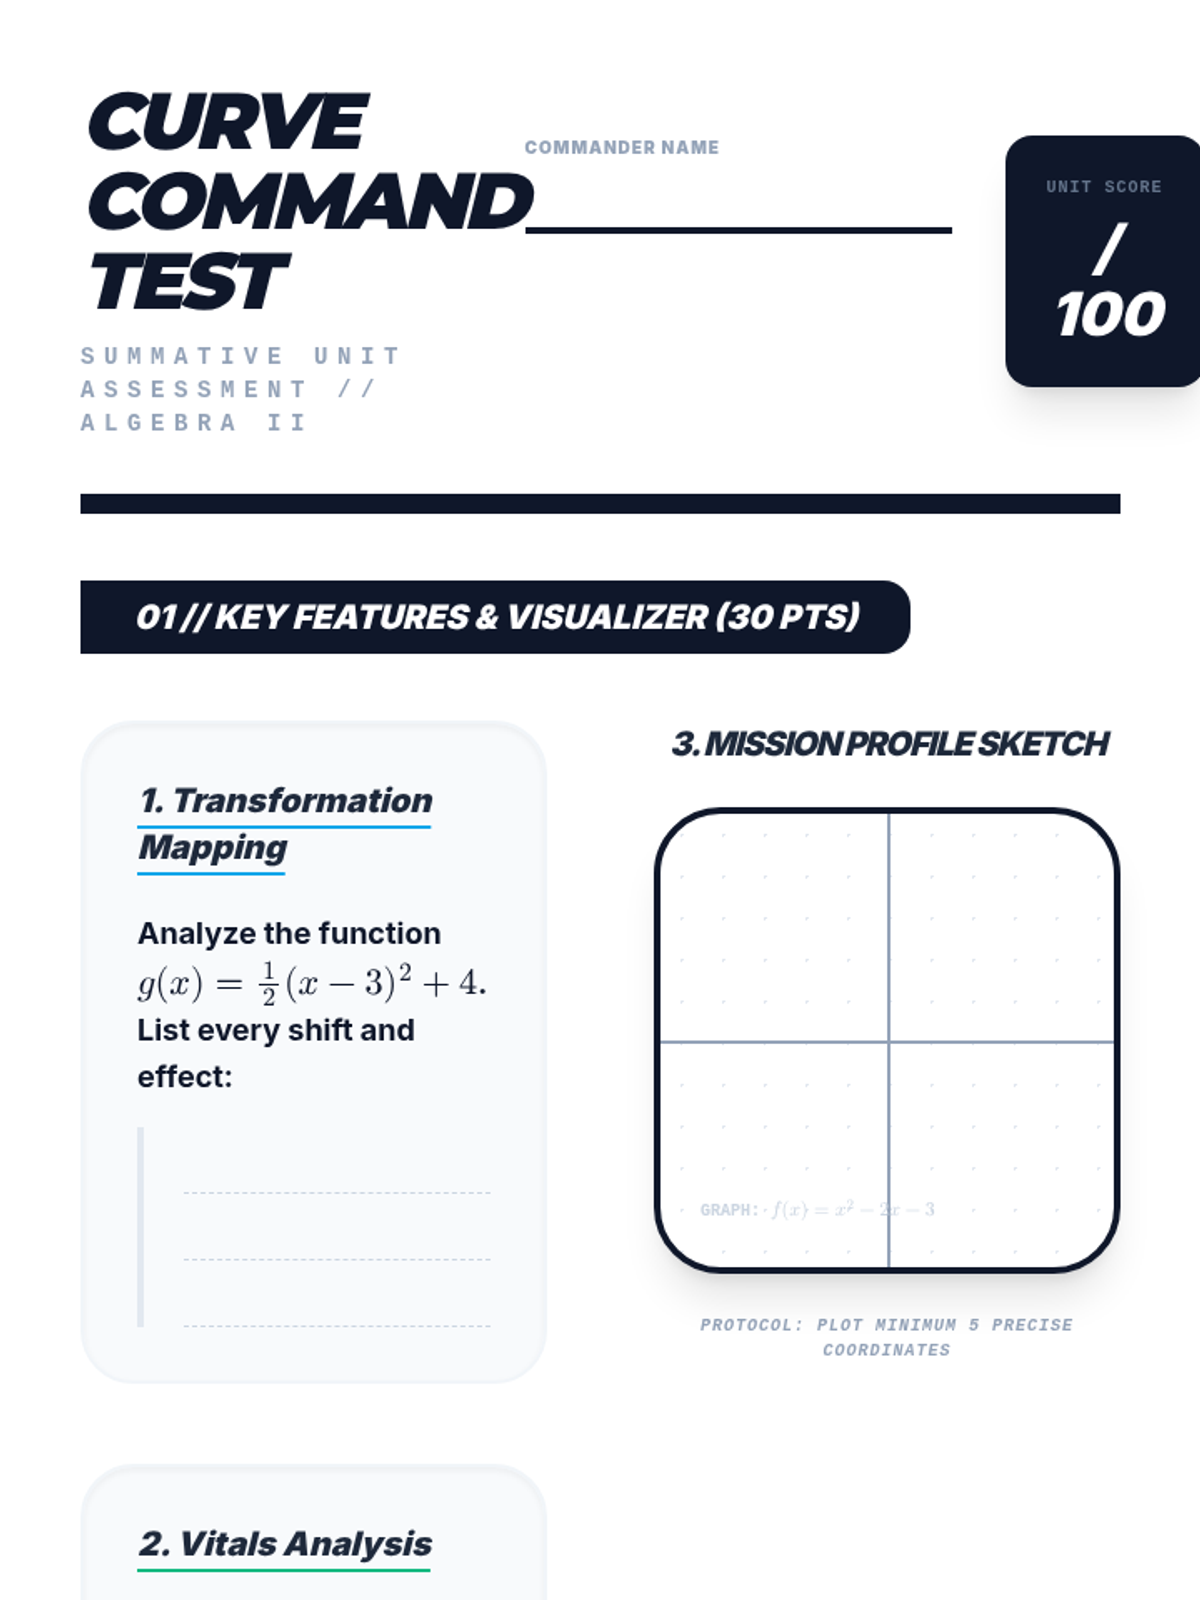
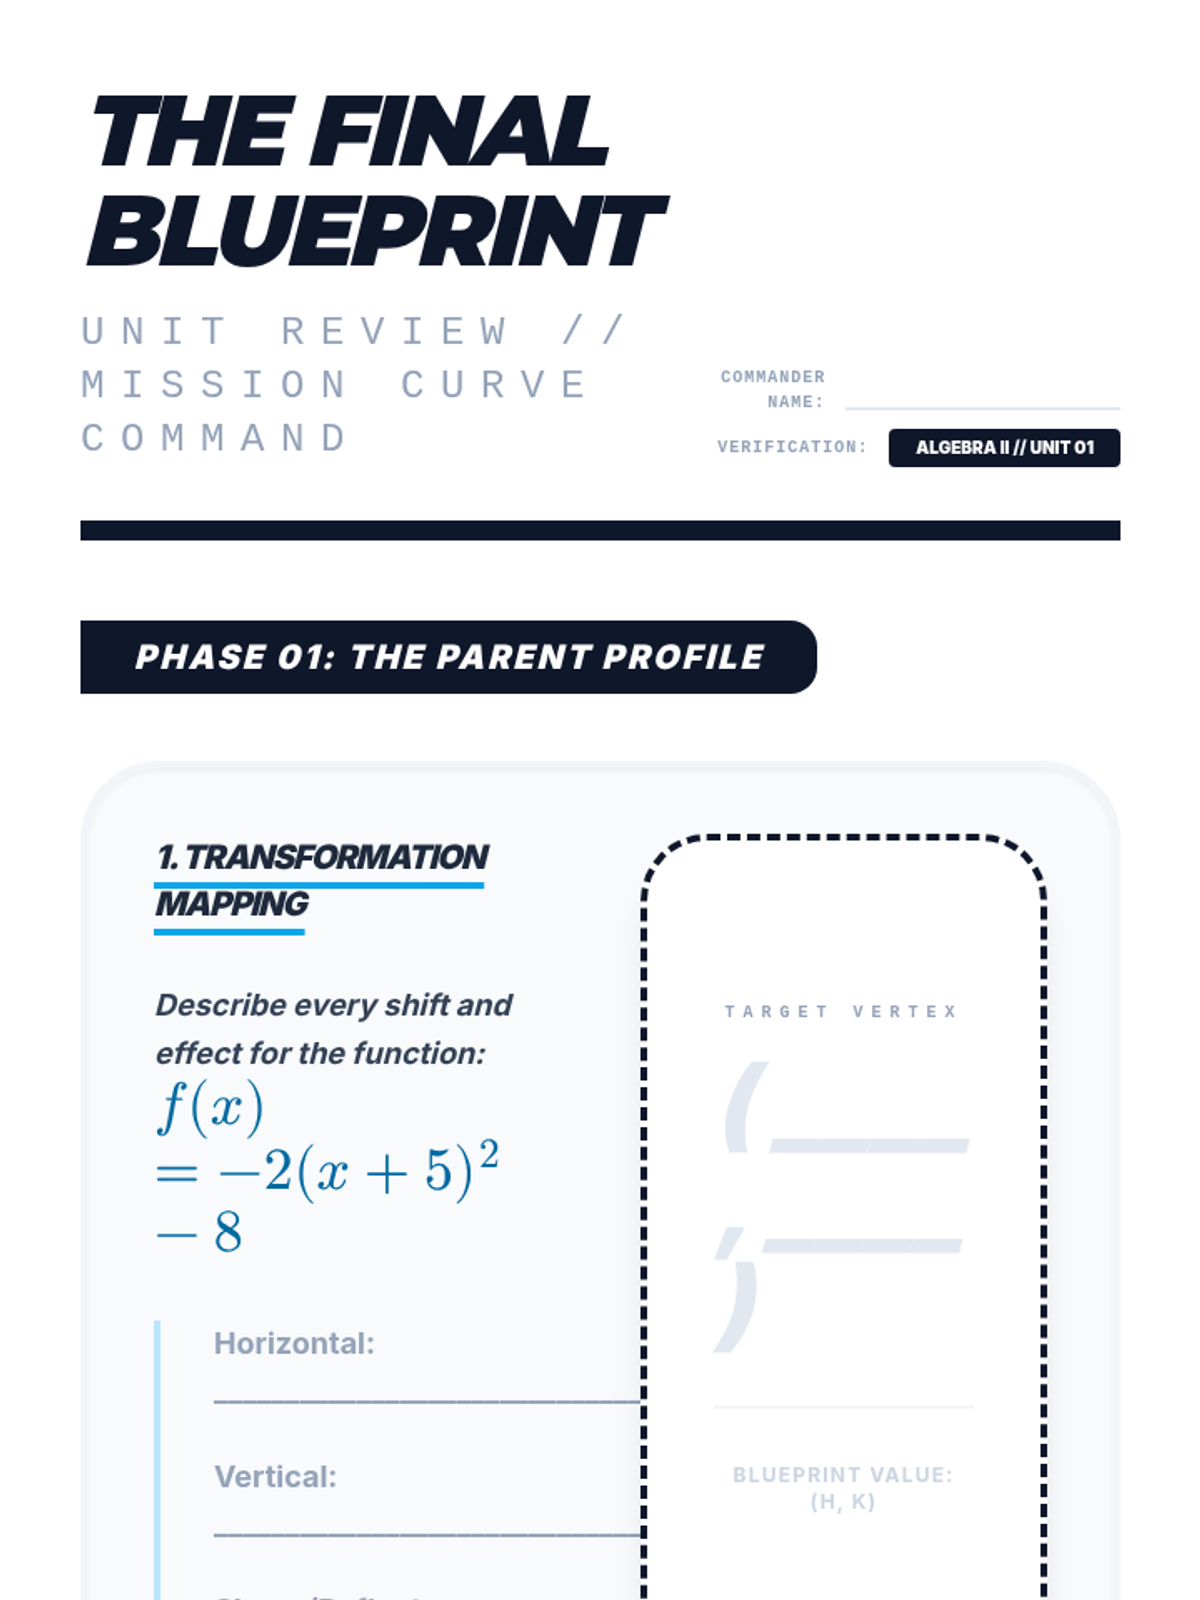
A lesson focused on identifying key features (vertex, intercepts) and graphing quadratic equations across standard, vertex, and factored forms.
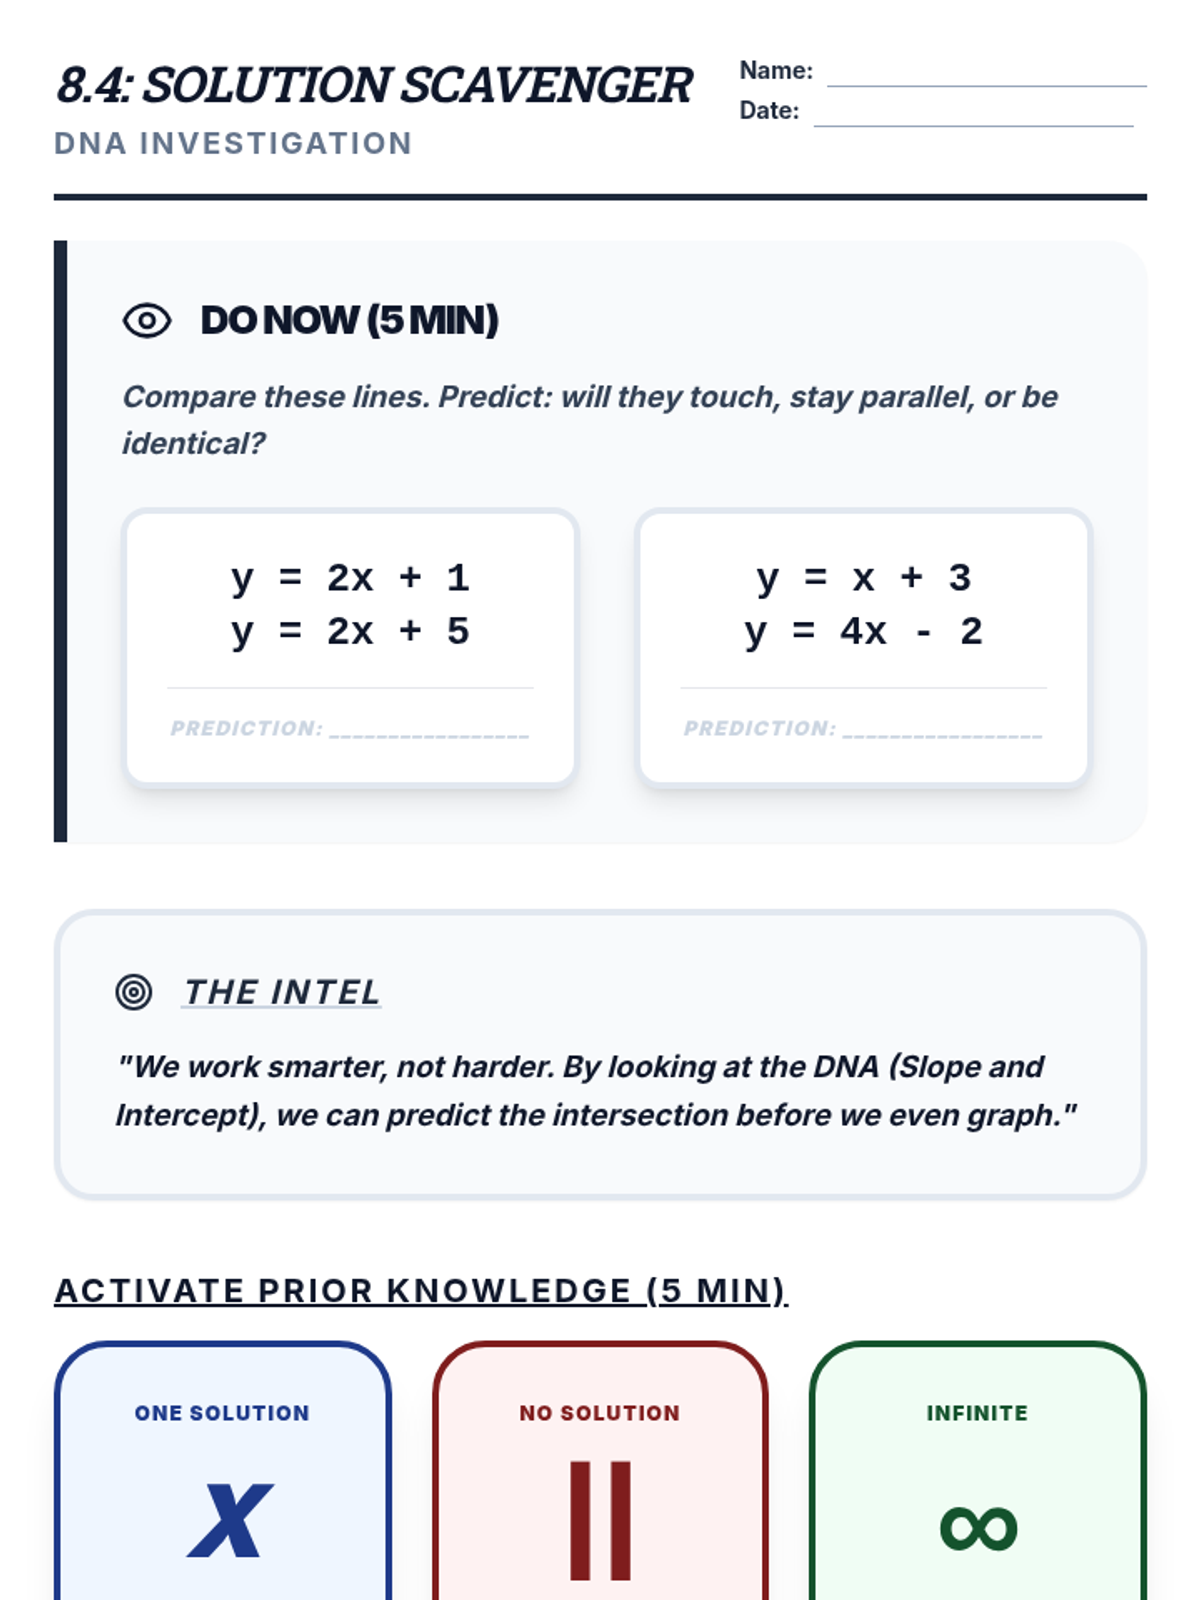
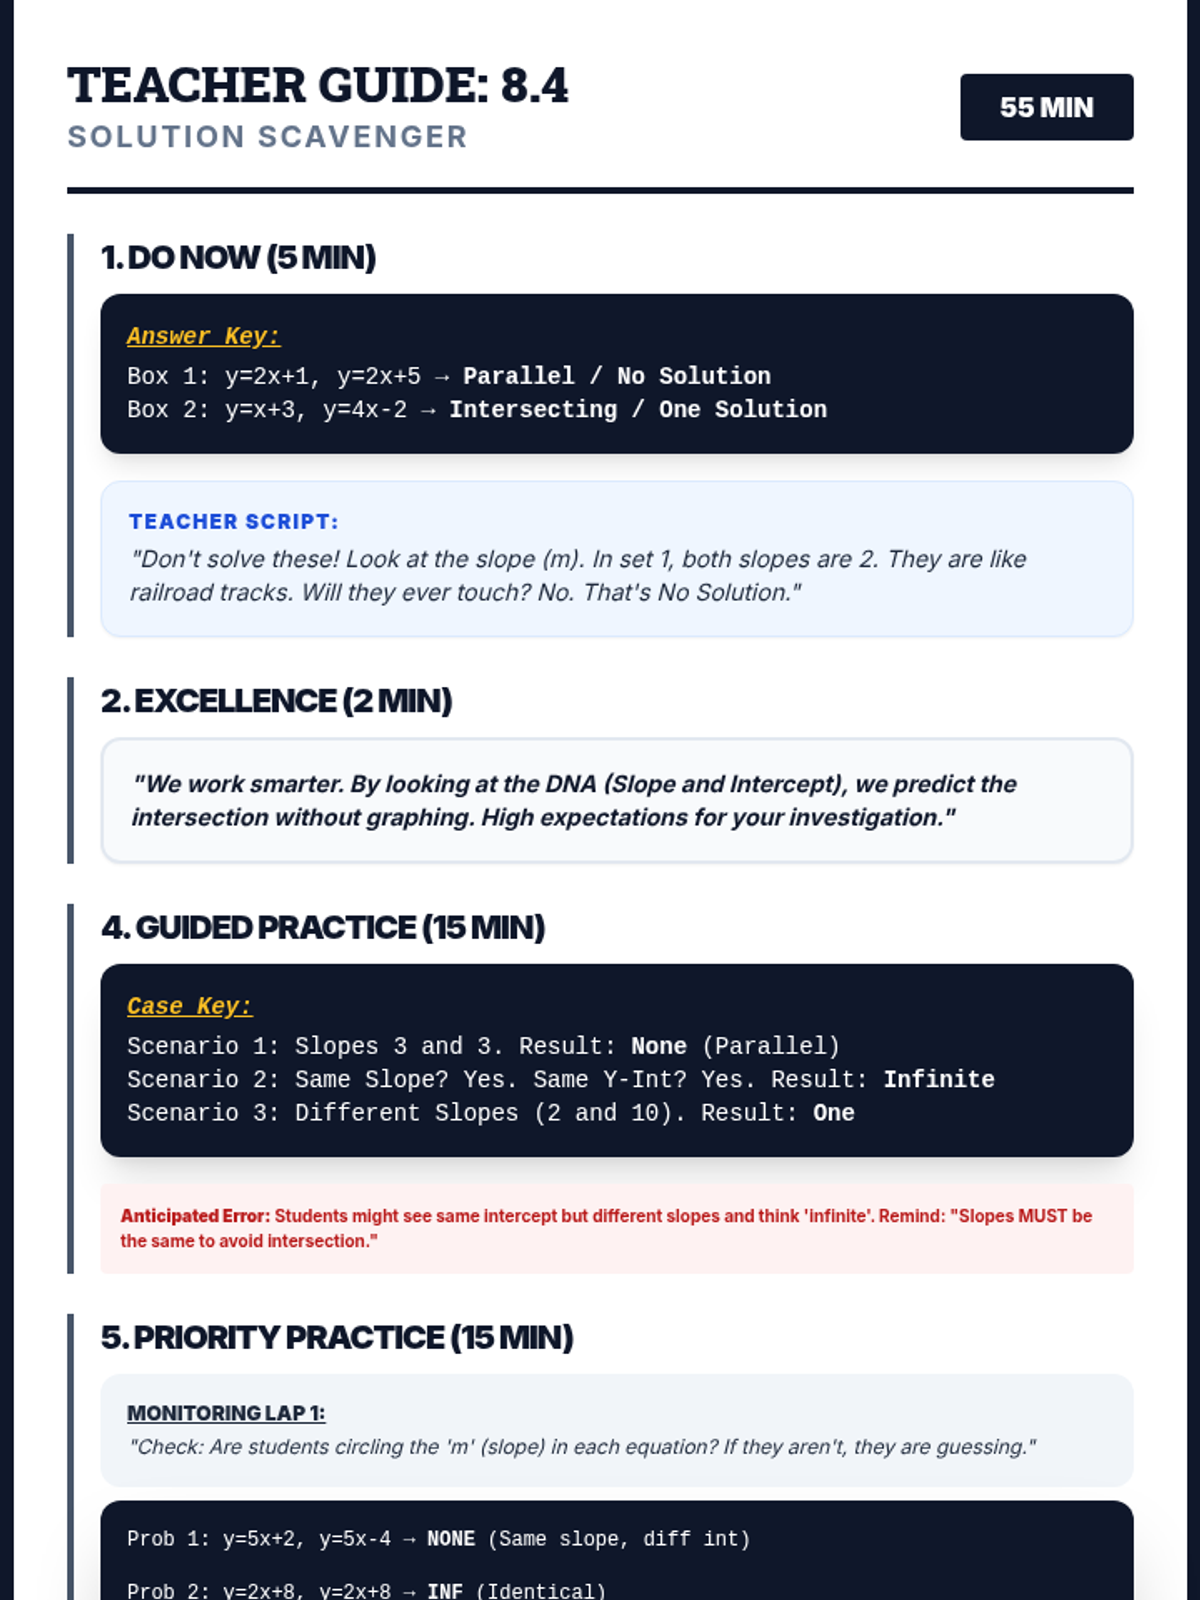
Students will analyze slopes and y-intercepts to determine if a system of equations has one solution, no solution, or infinitely many solutions.
Students will use addition and subtraction to eliminate variables in a system of equations, simplifying complex problems into solvable single-variable equations.
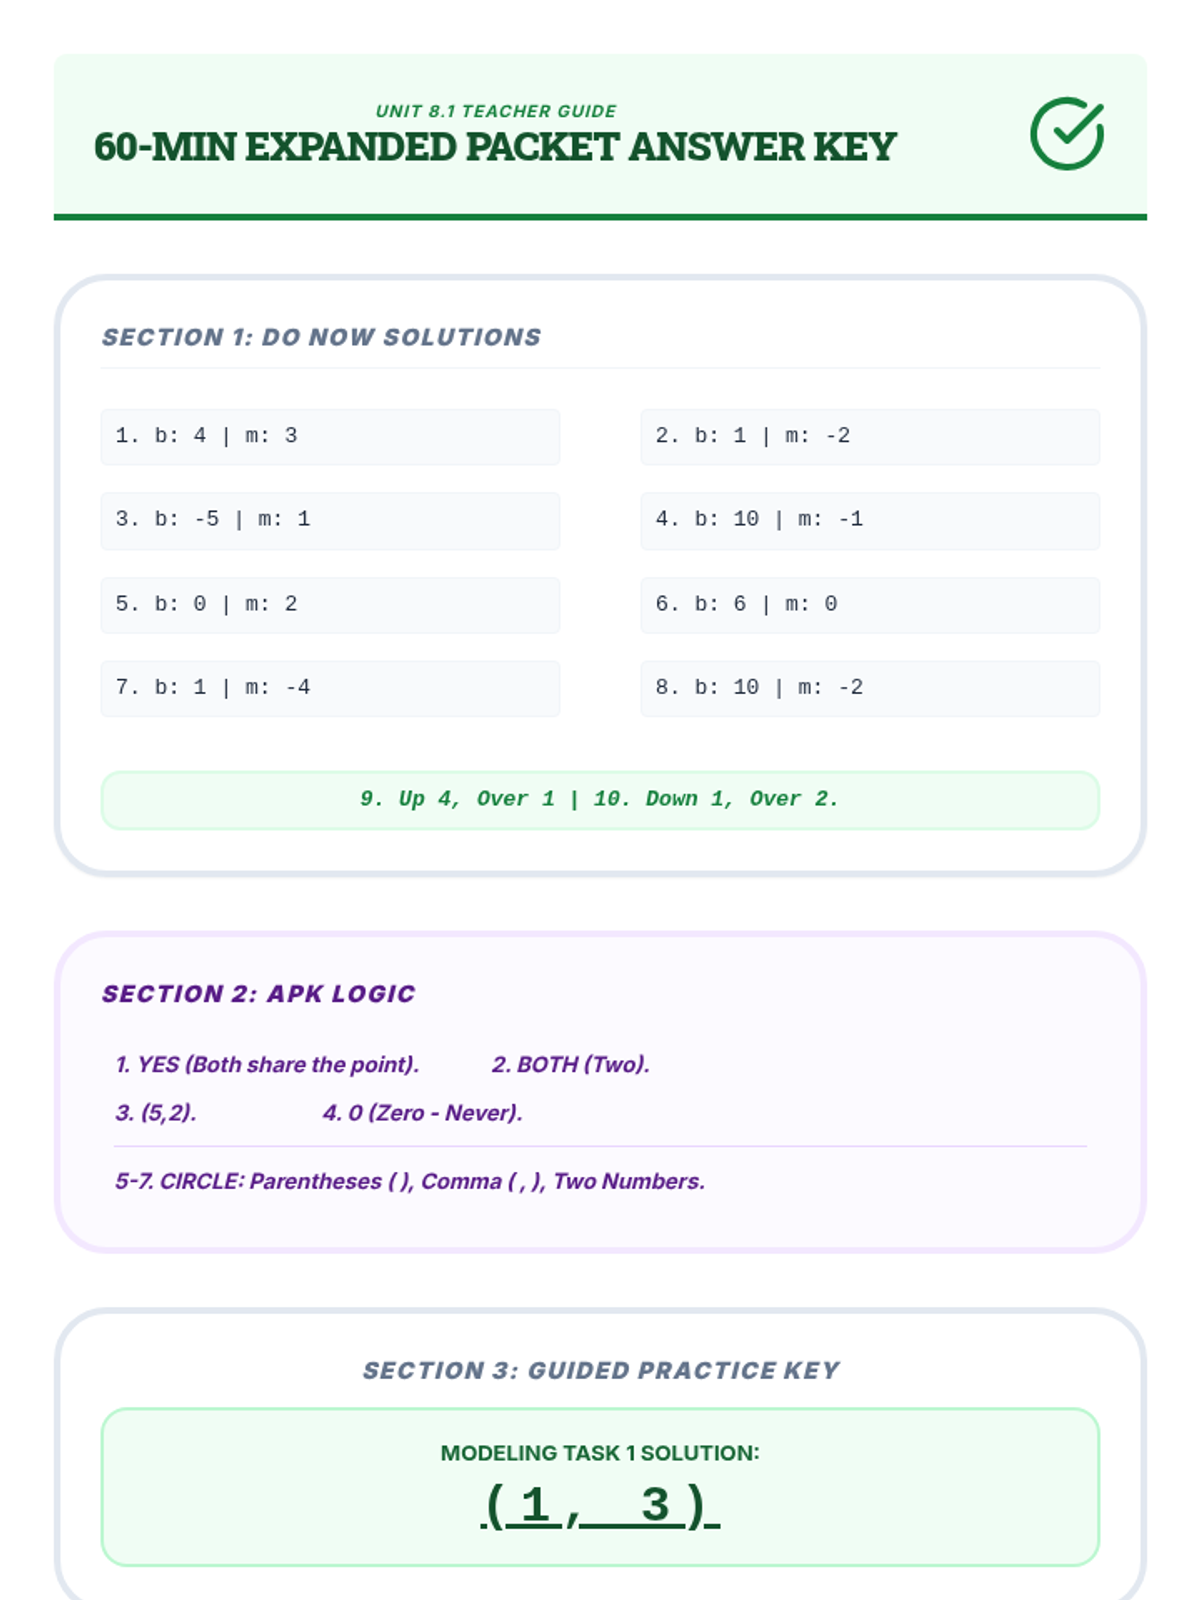
Students will master the substitution method for solving systems, learning to swap one variable for an equivalent expression to solve for unknowns.
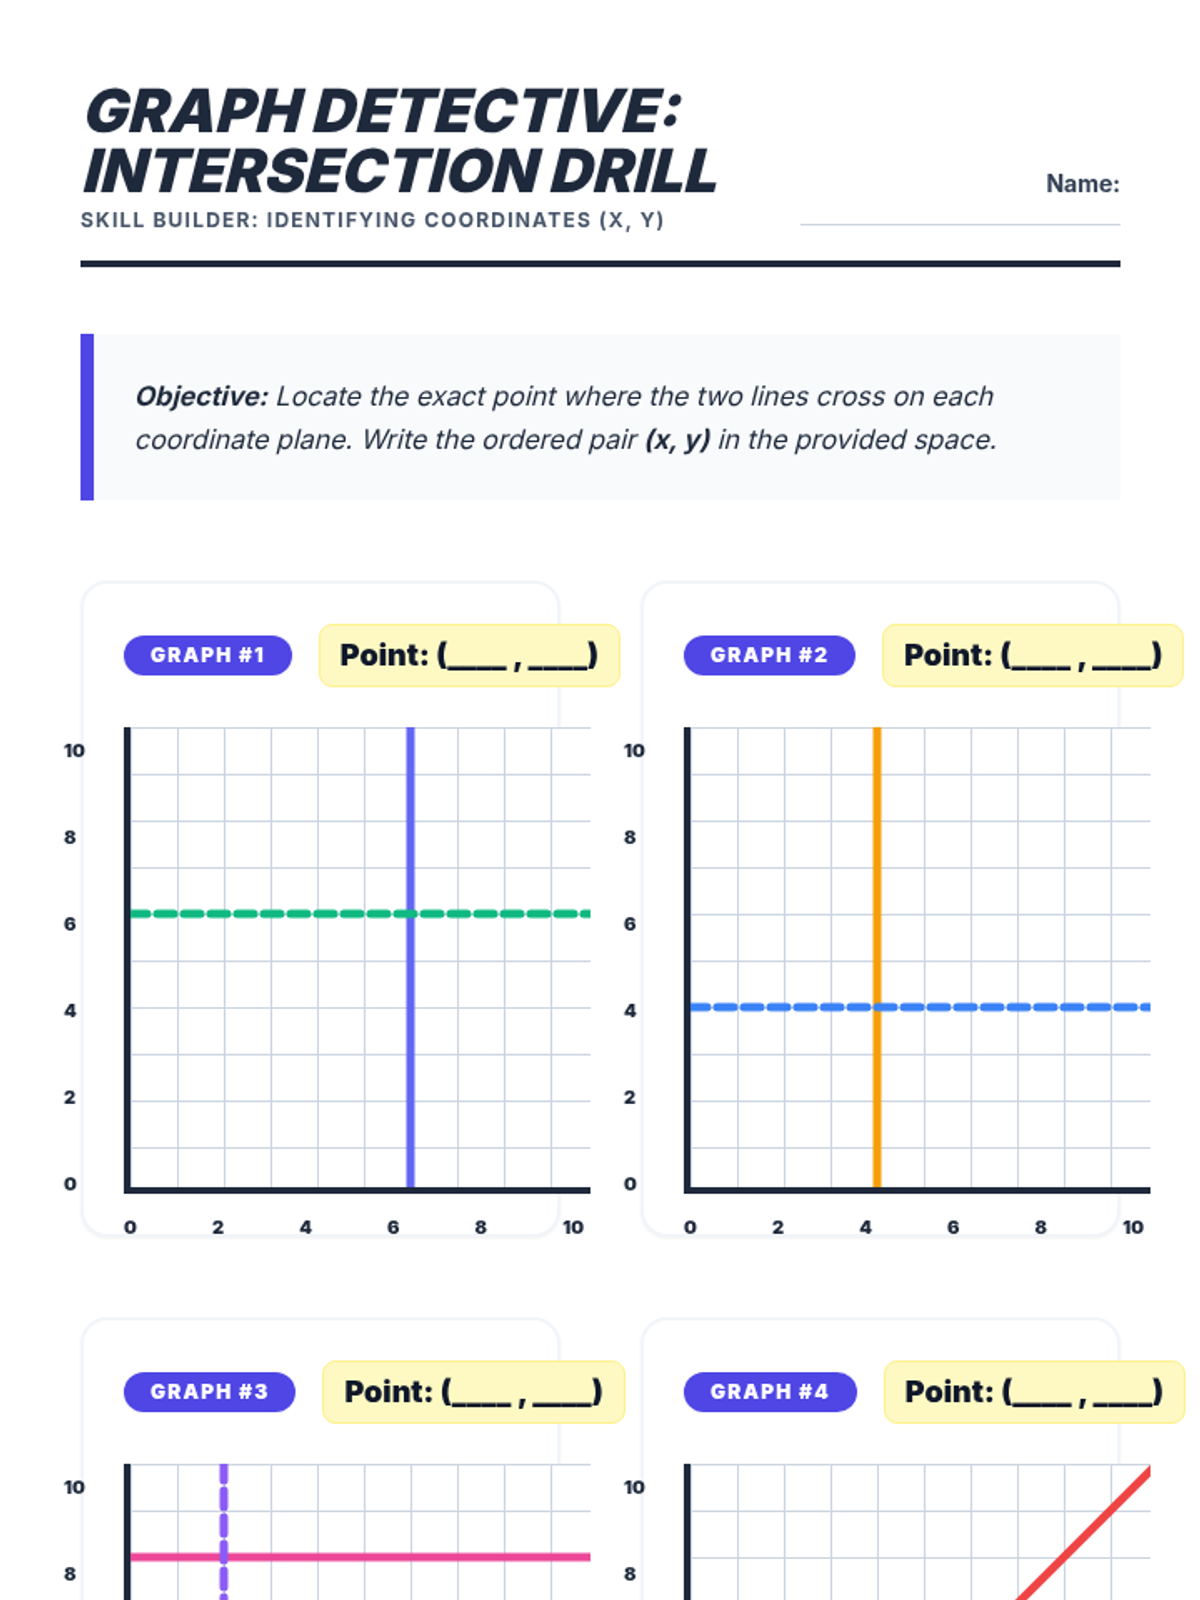
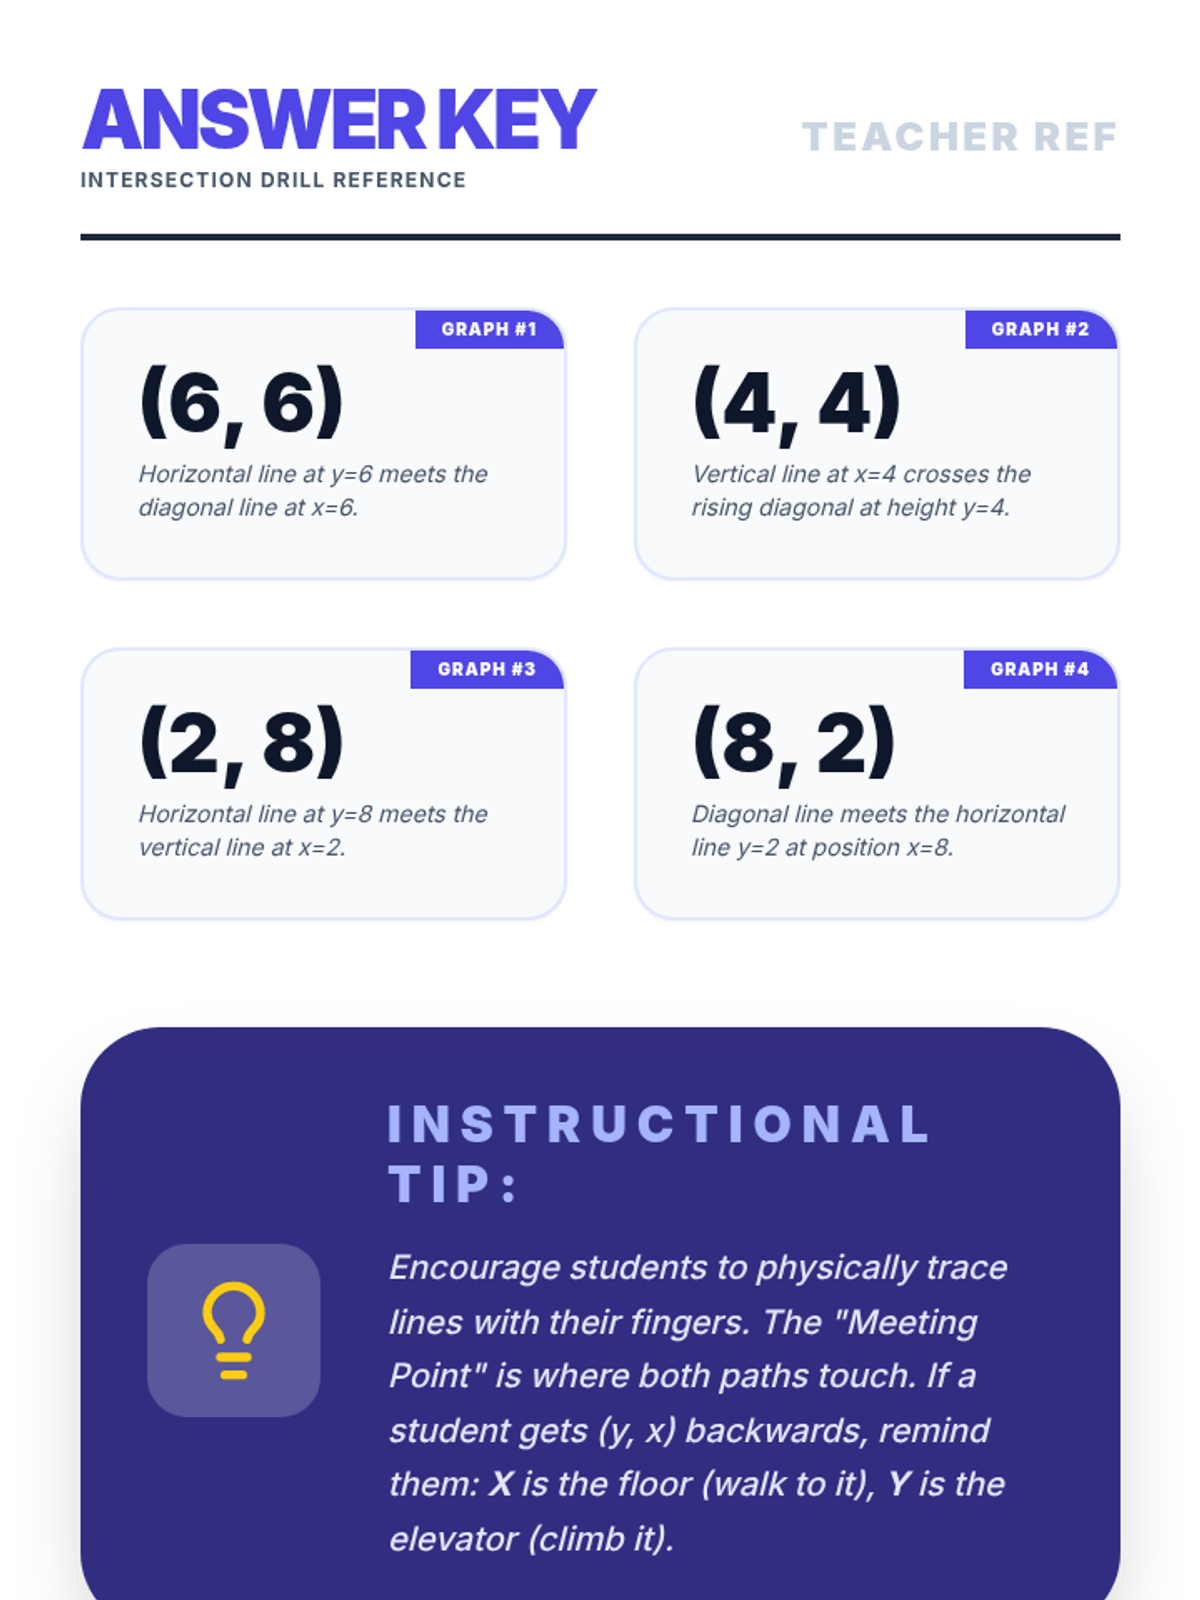
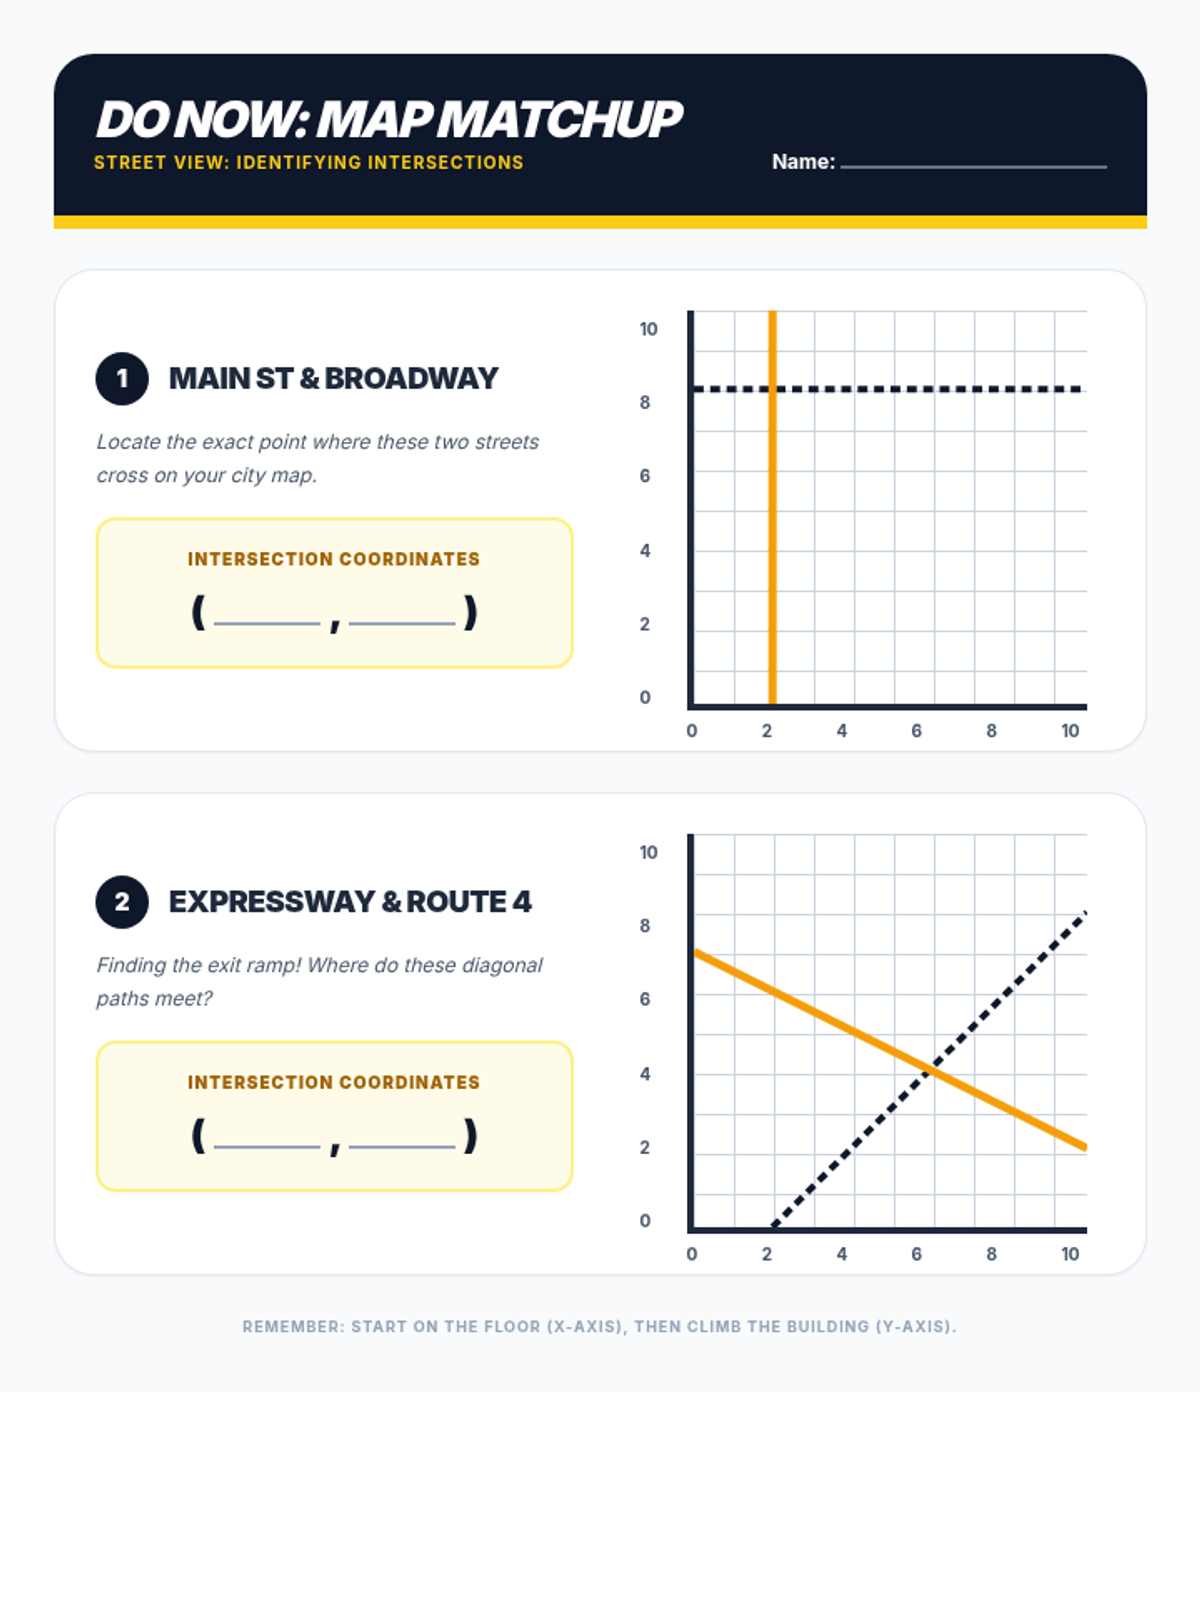
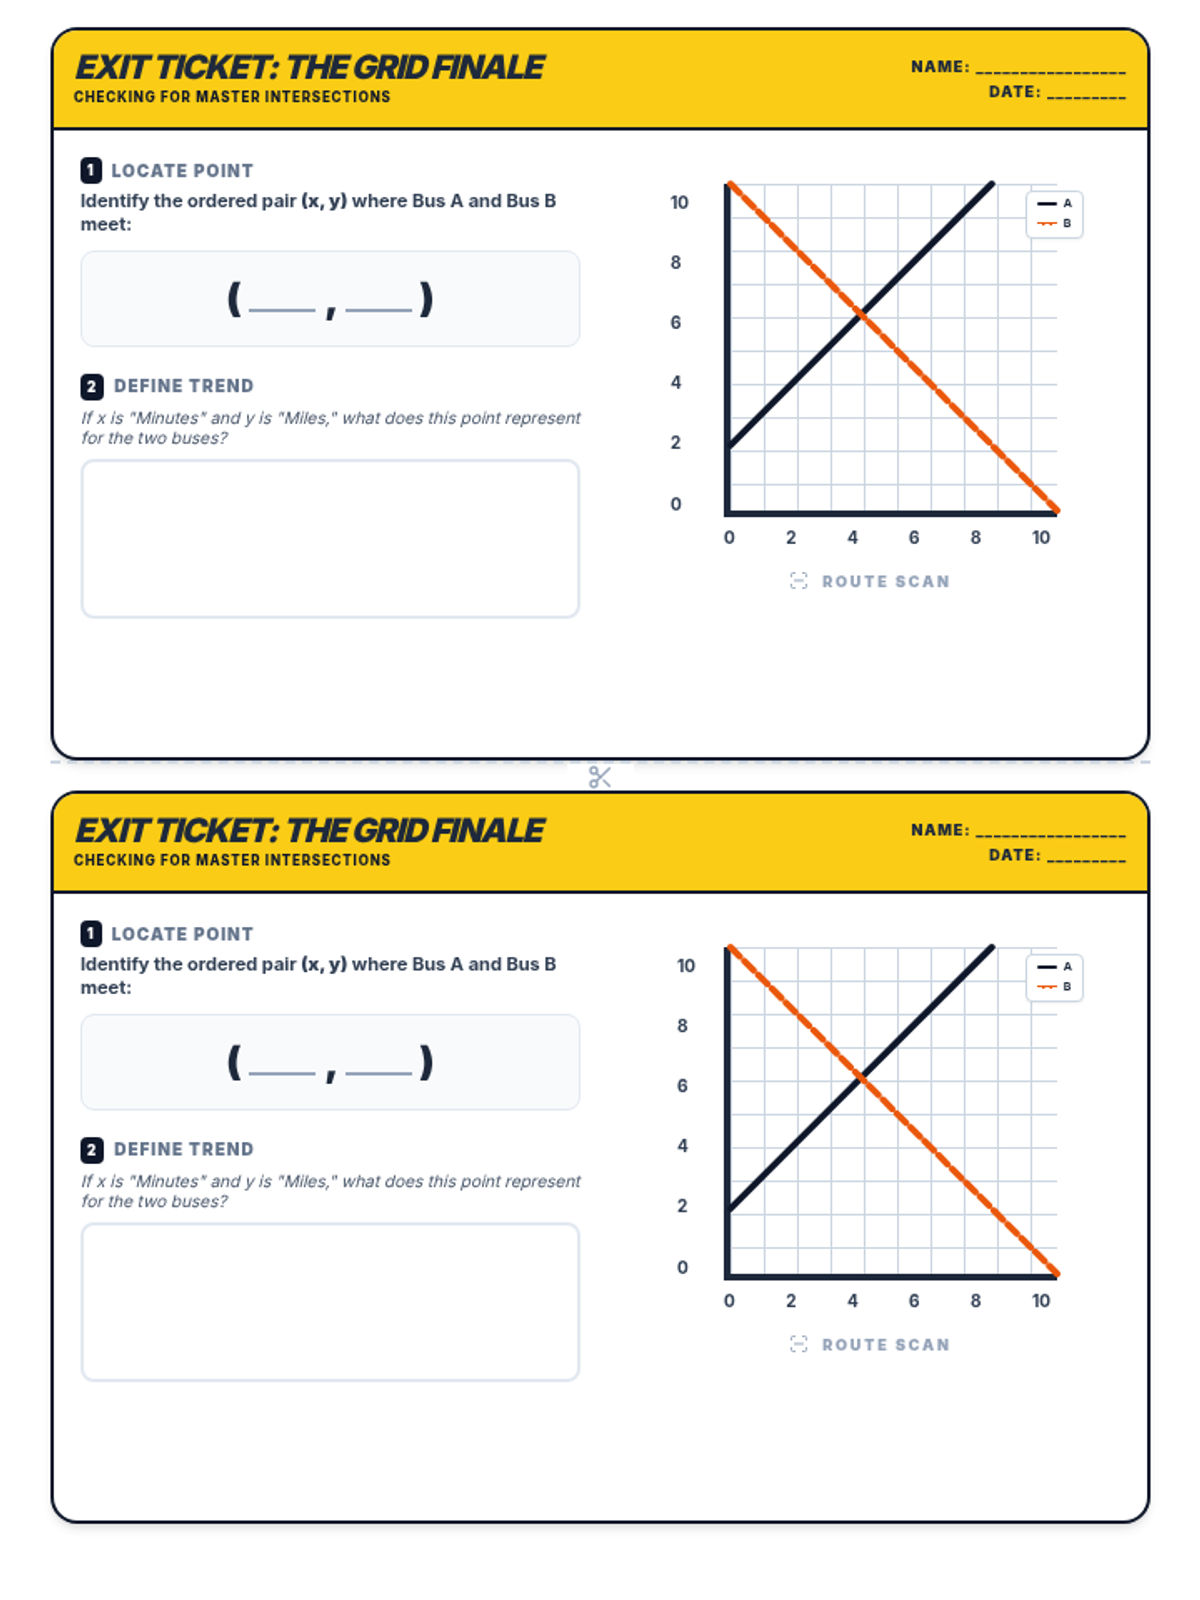
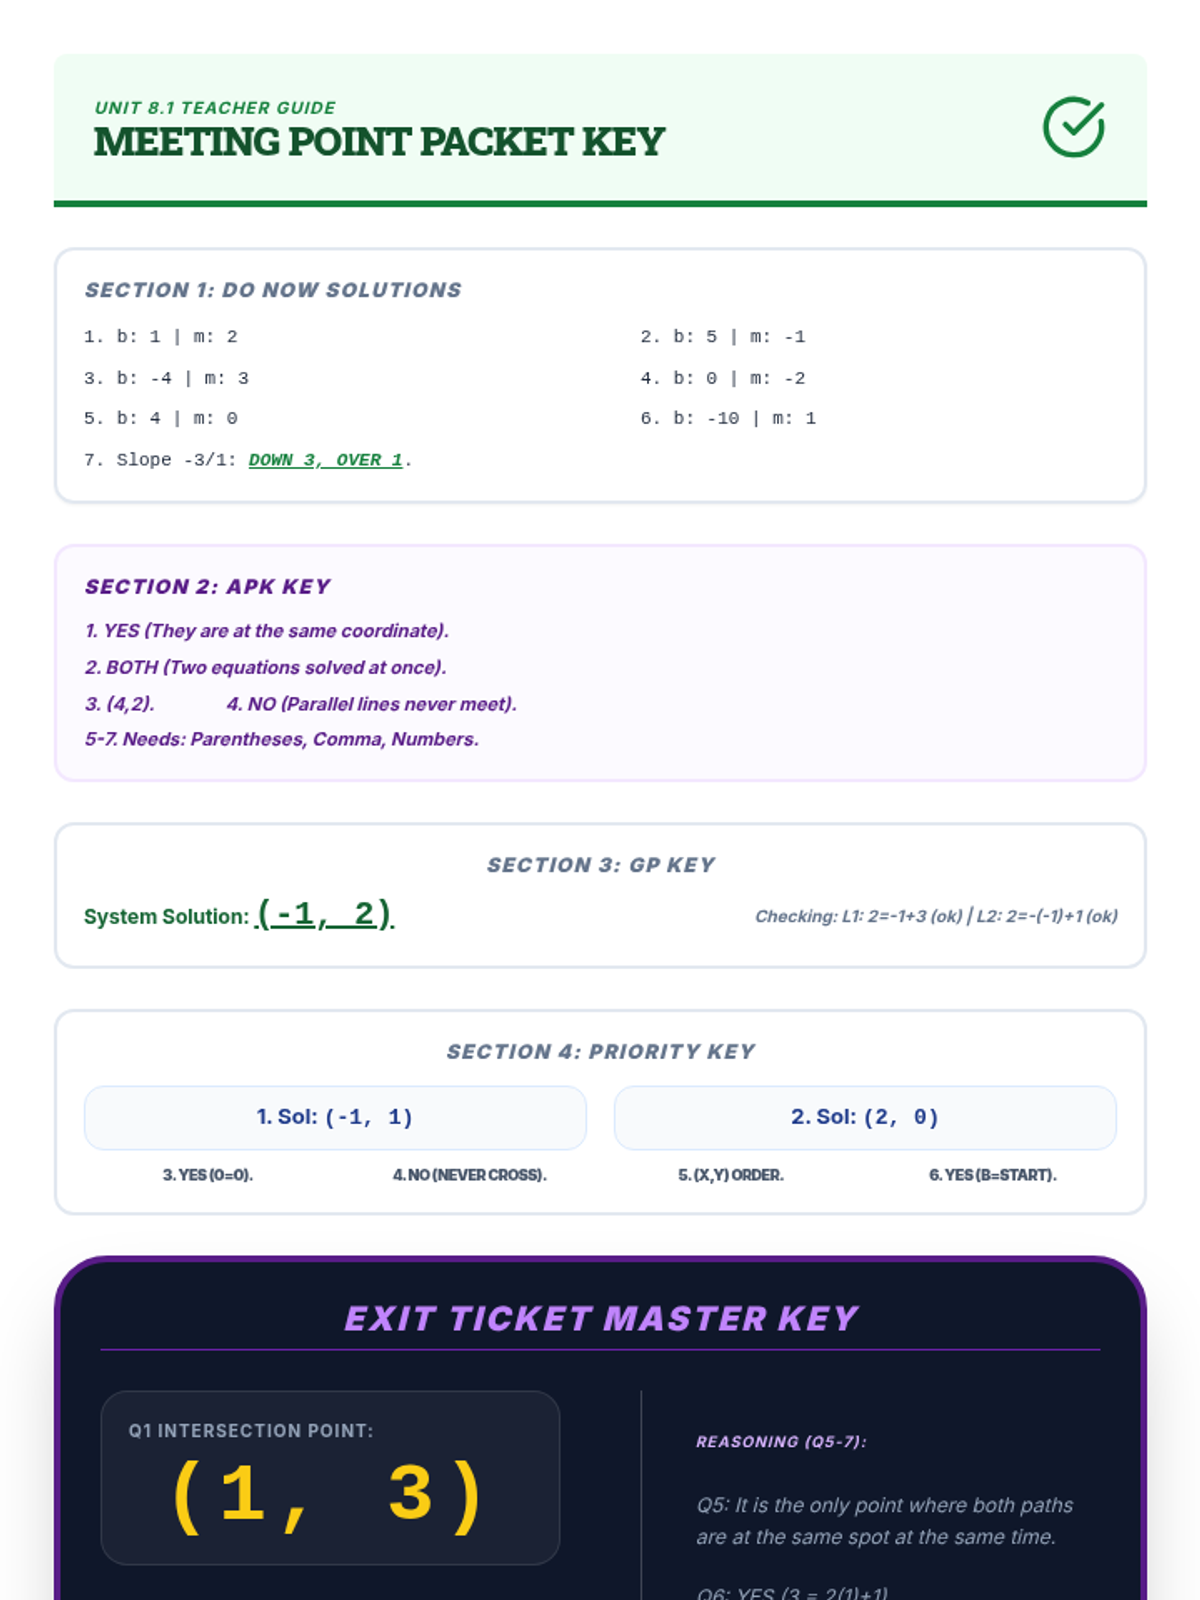
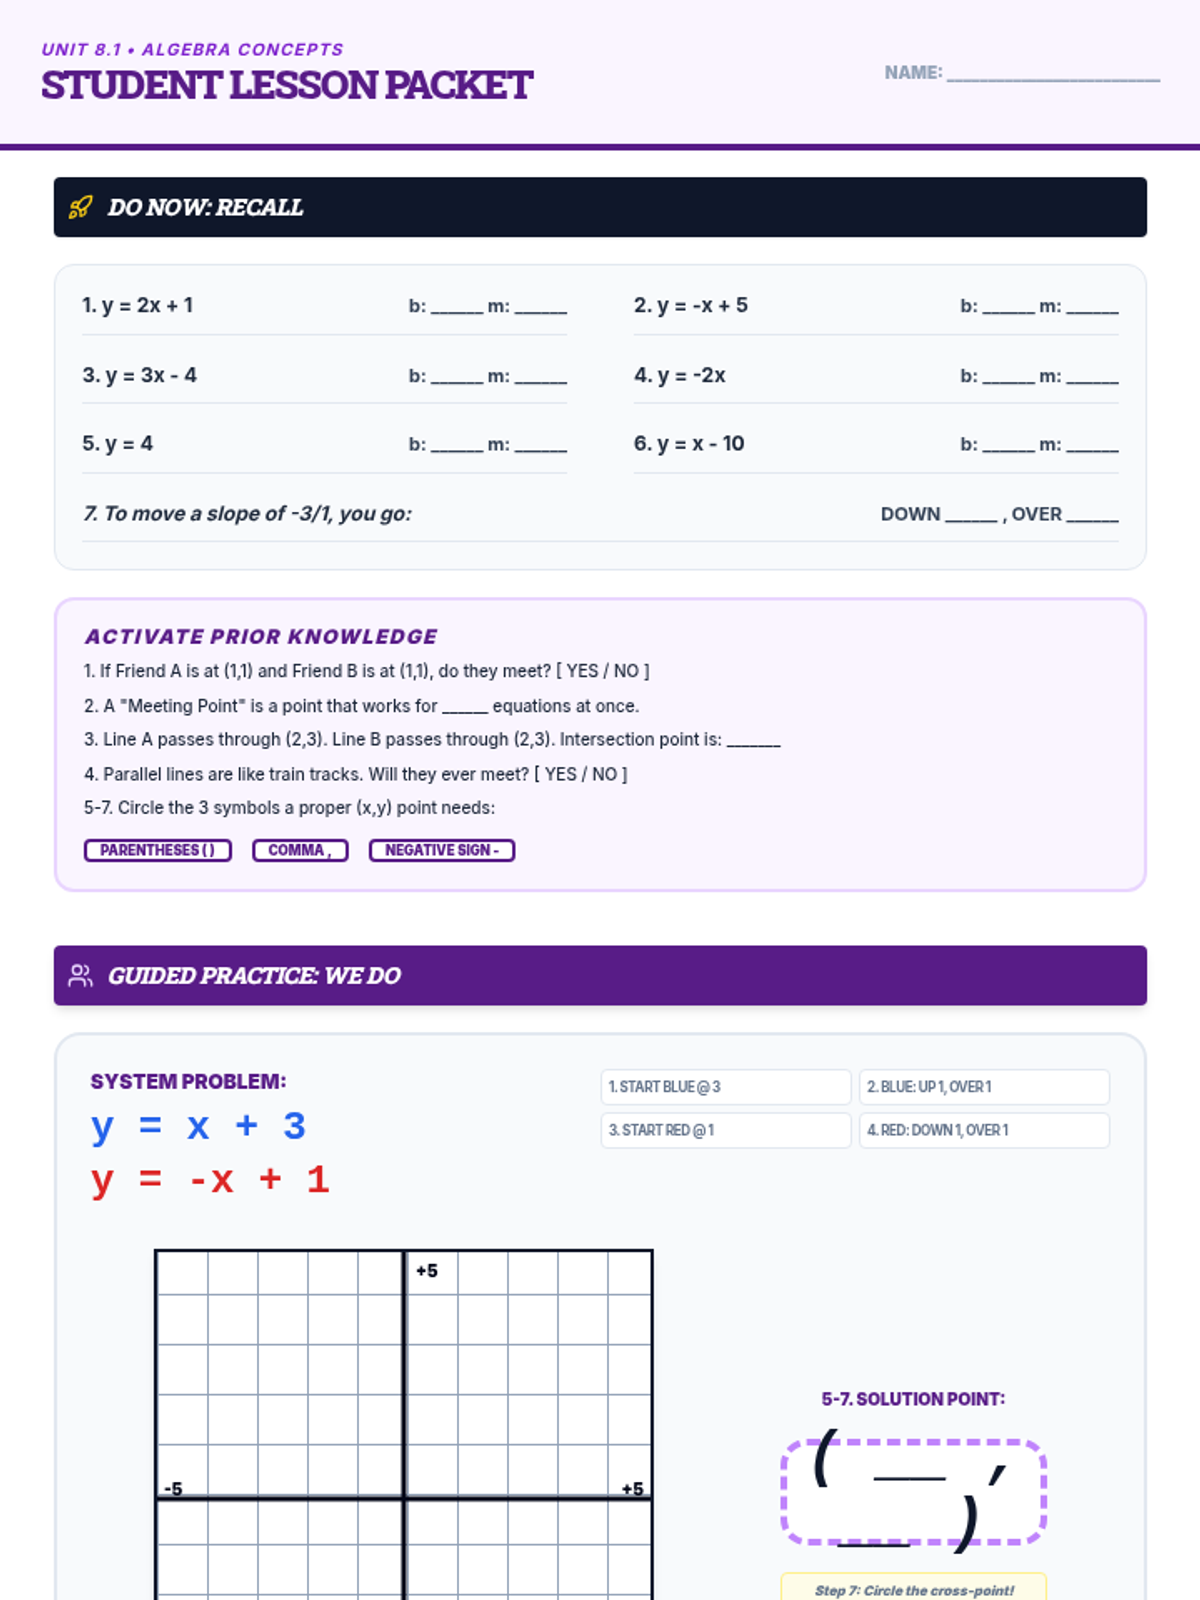
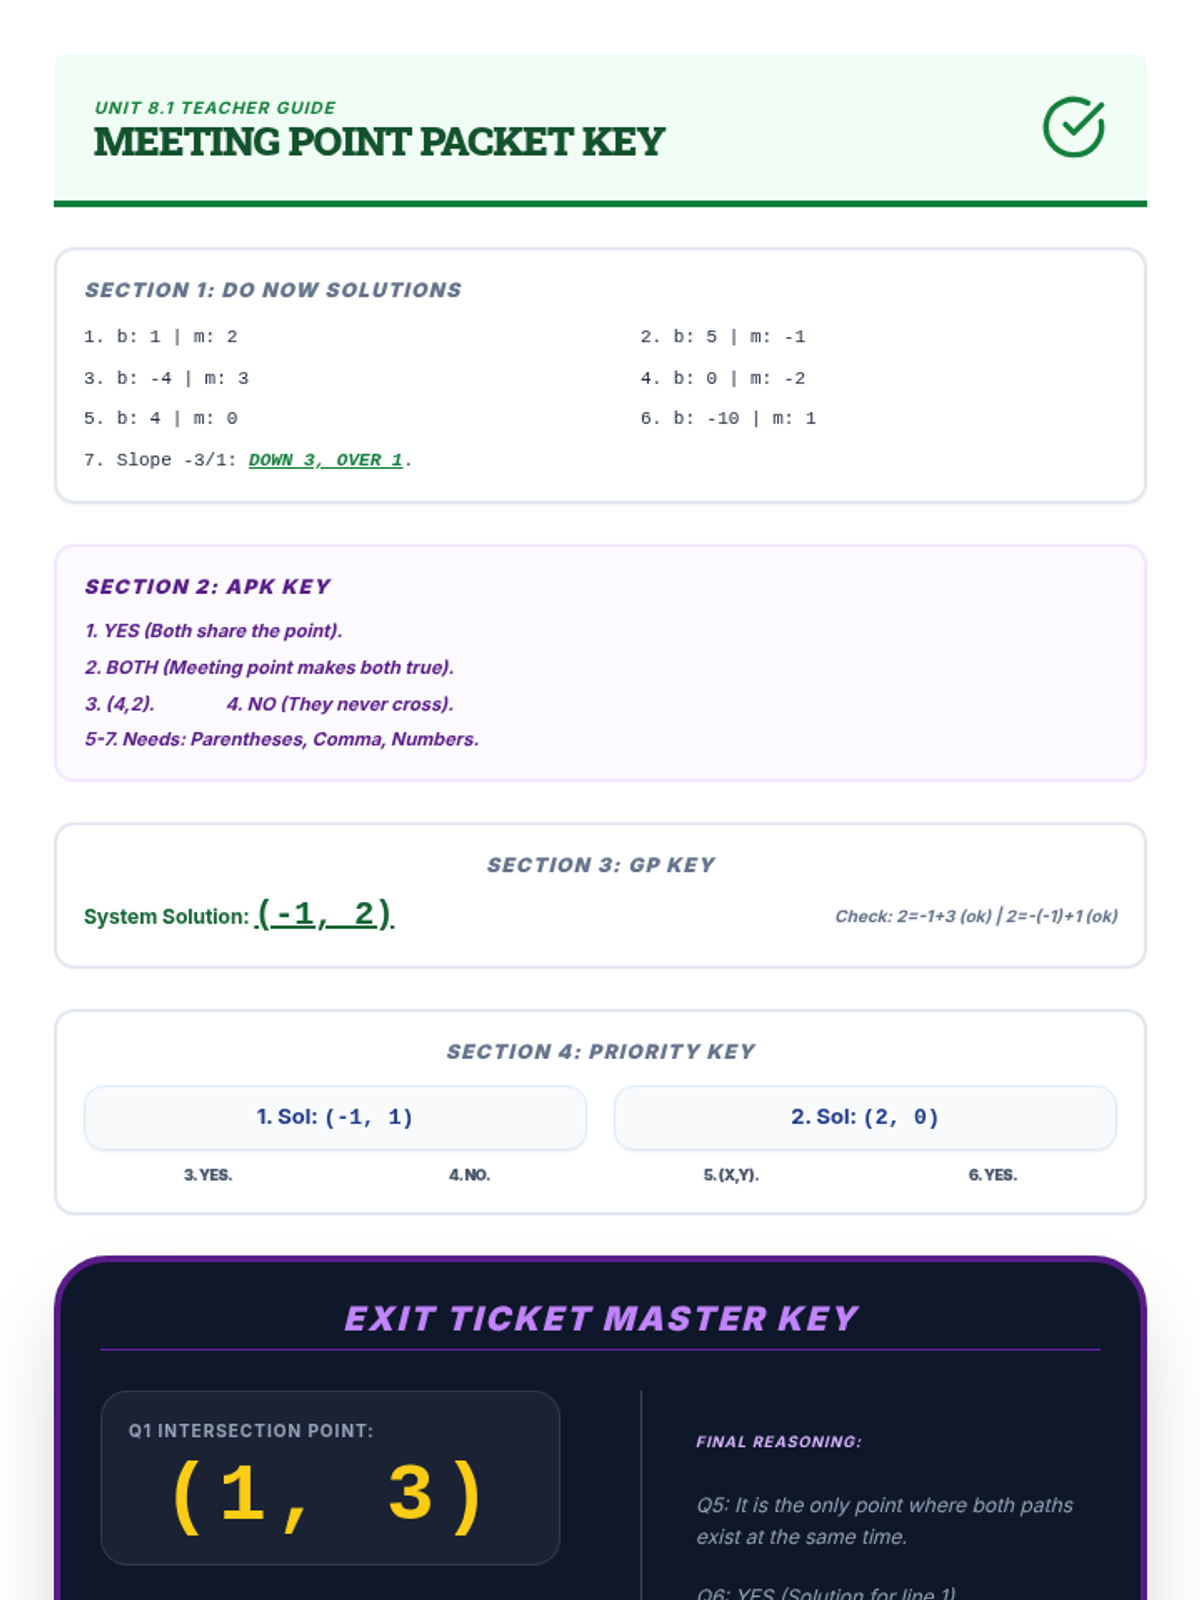
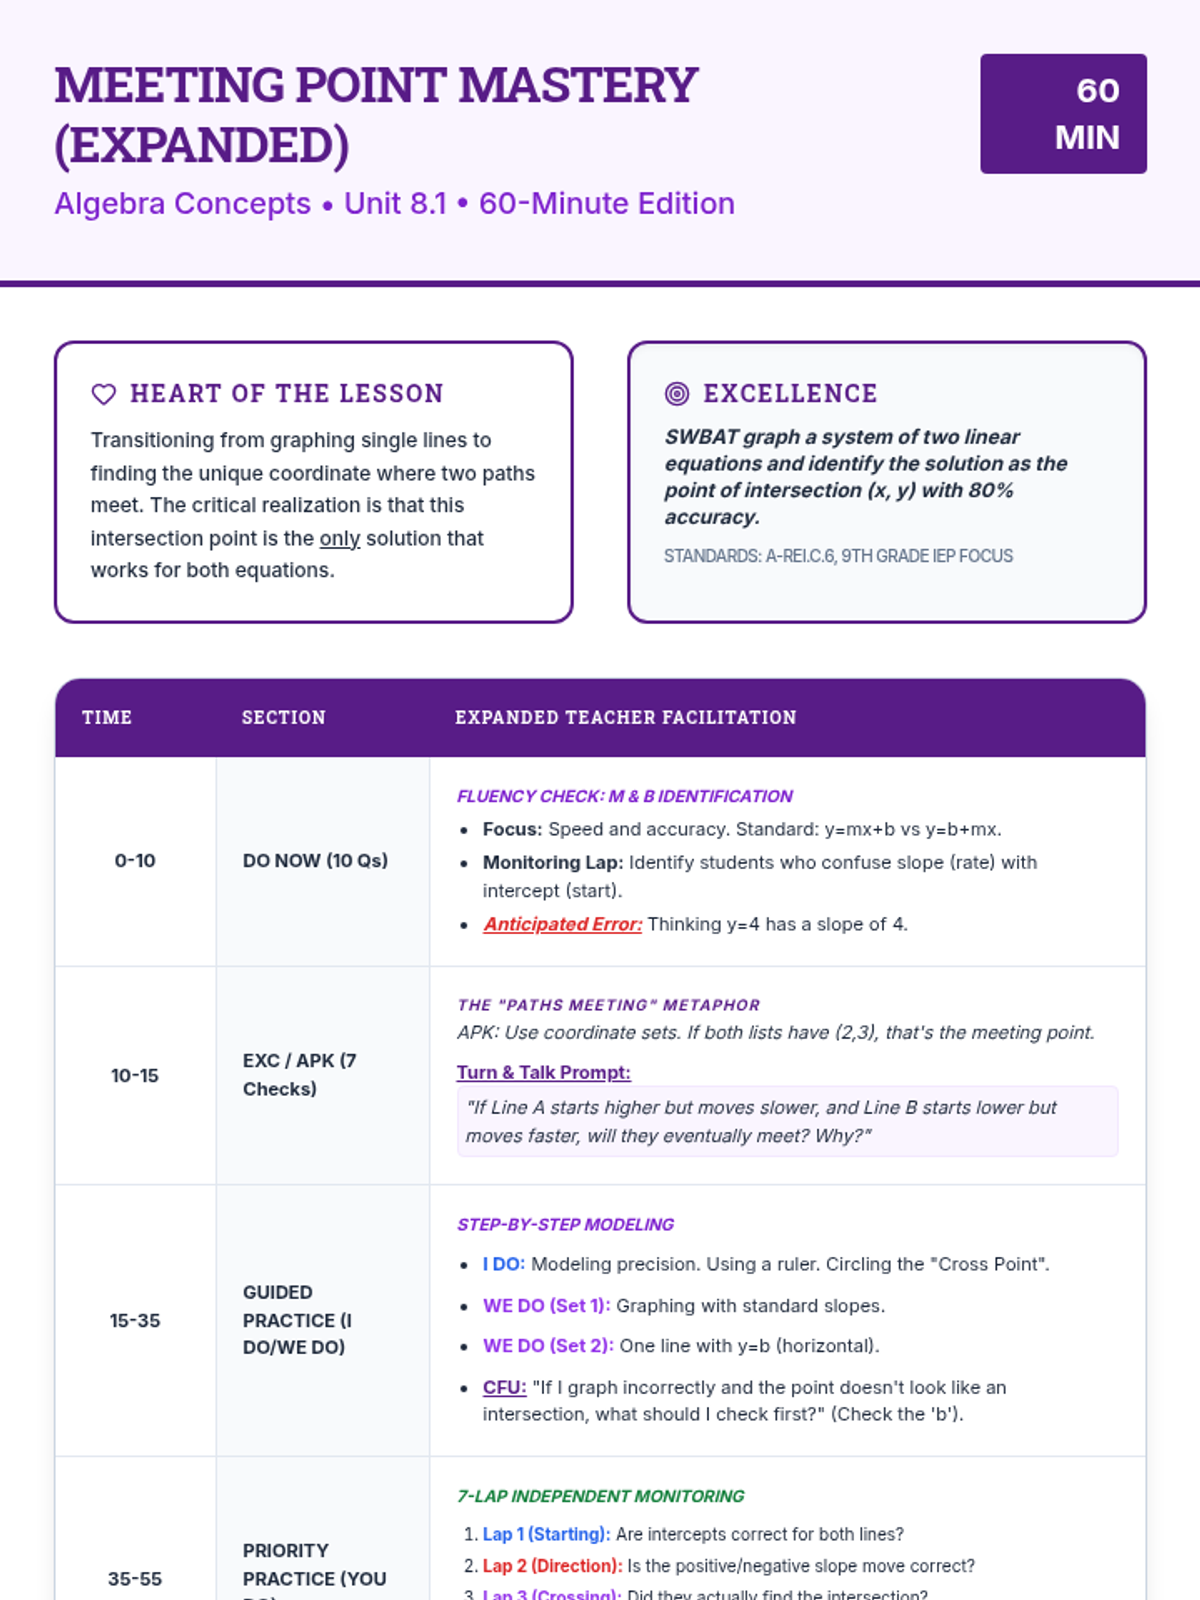
Students will solve systems of linear equations by graphing both lines and identifying the point where they cross as the unique solution.
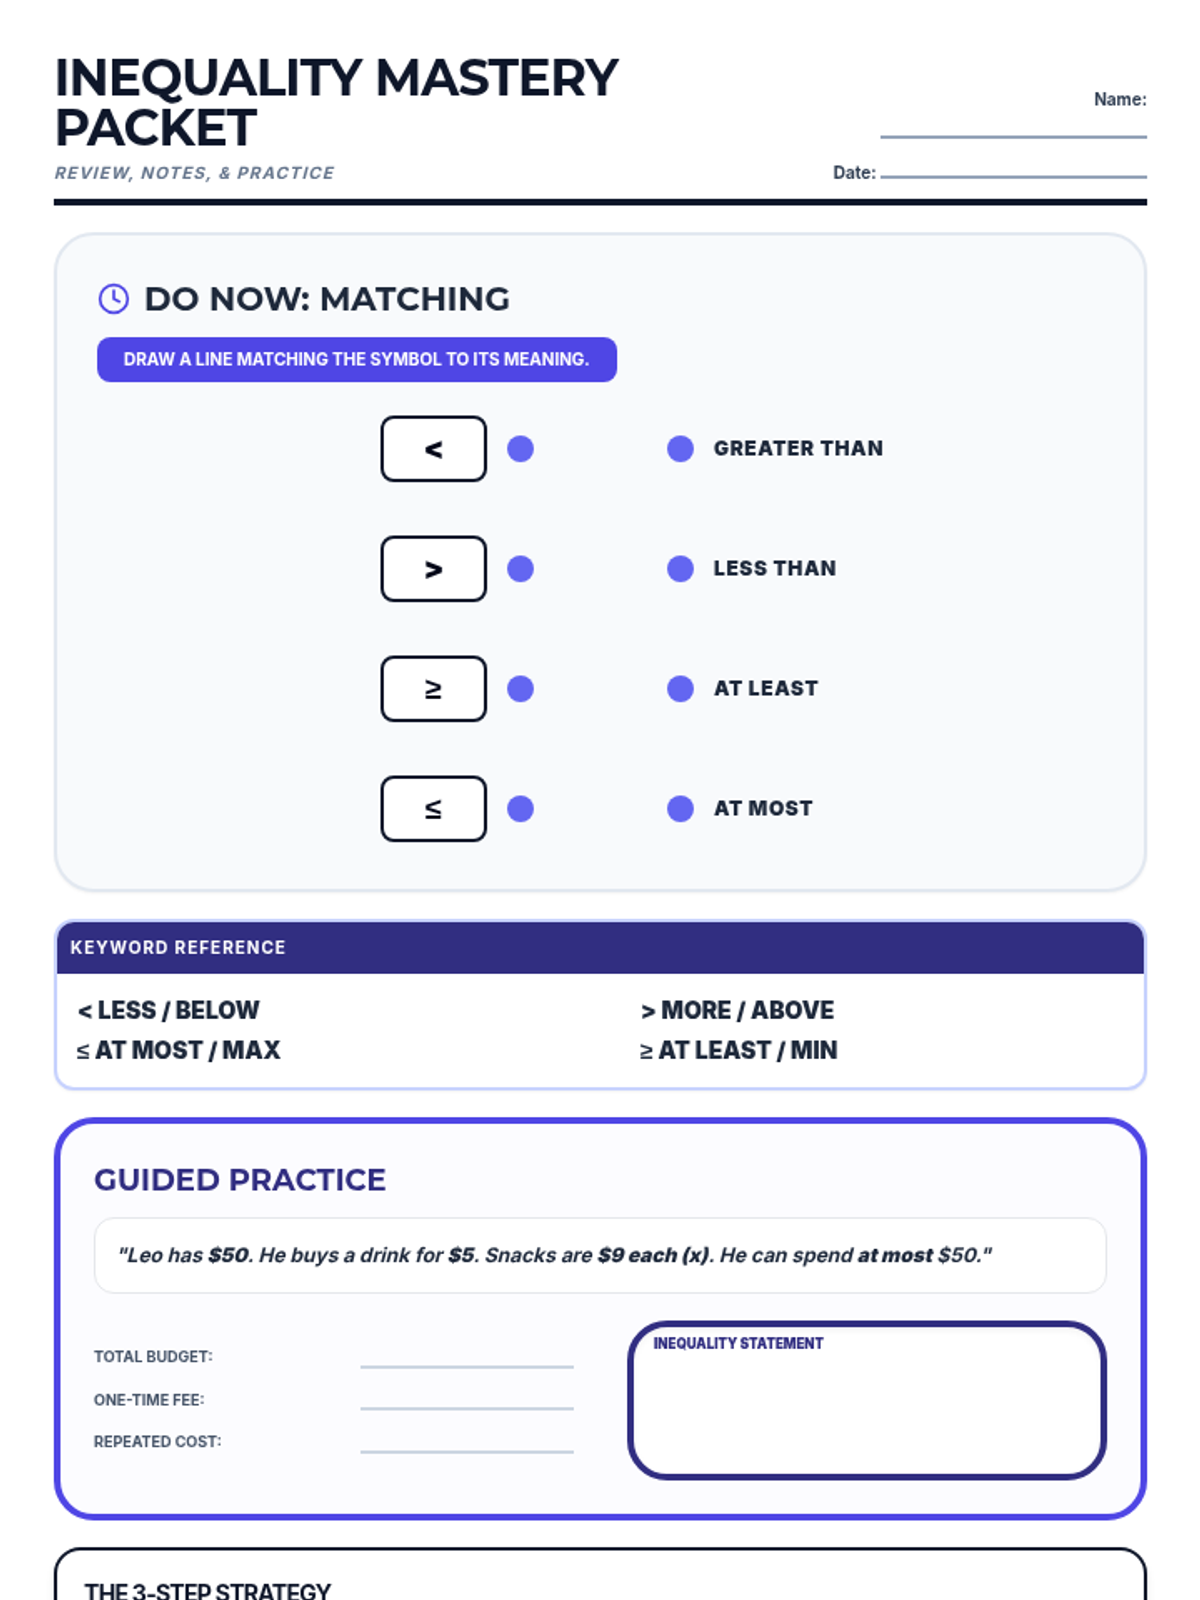
Students will learn to translate real-world scenarios into simple and compound linear inequalities, using keywords to determine the correct symbols and structures.
A focused lesson on finding the inverse of basic logarithmic functions using algebraic steps, specifically focusing on base 10 and base 2.
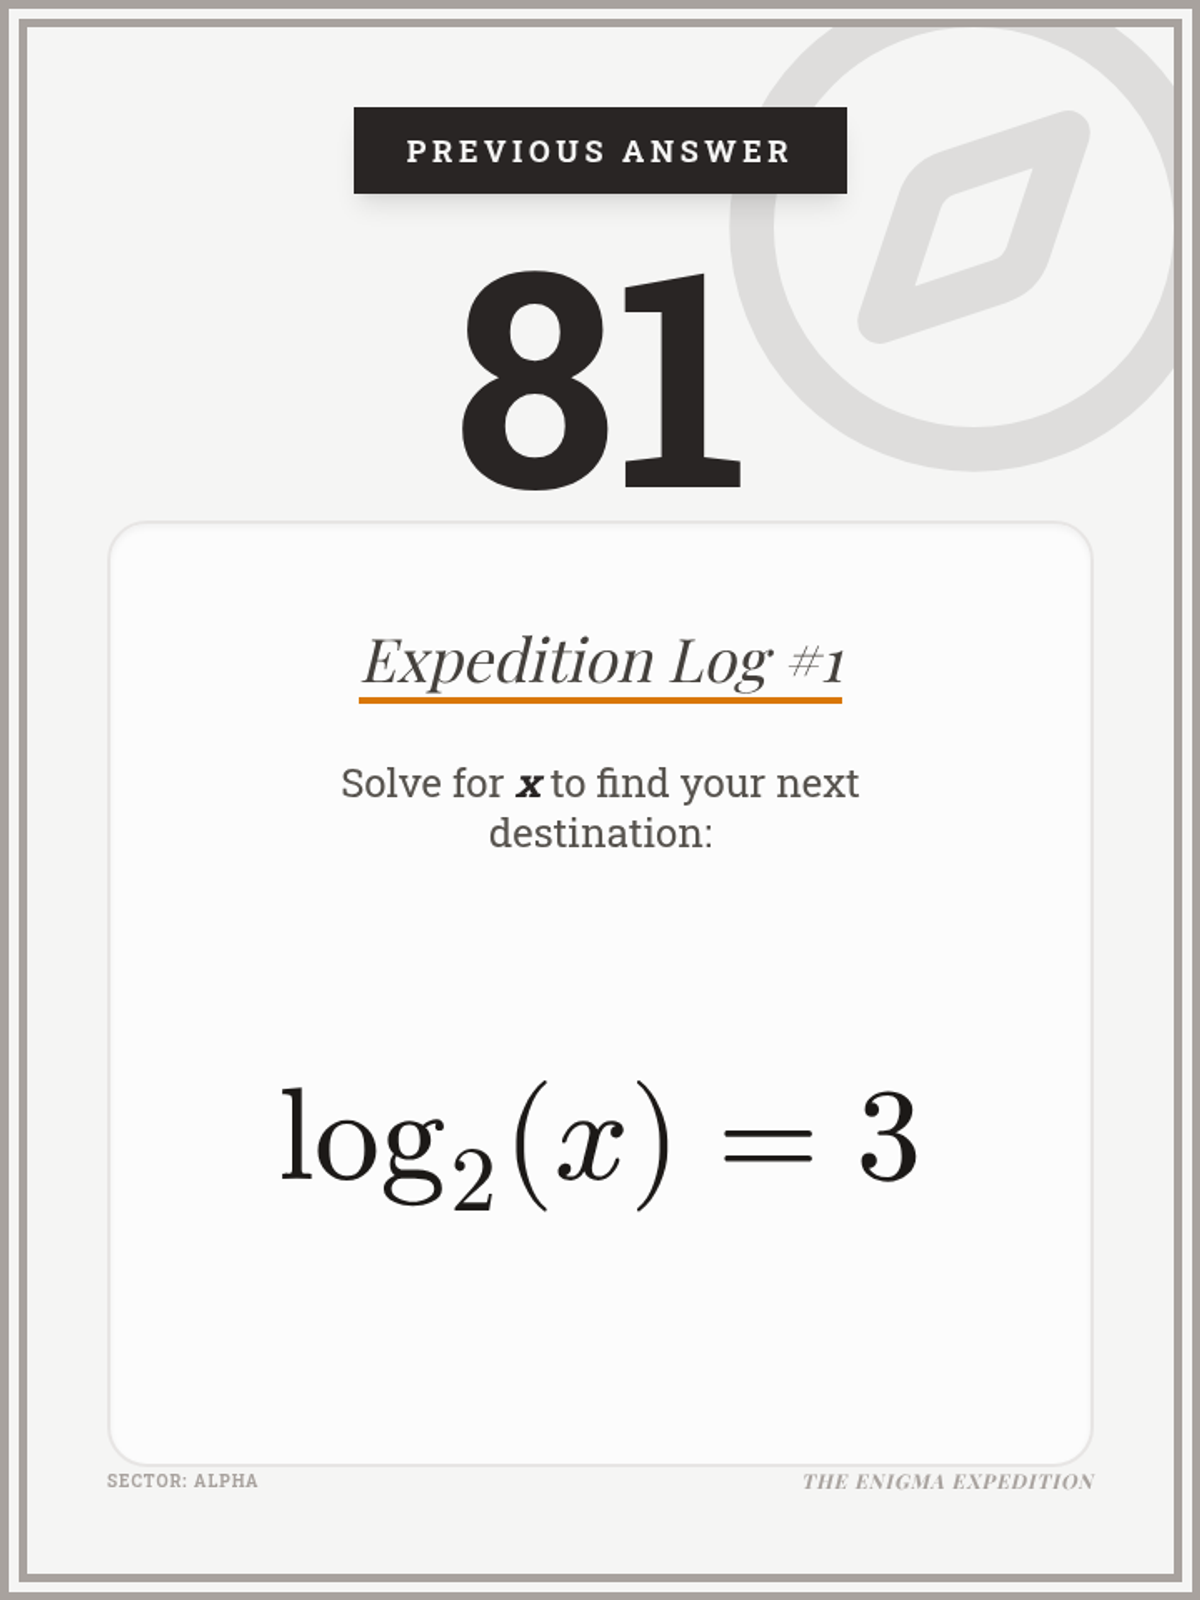
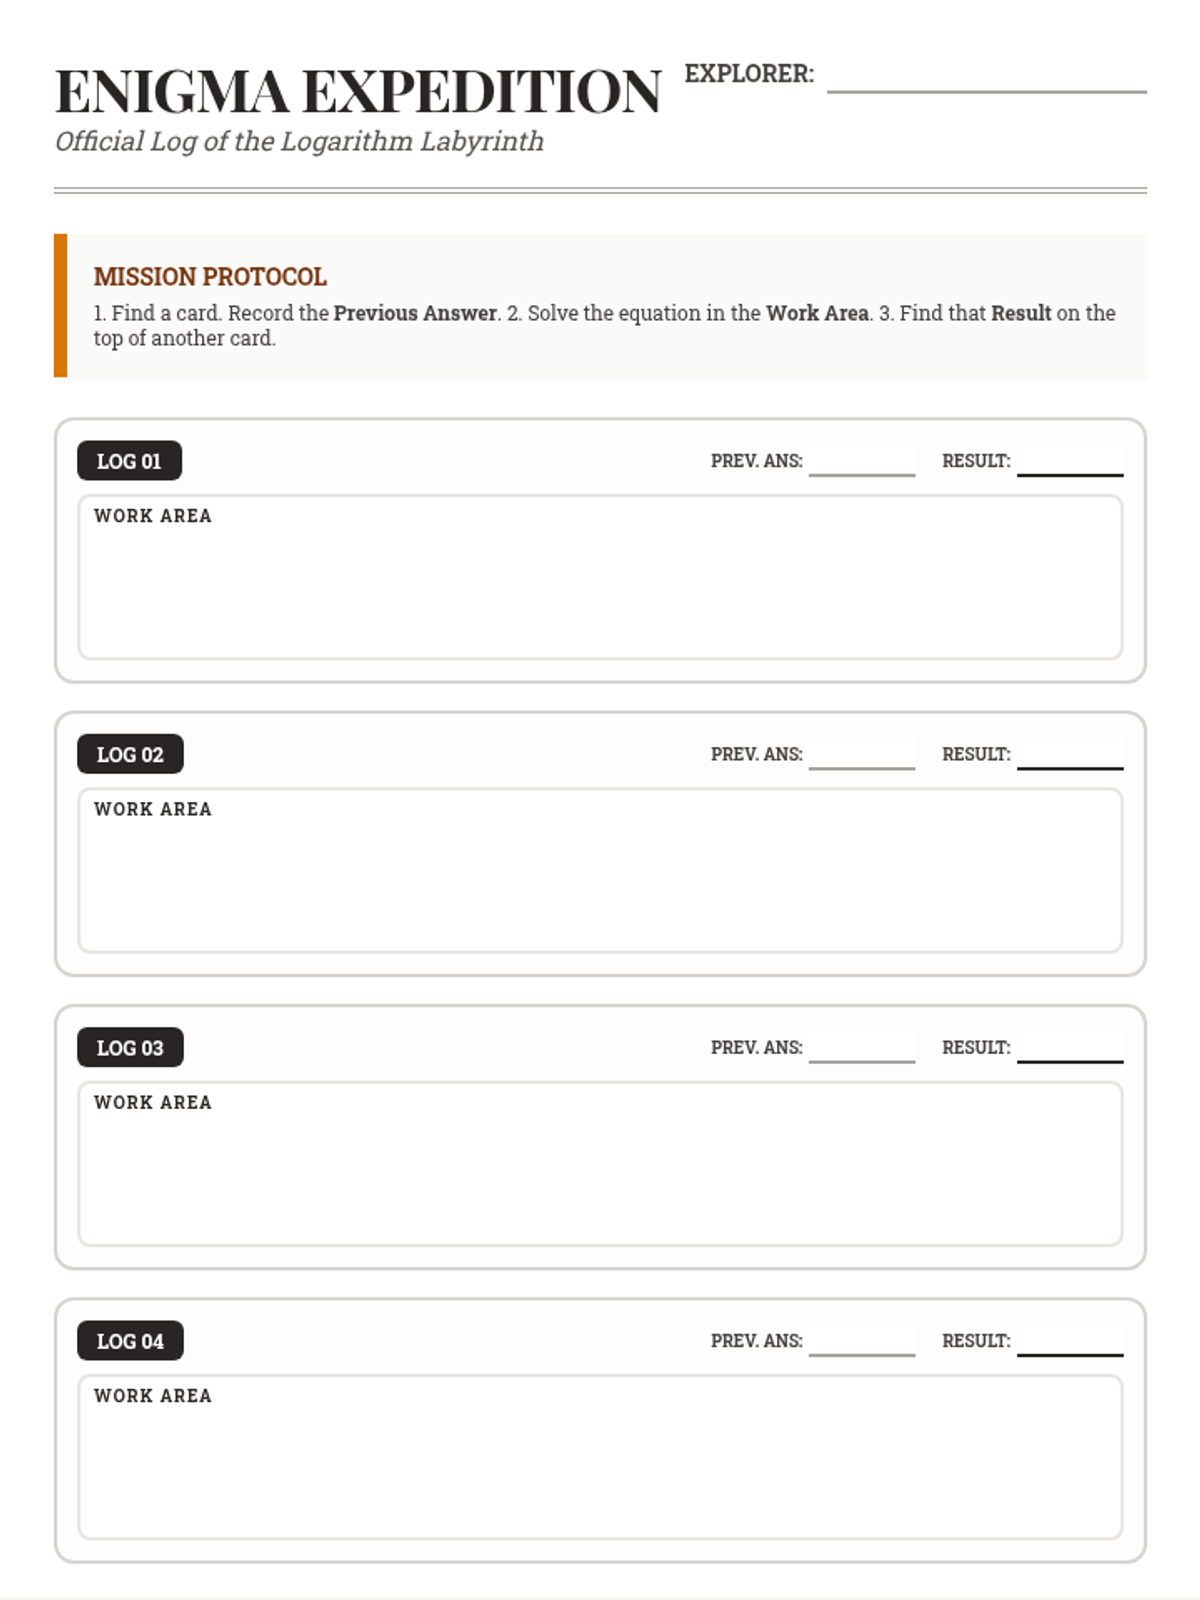
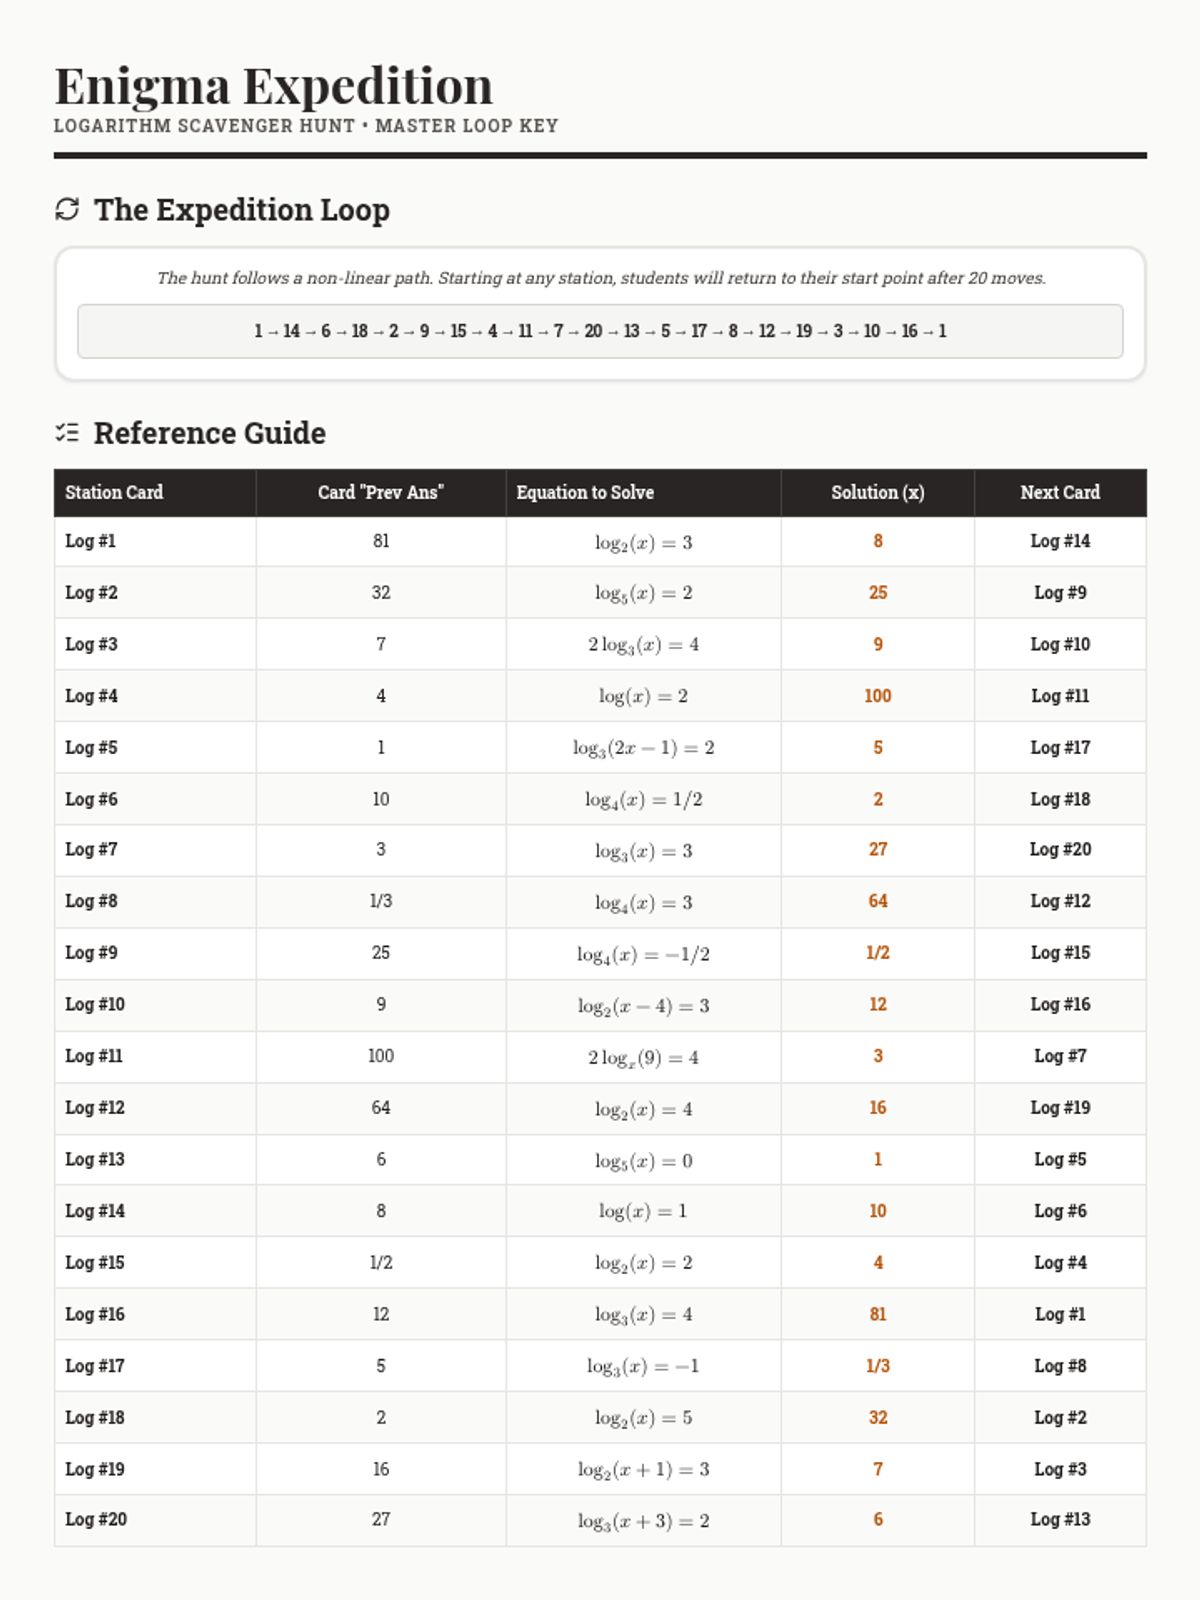
A self-checking scavenger hunt activity where students solve basic logarithmic equations involving conversions, isolations, and simple expressions. The activity is themed as an 'Enigma Expedition' through ancient ruins.
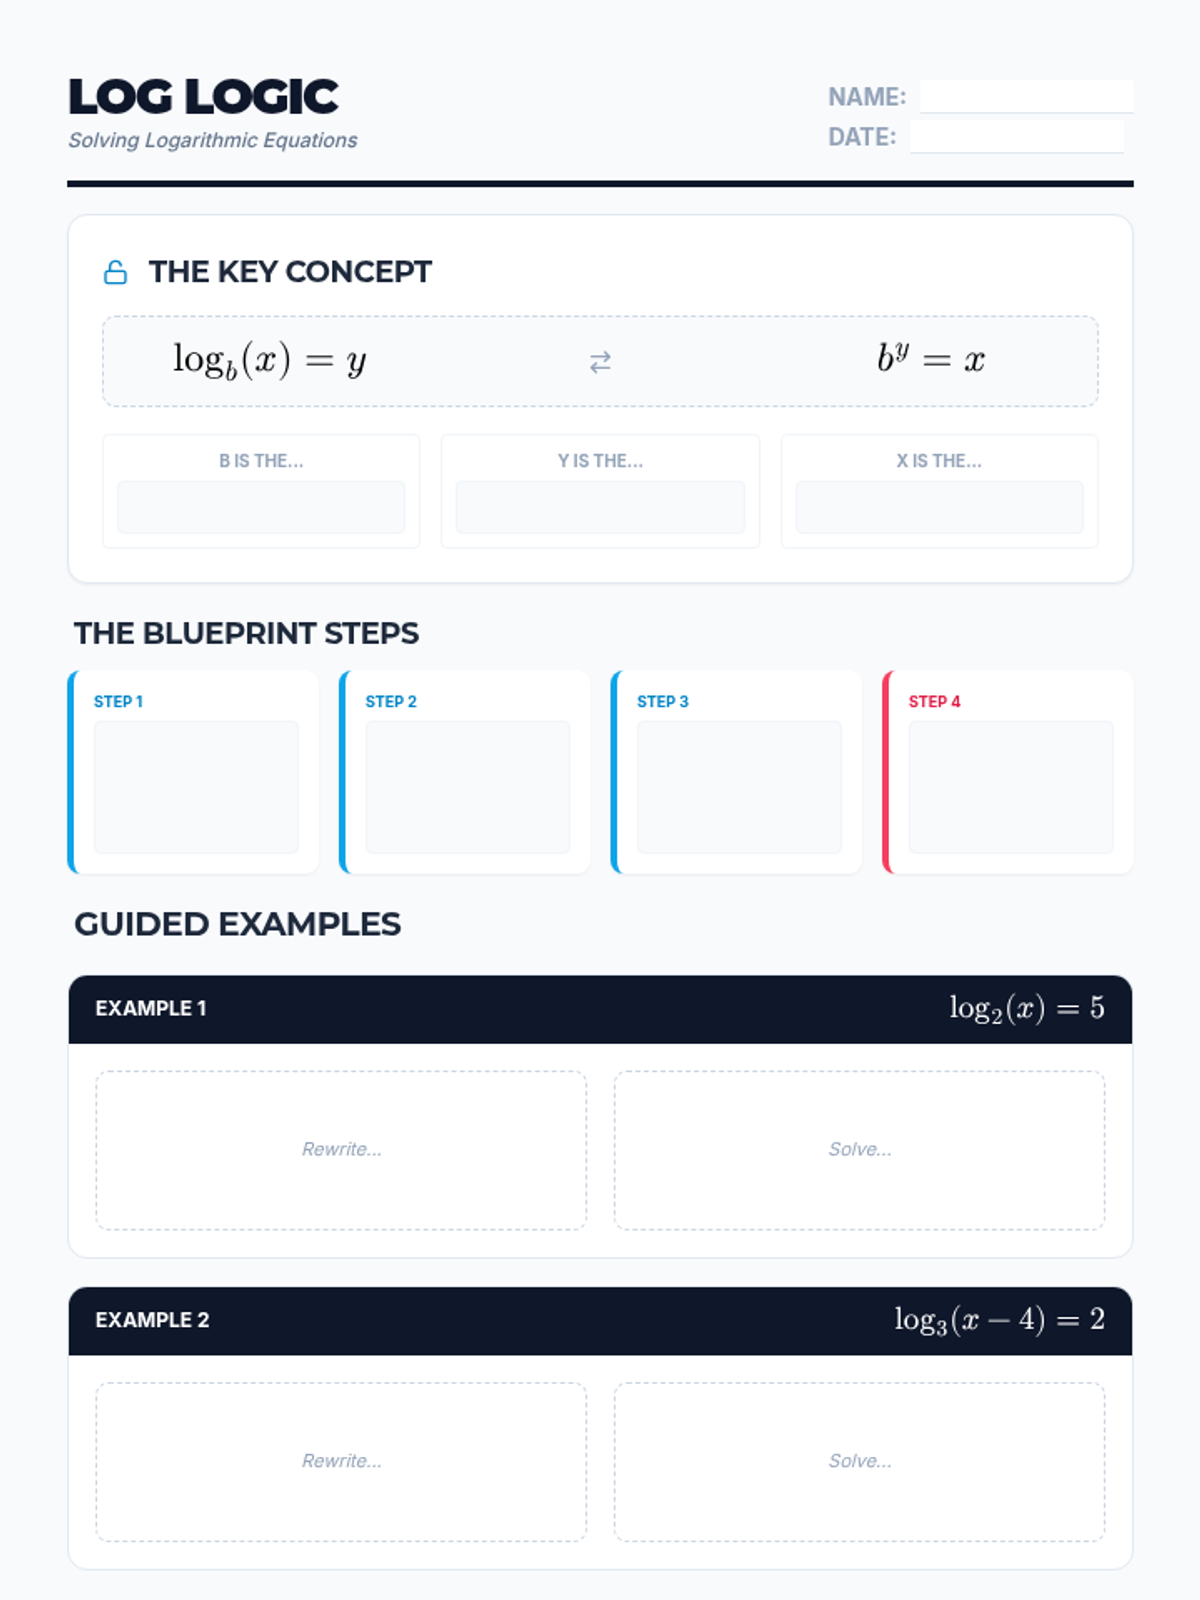
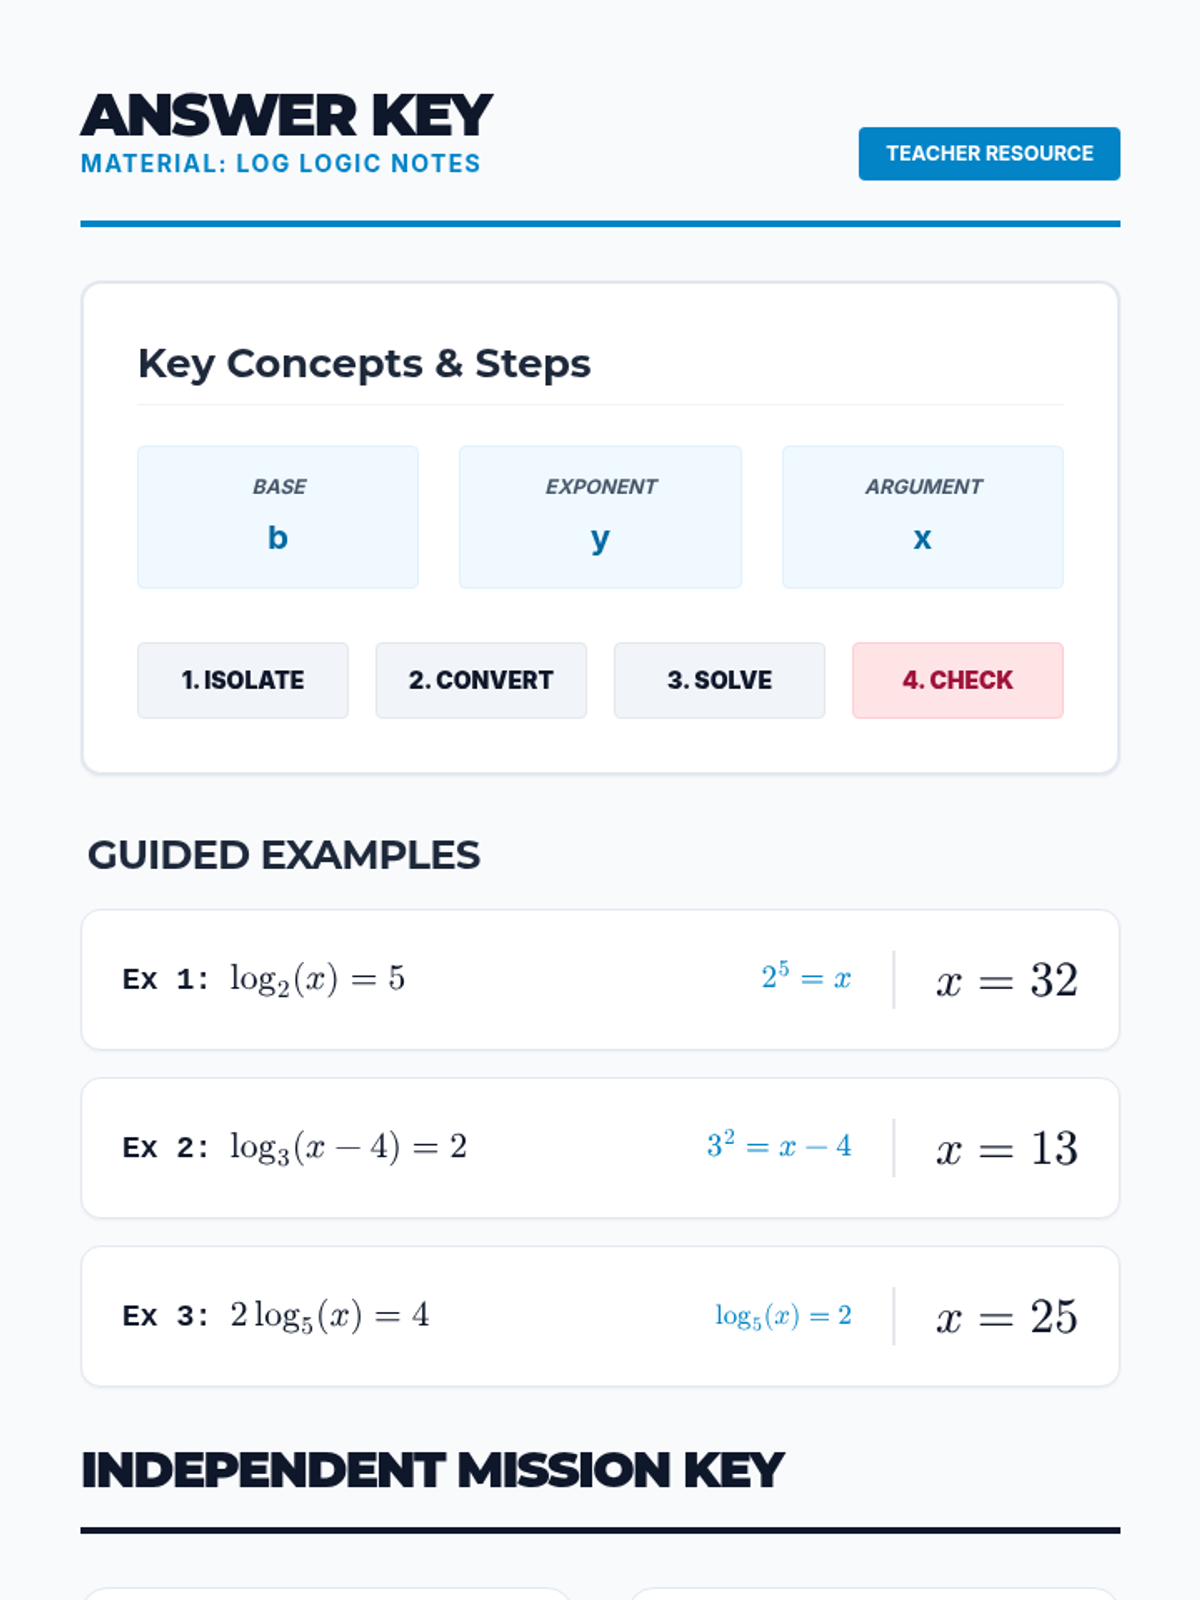
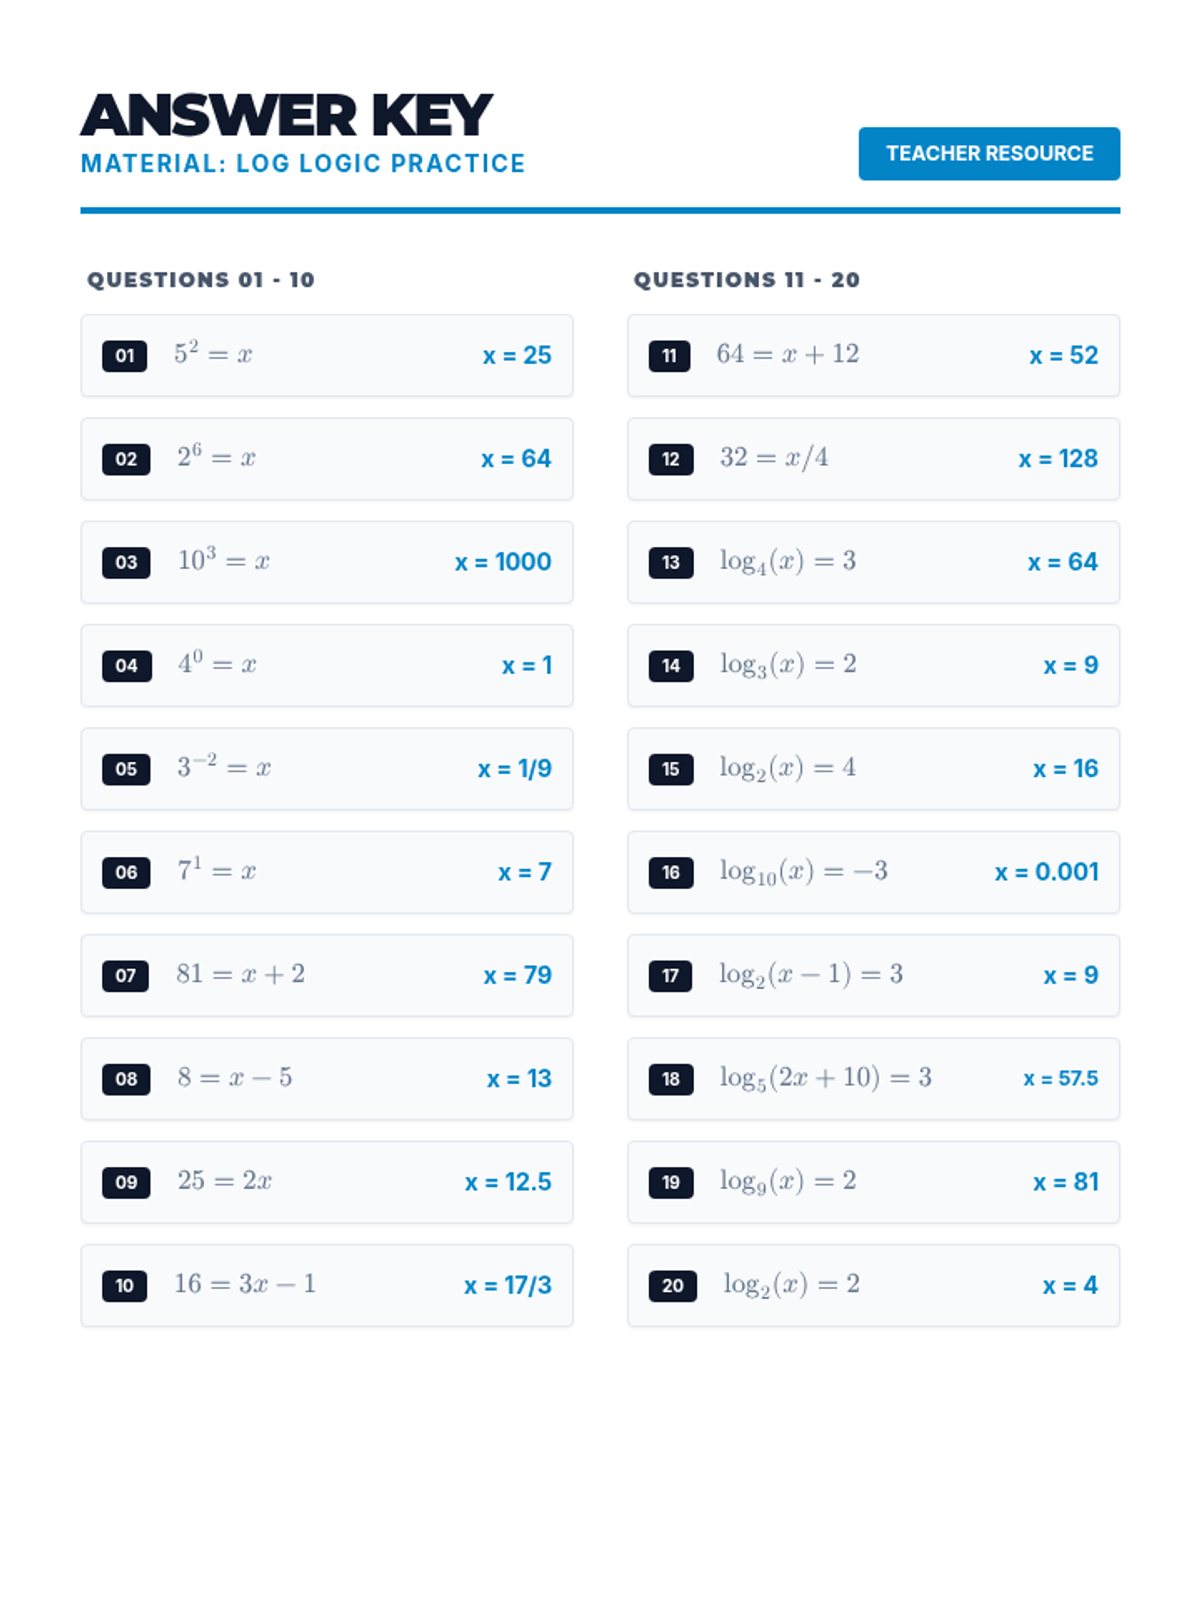
A comprehensive lesson on solving logarithmic equations by converting them to exponential form. Includes guided notes, a visual slide deck, and a complete answer key.
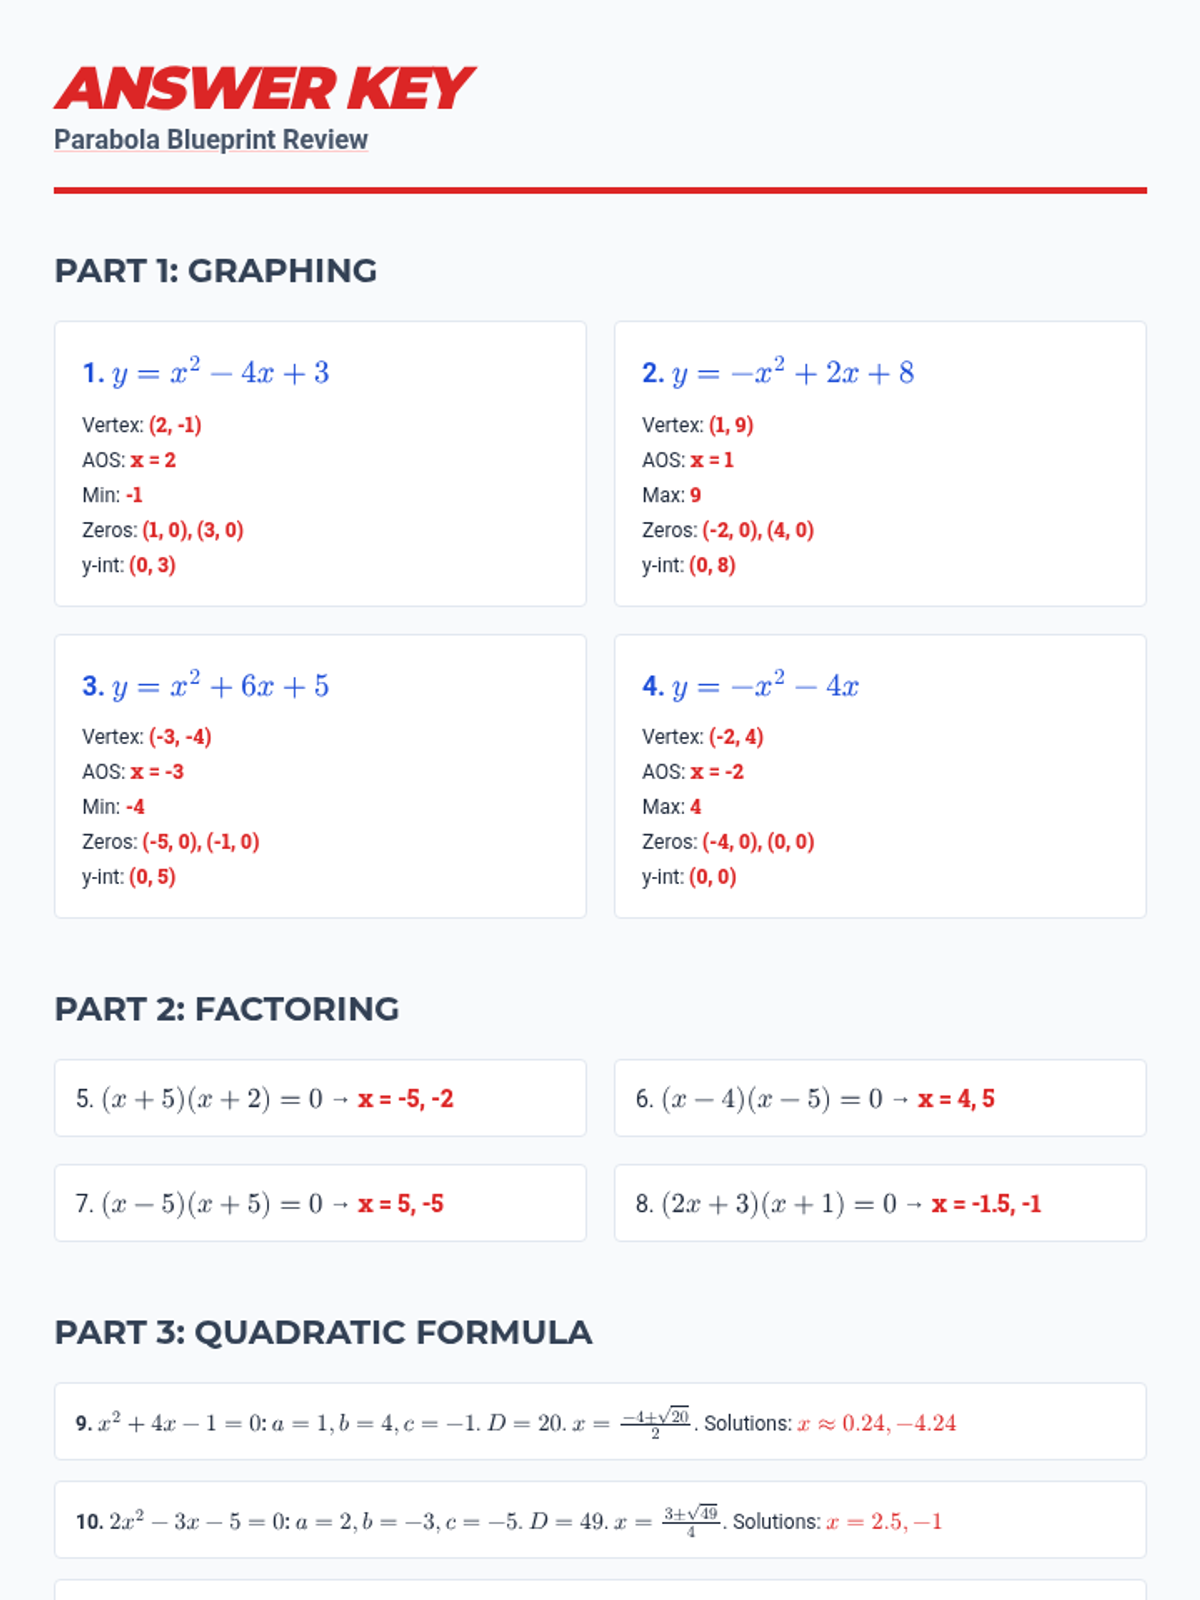
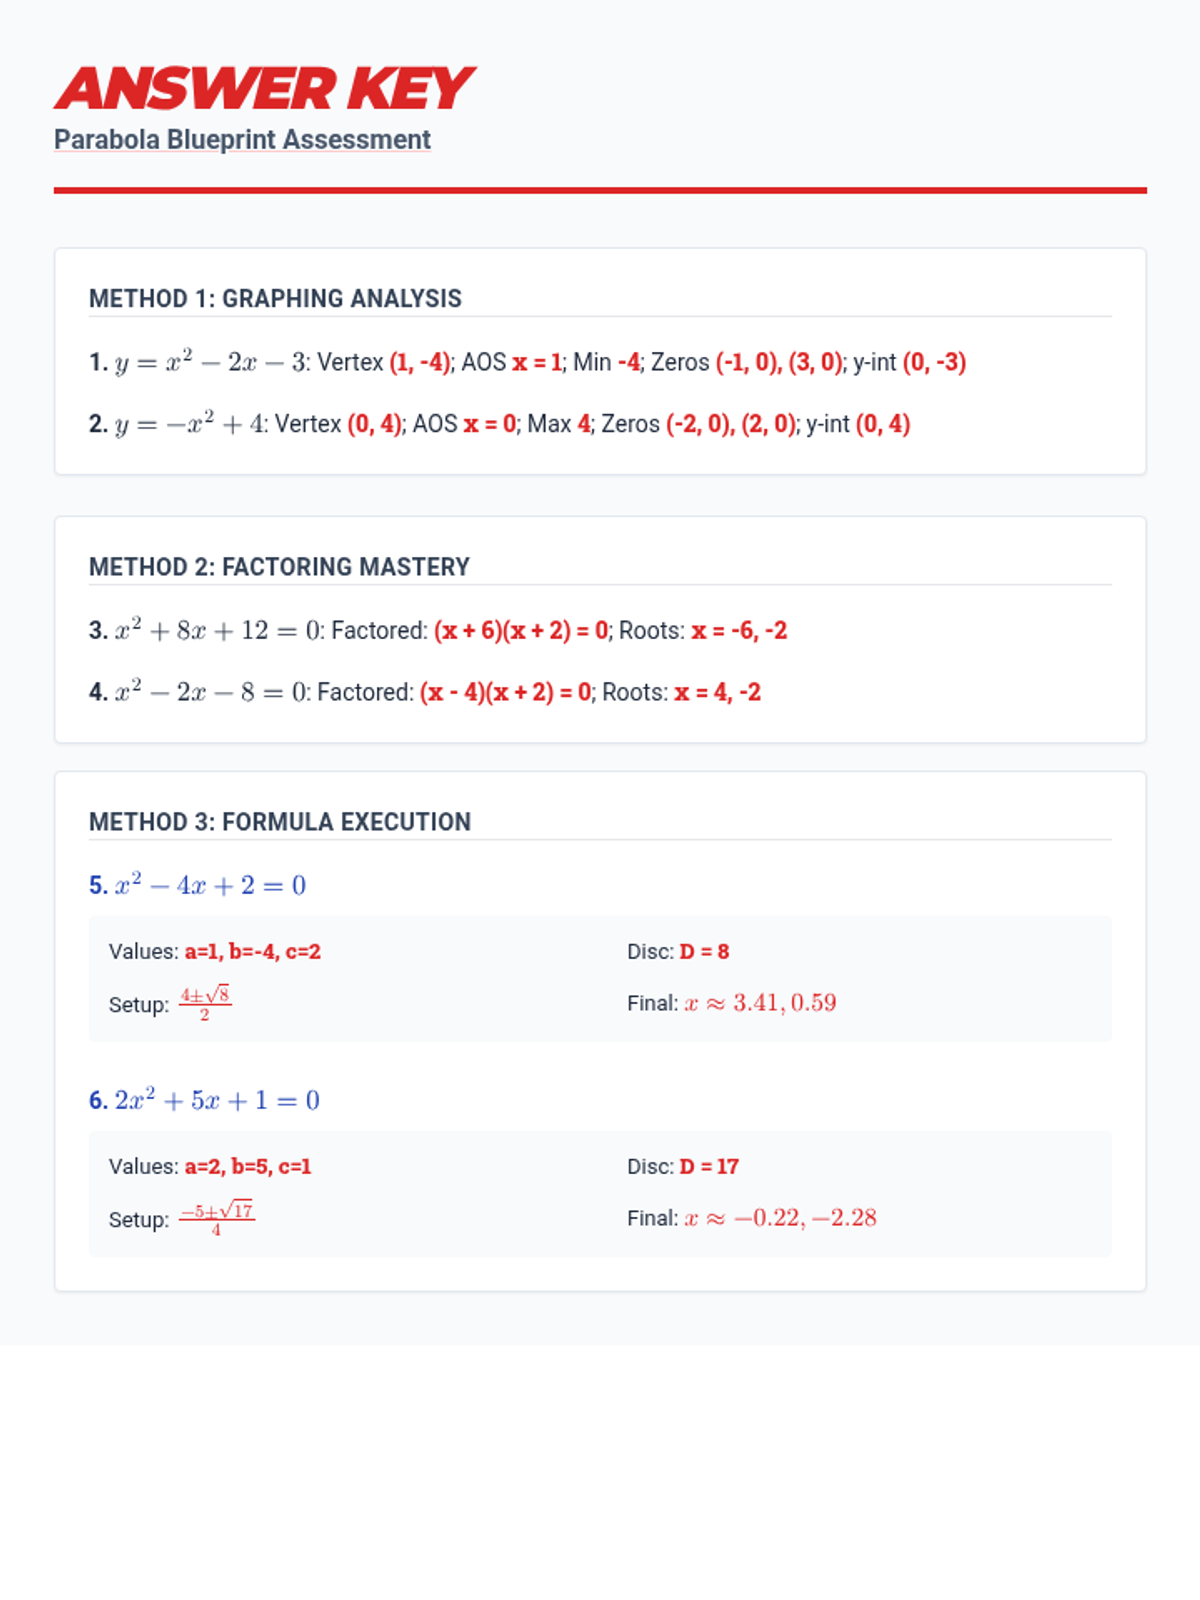
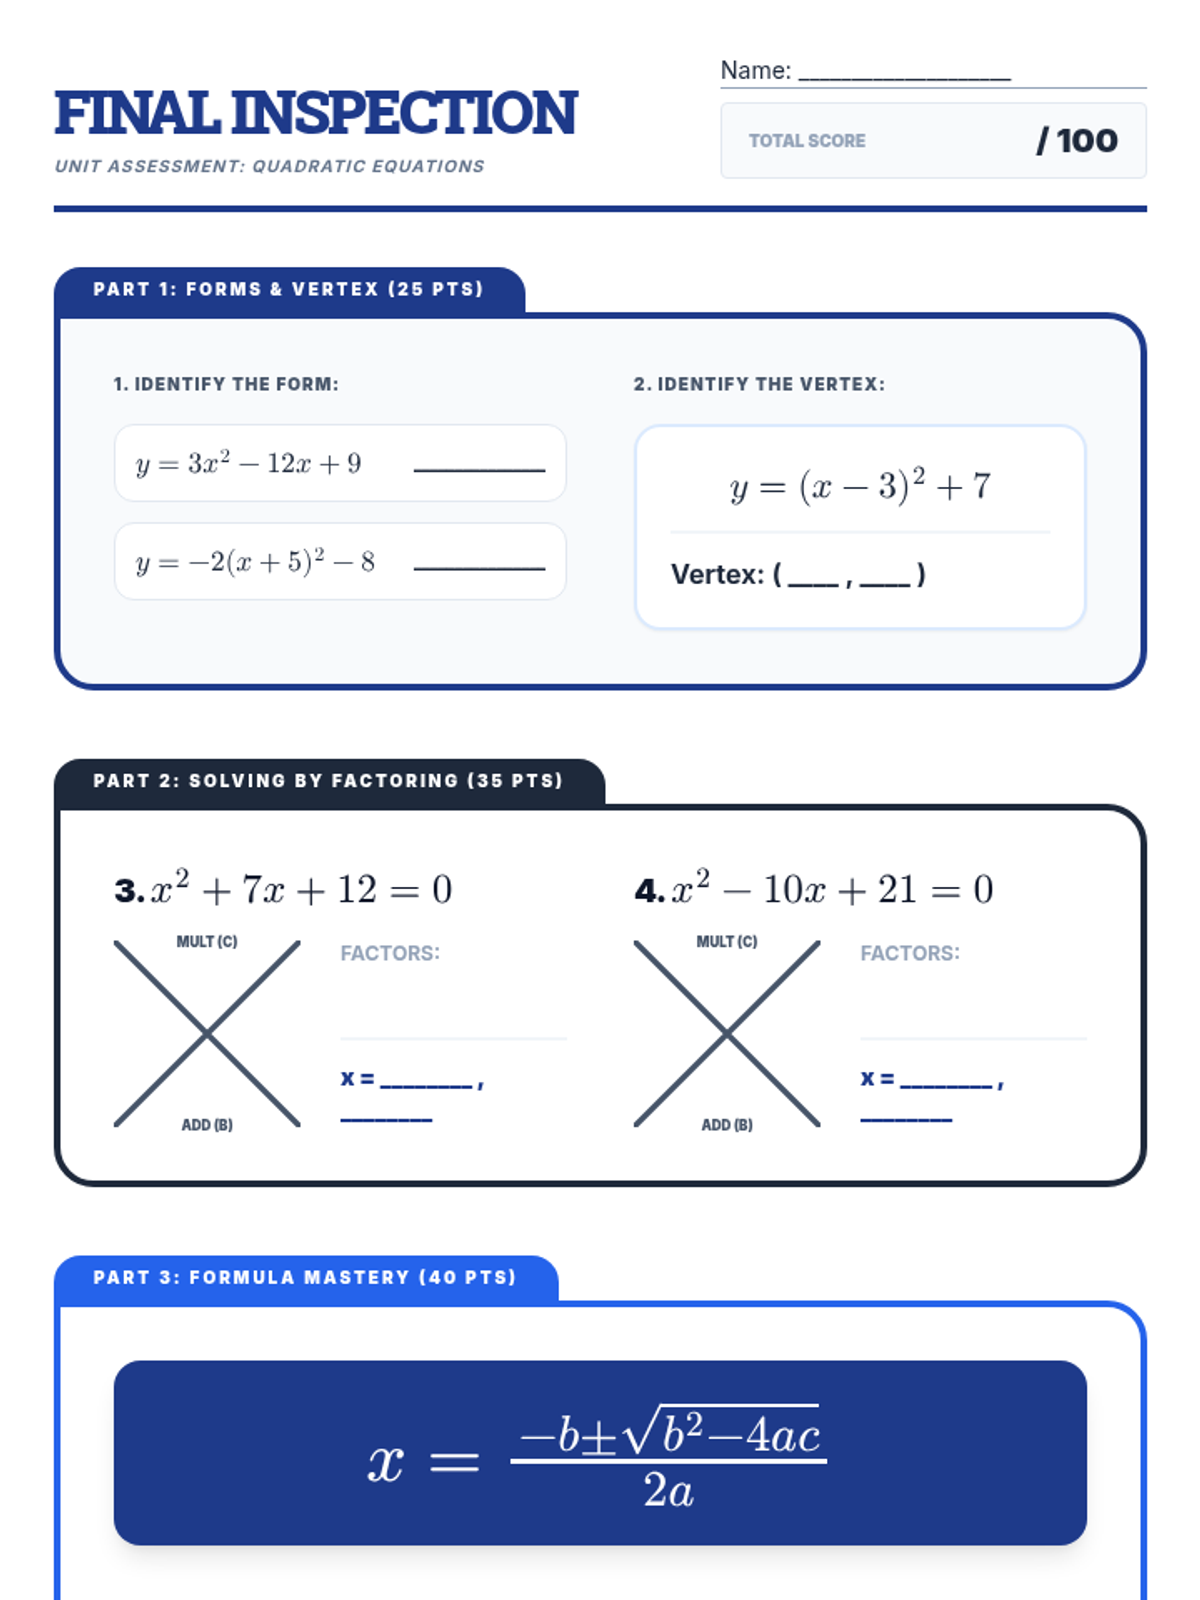
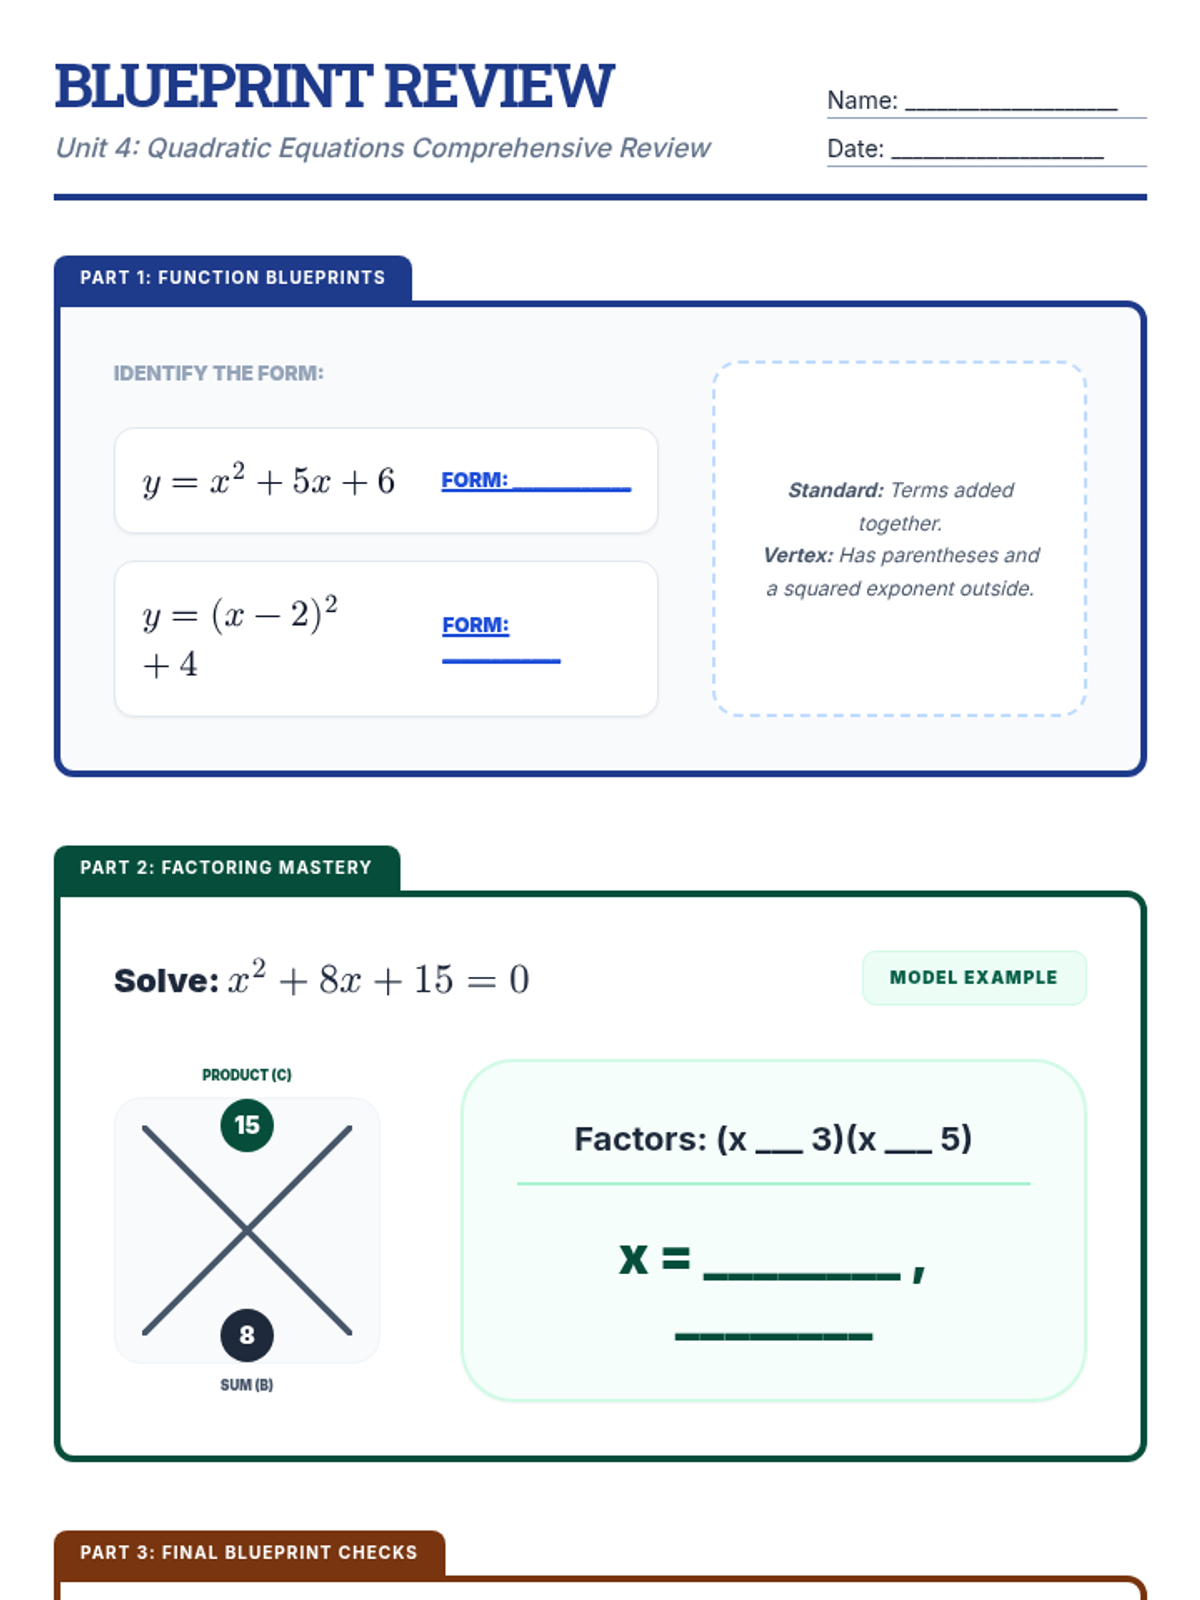
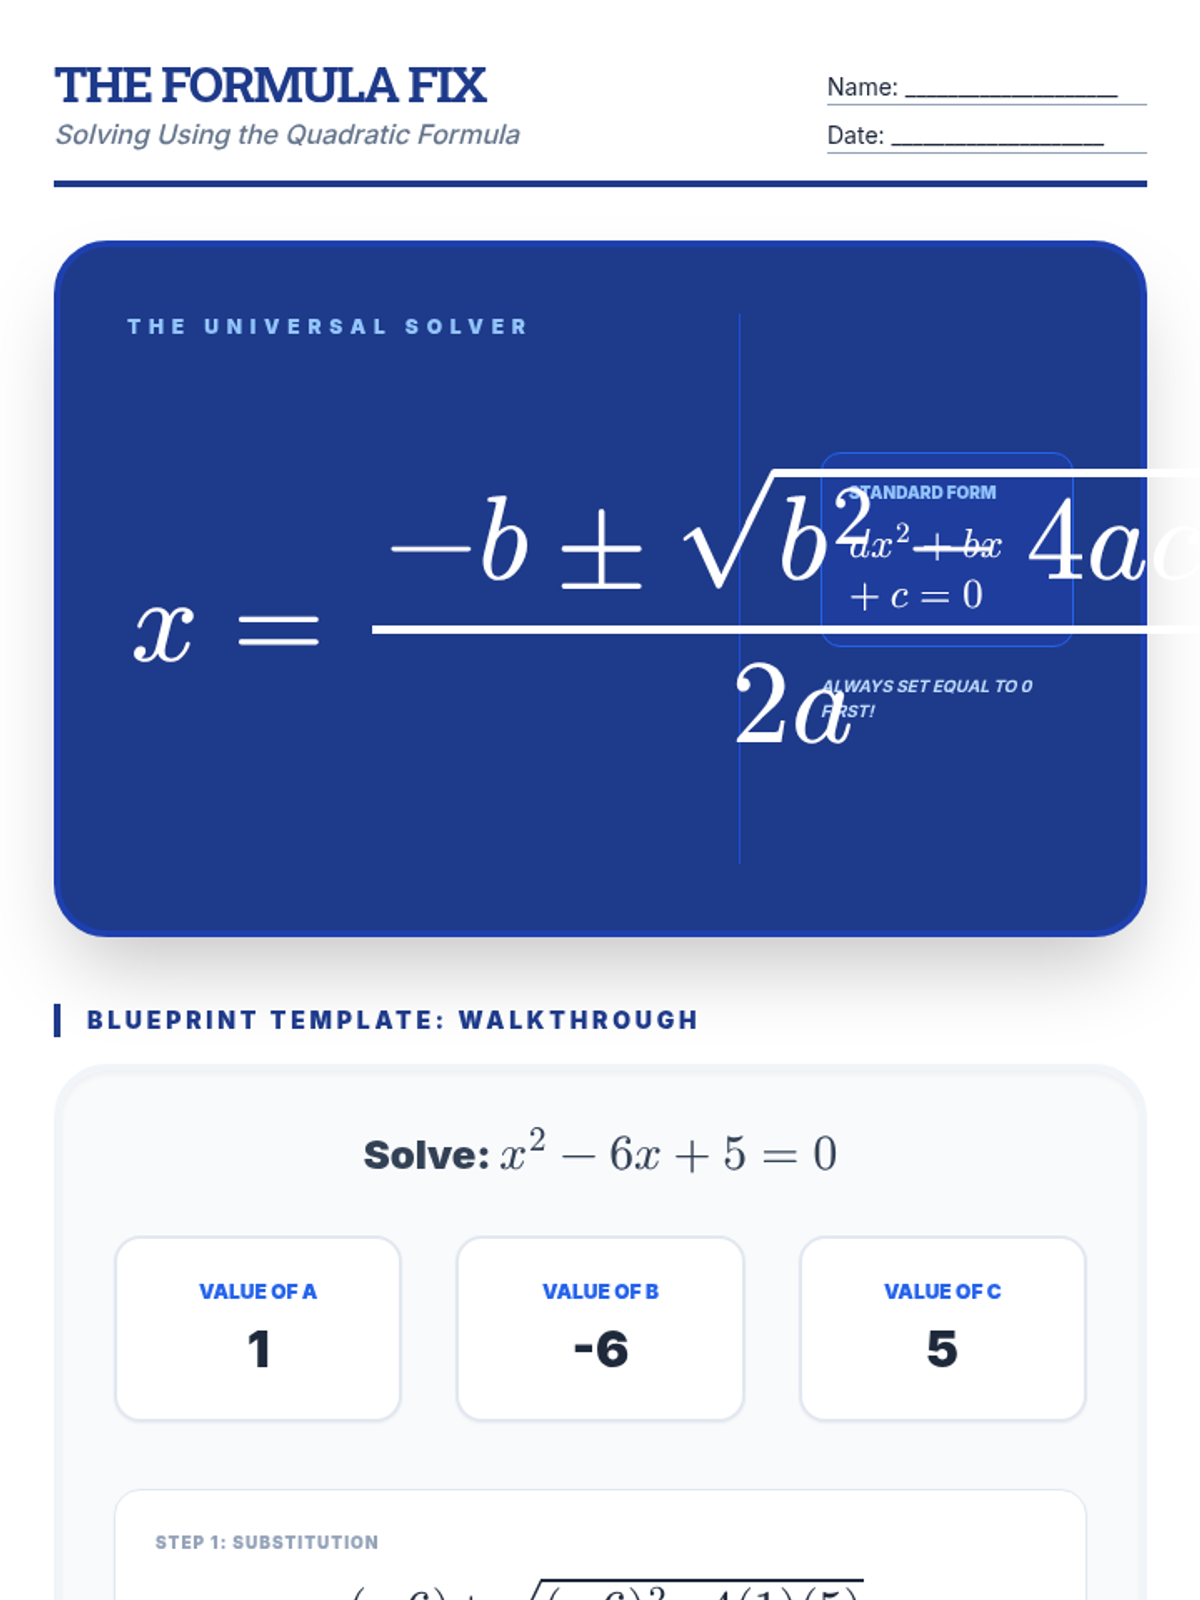
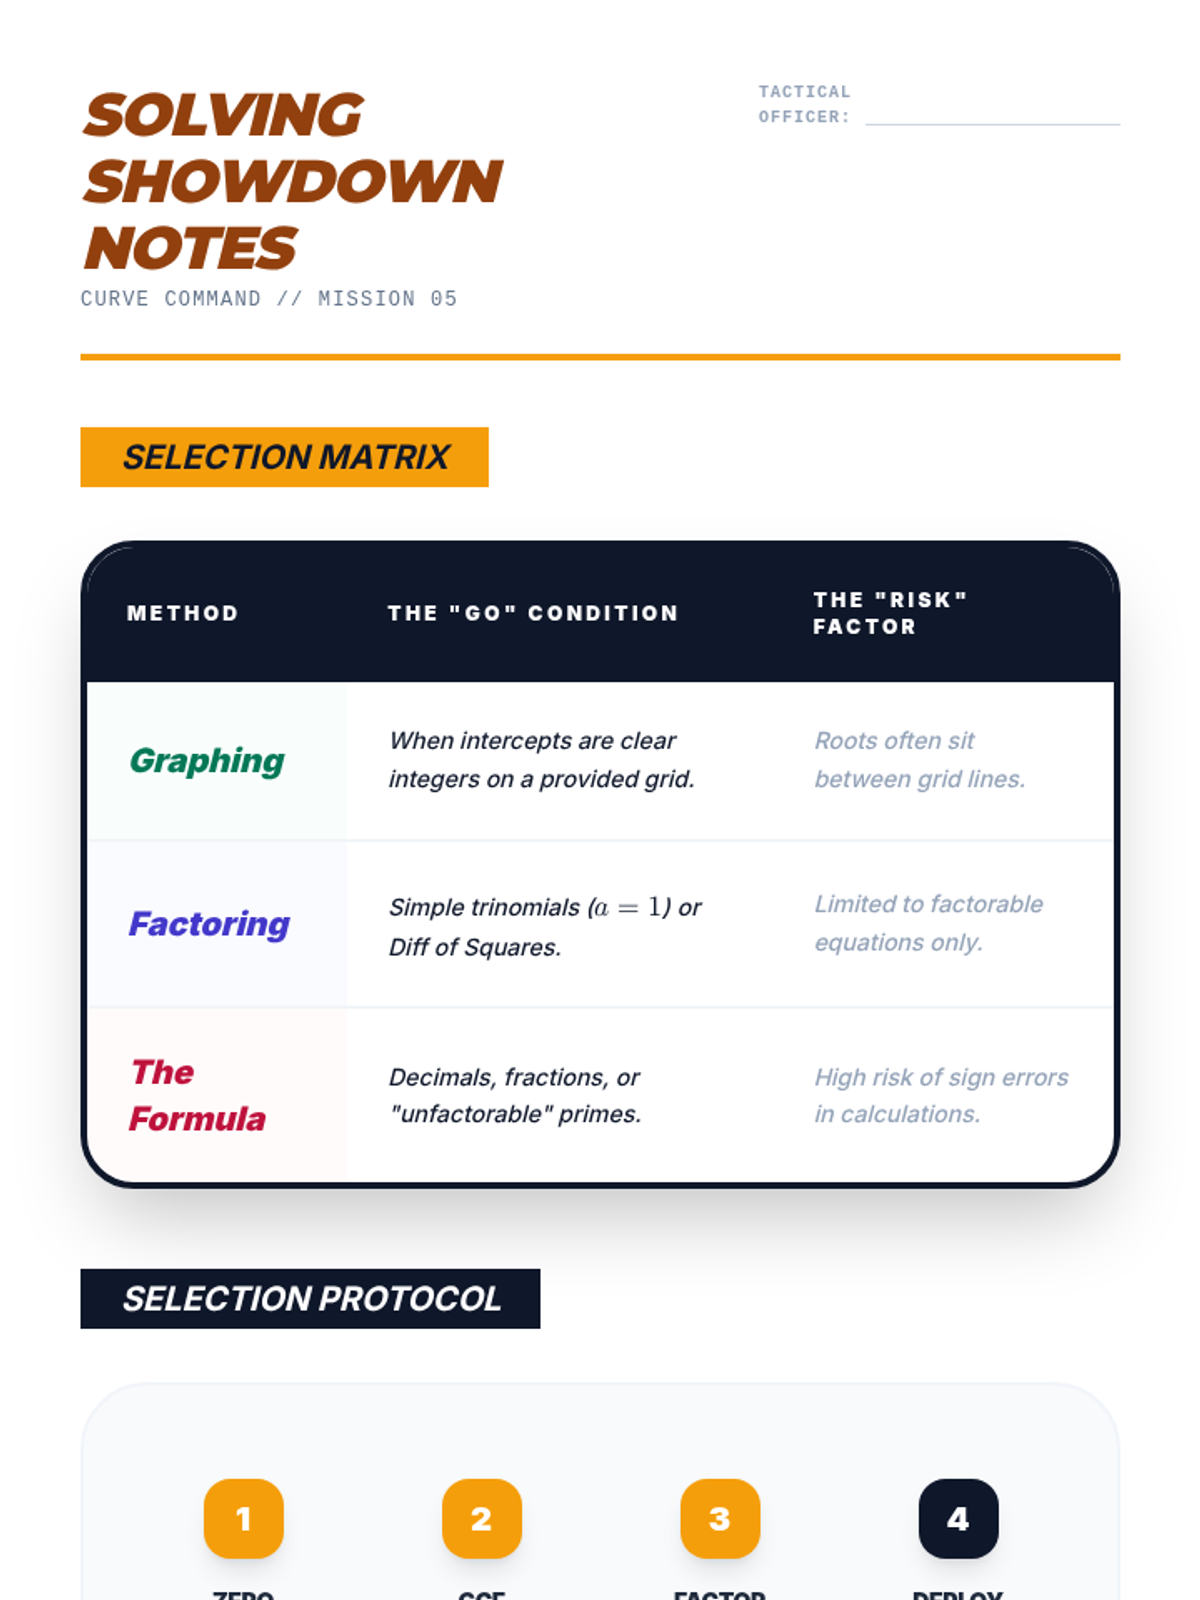
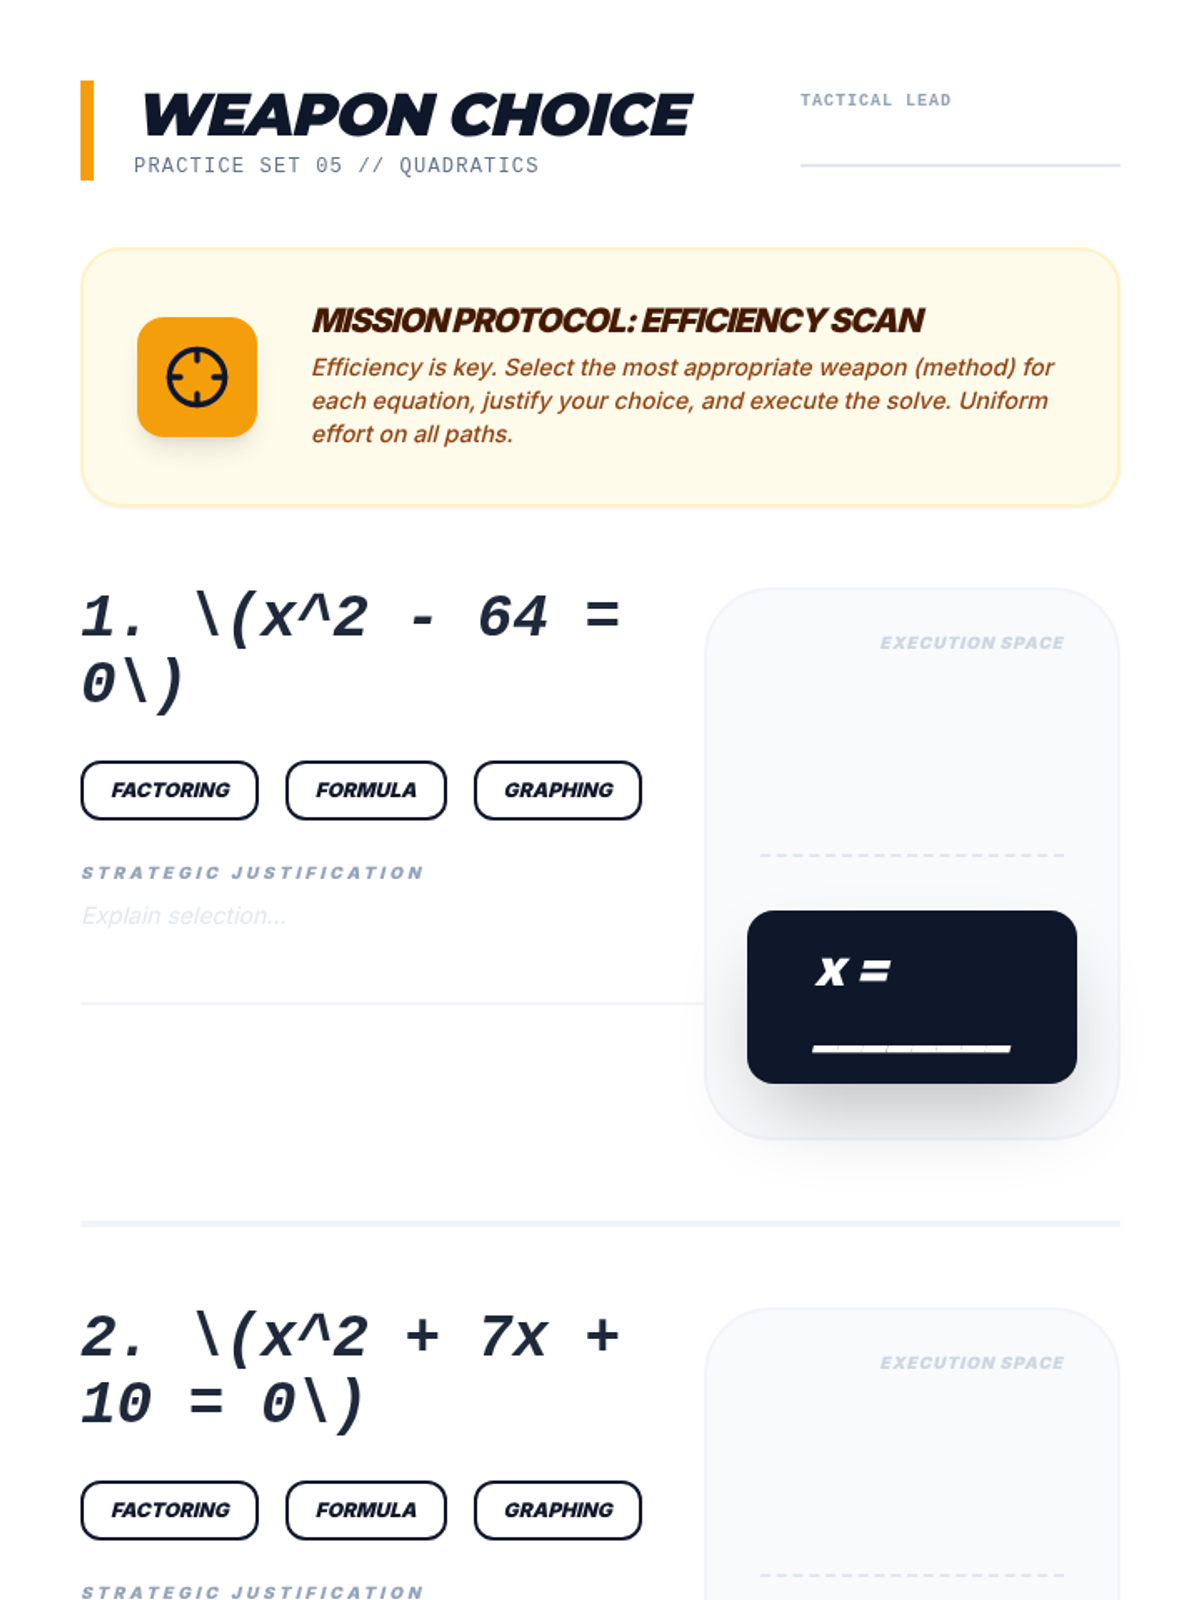
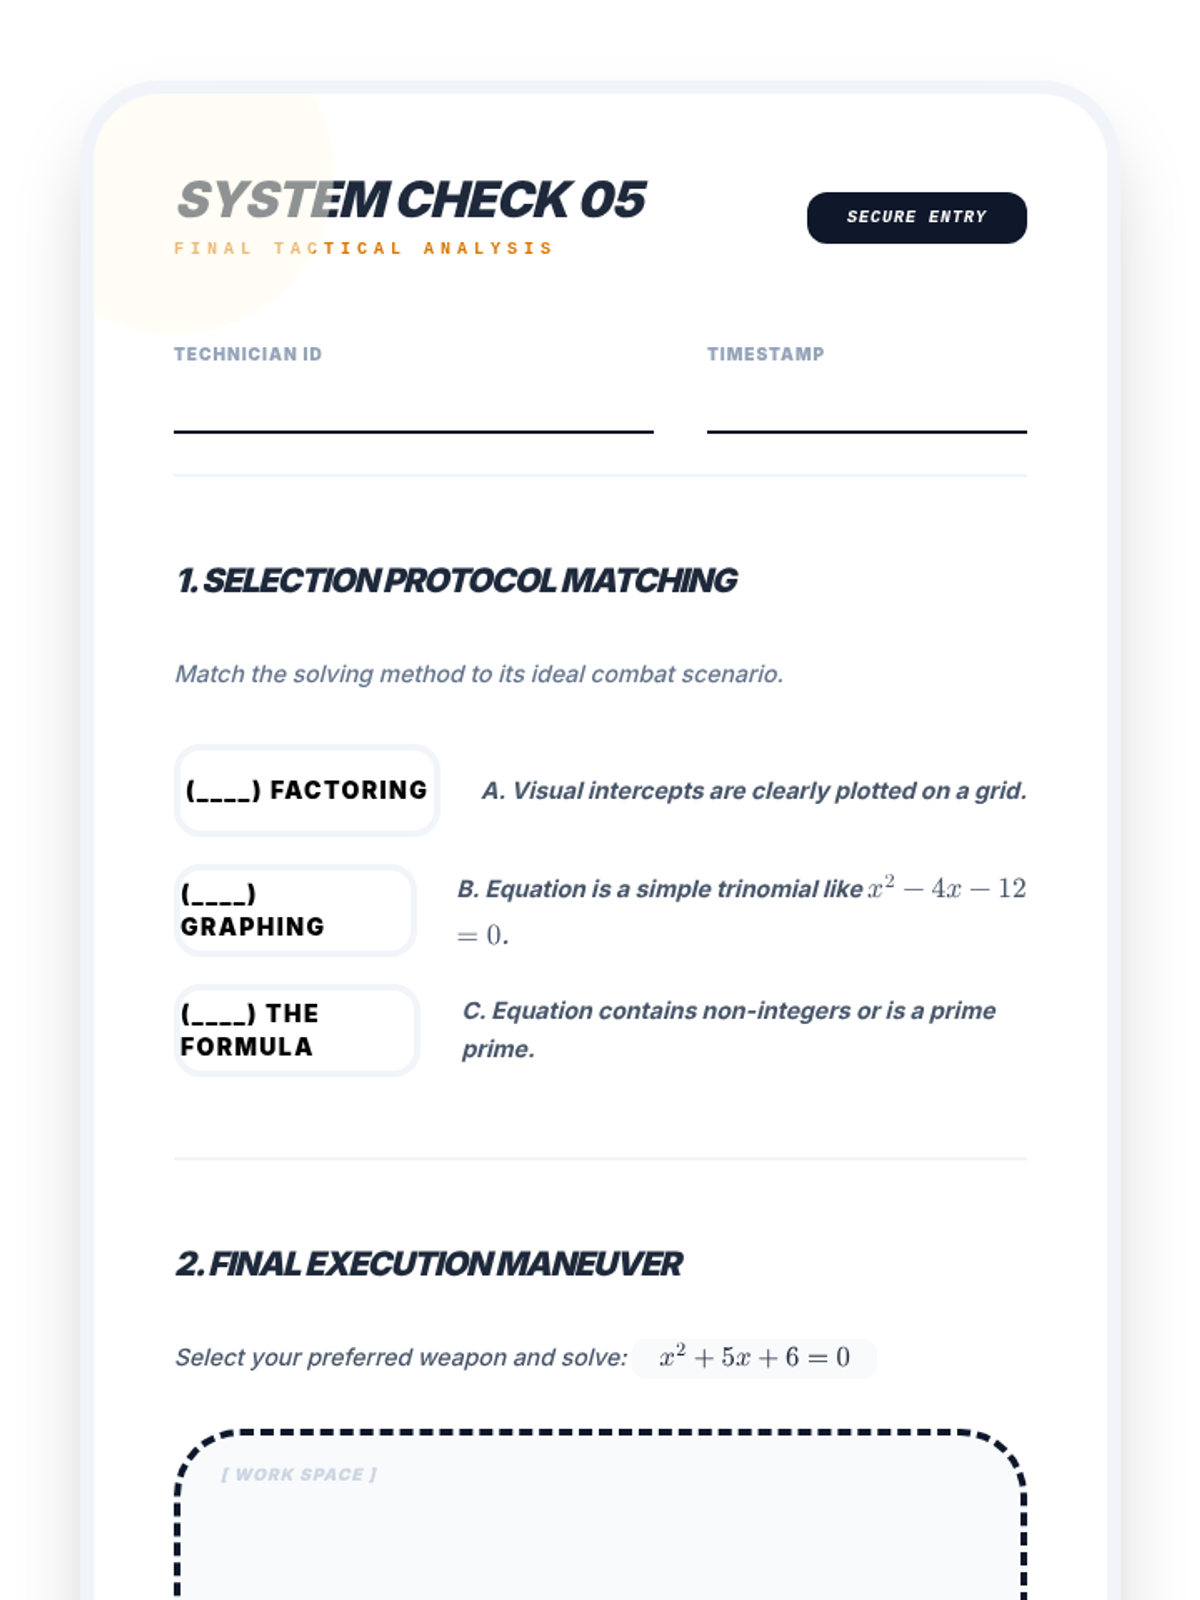
A comprehensive unit review and summative assessment covering three key methods for solving quadratic equations: graphing, factoring, and the quadratic formula. Students practice identifying key features of parabolas, algebraic manipulation for factoring, and the step-by-step application of the quadratic formula.
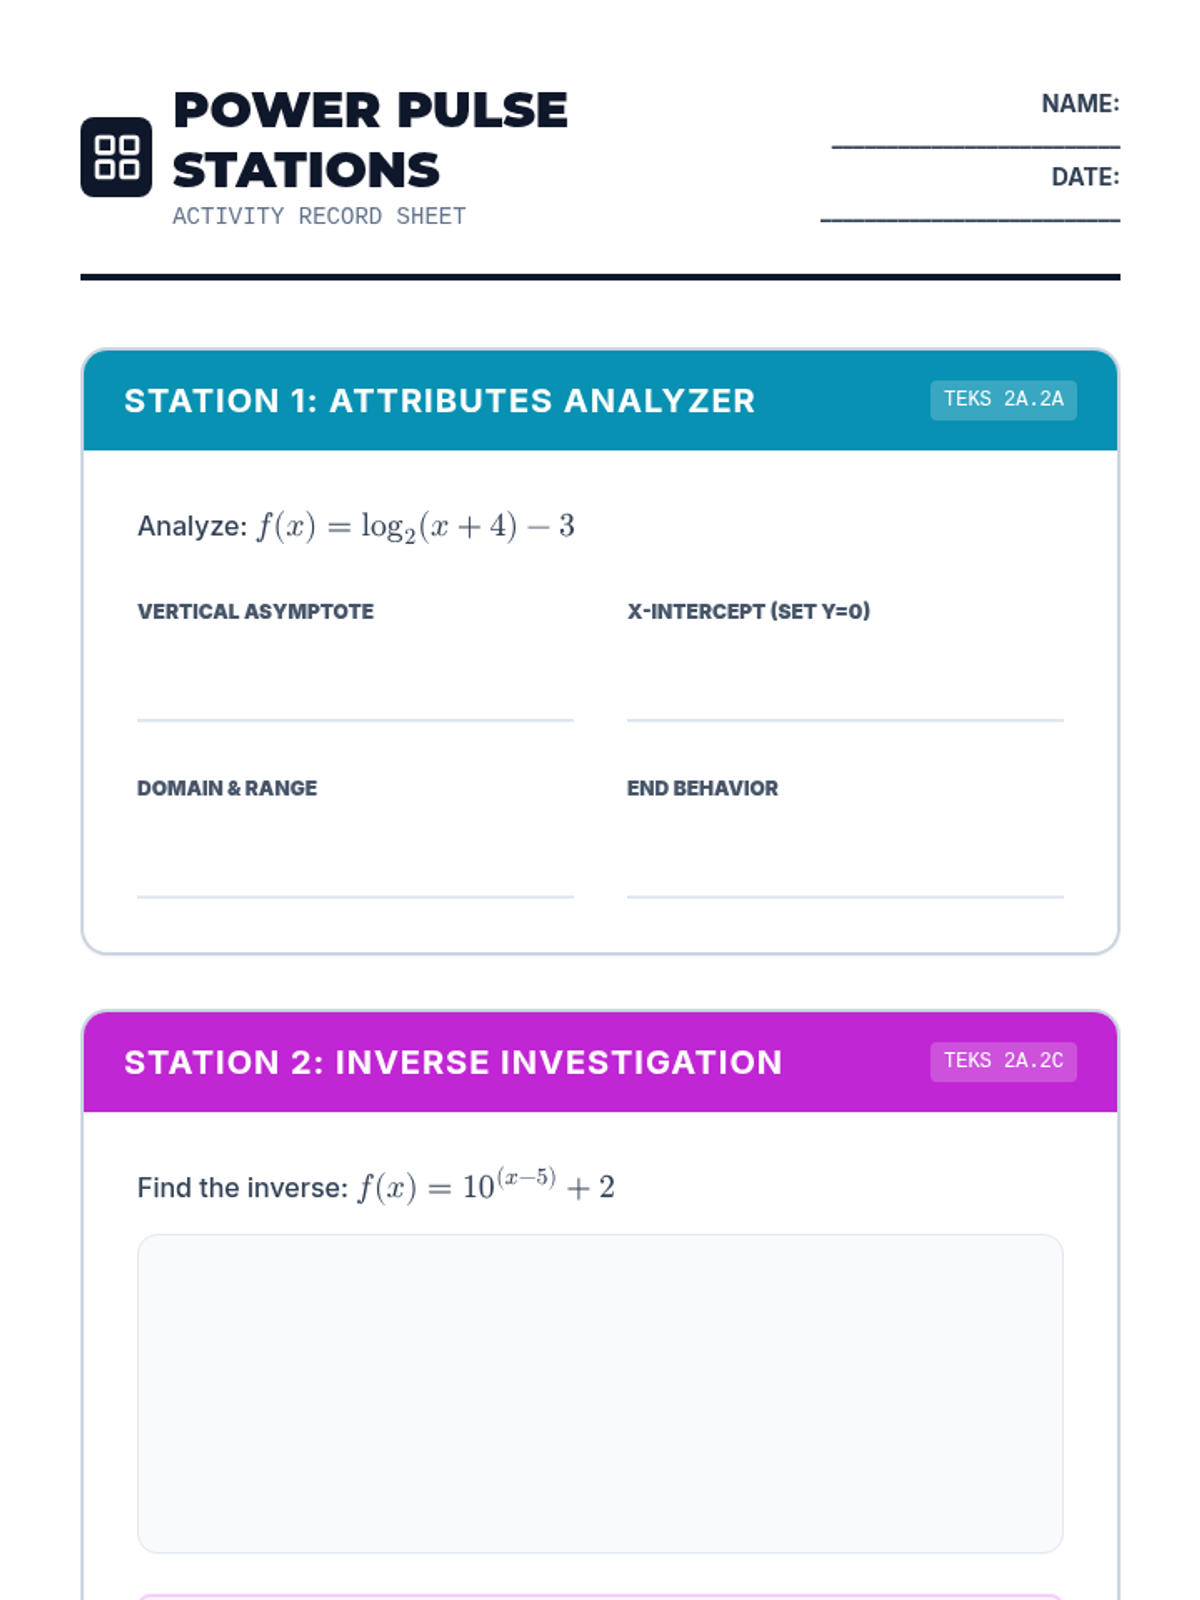
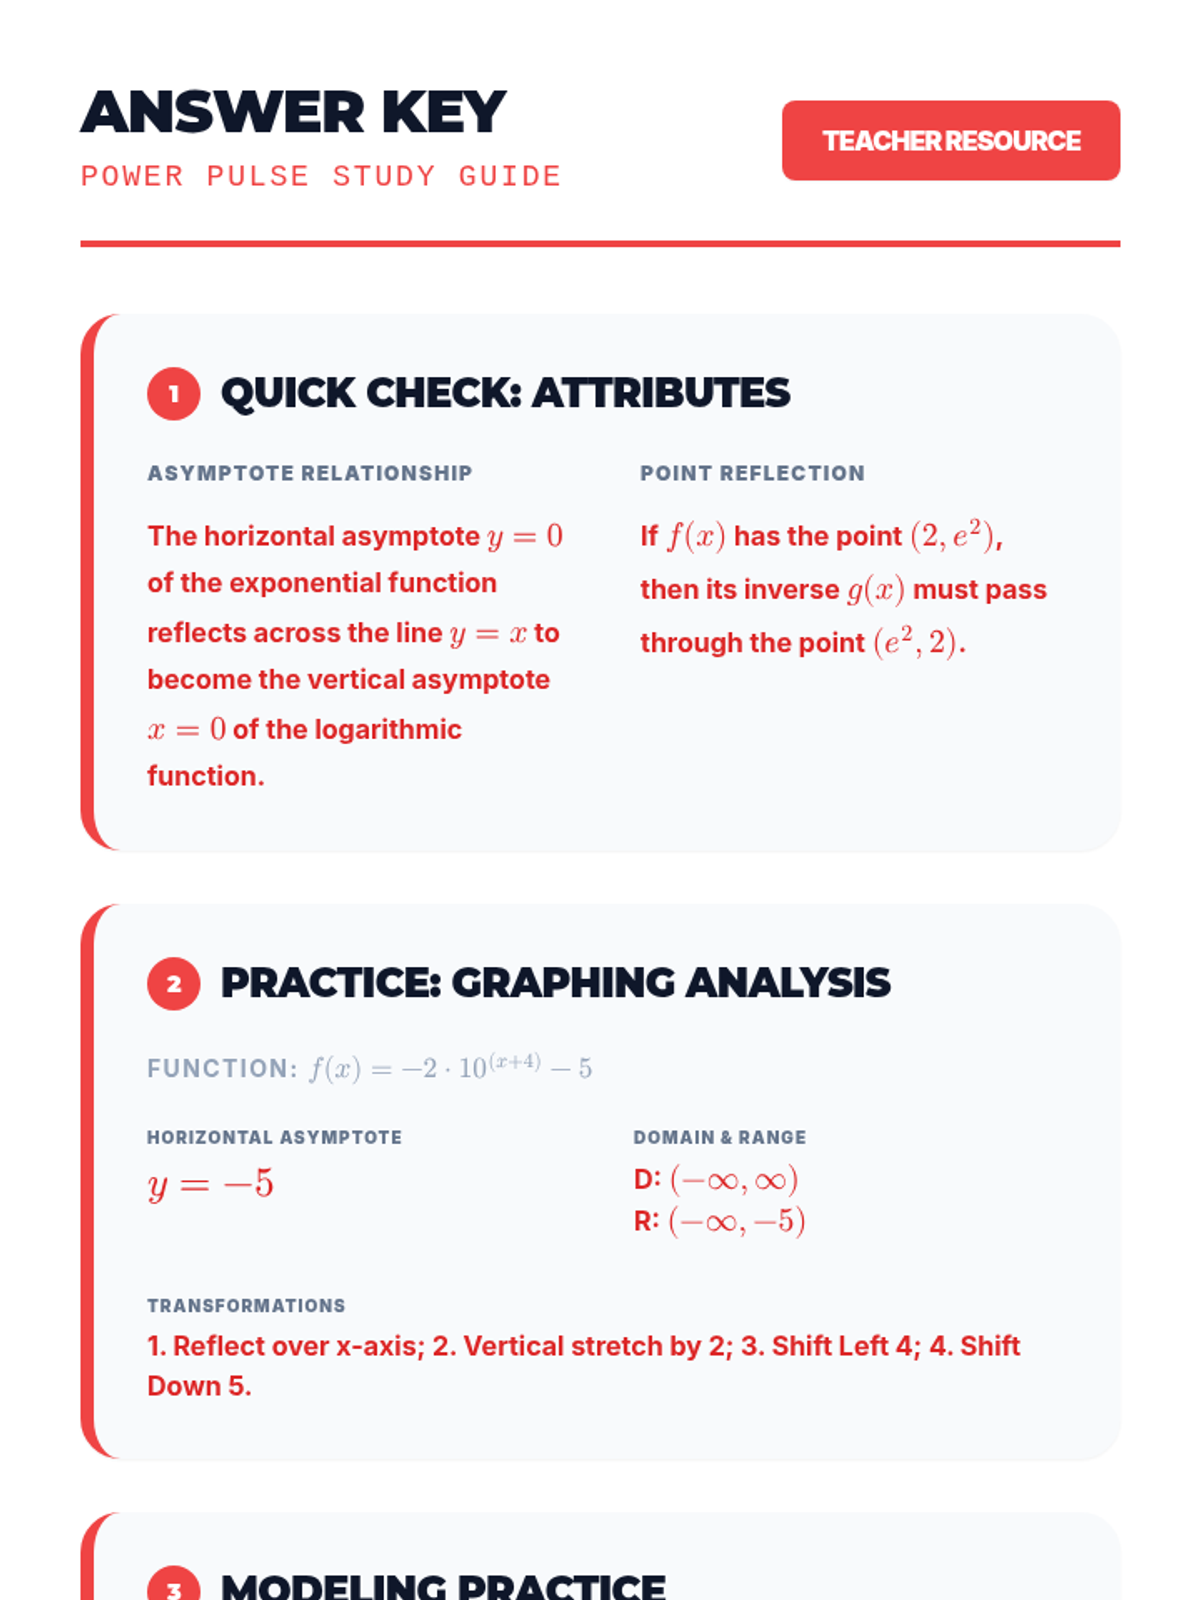
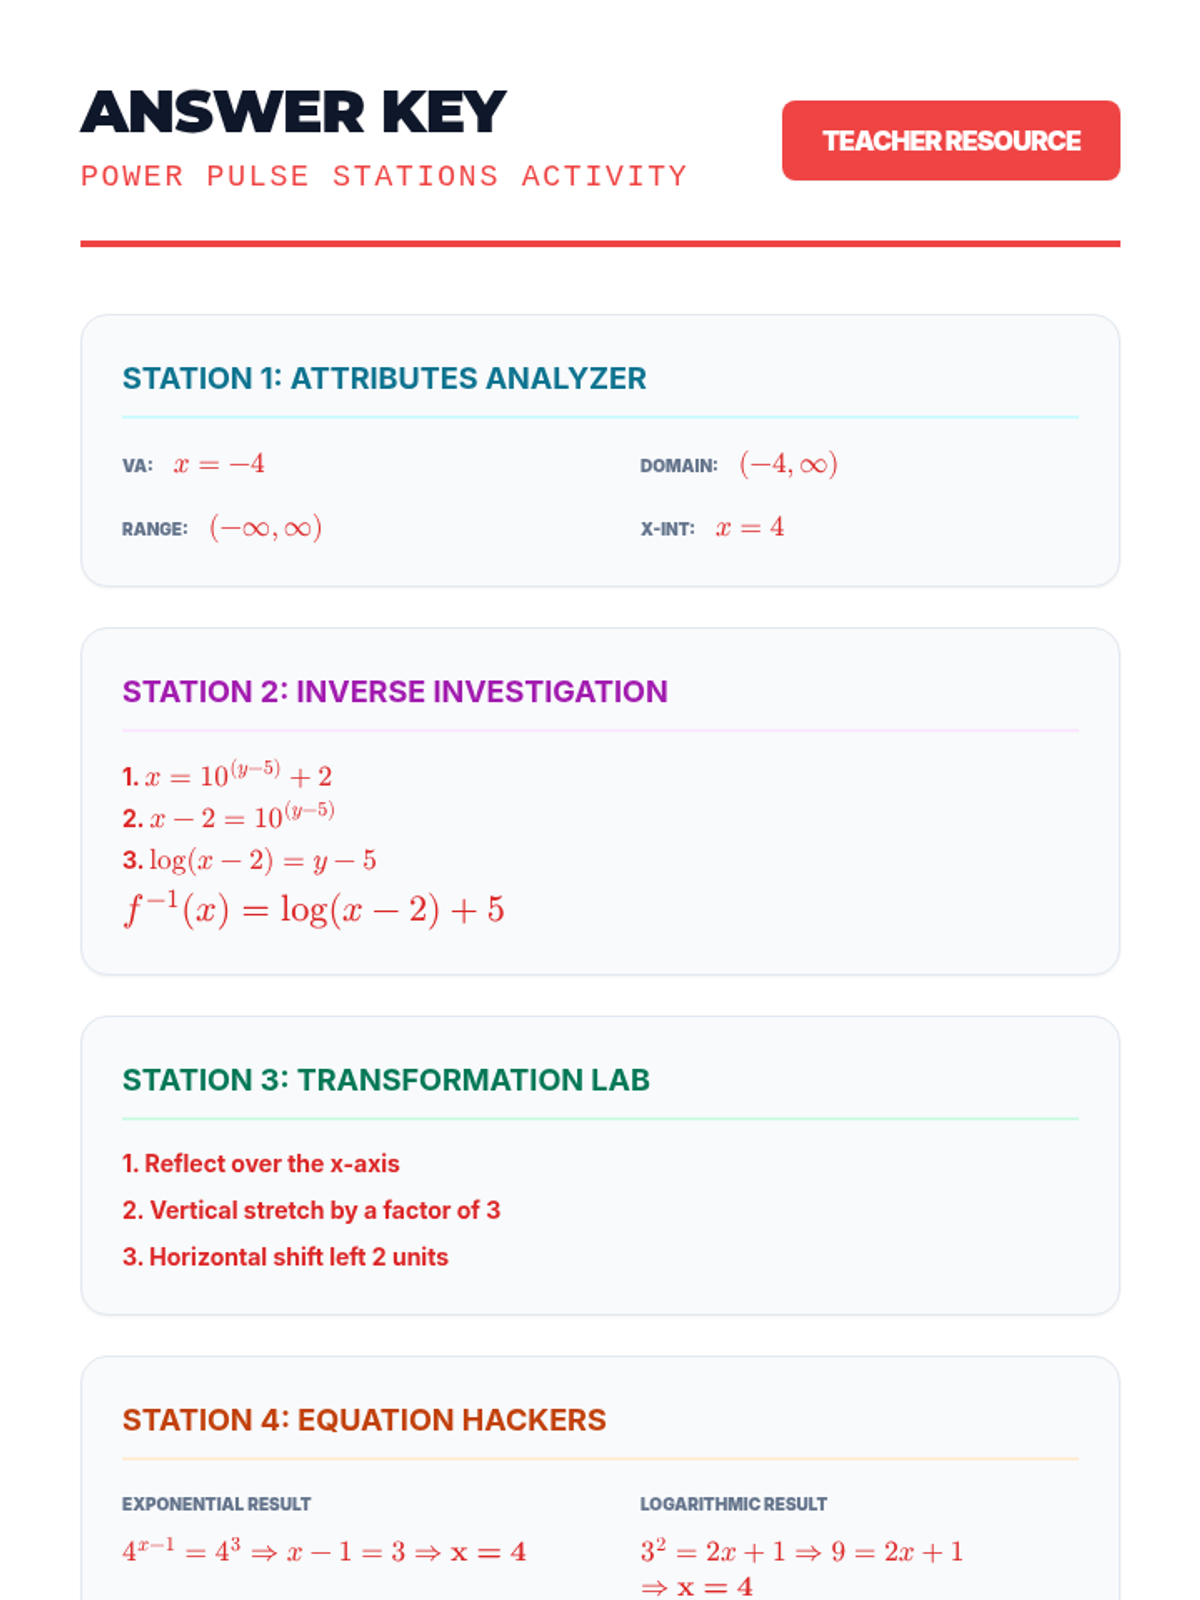
A comprehensive review of exponential and logarithmic functions, focusing on graphing attributes, transformations, inverse relationships, solving equations, and data modeling based on Texas Algebra 2 standards.
A summative assessment covering the identification of graph features and solving quadratic equations using multiple methods.
A comprehensive review of all three methods (graphing, factoring, formula) and identifying key features to prepare for the unit assessment.
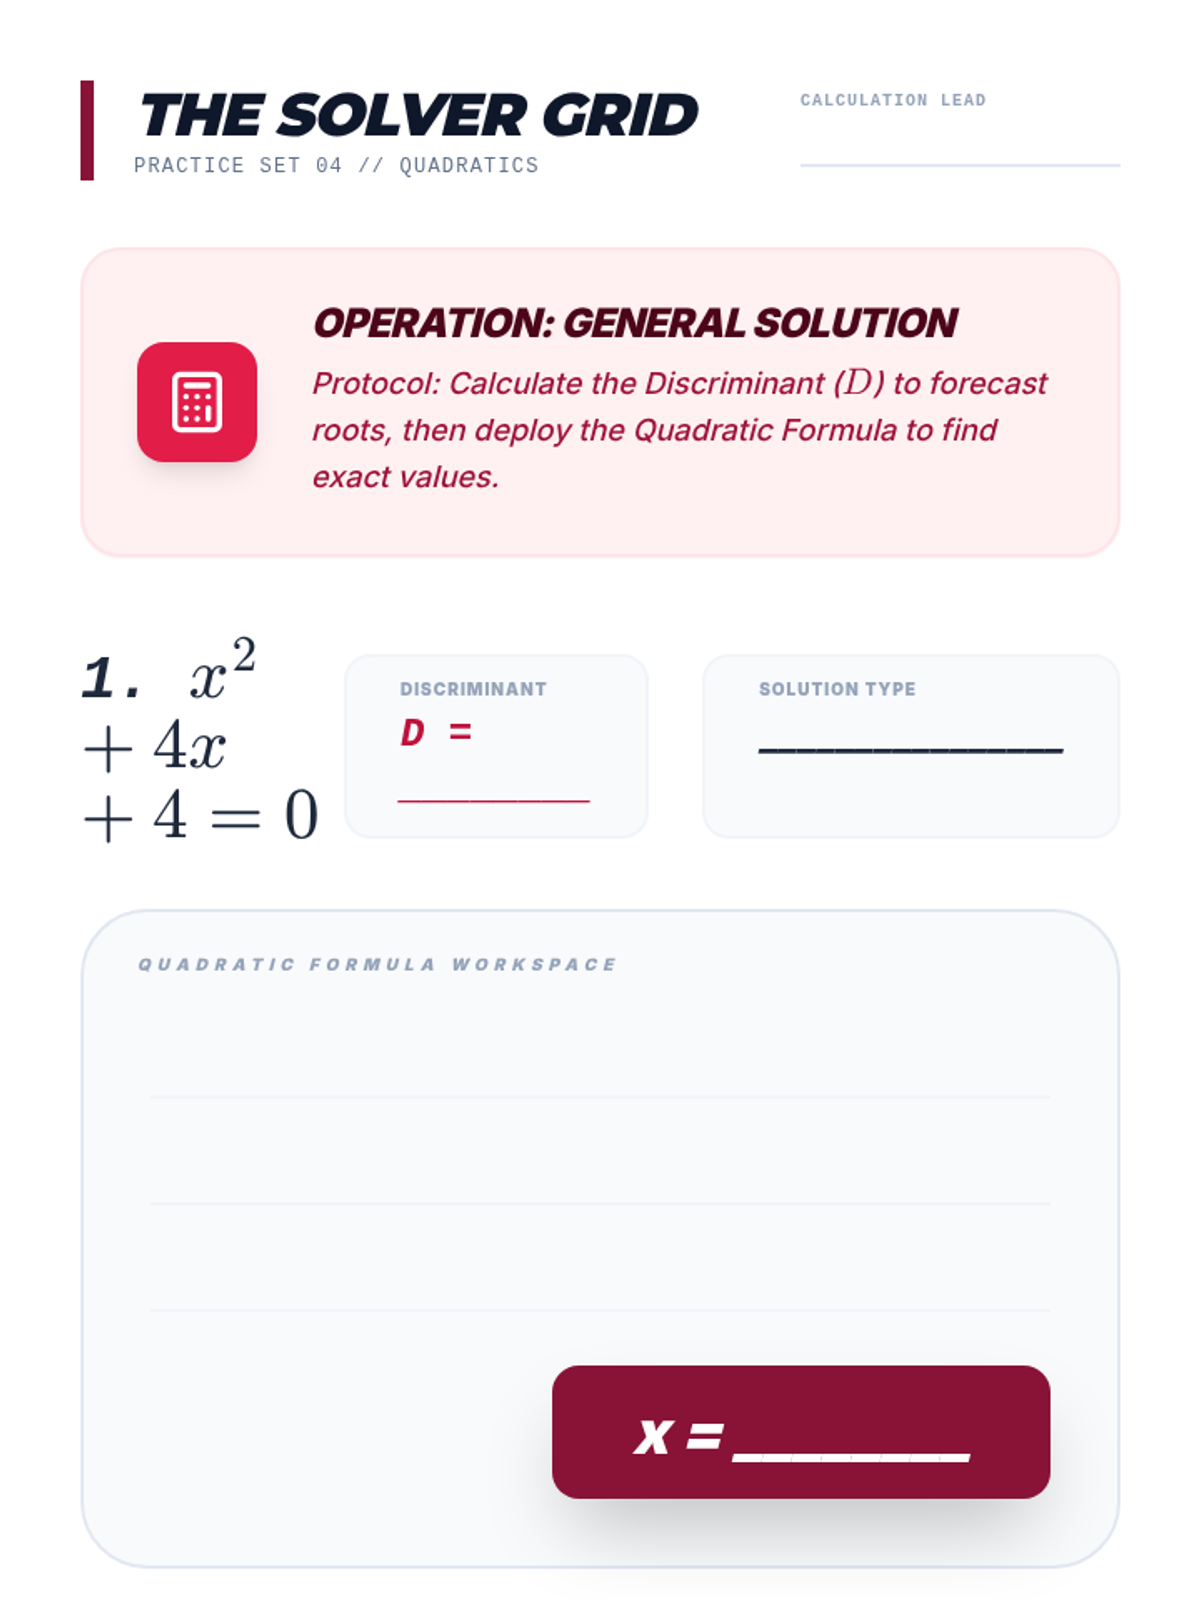
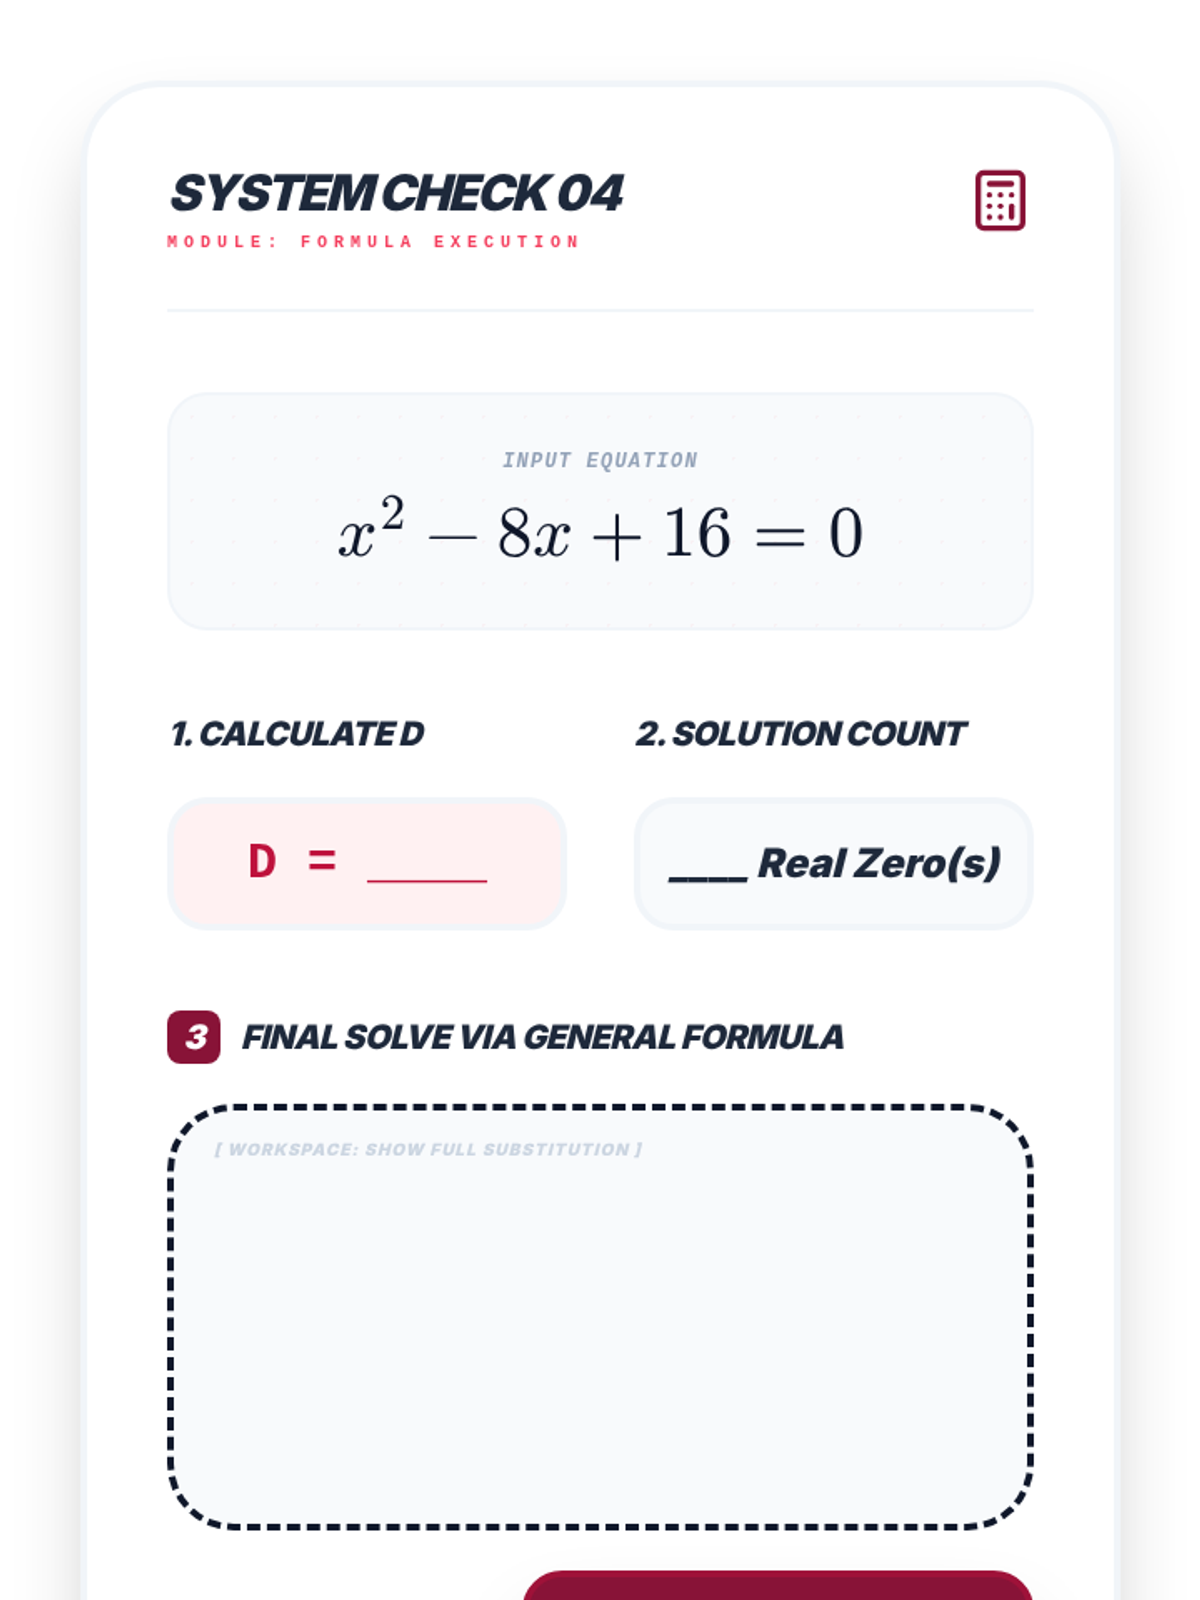
Students use the quadratic formula to solve equations that are not easily factorable, with an emphasis on identifying coefficients and simplifying the result.
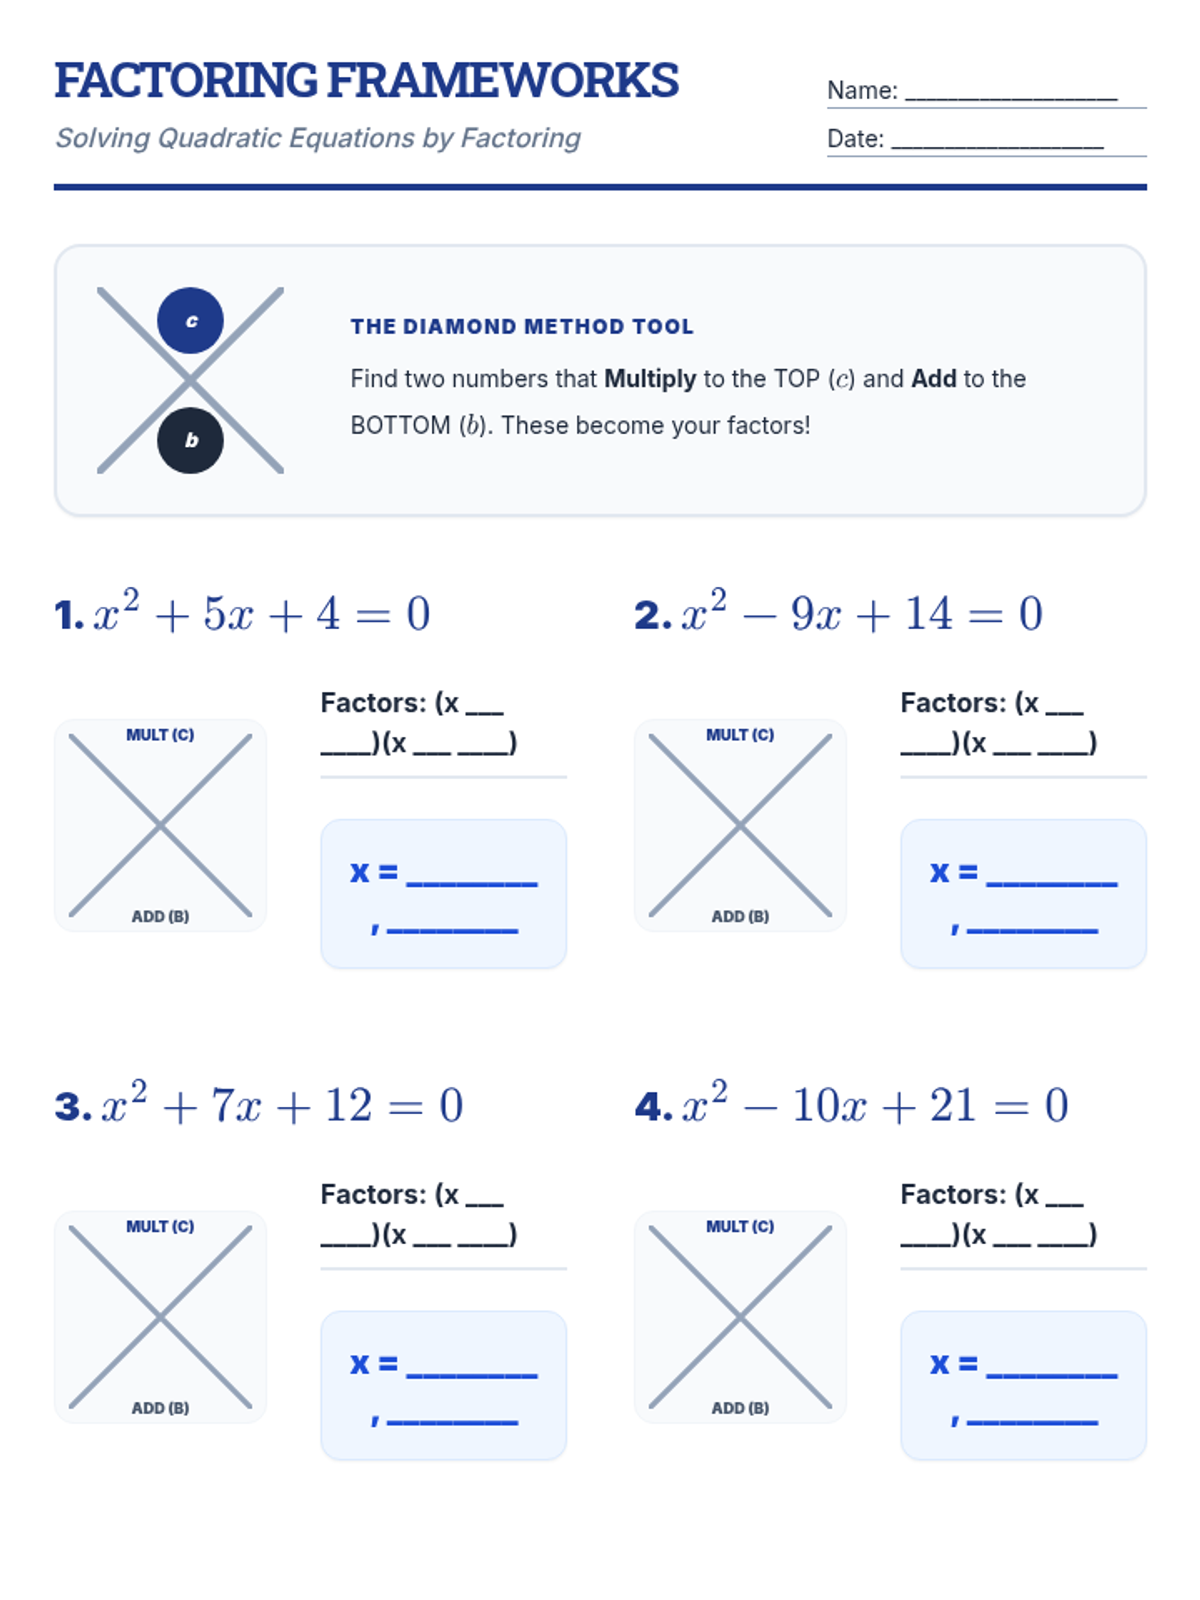
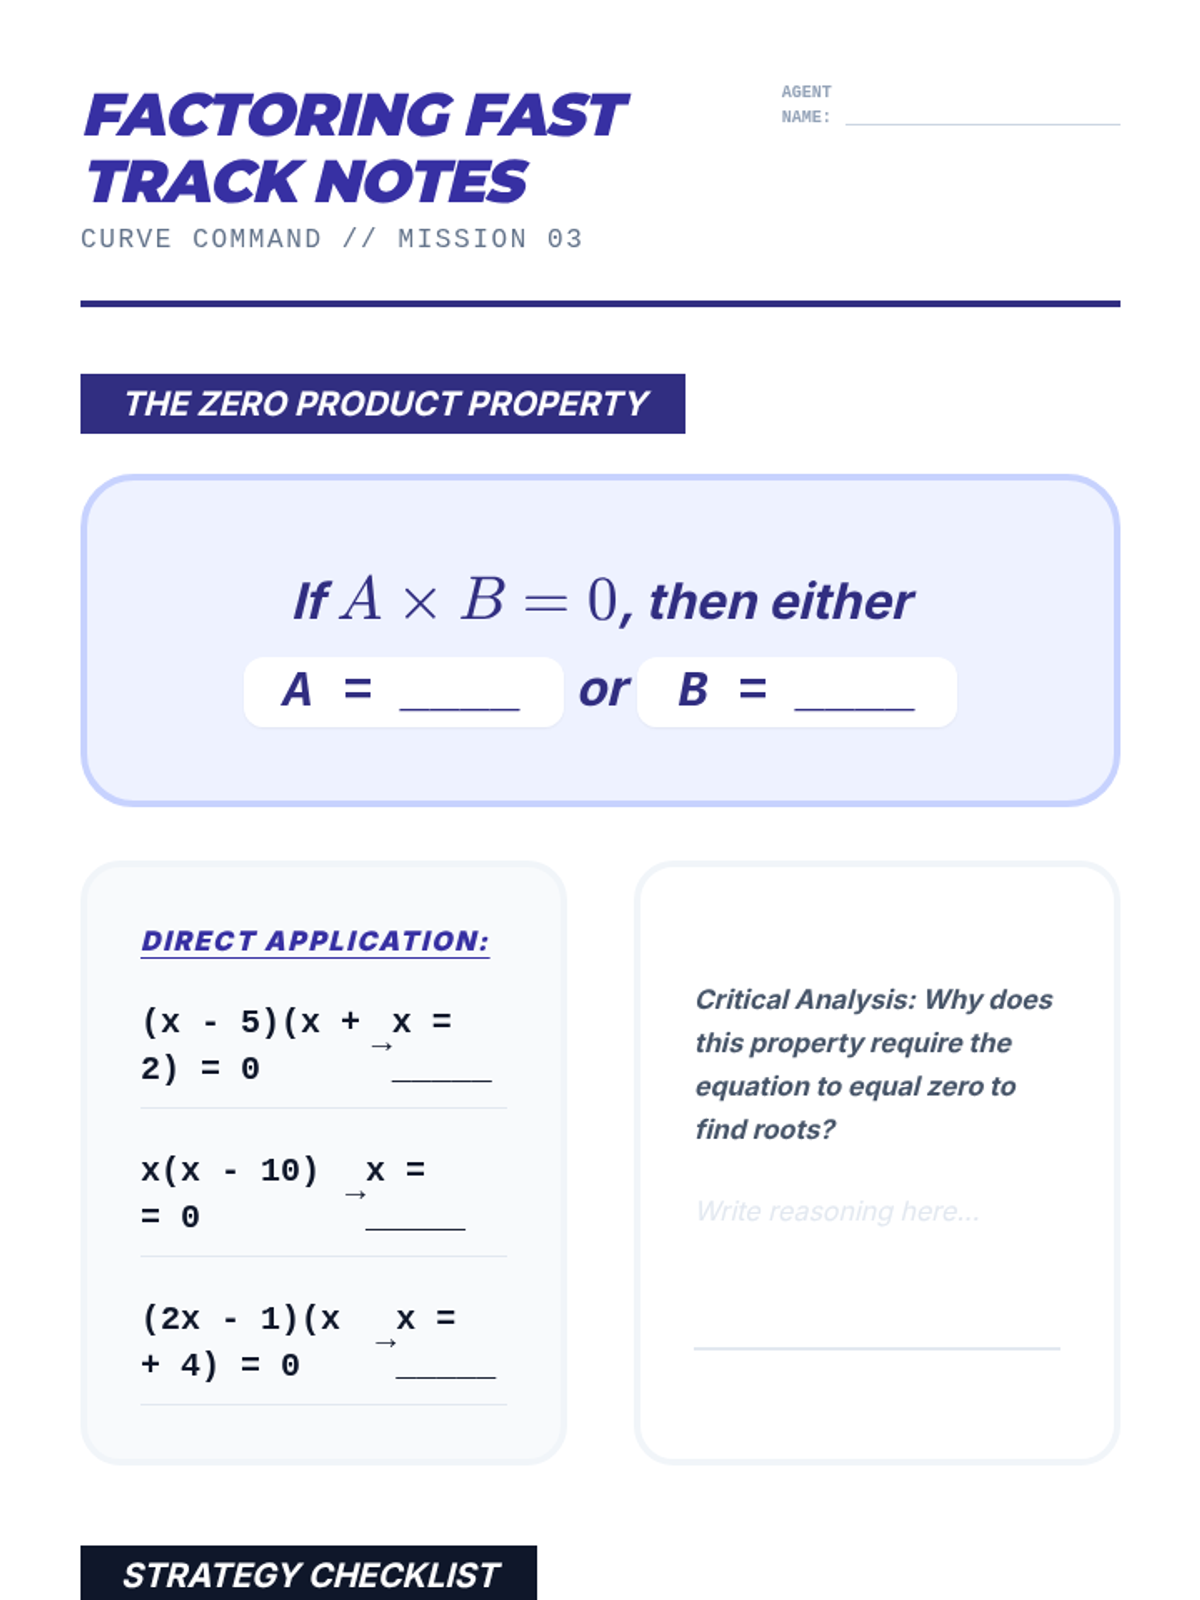
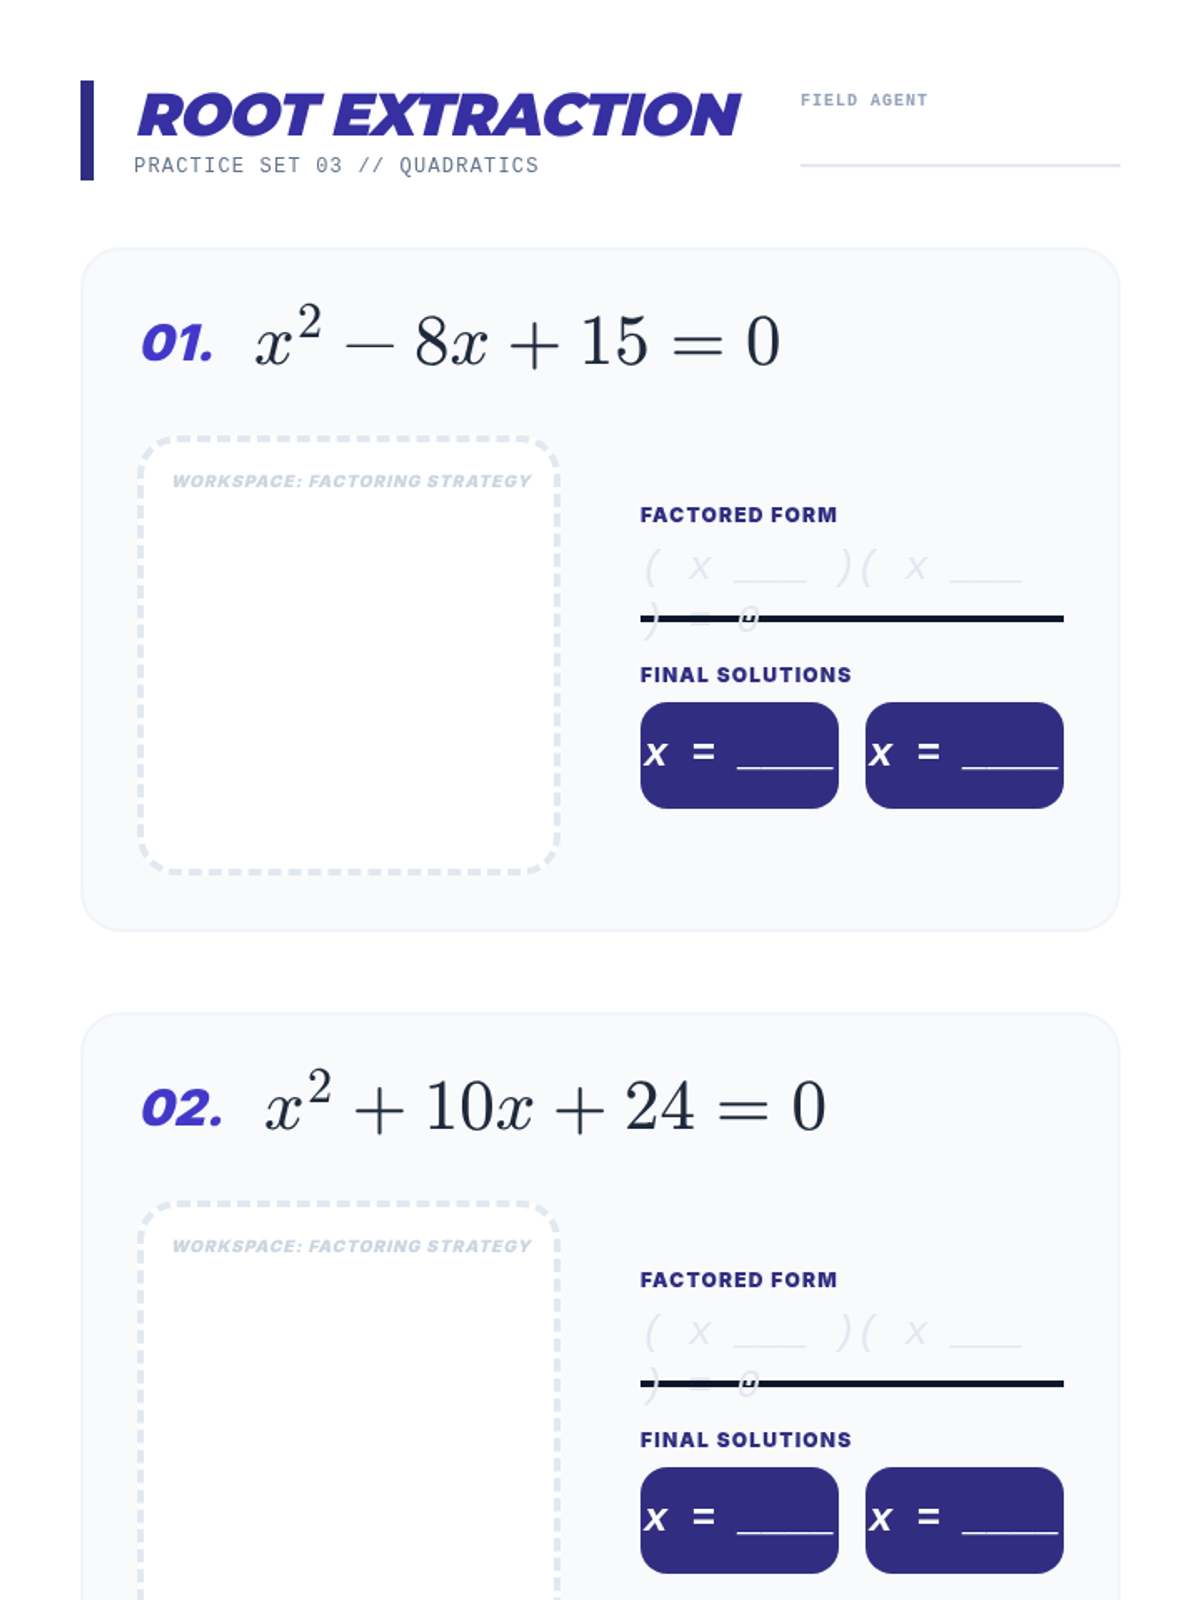
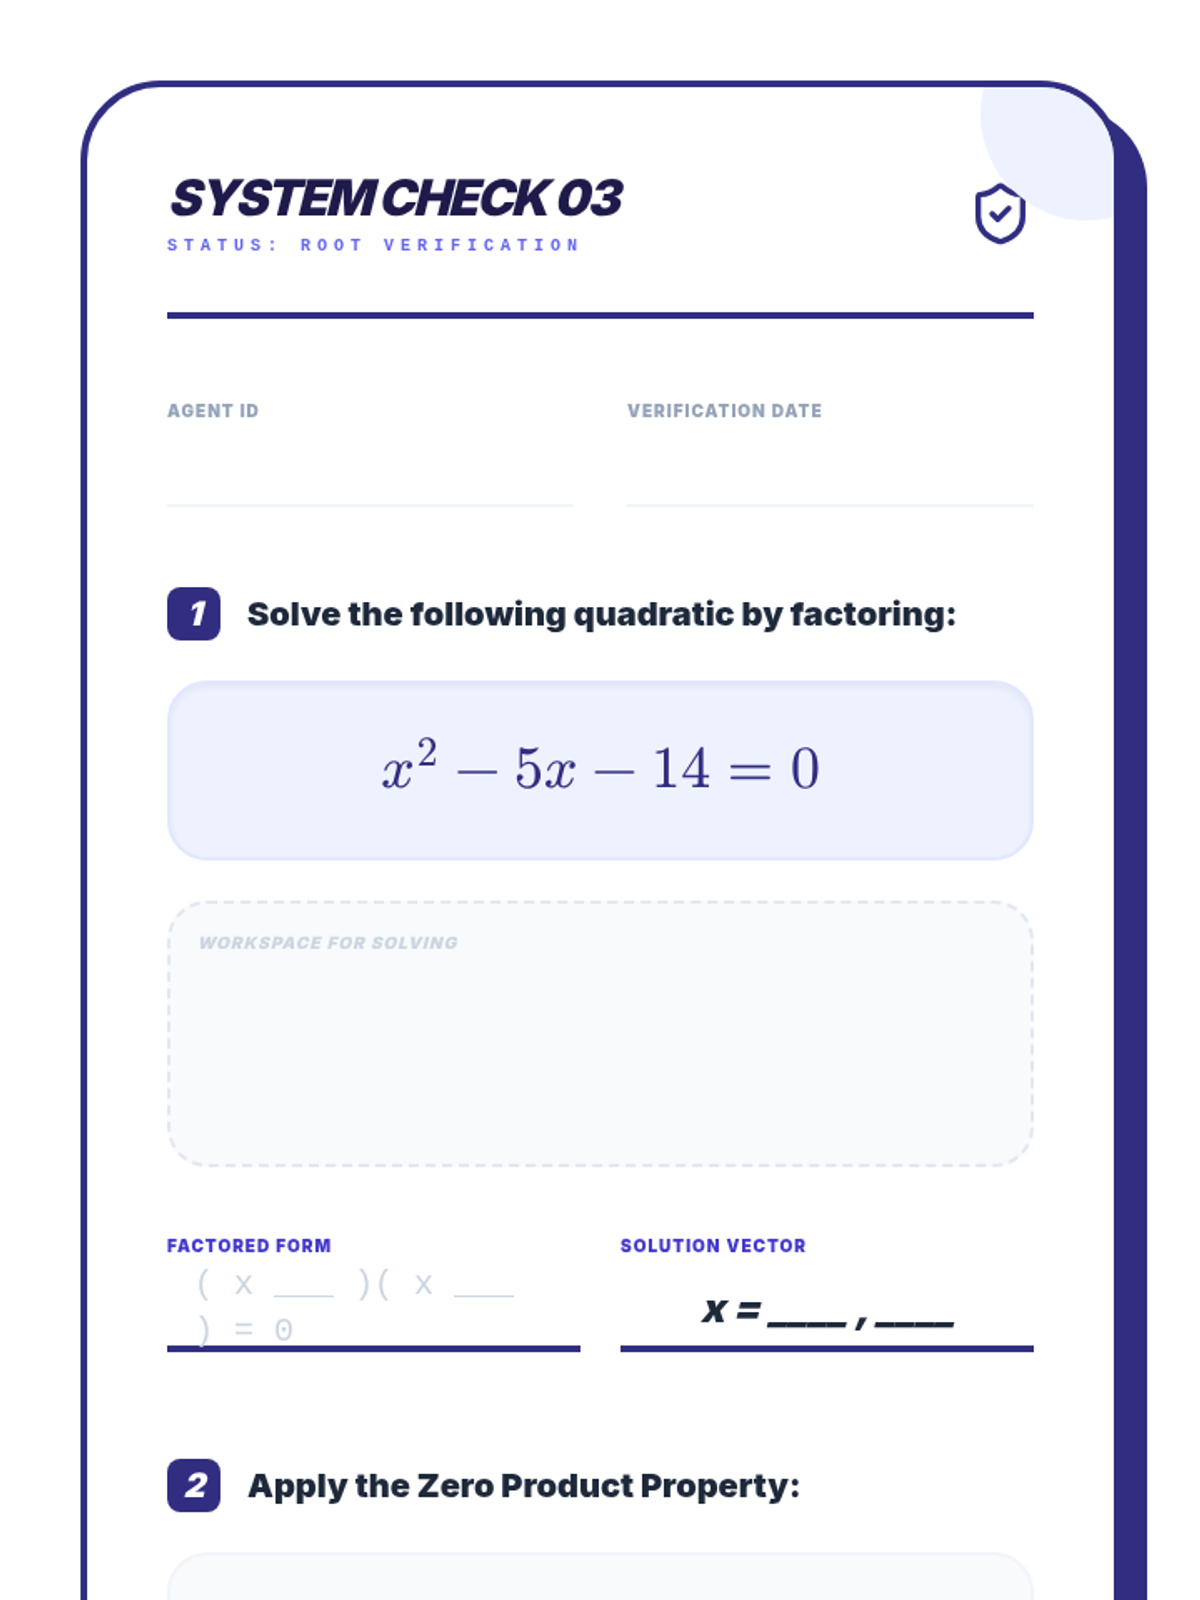
Students learn to solve quadratic equations by factoring trinomials and using the Zero Product Property, focusing on real roots and equations in standard form.
Students explore the quadratic parent function, identify key features of parabolas (vertex, axis of symmetry, zeros), and learn to graph by plotting points.
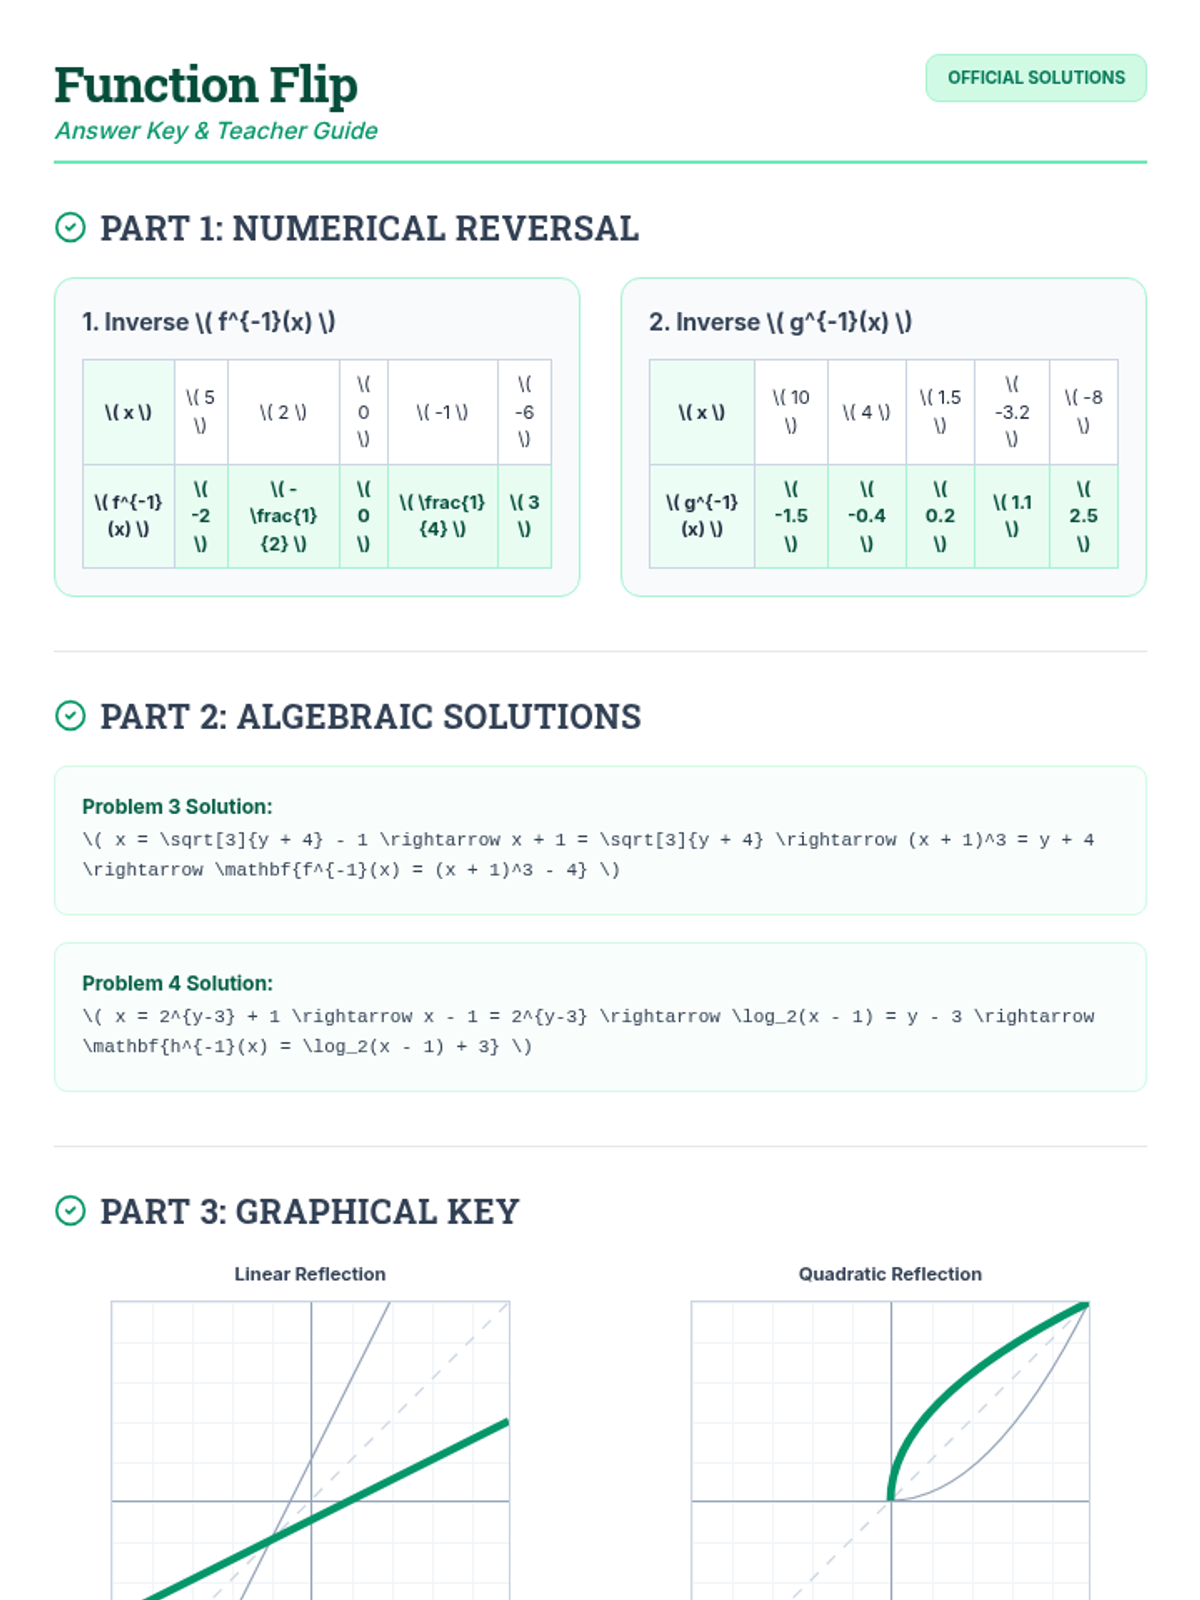
A lesson focused on understanding and calculating inverse functions through multiple representations: numerical tables, algebraic equations, and graphical reflections. Students will practice reversing operations and reflecting functions across the line y=x.
A comprehensive guide to solving exponential and logarithmic equations using common bases and property-based manipulation. Students will master converting between forms and applying product, quotient, and power rules.
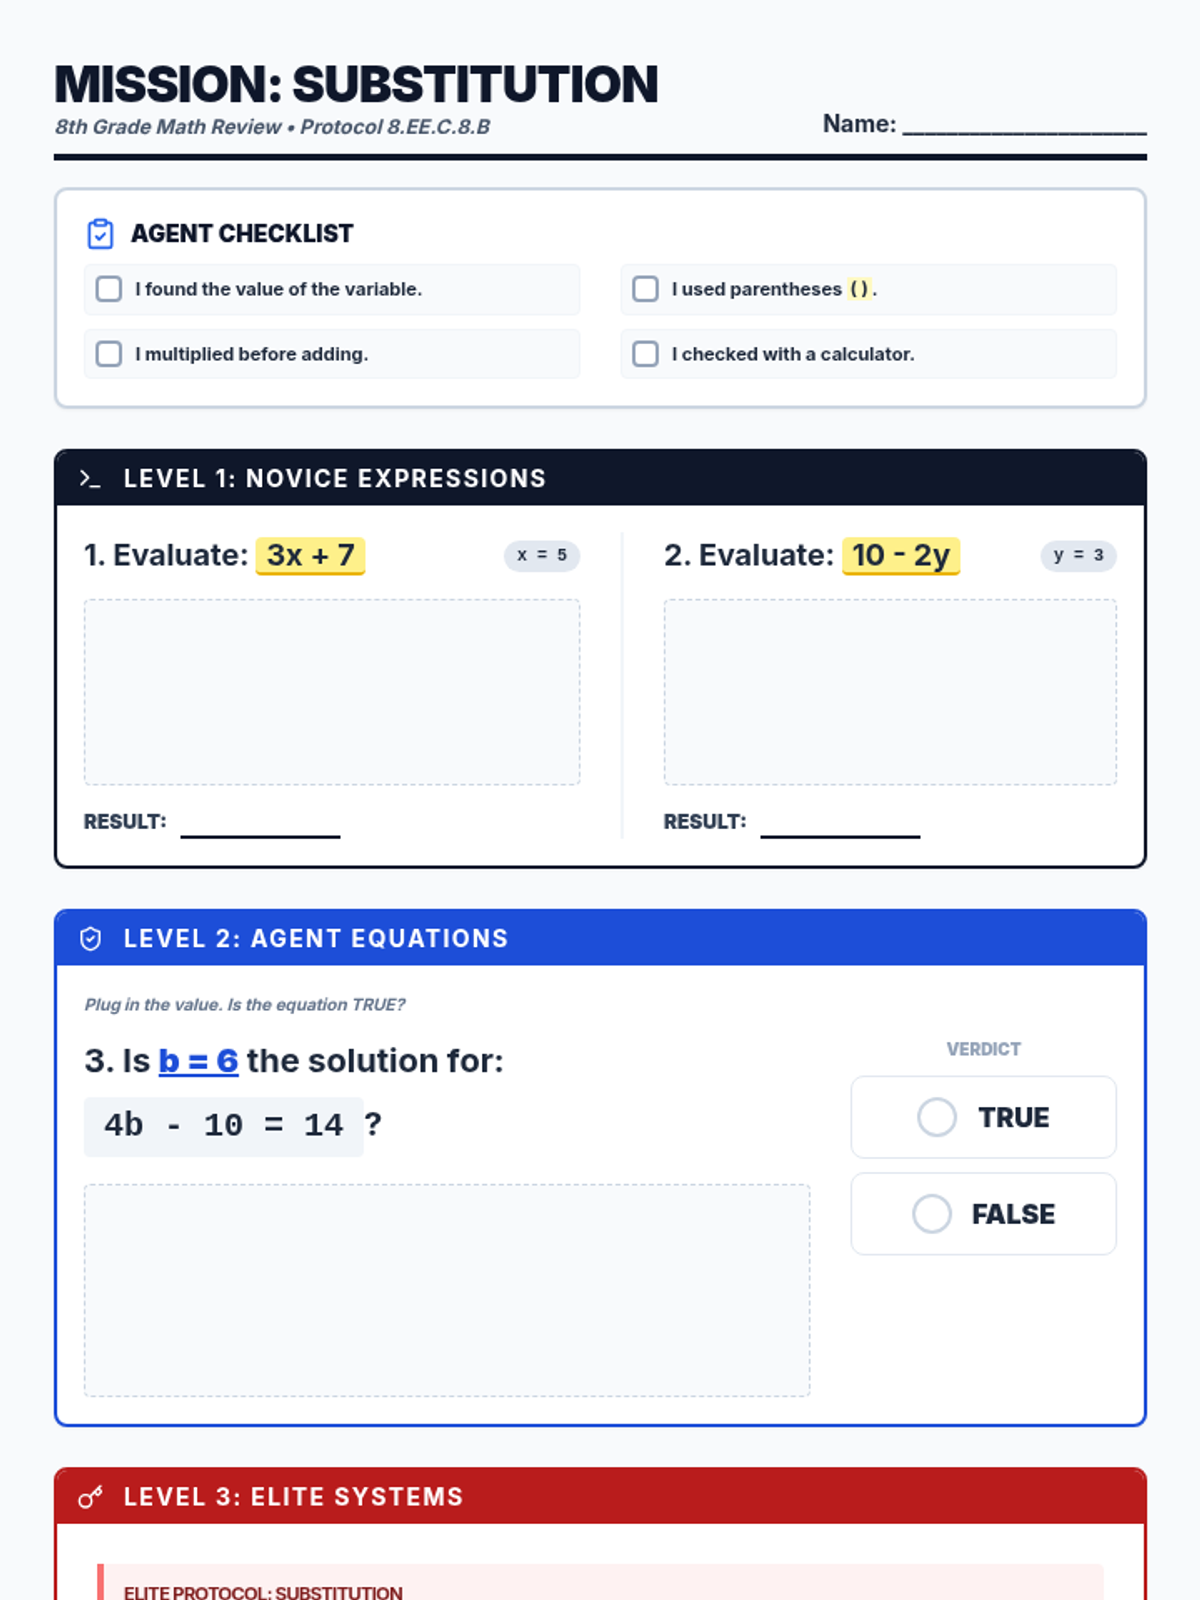
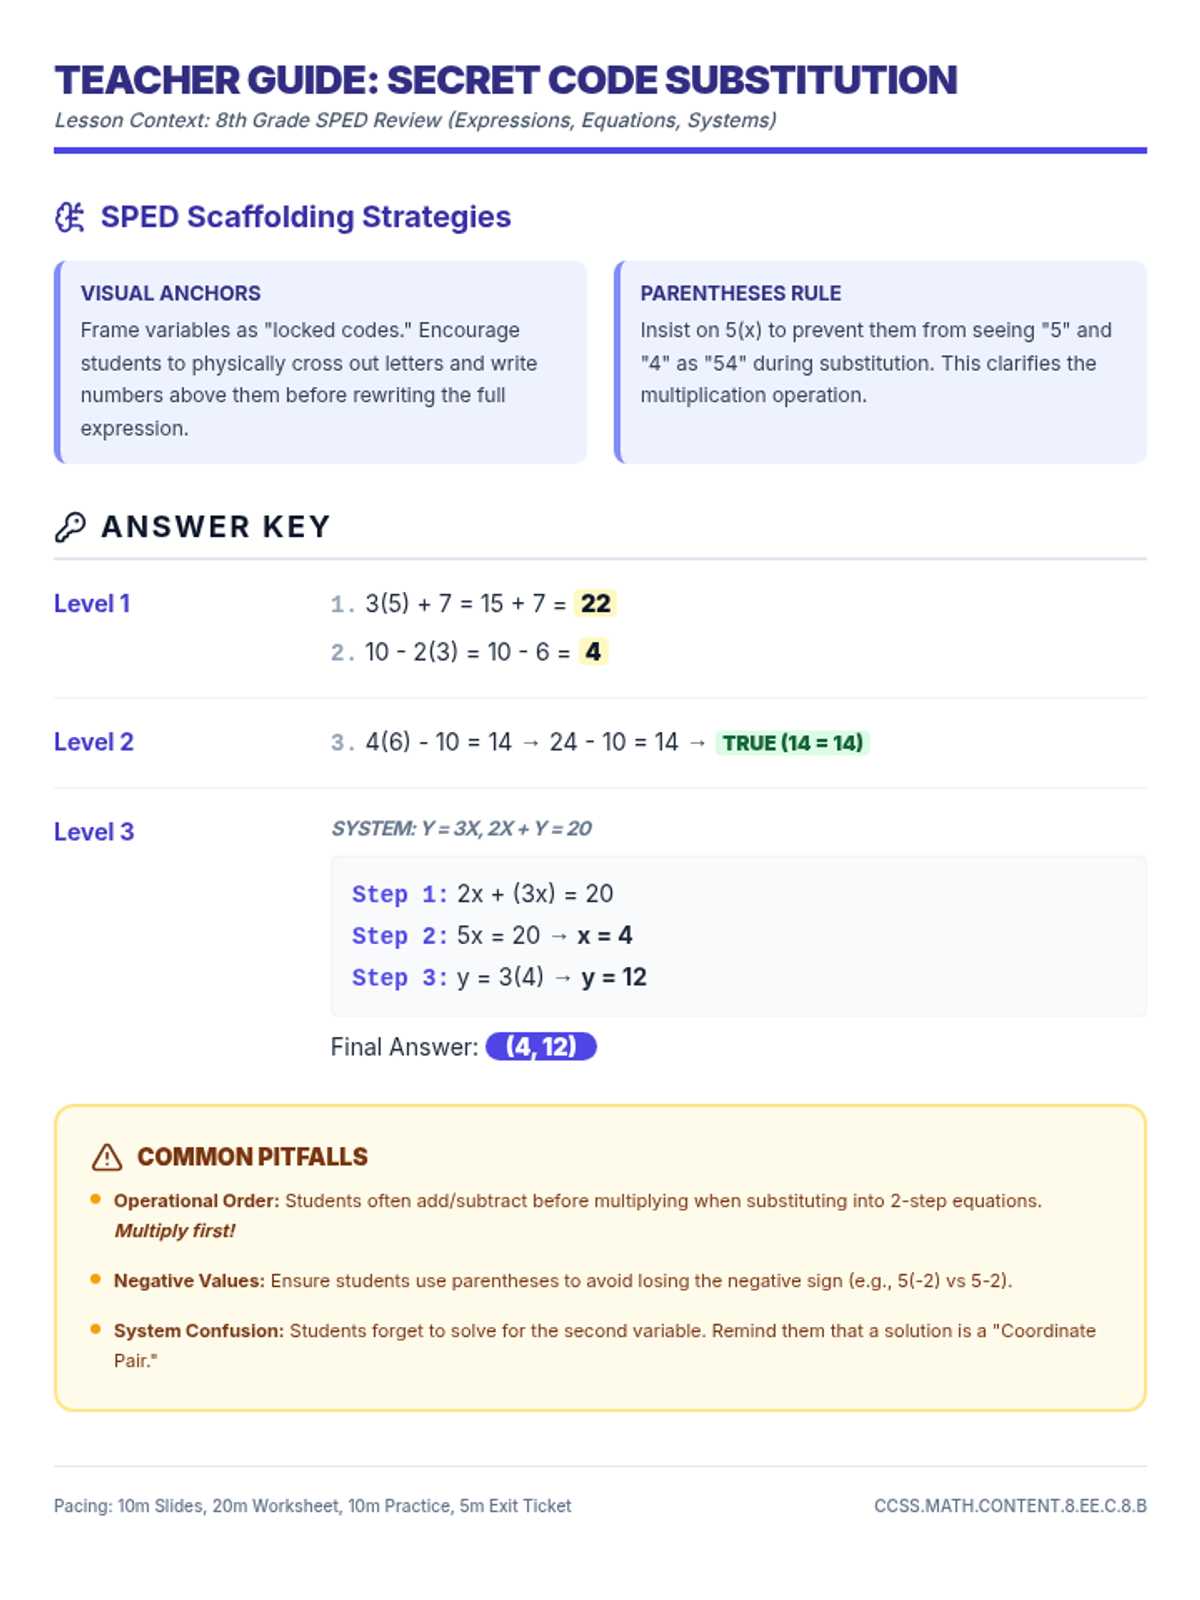
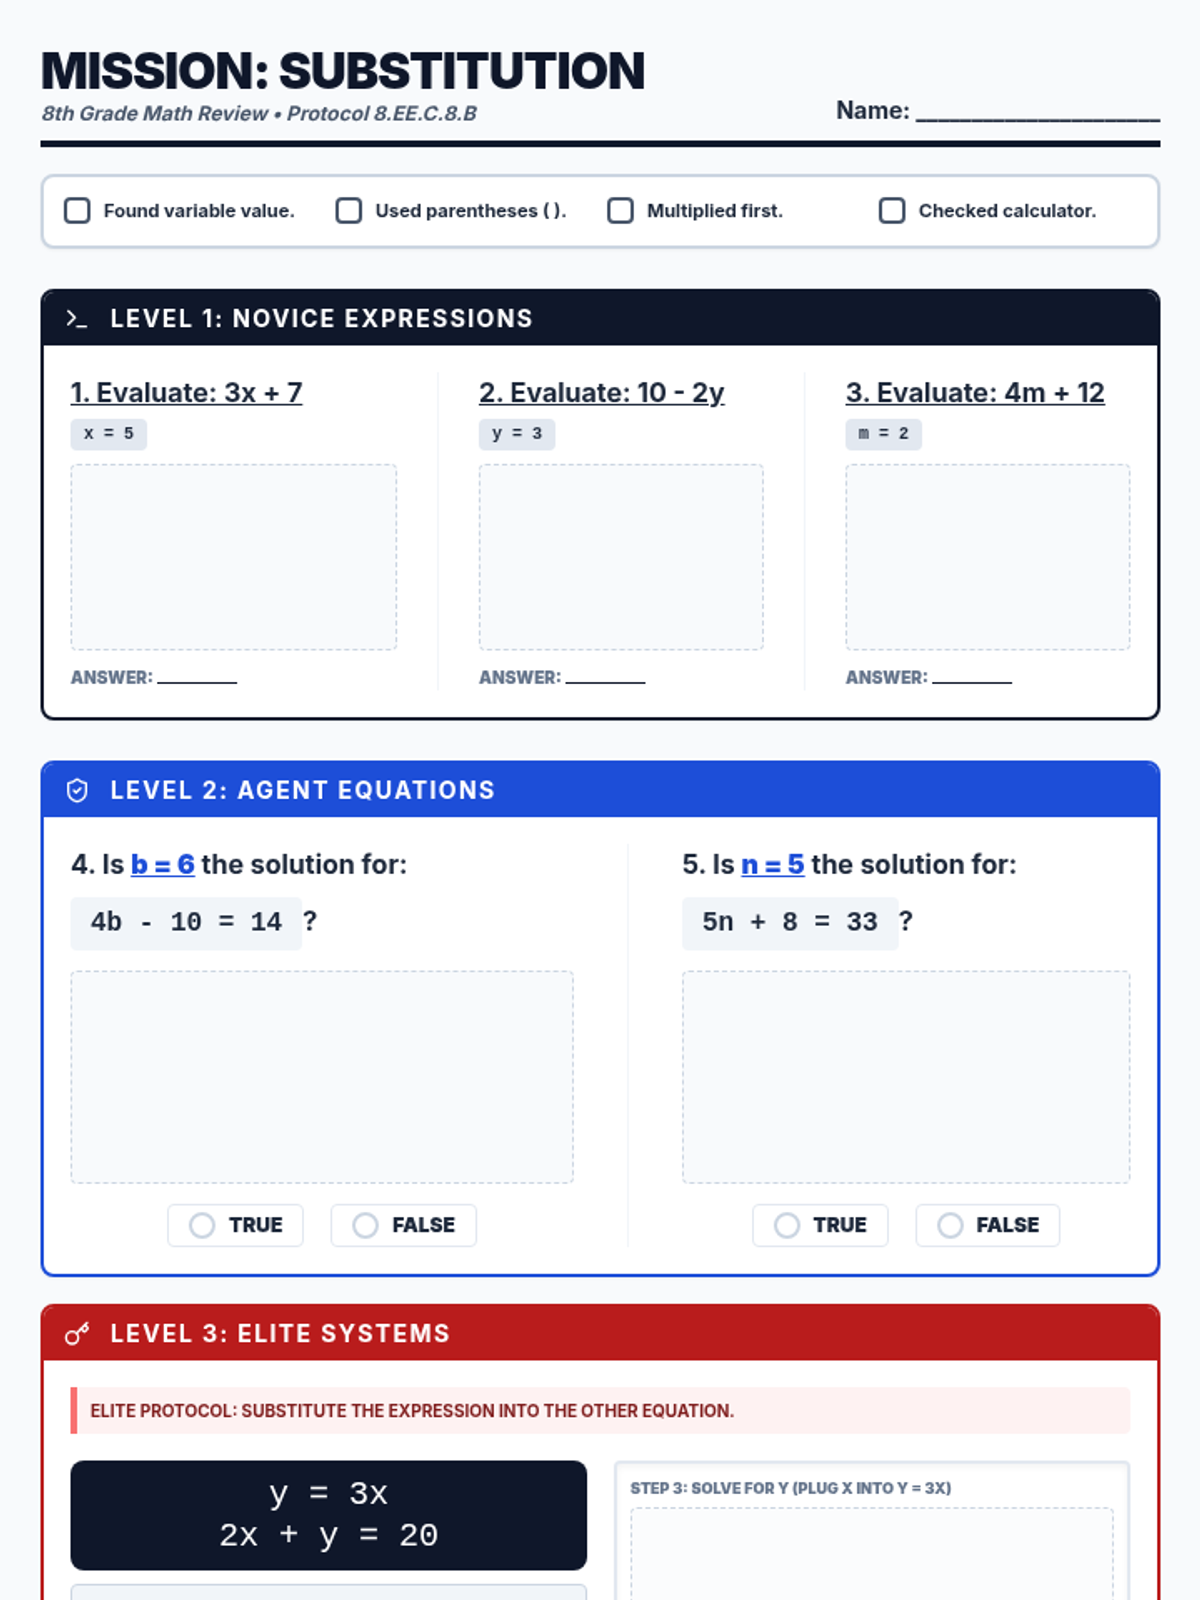
A focused math mini-lesson designed for 8th-grade special education students to review substitution across three levels: expressions, 2-step equations, and systems of equations. The lesson uses a 'Code Breaker' theme to make the abstract concepts more concrete and engaging.
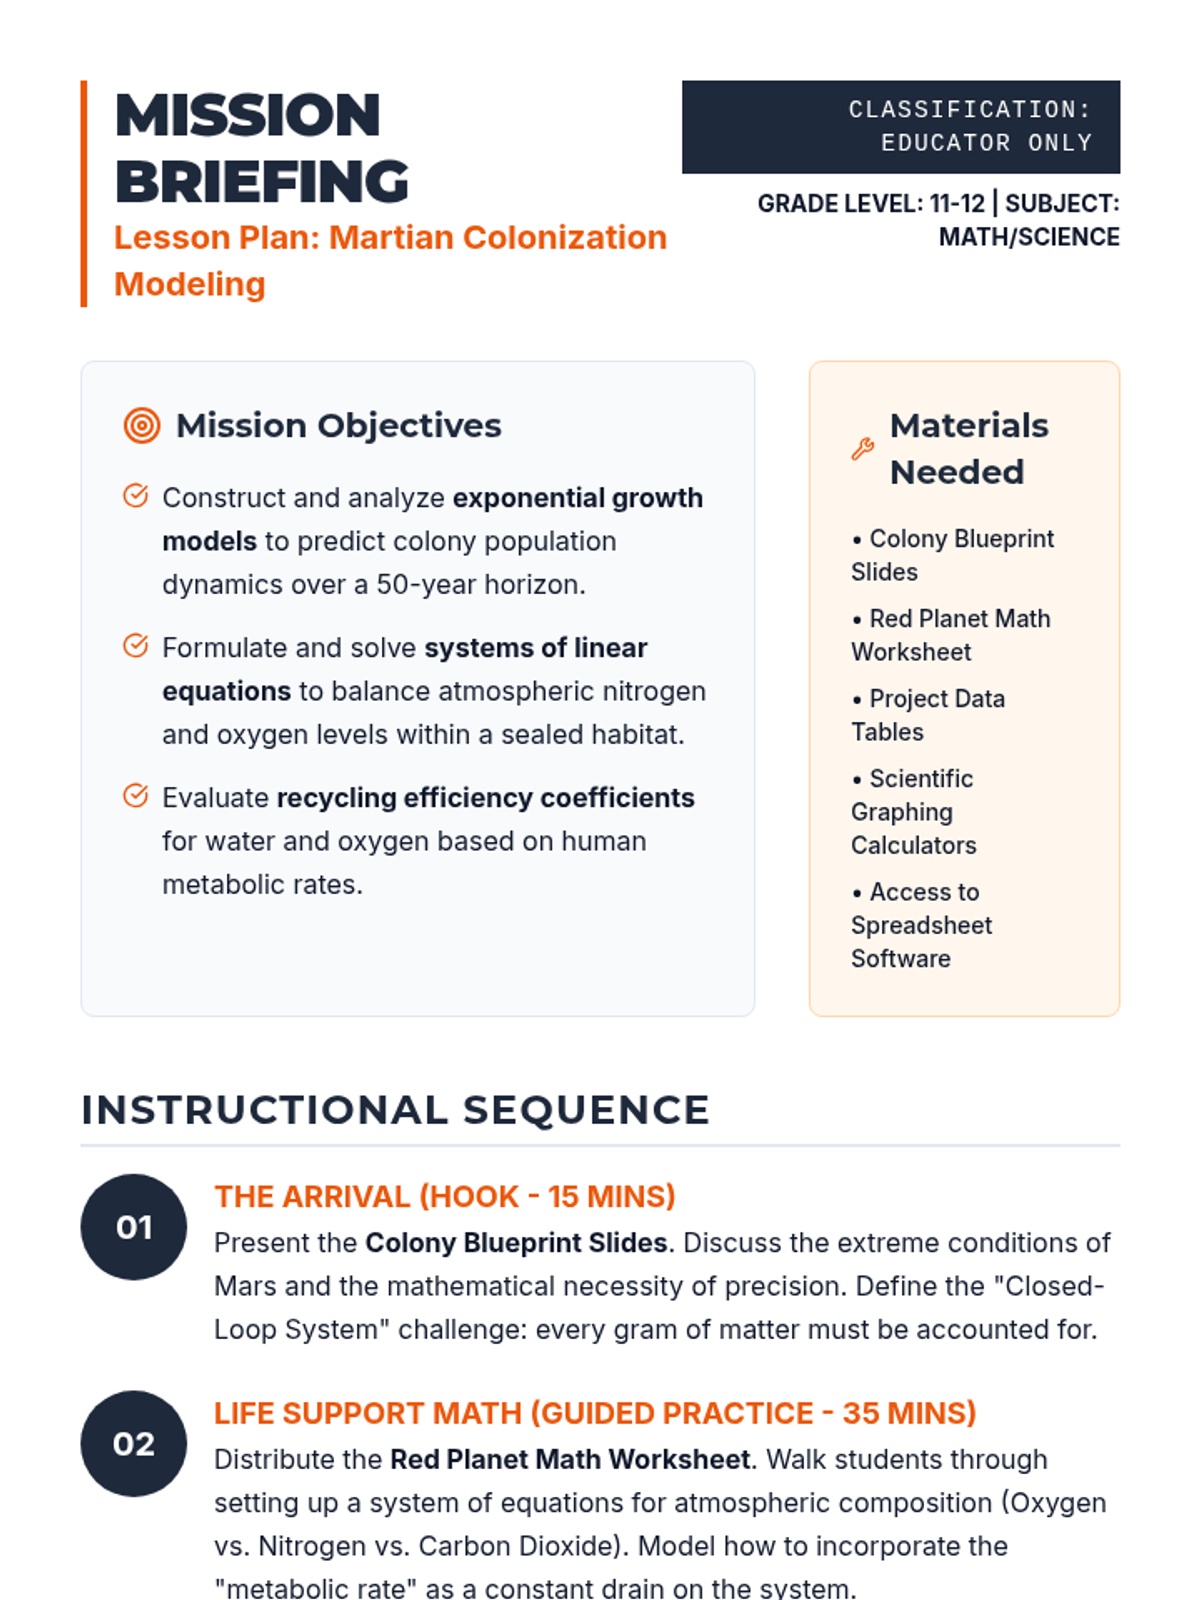
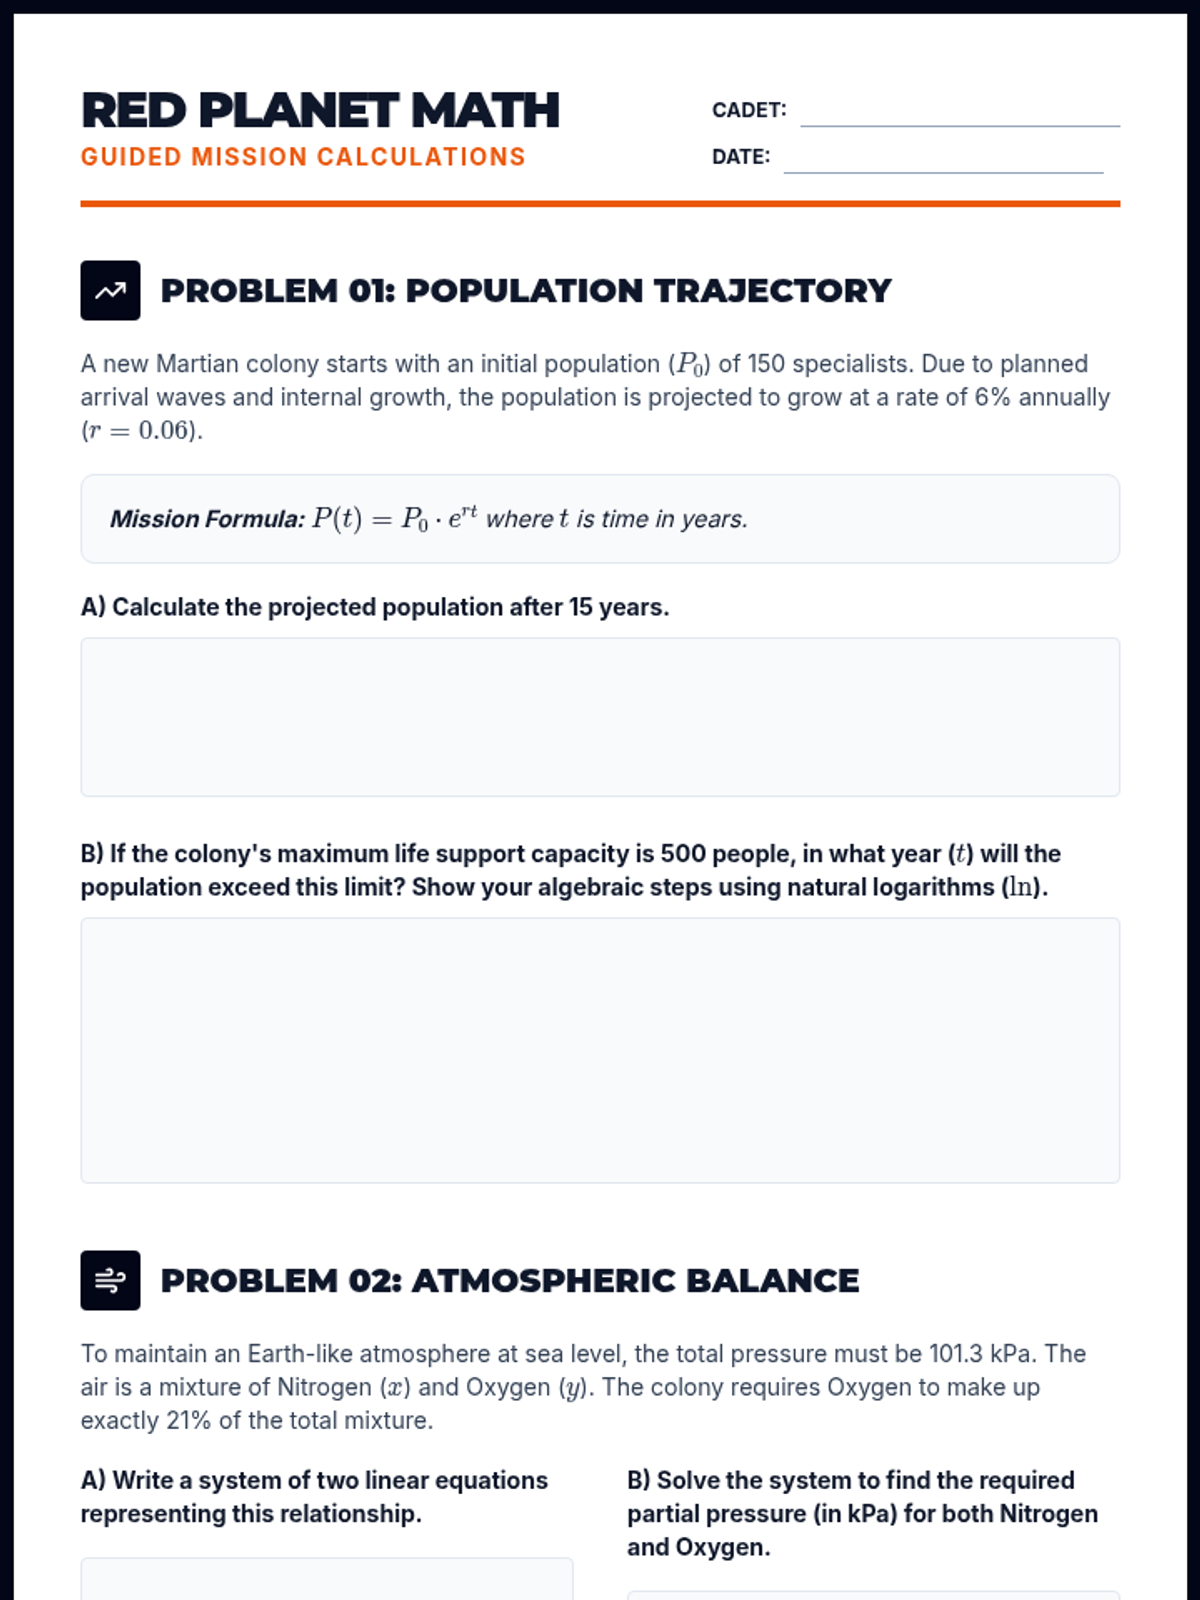
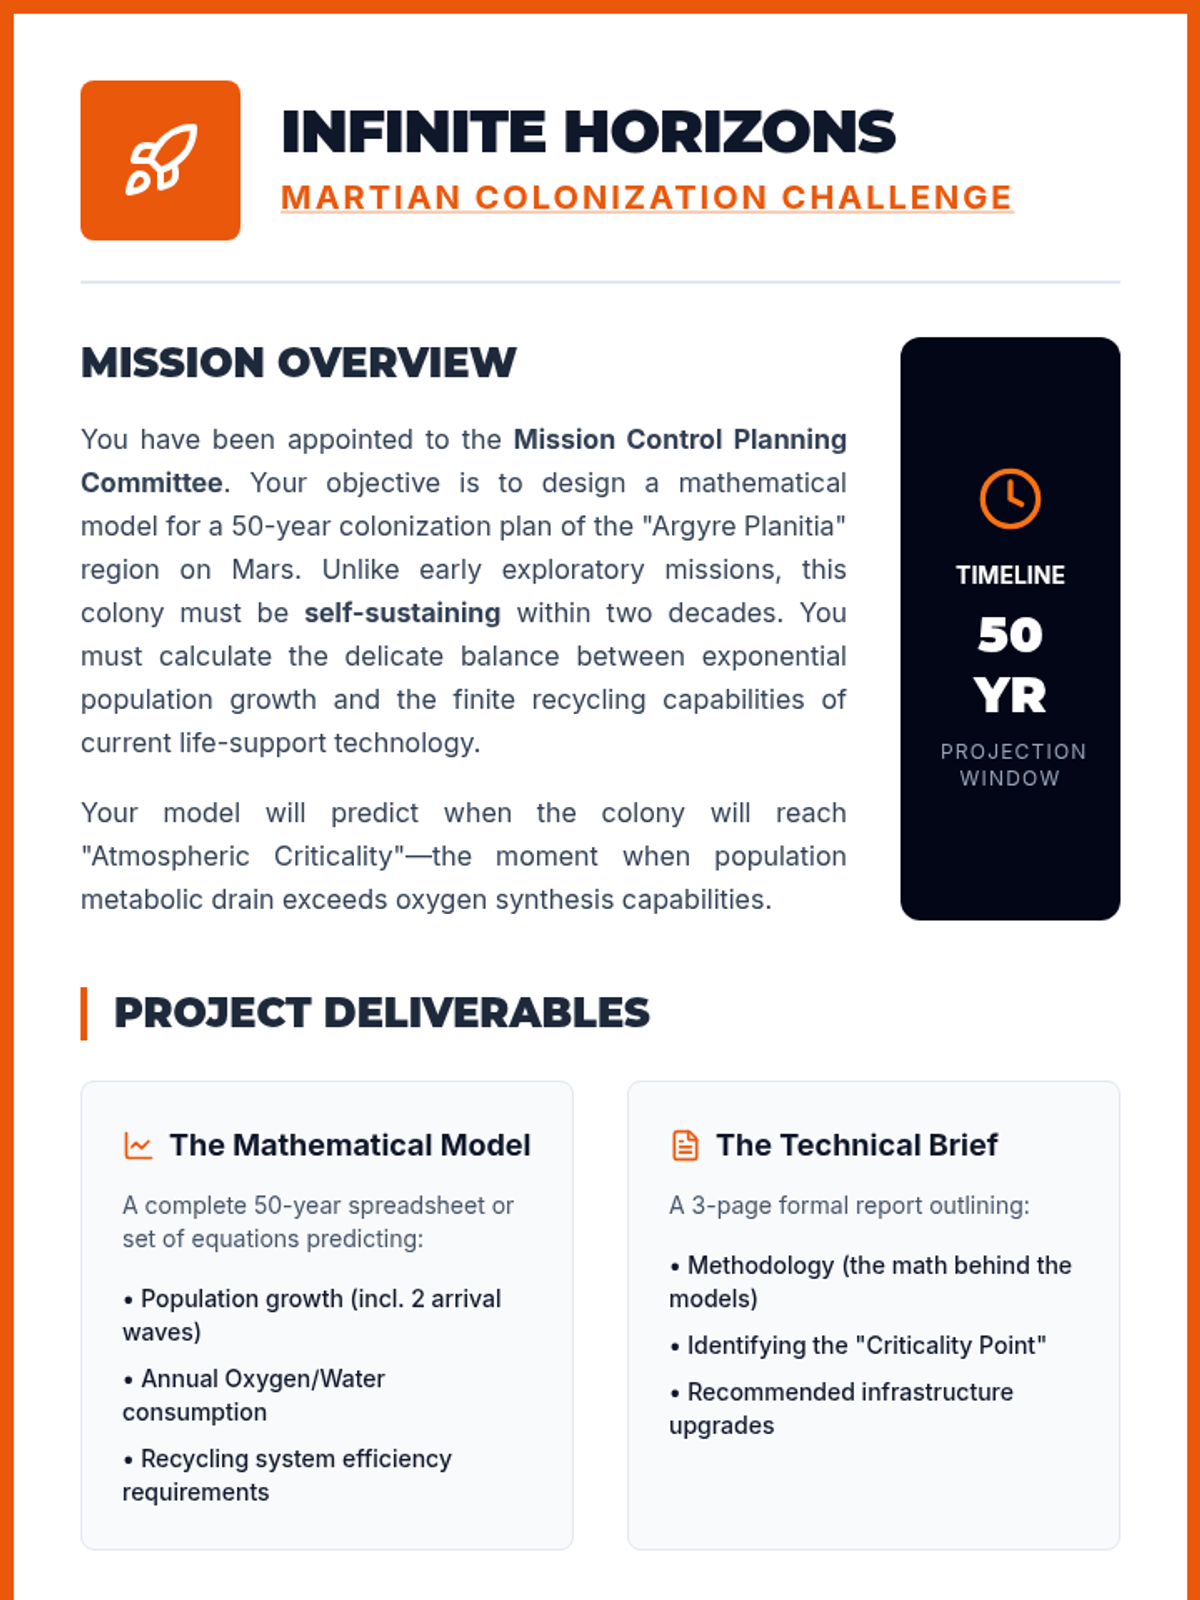
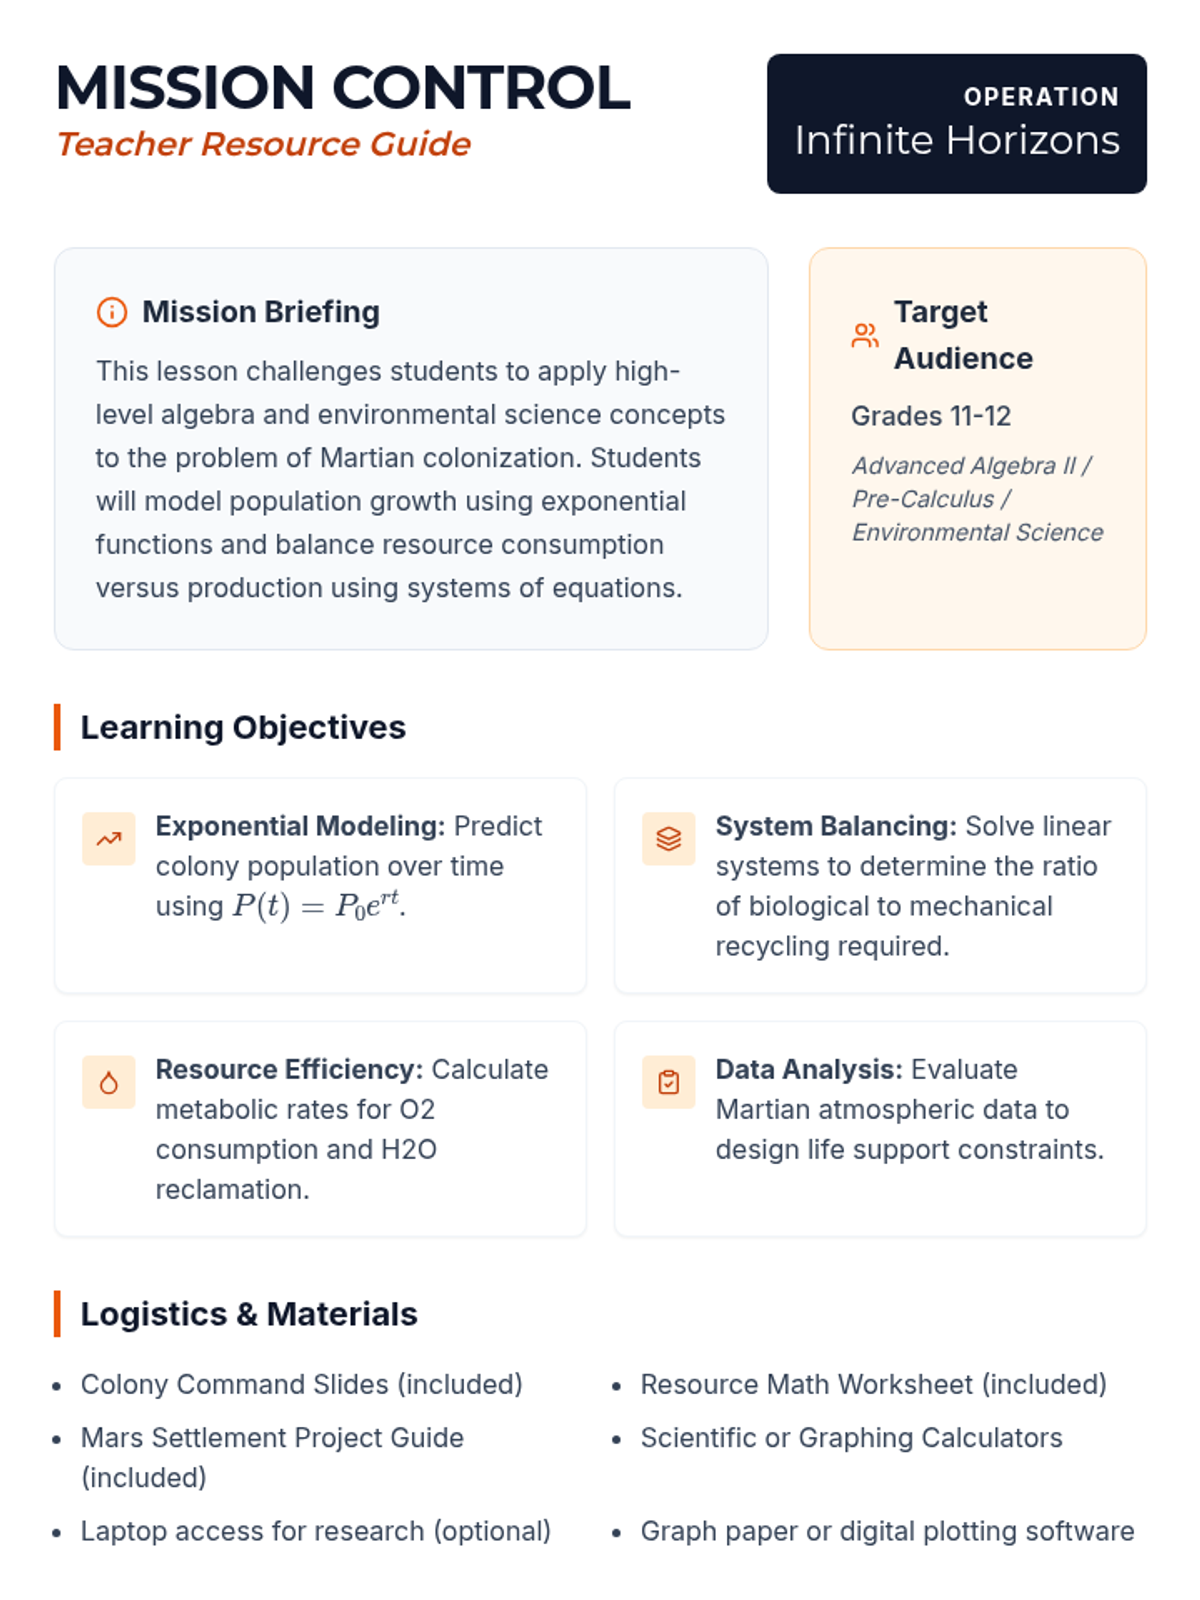
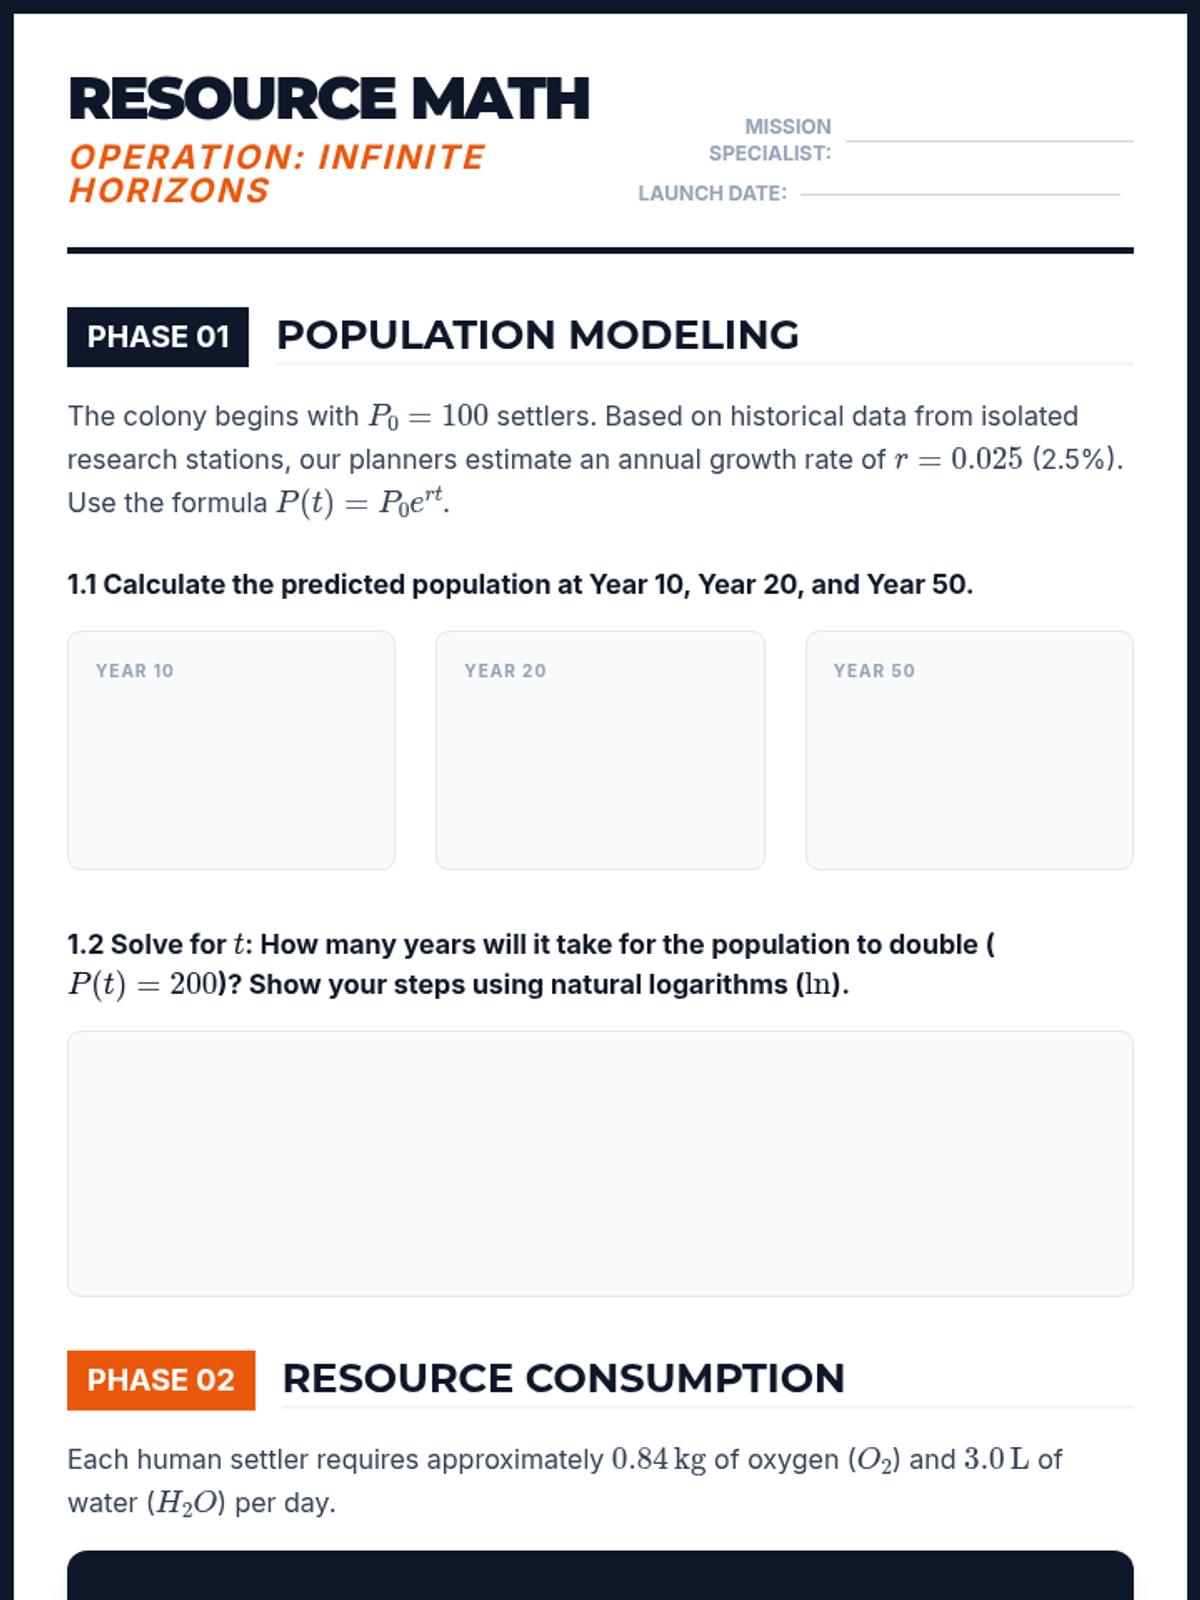
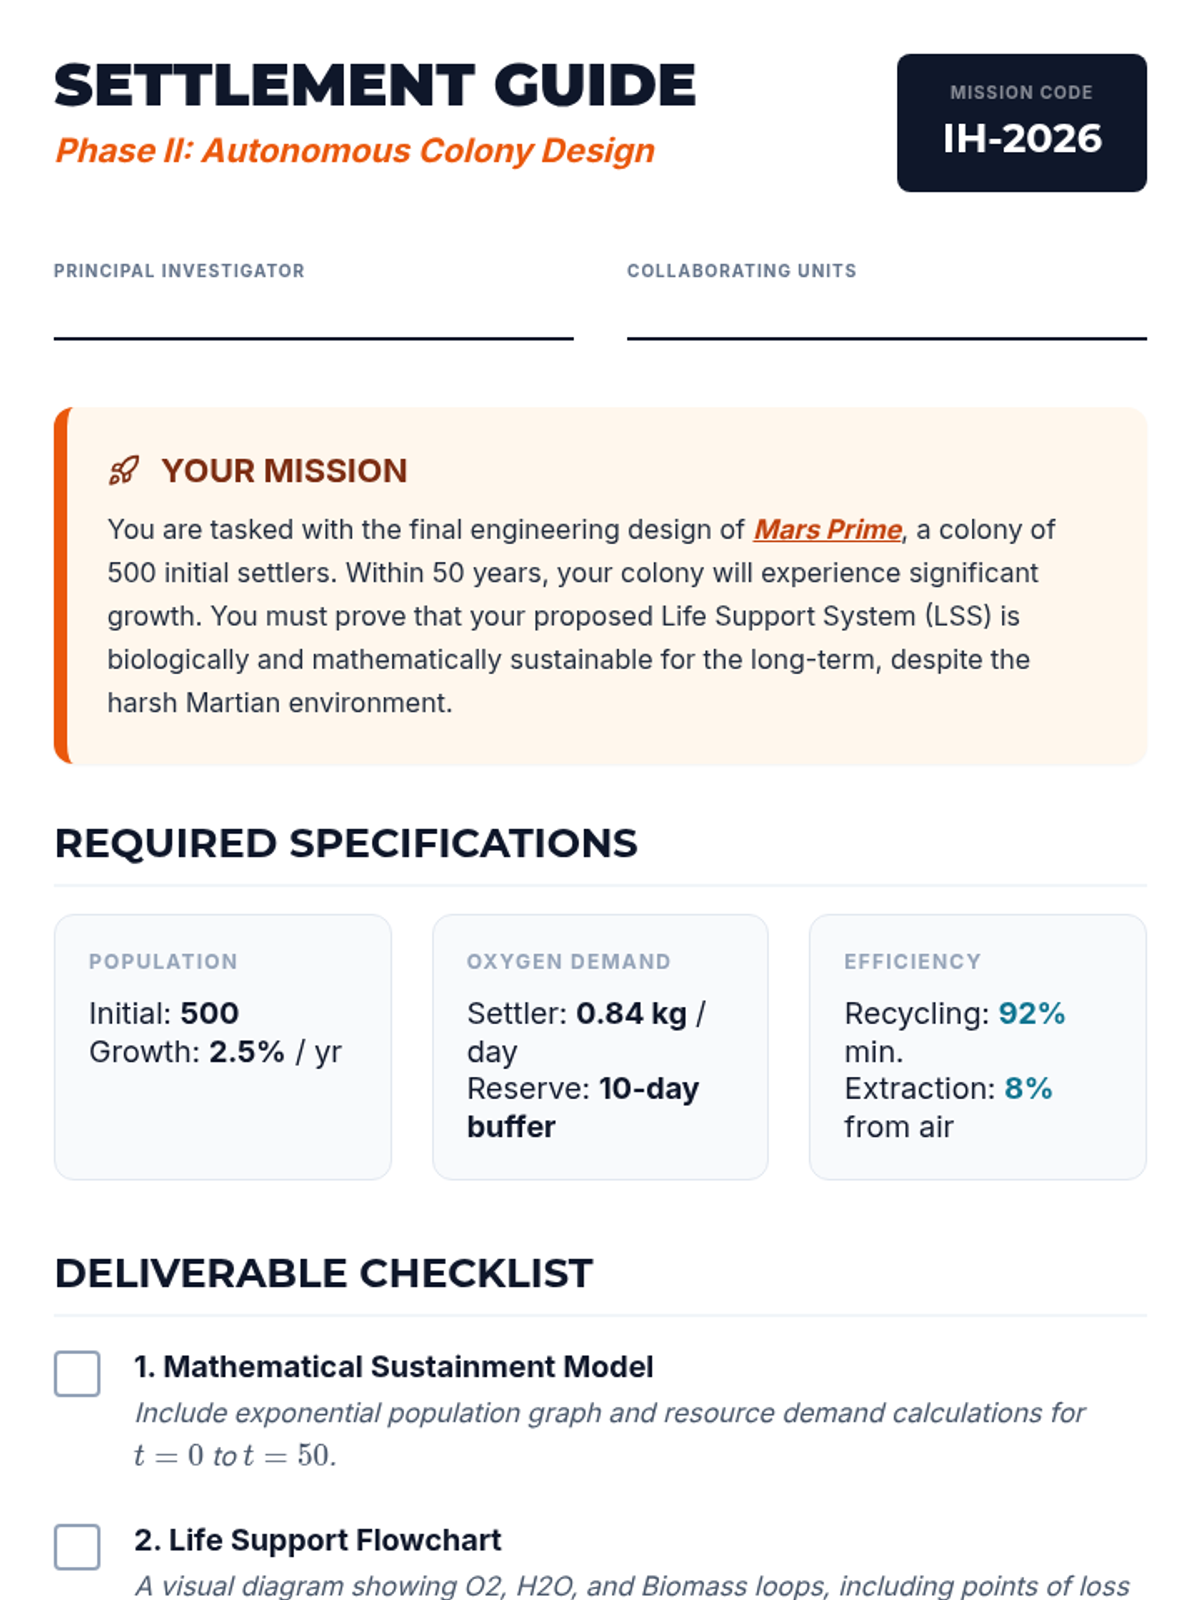
An interdisciplinary STEM challenge where 11th and 12th-grade students use exponential growth models and systems of equations to design a self-sustaining Mars colony, calculating metabolic and resource requirements.
An interdisciplinary challenge for 11th and 12th-grade students to model the mathematical and biological requirements for a self-sustaining Mars colony using exponential growth and systems of equations.
A focused practice session on converting logarithmic equations into their exponential equivalents using the definition of a logarithm.
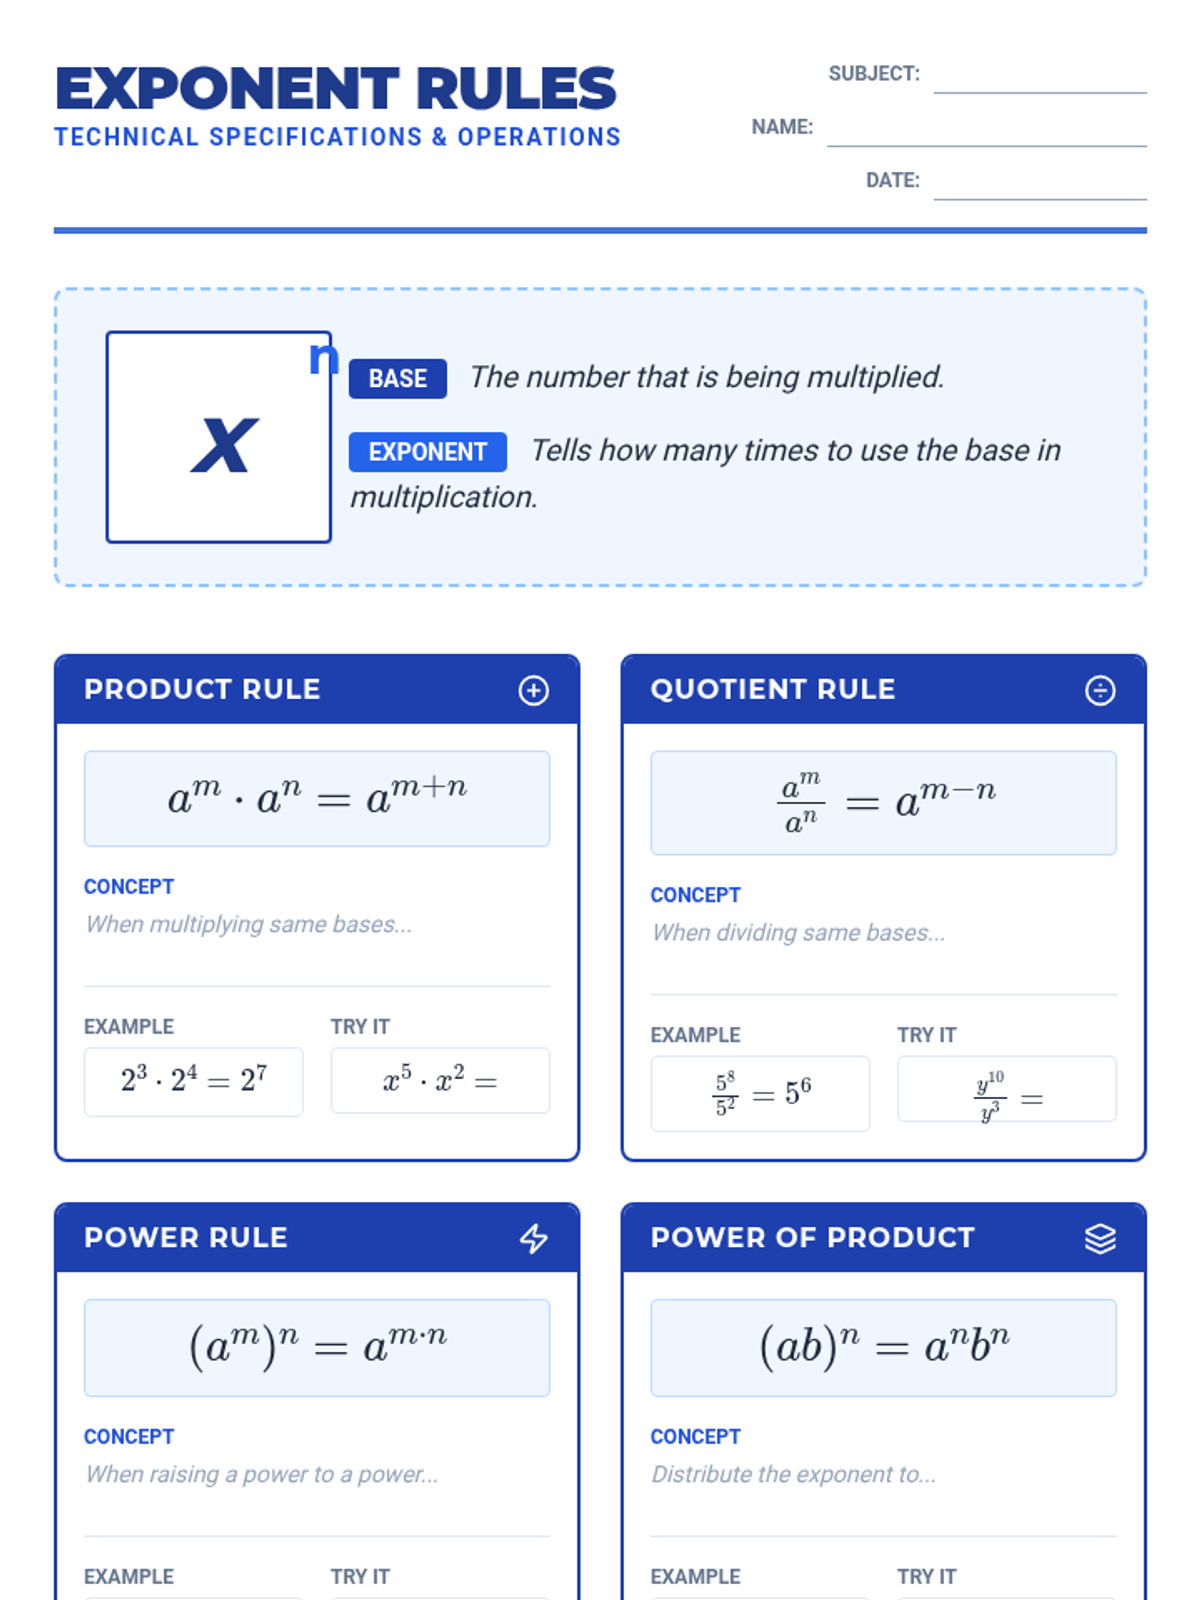
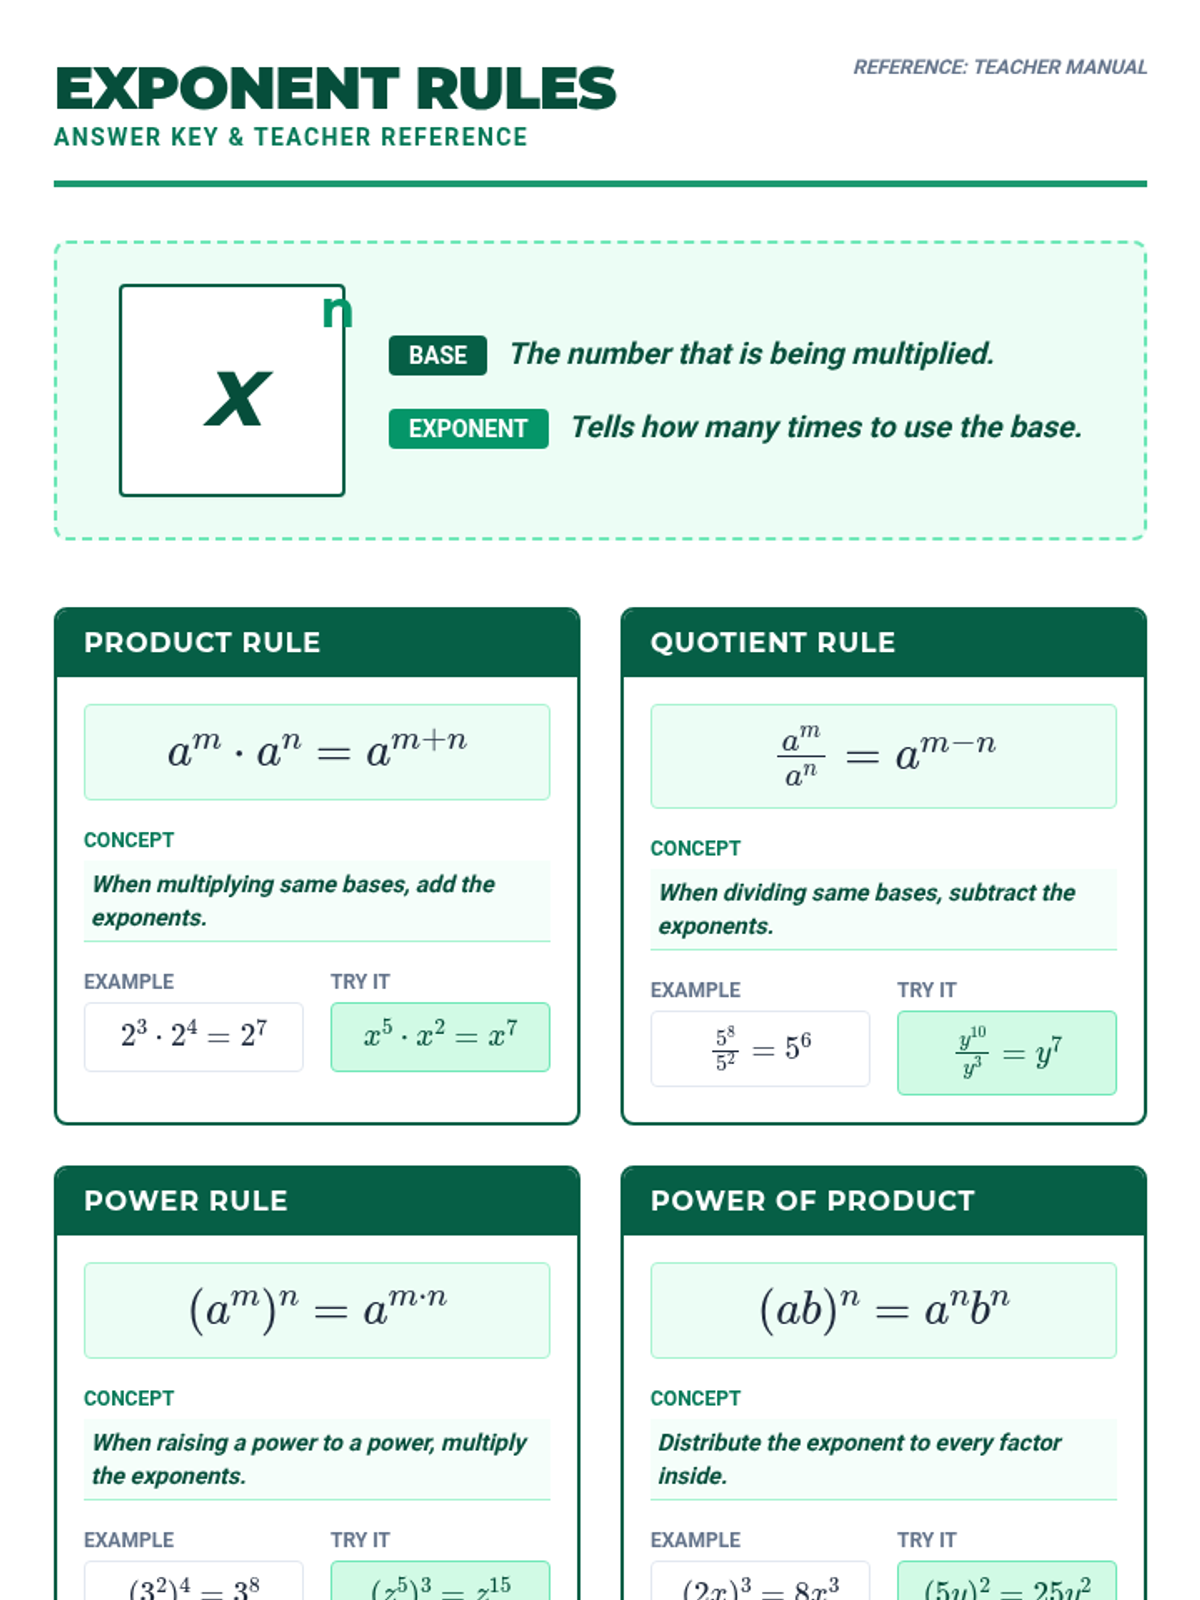
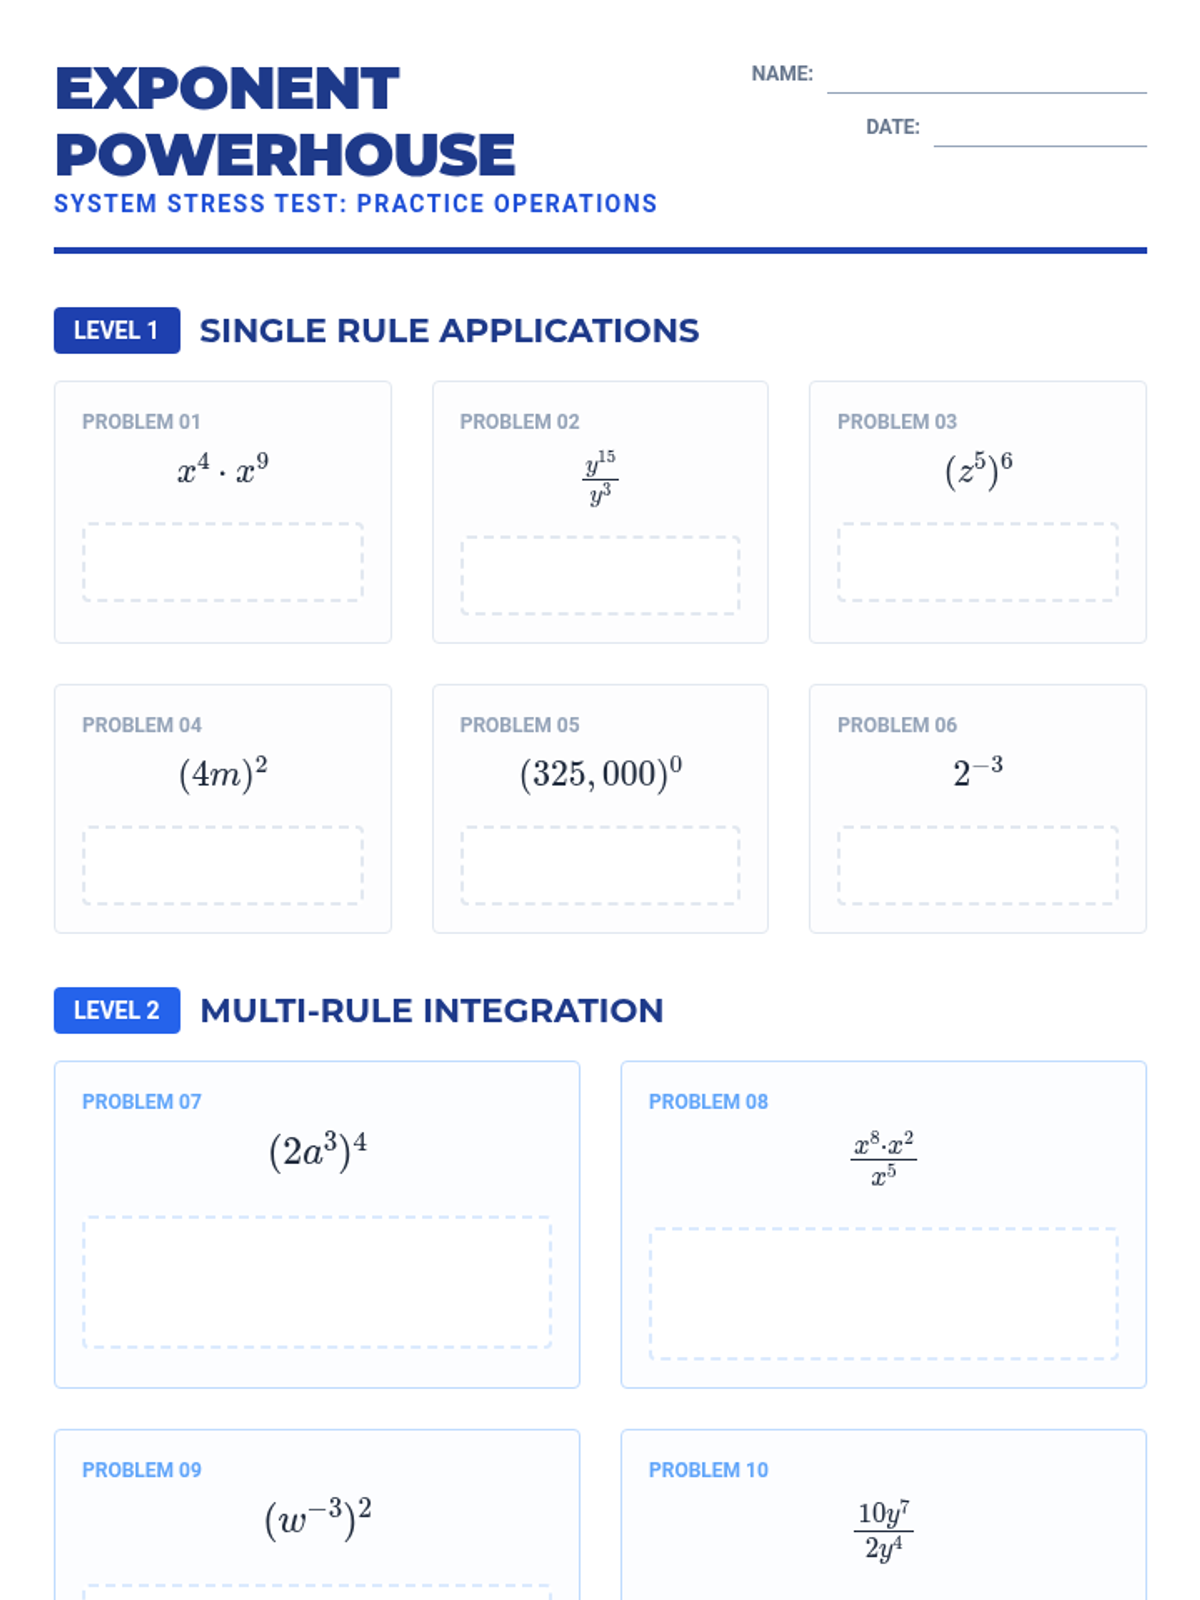
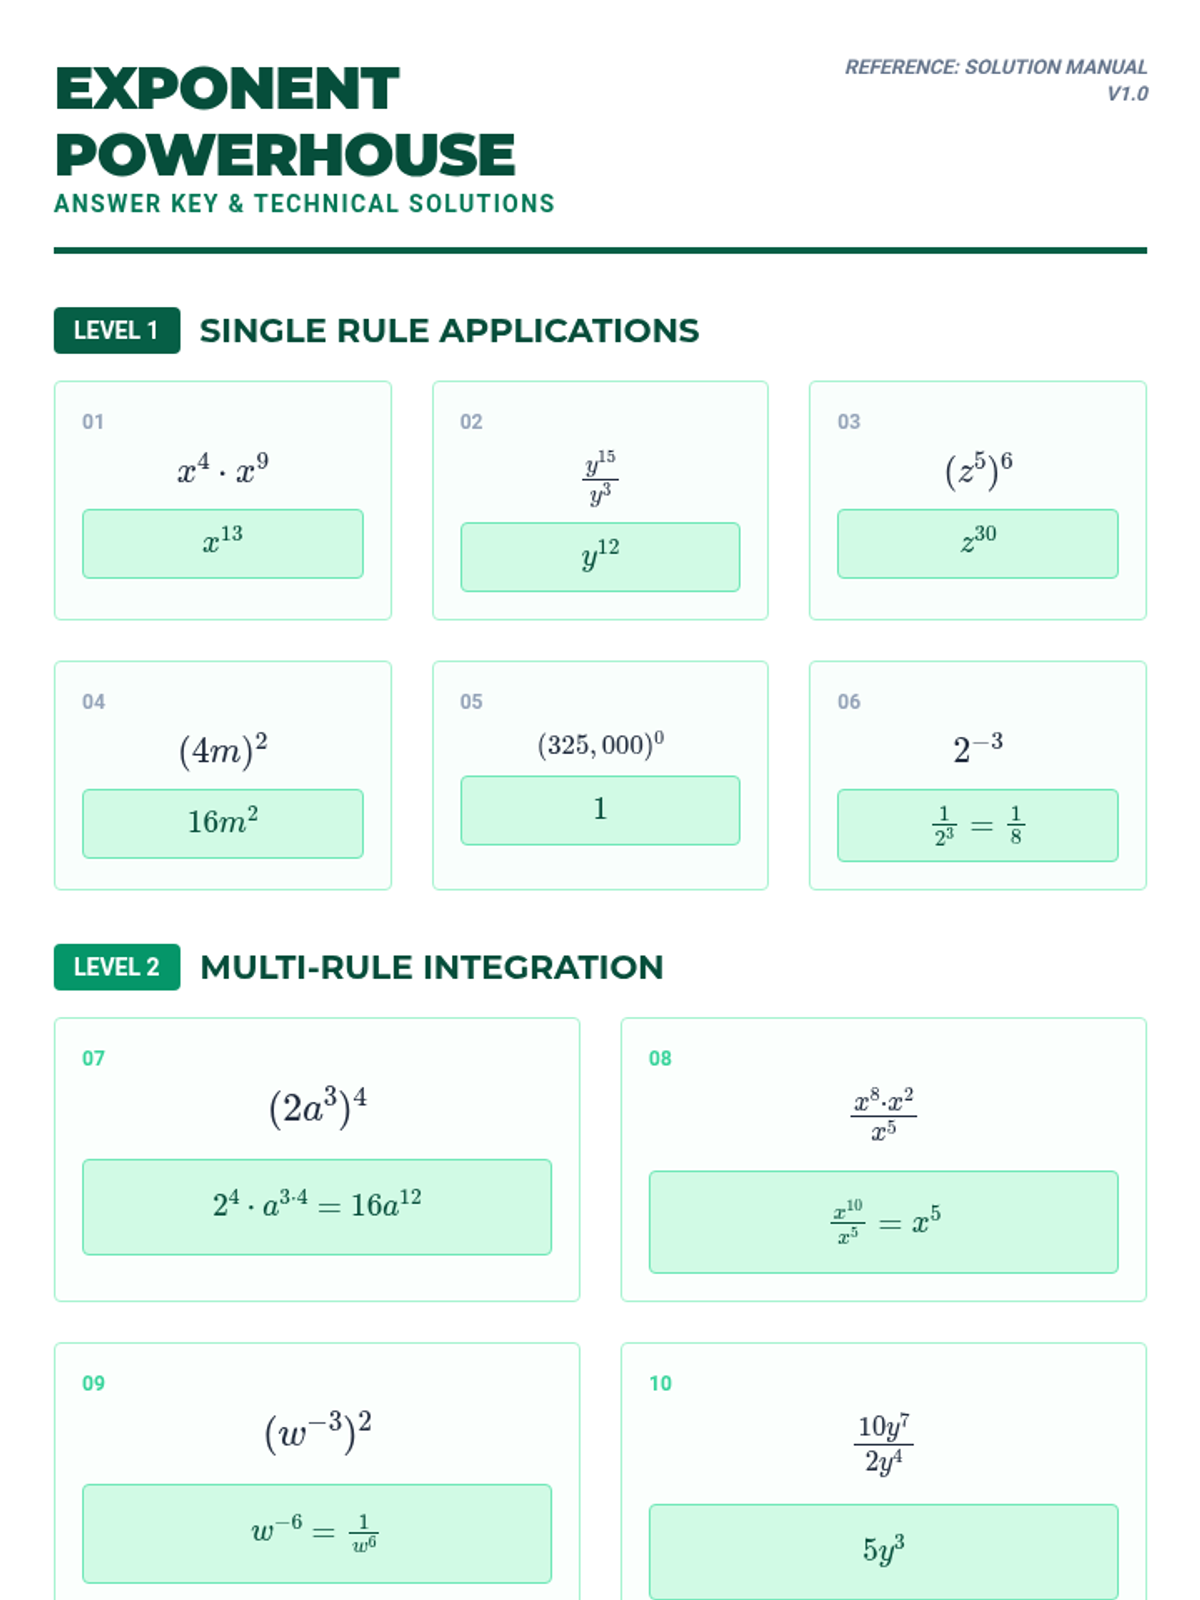
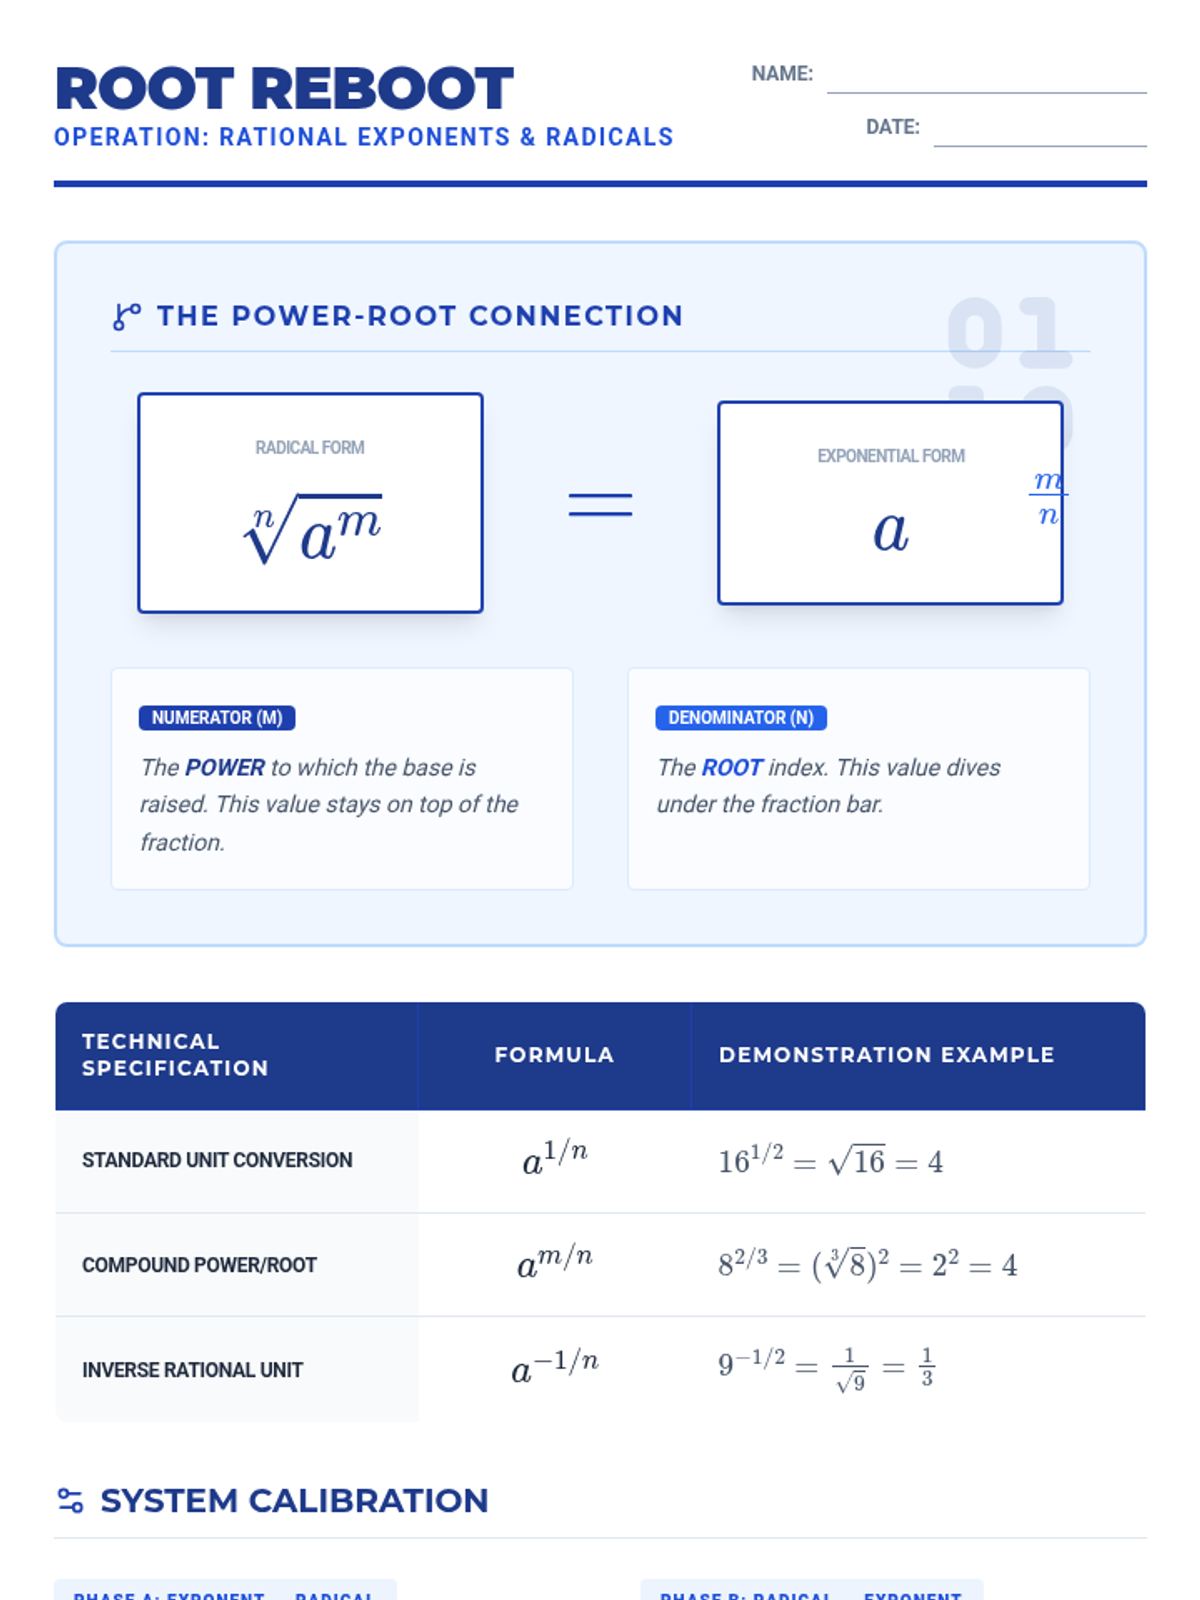
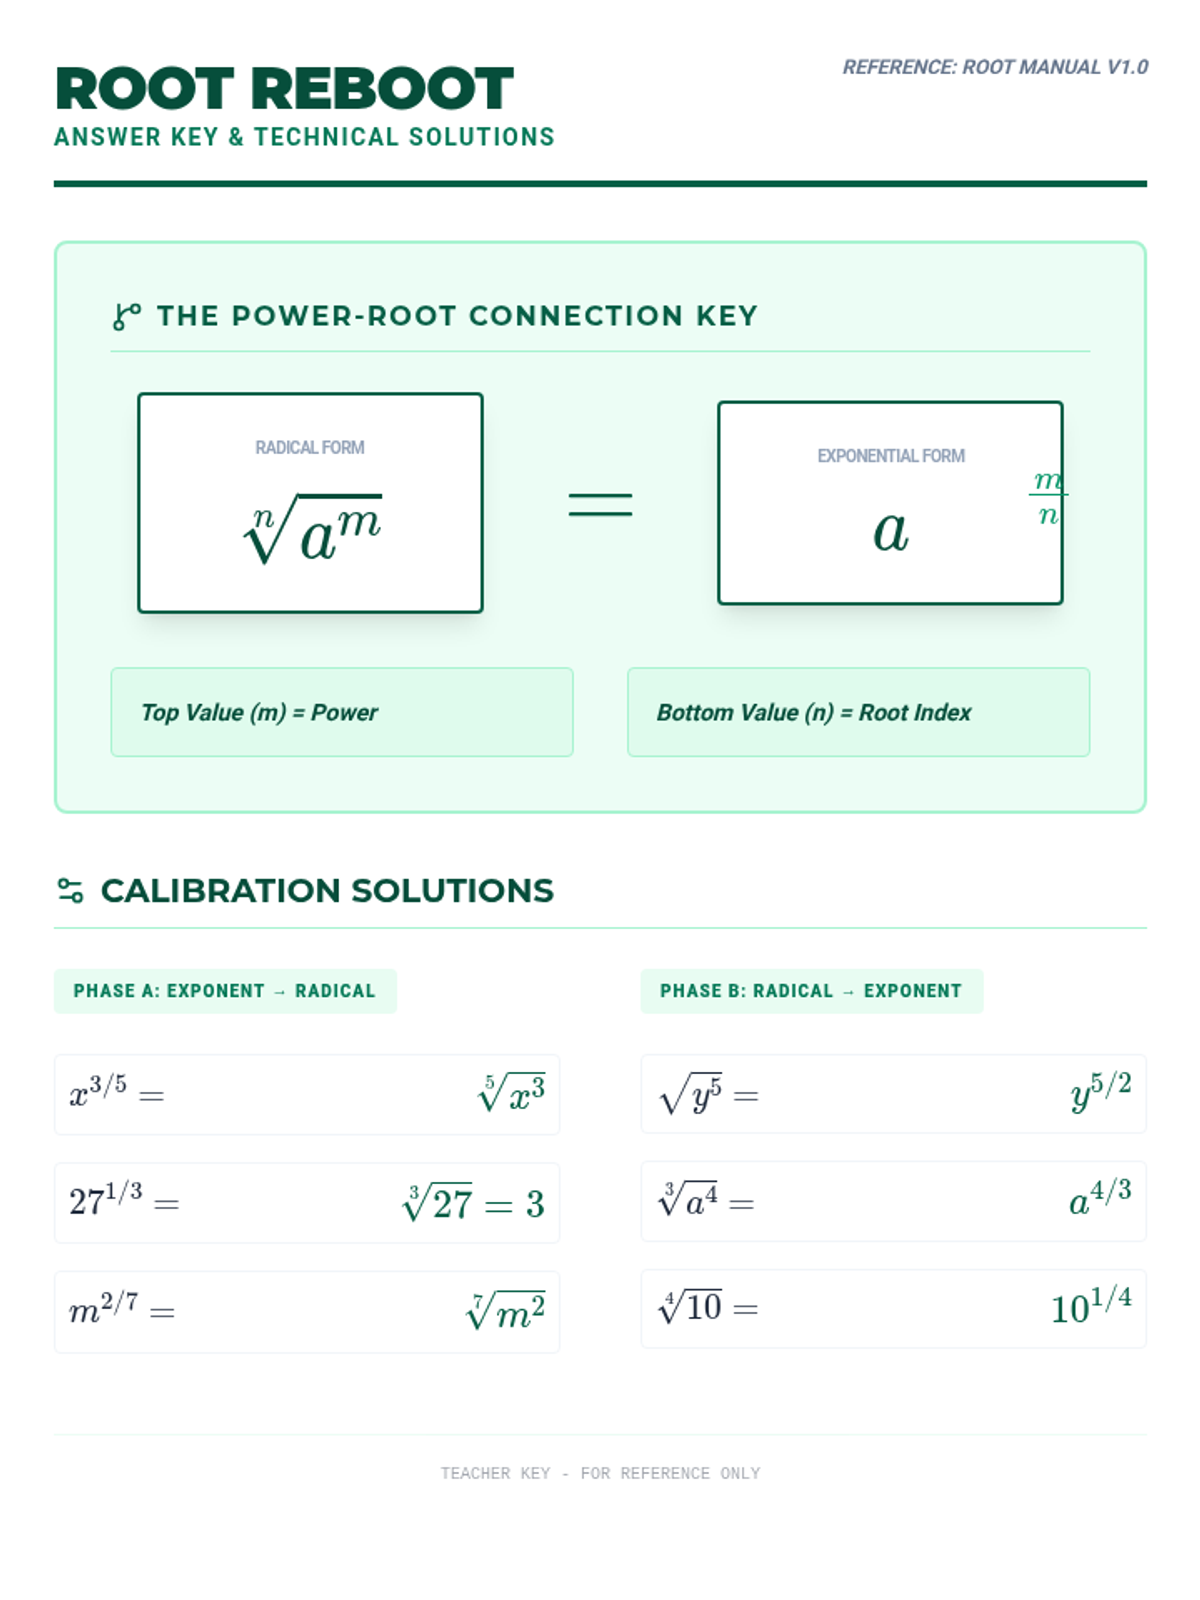
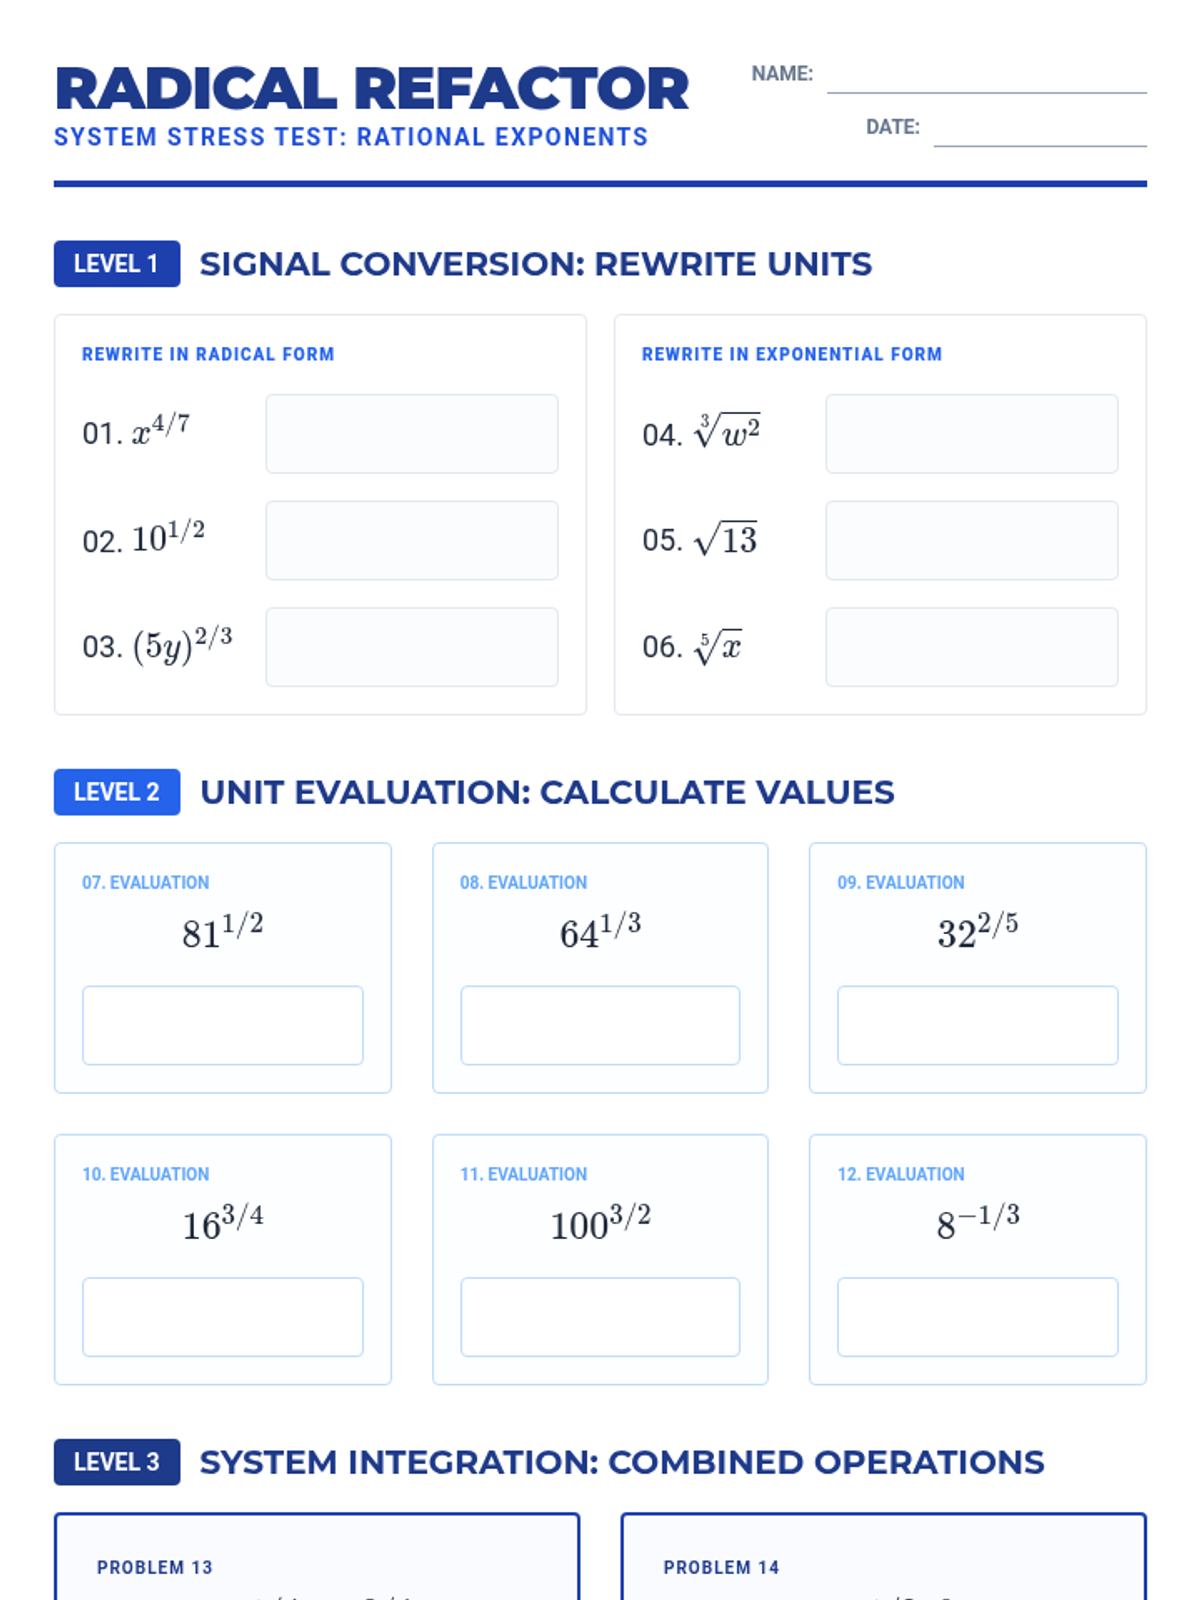
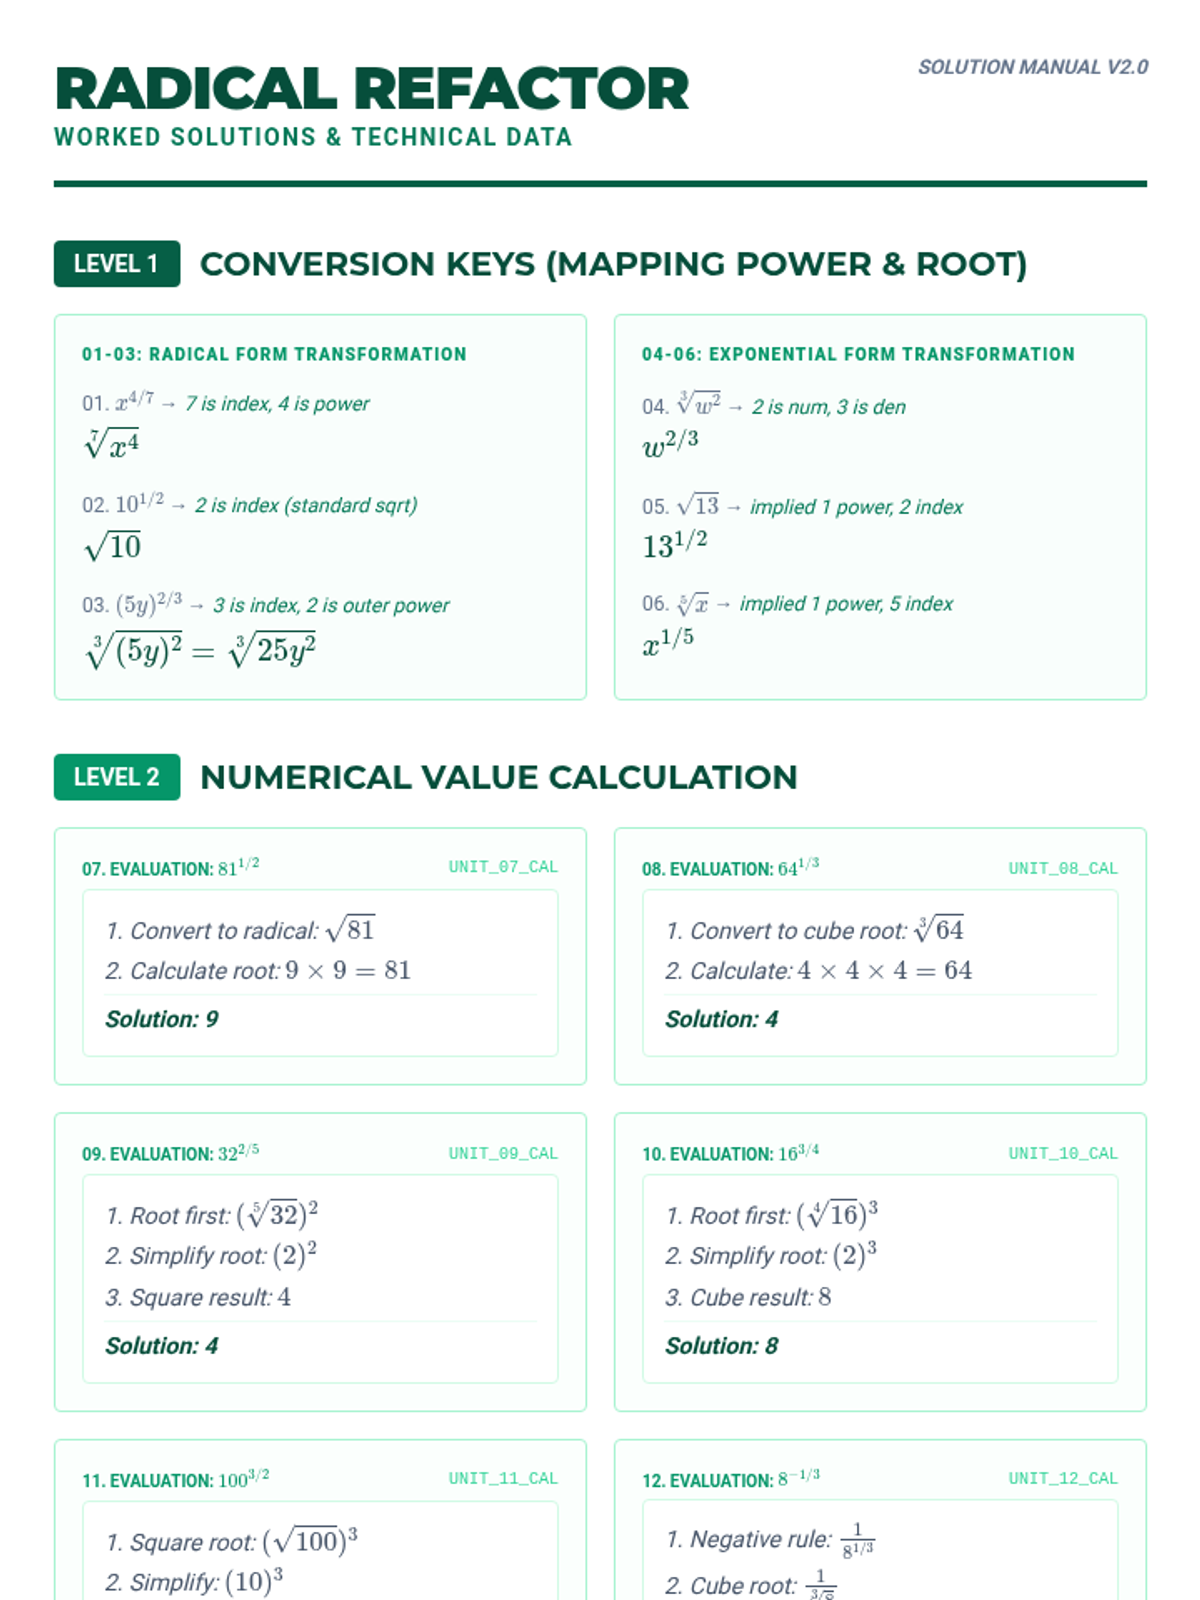
A comprehensive guide to mastering exponent rules, including product, quotient, power, zero, negative, and fractional (rational) exponents through technical organizers and tiered practice.
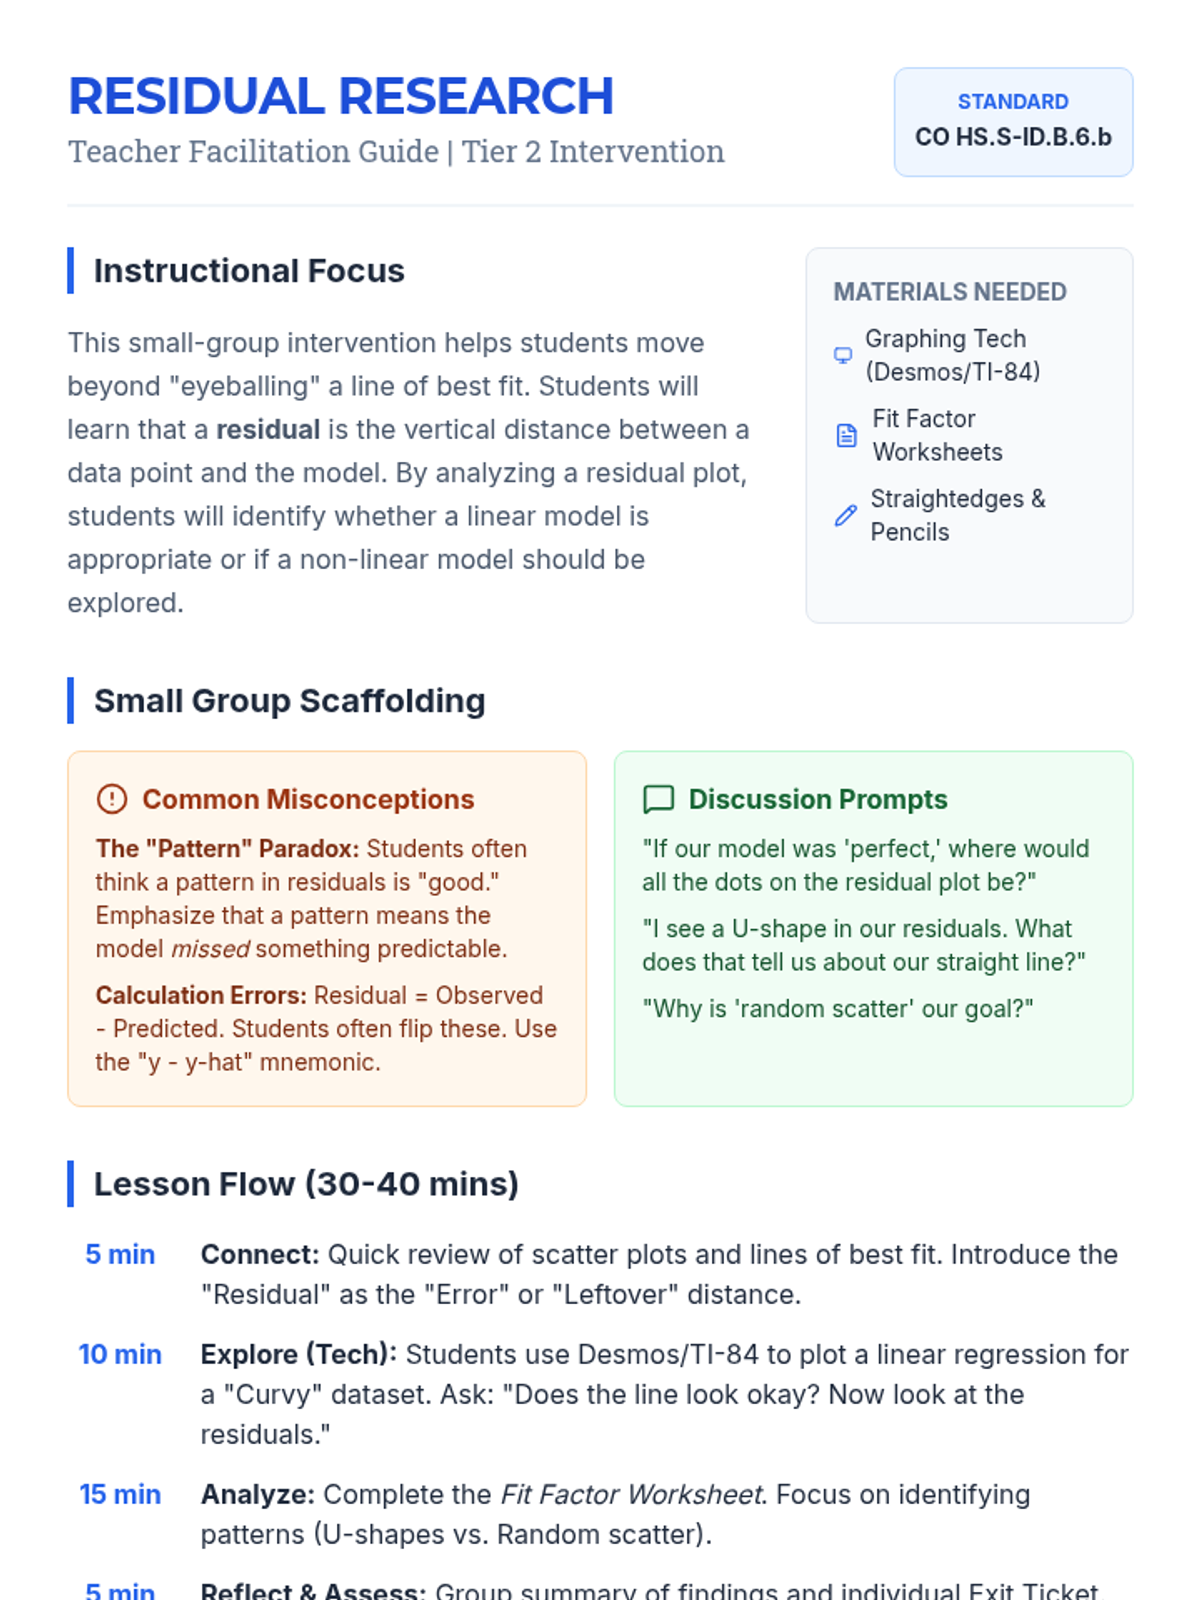
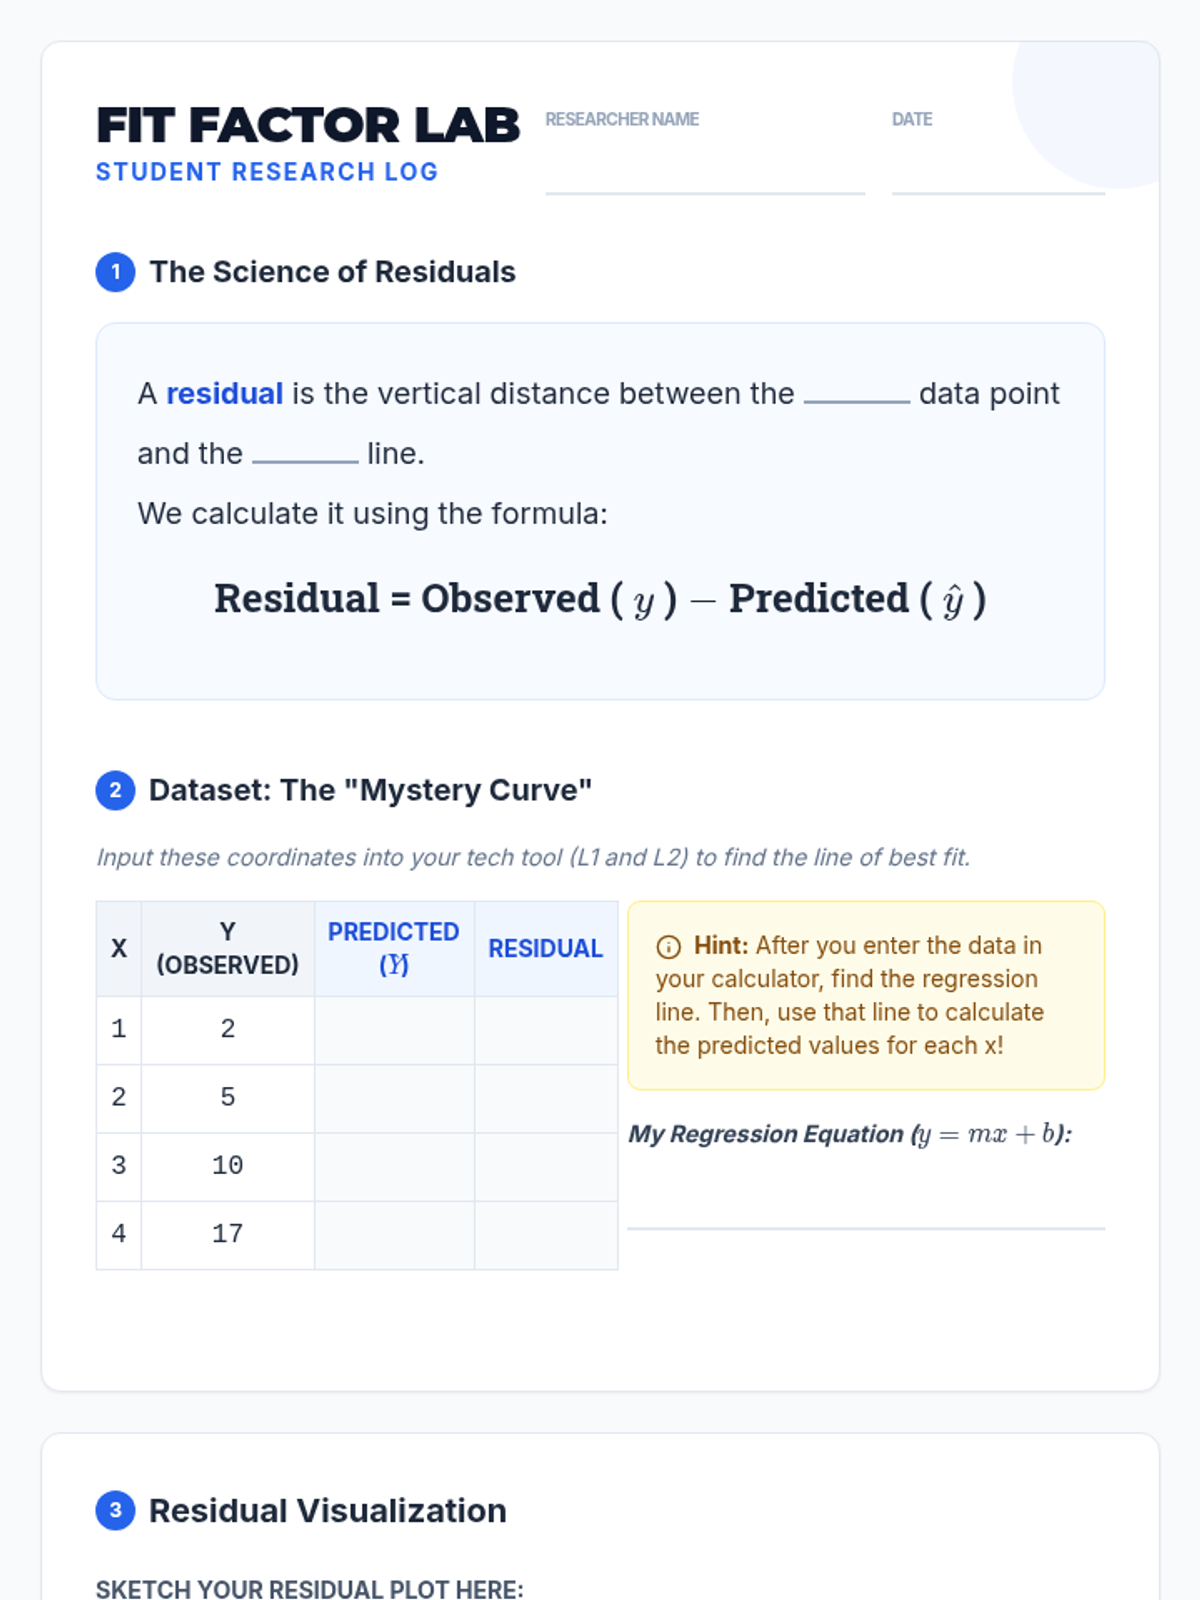
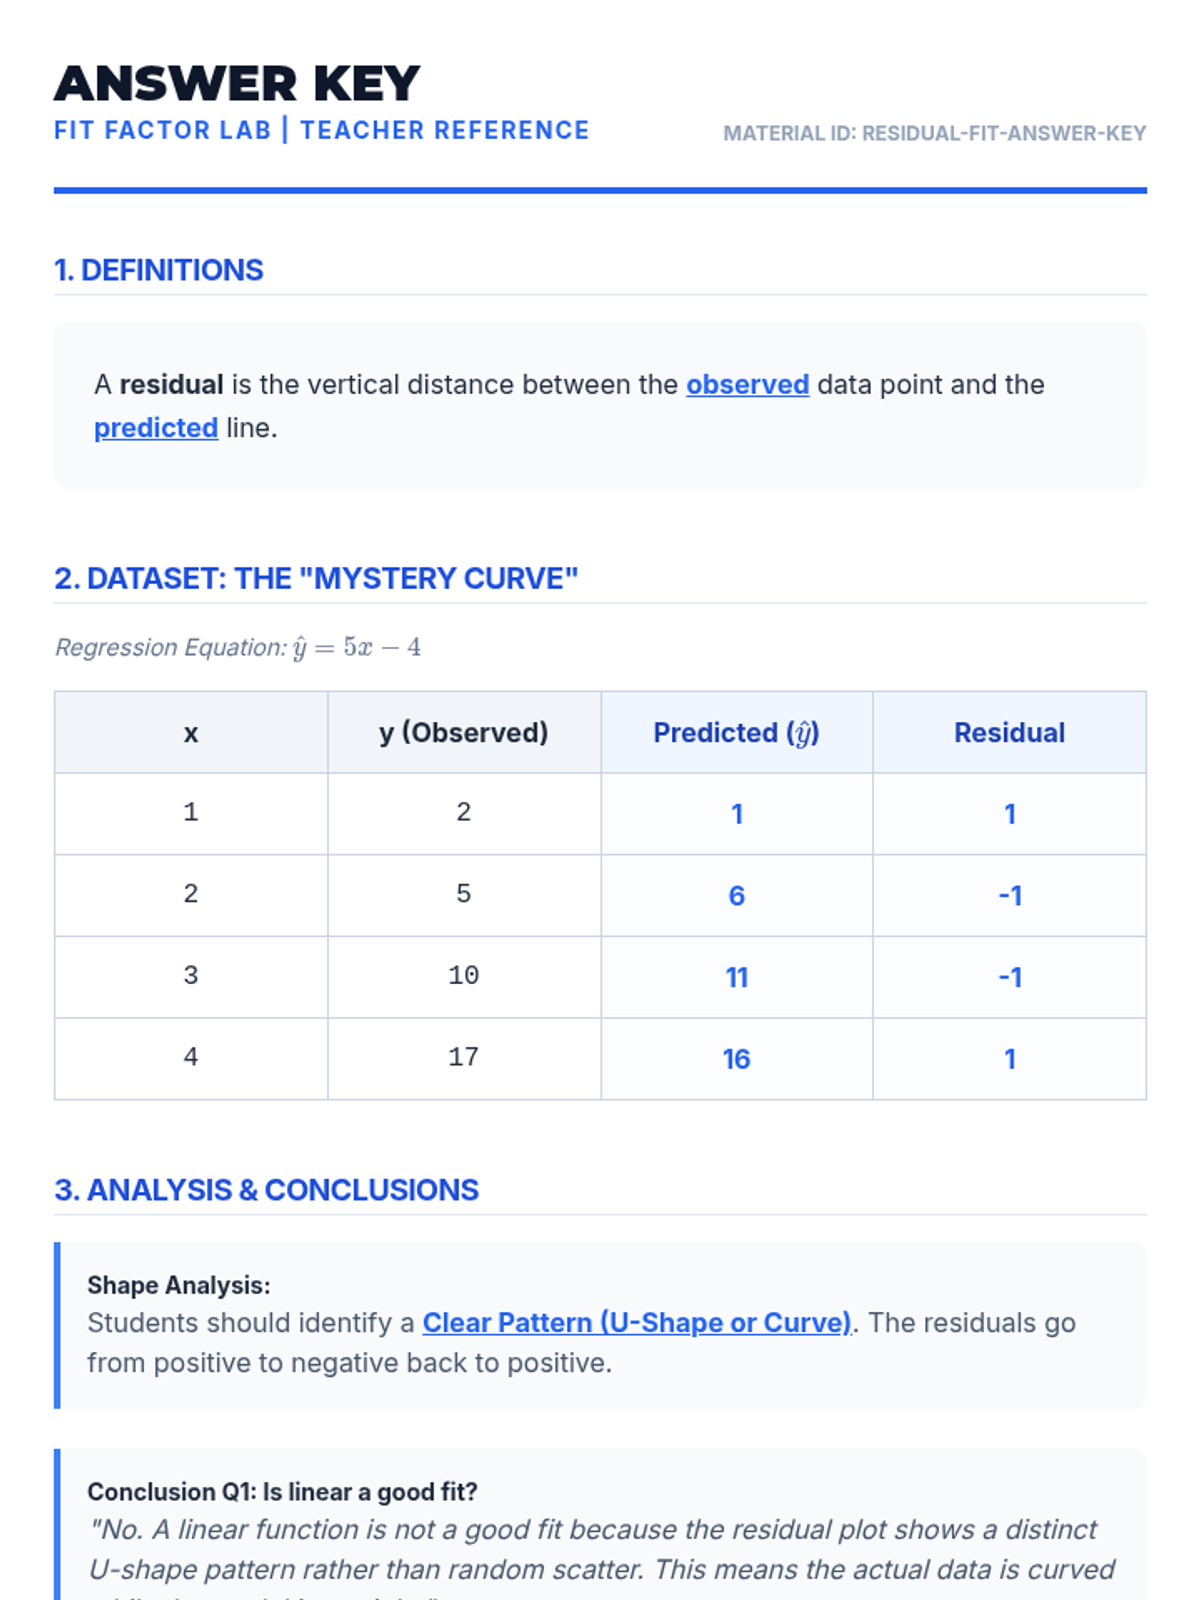
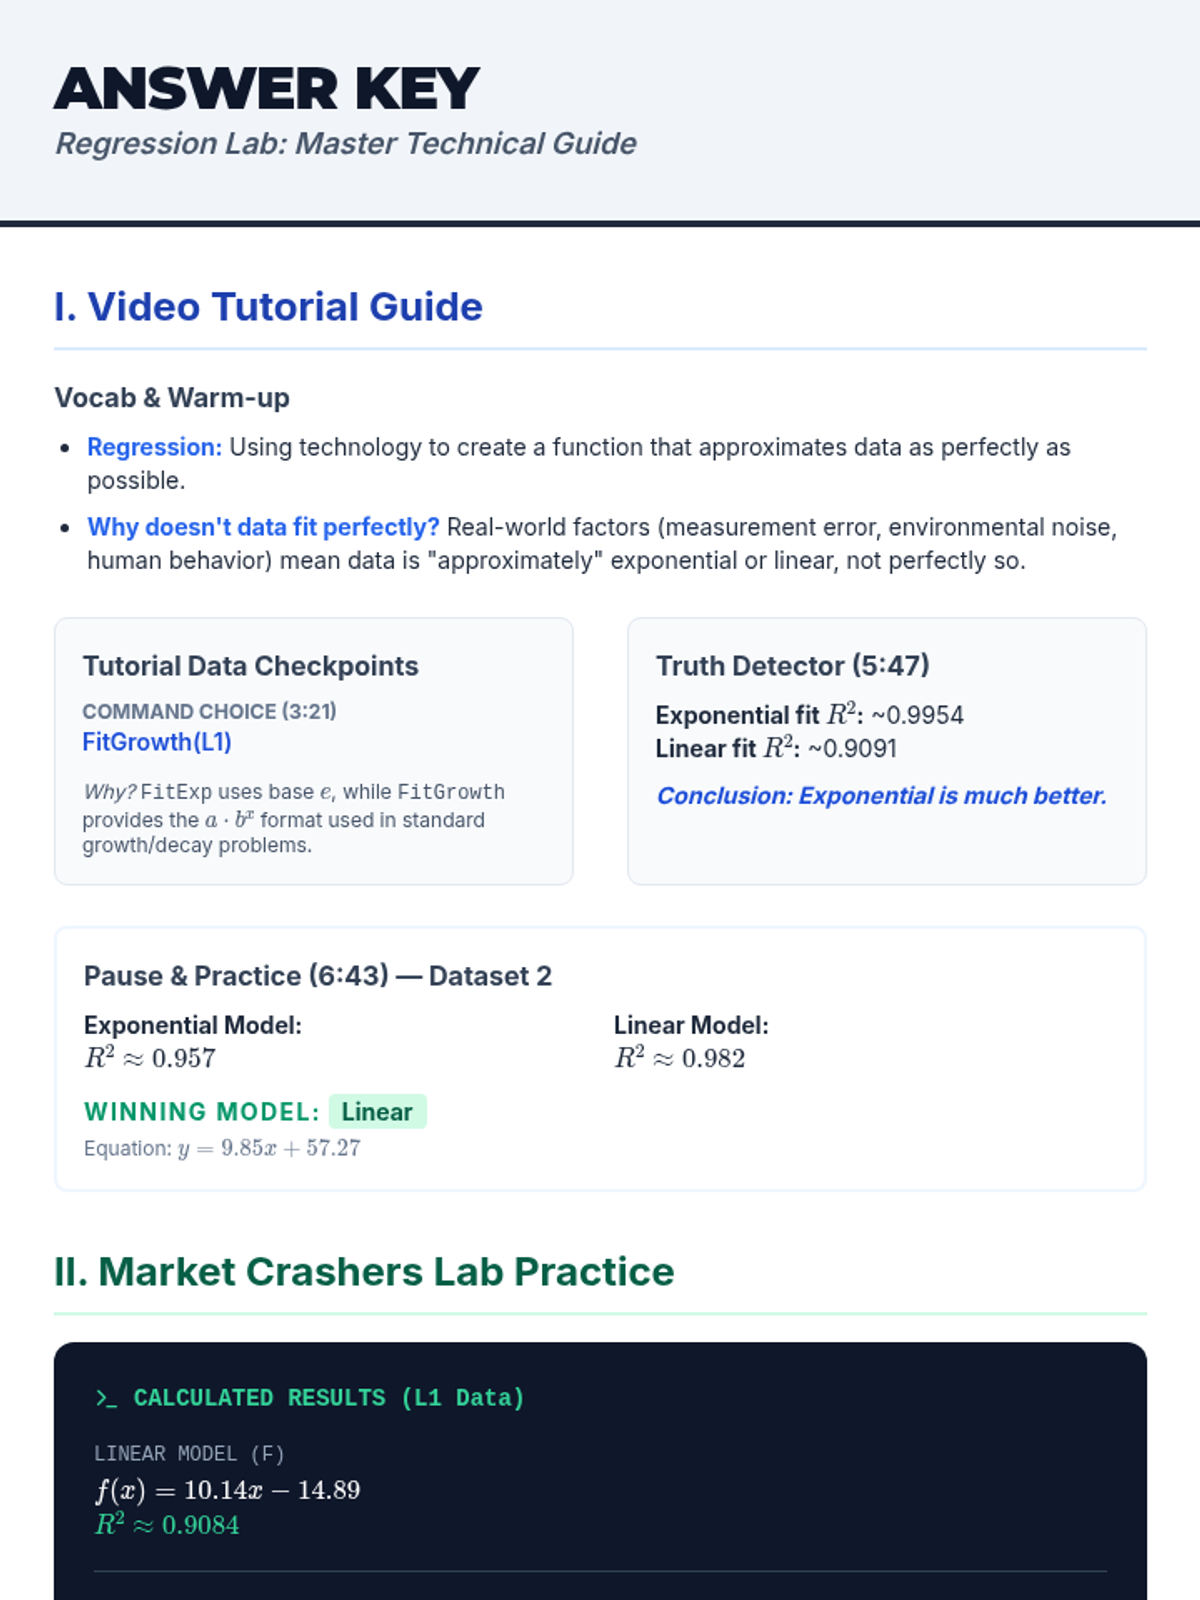
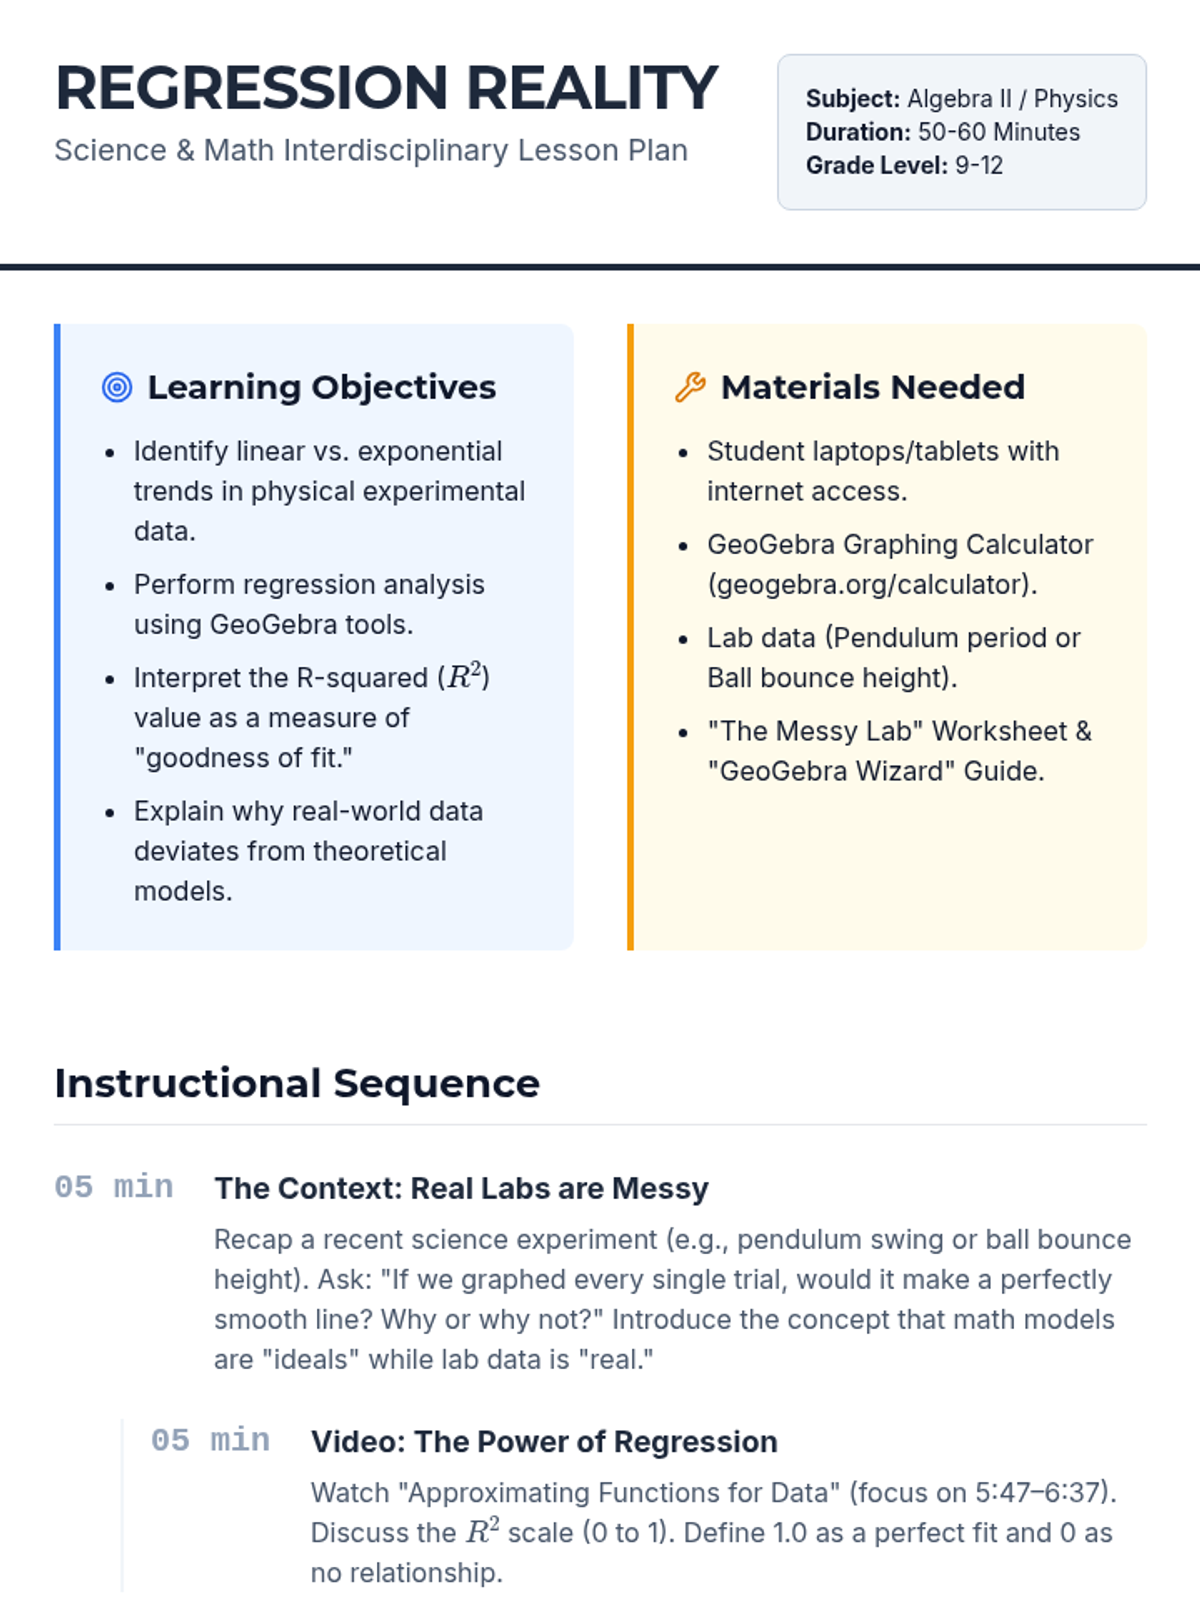
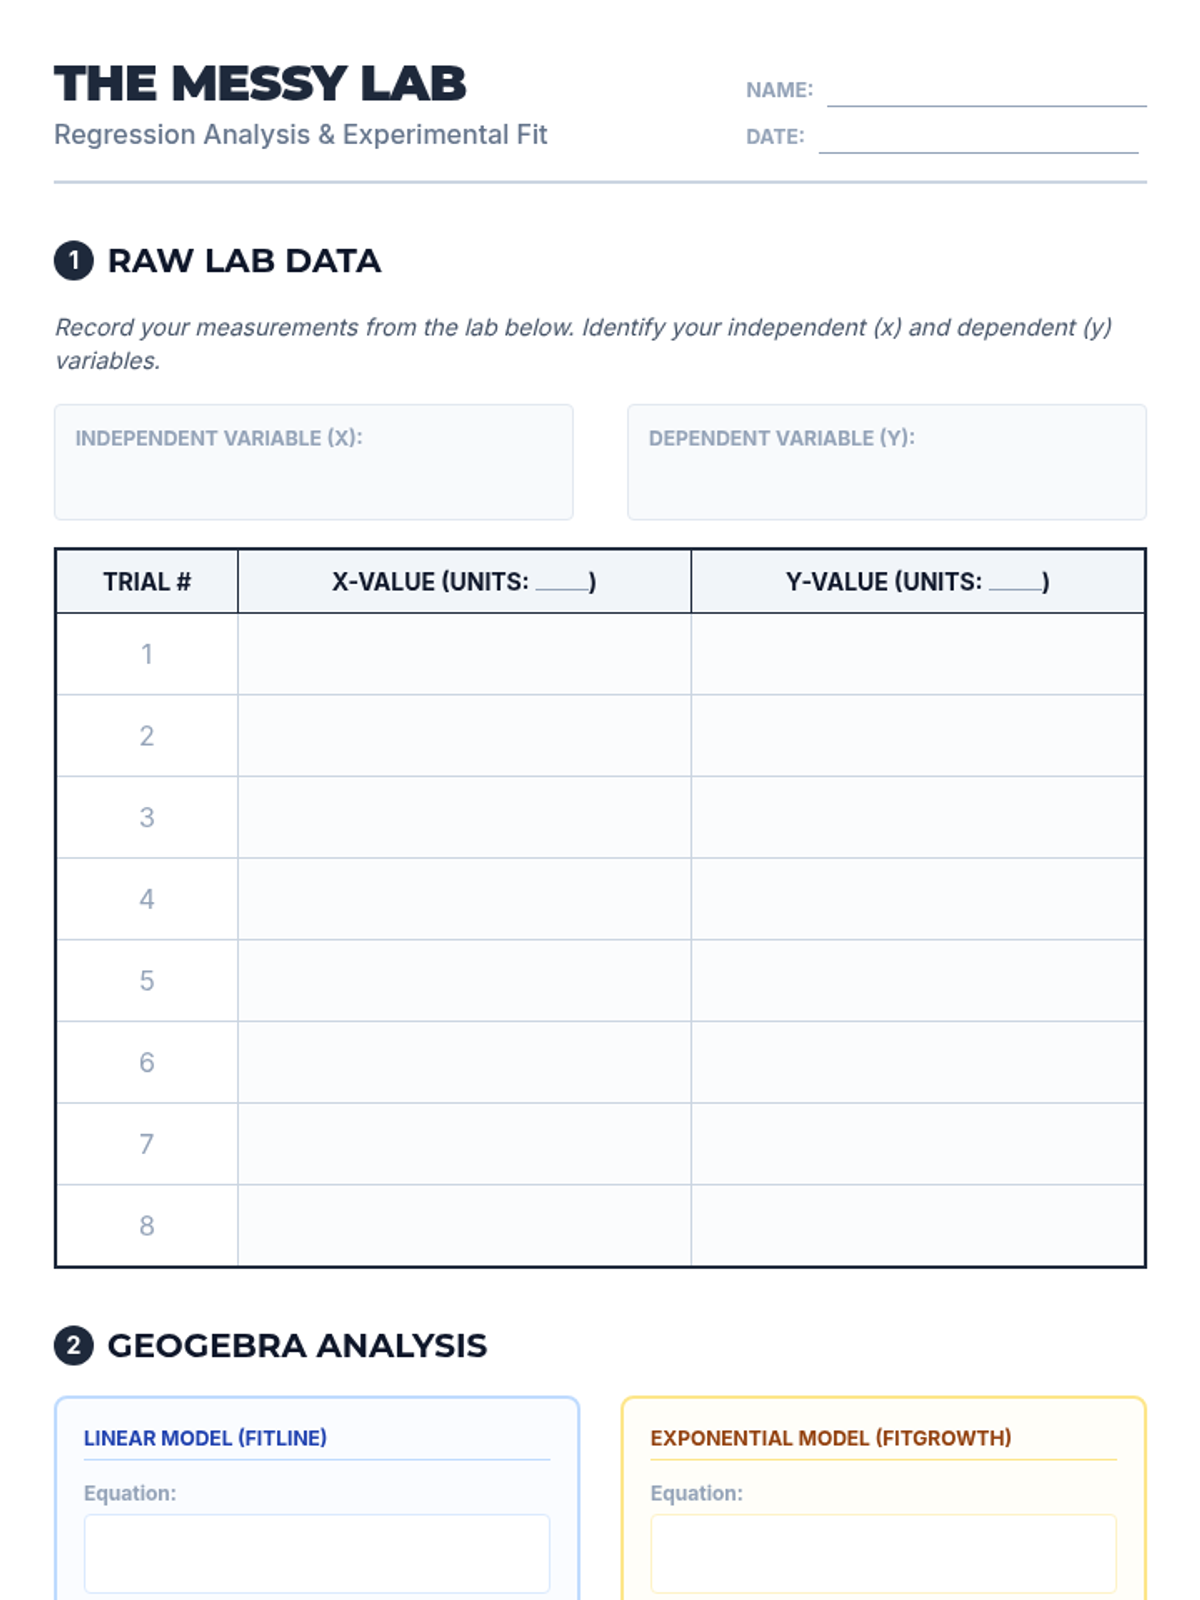
A targeted Tier 2 intervention lesson focusing on informally assessing function fit using residual plots, designed for small group instruction with scaffolded support and technology integration.
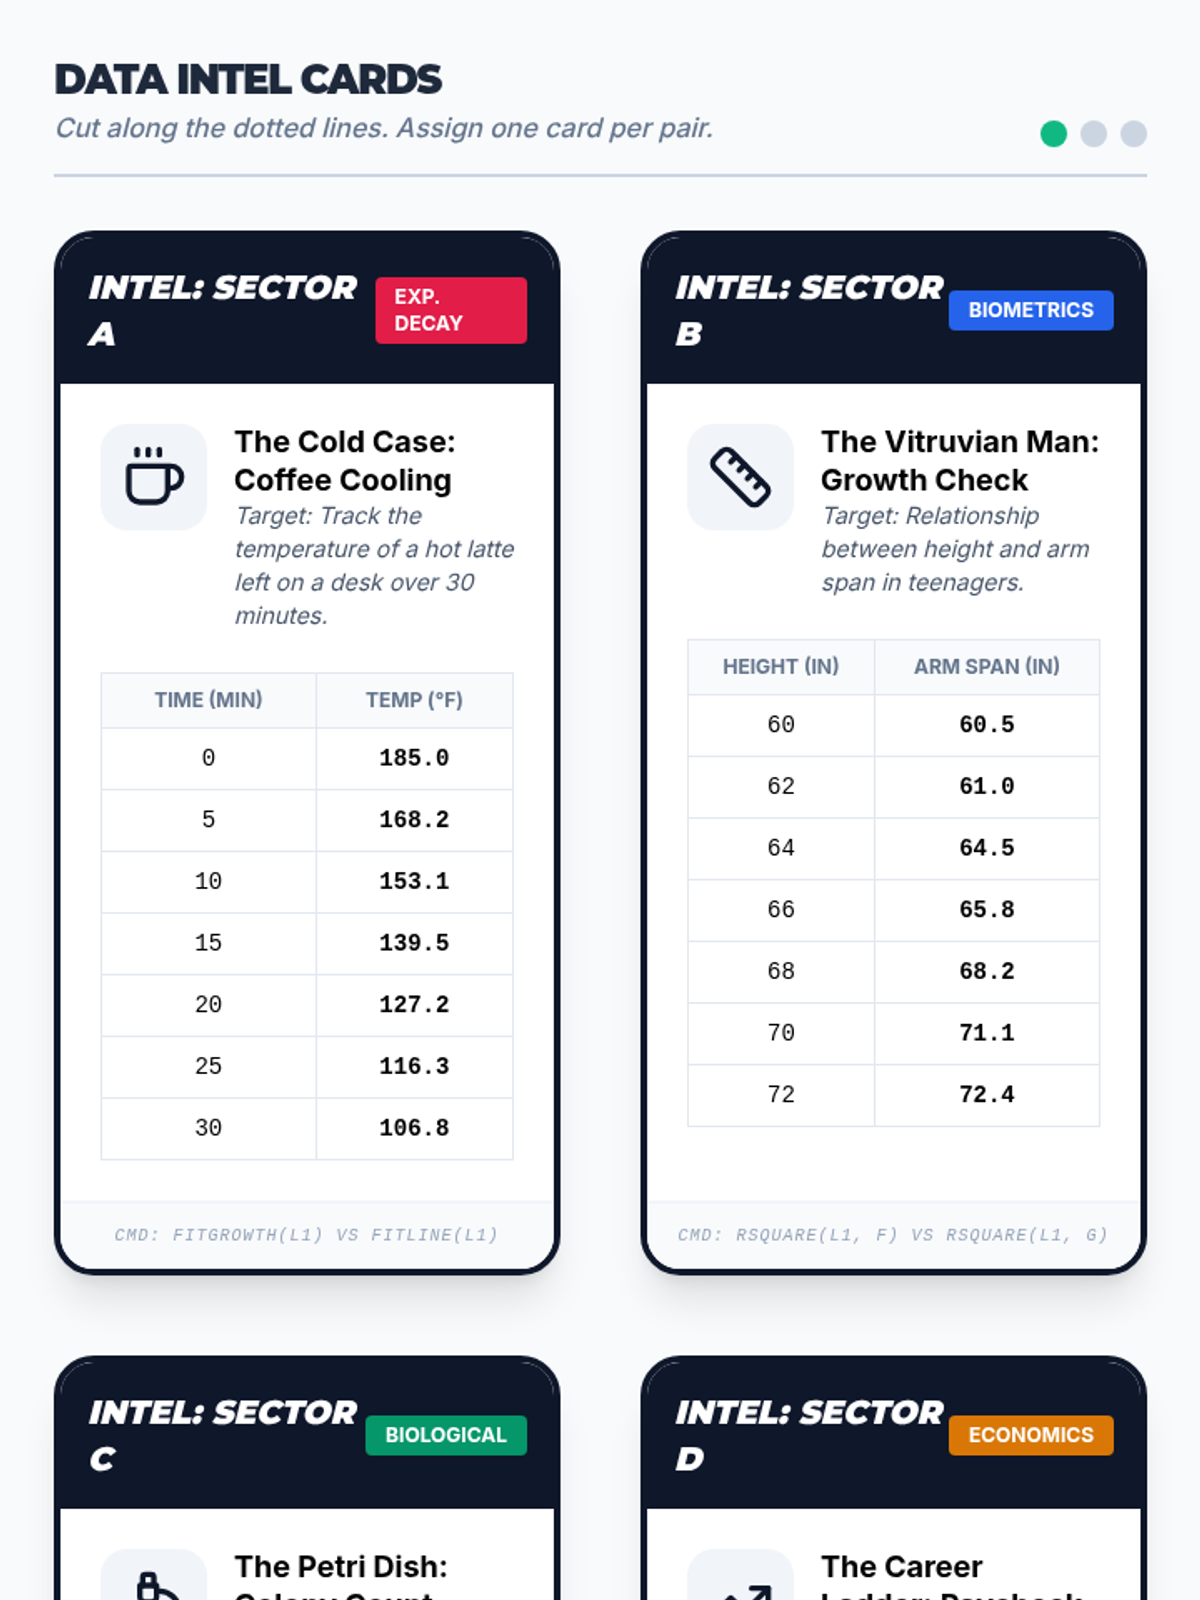
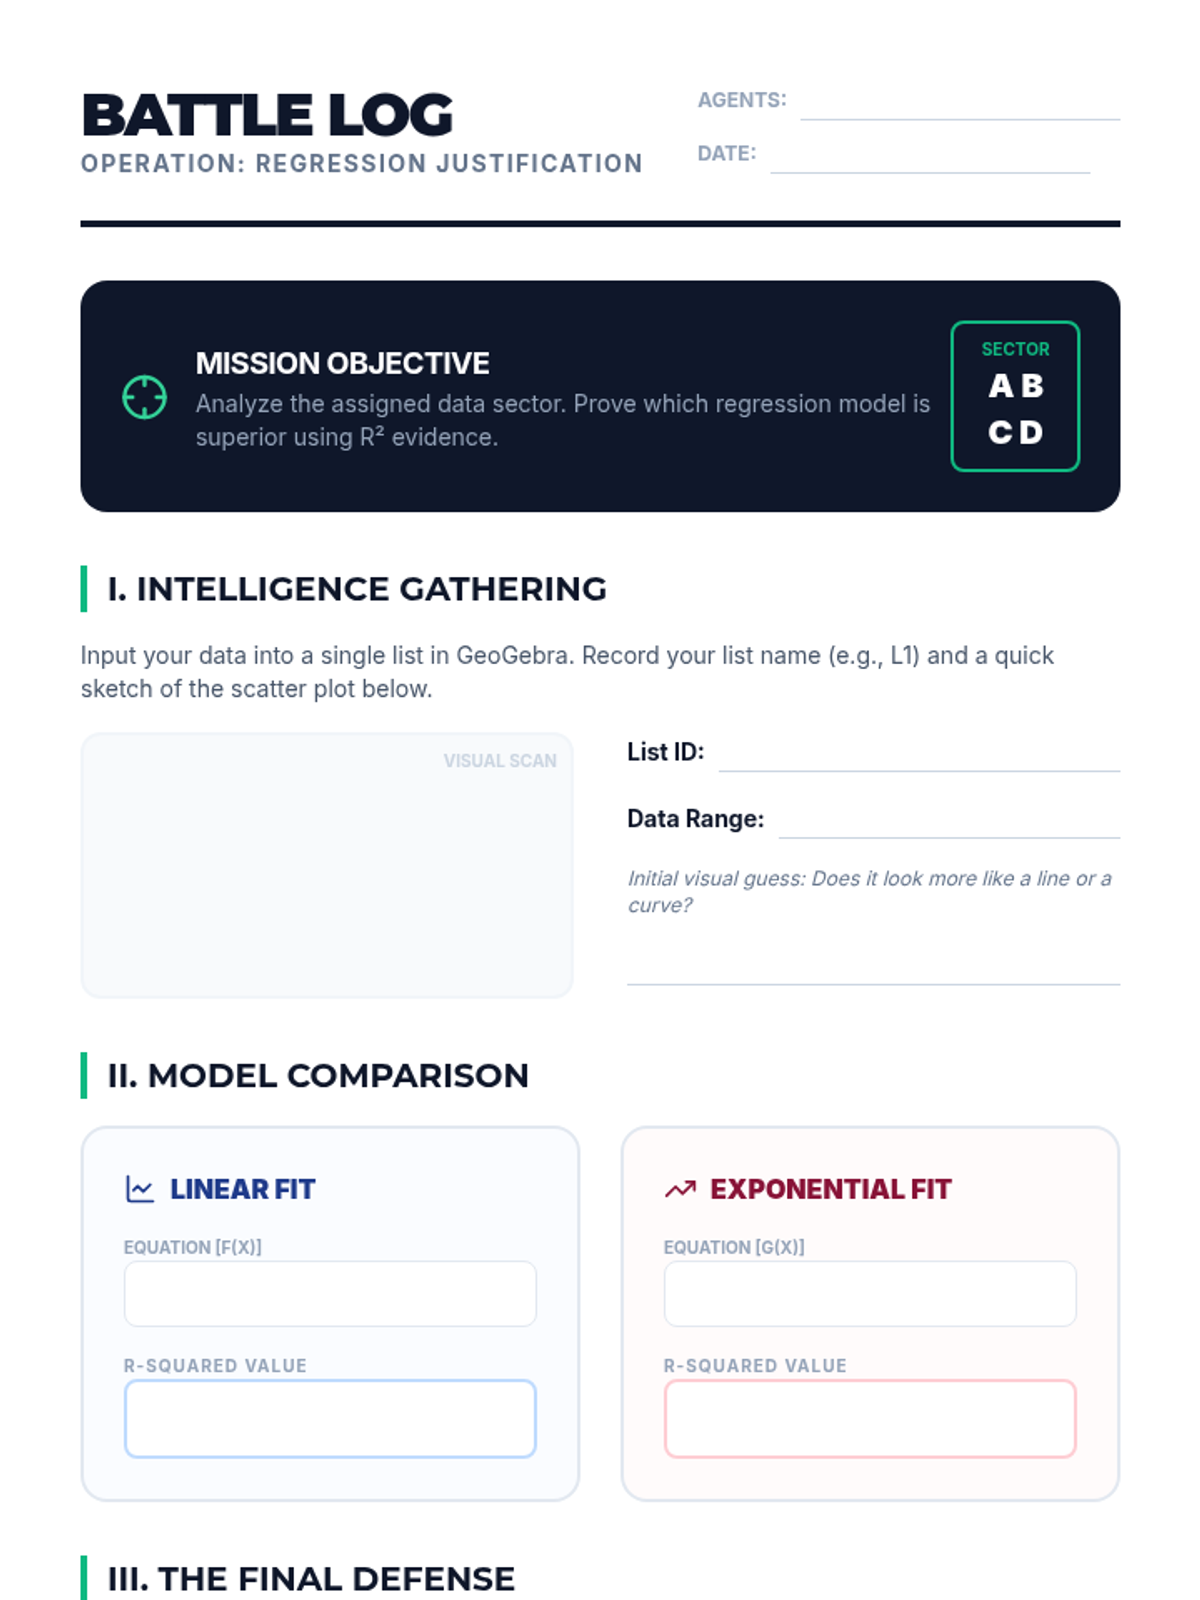
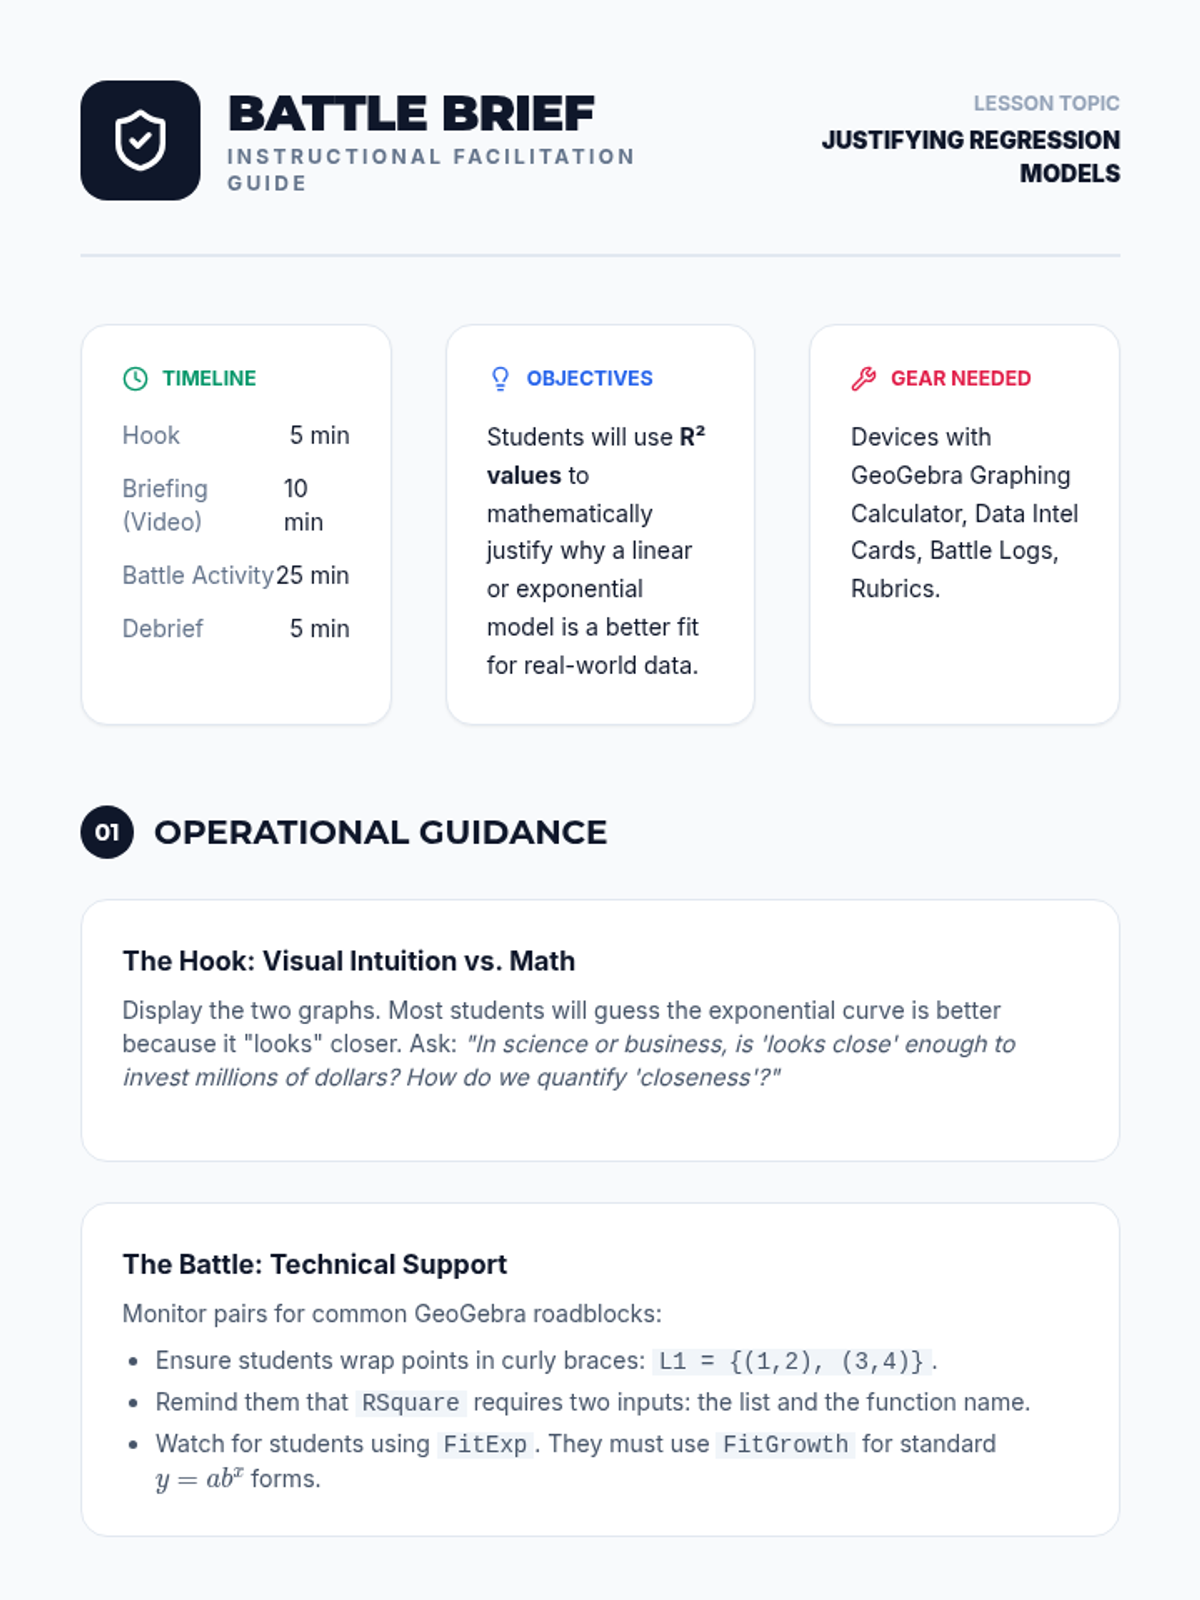
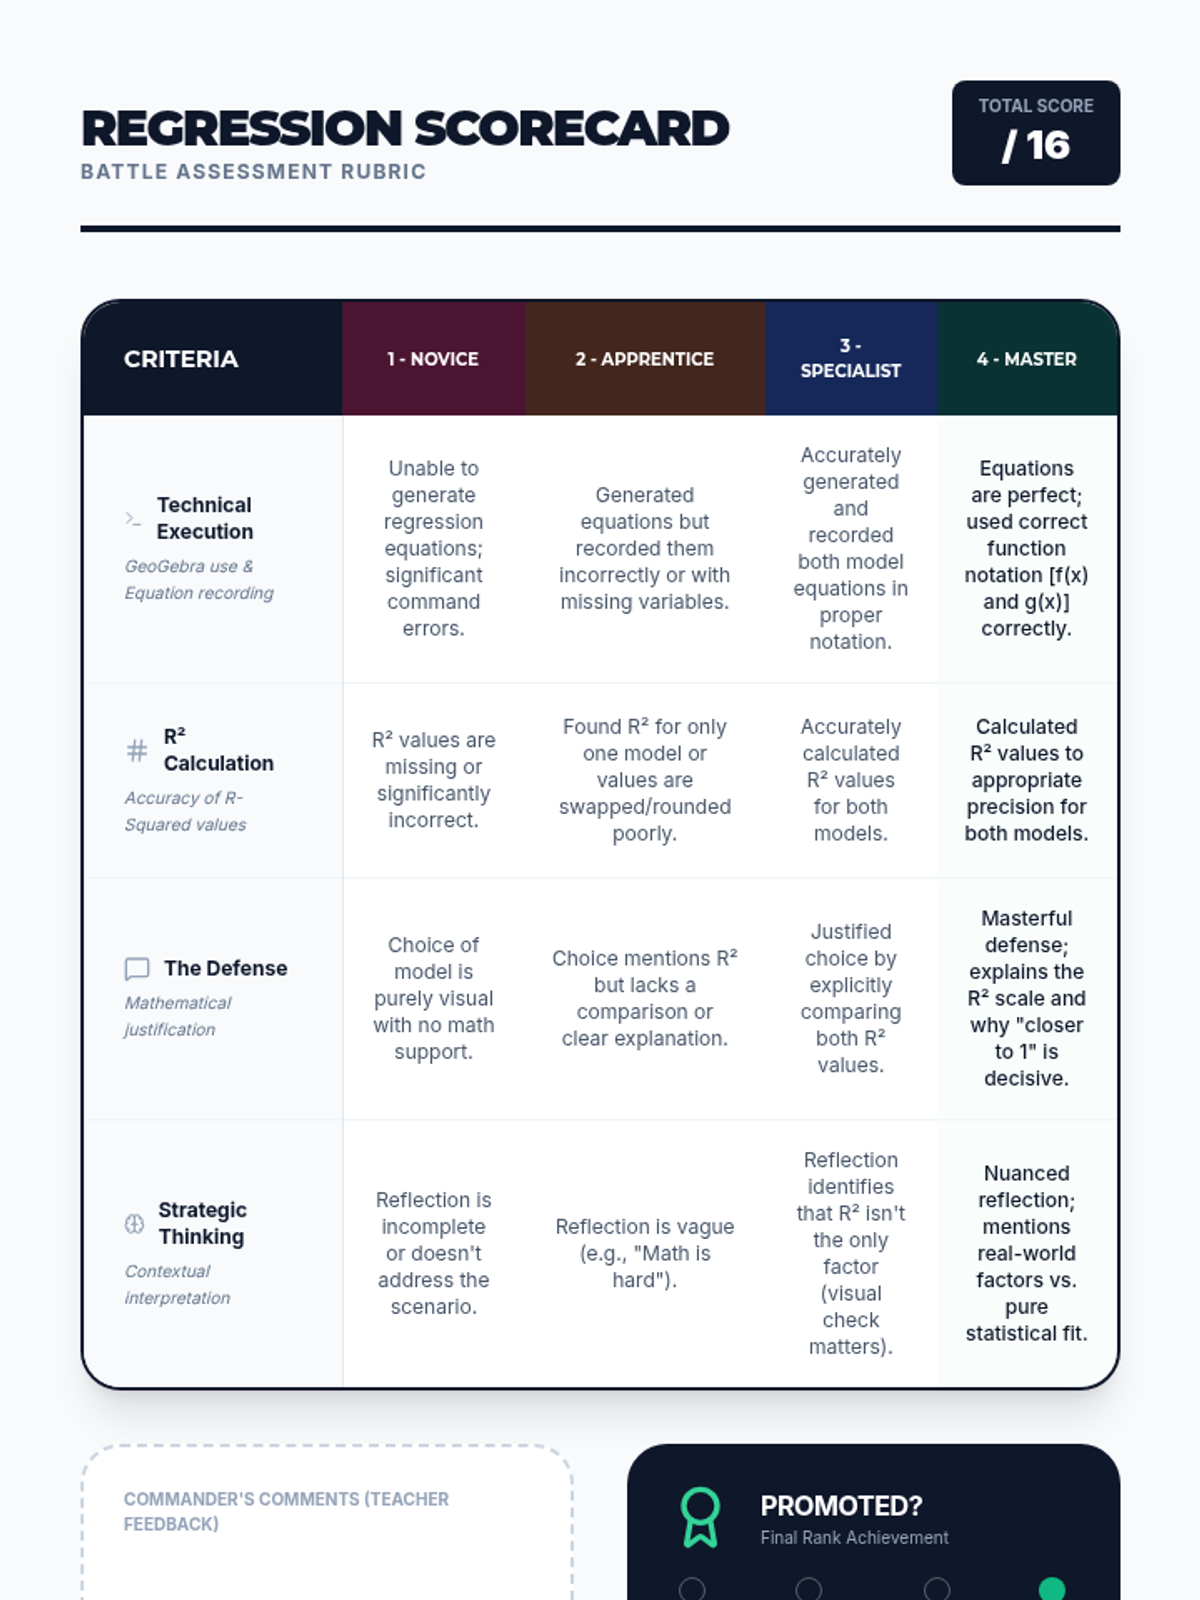
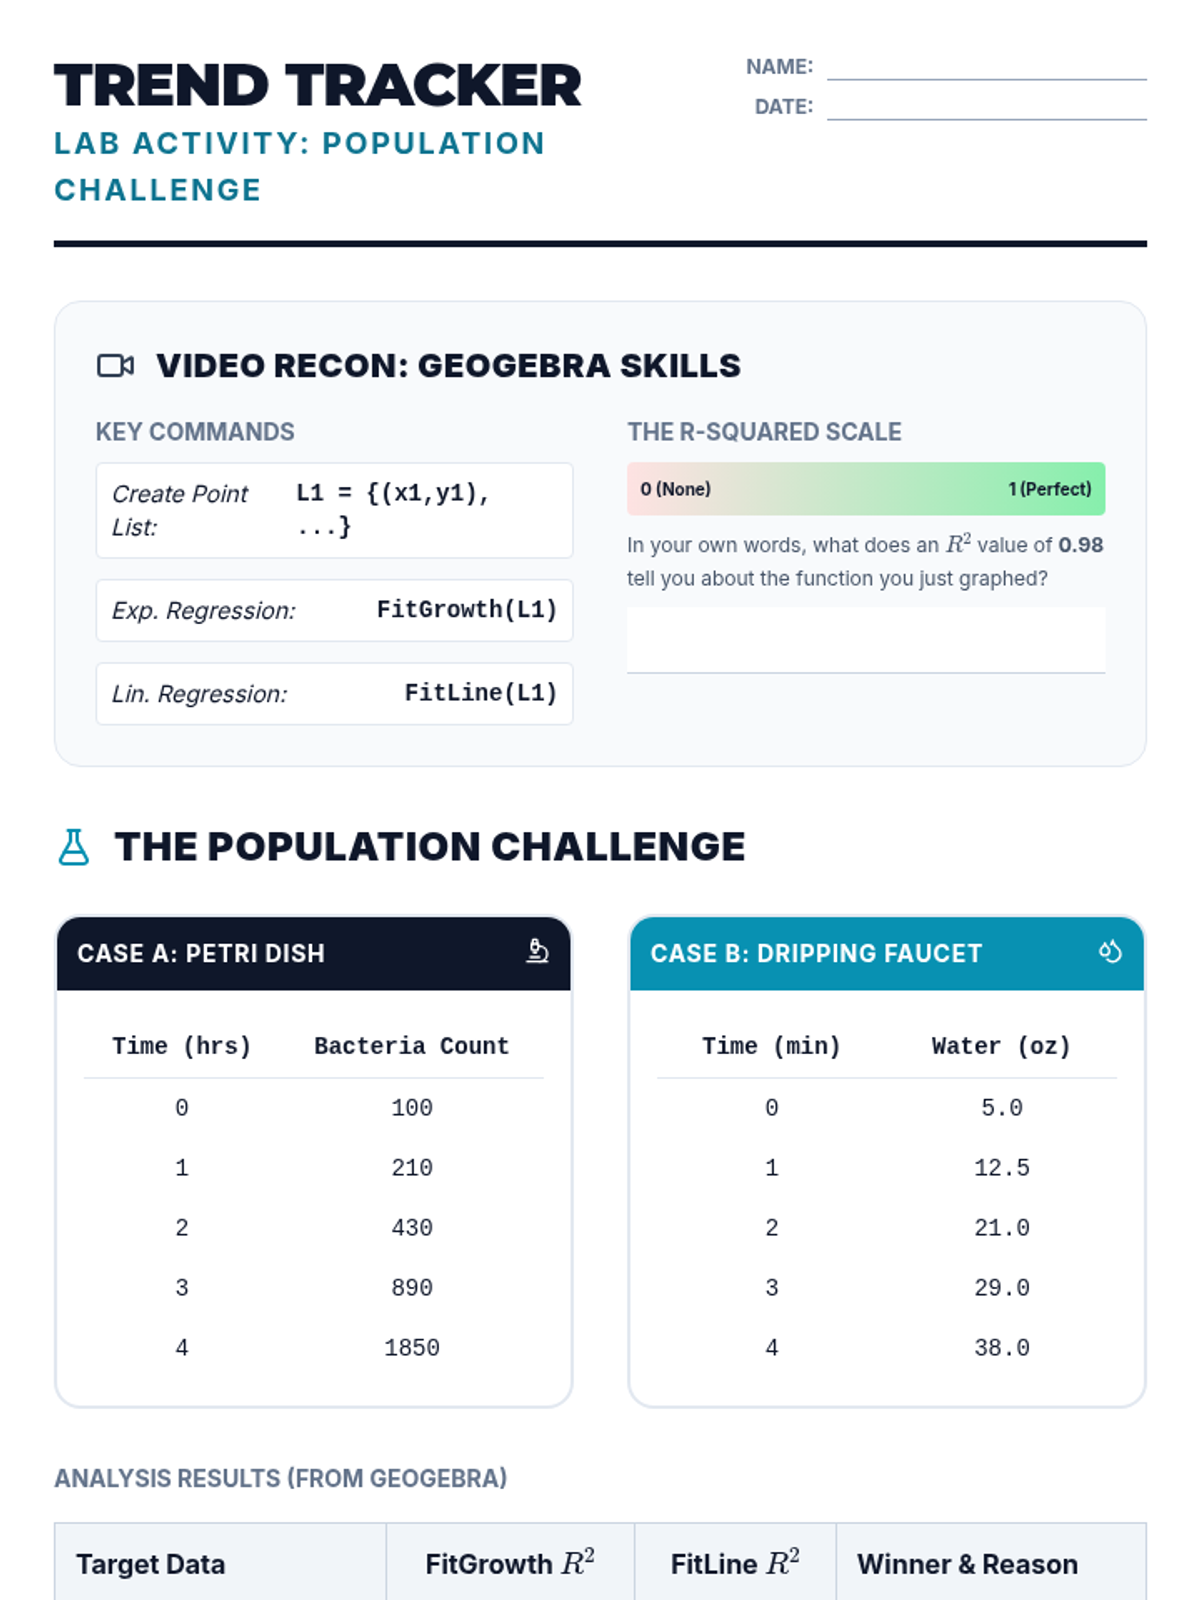
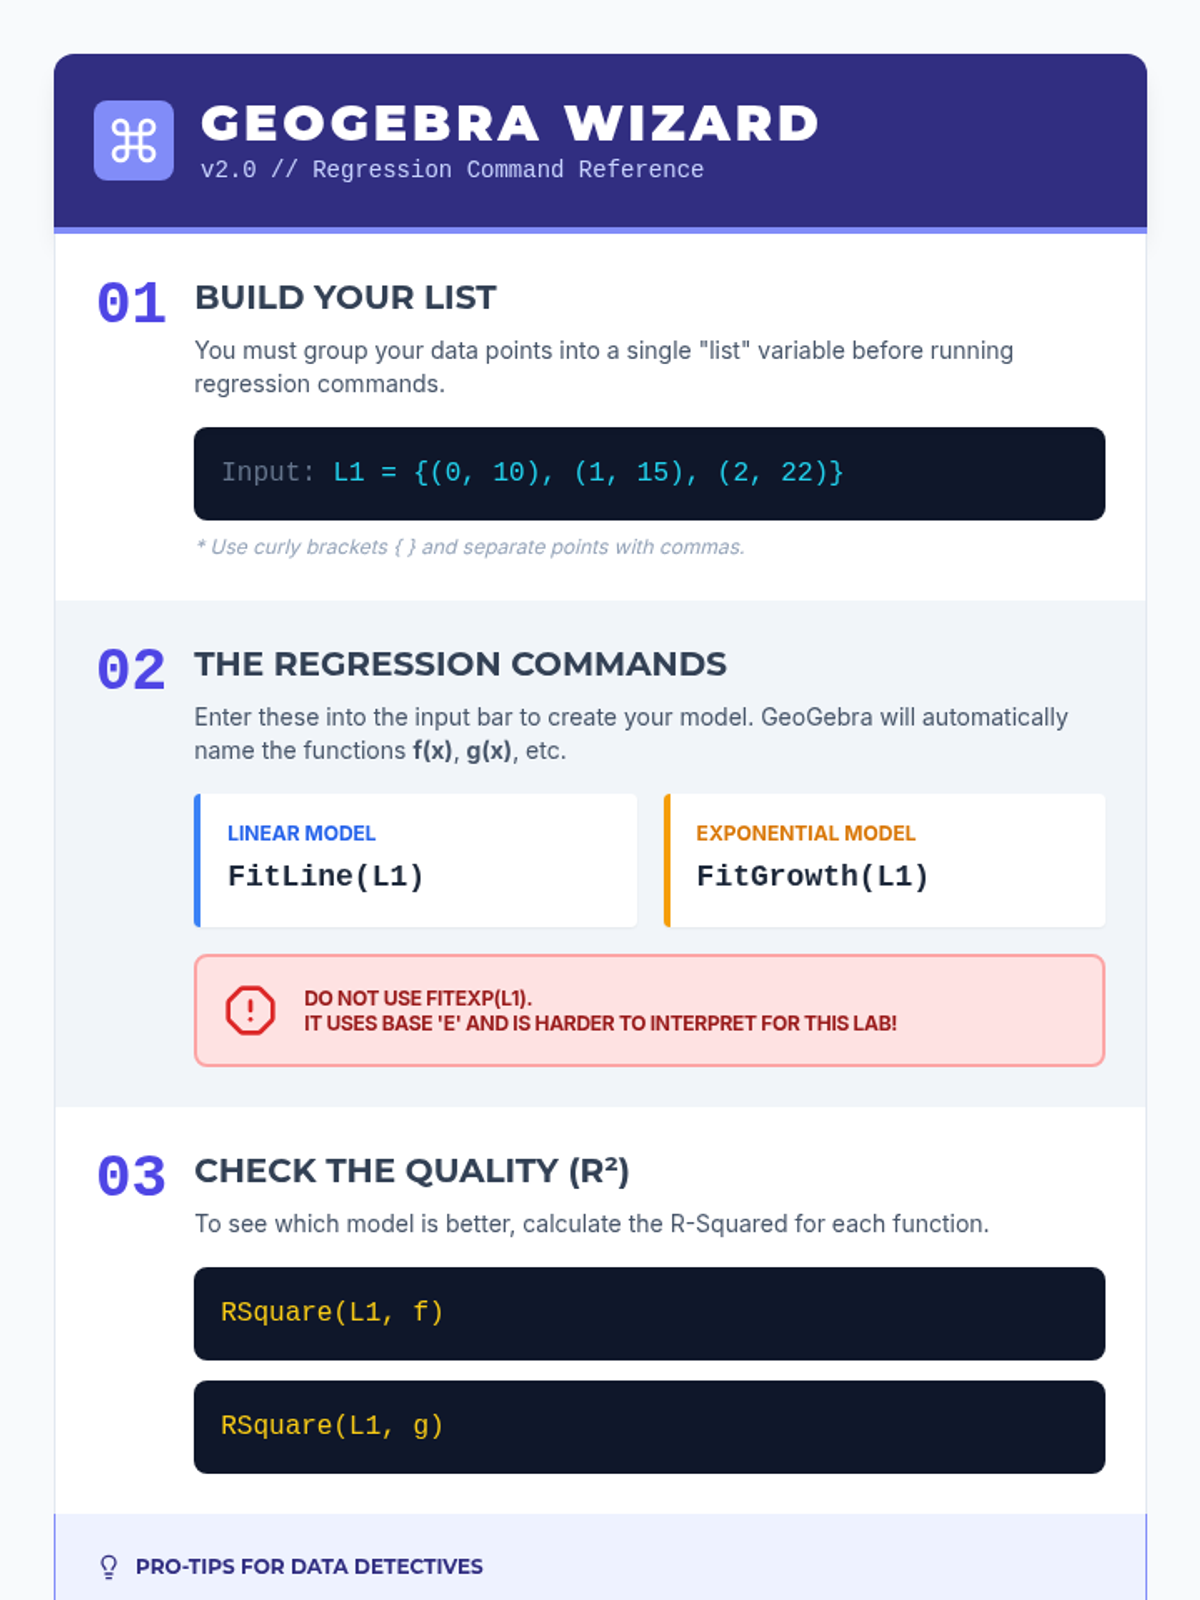
Students will learn to use the R-squared value in GeoGebra to mathematically justify the choice between linear and exponential regression models through a competitive 'Regression Battle' activity.
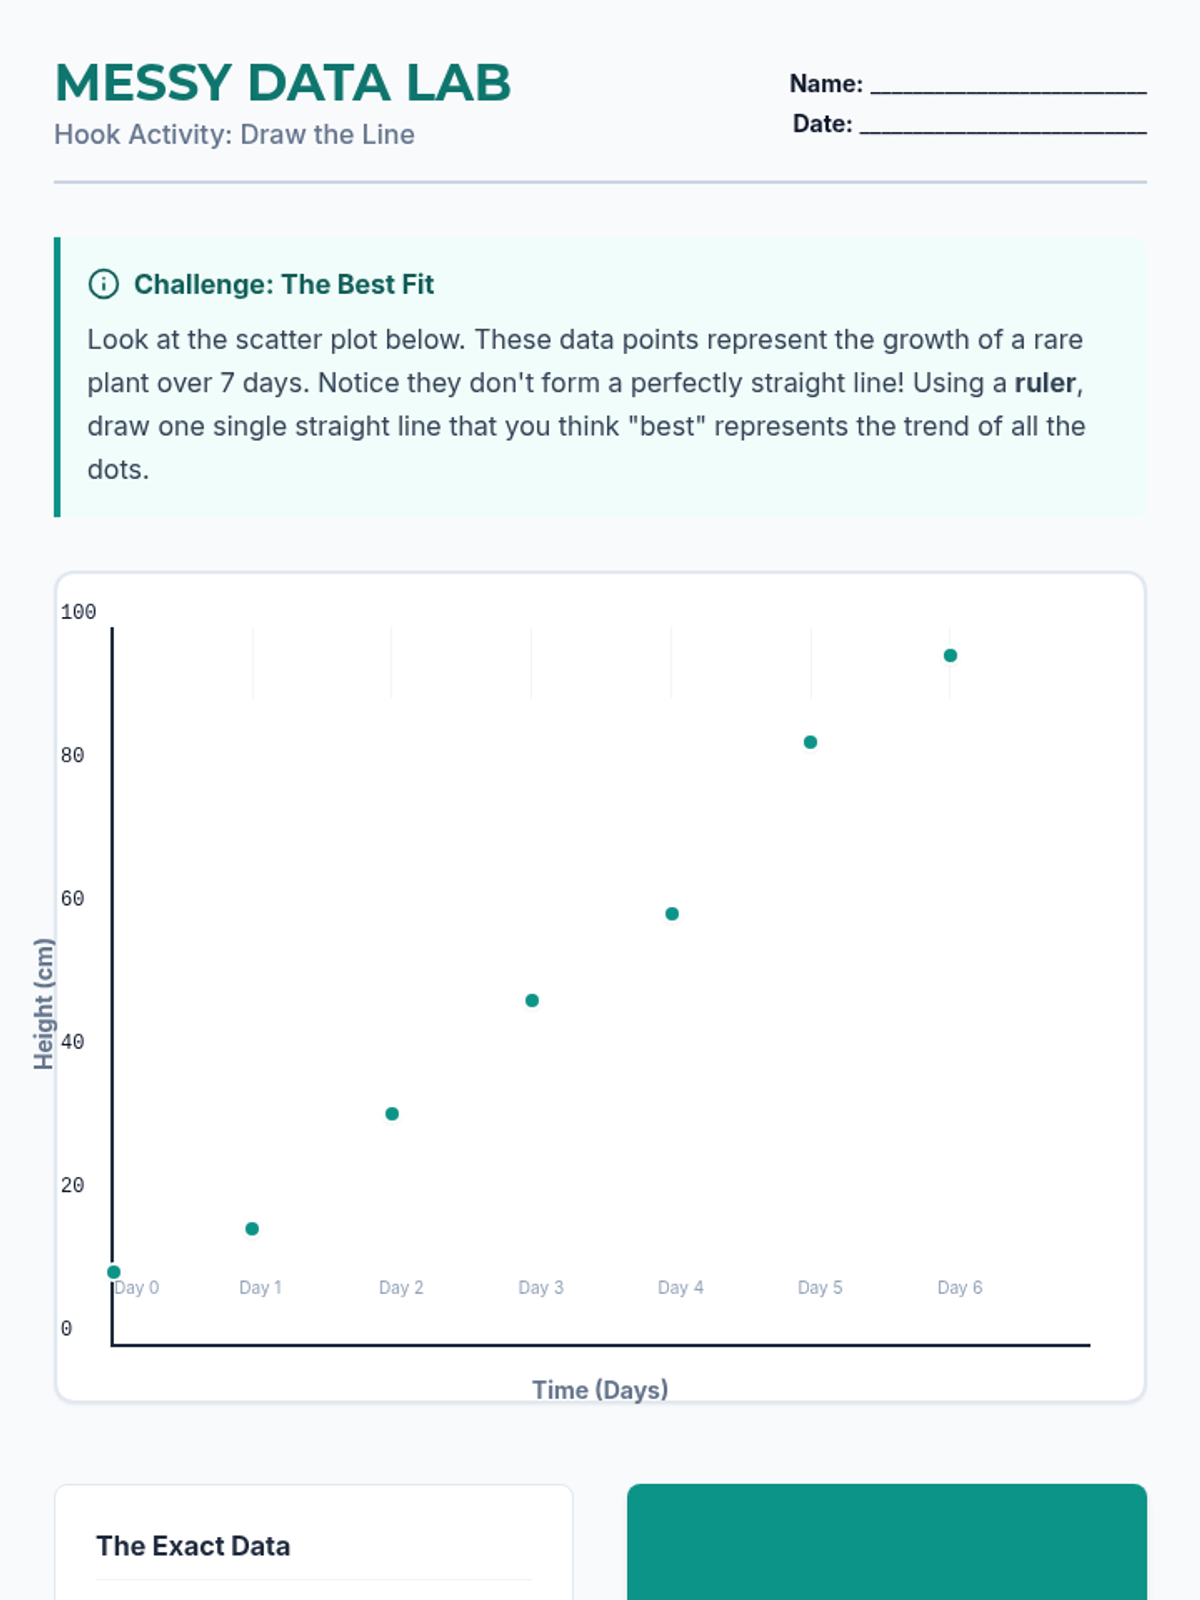
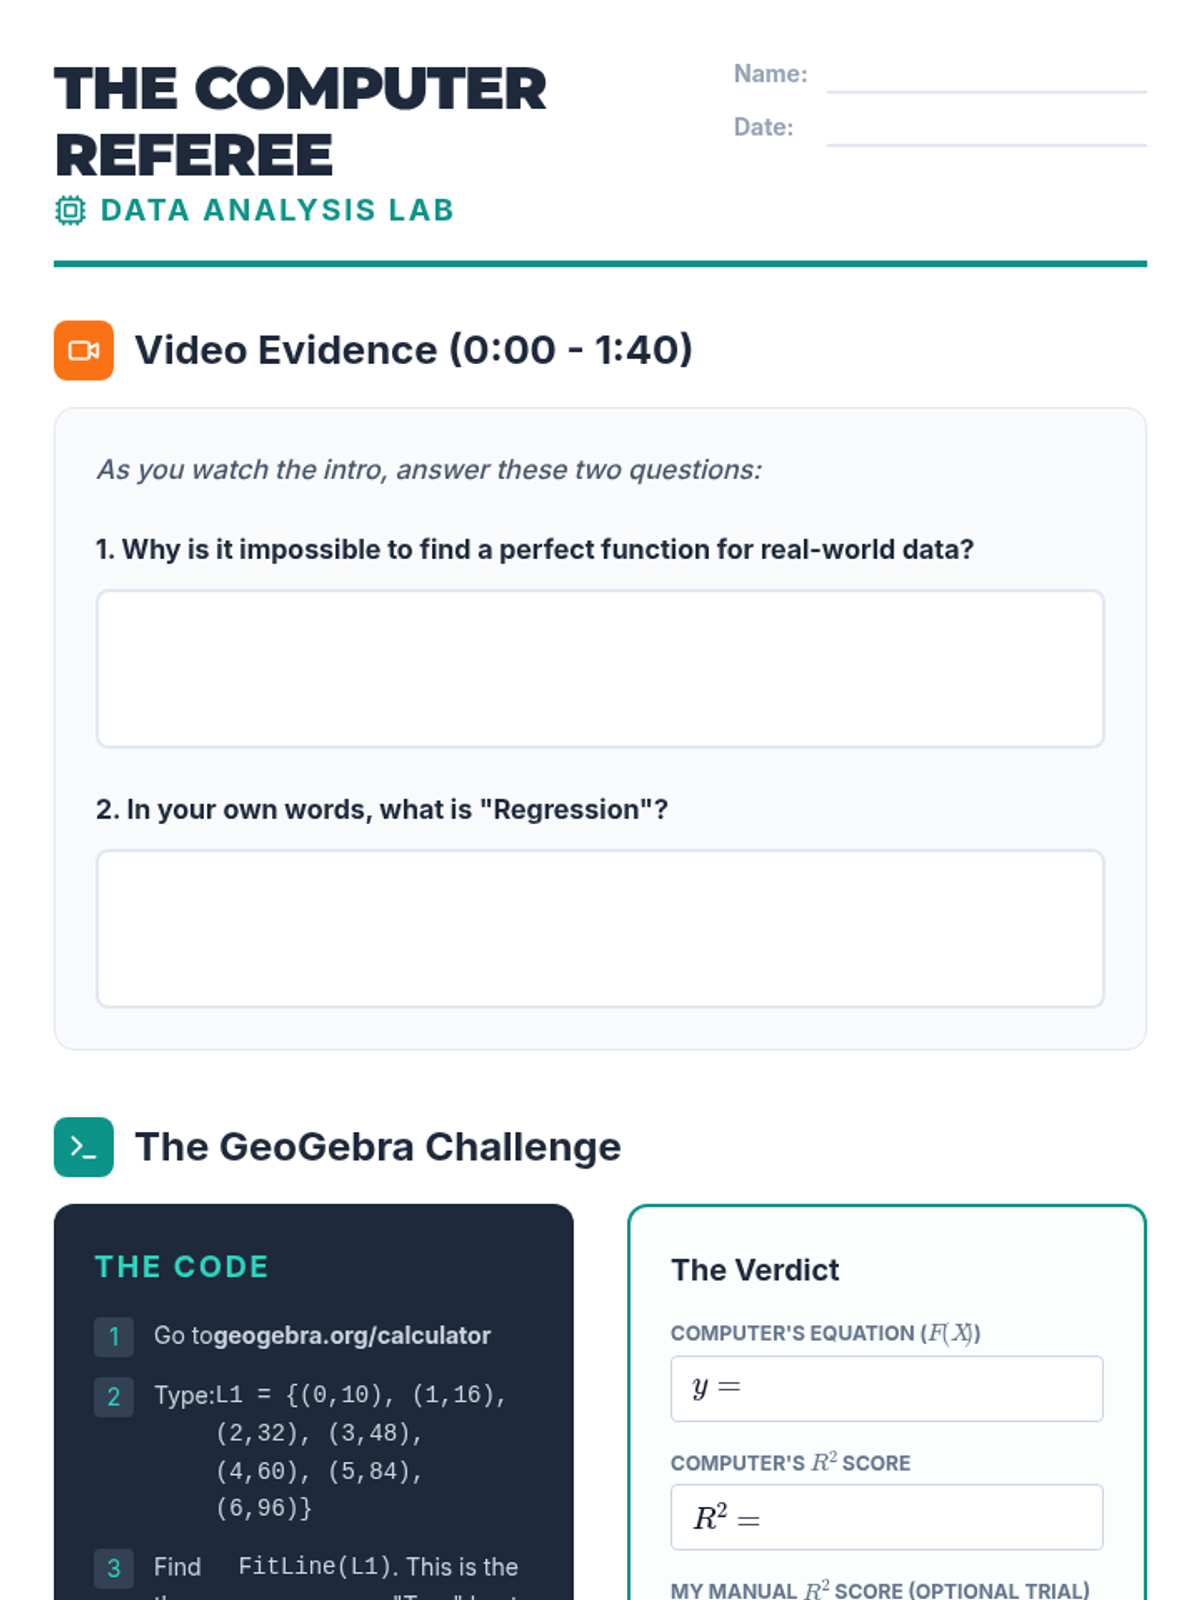
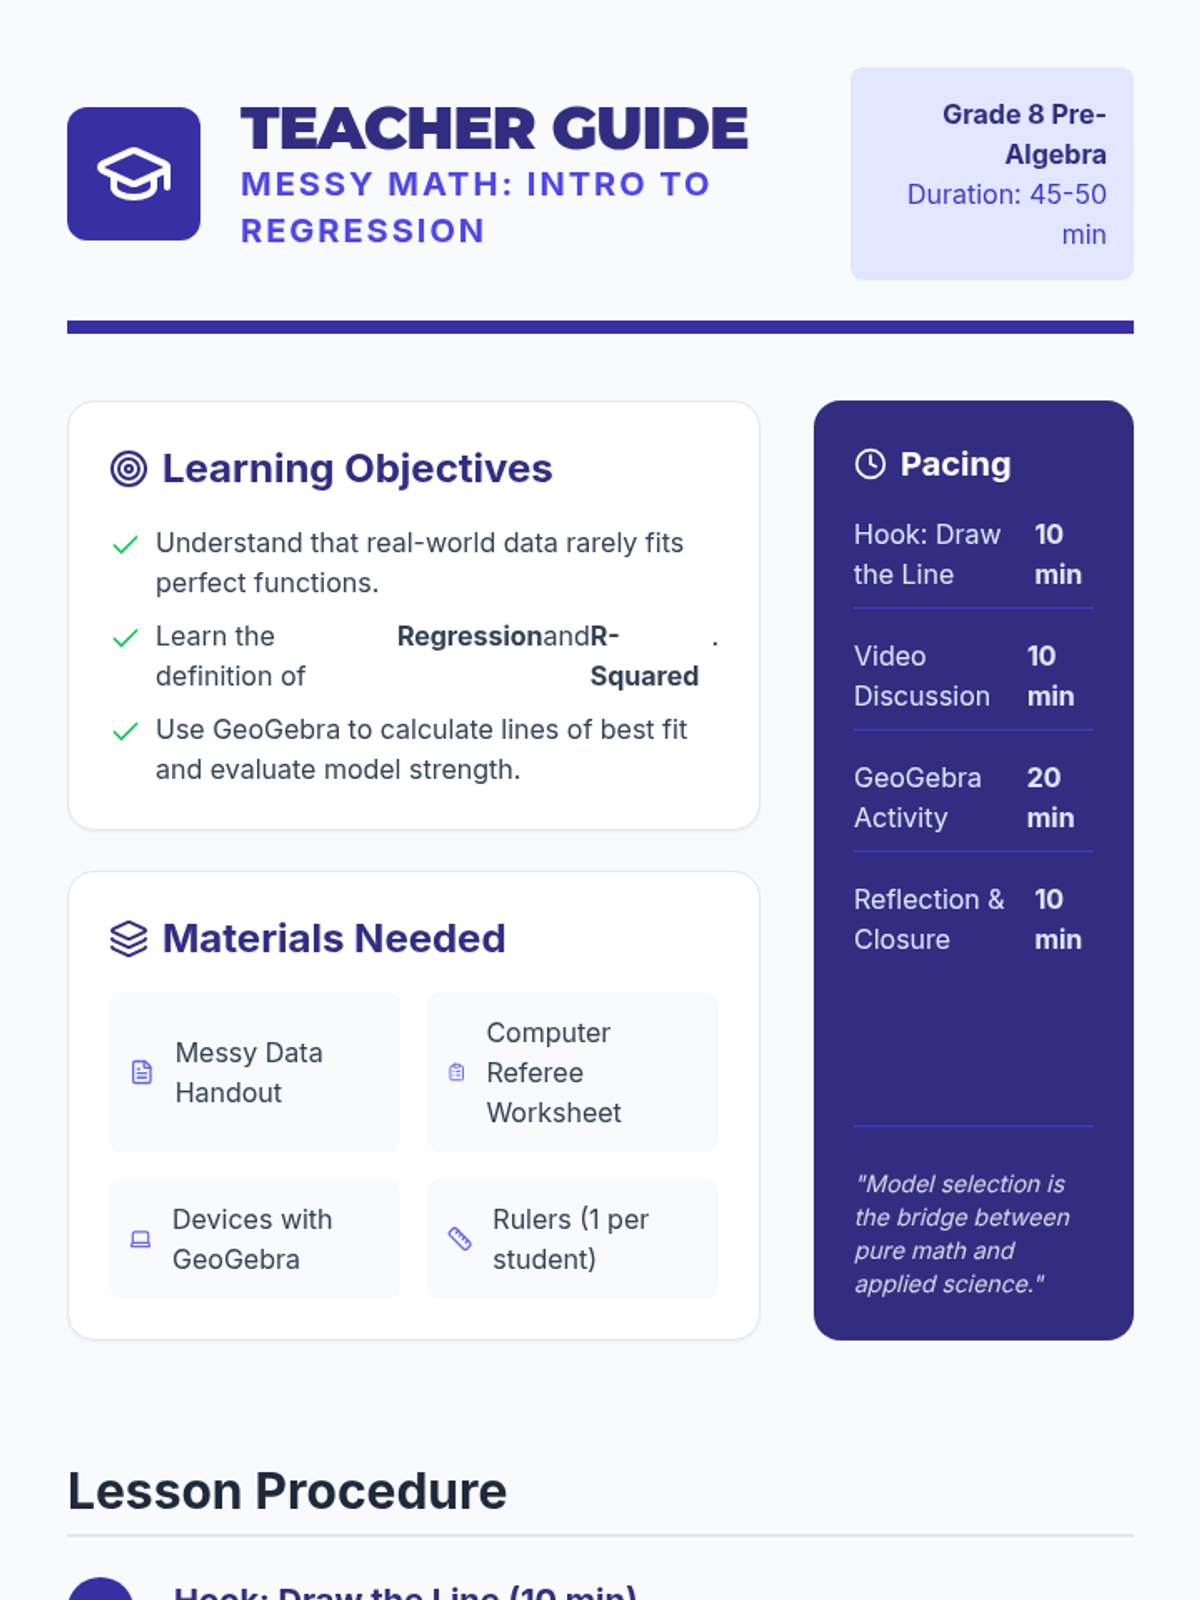
A lesson introducing students to regression and the 'line of best fit' by moving from manual estimation to computer-aided modeling using real-world messy data.
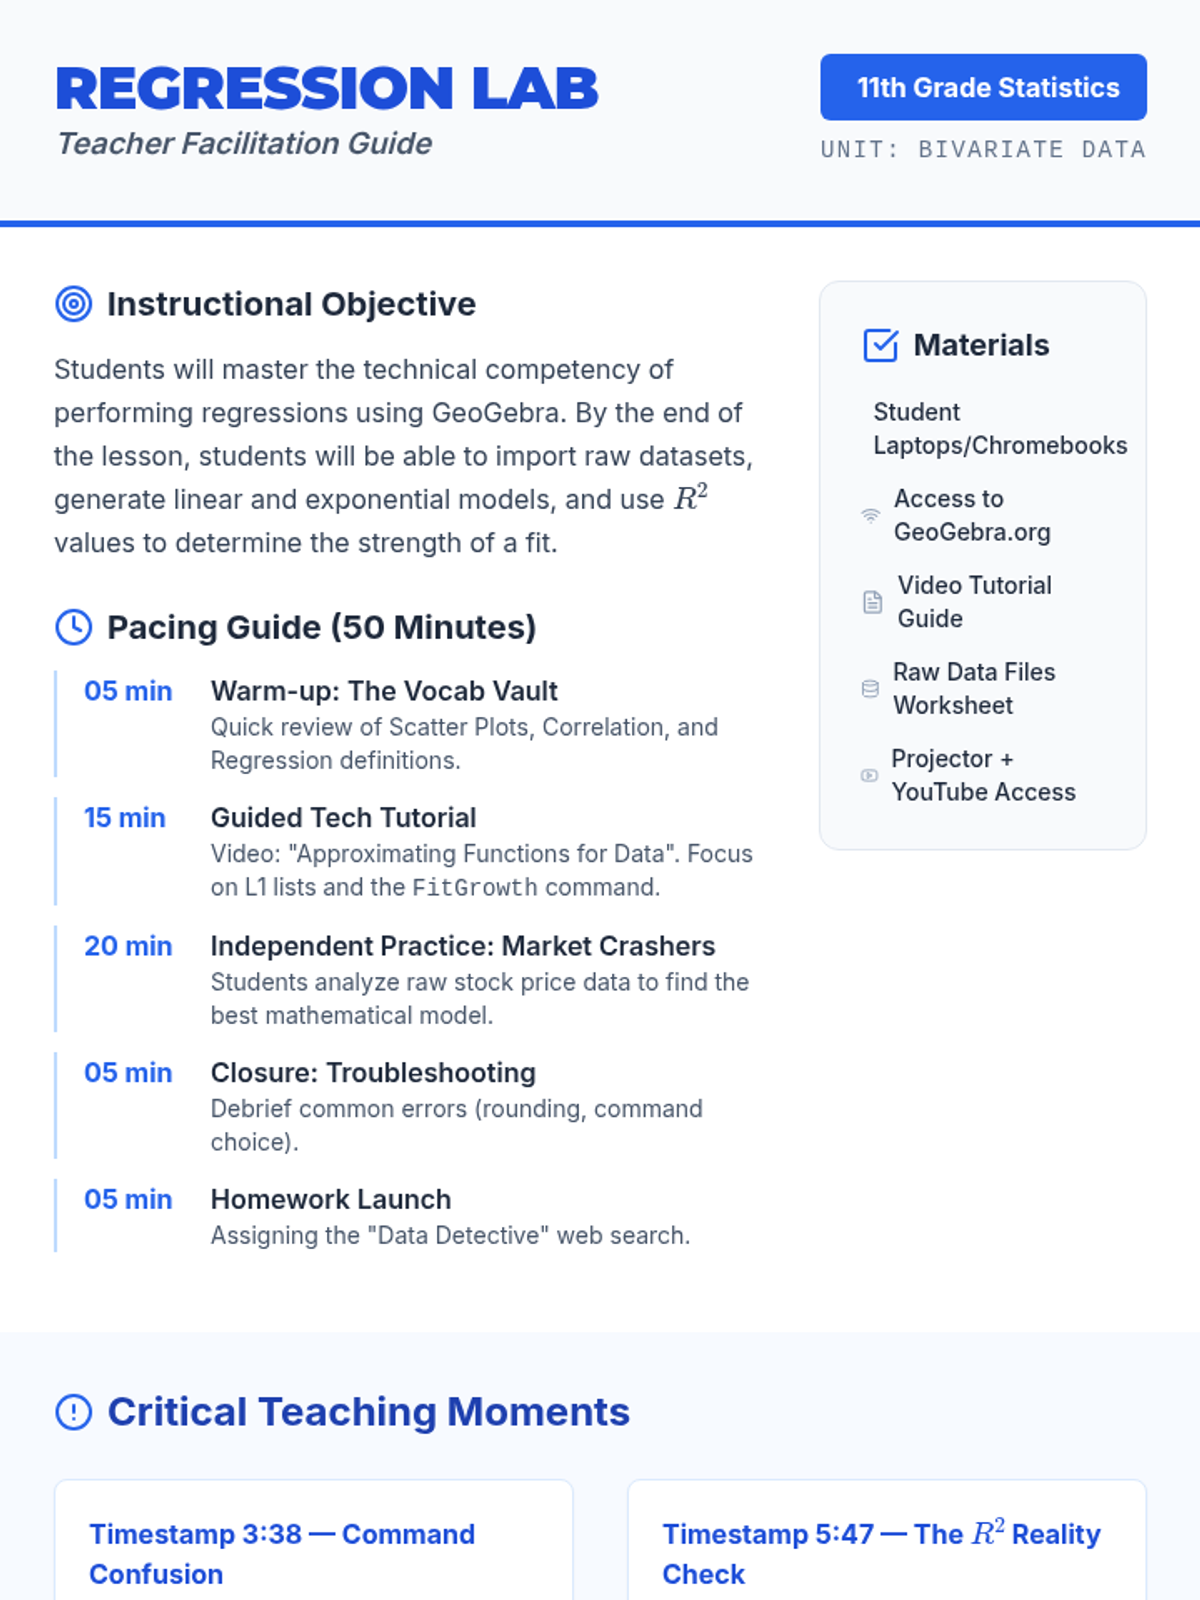
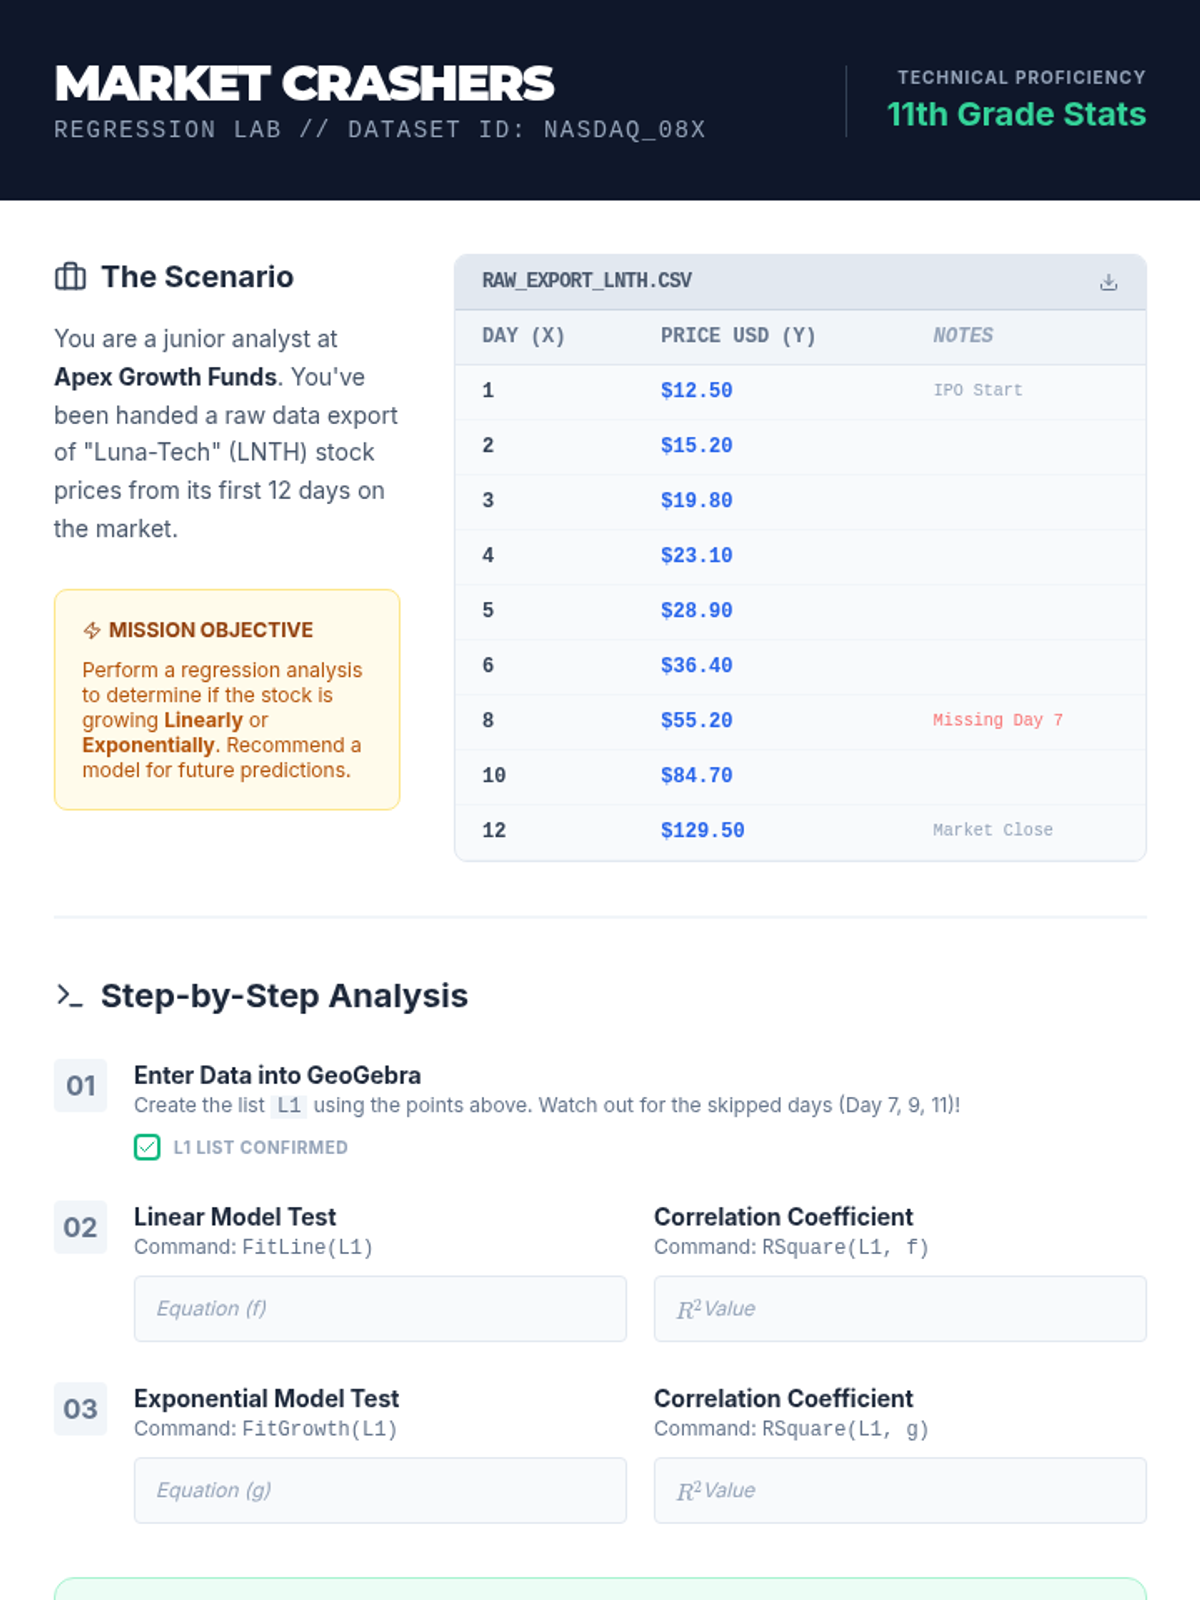
Students transition from textbook-perfect functions to real-world data analysis using GeoGebra. They will learn to perform linear and exponential regressions, interpret the R-squared value to determine the best fit, and apply these skills to distinguish between population growth and linear accumulation.
A technical, hands-on lesson teaching 11th-grade students how to perform linear and exponential regressions using GeoGebra, transitioning from textbook examples to messy real-world data analysis.
A high school interdisciplinary lesson connecting physics and algebra. Students analyze real-world lab data using linear and exponential regression in GeoGebra, exploring why experimental data rarely fits perfect mathematical models and how R-squared measures the quality of a fit.
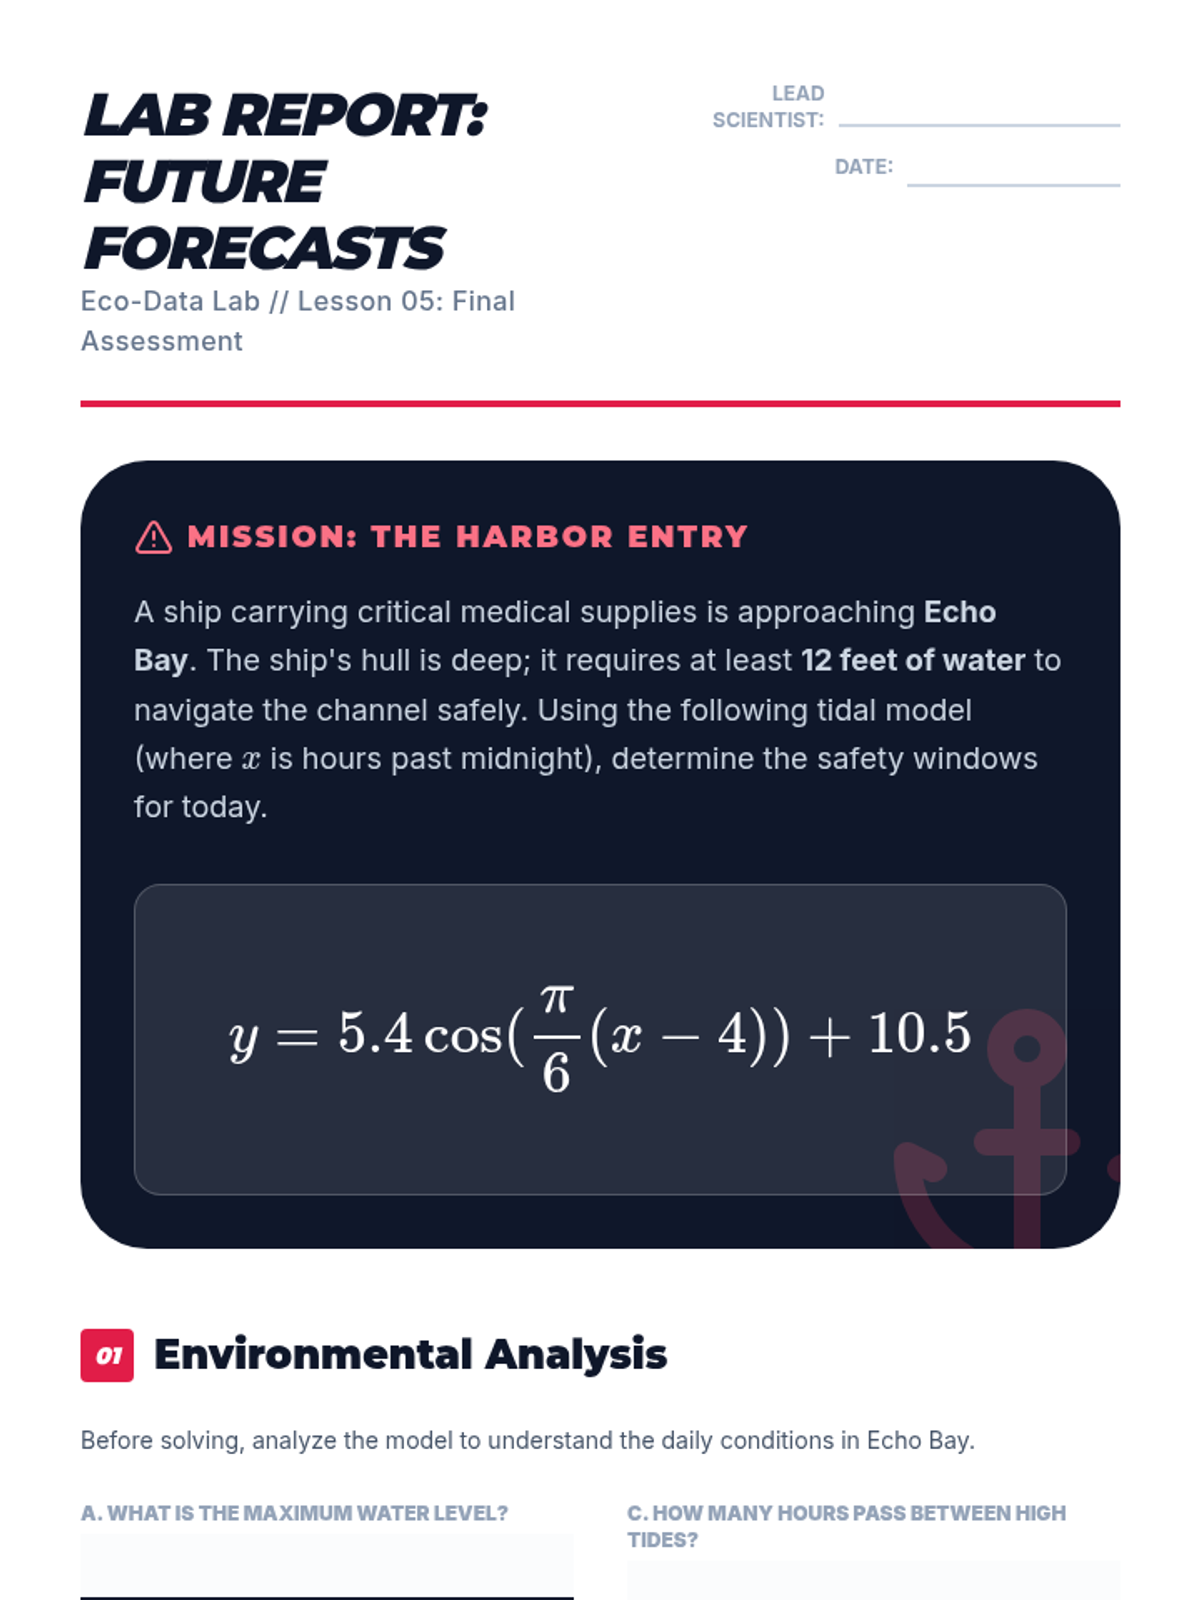
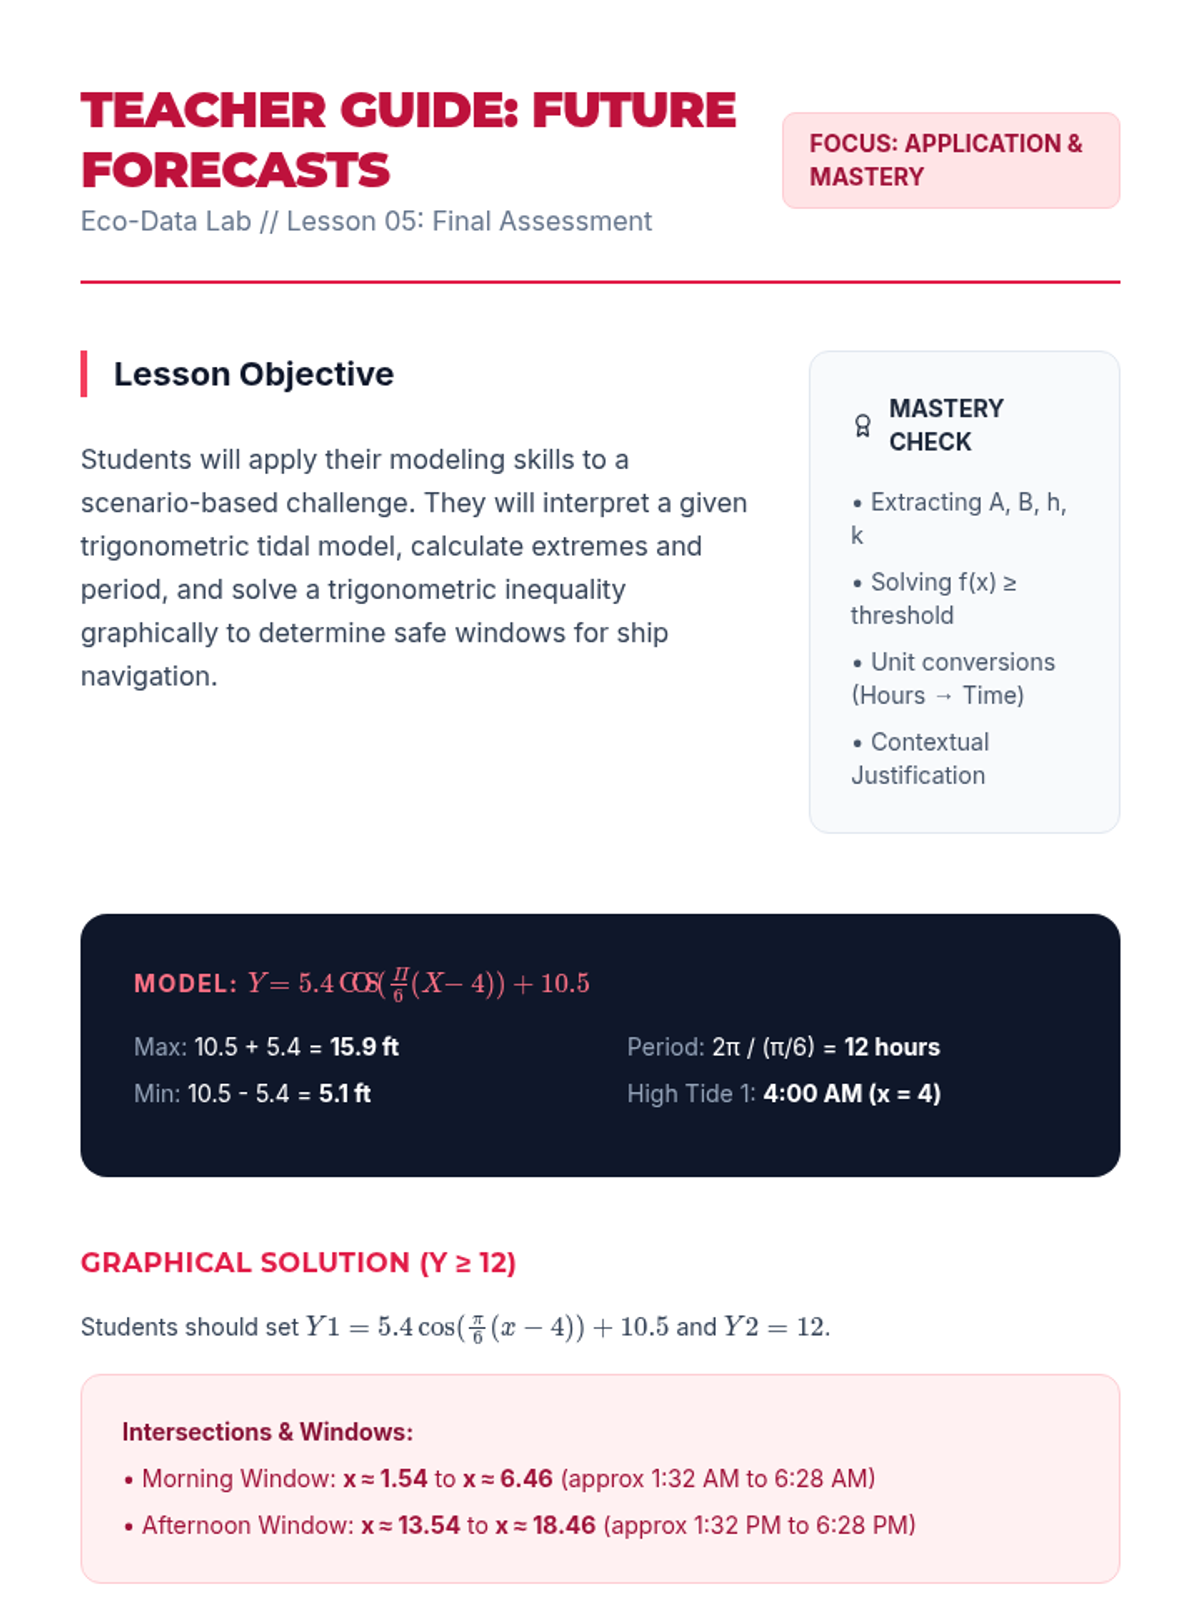
Students use their constructed models to extrapolate and answer questions about future events, solving trigonometric inequalities graphically.
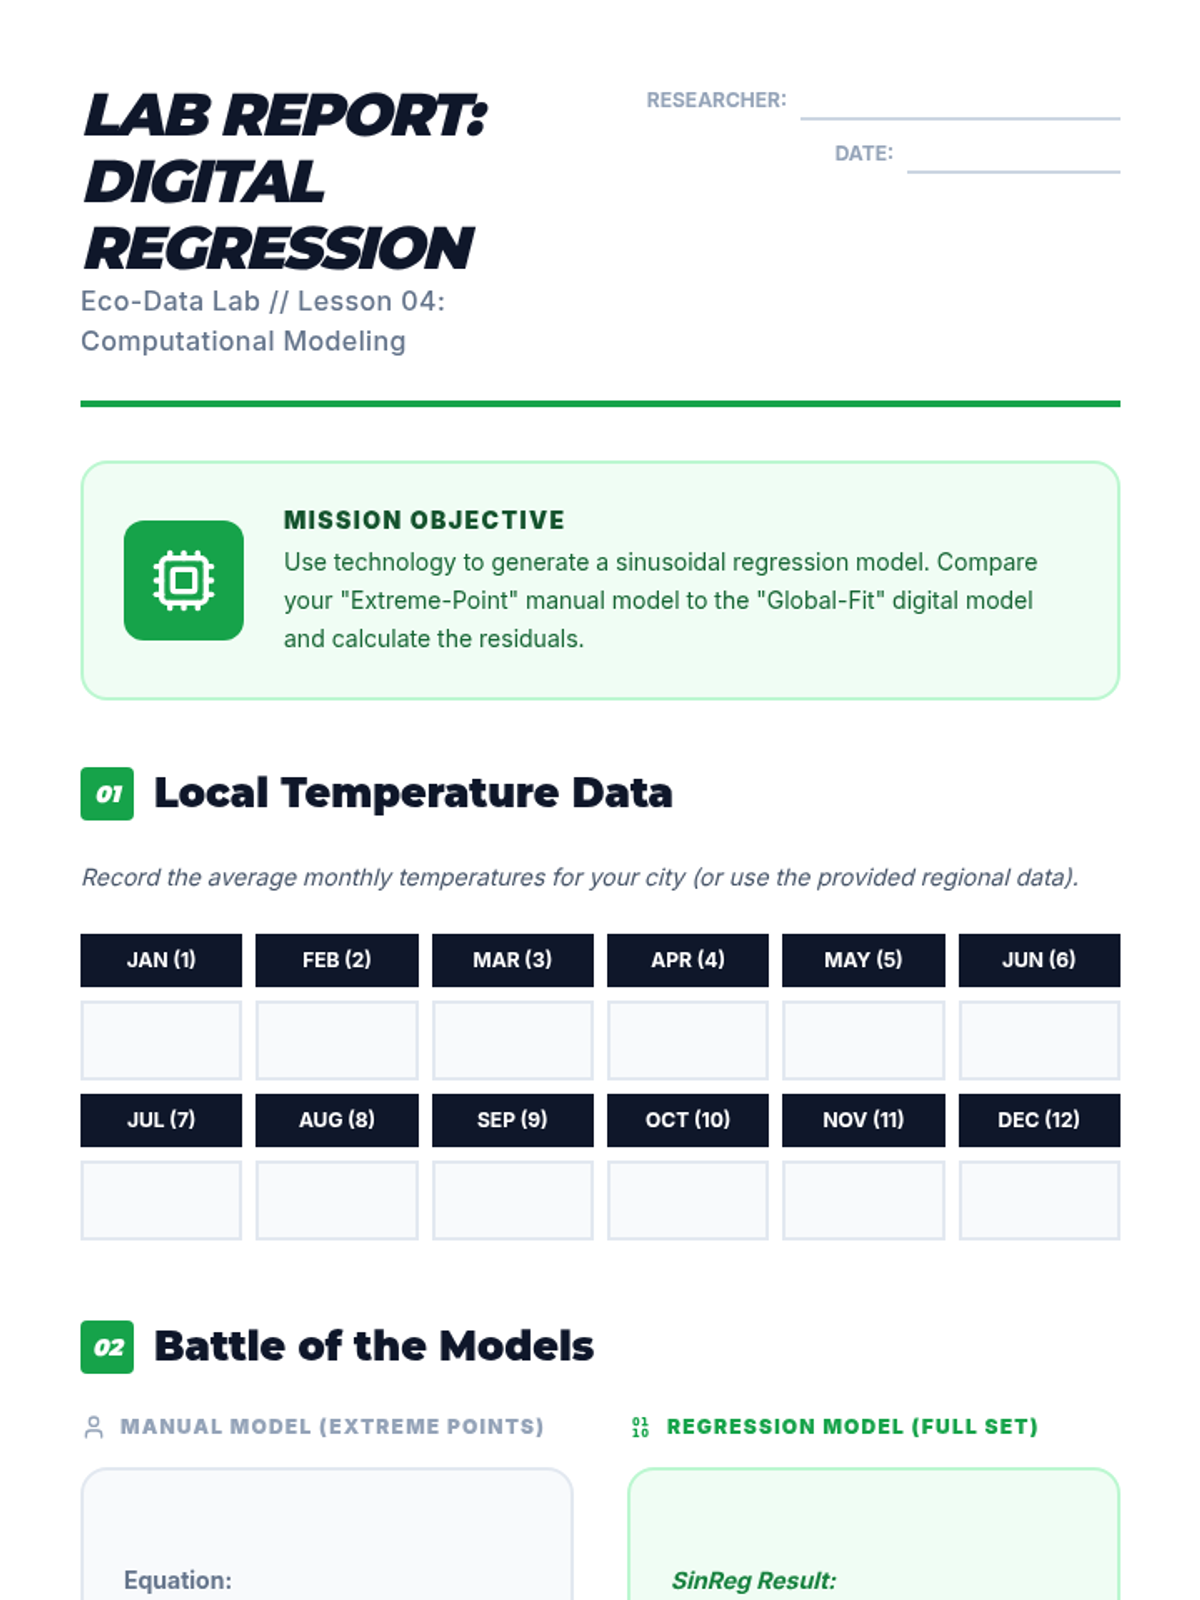
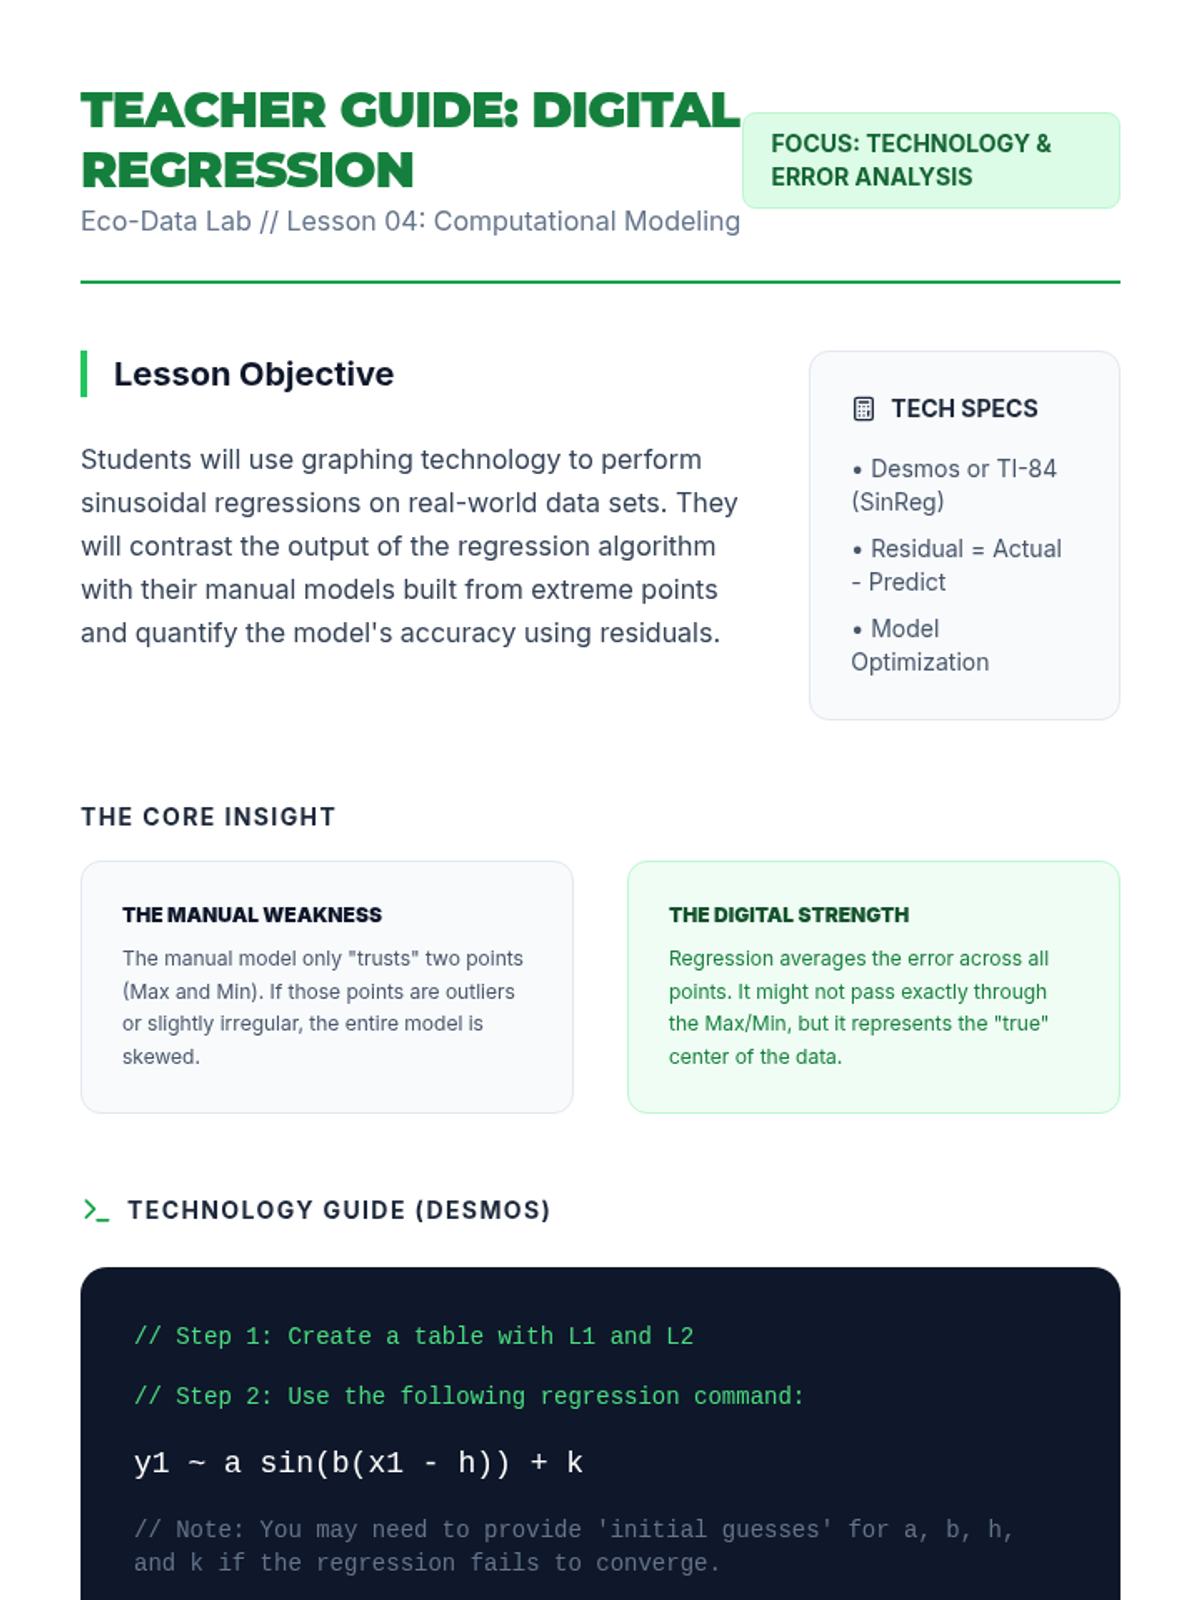
Students use graphing calculators or regression software to fit trigonometric equations to data sets. They compare their hand-calculated models to the regression models.
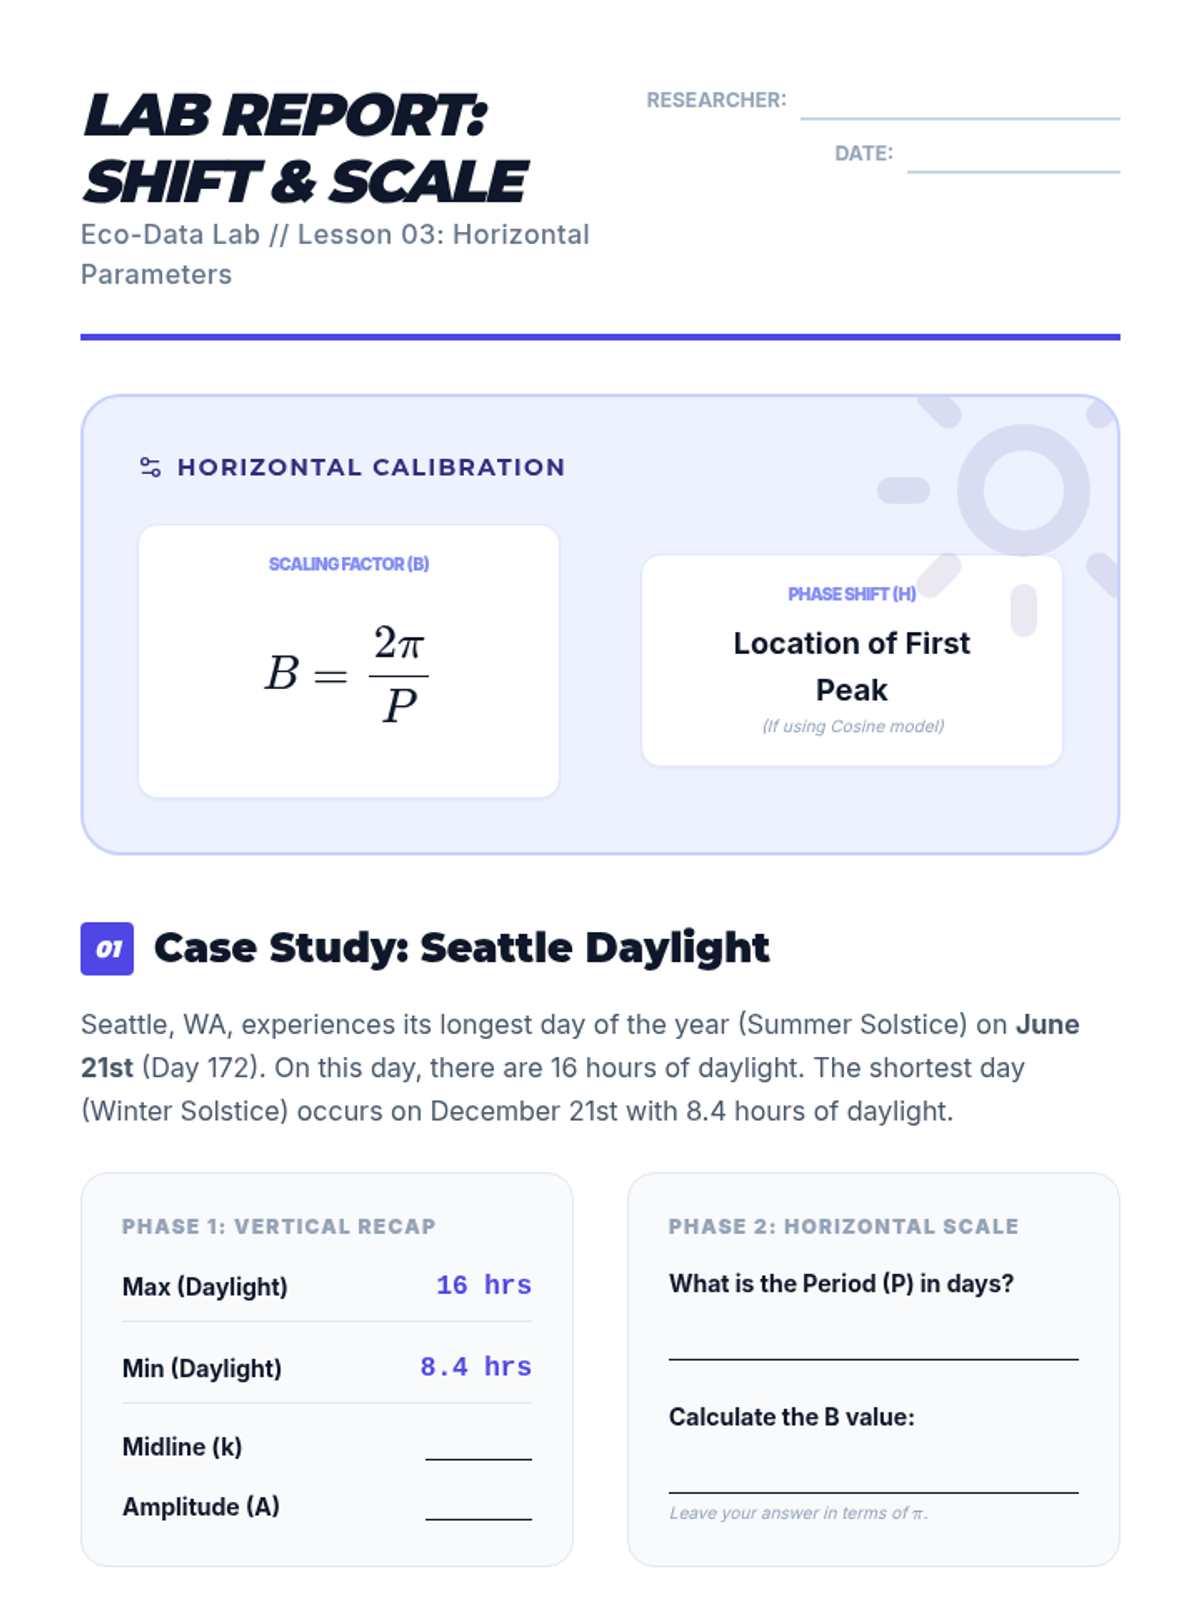
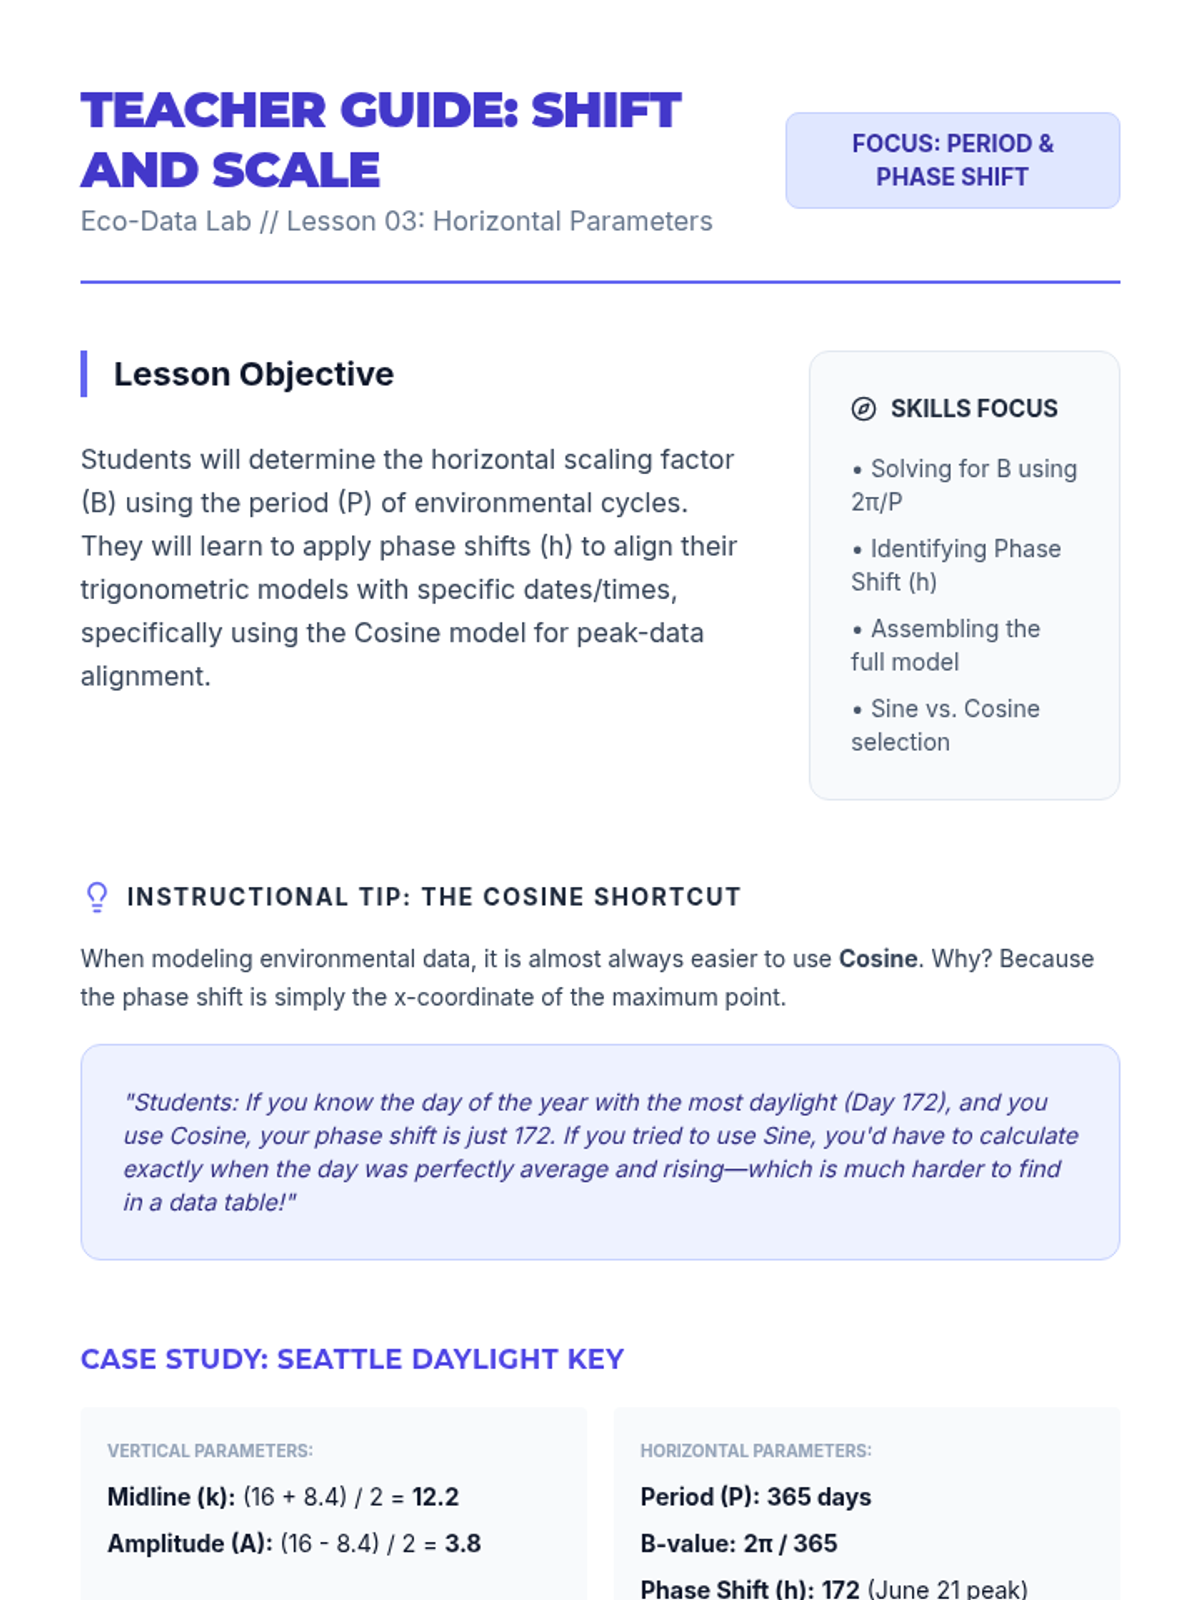
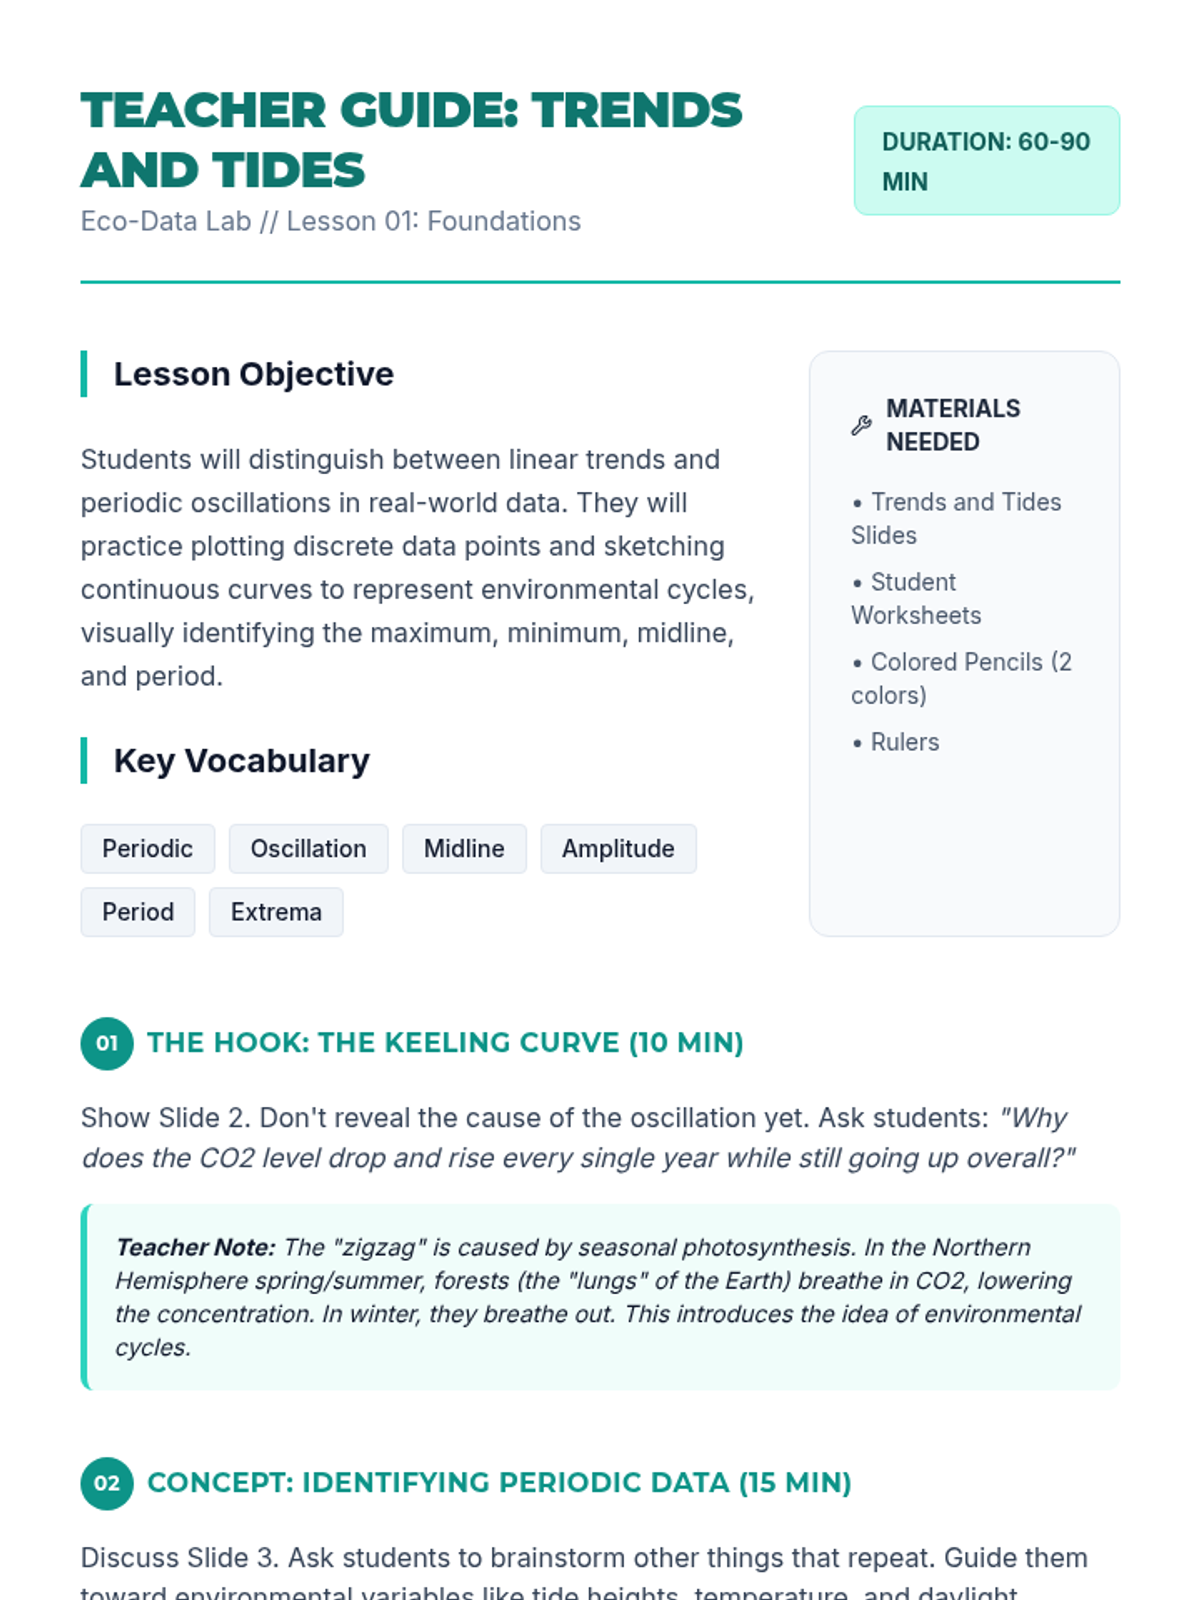
Focusing on the x-axis, students determine the period of real-world cycles. They calculate the horizontal scaling factor and determine appropriate horizontal shifts.
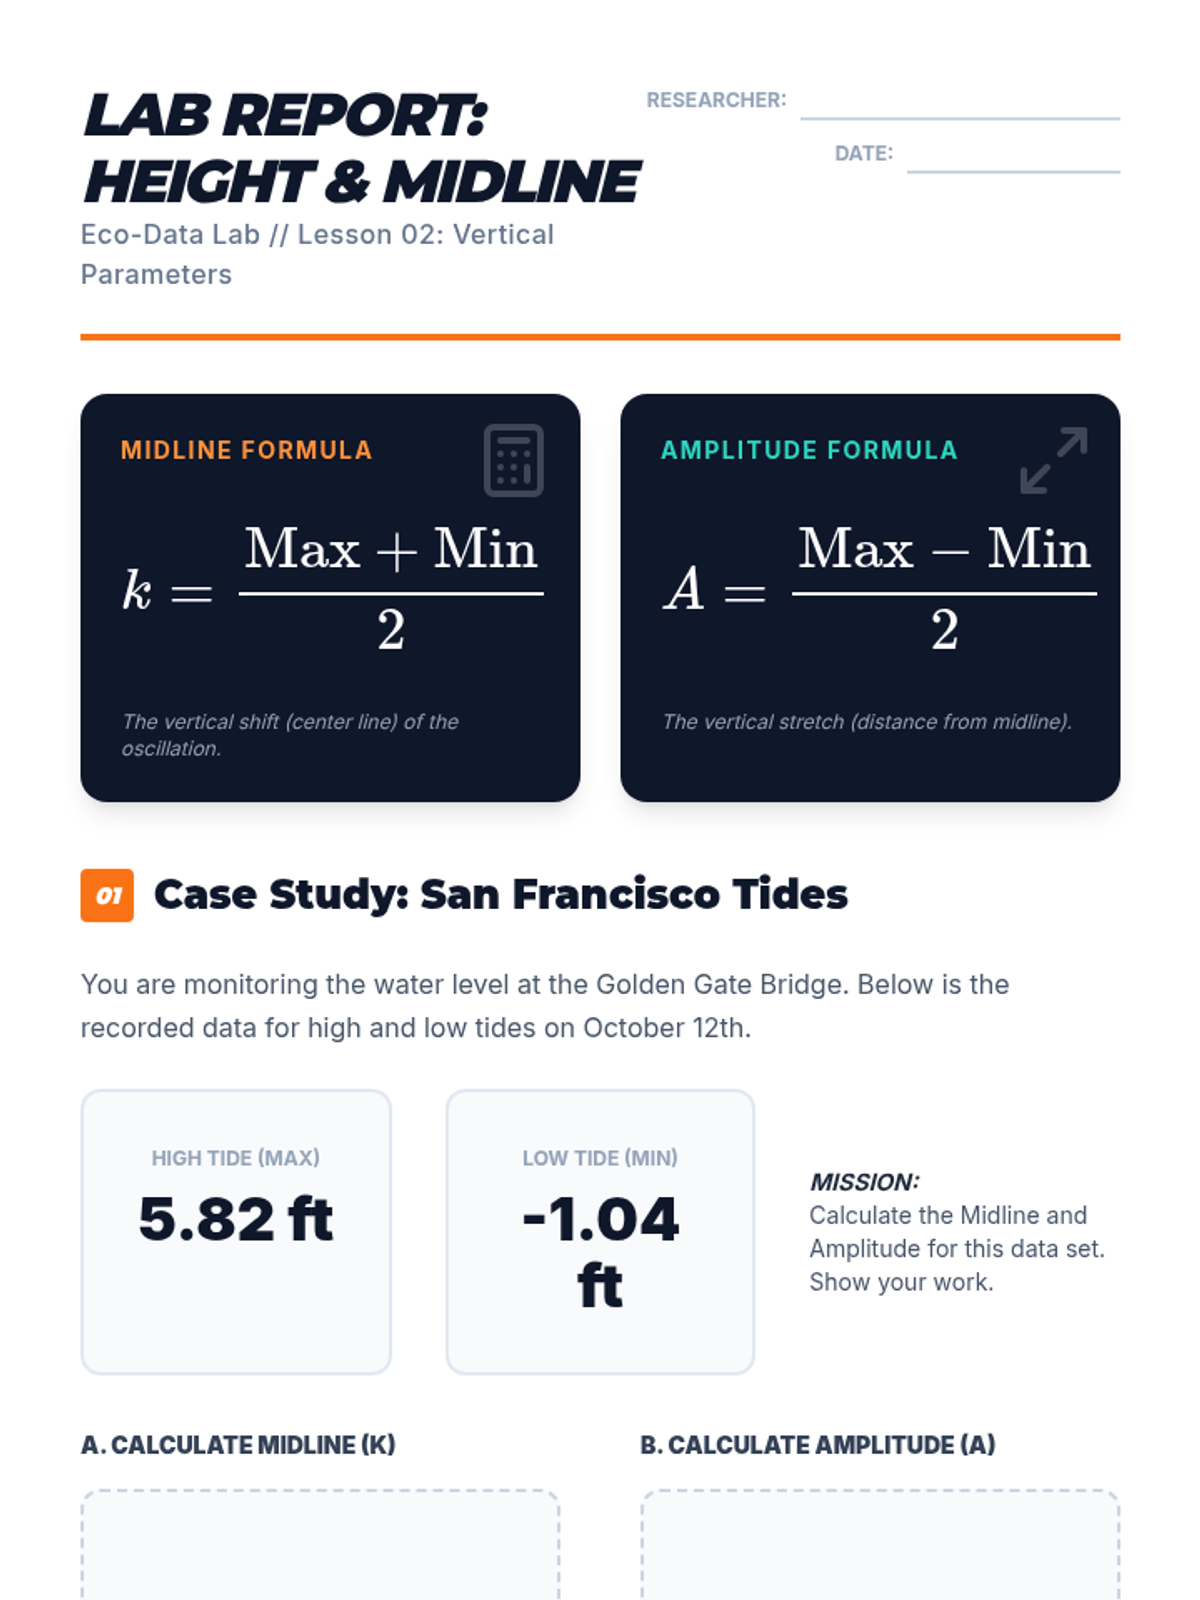
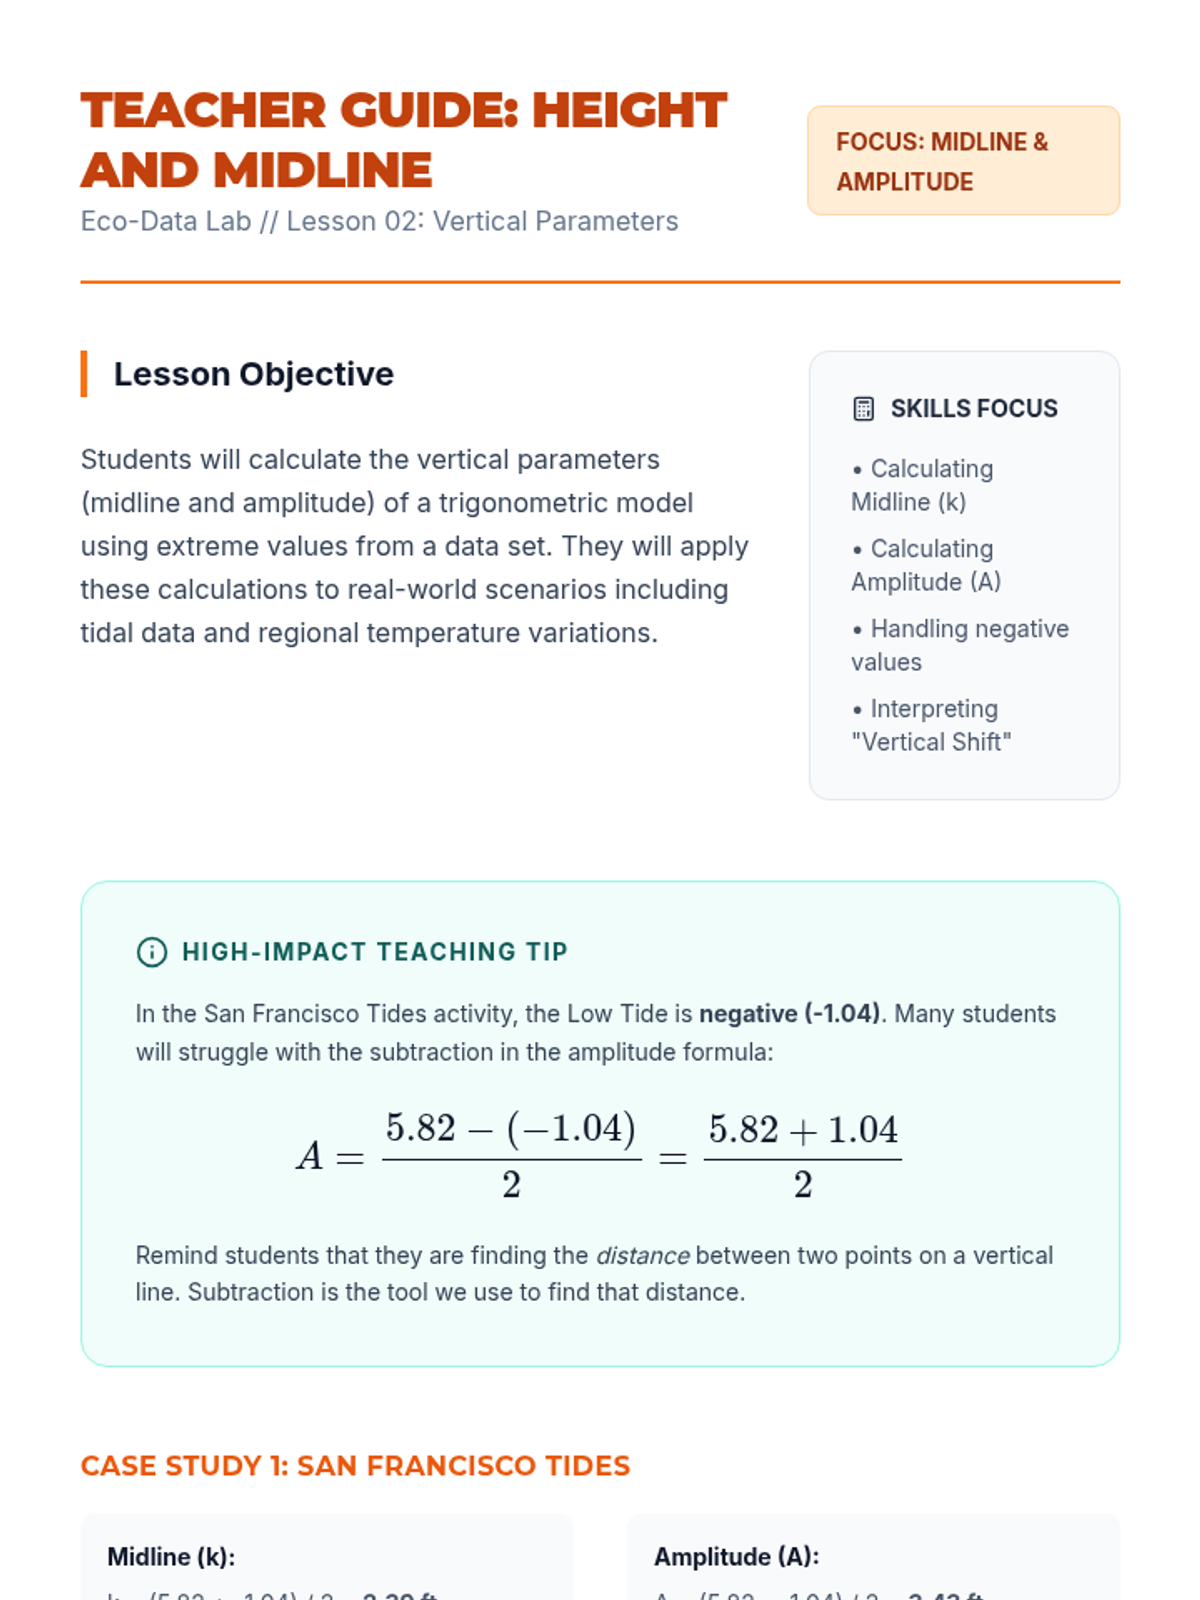
Students learn the algebraic techniques to extract the midline and amplitude from a data table. They practice these calculations on various environmental data sets.
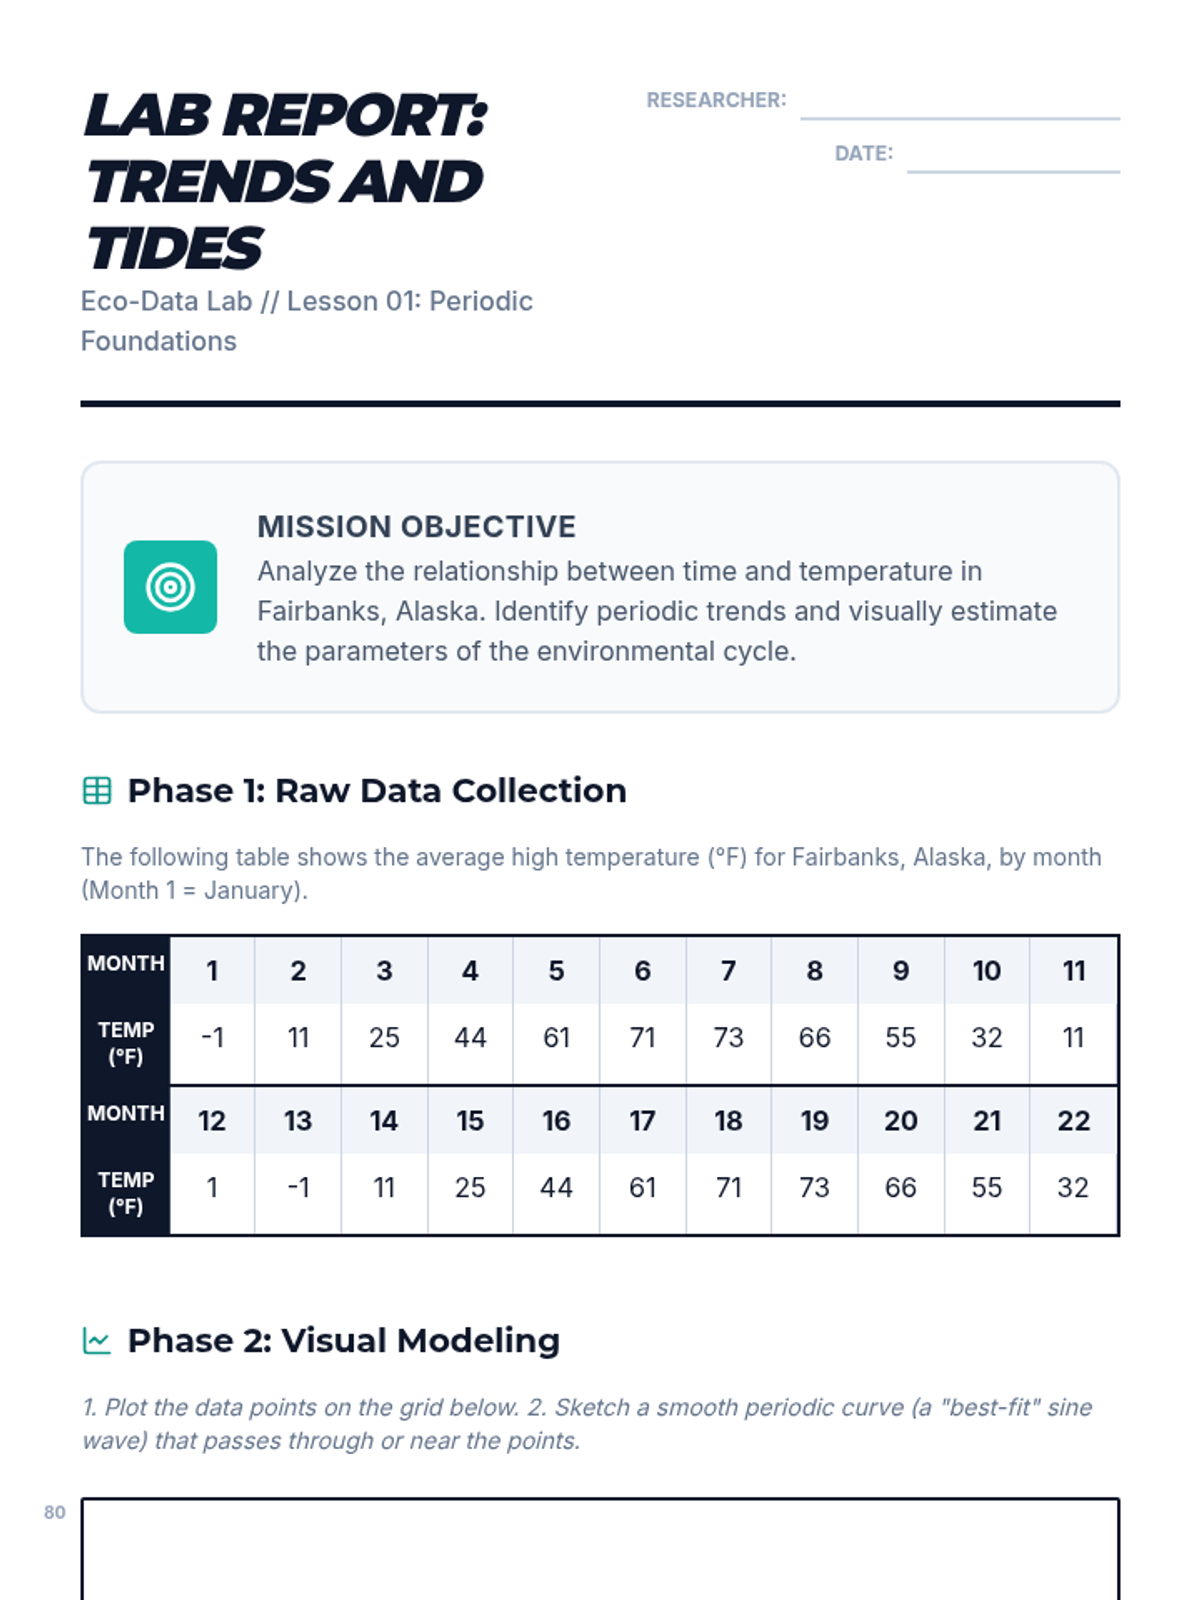
Students plot given data sets and identify the periodic nature of the data. They sketch a 'best fit' curve by hand to estimate the maximums, minimums, and cycle length.
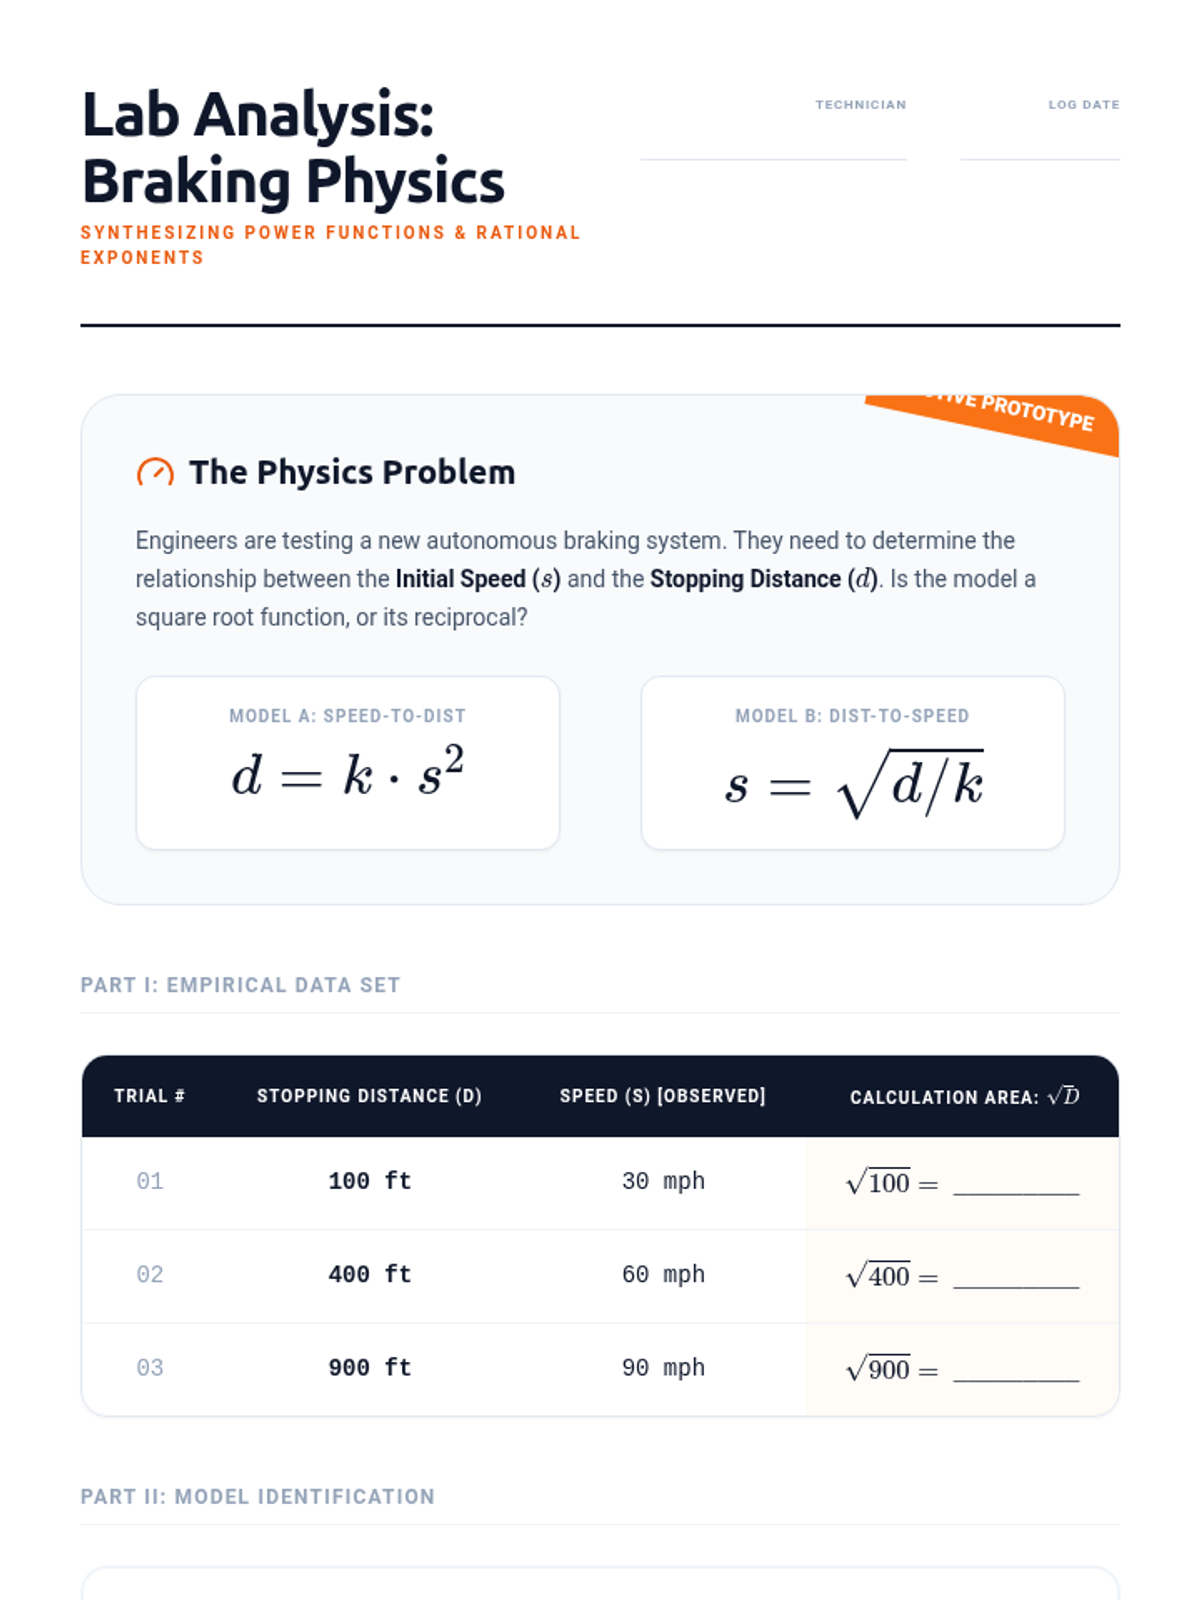
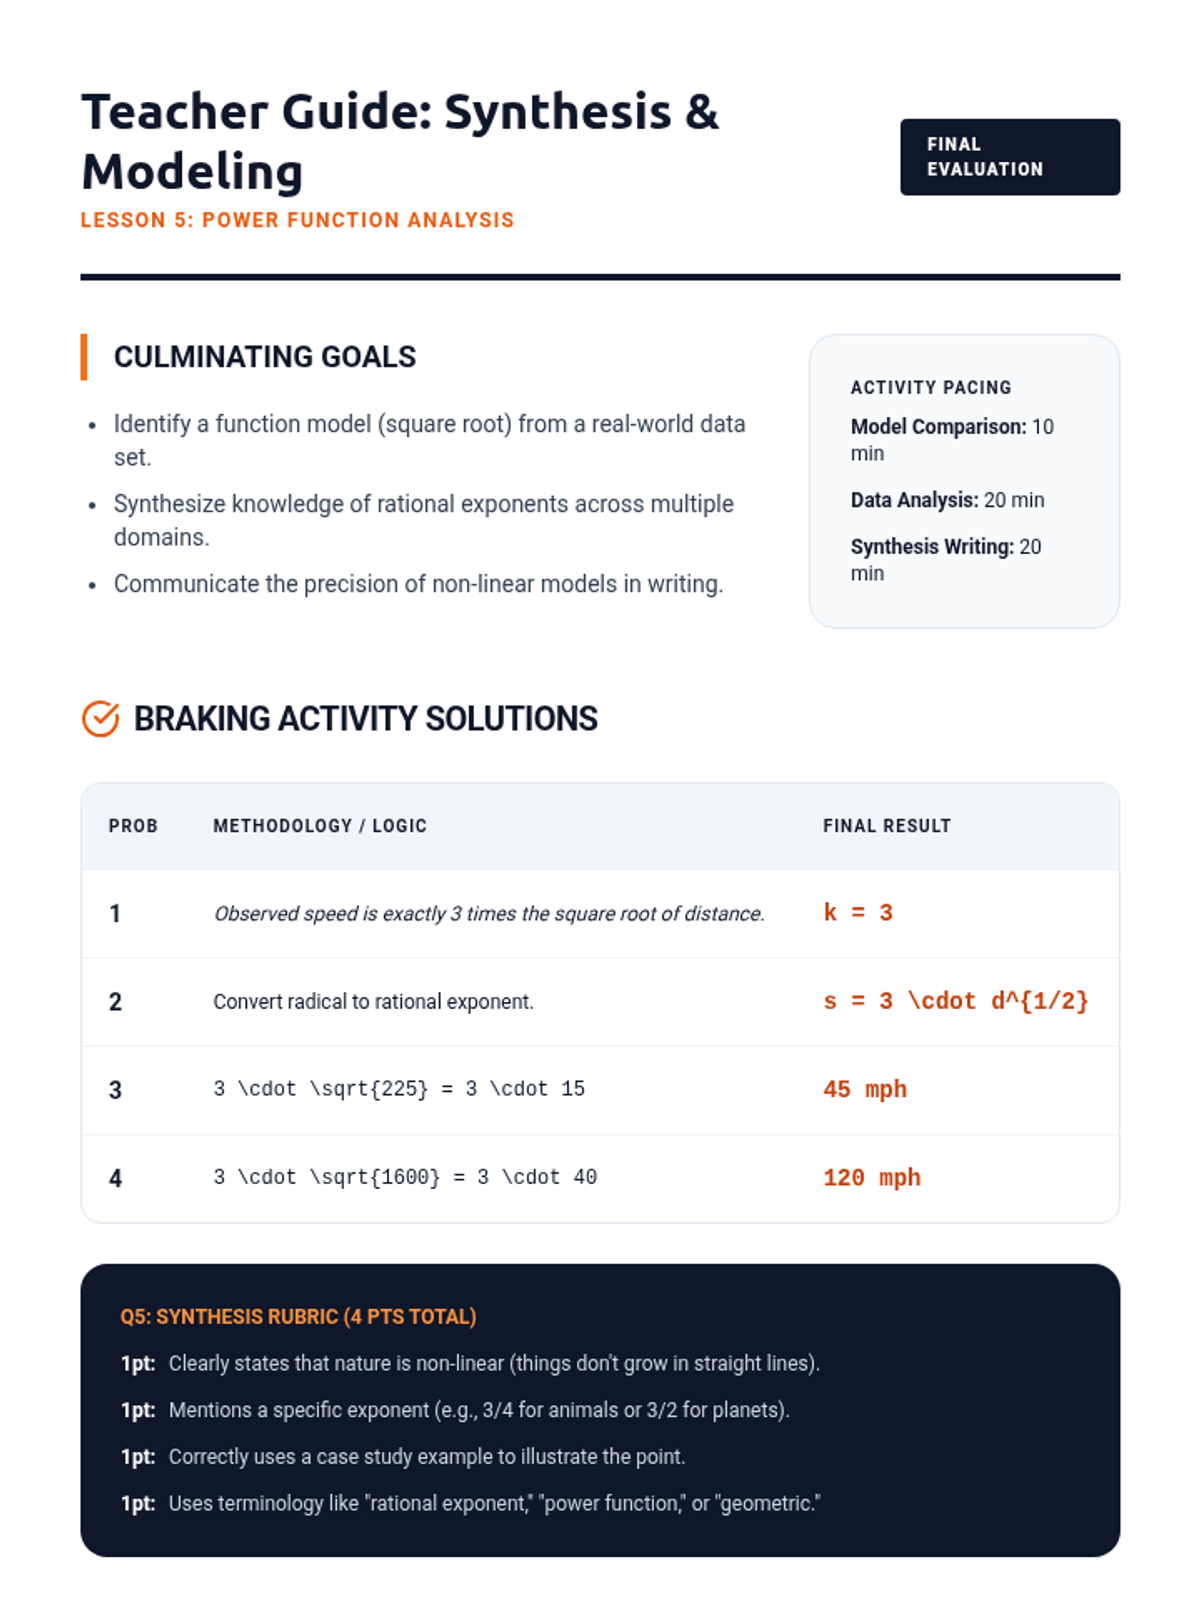
Students synthesize their knowledge by fitting power functions to real-world data sets, comparing square root and cube root models to find the best fit for physical phenomena.
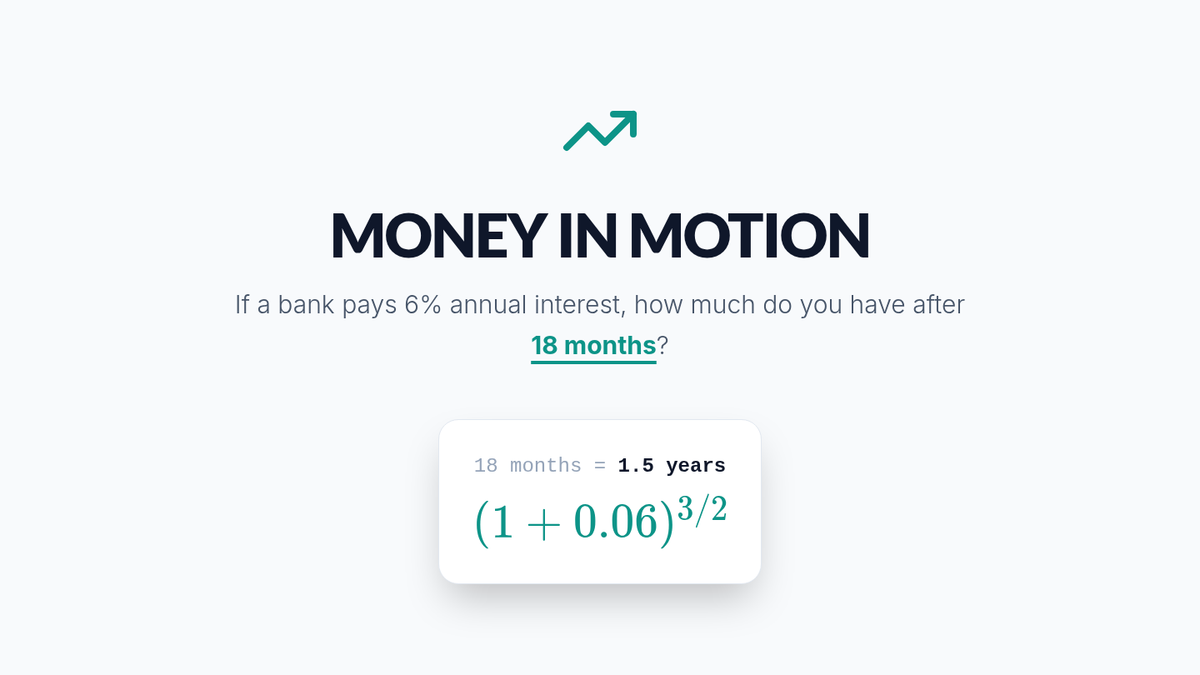
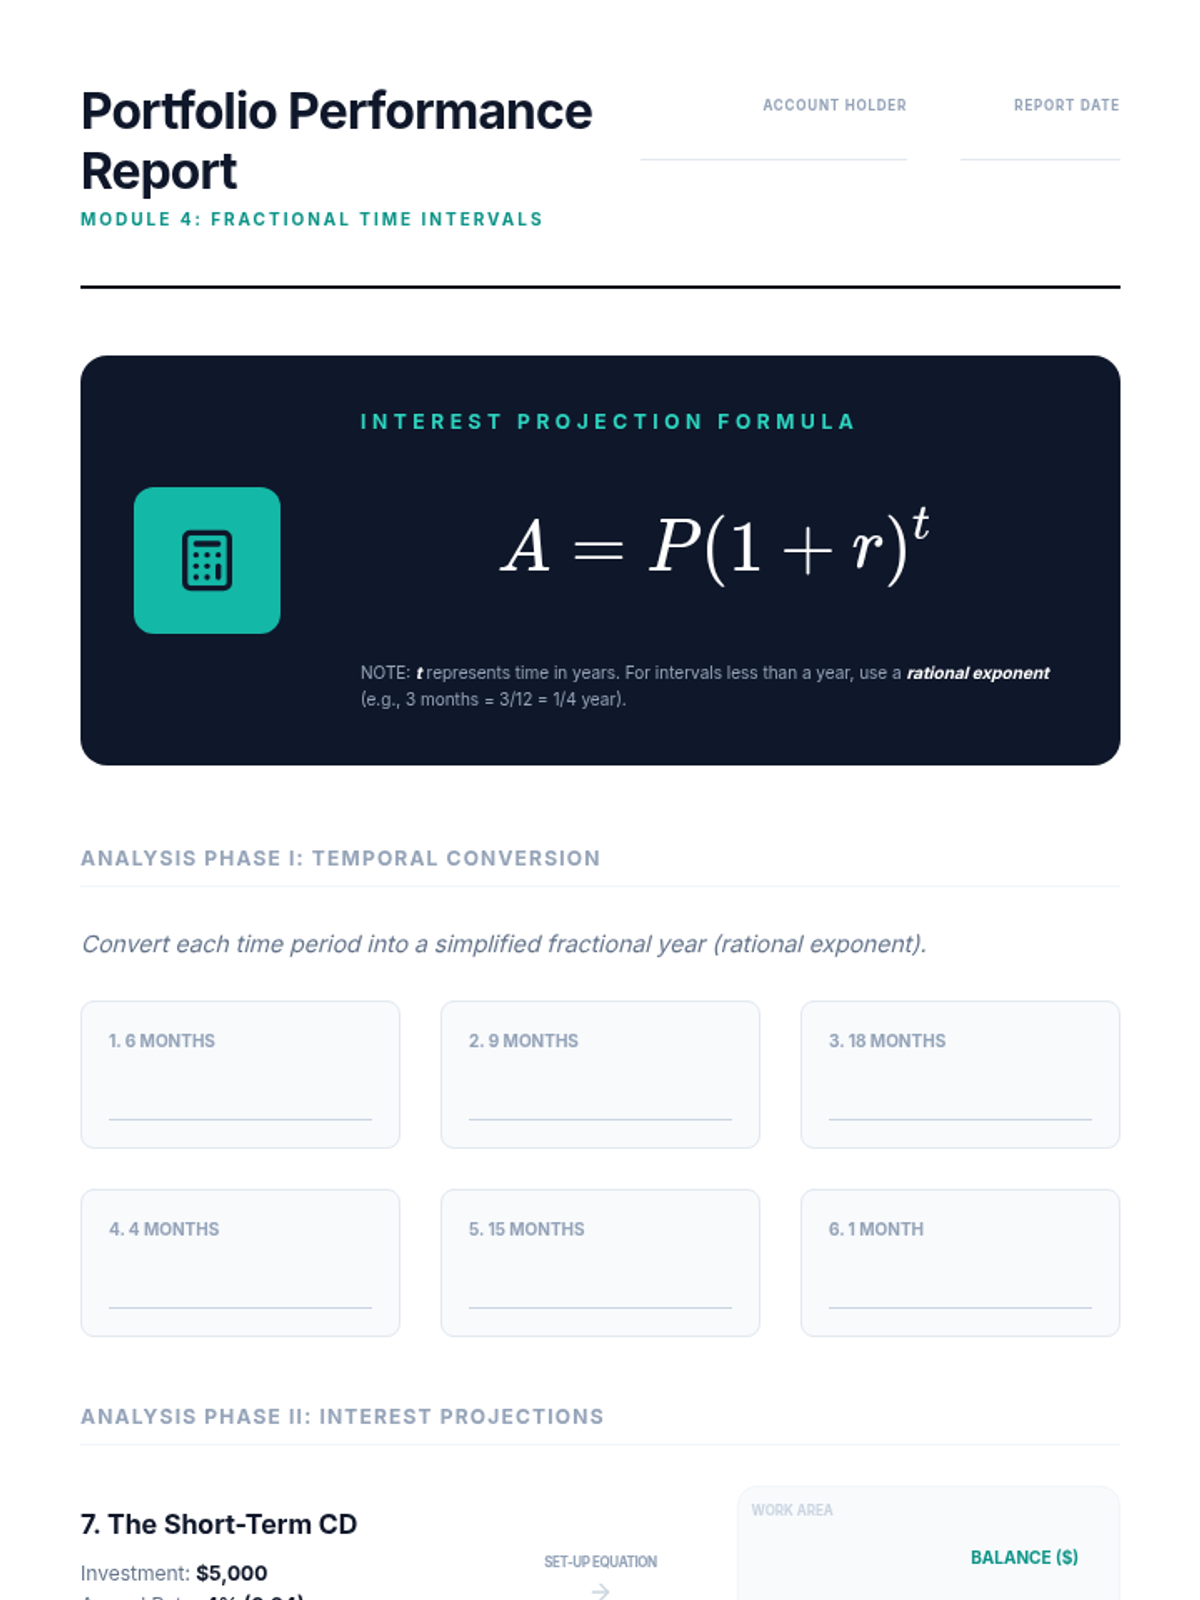
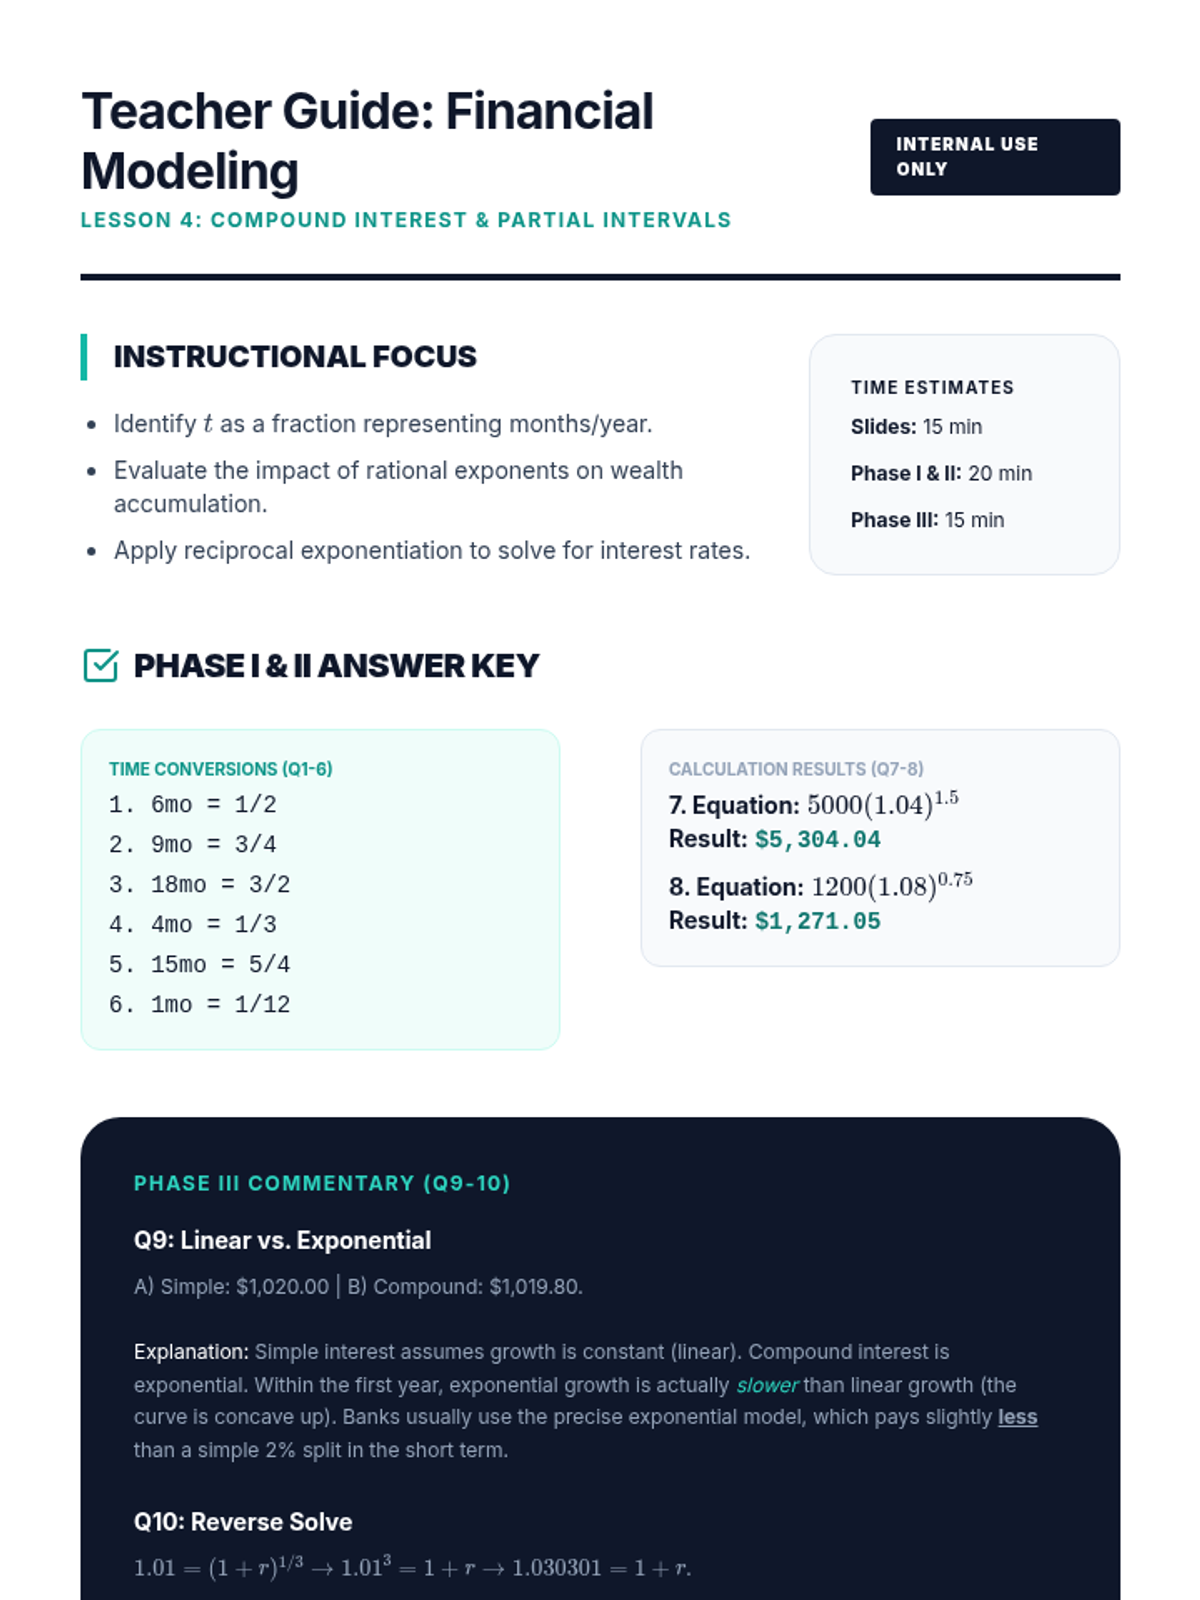
Students apply fractional exponents to compound interest formulas to calculate returns over partial time intervals, such as months or days within a year.
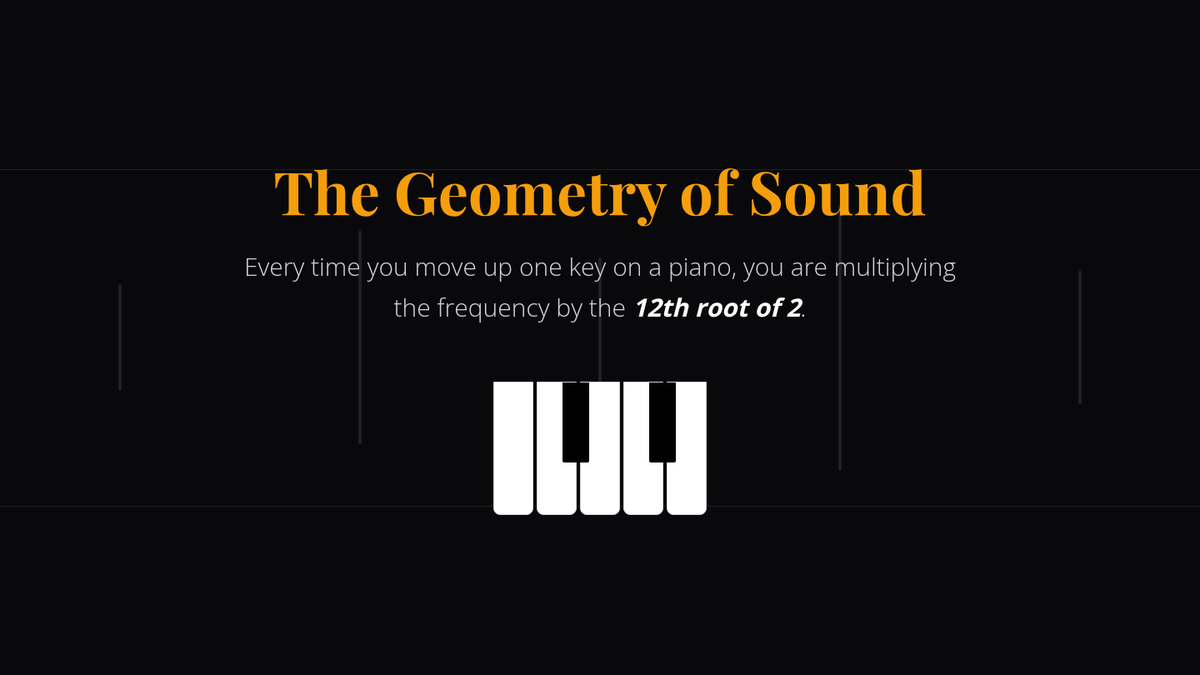
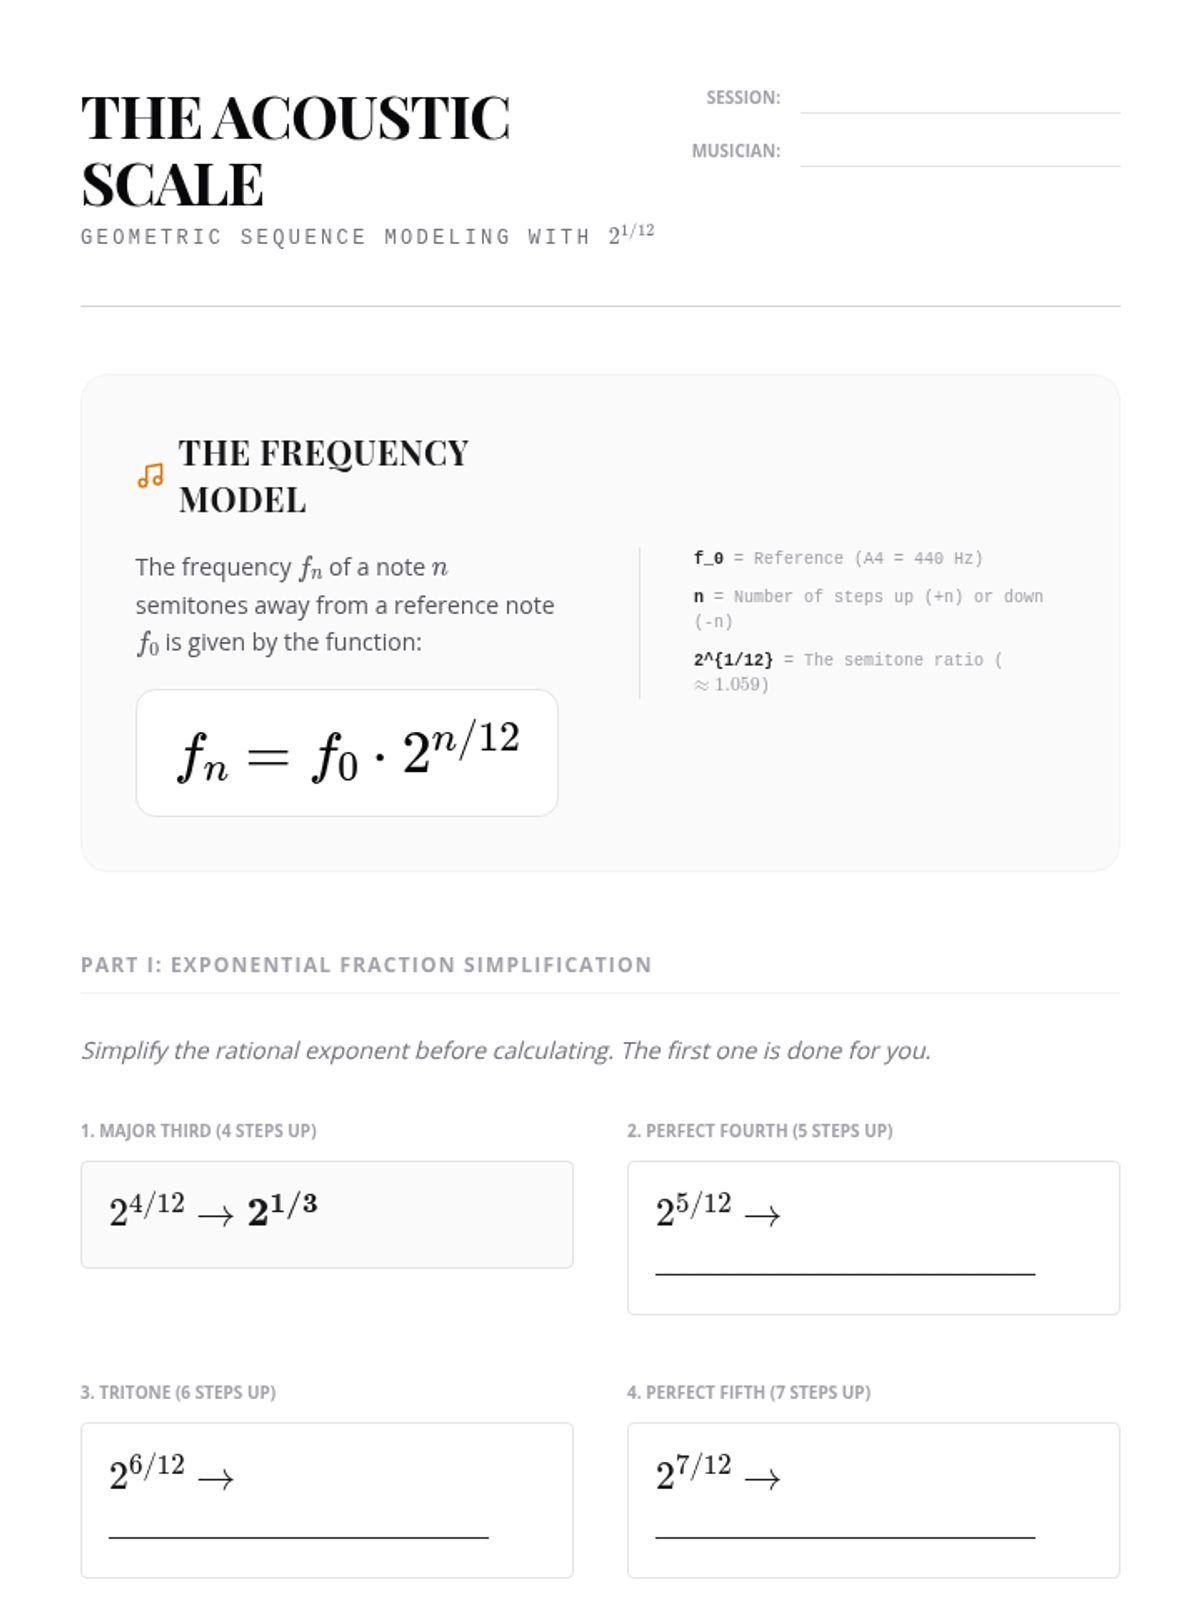
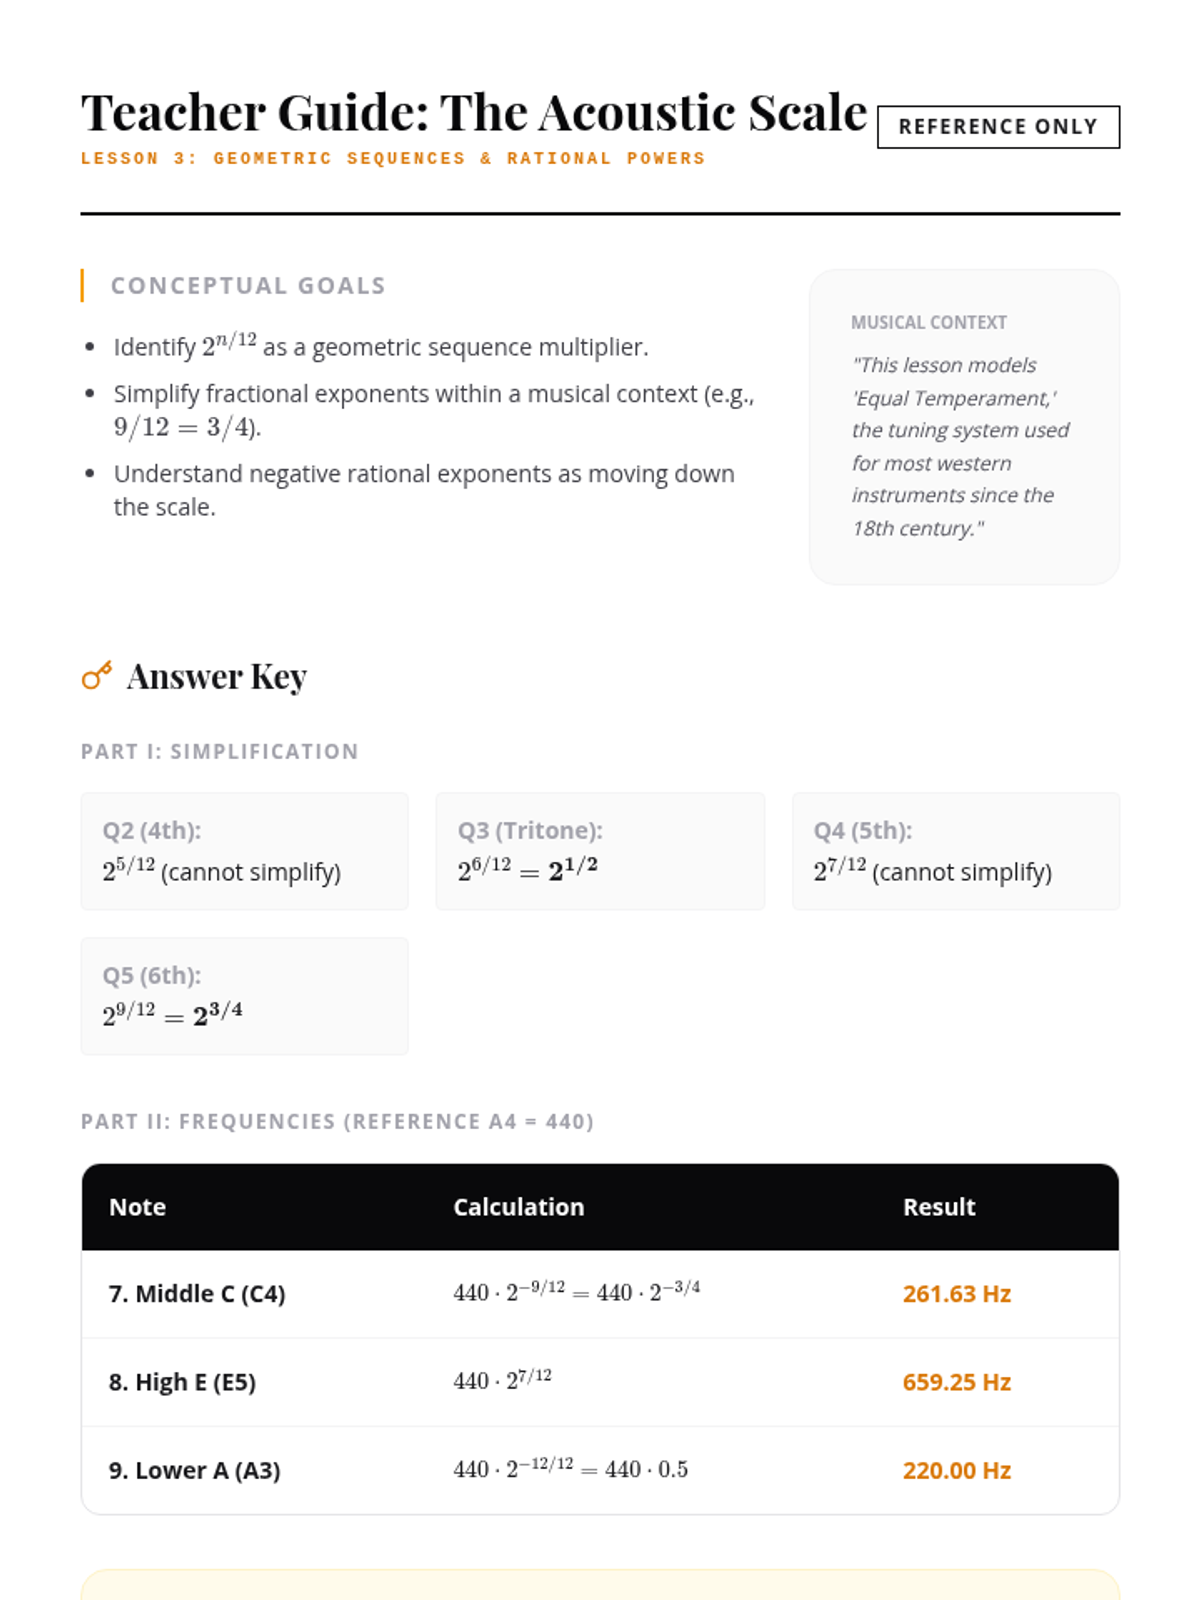
Students investigate the mathematical structure of the musical scale, where frequency steps are governed by the 12th root of 2, connecting geometric sequences to rational exponents.
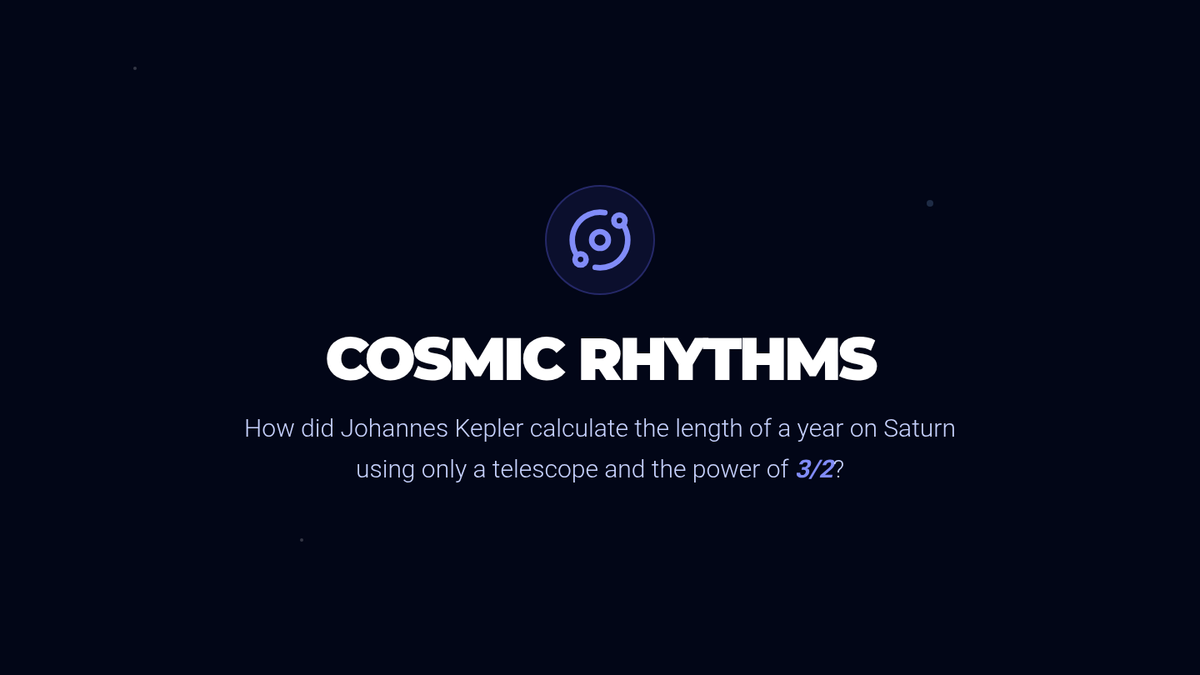
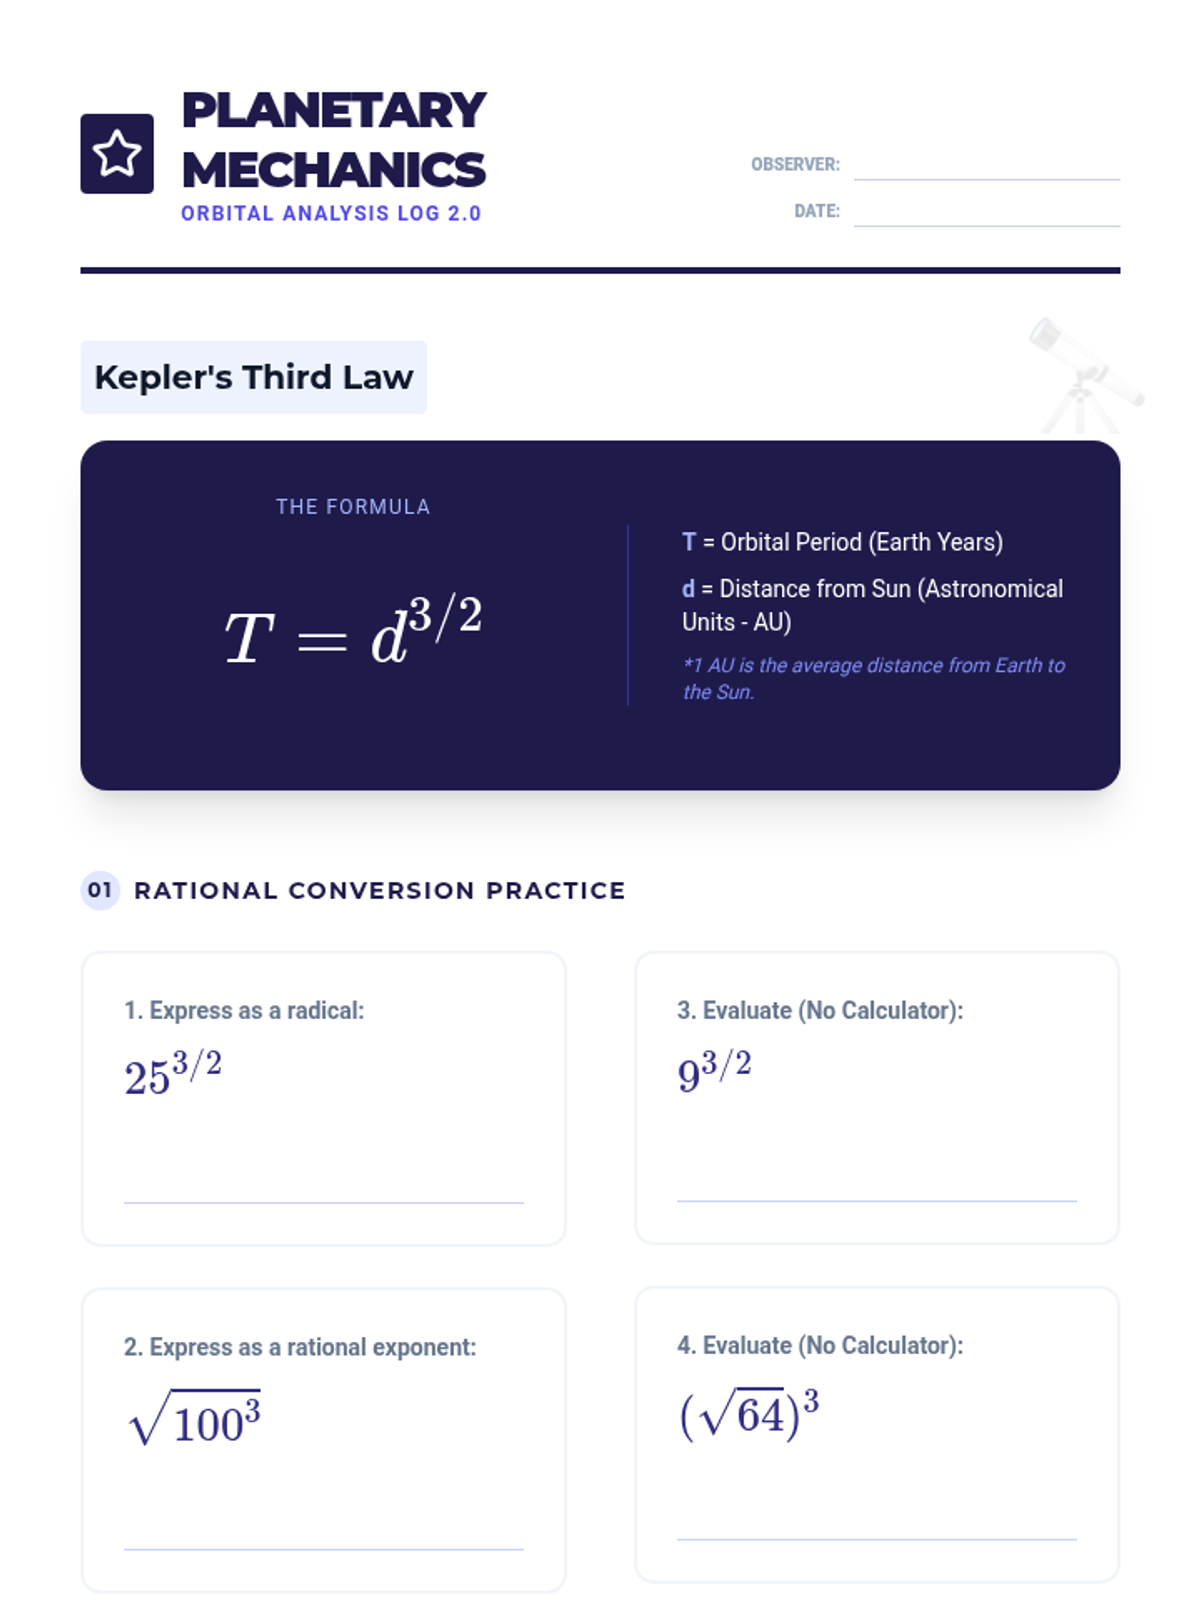
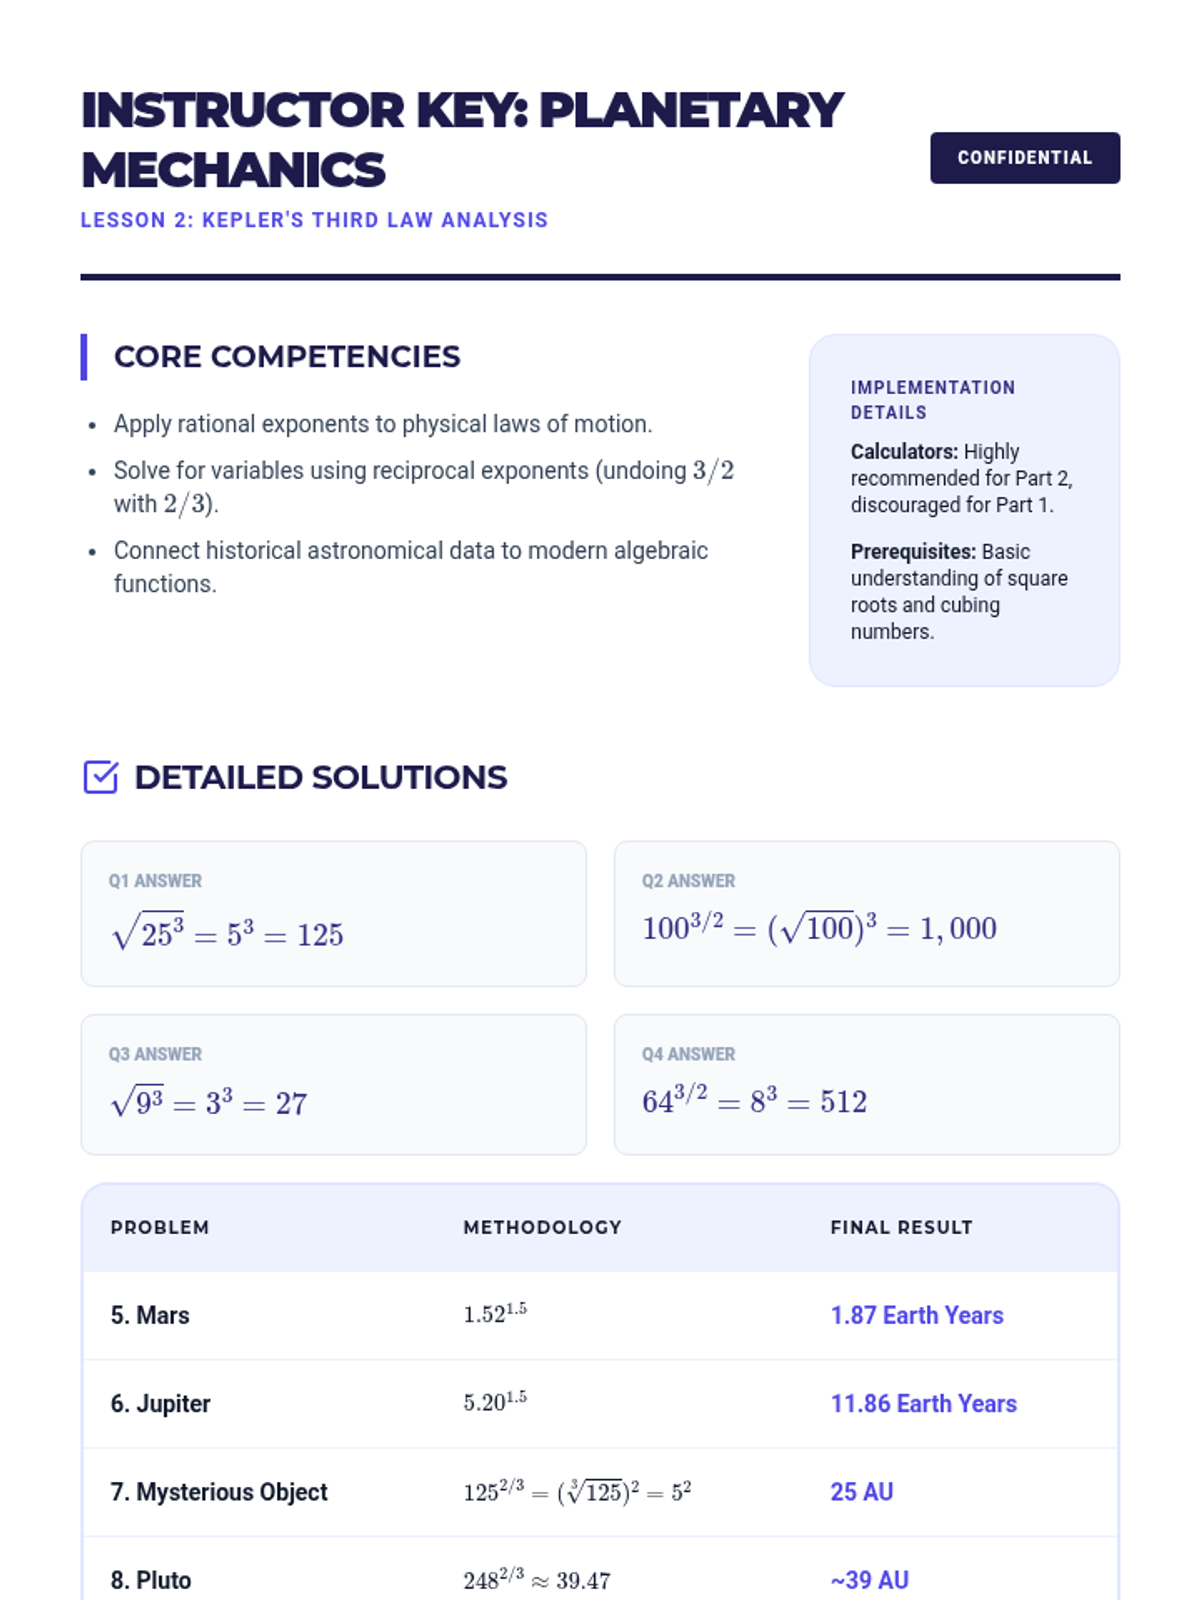
Students analyze Kepler’s Third Law to relate planetary orbital periods to distance from the sun using the 3/2 power, practicing conversions between radical and exponential forms.
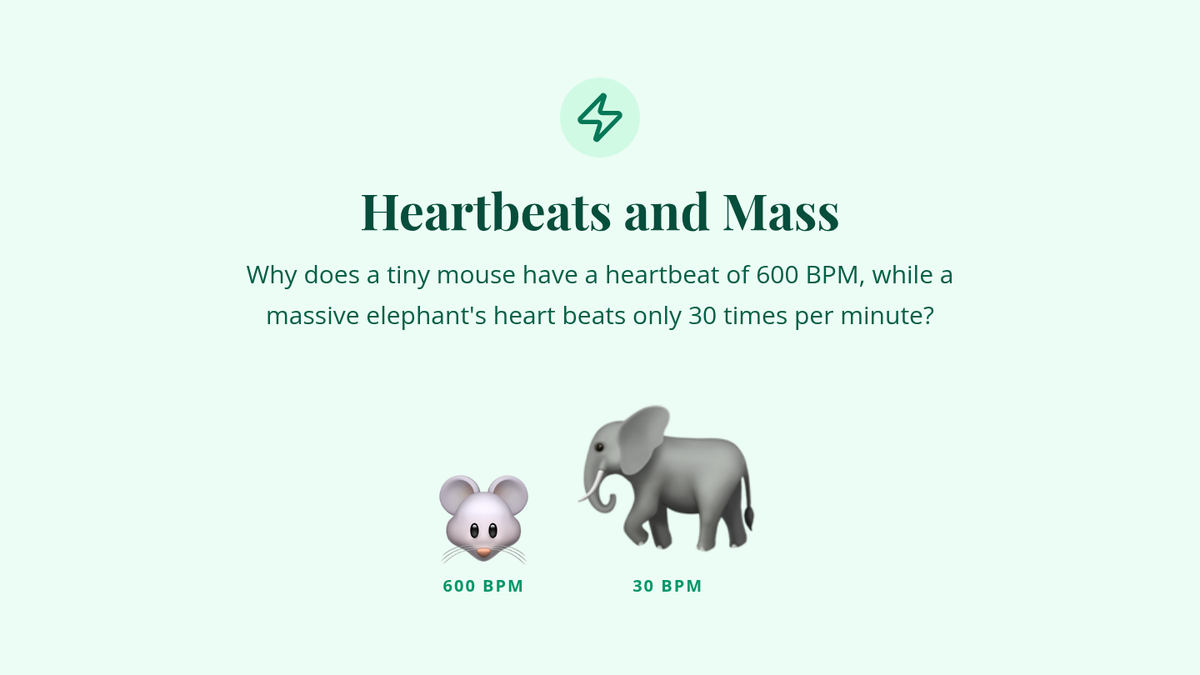
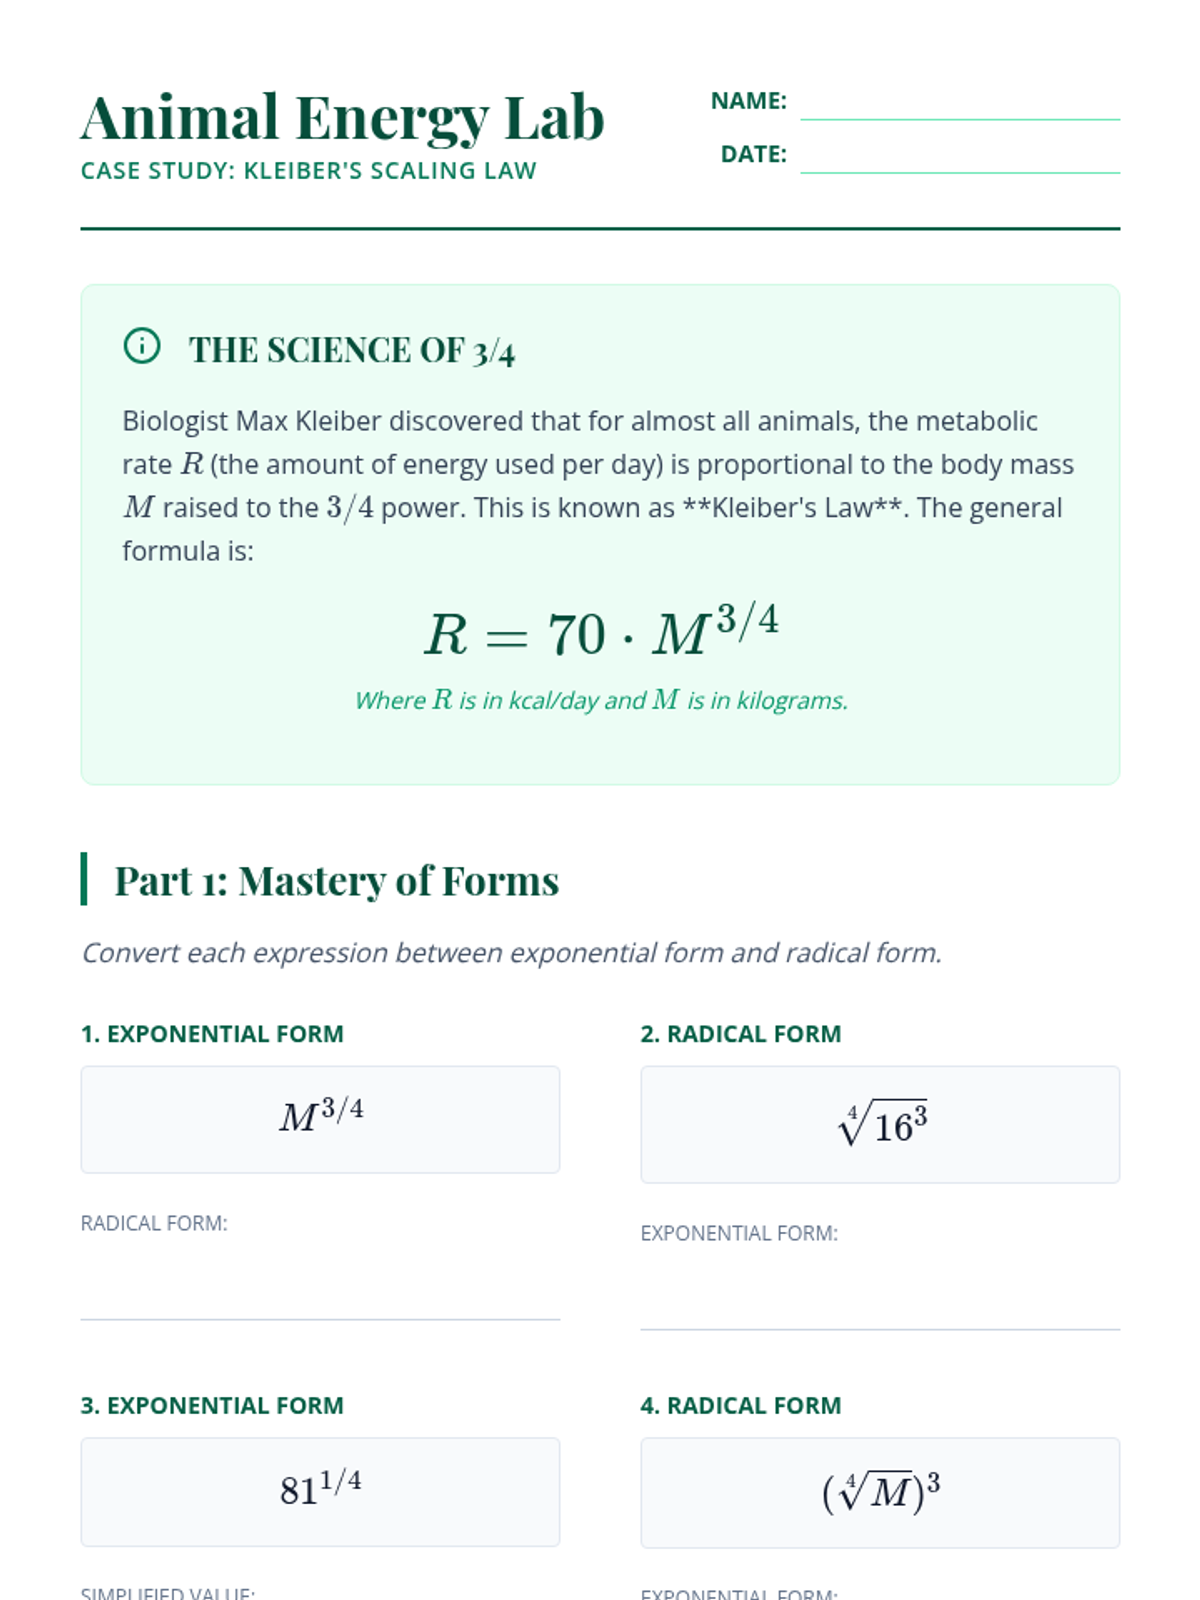
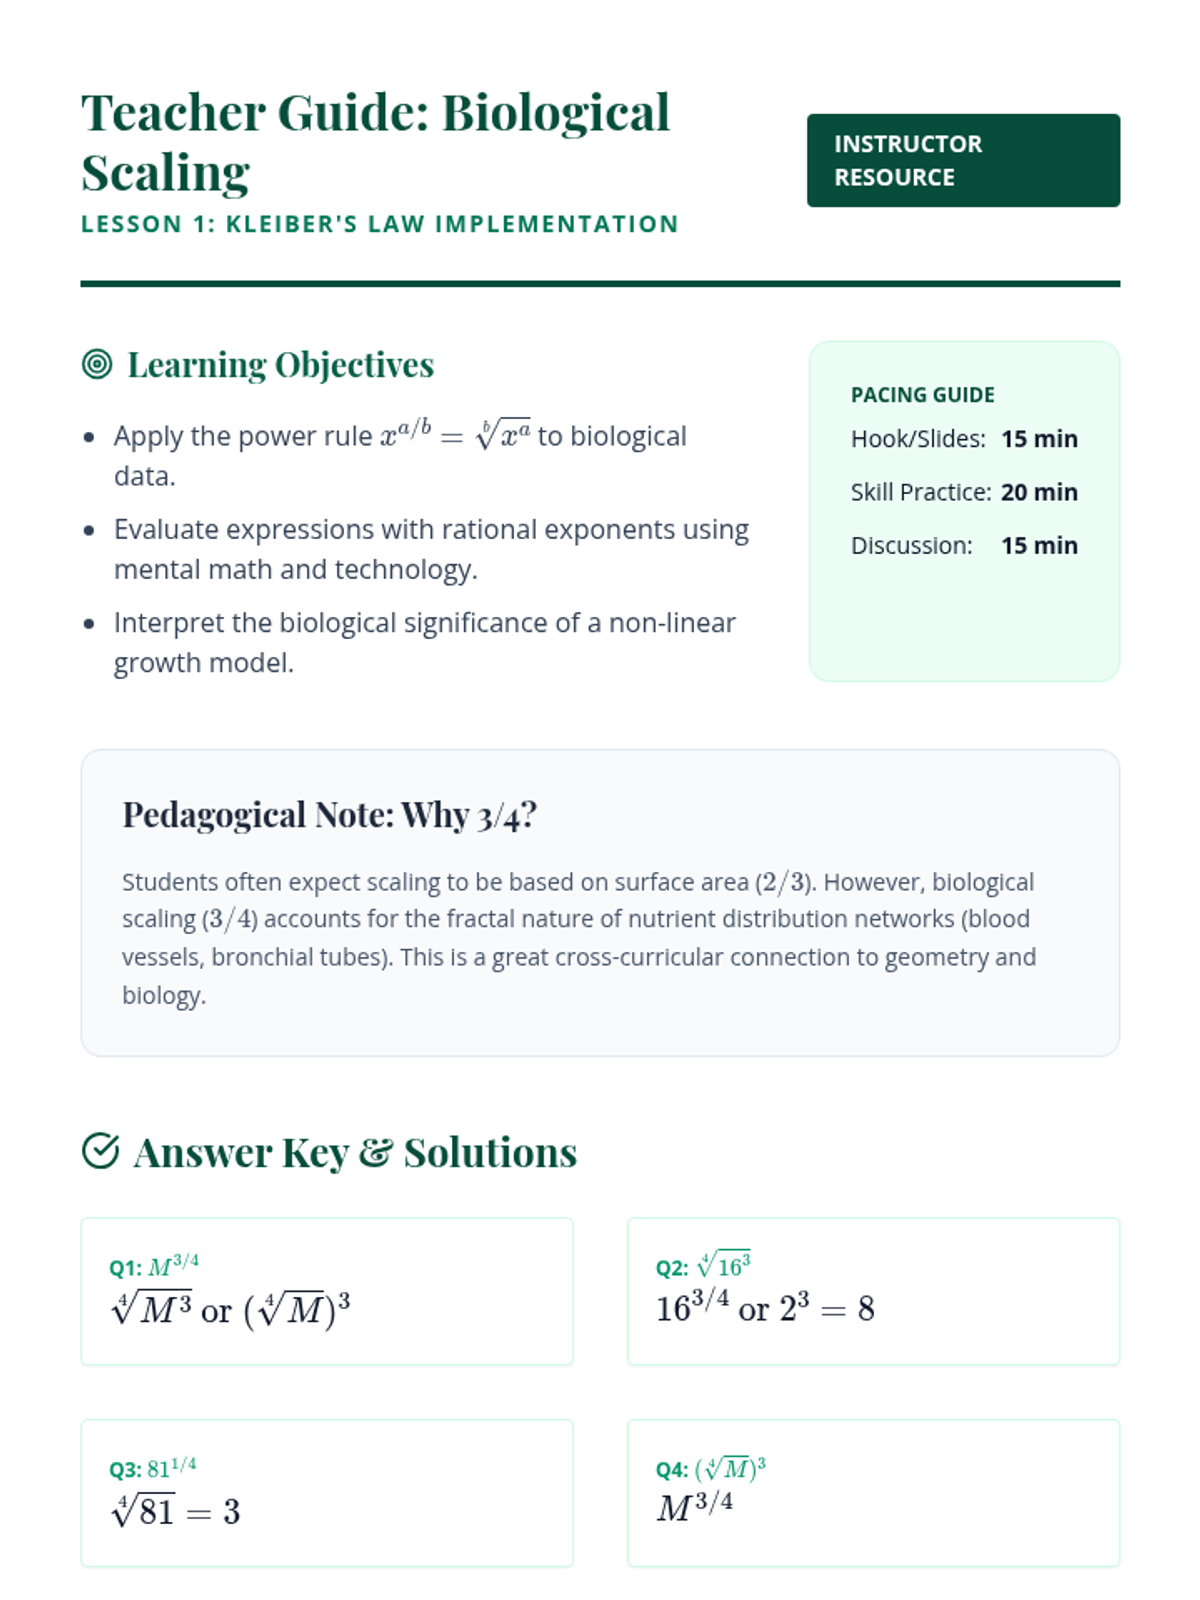
Students explore the relationship between animal mass and metabolic rate using Kleiber's Law (3/4 power rule), introducing the concept of fractional powers in biological systems.
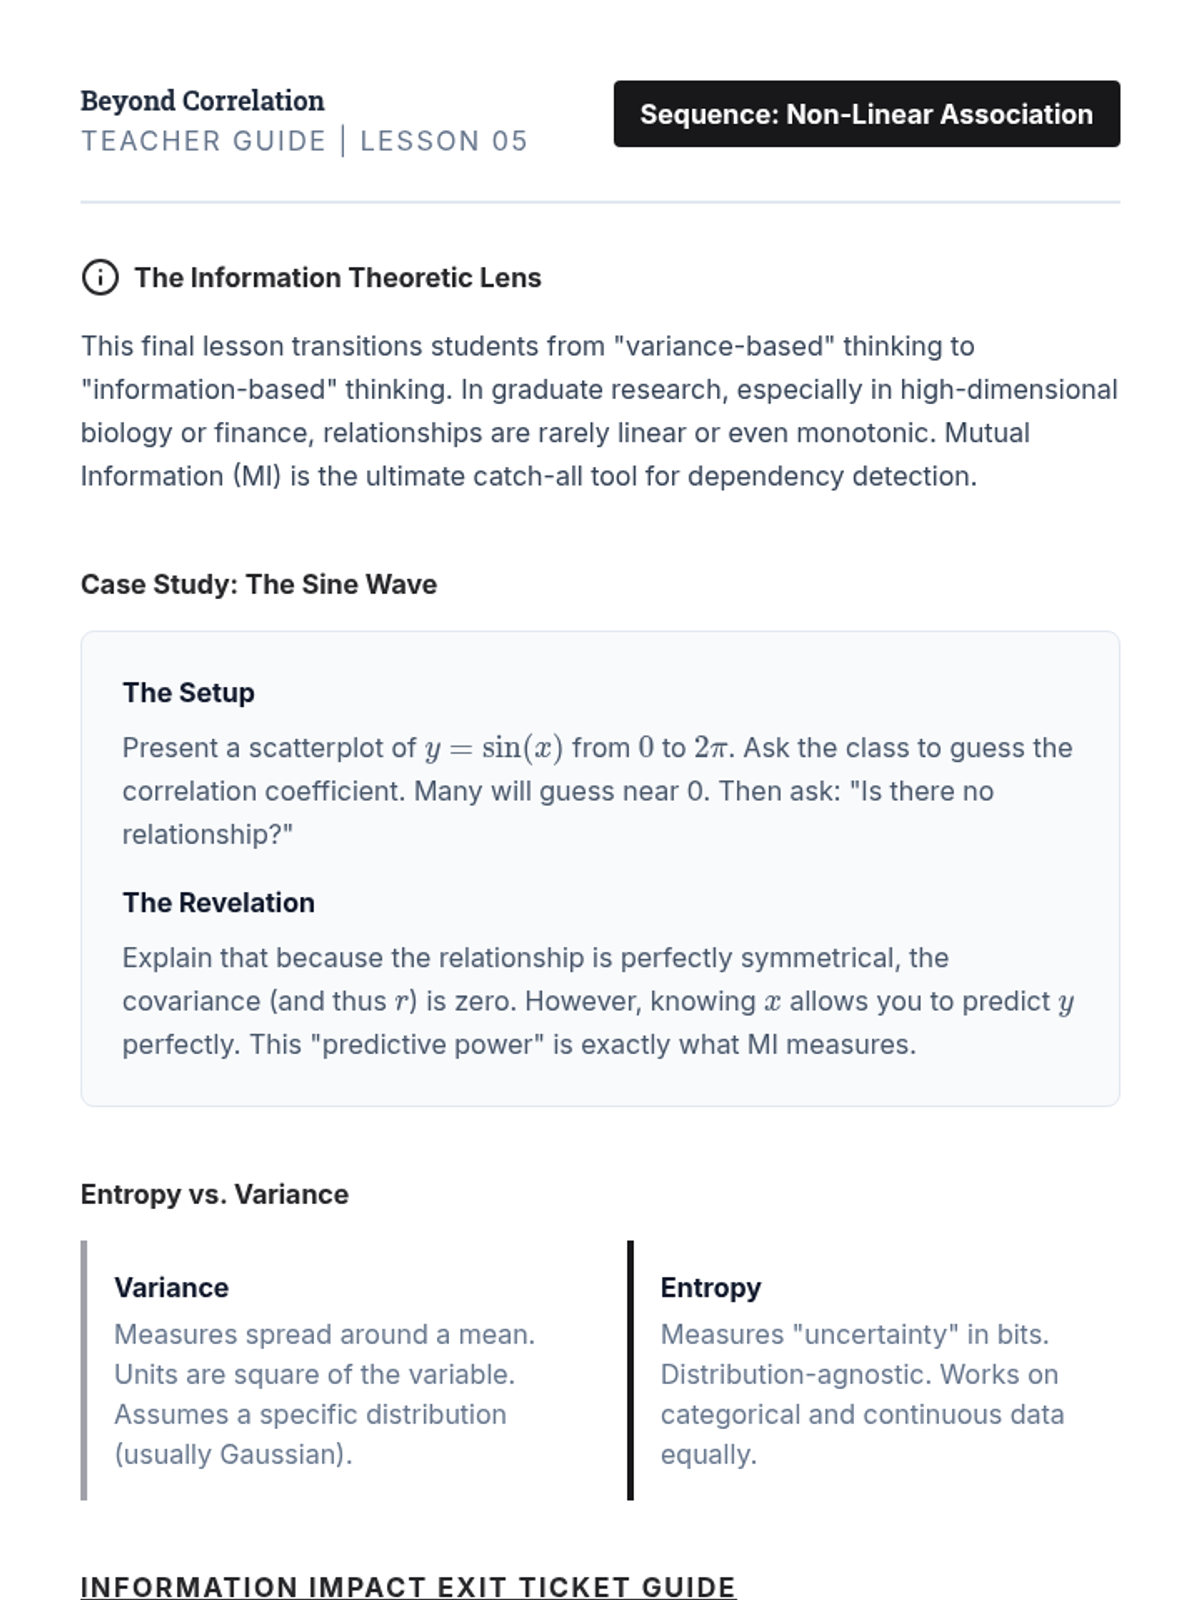
The sequence concludes with Information Theory metrics, using Mutual Information to detect non-monotonic, complex associations that correlation coefficients miss.
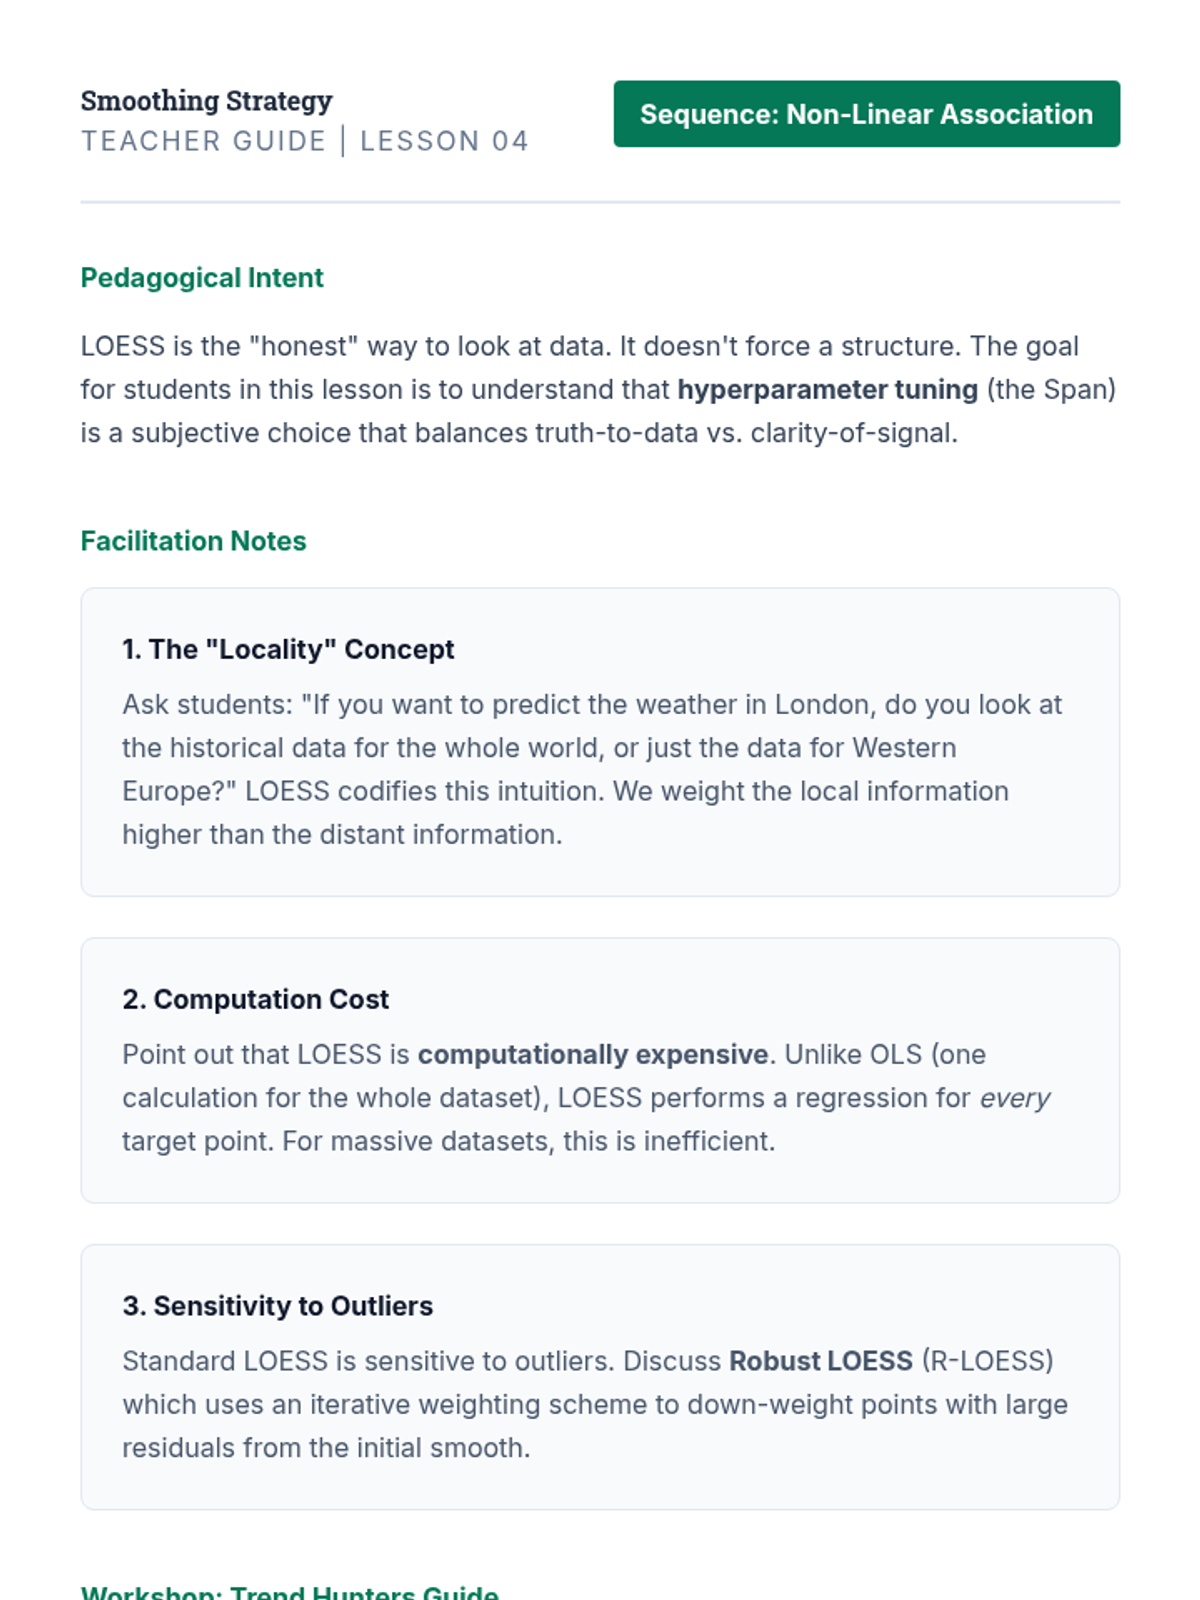
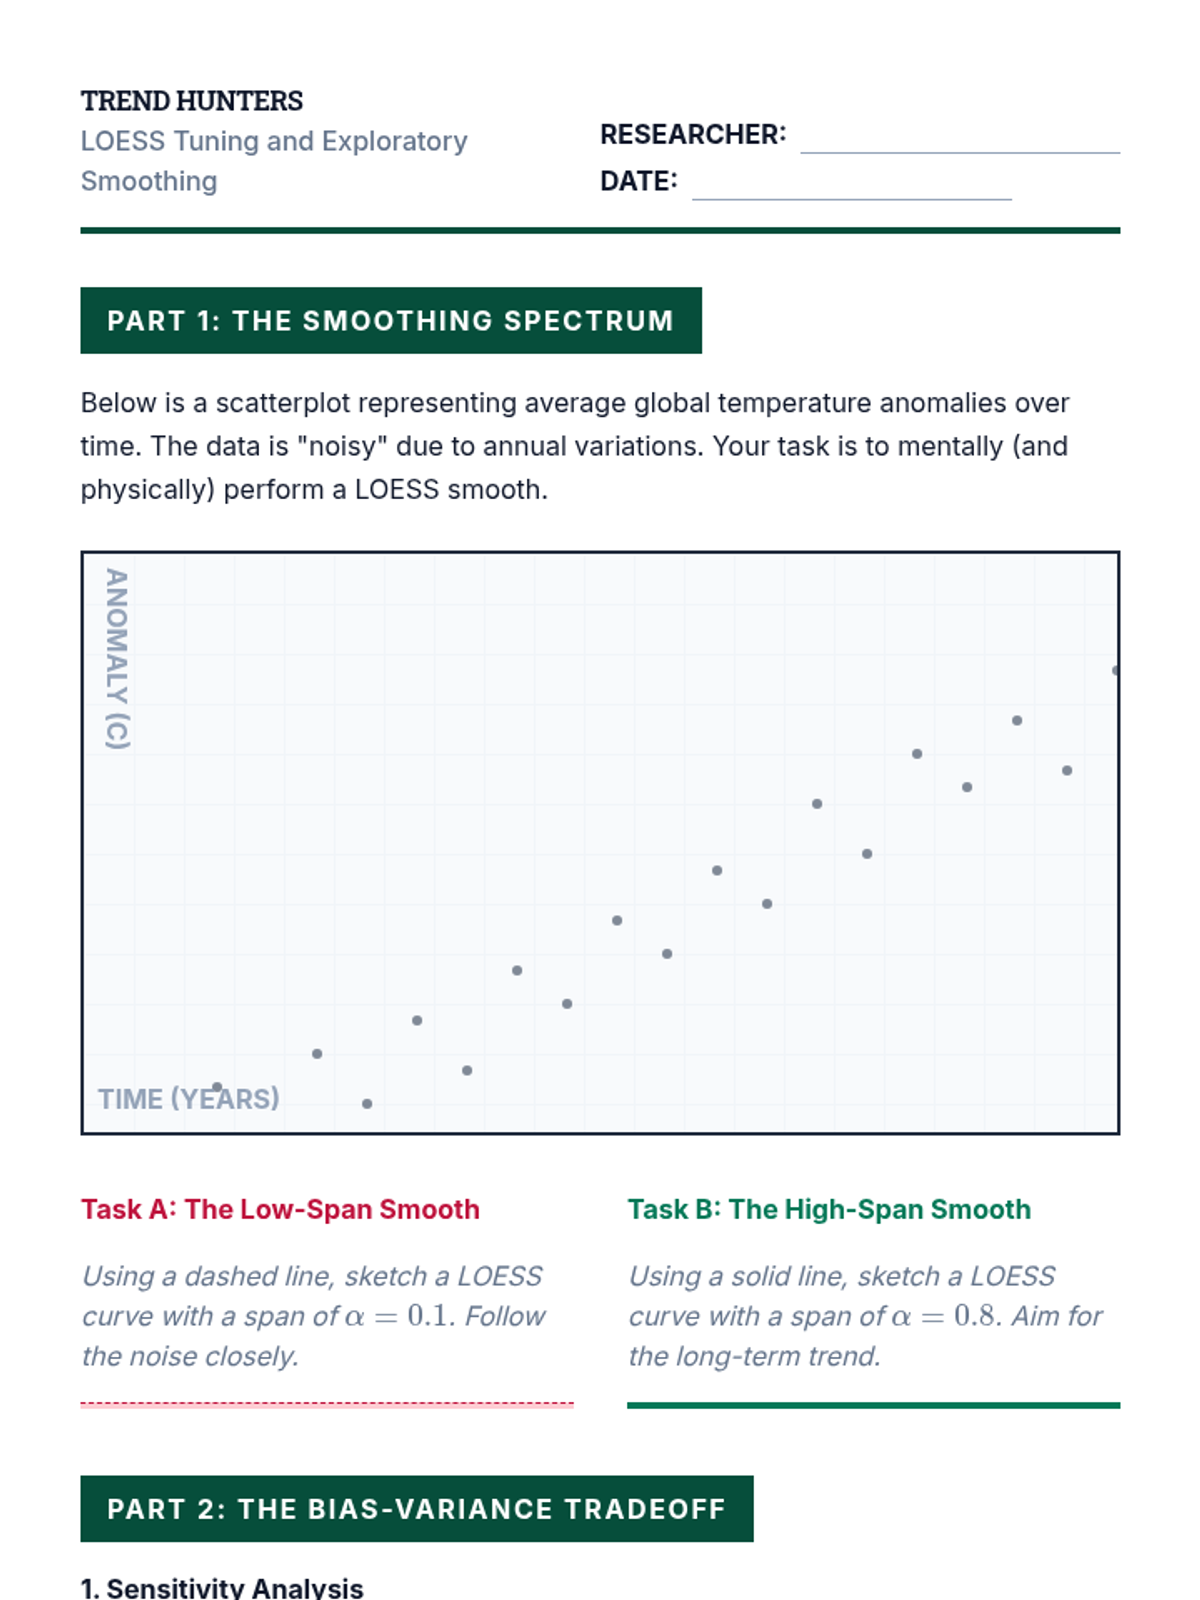
This lesson focuses on locally weighted scatterplot smoothing (LOESS) to visualize trends without pre-defined parametric functions, exploring bandwidth selection and smoothing.
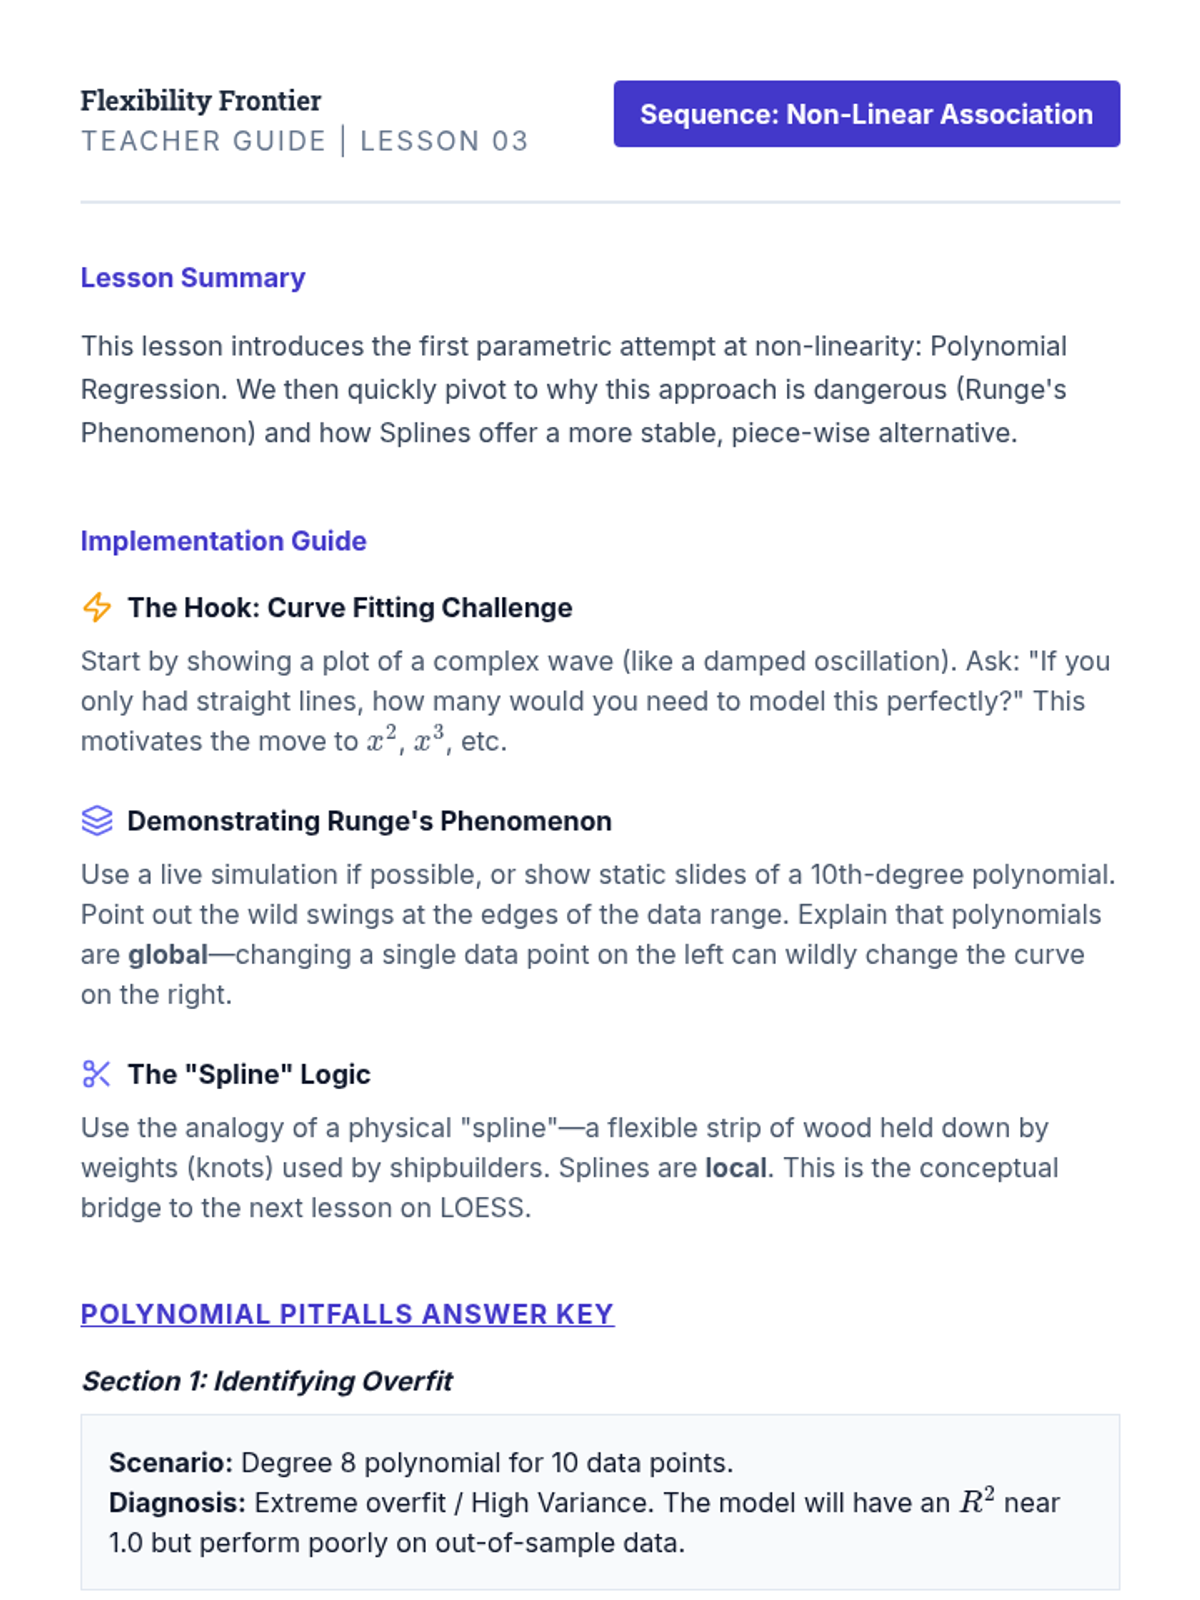
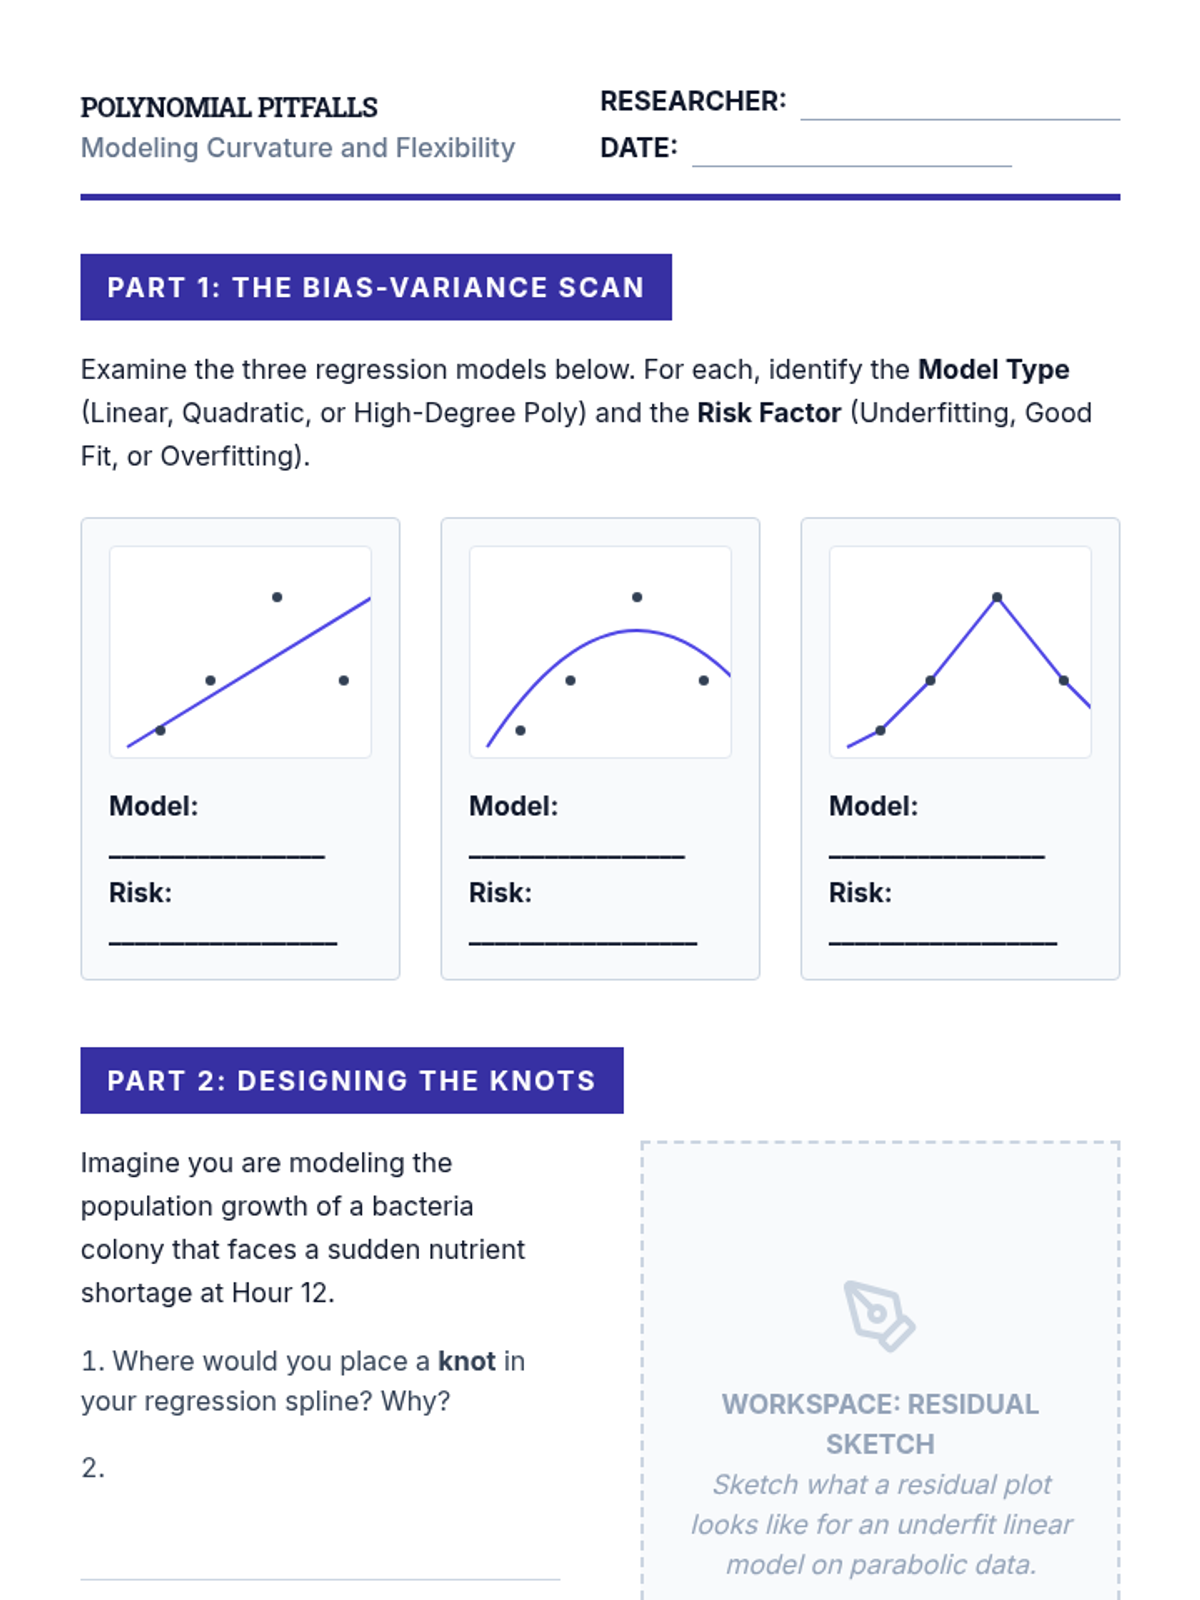
Students explore modeling curvature using polynomial terms and splines, while addressing the bias-variance tradeoff and the risks of overfitting.
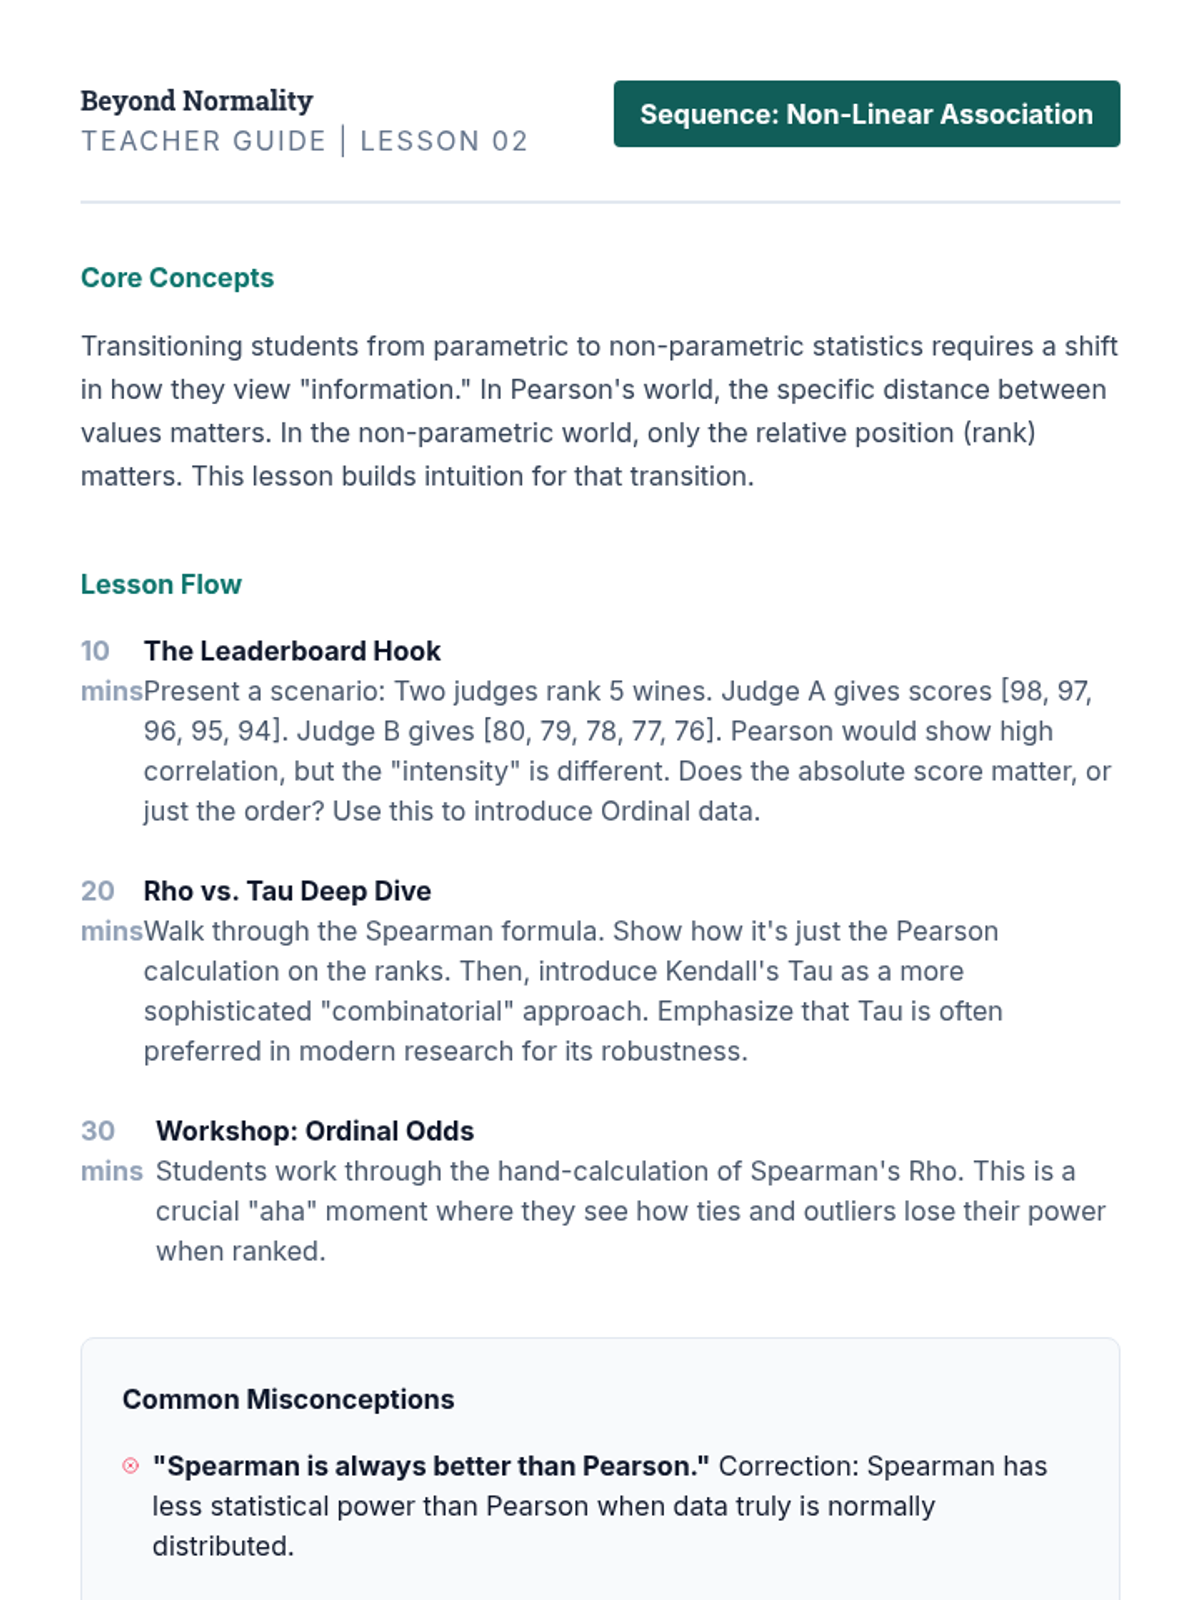
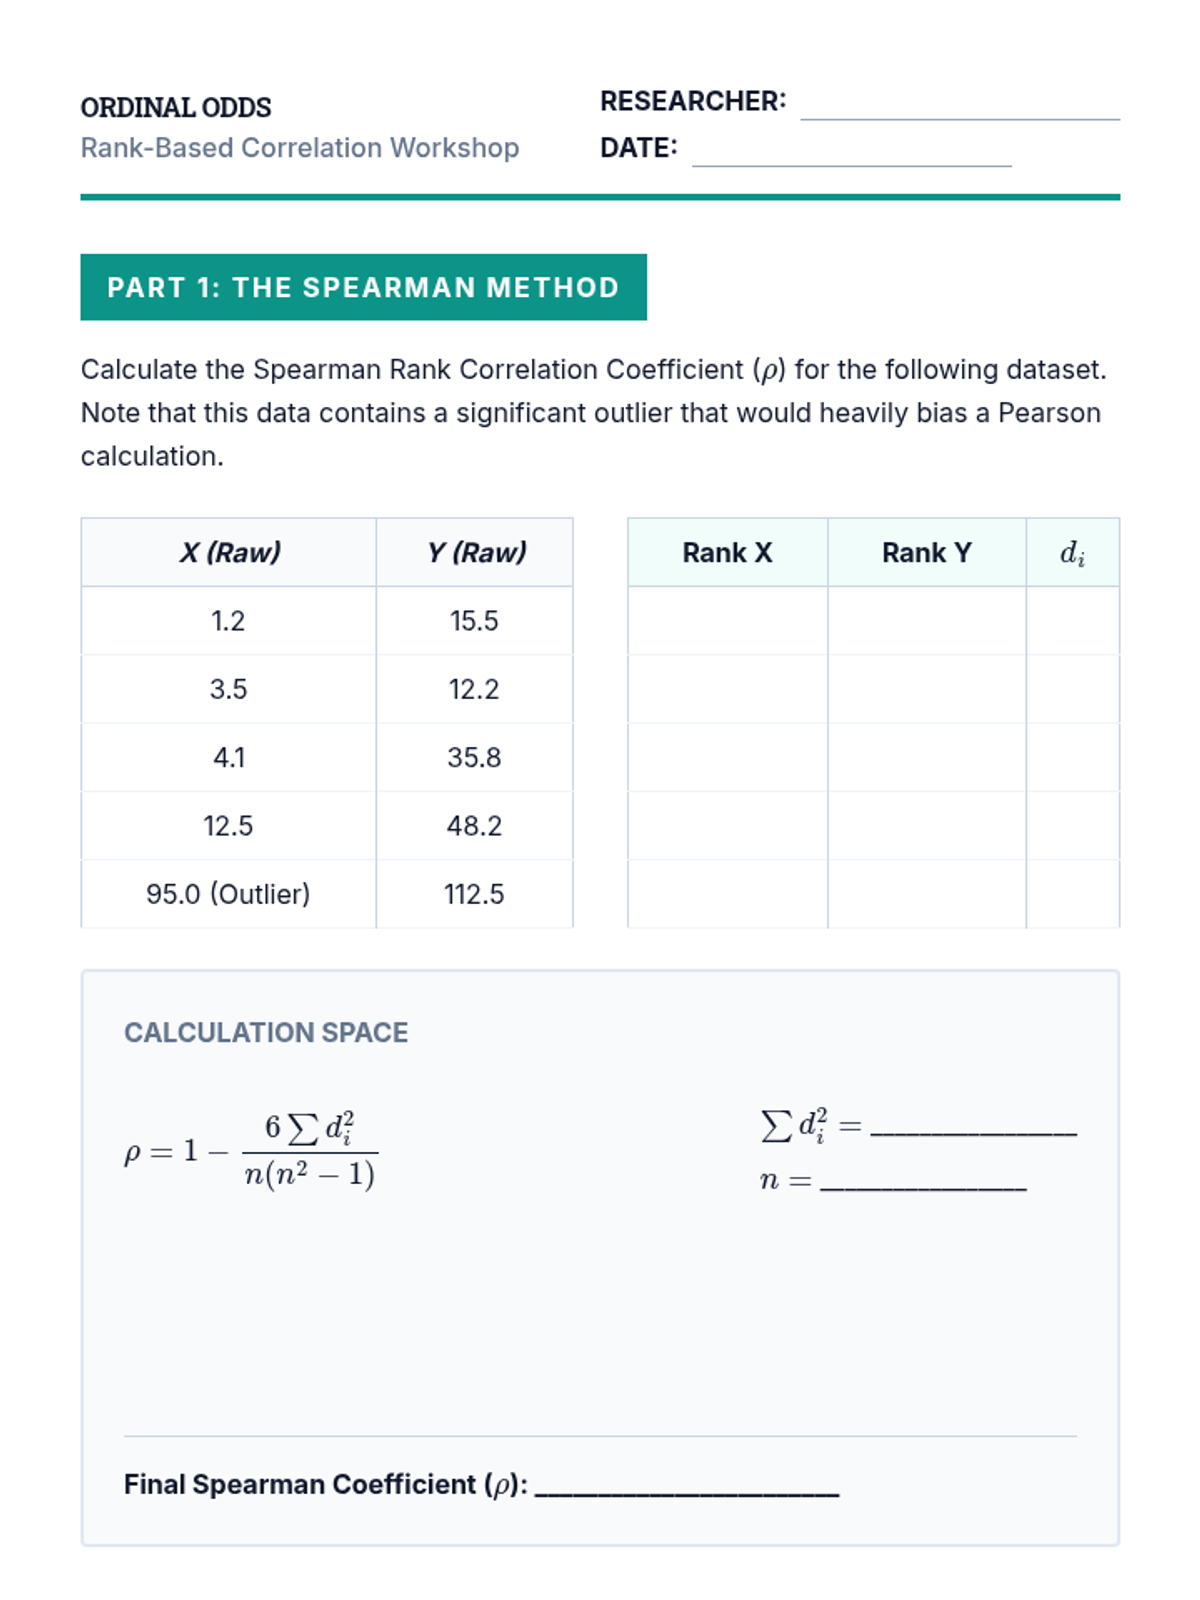
This lesson introduces Spearman’s rho and Kendall’s tau for assessing monotonic relationships in ordinal and non-normal continuous data.
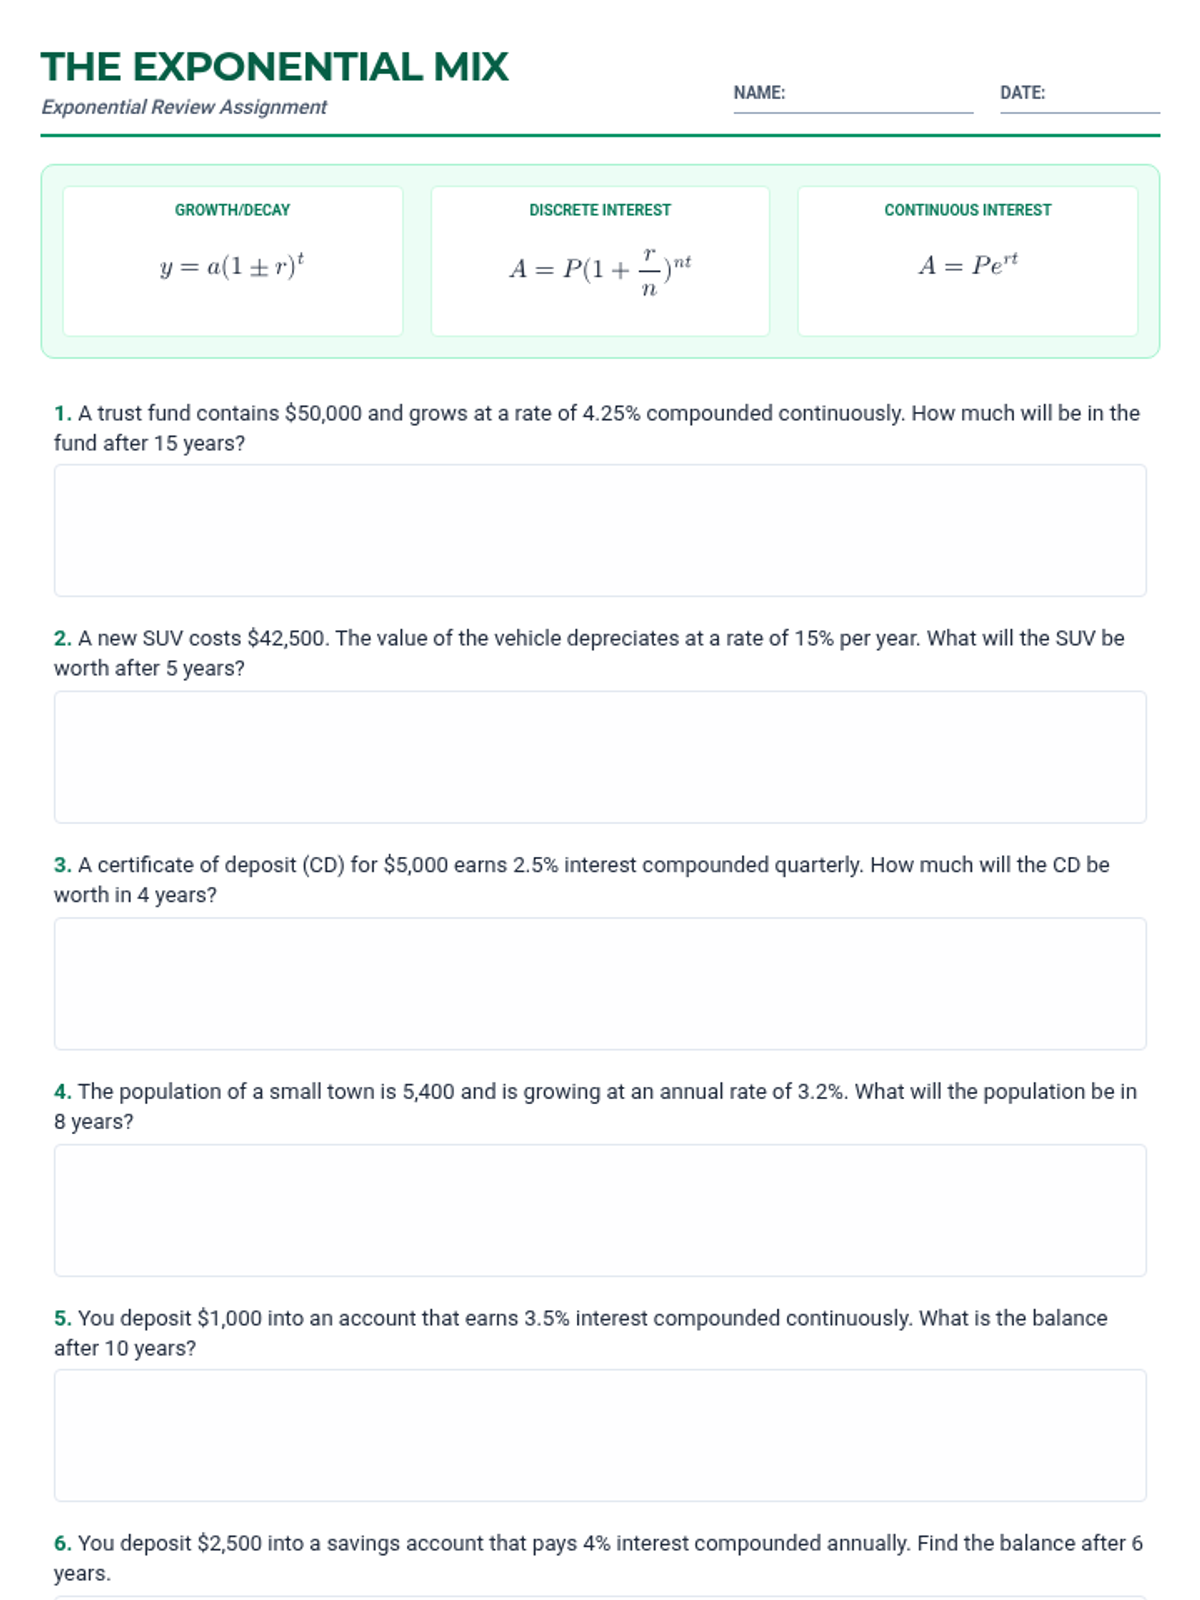
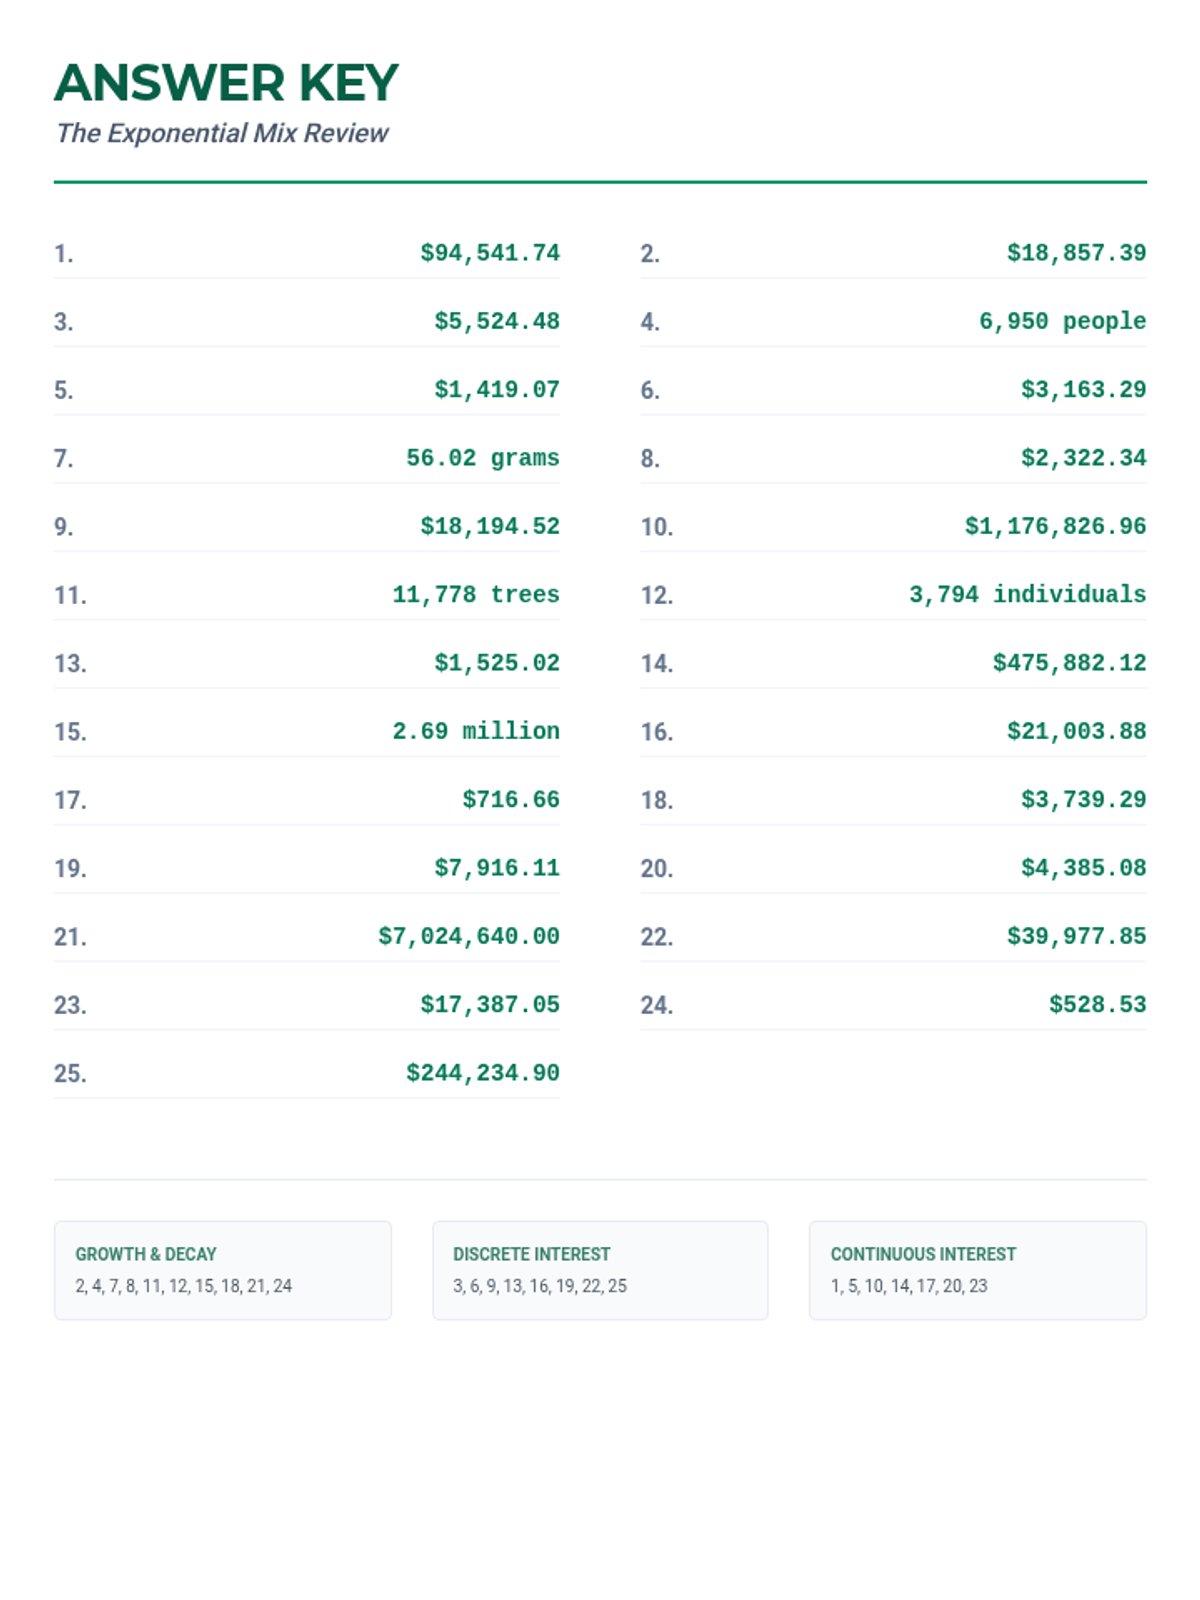
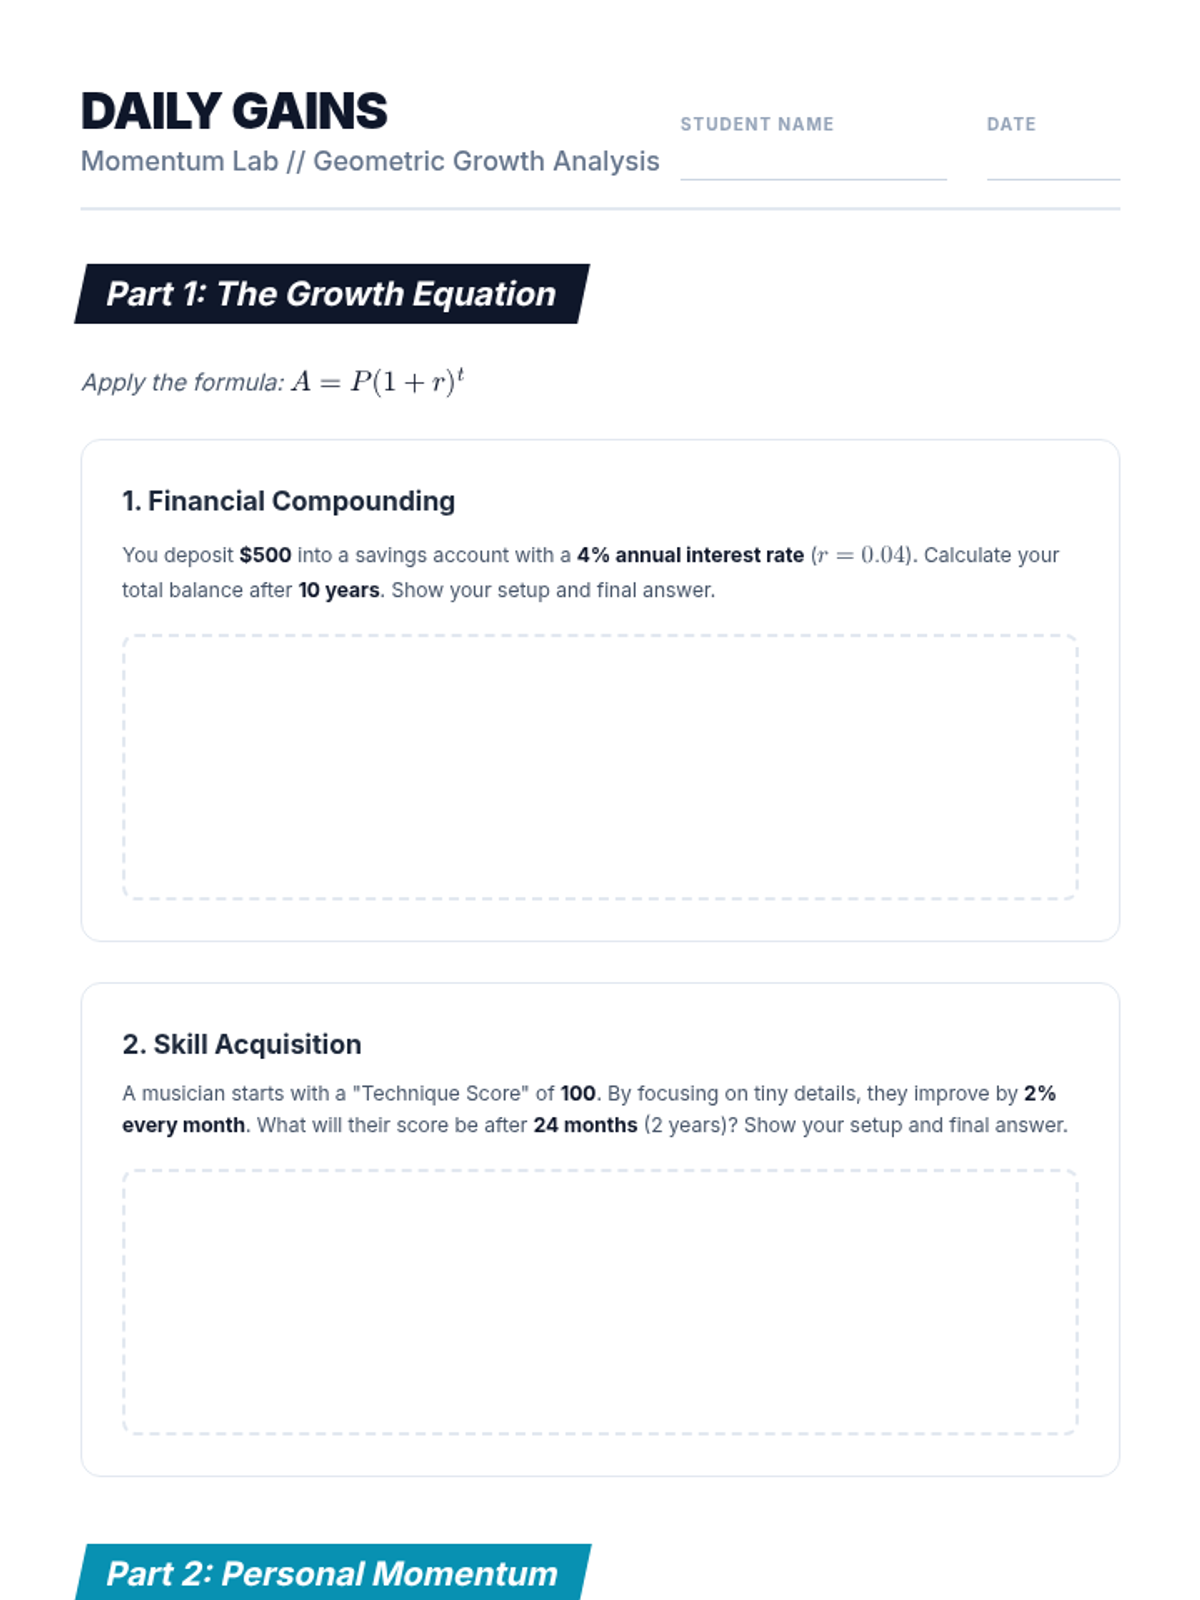
A comprehensive review of exponential growth, decay, and compound interest through real-world scenarios. Students practice applying discrete and continuous formulas to predict future values.
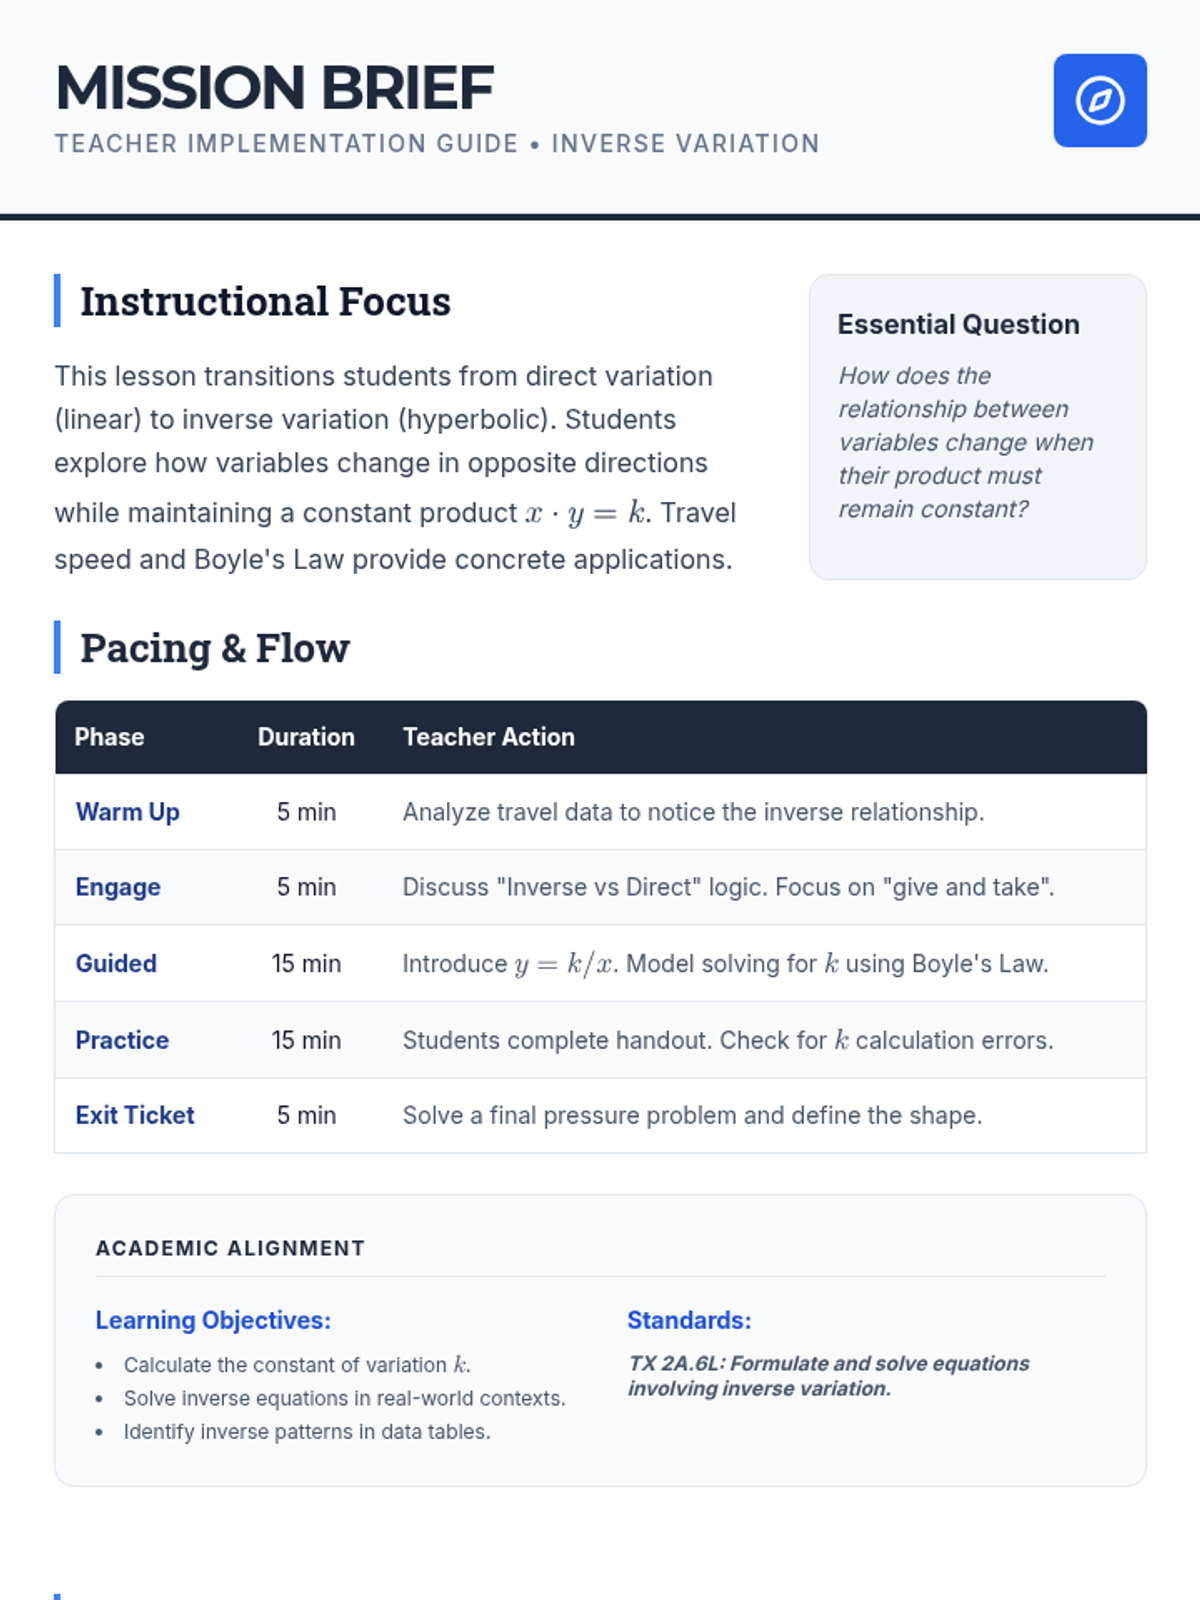
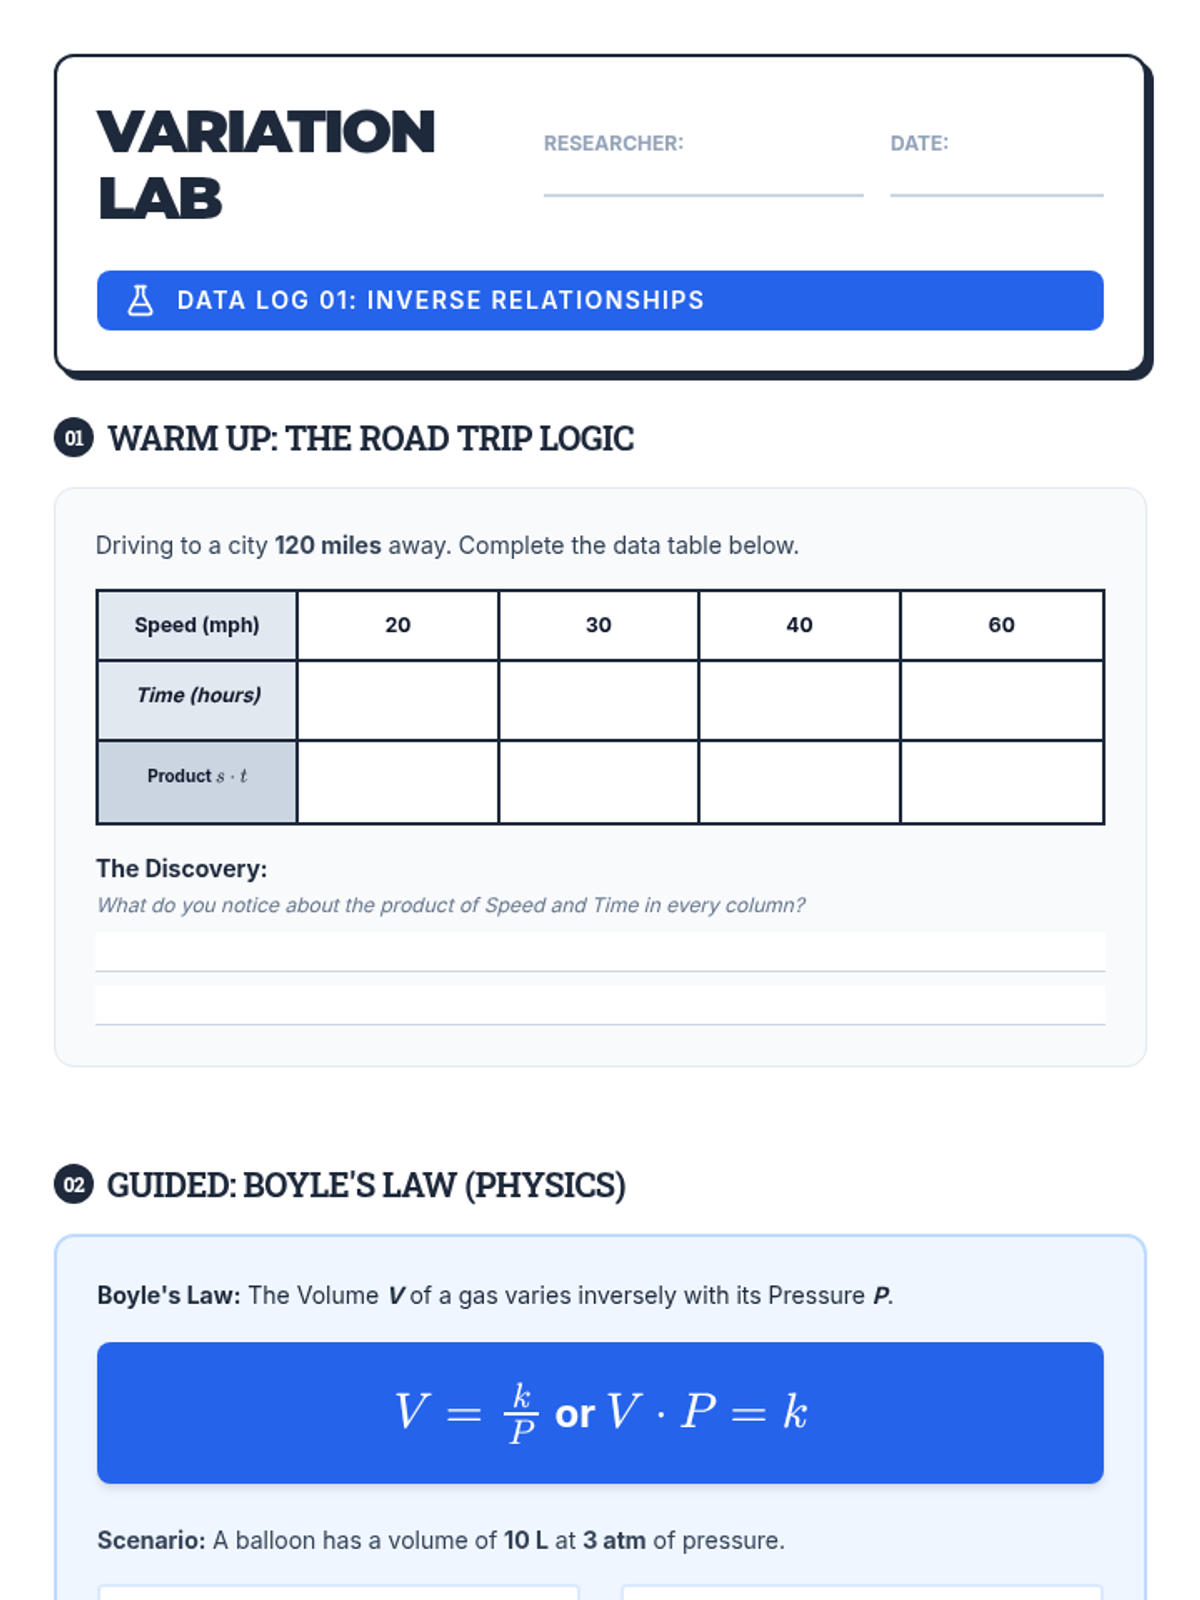
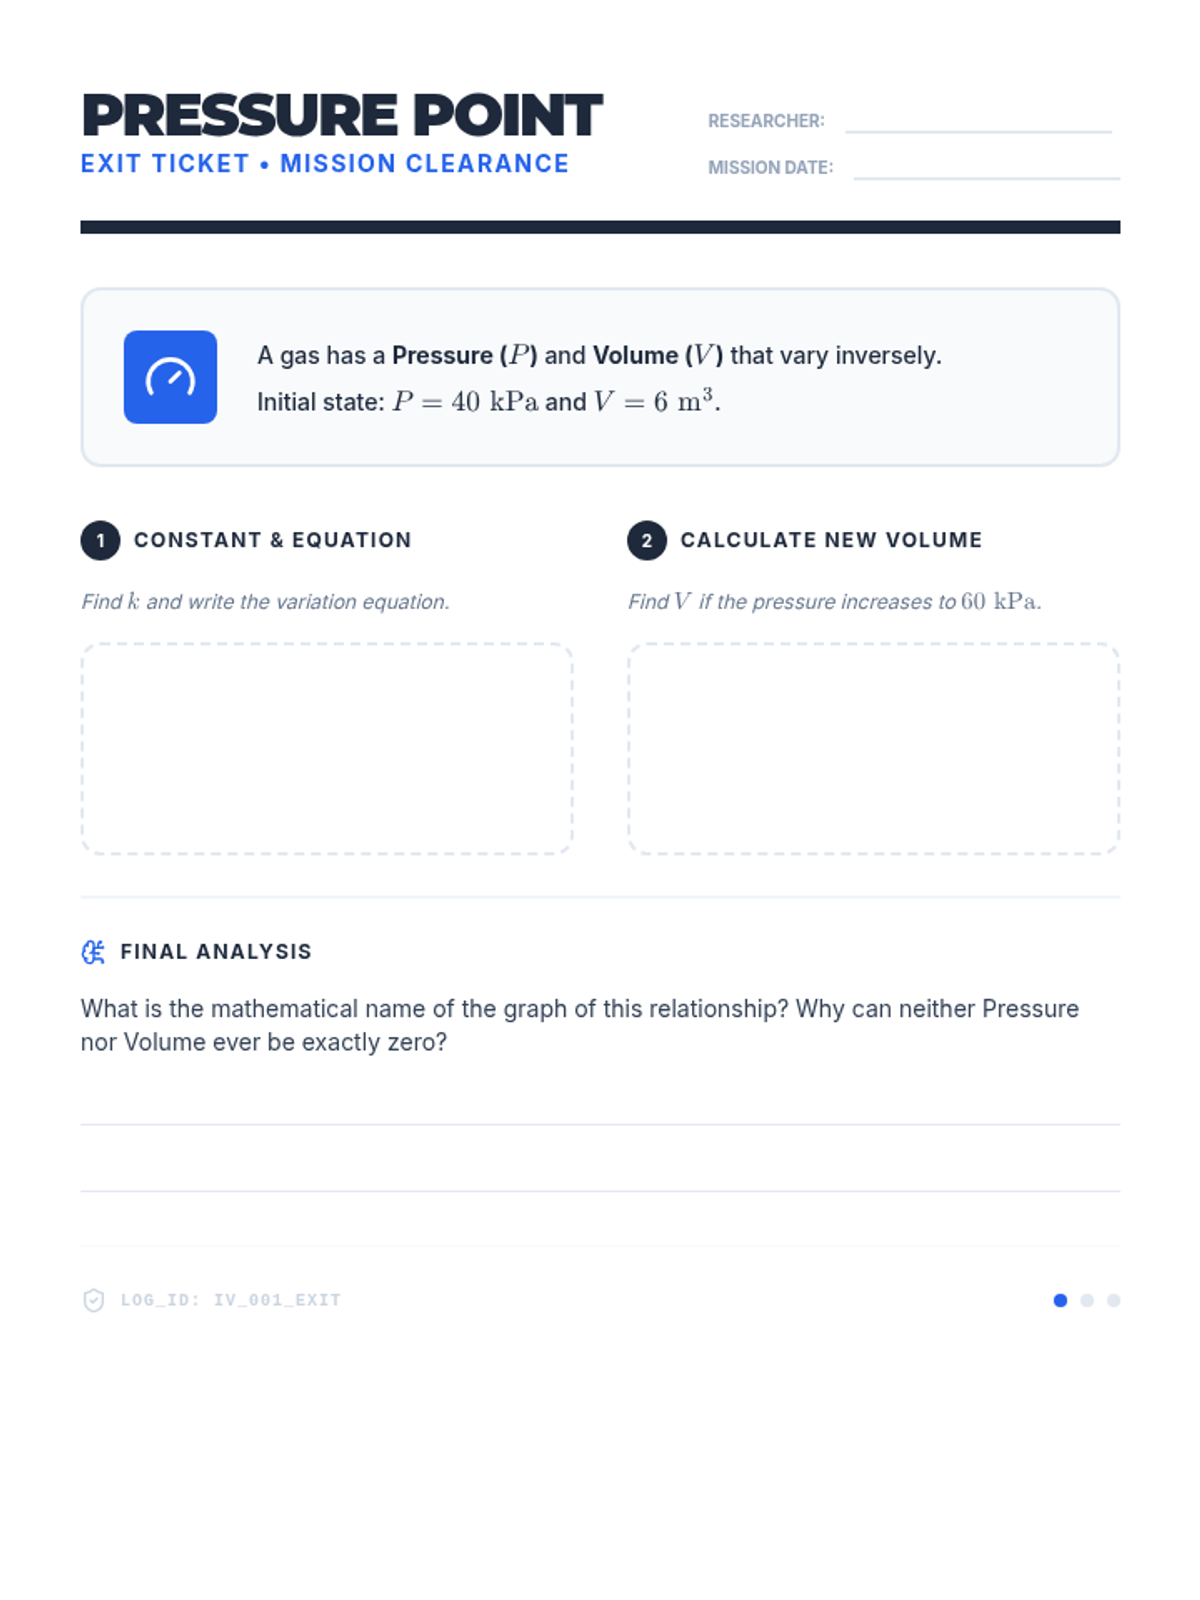
A 45-minute lesson exploring inverse variation through the lens of travel speed and Boyle's Law, focusing on formulating and solving equations for real-world scenarios.
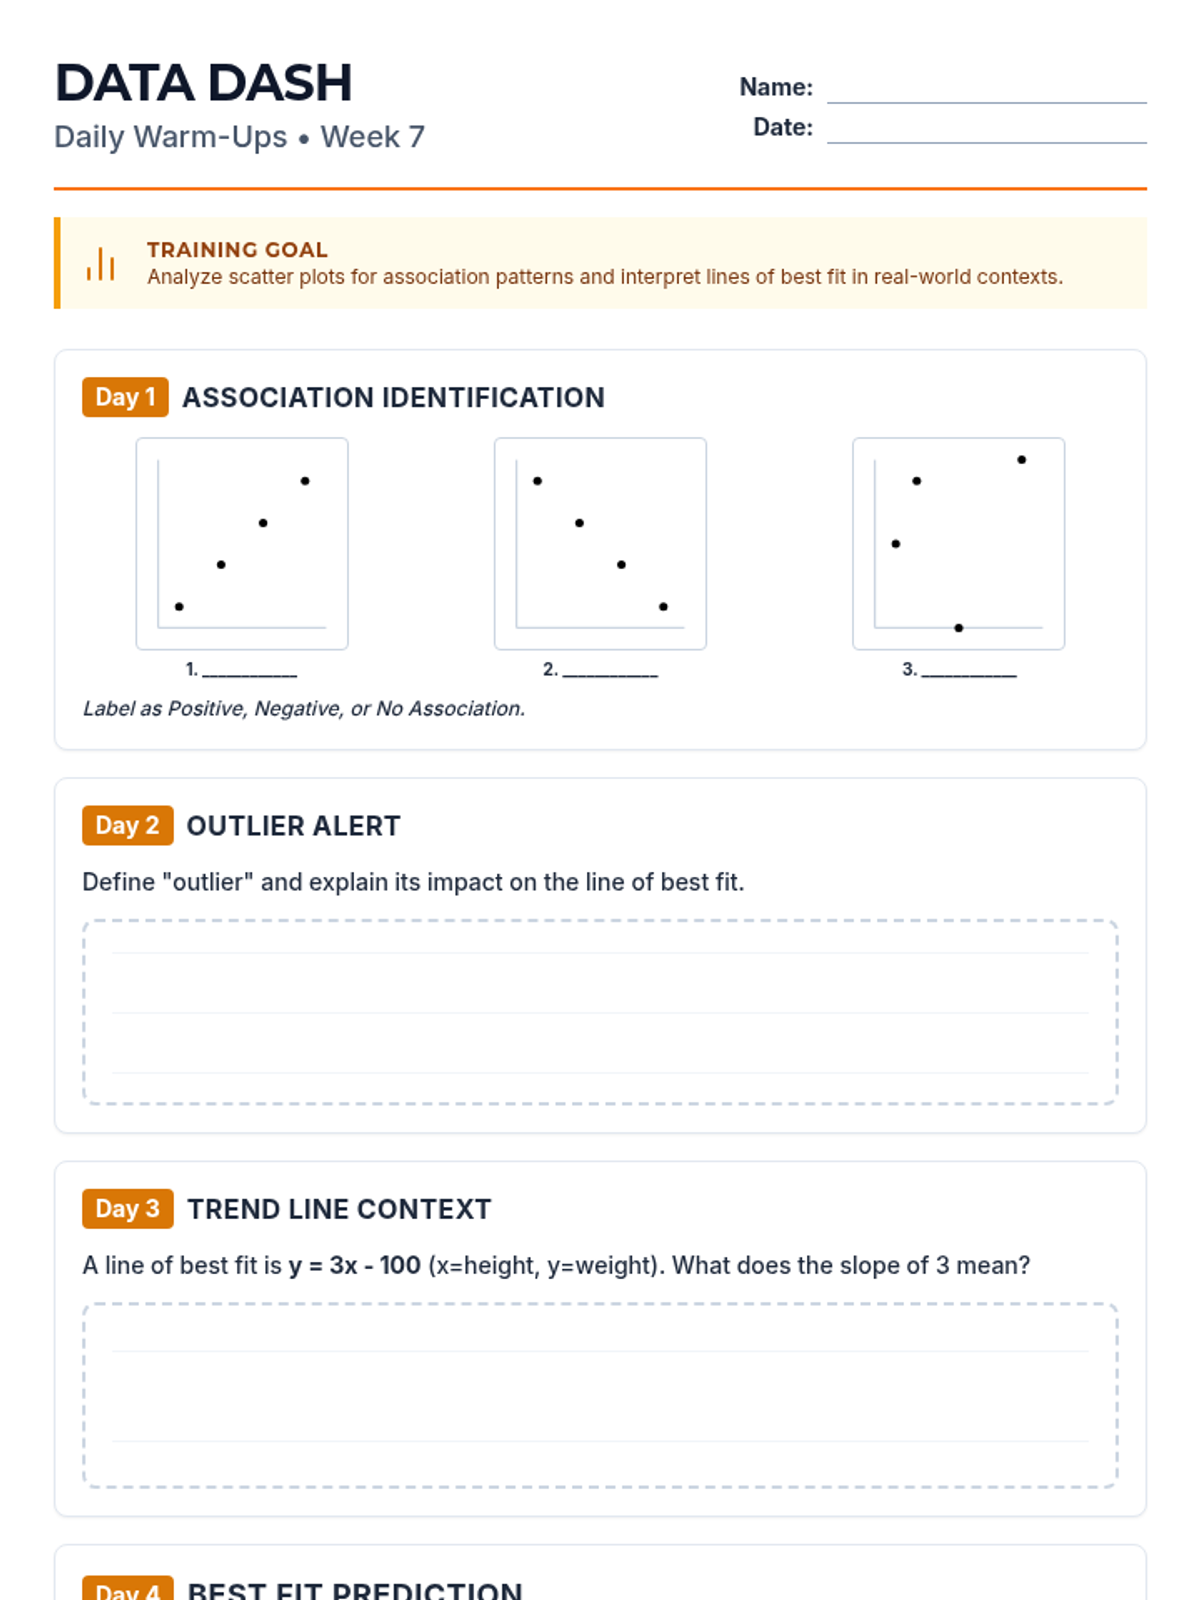
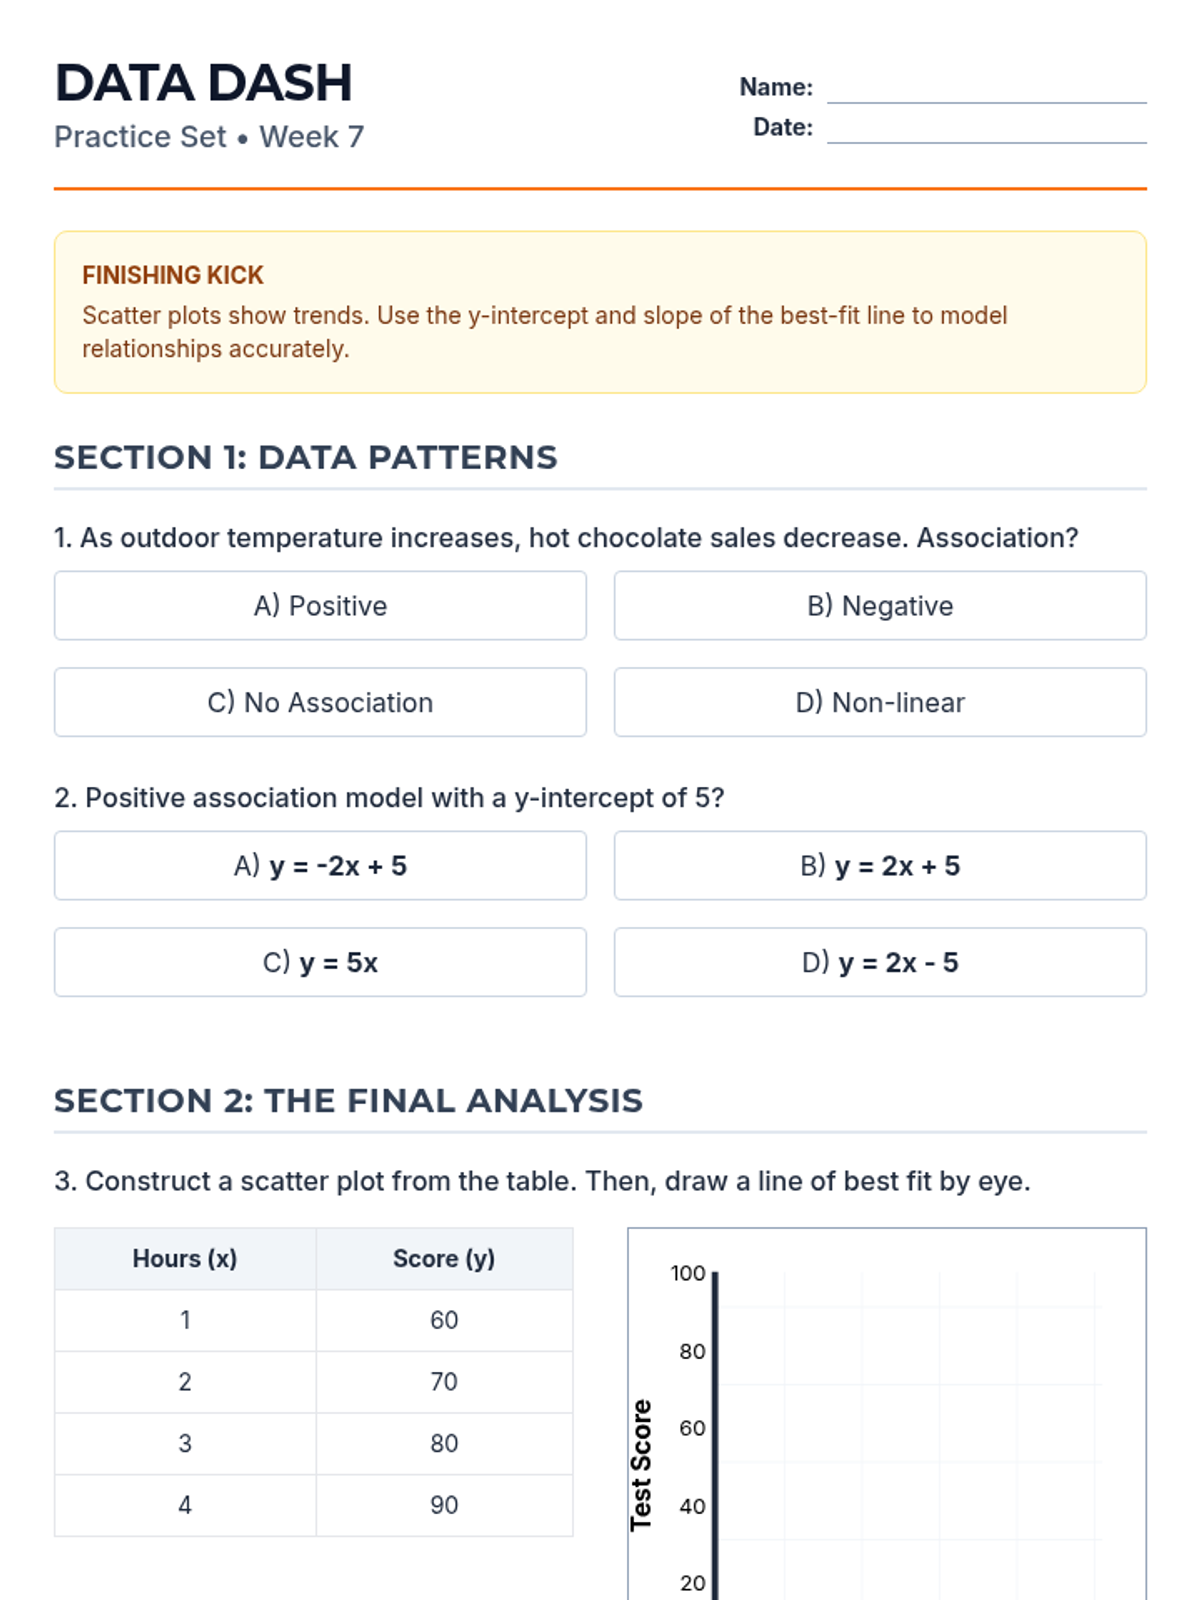
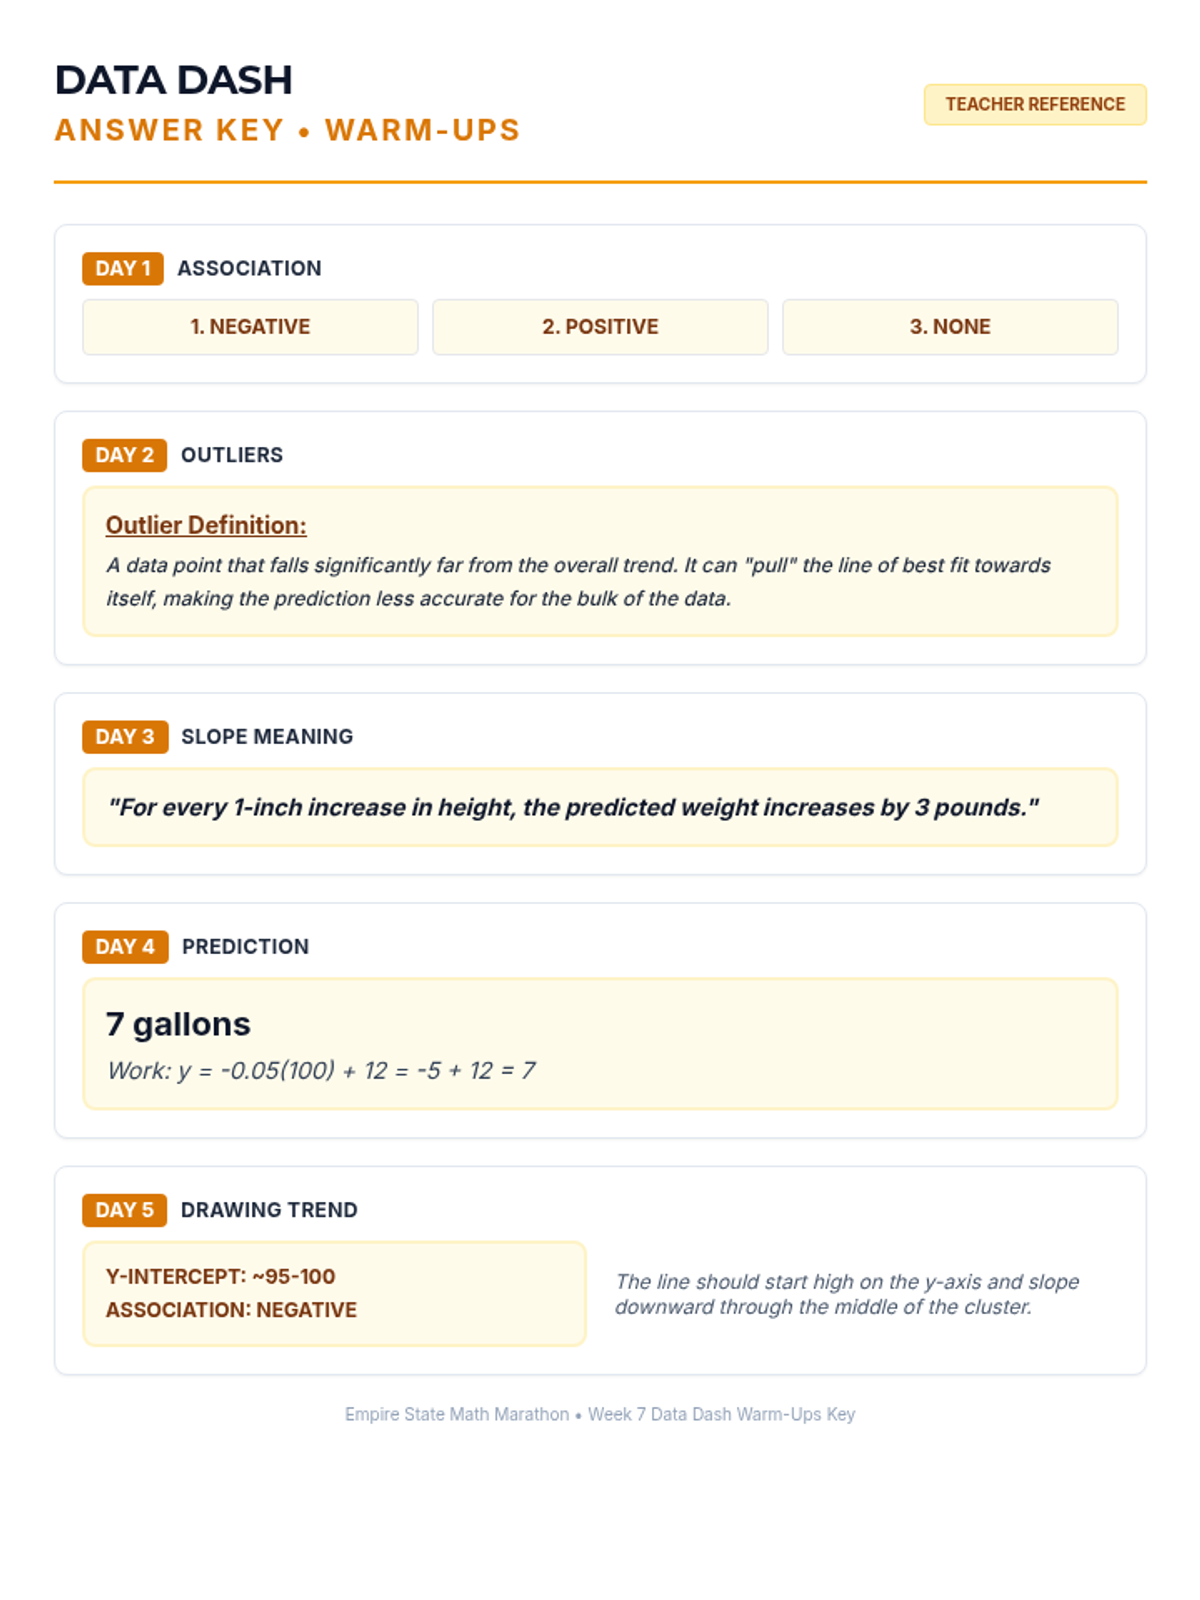
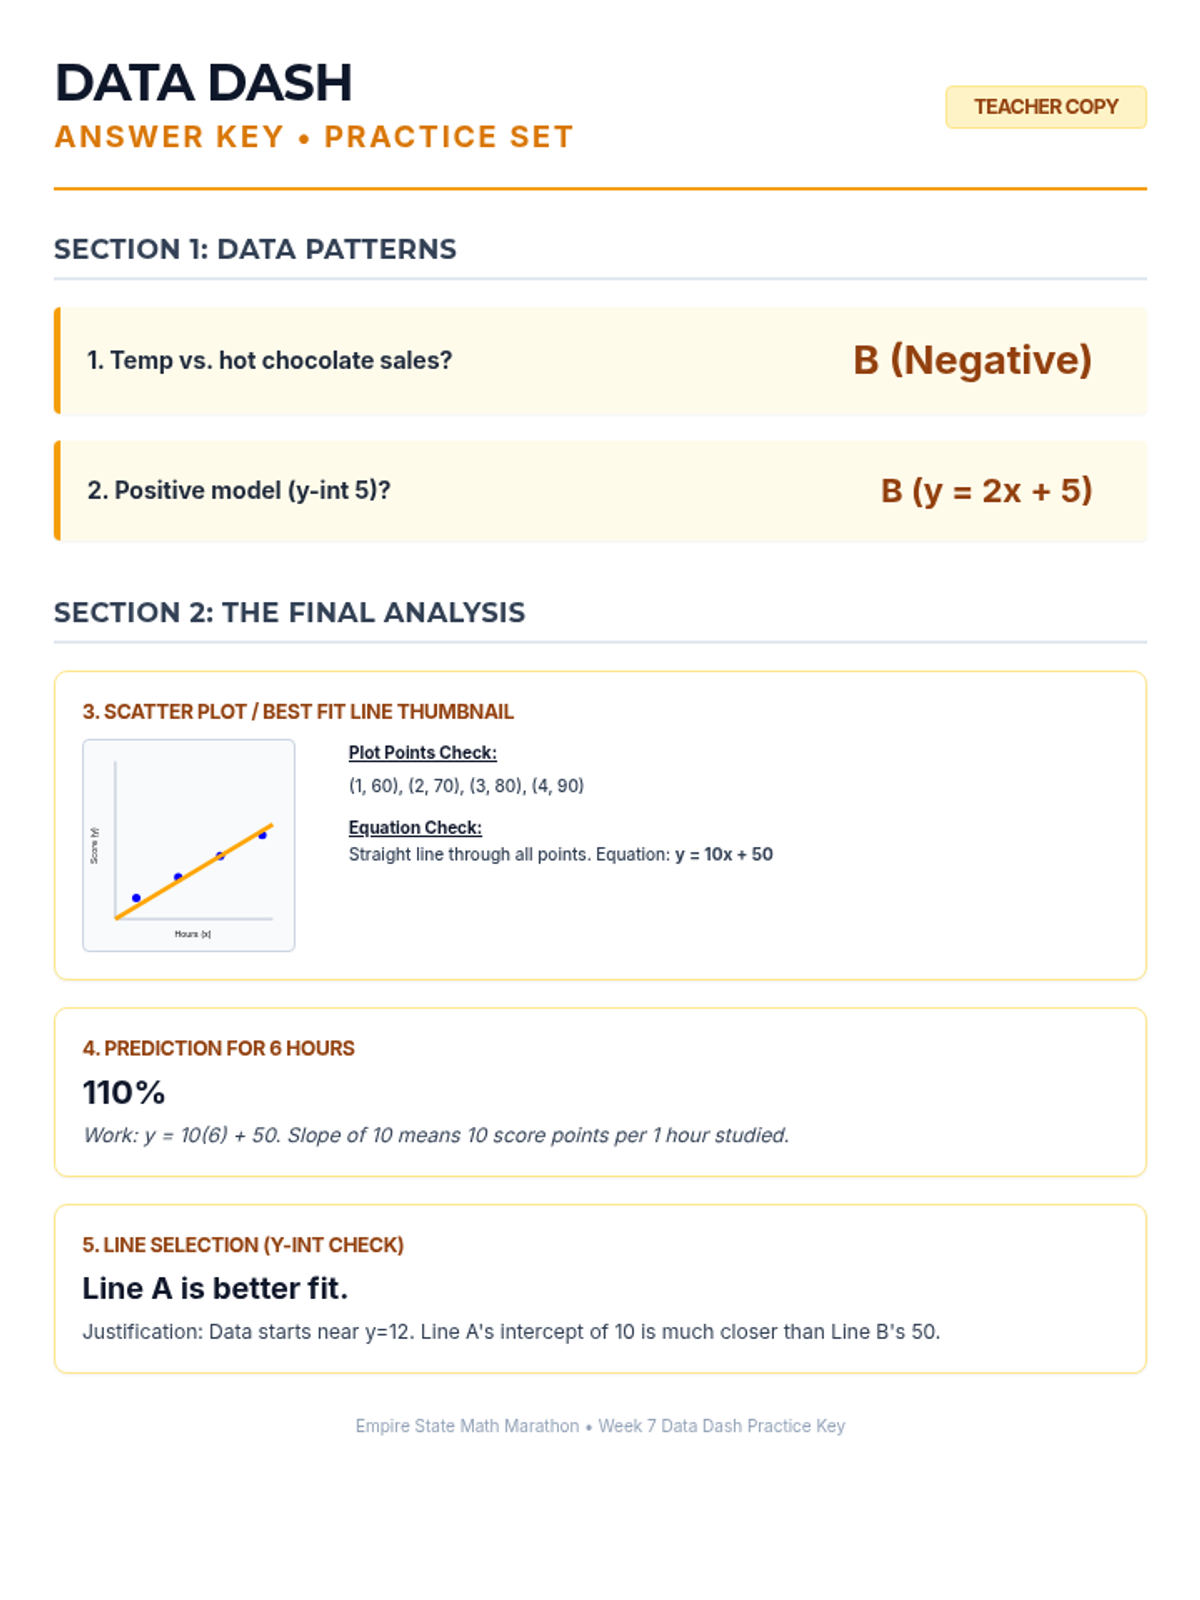
Week 7 analyzes bivariate data through scatter plots, interpreting lines of best fit, and using linear models to make predictions.
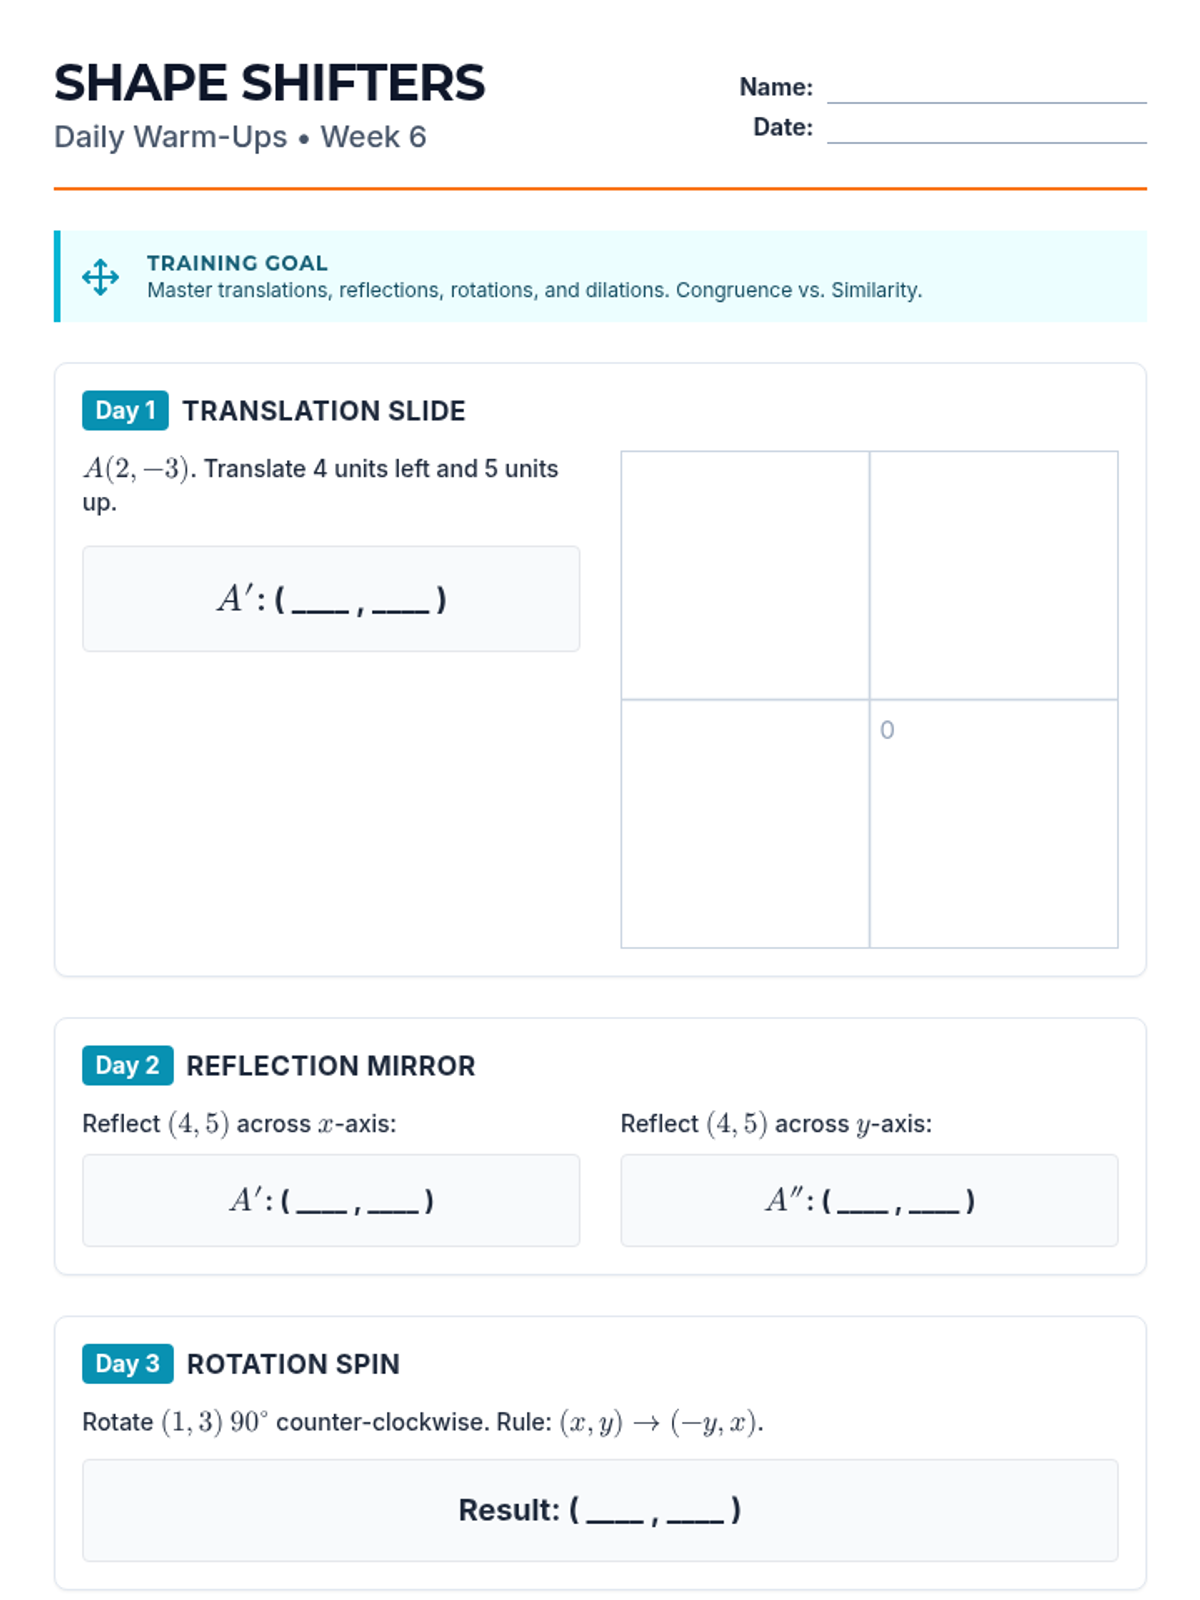
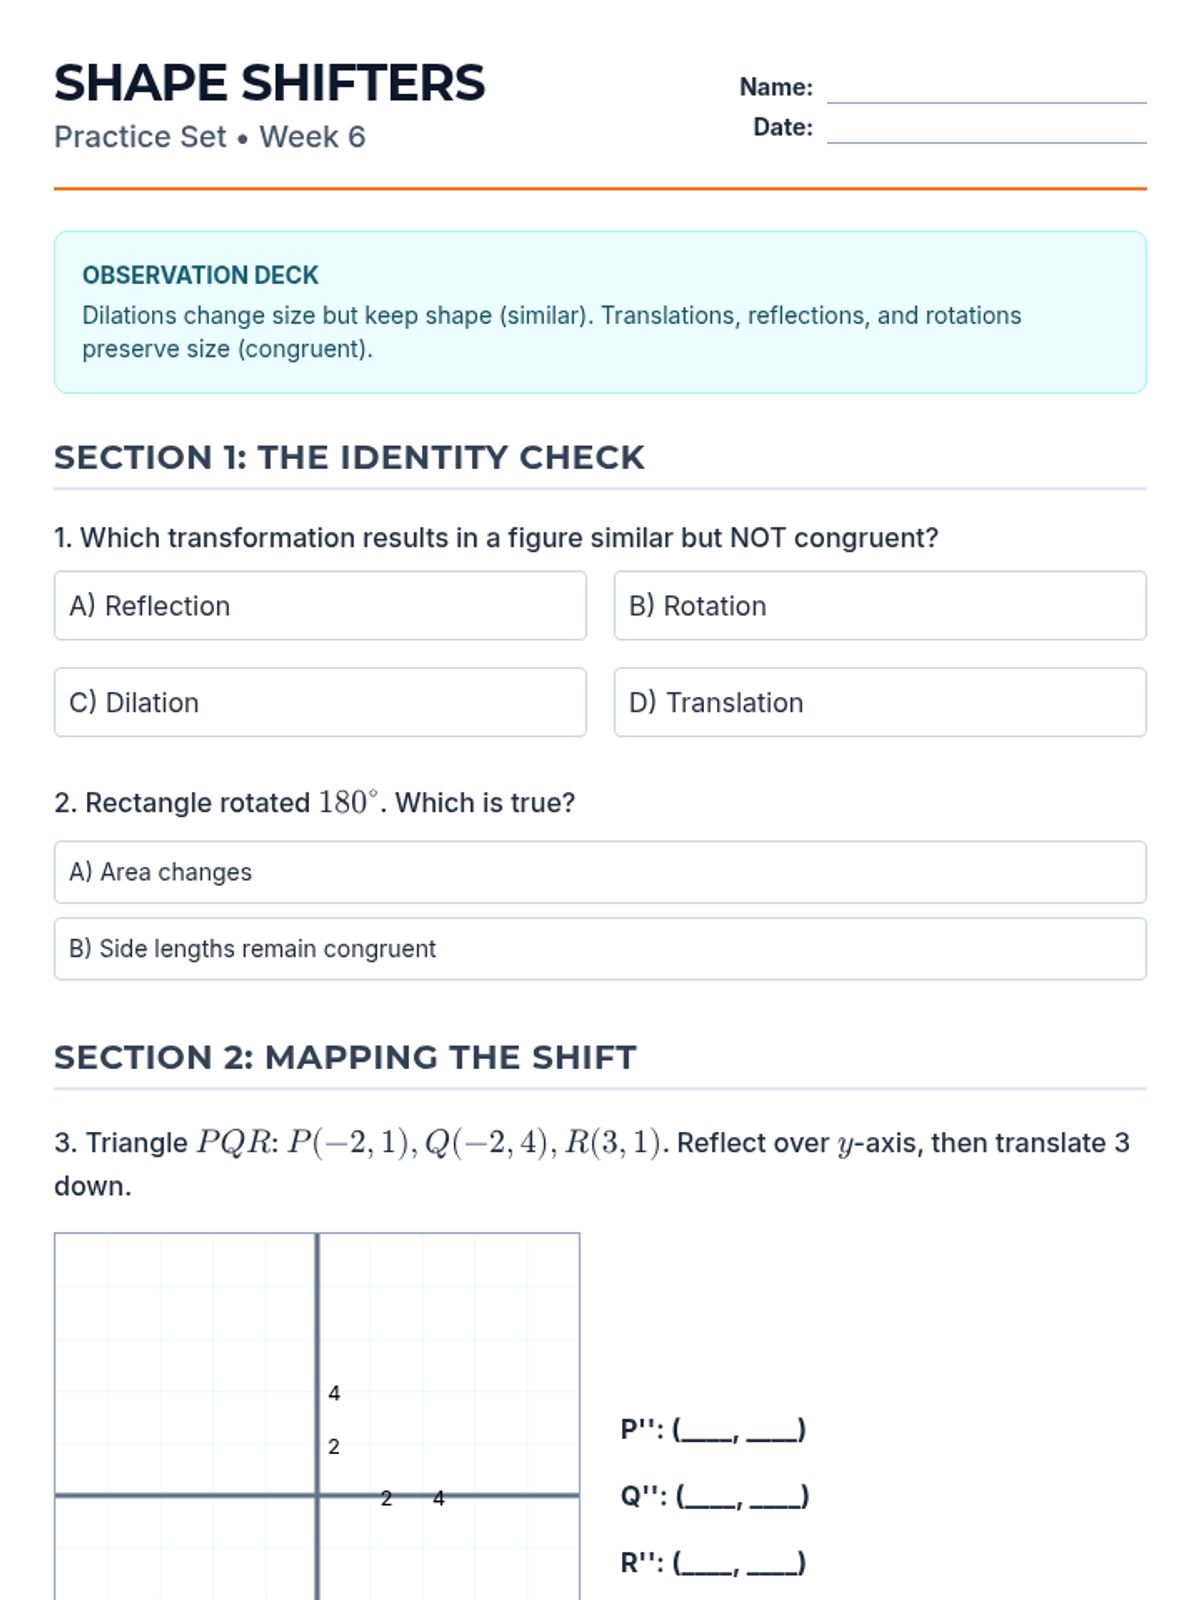
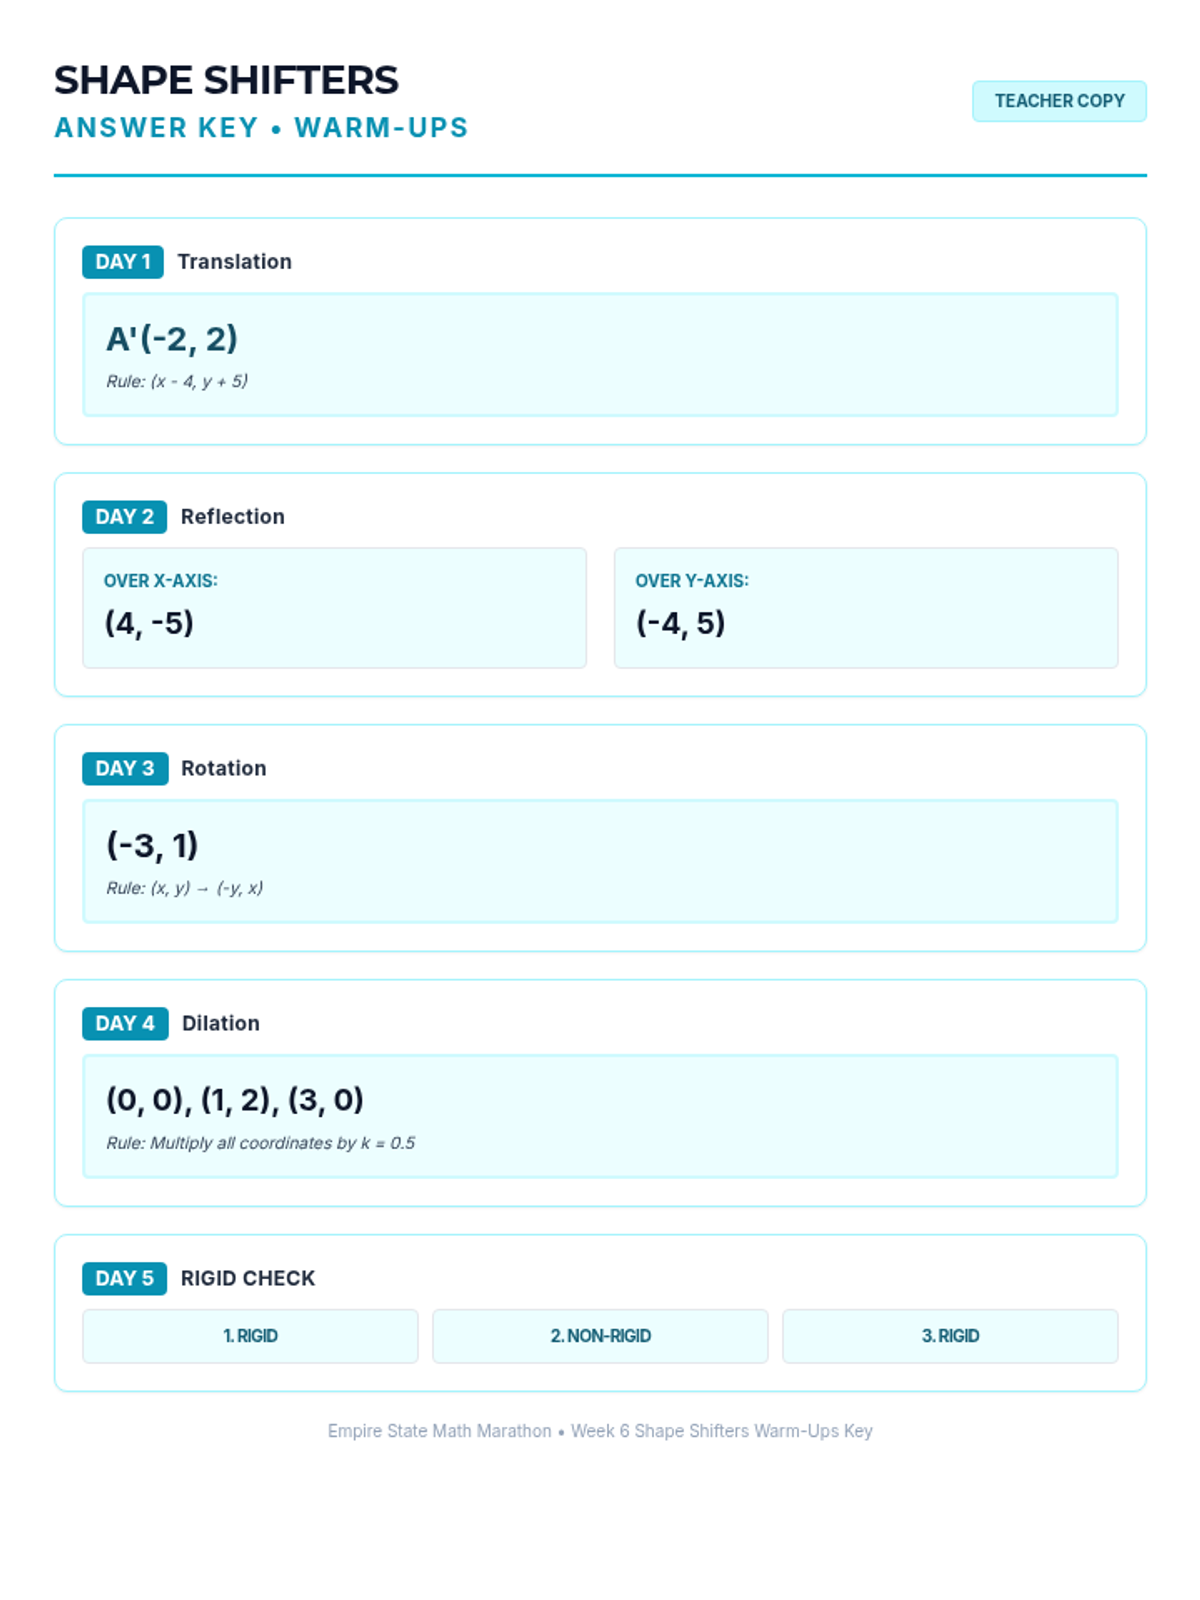
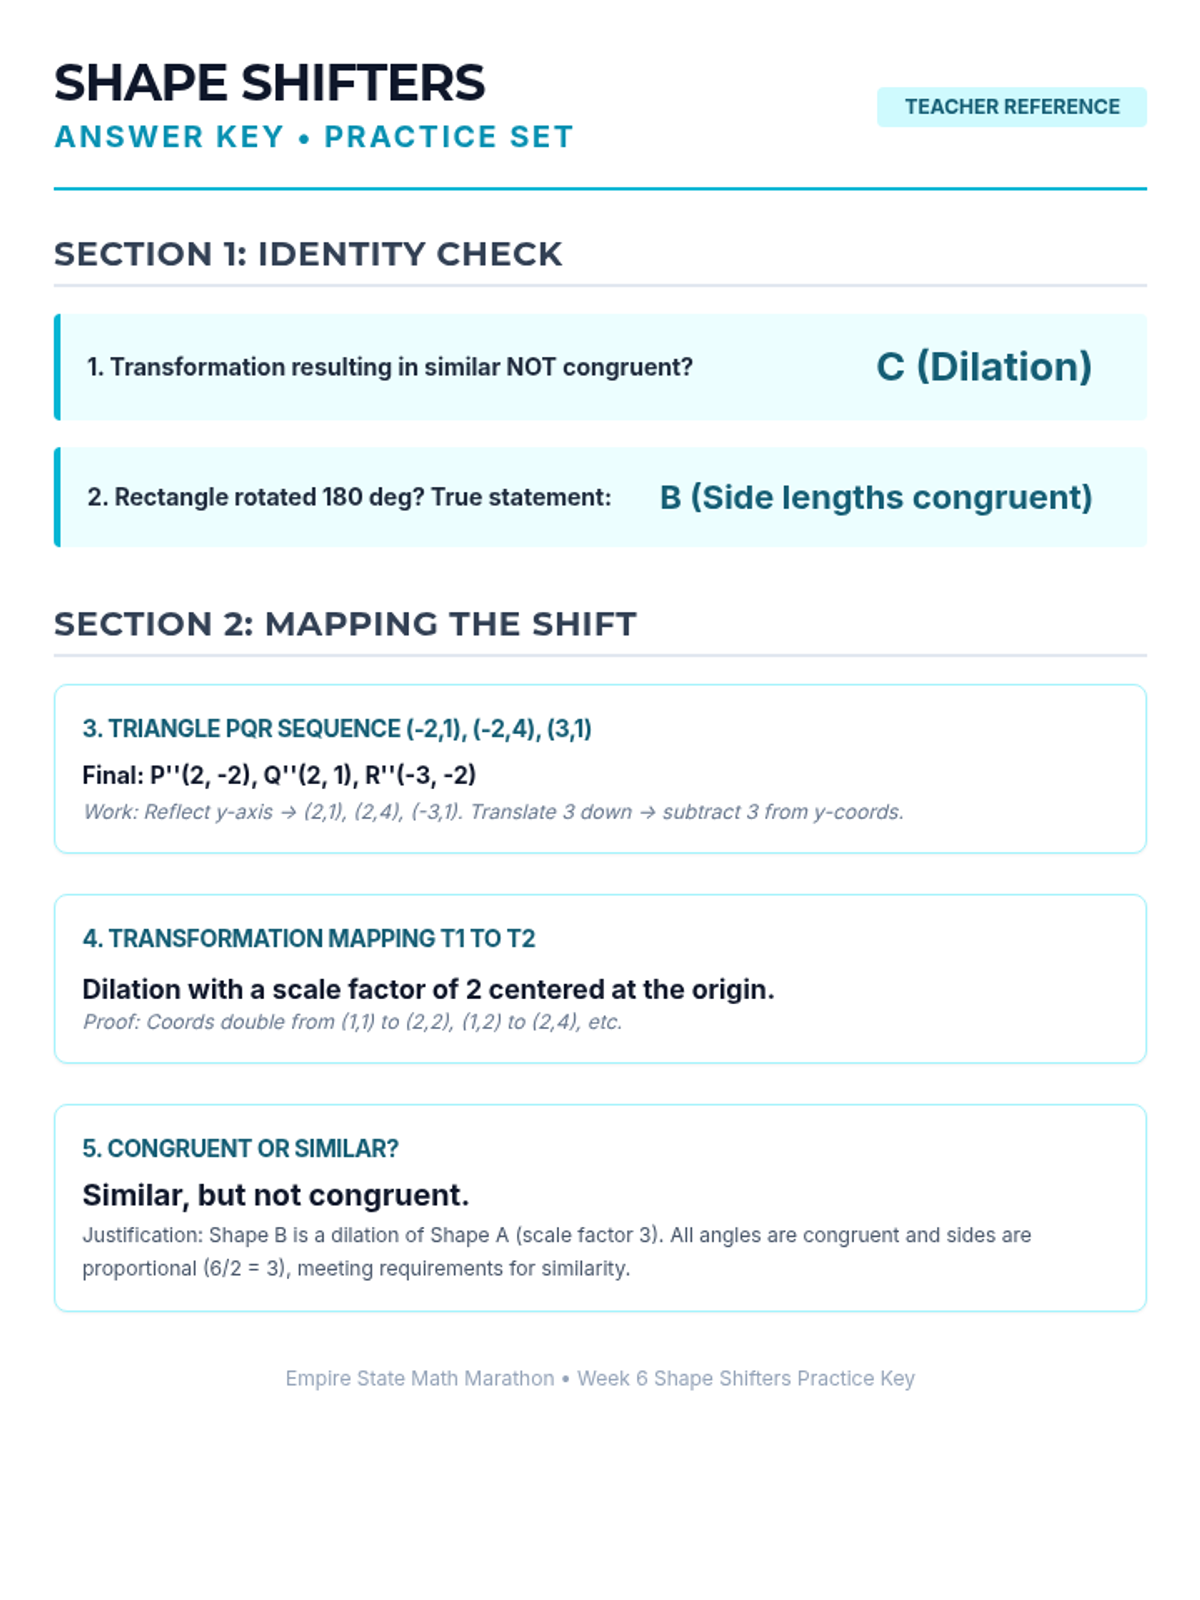
Week 6 focuses on rigid transformations (translations, reflections, rotations) and similarity transformations (dilations).
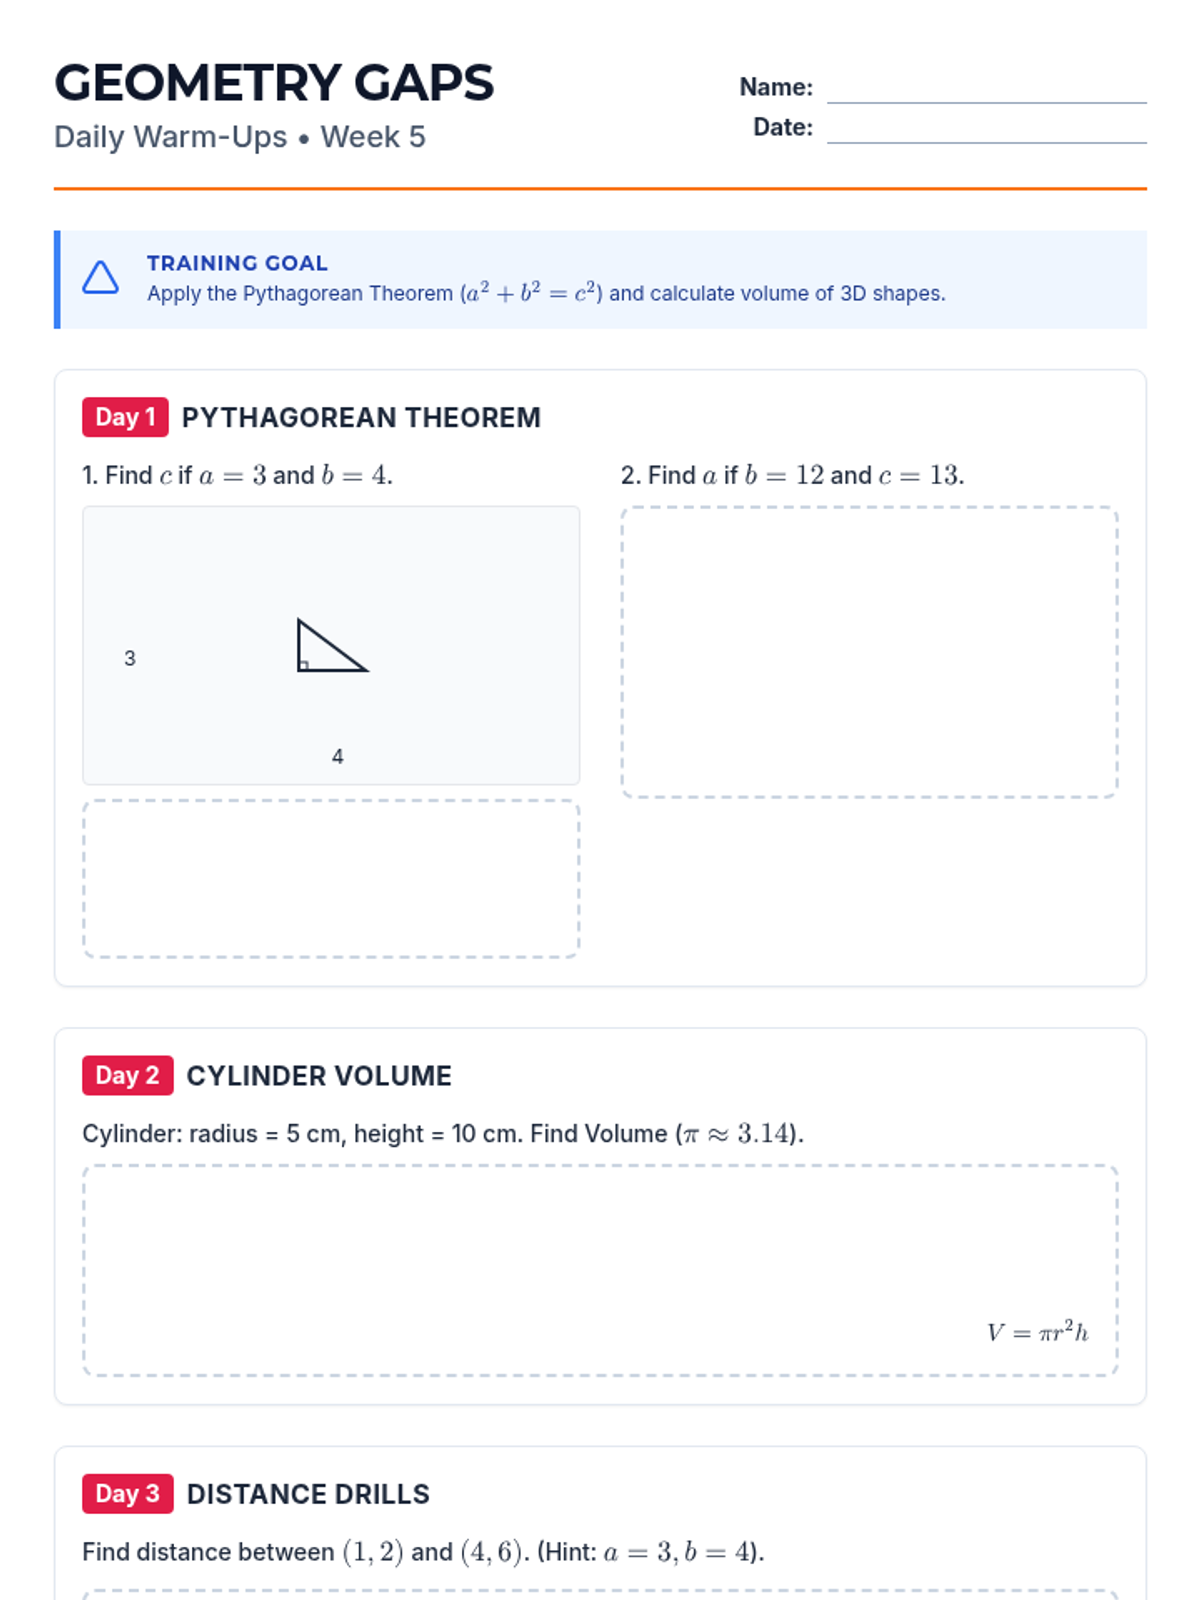
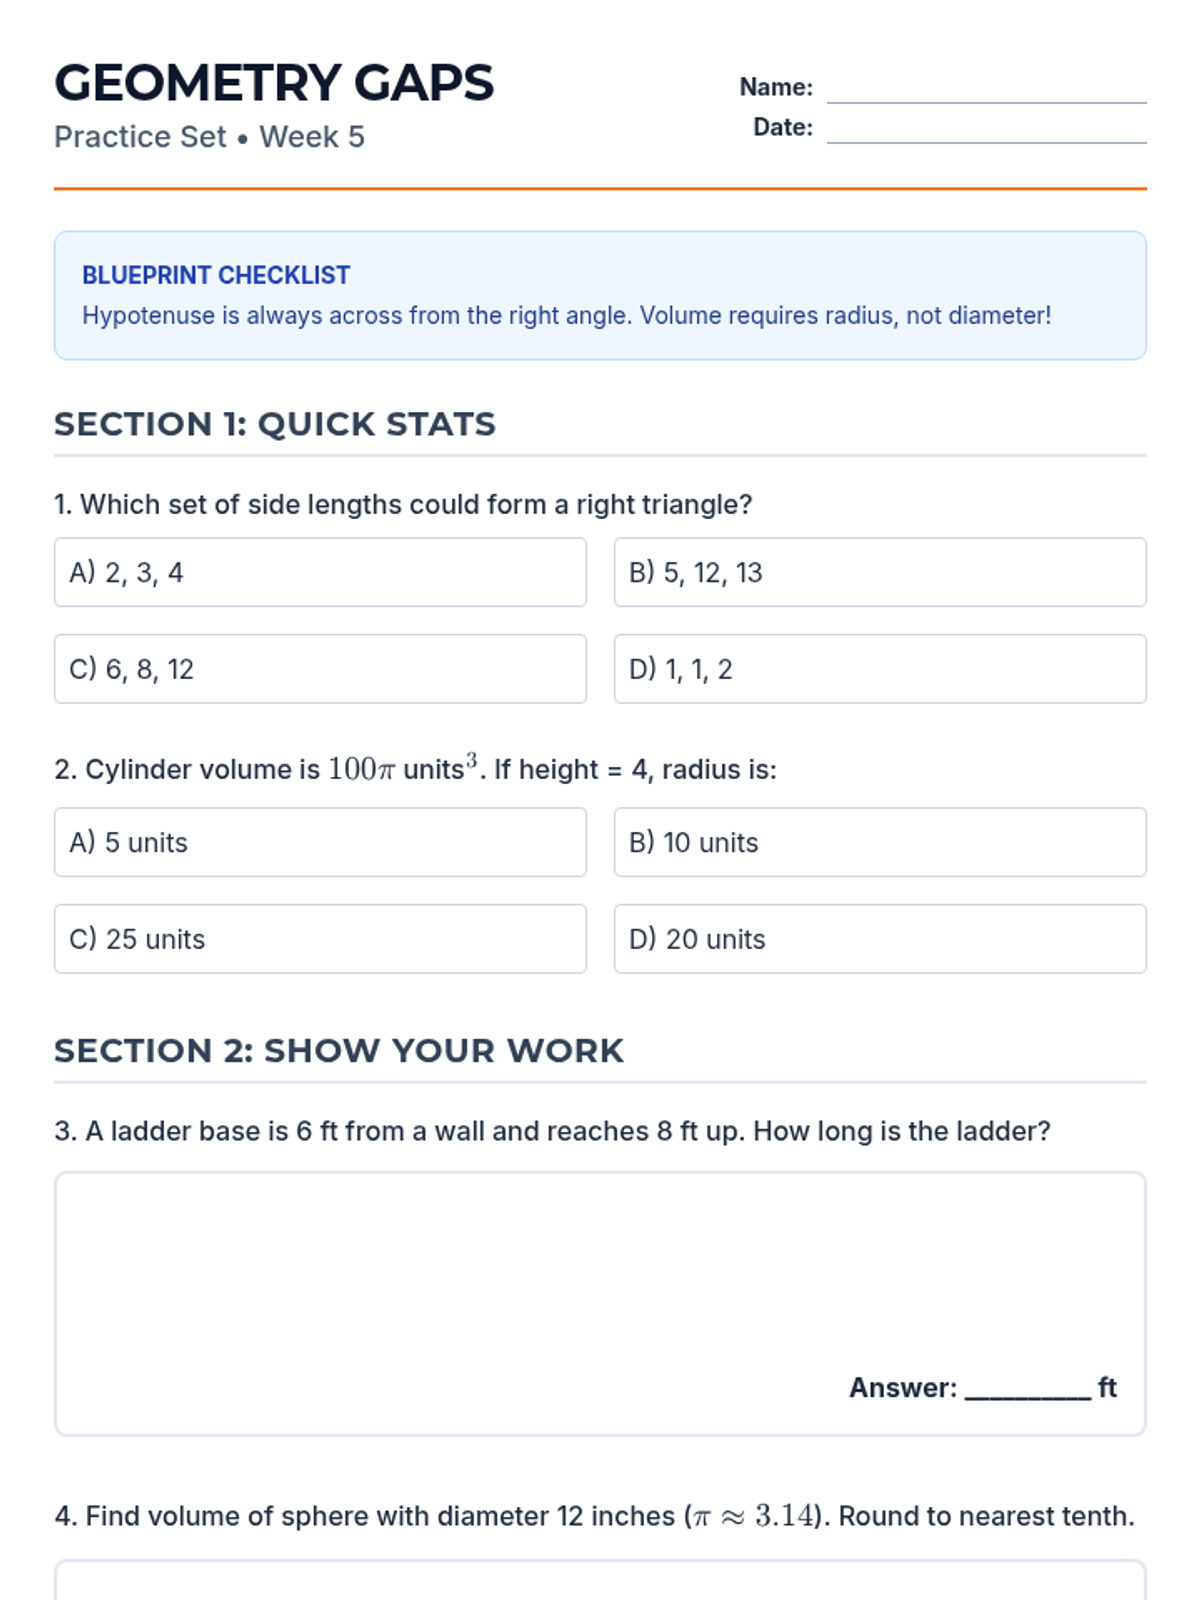
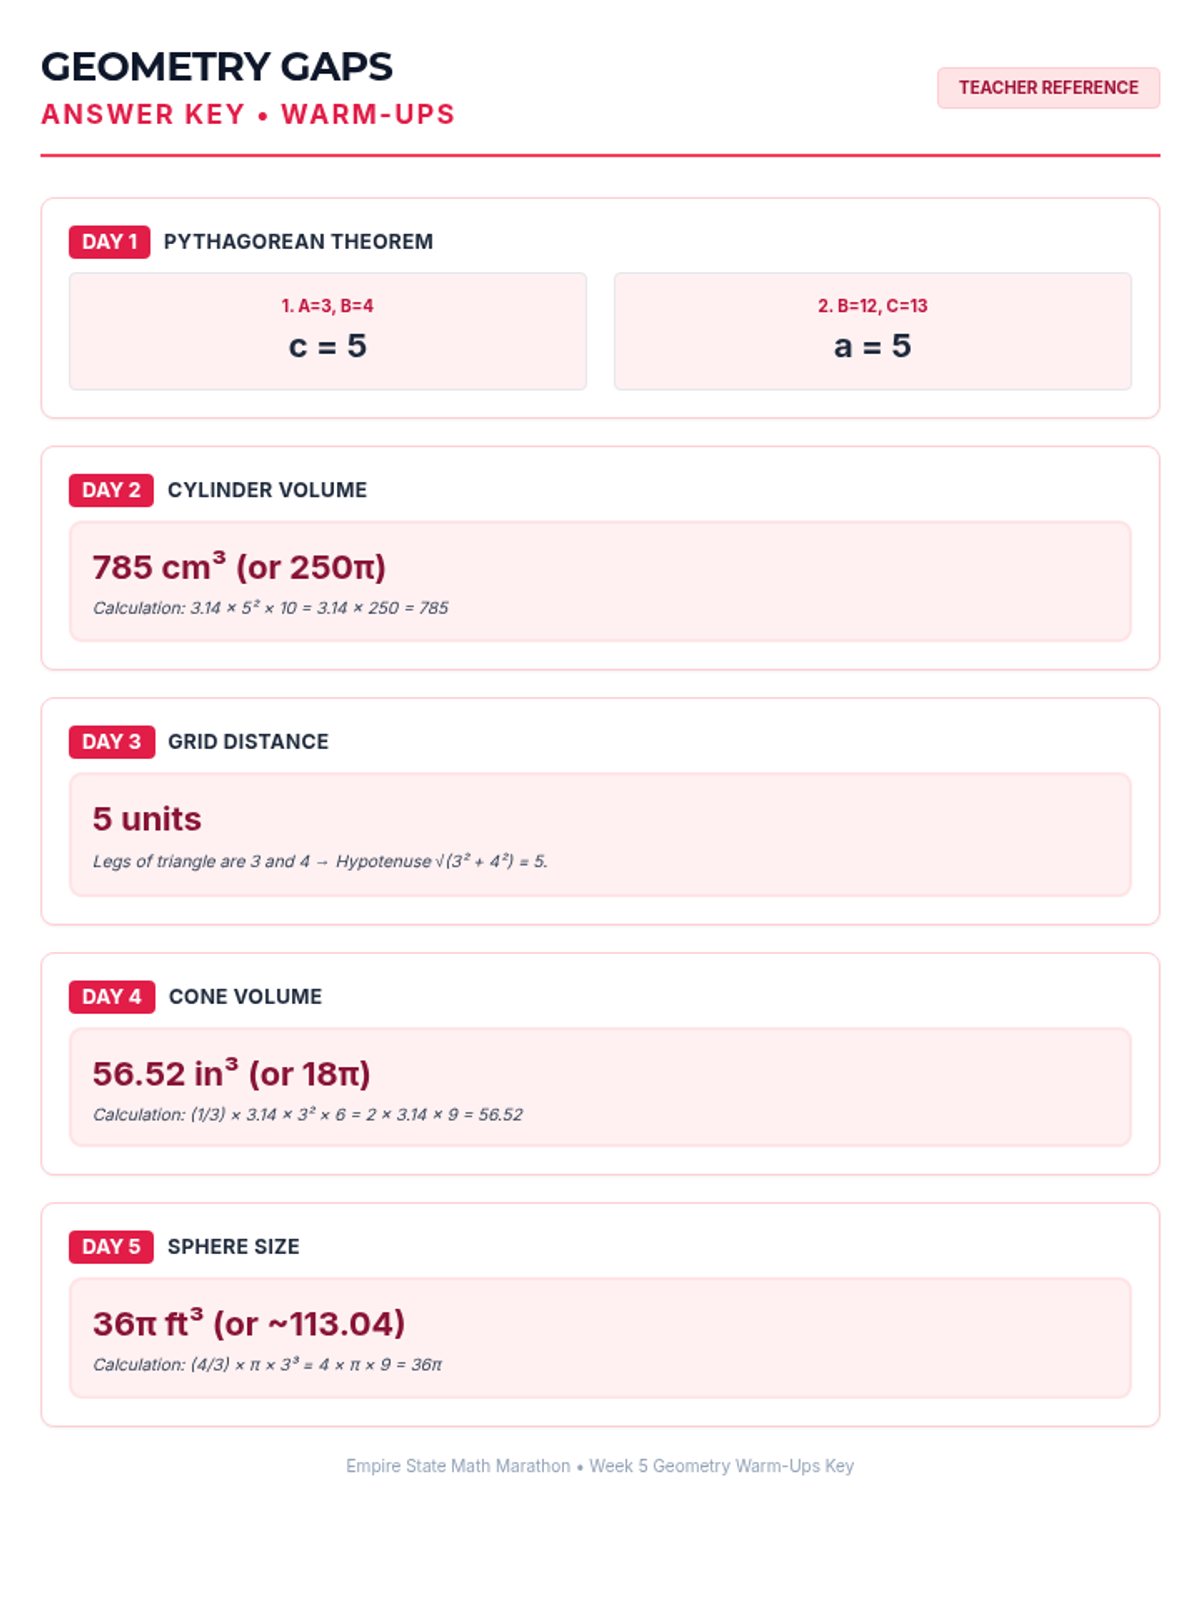
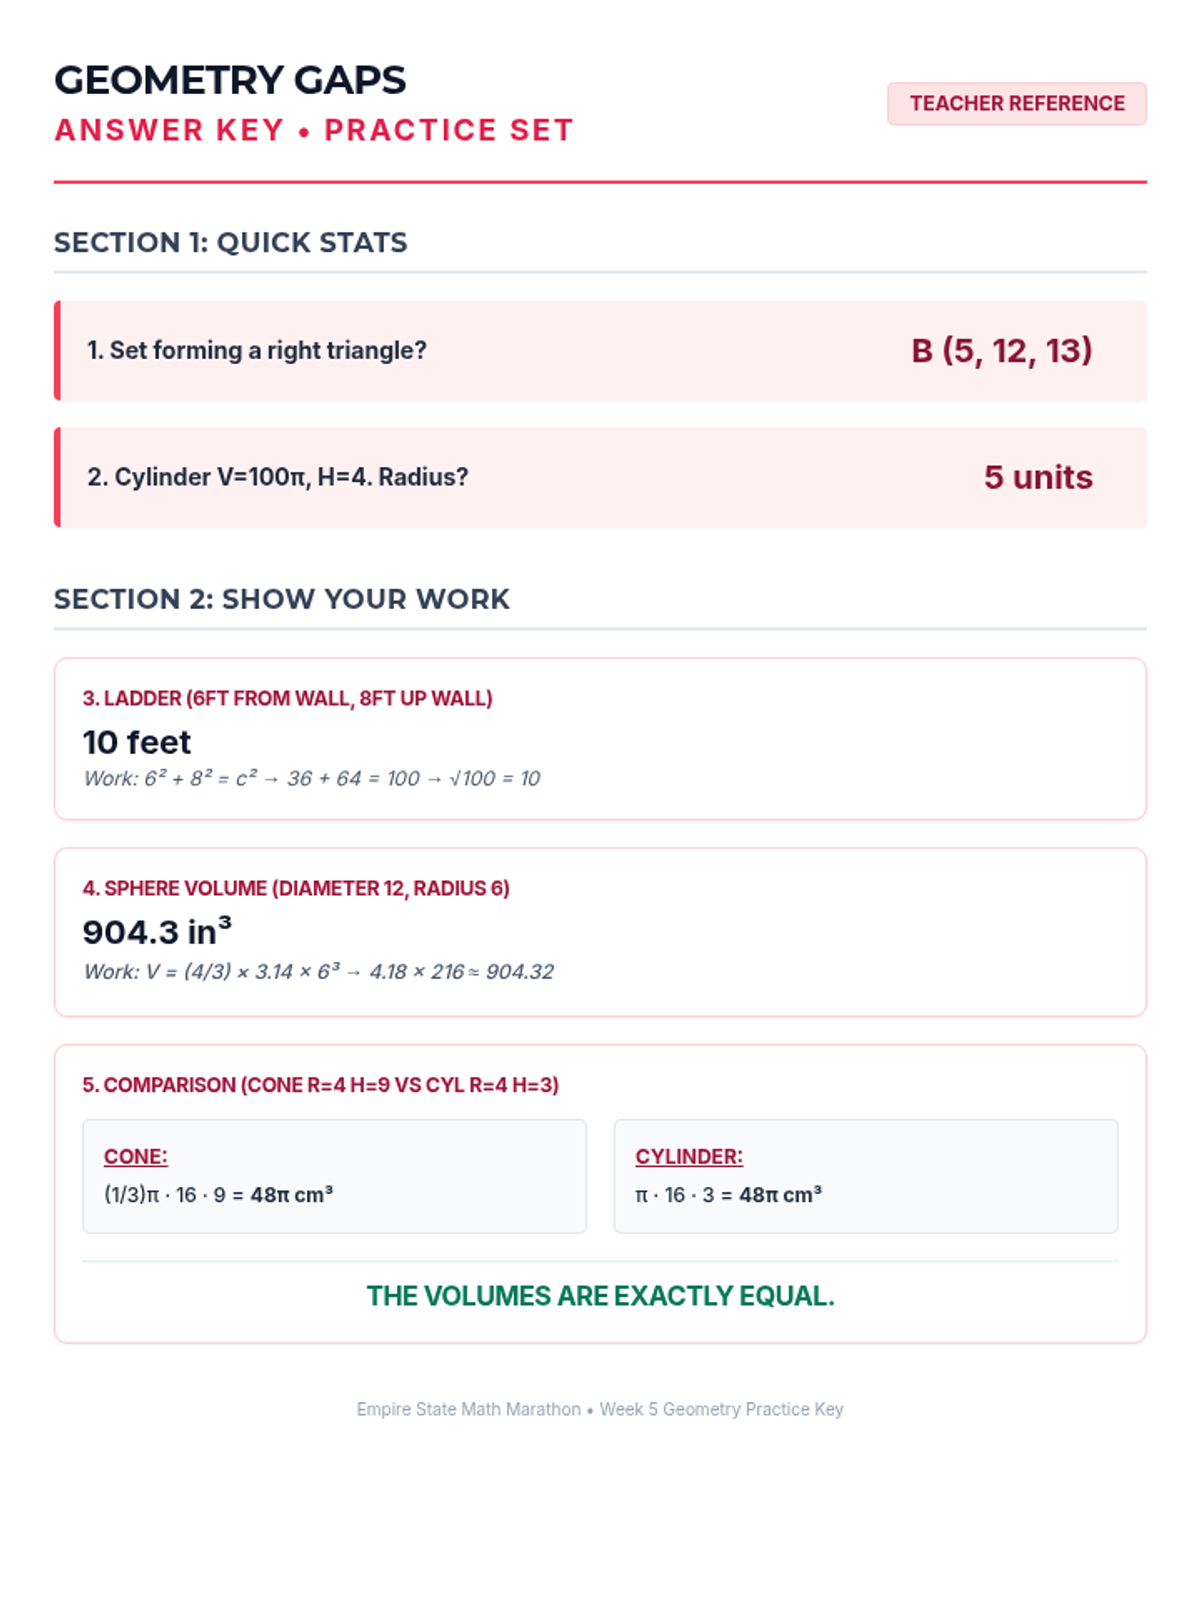
Week 5 reviews the Pythagorean Theorem and volume formulas for cylinders, cones, and spheres.
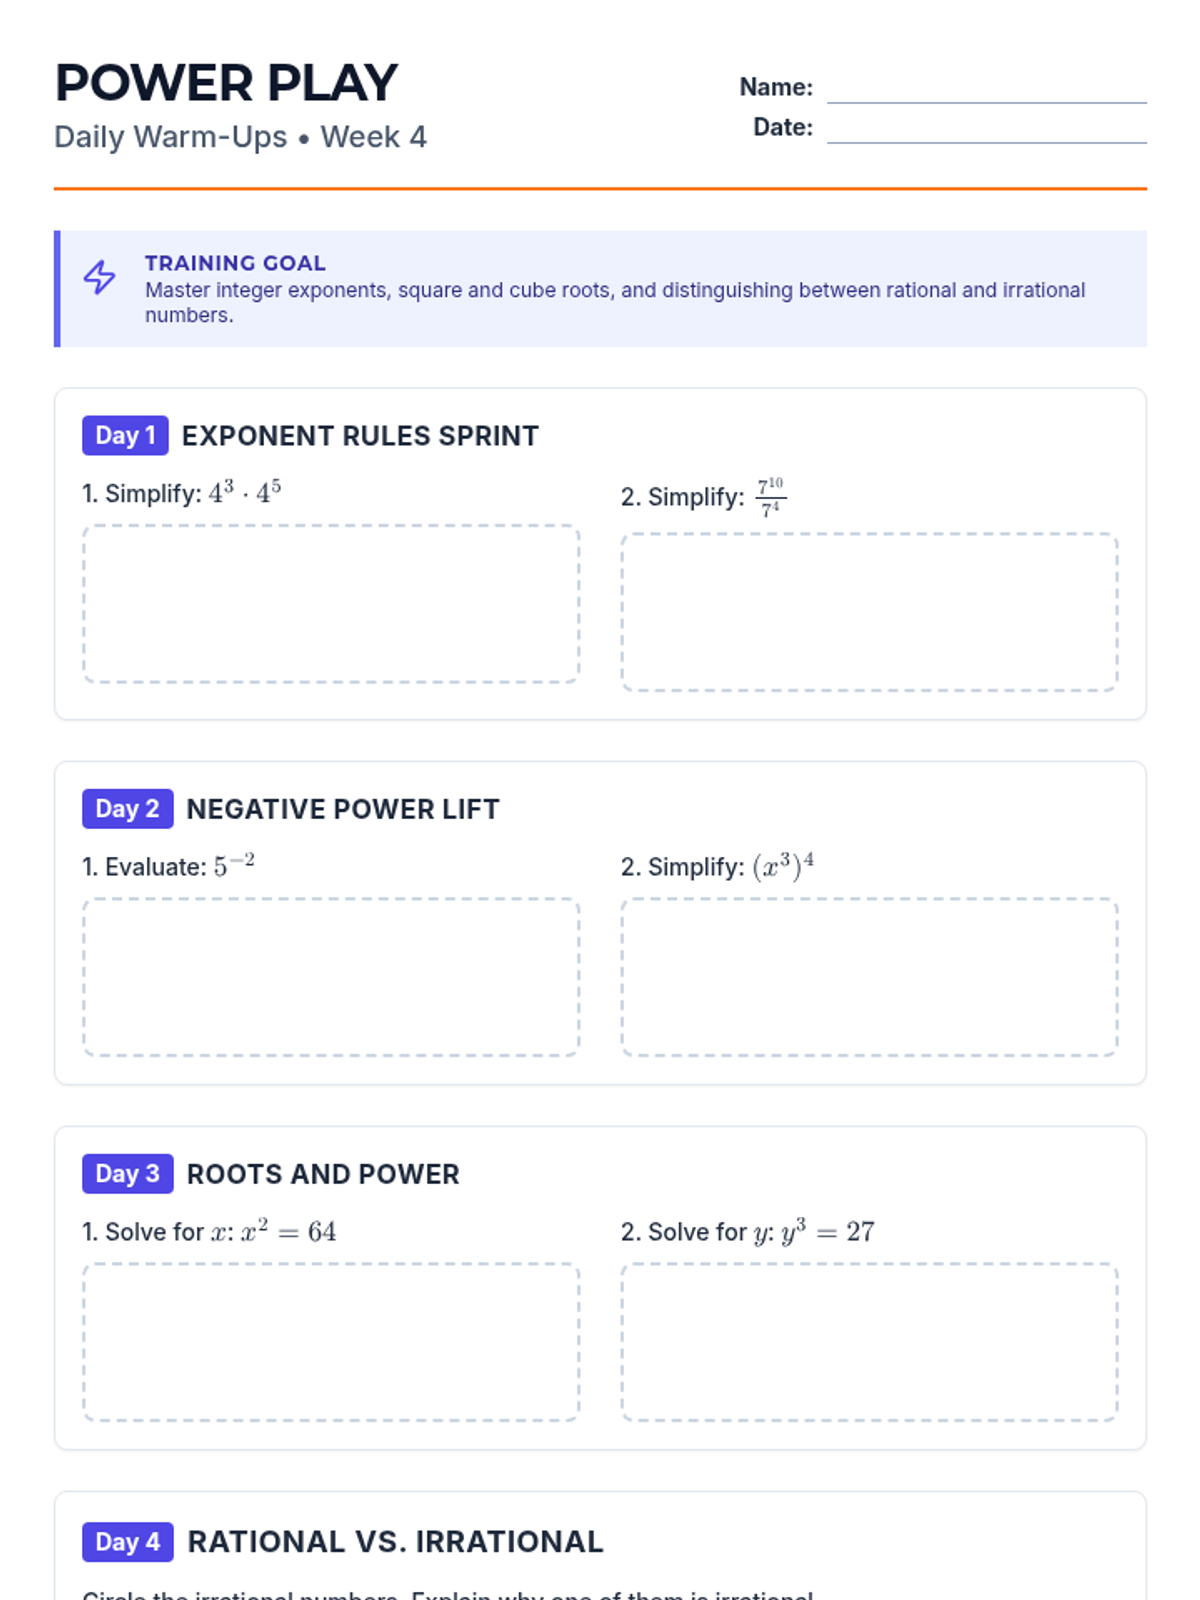
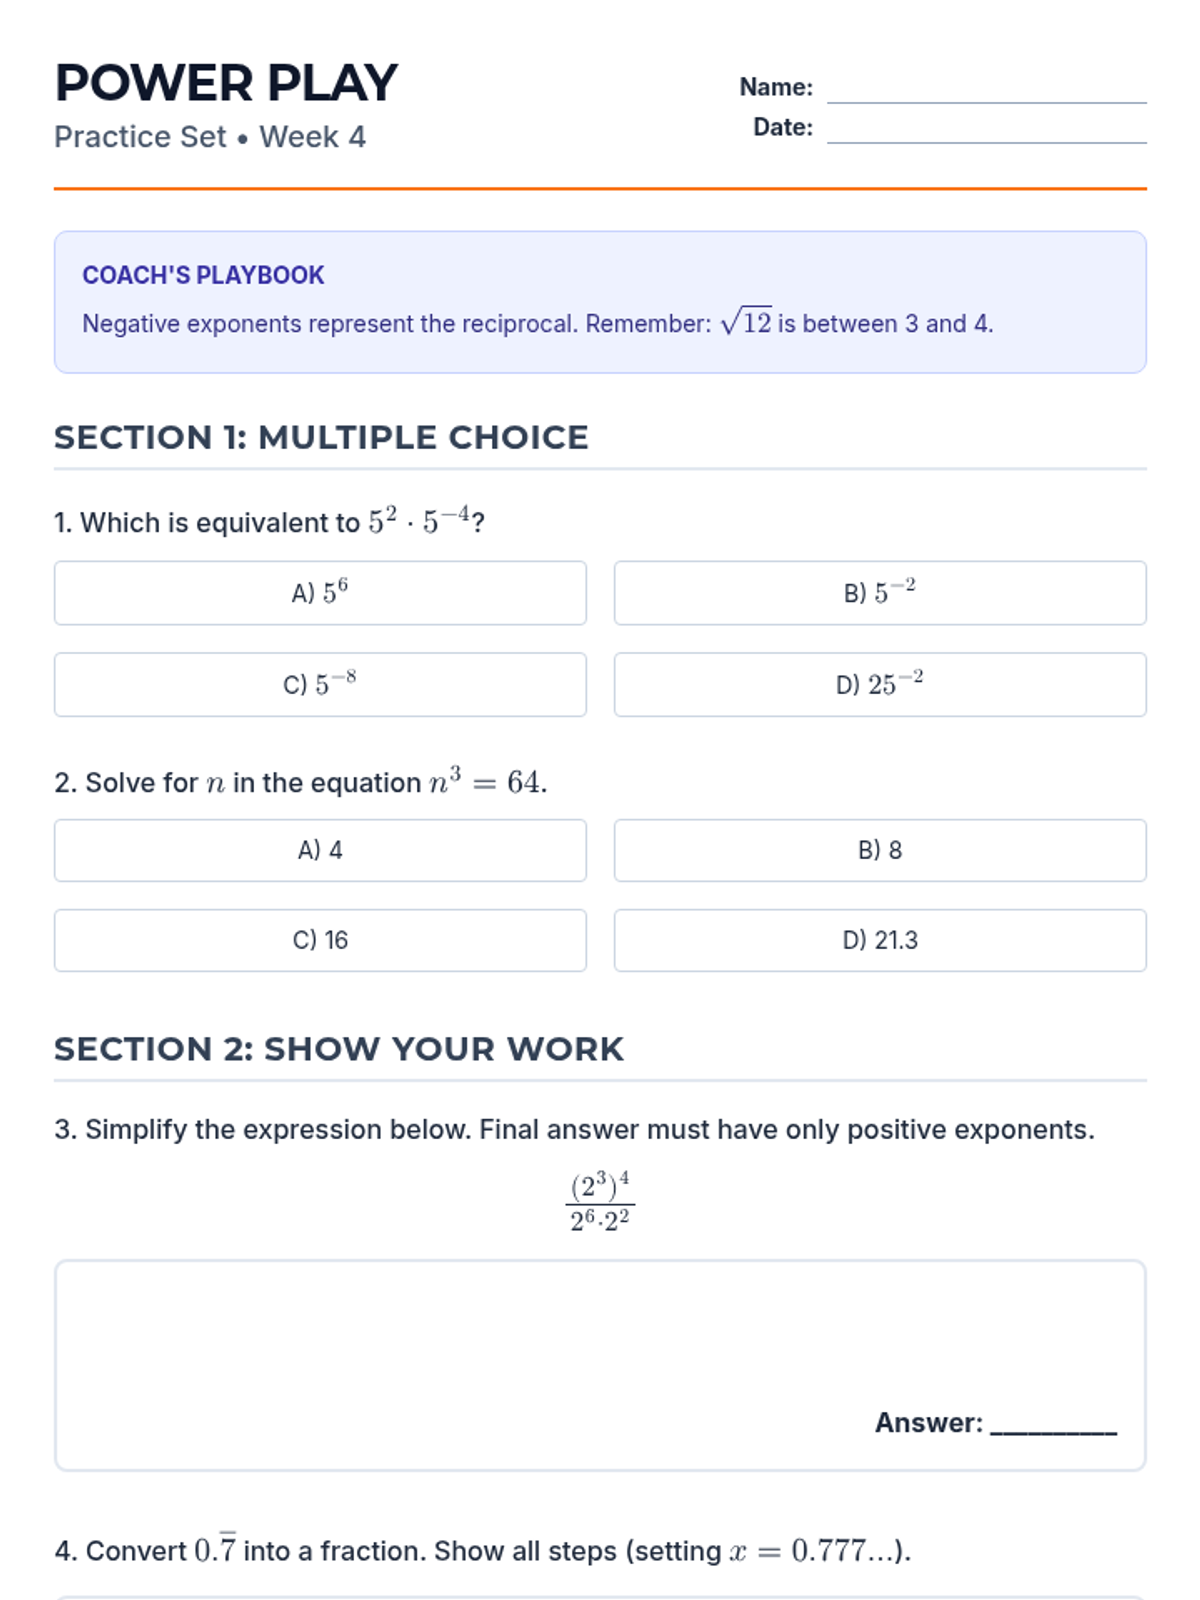
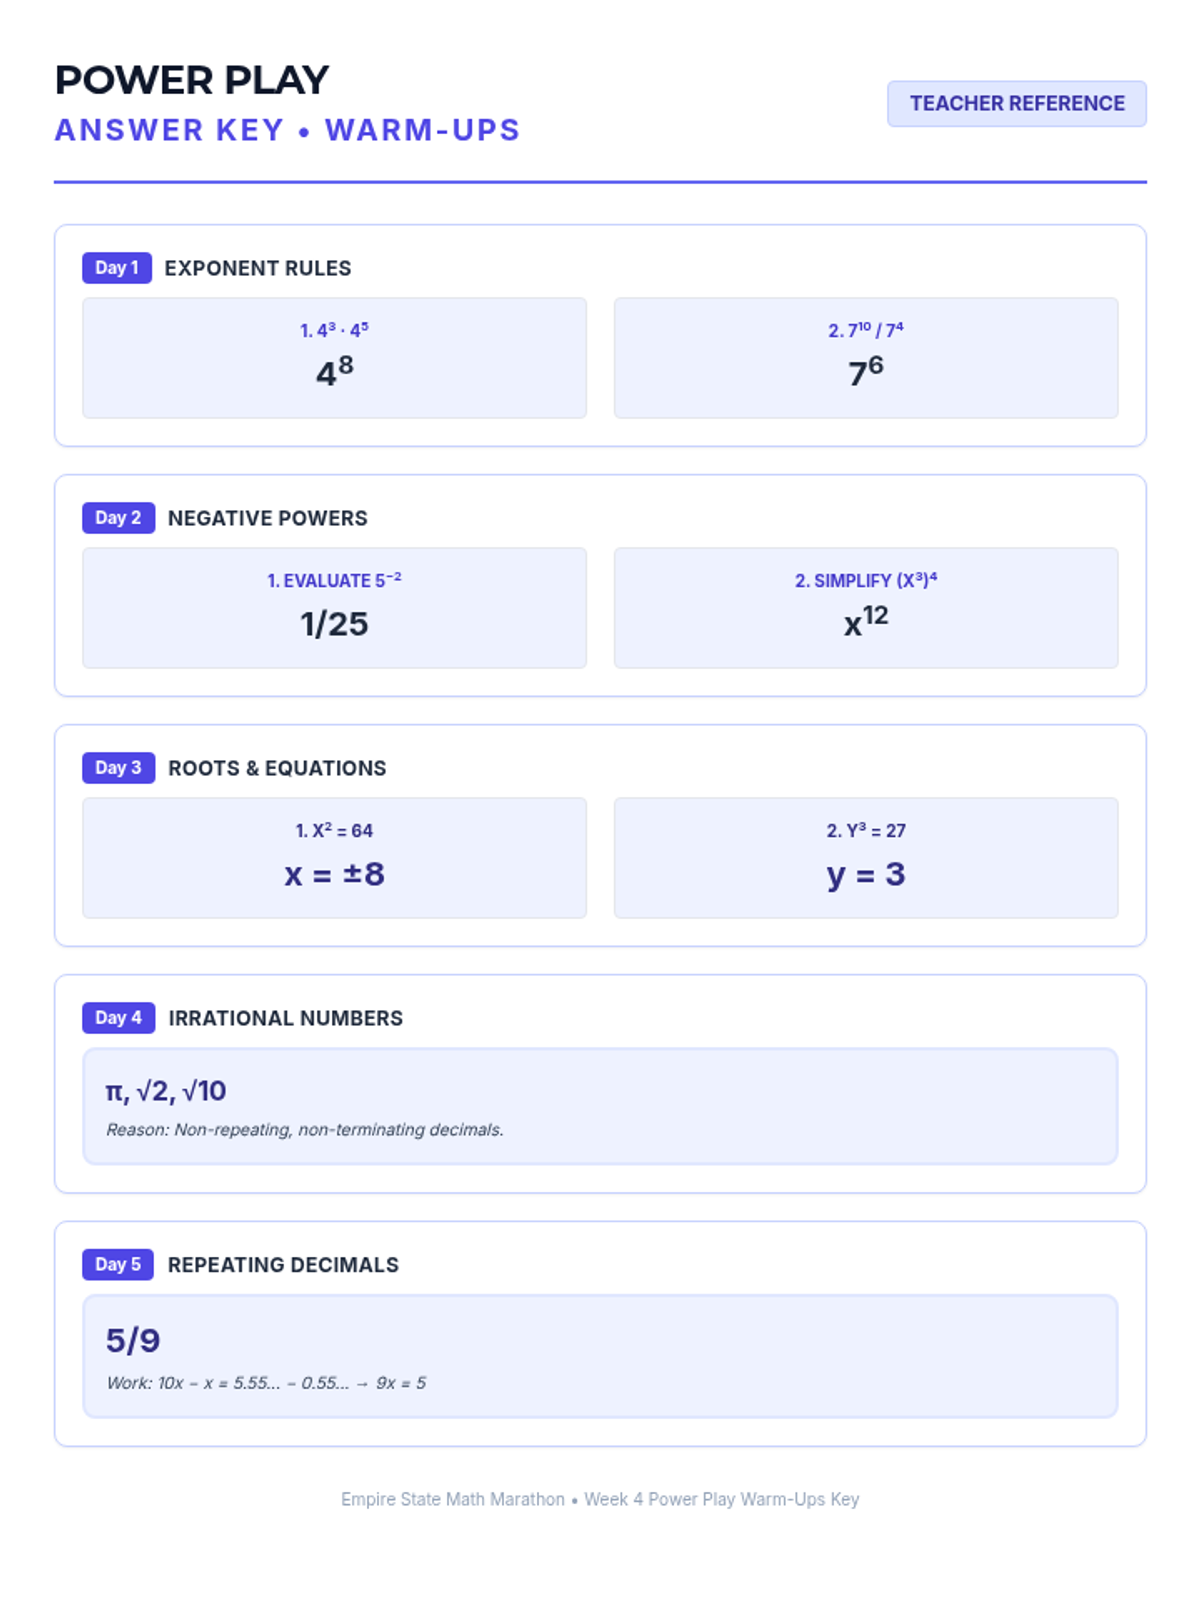
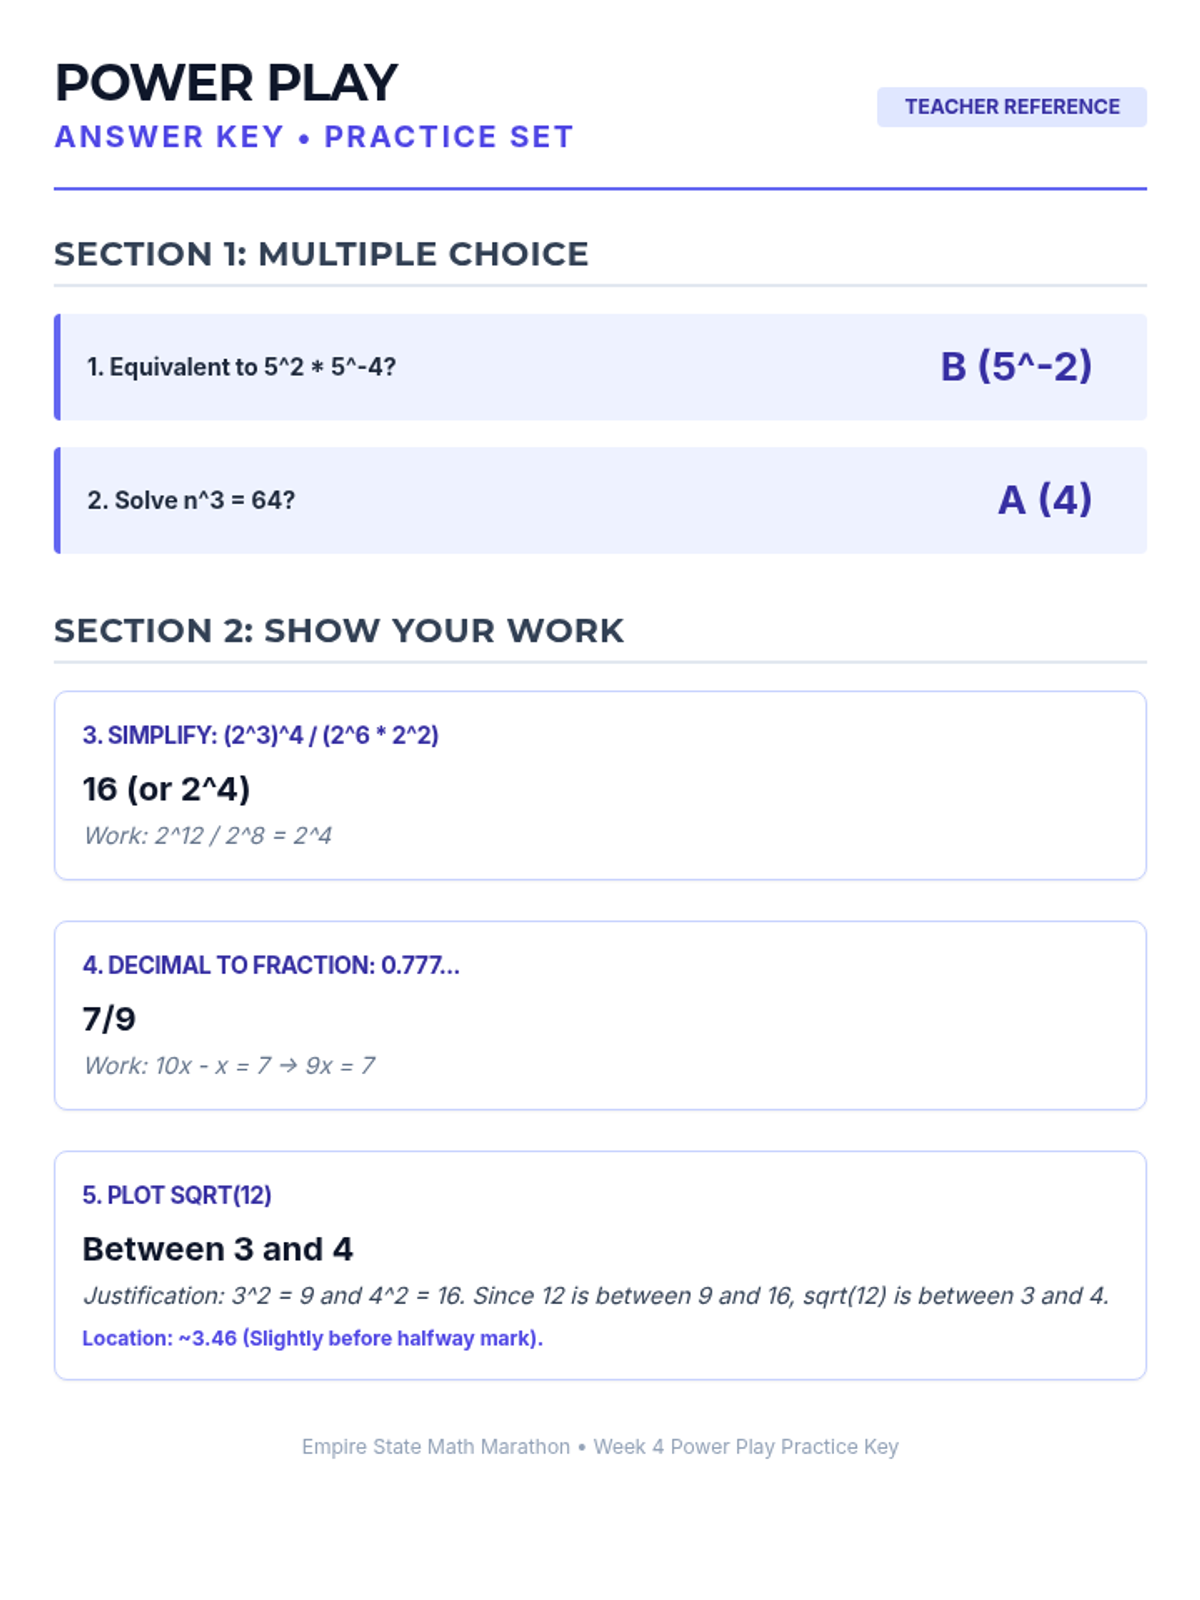
Week 4 explores integer exponent rules, perfect squares and cubes, and distinguishing between rational and irrational numbers.
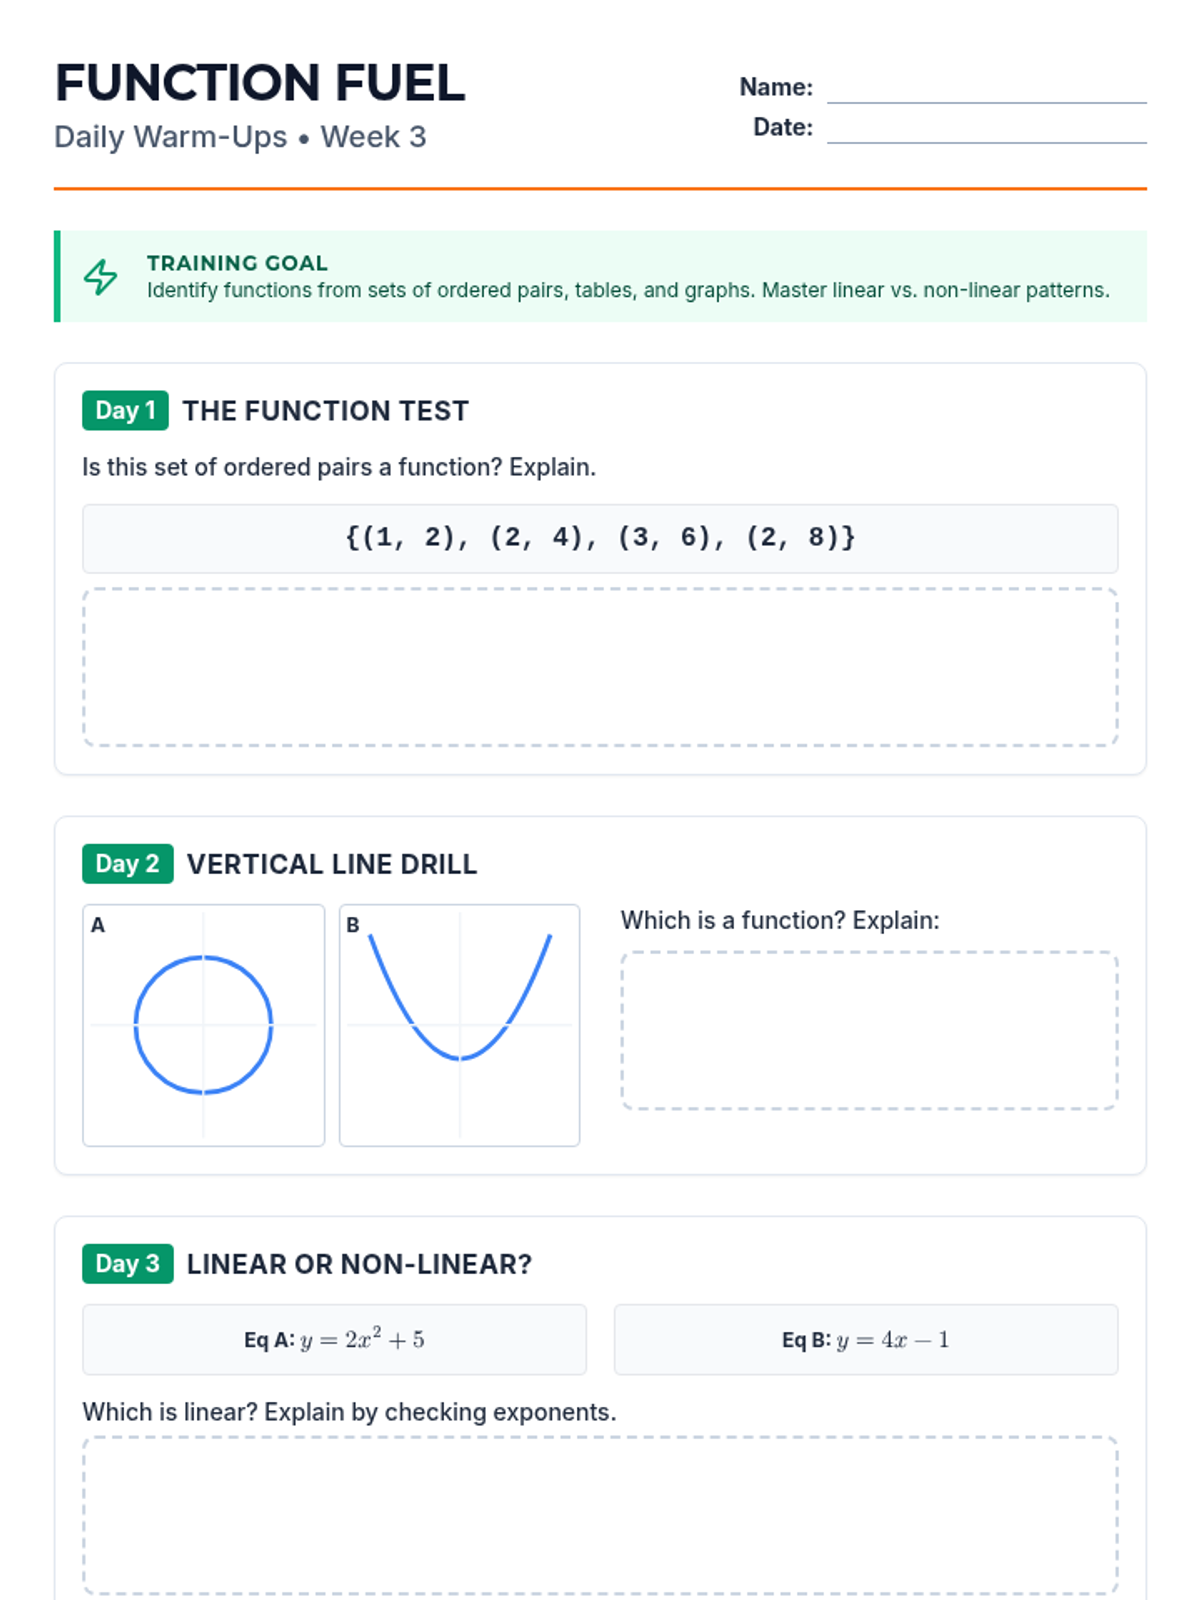
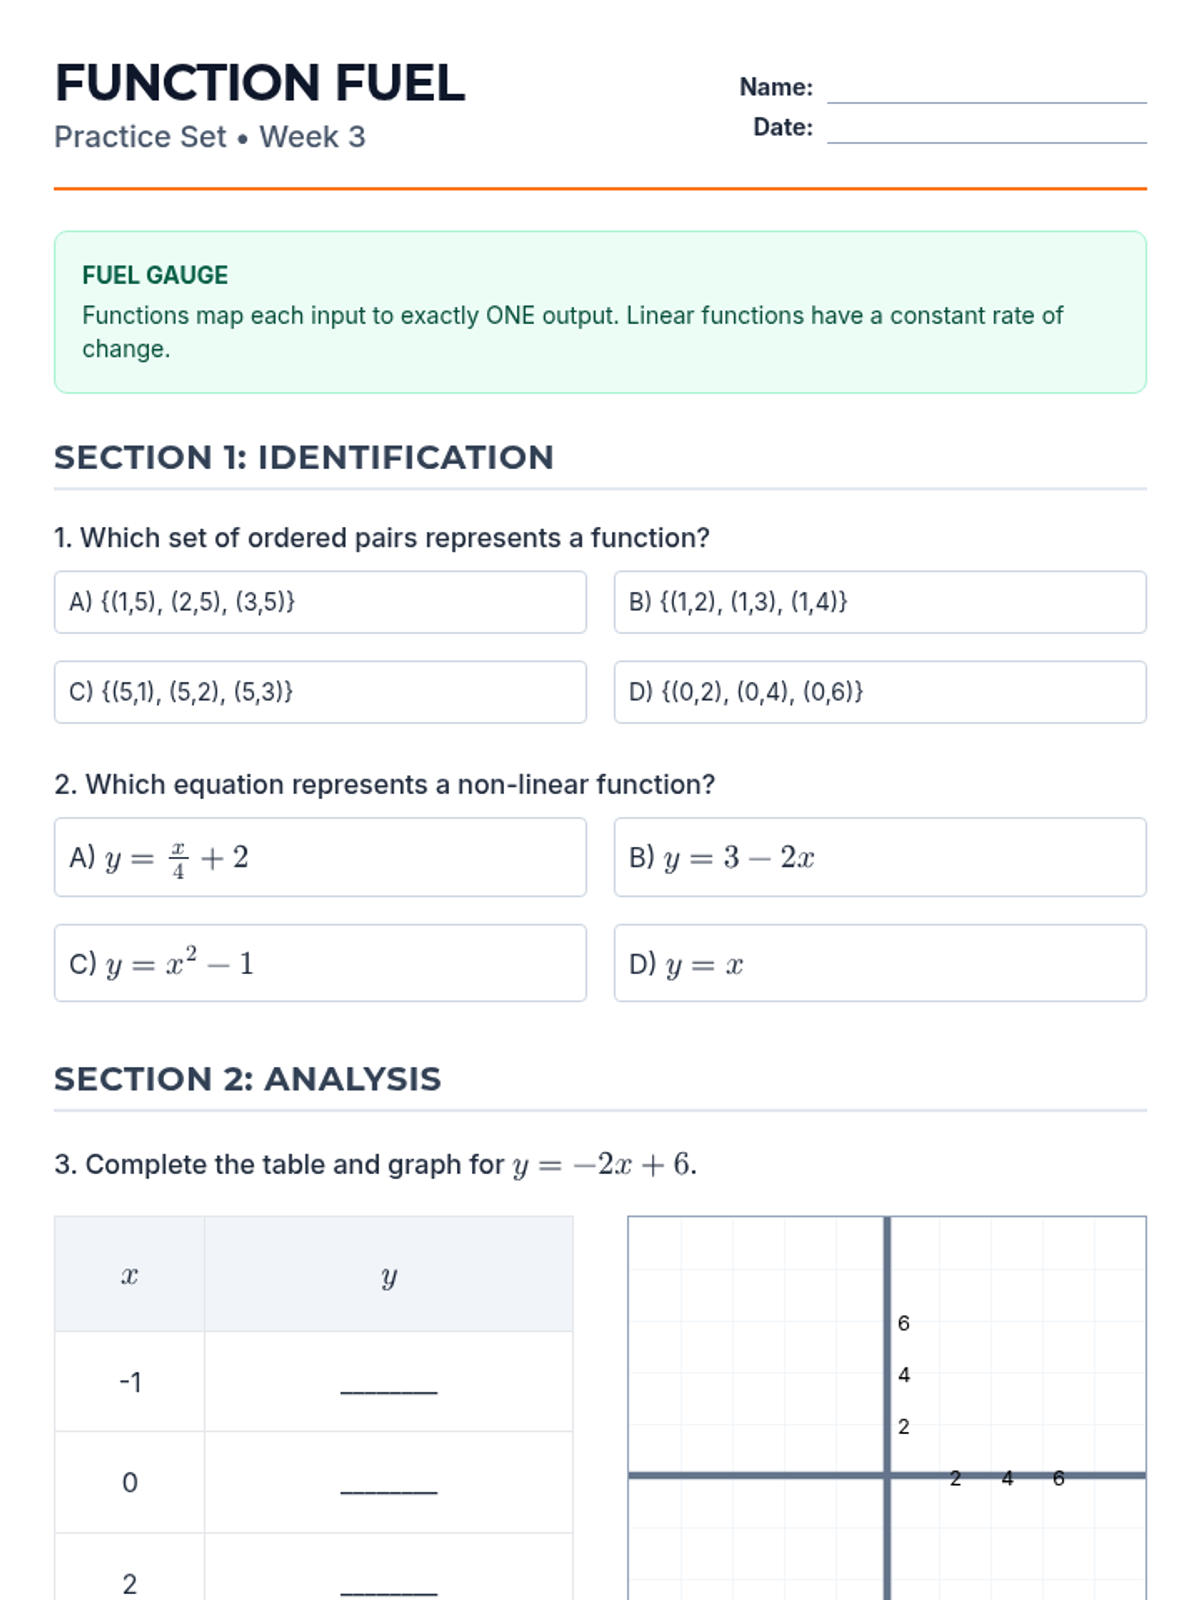
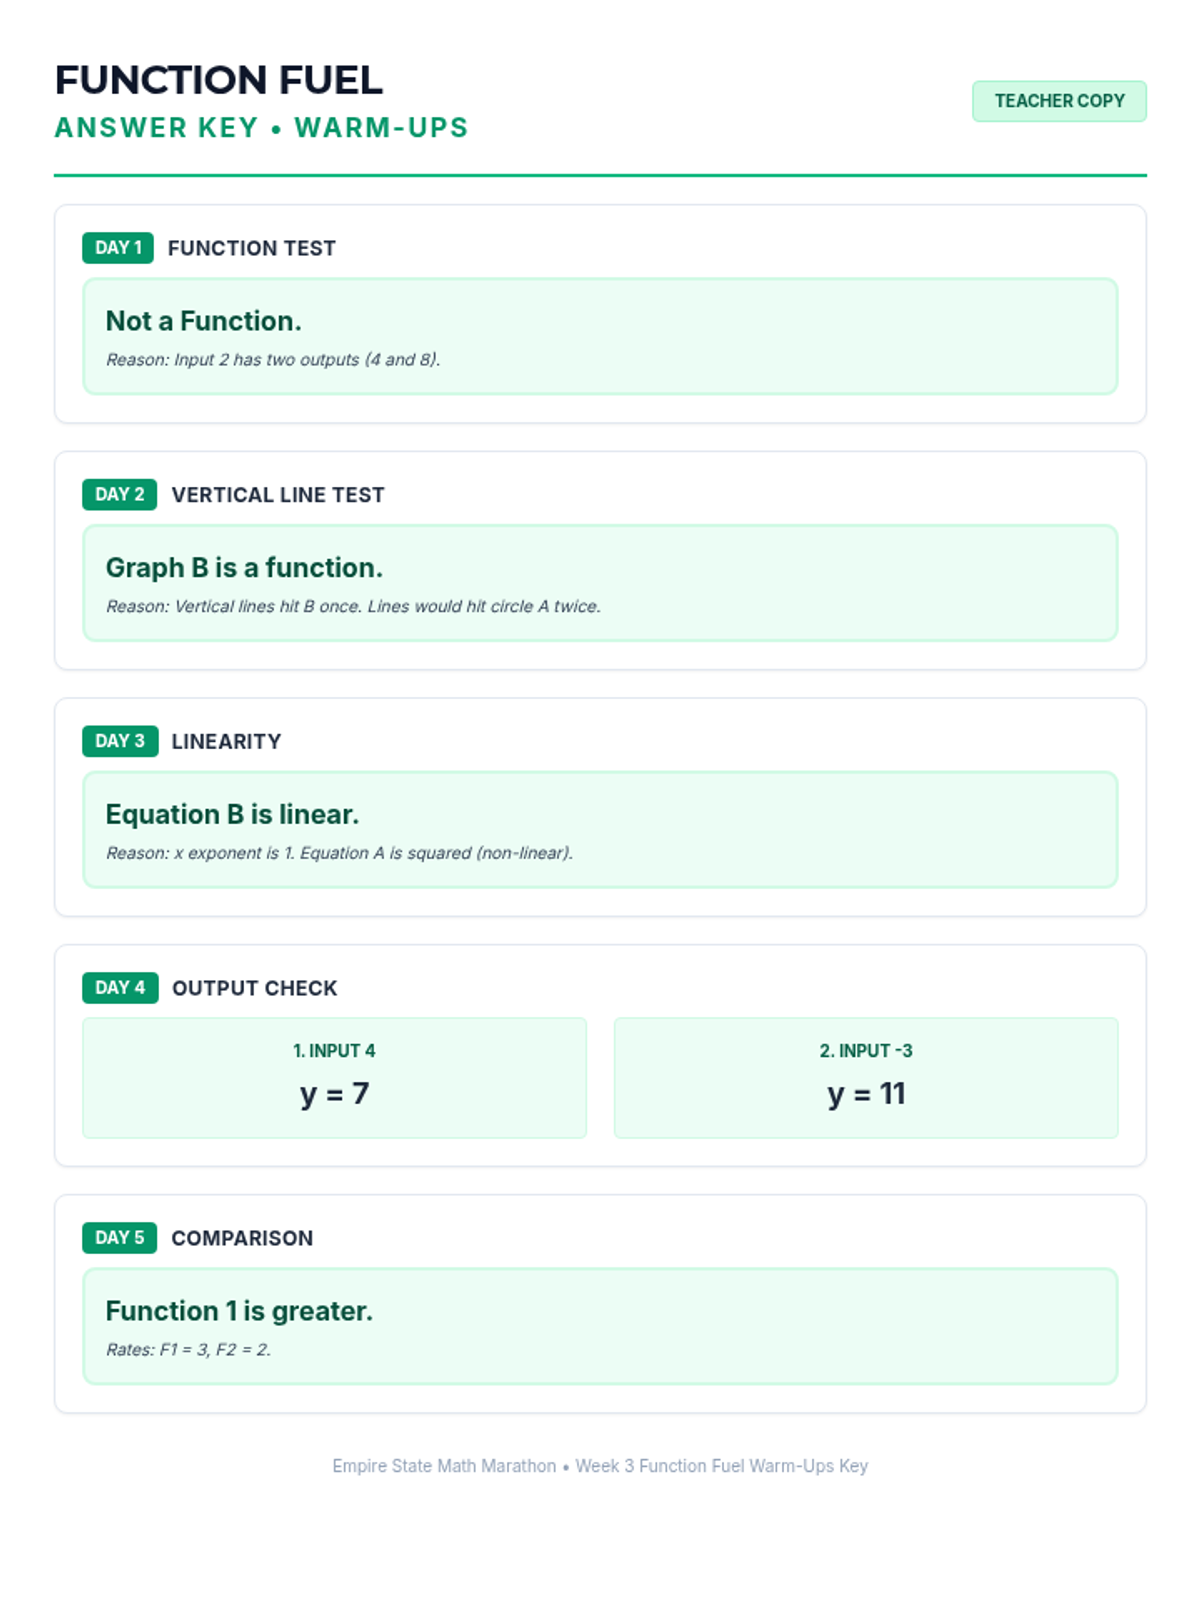
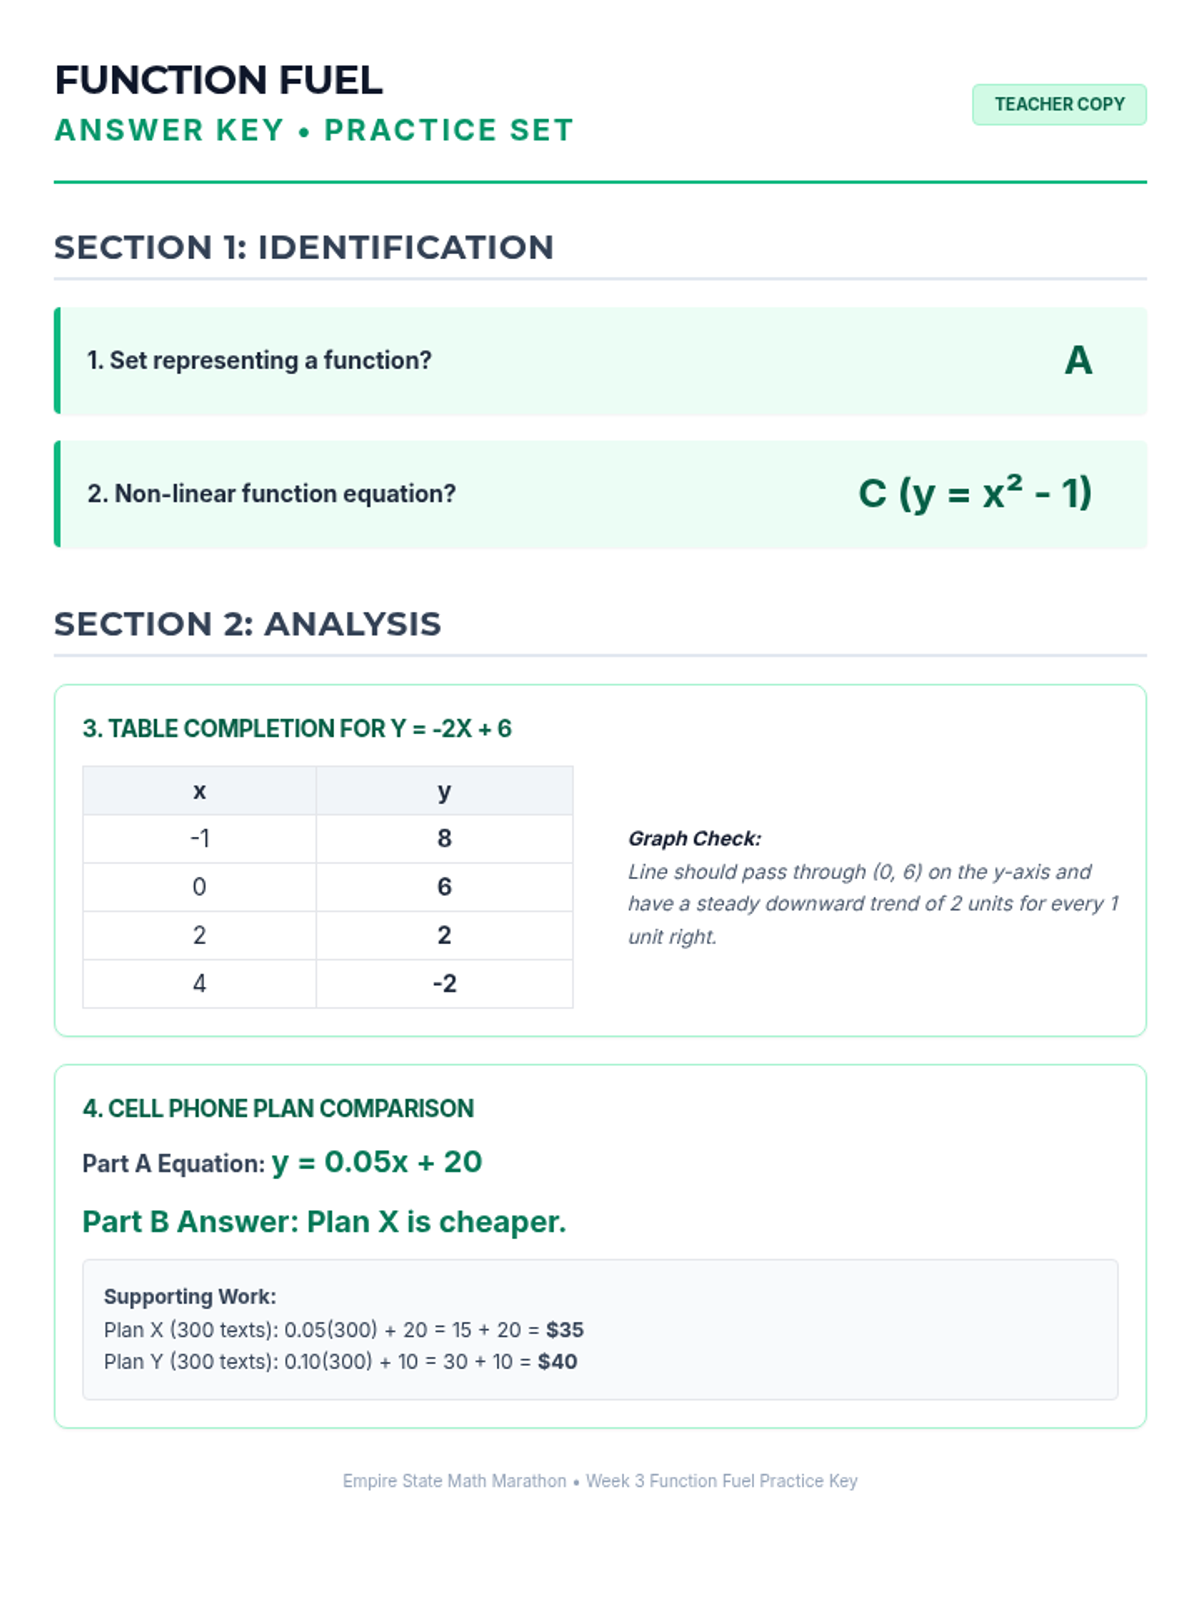
Week 3 defines, evaluates, and compares functions represented in different ways (tables, graphs, equations).
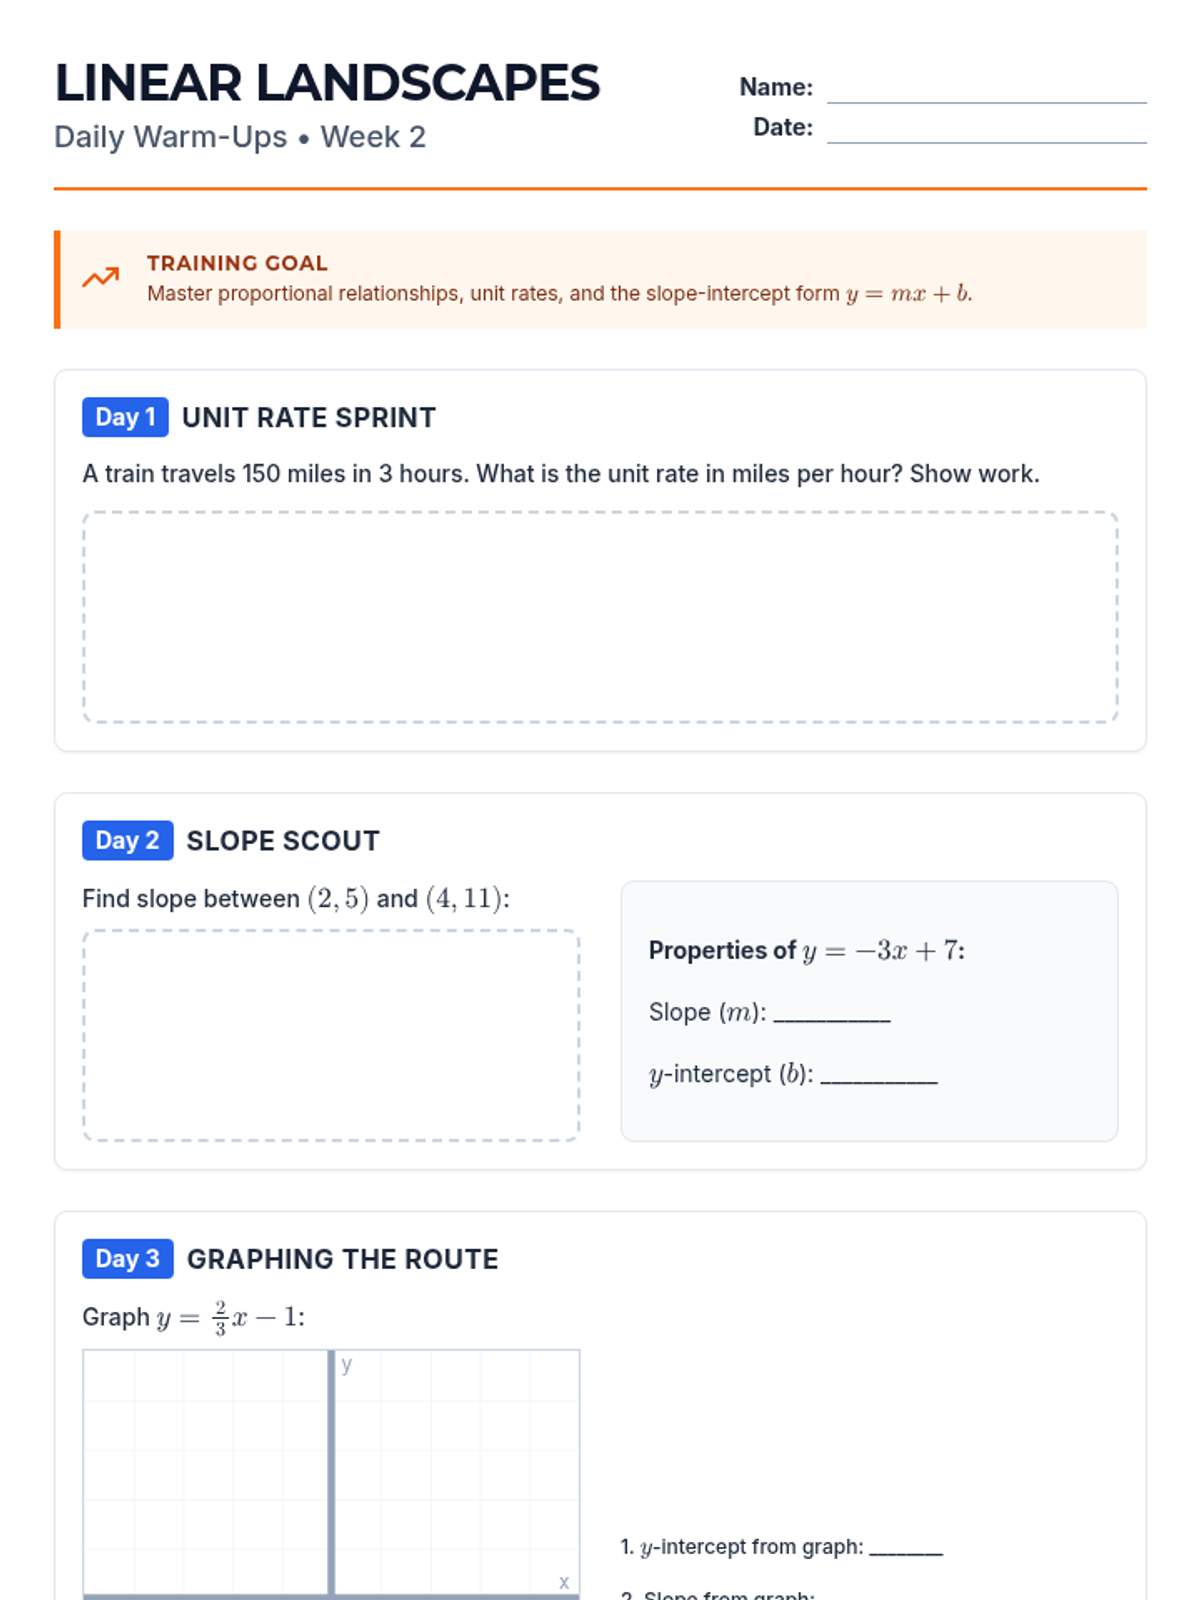
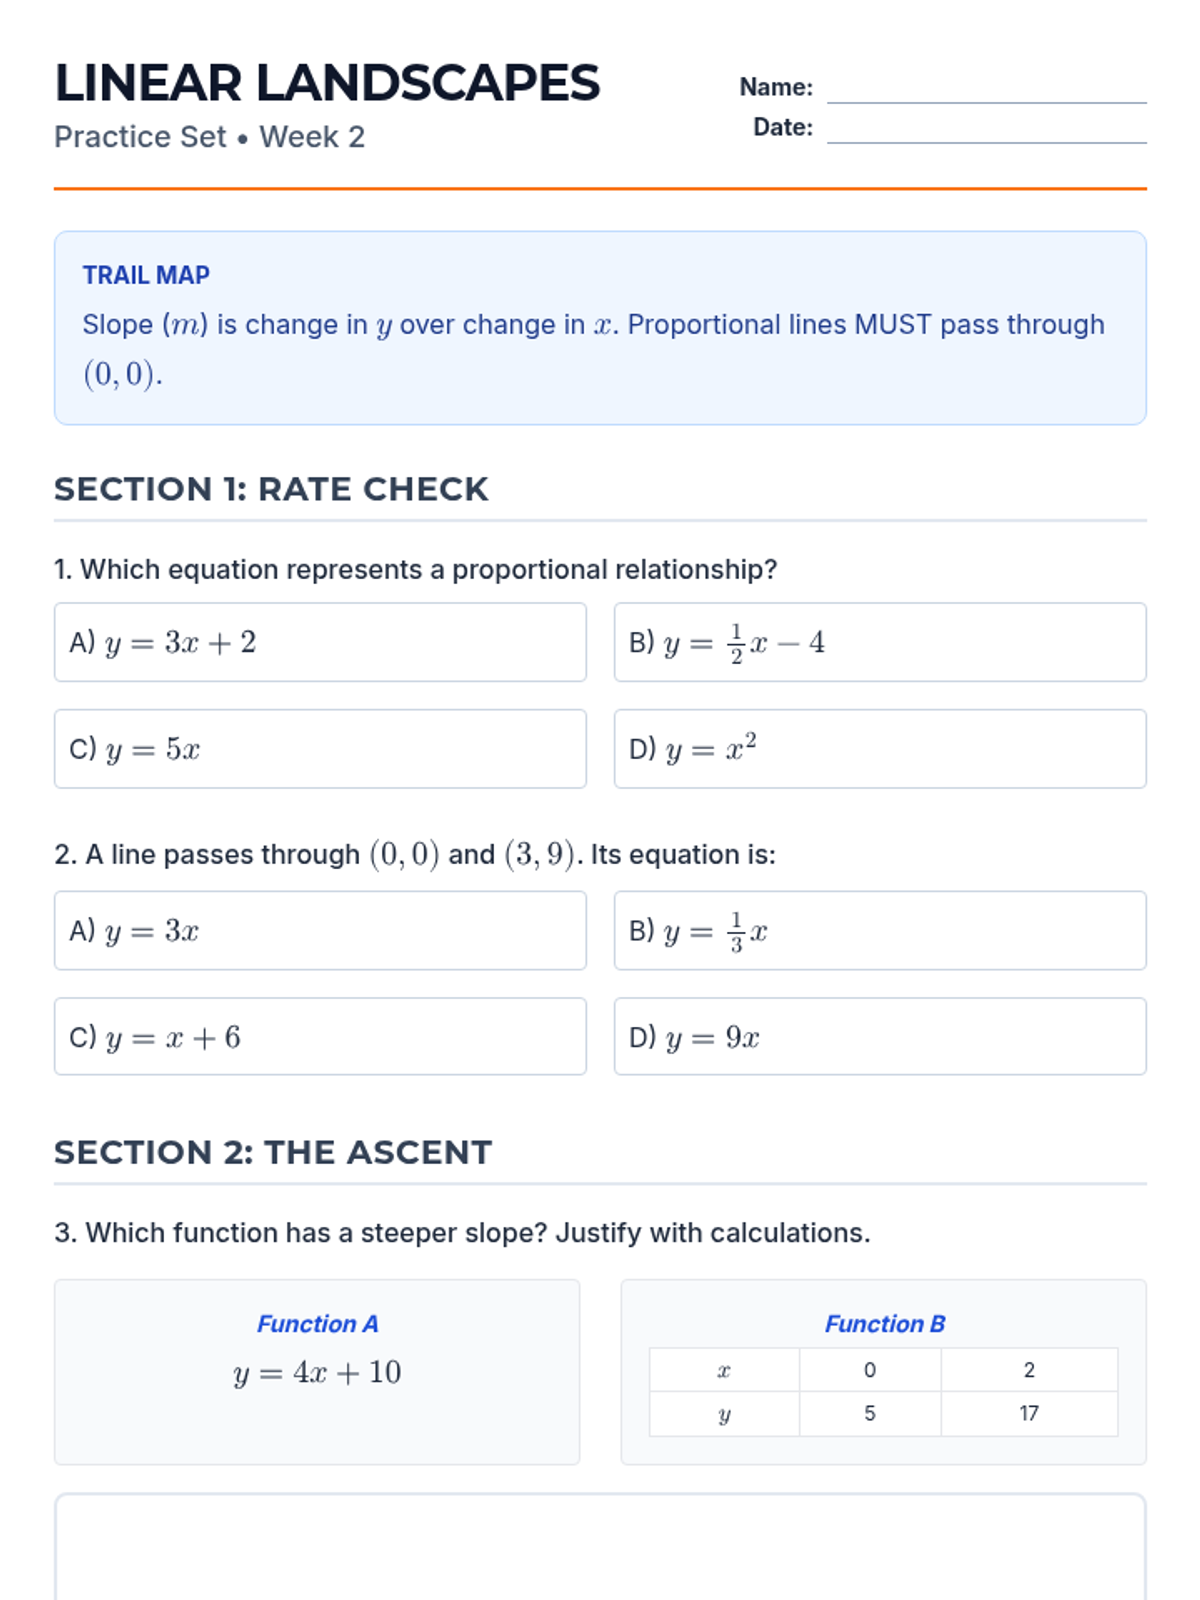
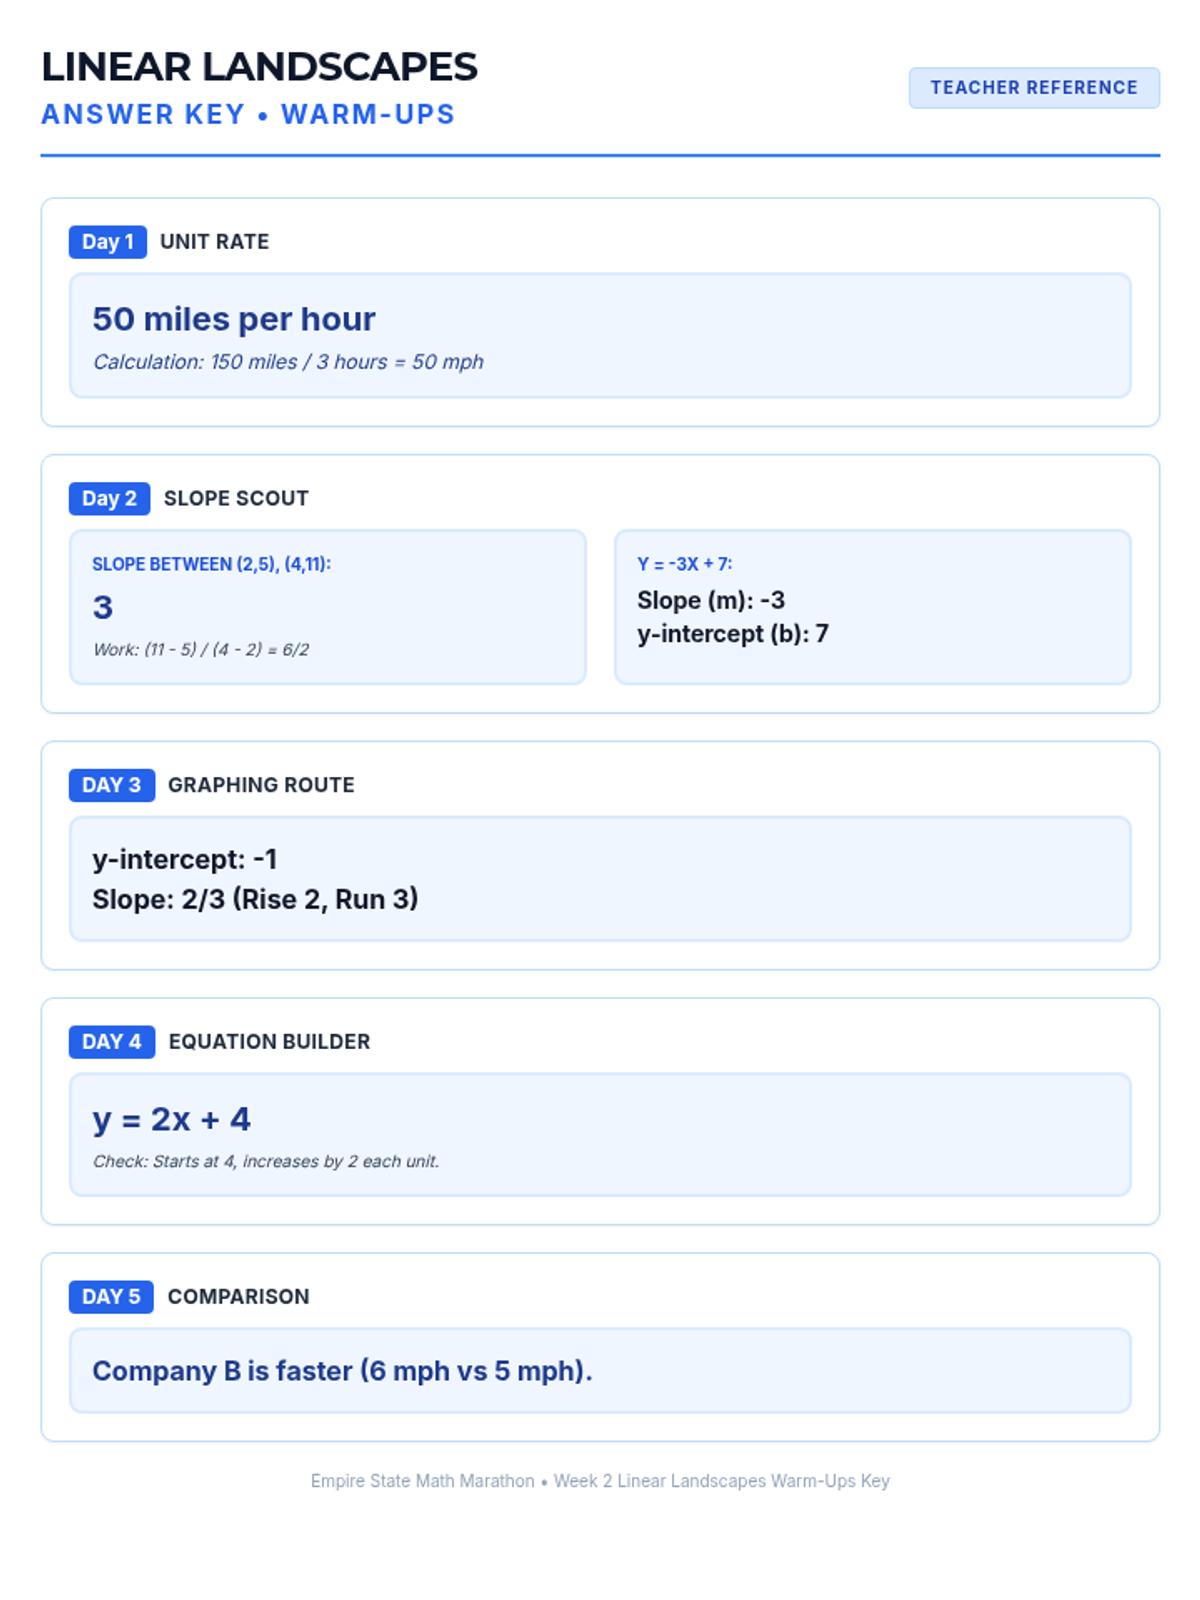
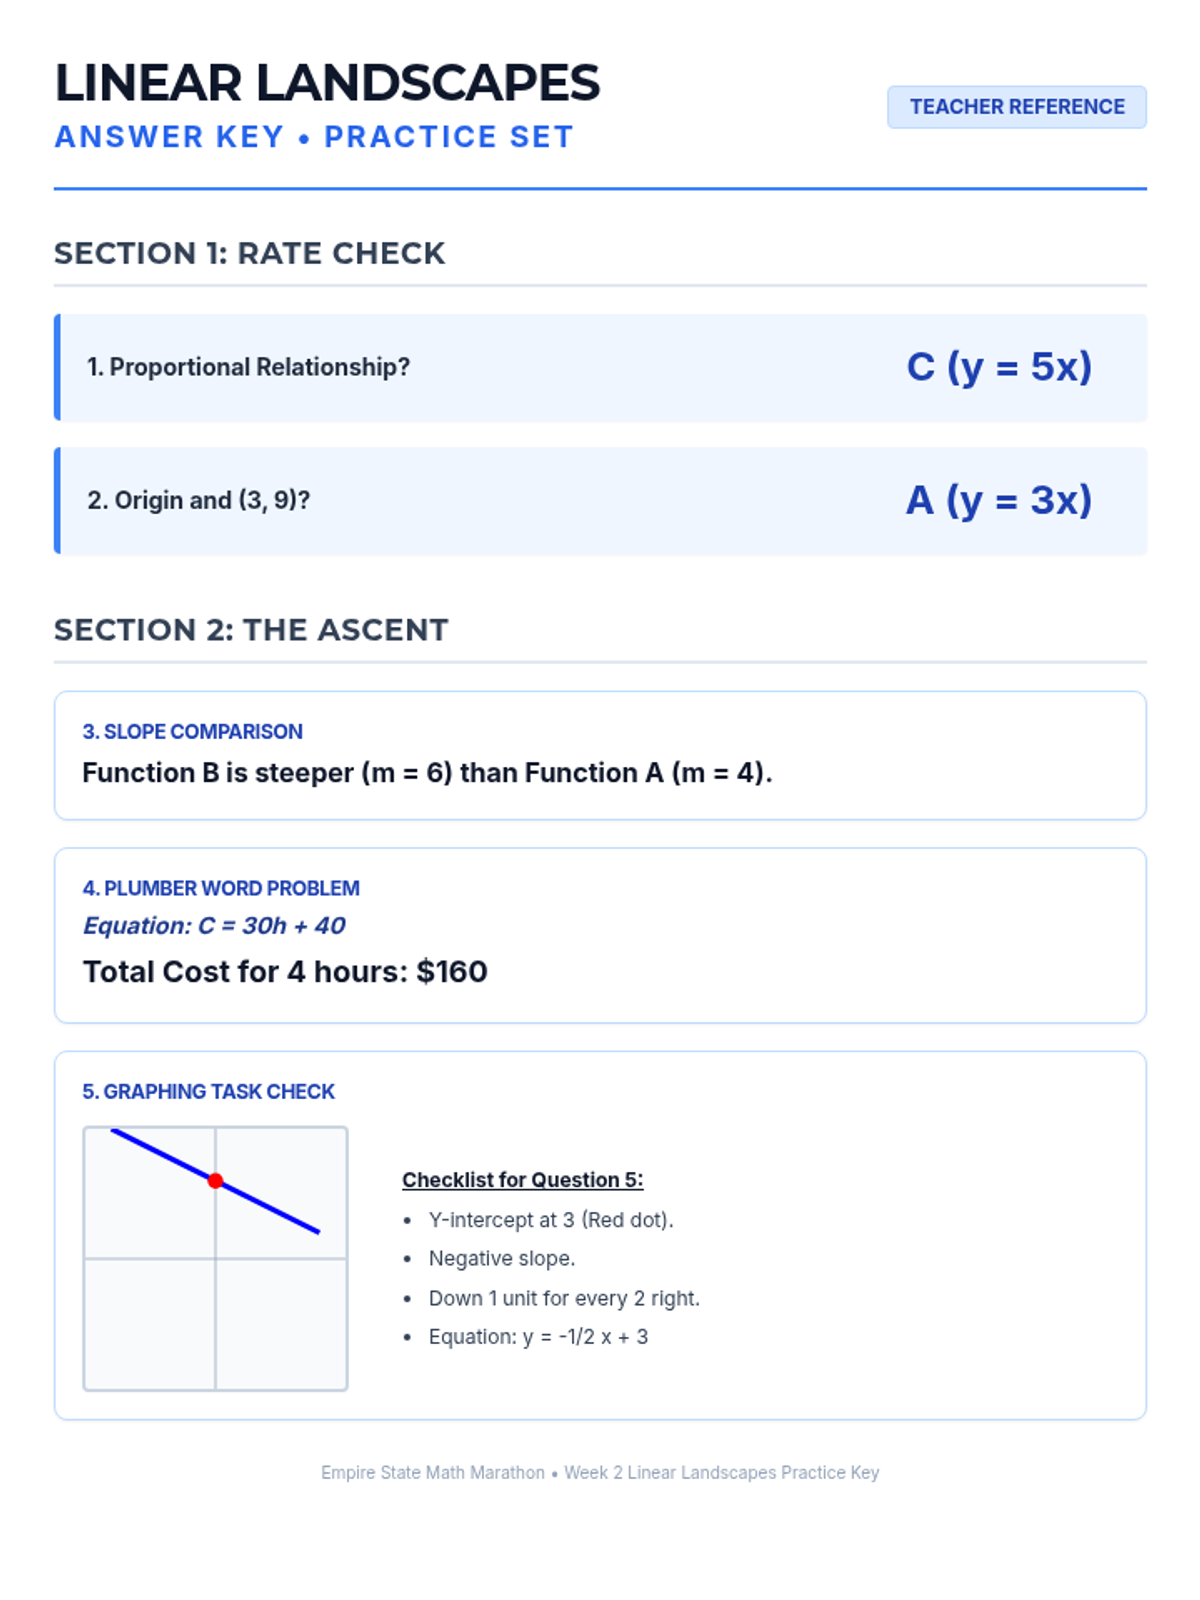
Week 2 covers proportional relationships, unit rates, and the slope-intercept form of linear equations.
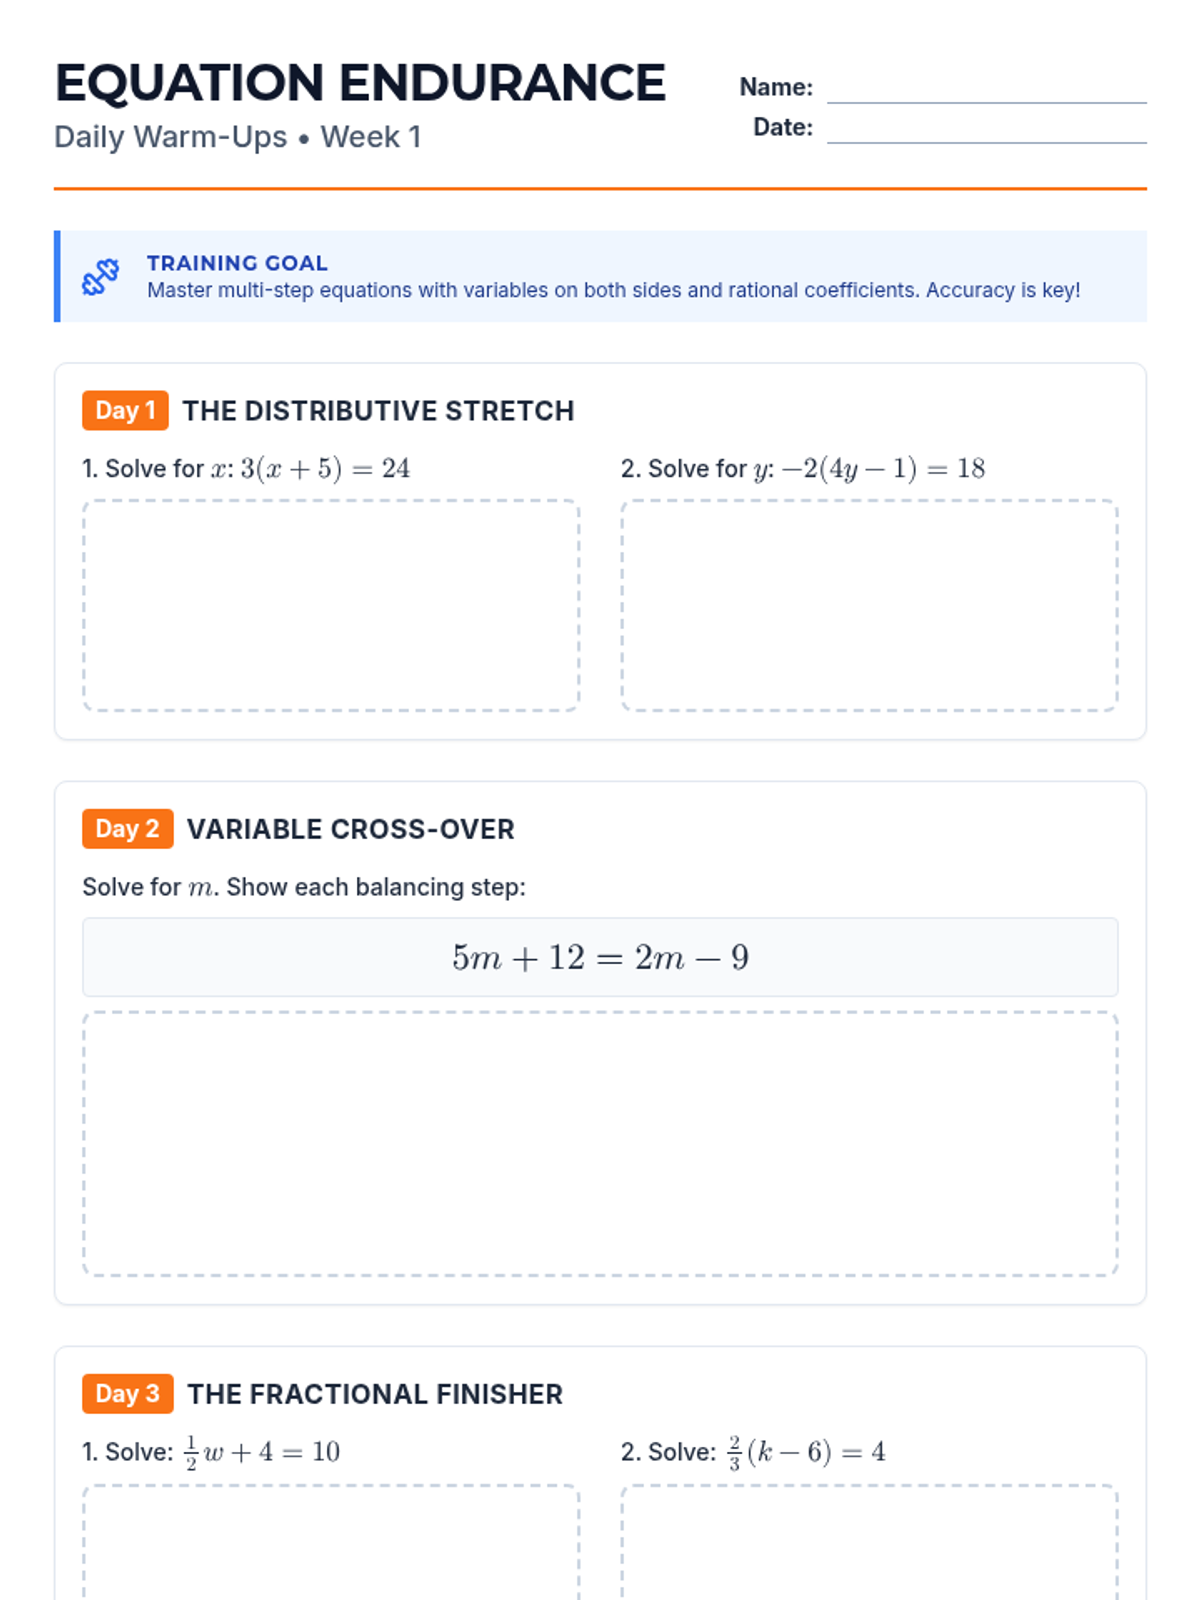
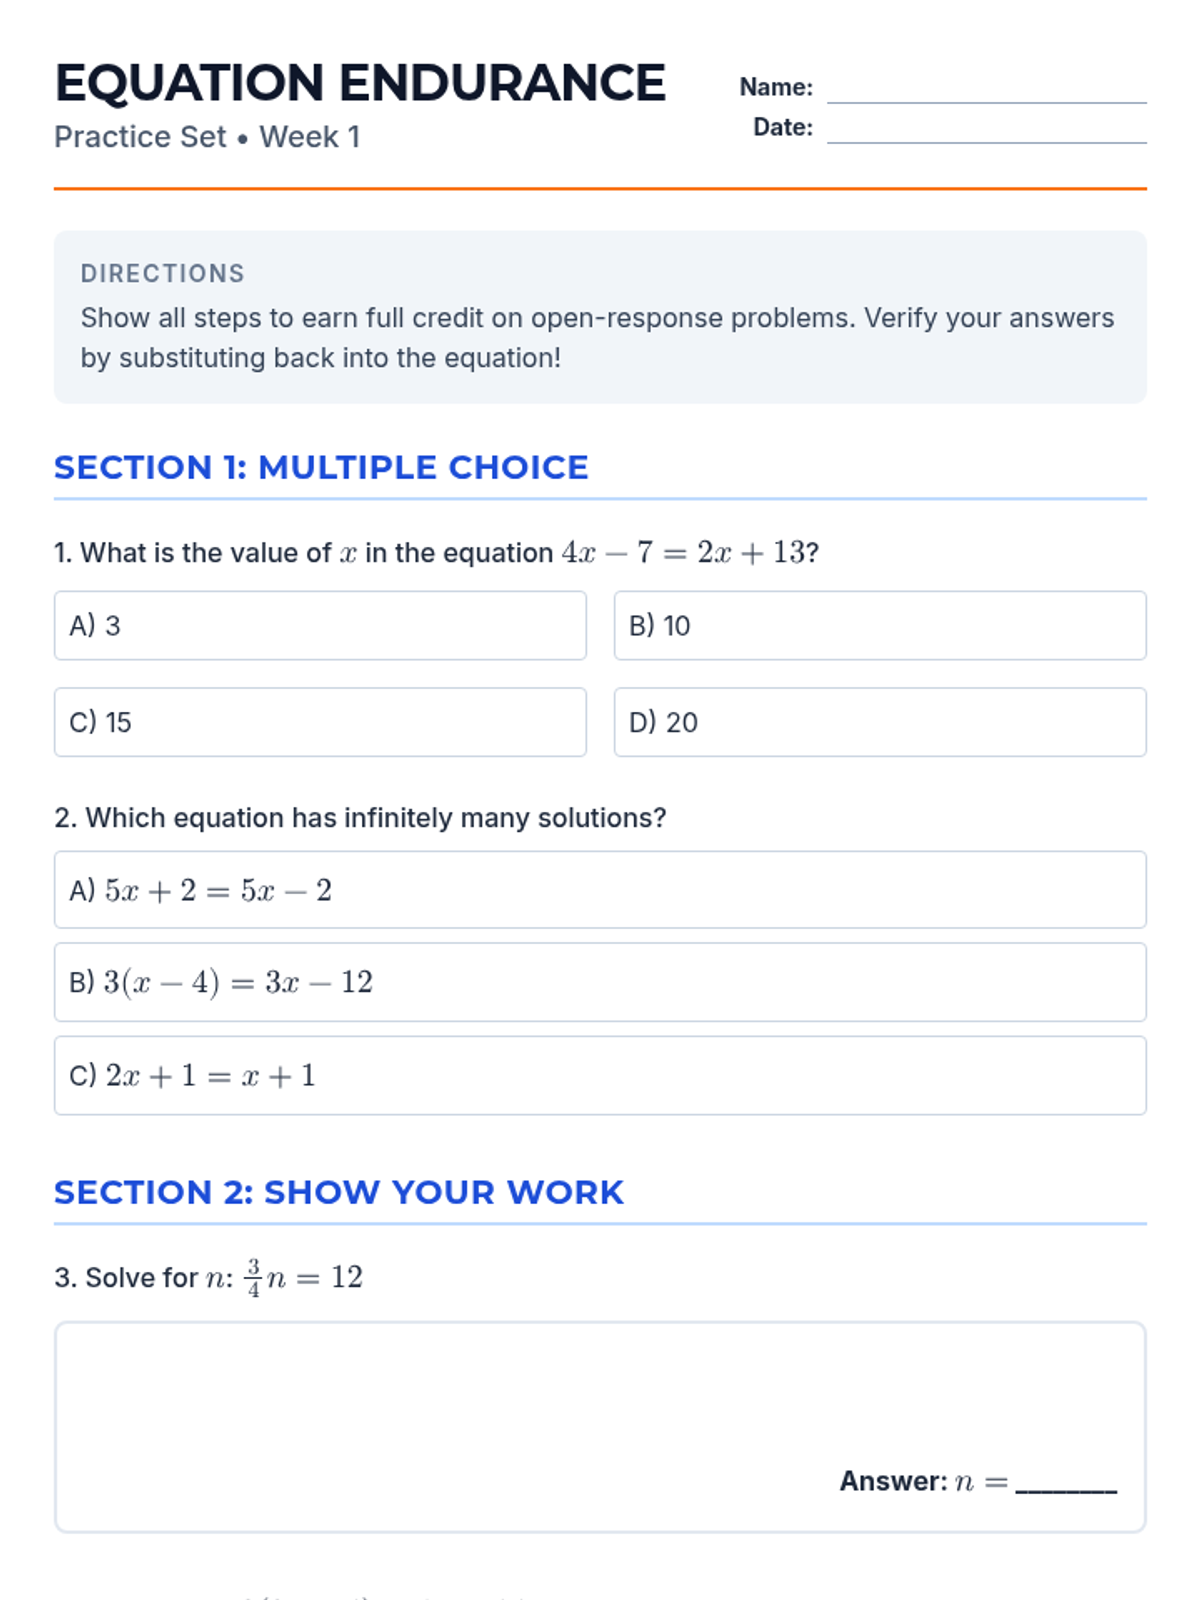
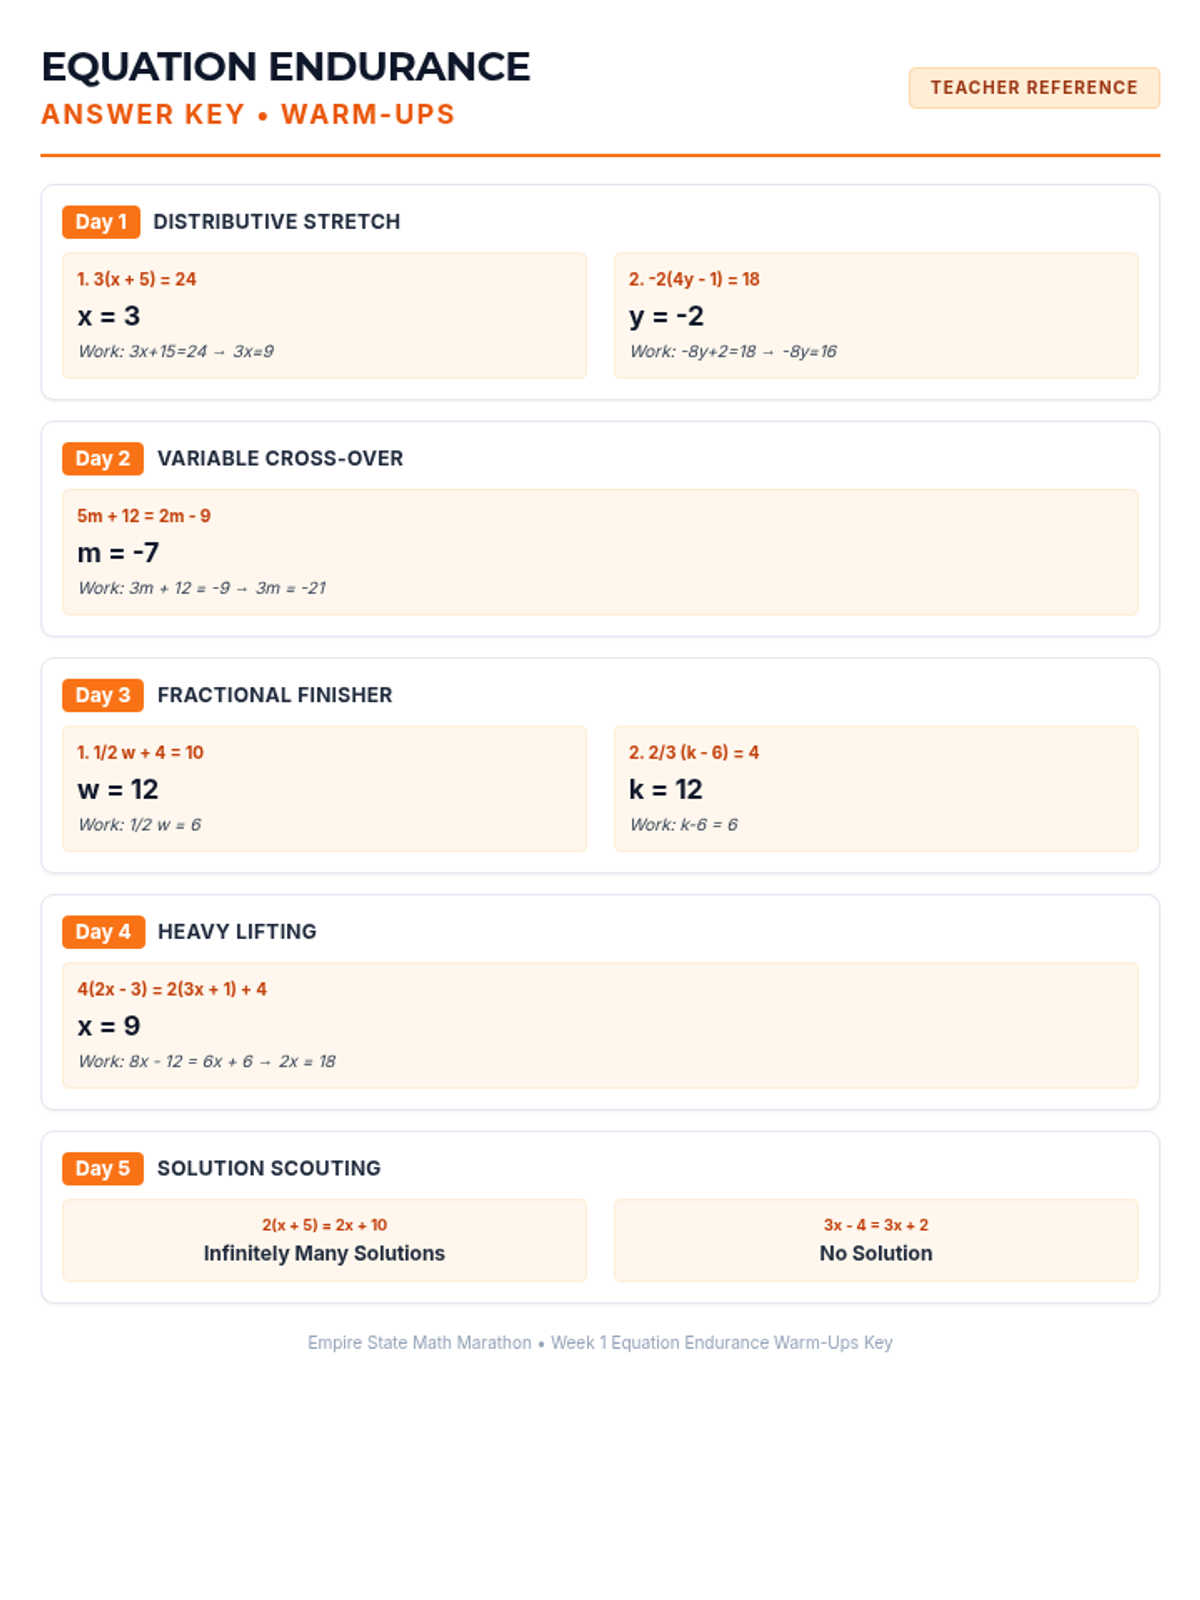
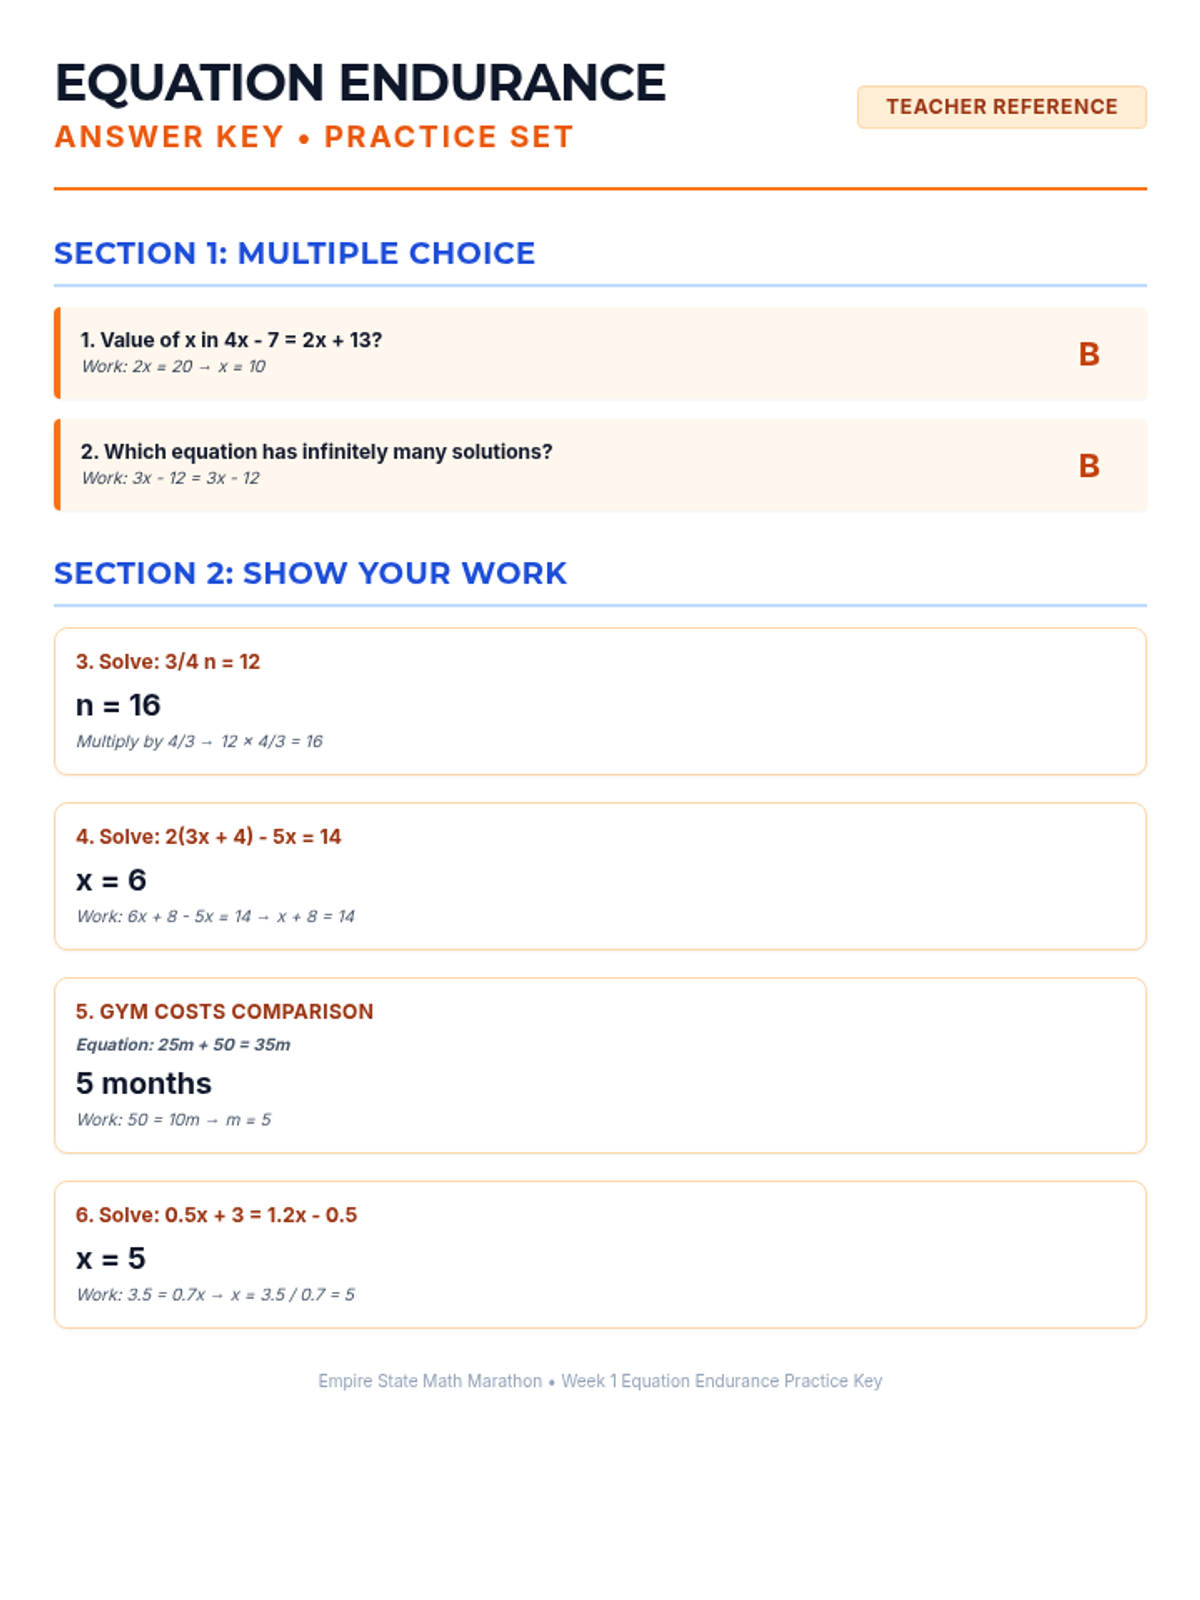
Week 1 focuses on solving multi-step equations, including those with variables on both sides, rational coefficients, and checking solutions.
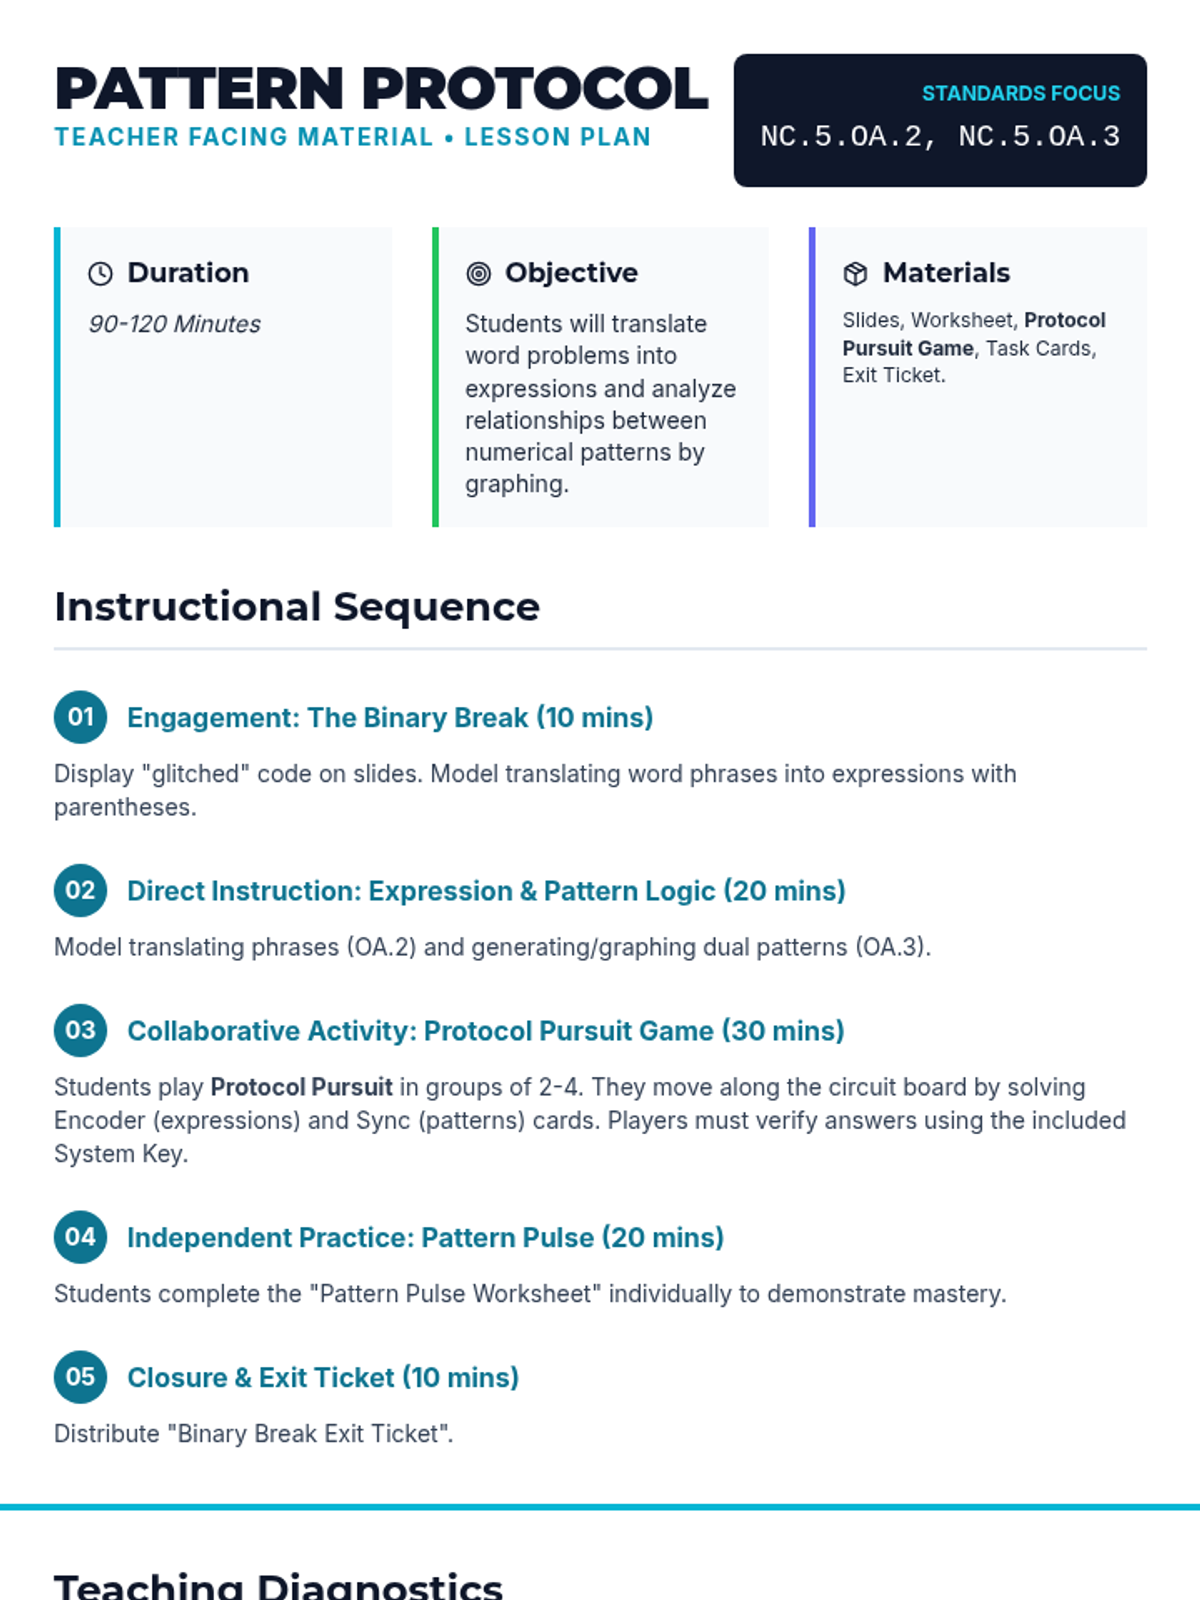
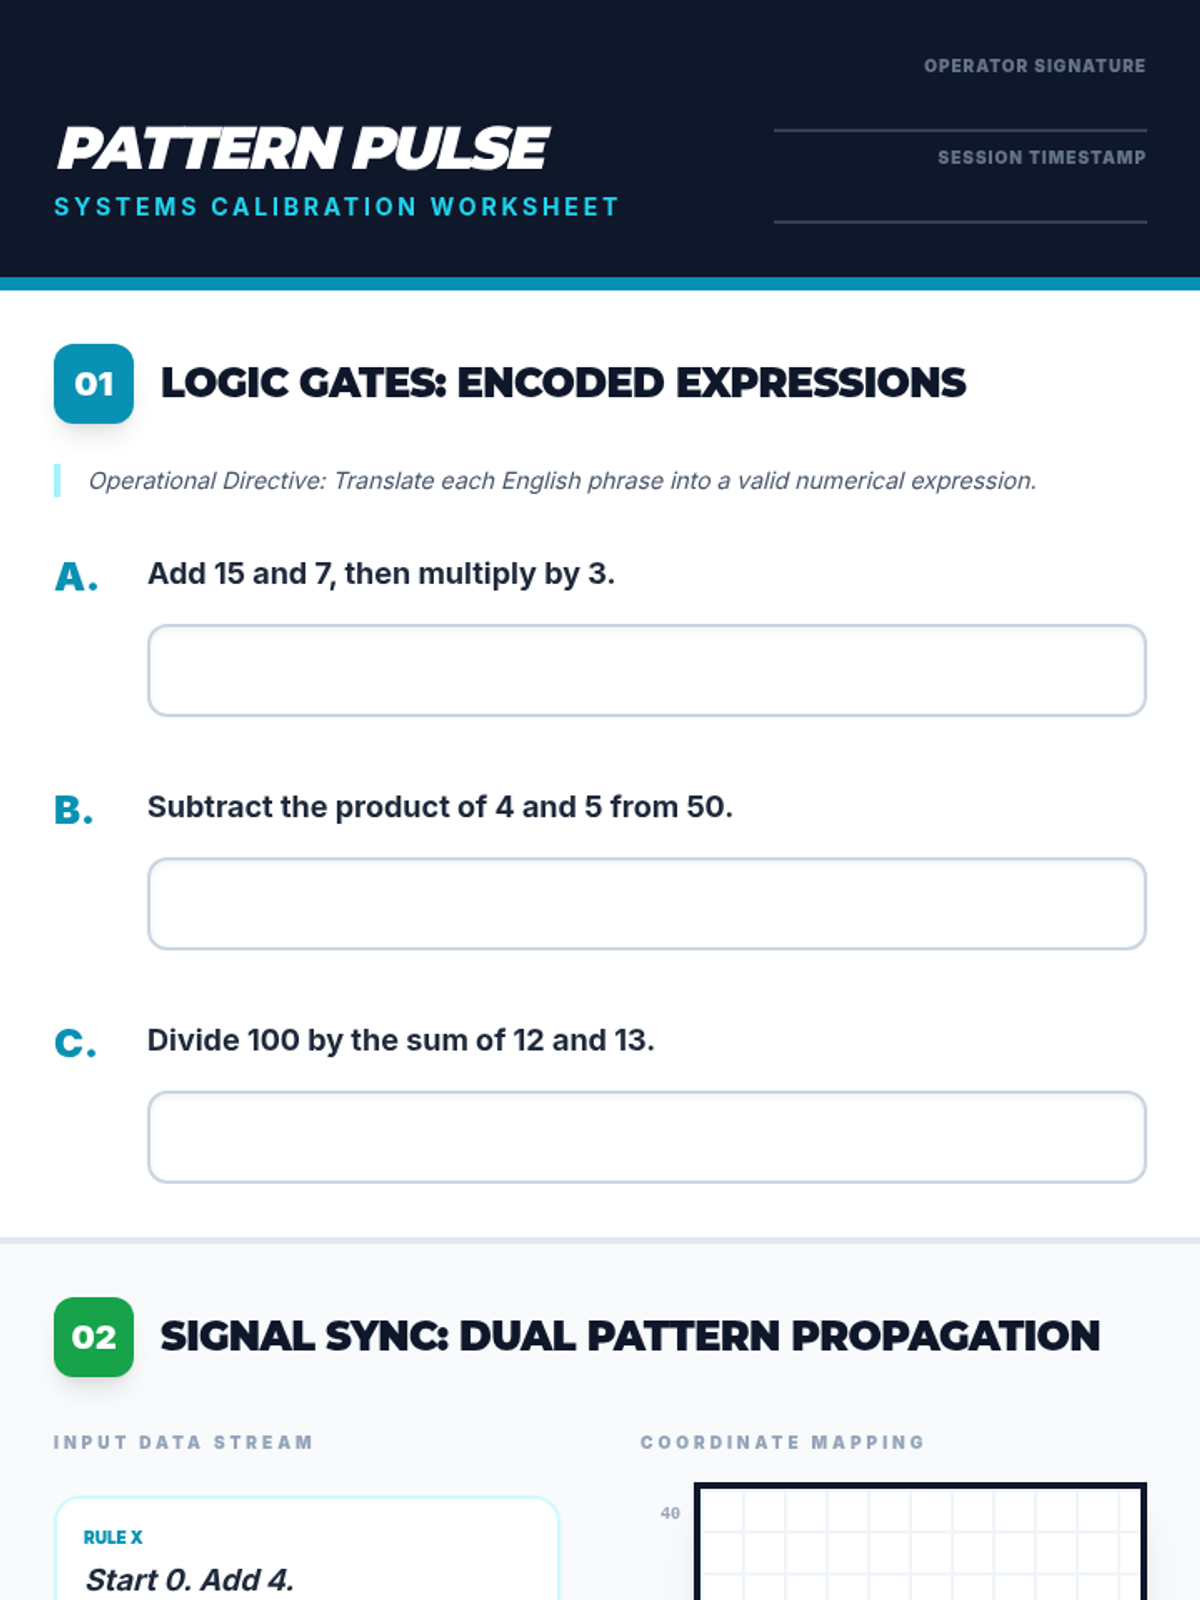
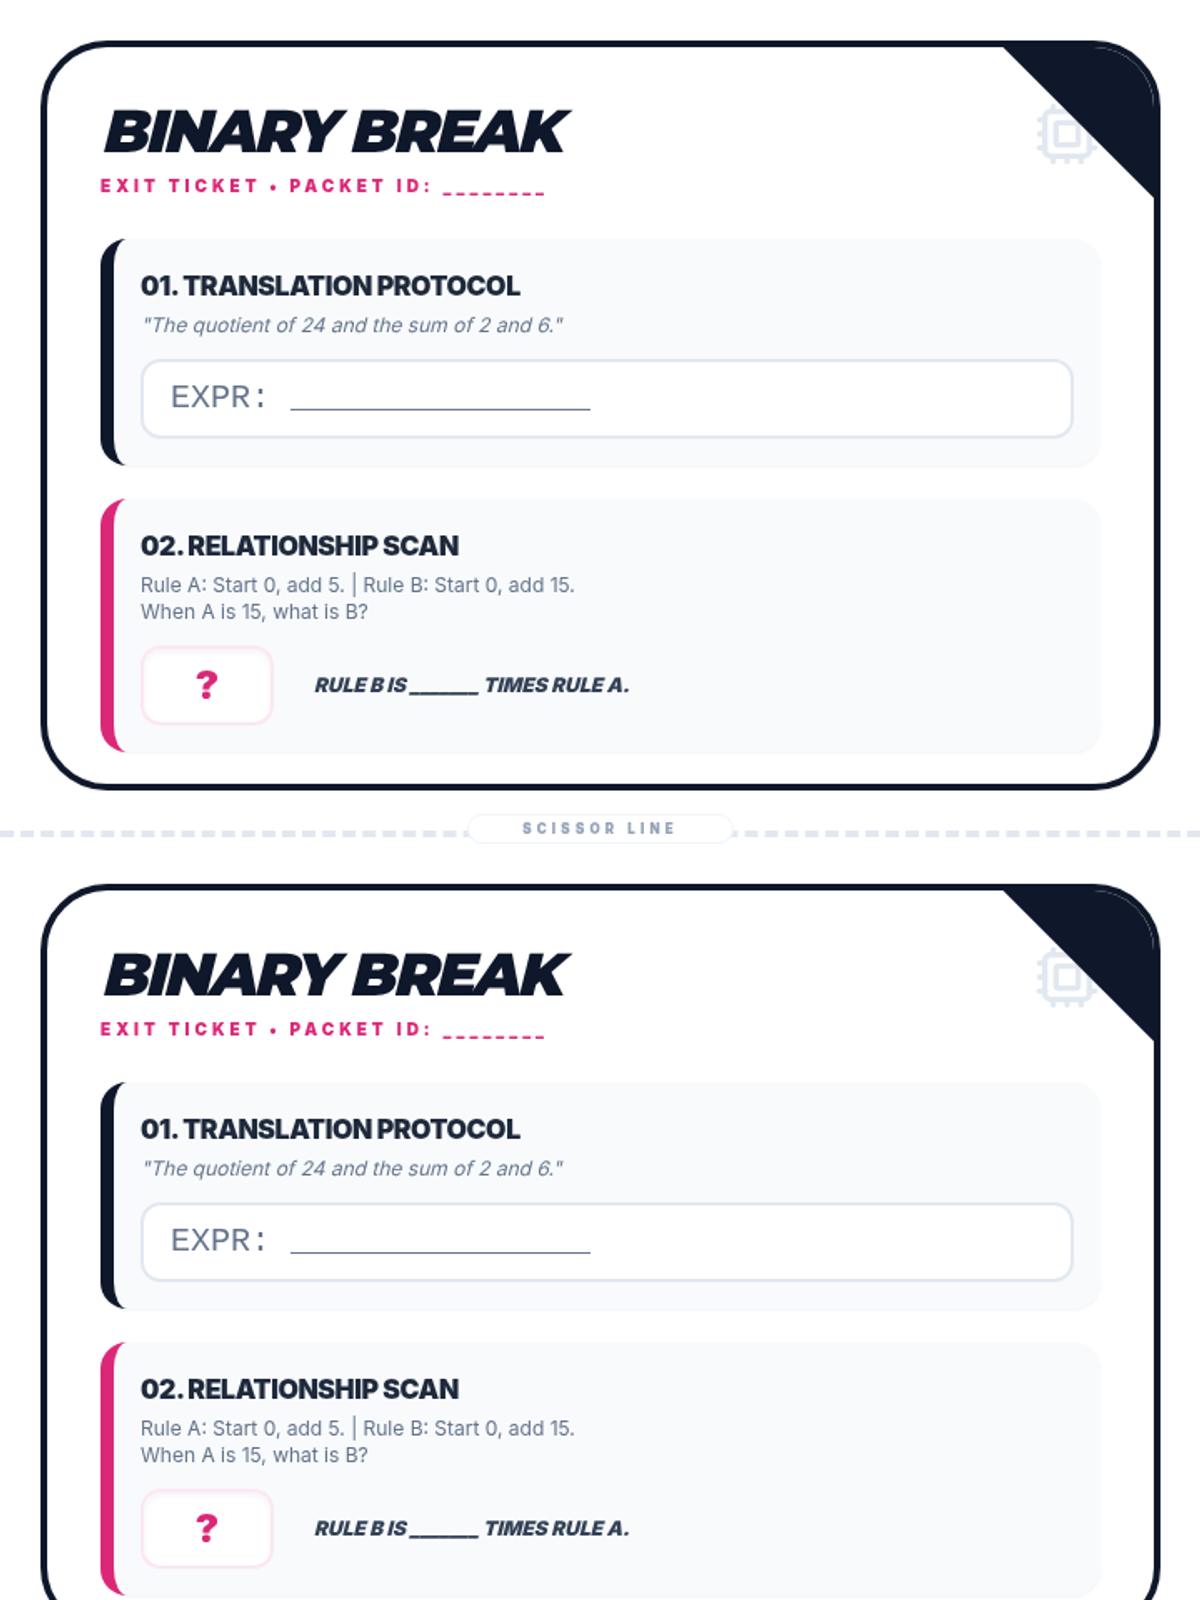
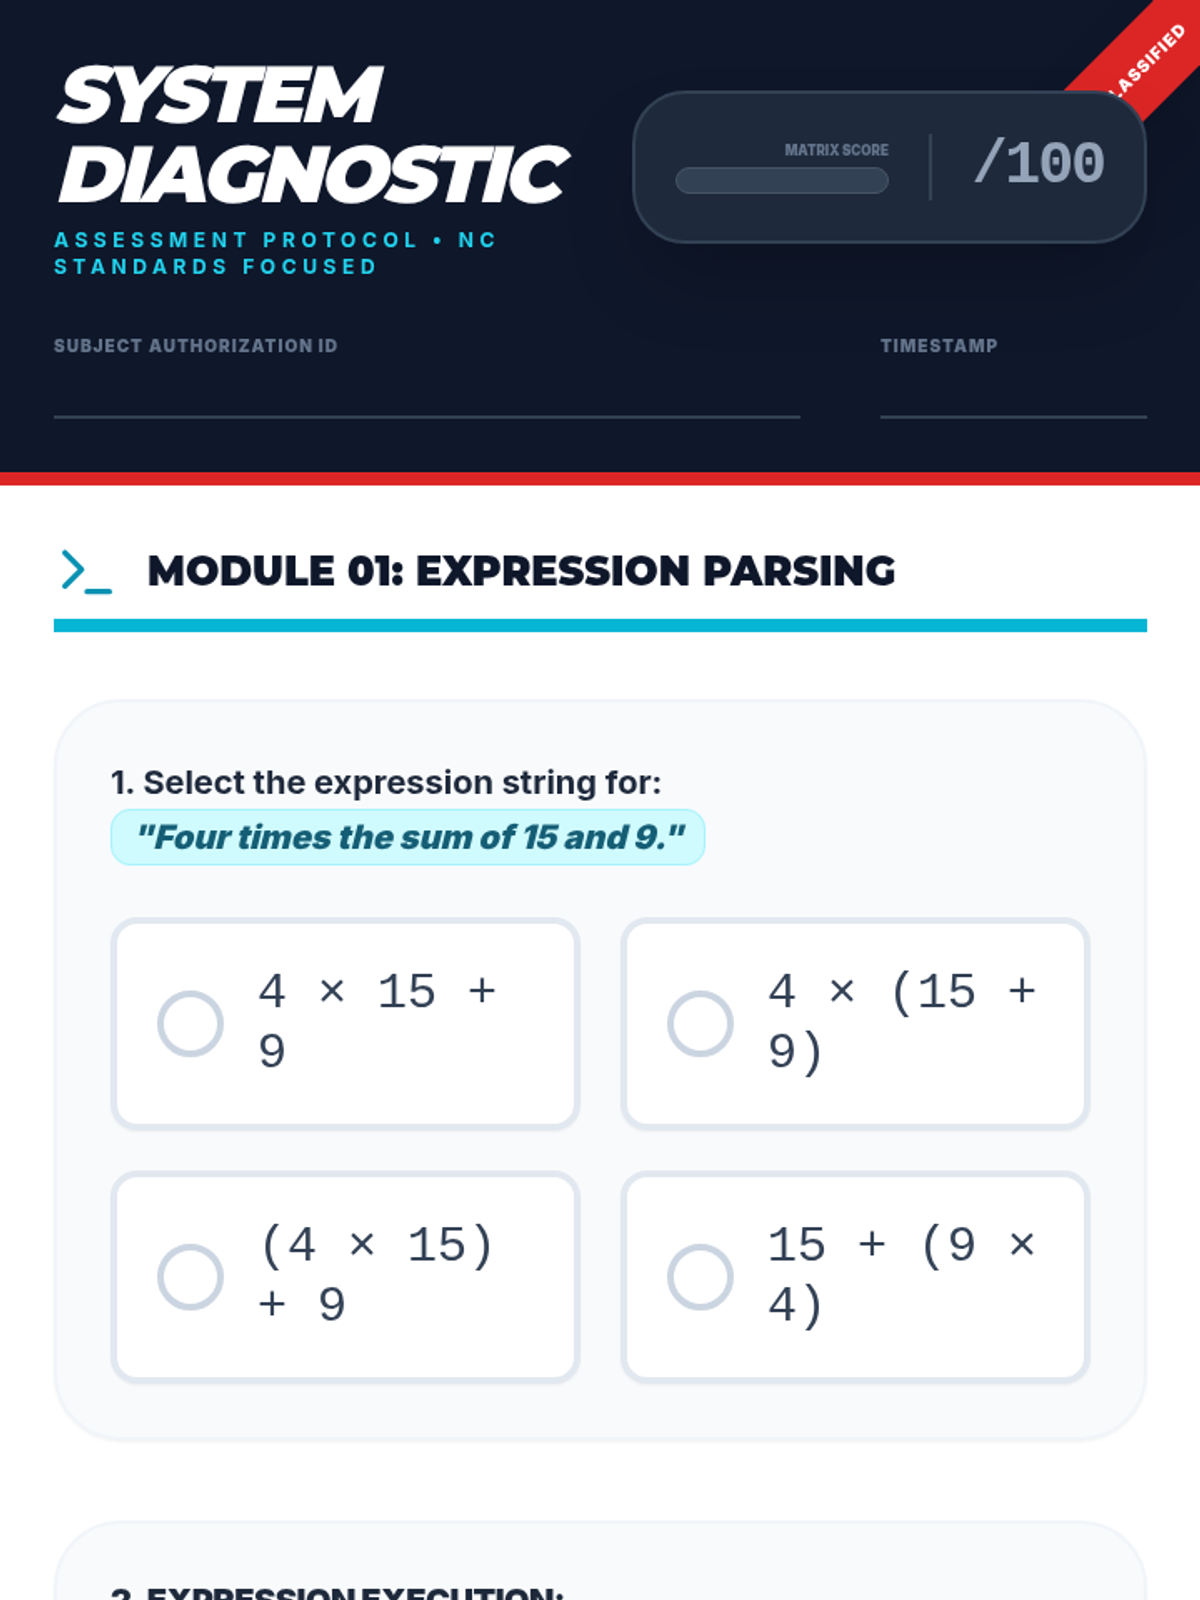
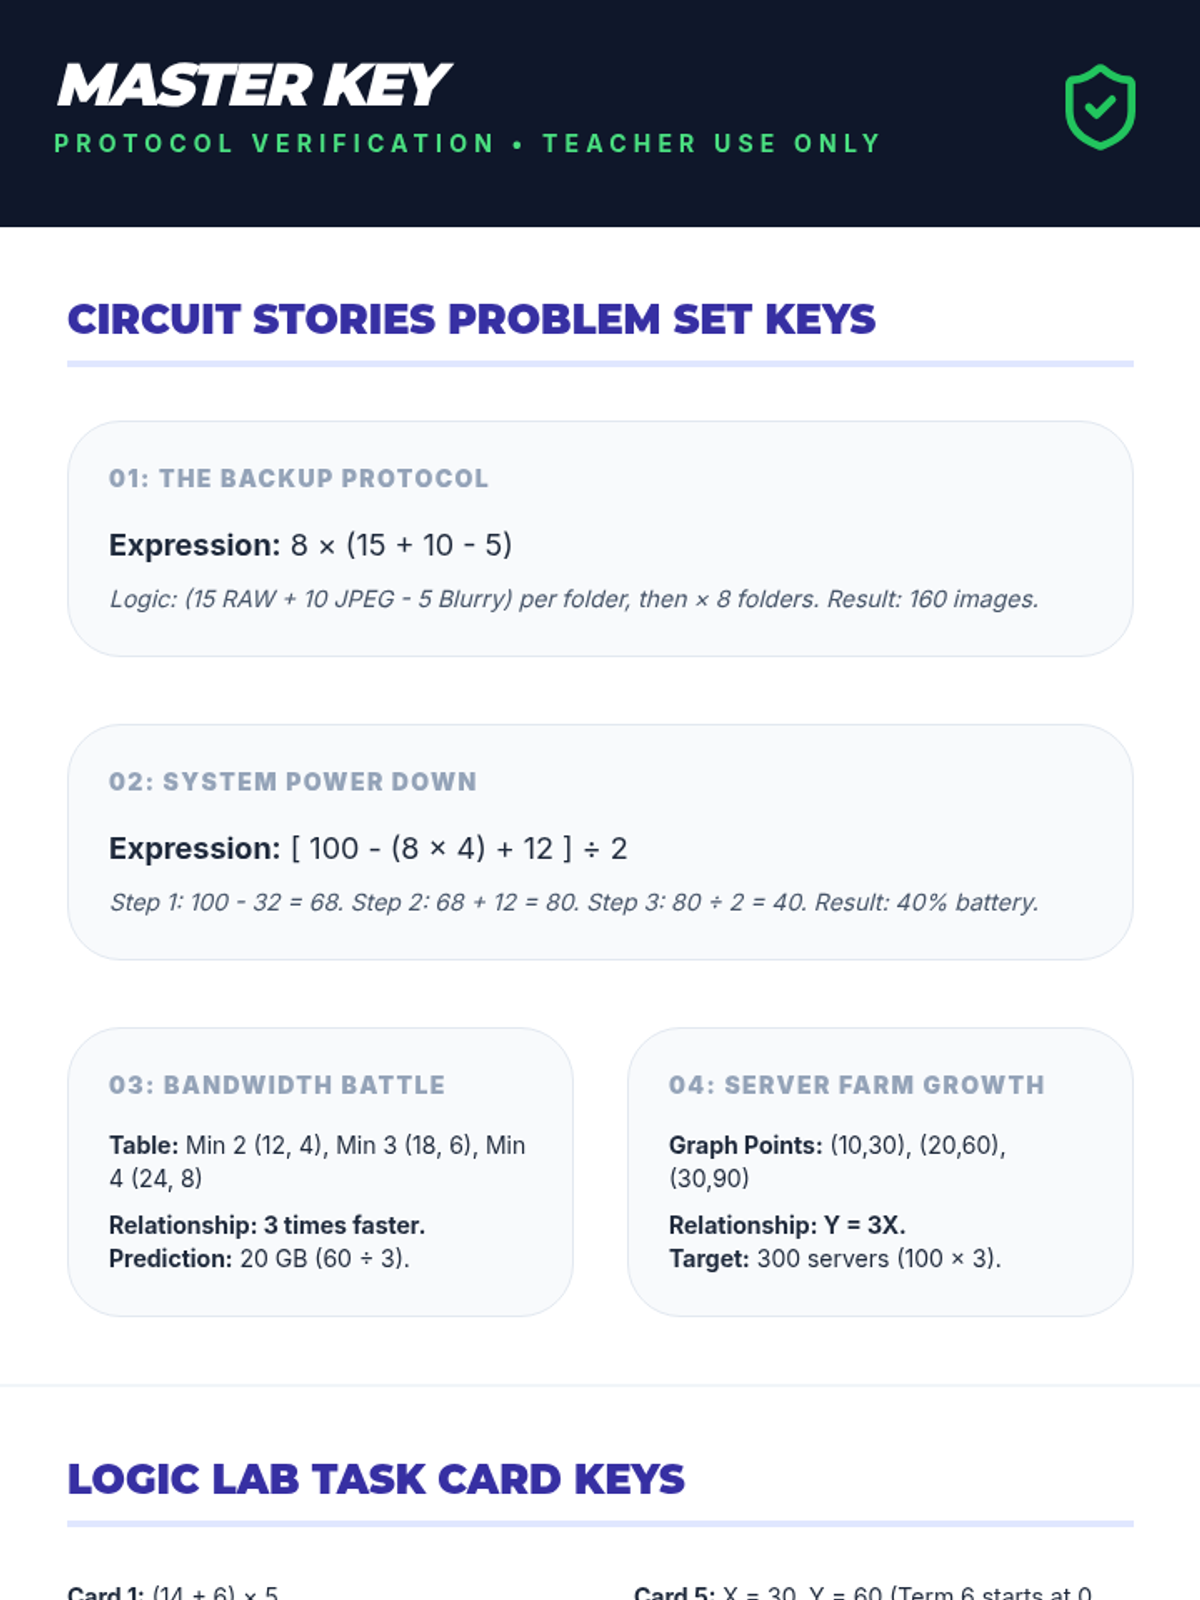
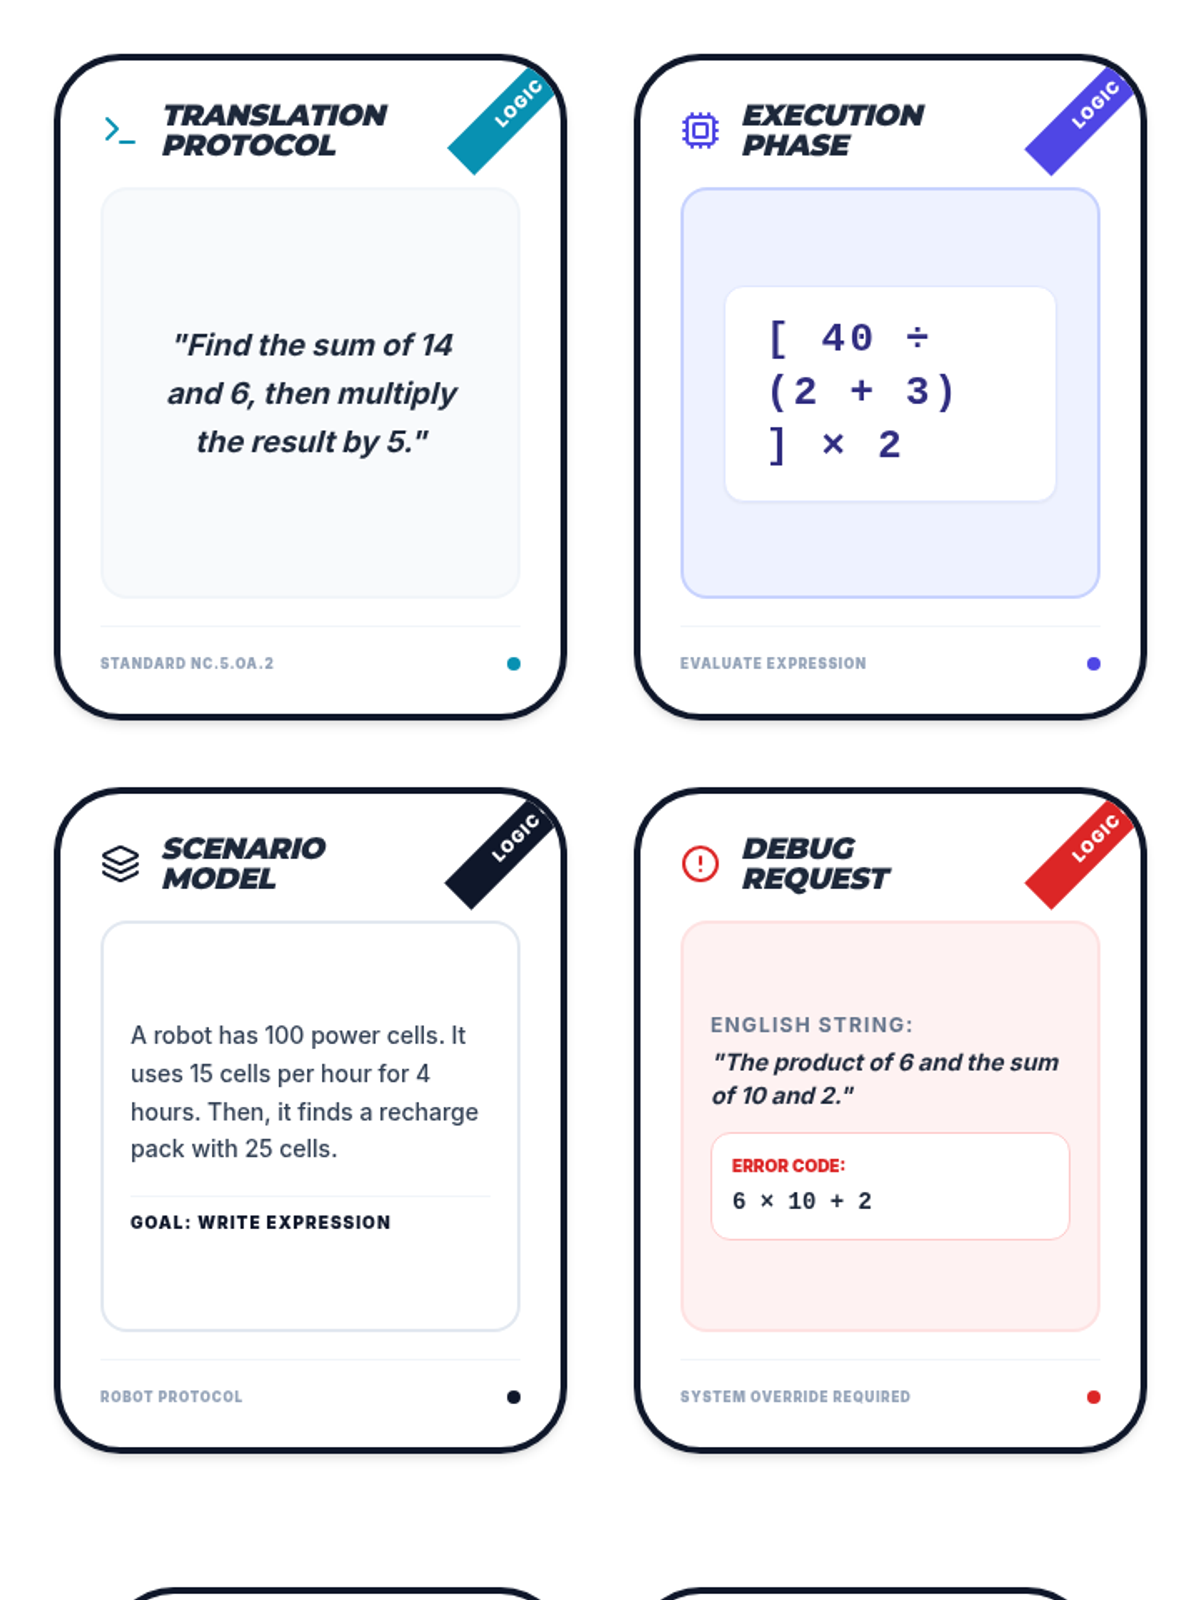
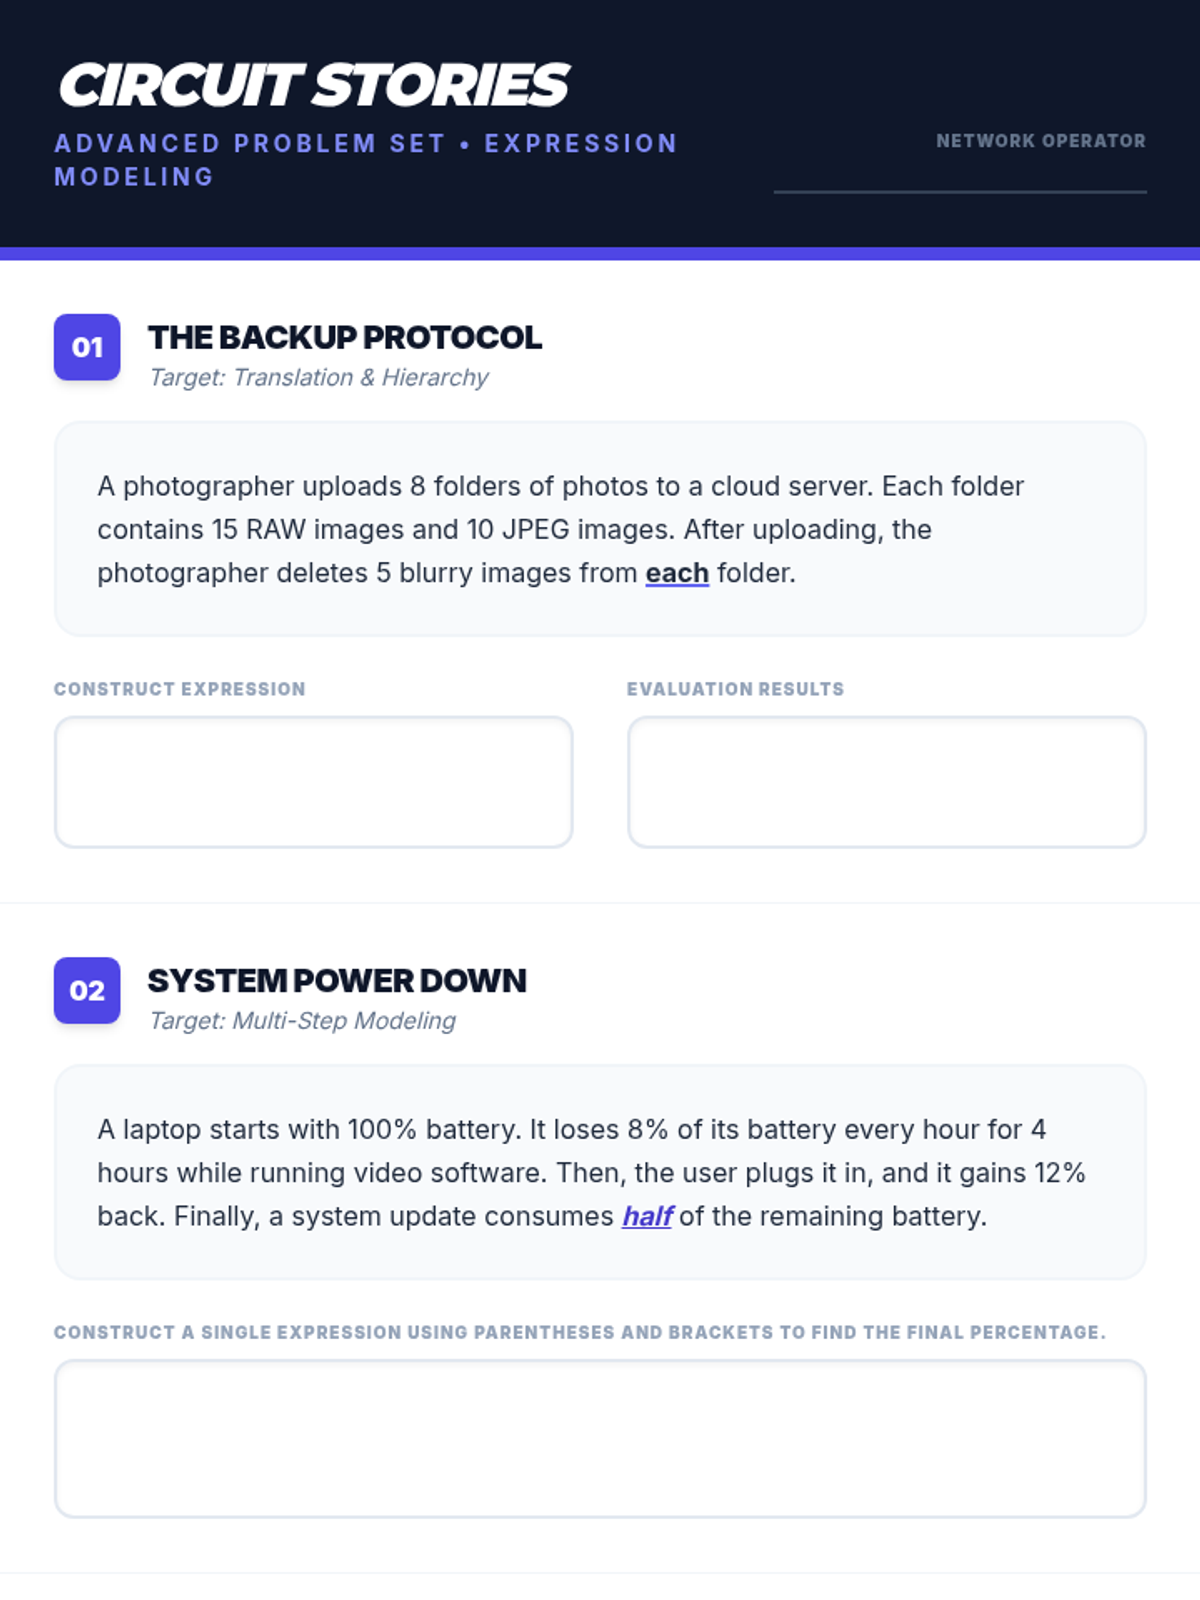
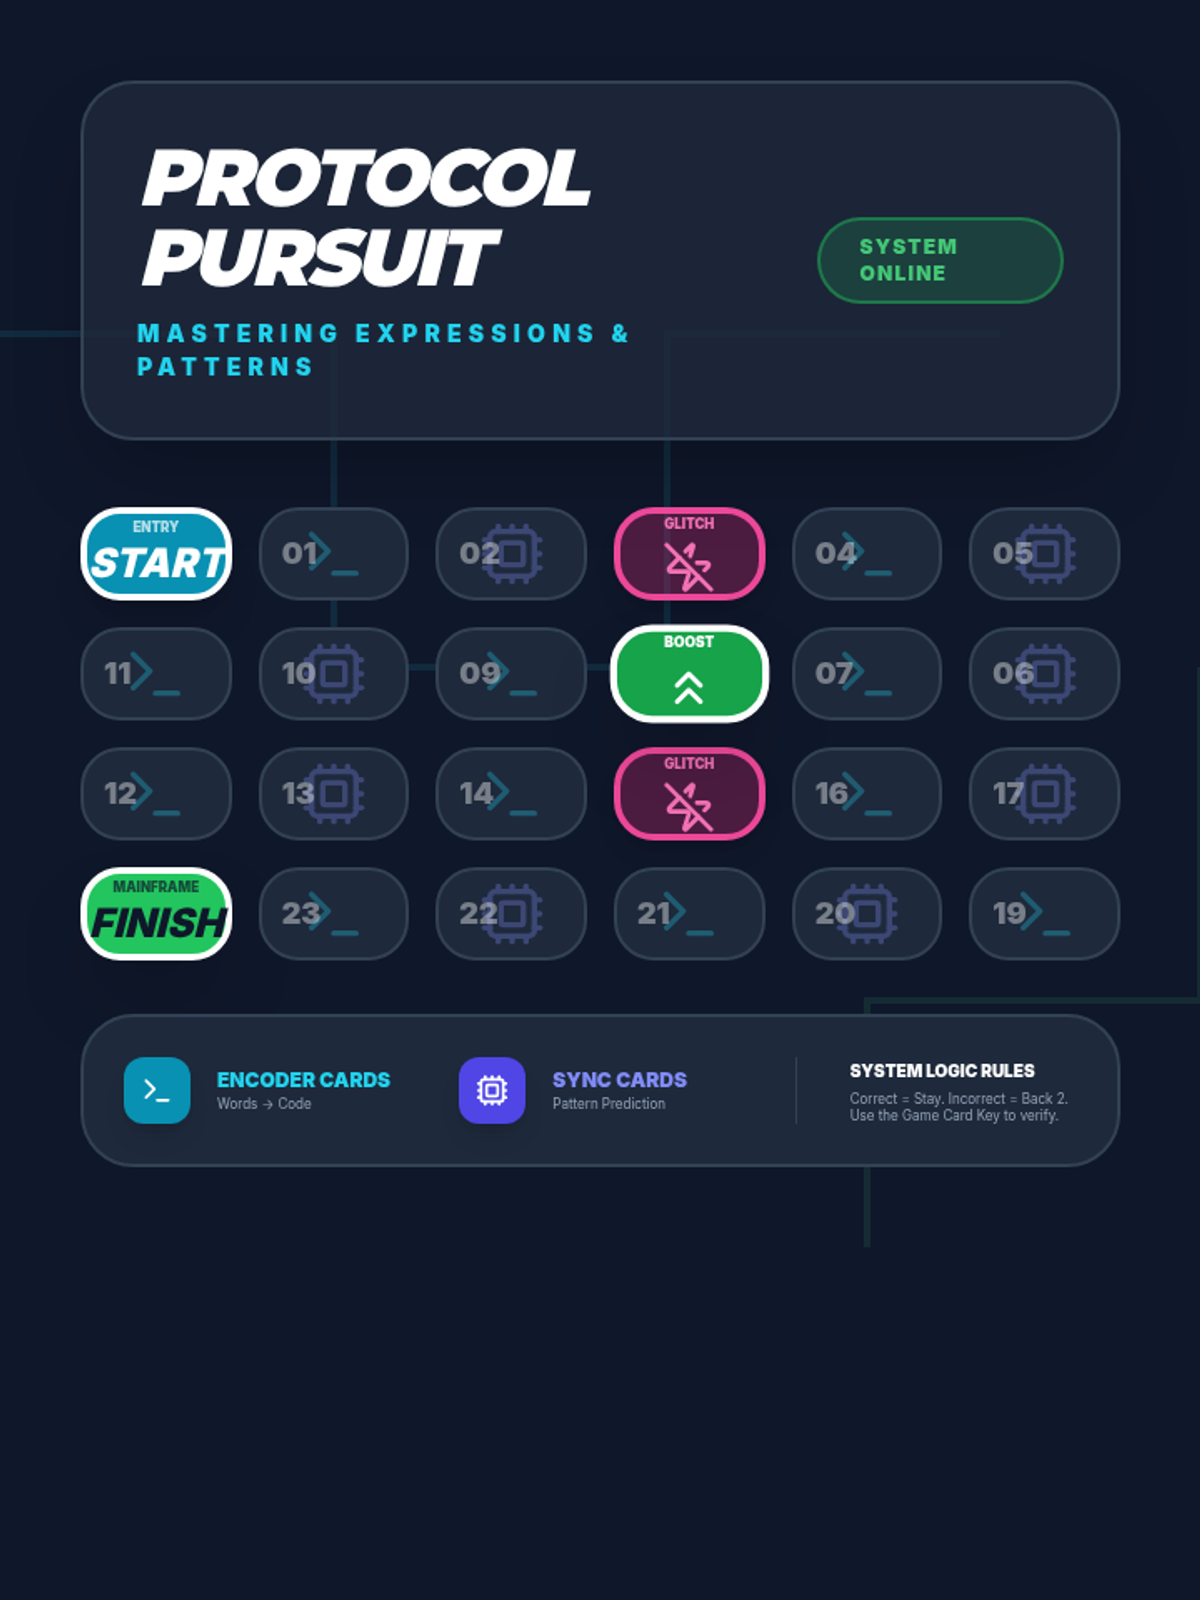
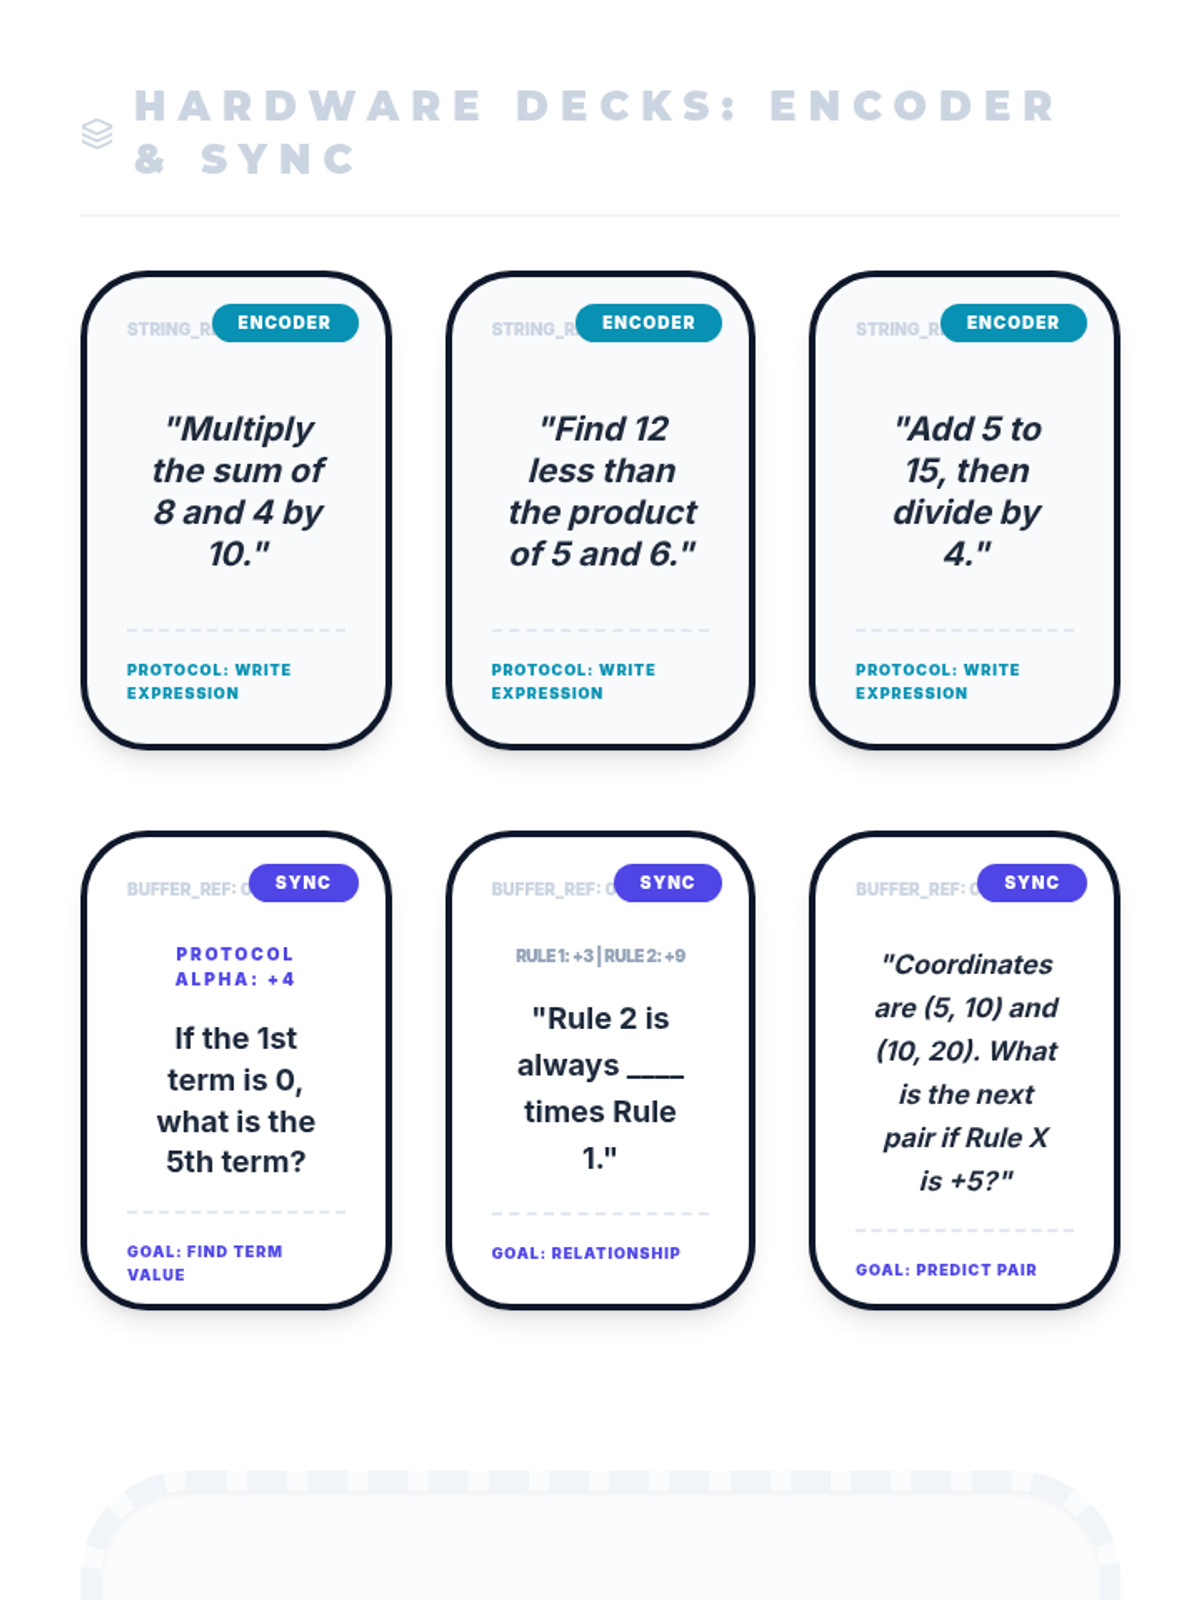
A comprehensive lesson on writing numerical expressions and analyzing mathematical patterns through the lens of digital logic and circuit design. Students will master parentheses in expressions and explore relationships between numerical patterns on a coordinate plane.
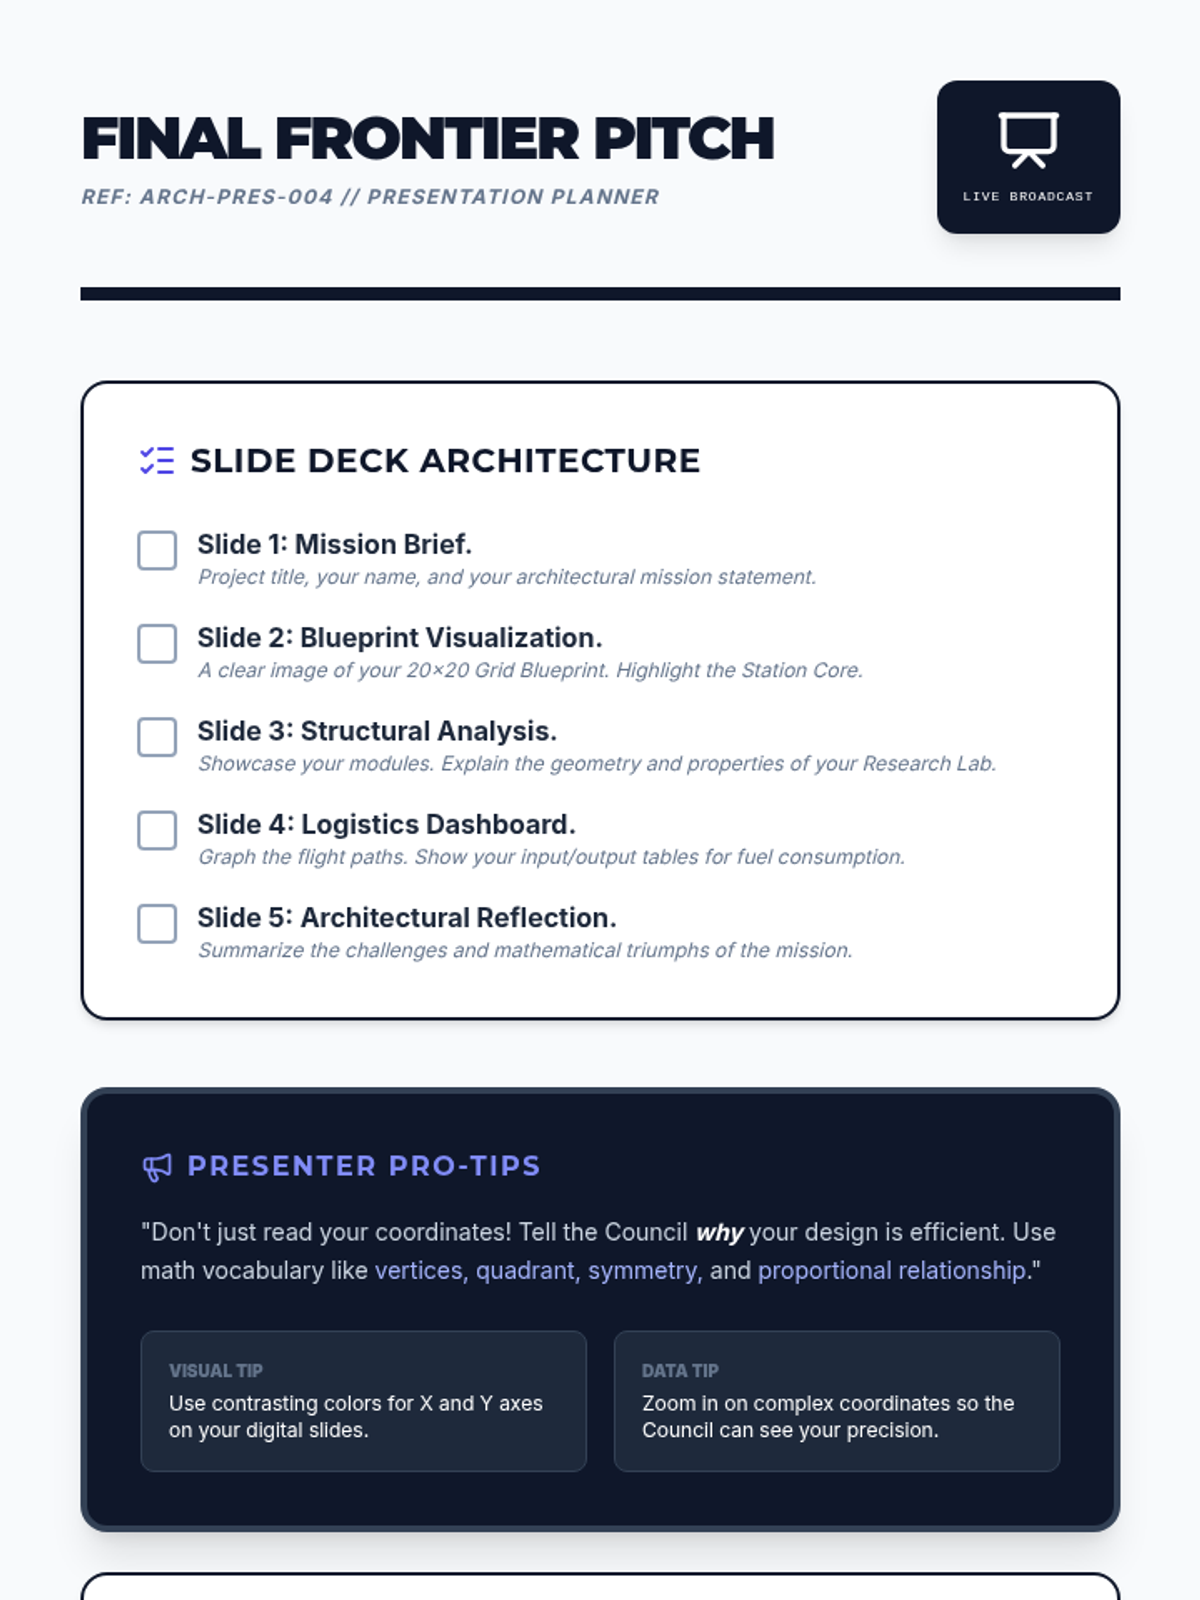
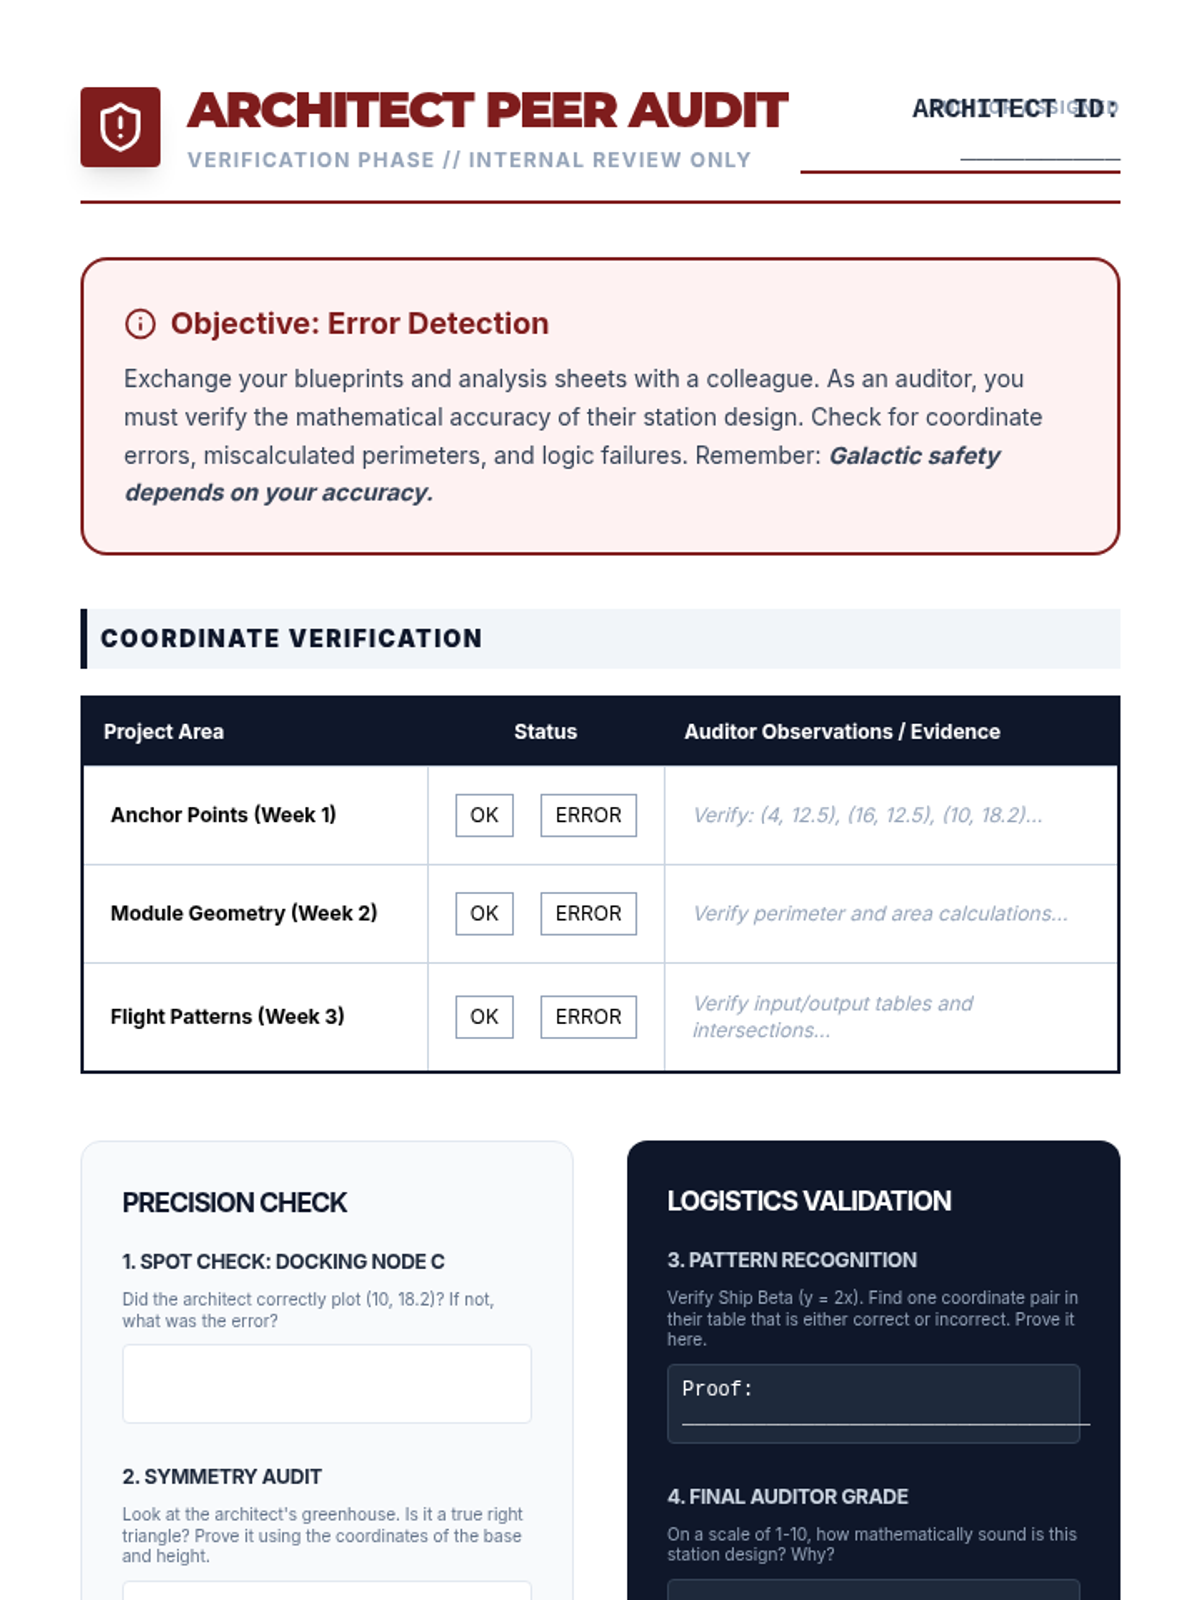
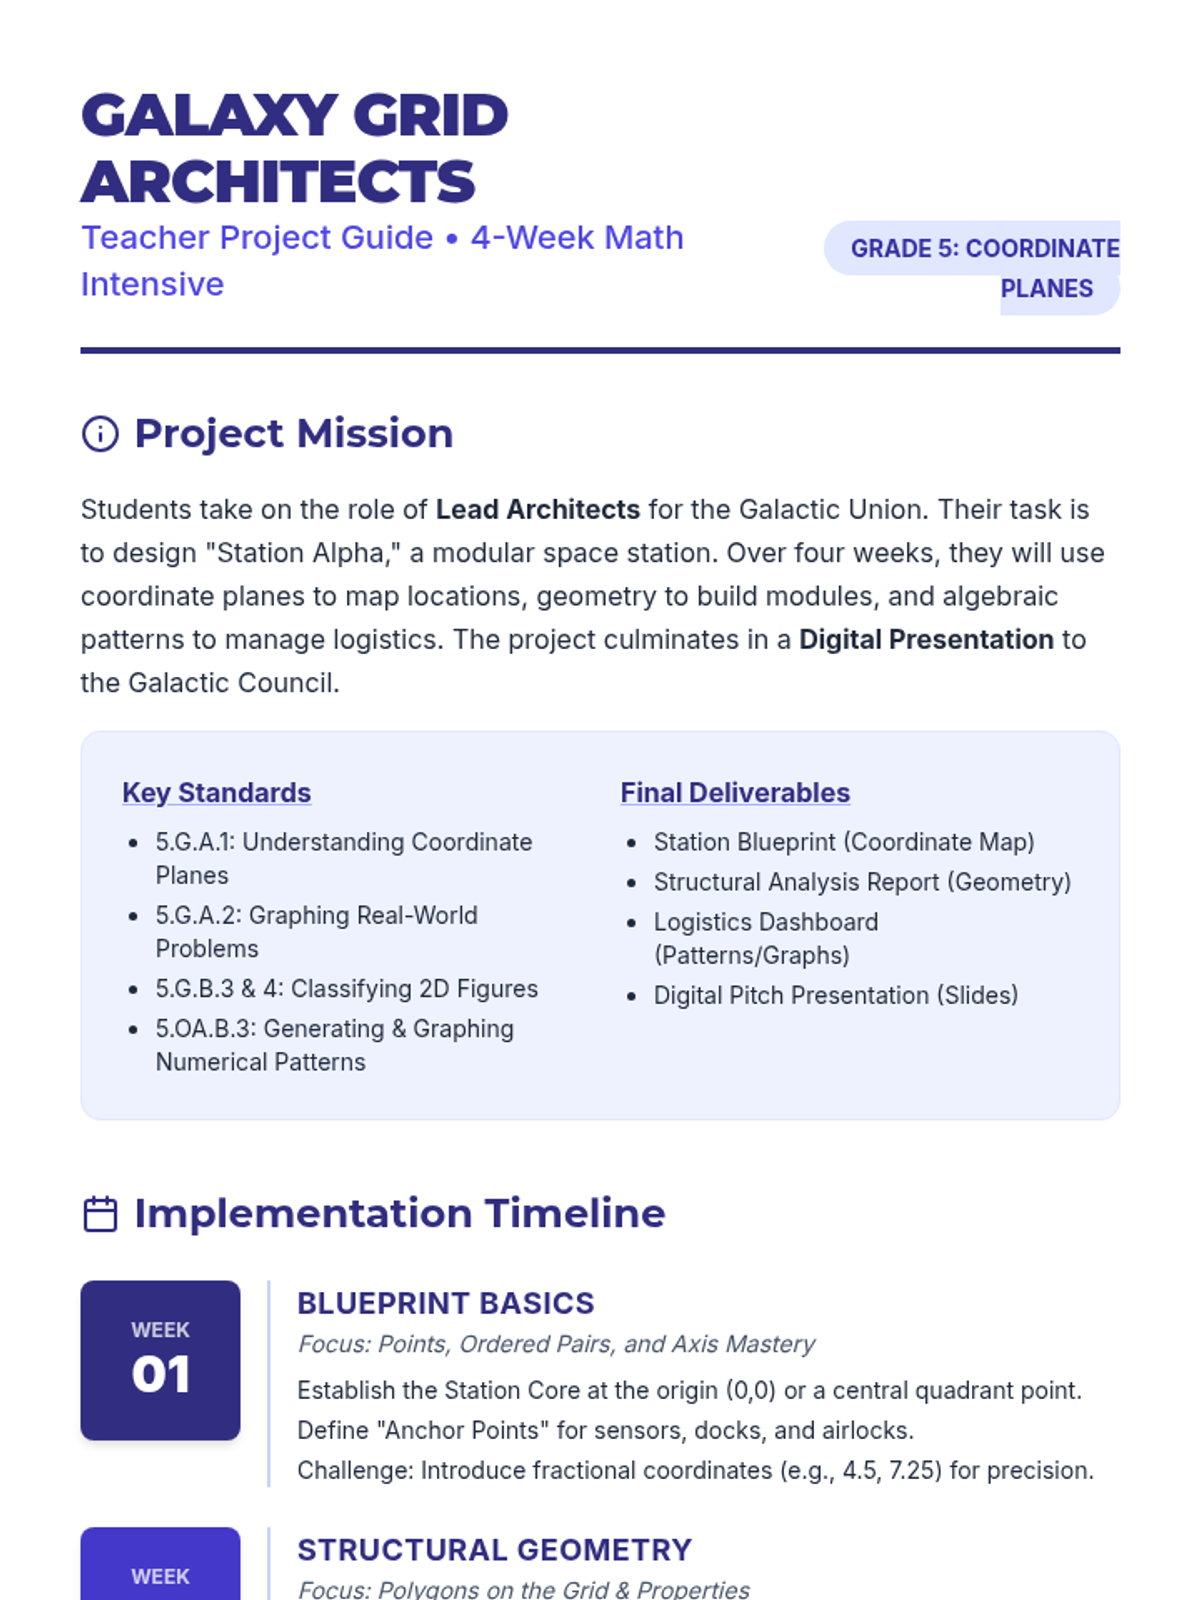
Synthesizing the design data into a professional digital presentation, including a project reflection and peer review of station designs.
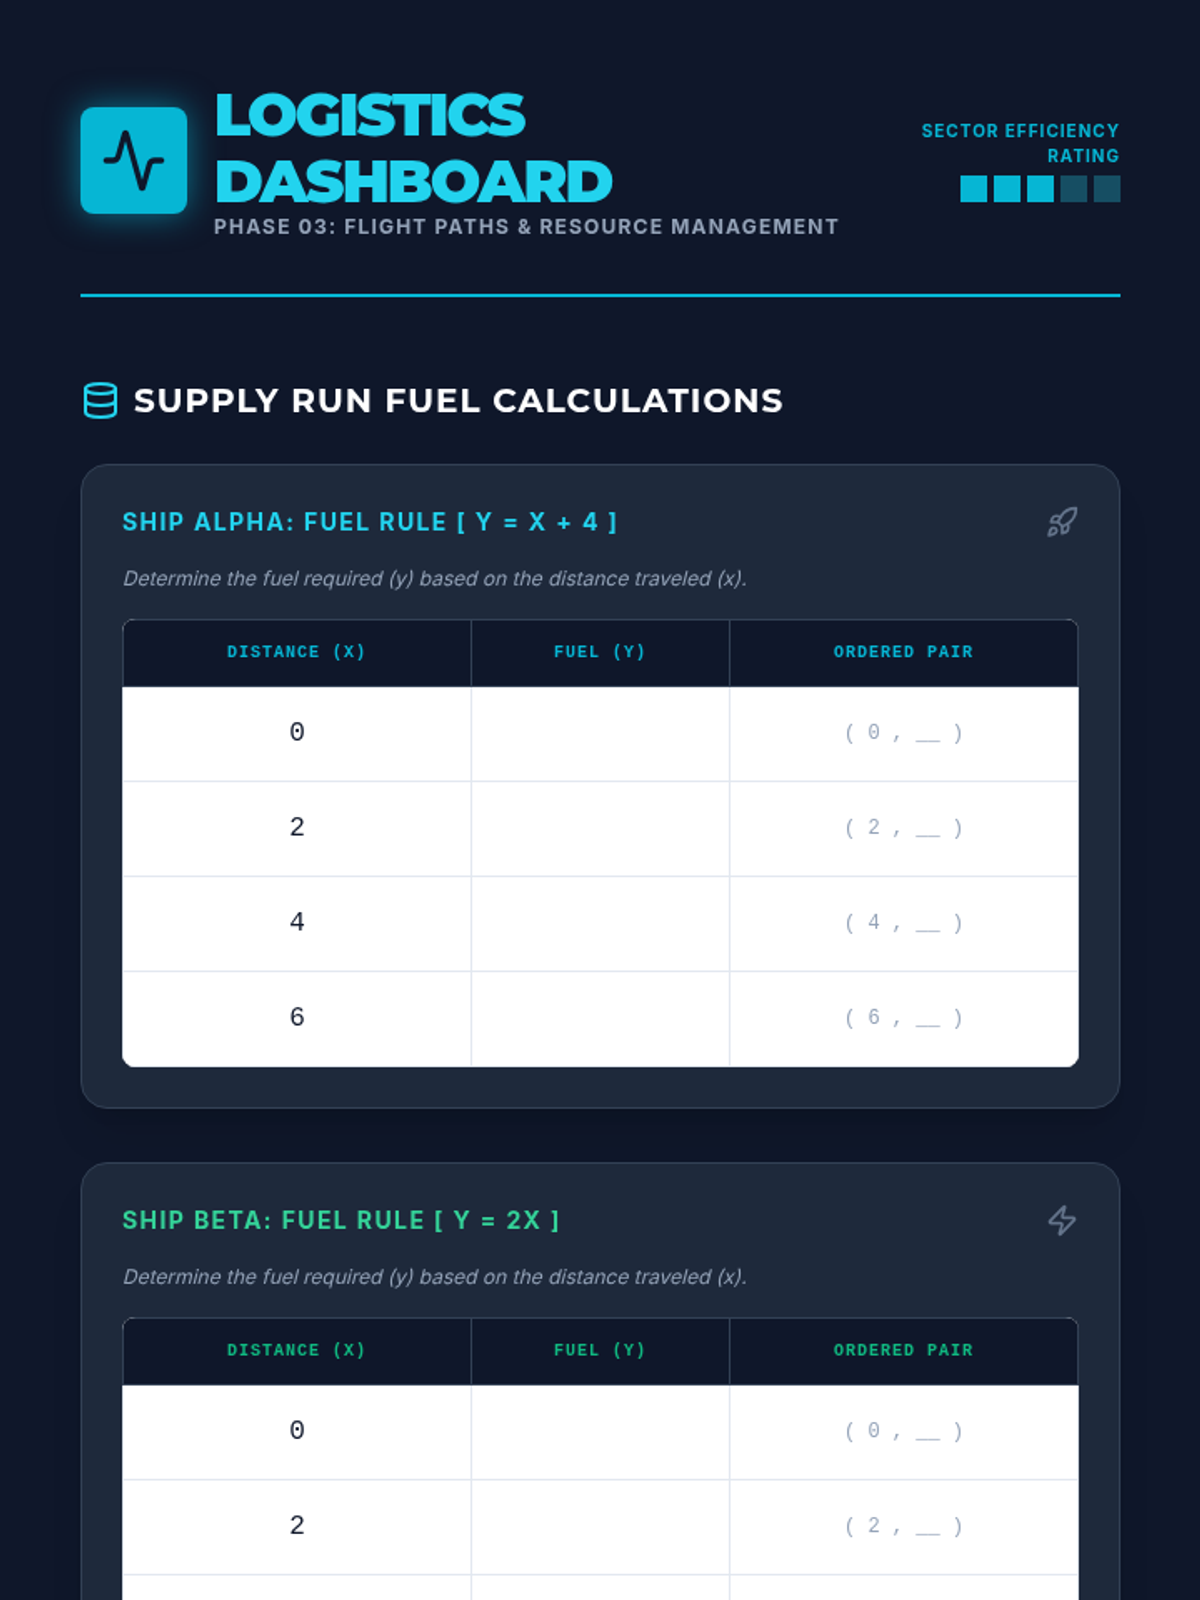
Analyzing flight paths and resource consumption using numerical patterns, input-output tables, and graphing relationships on the coordinate plane.
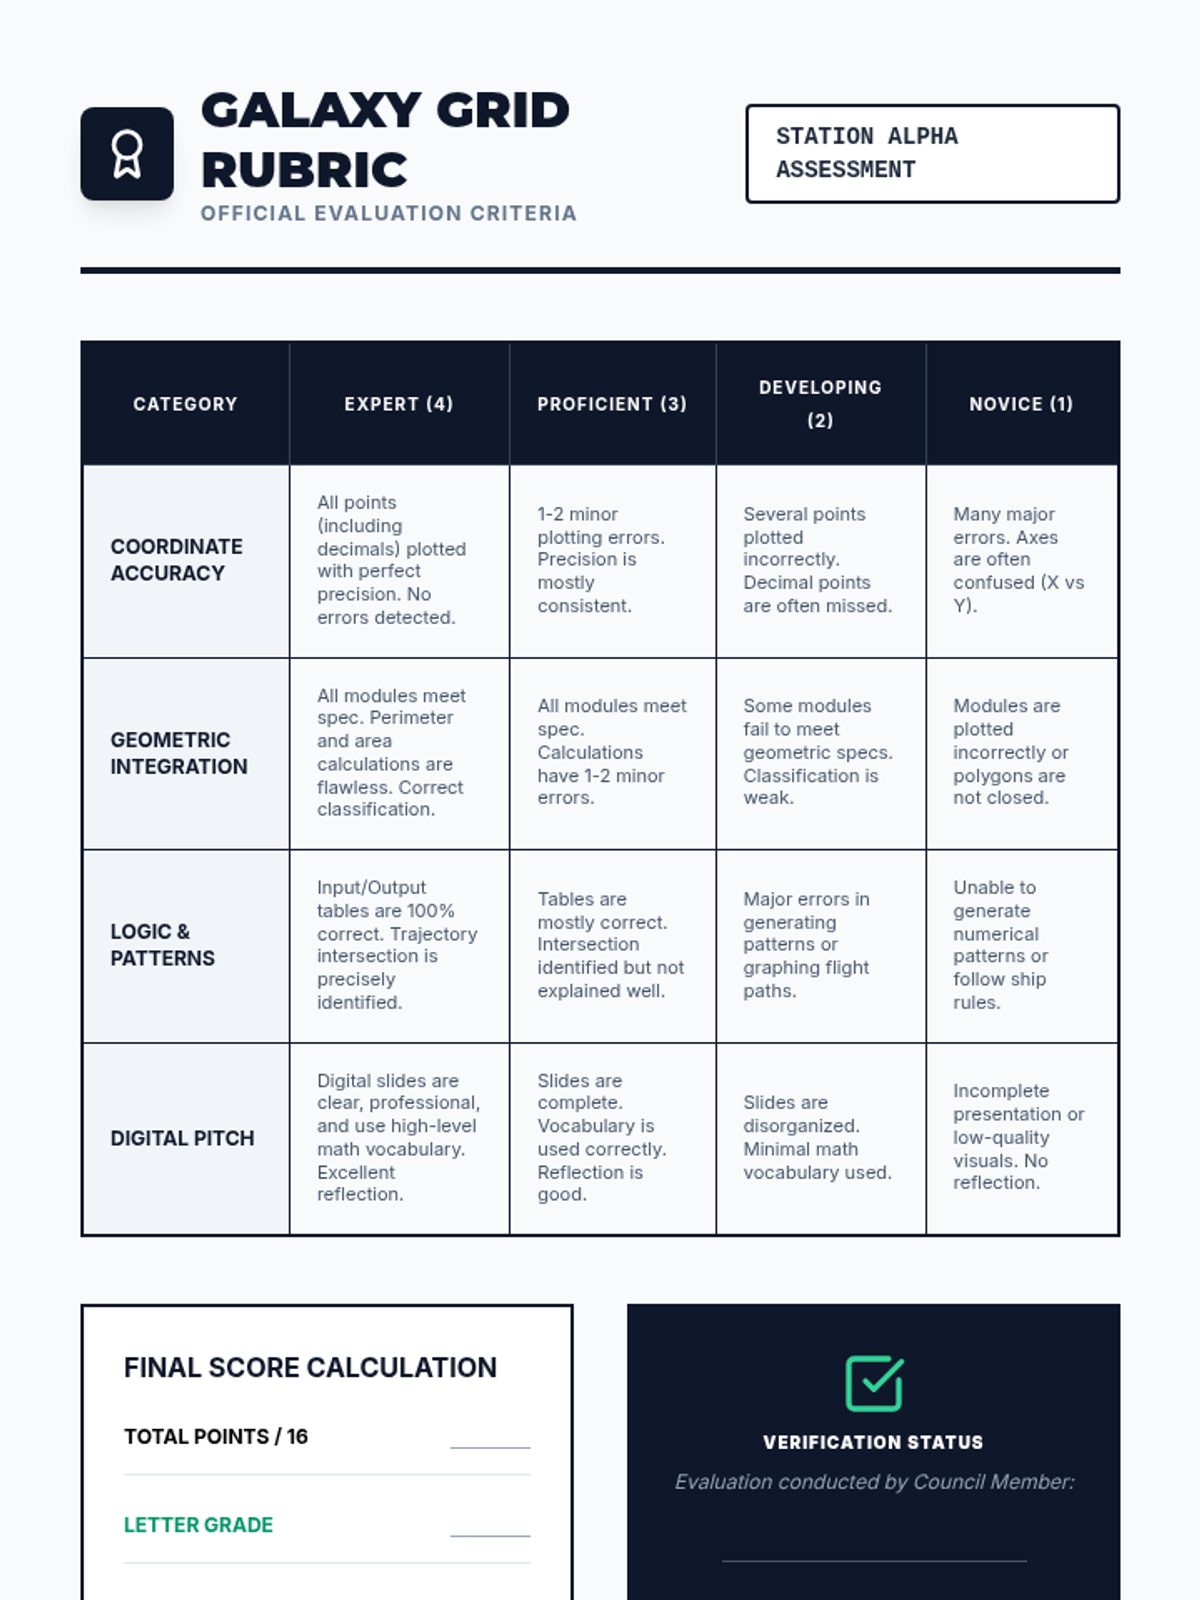
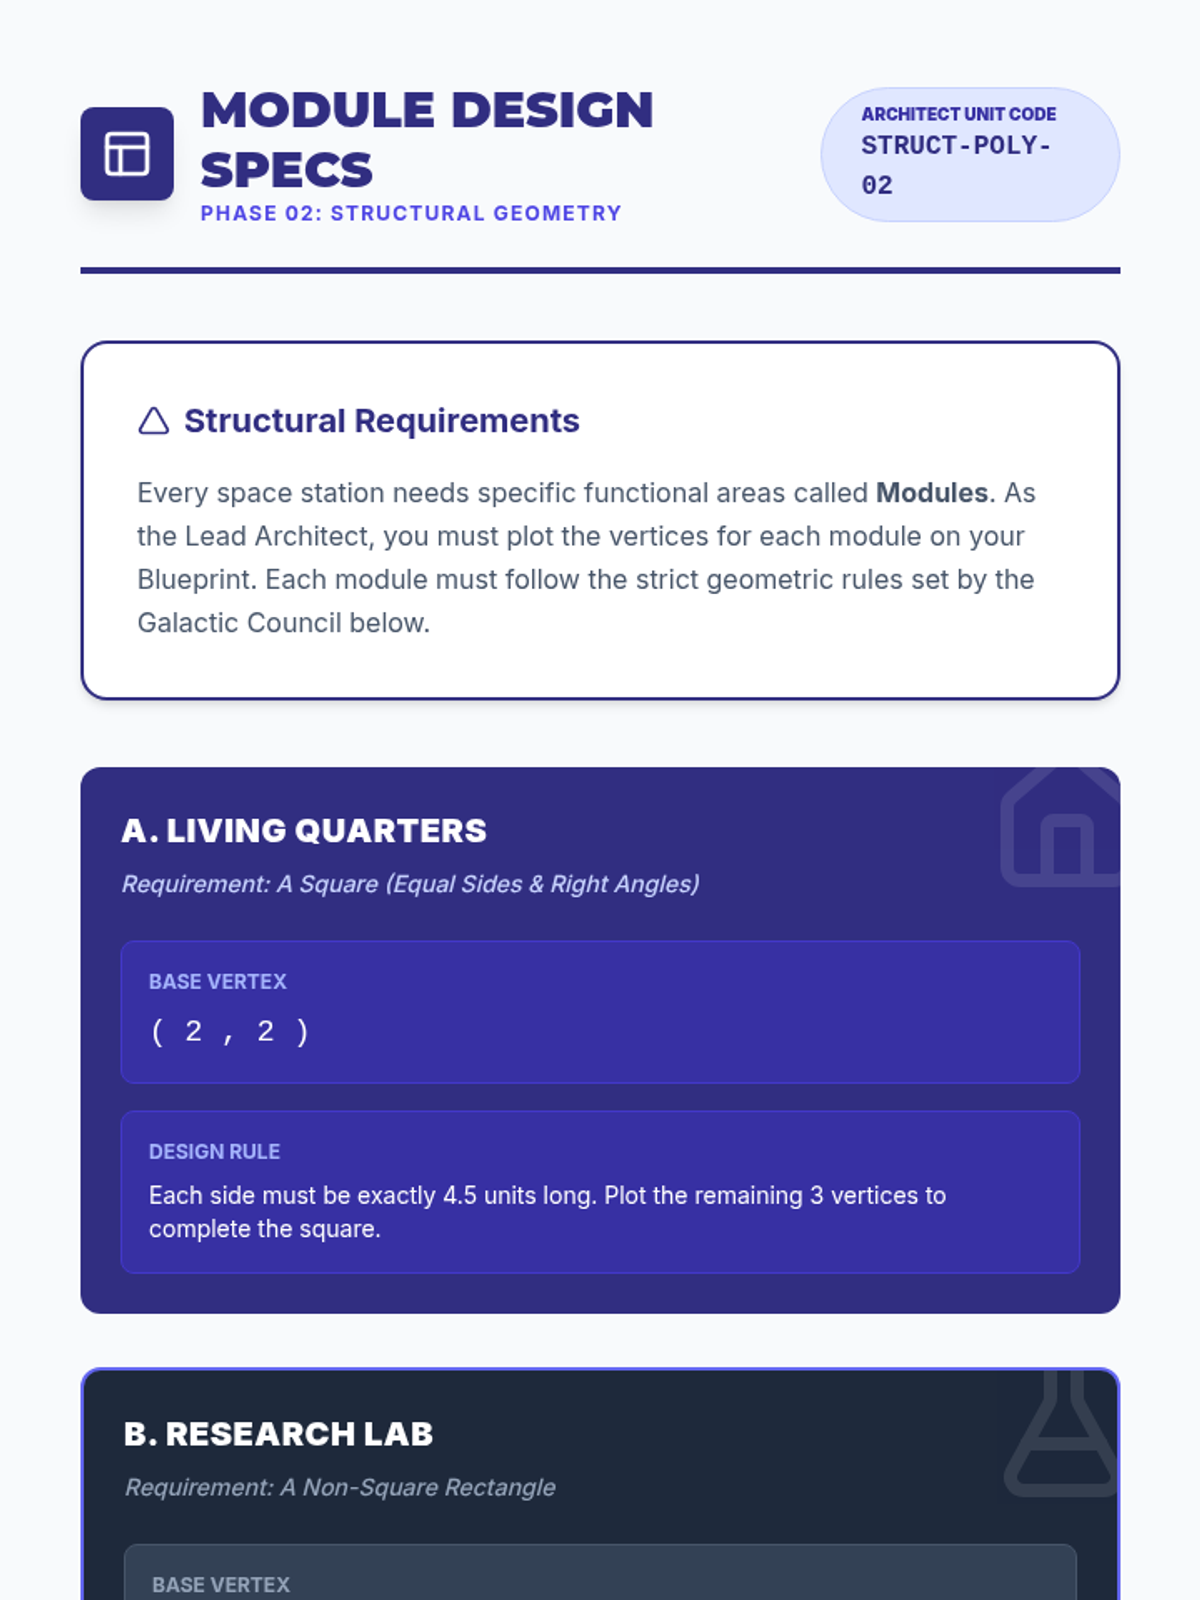
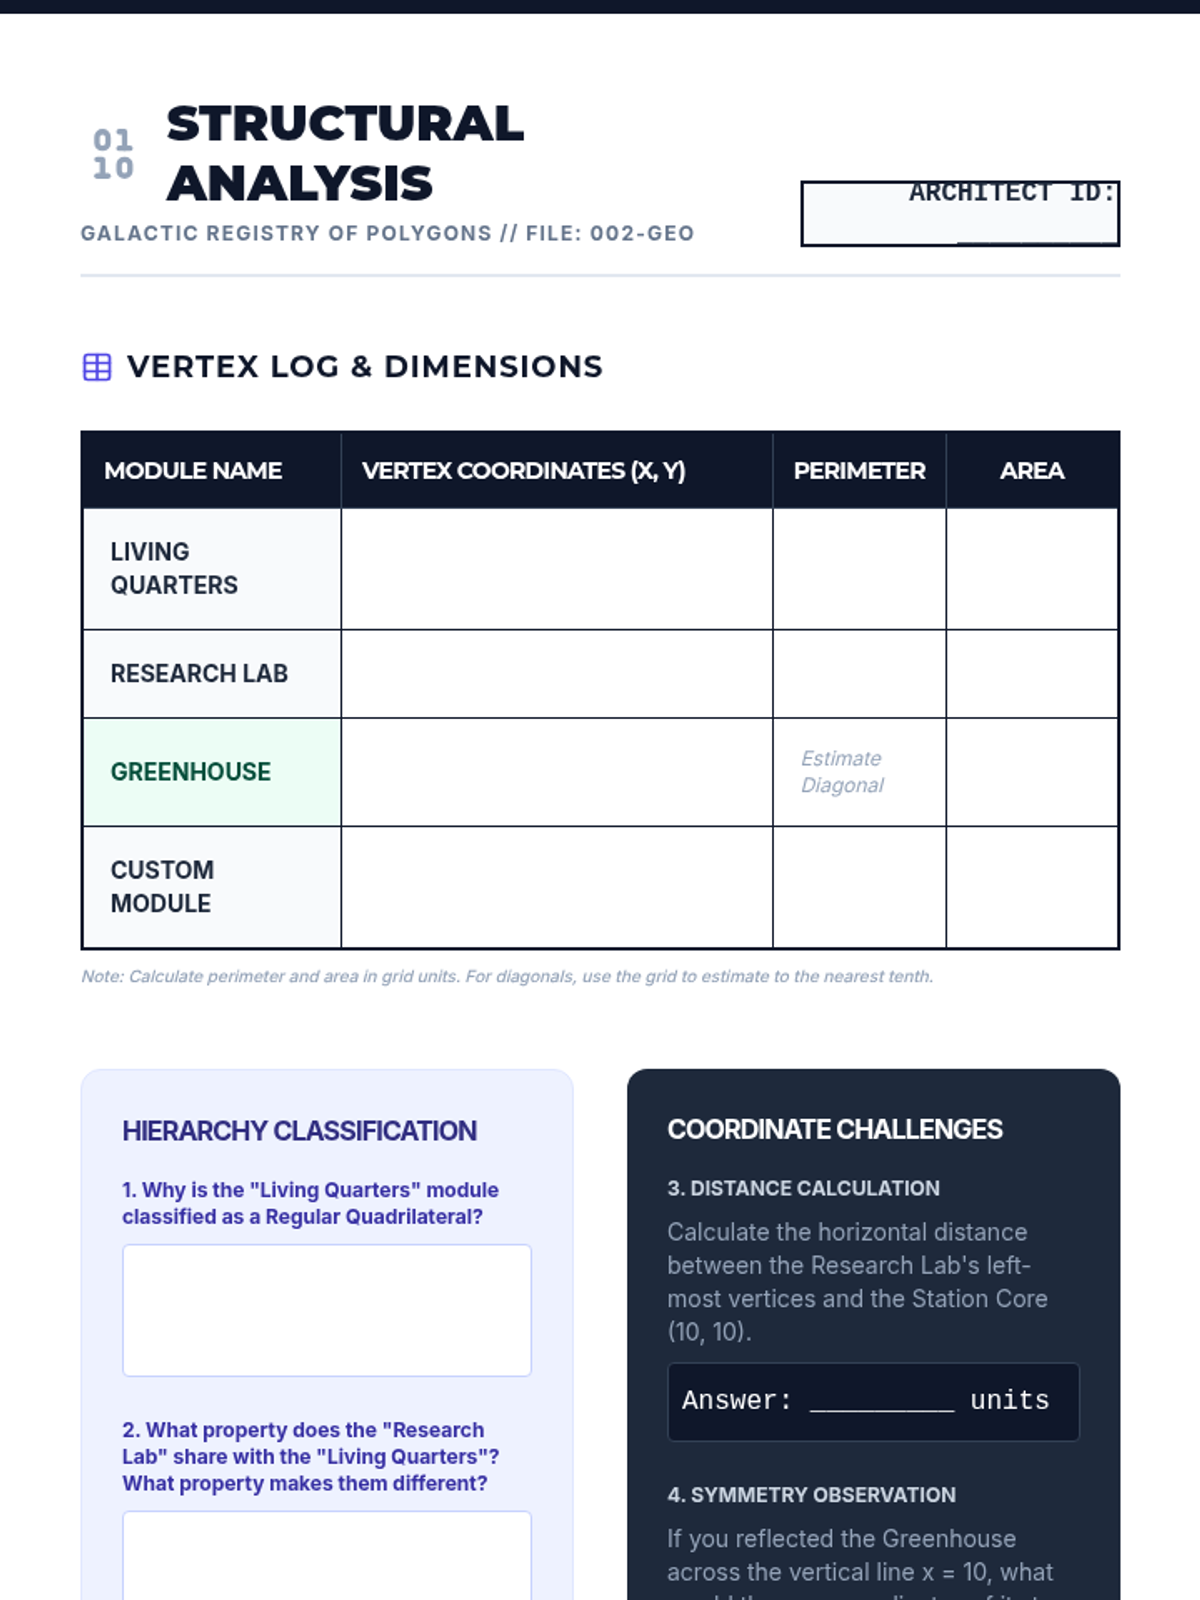
Using coordinate geometry to design station modules as specific polygons, calculating dimensions, and identifying geometric properties on the grid.
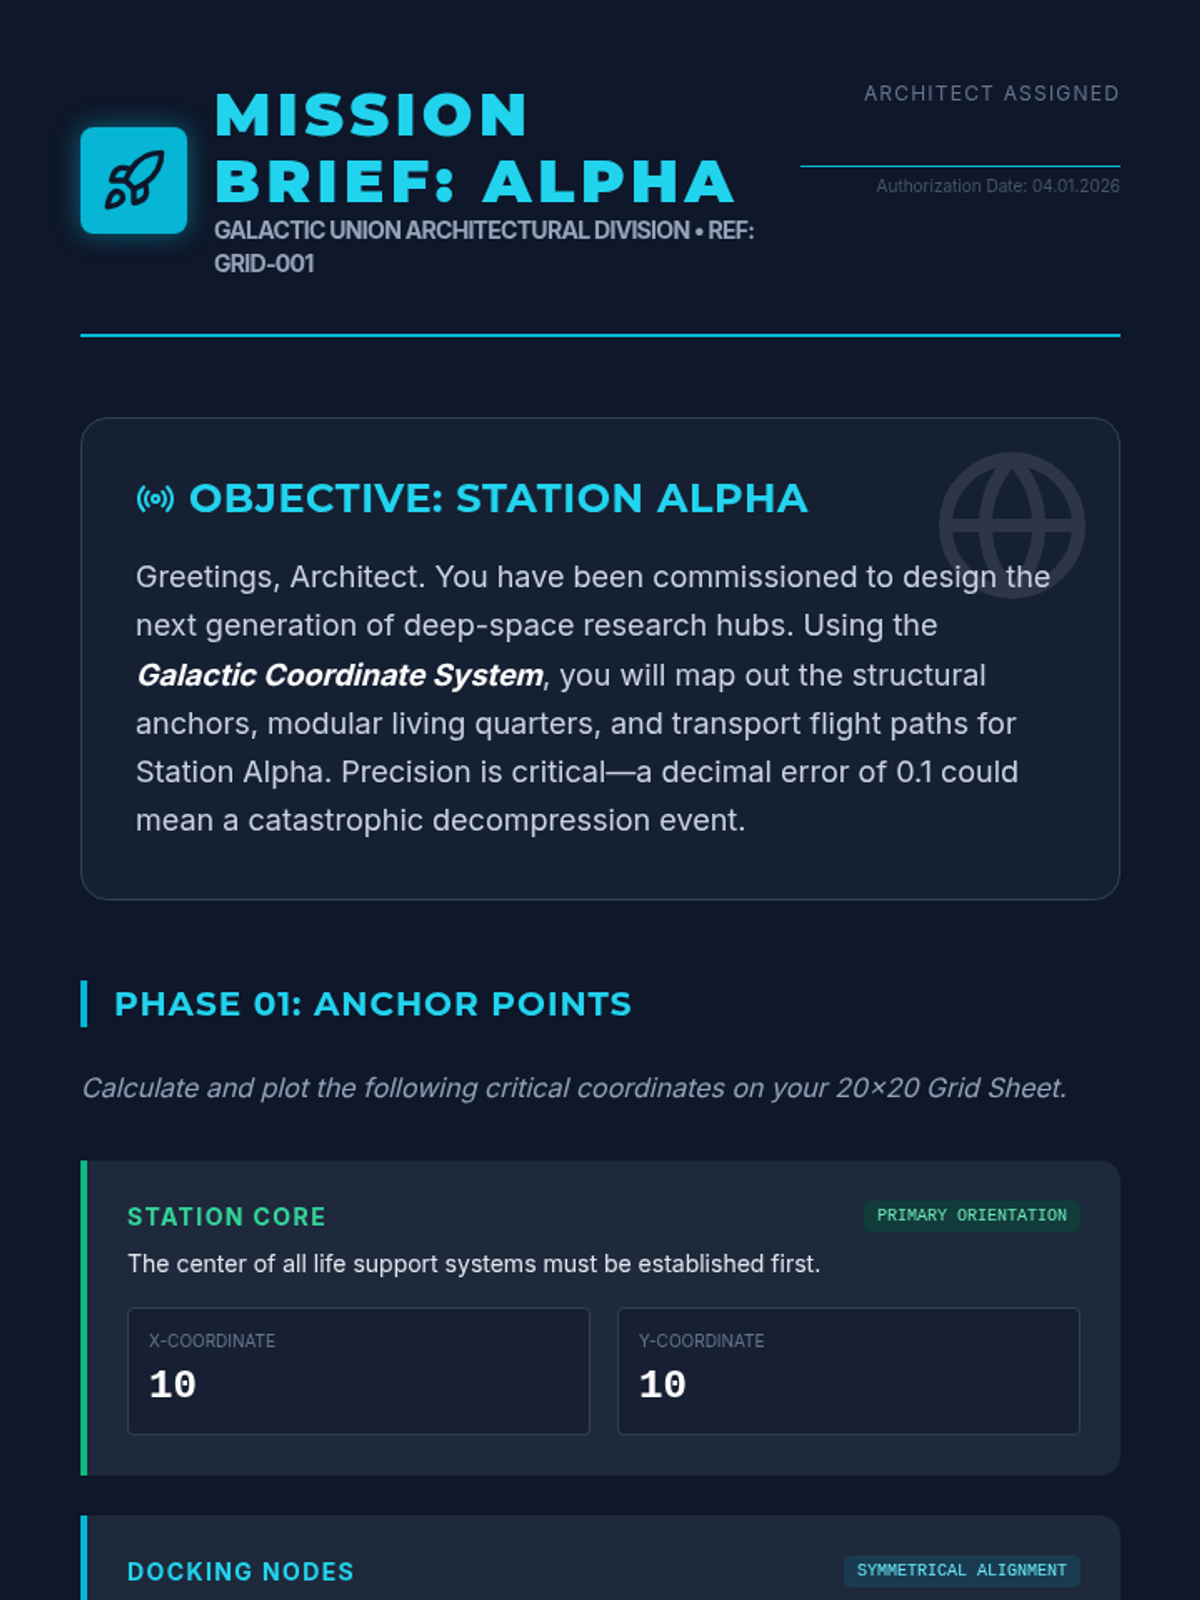
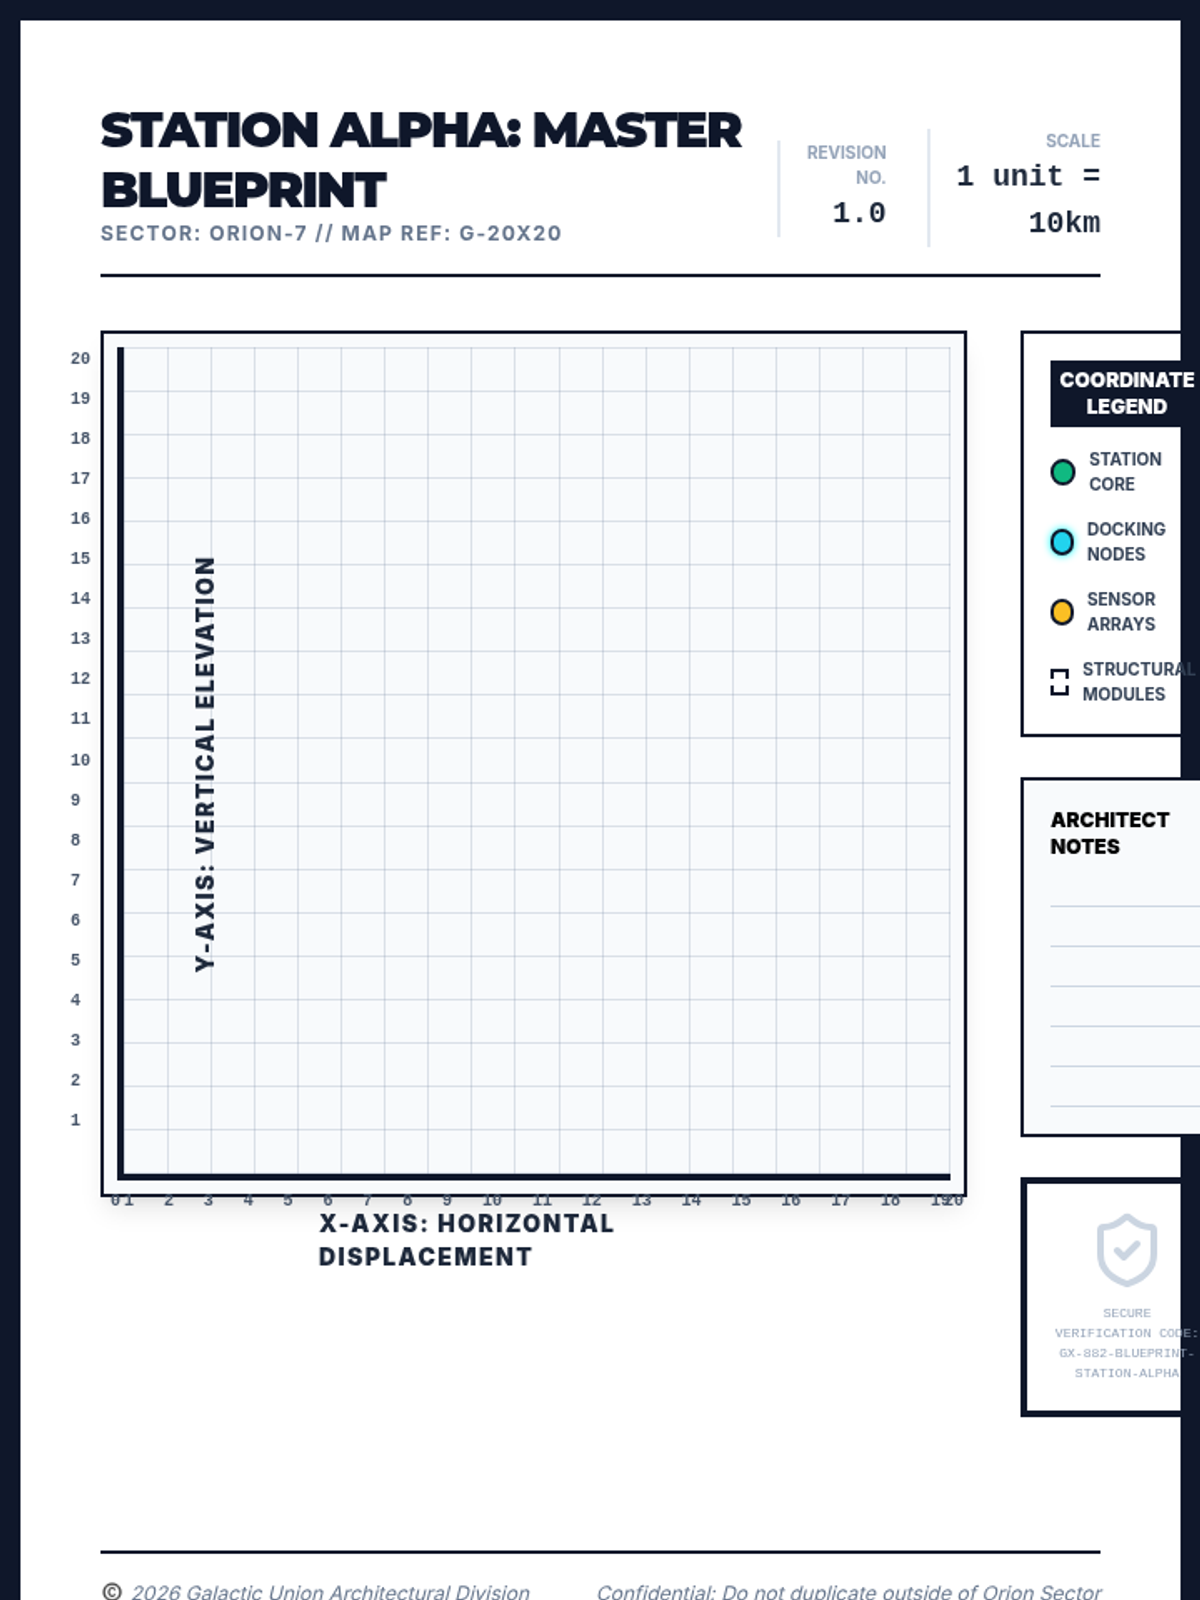
Introduction to the space station mission, establishing the coordinate grid system, and plotting the core anchor points of the station using precise coordinates.
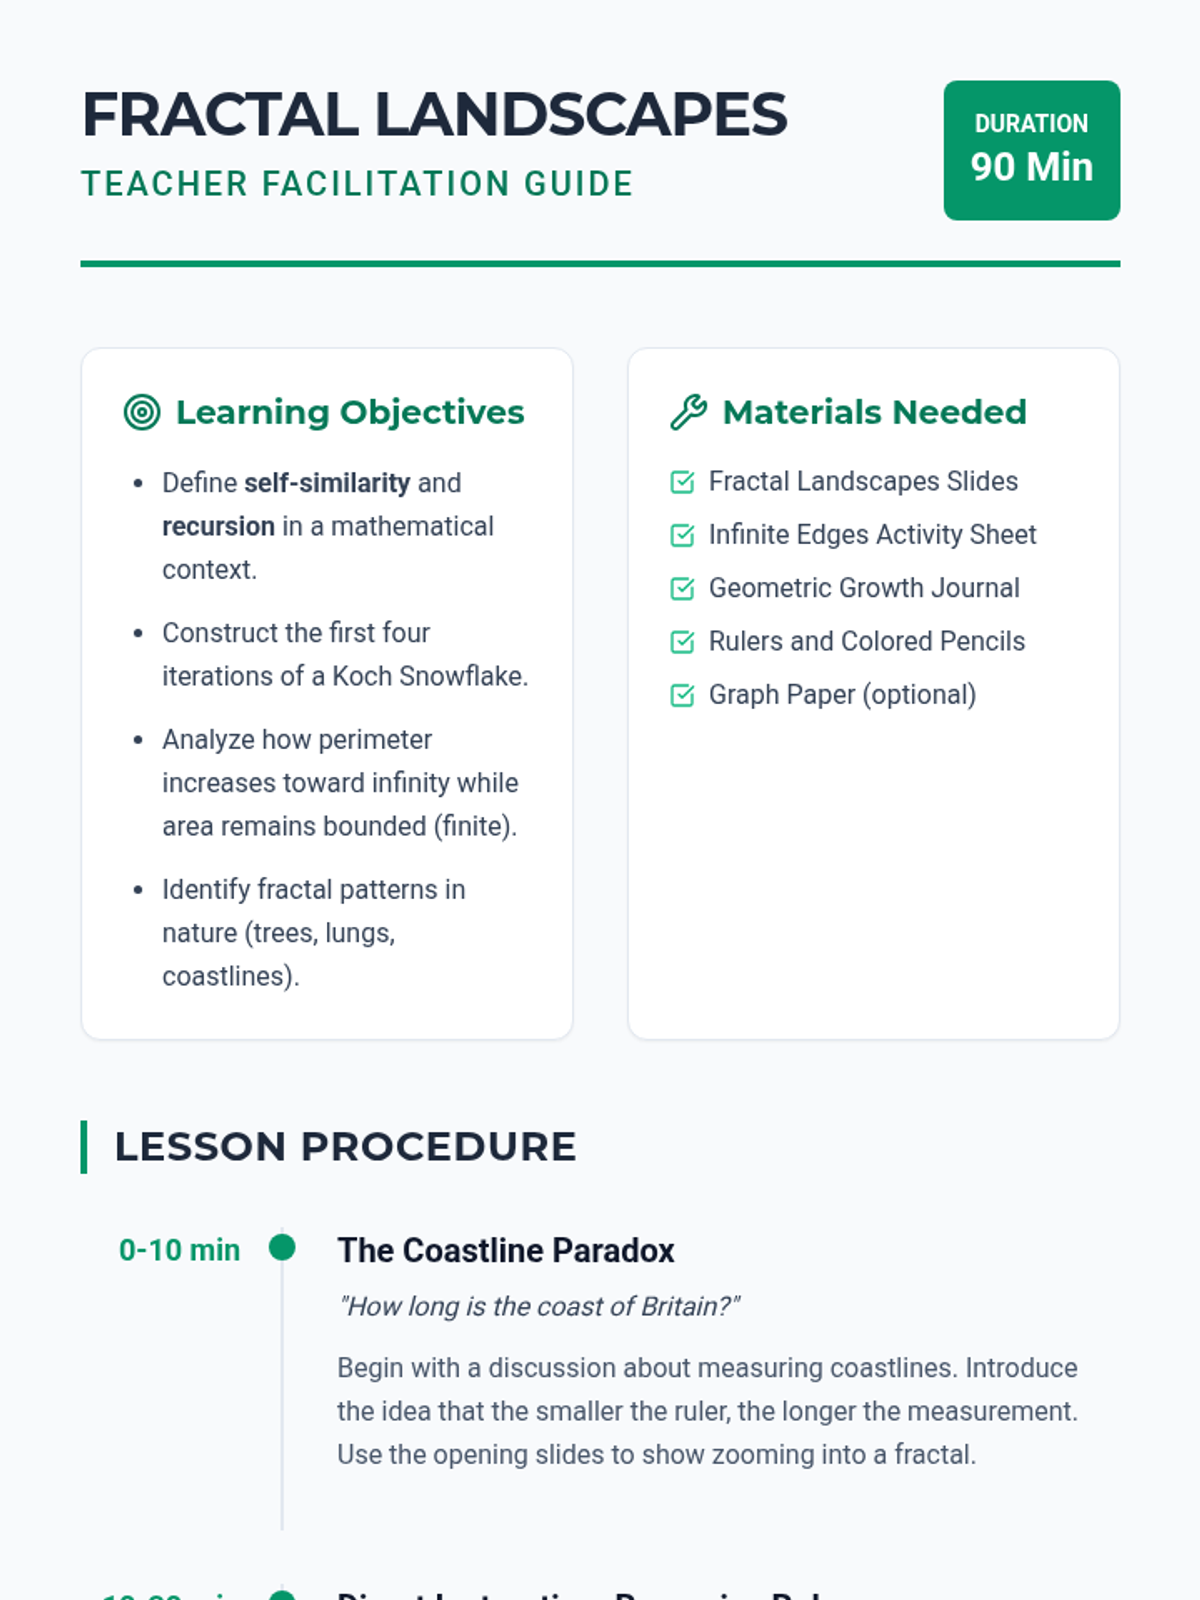
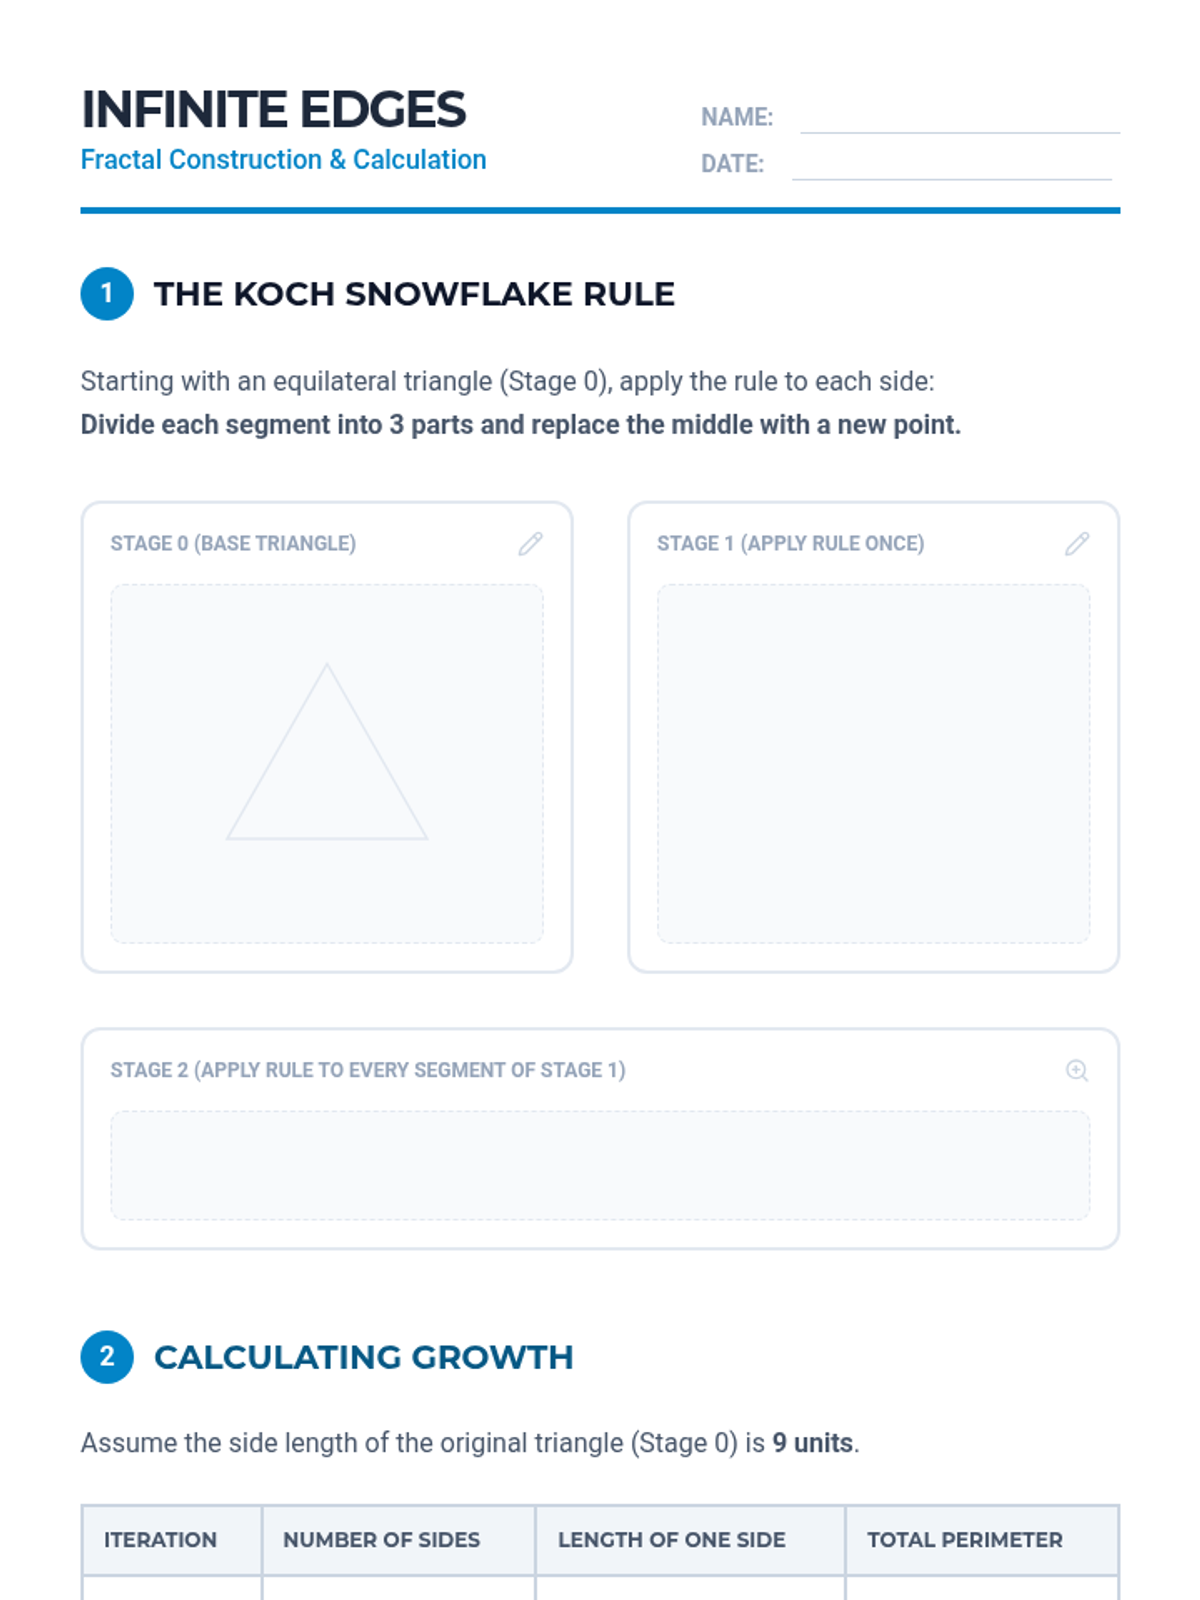
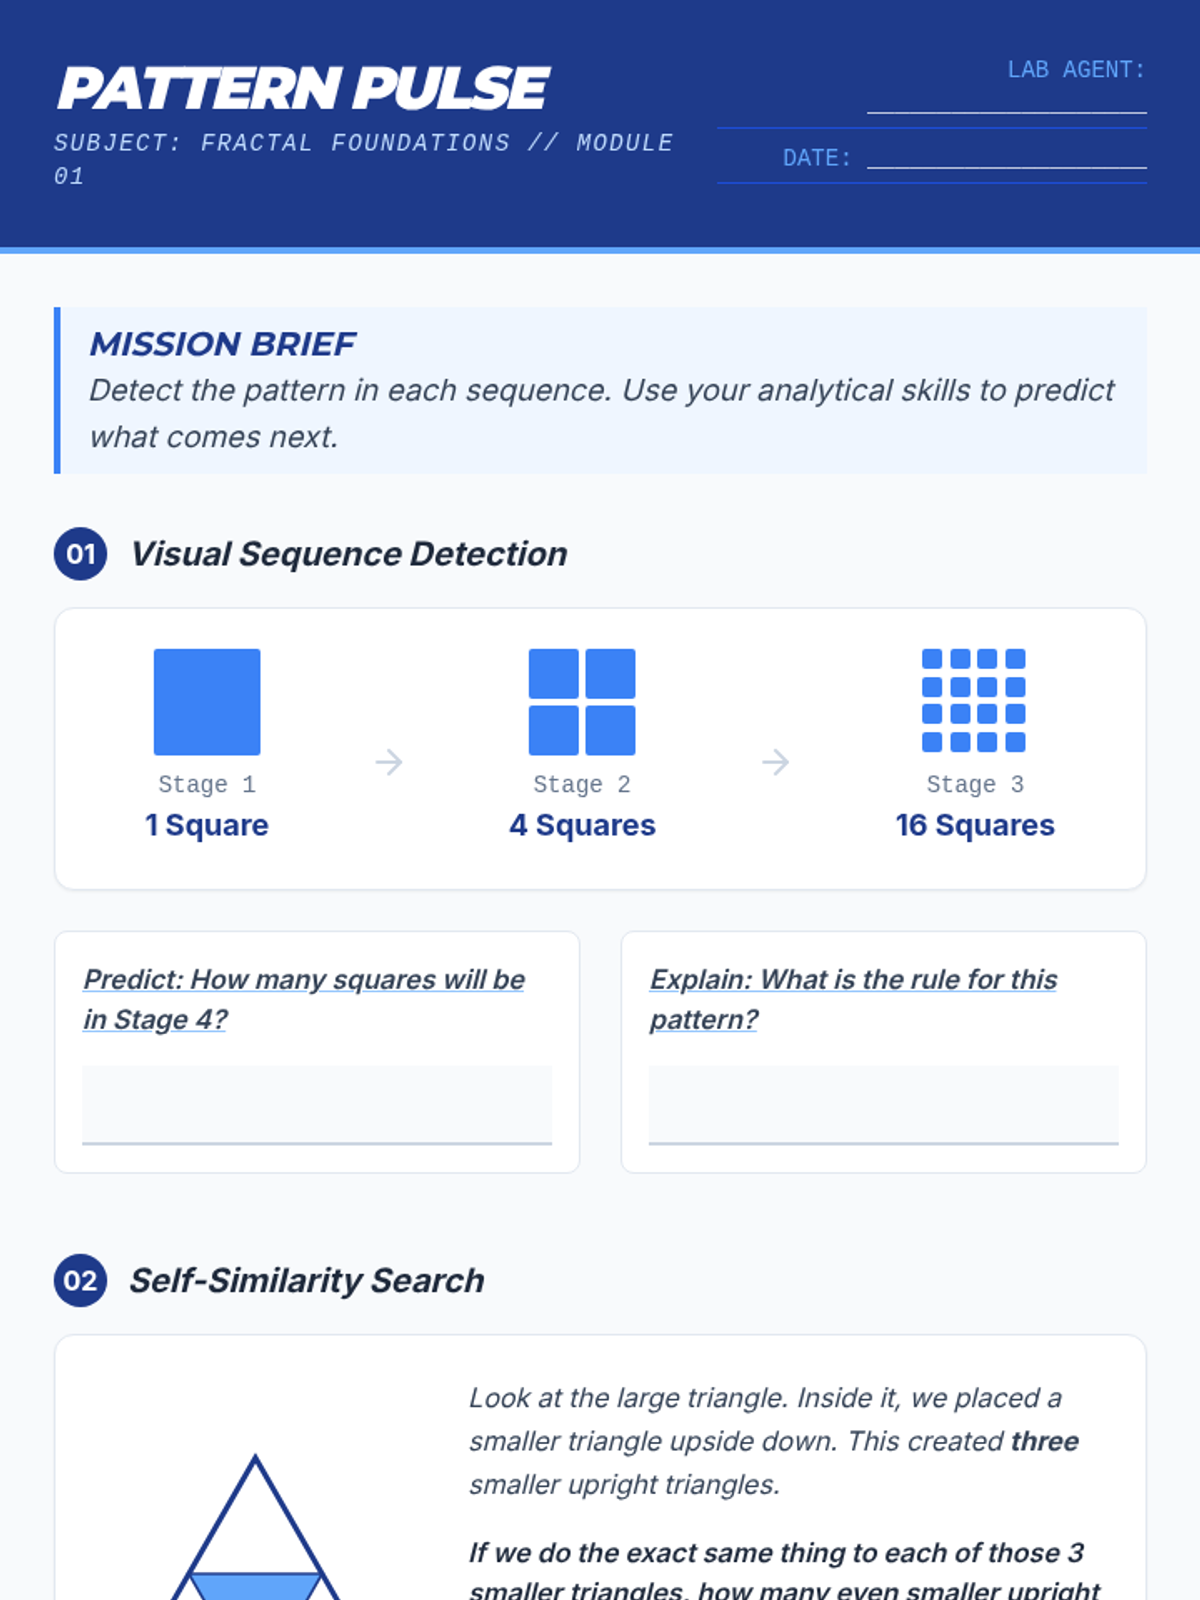
Explore the mesmerizing world of fractals where art meets mathematics. Students investigate recursive patterns, self-similarity, and the mind-bending paradox of infinite perimeters within finite spaces.
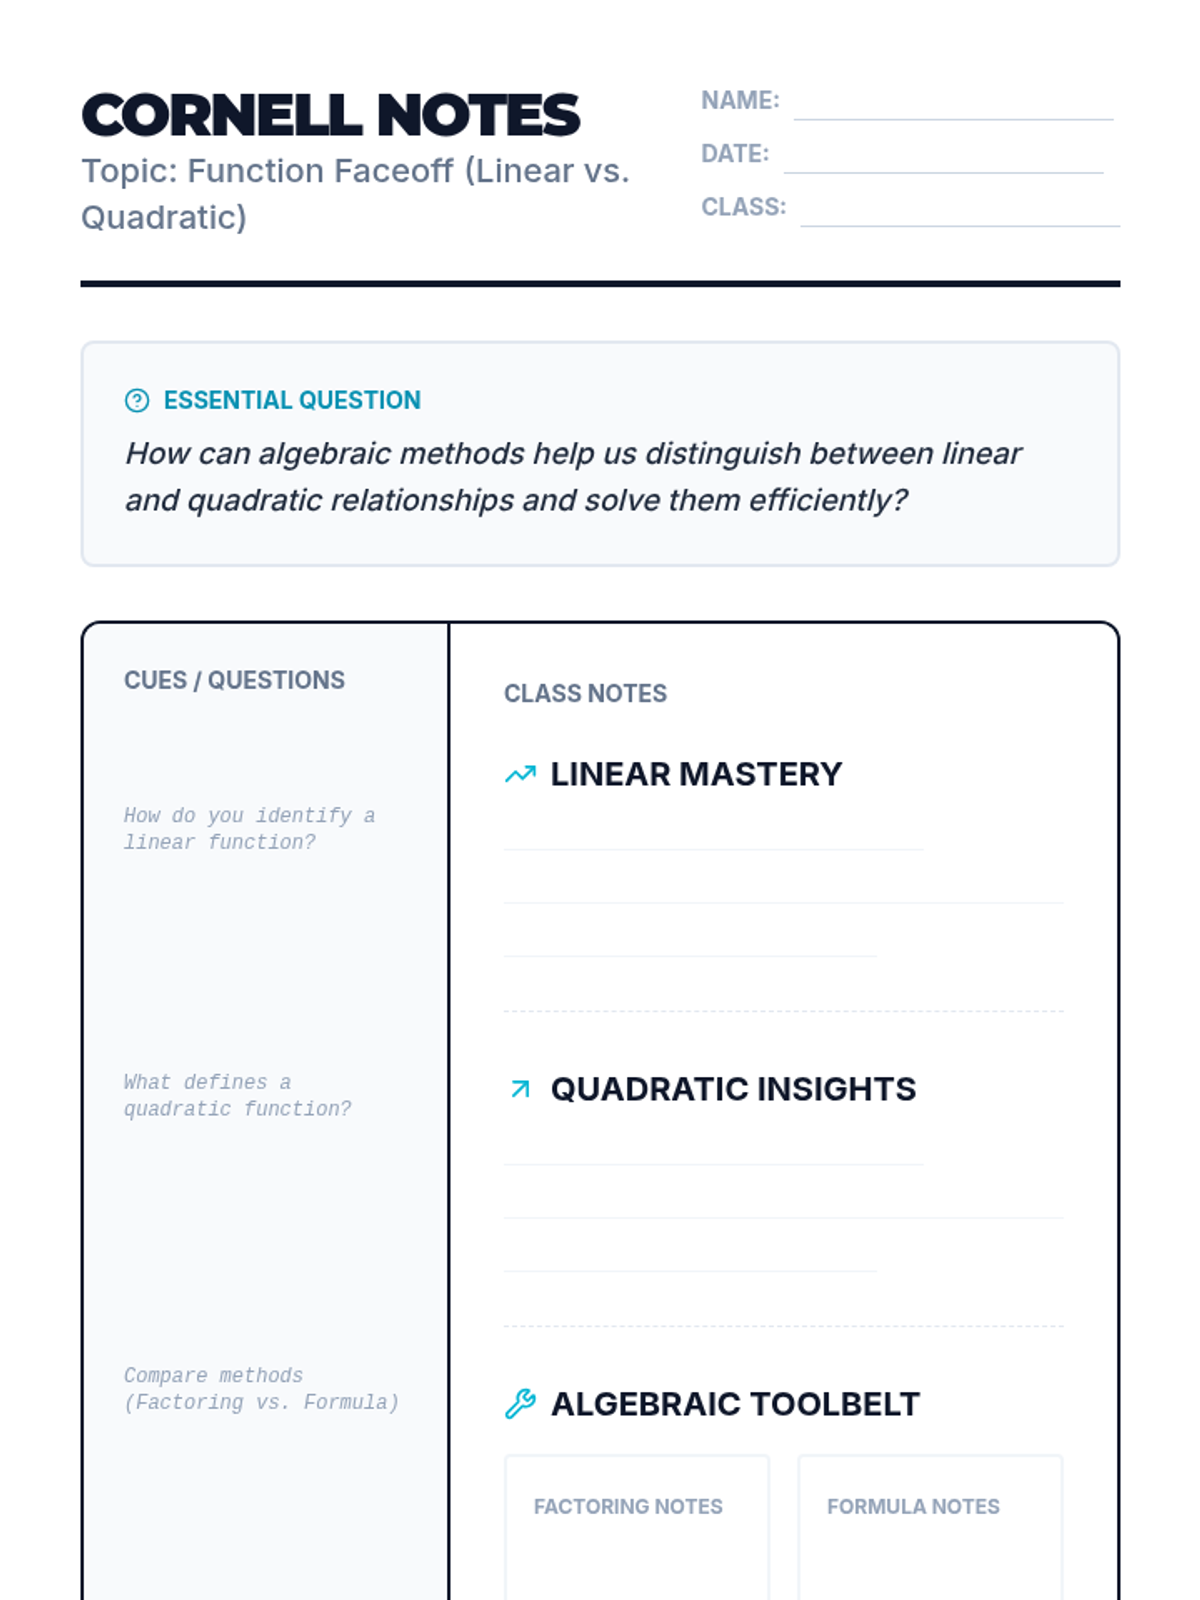
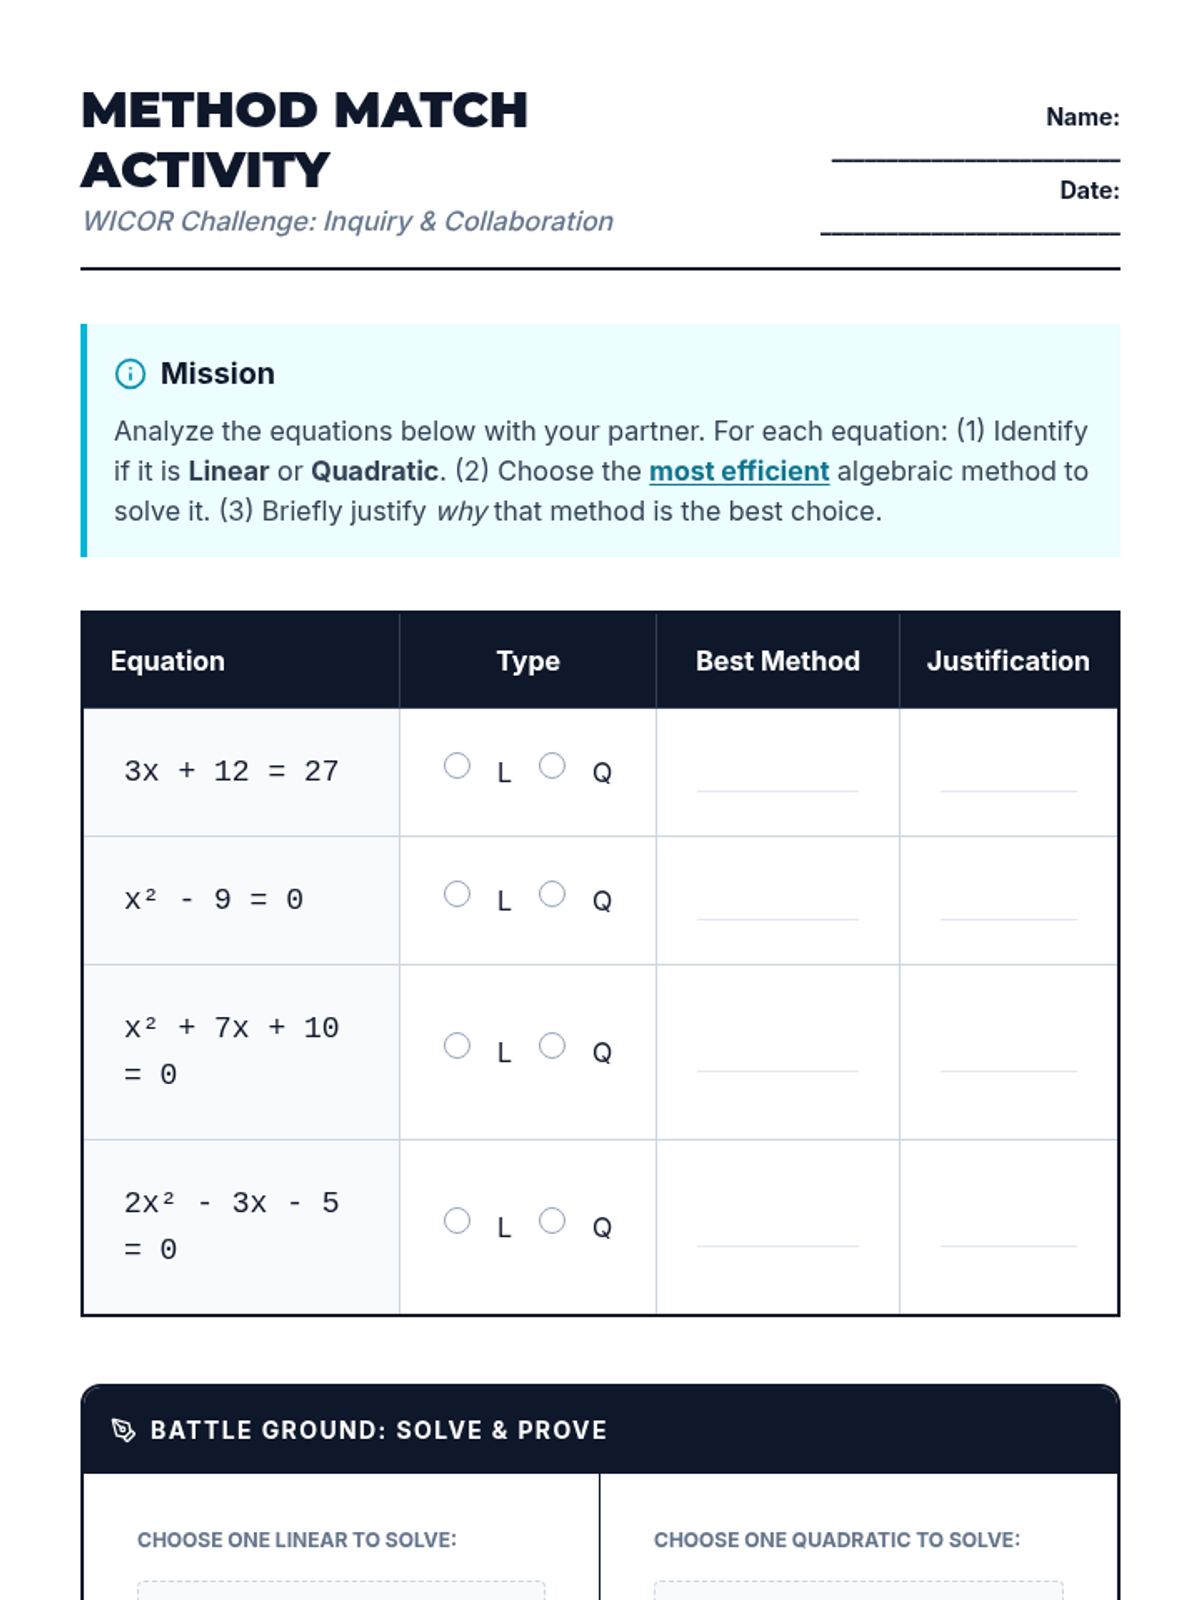
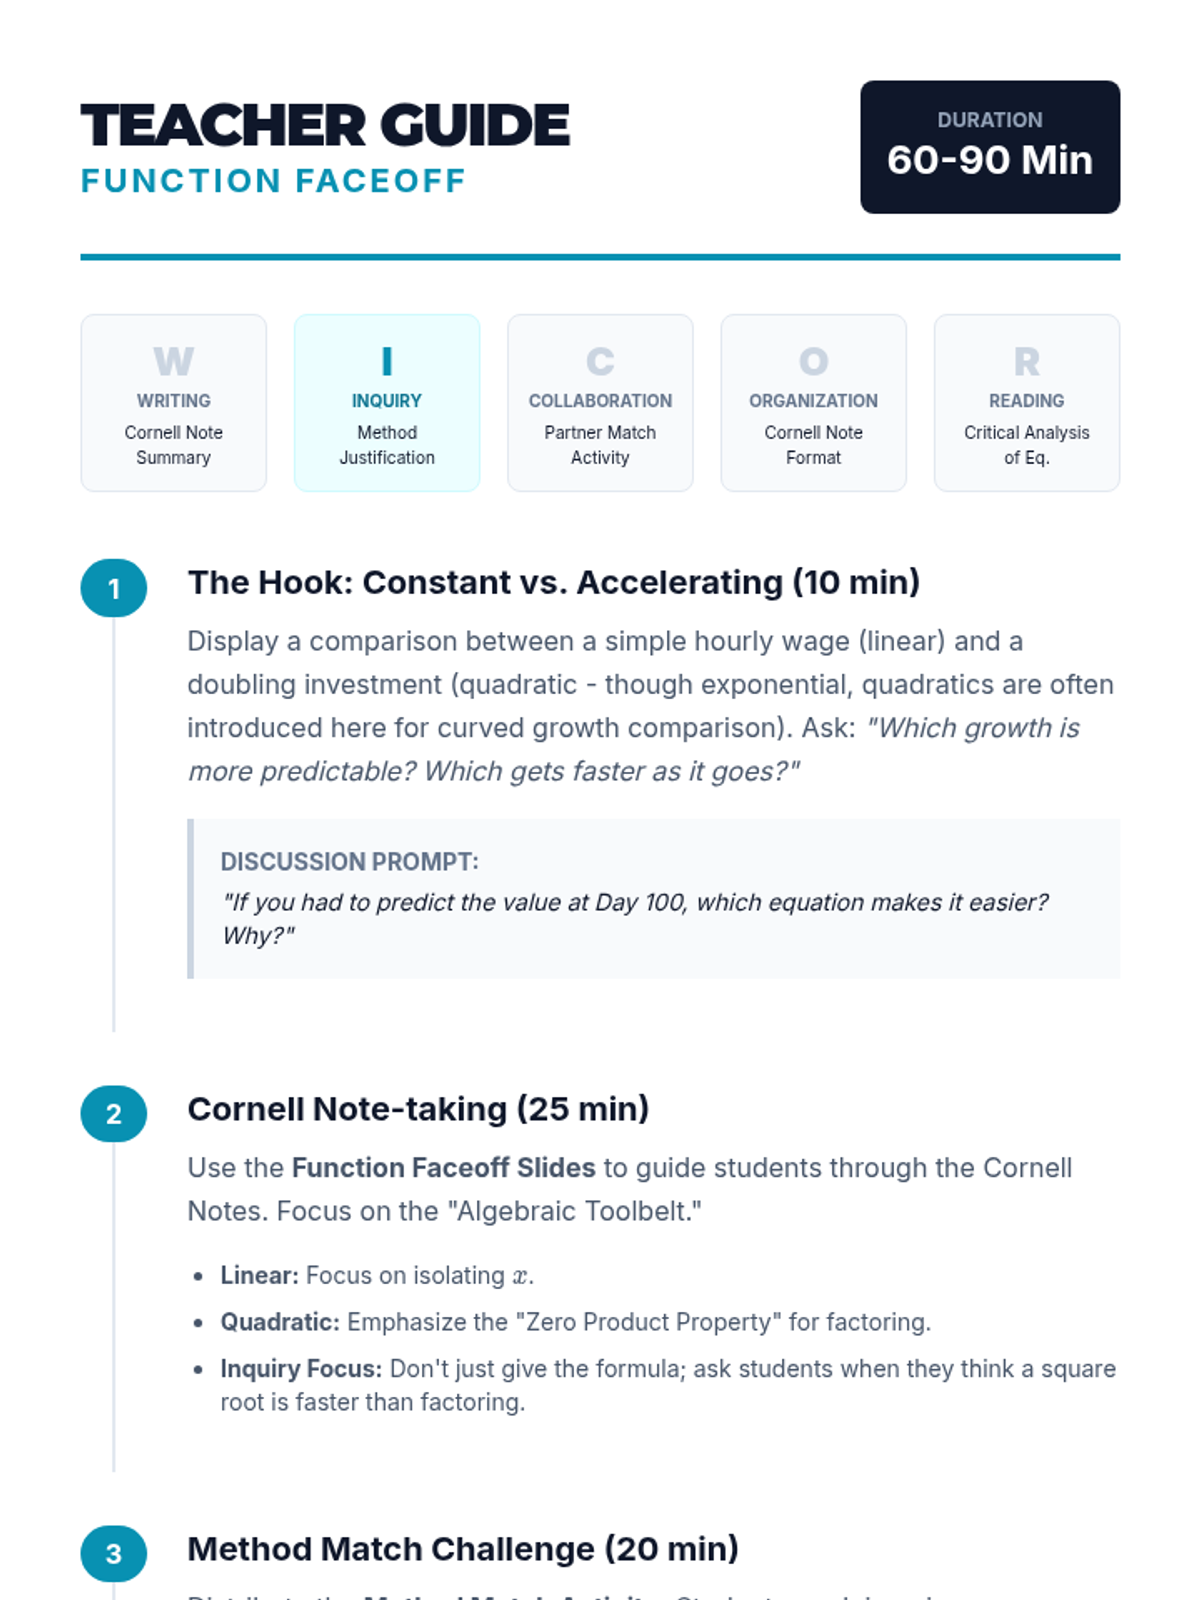
A comprehensive AVID-style lesson comparing linear and quadratic functions through inquiry-based algebraic methods and Cornell Note-taking.
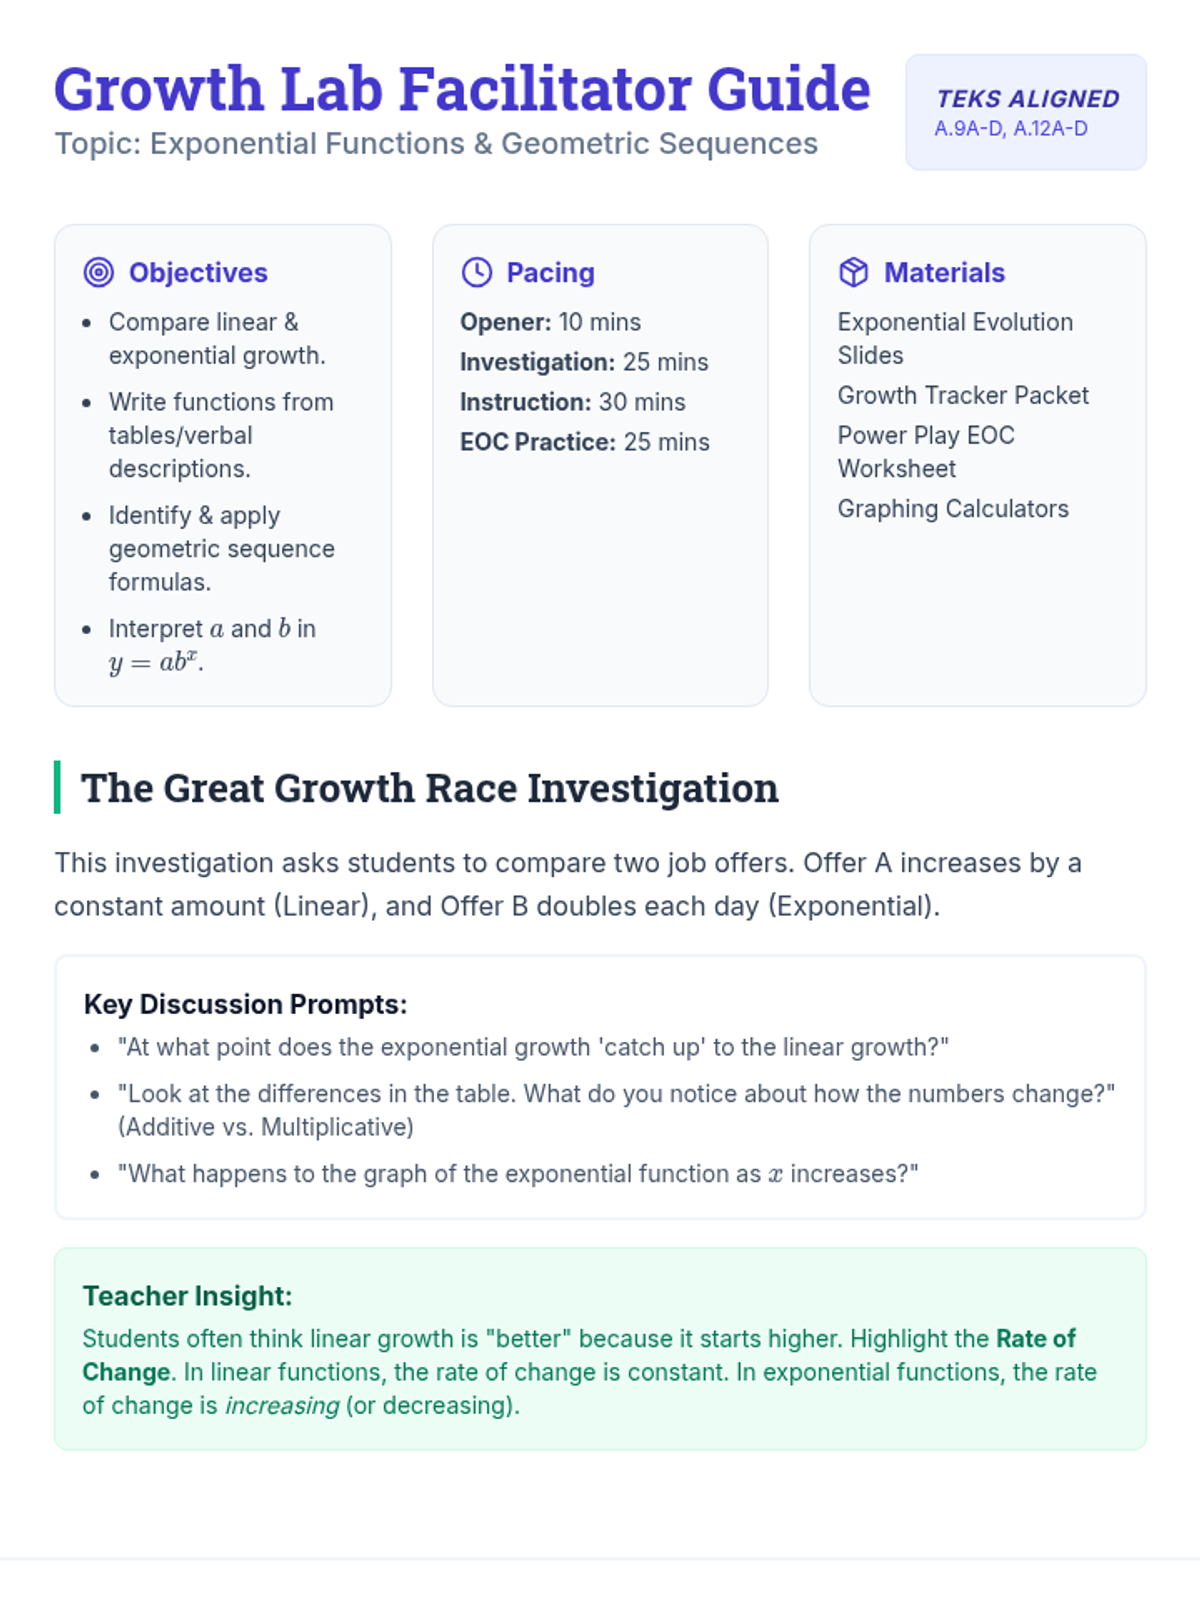
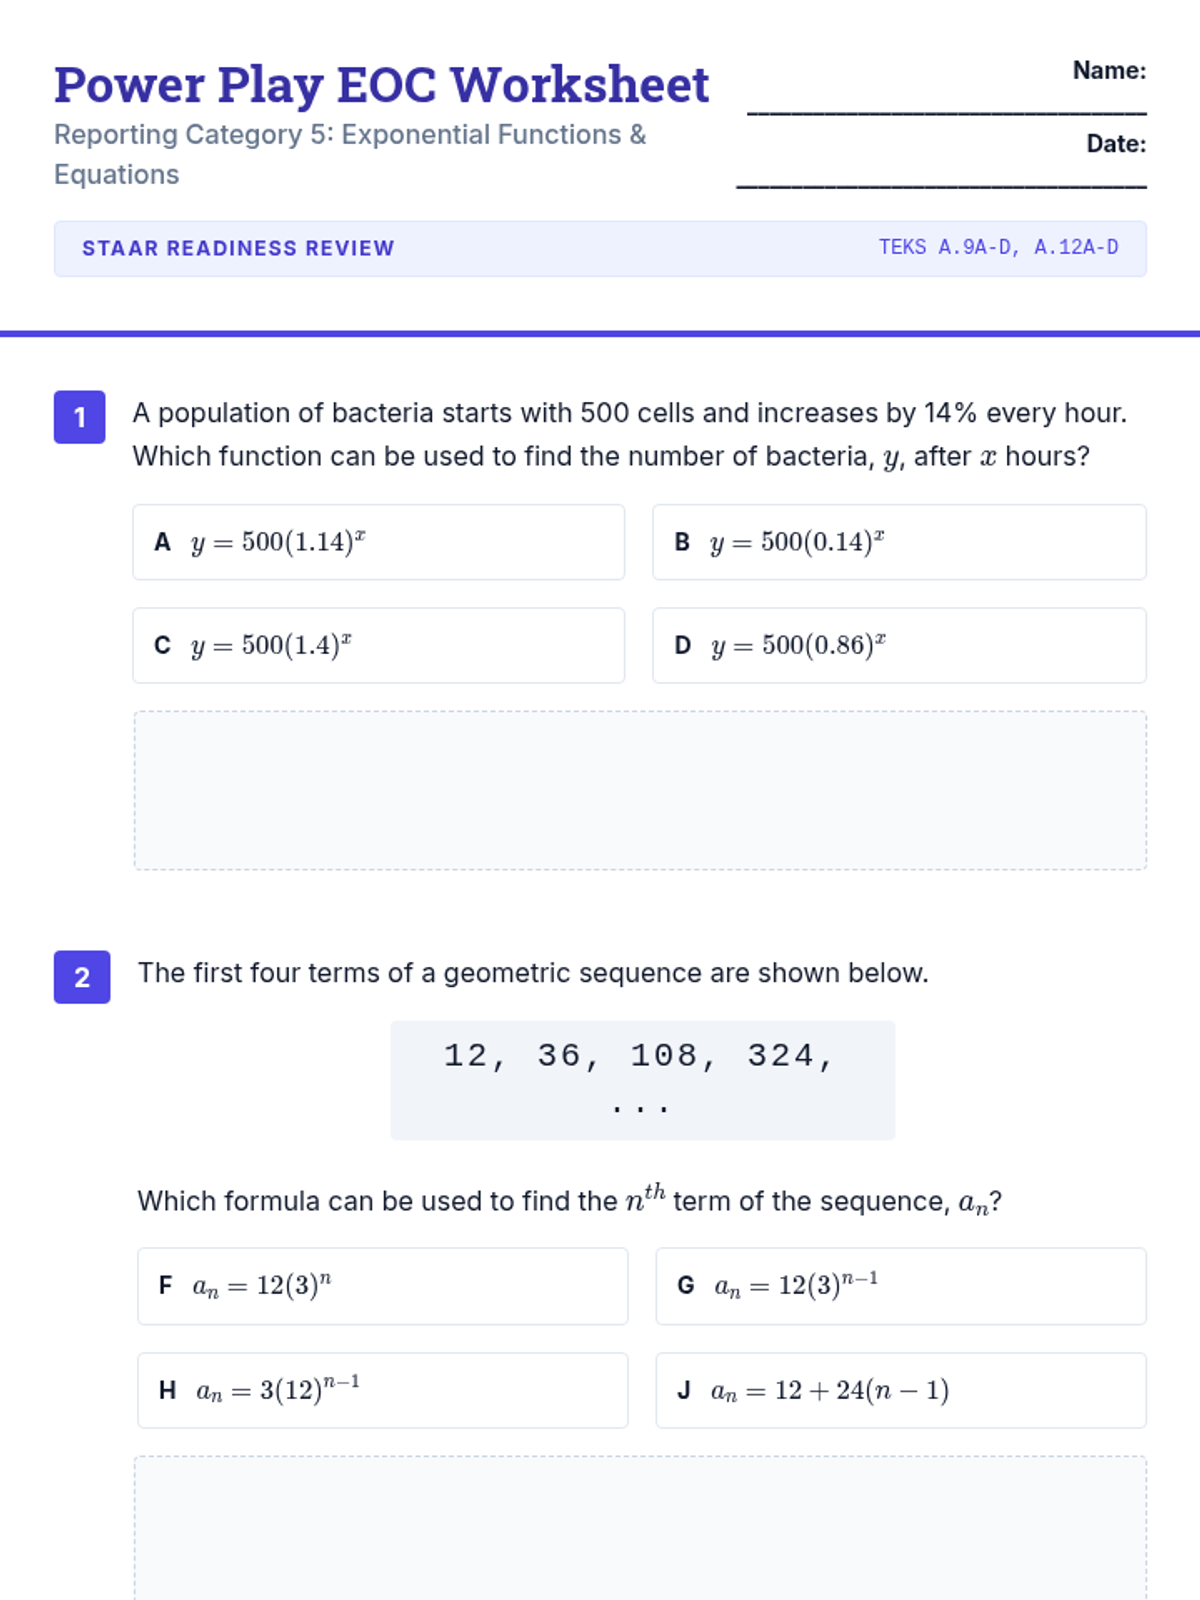
A comprehensive lesson on exponential functions and geometric sequences, covering TEKS A.9A-D and A.12A-D, with a focus on STAAR EOC preparation. Students investigate linear vs. exponential growth, model real-world scenarios, and master sequence formulas.
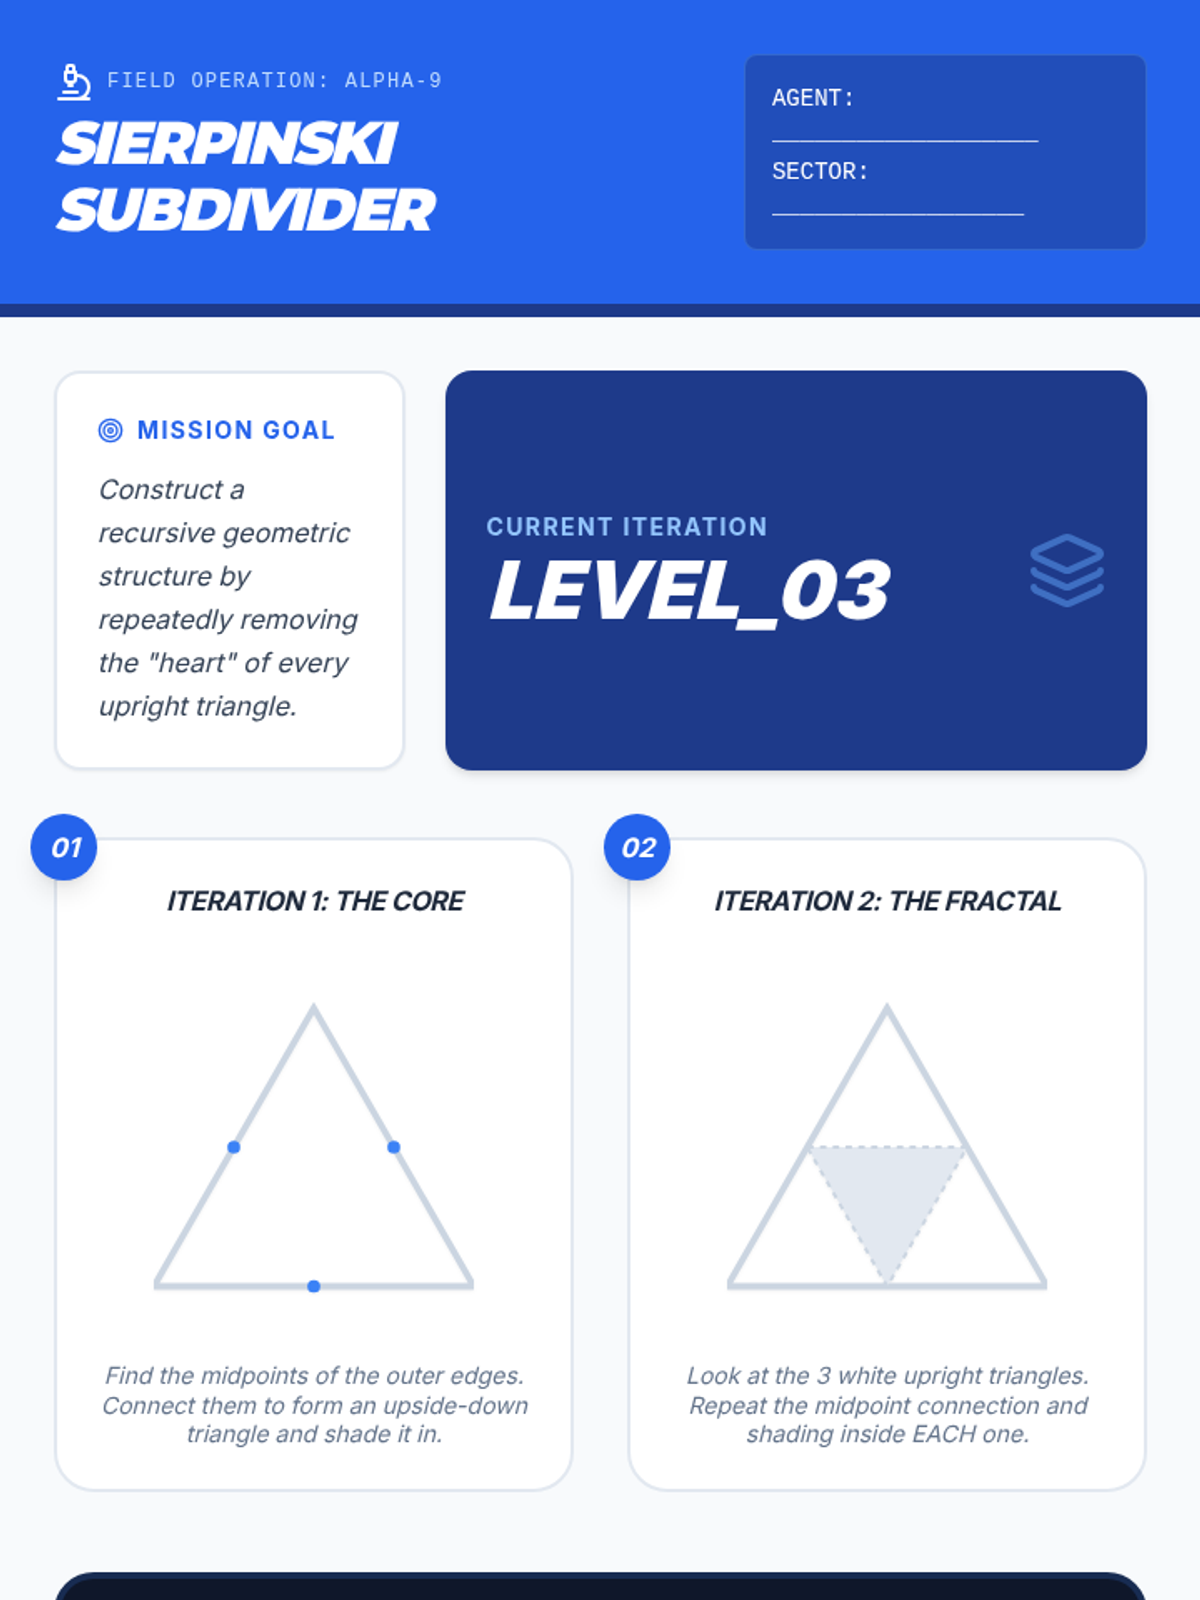
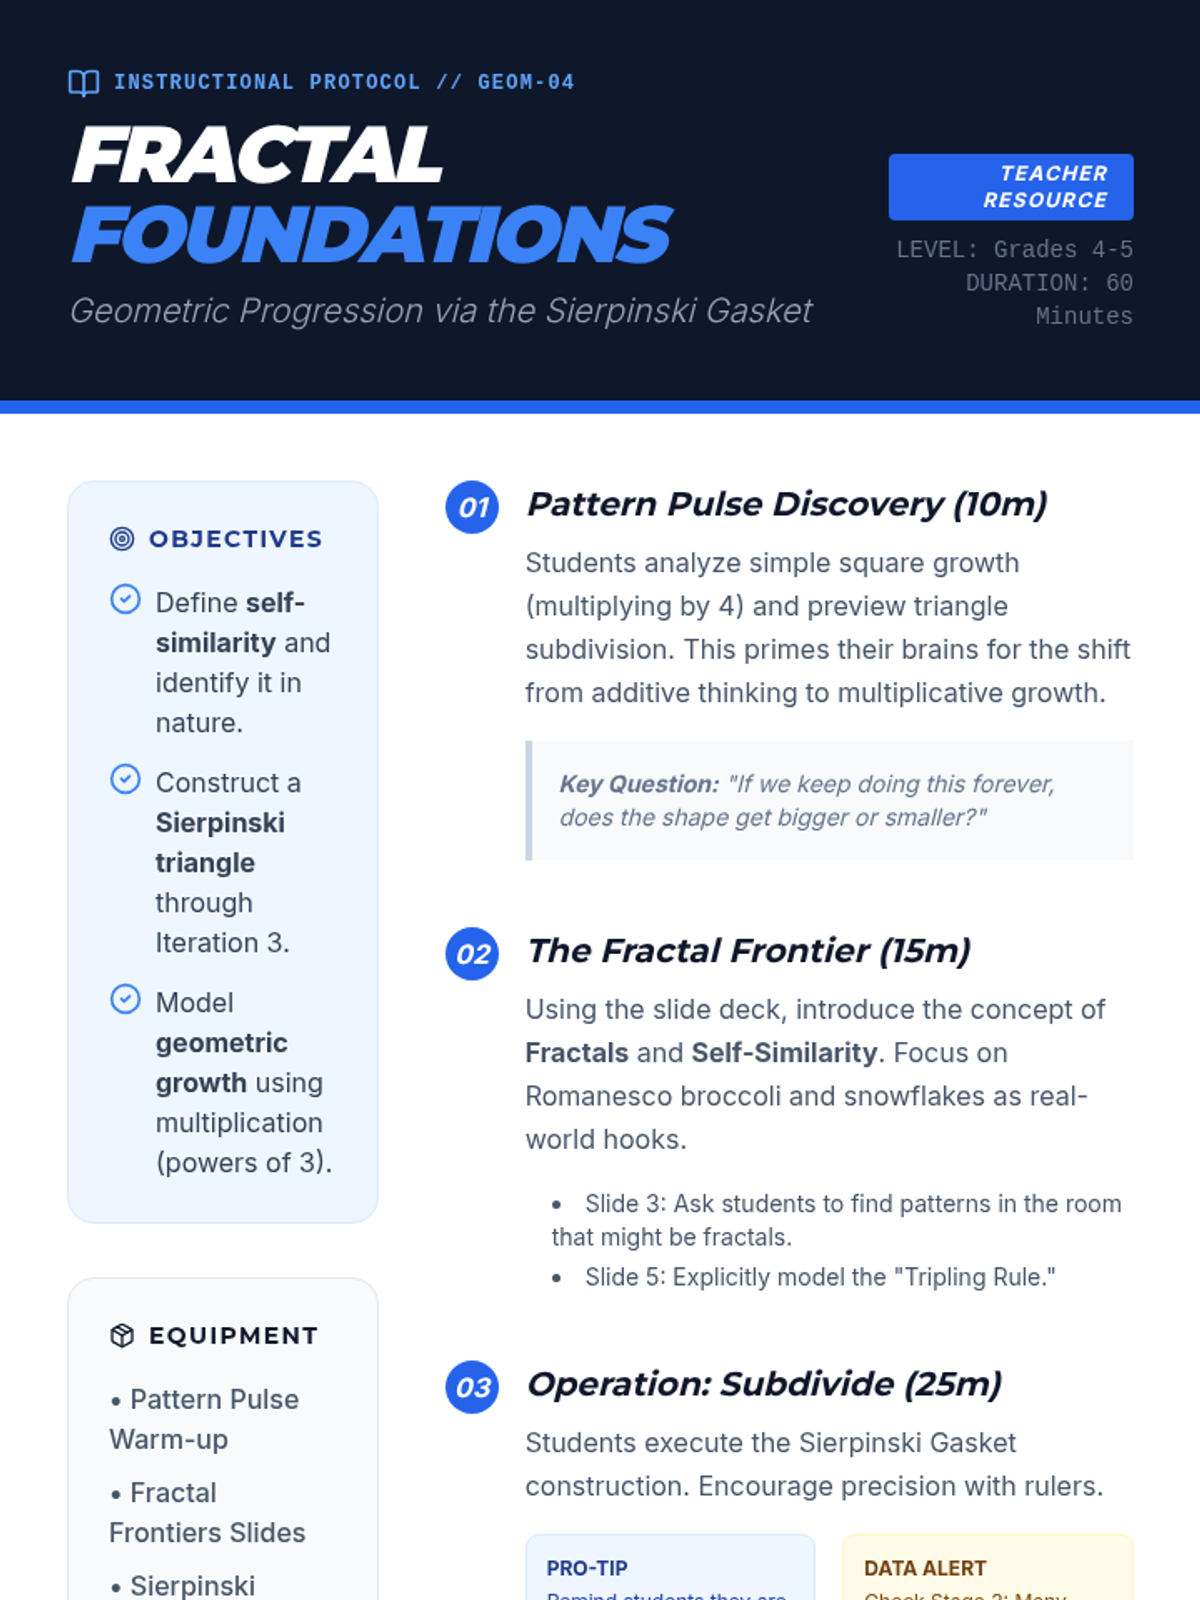
A high-engagement geometry lesson exploring self-similarity and patterns through the construction of Sierpinski triangles, bridging simple multiplication and geometric progression.
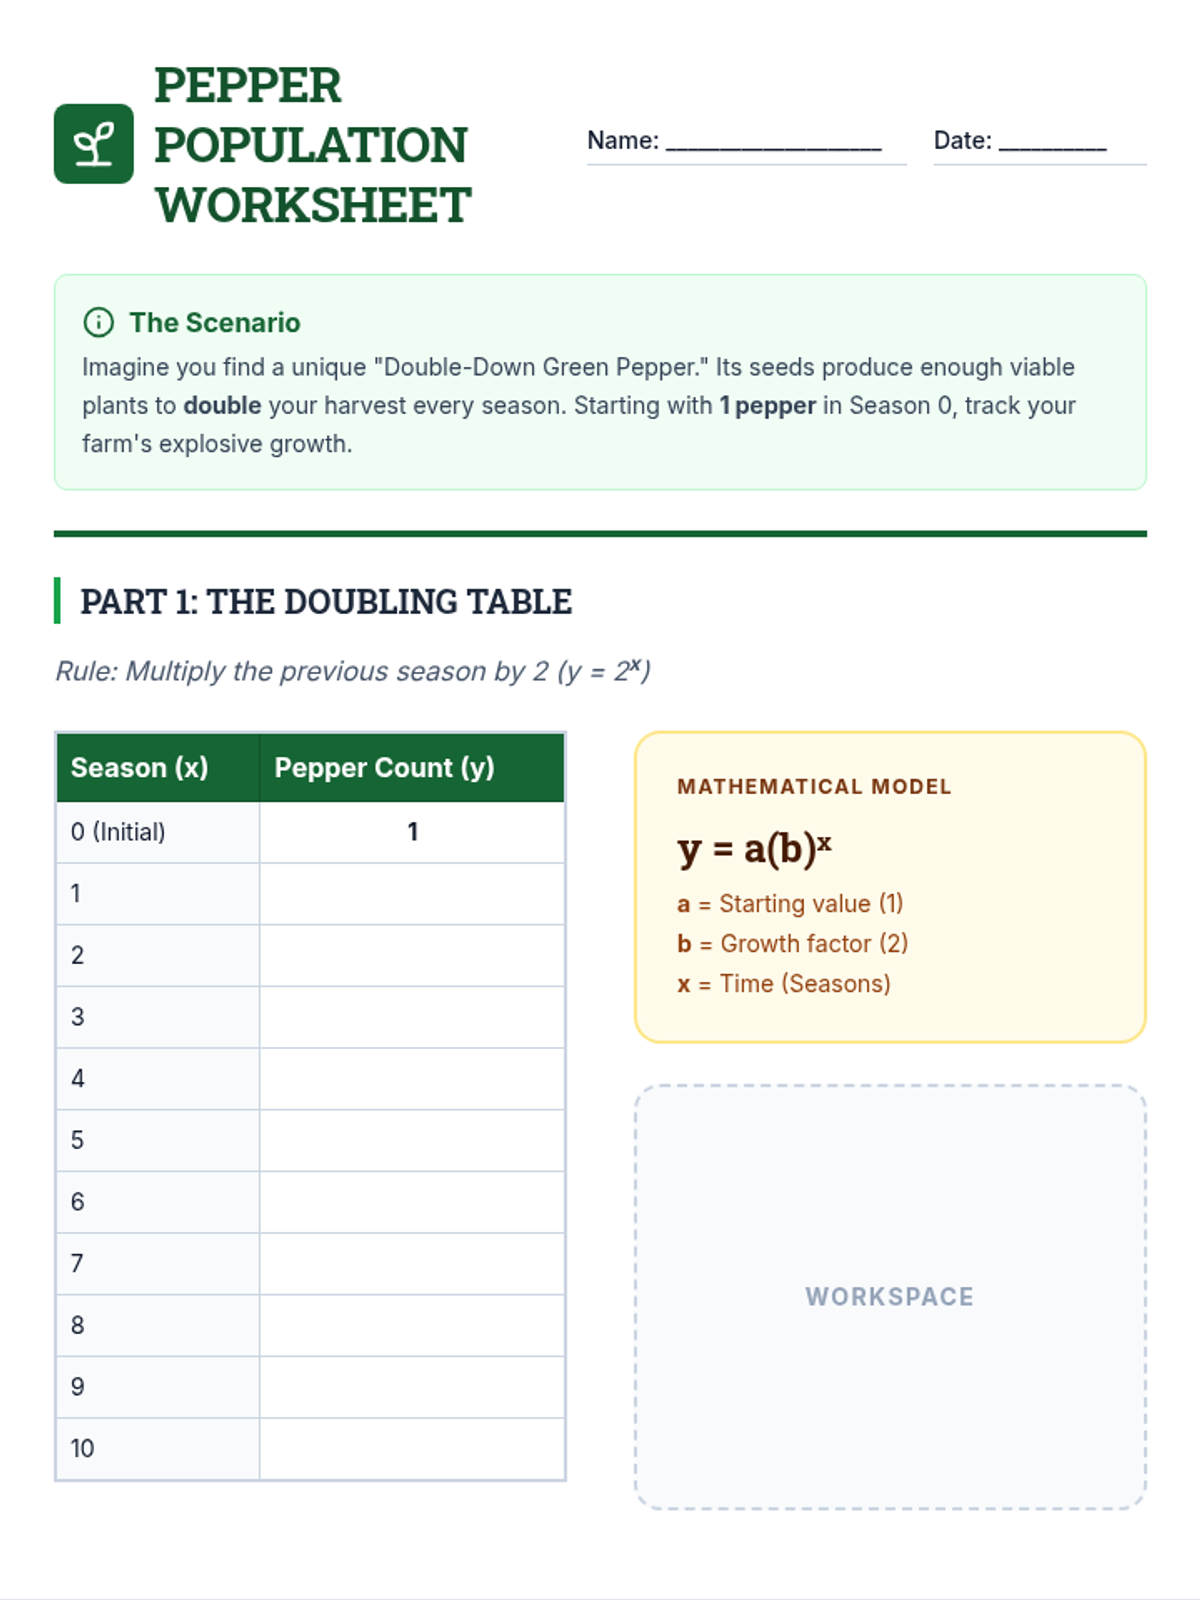
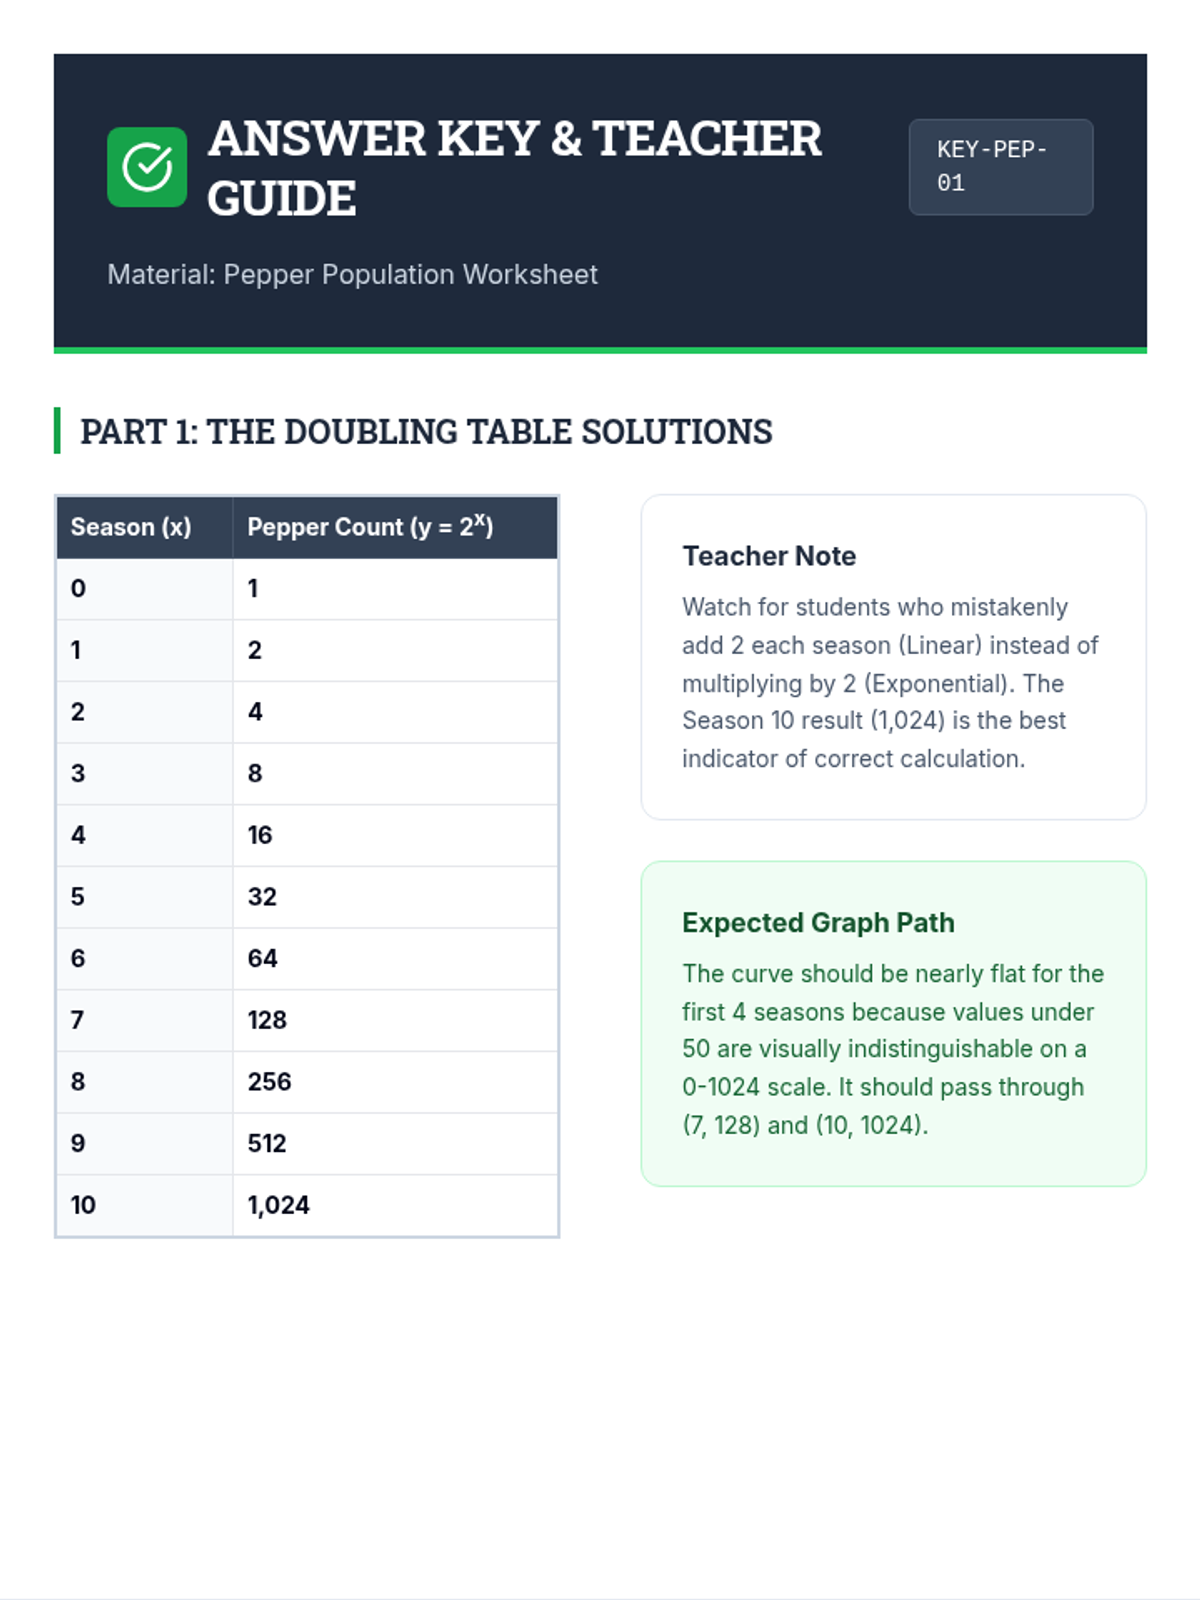
Students will model the exponential growth of a pepper population, starting from one pepper and doubling every season, to understand the power of geometric growth.
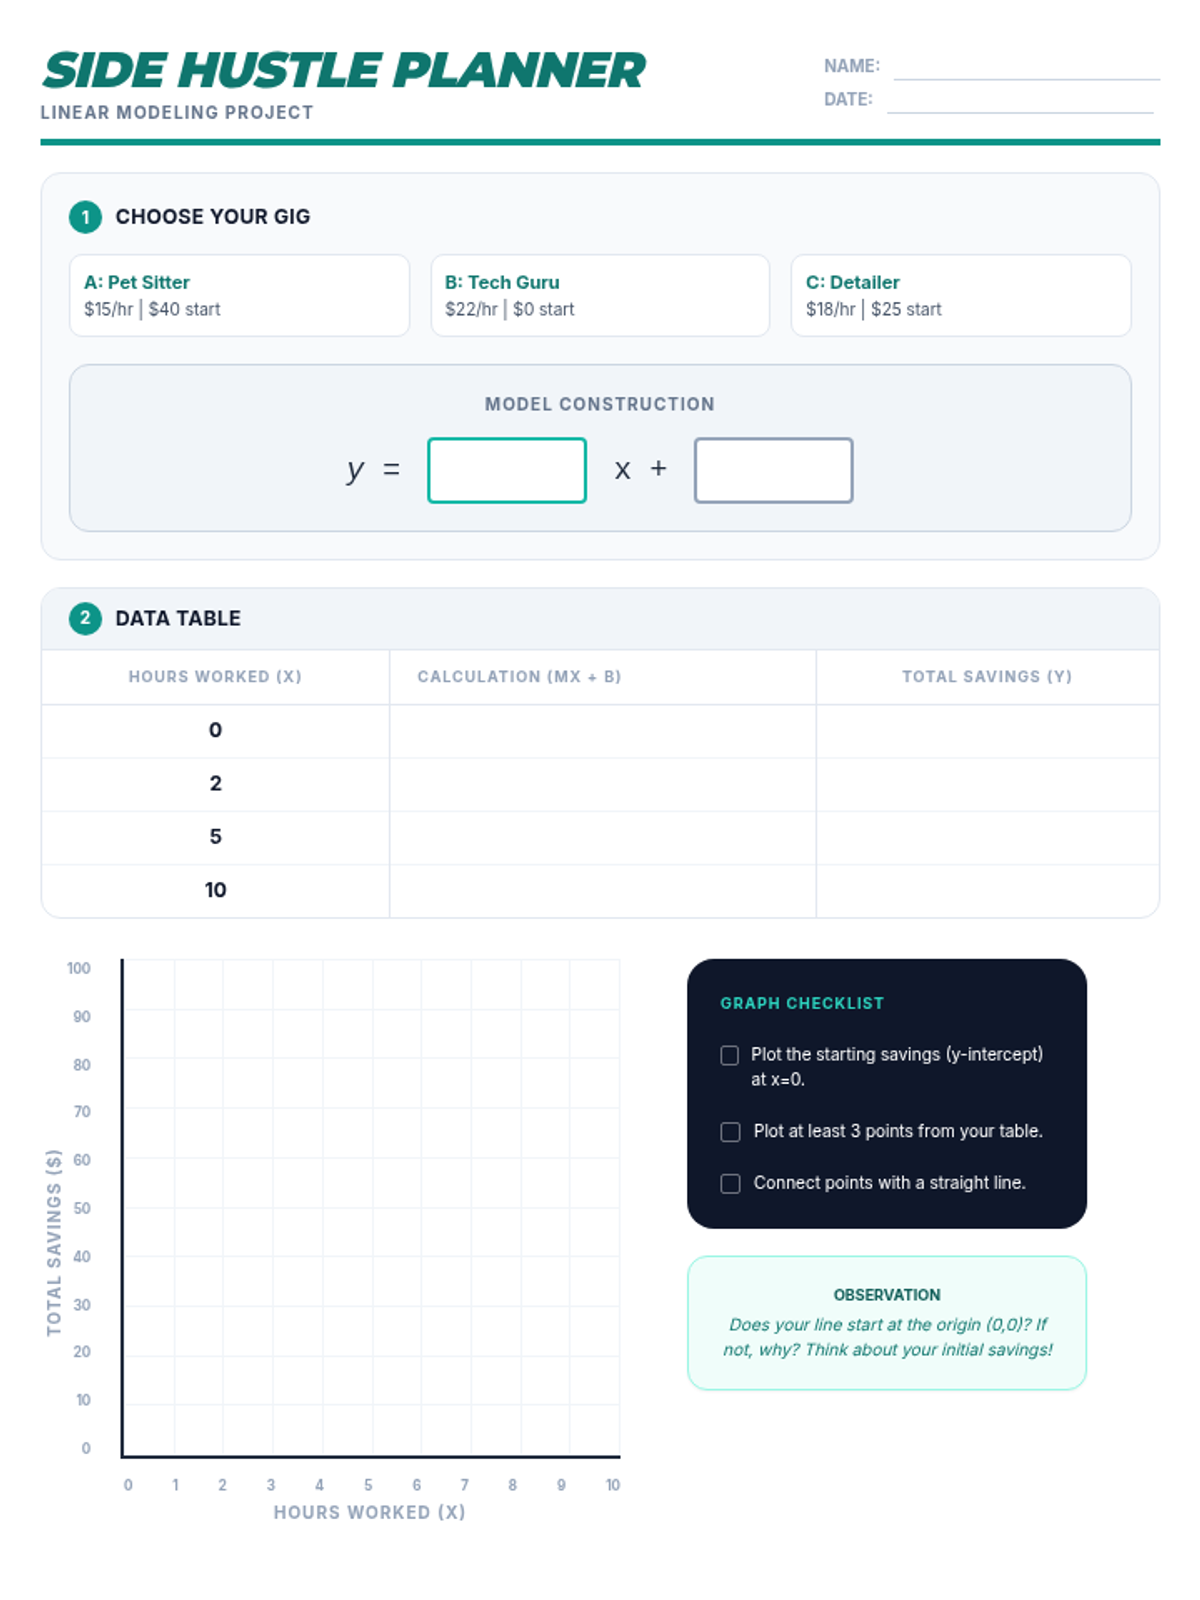
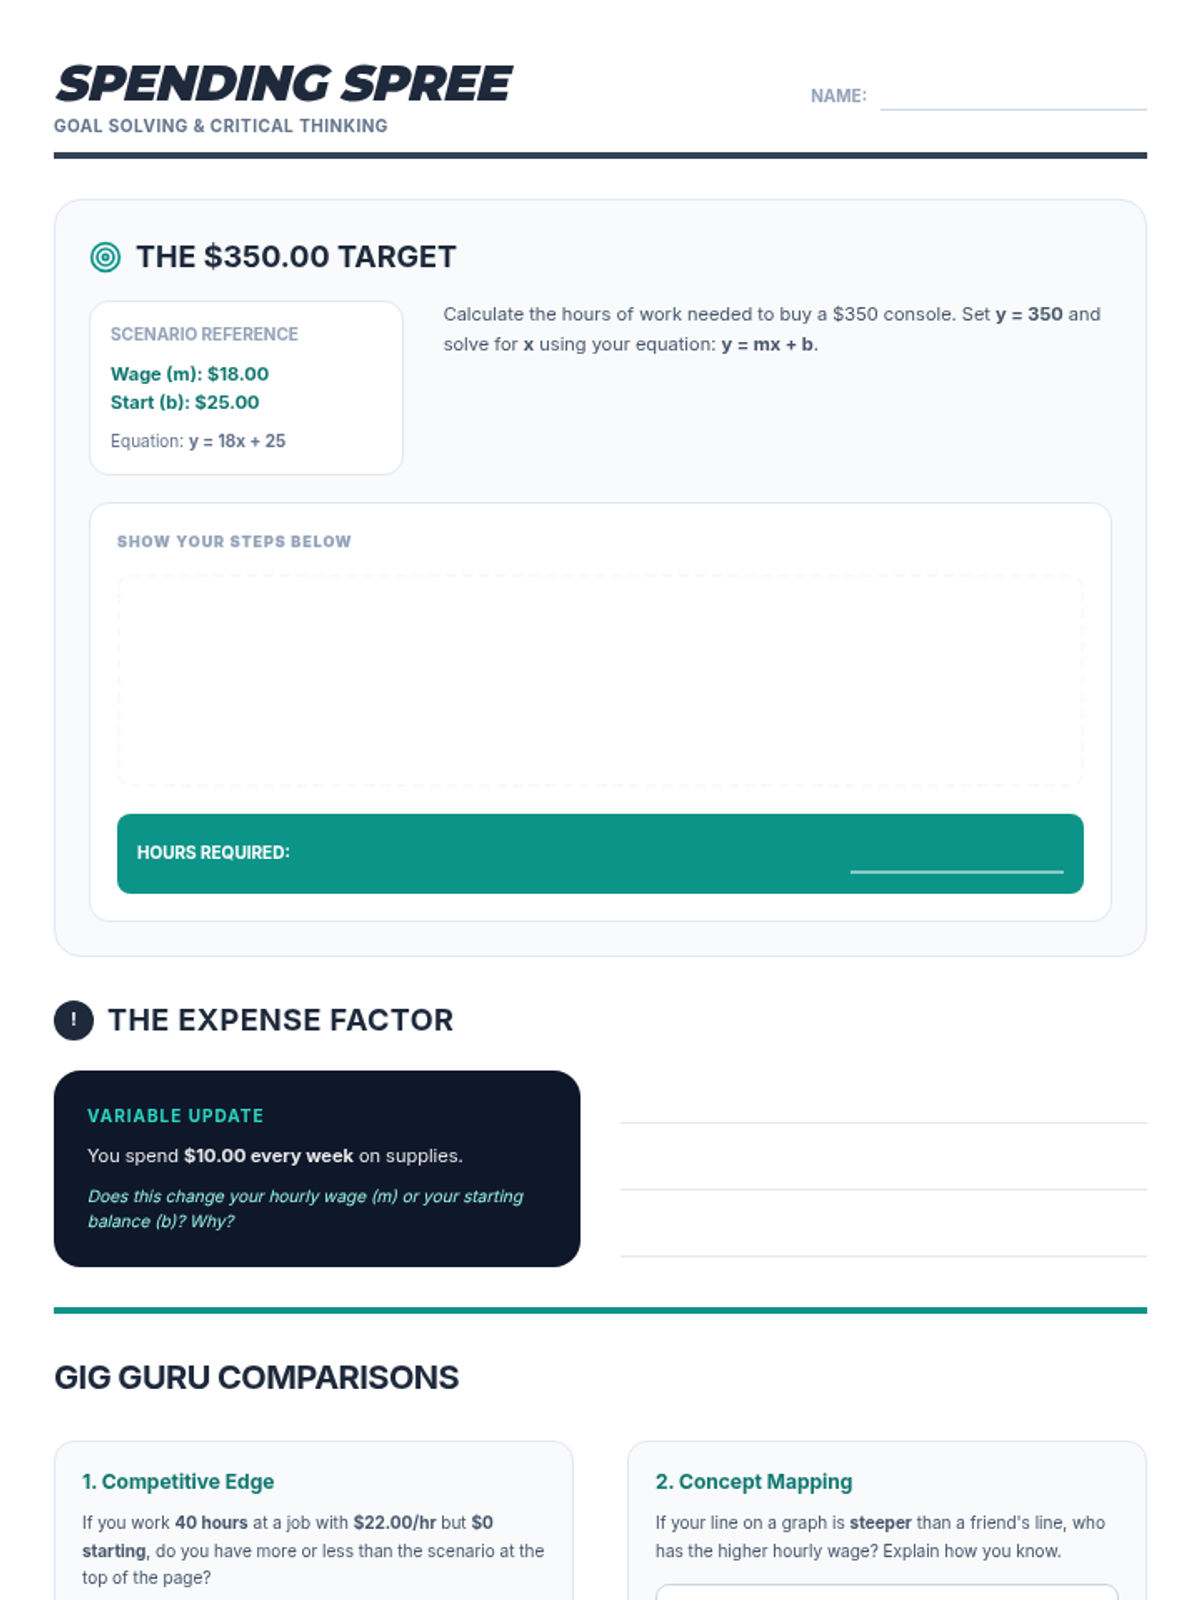
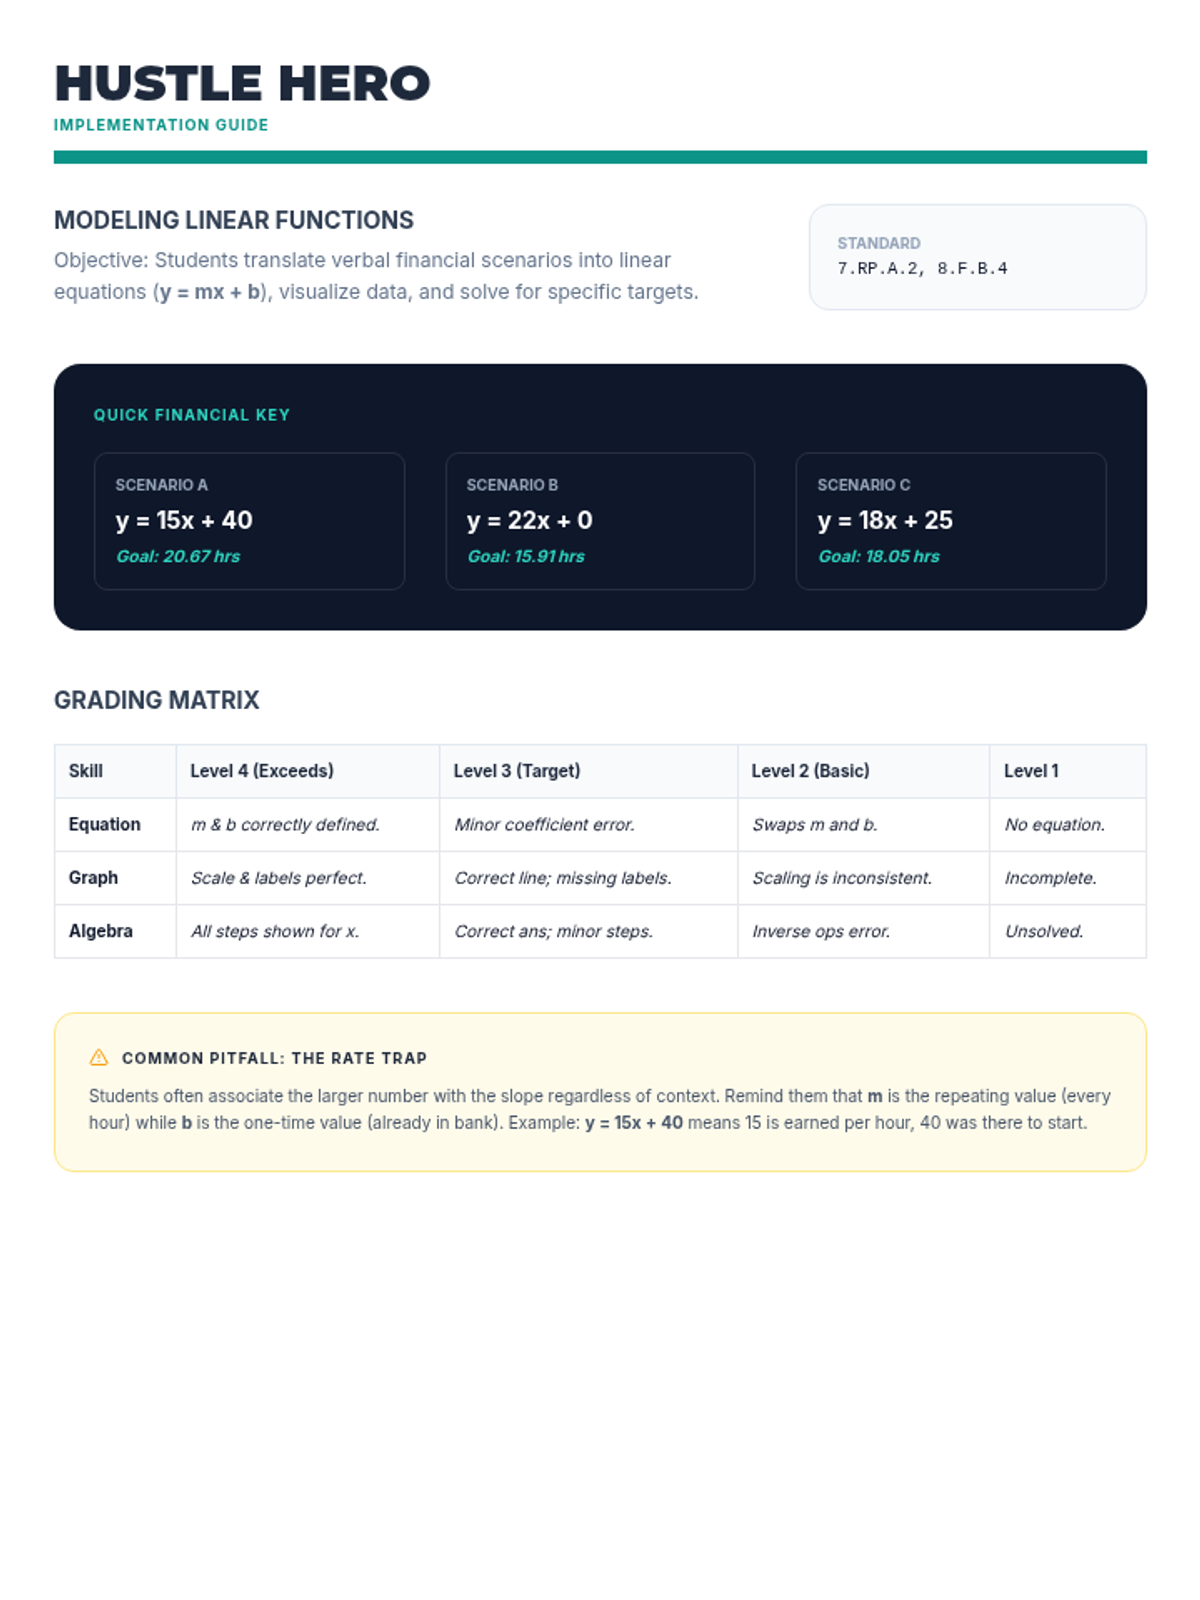
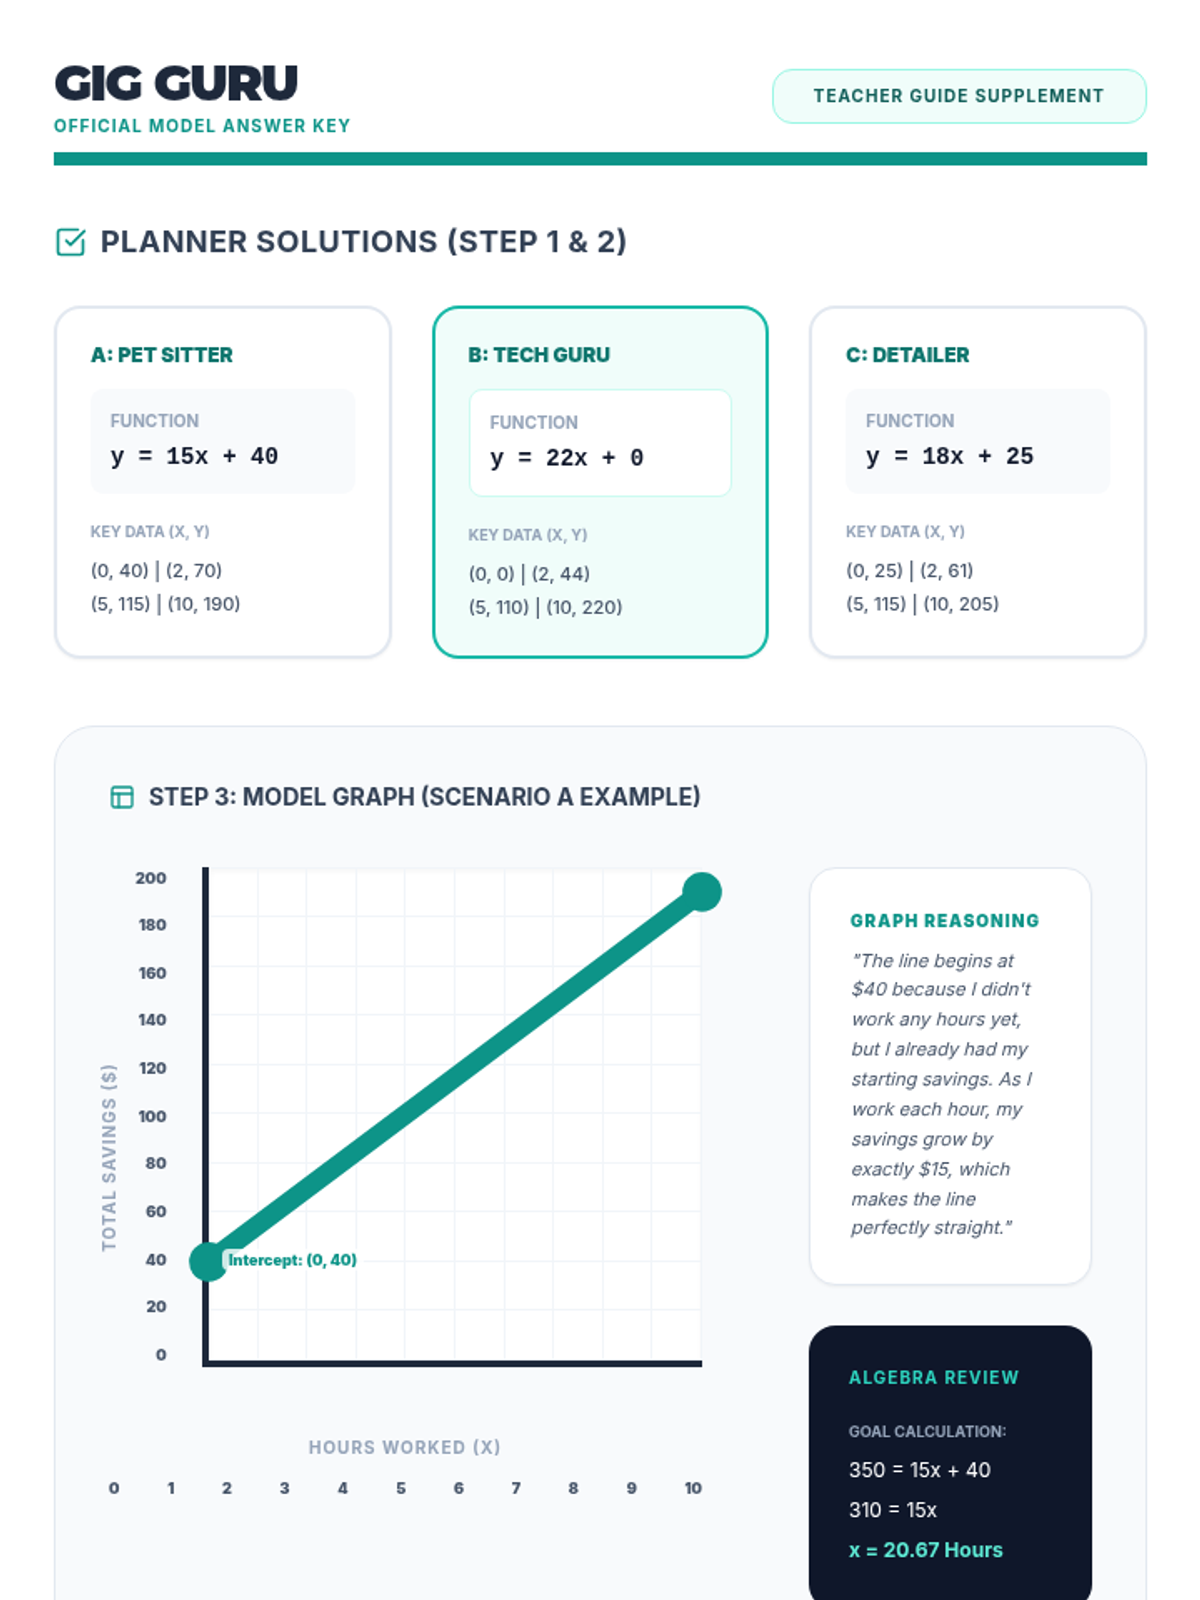
Students apply linear function concepts to model a real-world income and expense scenario. They will calculate rates of change, identify initial values, and visualize their budget through graphing.
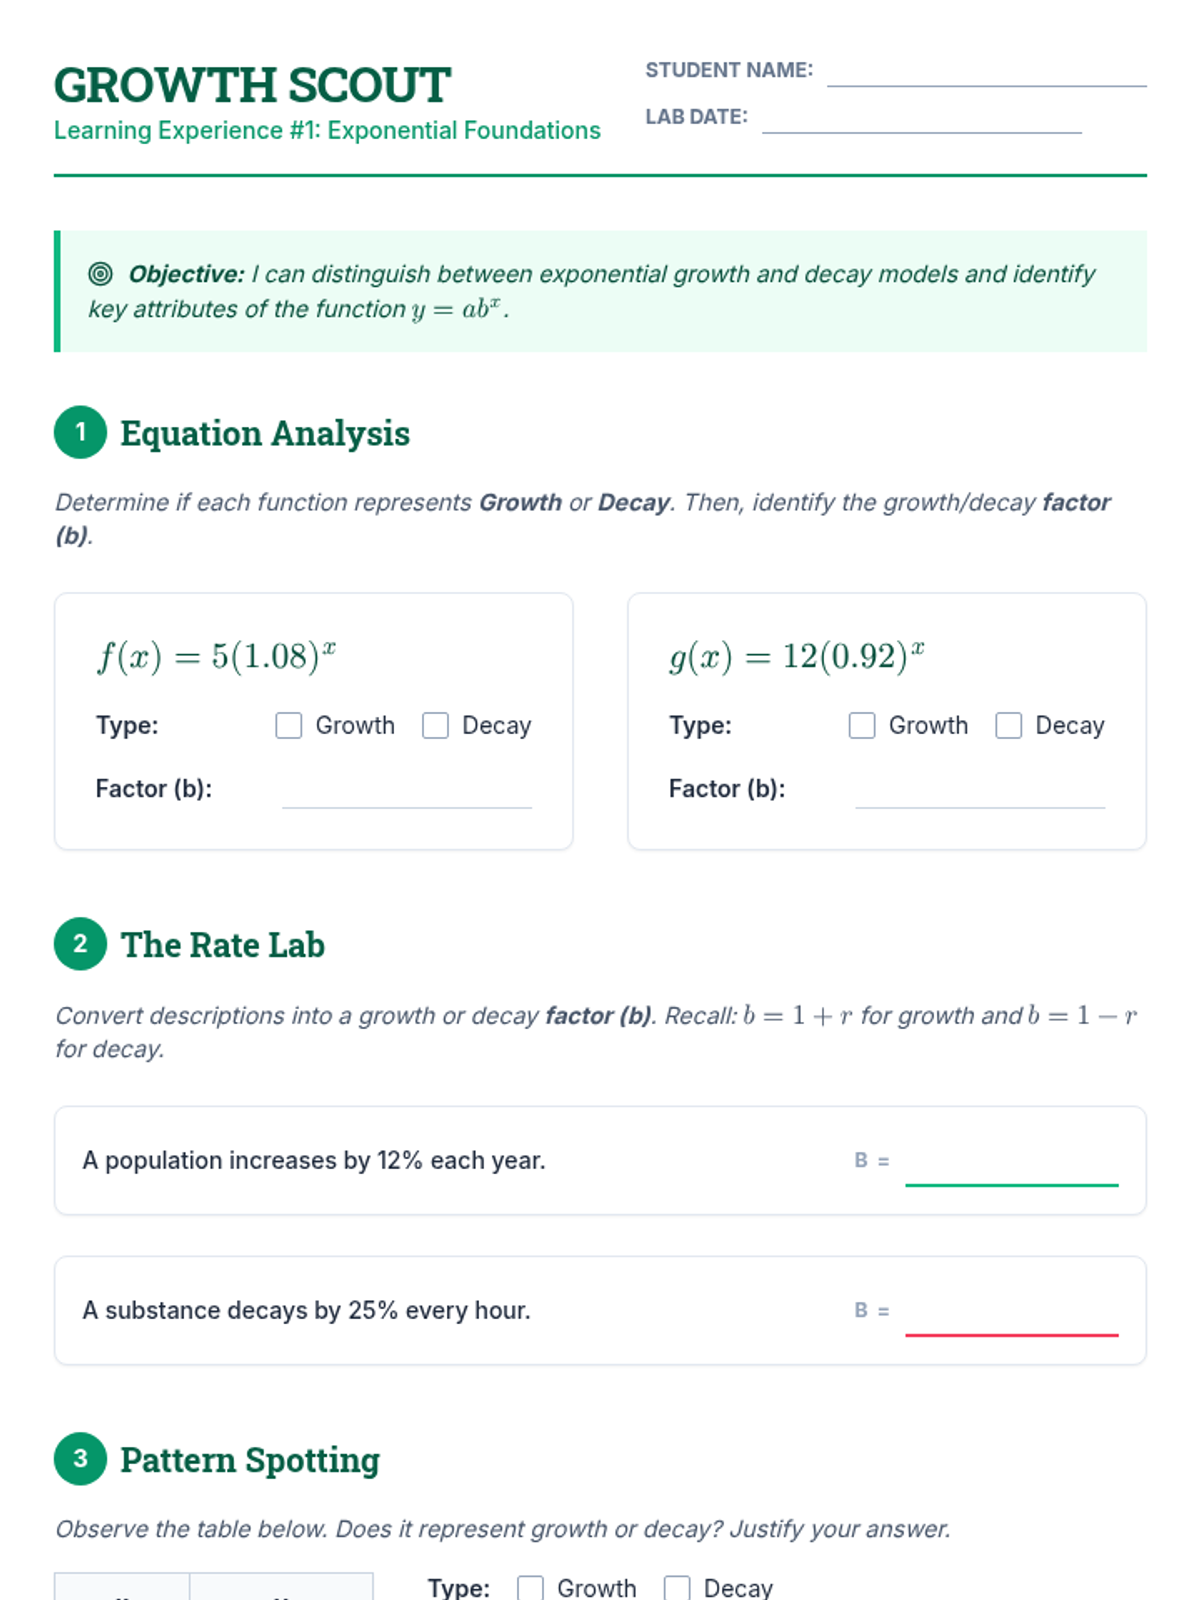
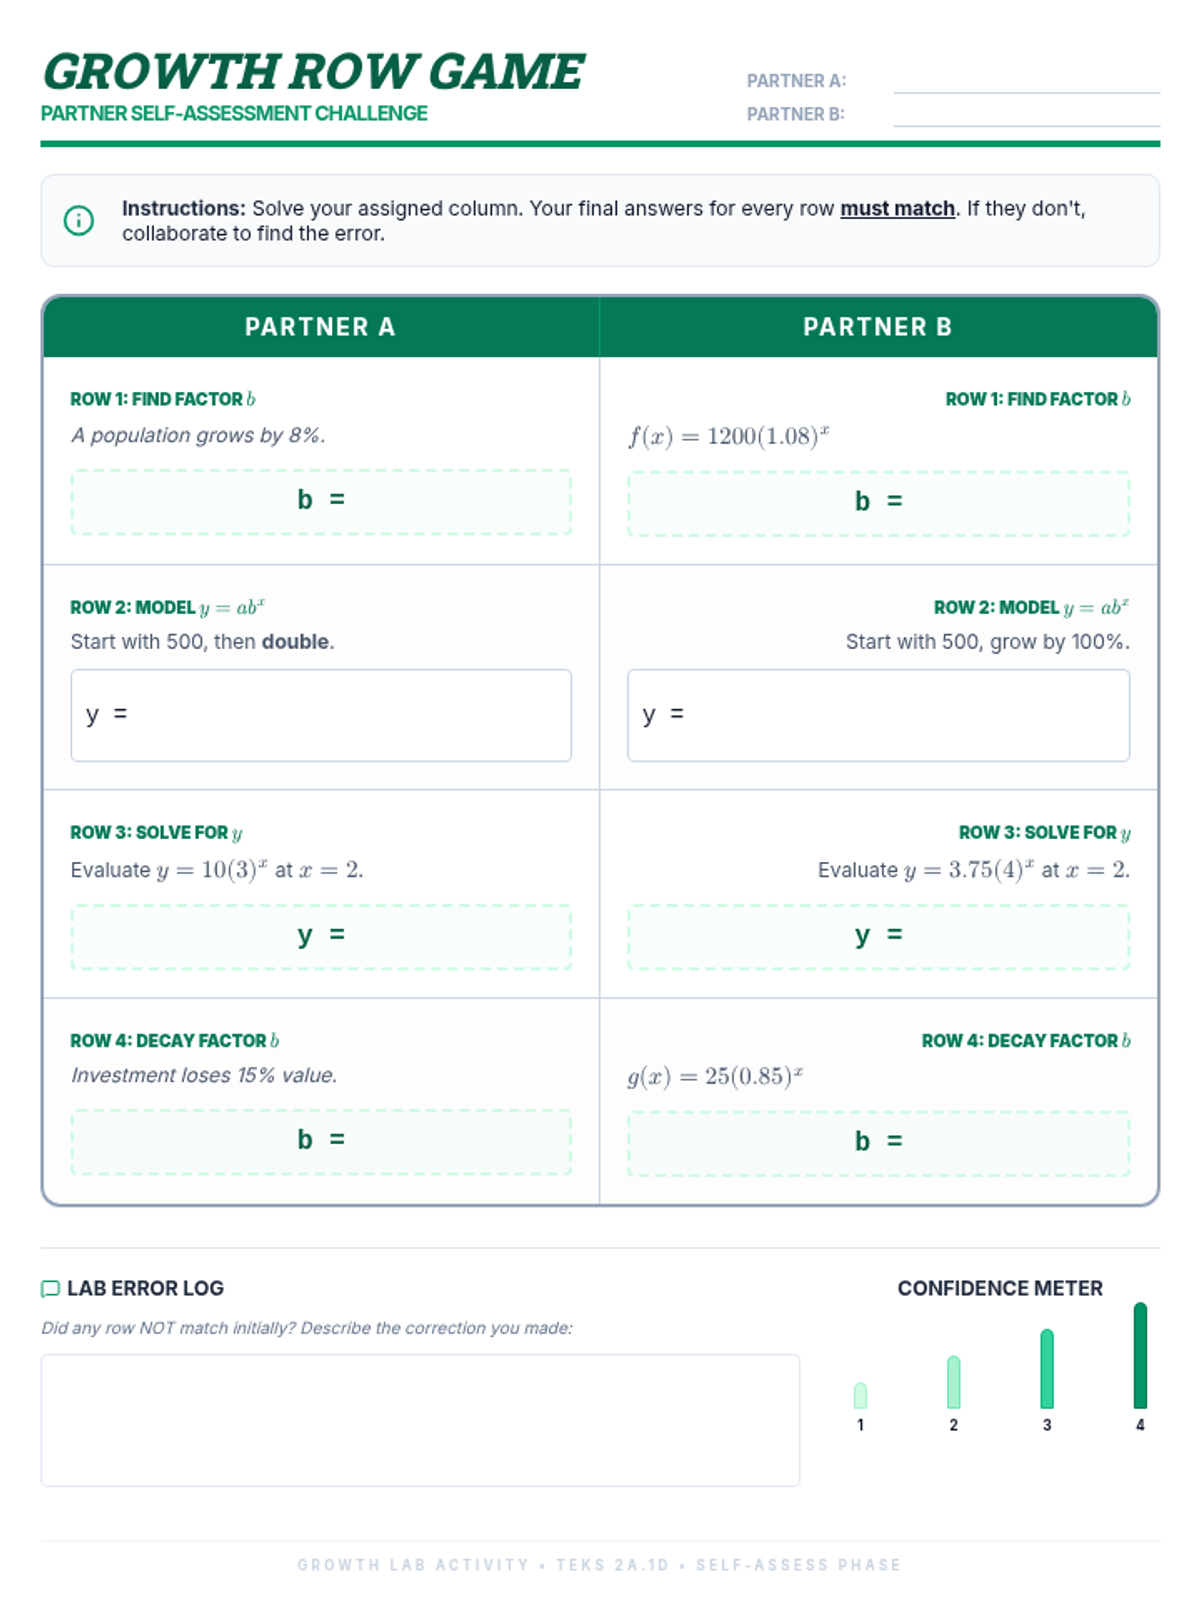
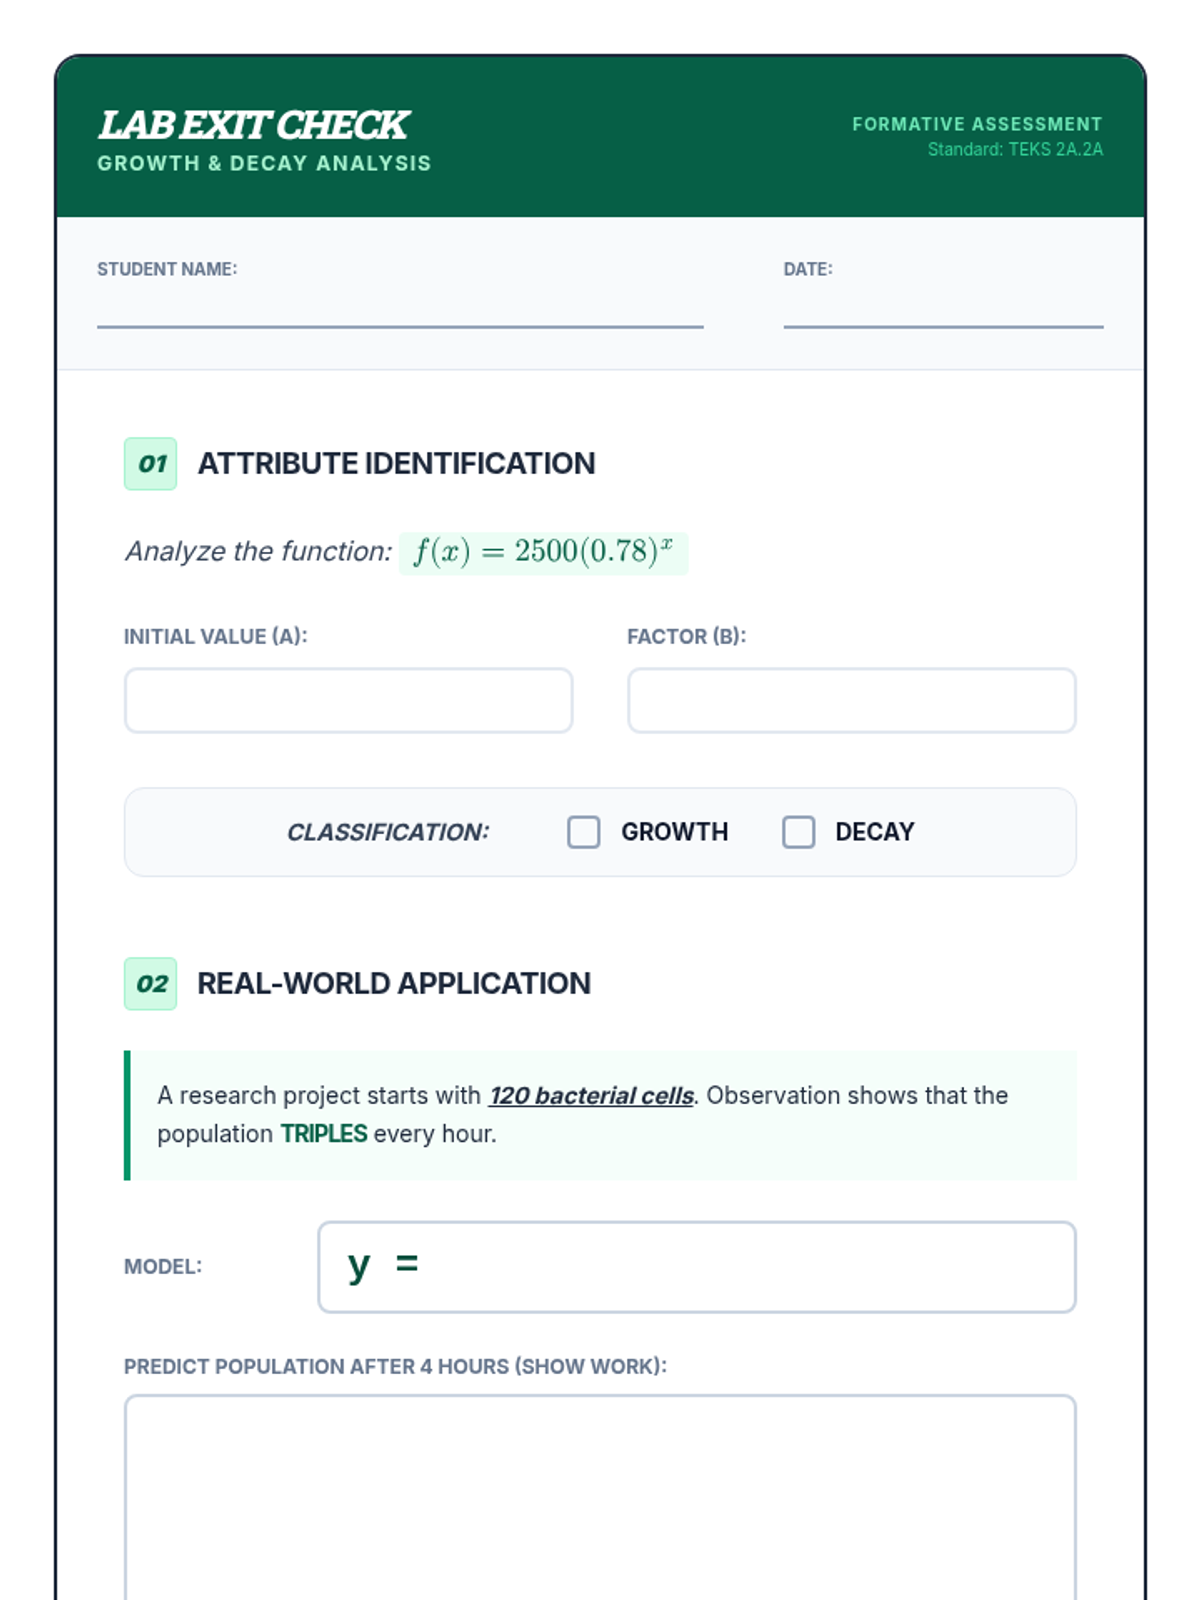
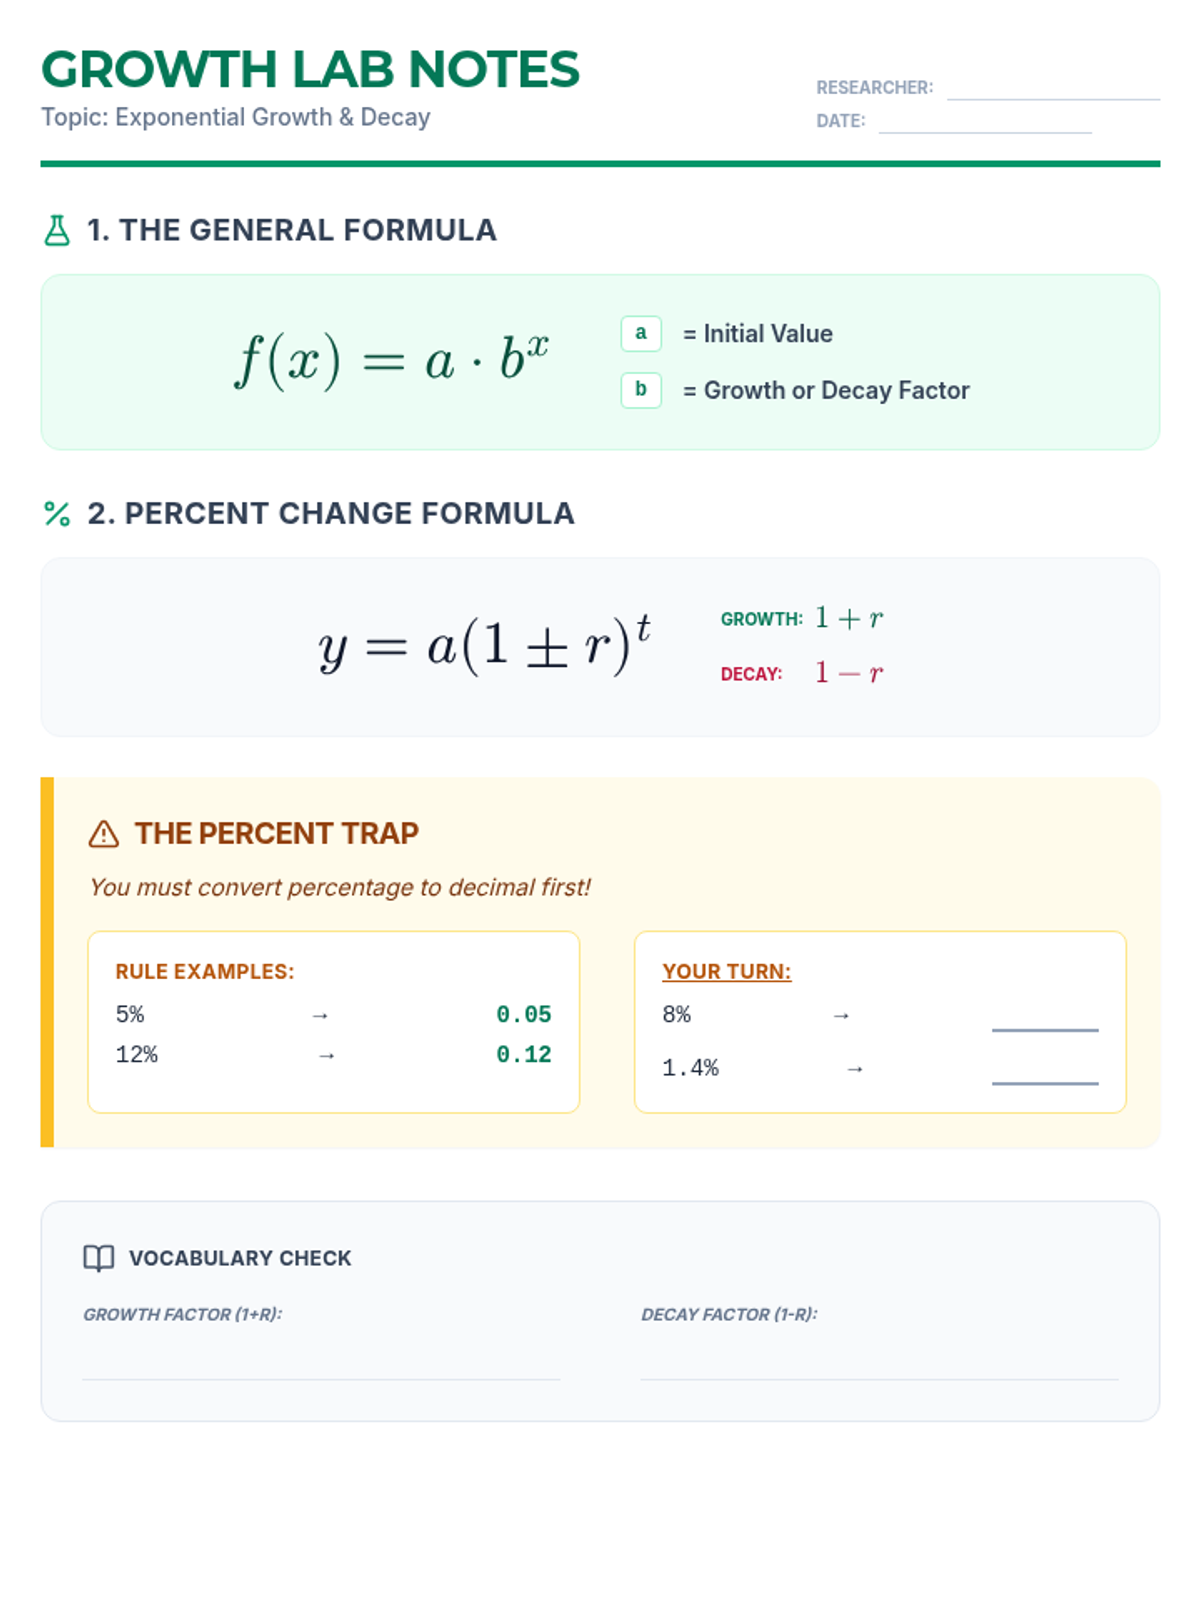
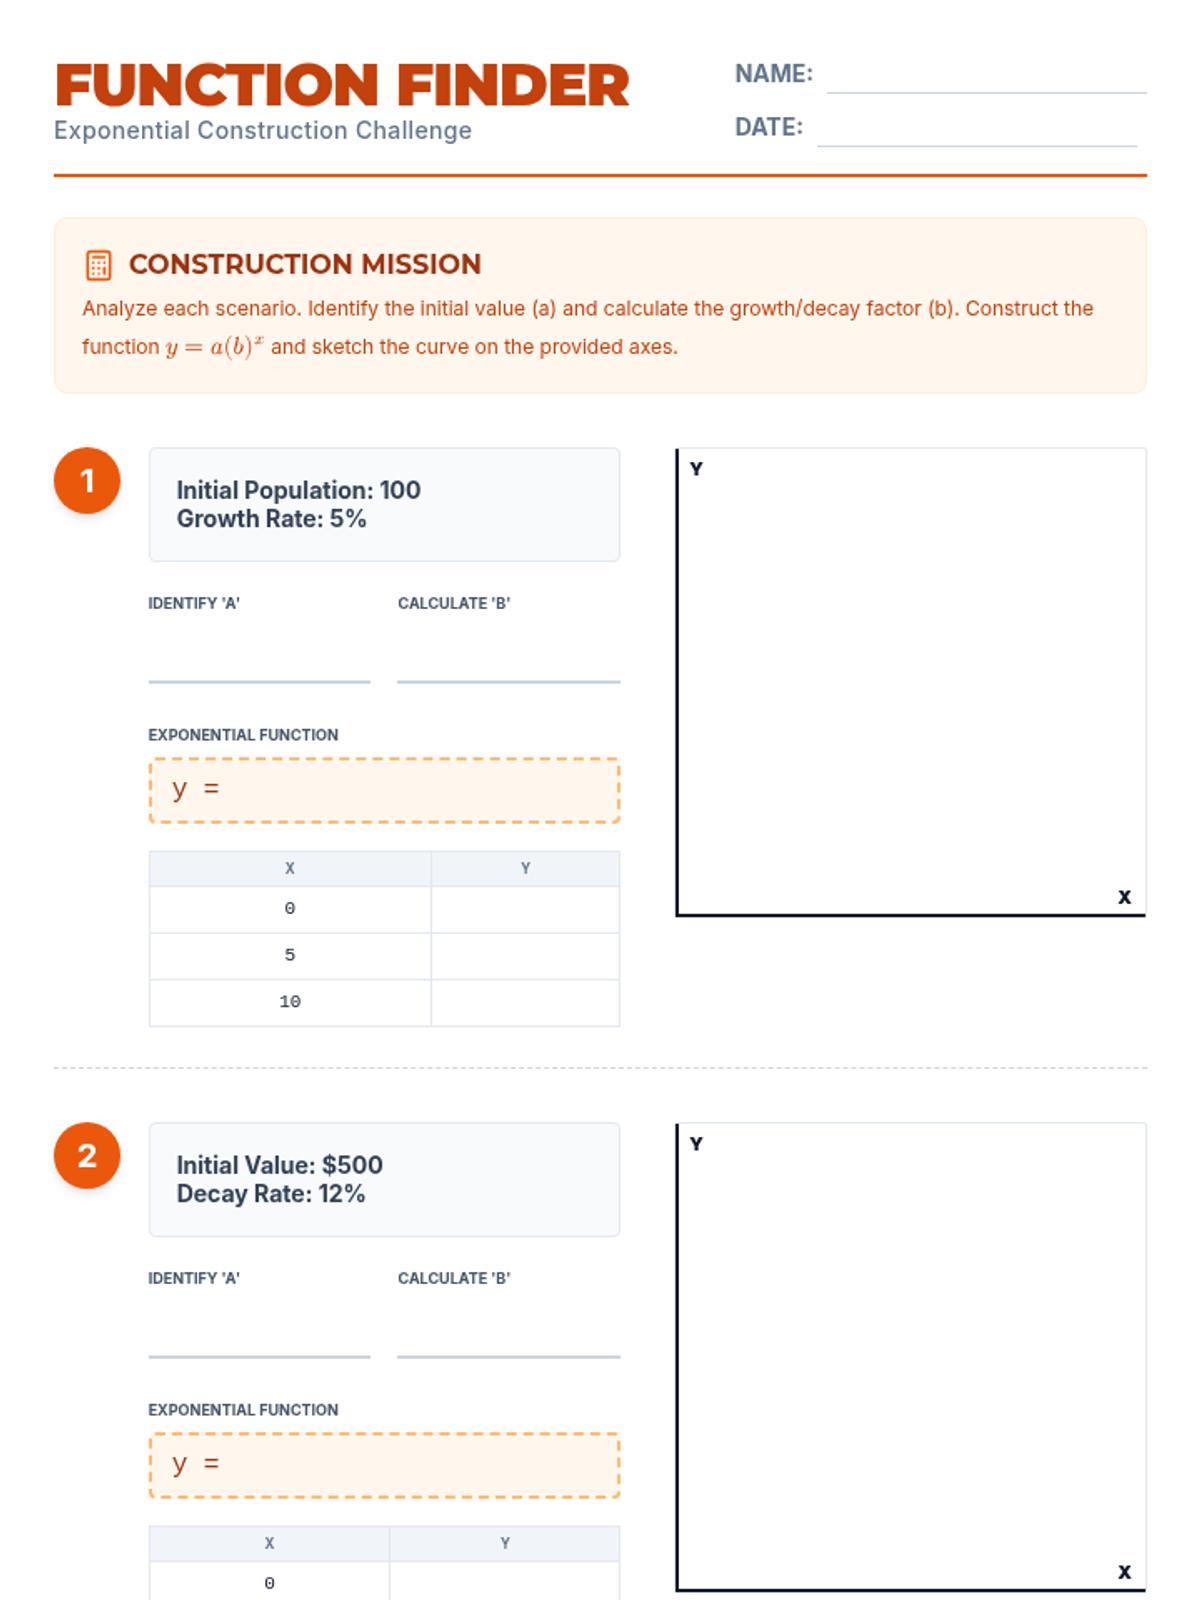
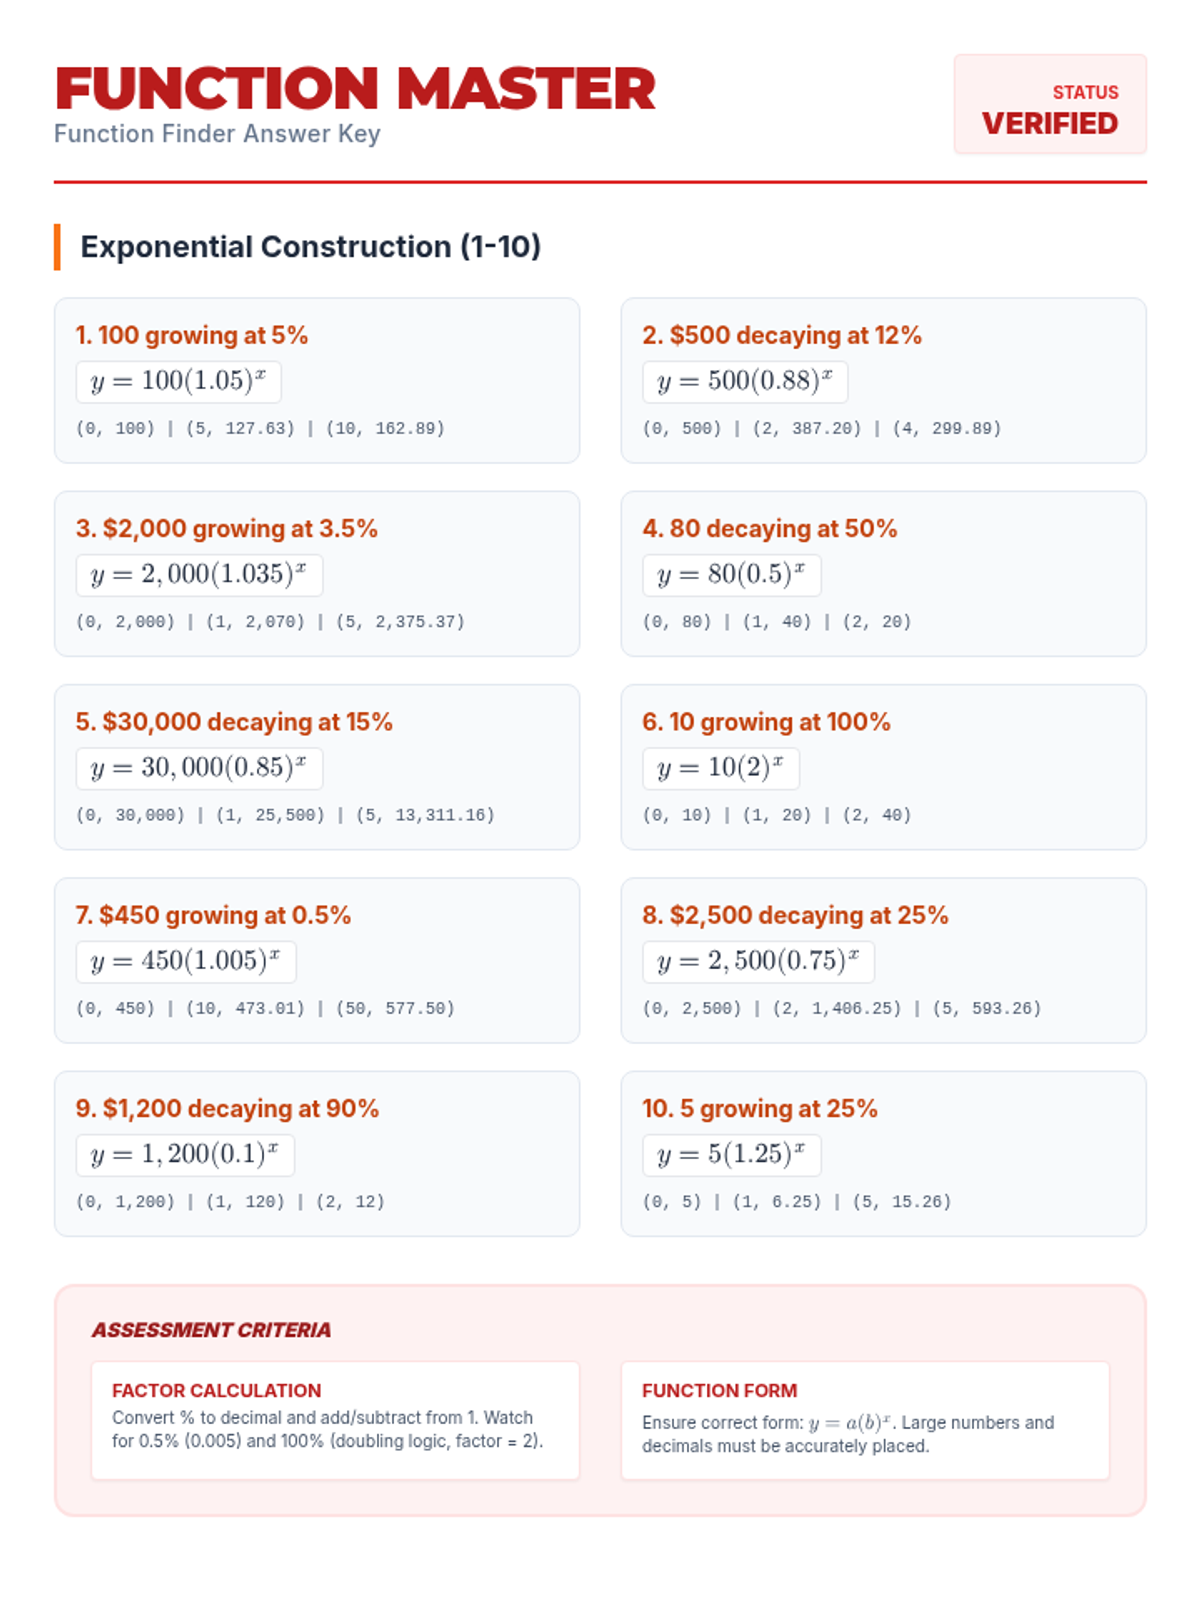
This lesson introduces exponential growth and decay functions, focusing on modeling real-life situations, identifying growth and decay factors, and analyzing key attributes of exponential models. Students will transition from Algebra 1 foundations to advanced Algebra 2 applications using the standard model \(y = ab^x\).
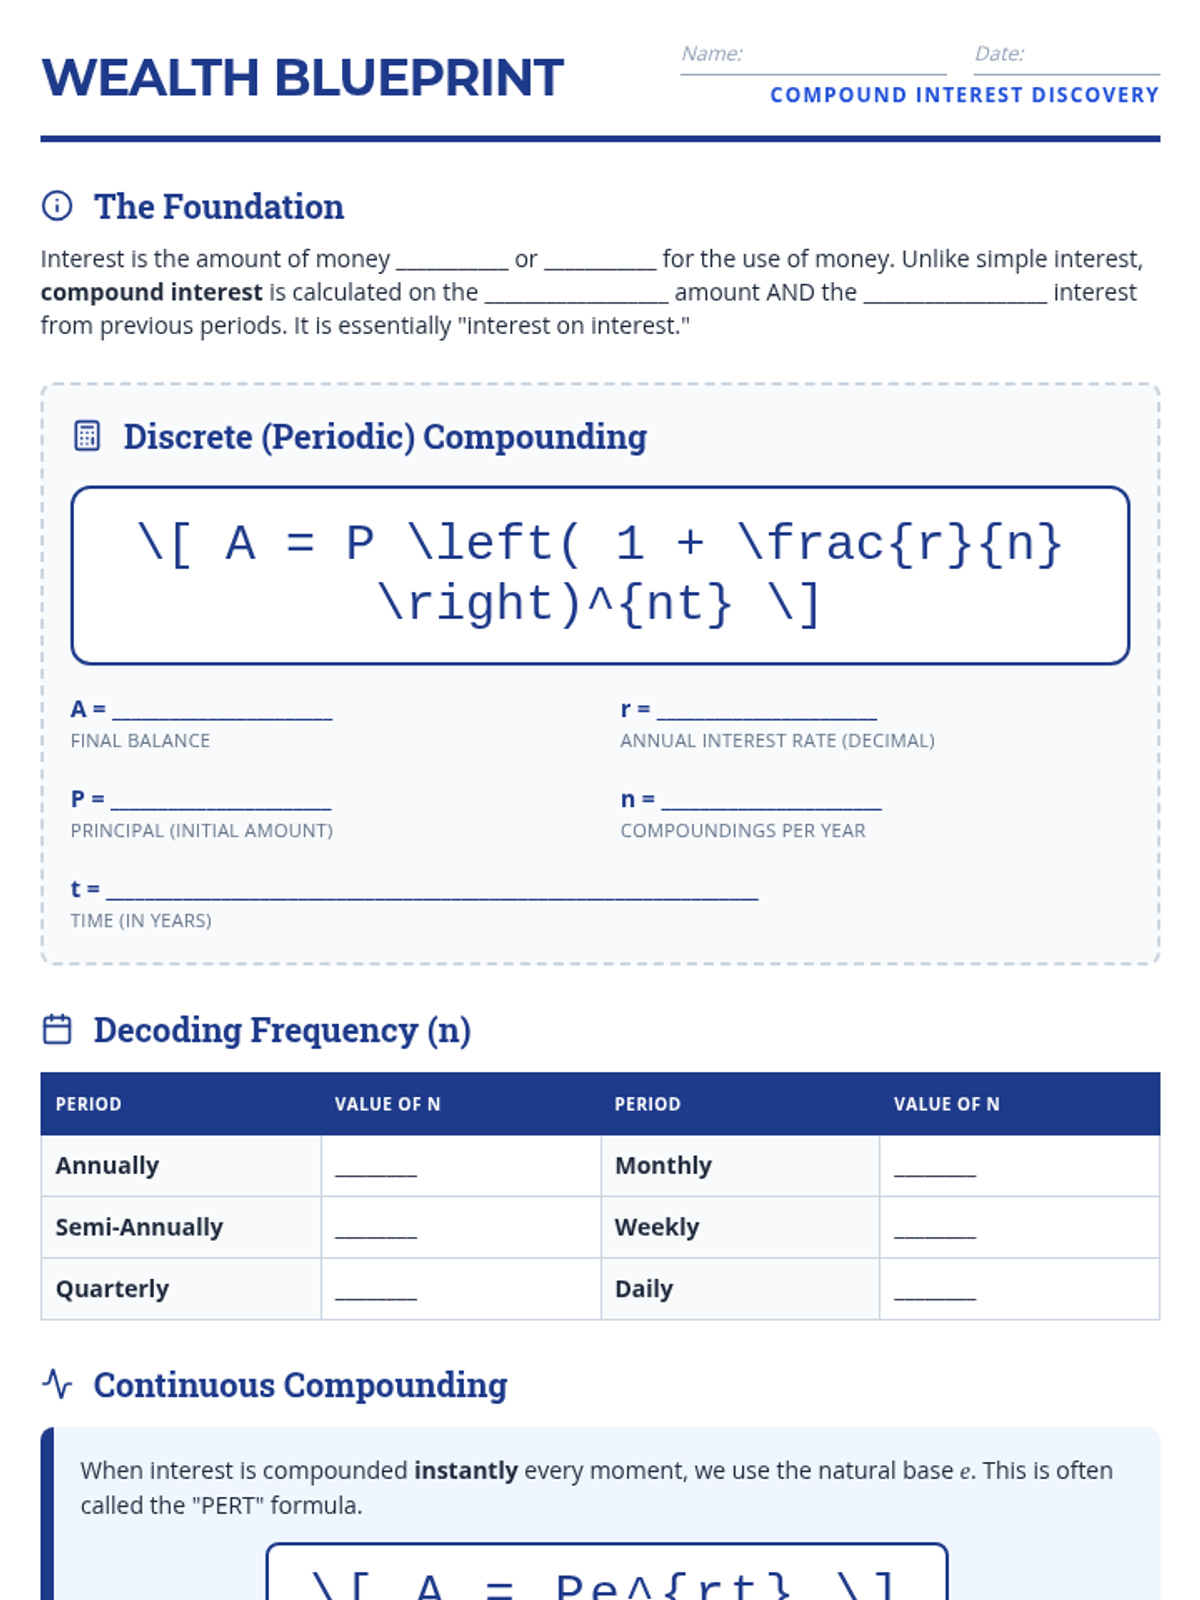
A guided exploration of discrete and continuous compound interest formulas through visual organizers and structured notes.
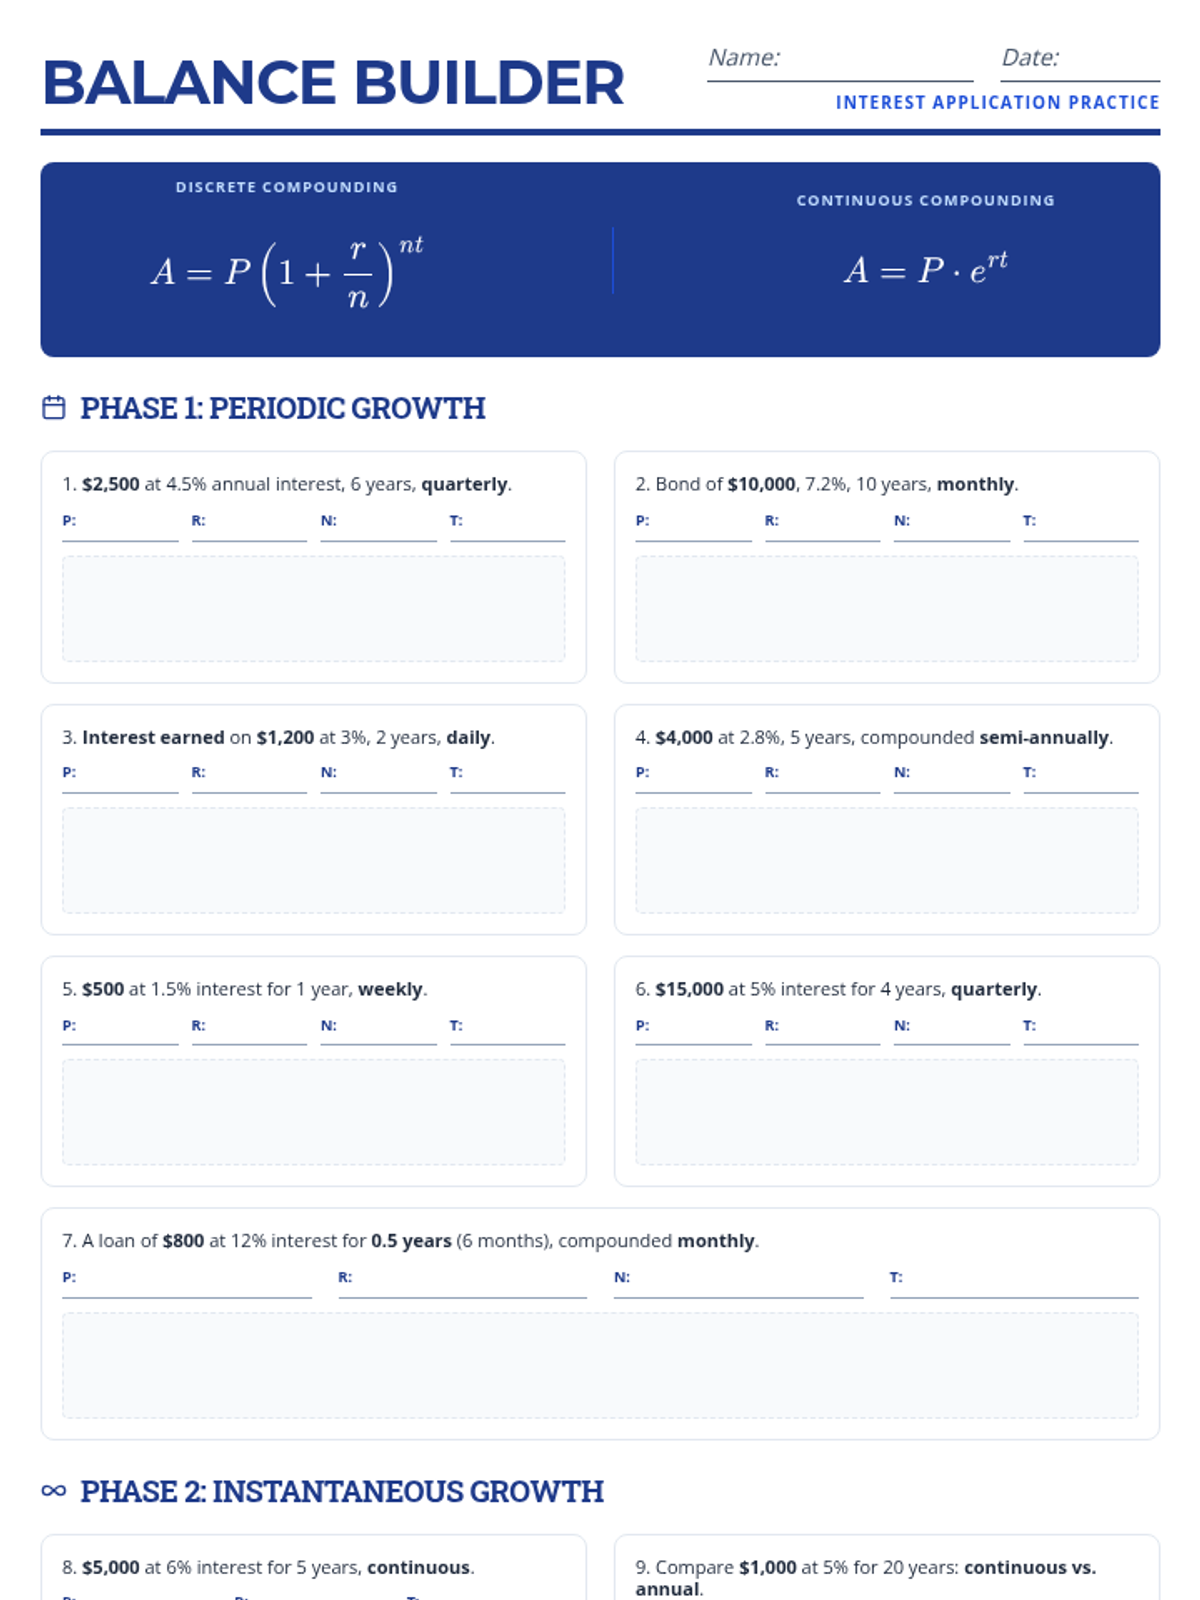
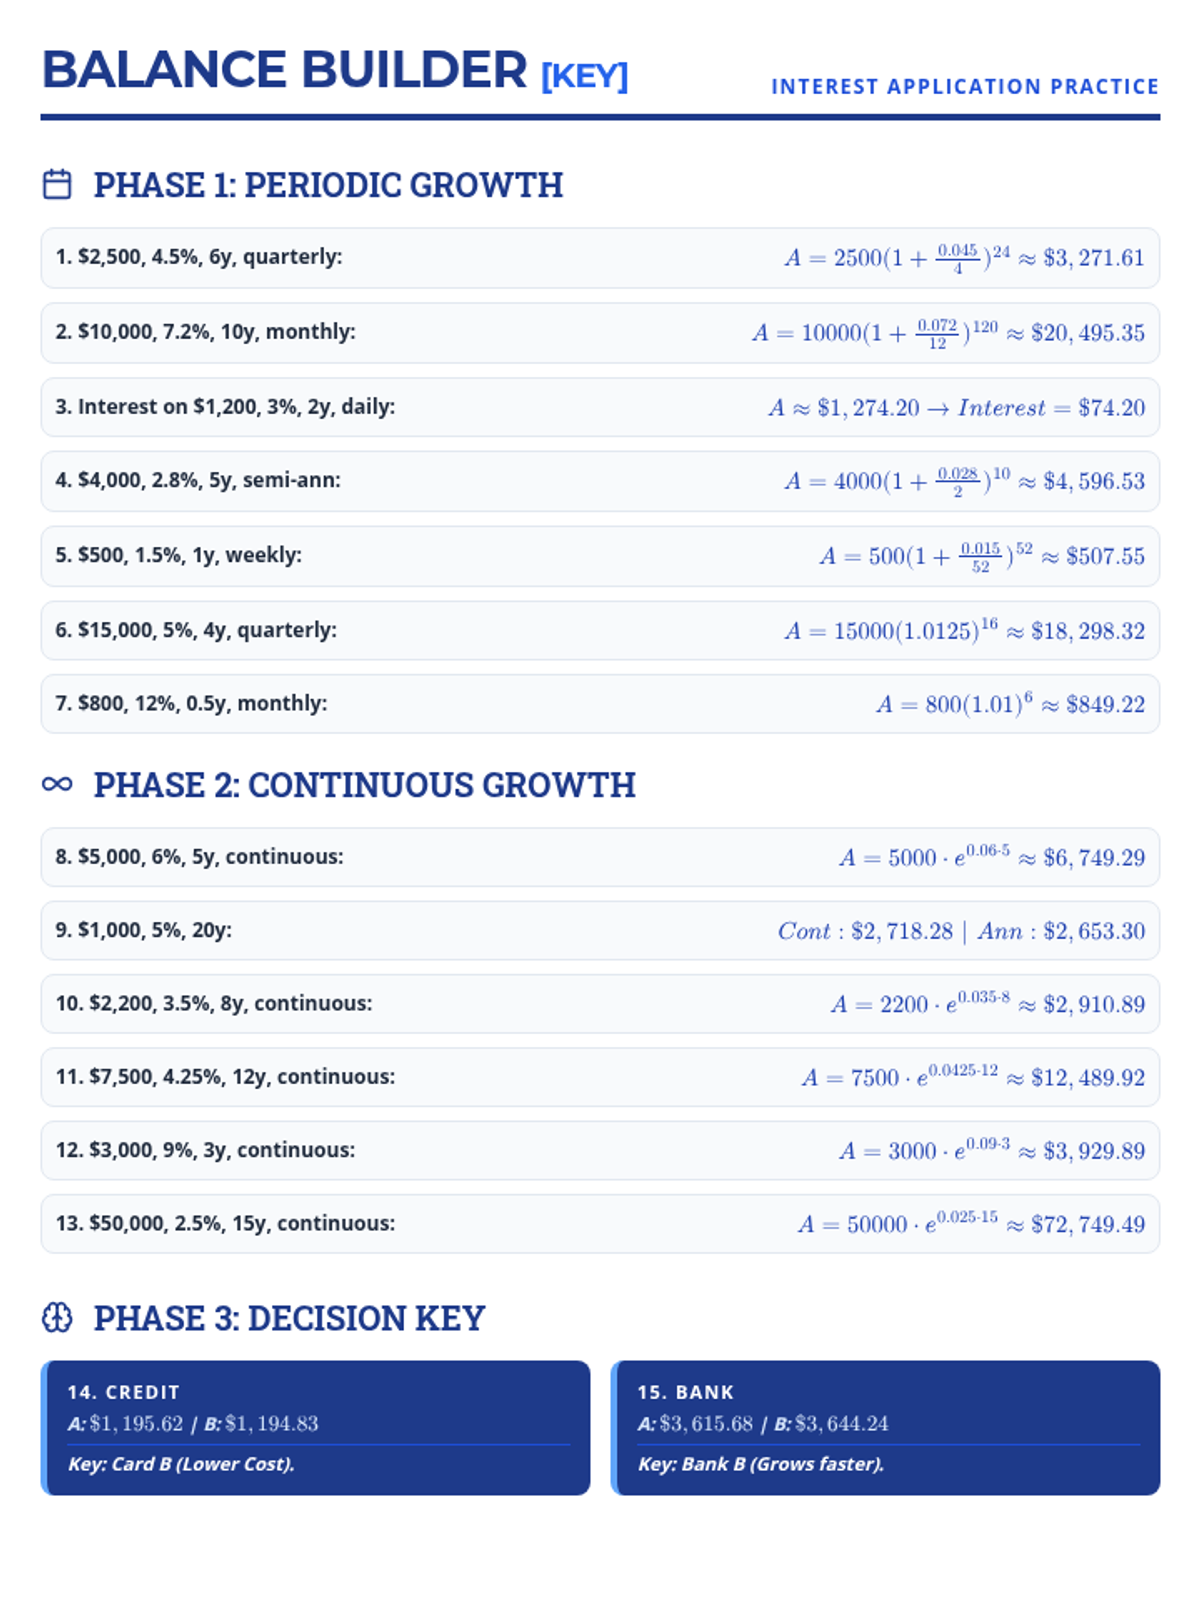
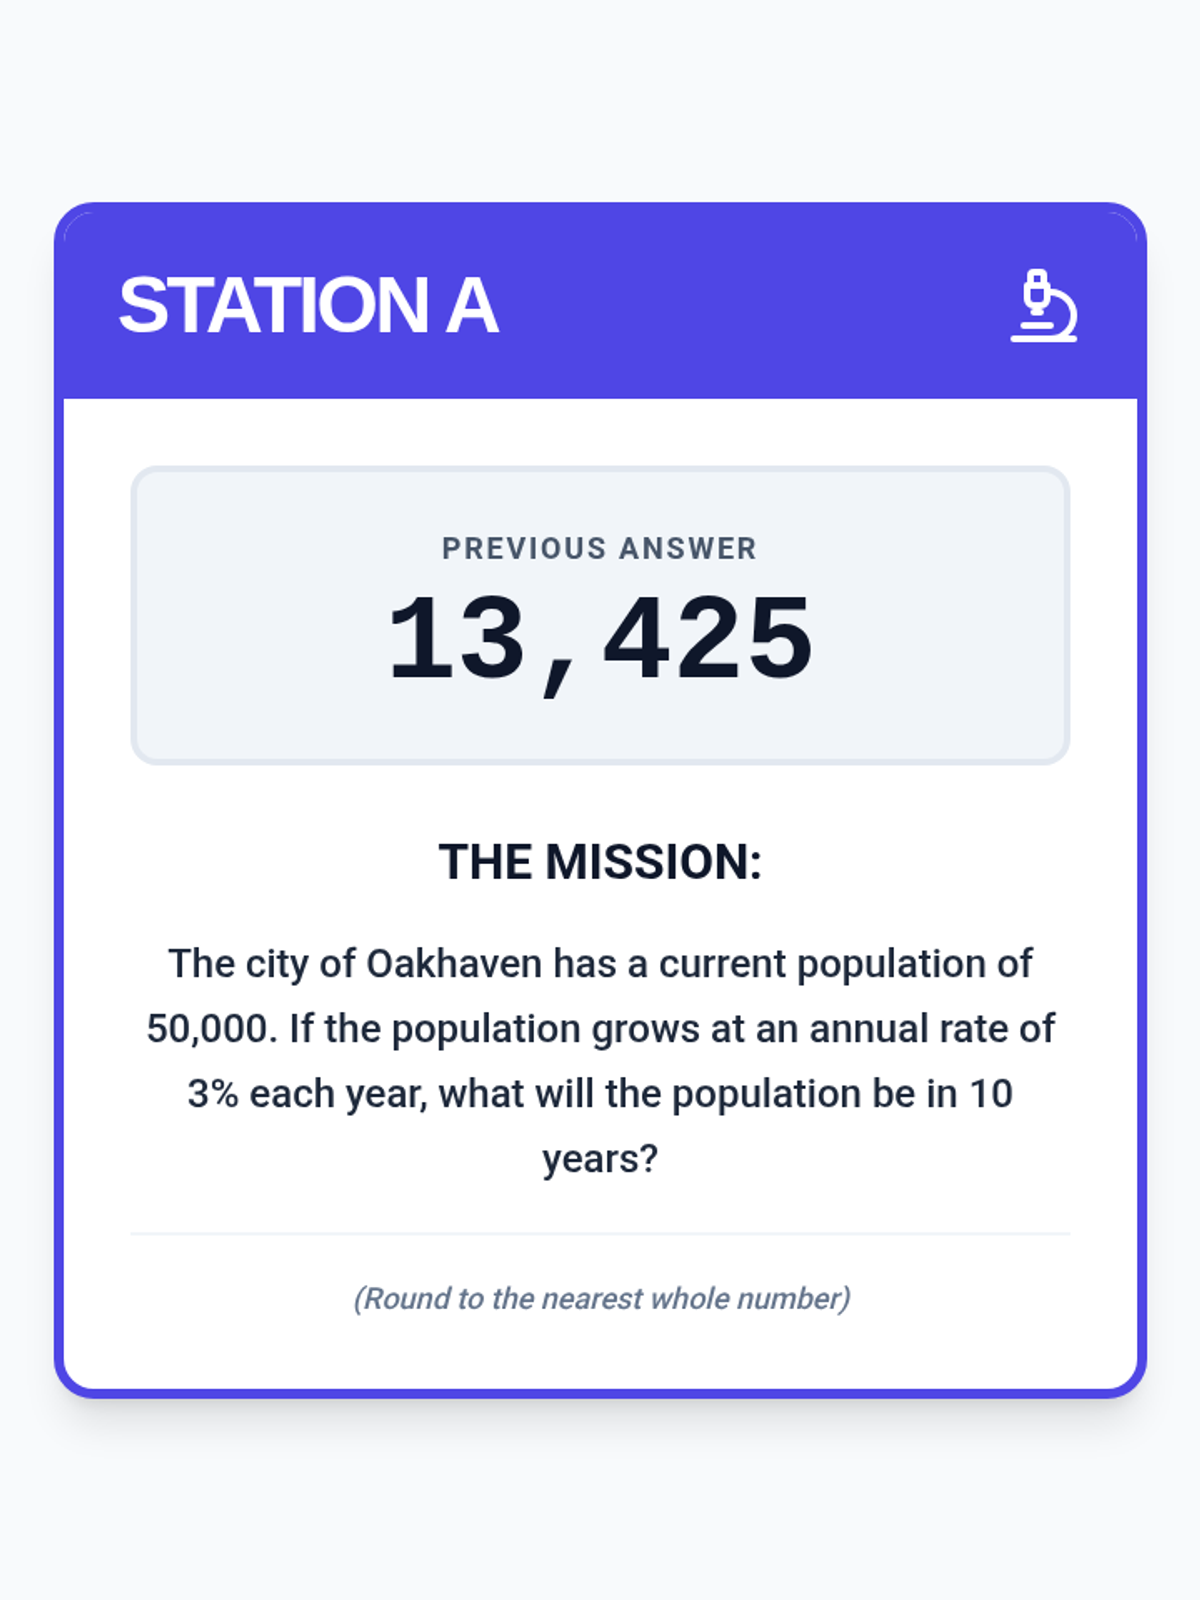
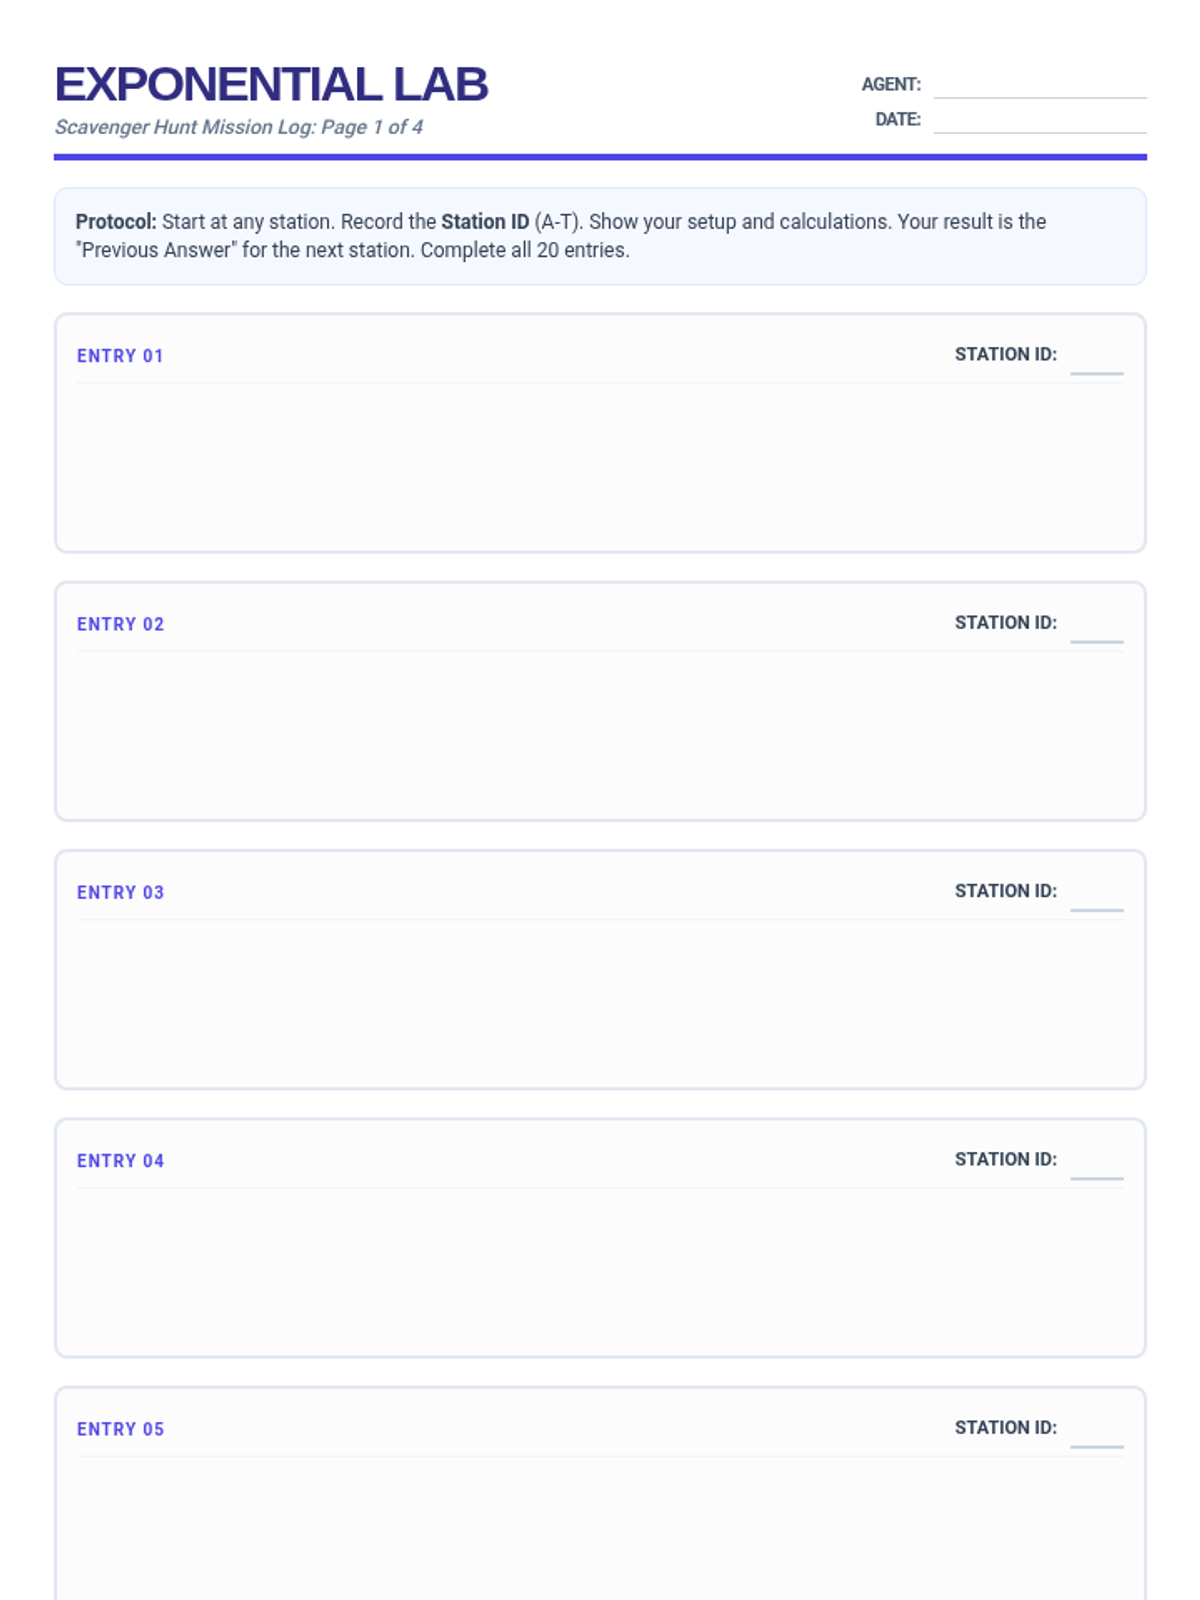
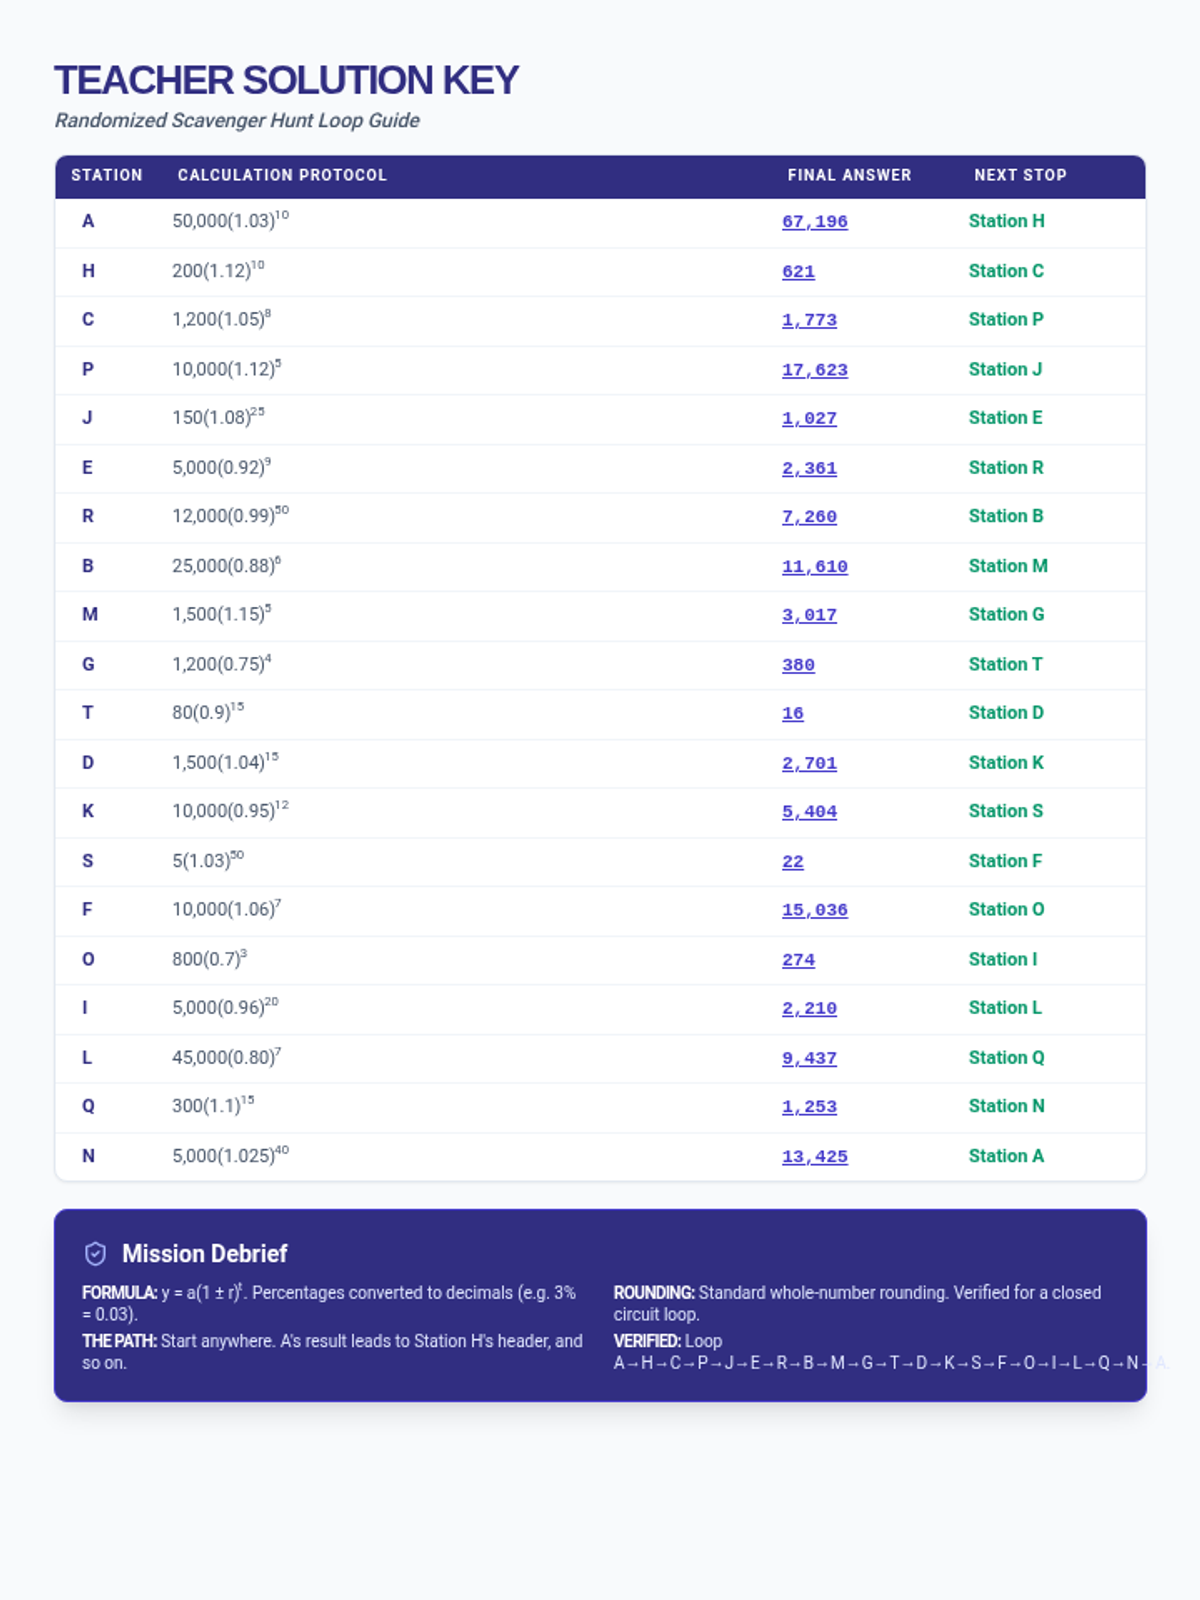
In this lesson, students will apply their knowledge of exponential growth and decay formulas to solve 20 real-world scenarios. They will move through stations in a self-correcting loop, reinforcing their understanding of interest, half-life, population growth, and depreciation.
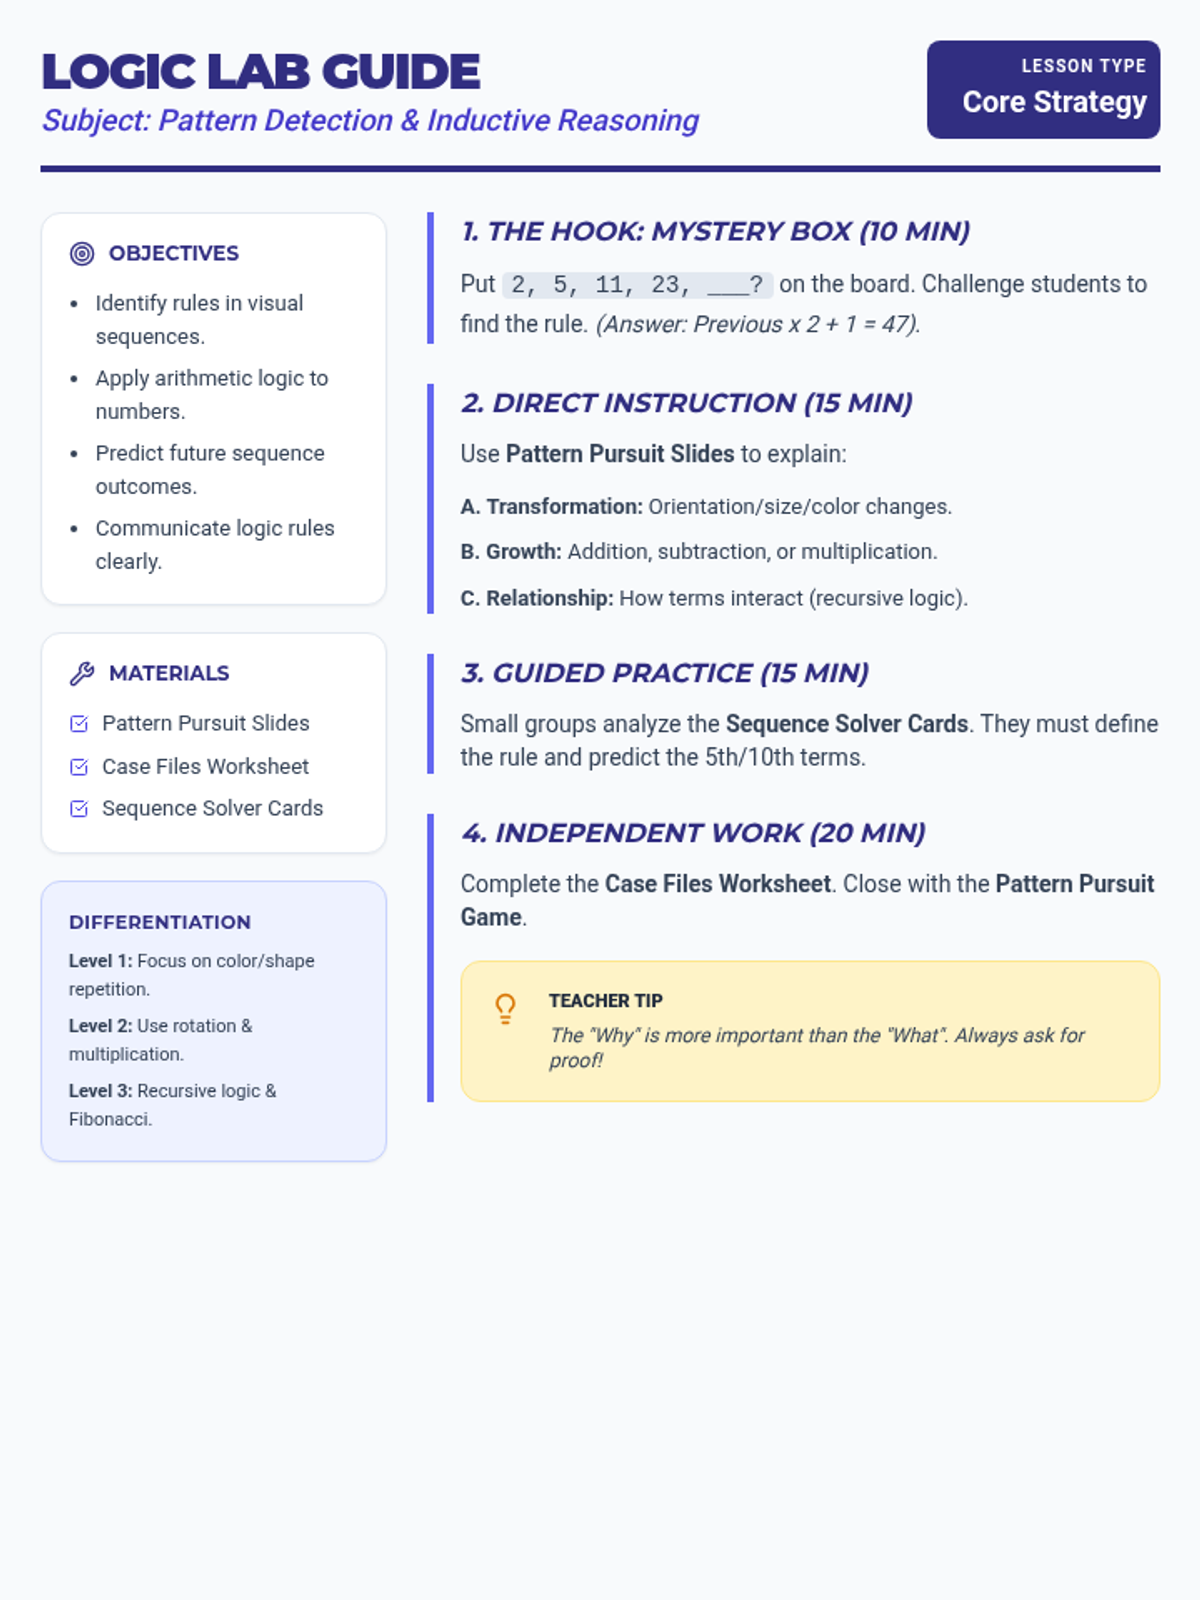
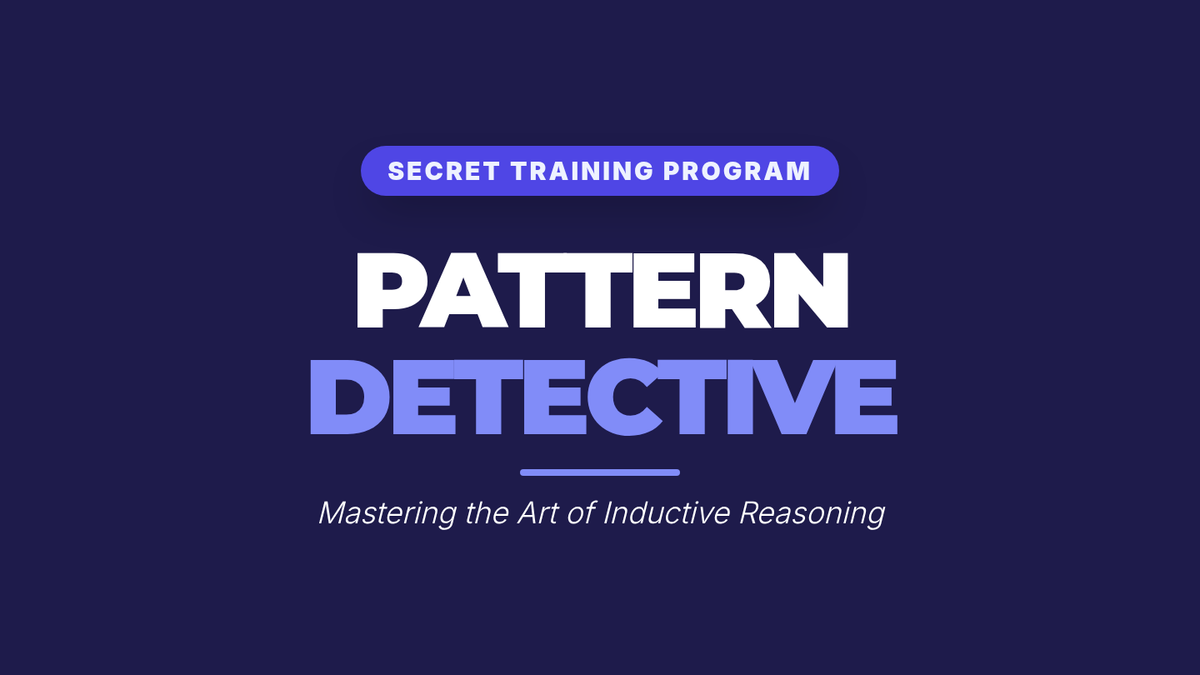
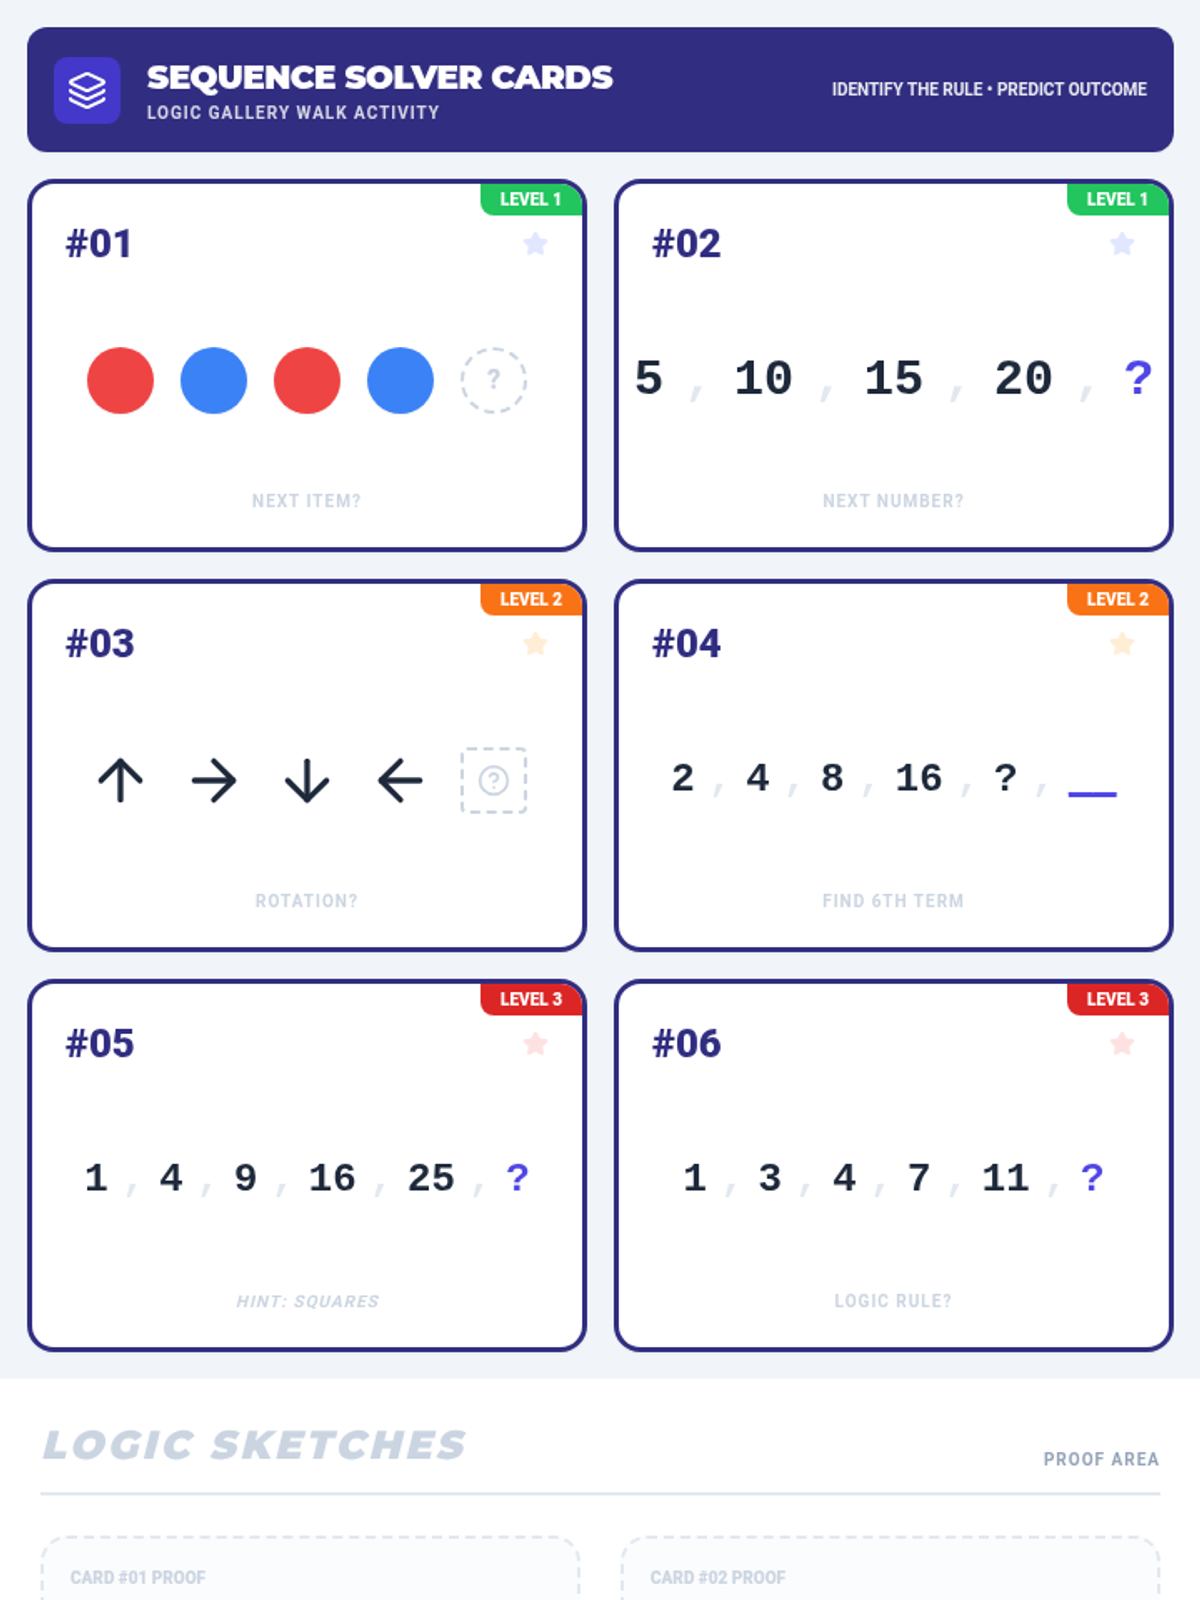
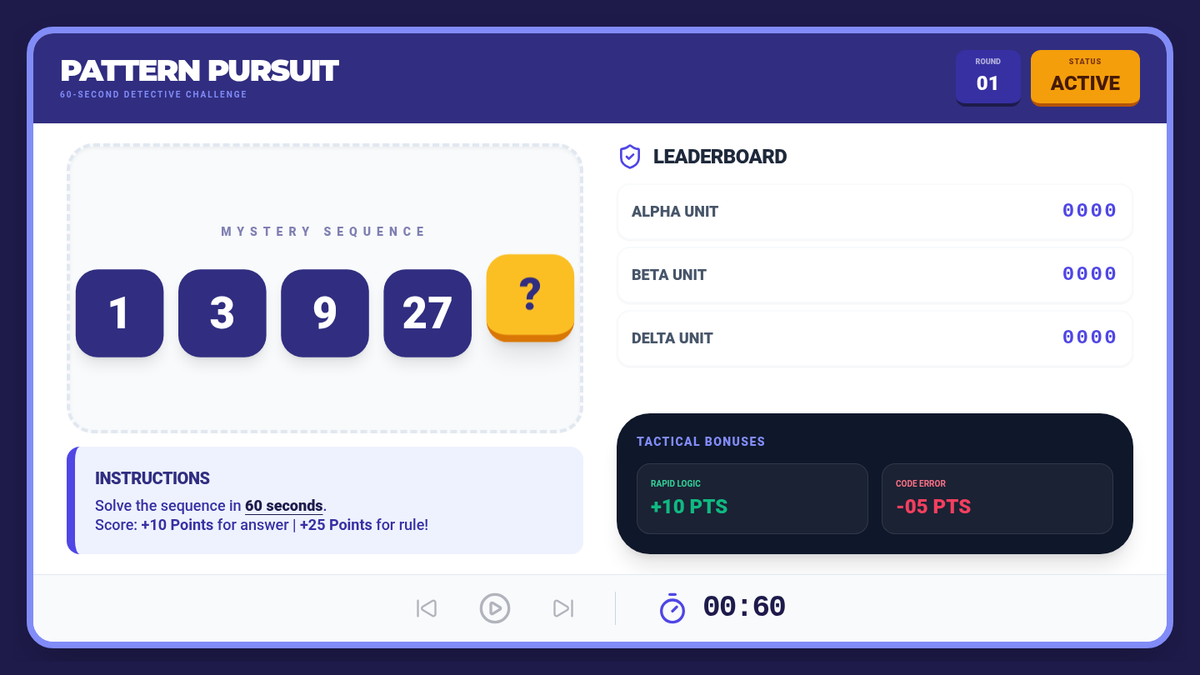
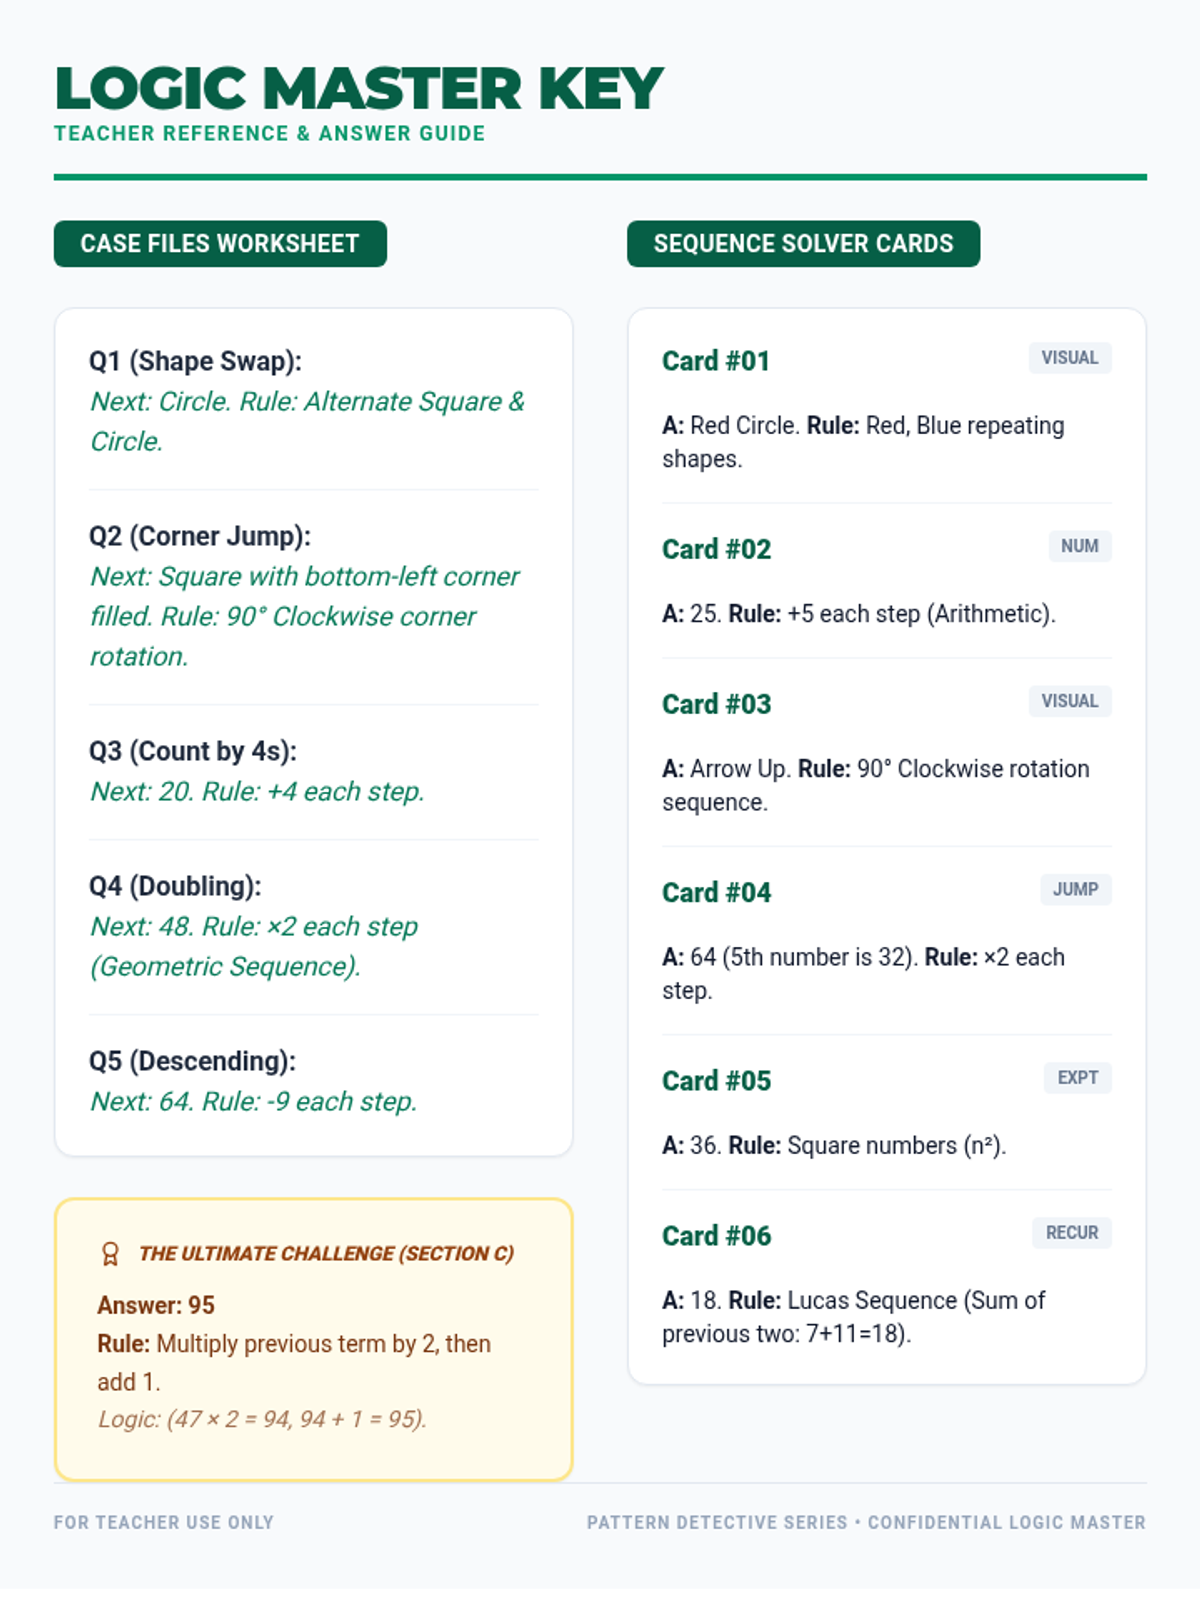
A comprehensive logic lesson where students act as detectives to identify rules in visual and numerical sequences, building inductive reasoning and prediction skills.
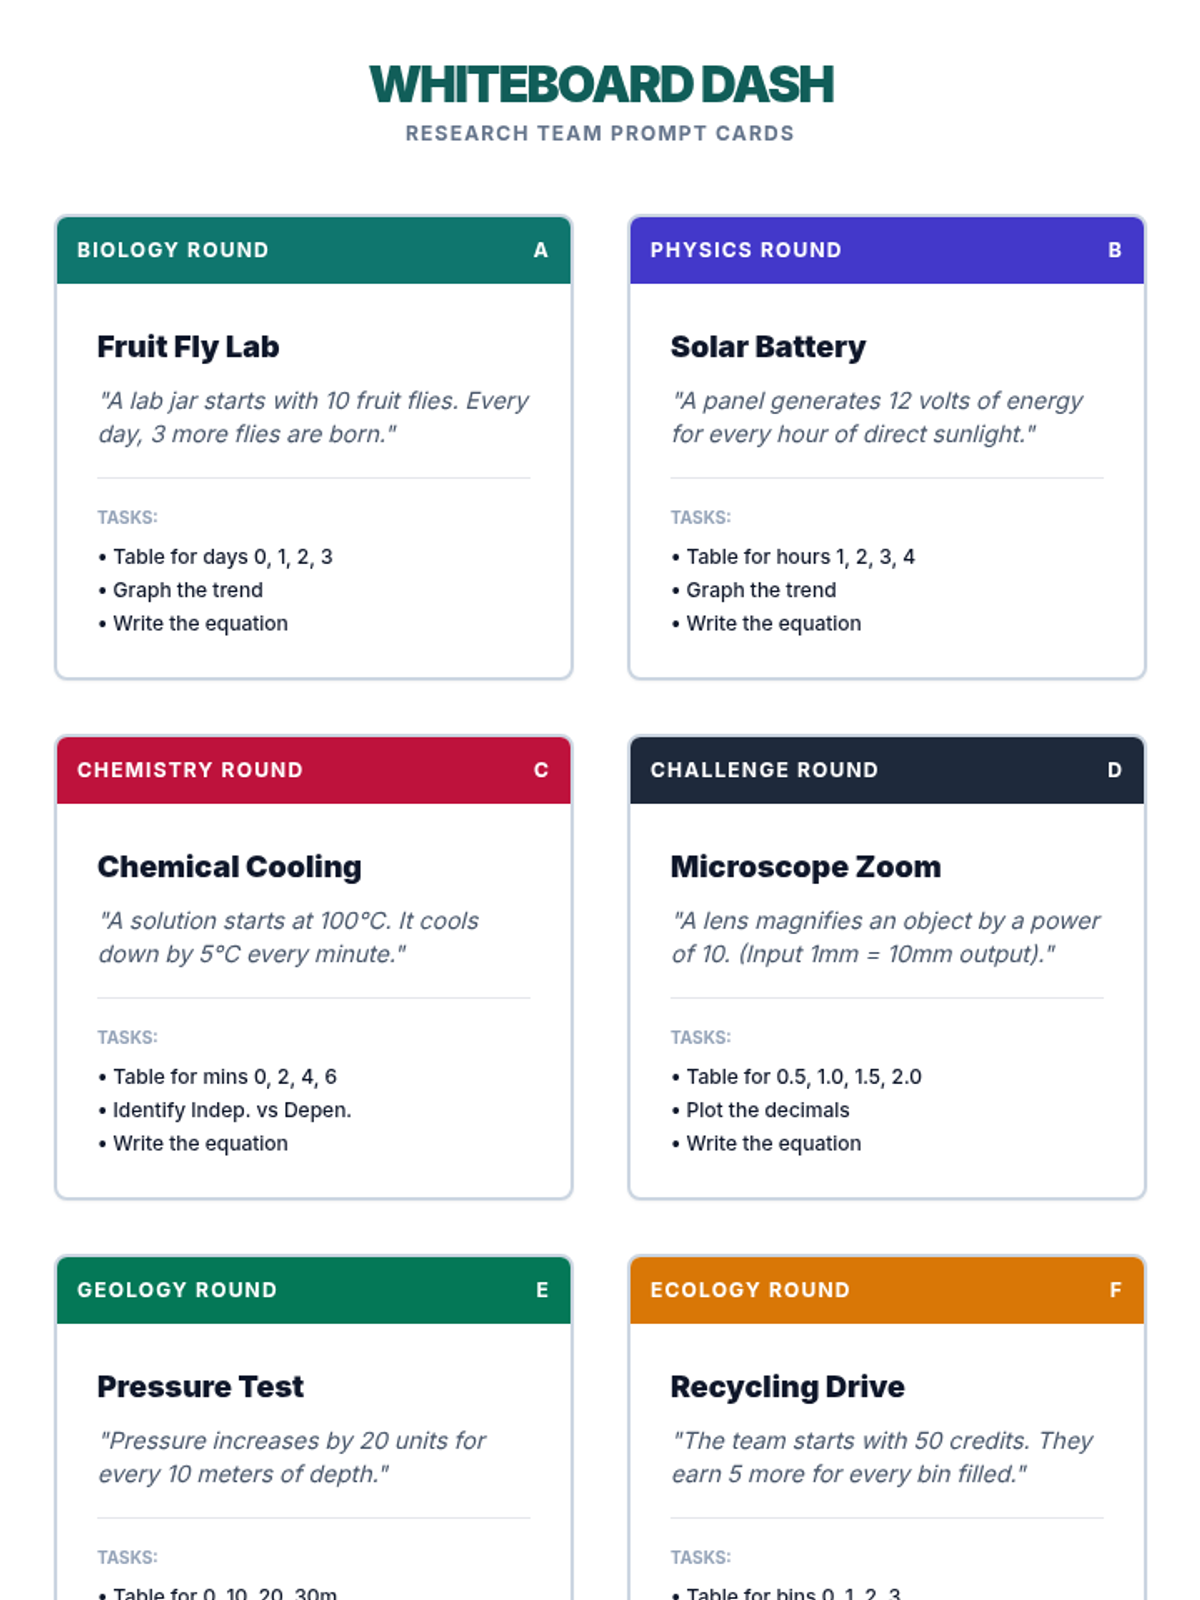
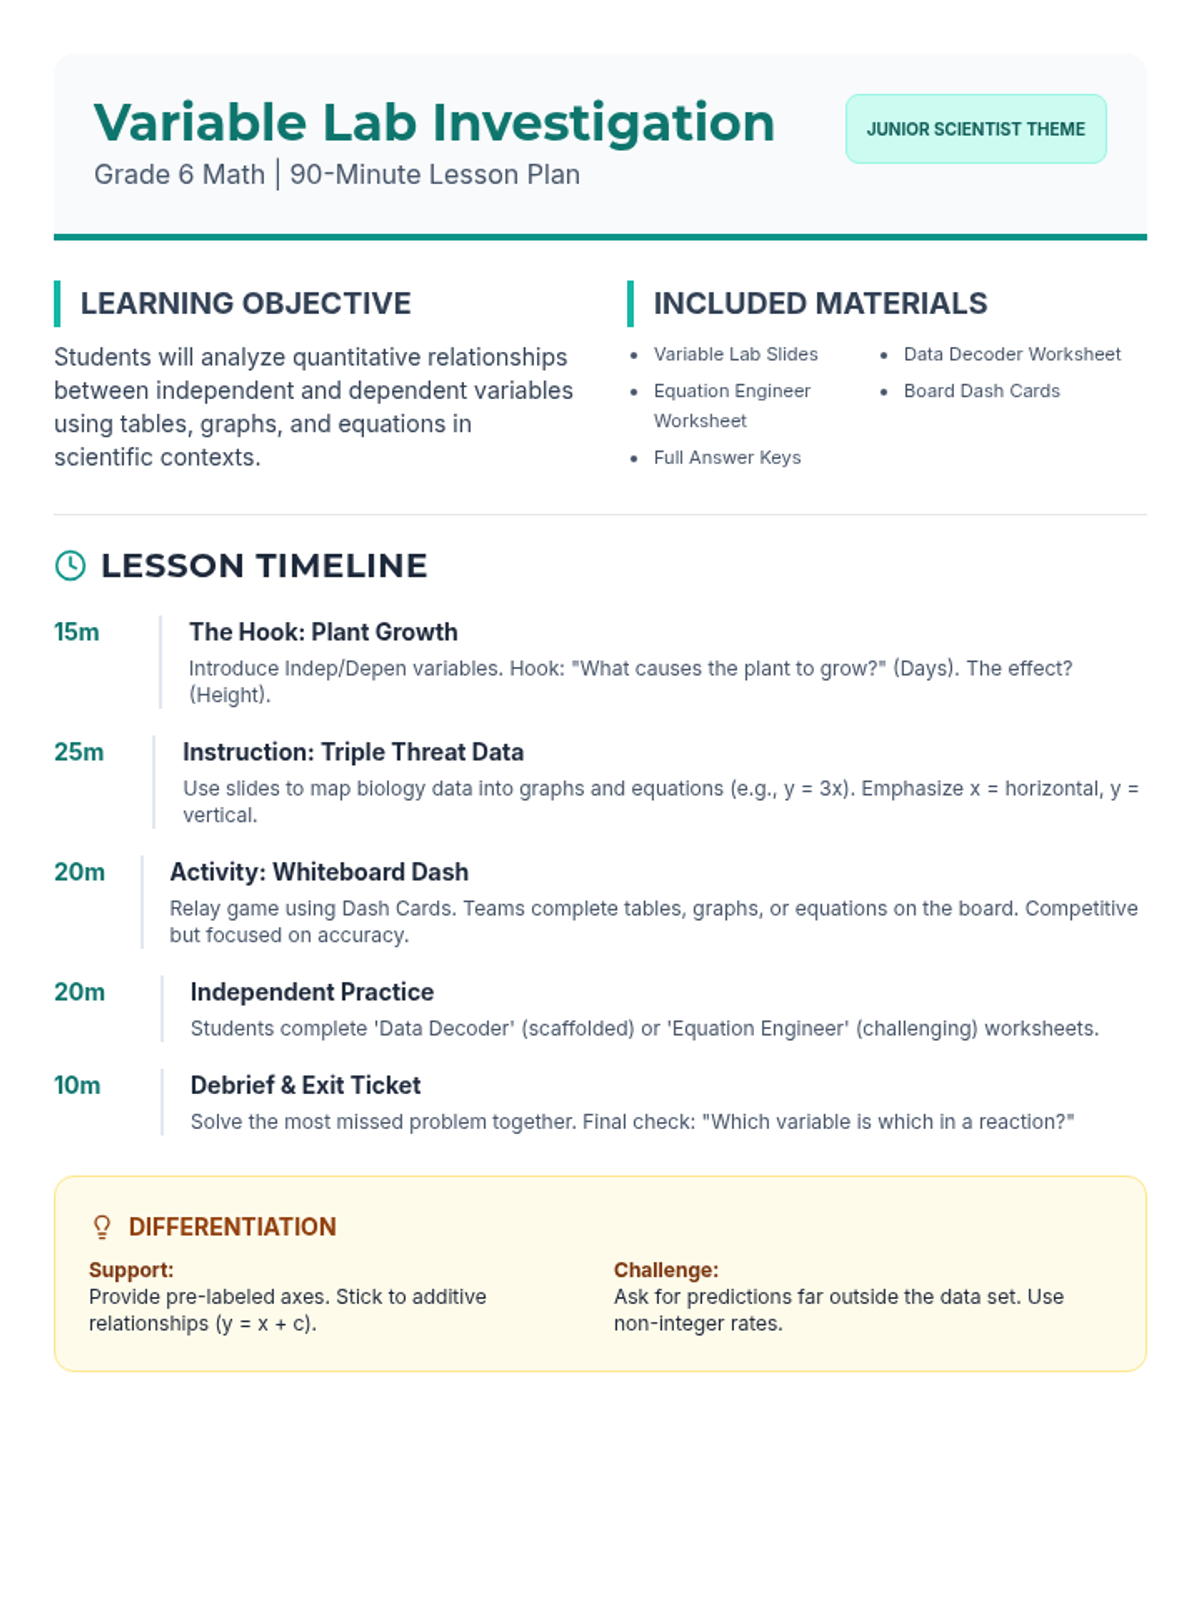
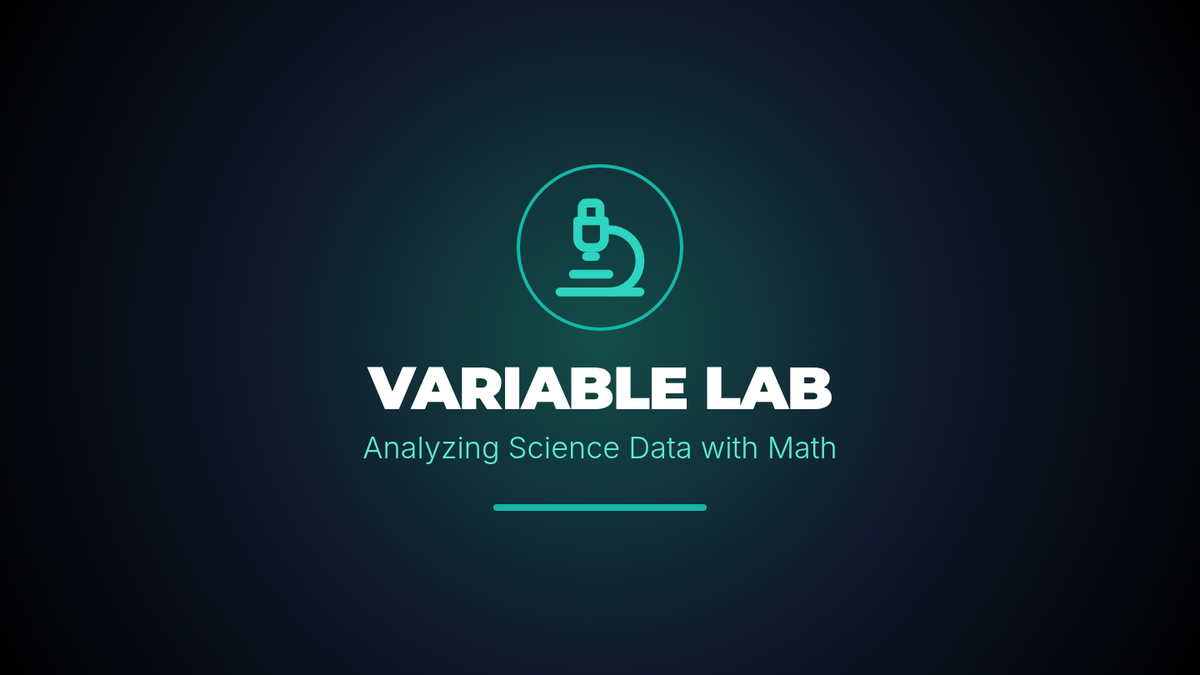
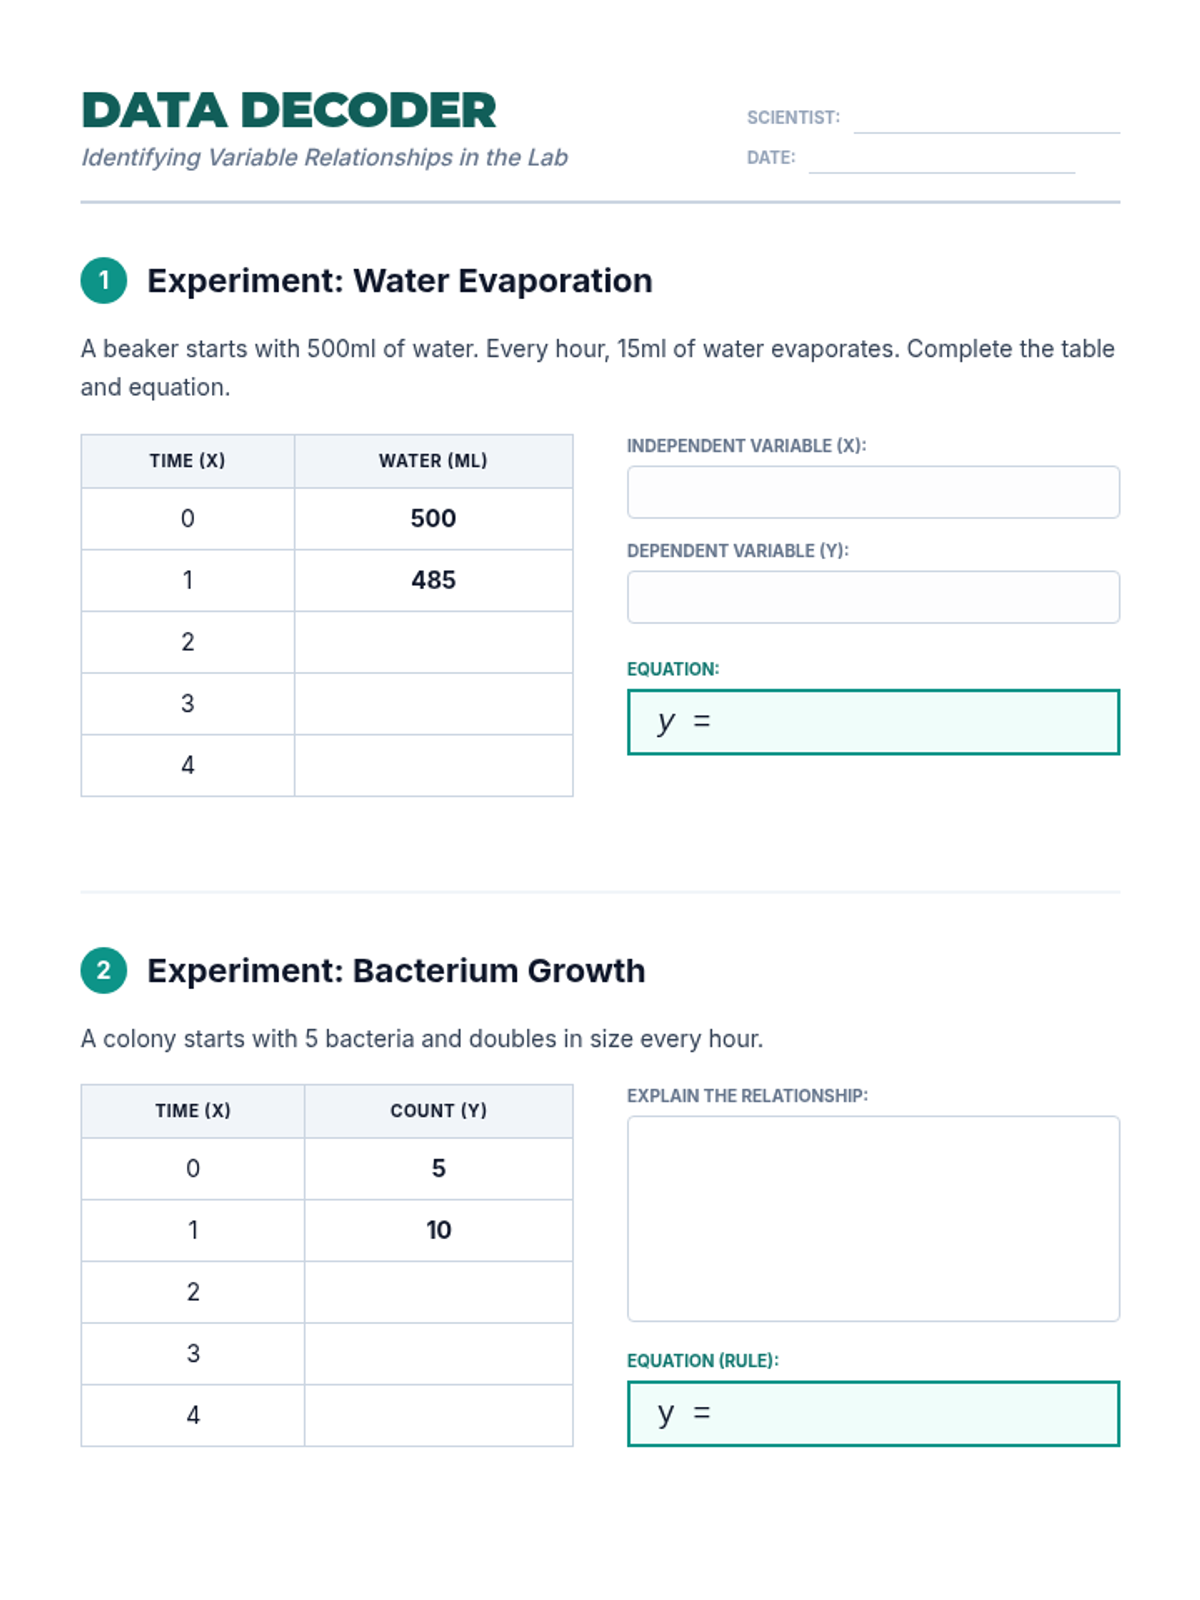
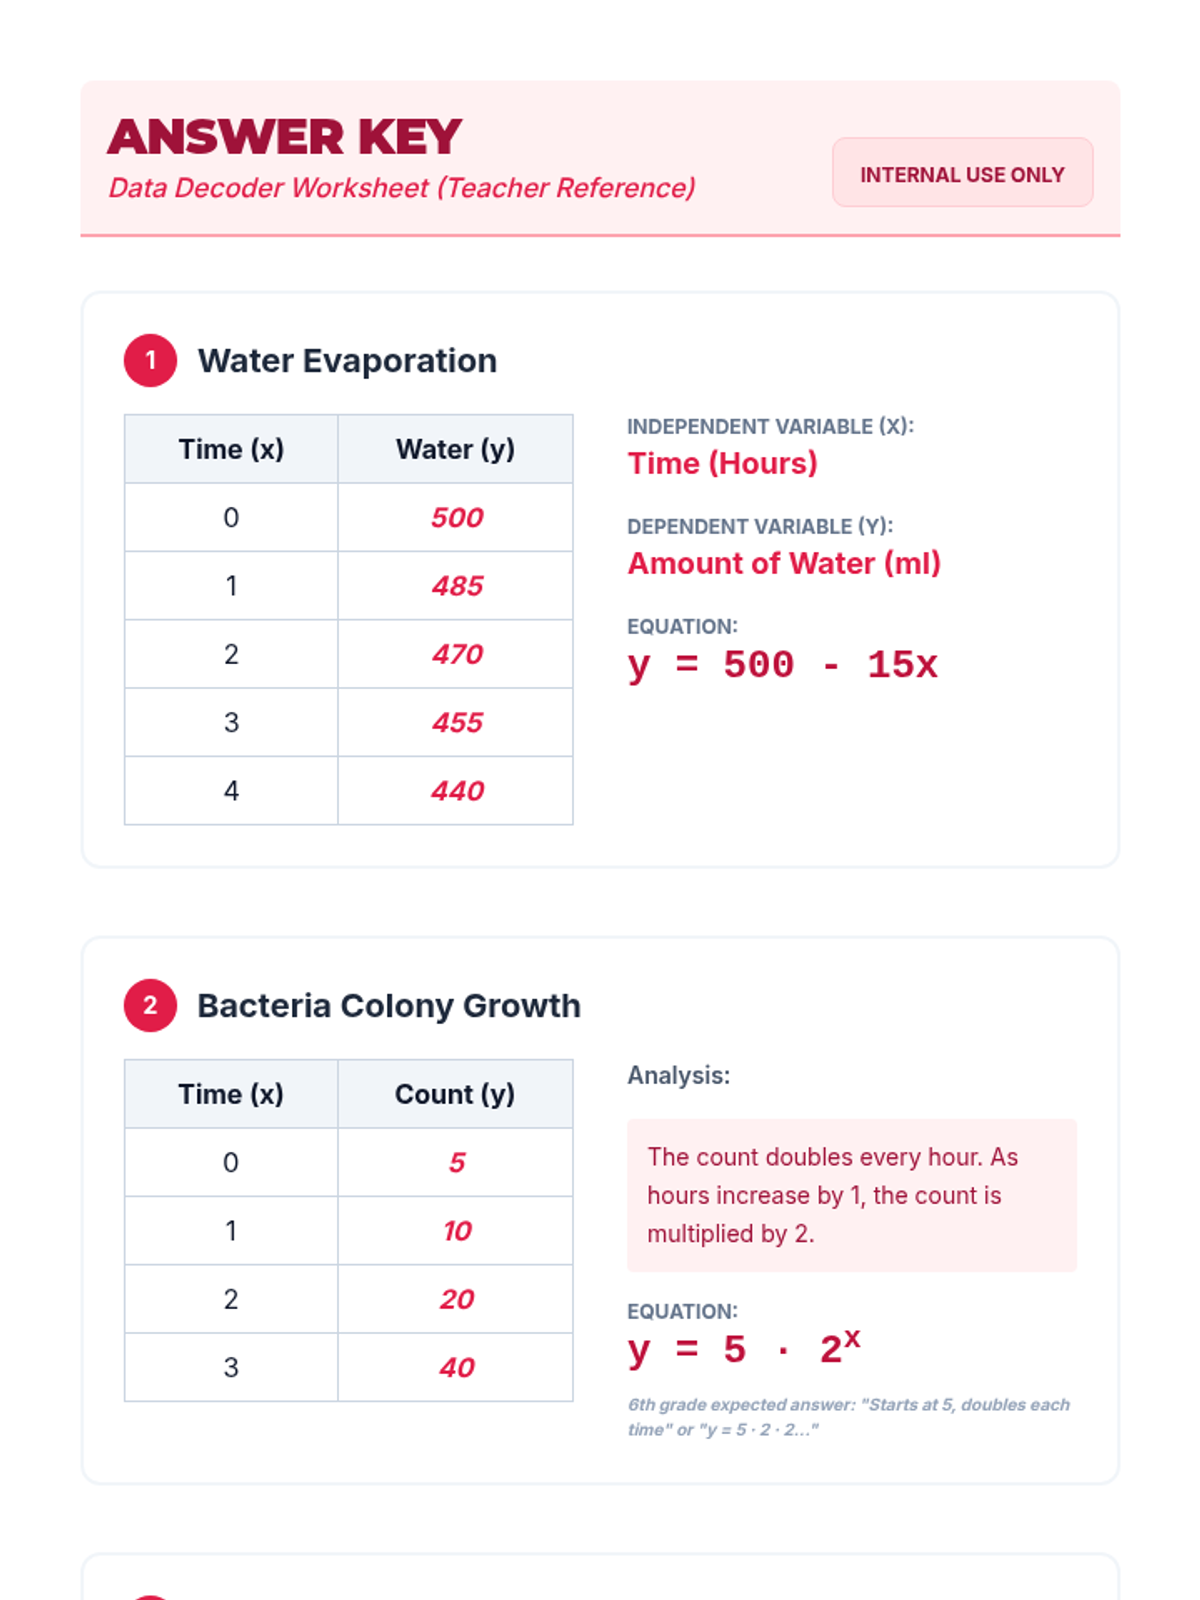
A 90-minute investigative math lesson where 6th grade students analyze independent and dependent variables through science experiment data. Students connect tables, graphs, and equations using real-world laboratory scenarios.
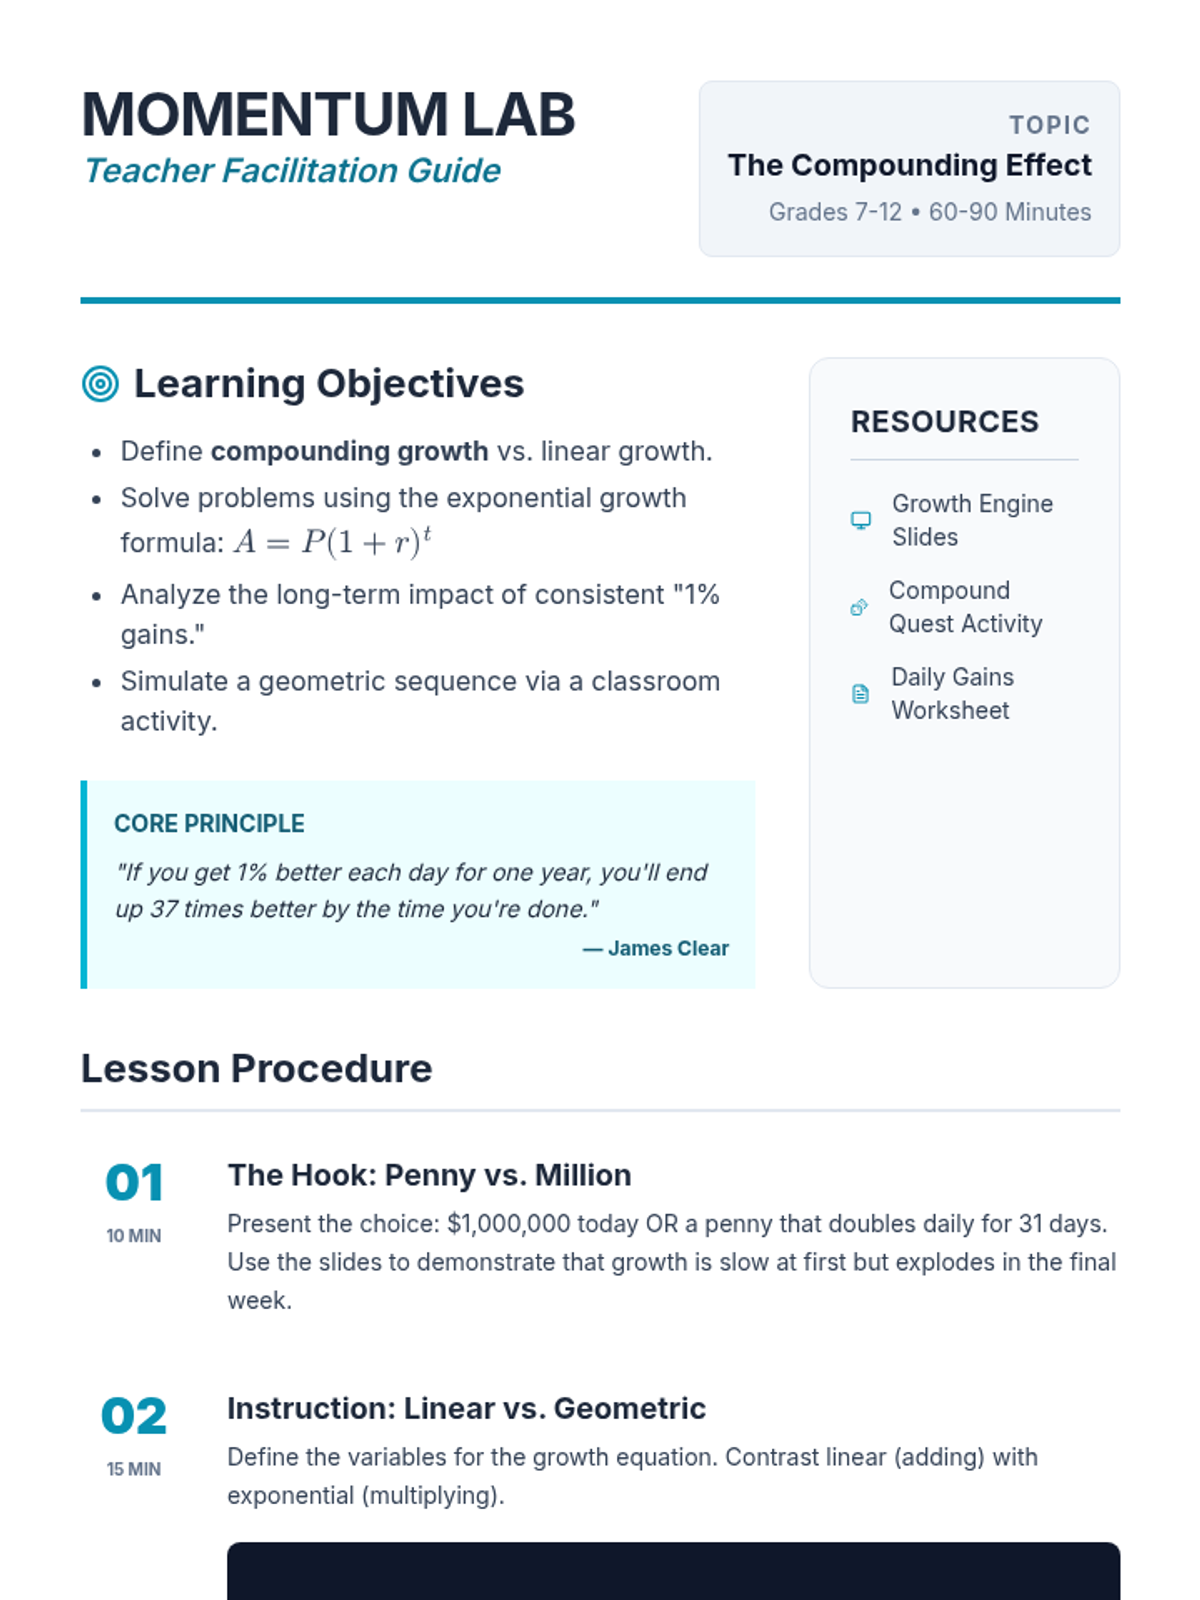
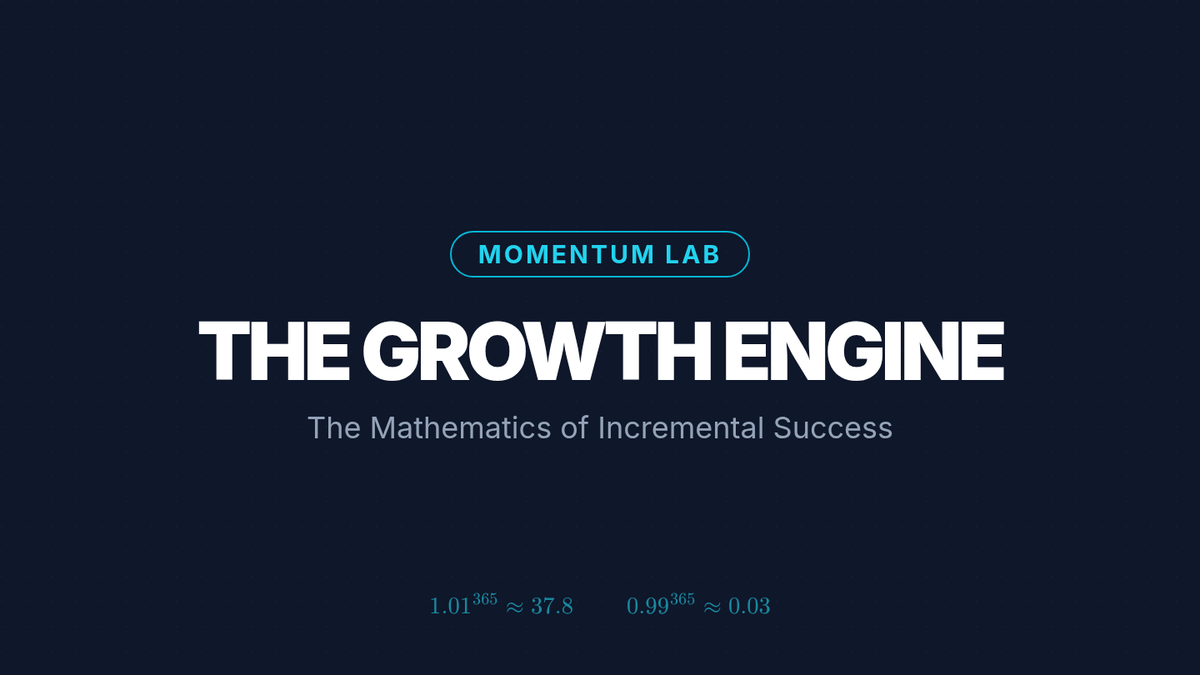
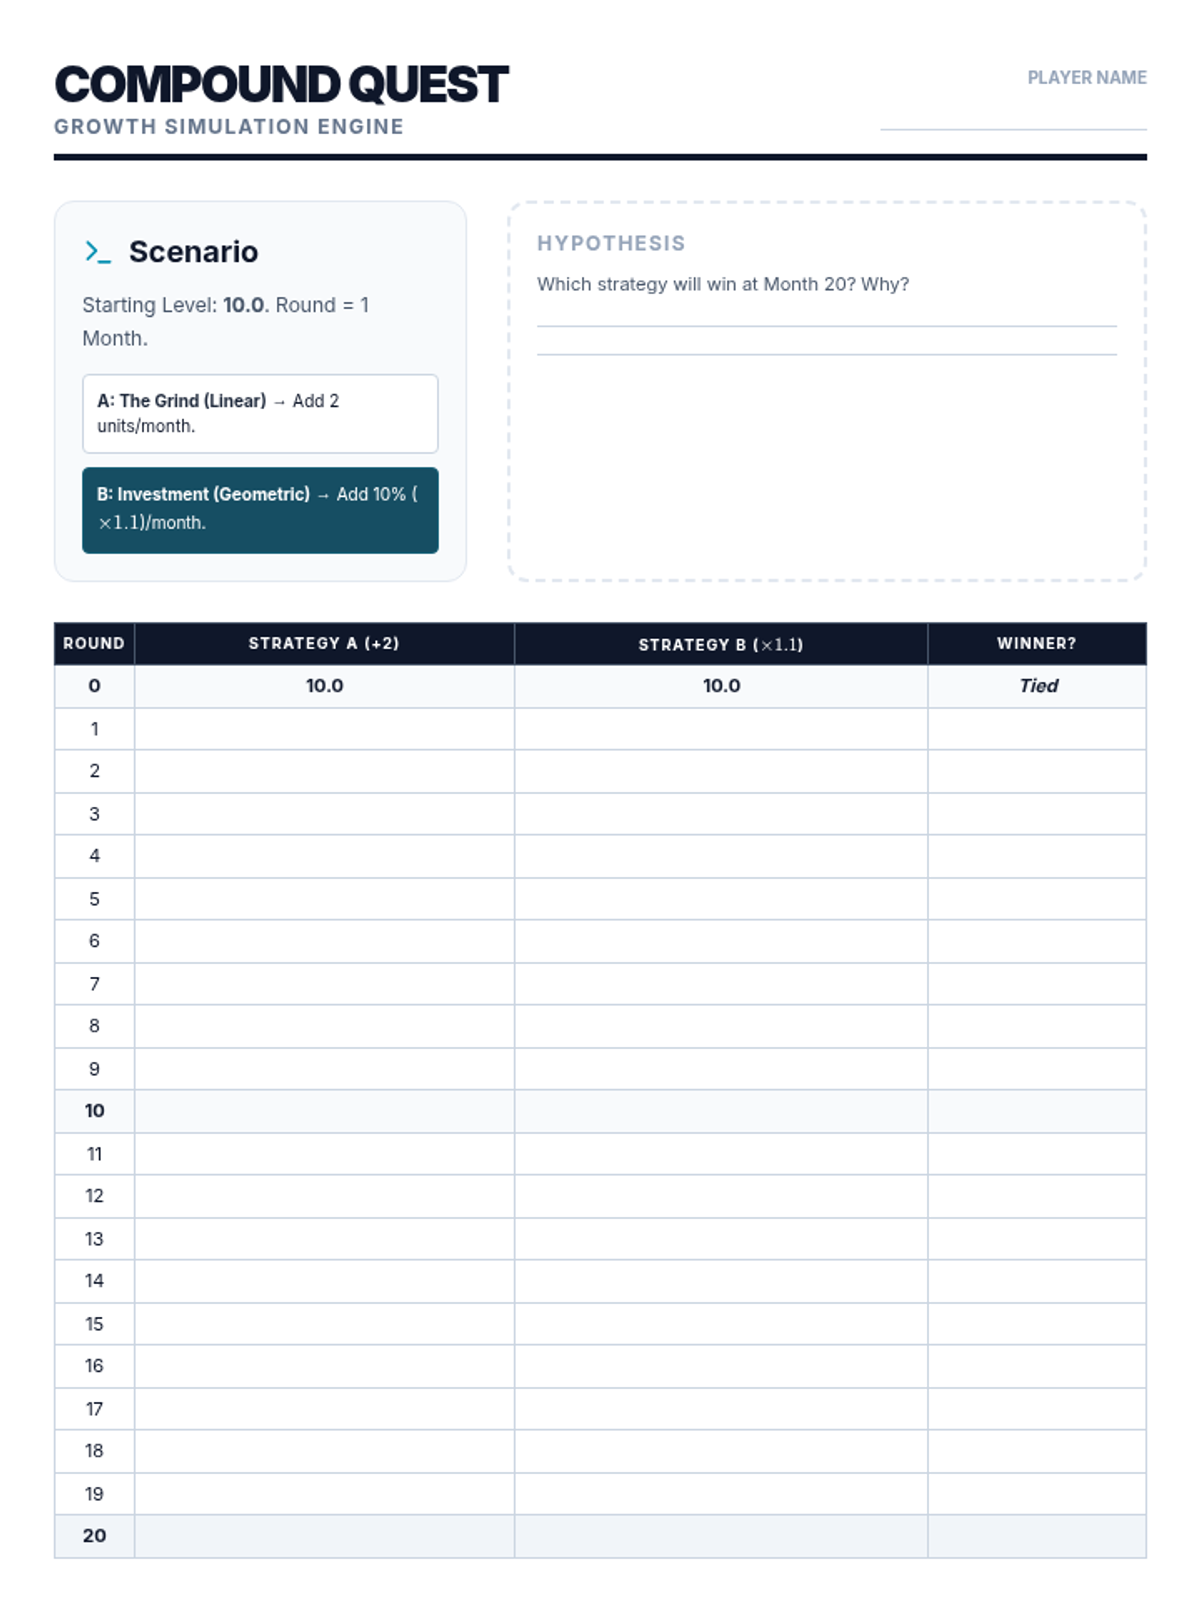
An exploration of geometric growth and the power of incremental habits for grades 7-12, combining mathematical modeling with behavioral science.
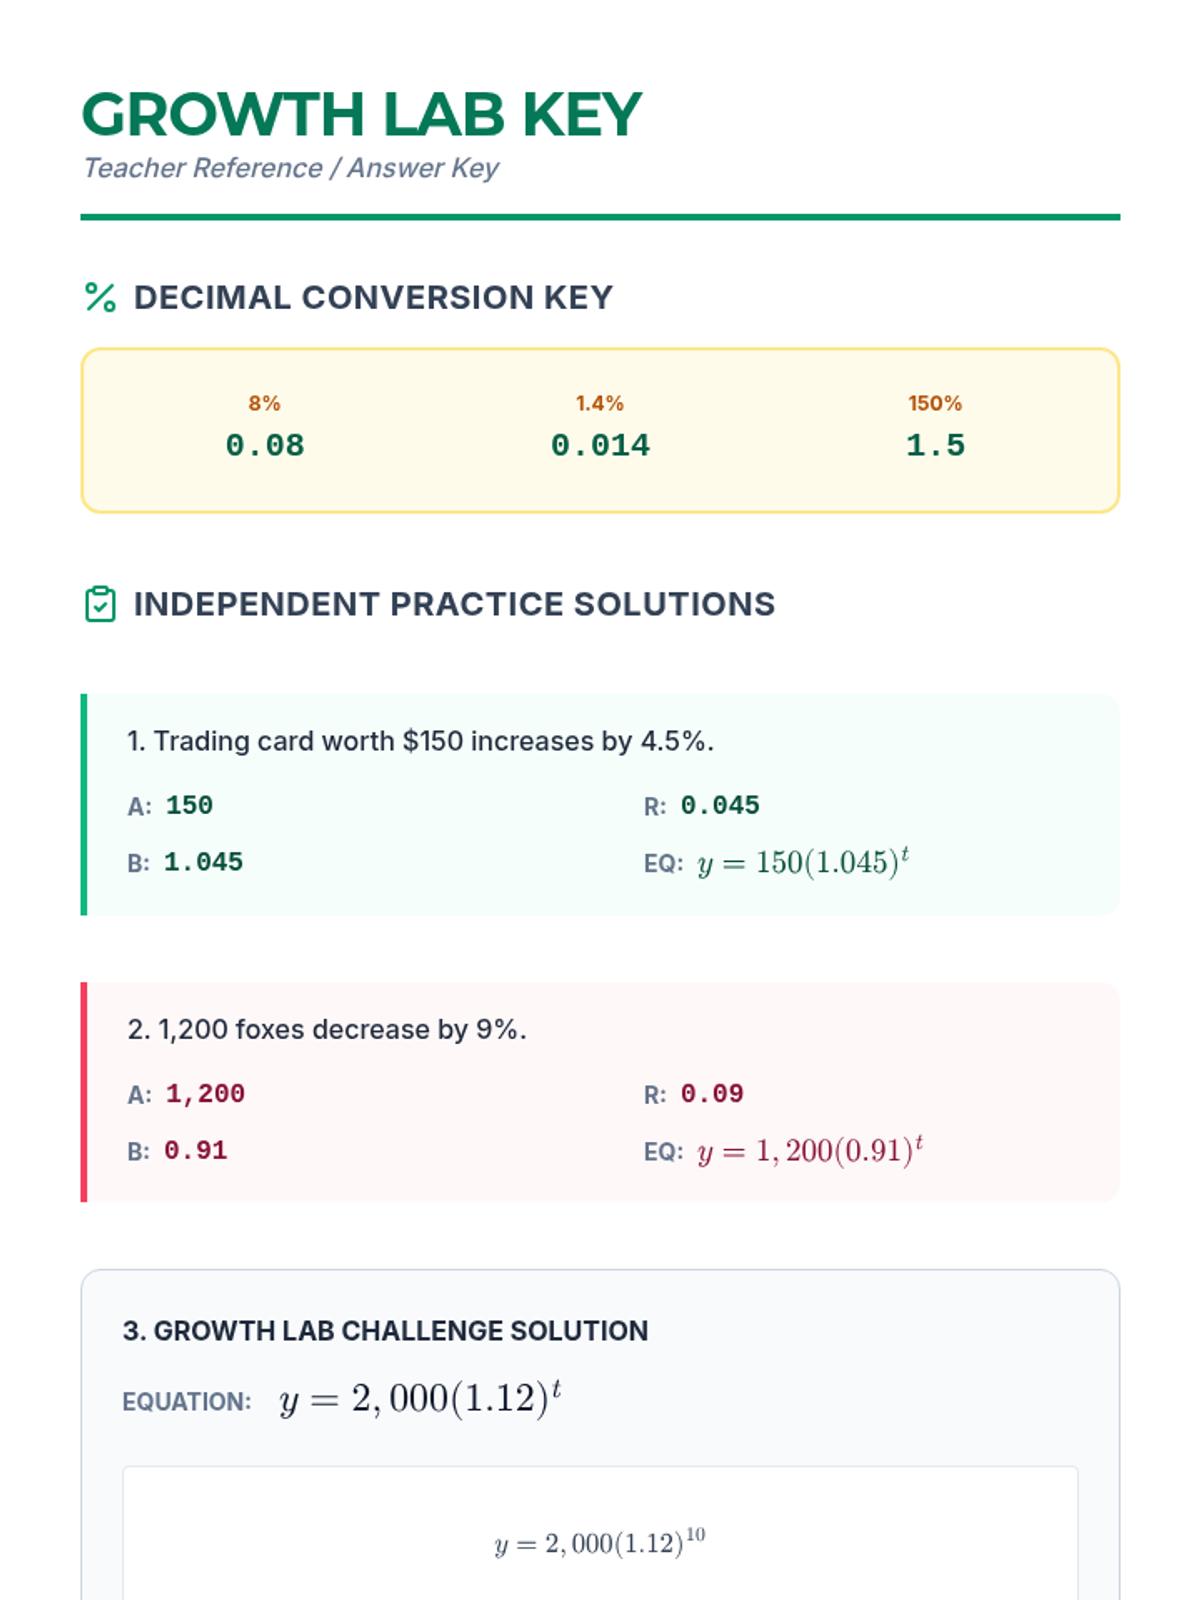
A lesson exploring the mathematics of exponential growth and decay through real-world scenarios, focusing on formula mastery and percentage-to-decimal conversion.
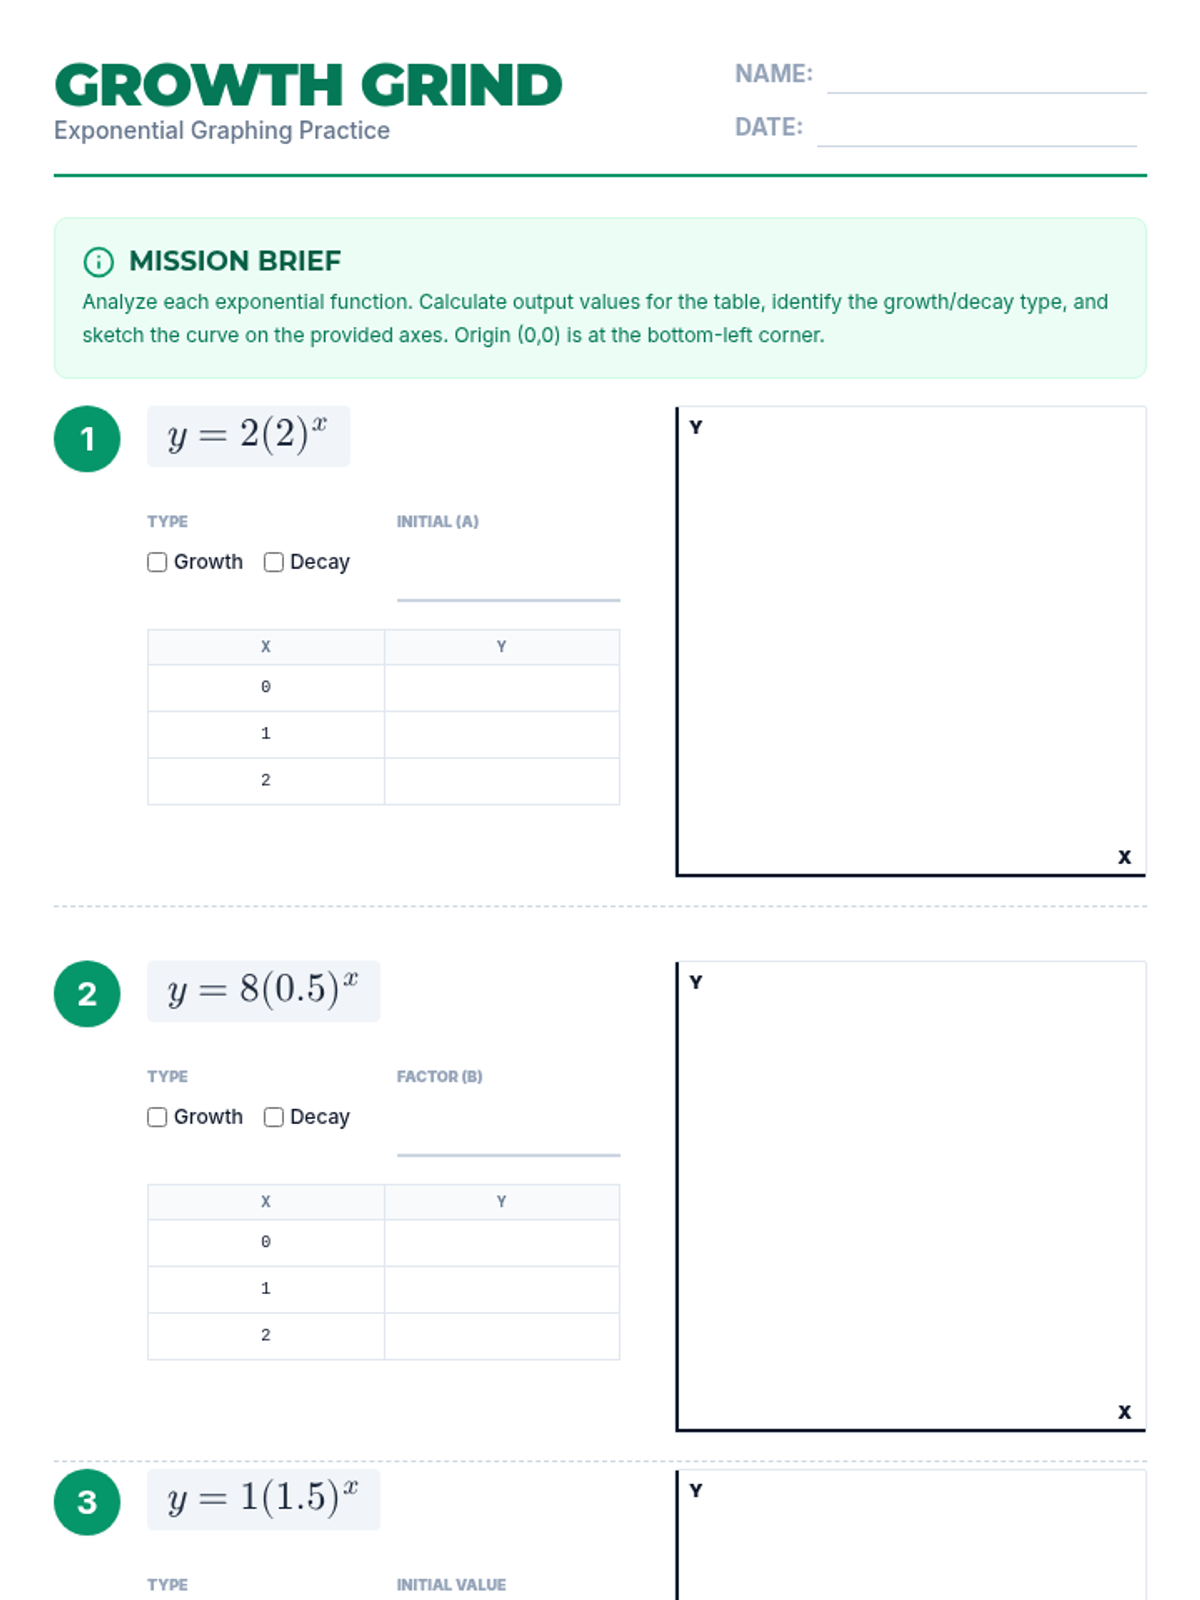
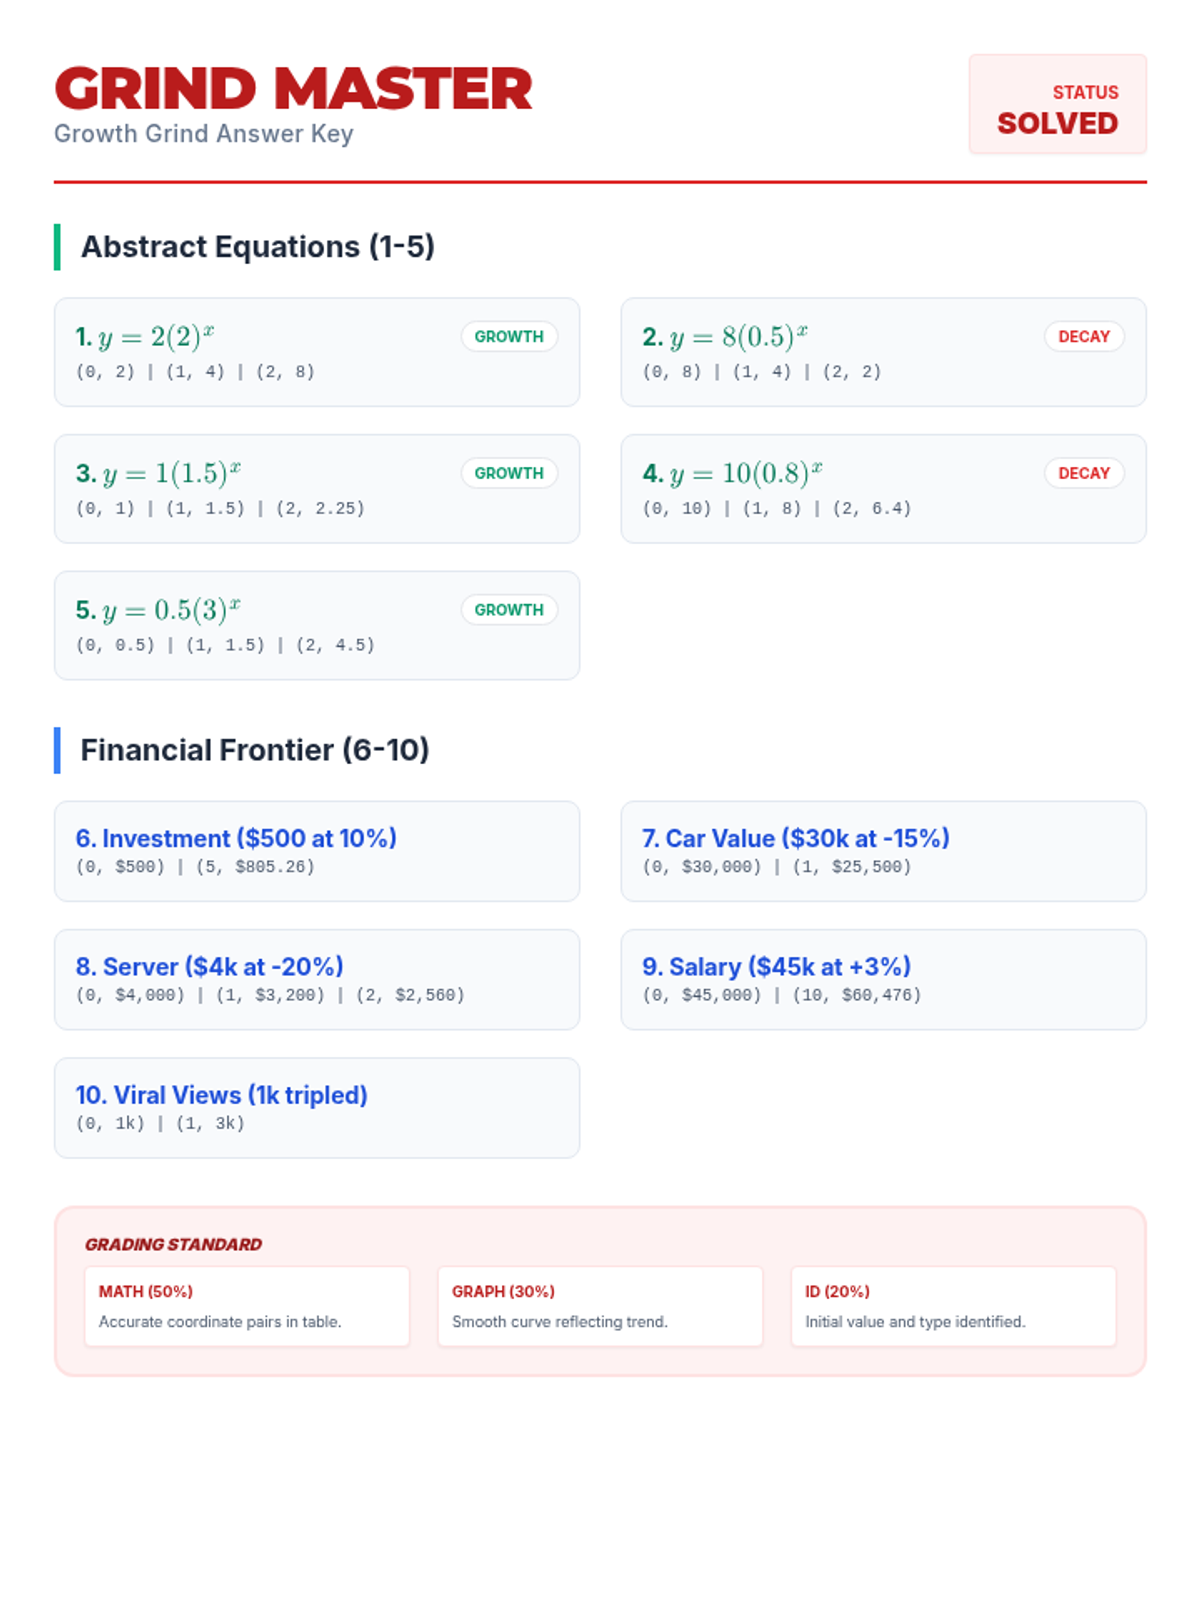
A fast-paced exploration of exponential growth and decay through abstract equations and real-world financial scenarios. Students practice graphing curves and calculating data points to visualize rapid change.
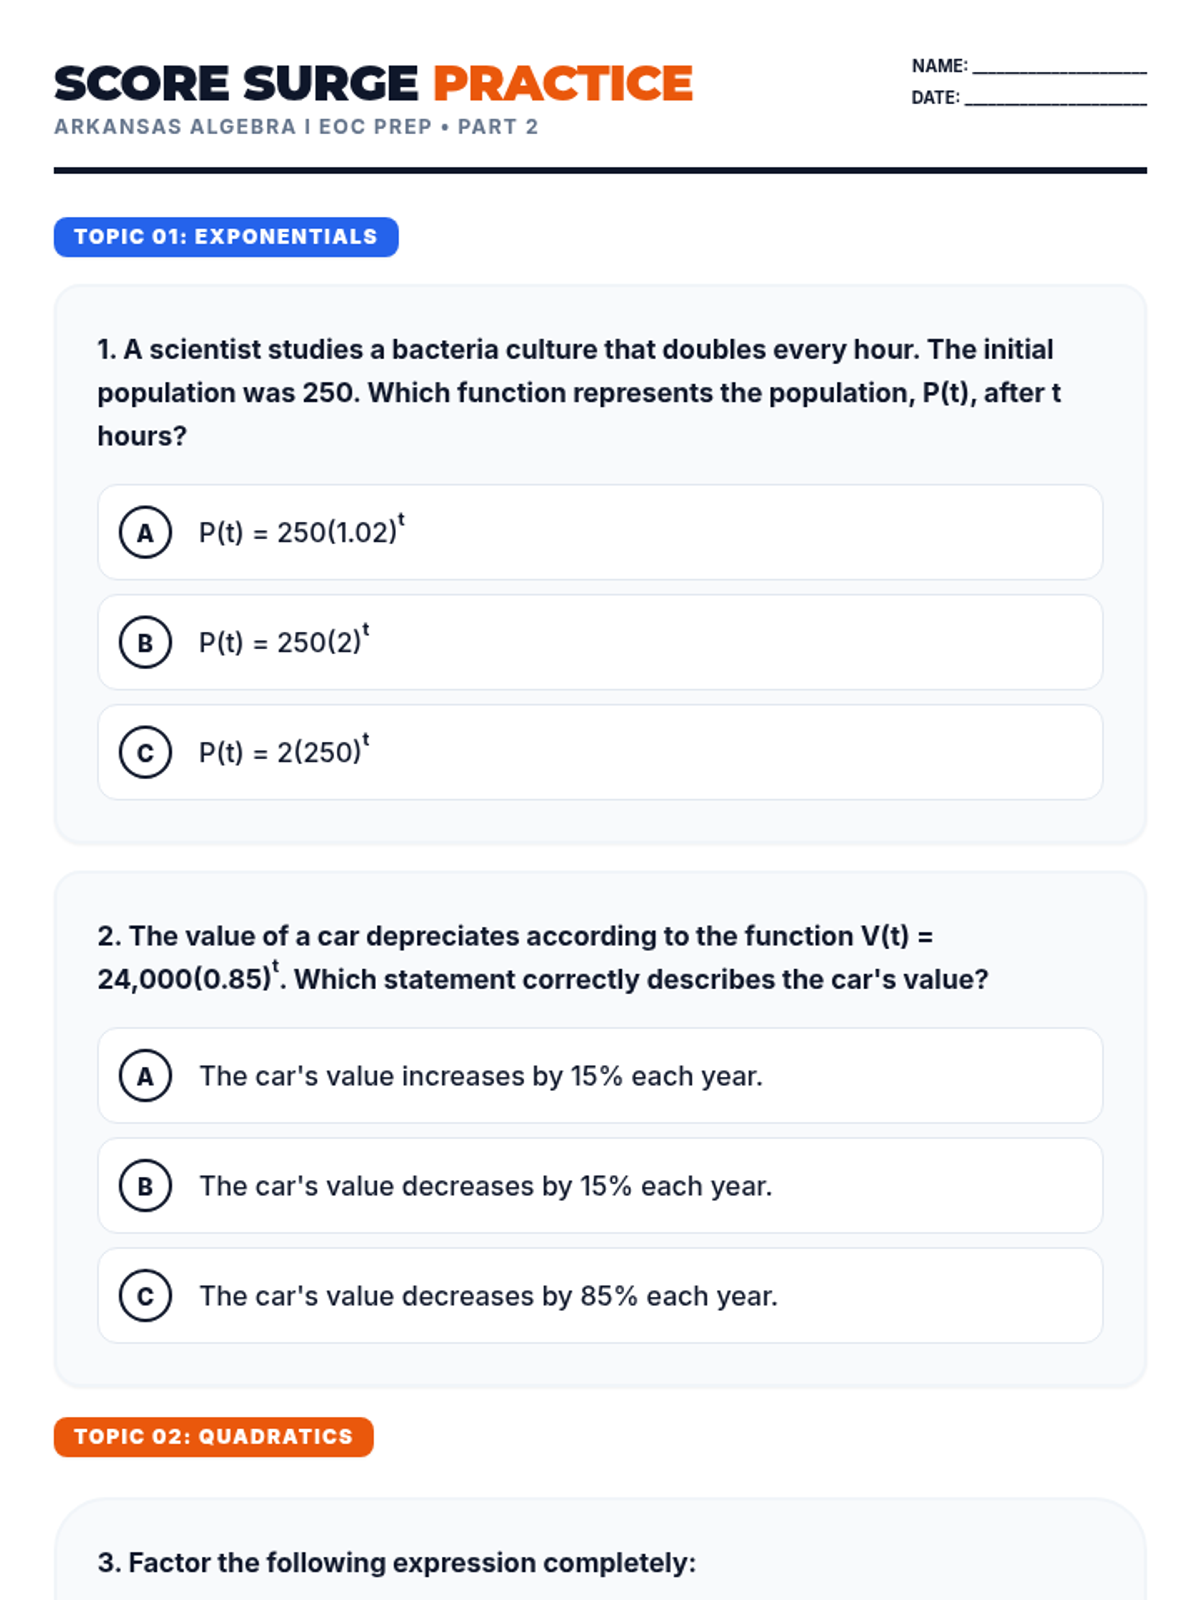
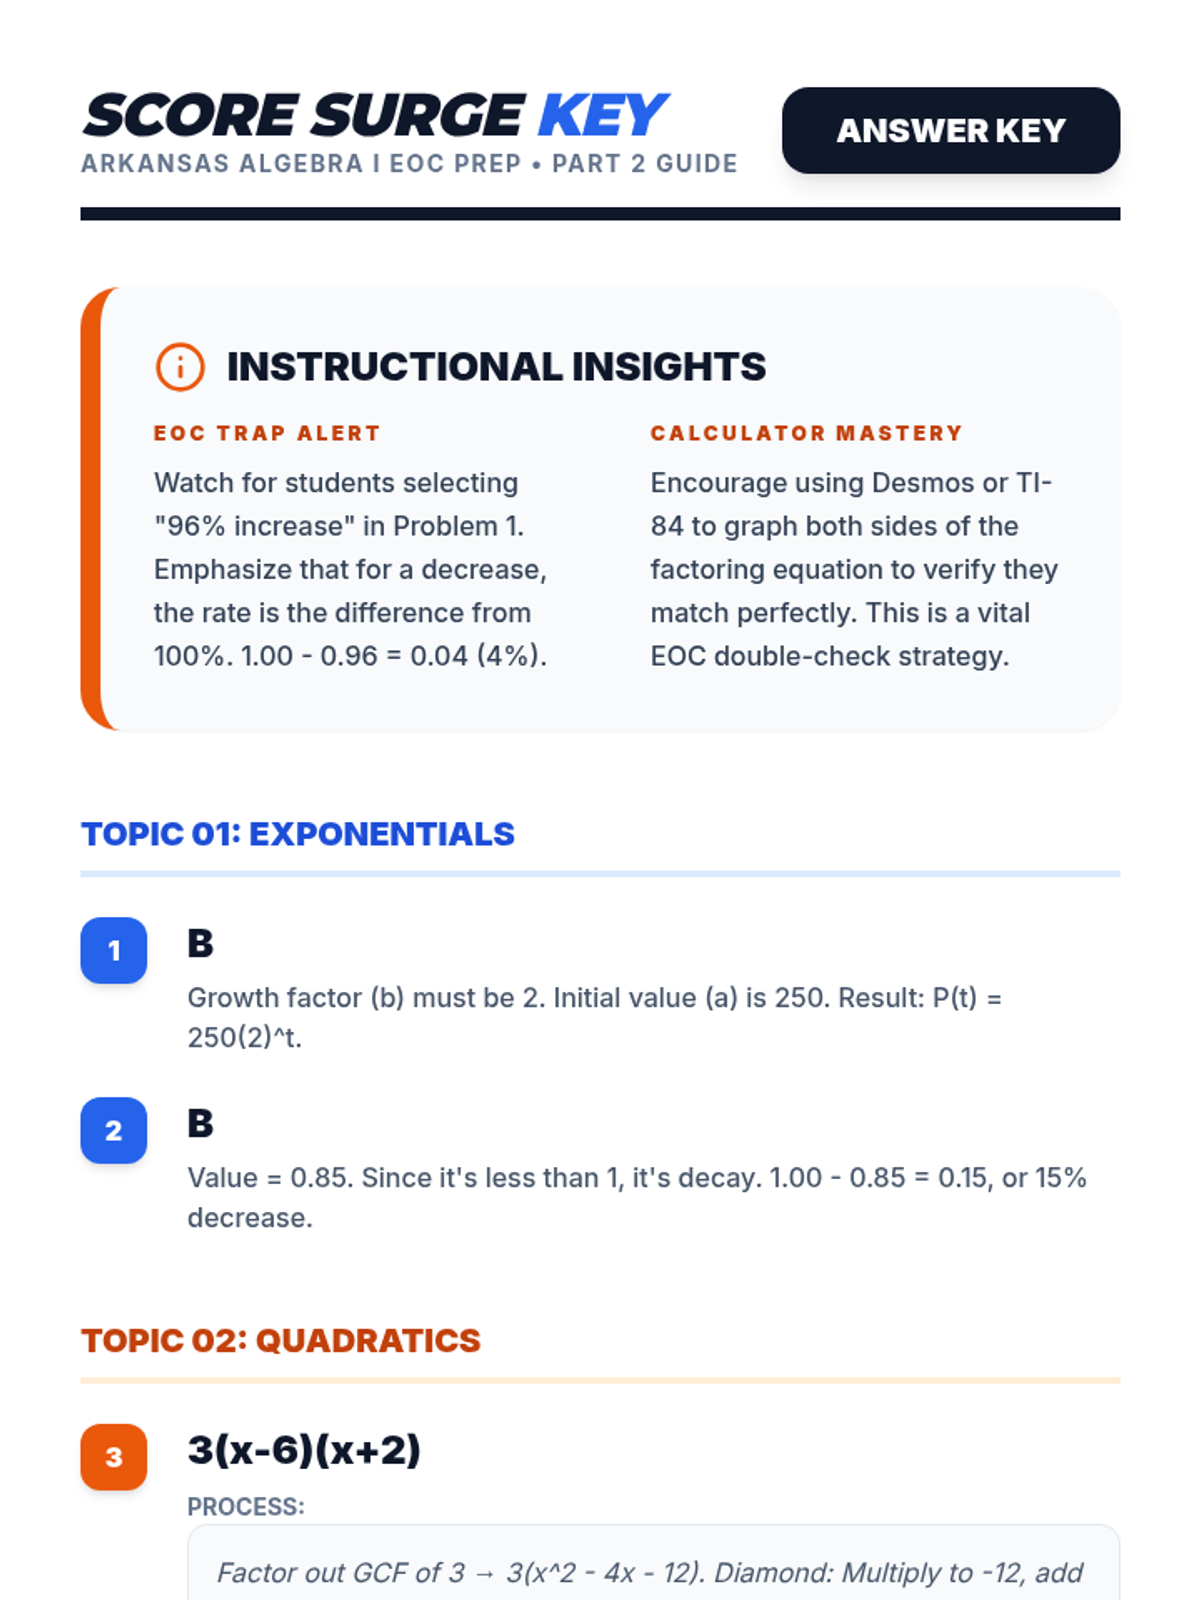
A high-intensity EOC preparation lesson focused on mastering exponential functions, quadratic expressions, and data statistics for the Arkansas Algebra I state exam.
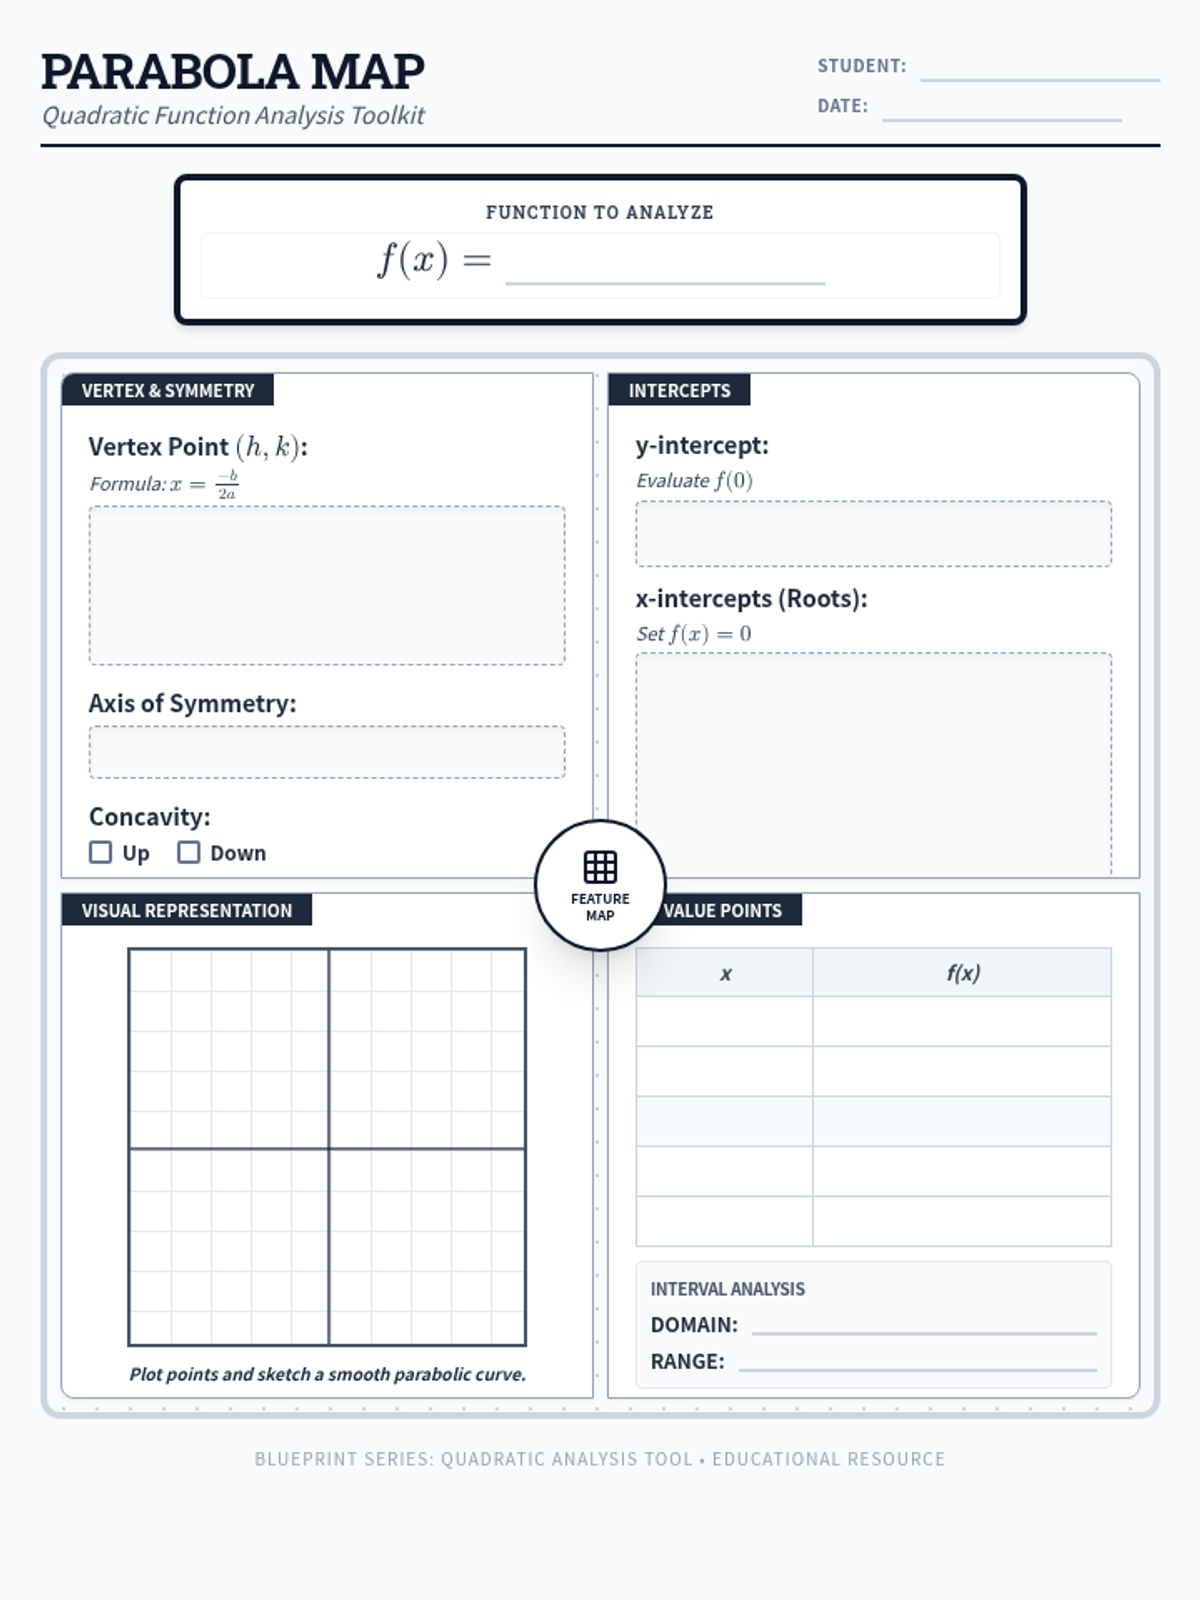
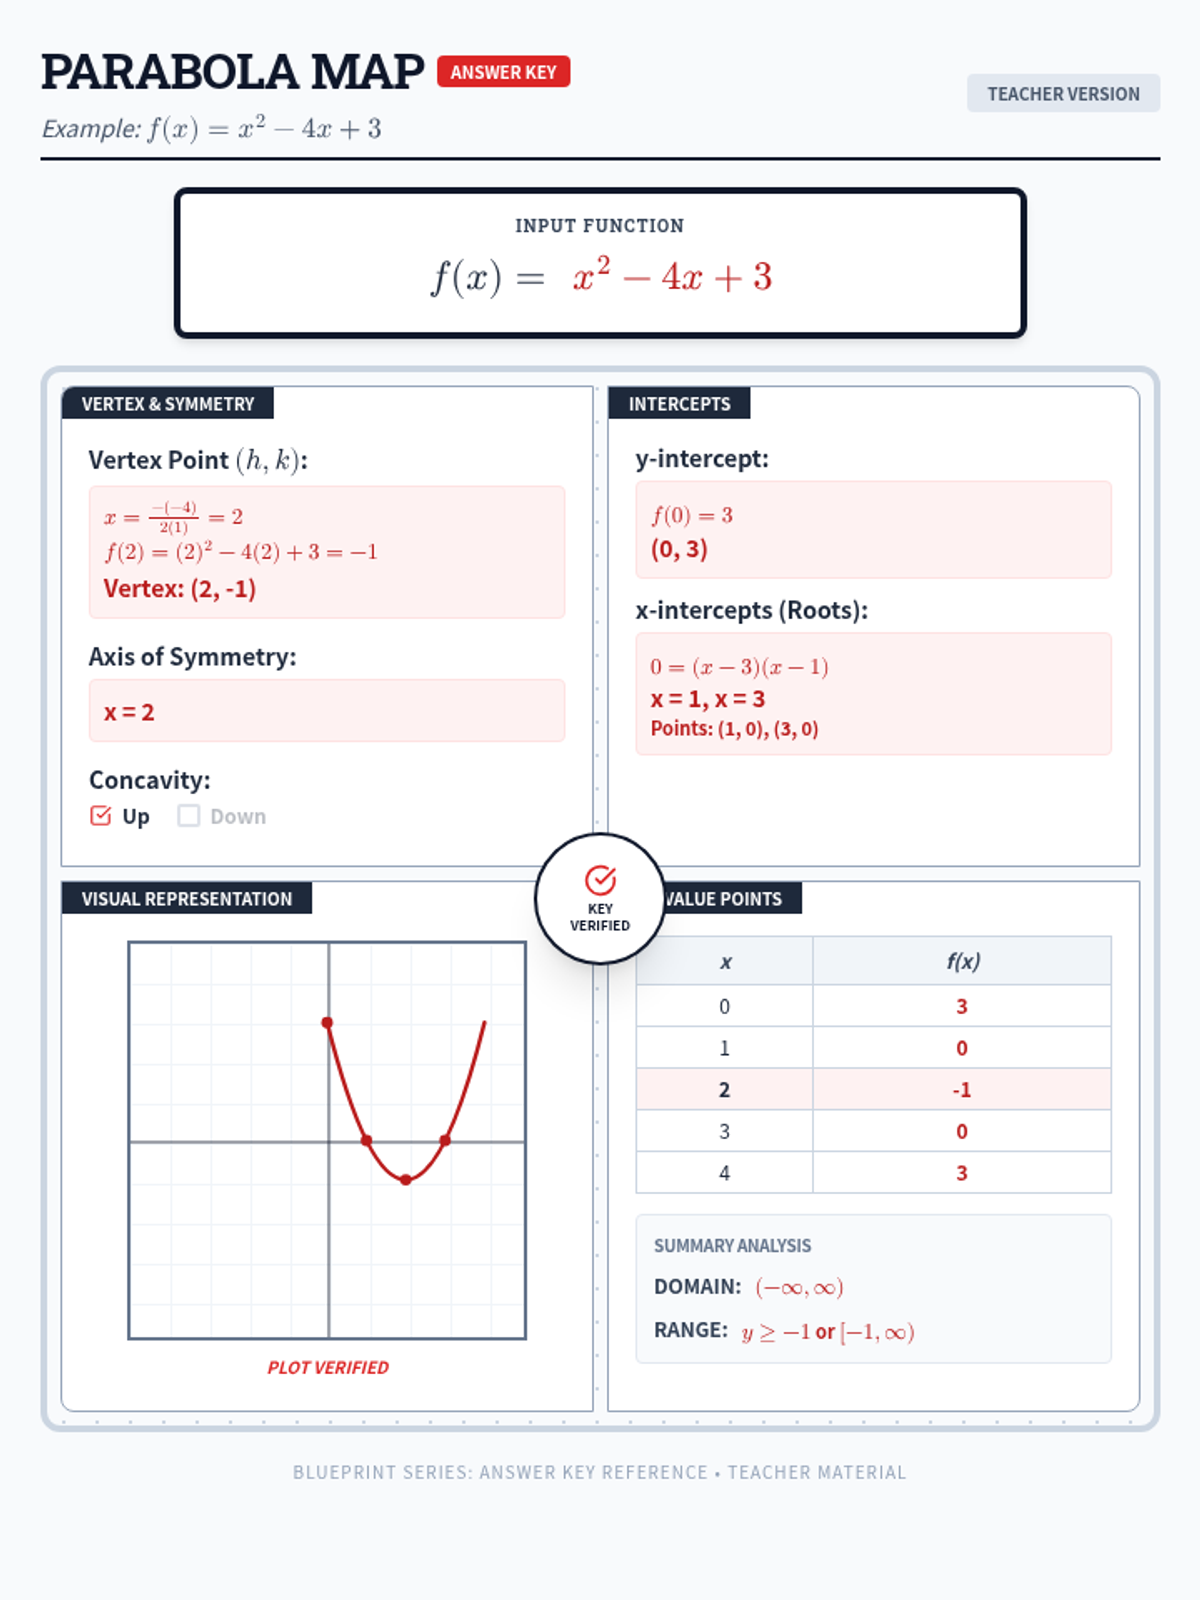
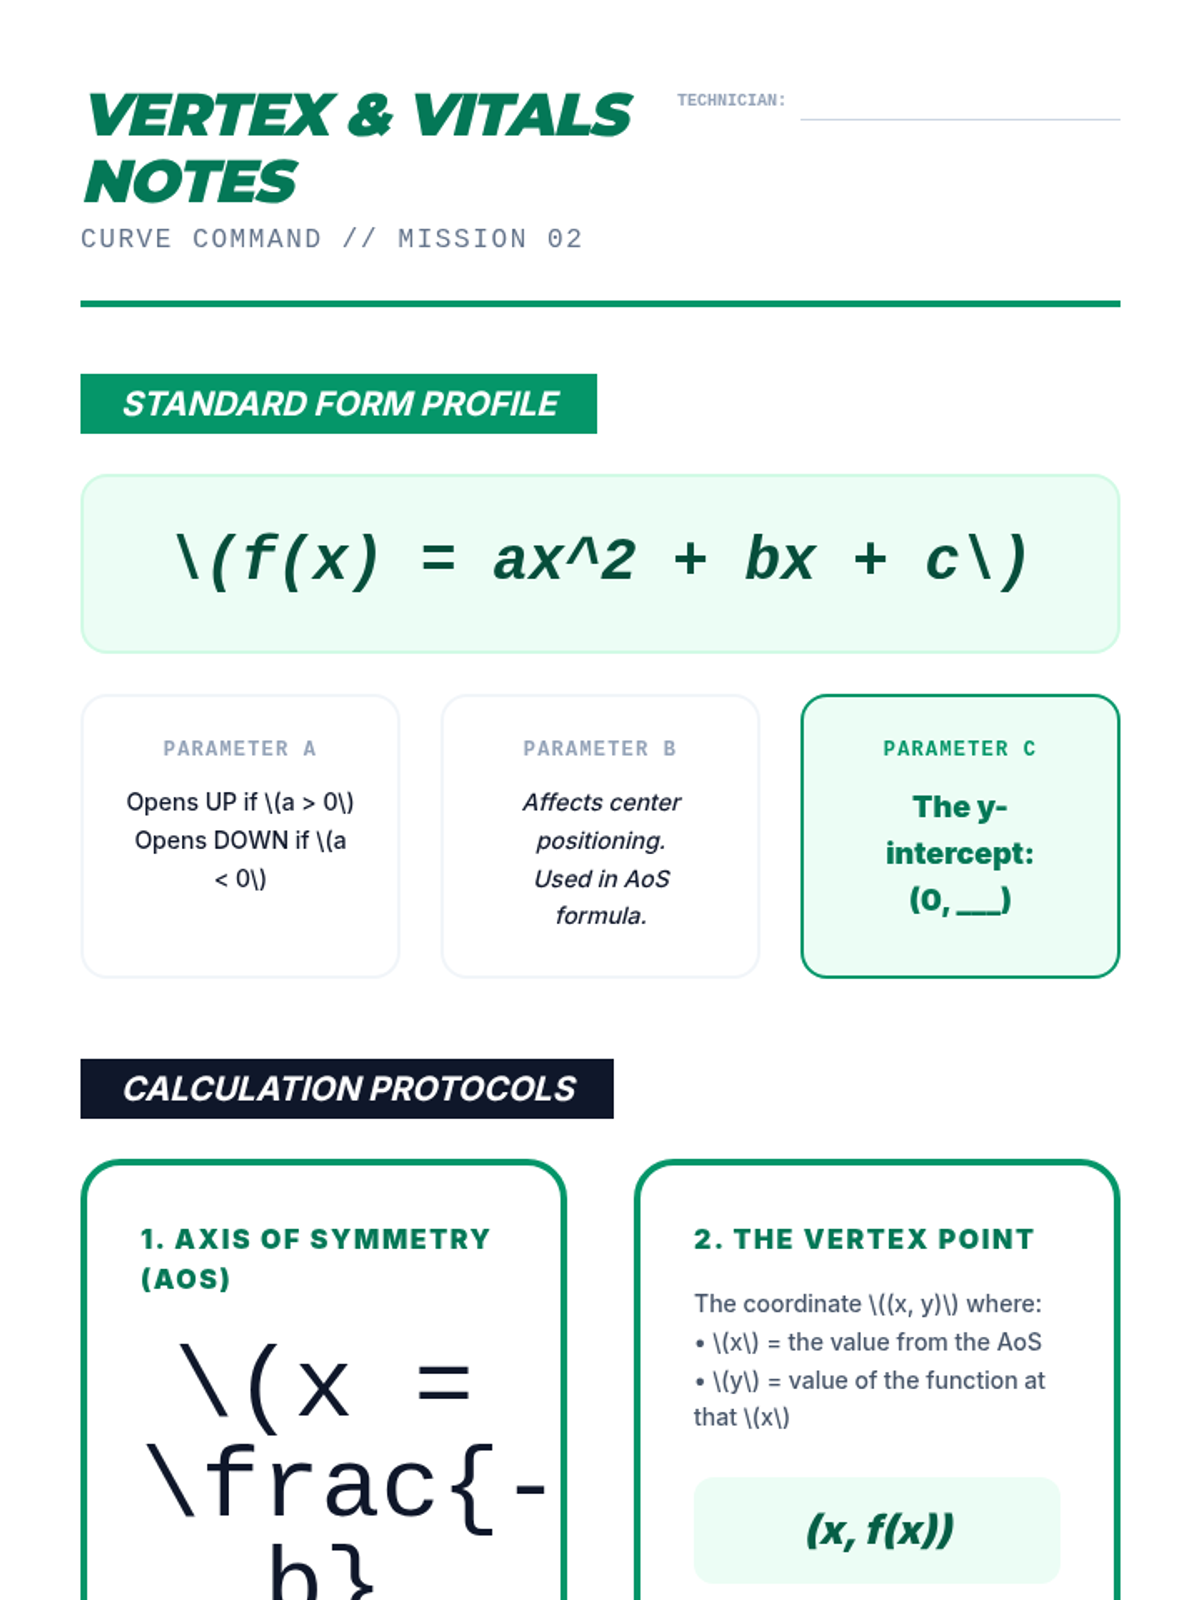
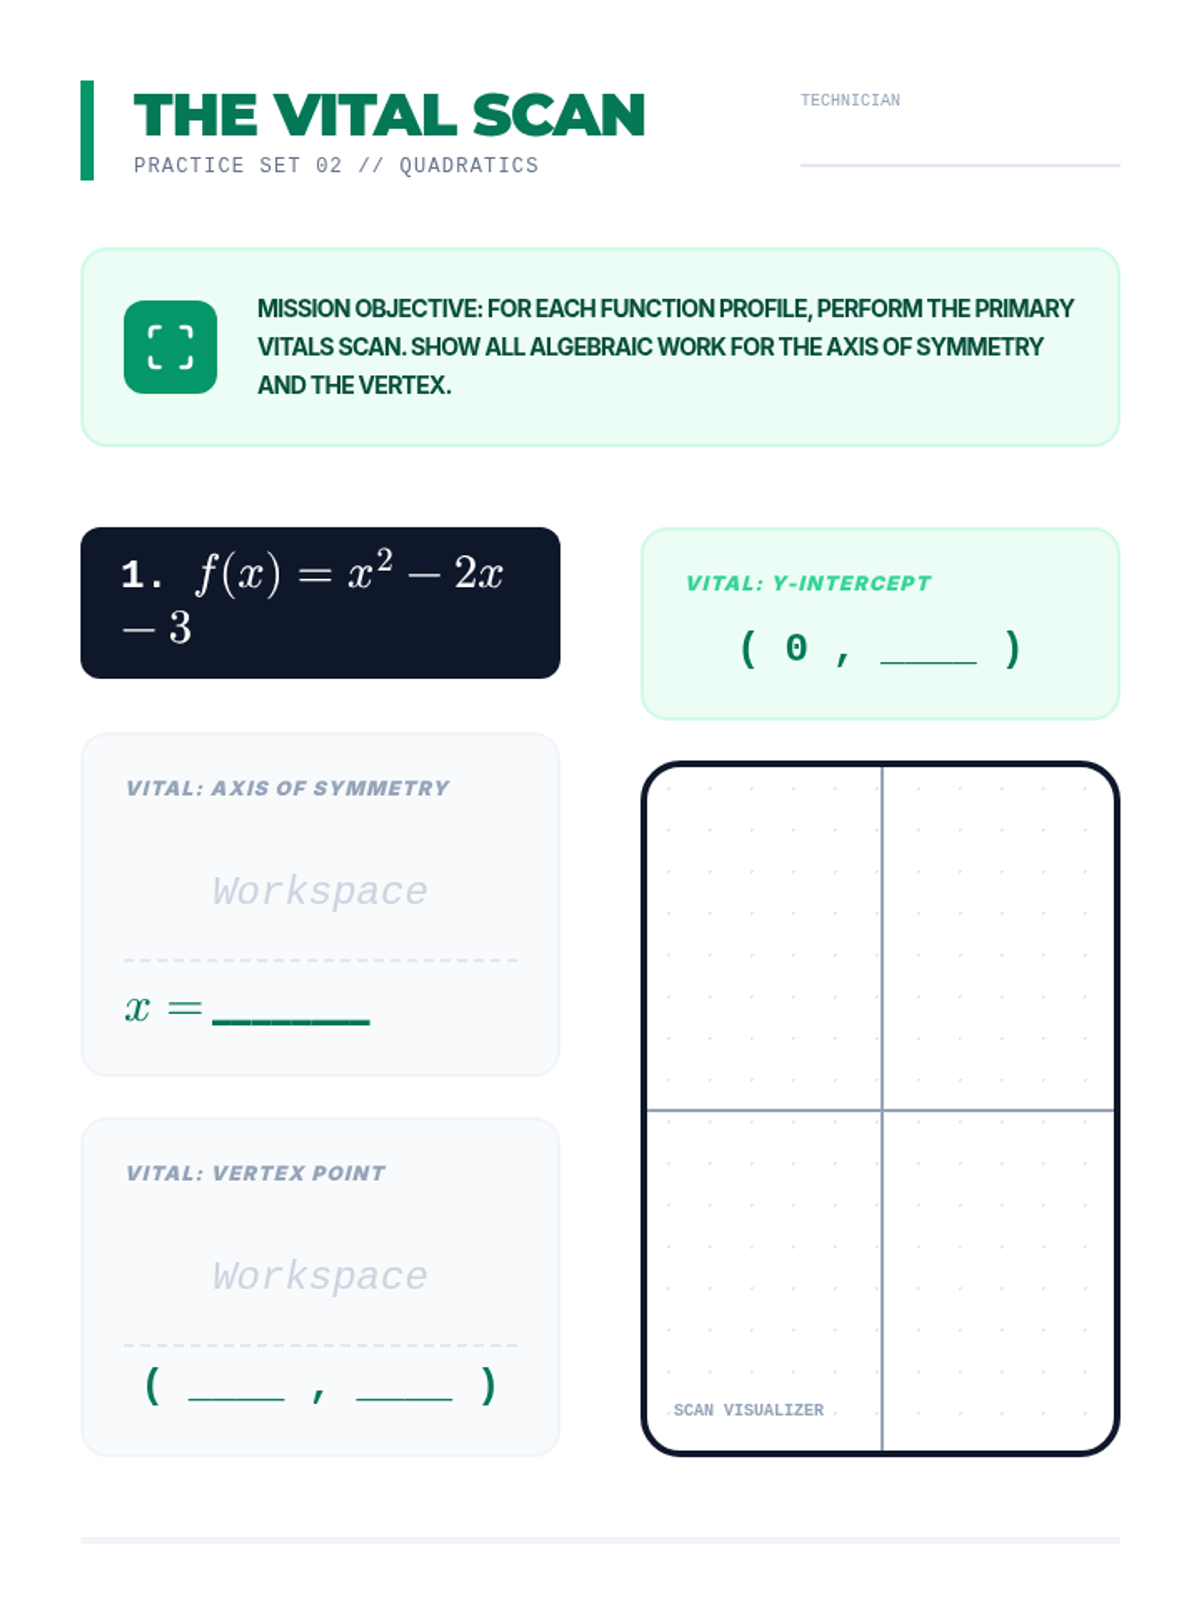
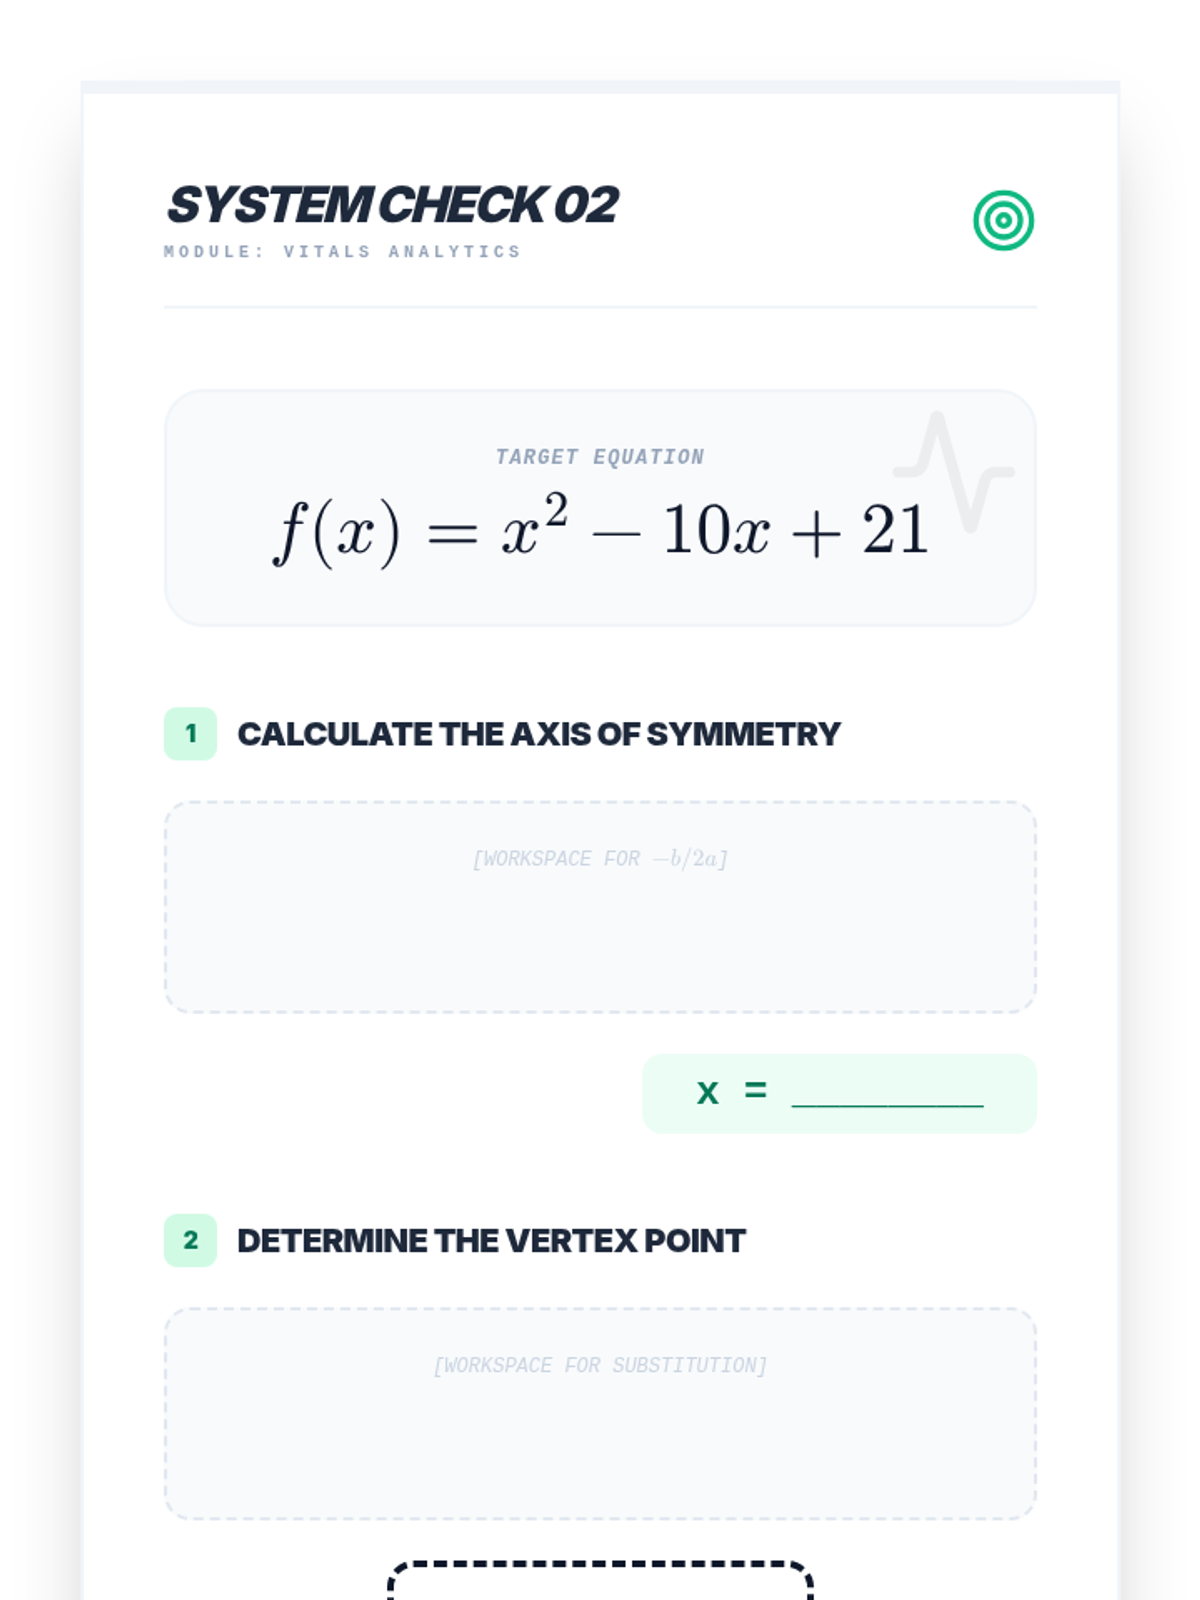
This lesson introduces students to the key features of quadratic functions using a structured graphic organizer. Students will identify and calculate the vertex, axis of symmetry, and intercepts to better understand the behavior of parabolas.
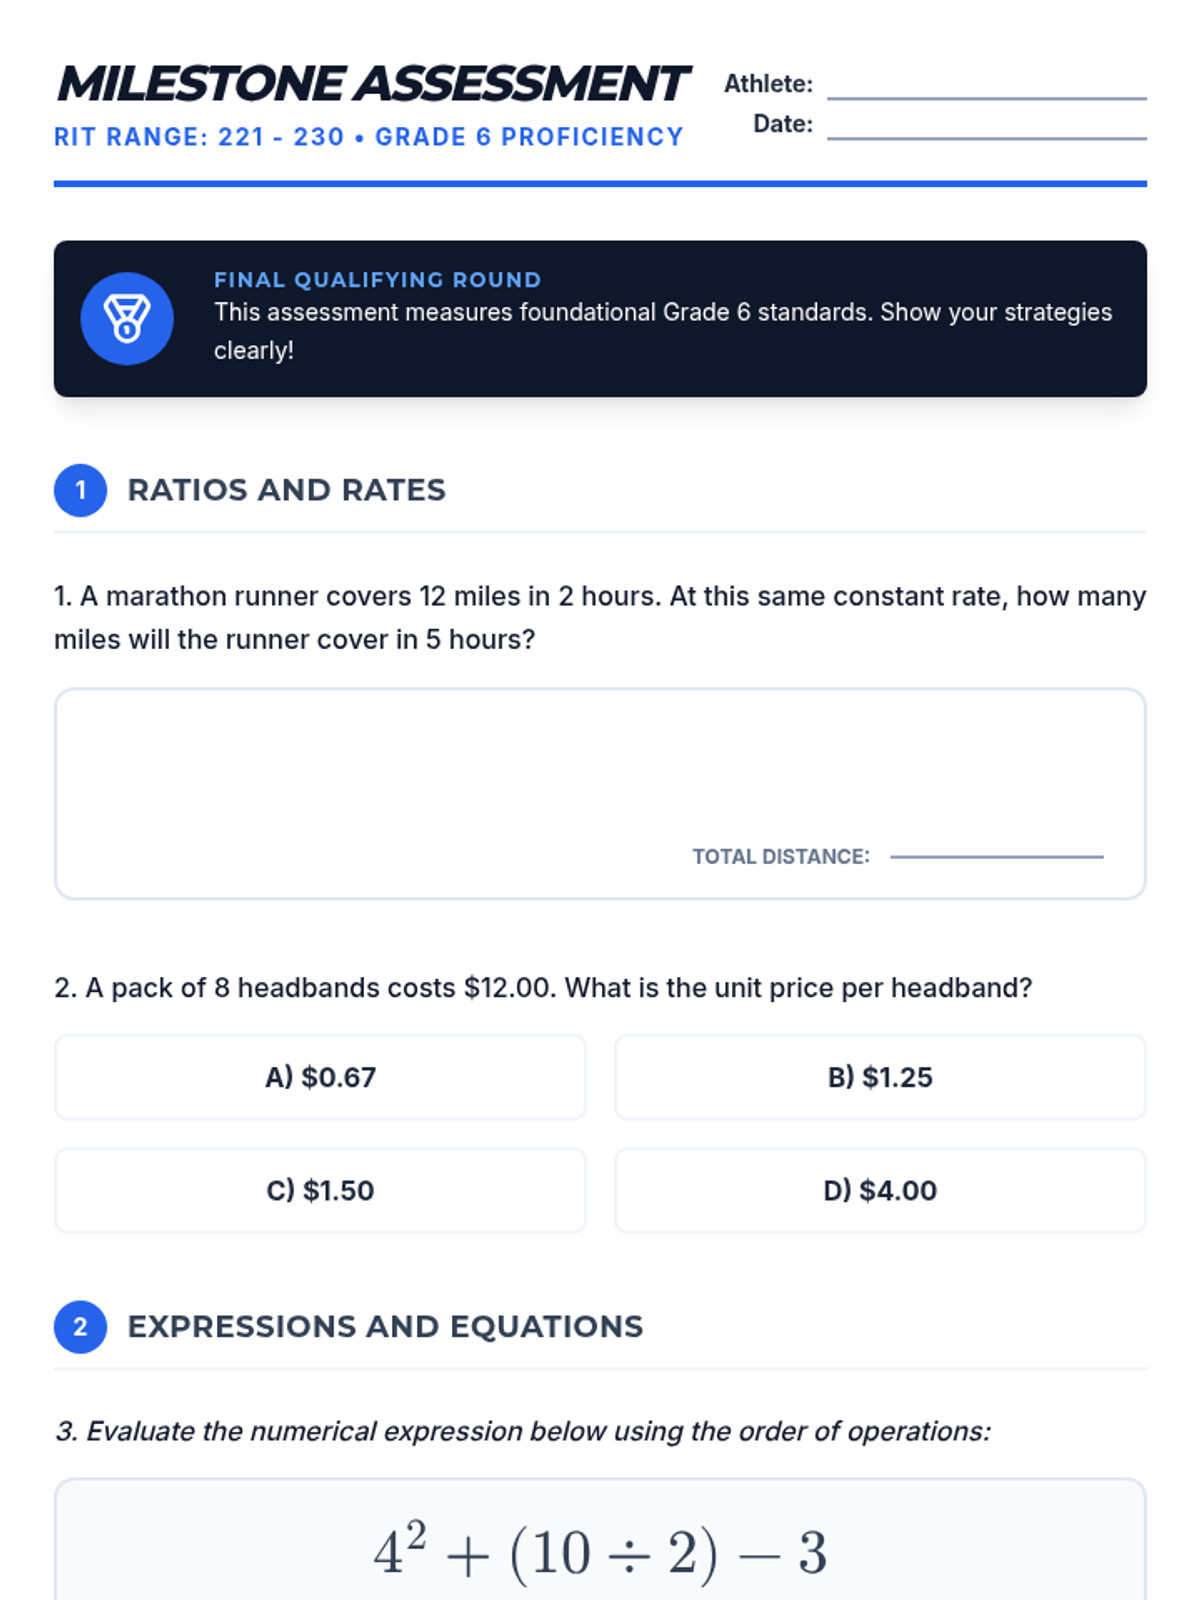
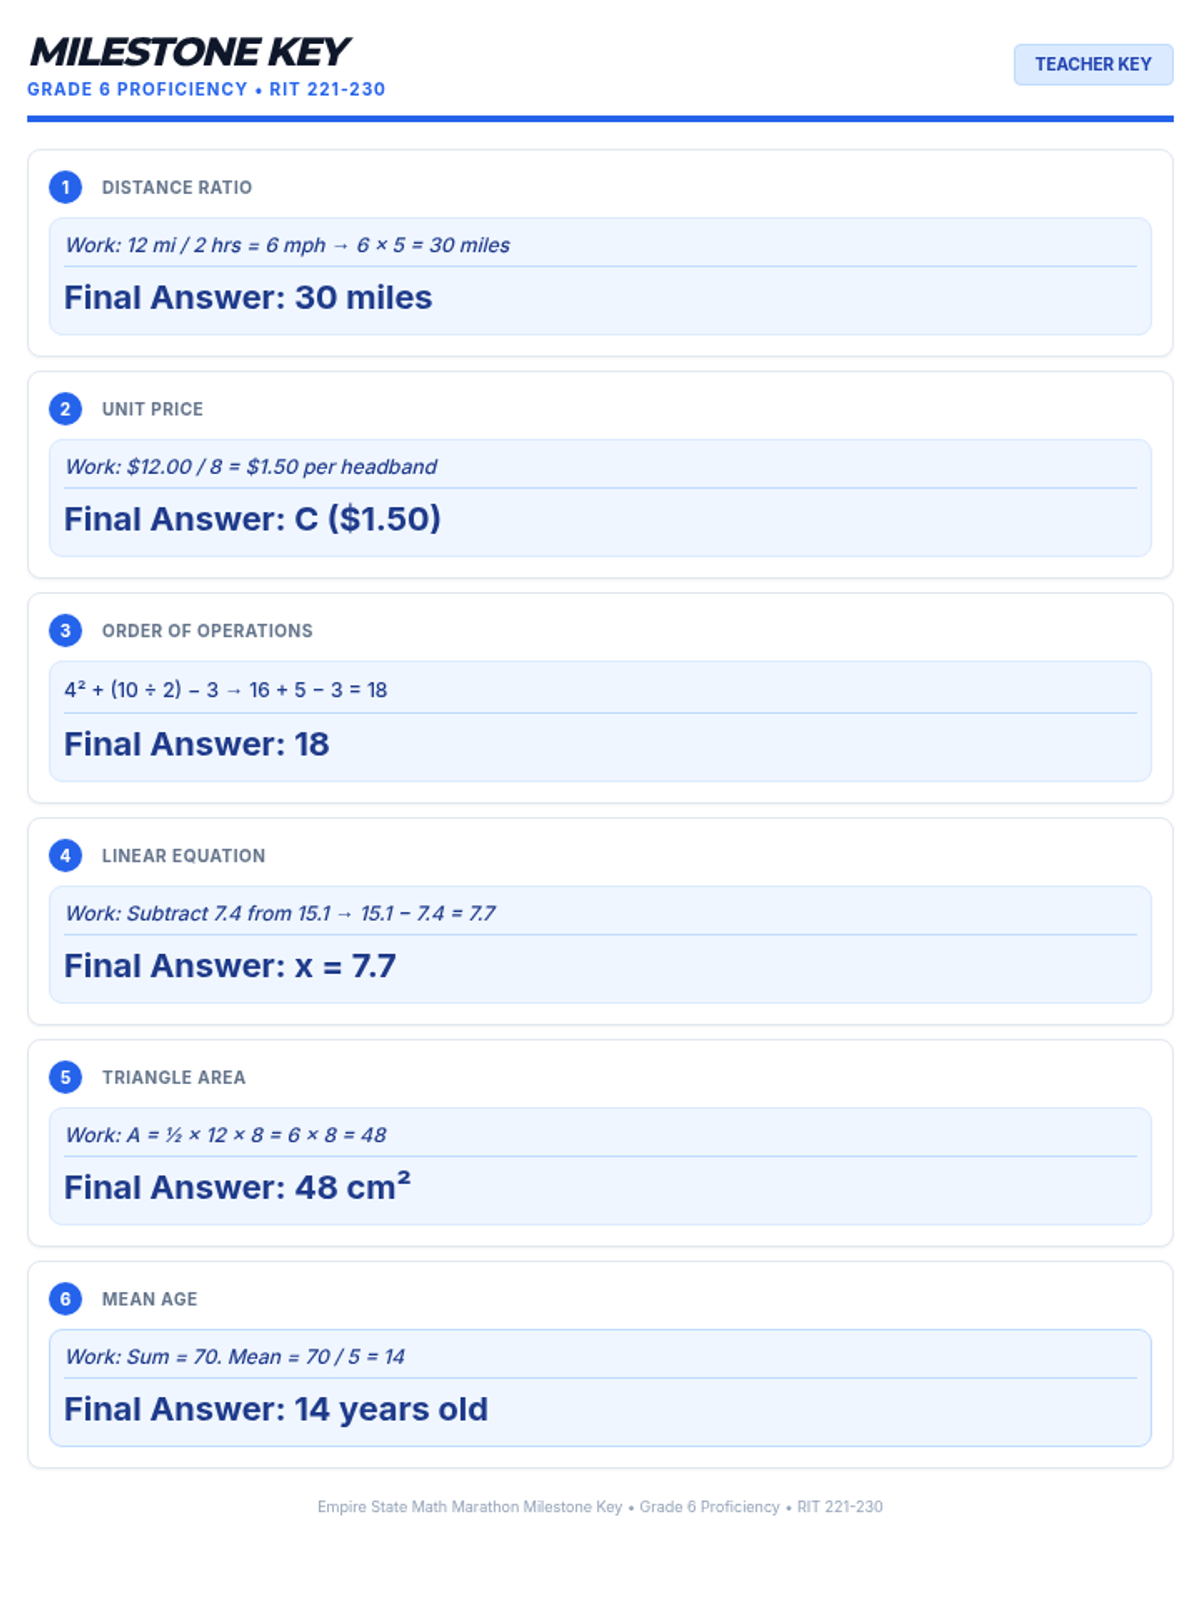
A cumulative milestone assessment designed for students at Grade 6 proficiency (RIT 221-230). This assessment checks foundational understanding of ratios, expressions, and geometry needed for 8th-grade success.
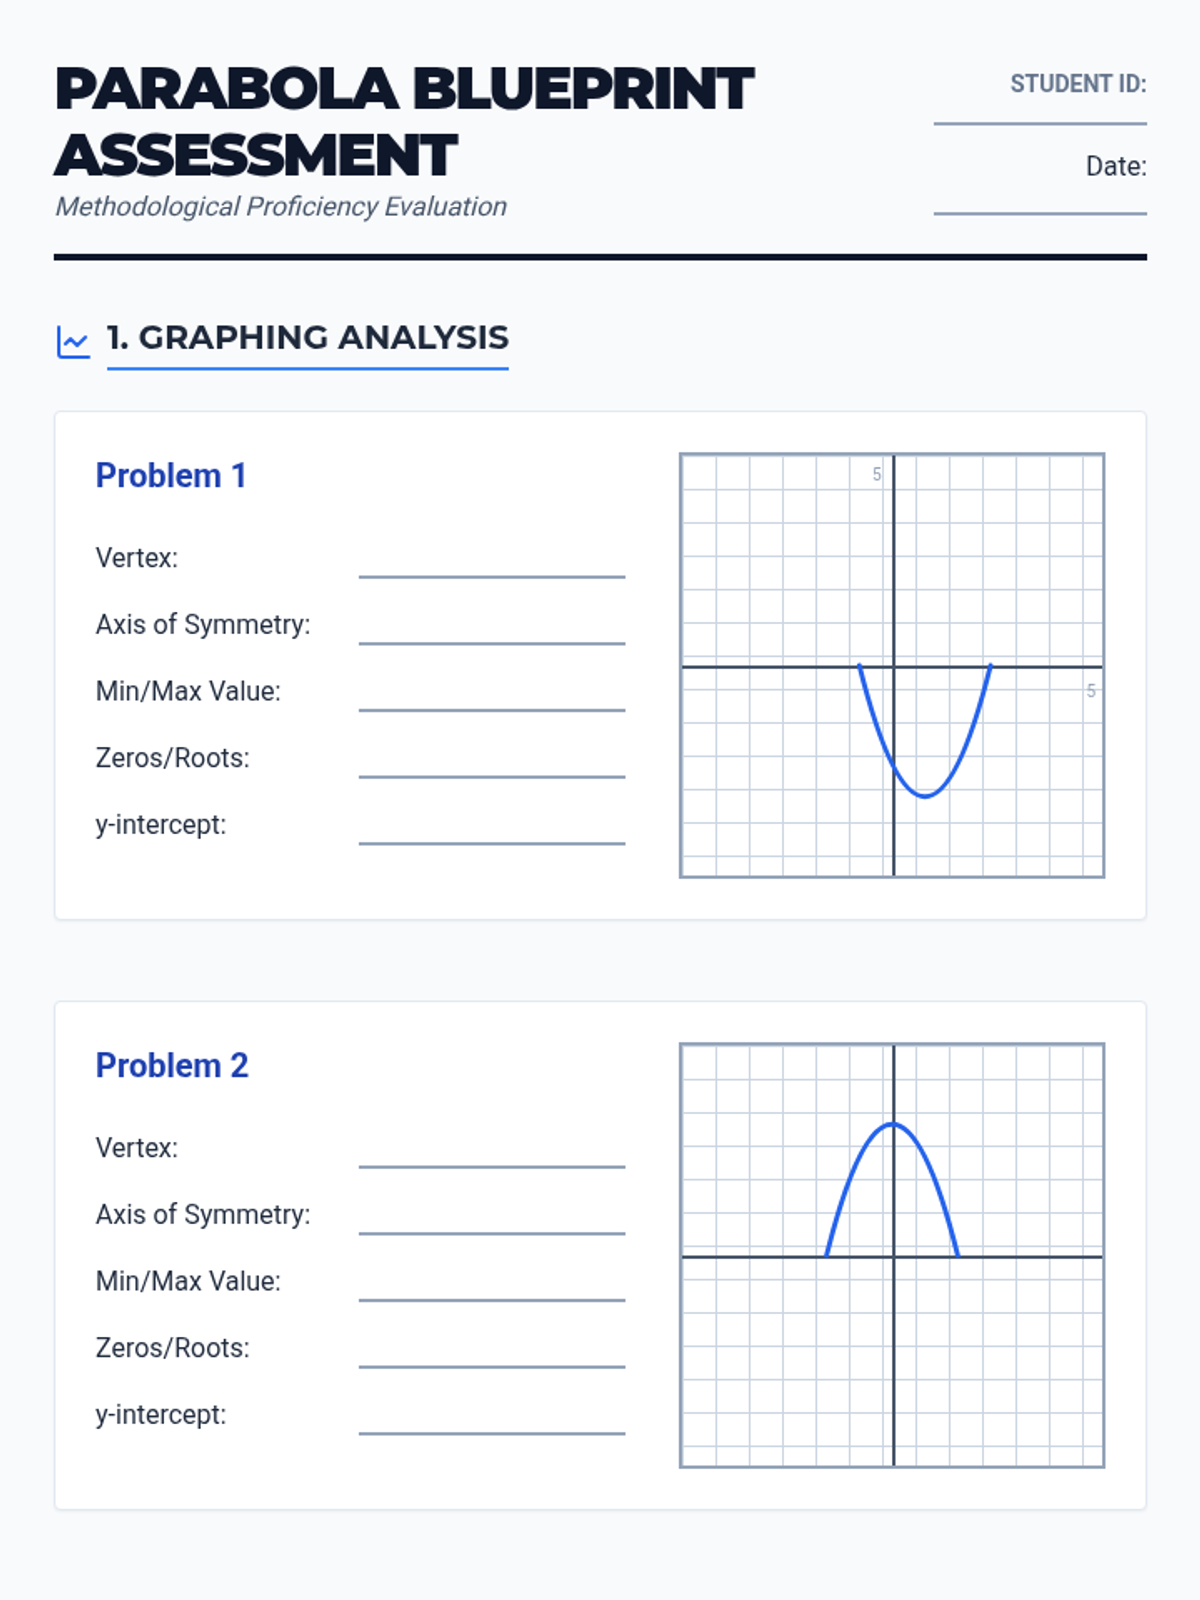
Summative assessment covering intercepts, vertex, AOS, and solving quadratic equations using various methods.
Comprehensive review of unit targets including graphing features and all solving methods.
Synthesizing solving methods (graphing, factoring, formula) and choosing the most efficient strategy for different quadratic forms.
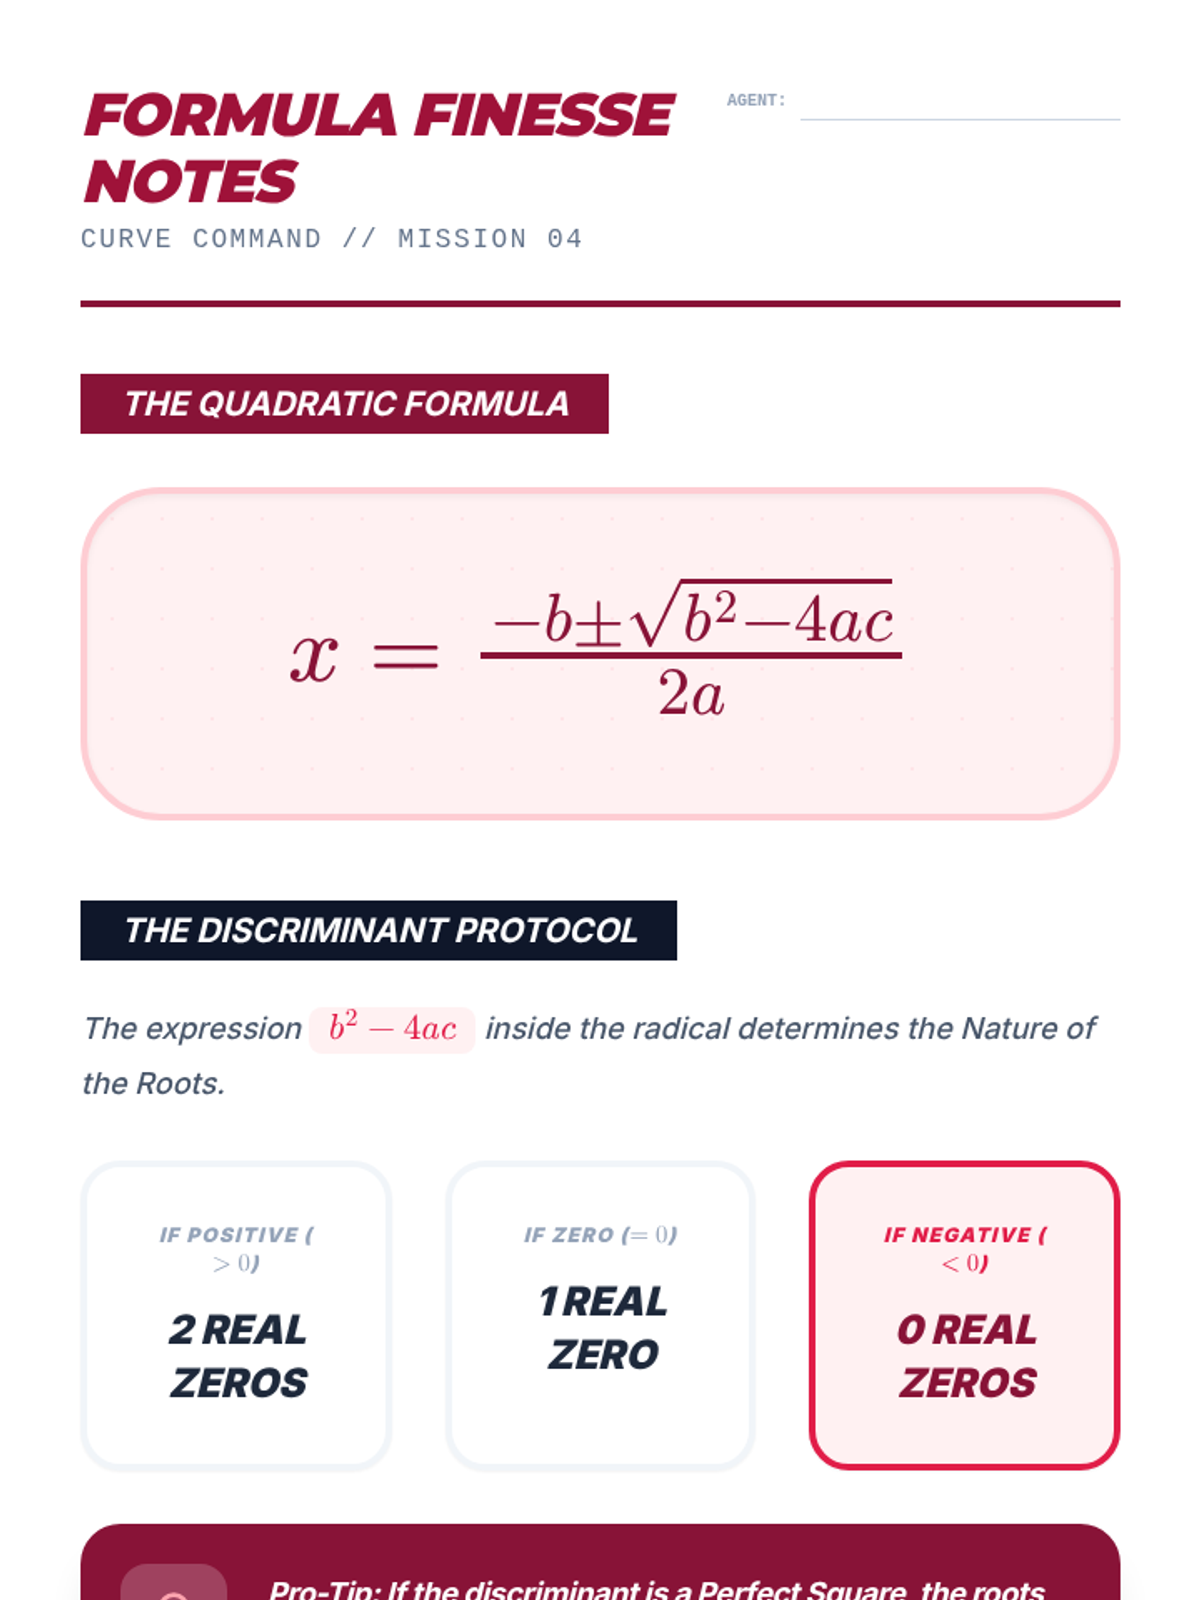
Using the quadratic formula to solve equations and the discriminant to determine the nature of the roots.
Solving quadratic equations by factoring and identifying x-intercepts using the Zero Product Property.
Finding the vertex, axis of symmetry, and intercepts of quadratic functions from standard form equations and graphs.
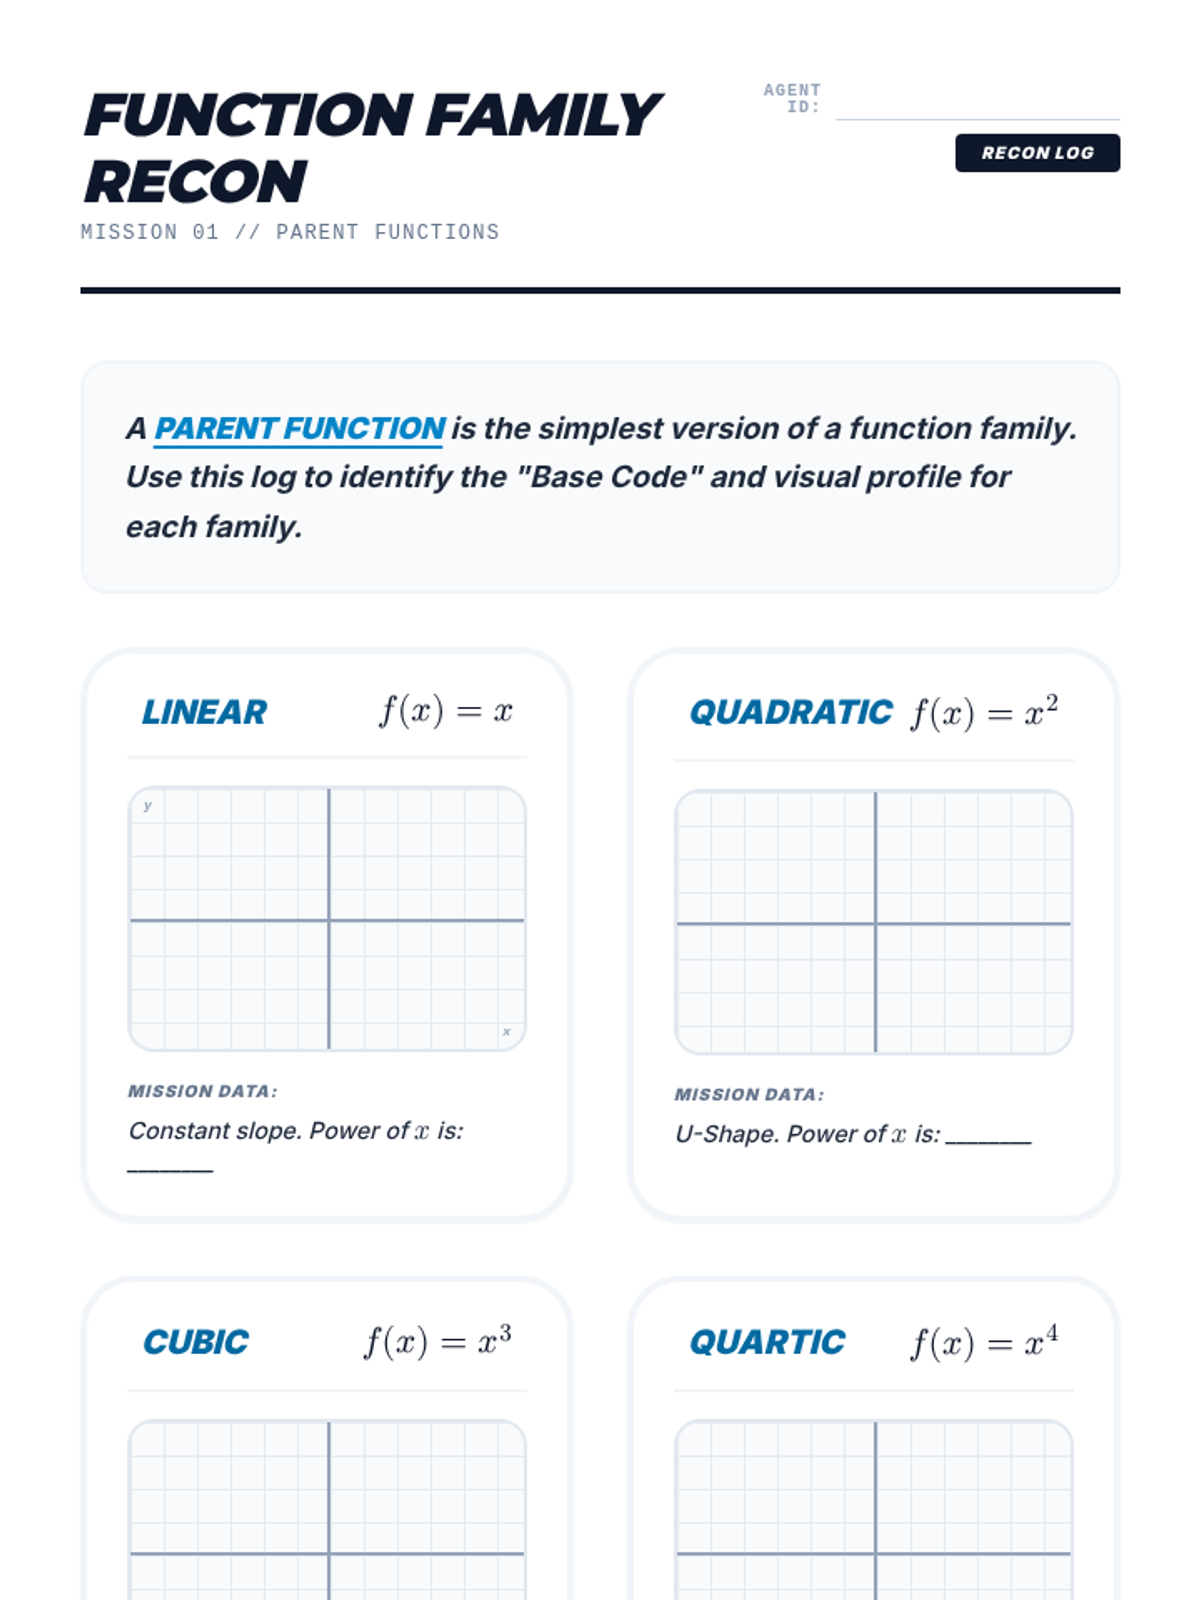
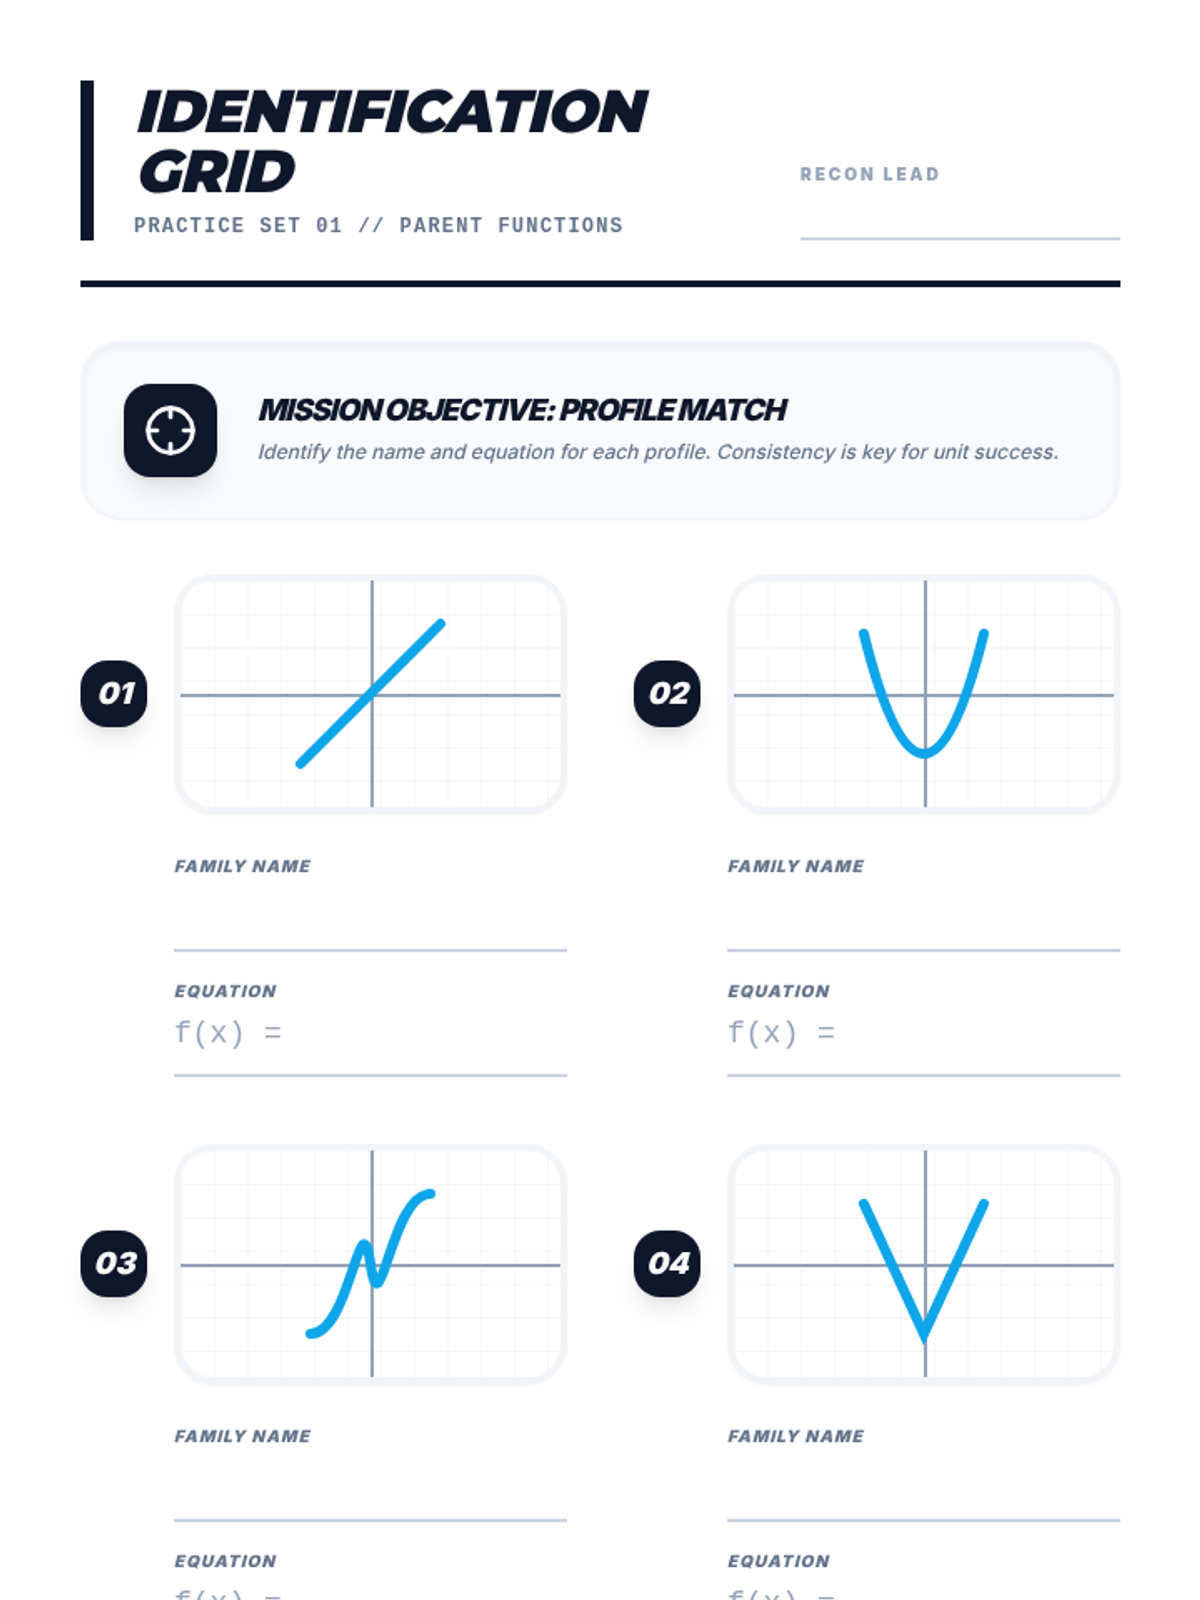
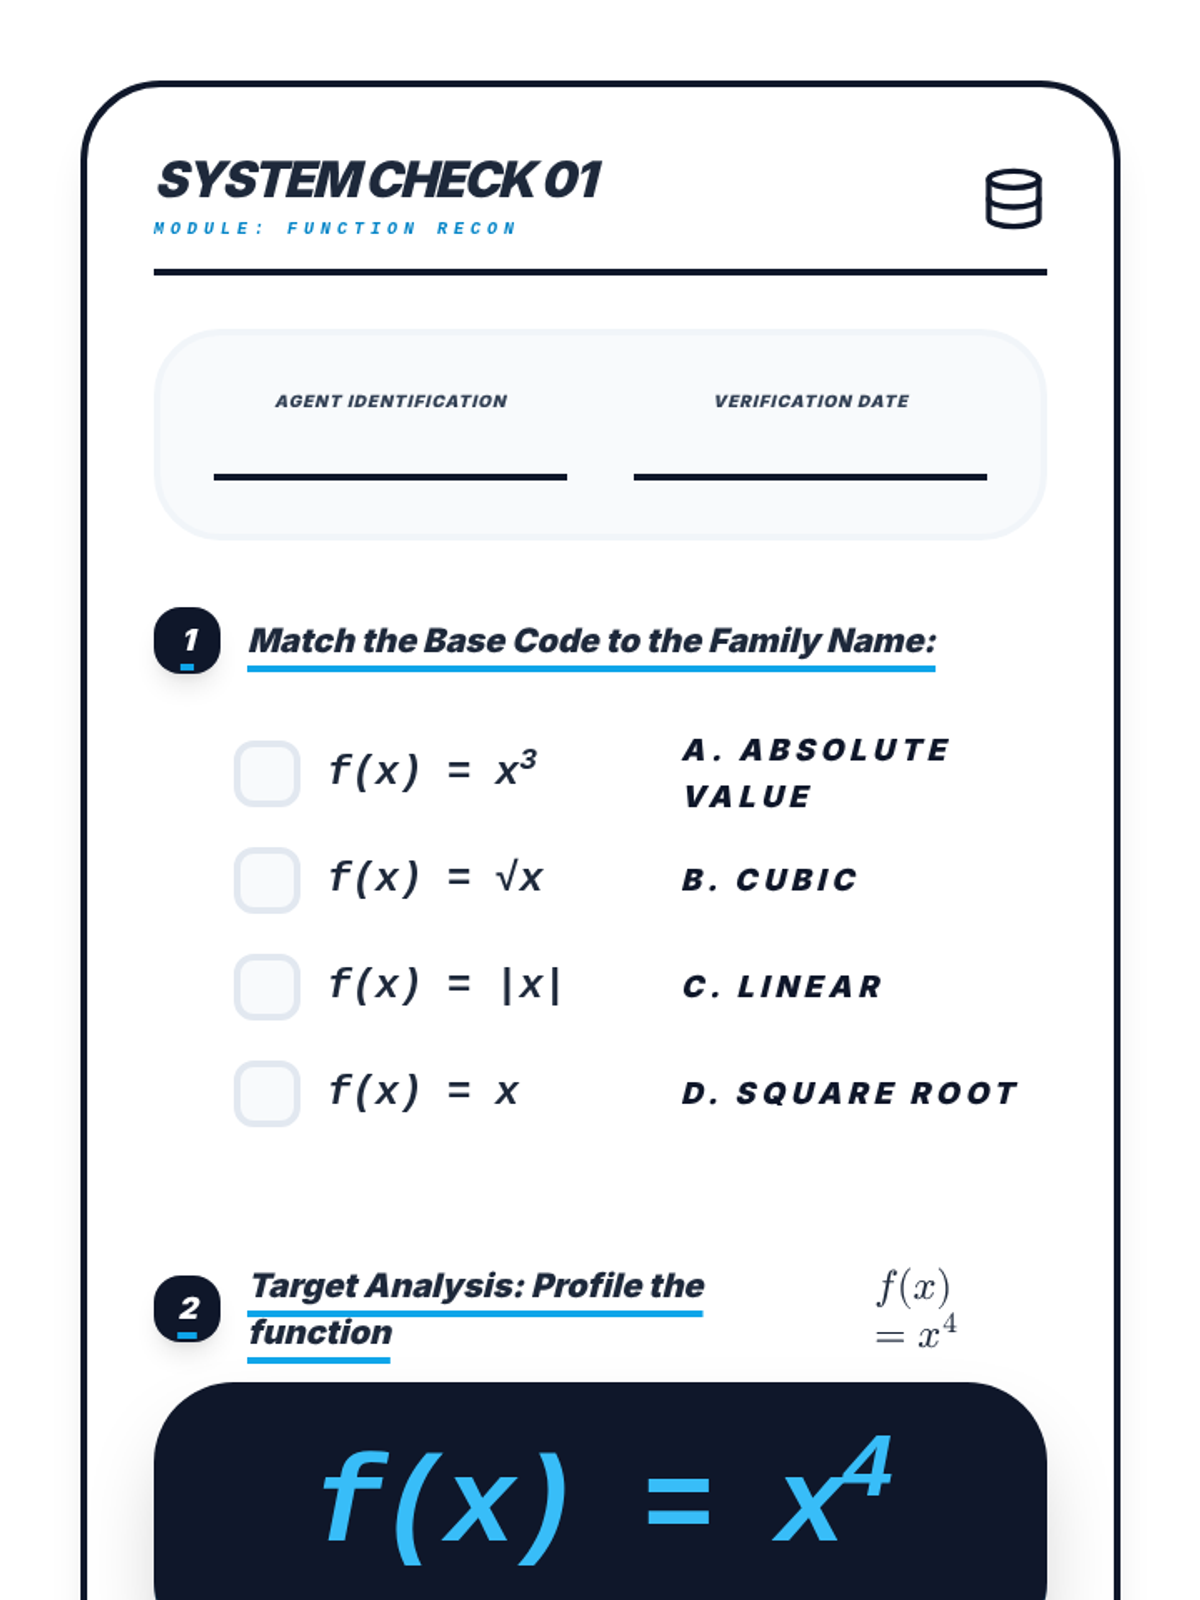
A high-speed reconnaissance of basic function families, including linear, quadratic, cubic, quartic, absolute value, and radical parent functions.
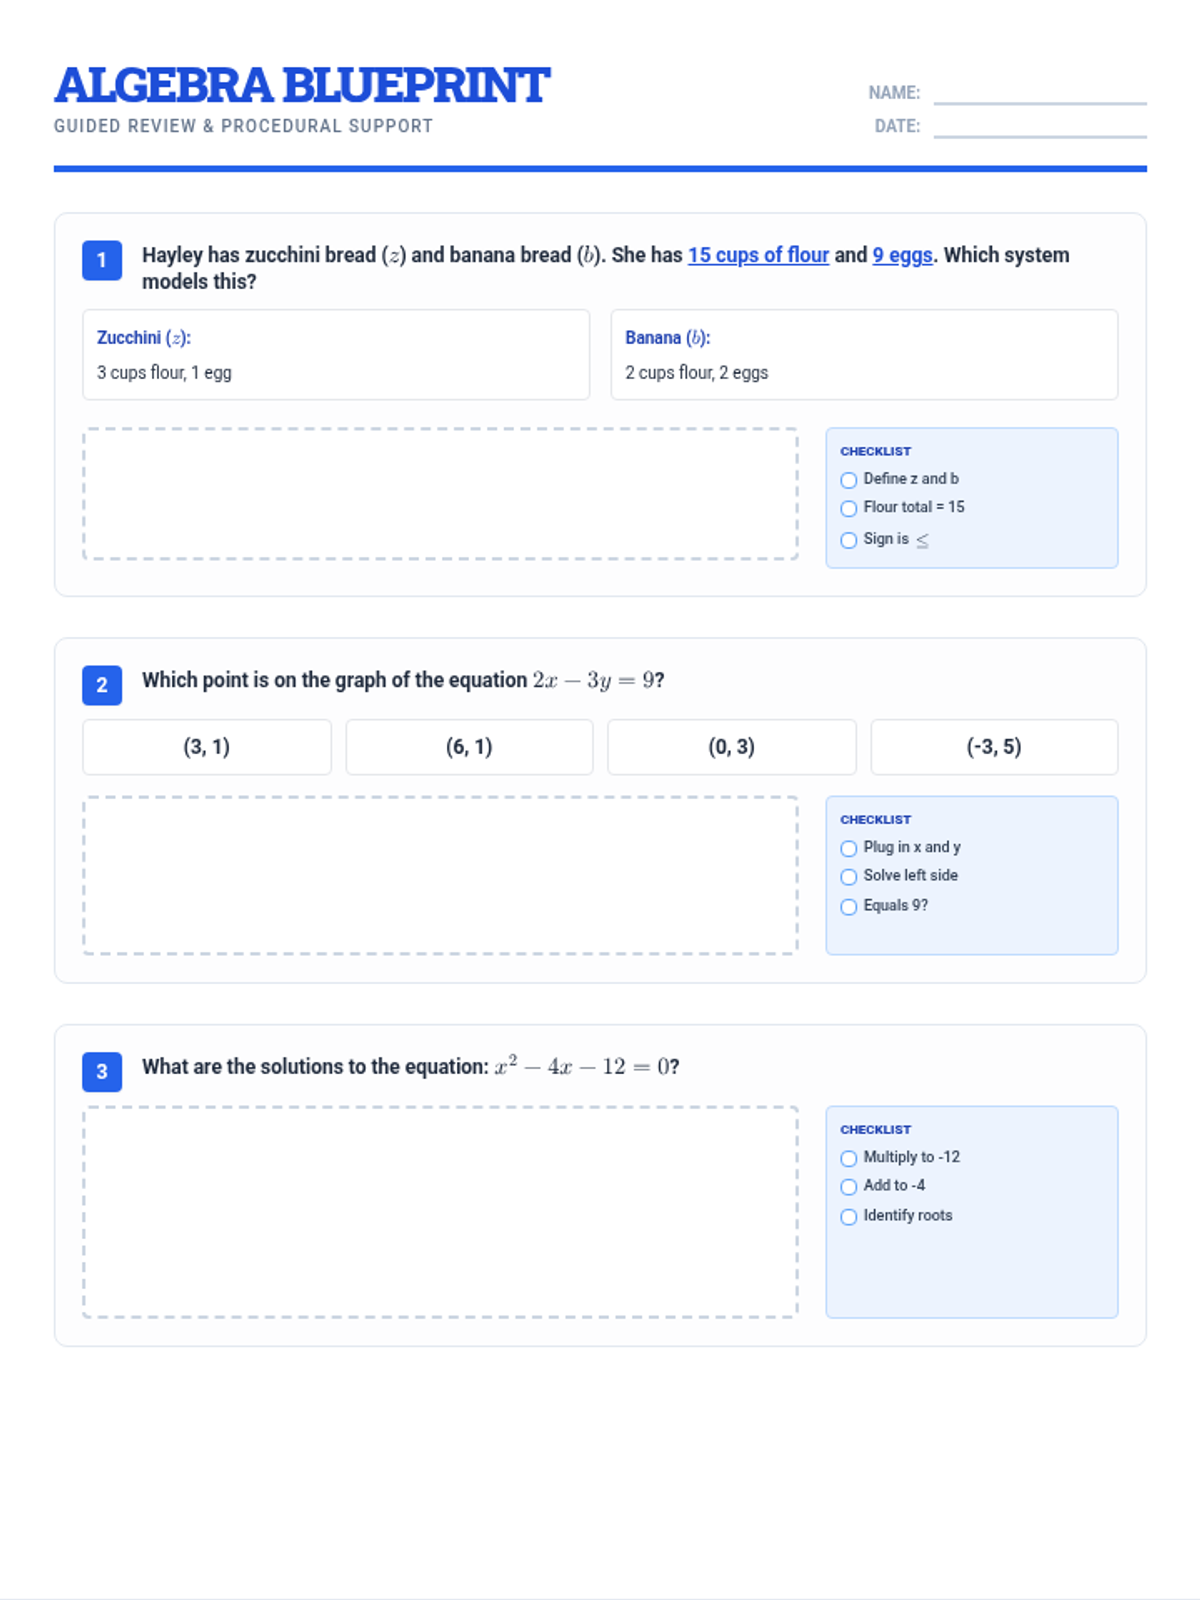
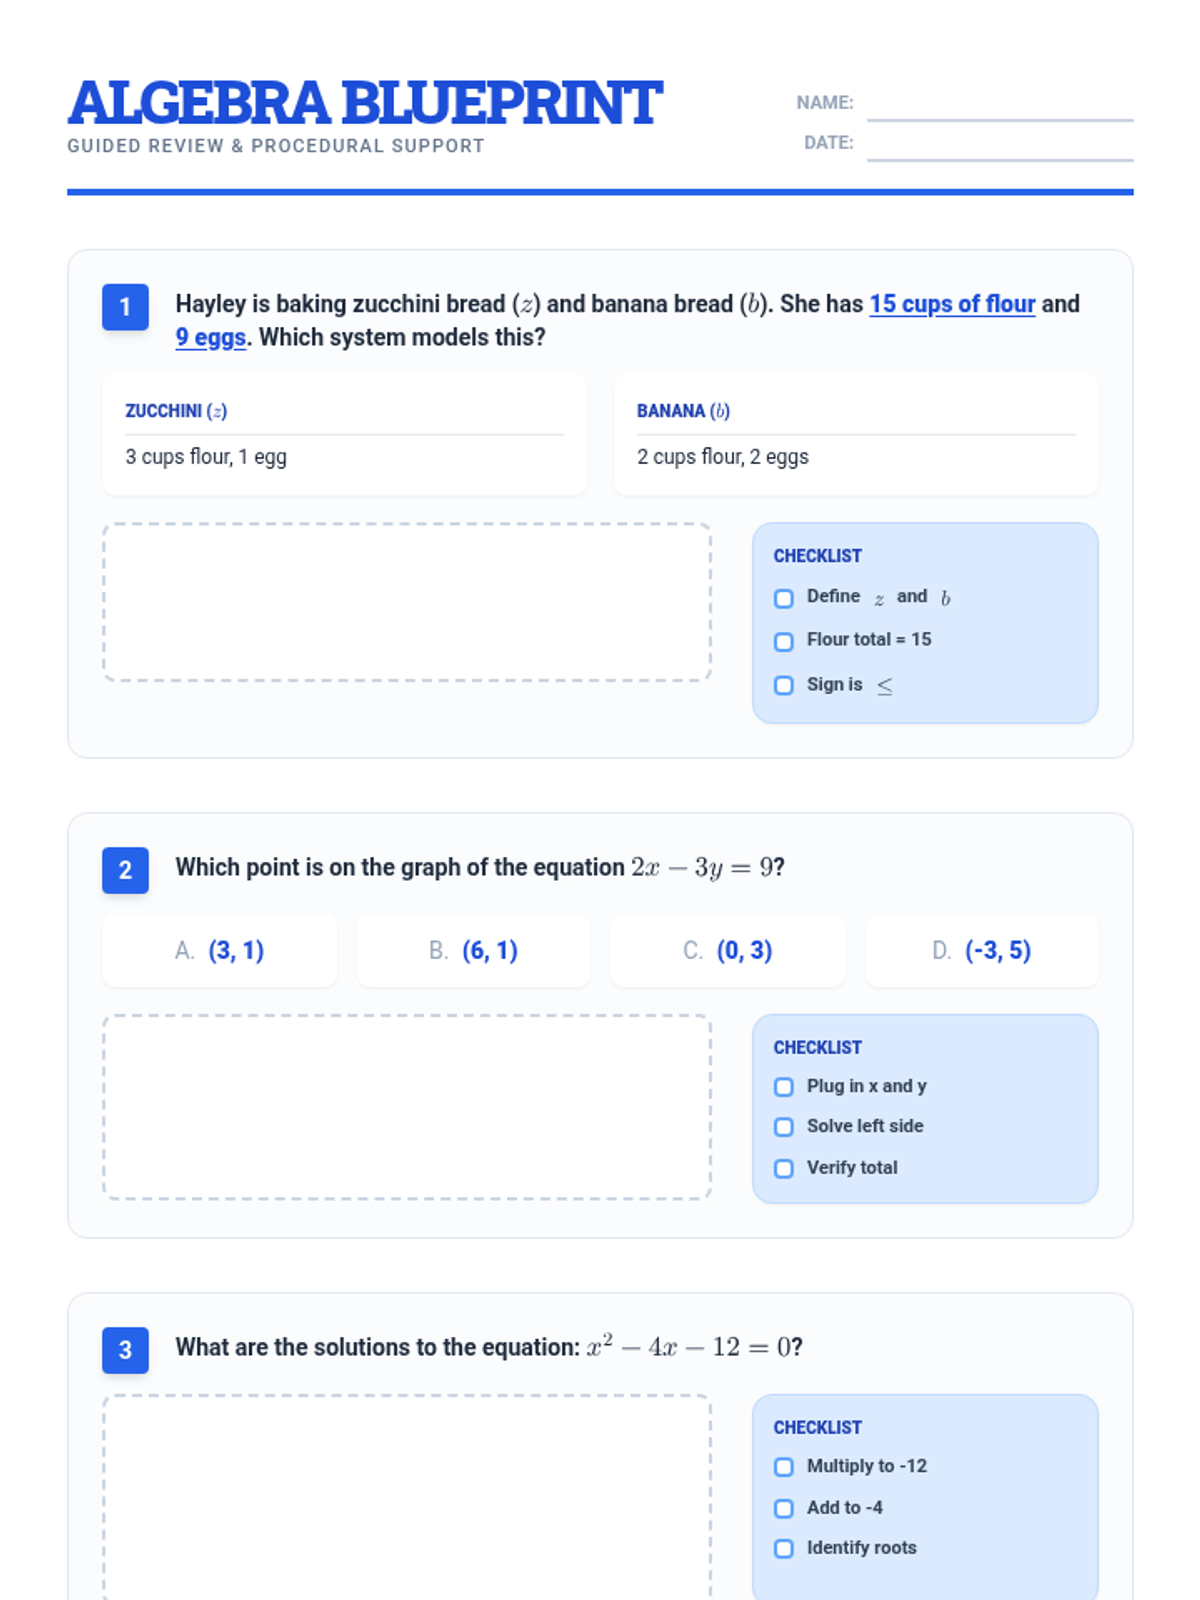
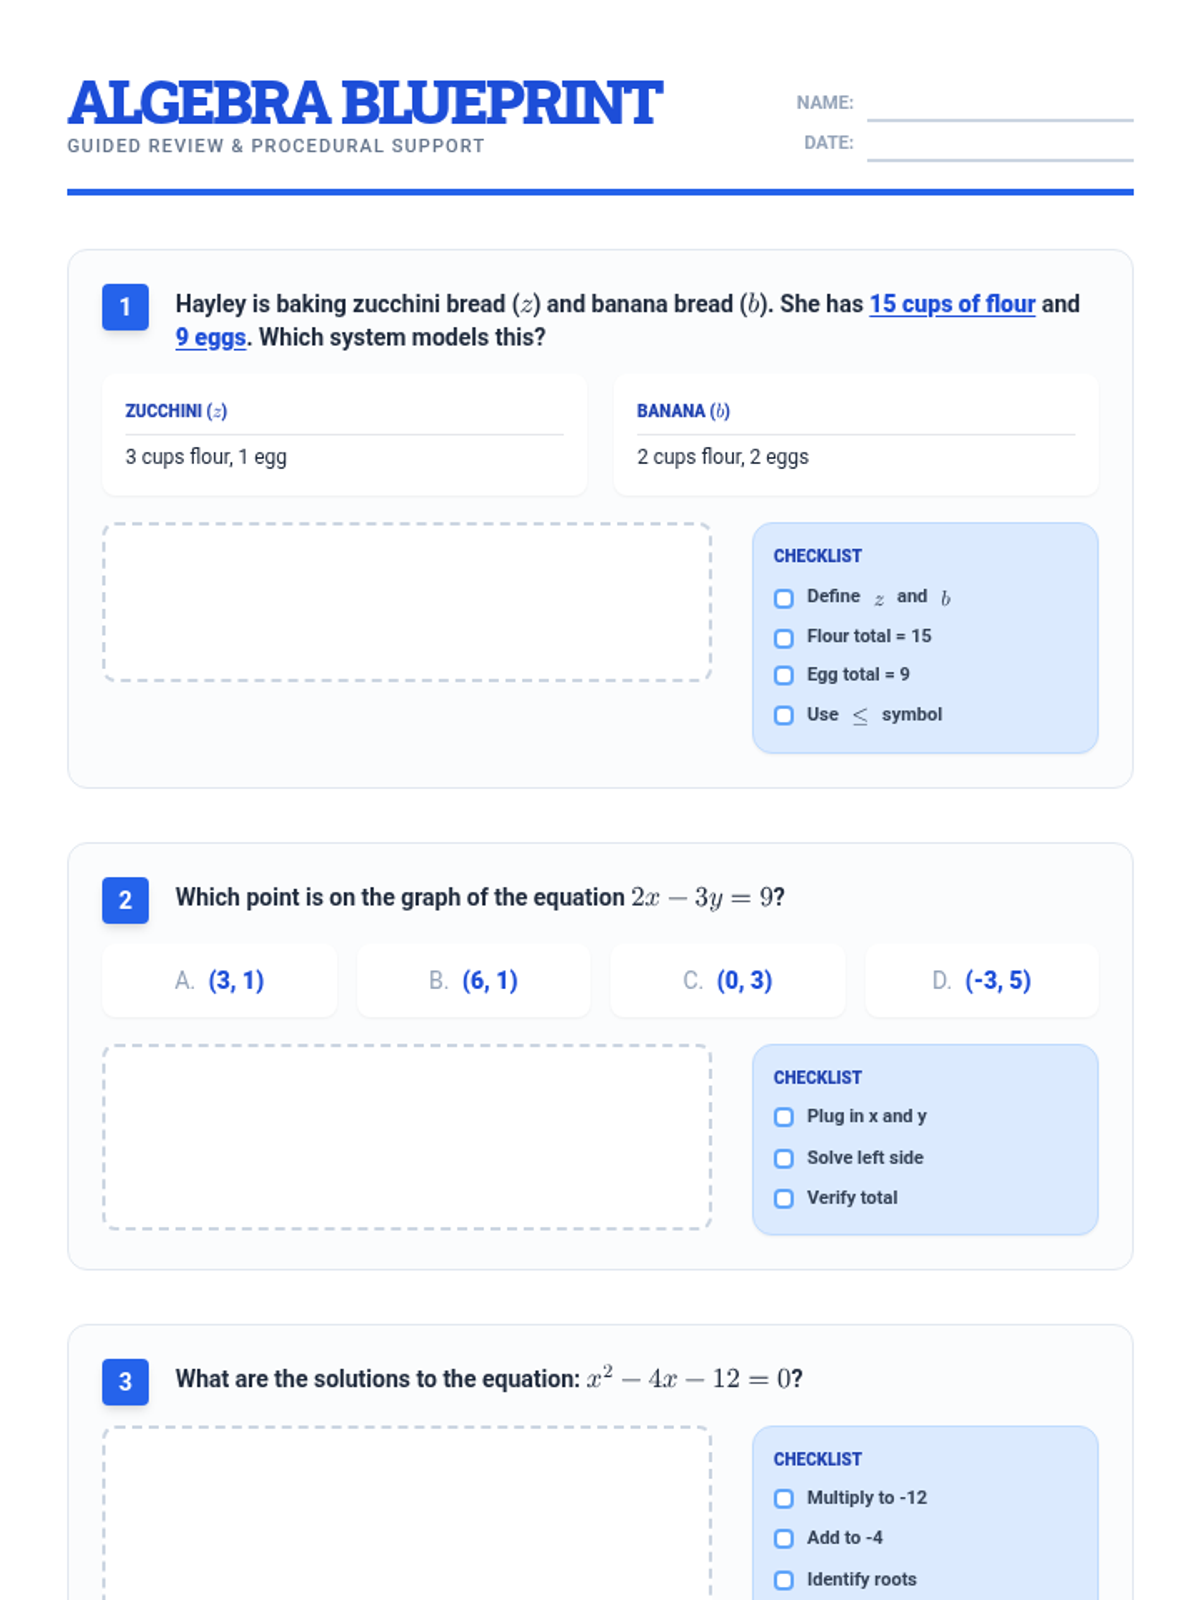
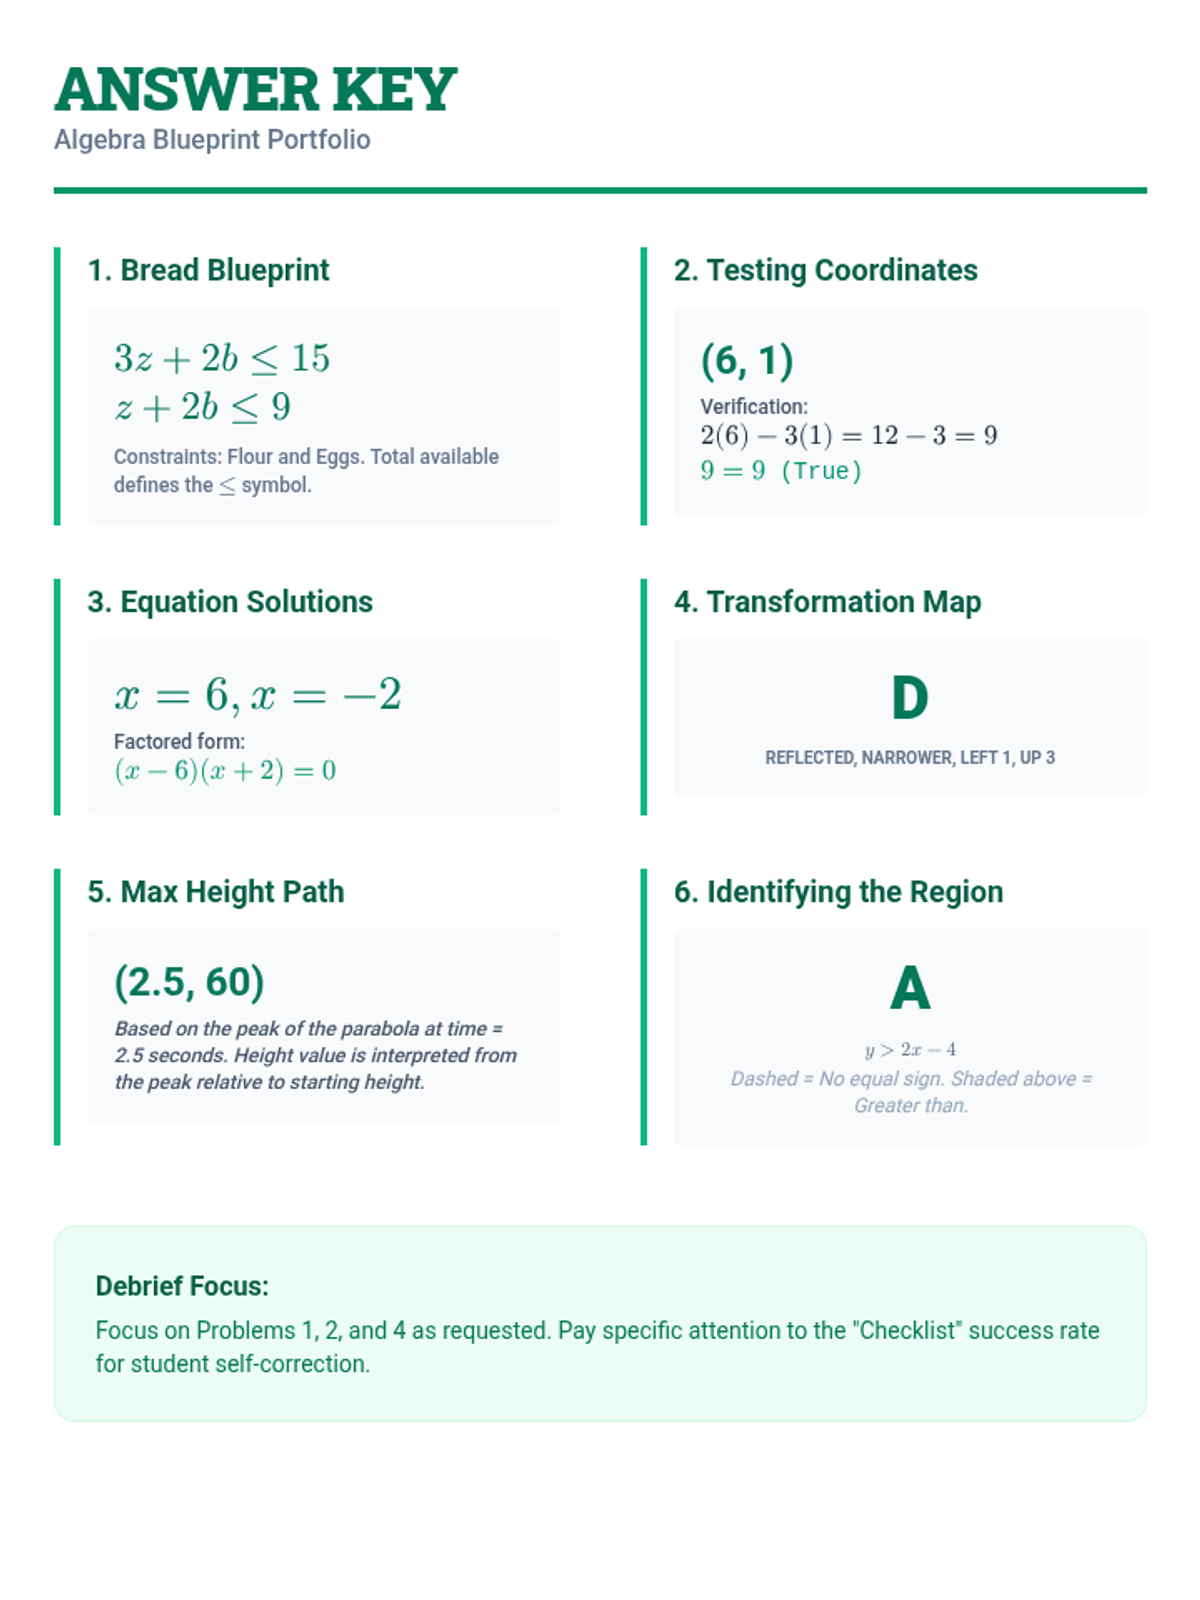
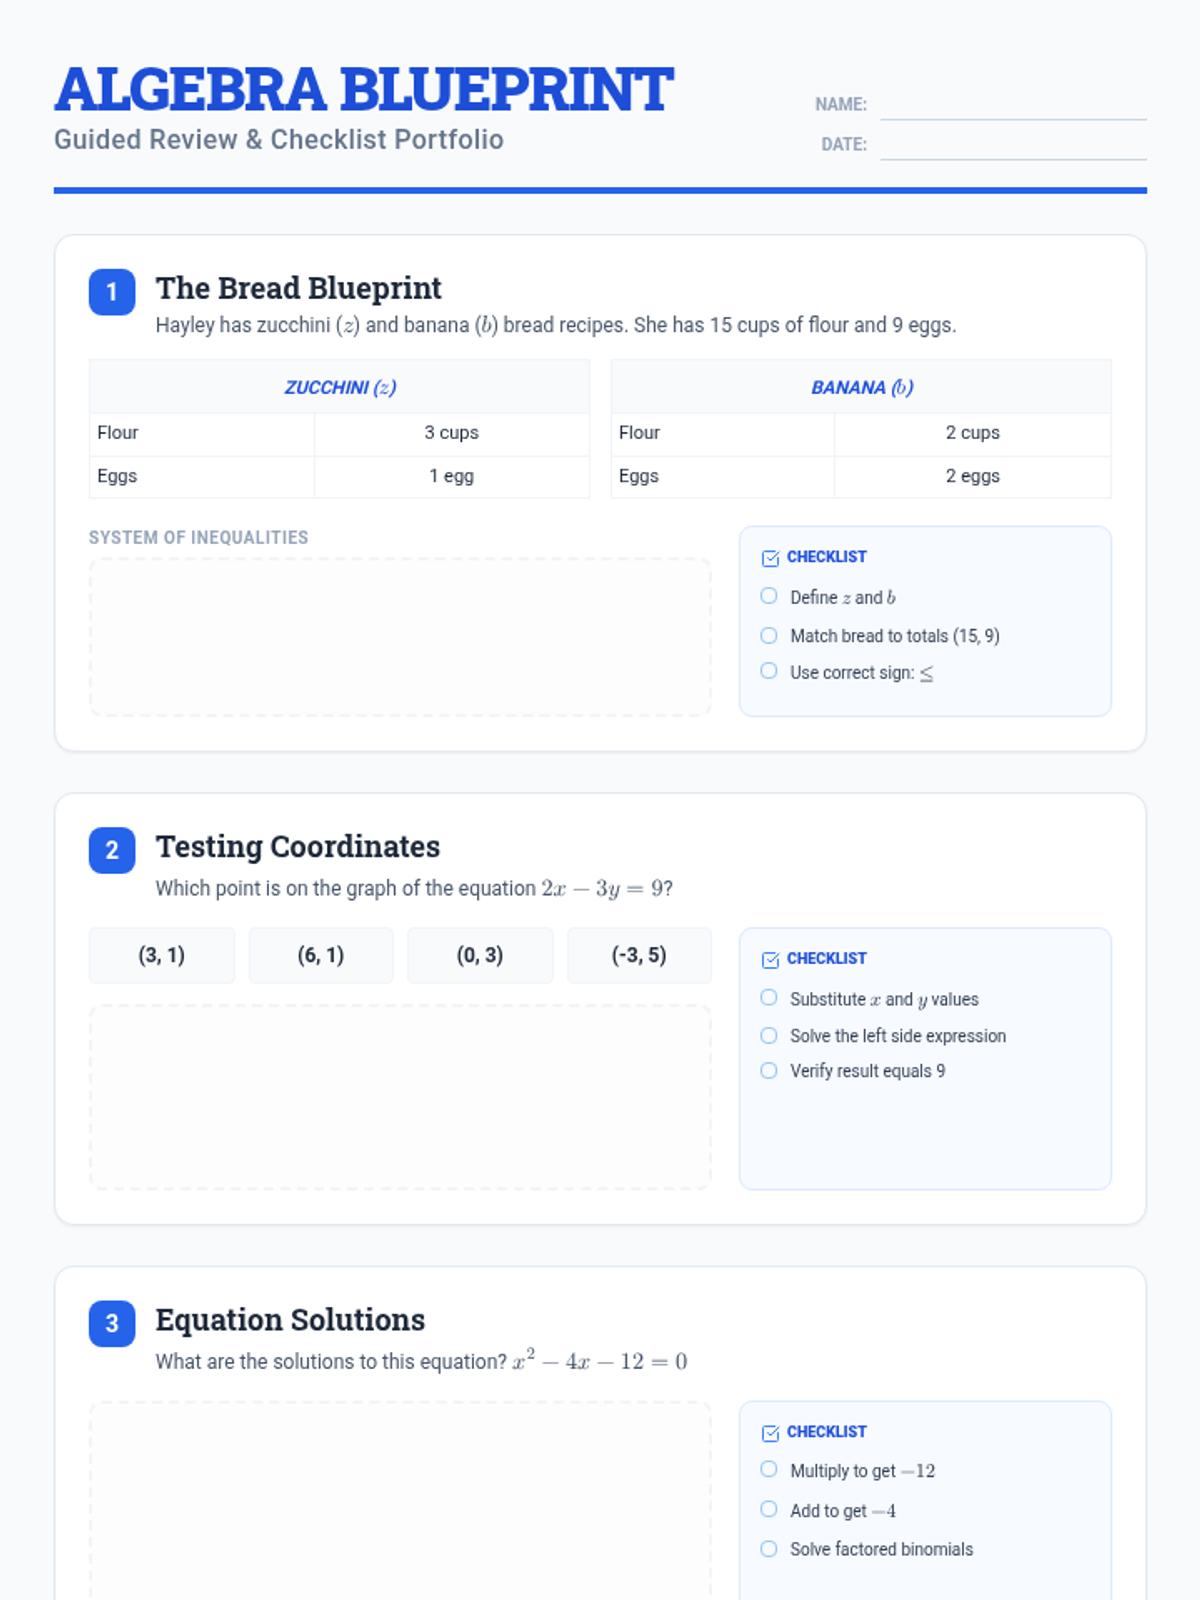
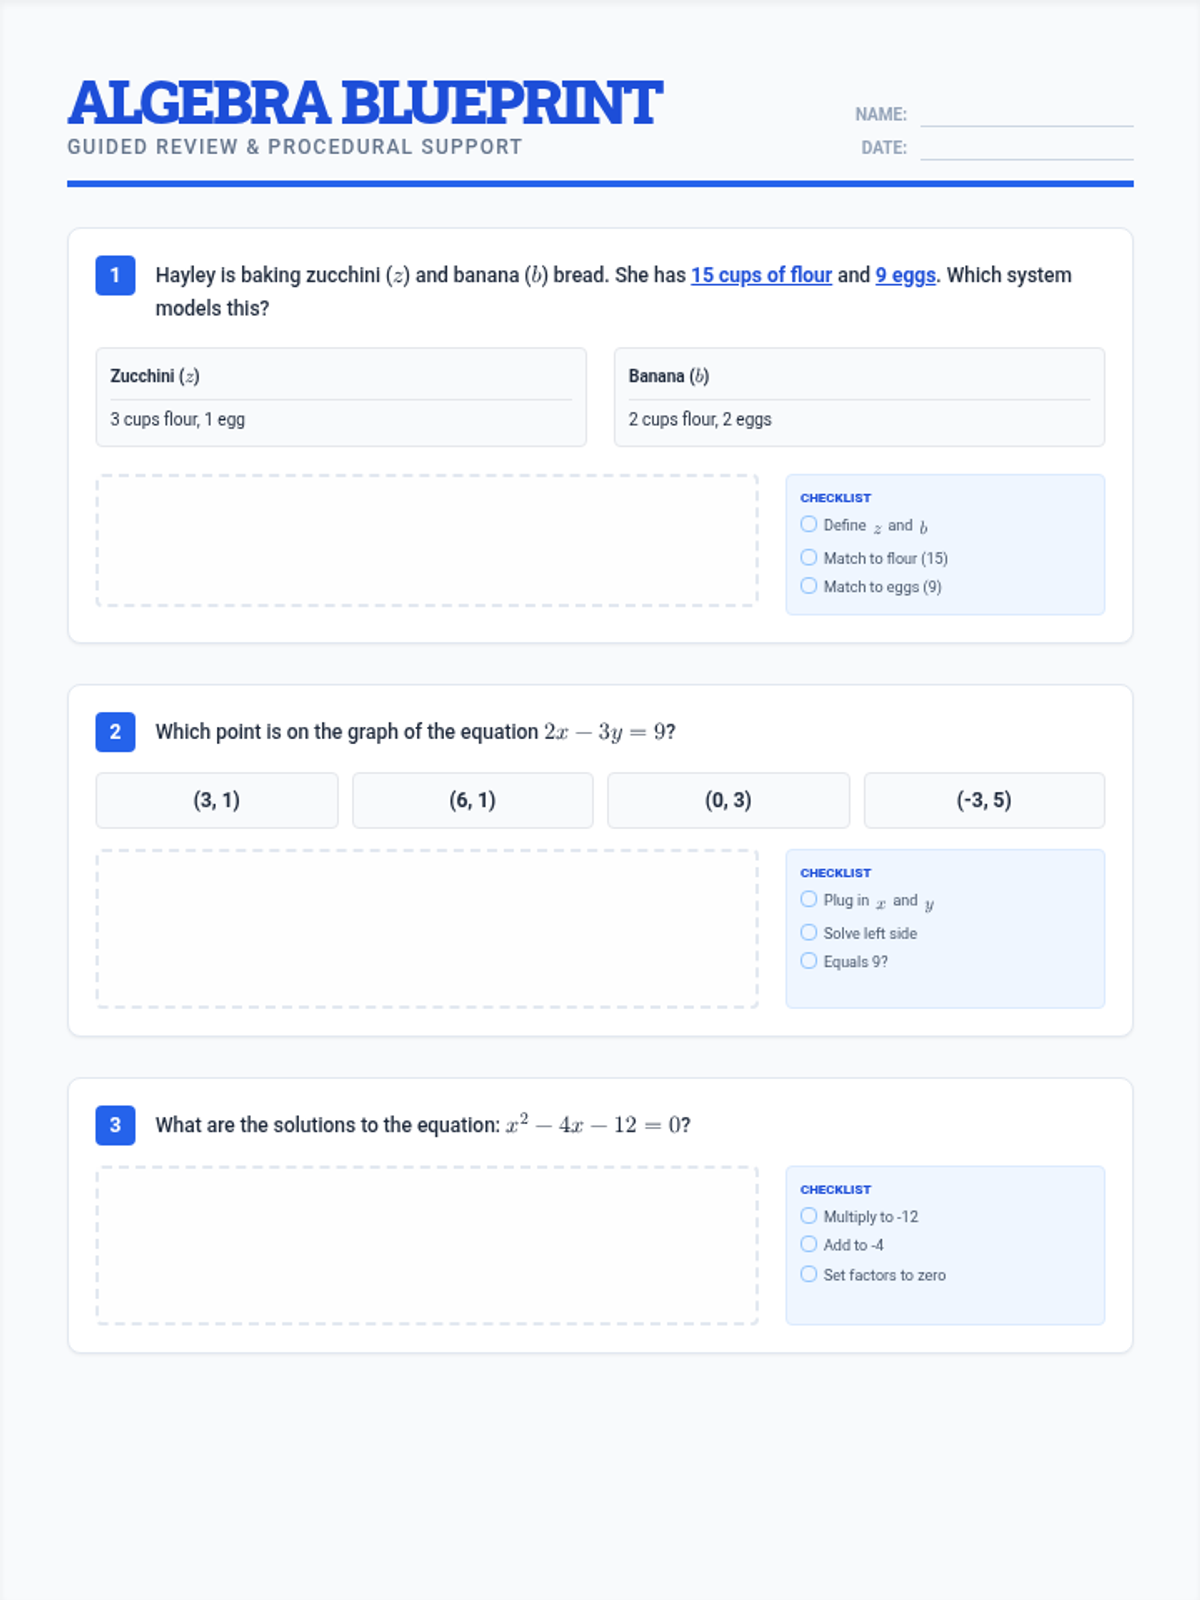
This lesson provides a guided review of core Algebra 1 concepts including systems of linear inequalities, transformations of functions, and quadratic equations. It features a step-by-step checklist approach to support students in breaking down complex multi-step problems.