Mapping relationships through notation, algebraic representations, and growth rate comparisons. Equips learners to transform functions, model contextual data, and solve exponential equations.
Final Executive Career Portfolio Handout. Professional summary document for students to synthesize their math evidence into a final career pitch. Features kid-friendly terminology ('Evidence Log', 'Calculation Summary'), high-contrast work areas, and a structured executive brief layout for the 2-hour final block. Improved font sizes and larger explanation boxes for better student usability. Consolidated to a more efficient layout to prevent page breaks. Header icons standardized. Cover page label legibility improved. Main background set to white for proper printer margins. Removed rigid height constraints to prevent fragmentation. Signature box enlarged. Header spacing corrected. Standardized to 'Executive Pitch Portfolio'.
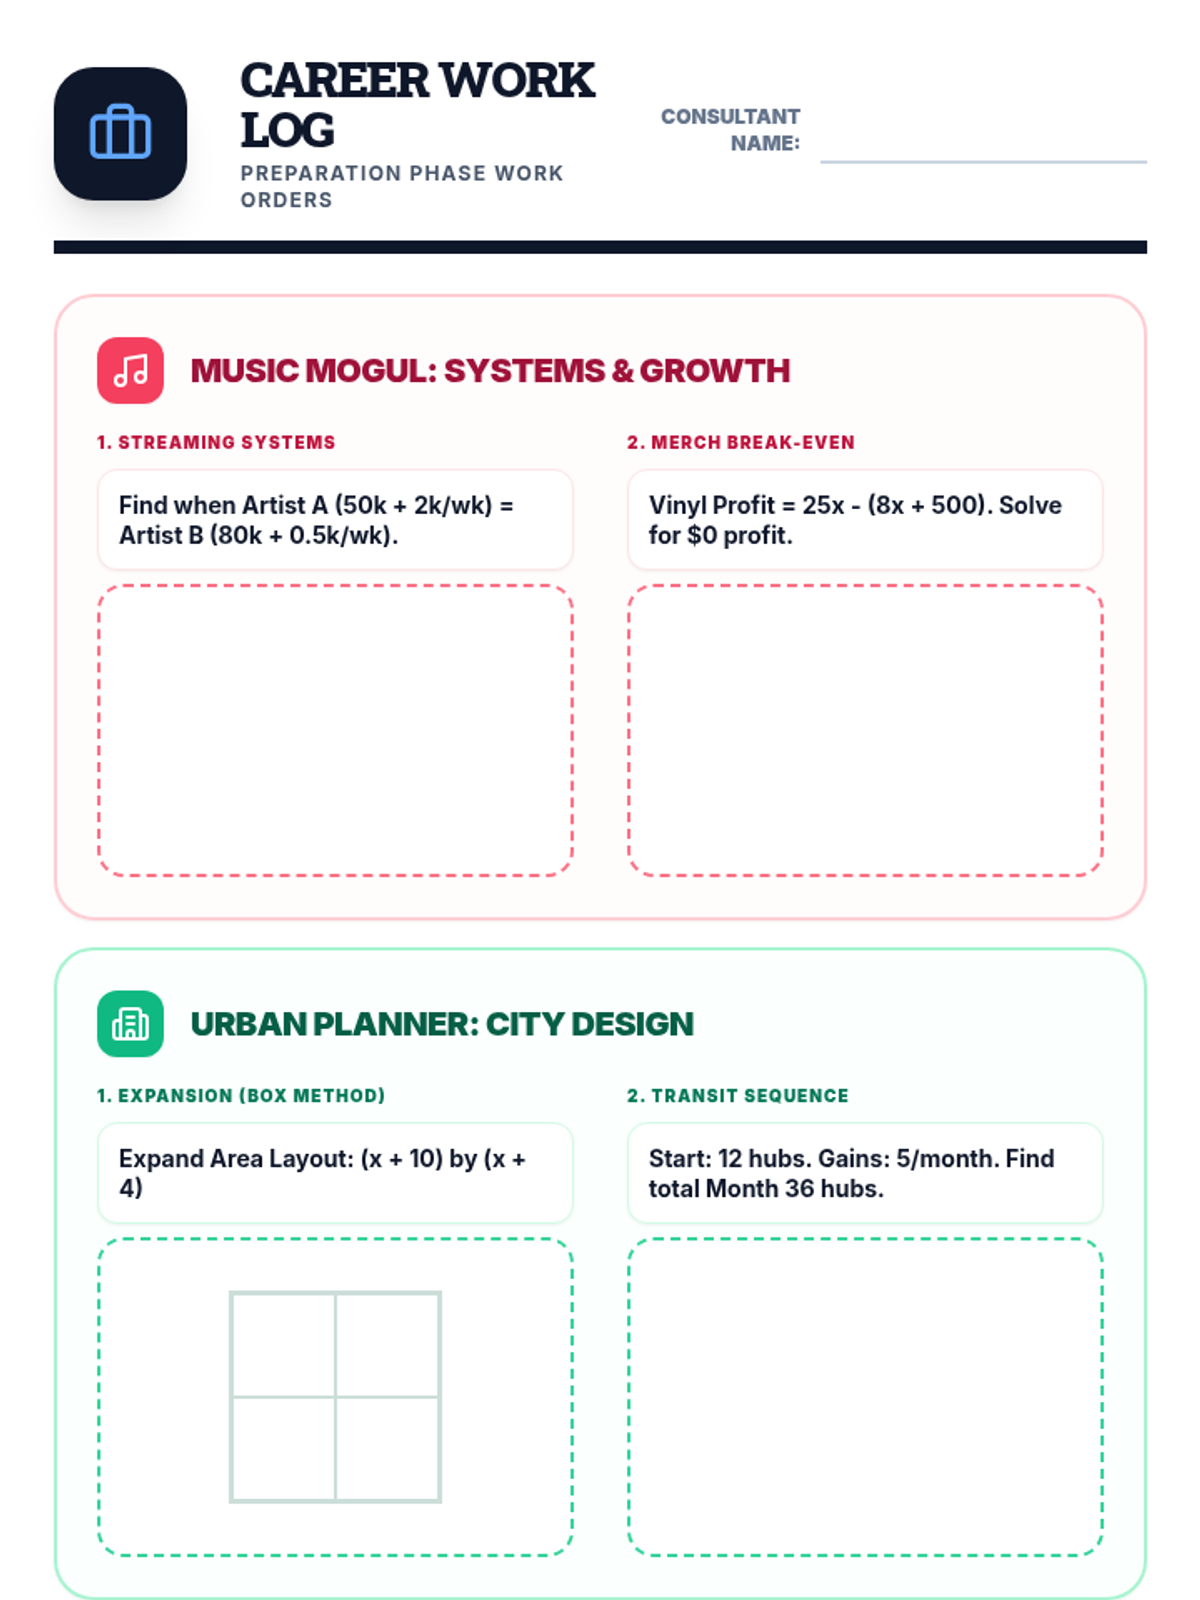
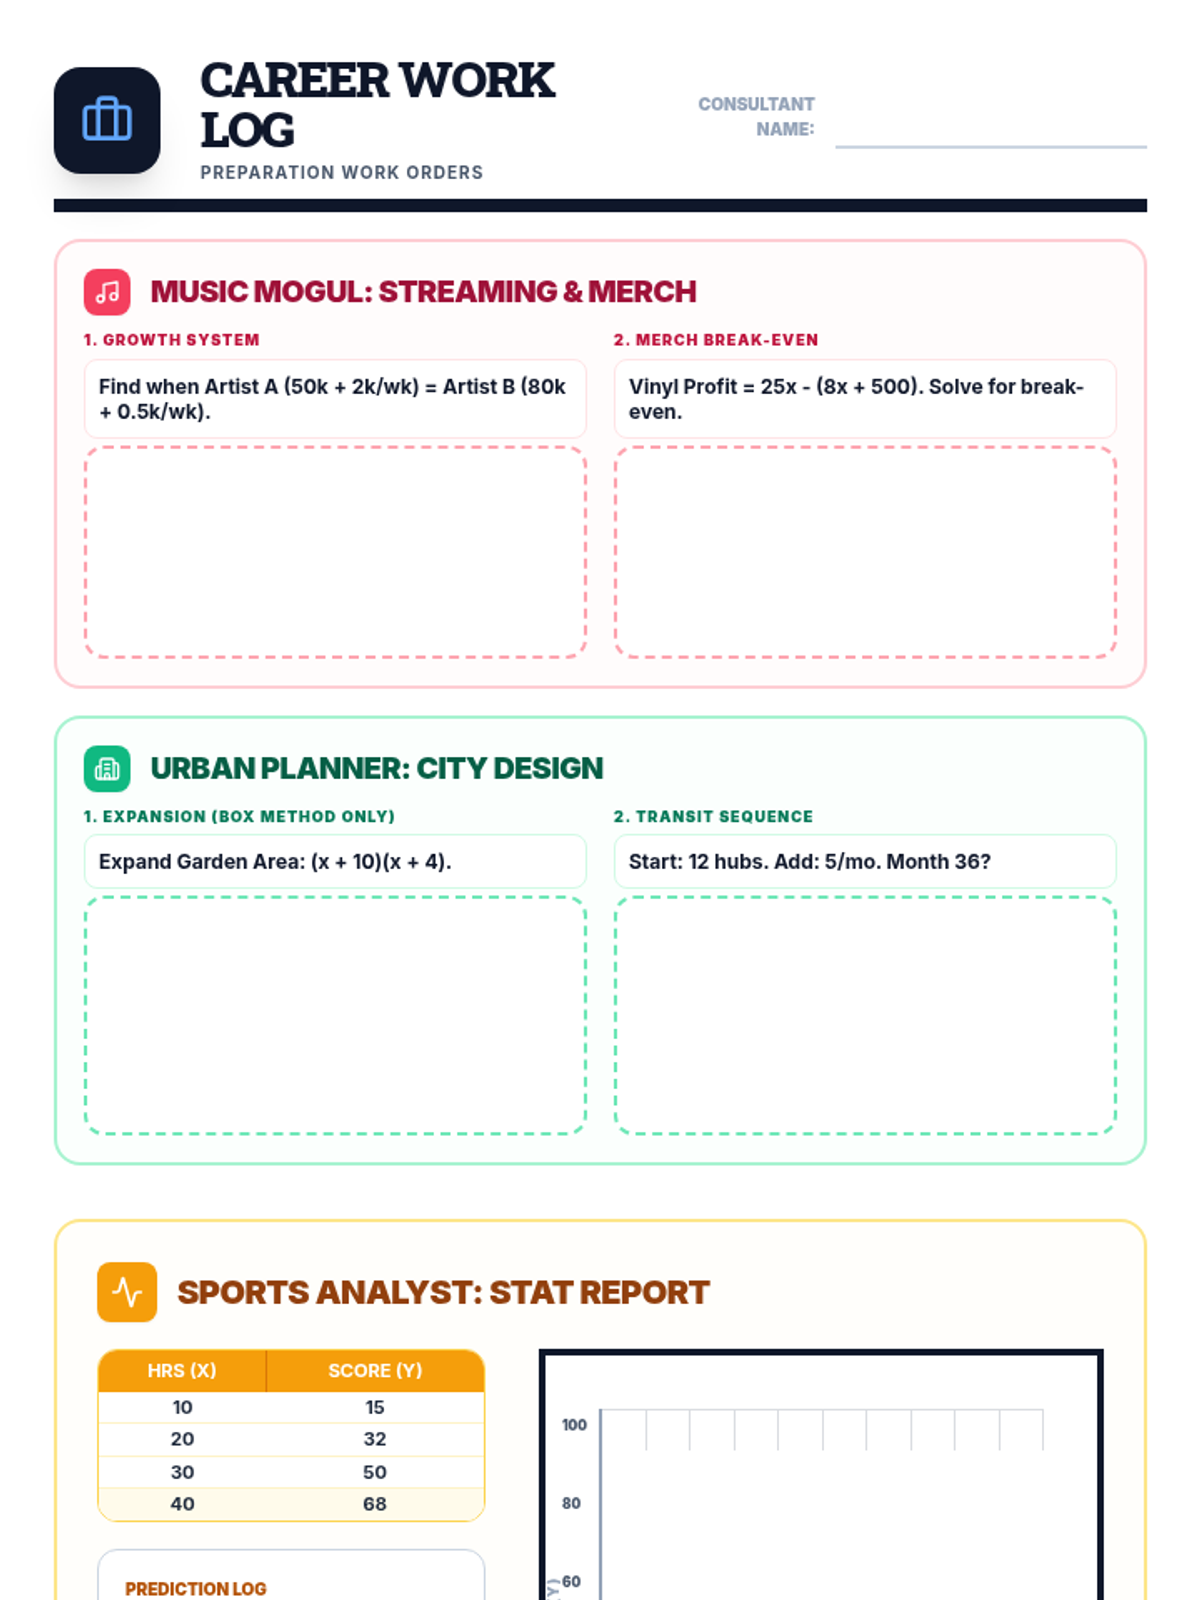
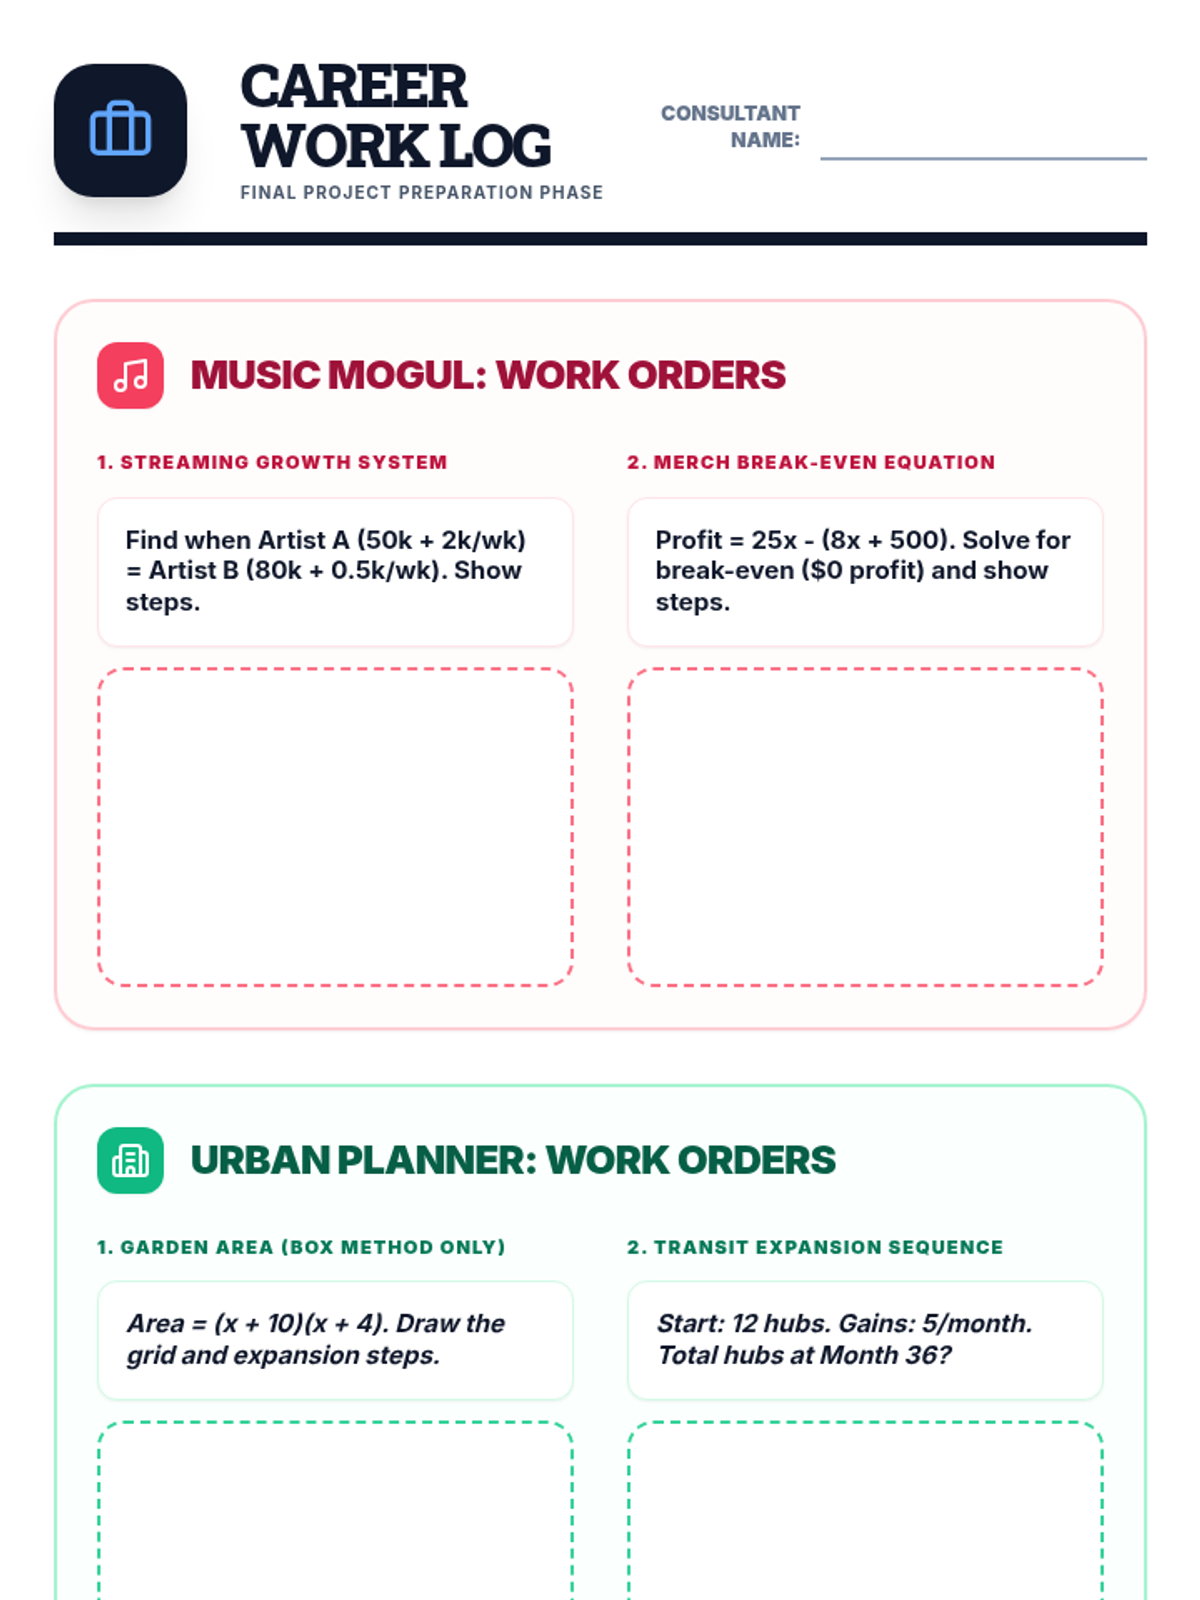
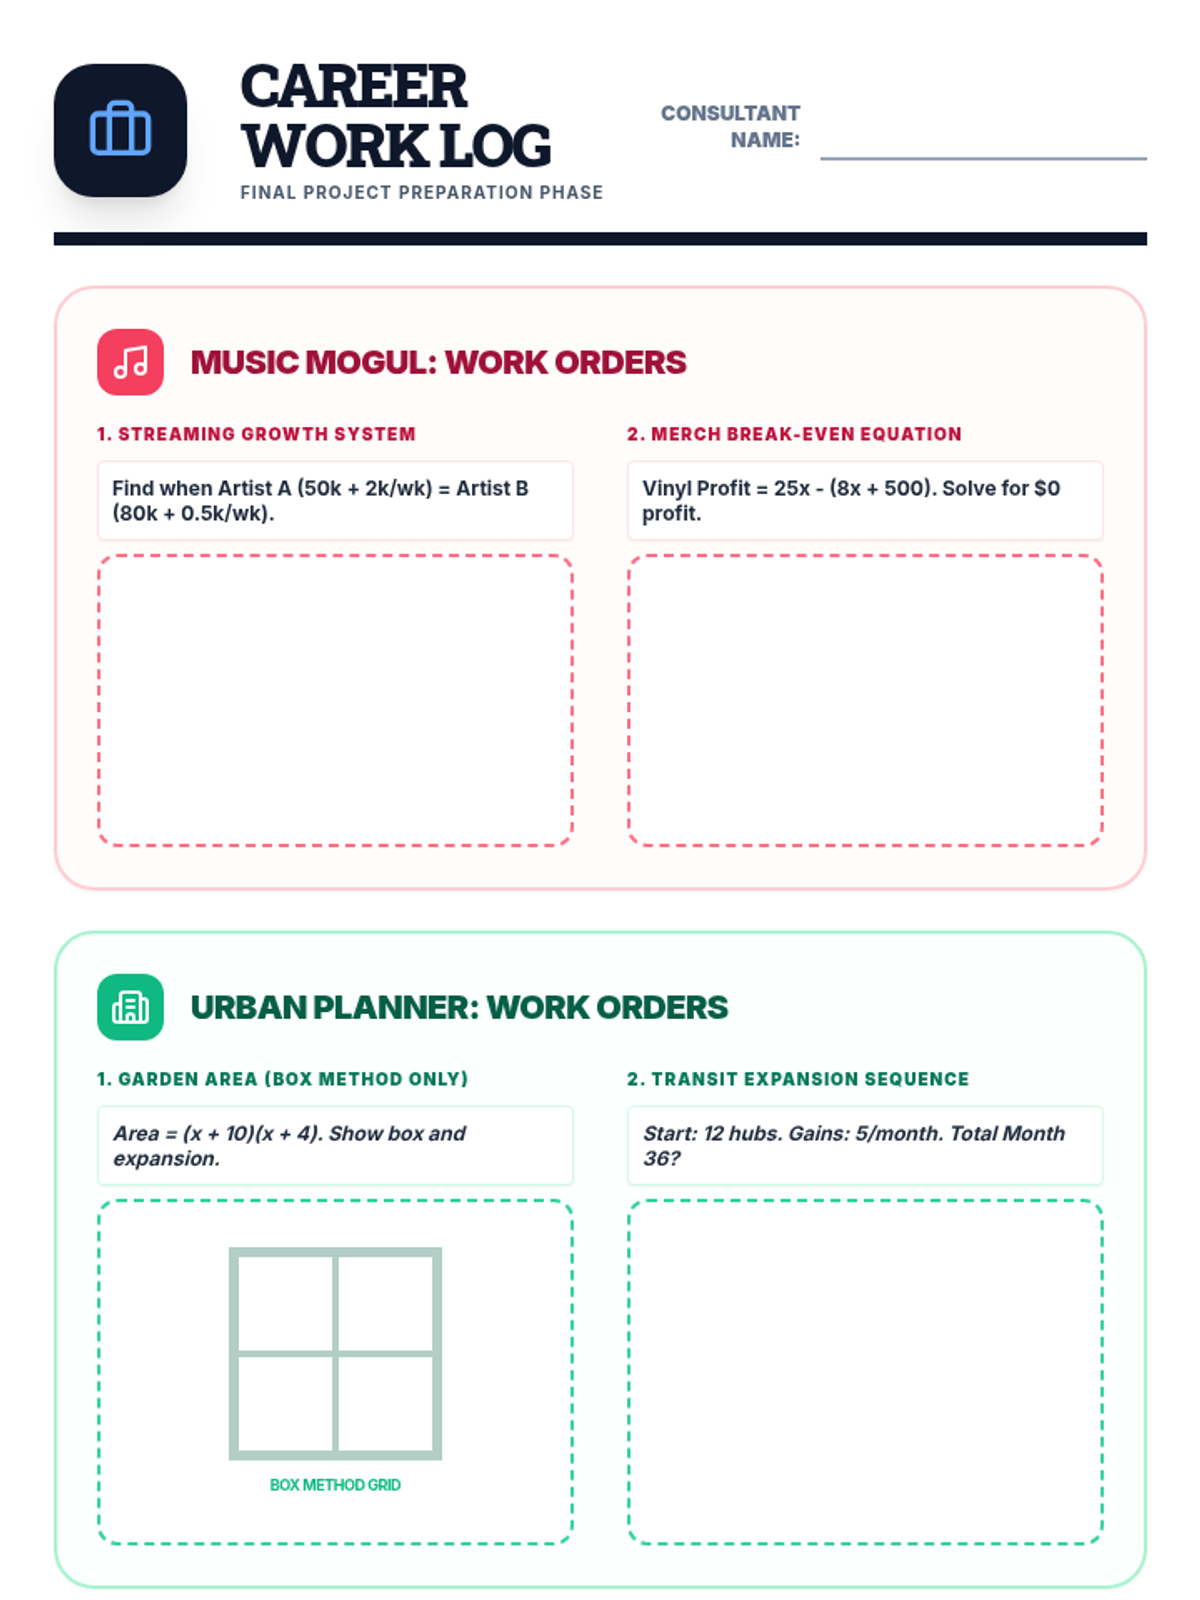
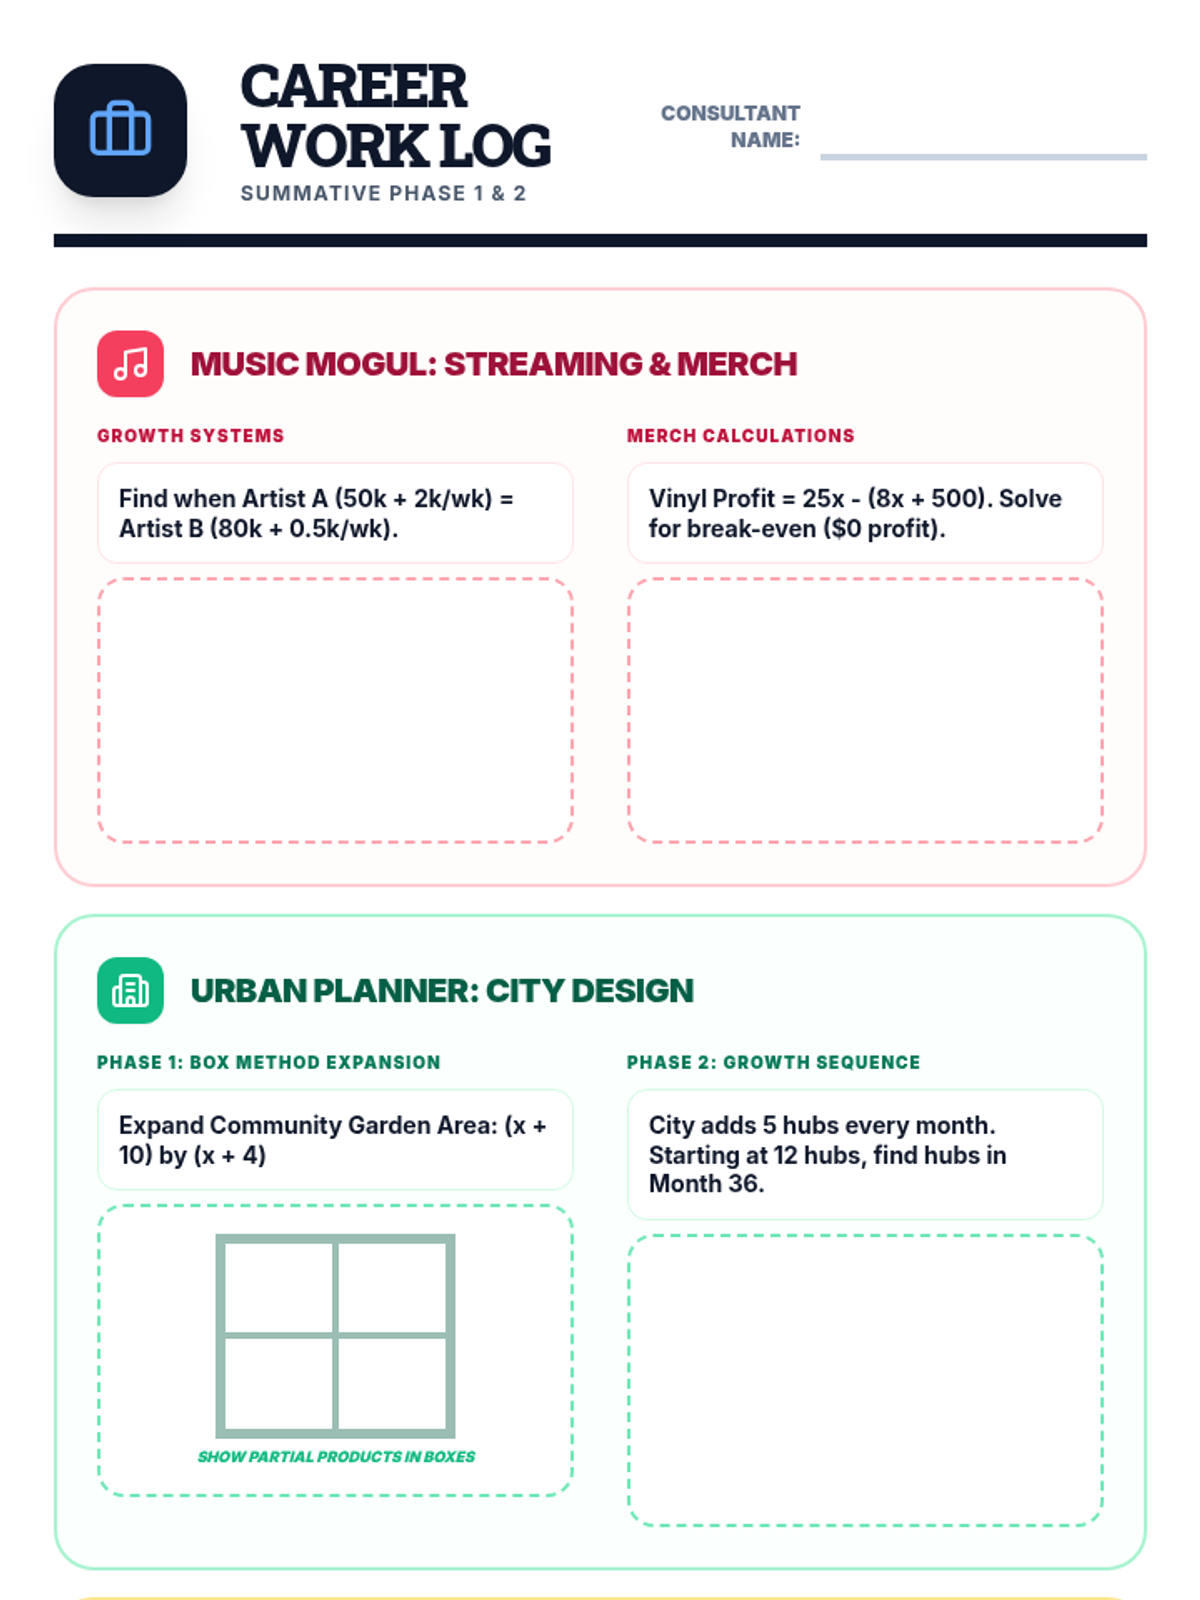
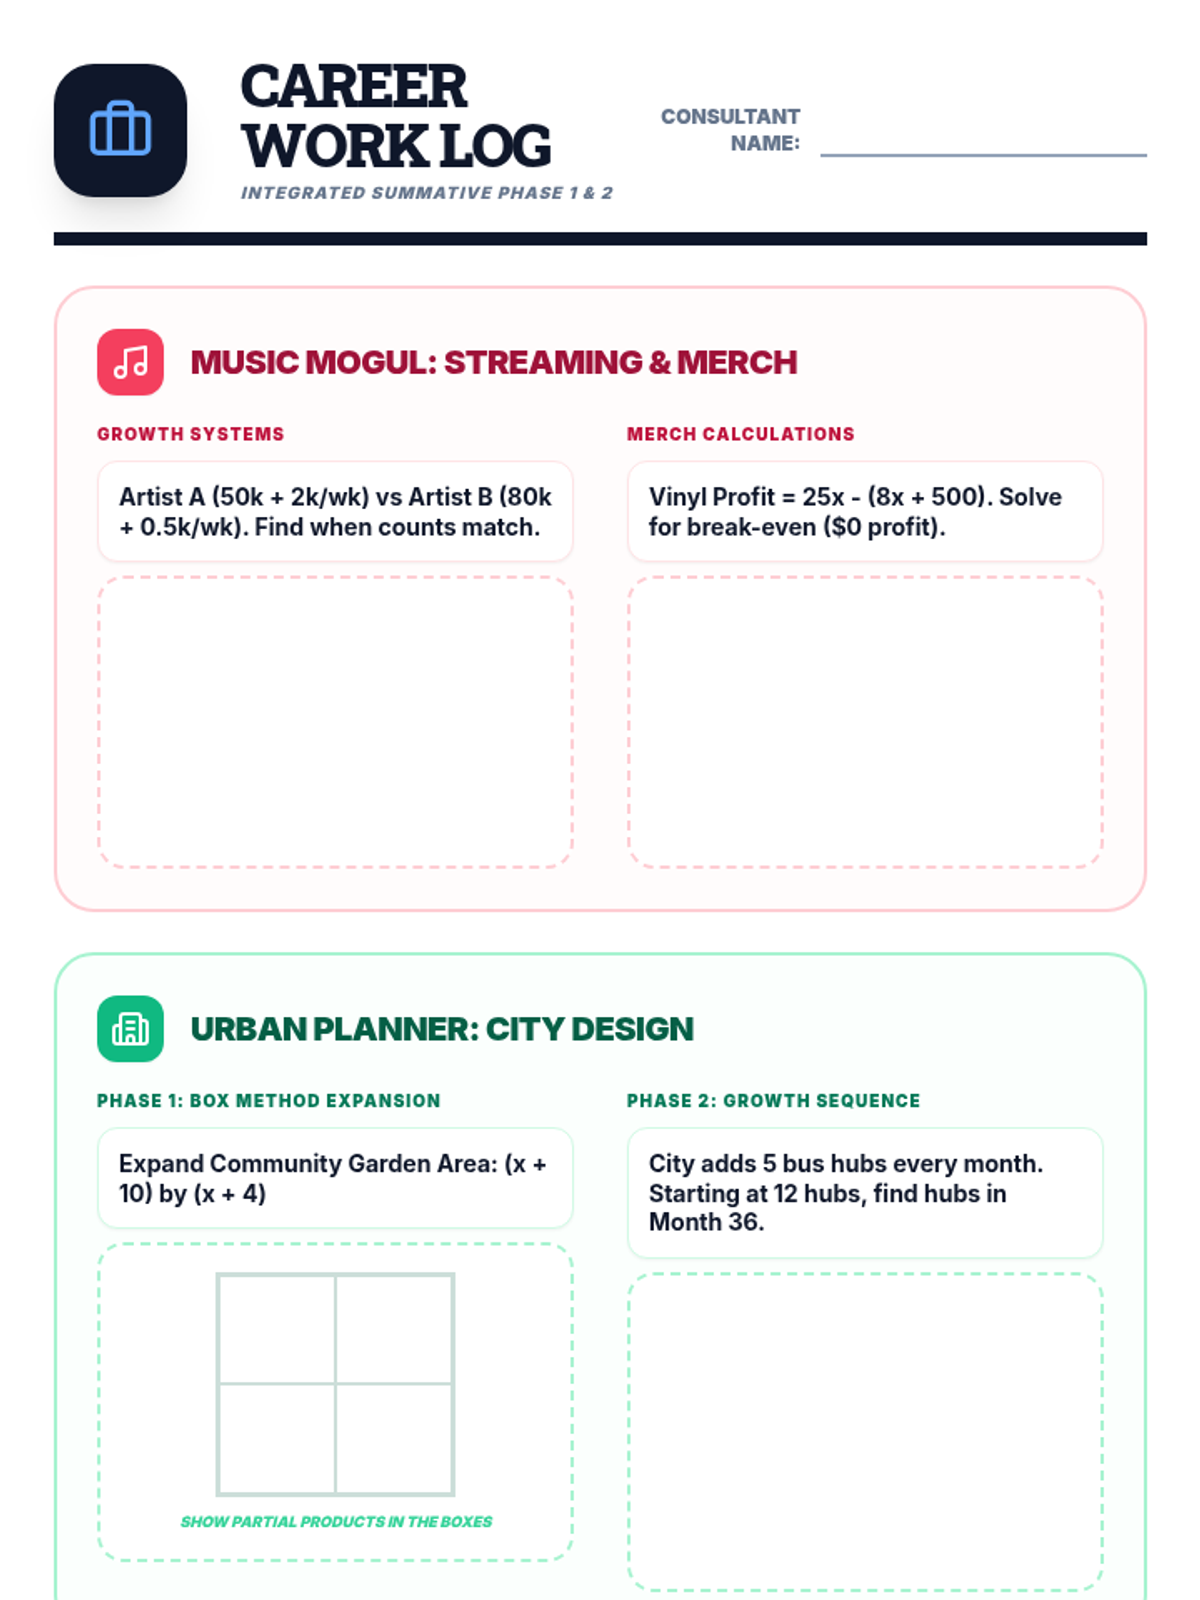
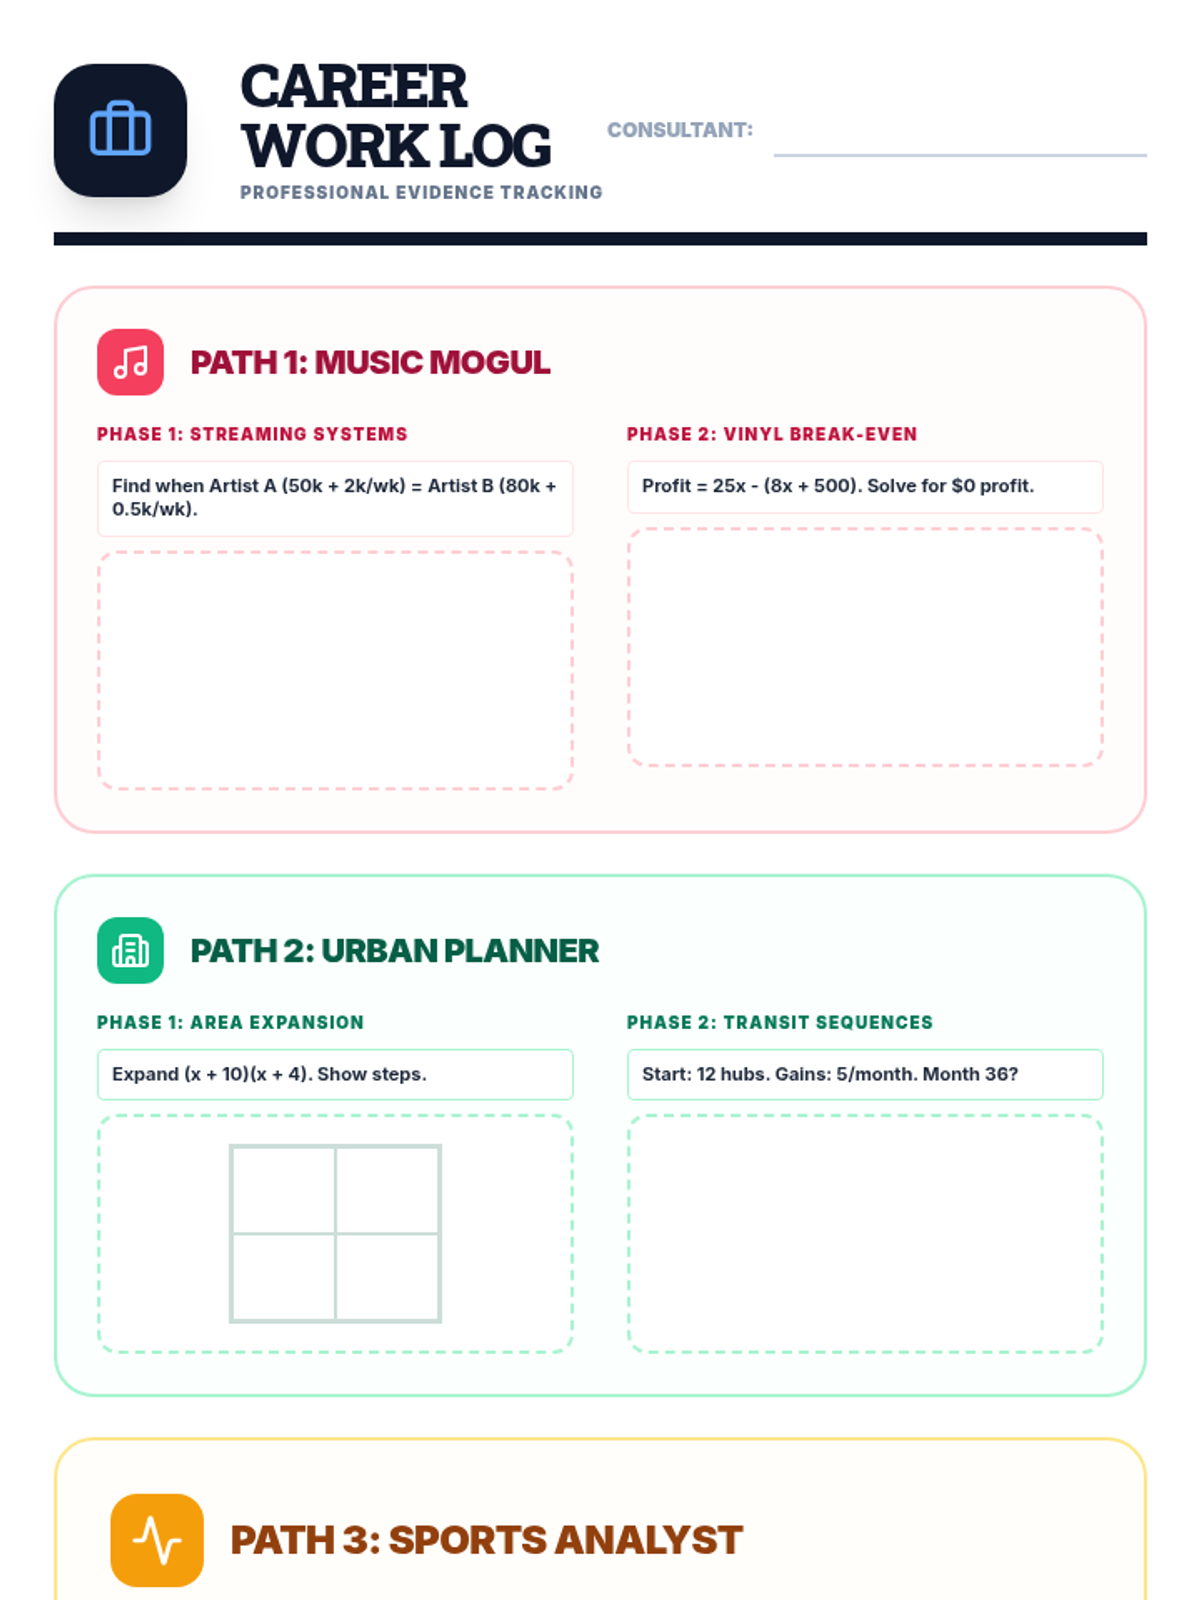
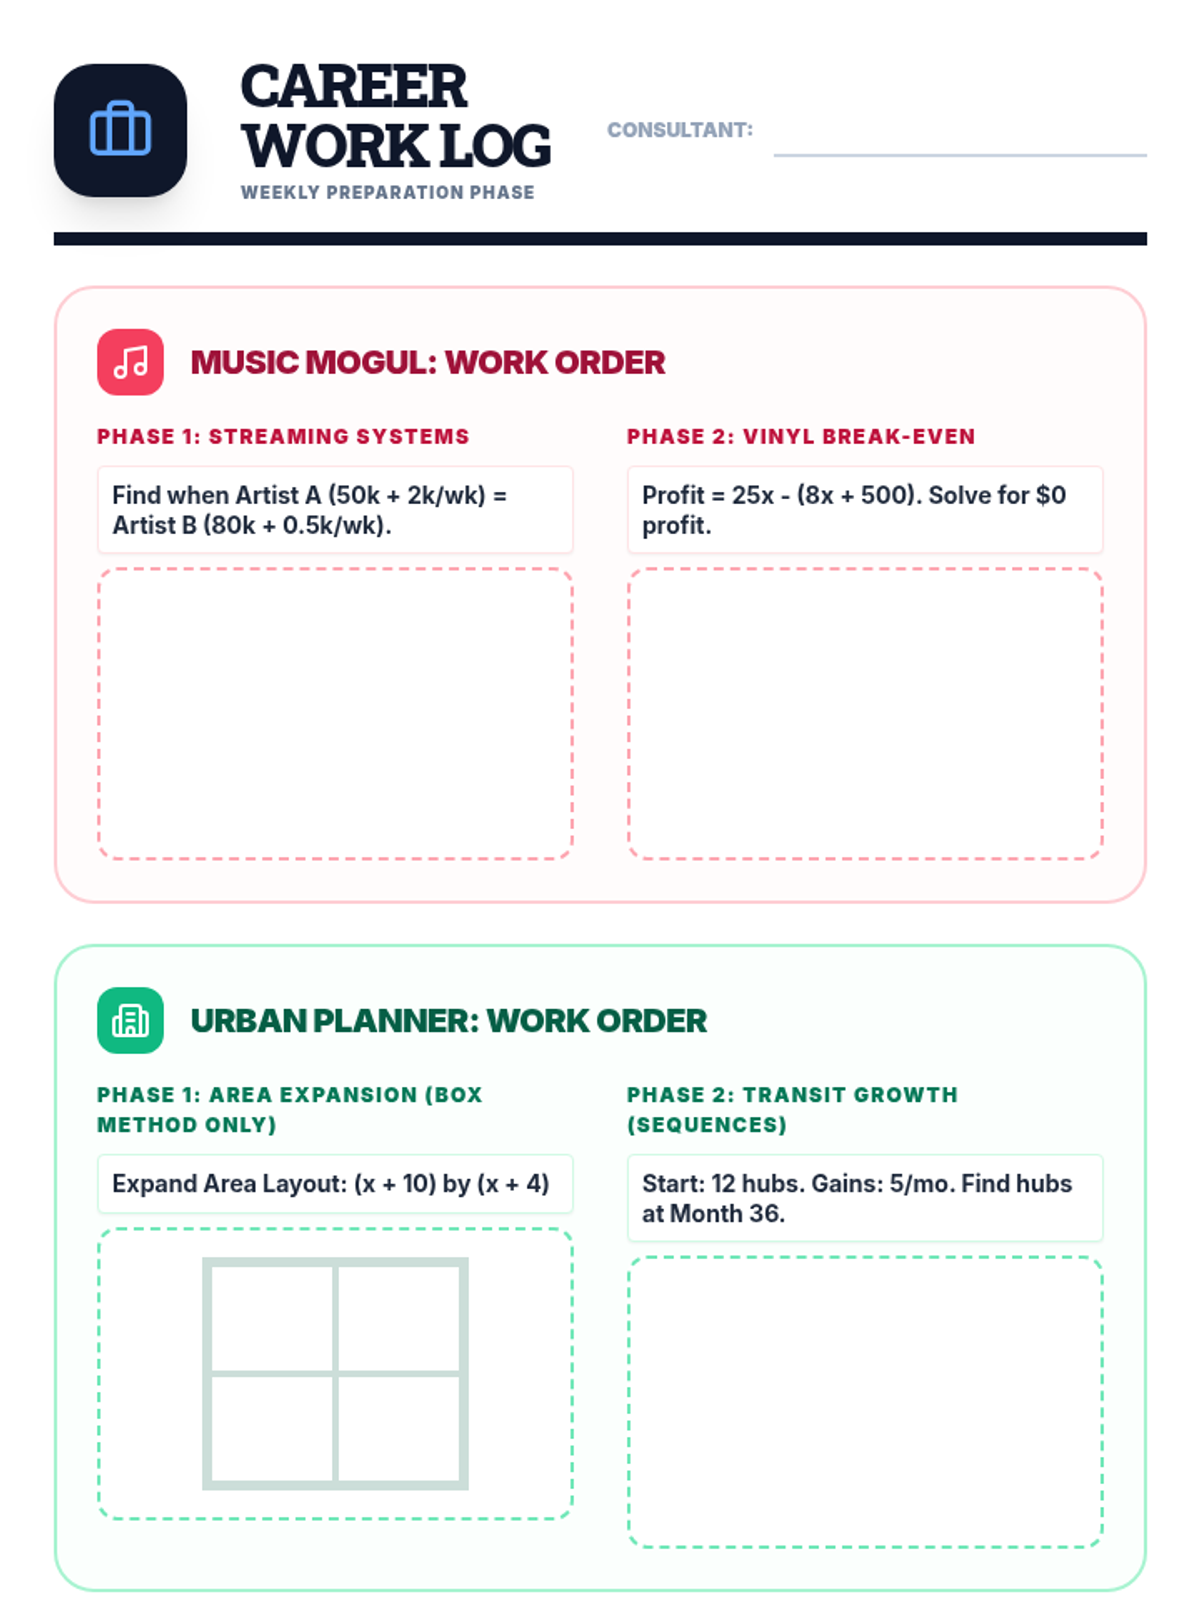
Revised Career Mission Log with large, dedicated work areas for the three professional paths. Each task is framed as a professional work order requiring the math skills learned in class (Systems, Polynomials, Sequences, and Data Analysis). Optimized for a 2-page layout with high-contrast text and corrected graph alignment. Prompts were enlarged for better readability. Y-axis labels fixed using standard rotation. Scatter plot grid spans full height. consolidated to 2 pages exactly. Vertical axis rotation fixed for legibility.
Revised Career Mission Log with large, dedicated work areas for the three professional paths. Each task is framed as a professional work order requiring the math skills learned in class (Systems, Polynomials, Sequences, and Data Analysis). Optimized for a 2-page layout with high-contrast text and corrected graph alignment. All placeholder text contrast improved for printing. Prompts were enlarged for better readability. Y-axis labels and header spacing fixed. Larger work areas for all phases. Fixed vertical text rotation. Consolidated to 2 pages exactly.
Final Career Pitch Portfolio Handout. Professional summary document for students to synthesize their math evidence into a final career pitch. Features kid-friendly terminology ('Evidence Log', 'Calculation Summary'), high-contrast work areas, and a structured executive brief layout for the 2-hour final block. Improved font sizes and larger explanation boxes for better student usability. Consolidated to a more efficient layout to prevent page breaks. Header icons standardized. Cover page label legibility improved. Main background set to white for proper printer margins. Removed rigid height constraints to prevent fragmentation. Signature box enlarged. Header spacing corrected. Standardized to 'Executive Pitch Portfolio'.
Revised Career Mission Log with large, dedicated work areas for the three professional paths. Each task is framed as a professional work order requiring the math skills learned in class (Systems, Polynomials, Sequences, and Data Analysis). Optimized for a 2-page layout with high-contrast text and corrected graph alignment. Prompts were enlarged for better readability. Y-axis labels fixed using standard rotation. Scatter plot grid spans full height. consolidated to 2 pages.
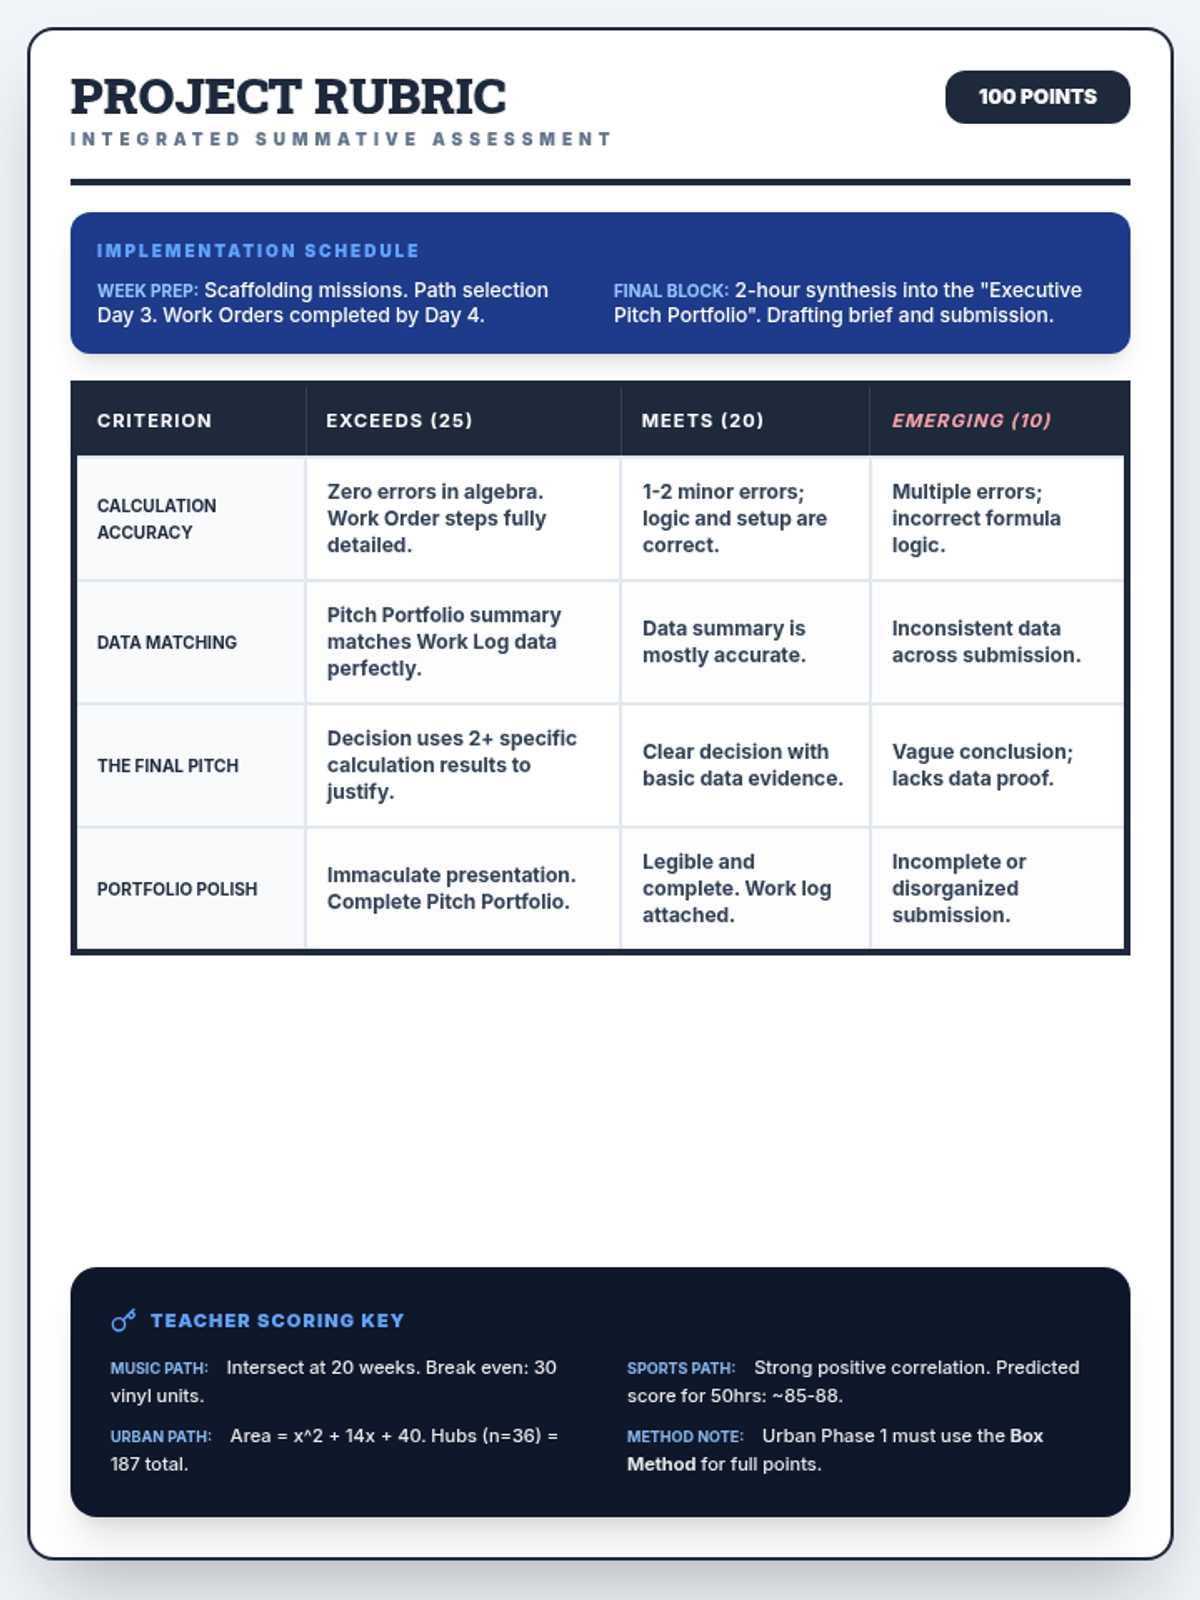
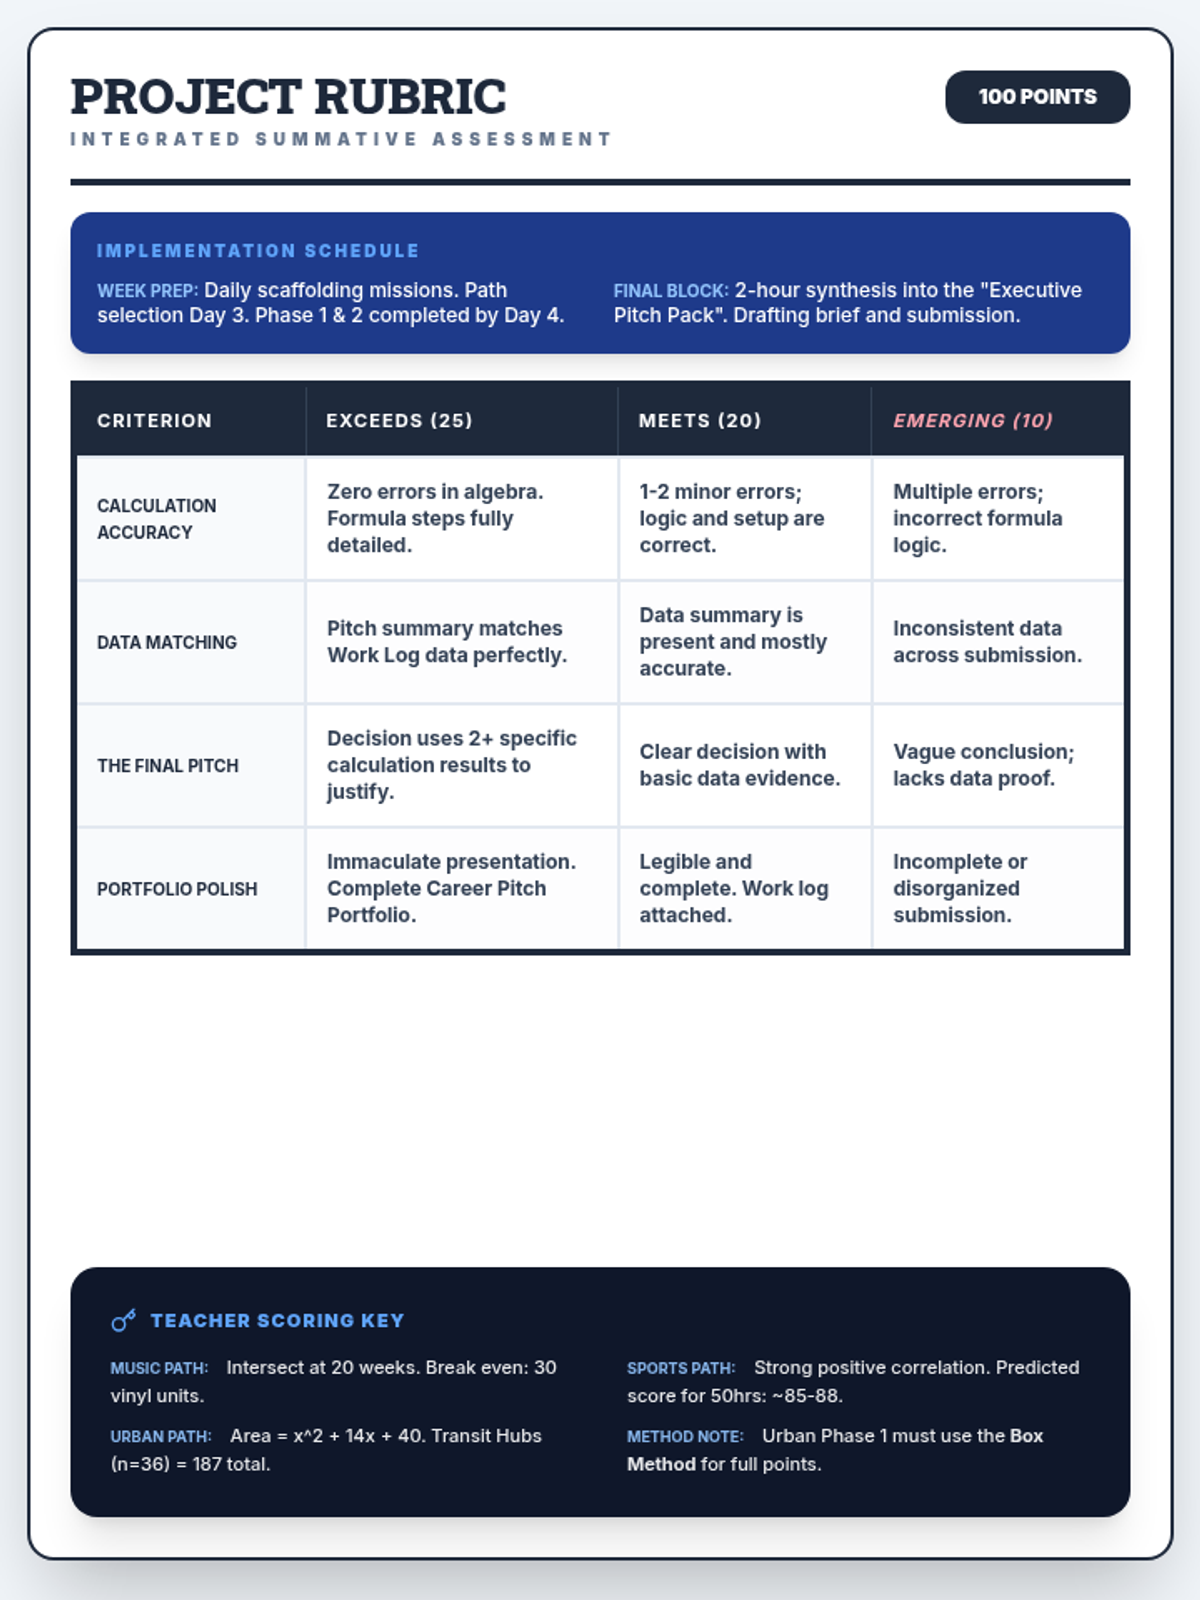
Revised Teacher Rubric updated with kid-friendly language. 'Math Accuracy' is now 'Calculation Accuracy', 'Proof Synthesis' is 'Data Matching', and 'Executive Brief' is 'The Final Pitch'. Maintains a clean one-page layout. Updated to explicitly reference the Box Method for the Urban Planner path. Naming standardized to 'Executive Pitch Portfolio'.
Final Executive Career Portfolio Handout. Professional summary document for students to synthesize their math evidence into a final career pitch. Features kid-friendly terminology ('Evidence Log', 'Calculation Summary'), high-contrast work areas, and a structured executive brief layout for the 2-hour final block. Improved font sizes and larger explanation boxes for better student usability. Consolidated to a more efficient layout to prevent page breaks. Header icons standardized. Cover page label legibility improved. Main background set to white for proper printer margins. Removed rigid height constraints to prevent fragmentation.
Revised Career Mission Log with large, dedicated work areas for the three professional paths. Each task is framed as a professional work order requiring the math skills learned in class (Systems, Polynomials, Sequences, and Data Analysis). Optimized for a 2-page layout with high-contrast text and corrected graph alignment. All placeholder text contrast improved for printing. Prompts were enlarged for better readability. Y-axis labels and header spacing fixed. Larger work areas for all phases. Fixed vertical text rotation.
Final Career Pitch Portfolio Handout. Professional summary document for students to synthesize their math evidence into a final career pitch. Features kid-friendly terminology ('Evidence Log', 'Calculation Summary'), high-contrast work areas, and a structured executive brief layout for the 2-hour final block. Improved font sizes and larger explanation boxes for better student usability. Consolidated to a more efficient layout to prevent page breaks. Fixed fixed height issues causing rendering errors. Signature box enlarged. Header spacing corrected. Header icons standardized. Cover page label legibility improved. Main background set to white for proper printer margins. Removed rigid height constraints to prevent fragmentation.
Revised Career Mission Log with large, dedicated work areas for the three professional paths. Each task is framed as a professional work order requiring the math skills learned in class (Systems, Polynomials, Sequences, and Data Analysis). Optimized for a 2-page layout with high-contrast text and corrected graph alignment. All placeholder text contrast improved for printing. Prompts were enlarged for better readability. Y-axis labels and header spacing fixed. Larger work areas for all phases.
Revised Career Mission Log with large, dedicated work areas for the three professional paths. Each task is framed as a professional work order requiring the math skills learned in class (Systems, Polynomials, Sequences, and Data Analysis). Optimized for a 2-page layout with high-contrast text and corrected graph alignment. All placeholder text contrast improved for printing. Y-axis labels and header spacing fixed. Larger work areas for all phases.
Revised Teacher Rubric updated with kid-friendly language. 'Math Accuracy' is now 'Calculation Accuracy', 'Proof Synthesis' is 'Data Matching', and 'Executive Brief' is 'The Final Pitch'. Maintains a clean one-page layout. Updated to explicitly reference the Box Method for the Urban Planner path.
Revised project introduction slides centered around a 'Job Board' theme. Each career path (Music Mogul, Urban Planner, Sports Analyst) explicitly requires the math skills learned in class, framed as professional requirements. Improved spacing, consistent alignment, and increased font sizes for legibility.
Revised Career Mission Log with large, dedicated work areas for the three professional paths. Each task is framed as a professional work order requiring the math skills learned in class (Systems, Polynomials, Sequences, and Data Analysis). Optimized for a 2-page layout with high-contrast text and corrected graph alignment. All placeholder text contrast improved for printing. Prompts were enlarged for better readability. Y-axis labels and header spacing fixed.
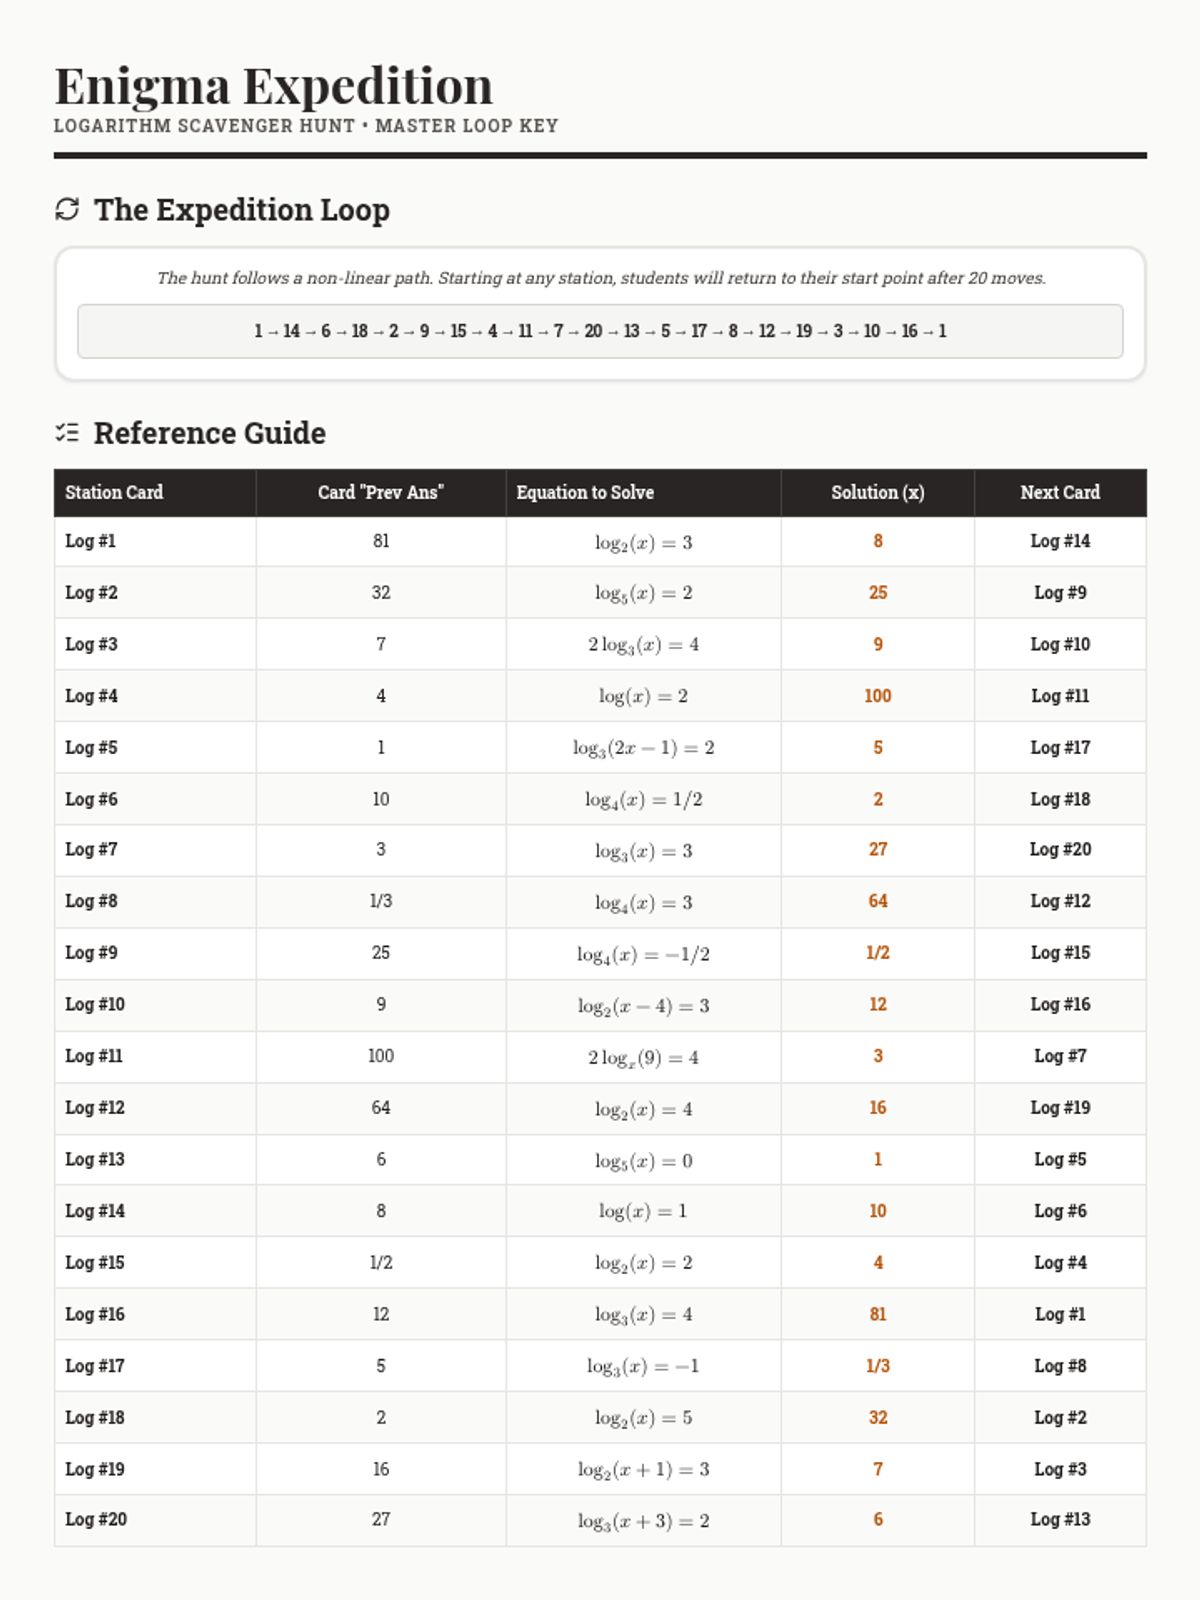
A comprehensive teacher answer key for the Enigma Expedition scavenger hunt. It includes the correct randomized loop sequence and a detailed station-by-station breakdown of previous answers, equations, and solutions.
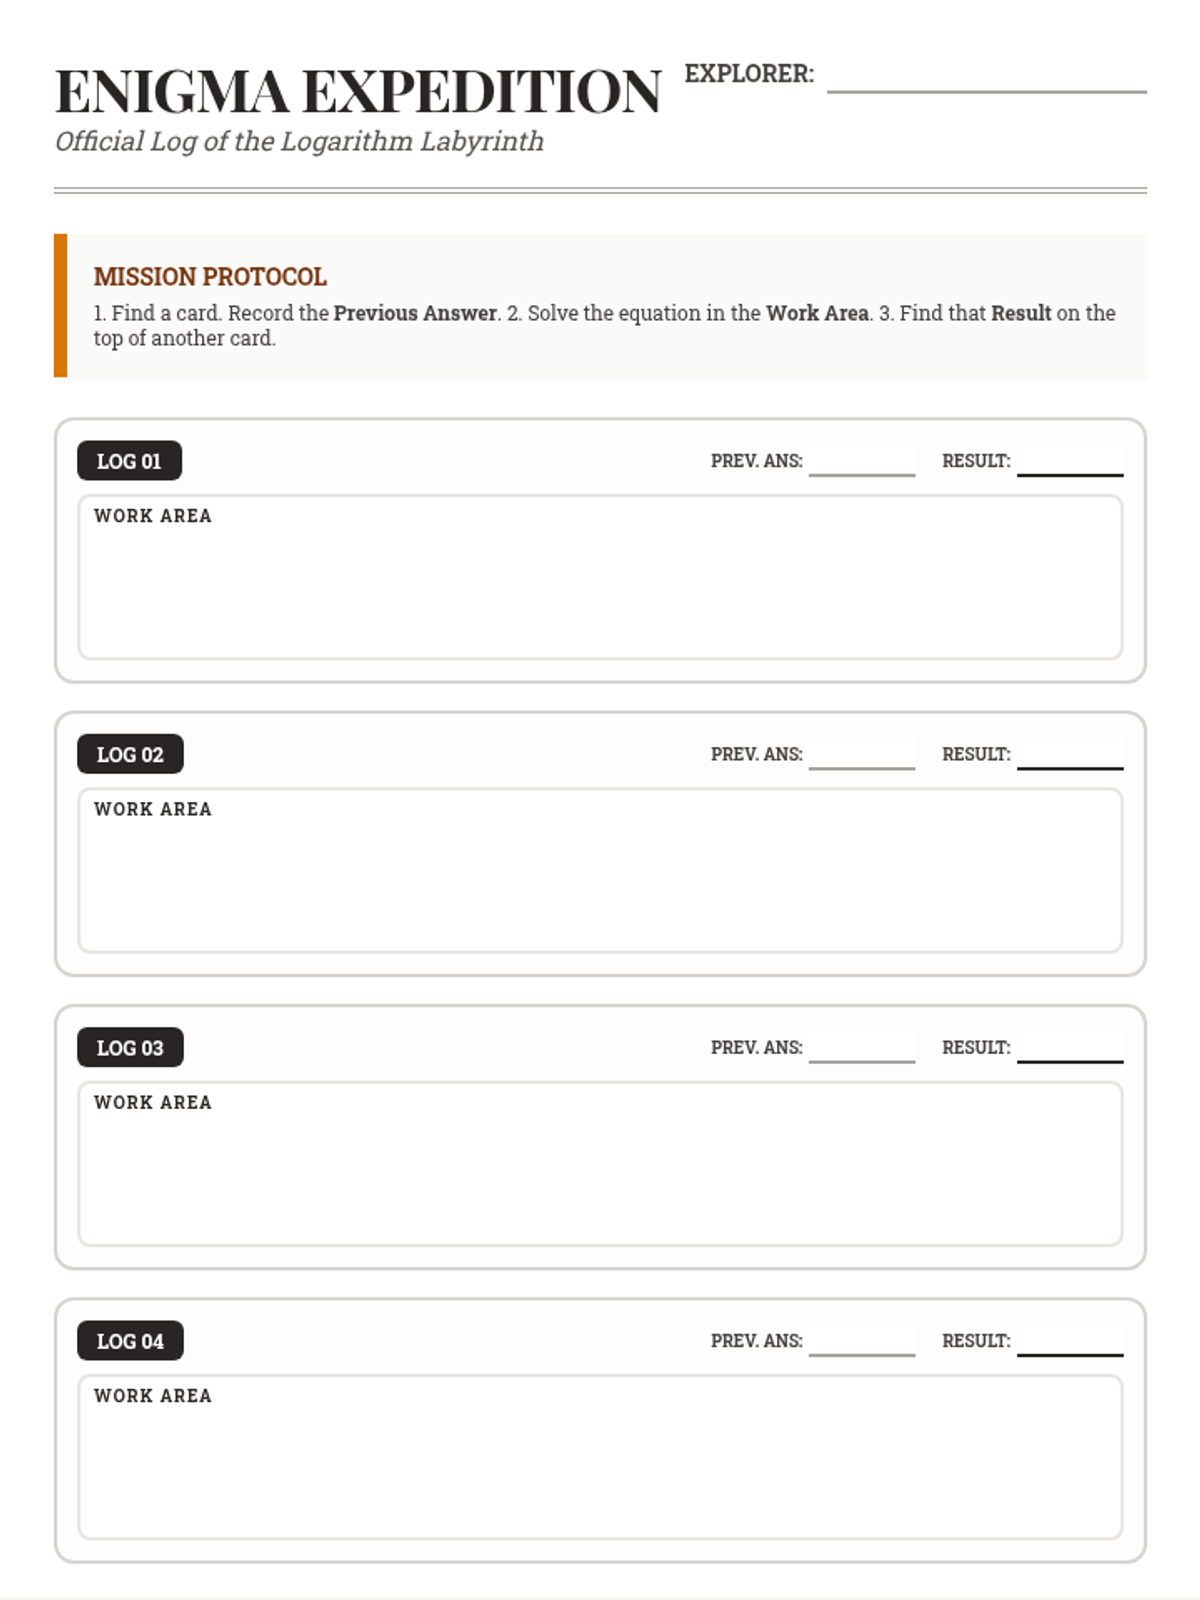
A student recording sheet for the Enigma Expedition scavenger hunt. It includes 20 numbered work boxes for students to track their progress, record station numbers, and show their calculations.
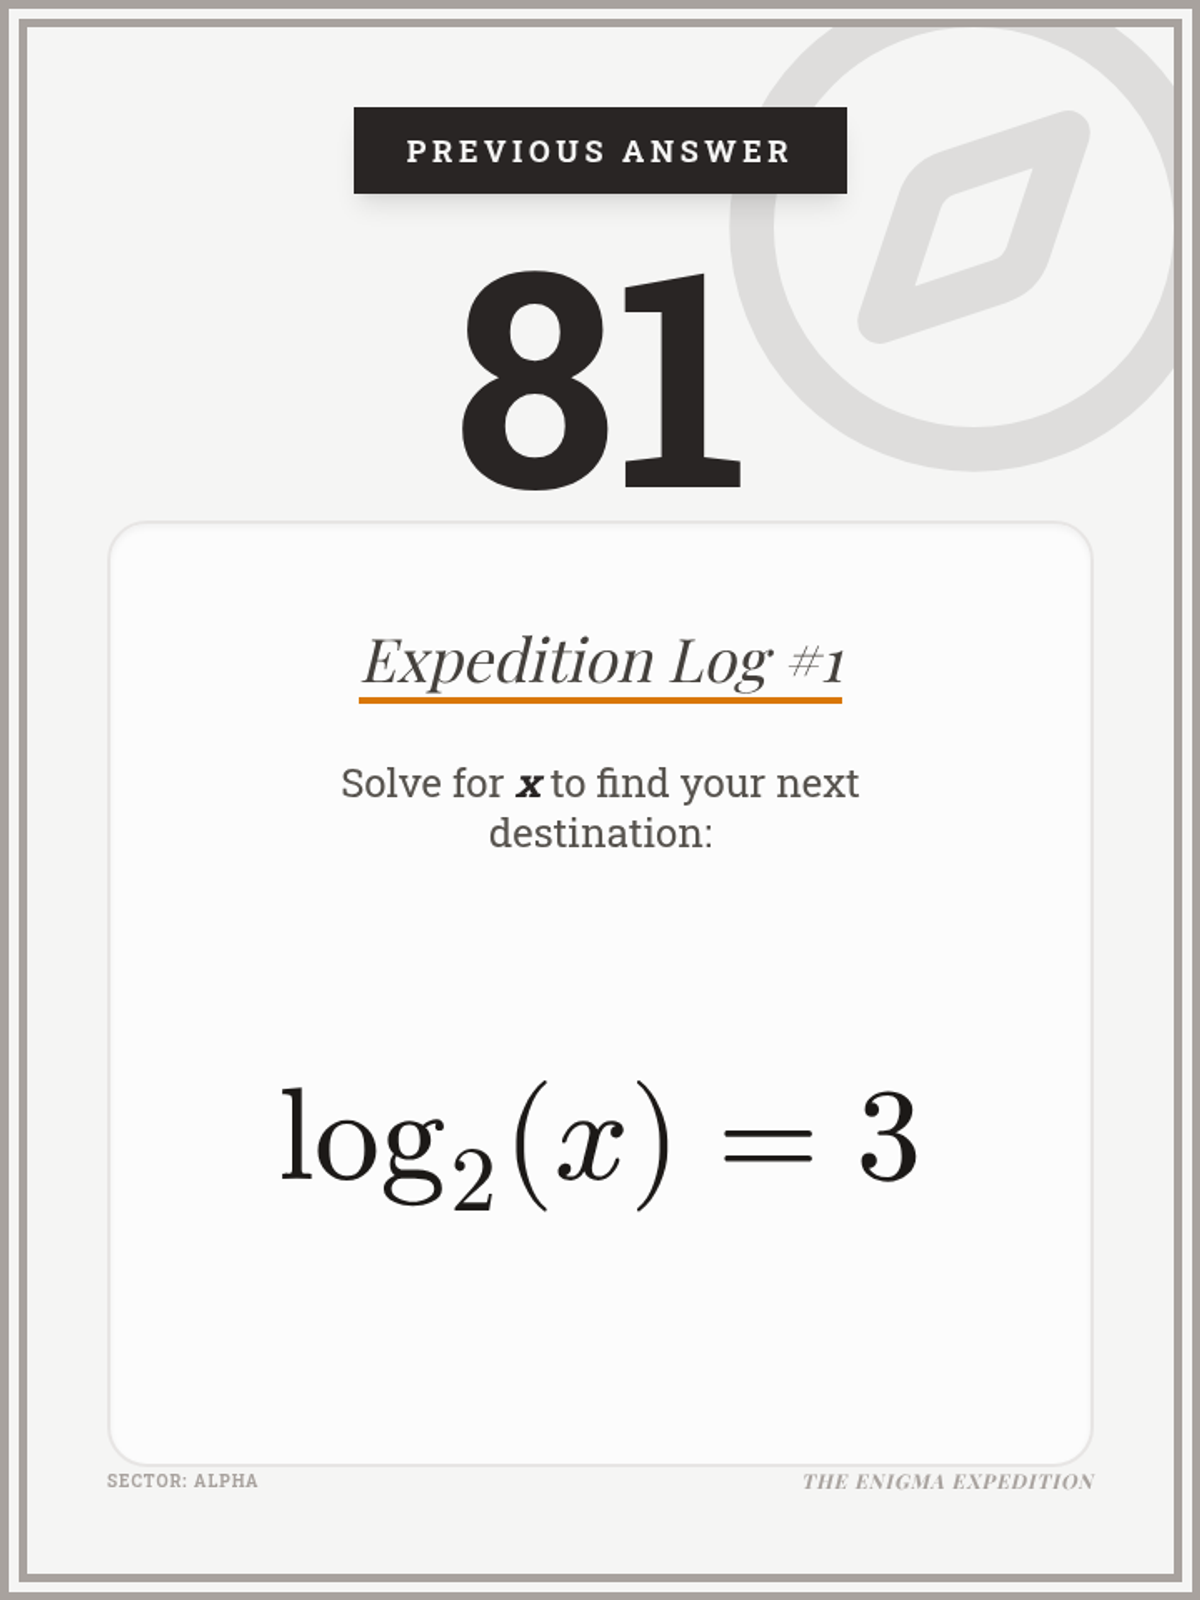
A set of 20 scavenger hunt task cards themed as an 'Enigma Expedition'. The stations have been randomized to create a non-linear loop, featuring a 'Previous Answer' at the top and a logarithmic equation to solve in the center.
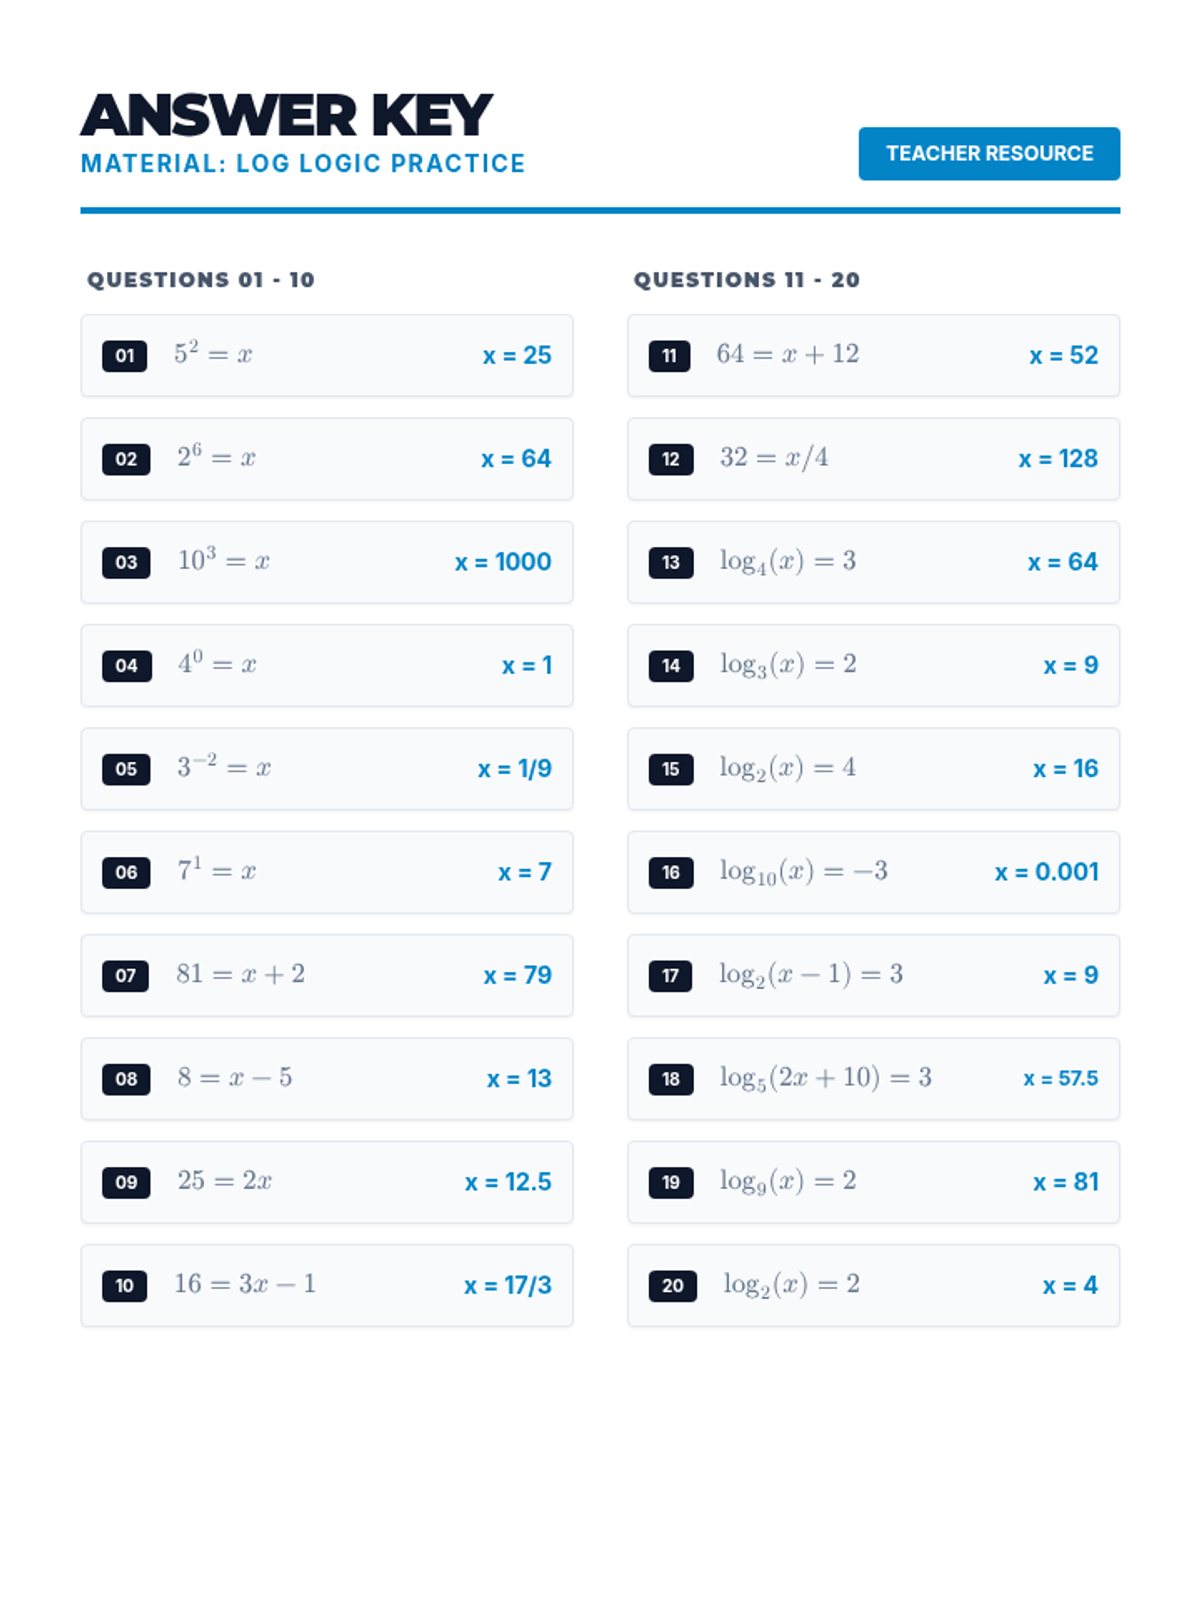
A complete answer key for the 20-question practice worksheet, providing step-by-step logic and final answers for each problem.
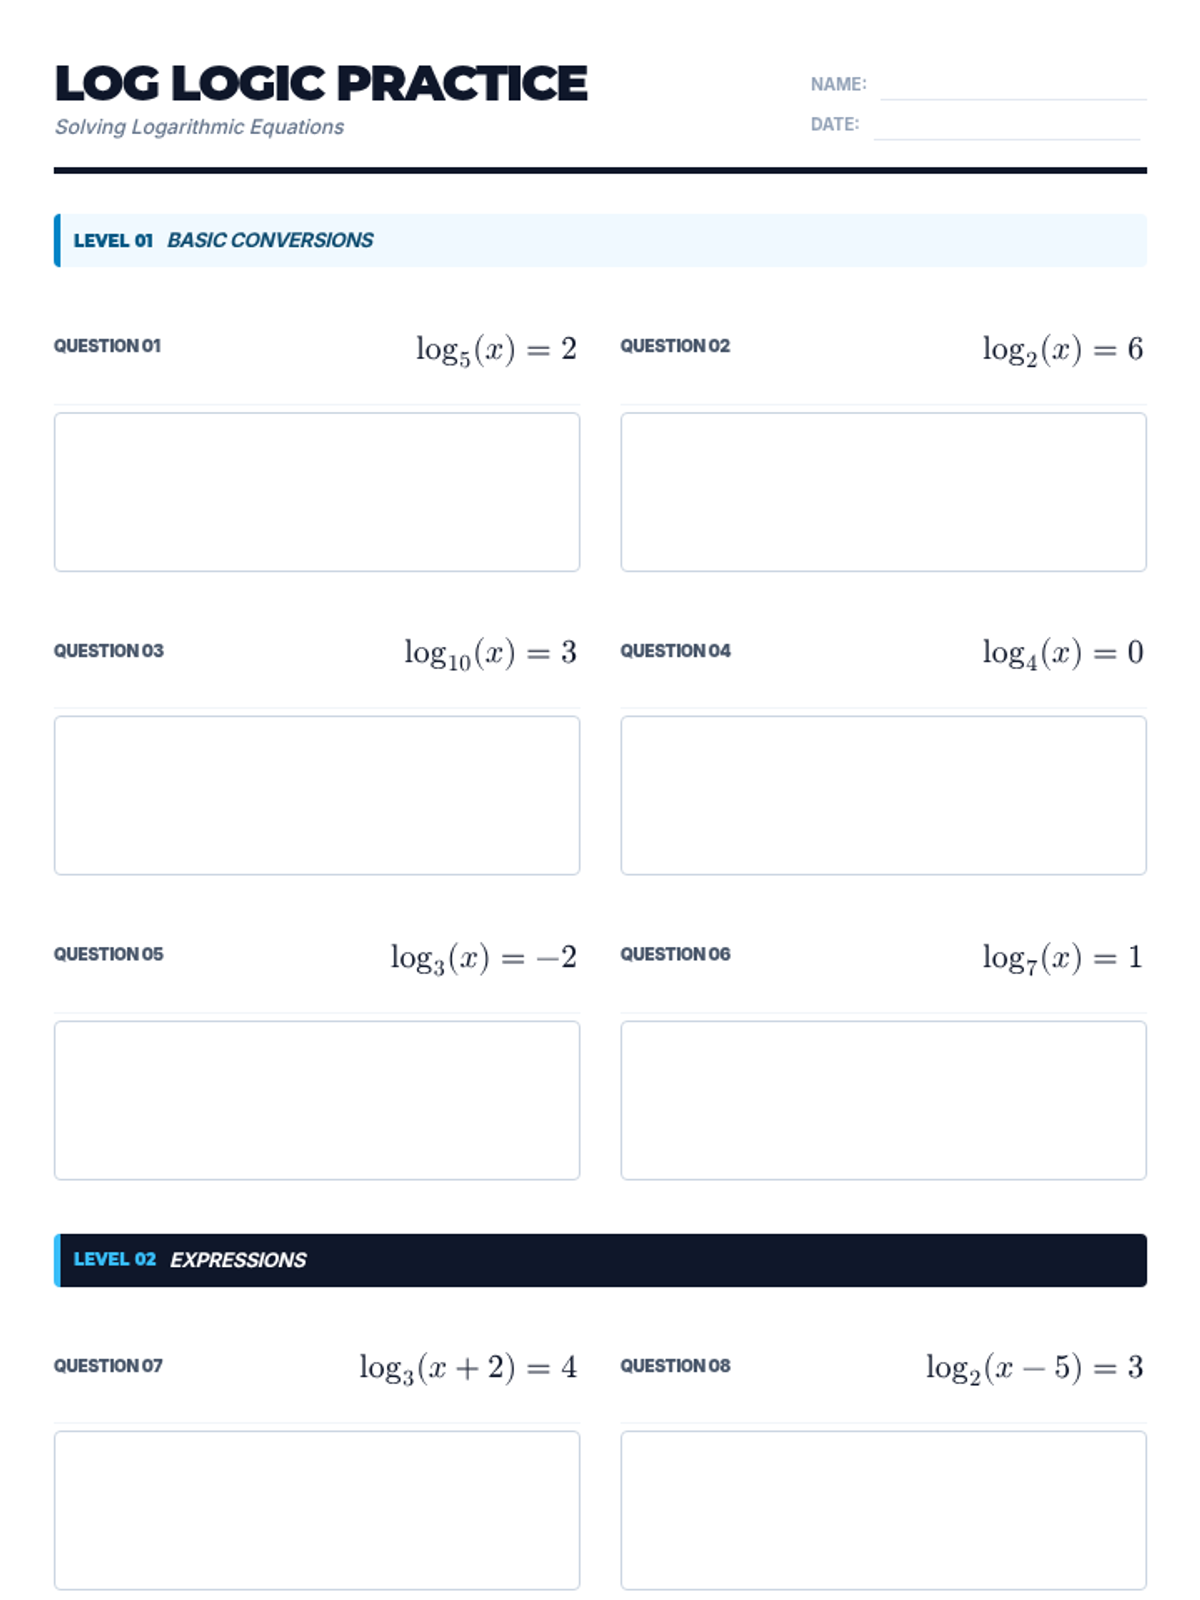
A comprehensive 20-question practice worksheet for solving logarithmic equations. Progresses from basic conversions to expression arguments and equations requiring isolation.
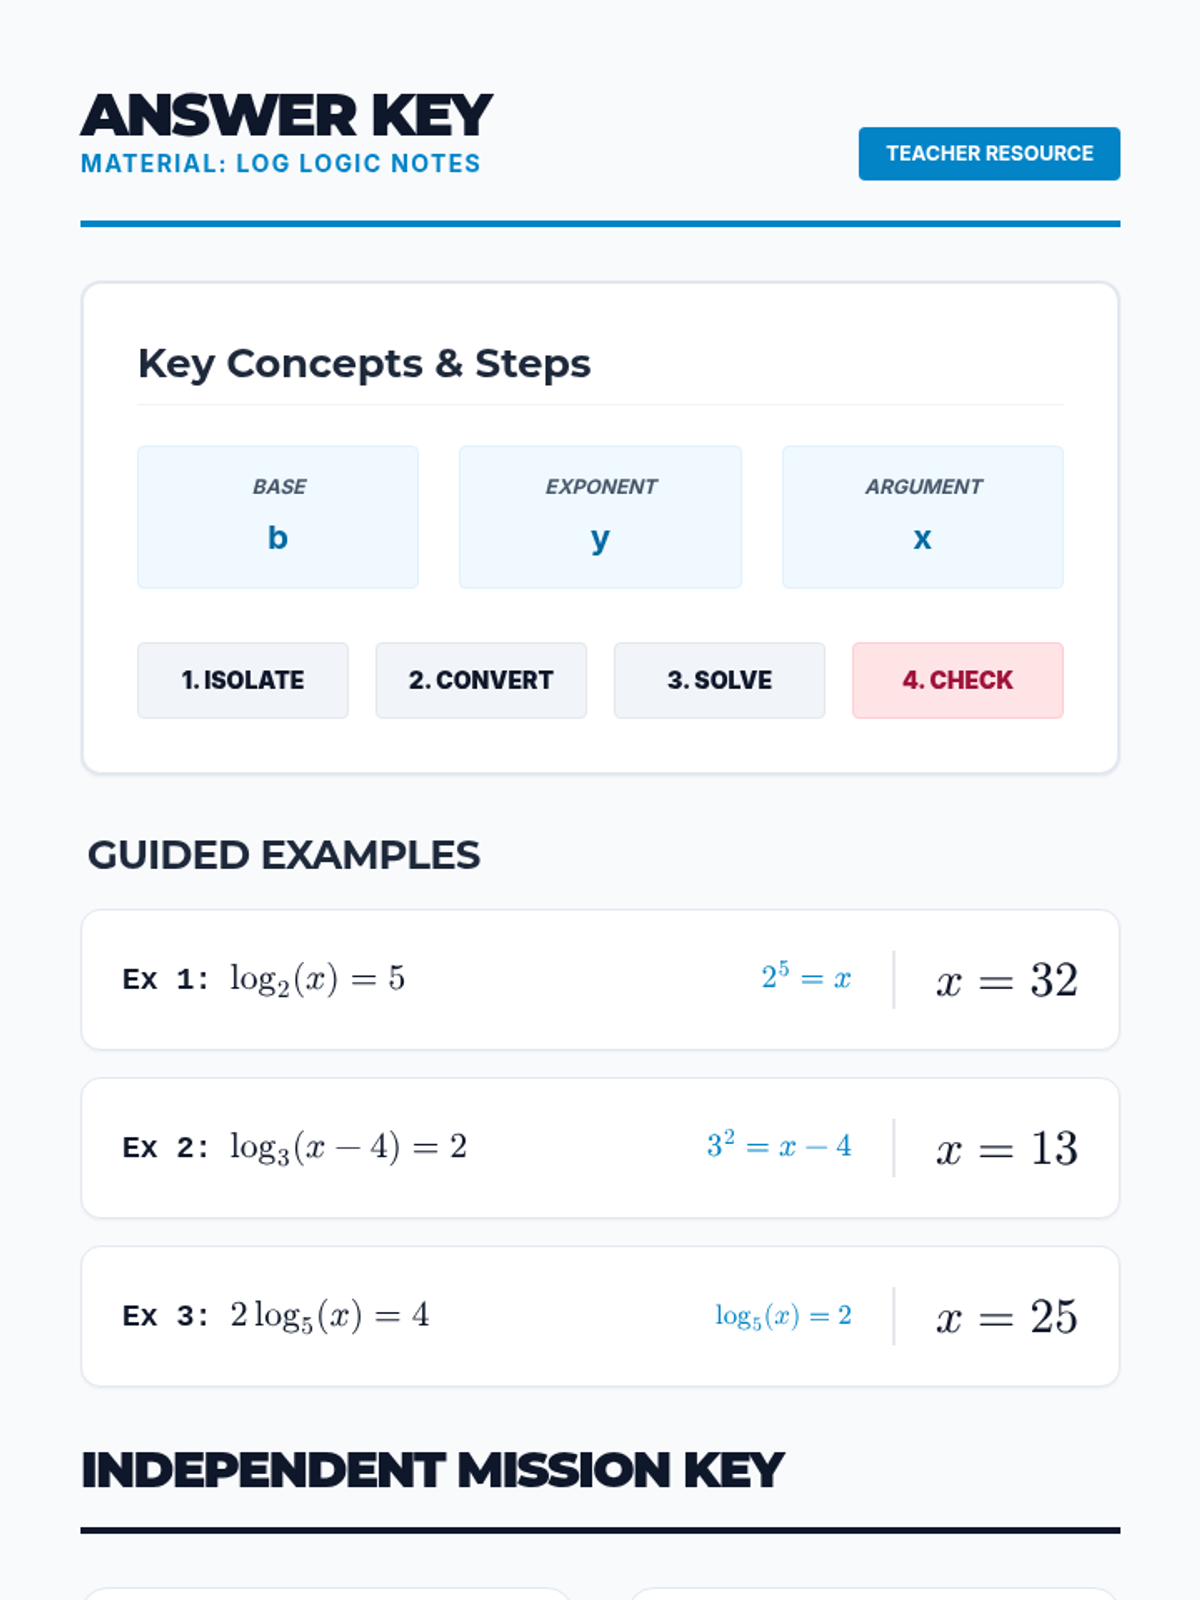
A complete answer key for the Log Logic notes and practice worksheet. Provides step-by-step solutions for all guided and independent problems.
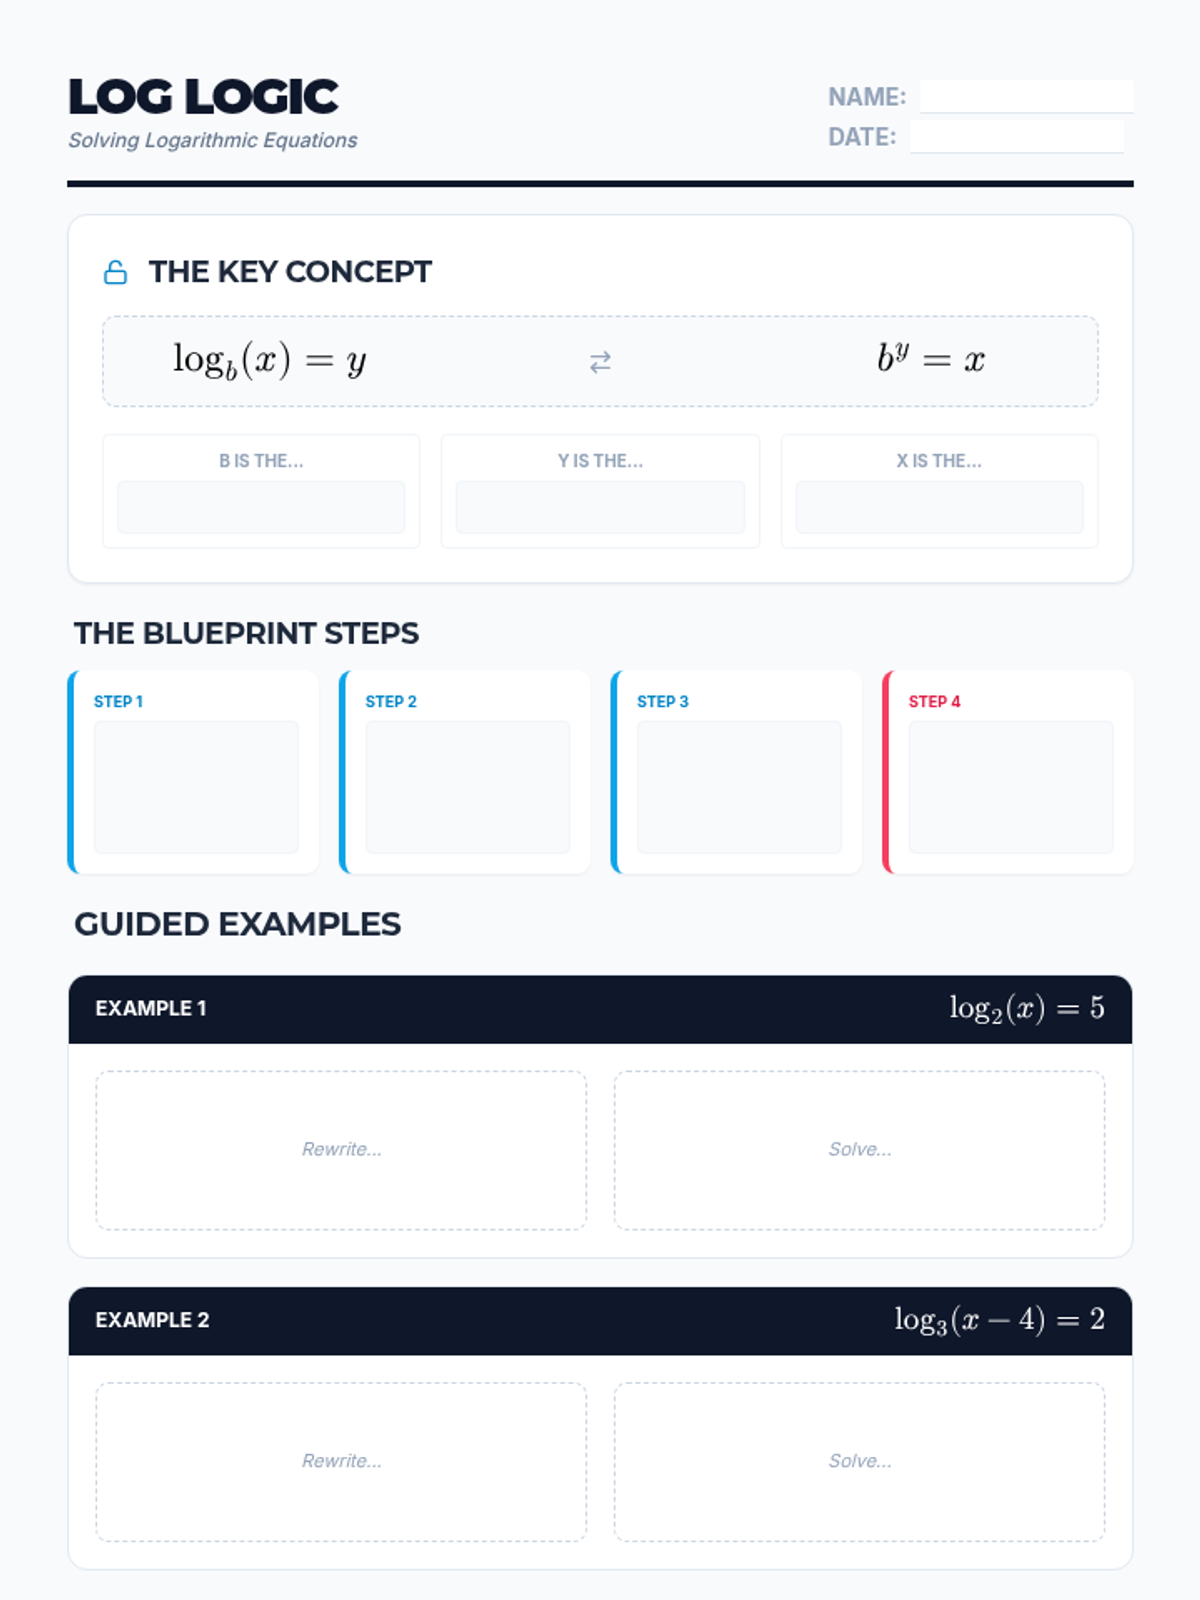
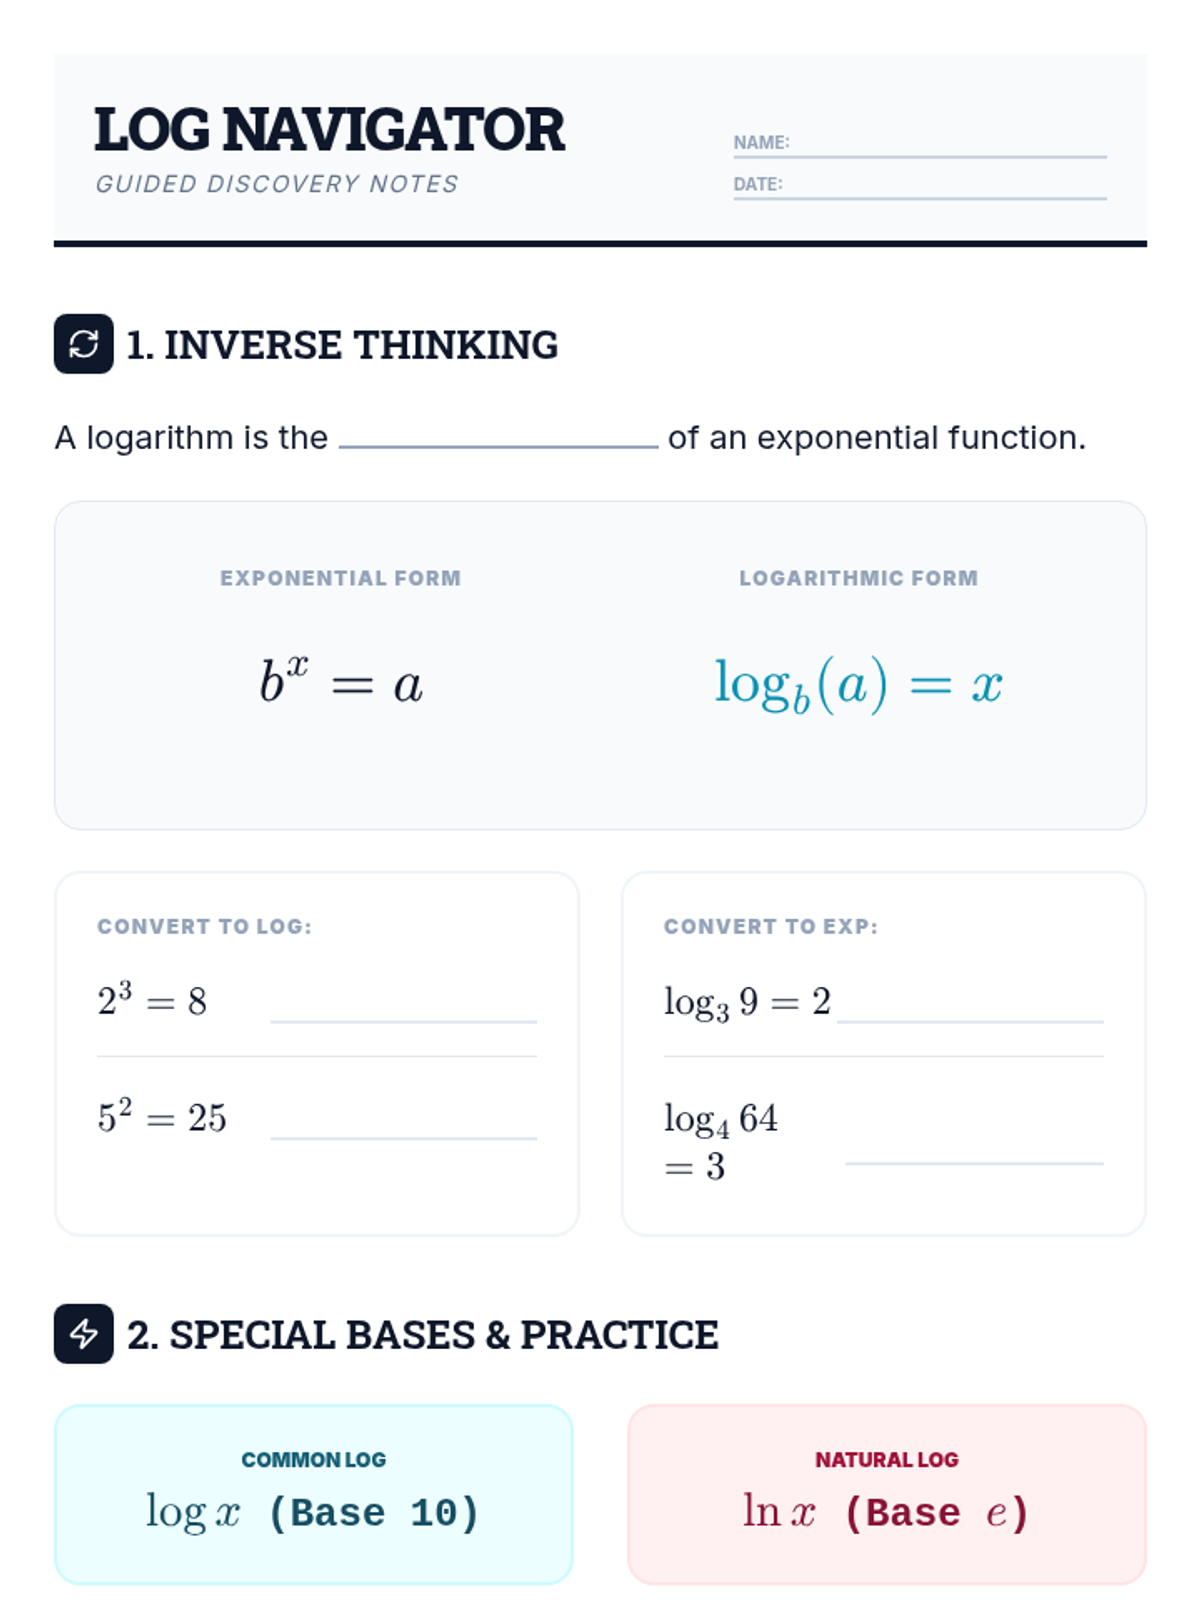
A guided notes document designed for students to fill out while following the presentation. It covers the core conversion formula, isolation steps, and includes three guided examples plus independent practice problems.
A visual slide deck teaching the core concept of solving logarithmic equations by converting them to exponential form. Includes the 'loop' method visualization and step-by-step examples.
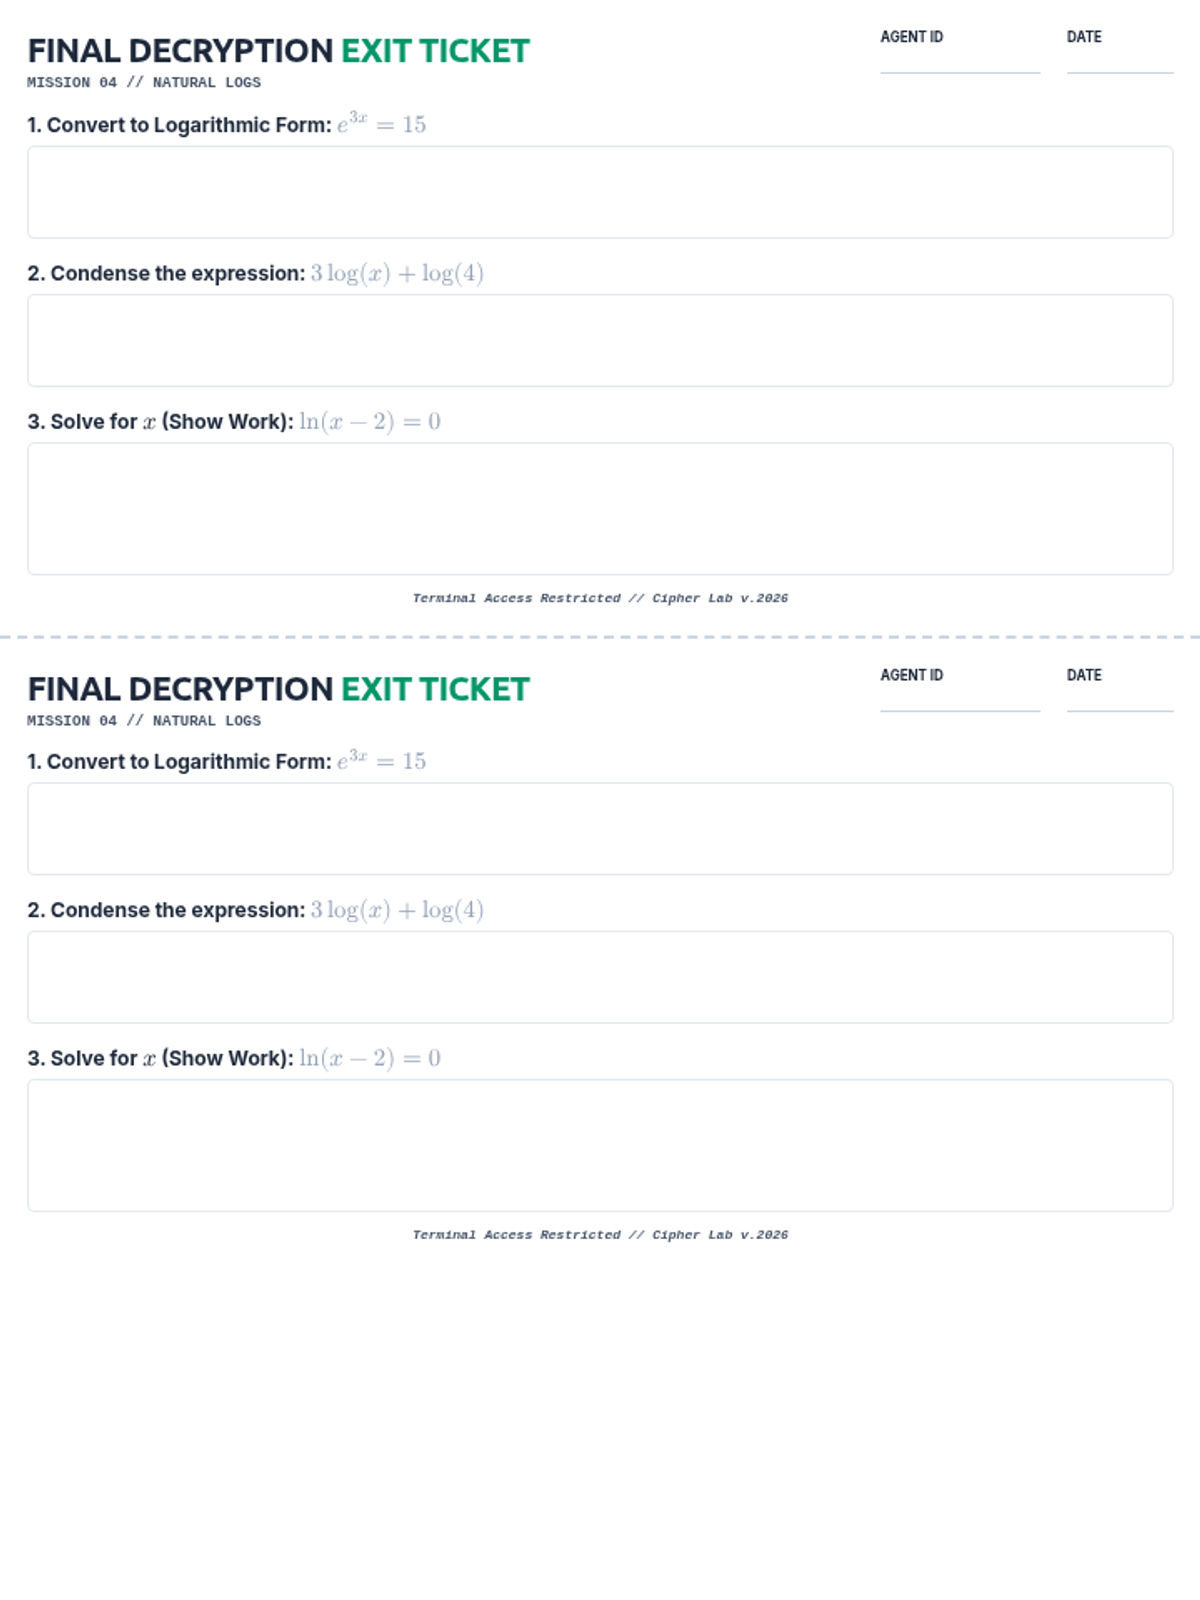
A half-page exit ticket designed to quickly assess student understanding of form conversion, logarithmic properties, and natural log equations.
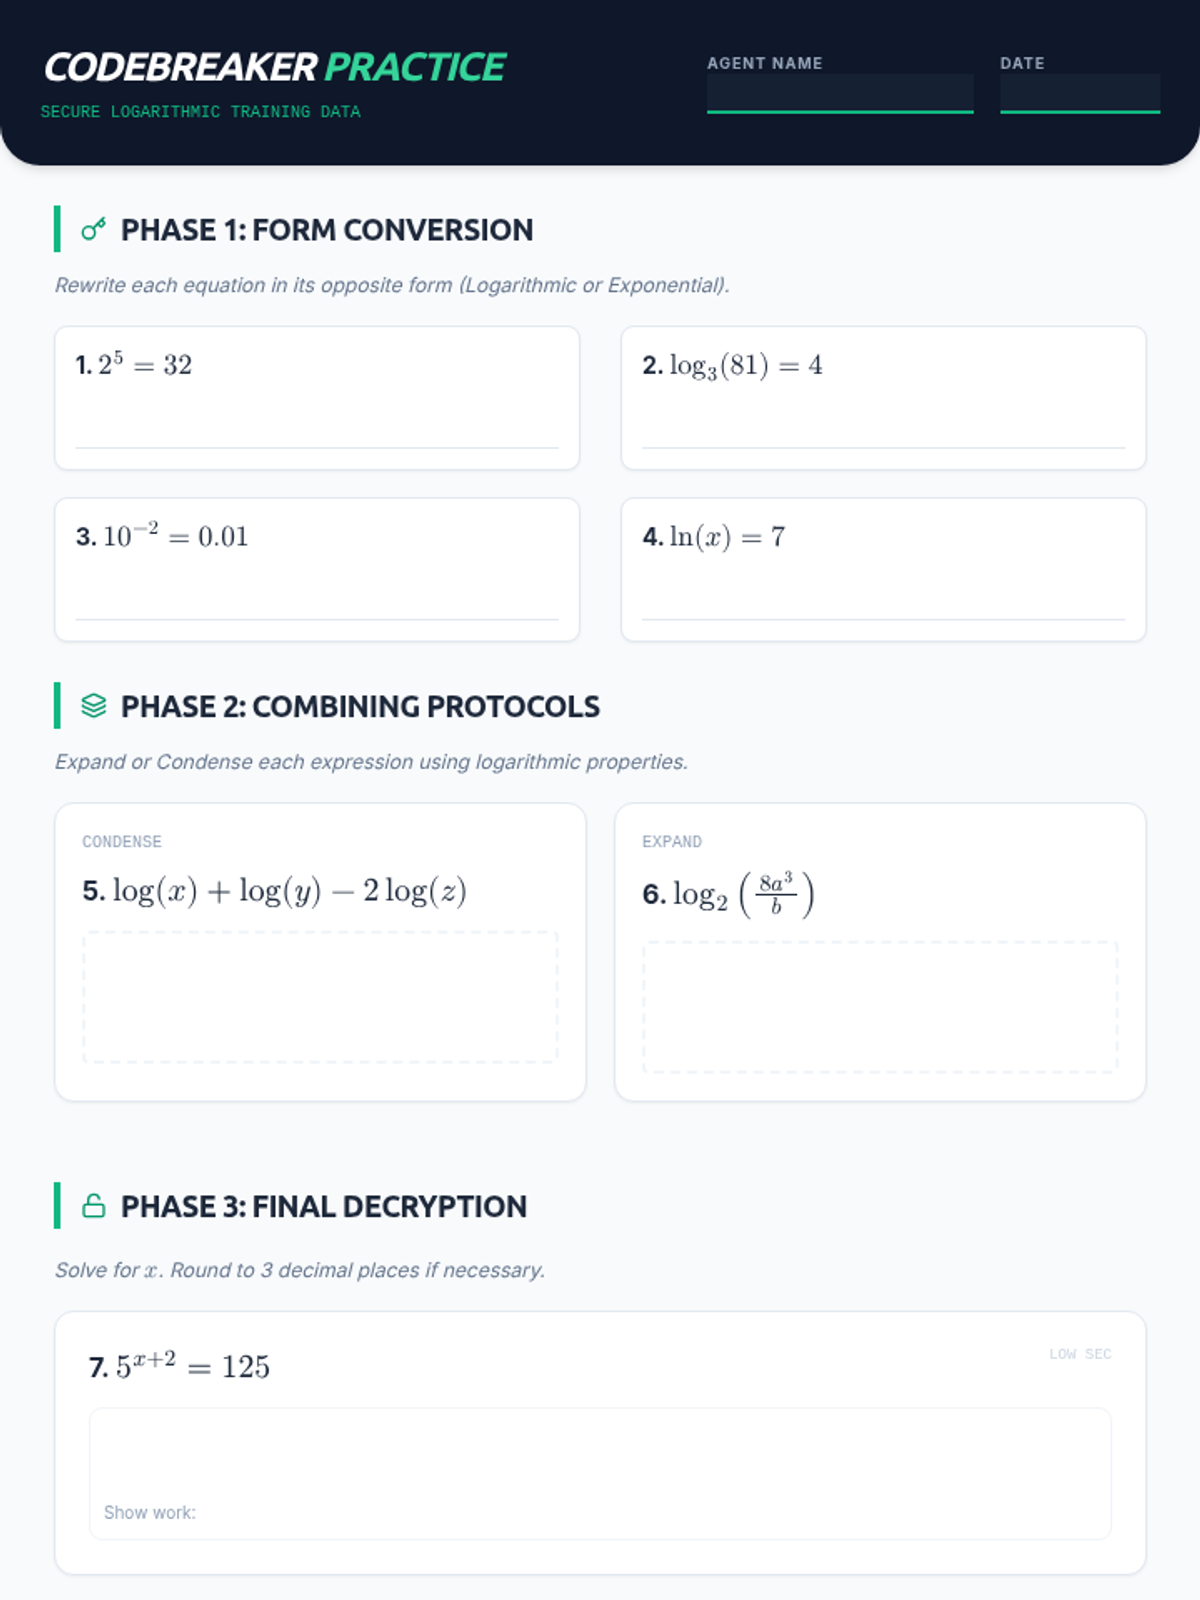
A themed student worksheet for practicing logarithmic and exponential conversions, property application, and equation solving.
An engaging visual slide deck for the Cipher Lab lesson, featuring the decoder ring for form conversion, logarithmic properties, and solving natural log equations.
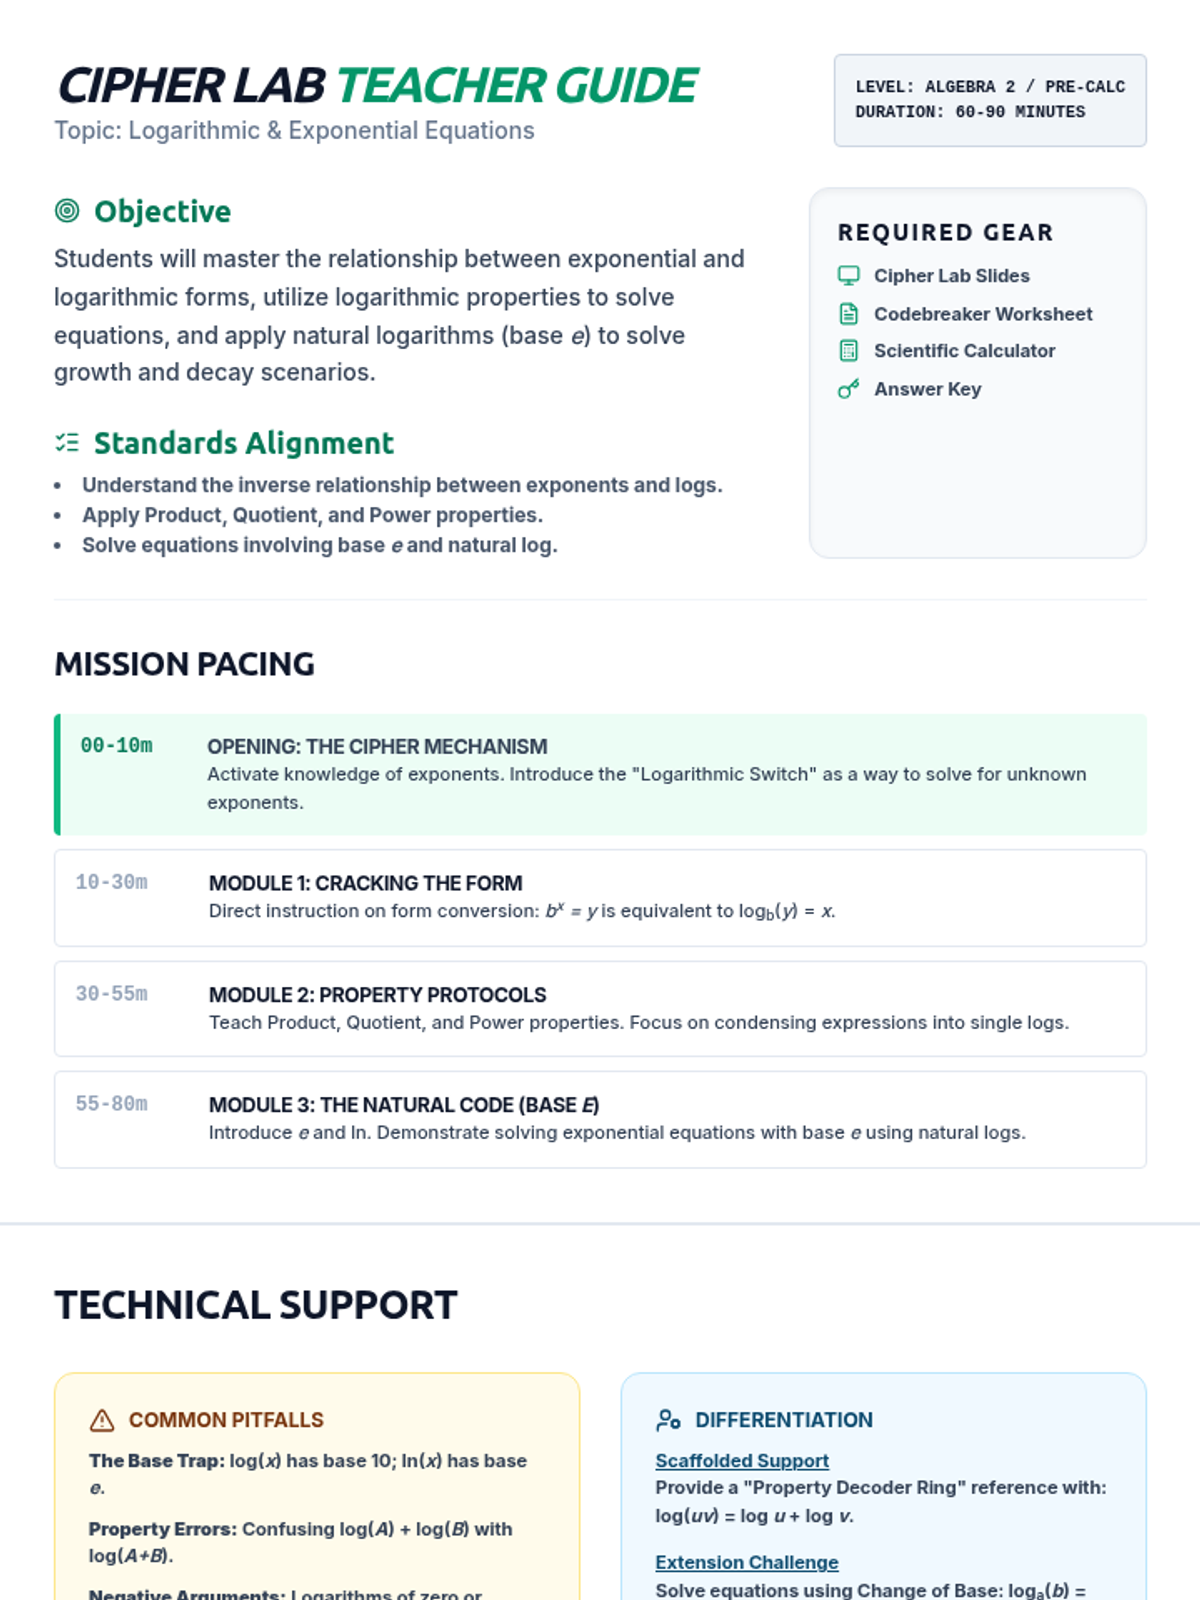
A comprehensive teacher guide for a lesson on logarithmic and exponential equations, including mission pacing, common pitfalls, differentiation strategies, and an answer key reference.
An engaging presentation slide deck for introducing logarithms. It covers the inverse relationship with exponentials, form conversion techniques, the constant 'e' and natural logarithms, and the three main logarithmic properties (Product, Quotient, and Power) with visual cues and practice problems.
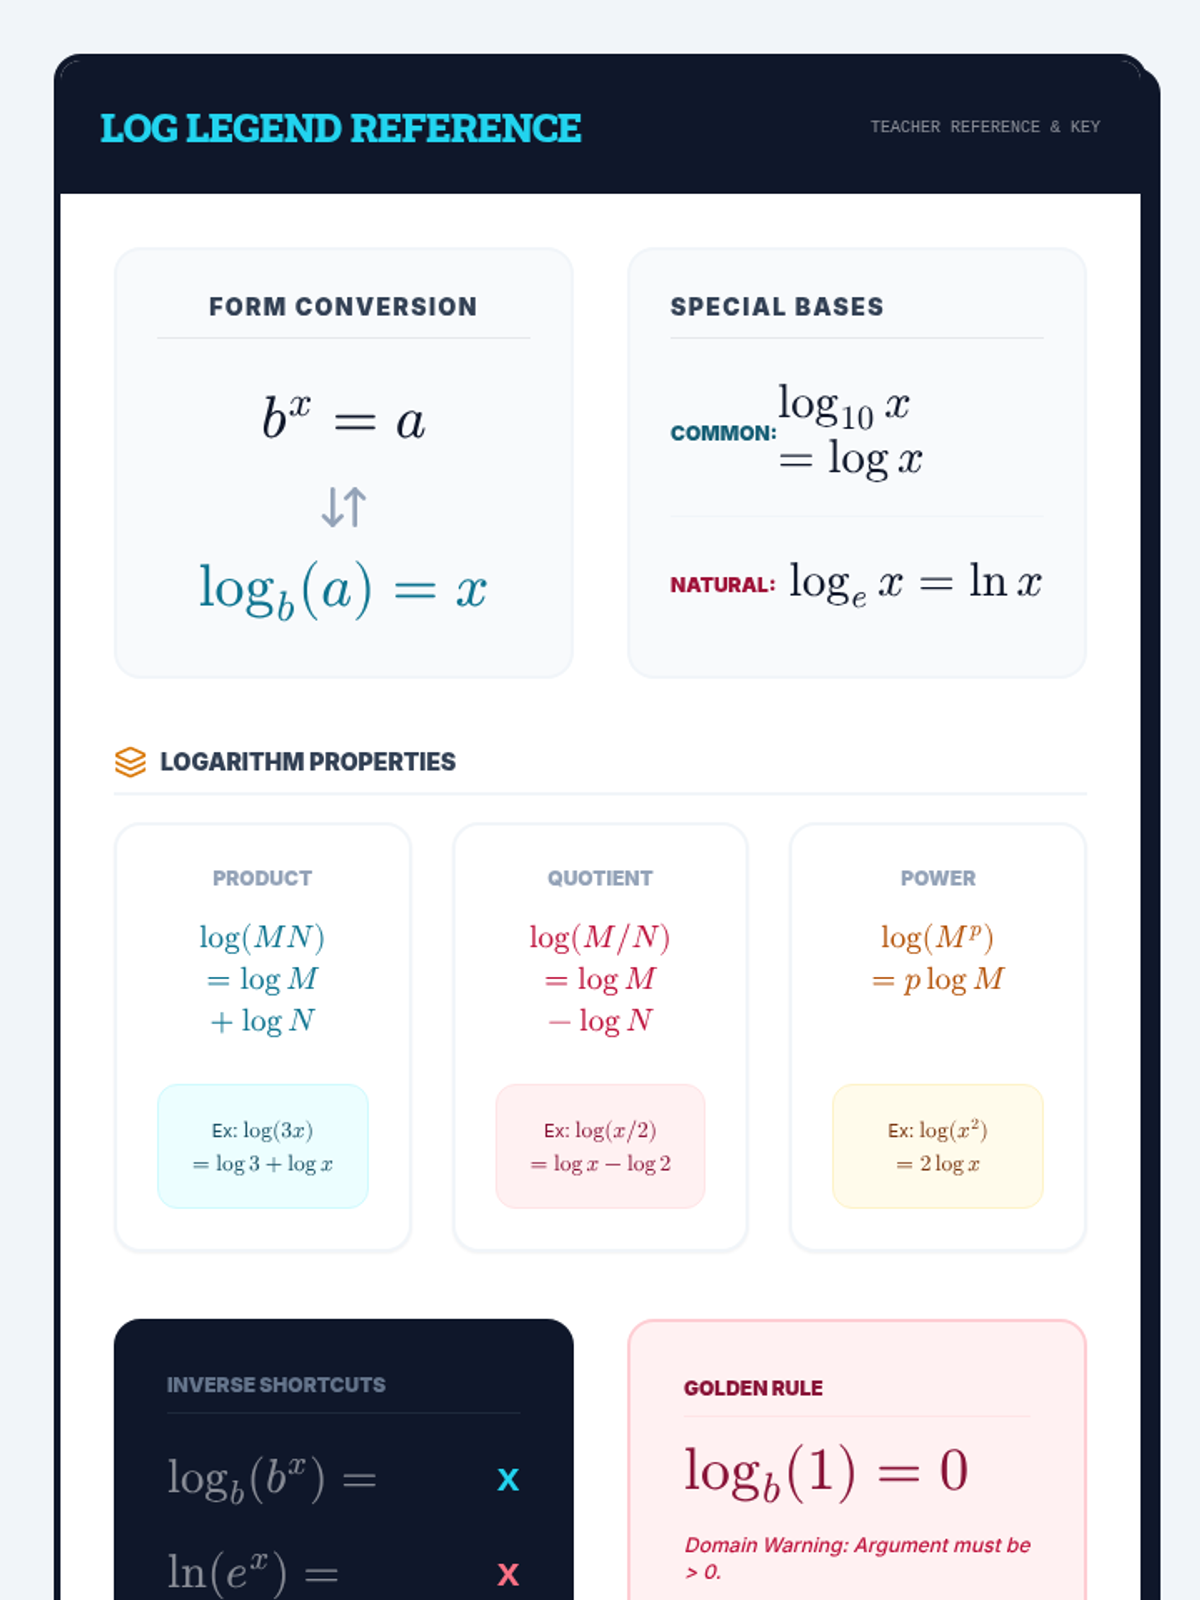
A high-density reference sheet summarizing the core rules of logarithms. It includes the exponential-to-logarithmic conversion formula, properties of logarithms (Product, Quotient, Power), special bases (common and natural), inverse identity shortcuts, and common pitfalls to avoid.
A comprehensive guided notes sheet for introducing logarithmic concepts. It features structured sections for converting between exponential and logarithmic forms, evaluating logs with various bases (including common and natural logs), and exploring fundamental logarithmic properties.
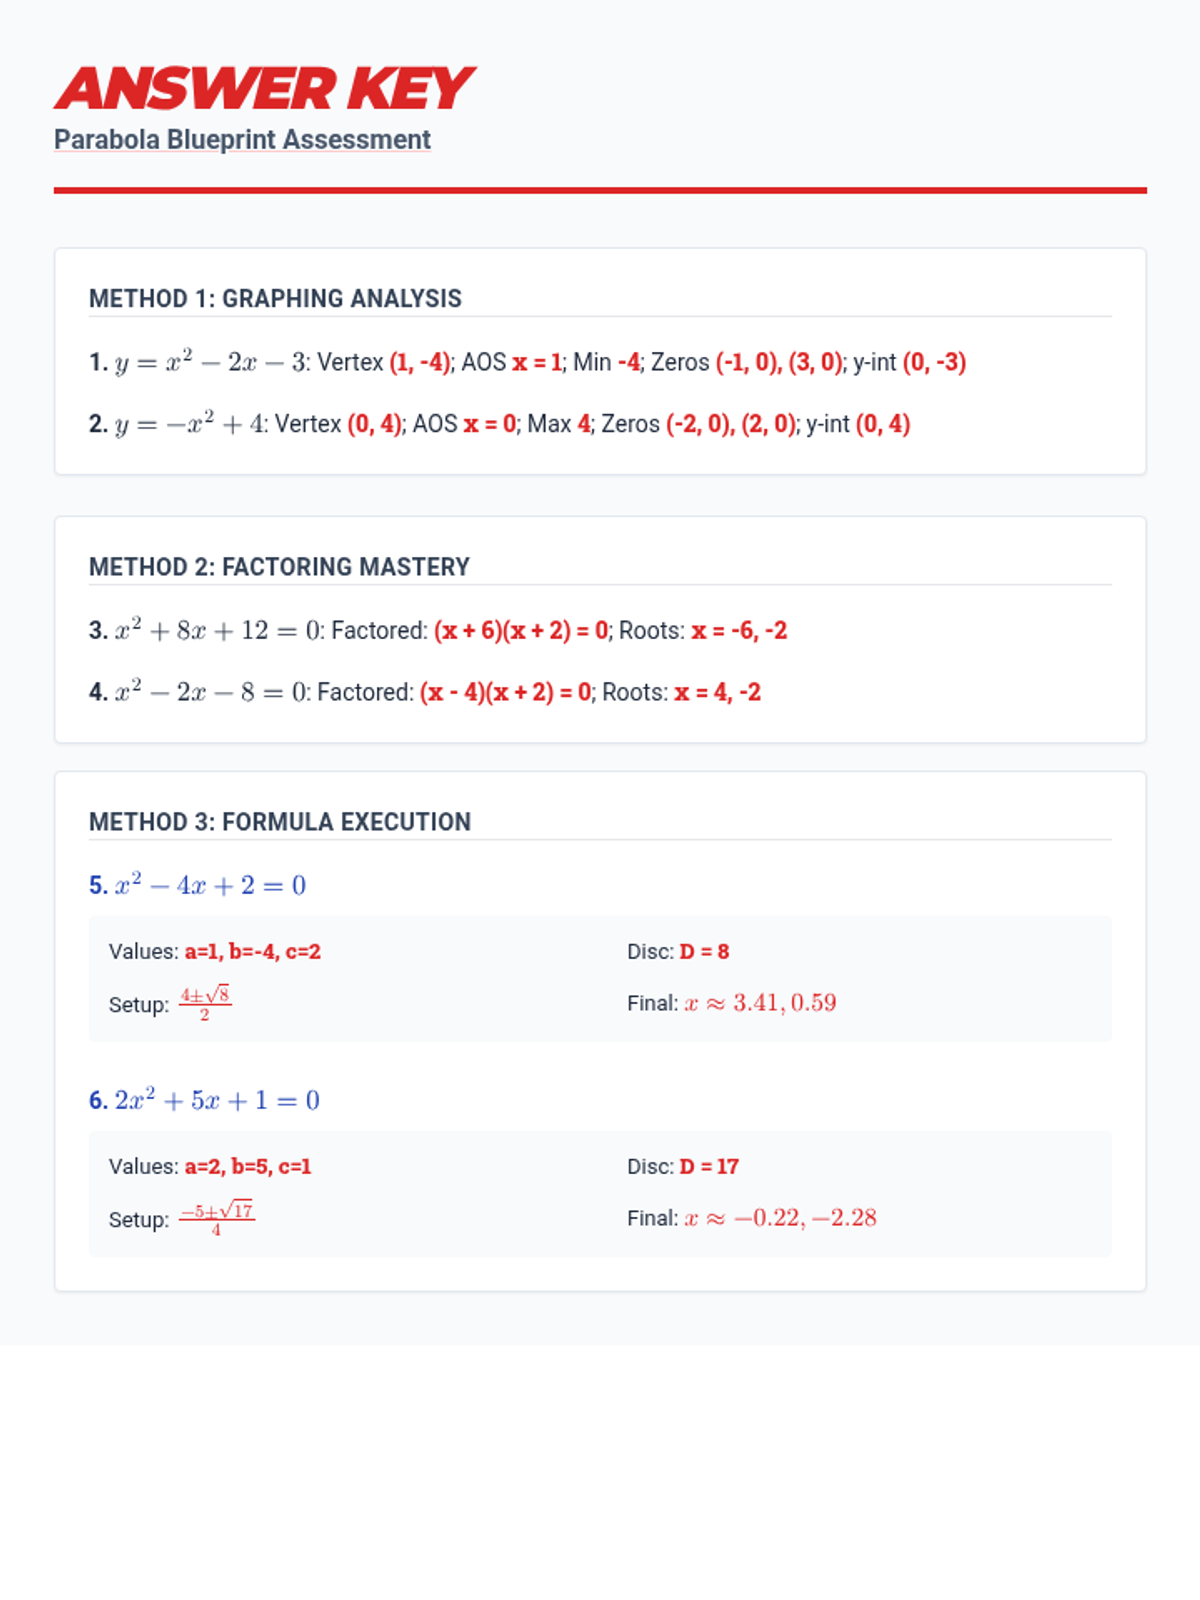
Teacher-facing answer key for the summative assessment. Refined to align with the single-column parabola analysis and updated problem layouts.
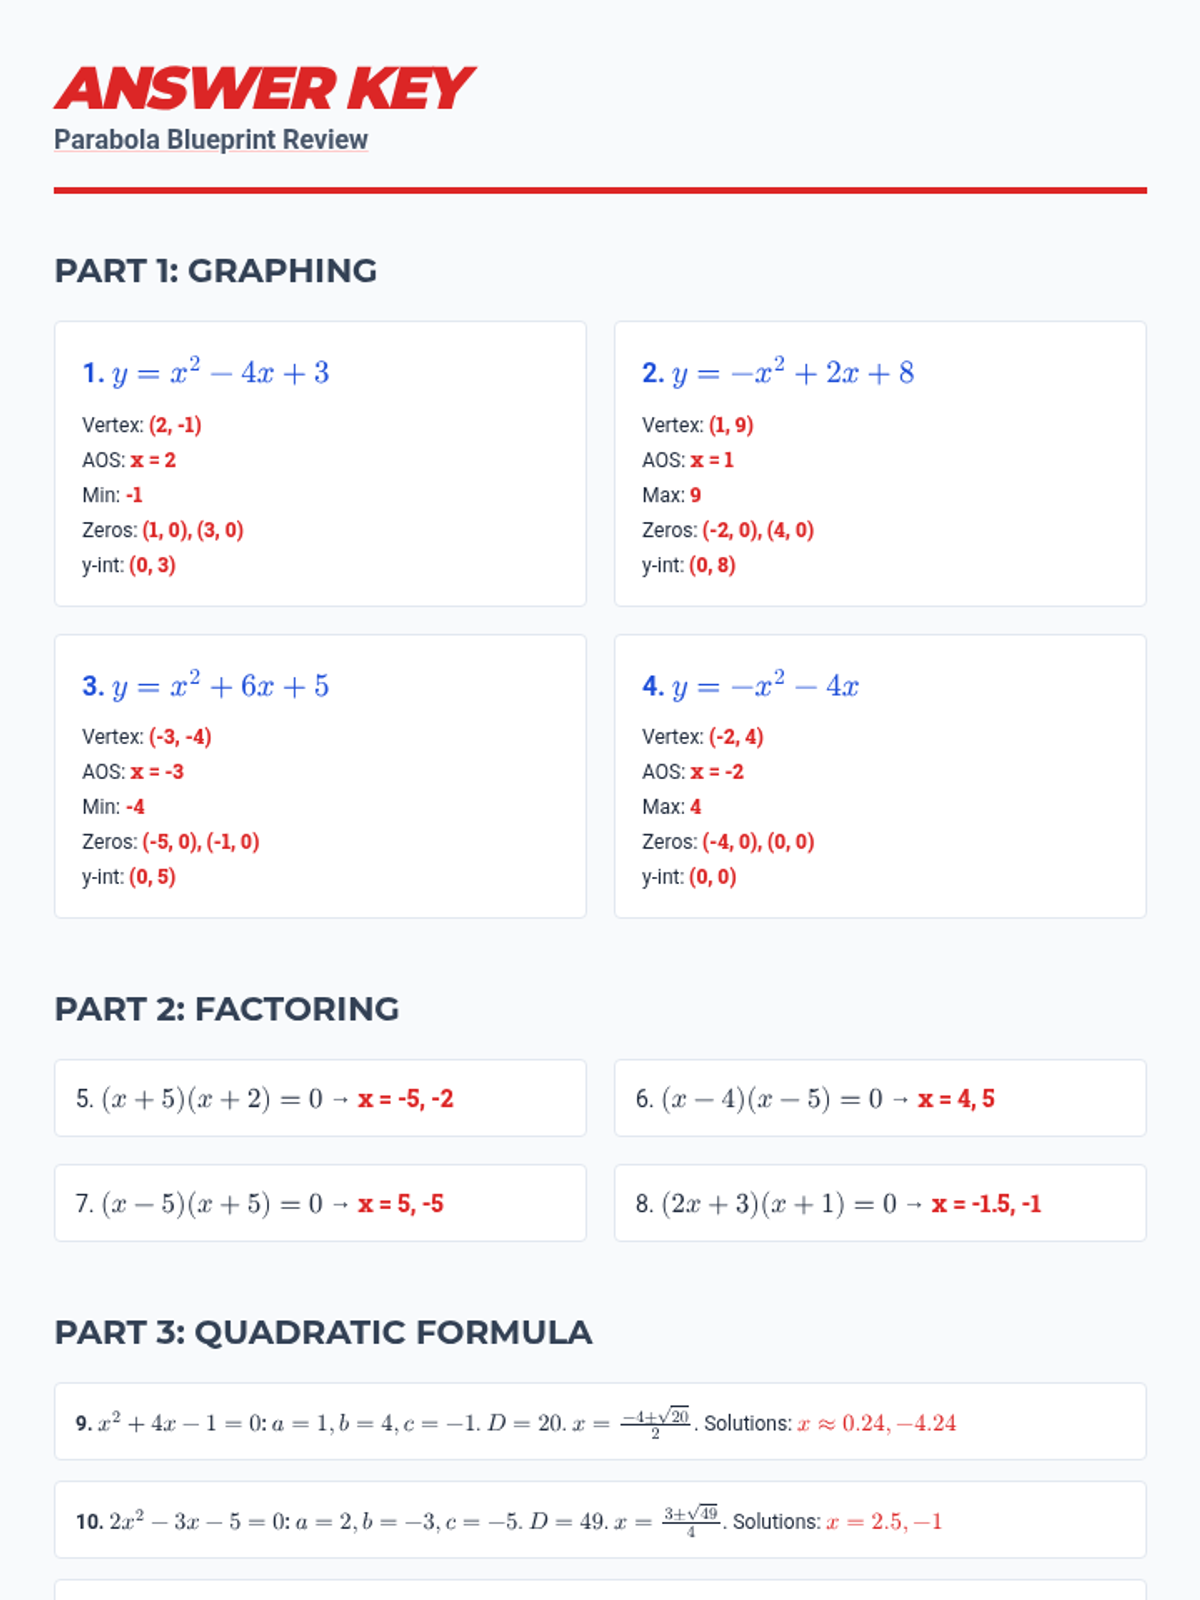
Teacher-facing answer key for the review worksheet. Updated to match the refined single-column parabola analysis items.
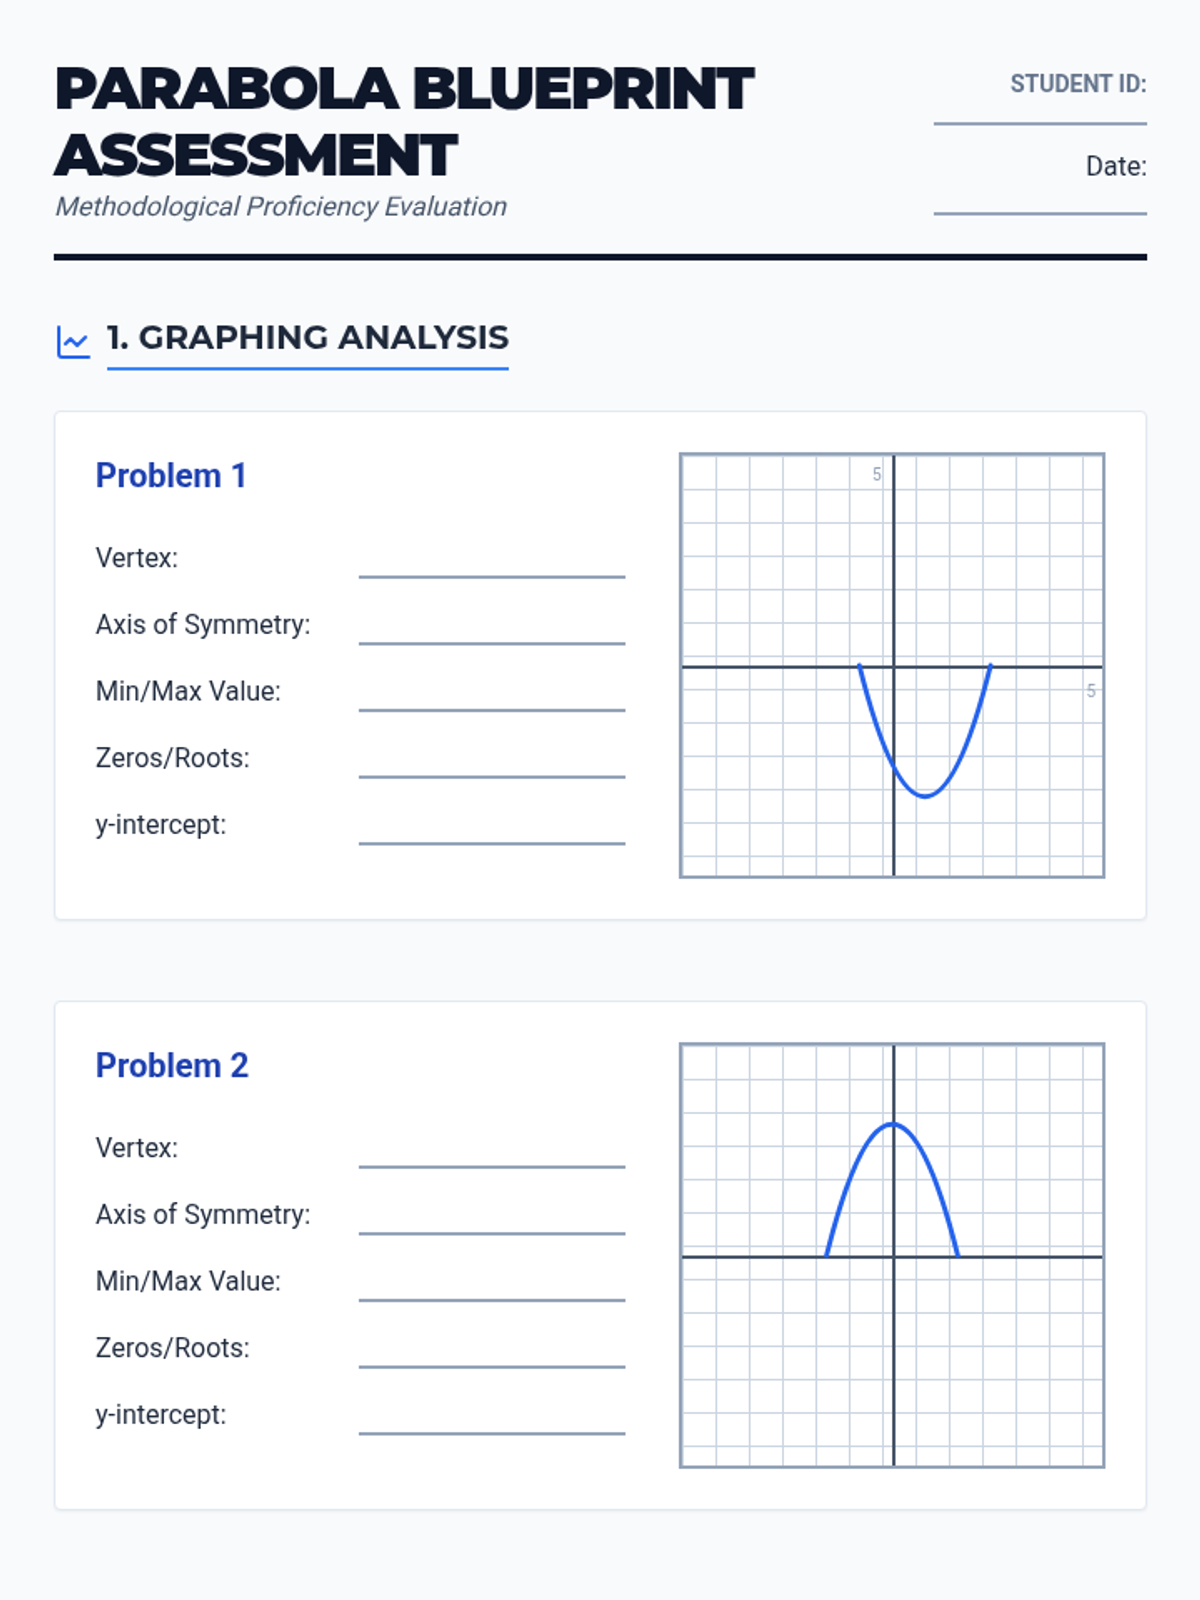
A formal summative assessment with 6 items, evaluating student proficiency in solving quadratic equations through graphing analysis, algebraic factoring, and guided quadratic formula steps. Graphing items feature single-column layouts and explicitly displayed equations. Fixes layout bugs in the formula section.
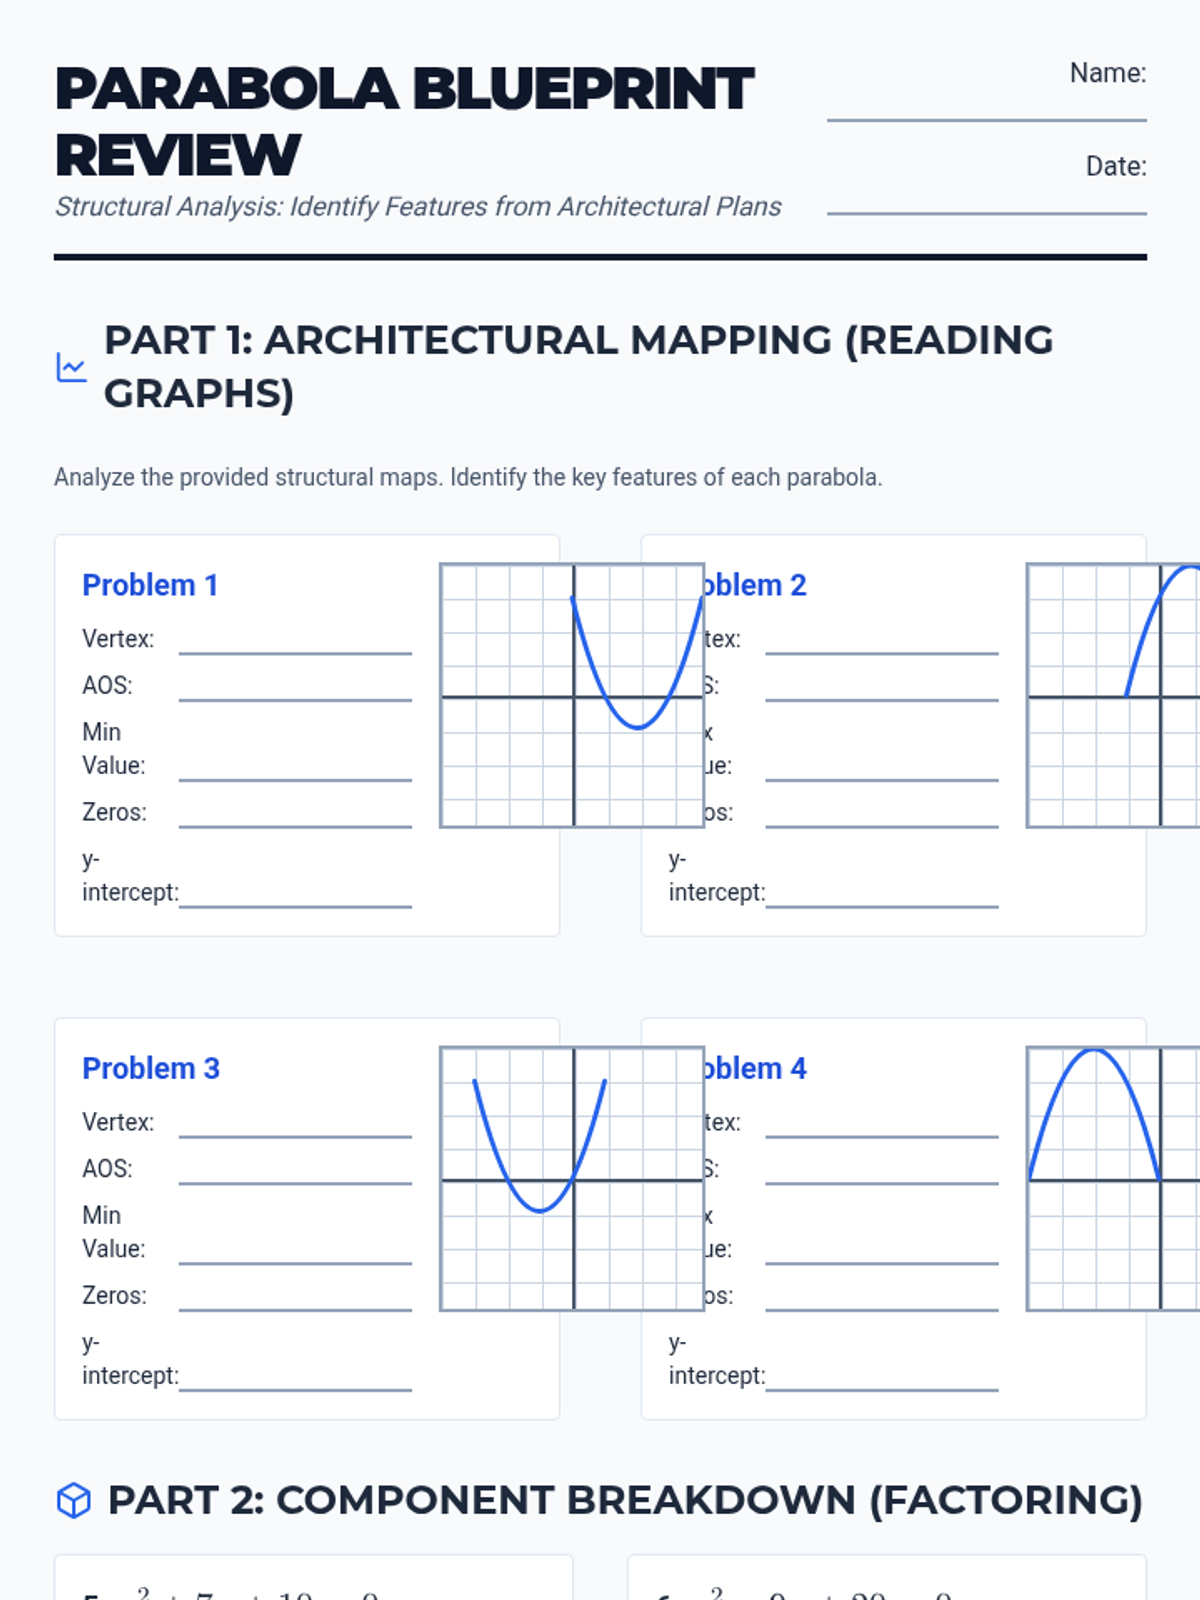
A 12-question comprehensive review worksheet covering quadratic equations via graphing, factoring, and the quadratic formula, styled with a professional 'blueprint' aesthetic. This version features single-column graph layouts, explicitly displayed equations, and refined formula templates.
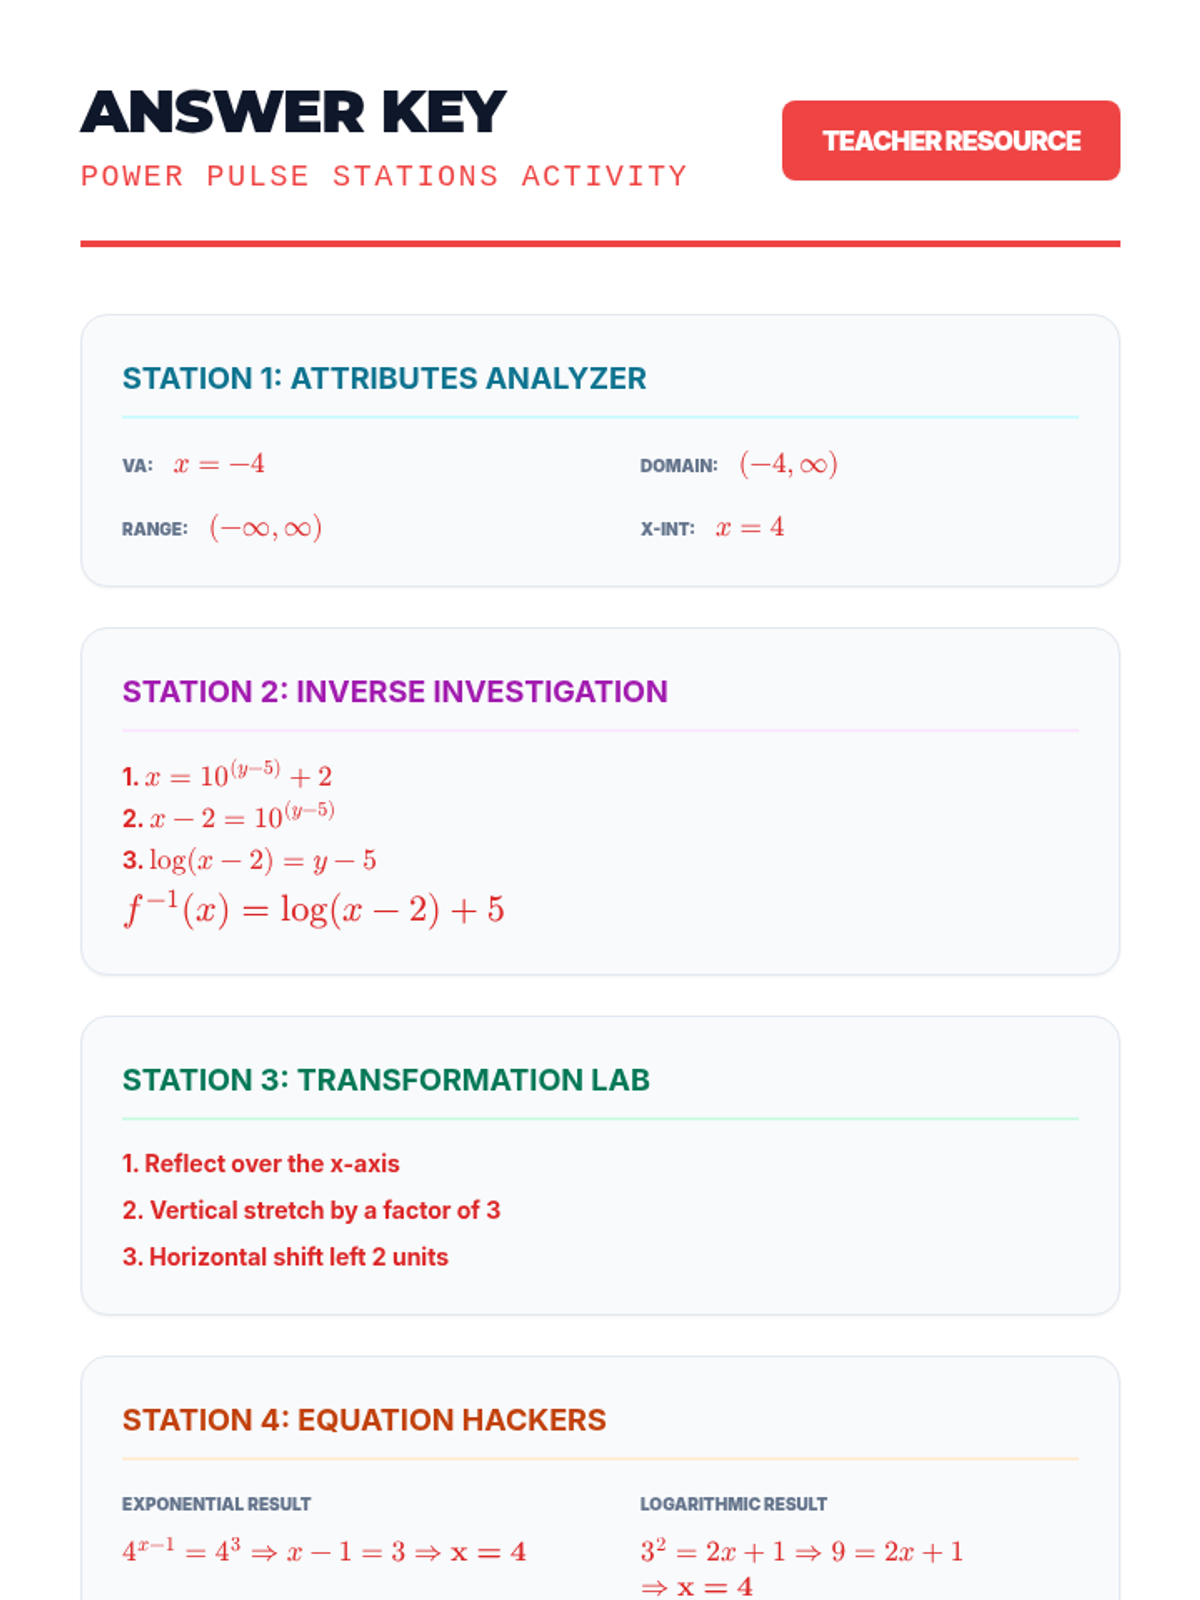
The answer key for the Power Pulse Stations Activity, providing step-by-step solutions and final answers for all five stations.
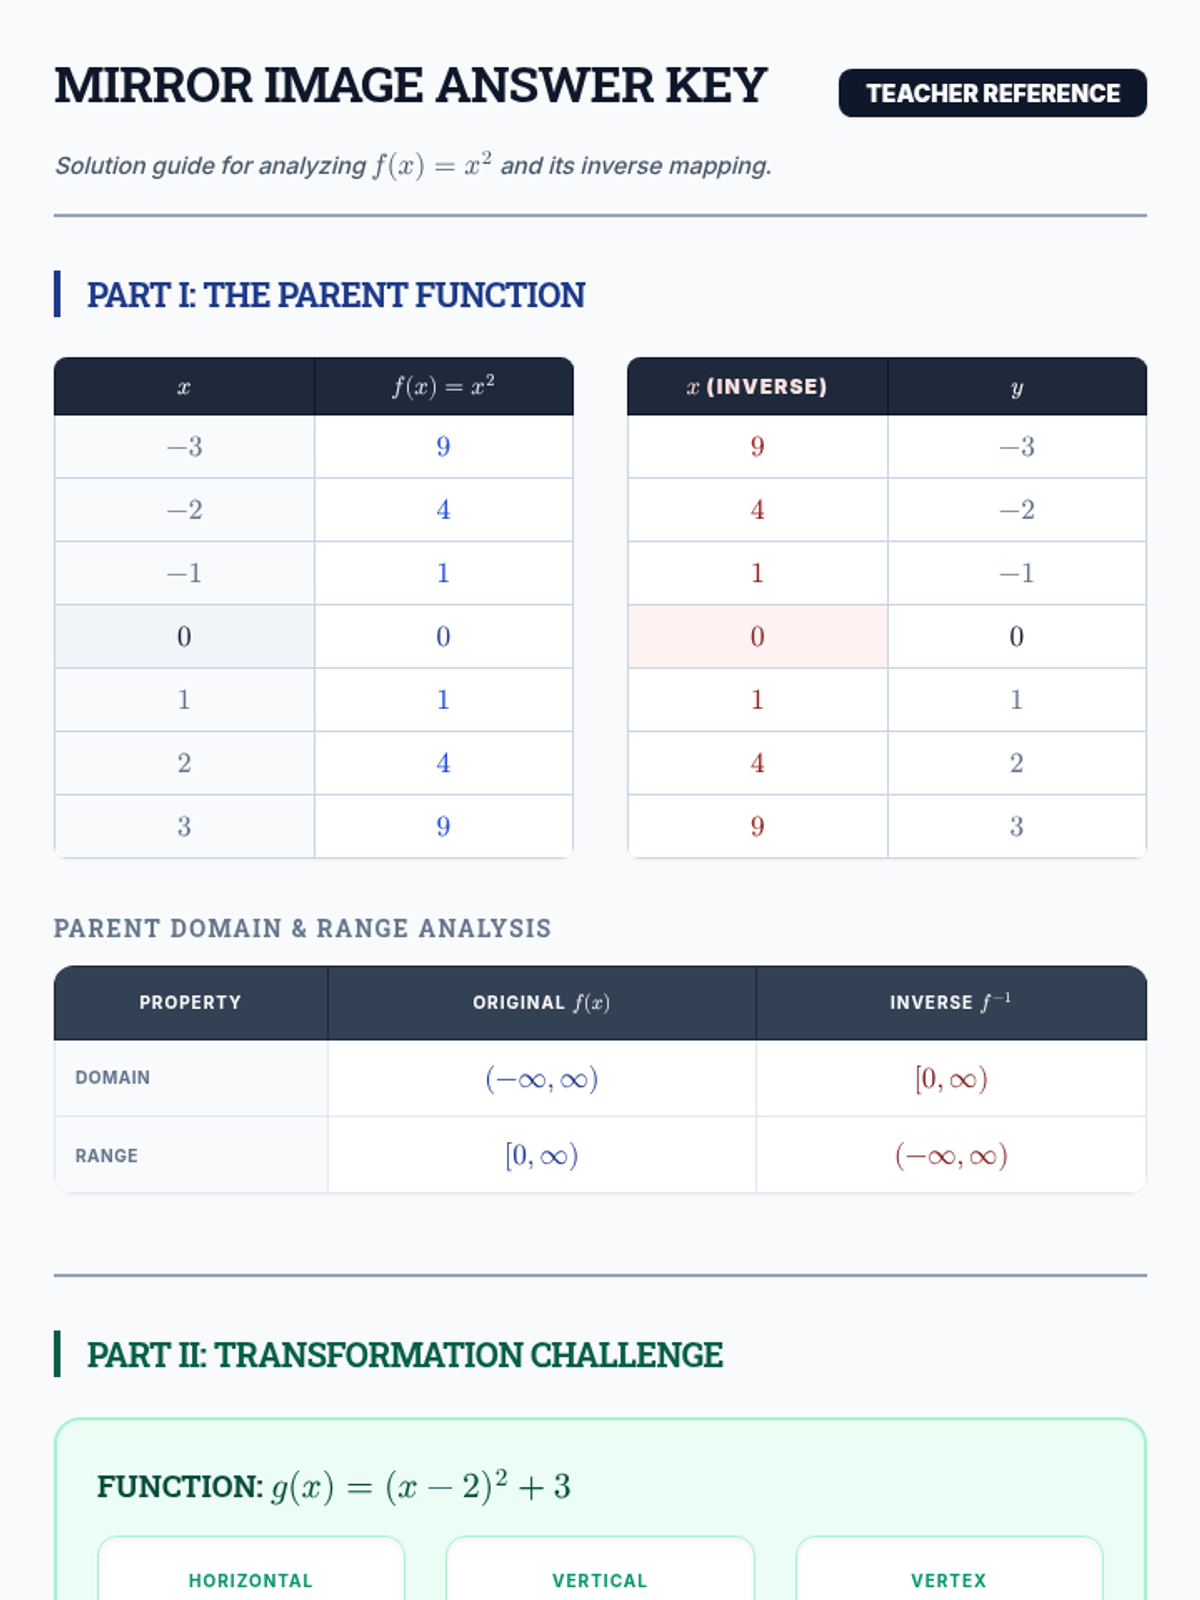
An answer key for the Mirror Image Worksheet, providing correct table values, domain and range comparisons, and the formal justification for why the inverse of a quadratic is a relation. Now includes solutions for the transformation page.
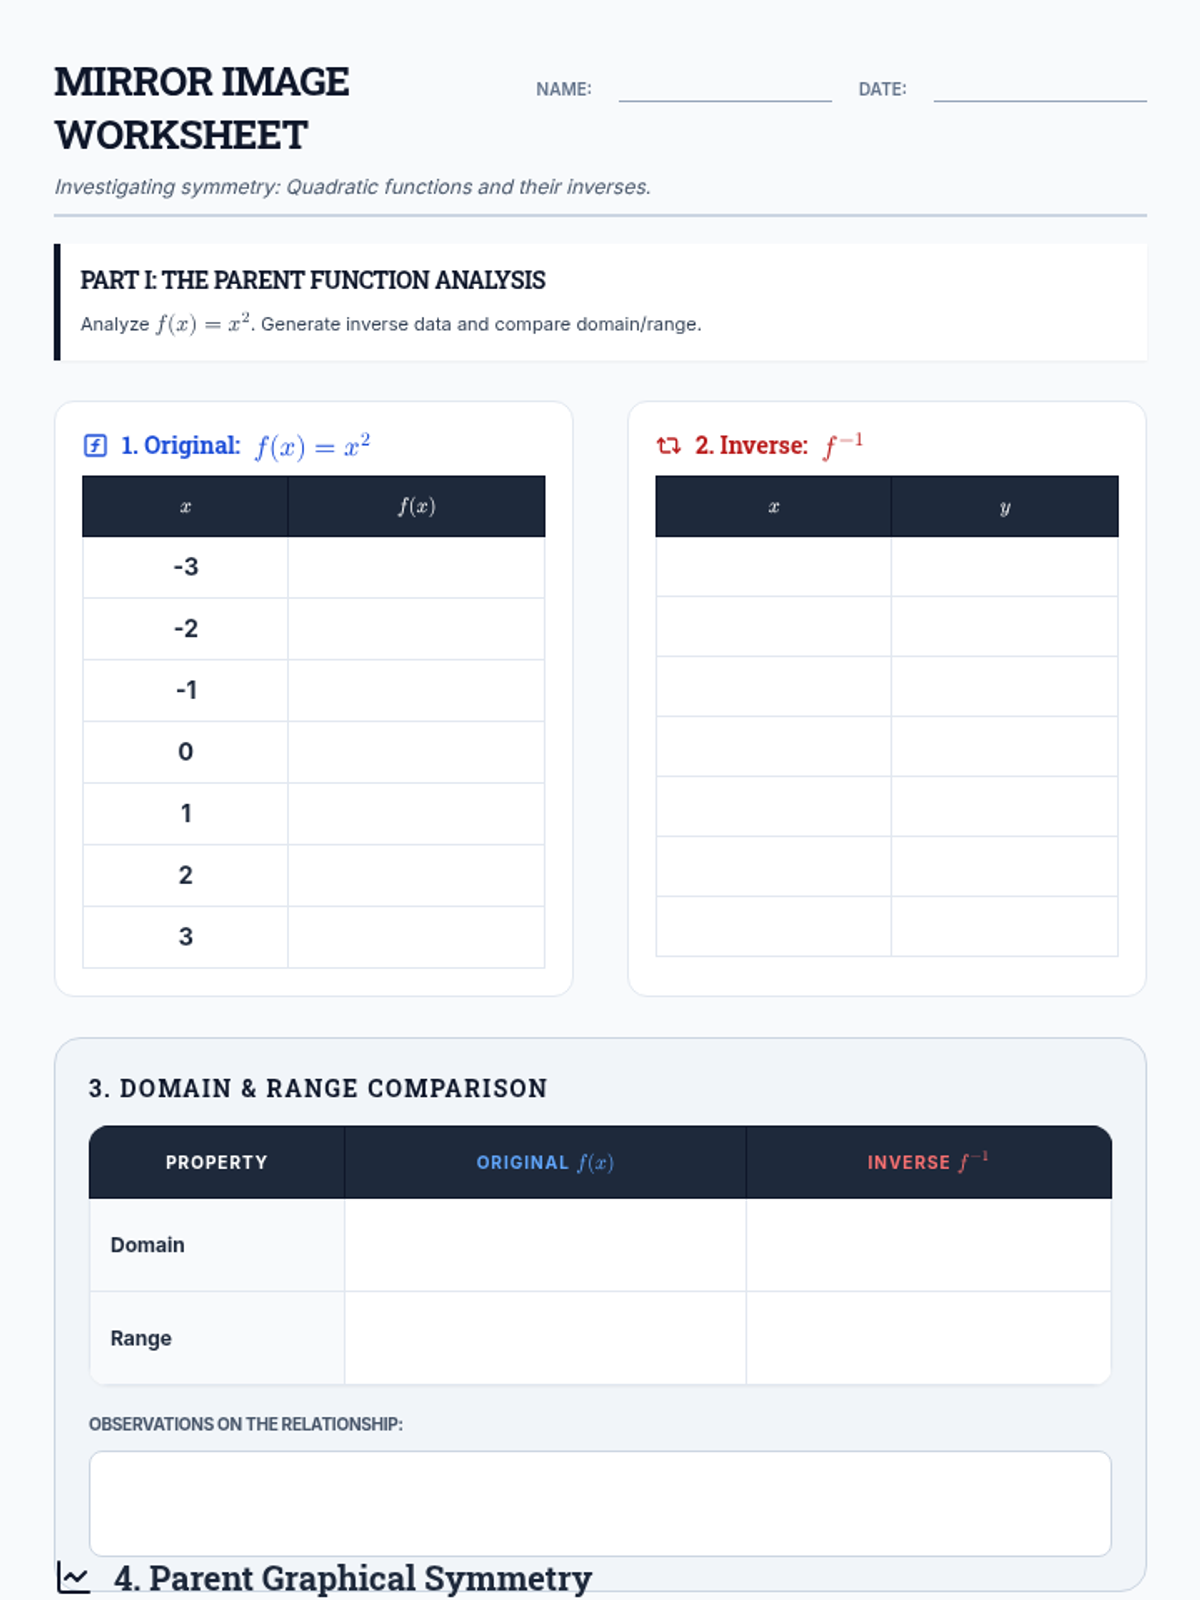
A worksheet for students to explore the relationship between a quadratic function and its inverse. Includes sections for data tables, graphing on a coordinate plane, comparing domain and range, and determining if the inverse is a function or a relation. Now includes a third page for transformations.
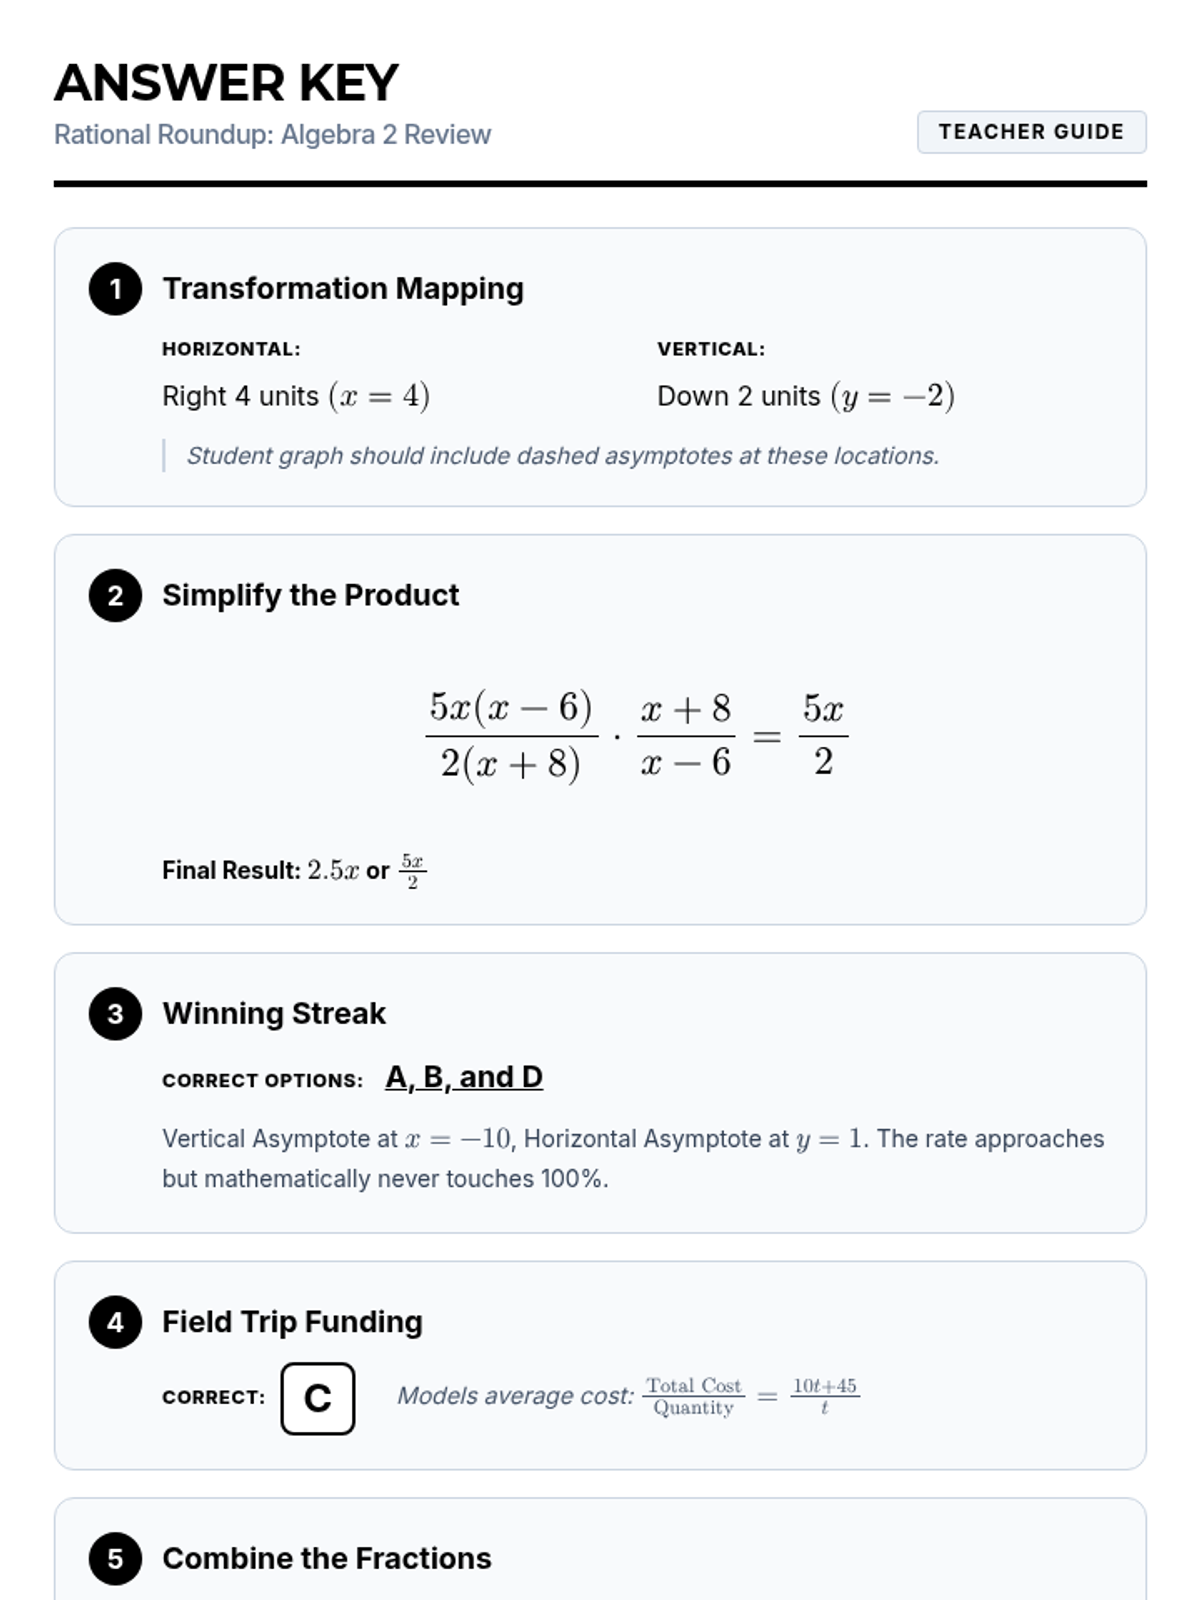
The original 1-page teacher answer key for the 3-page Rational Roundup worksheet. It now includes expanded, step-by-step explanations for both Question 5 (Adding Rational Expressions) and Question 10 (Asymptote Detective). All colors have been removed for high-contrast, black-and-white printing.
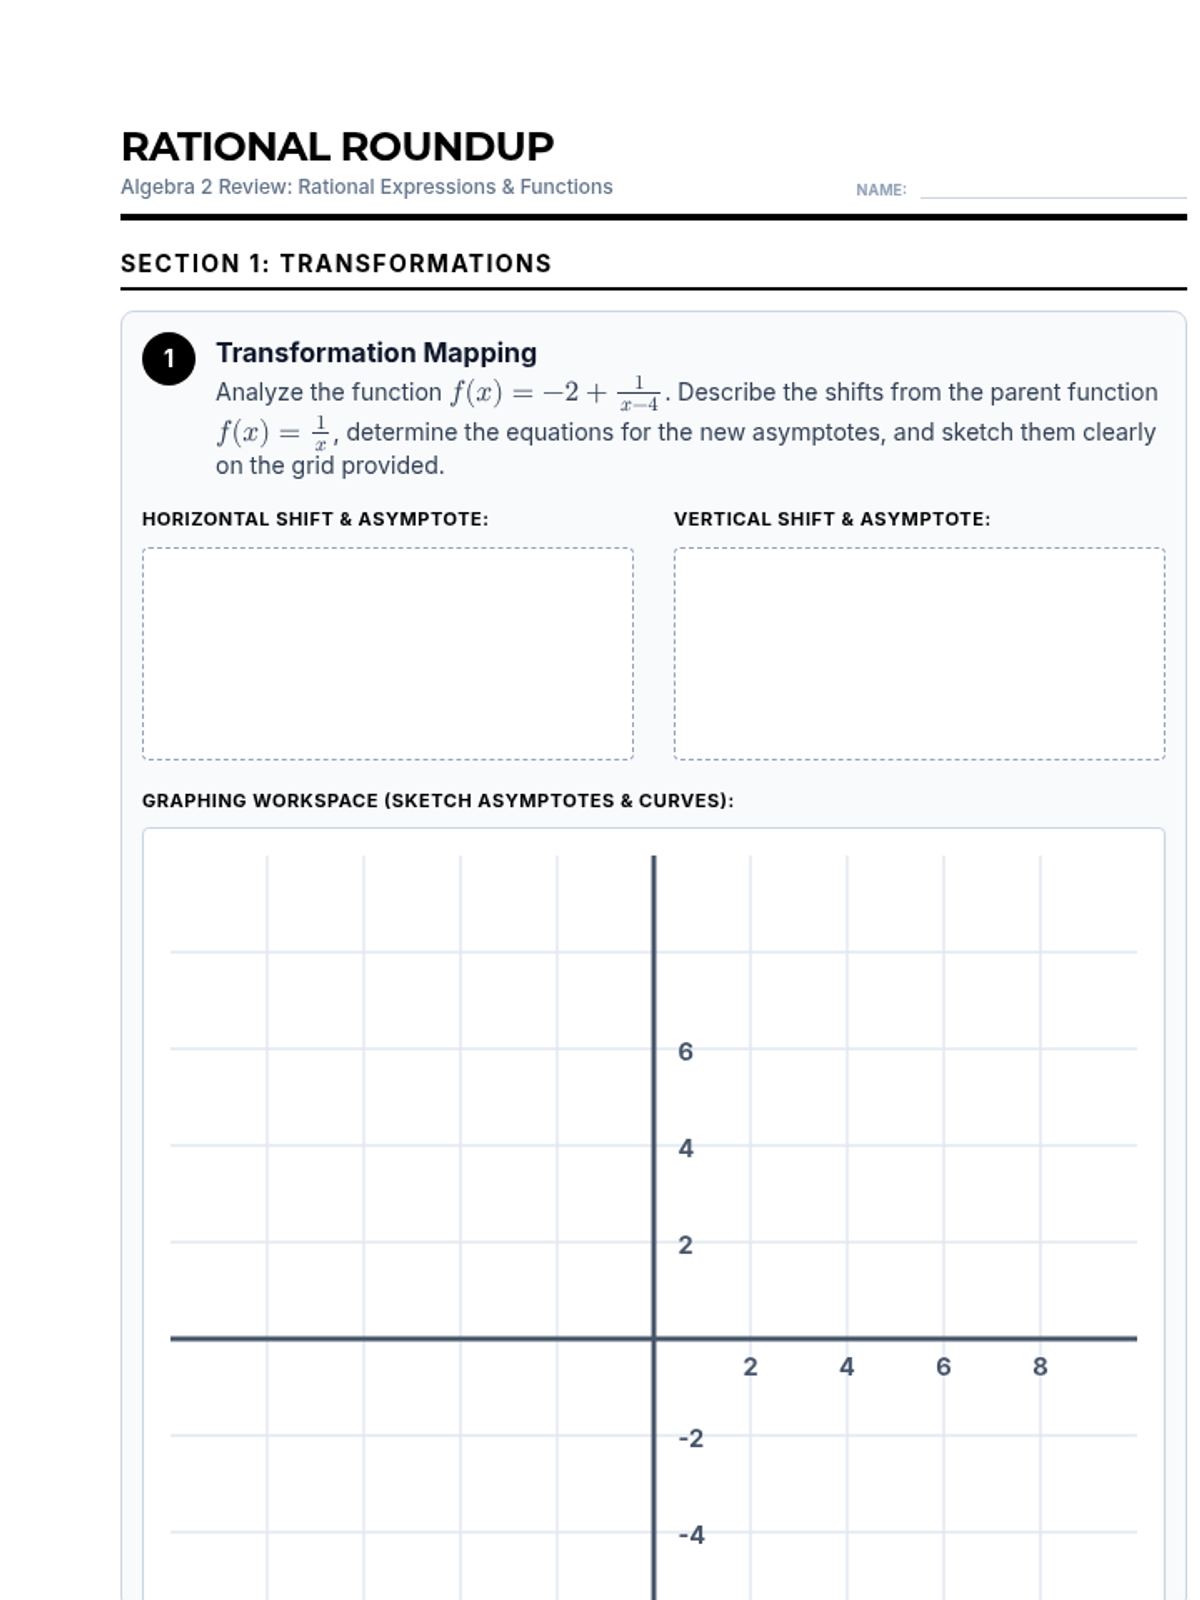
An expanded 4-page black-and-white version of the Algebra 2 review worksheet. Optimized for print-friendliness, it removes all color accents while maintaining high contrast and ample student work space. Question 1 occupies the first page with a large coordinate grid, and all other questions follow district standards numbering.
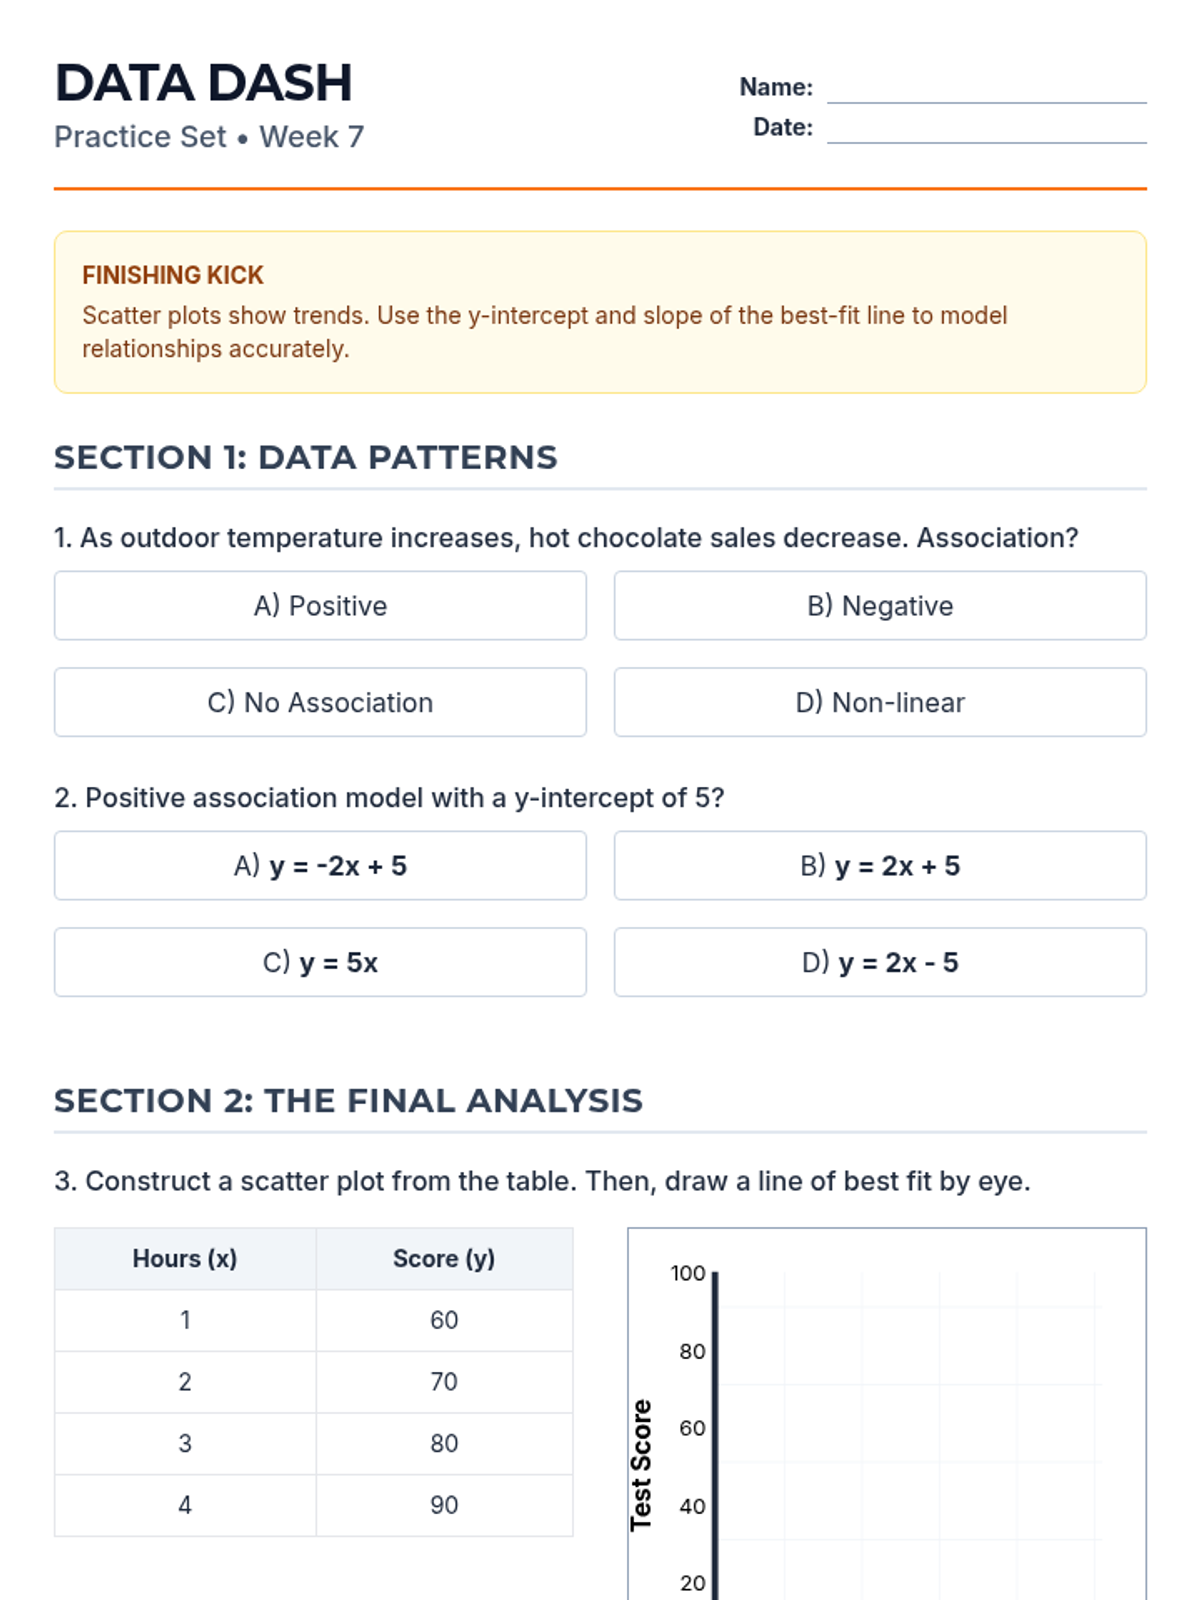
Revised 2-page practice set for Week 7. Fixed scatter plot grid Y-axis labels and tick alignment. Darkened handwriting guides and corrected table variable text for better PDF rendering.
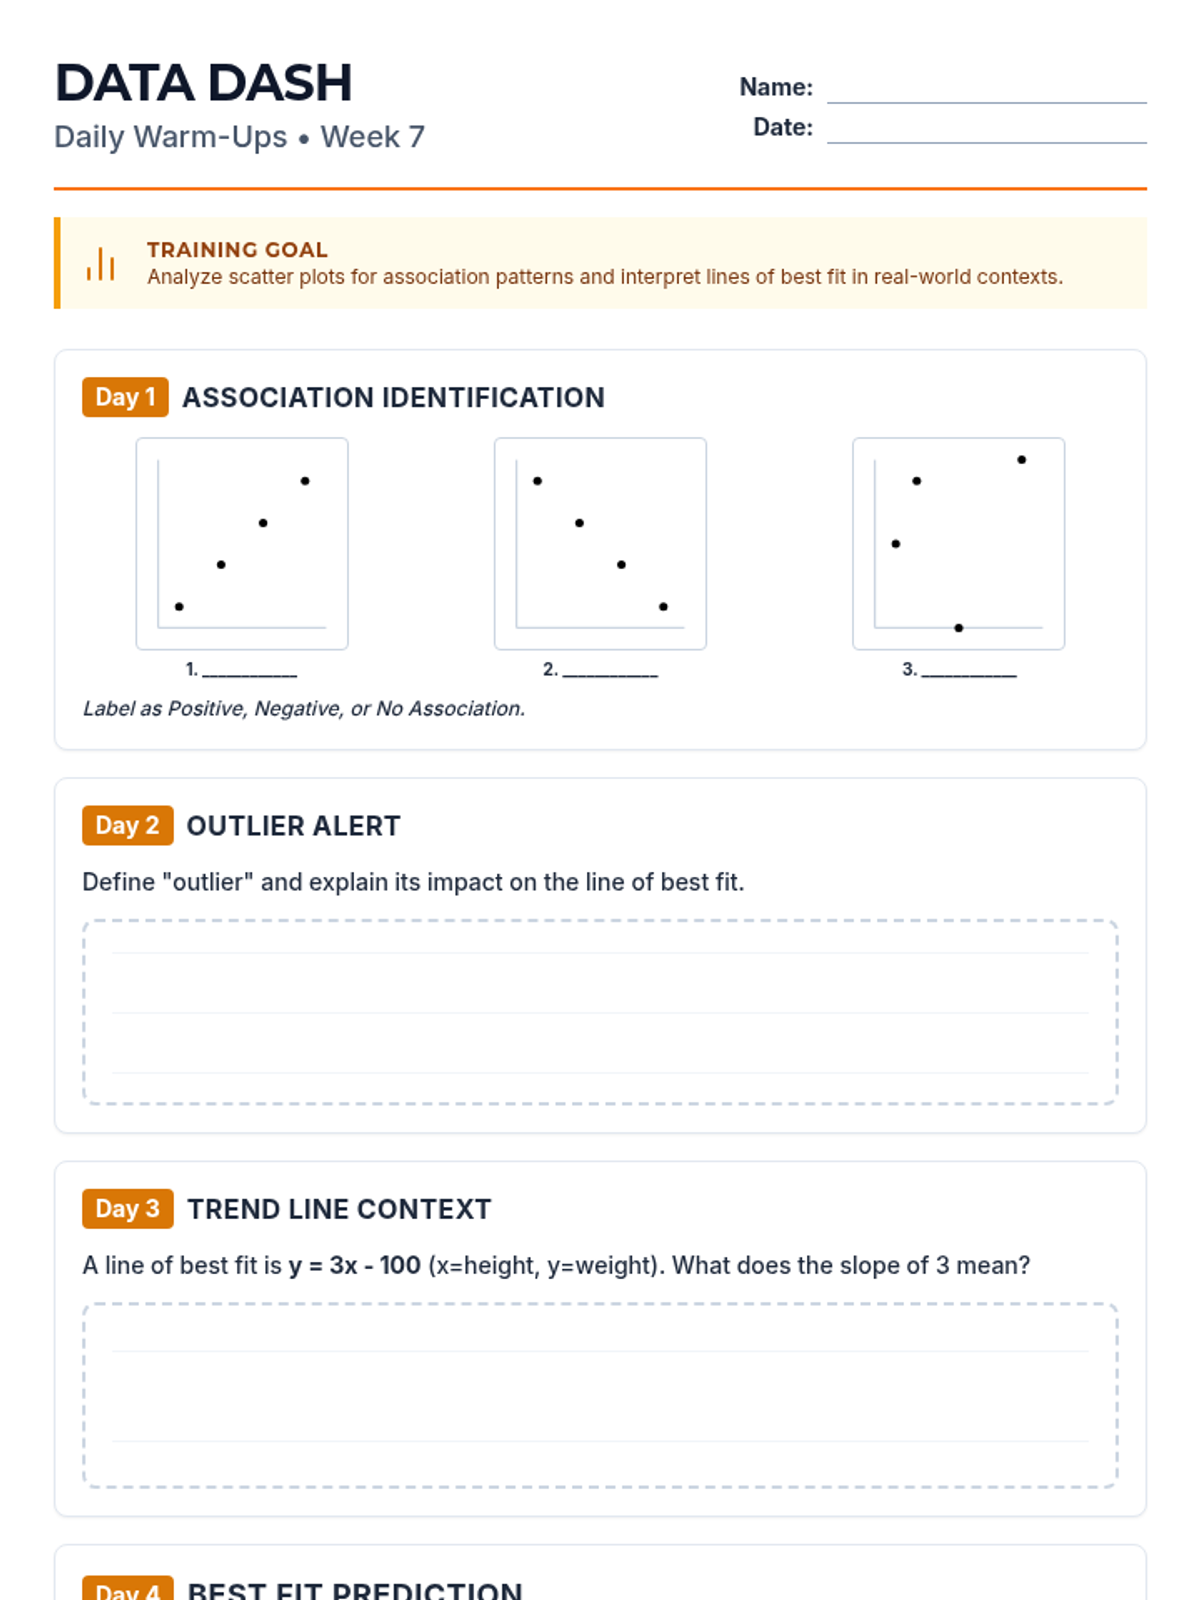
Polished 2-page Warm-Up for Week 7. Replaced MathJax in body text with standard bold for better PDF compatibility, consolidated layout to fit on two pages, and added guided handwriting lines.
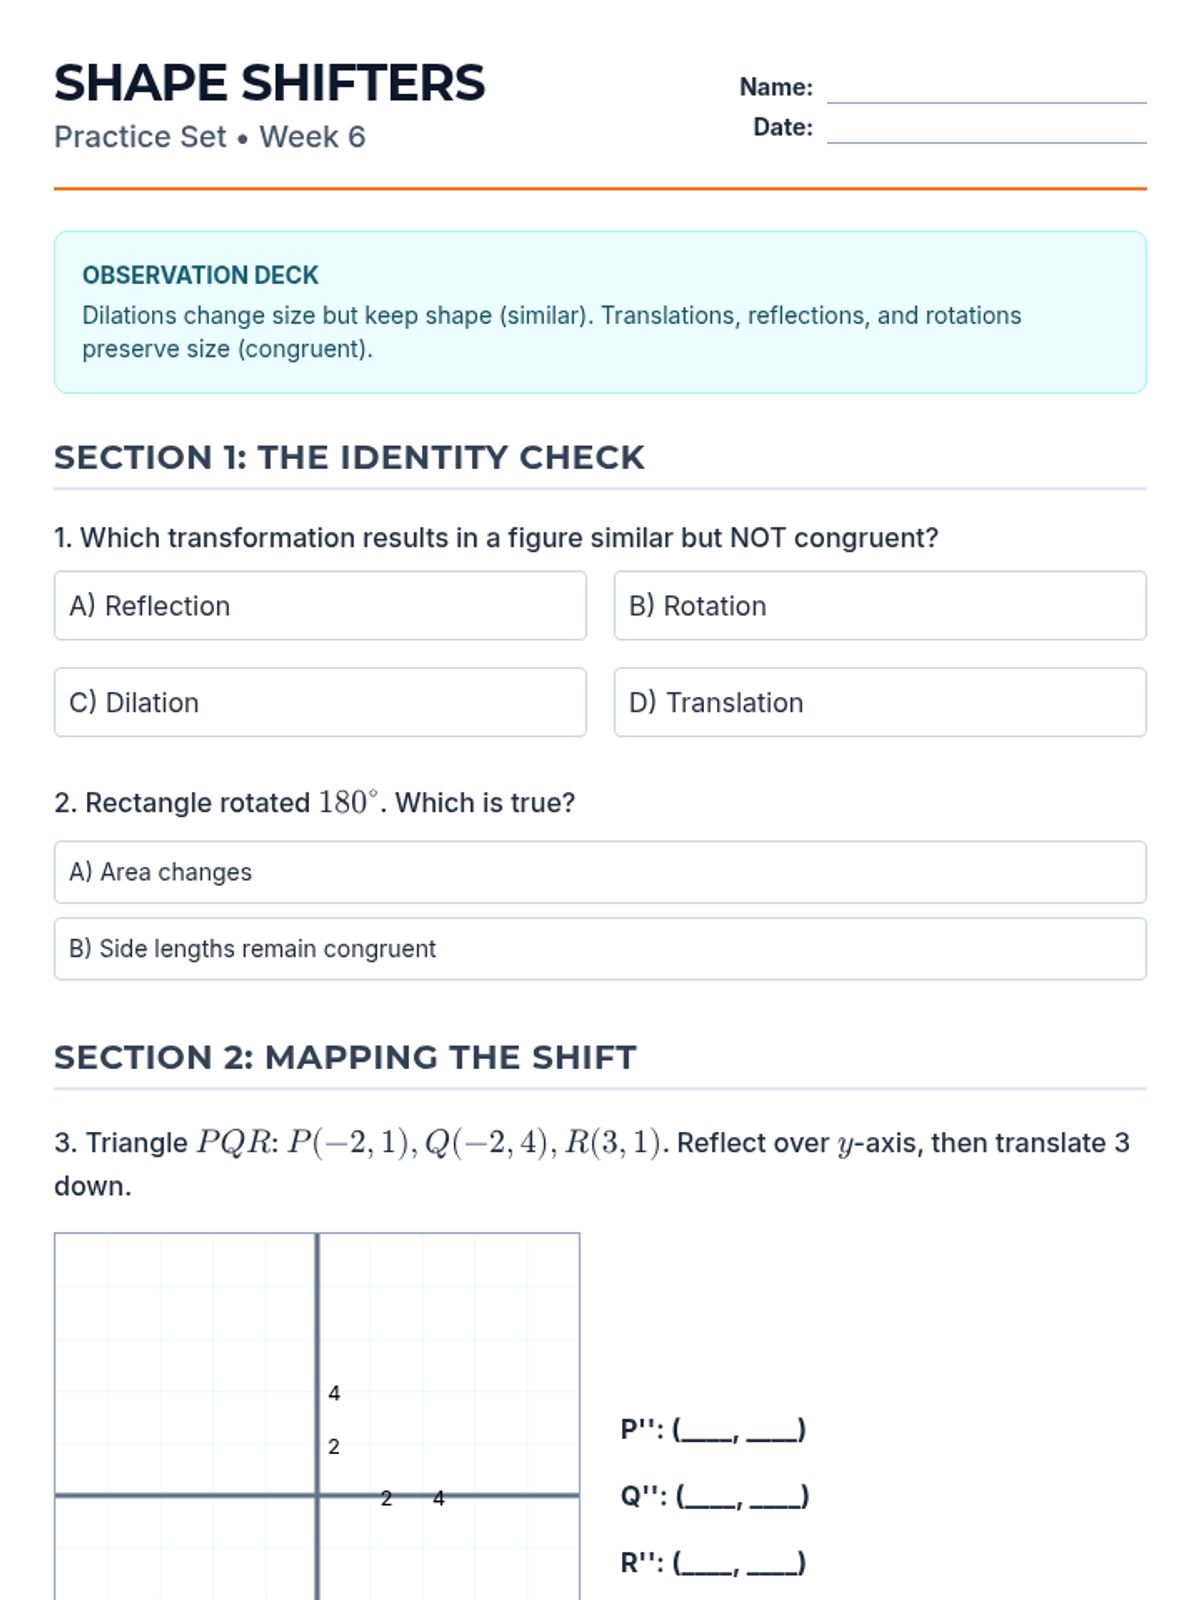
Revised 2-page practice set for Week 6. Added grid and numerical labels to coordinate planes, consolidated layout to avoid orphaned headers, and improved shape comparison workspace.
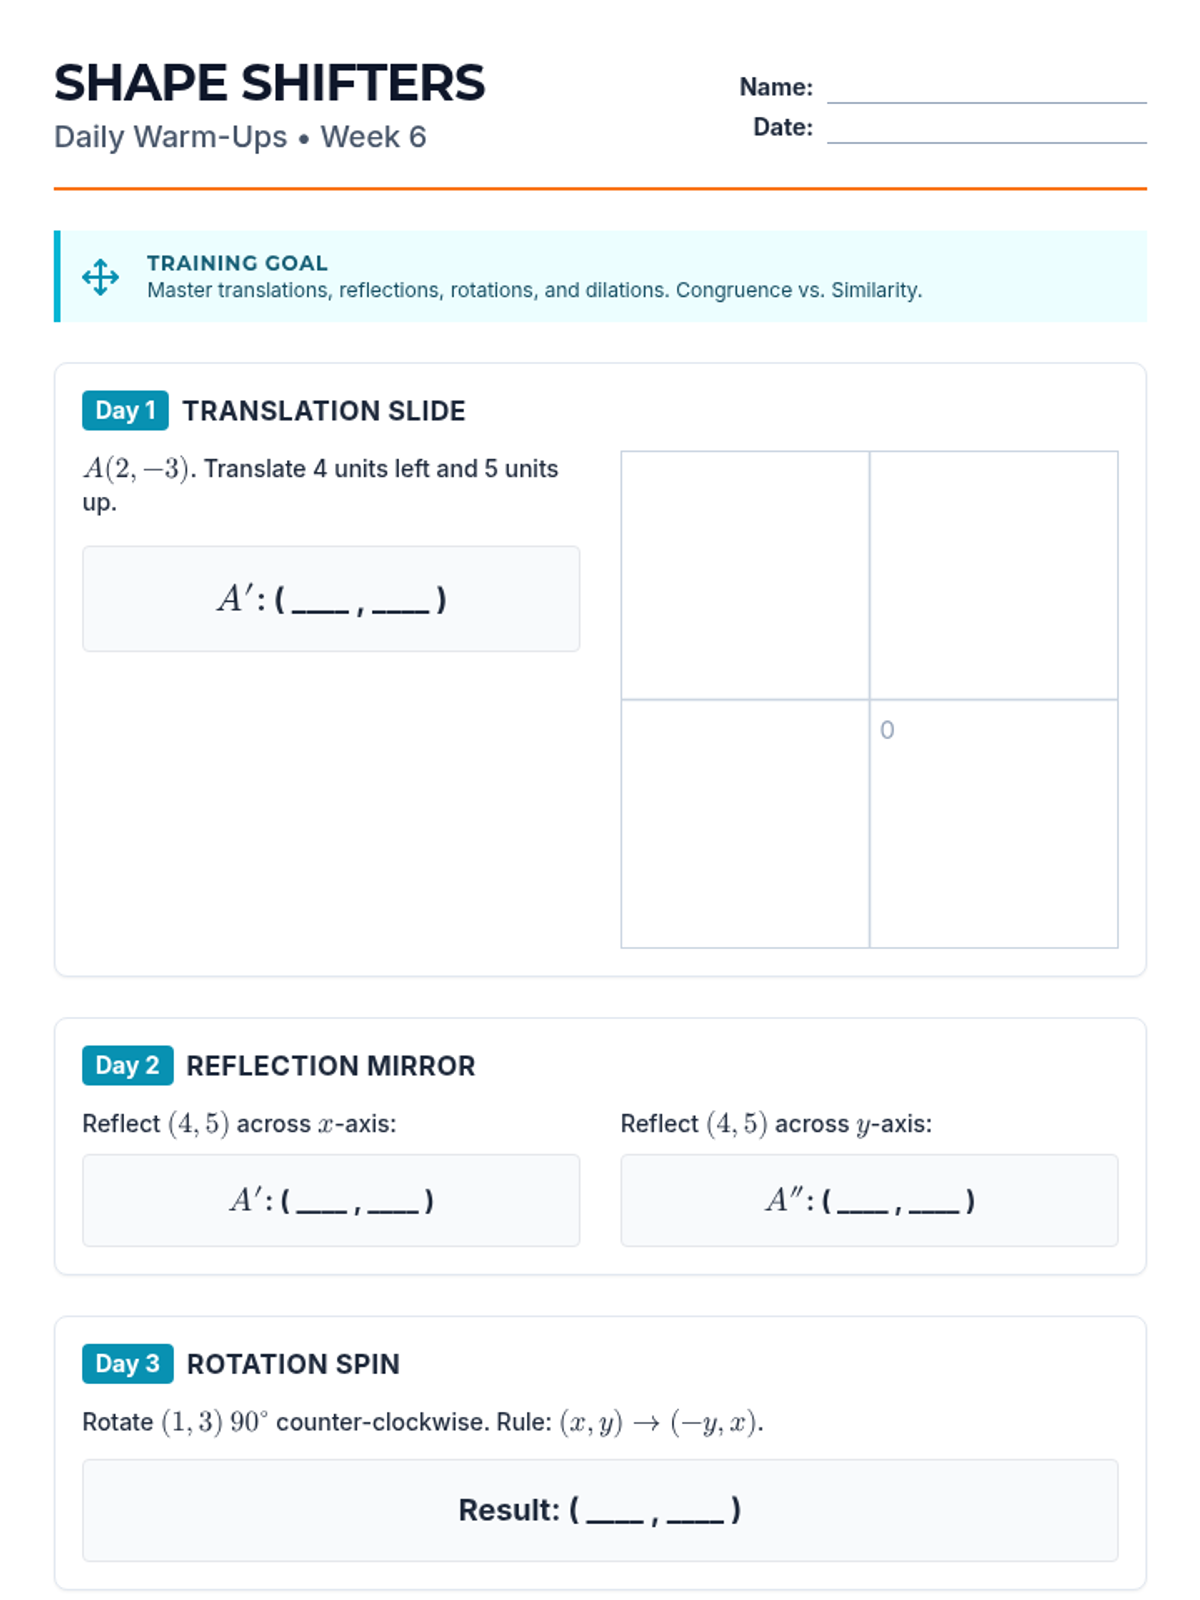
Revised 2-page Warm-Up for Week 6. Fixed overlapping coordinate plane, removed raw markdown asterisks, and consolidated all 5 days onto two pages.
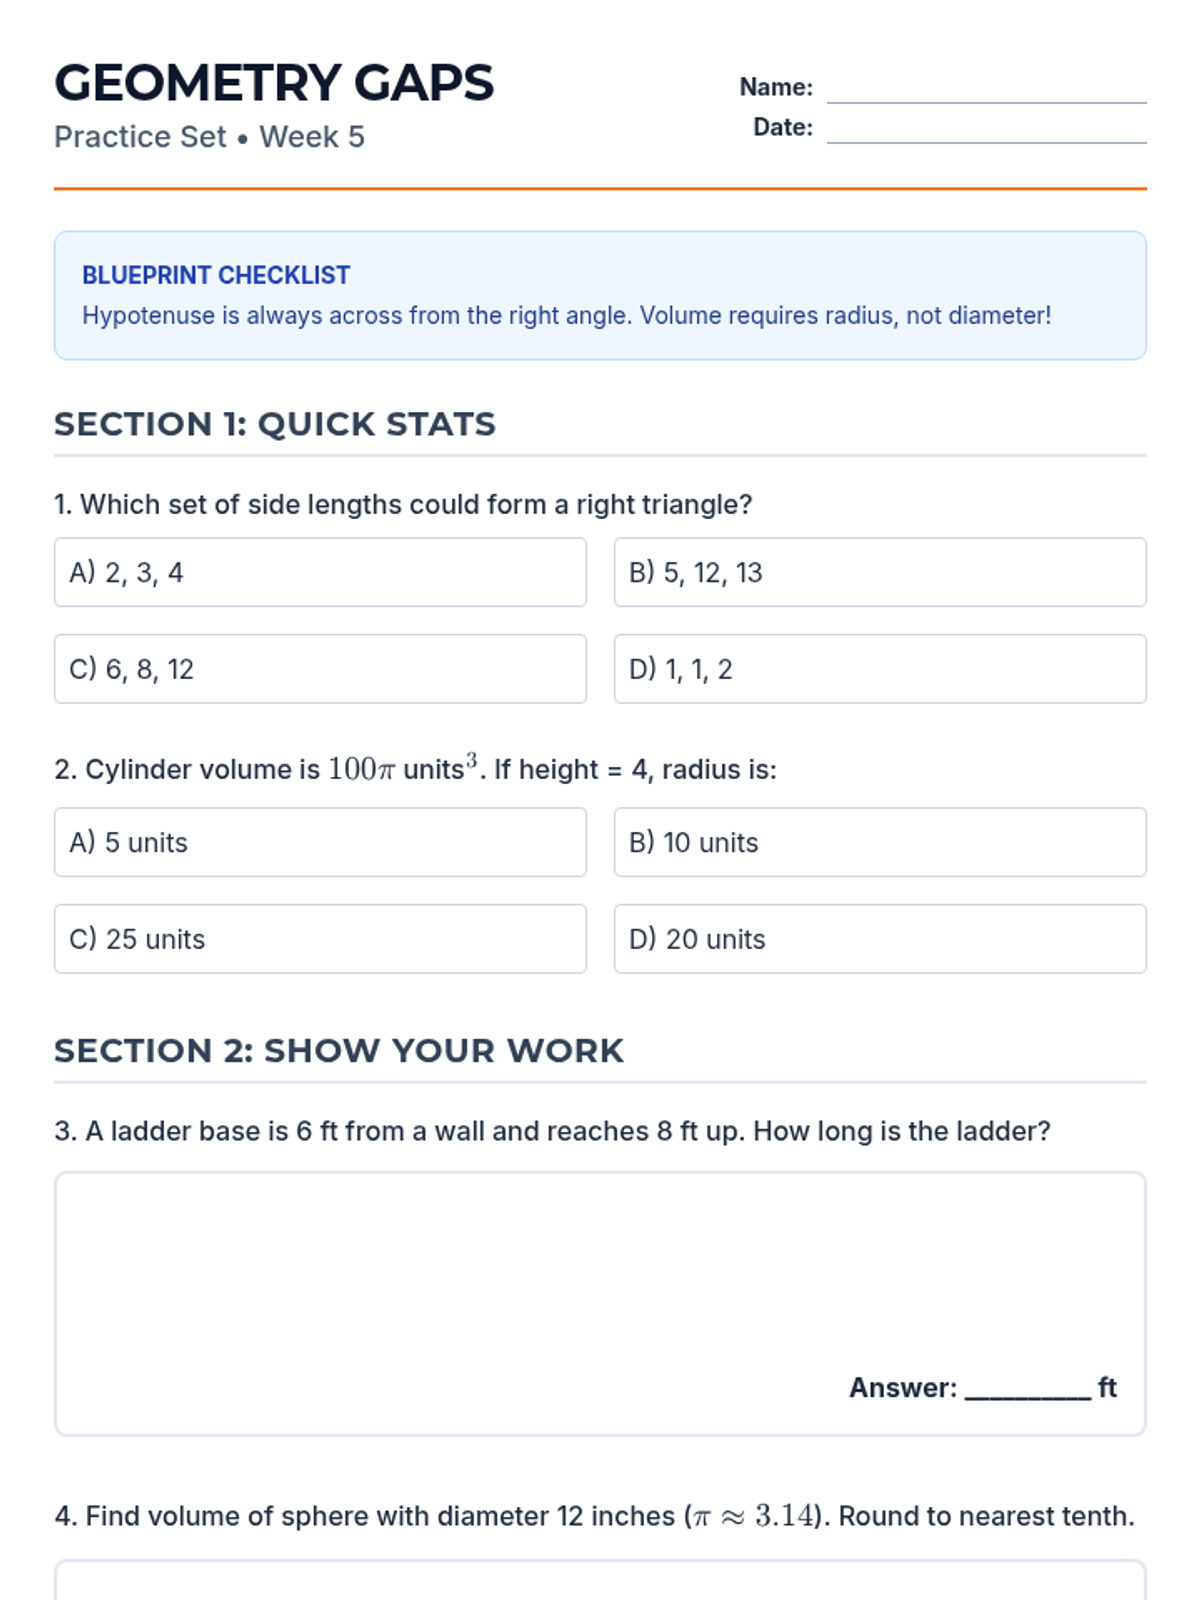
Revised 2-page practice set for Week 5. Corrected LaTeX rendering for exponents, improved shape comparison workspace, and consolidated Section 2 layout.
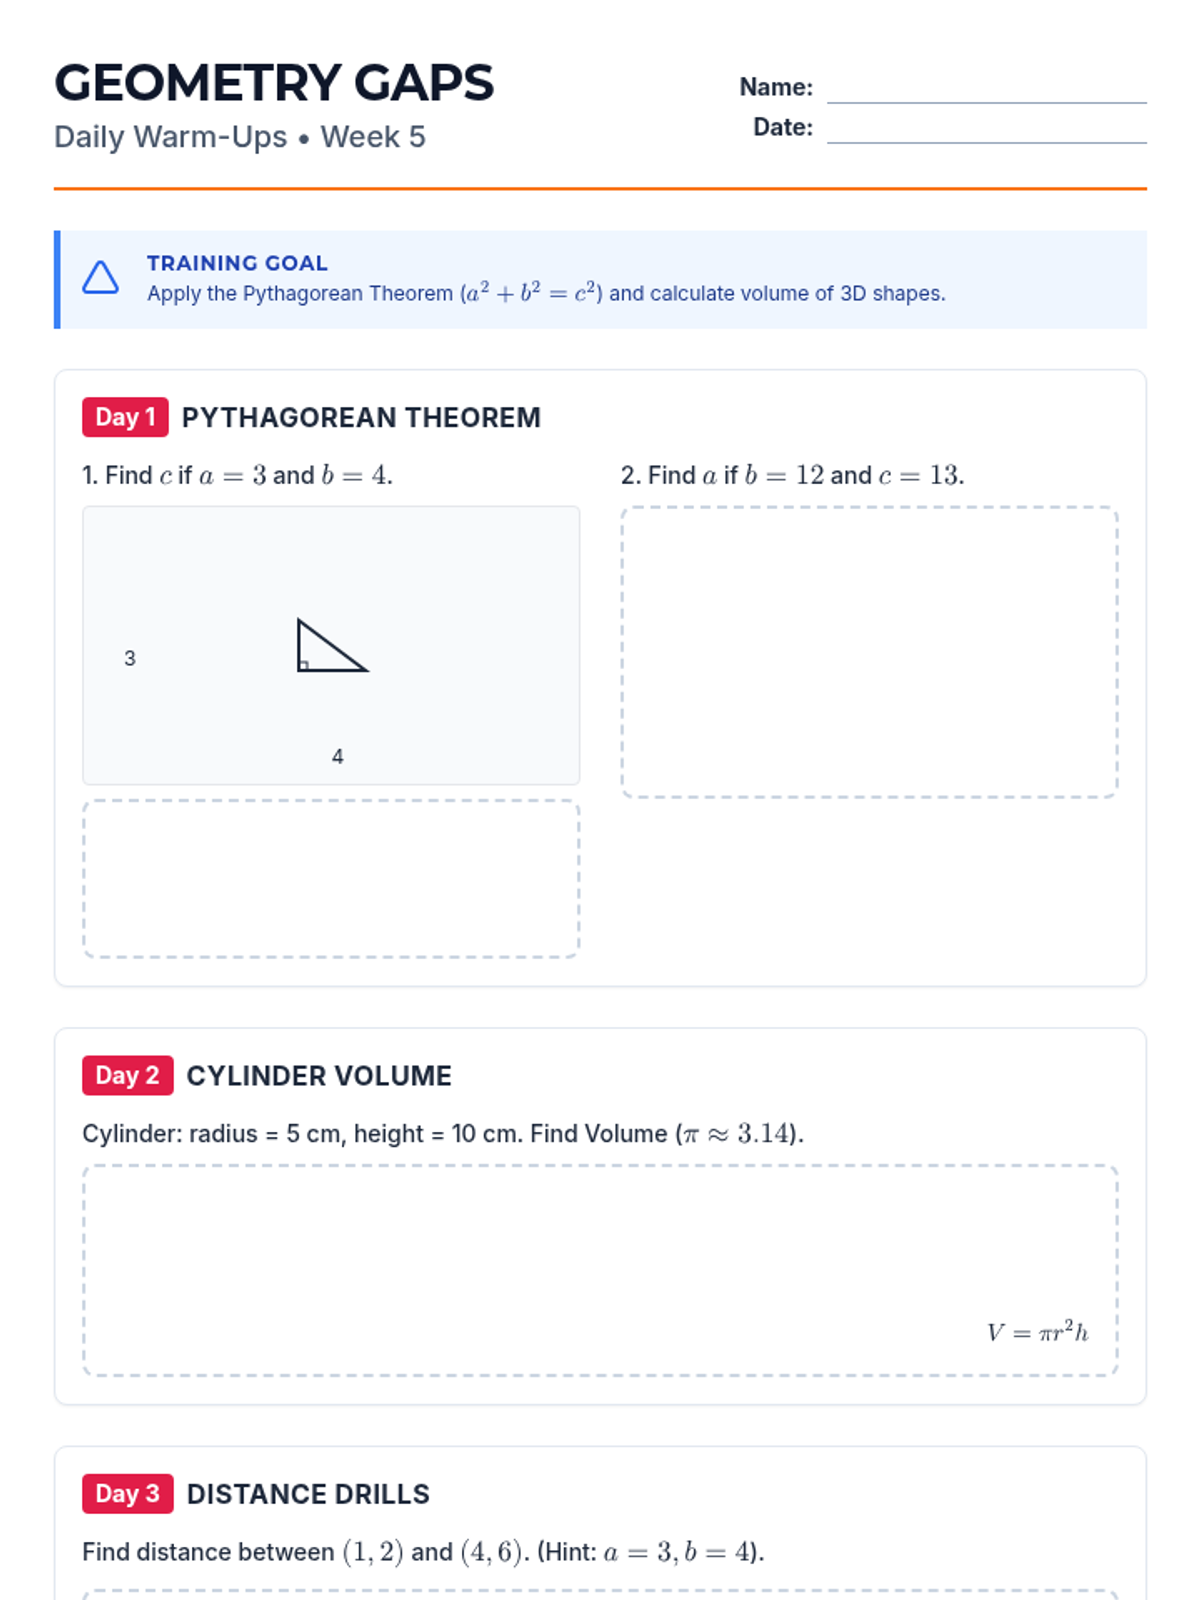
Revised 2-page Warm-Up for Week 5. Fixed LaTeX rendering issues, consolidated layout to fit all days efficiently, and standardized work area heights.
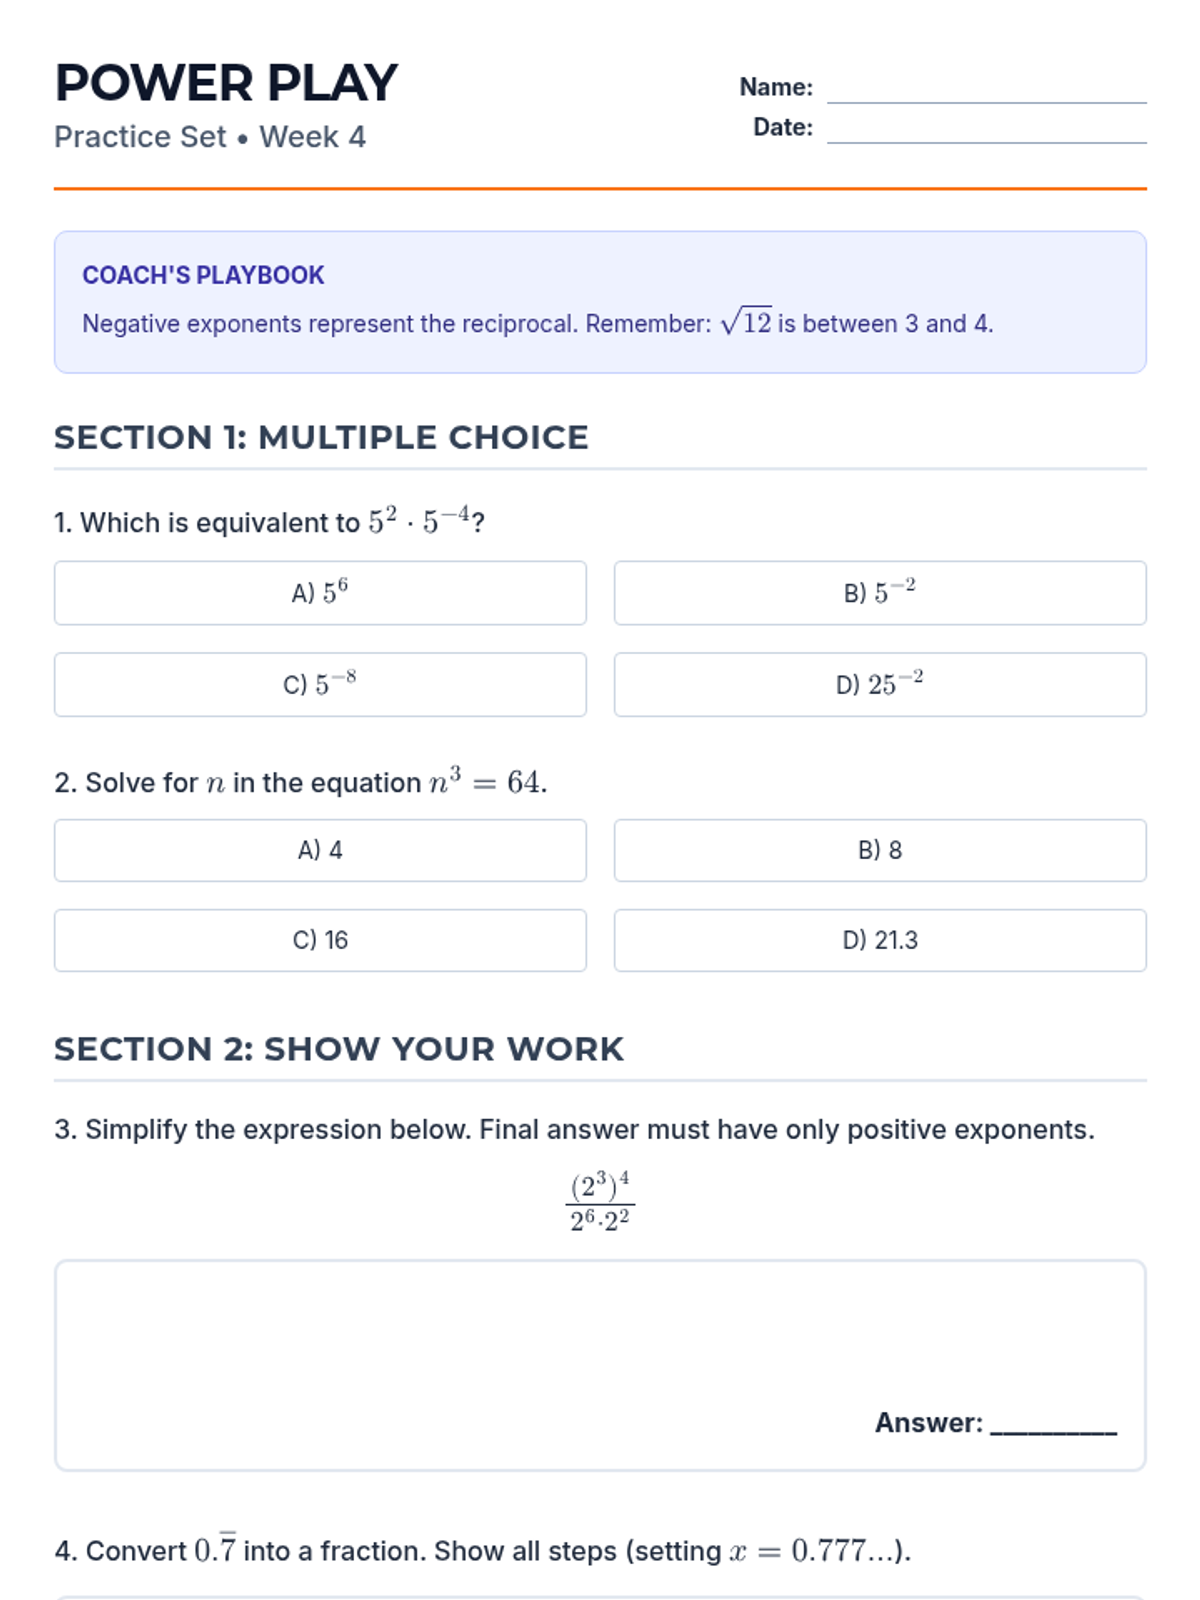
Optimized 2-page practice set for Week 4. Standardized work area heights to fit all content on two pages and improved SVG number line scale and labels.
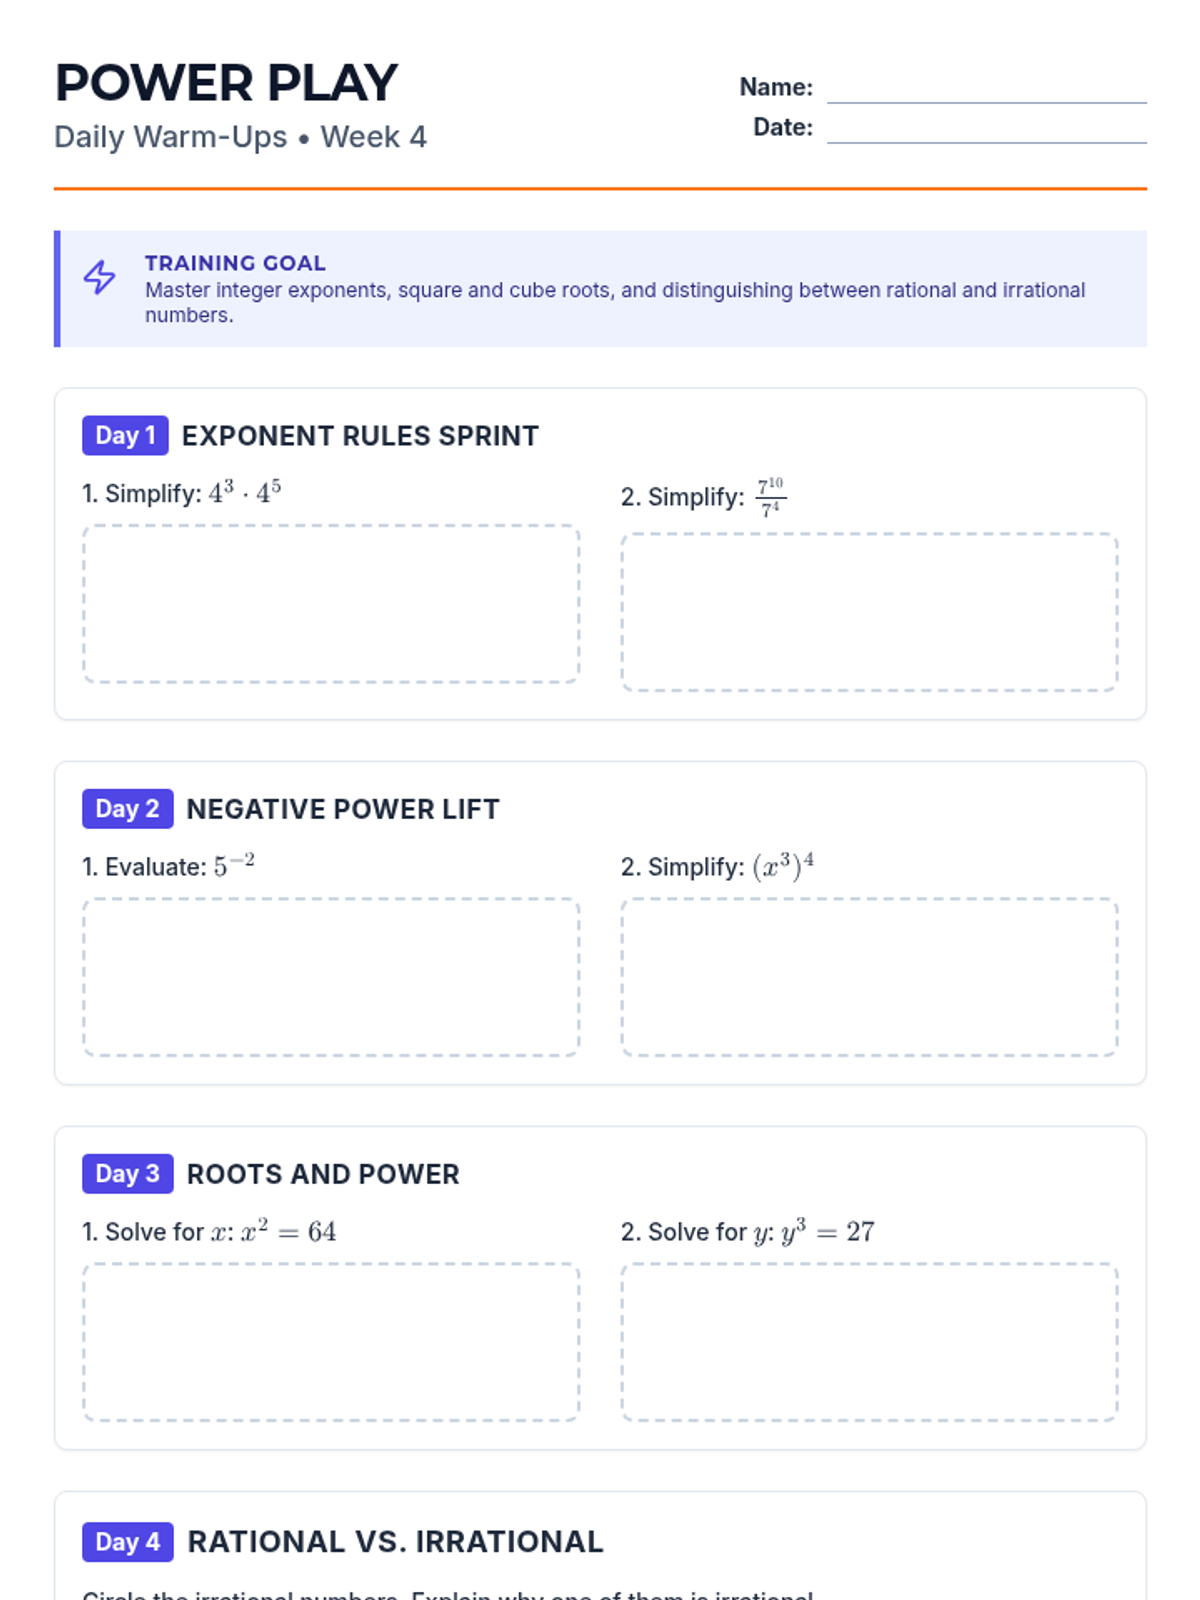
Revised 2-page Warm-Up for Week 4. Replaced scientific notation with square/cube roots and repeating decimal conversions. Improved pagination and font consistency.
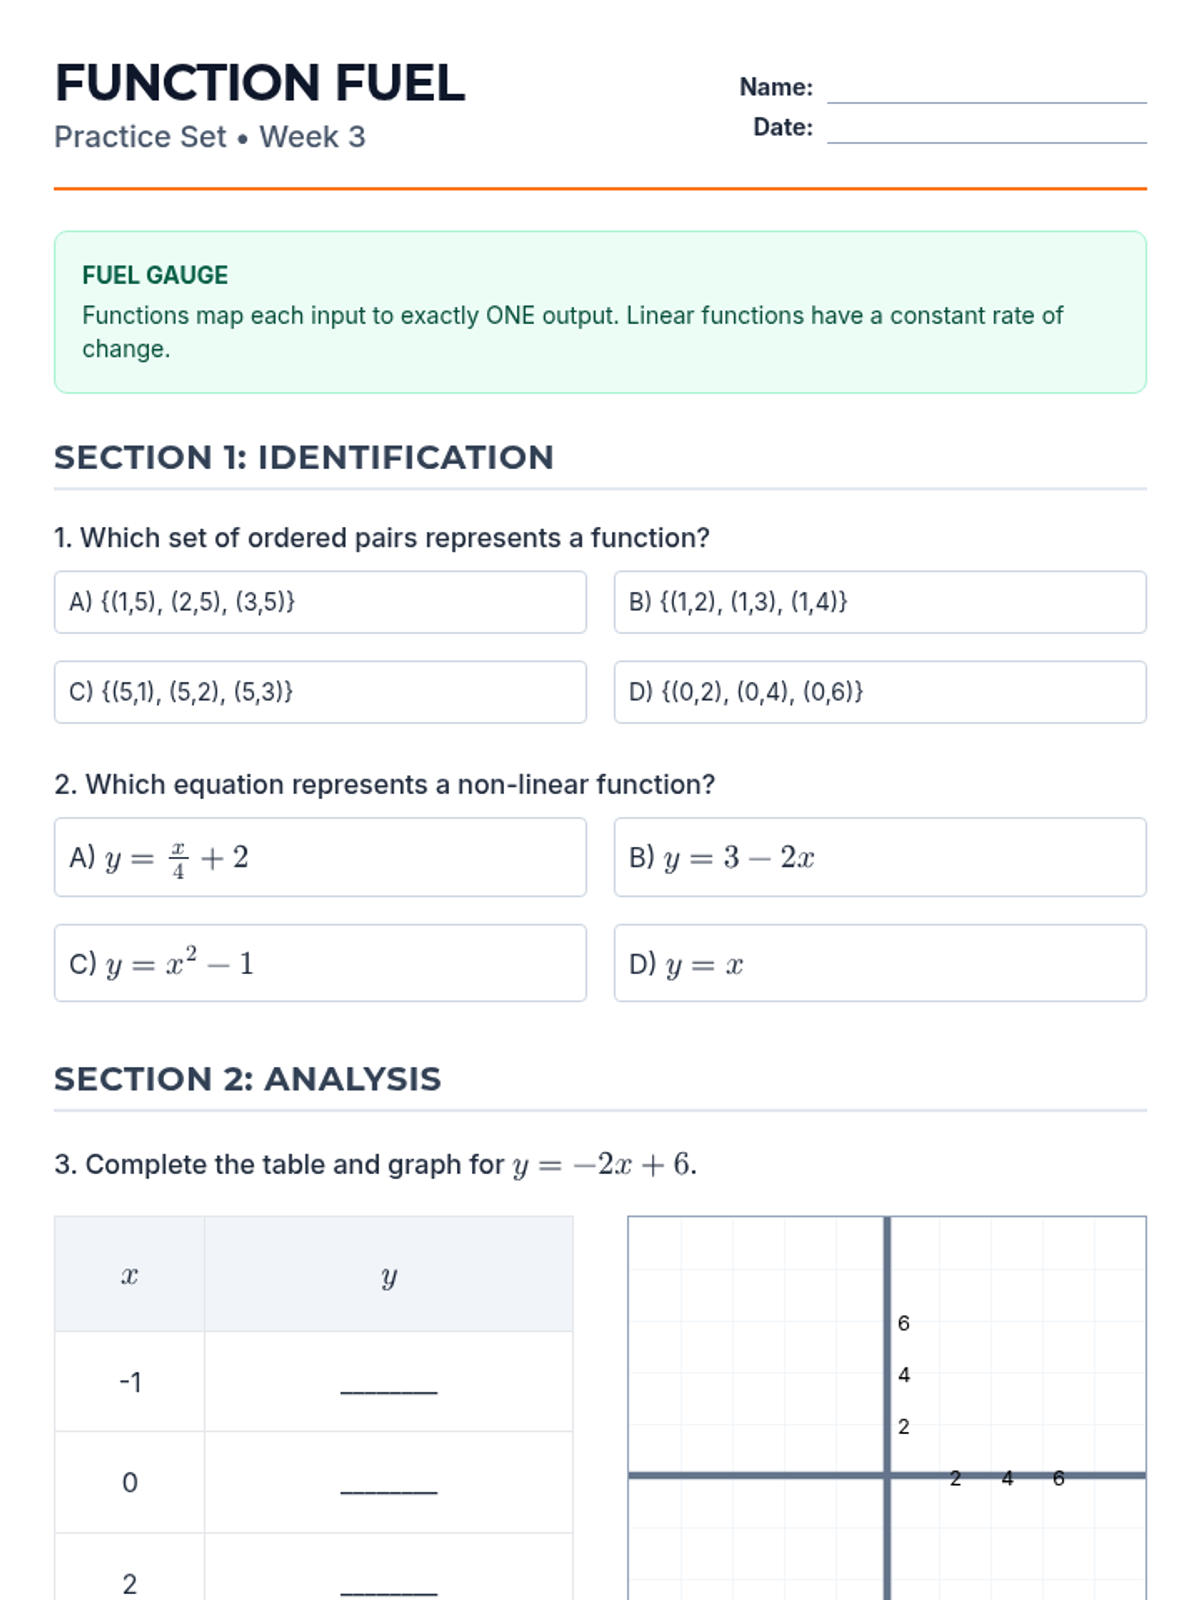
Revised 2-page practice set for Week 3. Improved coordinate plane with numerical labels, corrected font sizes, and consolidated layout.
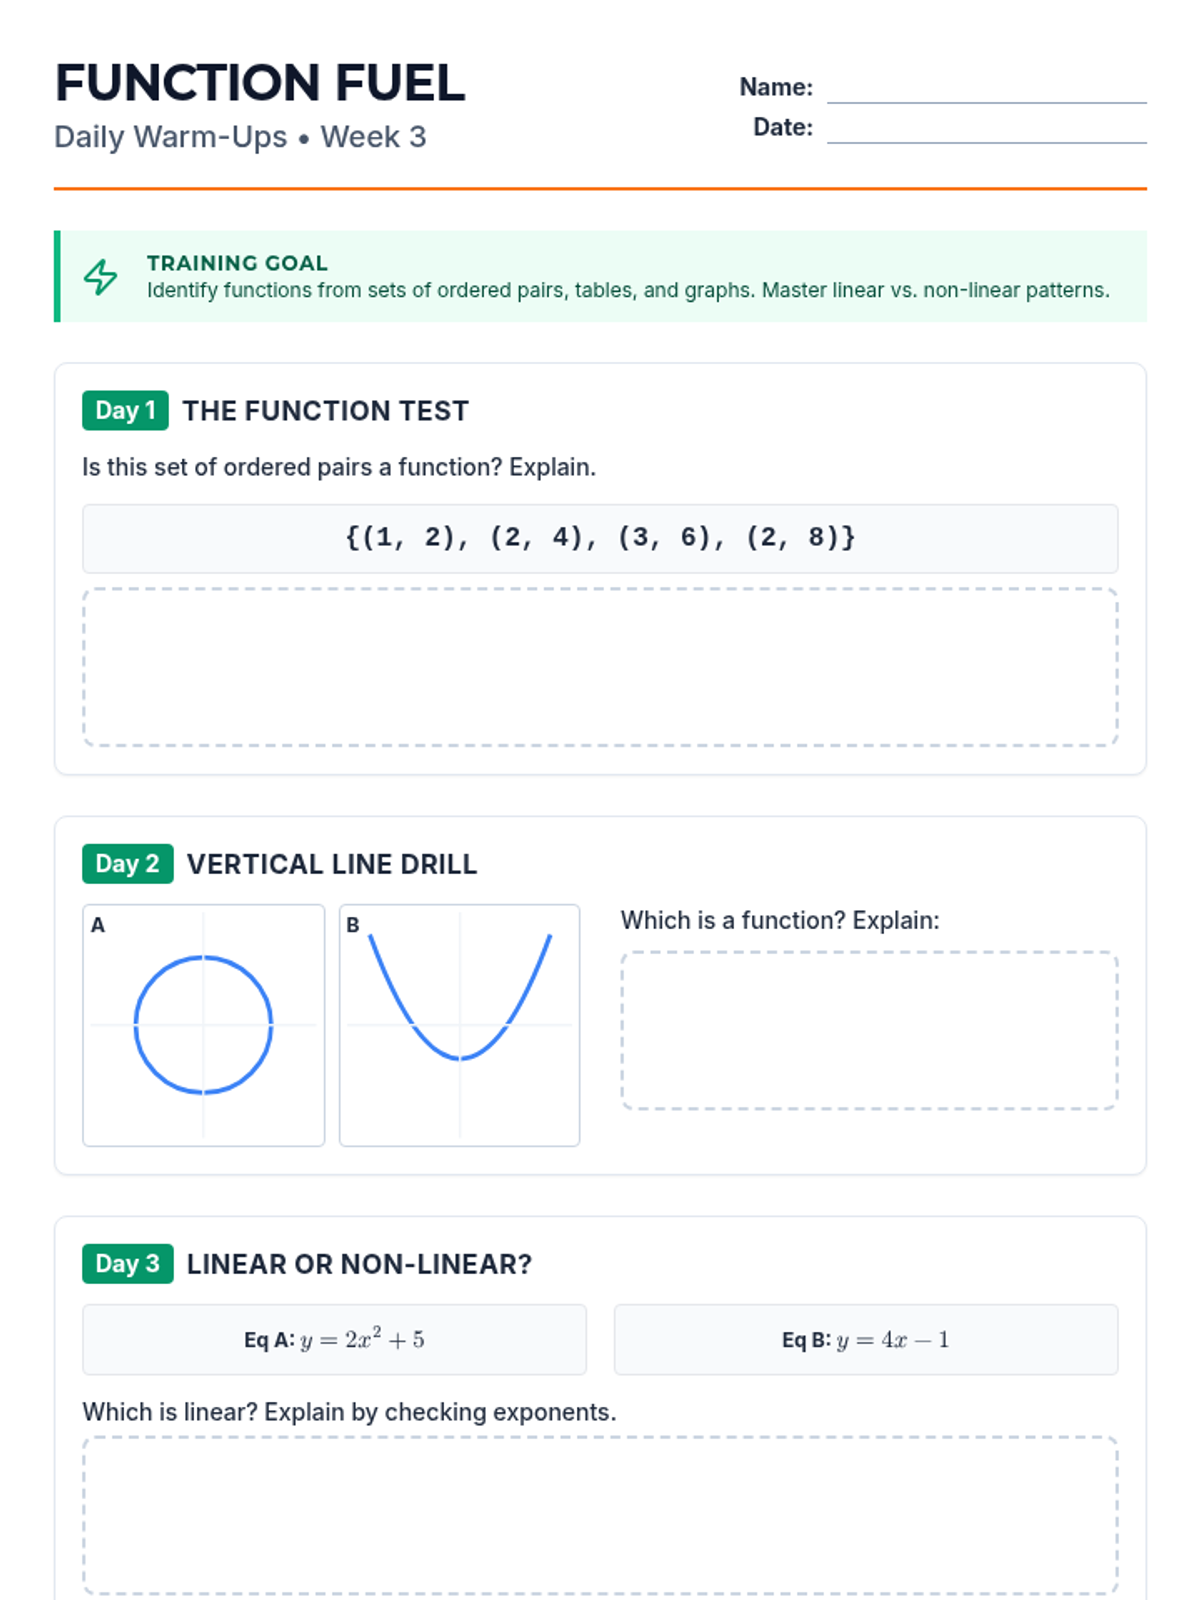
Revised 2-page Warm-Up for Week 3. Consolidated layout, fixed overlapping Day 2 elements, and improved work area contrast for better printing.
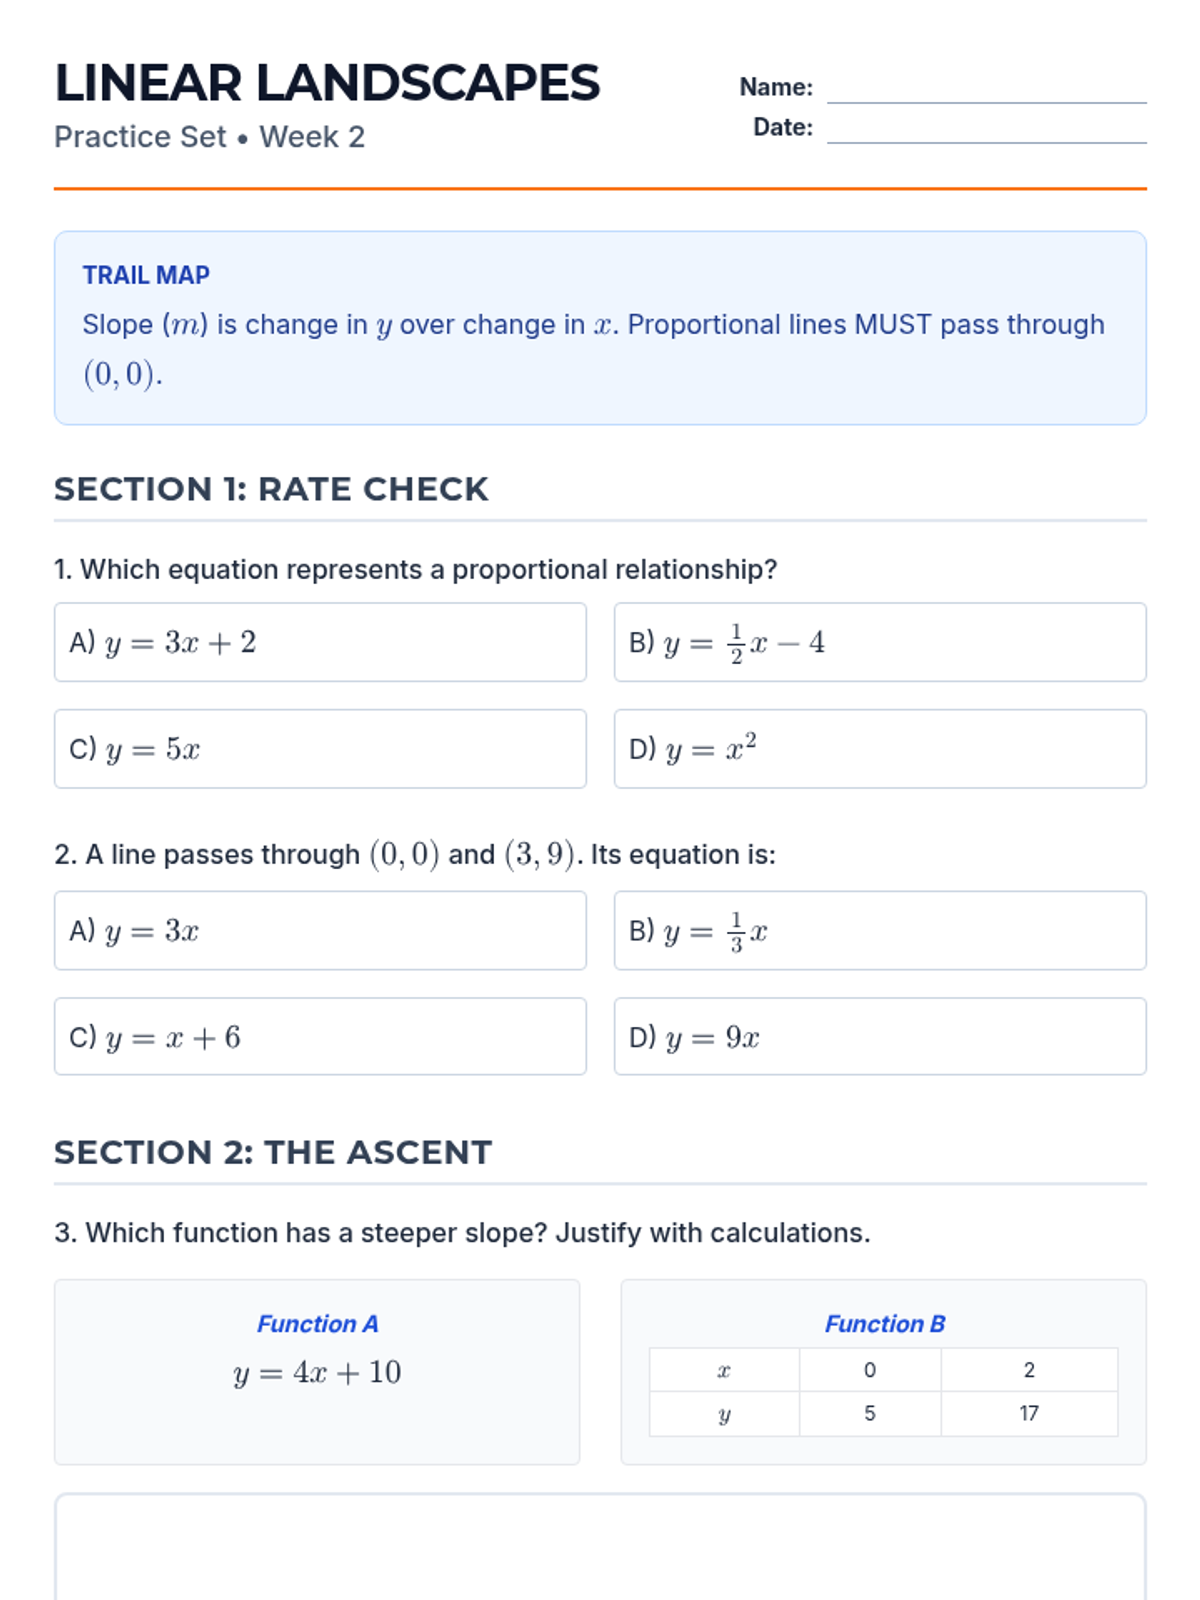
Revised 2-page practice set for Week 2. Fixed pagination, added numerical scale to coordinate plane, and improved the layout of word problems.
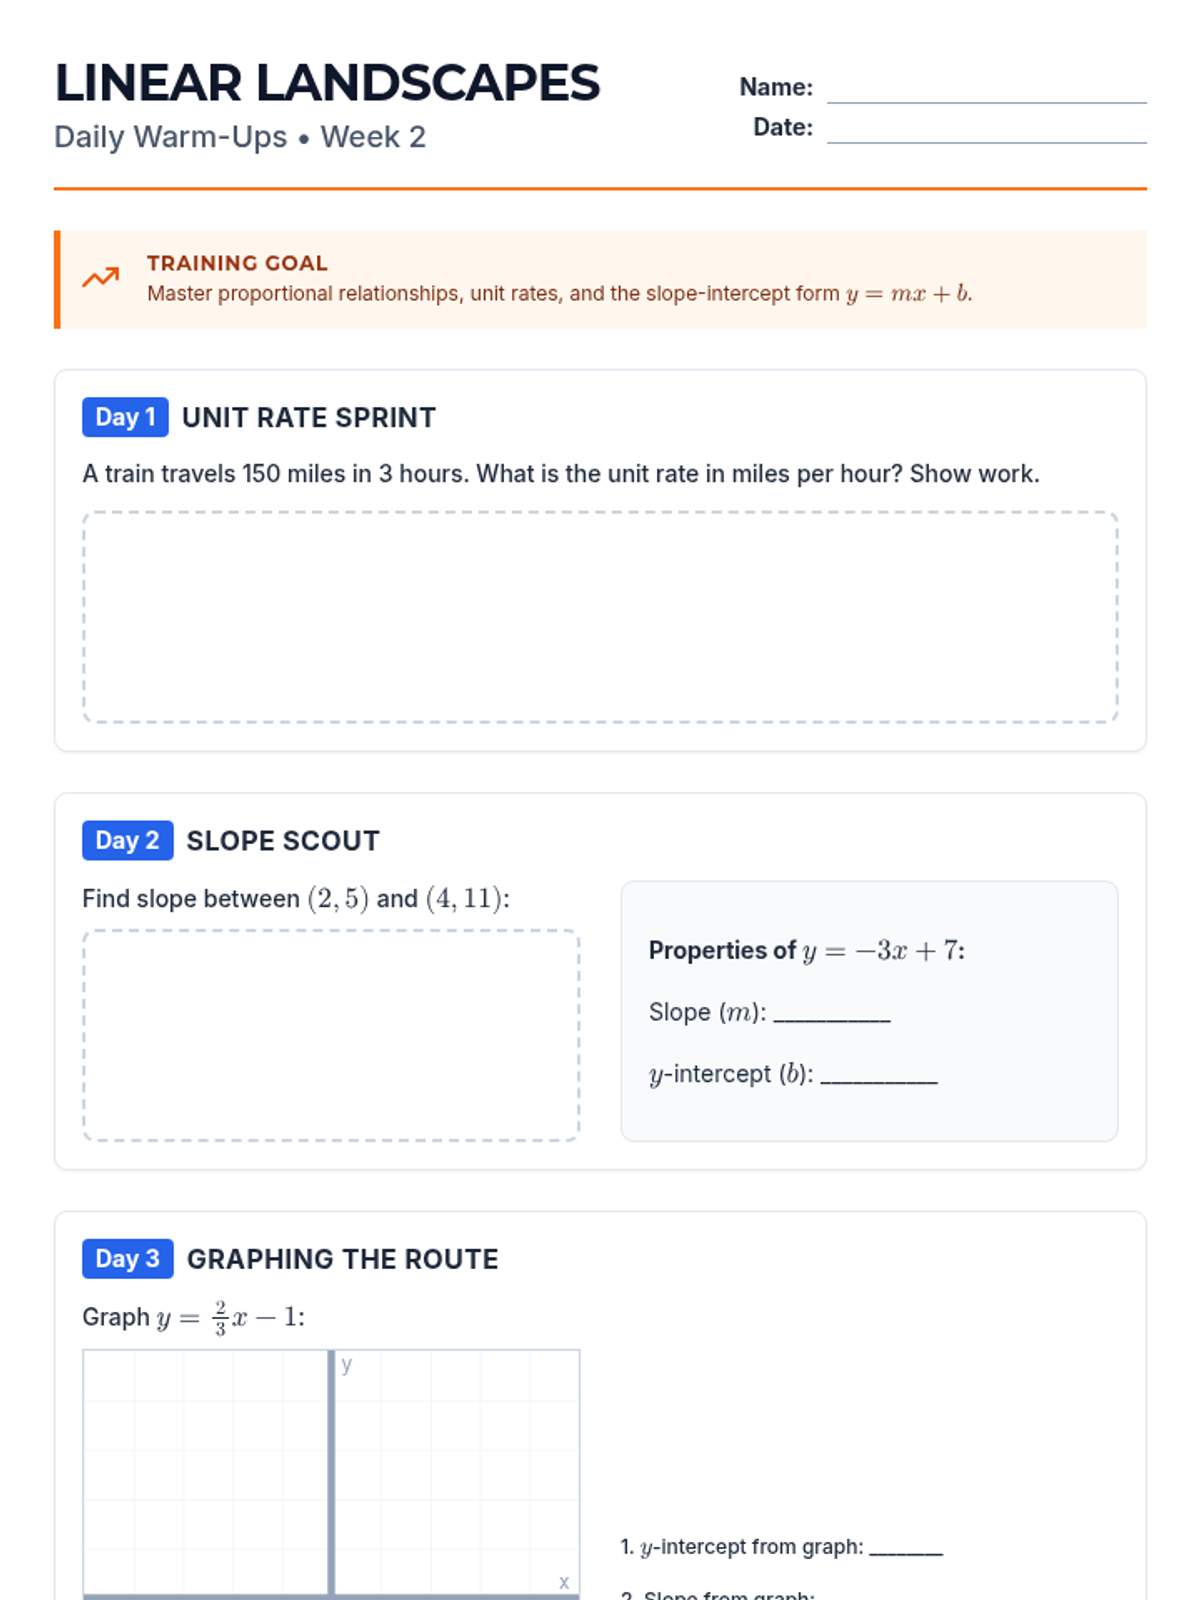
Revised 2-page Warm-Up for Week 2. Fixed pagination, added scale to coordinate plane, and improved the response area for slope identification.
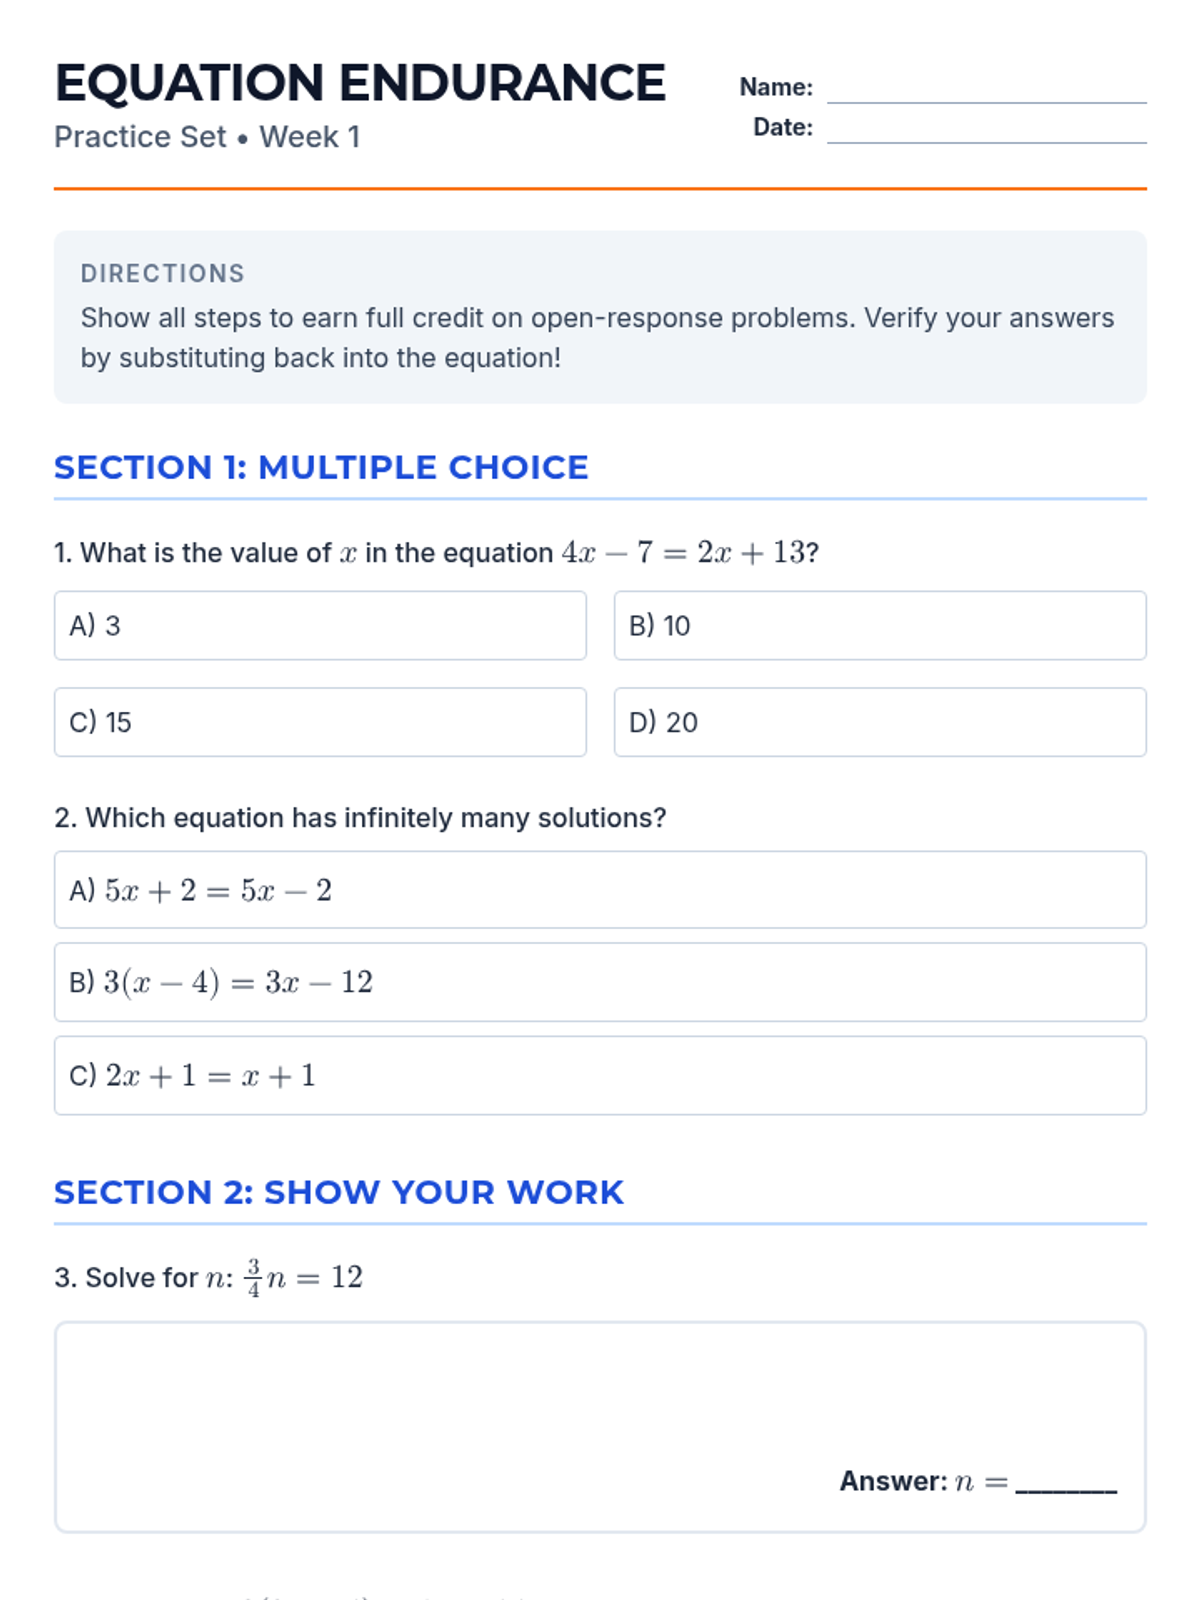
Revised 2-page practice set for Week 1. Consolidated layout to avoid orphaned headers and added specific answer lines.
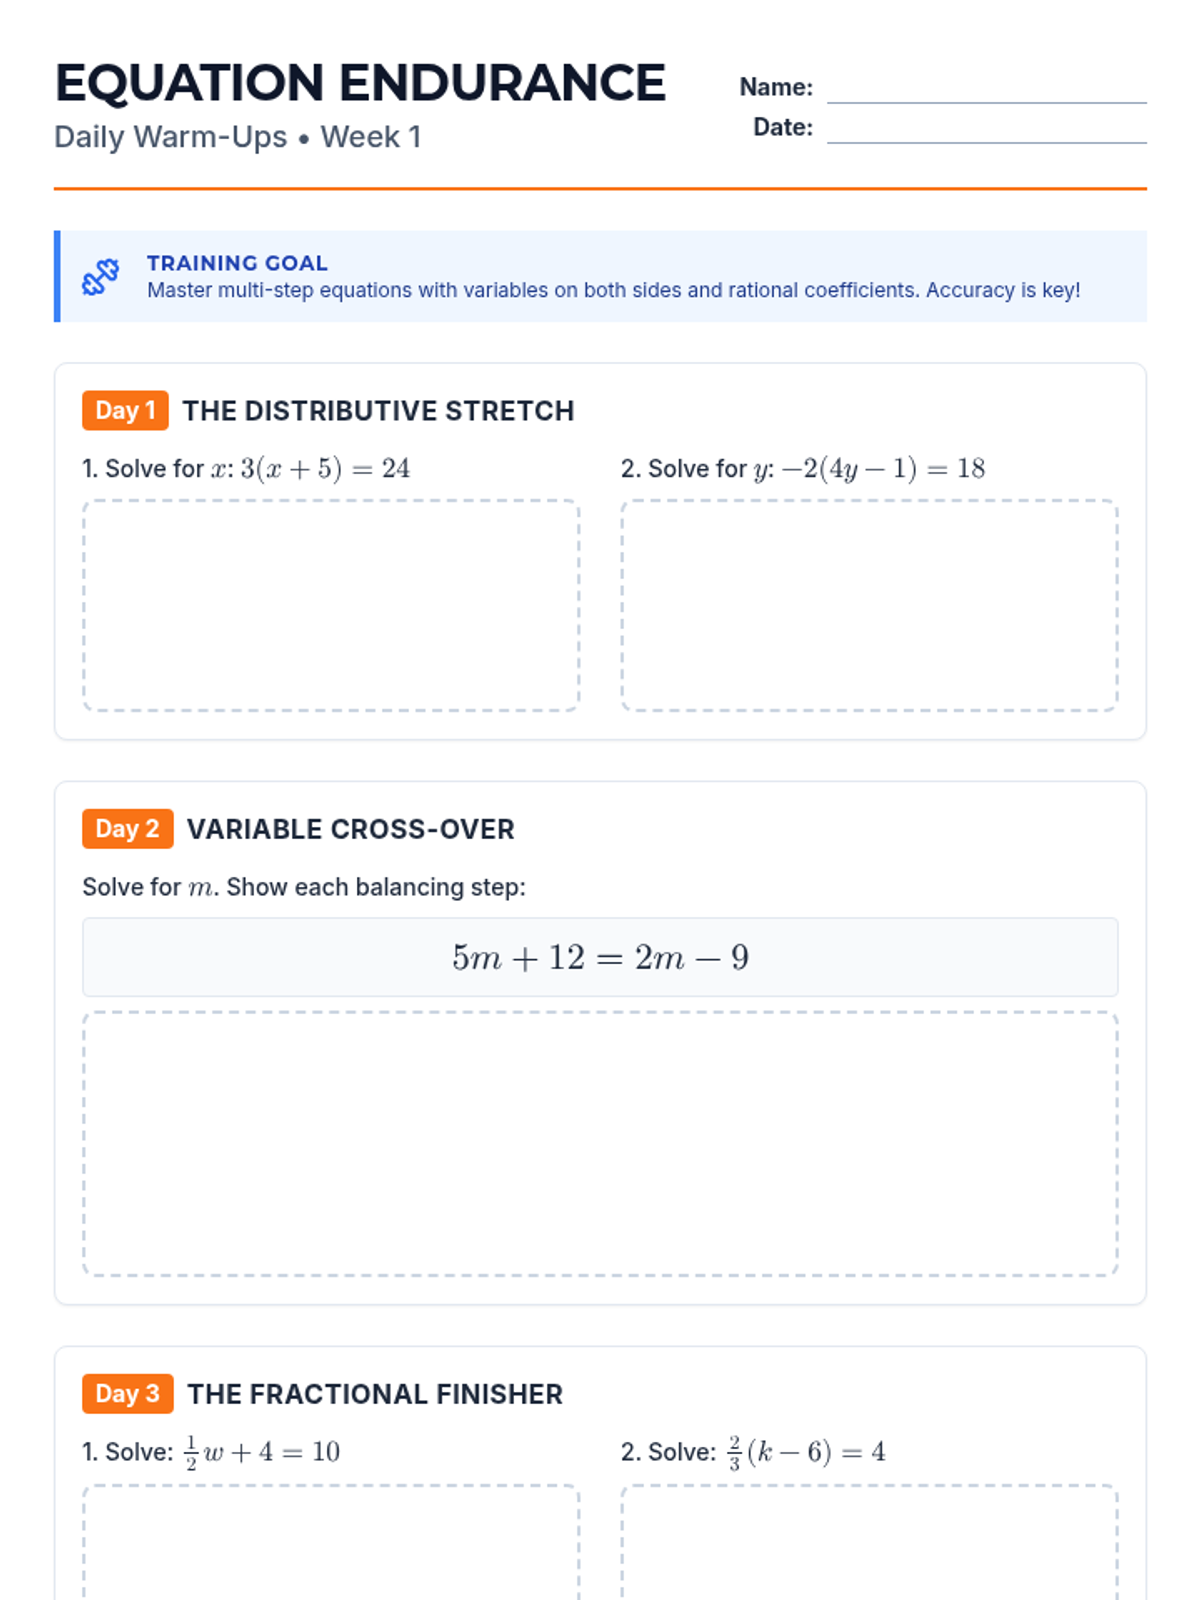
Condensed and polished 2-page Warm-Up for Week 1. Fixed pagination issues and improved work area contrast for printing.
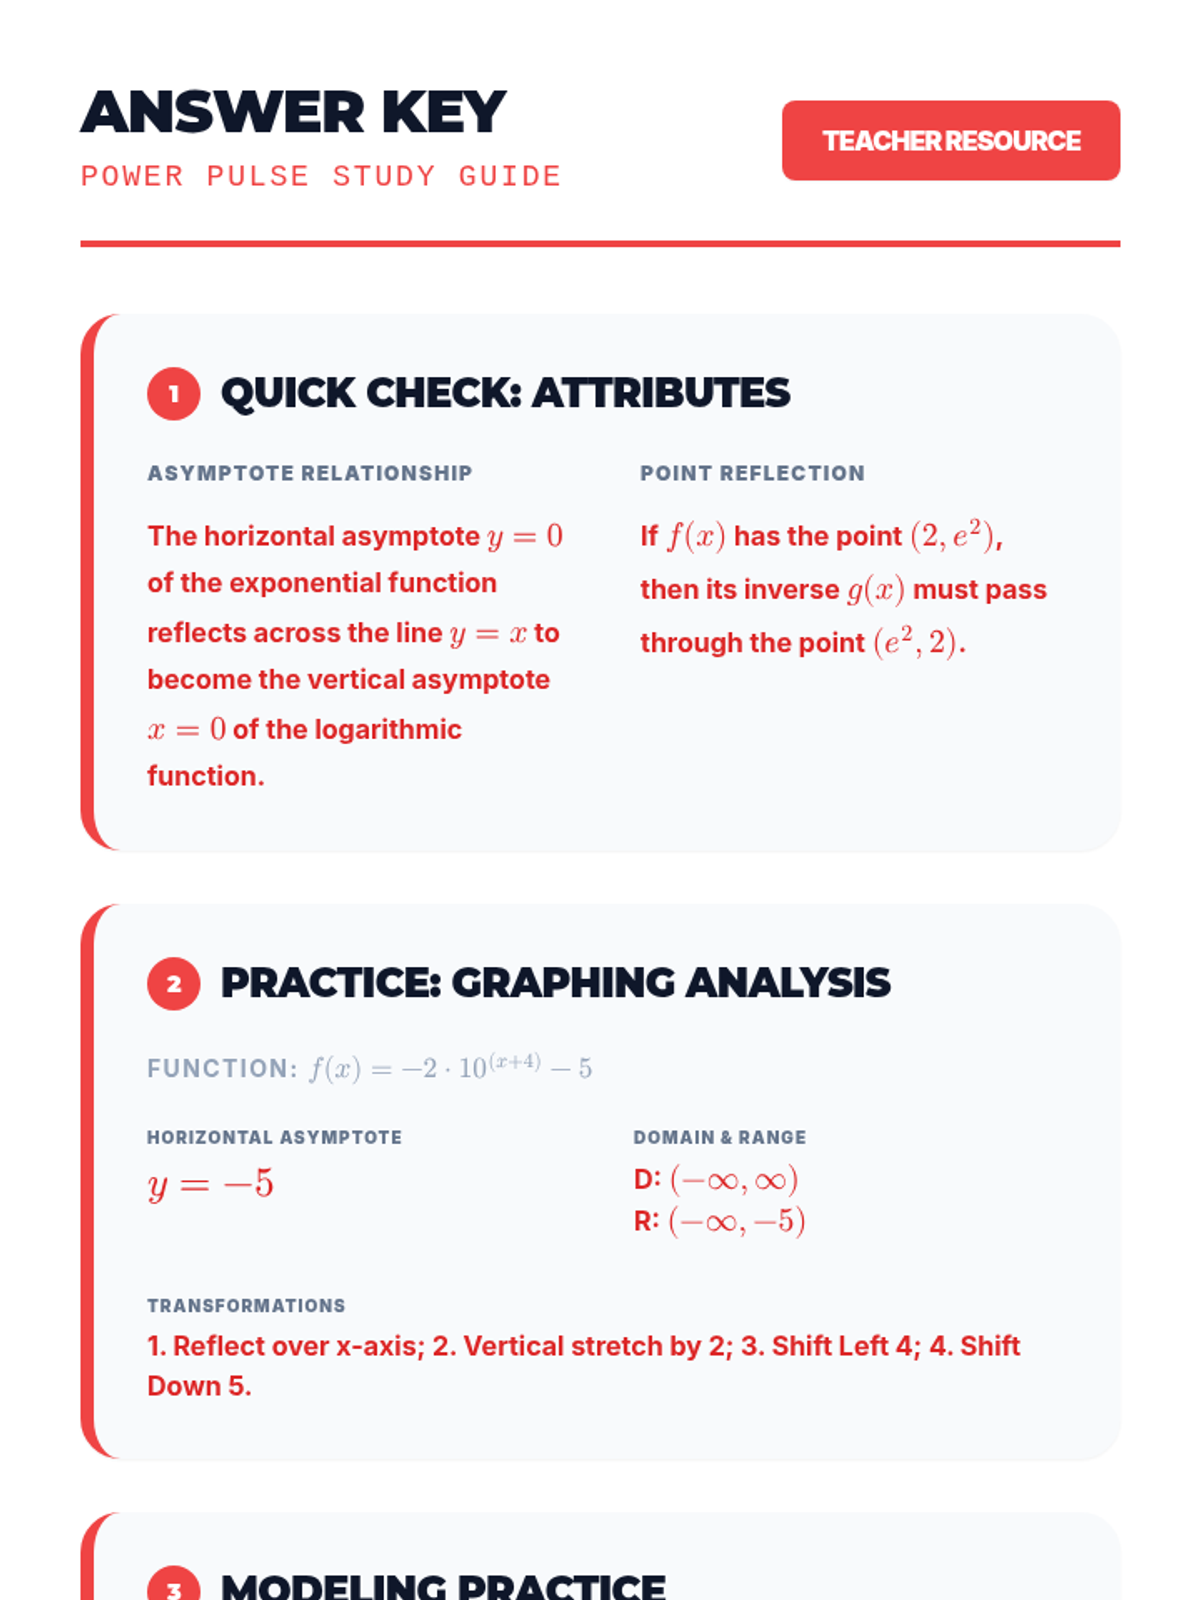
The complete answer key for the Power Pulse Study Guide, providing specific solutions for the Quick Check exercises, attribute analysis, and modeling scenarios.
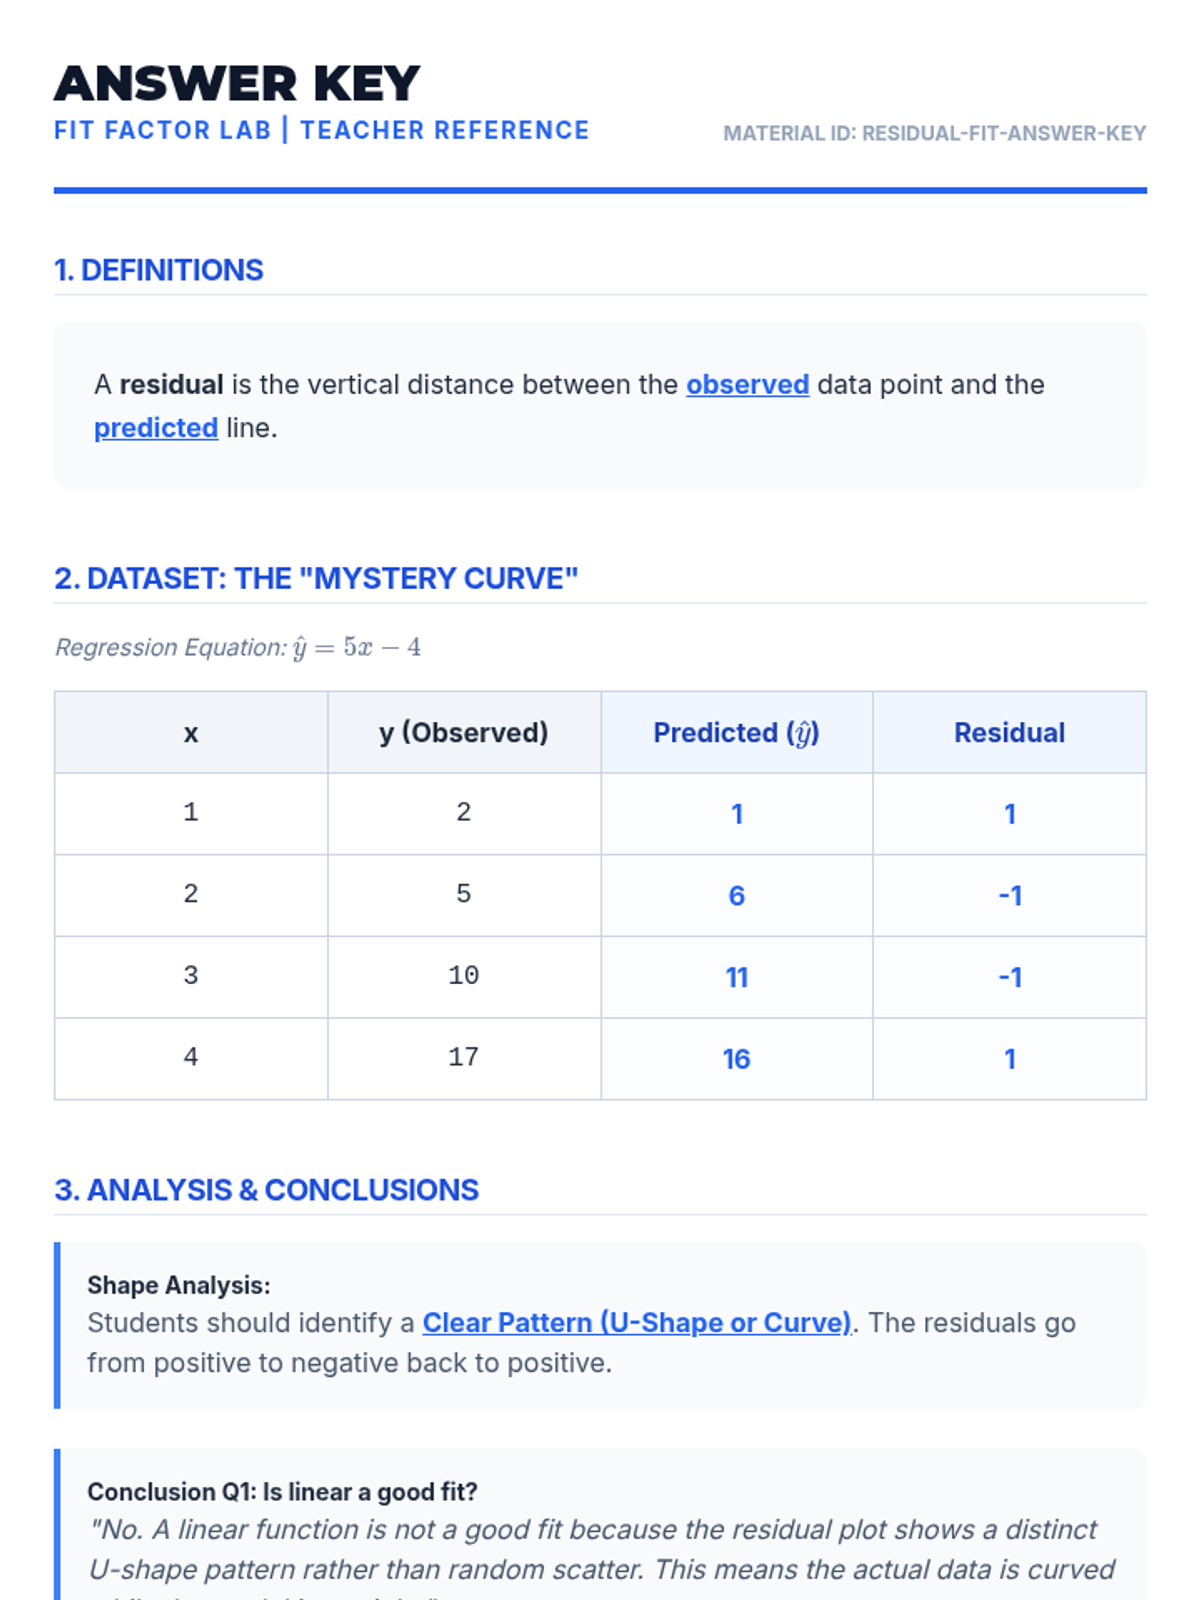
An answer key for the Fit Factor Worksheet, providing the regression equation, calculated predicted values, residuals, and sample responses for the analysis questions.
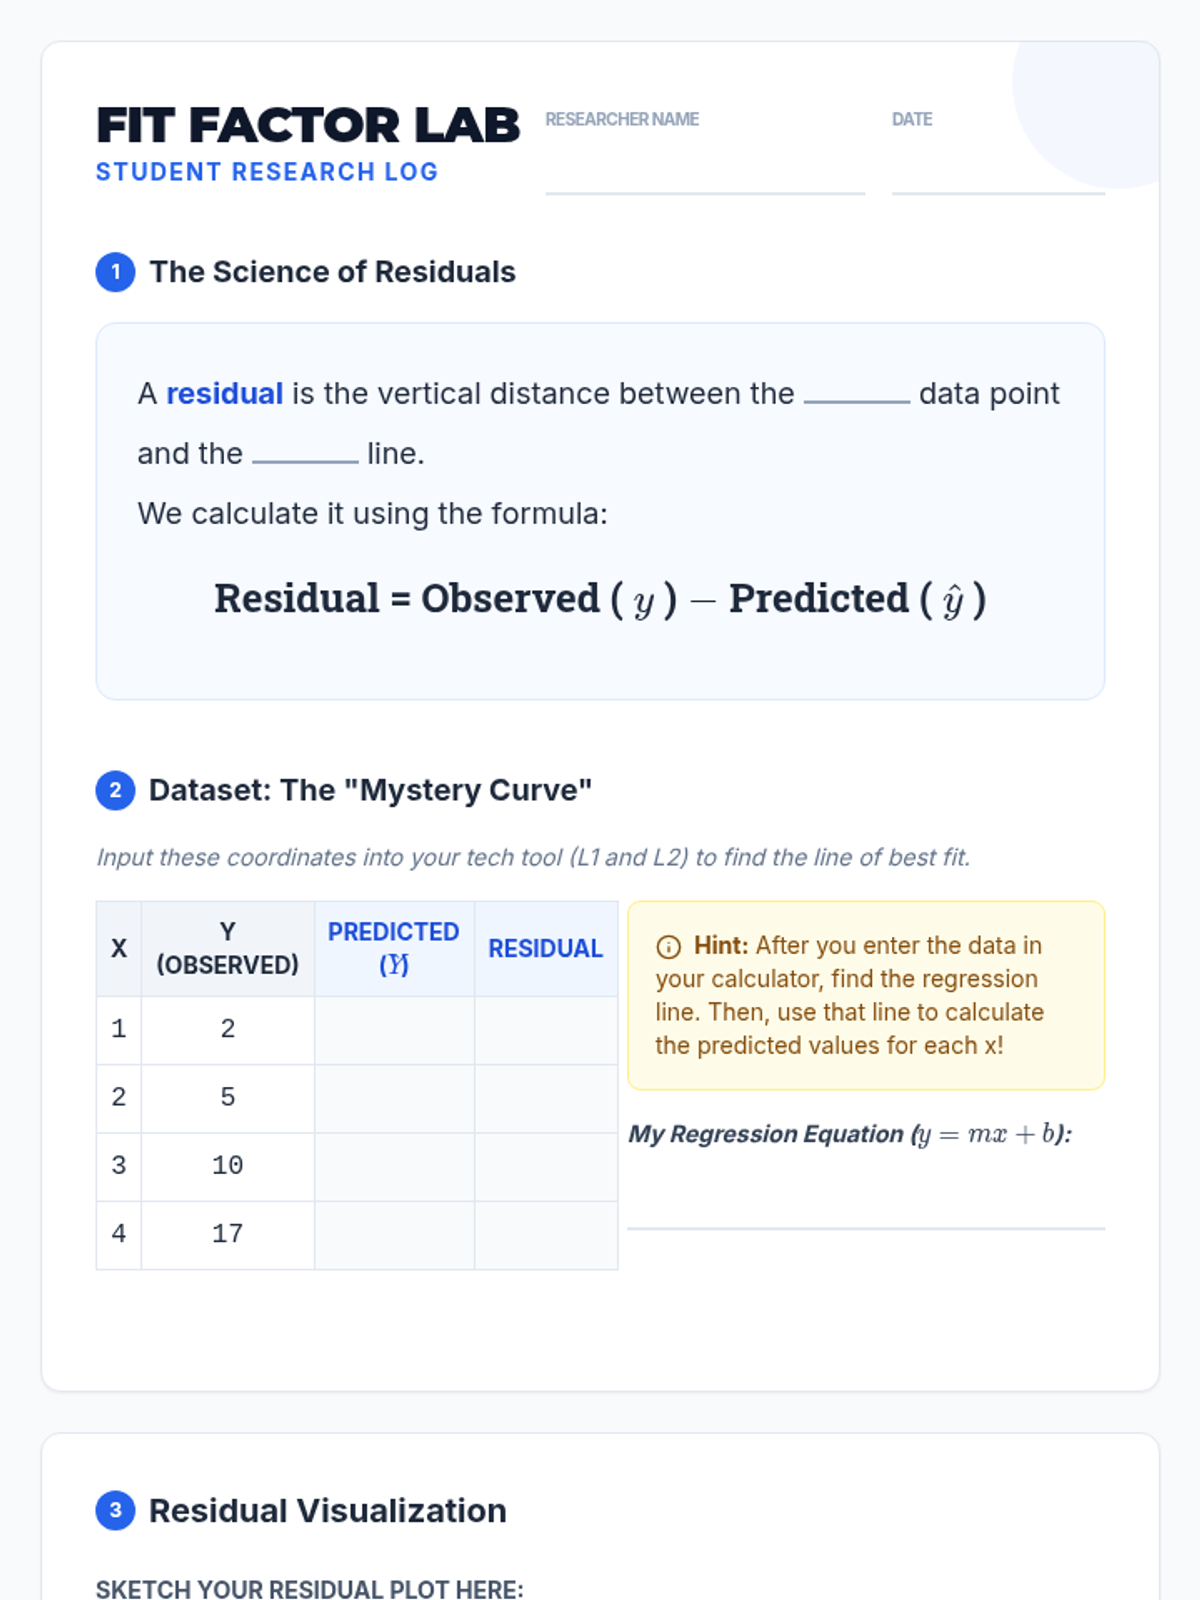
A scaffolded student worksheet for the Residual Research lesson. Students define residuals, calculate them for a small dataset, create a residual plot, and analyze the results to determine the appropriateness of a linear fit.
A visual slide deck for the Residual Research lesson, designed for teacher-led instruction and student tech exploration. Includes definitions, visual guides for analyzing residual plots, and discussion prompts.
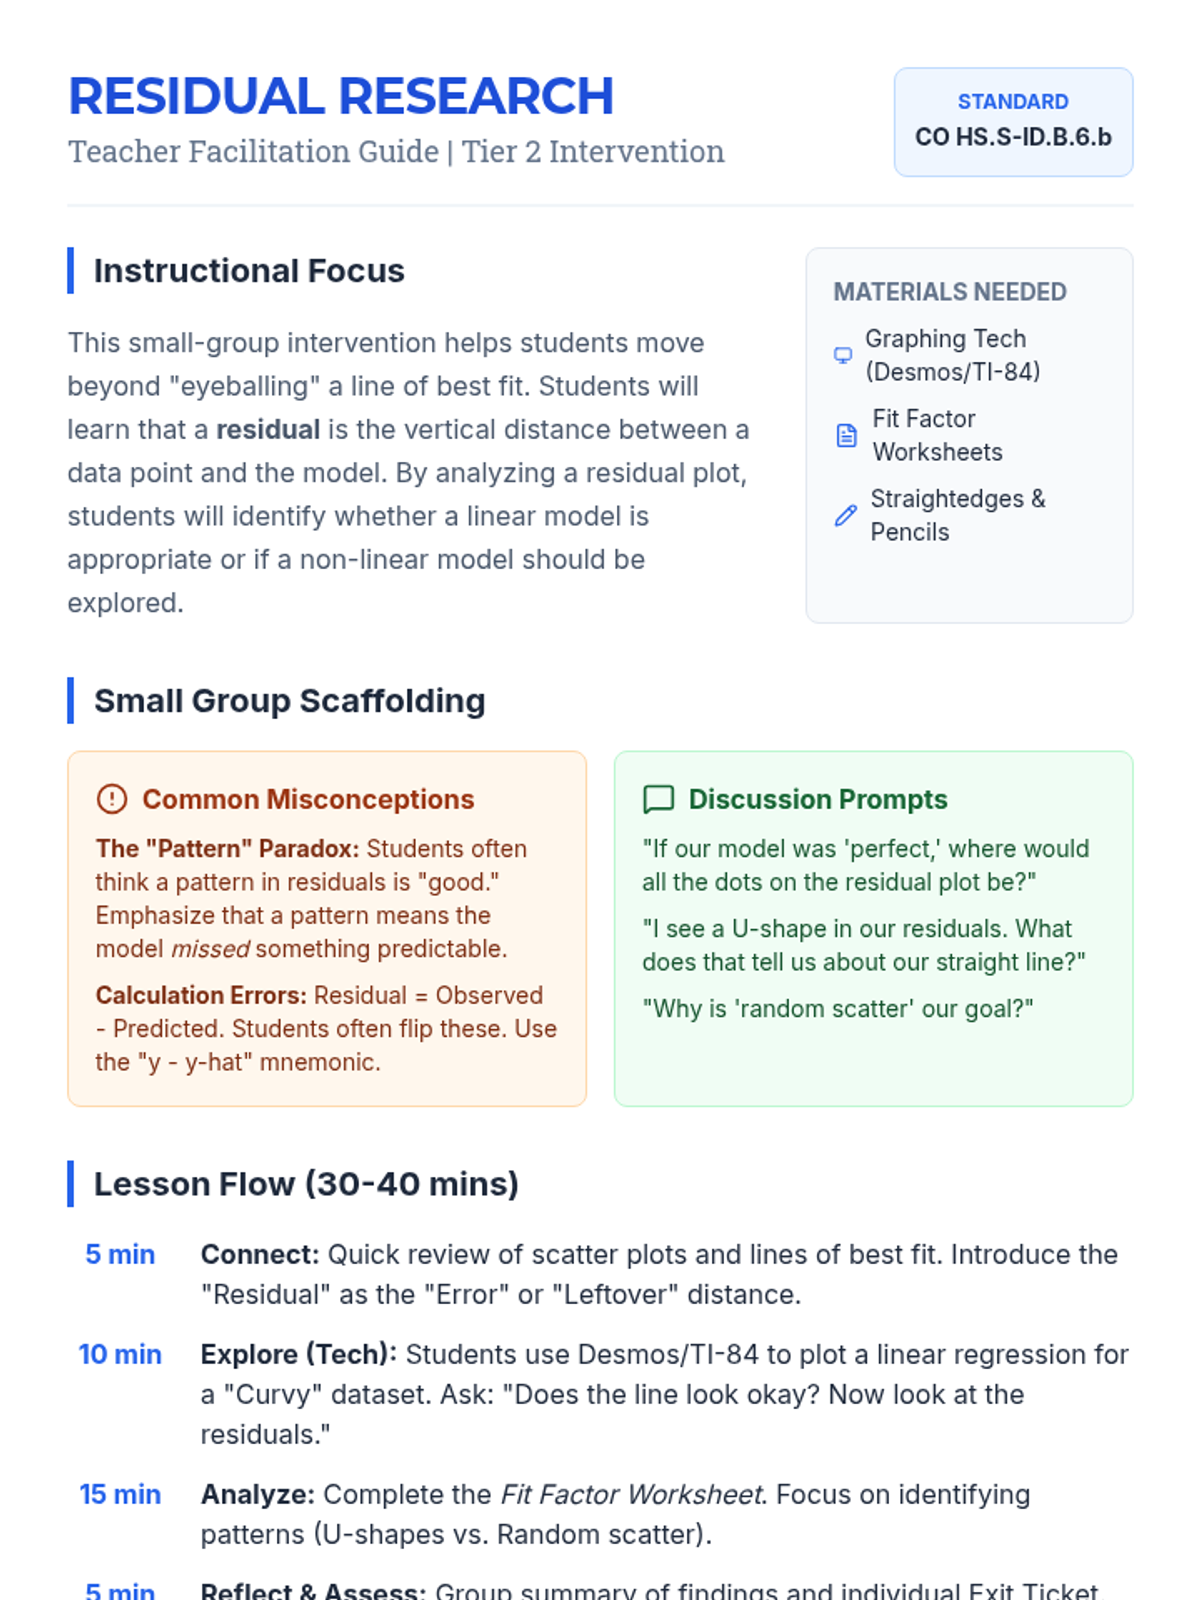
A comprehensive teacher facilitation guide for the Residual Research lesson, featuring instructional flows, small-group scaffolding strategies, common misconceptions, and a progress monitoring tracker for student assessment.
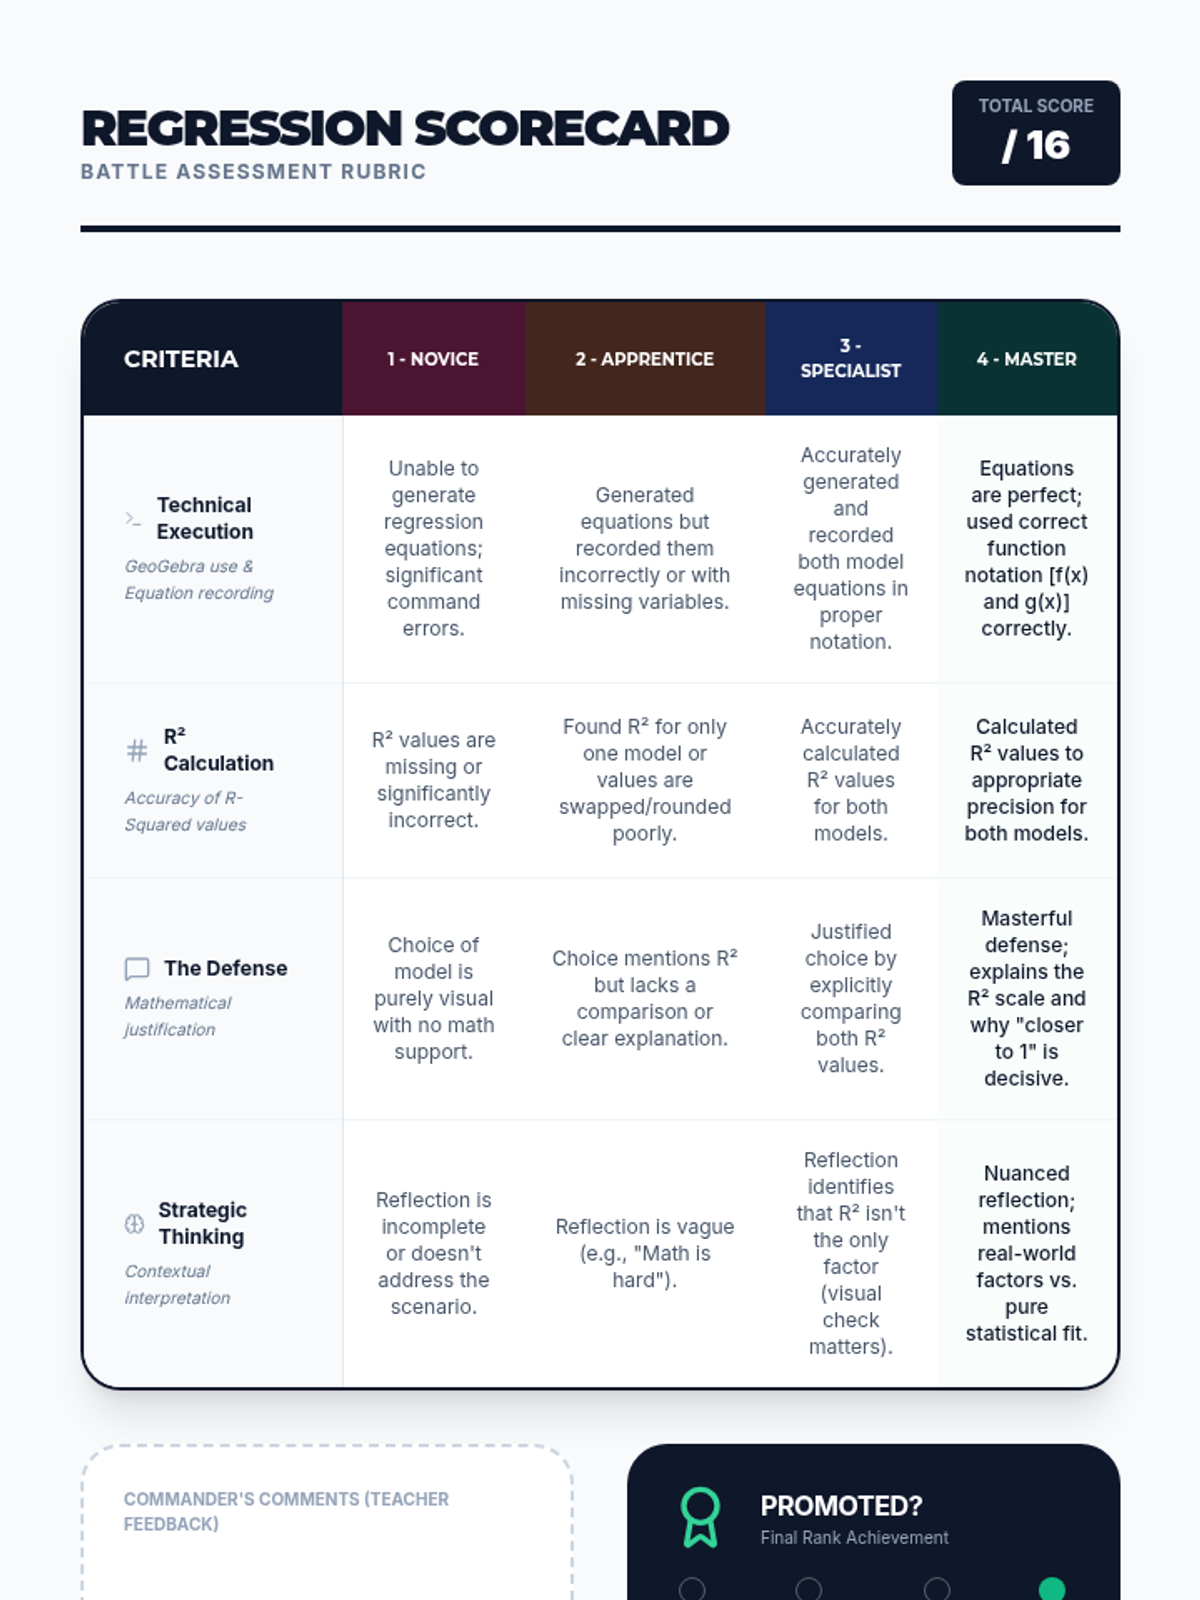
A specialized rubric for the 'Regression Battle' activity, using a gamified theme. Evaluates students on technical execution, R-squared accuracy, mathematical justification, and contextual reflection.
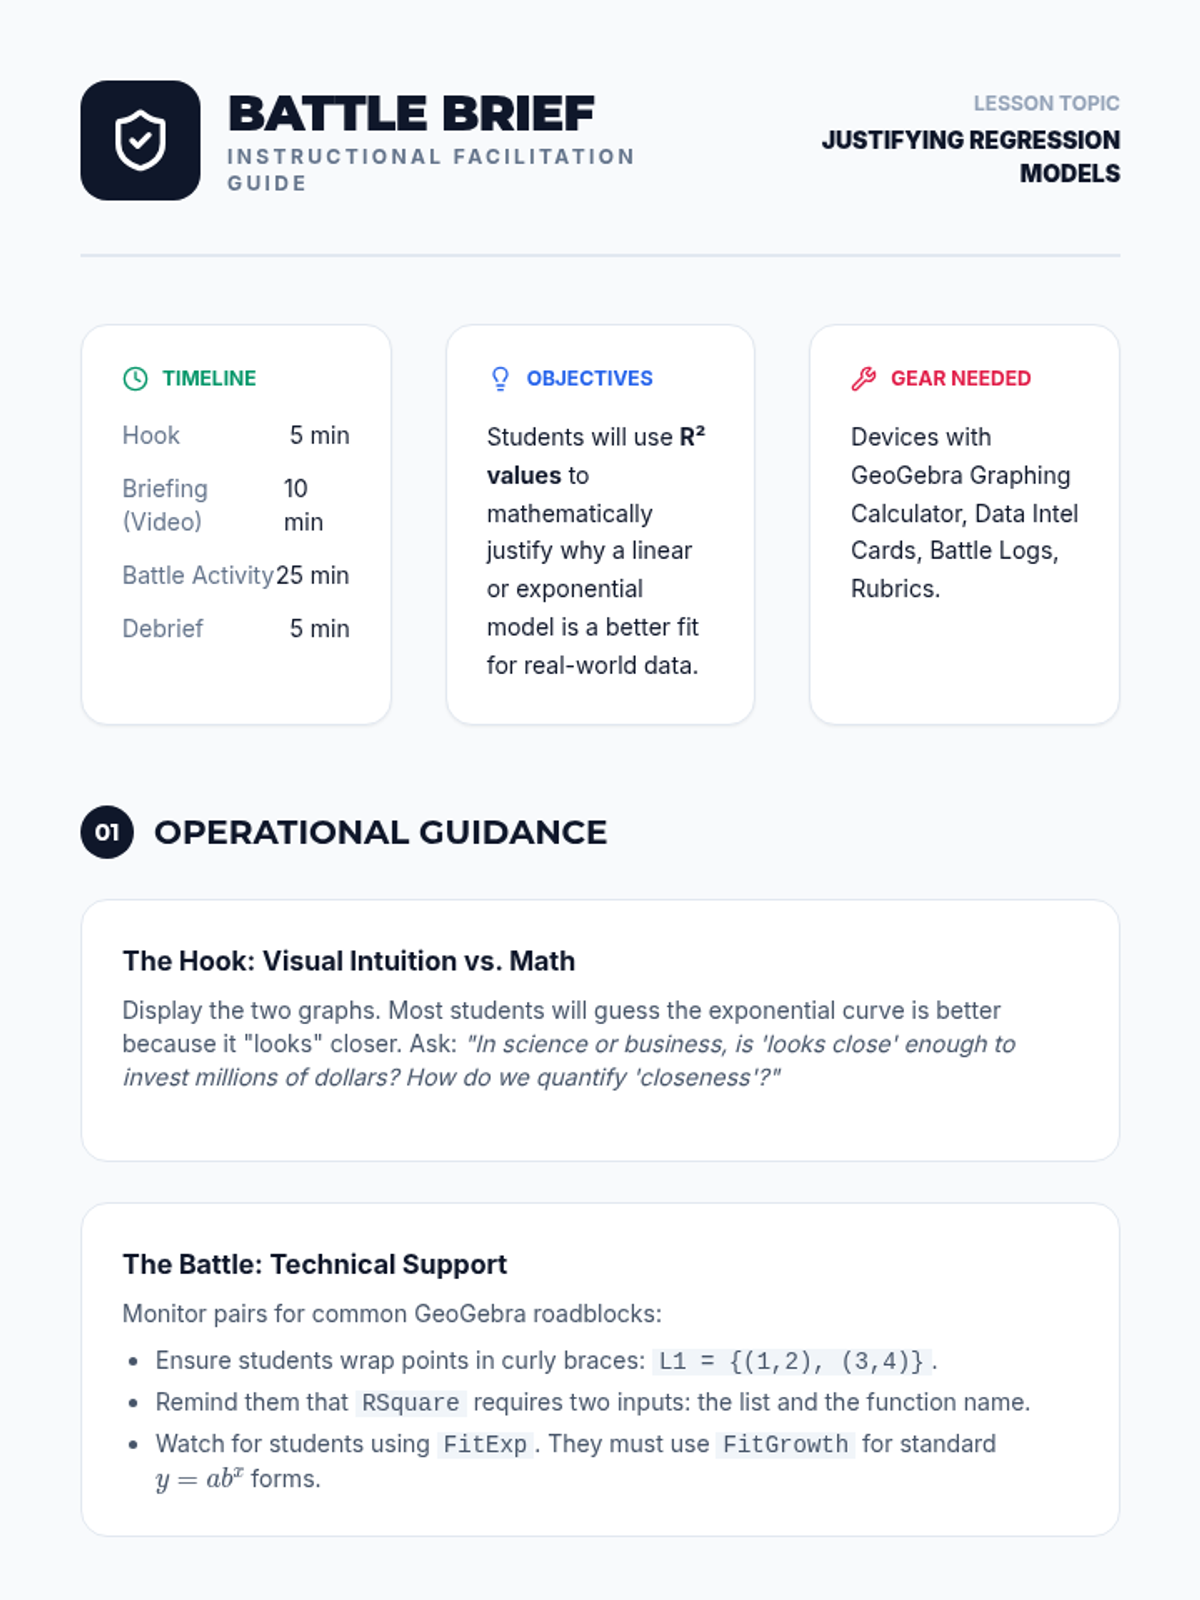
A comprehensive teacher guide for the 'Regression Battle' lesson. Includes lesson timeline, technical troubleshooting for GeoGebra, a complete answer key for the data sectors, and discussion prompts.
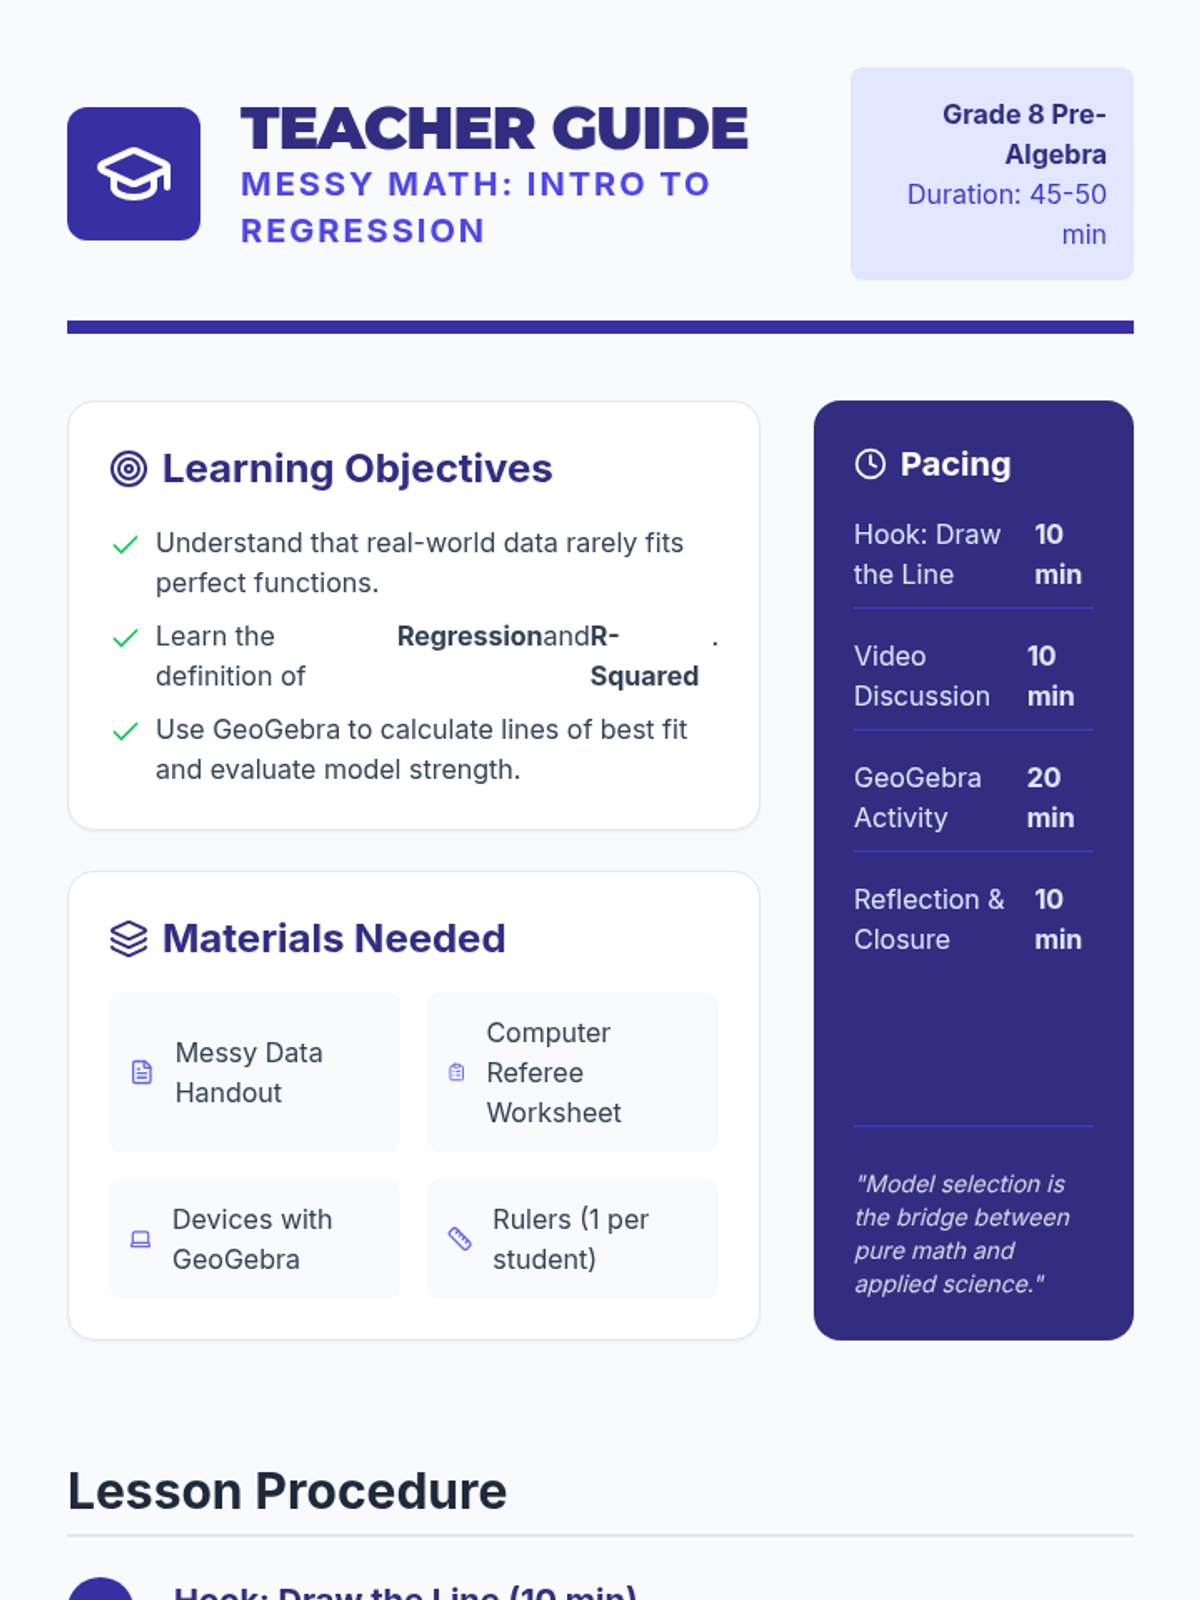
Teacher facilitation guide for the Messy Math lesson. Includes lesson pacing, student common pitfalls, answer keys for the GeoGebra activity, and discussion prompts for comparing linear and exponential models.
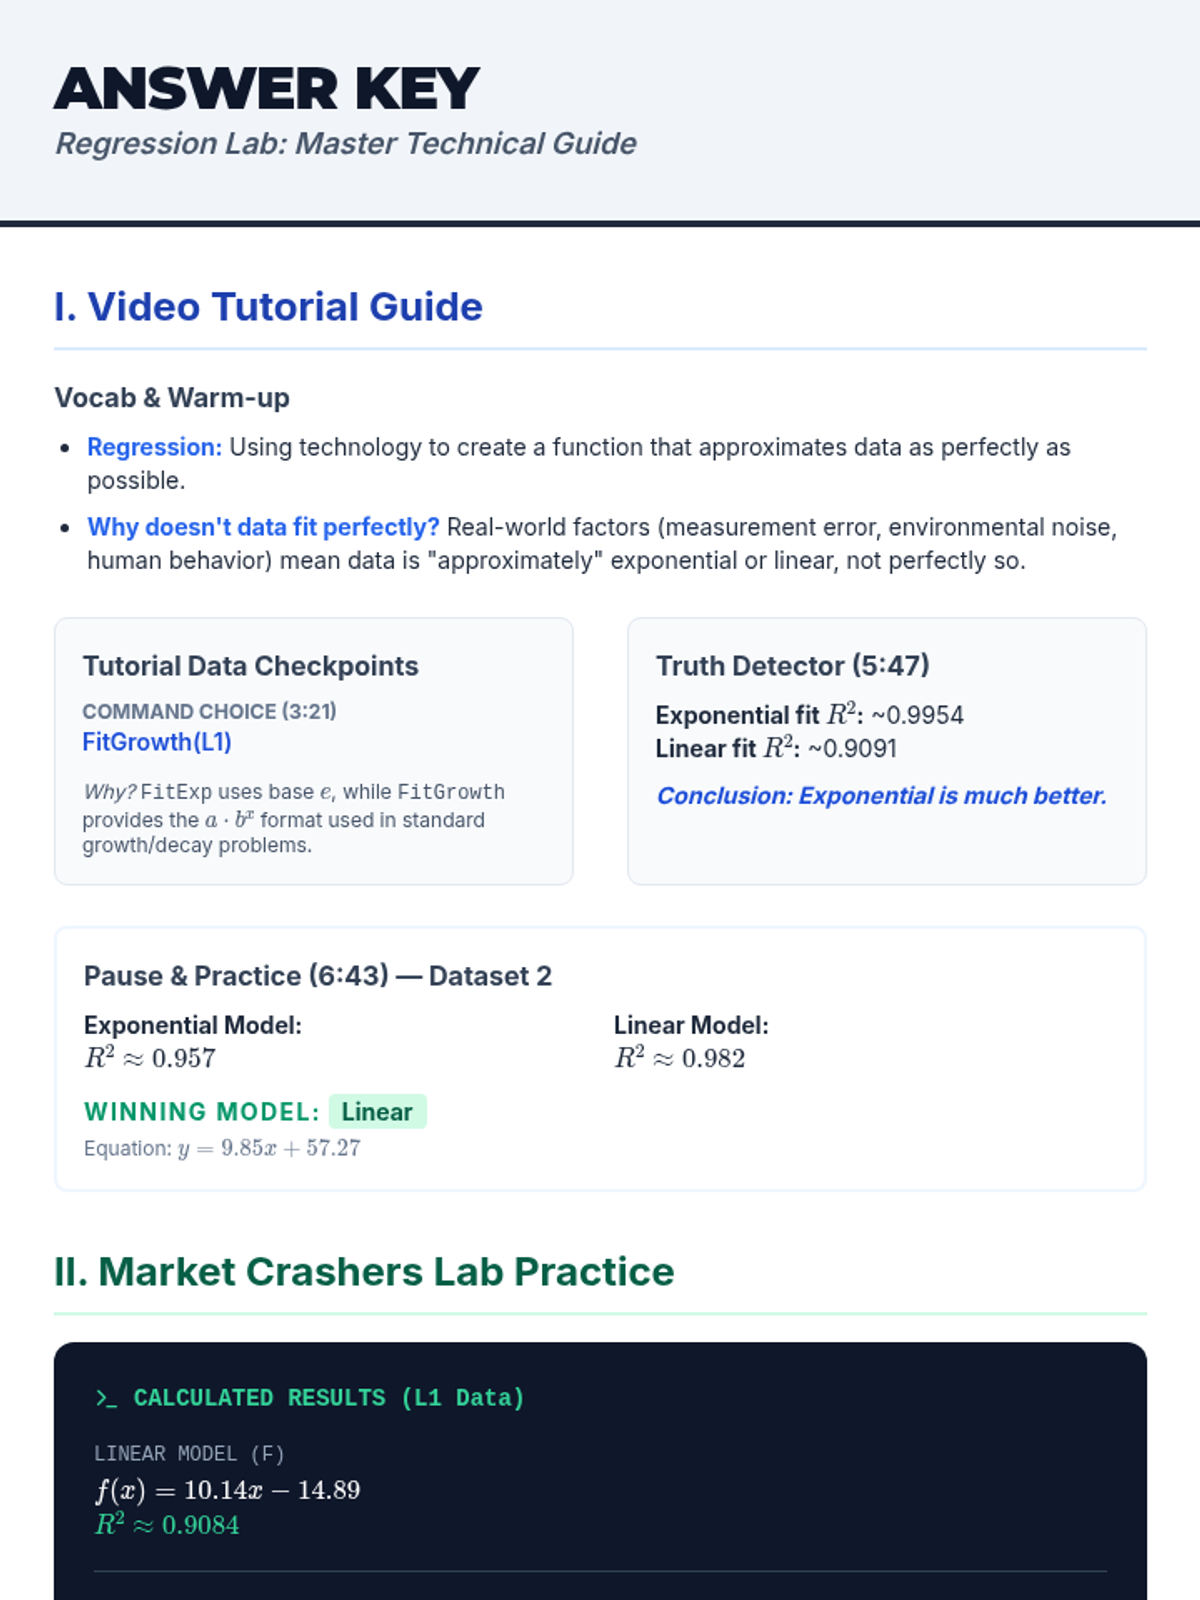
An answer key for the Regression Lab, providing calculated regression models, R-squared values, and justifications for both the video tutorial and the stock market practice.
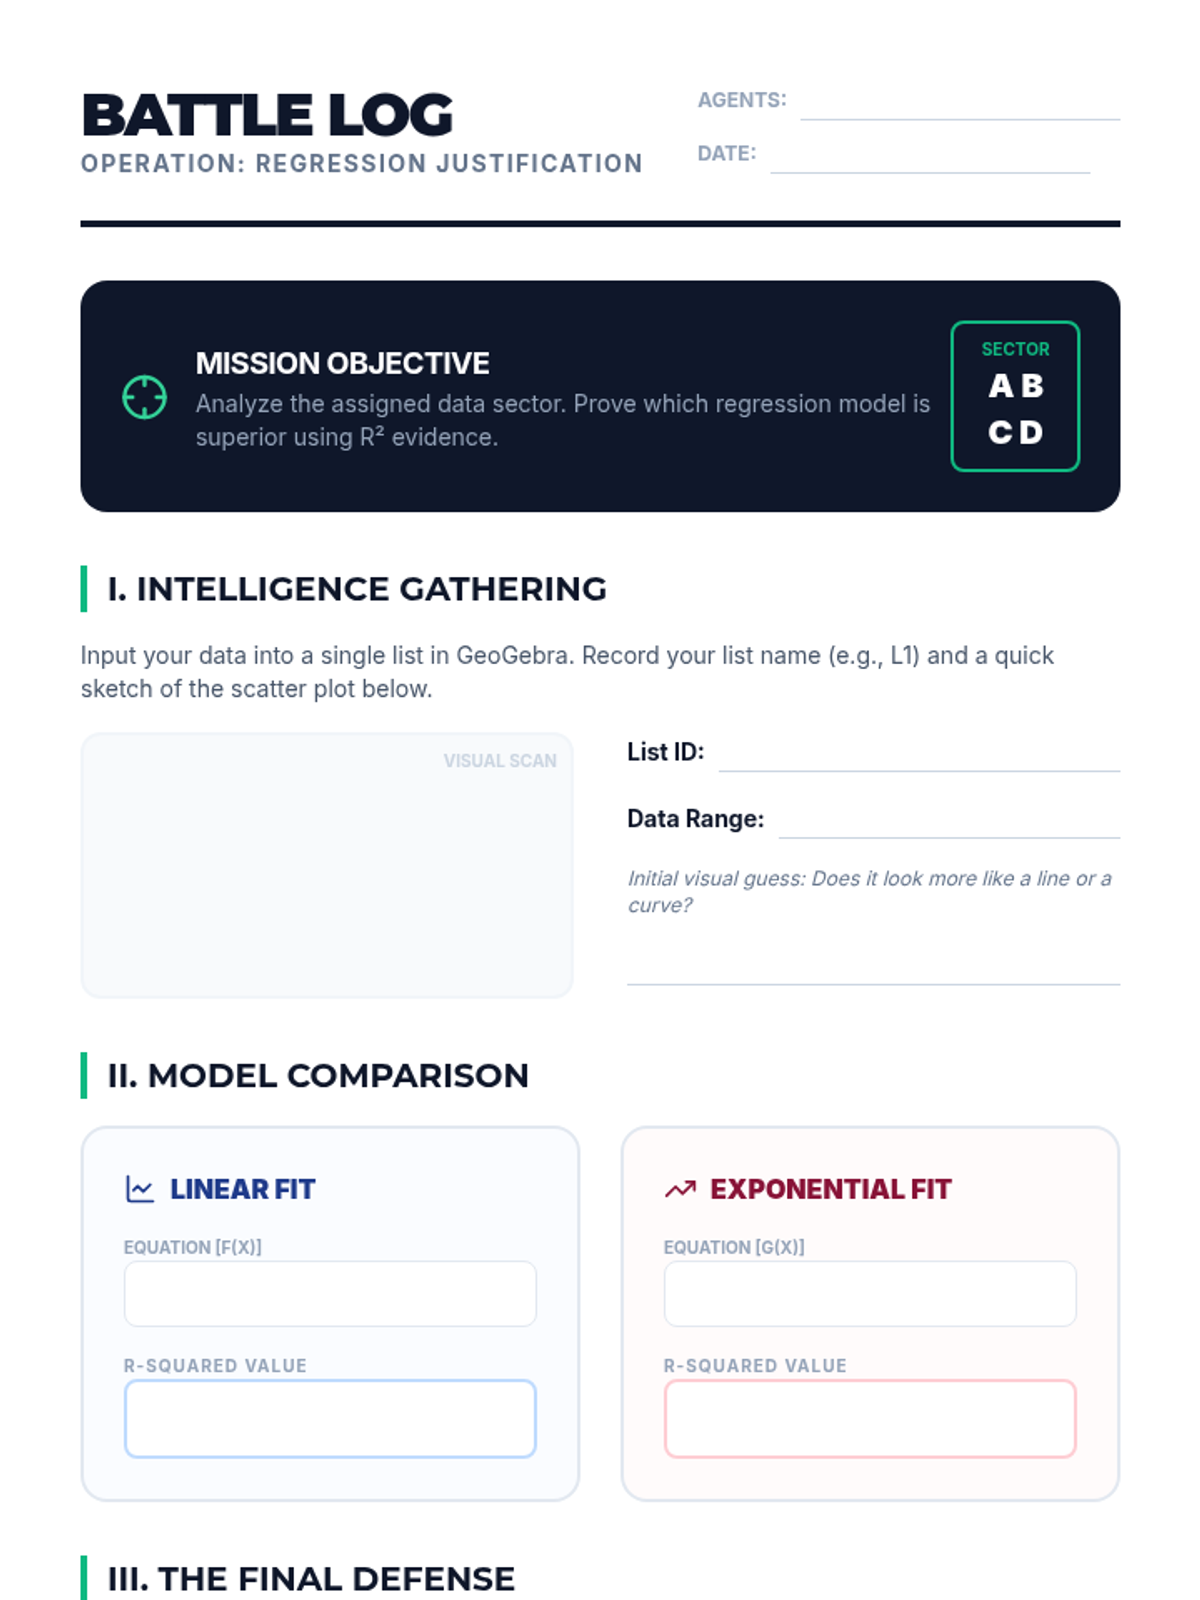
A student worksheet for the 'Regression Battle' activity. Includes space for recording data list names, linear vs. exponential equations, R-squared values, and a structured area for writing a mathematical defense.
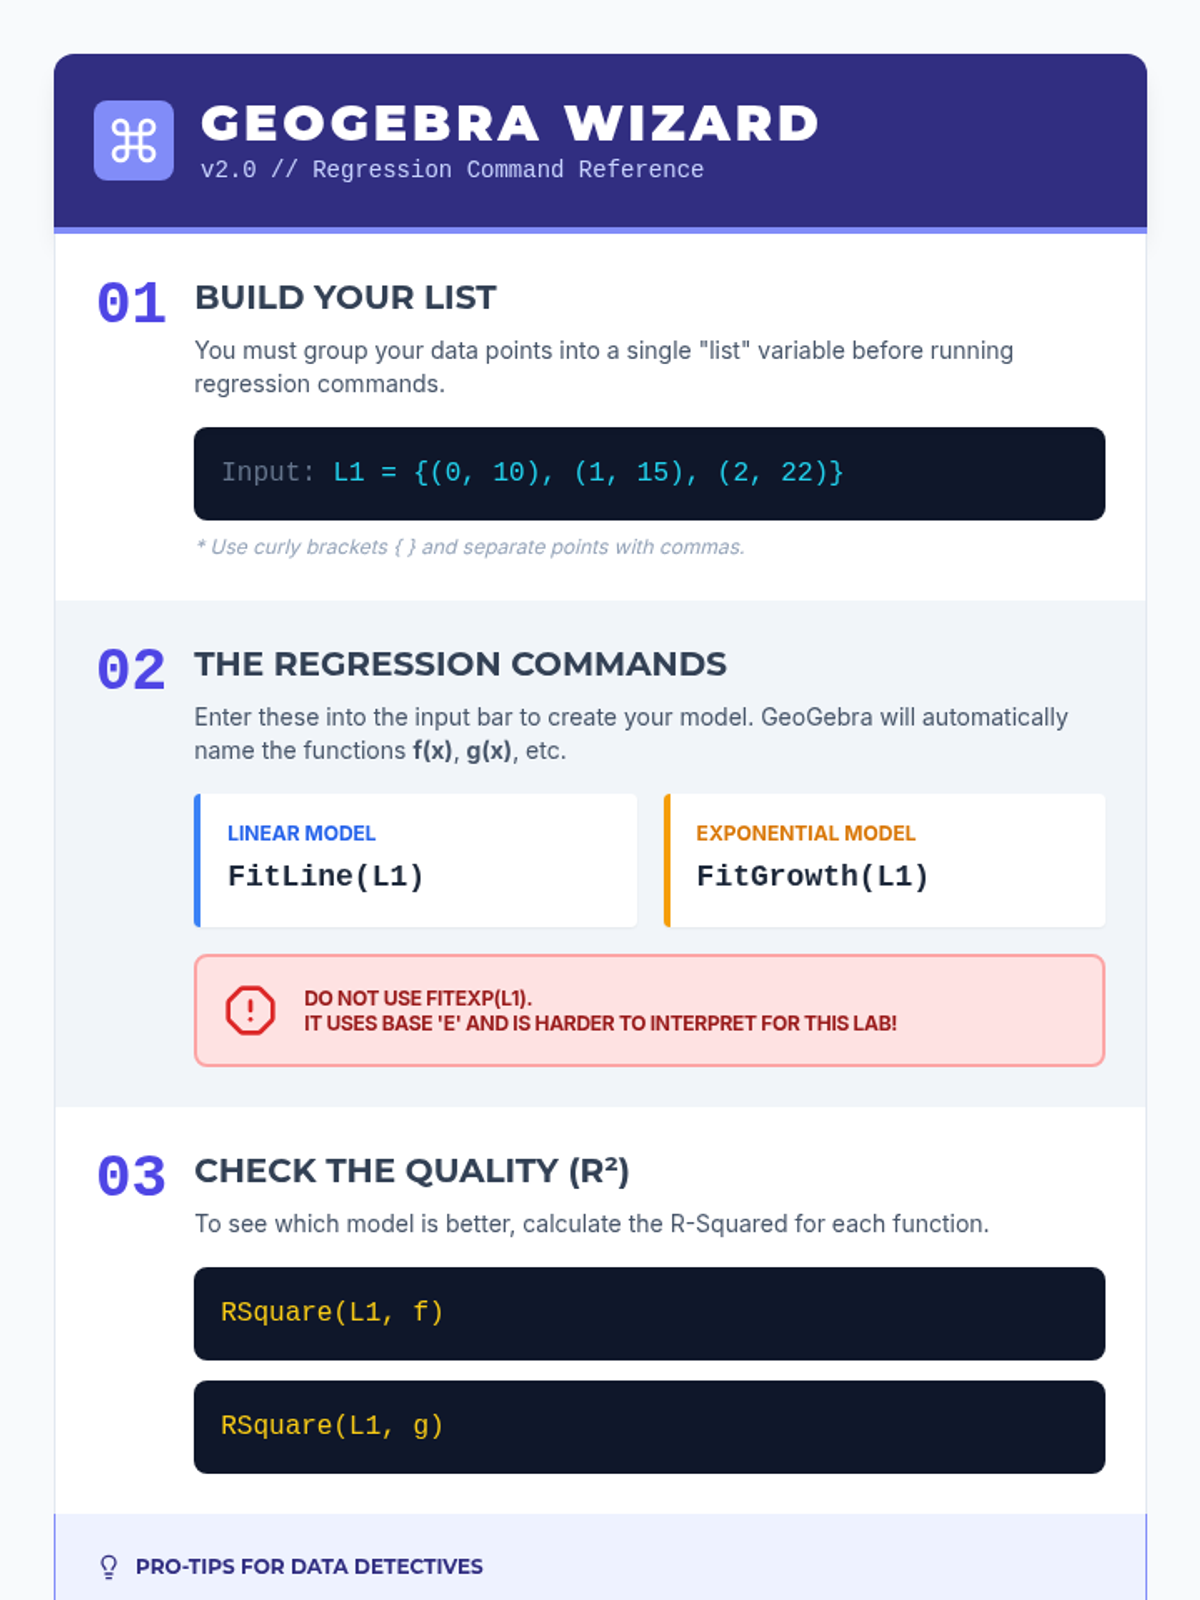
A technical "cheat sheet" for students using GeoGebra for regression, featuring step-by-step command syntax, critical warnings about exponential base choice, and R-squared calculation instructions.
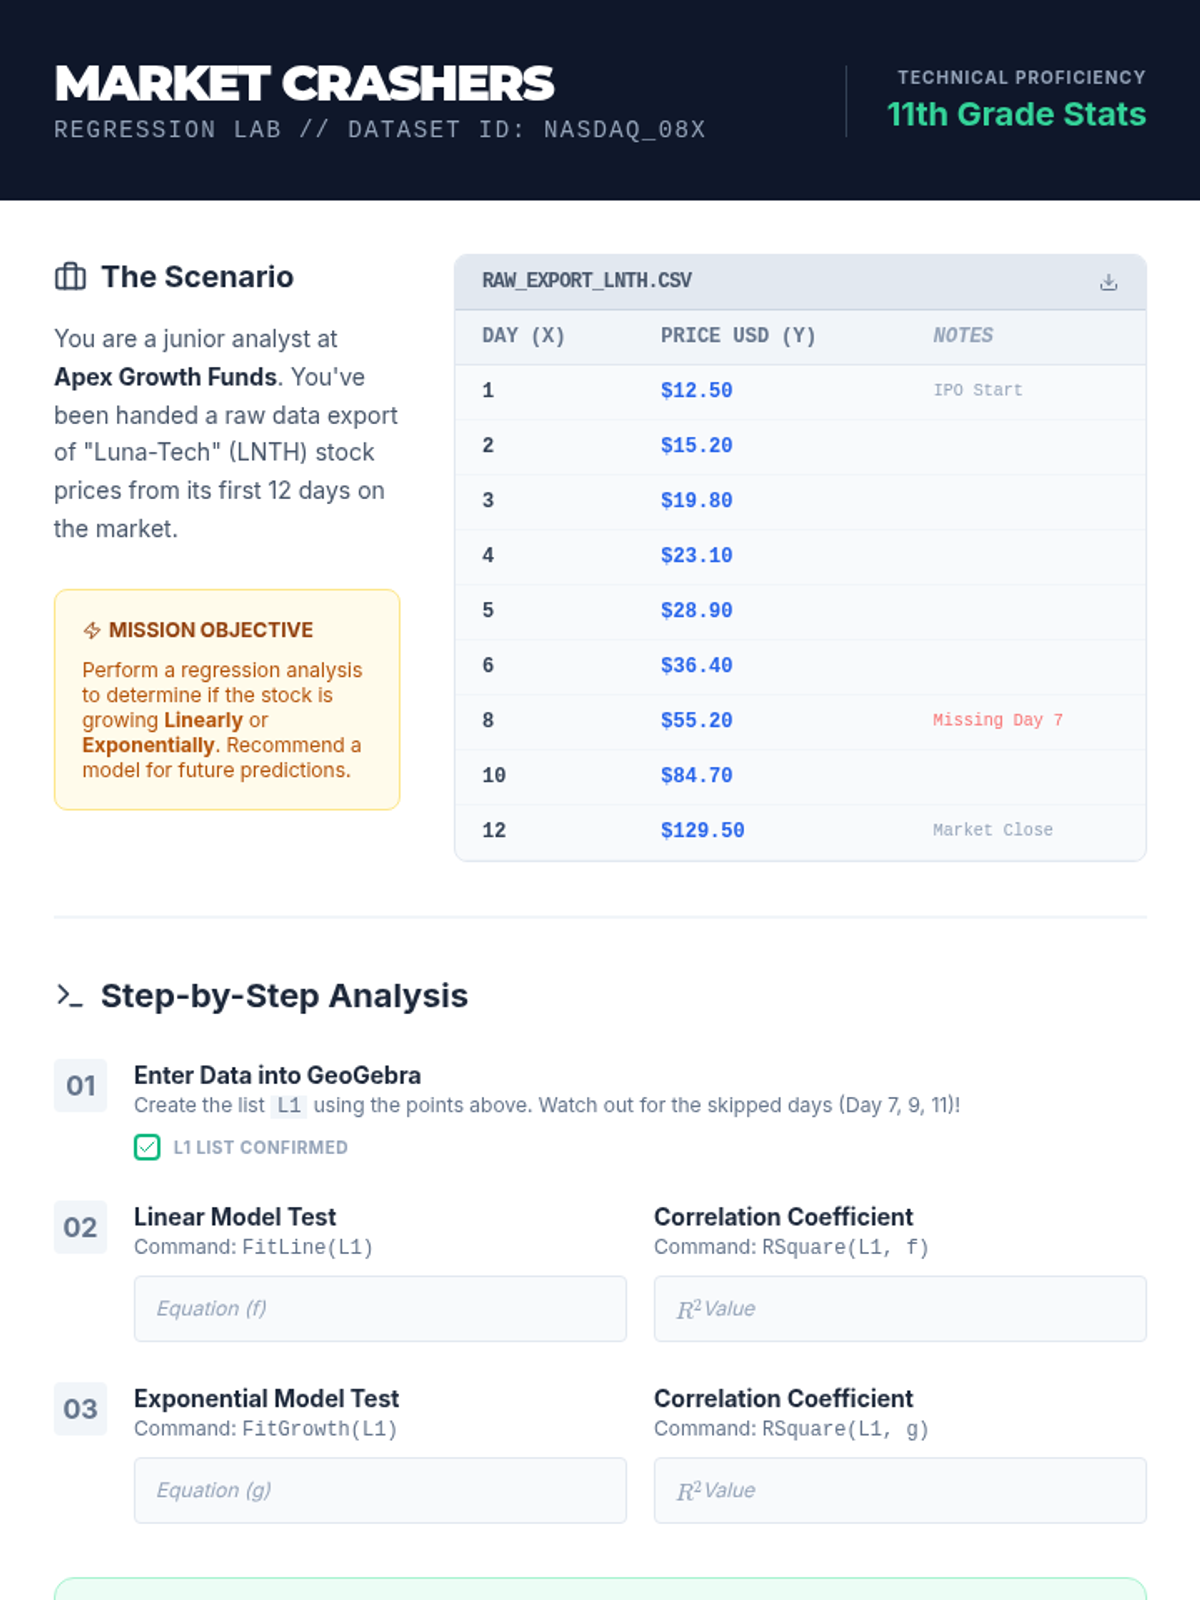
An independent practice worksheet where students analyze a simulated stock market dataset to perform regression analysis and compare linear vs. exponential models.
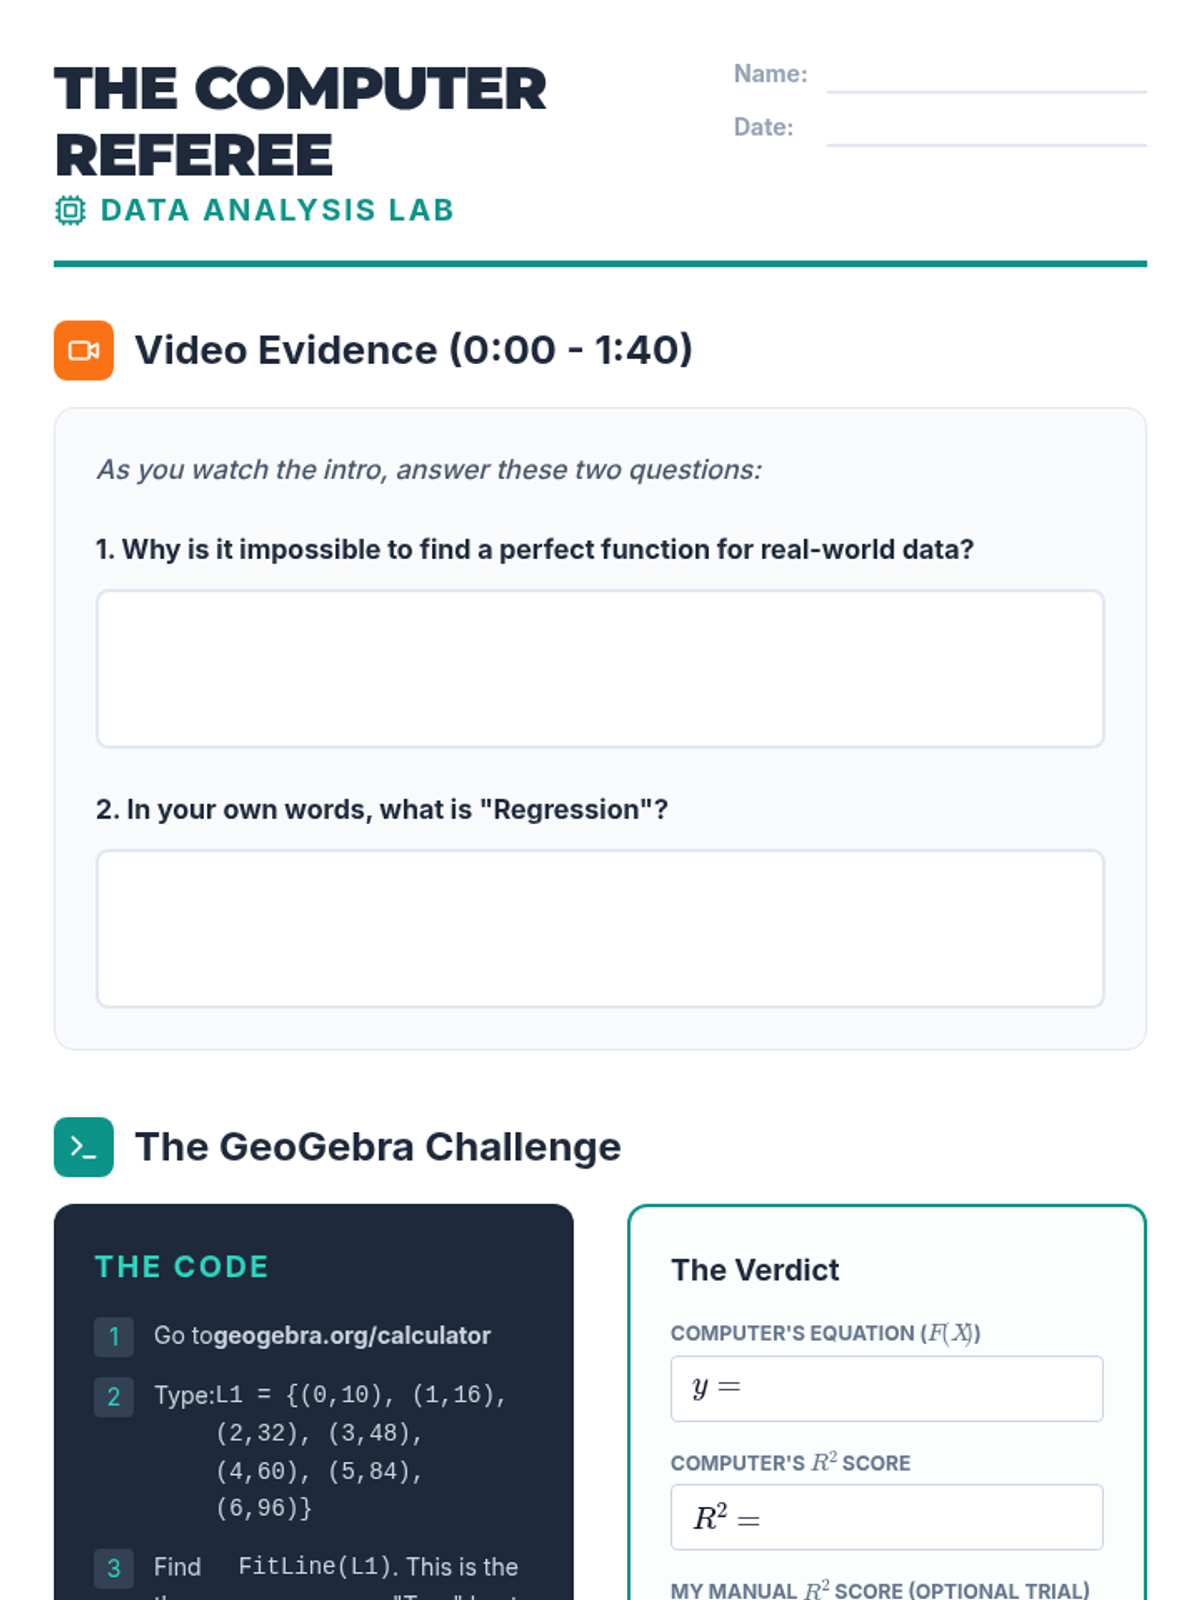
A comprehensive student worksheet for the regression lesson. Includes video viewing questions, step-by-step GeoGebra instructions, and reflection questions on model comparison and R-squared values.
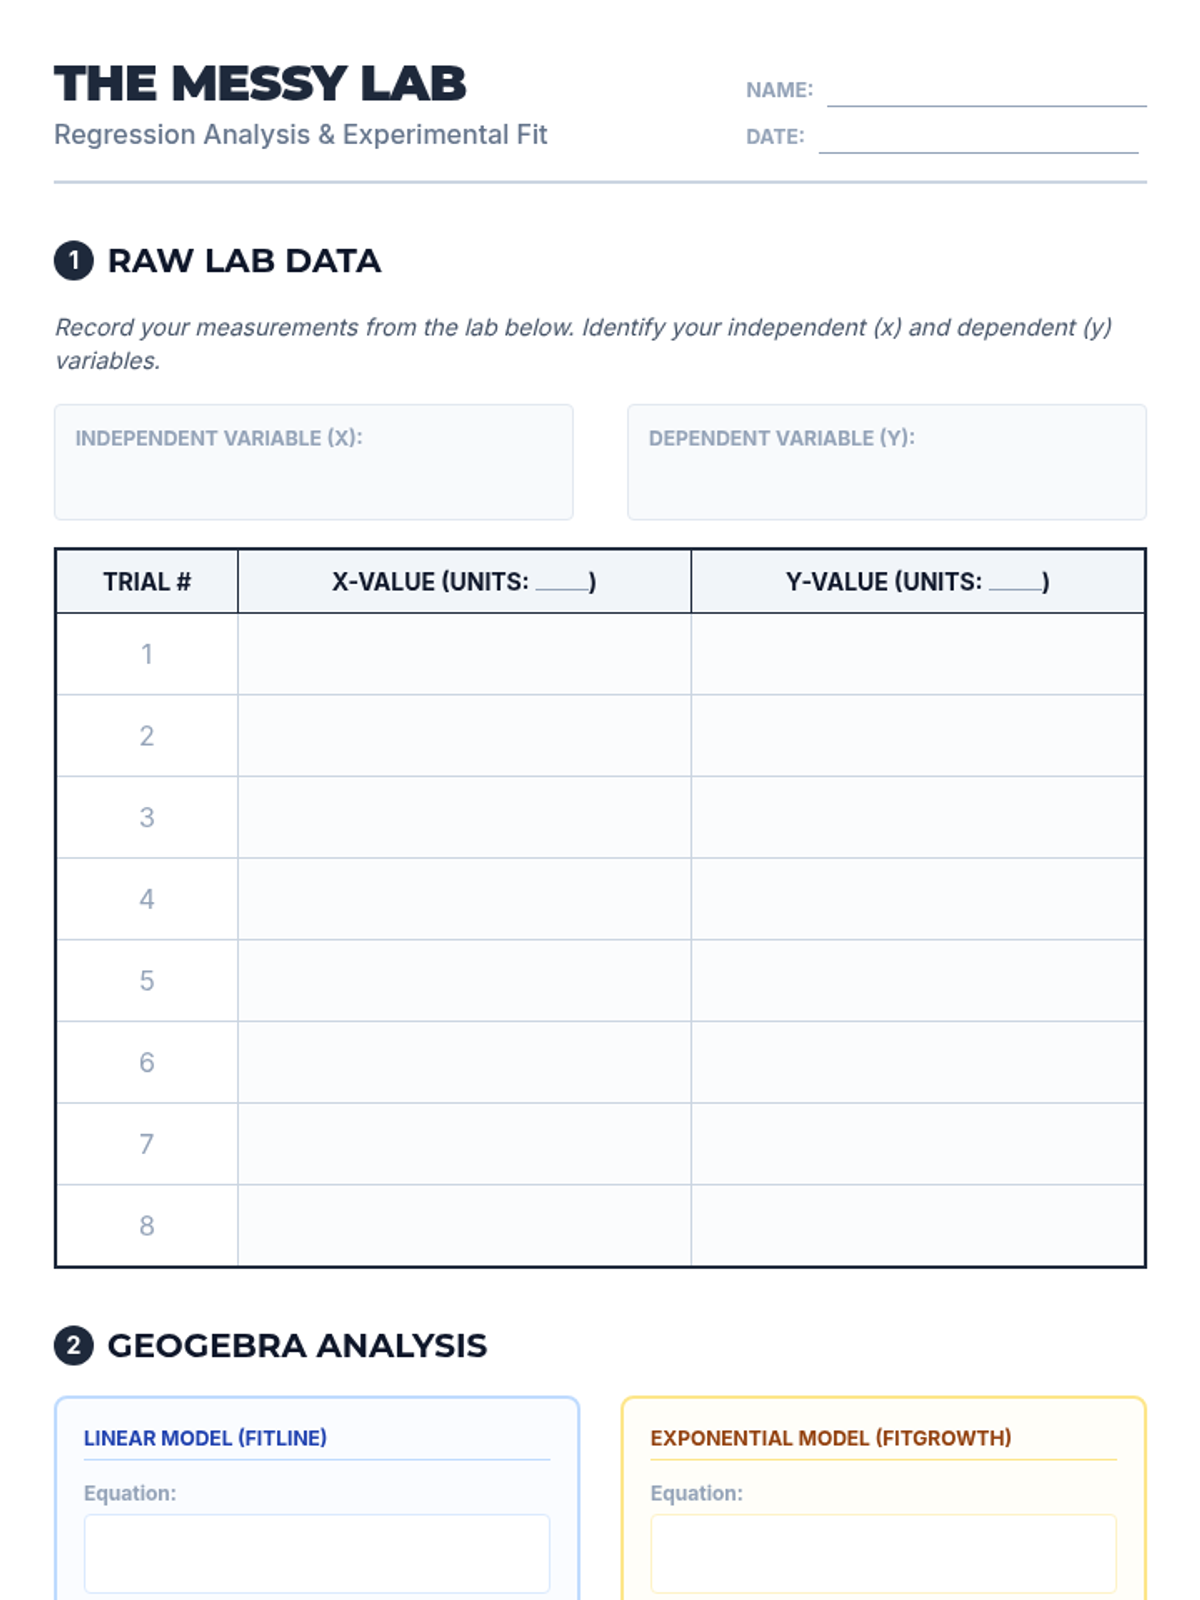
A student data sheet for recording lab measurements and documenting regression results from GeoGebra, including space for comparative analysis of linear and exponential models.
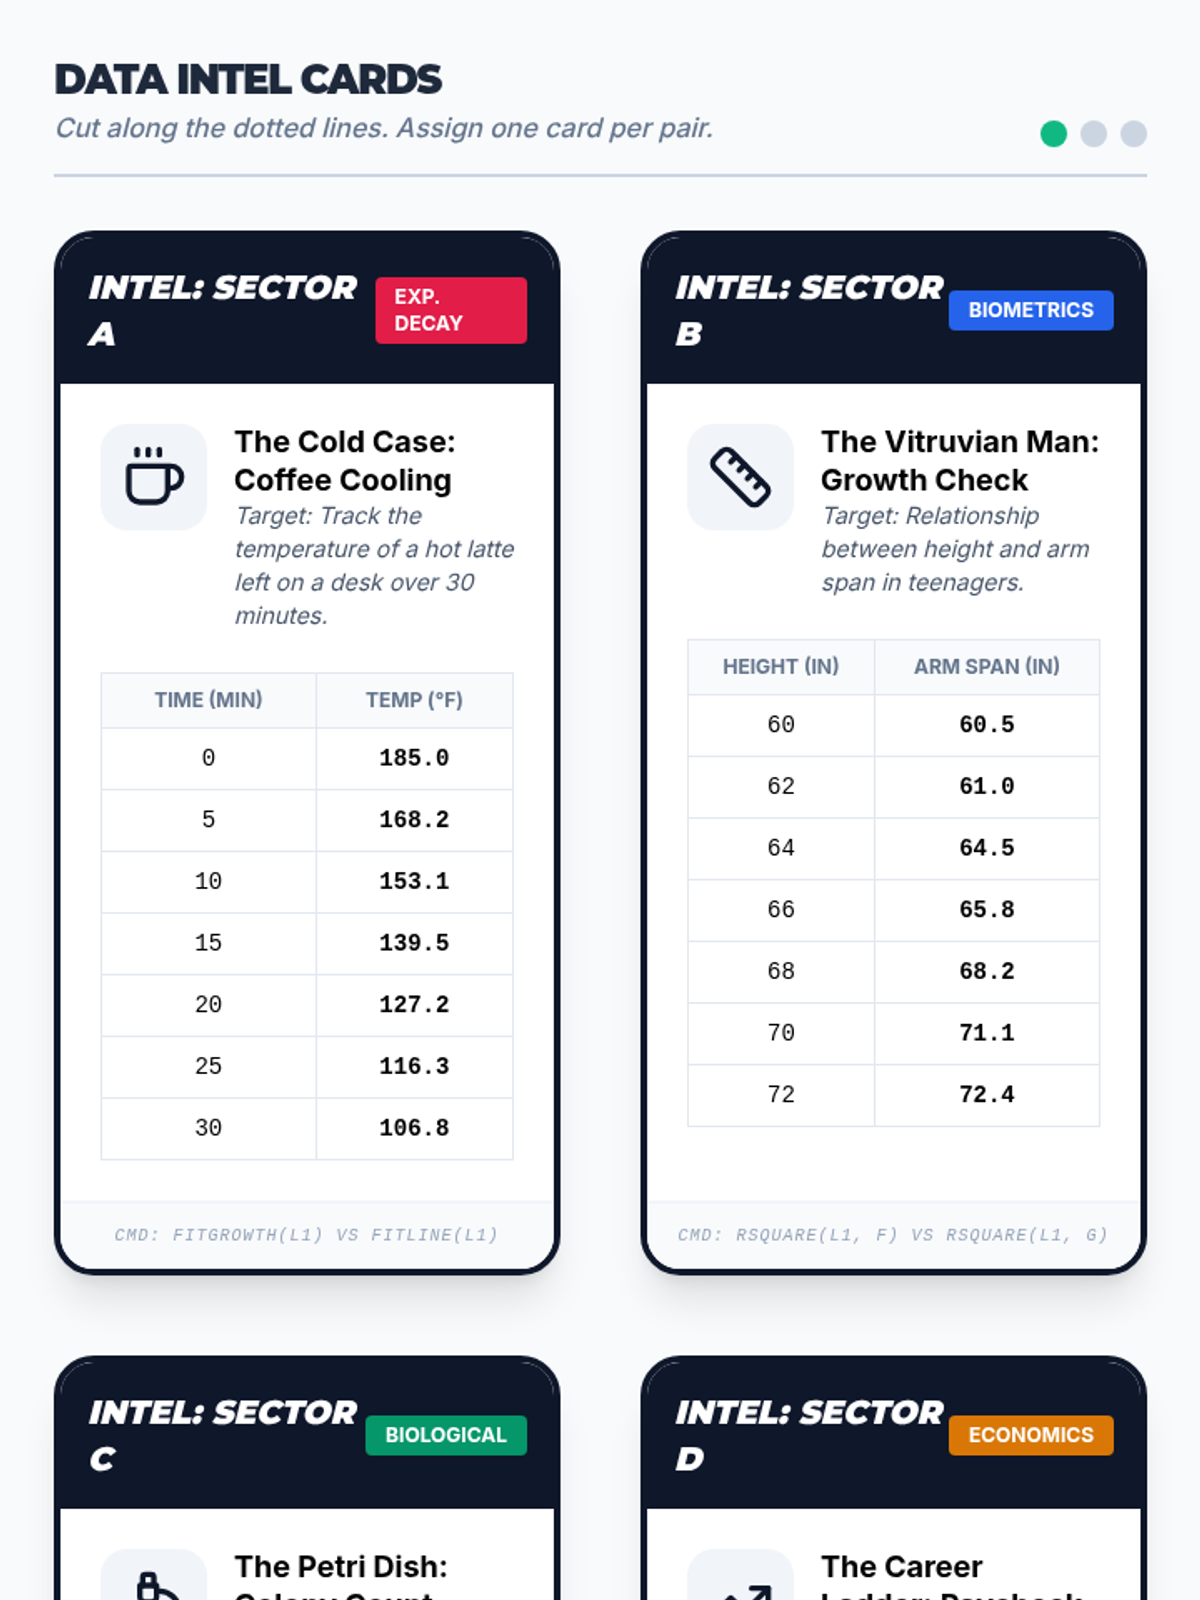
Four real-world data set cards for the Regression Battle activity. Includes scenarios like cooling coffee, biometrics, bacterial growth, and career salaries, designed as game-like 'Intelligence Cards'.
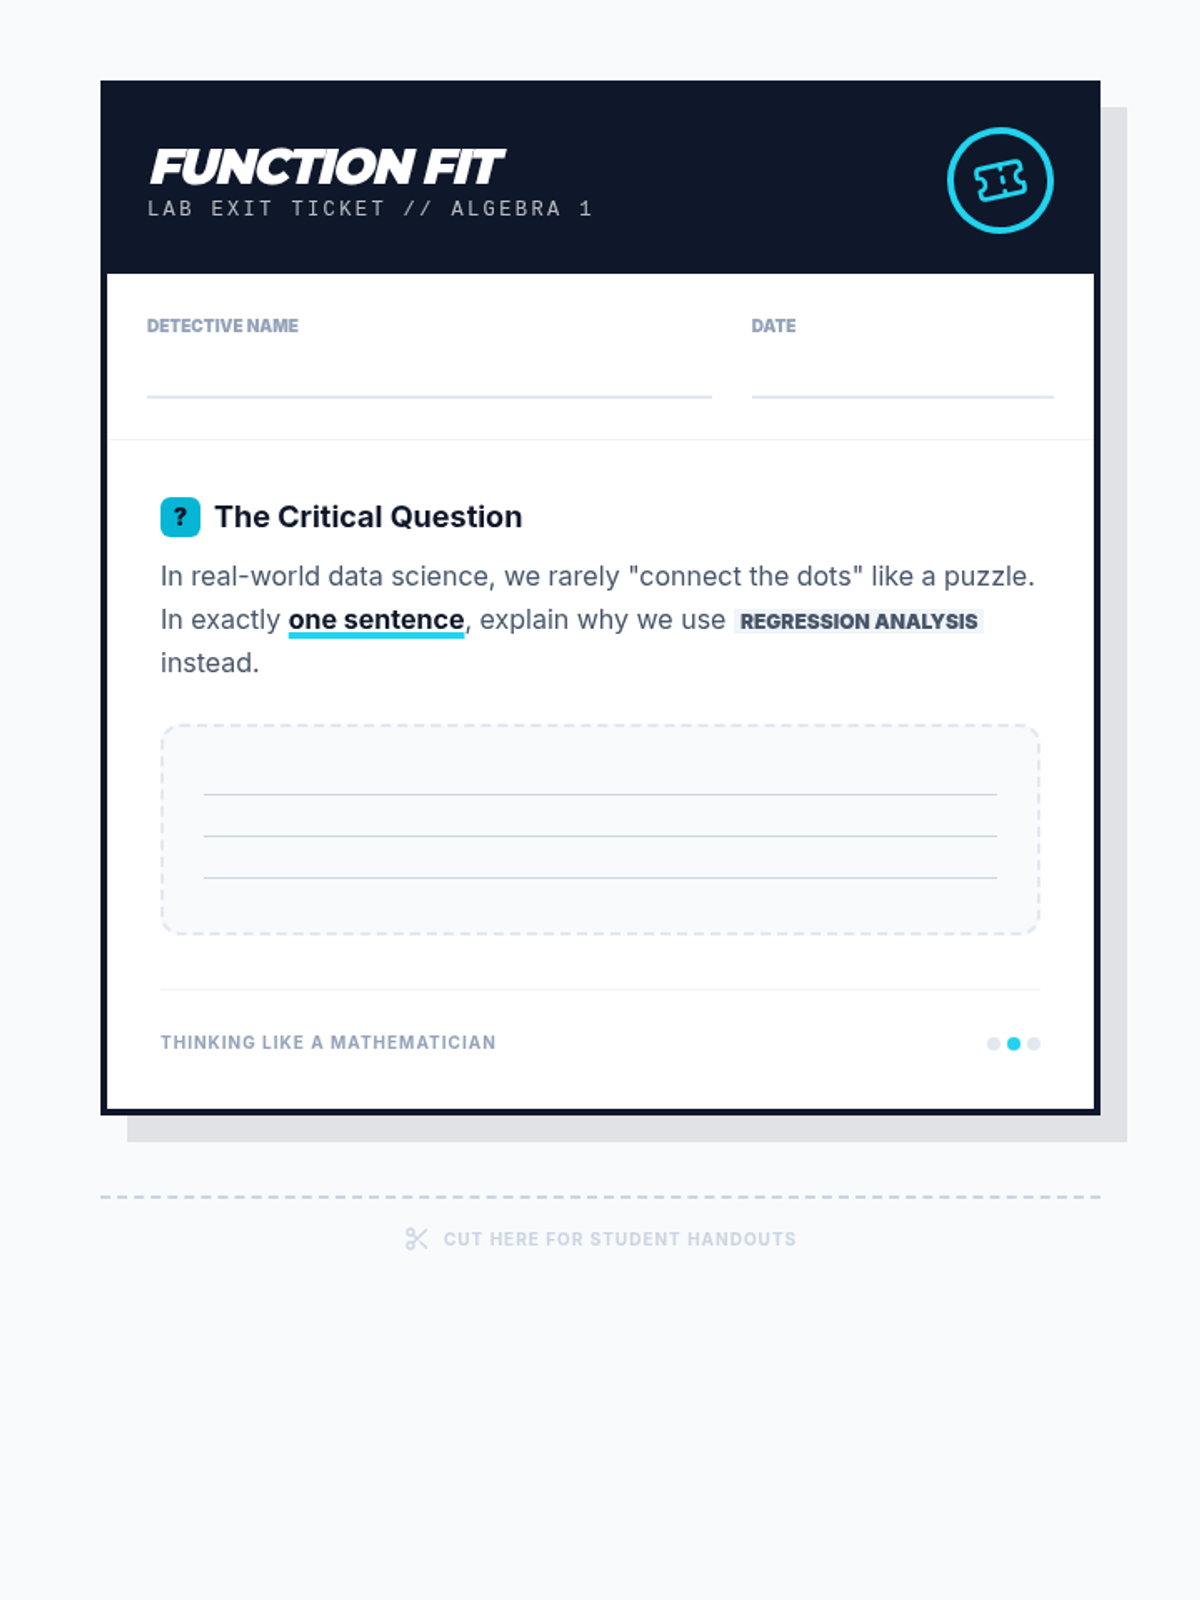
A concise exit ticket for the regression lesson, prompting students to write a single-sentence explanation of why regression analysis is used over simple point-to-point connection. Styled as a premium data lab slip.
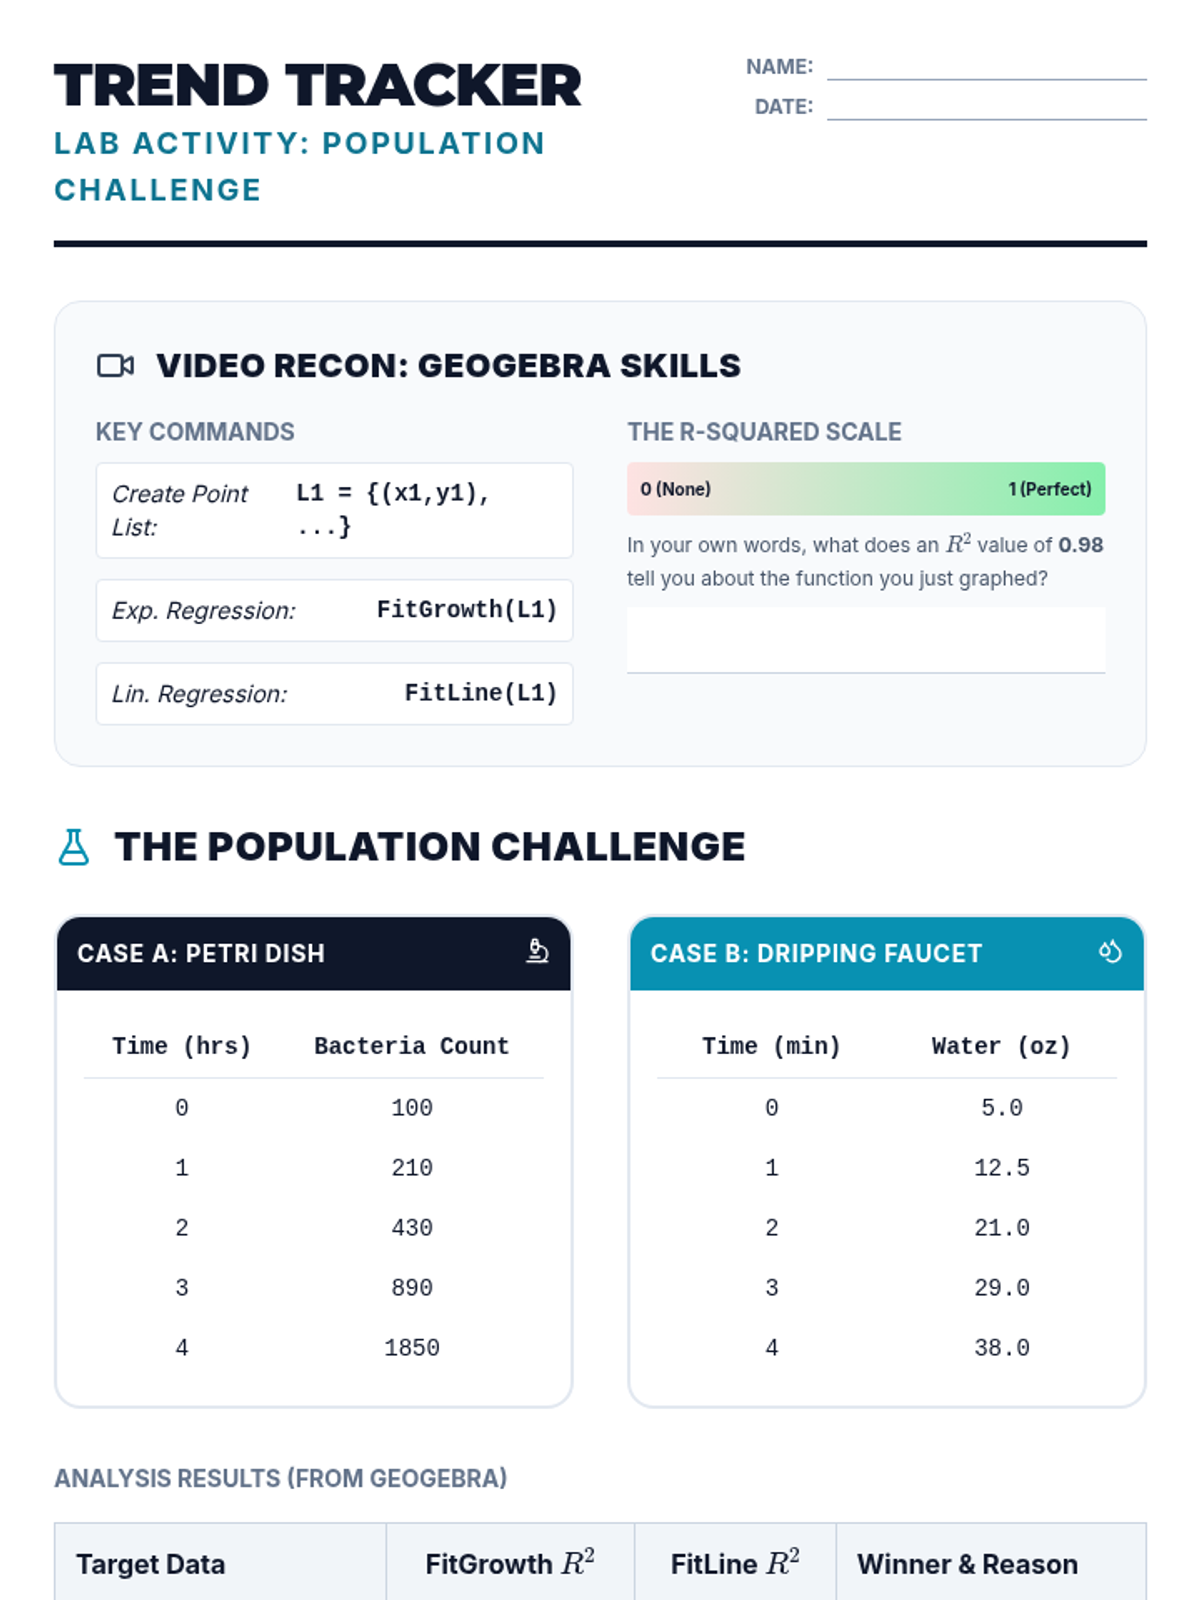
A lab worksheet for students to record GeoGebra regression results for two real-world scenarios: bacteria growth and a dripping faucet. Includes space for video notes, data tables, and an analysis of R-squared values to determine the best fit.
A slide deck to support the lesson on regression. Includes a video embed, key vocabulary (Regression, R-Squared), and a step-by-step guide for the GeoGebra activity.
A 7-slide presentation for introducing regression analysis in a lab setting, featuring embedded video focus, GeoGebra command guides, and discussion prompts on experimental error and R-squared.
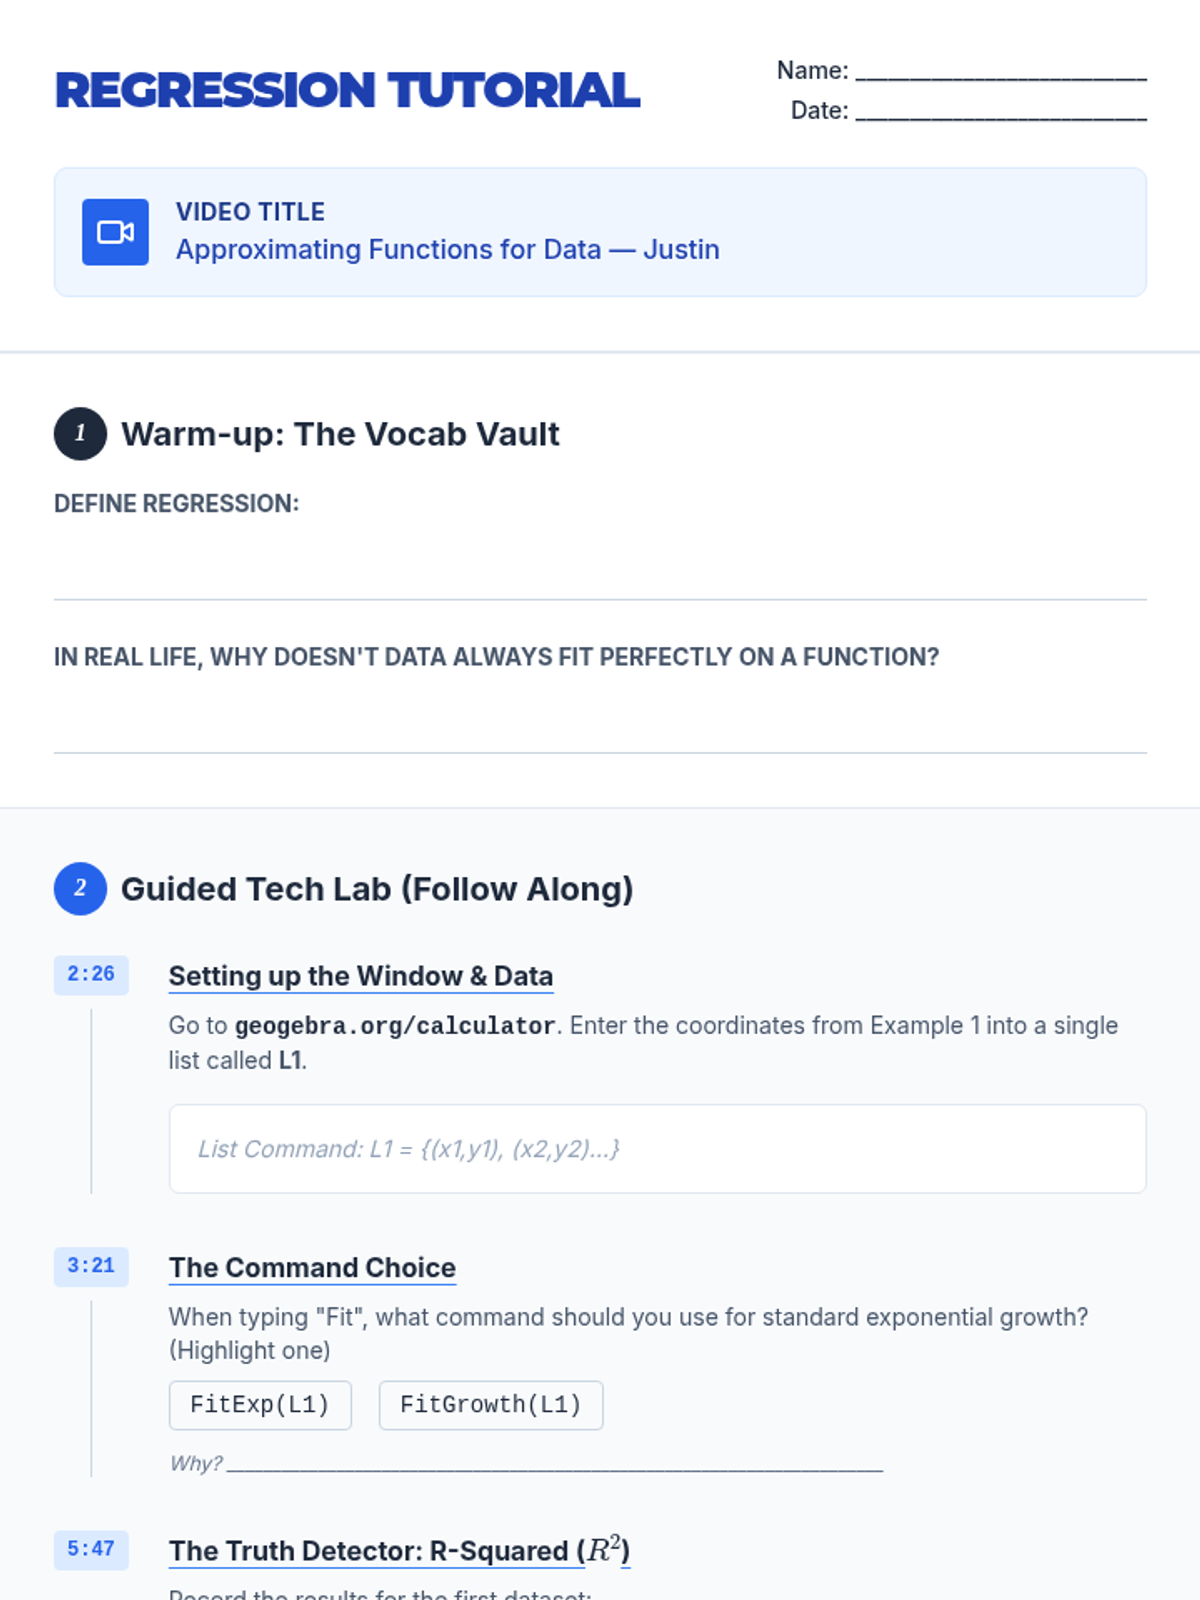
A student follow-along worksheet for the "Approximating Functions for Data" video, including timestamped checkpoints and spaces for data entry and model recording.
A comprehensive slide deck for 9th Grade Algebra covering linear and exponential regression. Includes a warm-up, an embedded GeoGebra tutorial video, lab instructions, and discussion prompts.