A comprehensive lesson on translating between tables, graphs, and verbal descriptions to construct linear equations in slope-intercept form. Students act as 'Equation Architects' to build mathematical models of real-world scenarios.
A comprehensive summer bridge workbook for rising 8th graders transitioning to Algebra 1. Contains review of prerequisite topics, advanced pre-algebra skills, real-world application, and an Algebra Escape Challenge.
Create a lesson for the clueless word fill-in crossword puzzle.
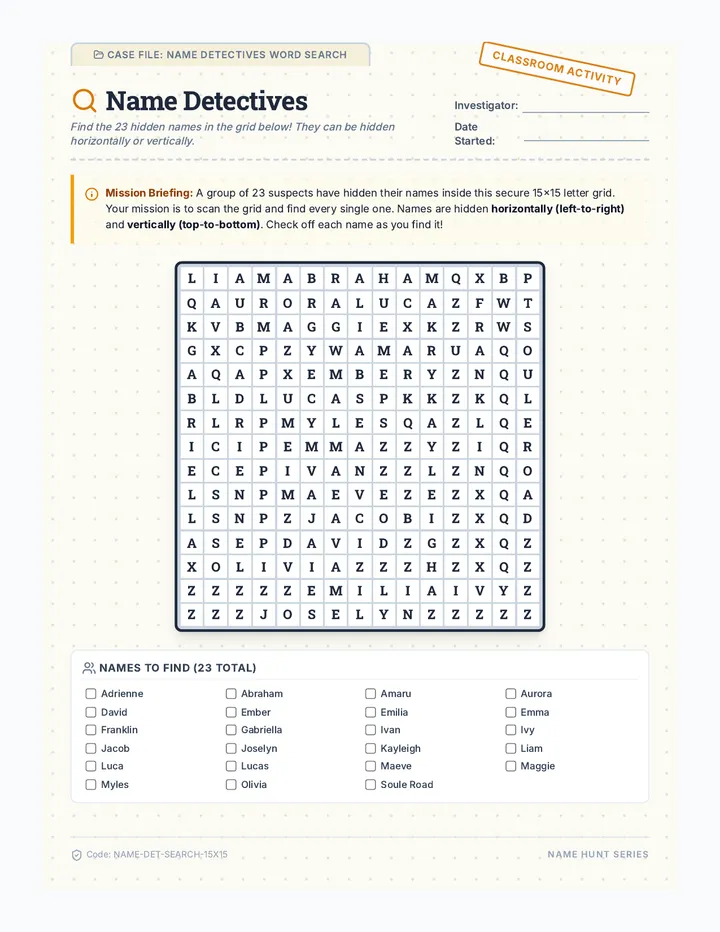
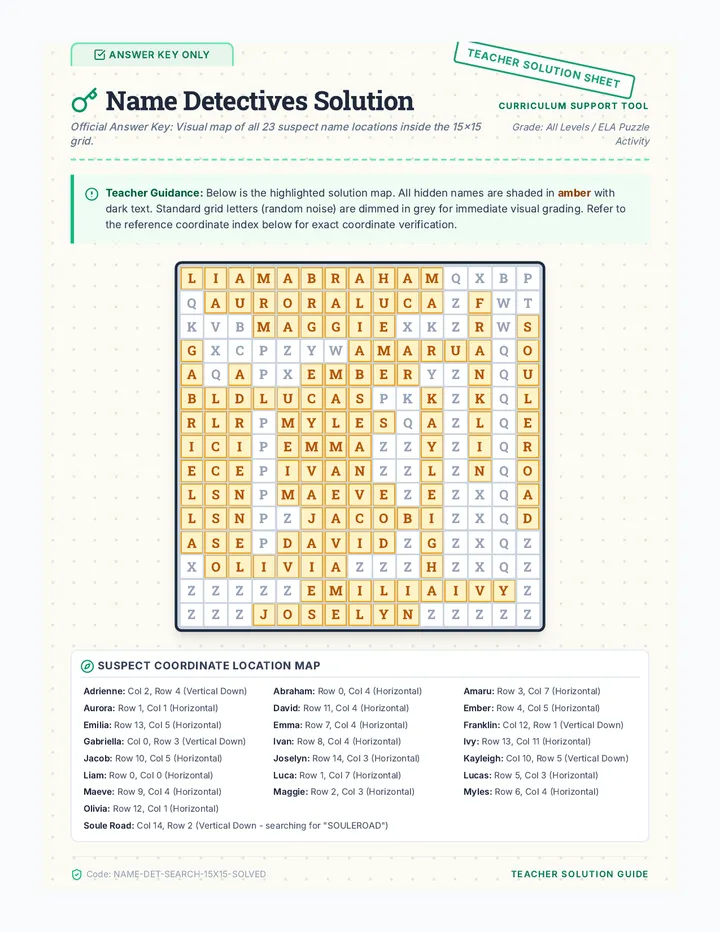
A detective-themed name word search puzzle where students find 23 names hidden in a 15x15 grid of letters. No clues are provided, offering an engaging brain-teaser challenge.
A high-intensity, 120-minute math simulation. Students act as lead consultants, completing a high-speed skill warmup before selecting a professional sector (Music, Urban Planning, Rocket Science, or Sports Analytics) to solve a series of complex work orders.
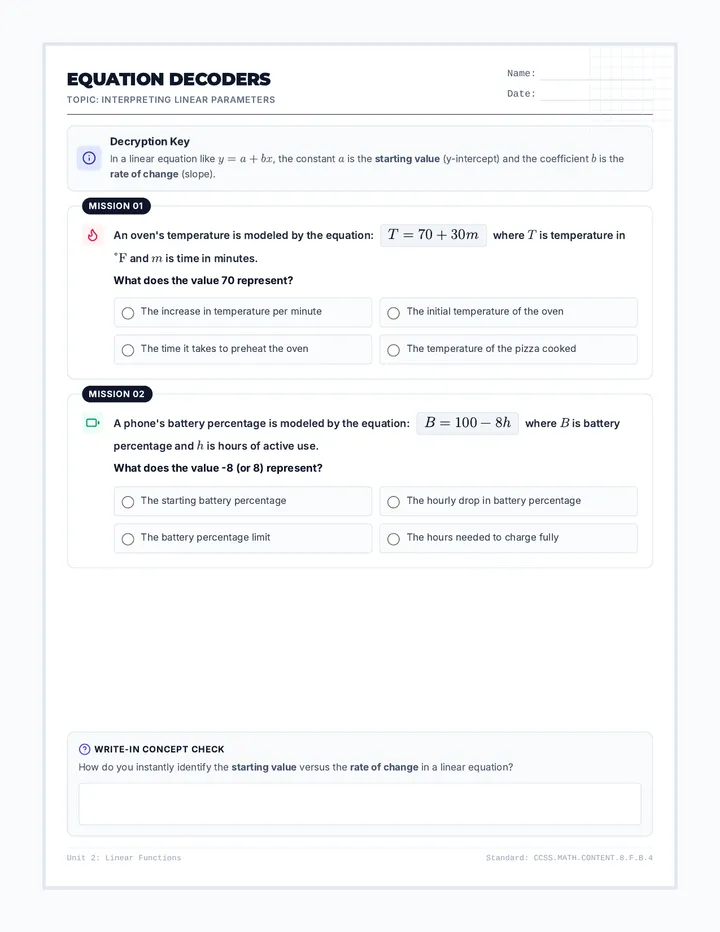
A lesson focused on breaking down linear equations to interpret rates of change and initial values in simplified, direct contexts.
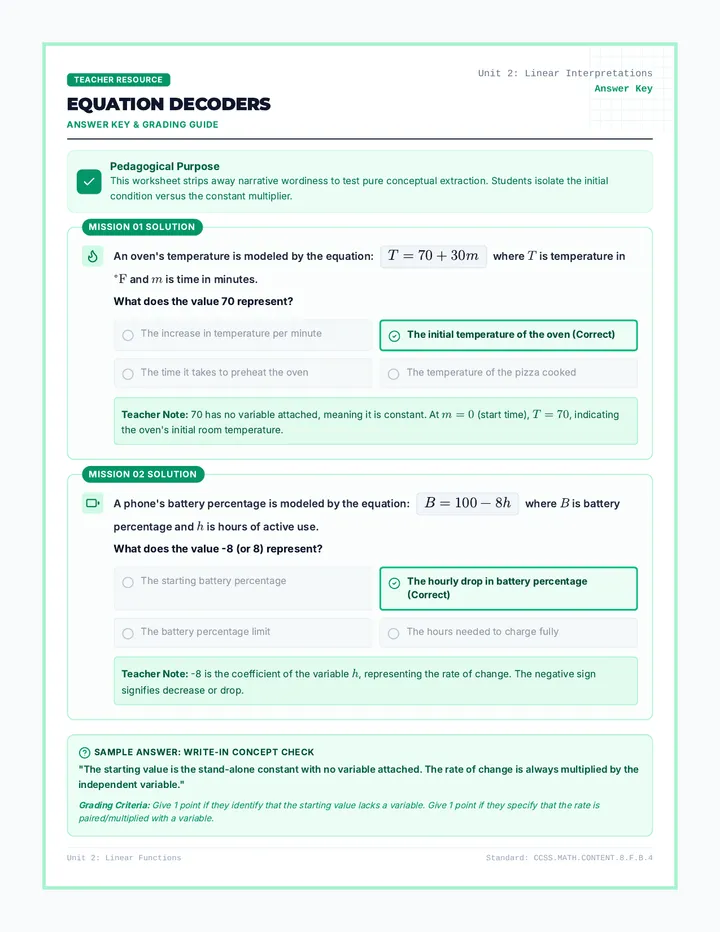
The official answer key for the Equation Decoders worksheet, containing solutions, pedagogical tips, and student explanation cues.
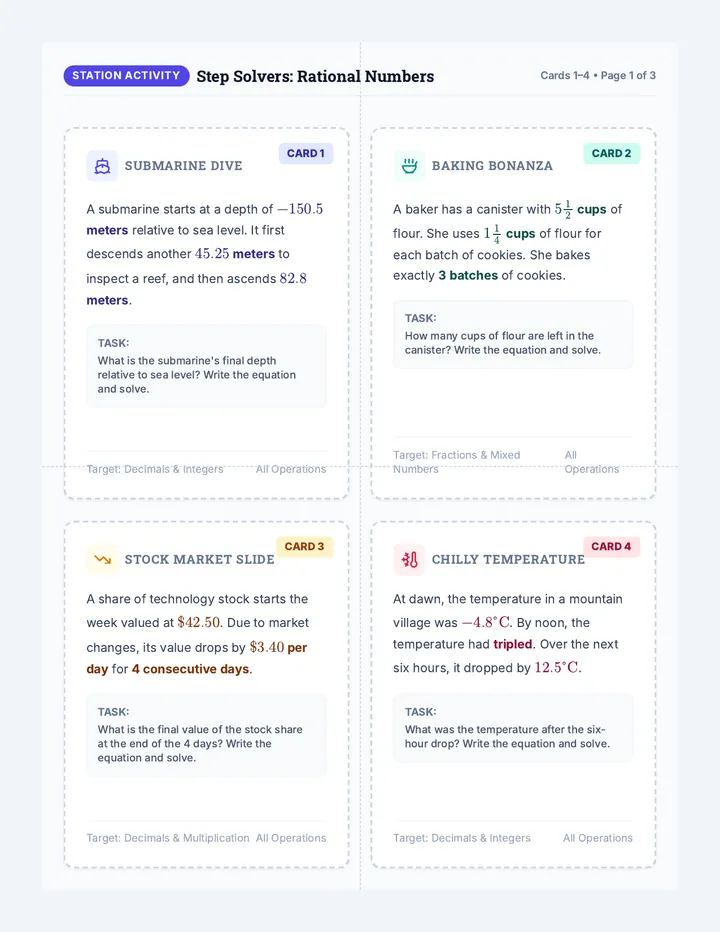
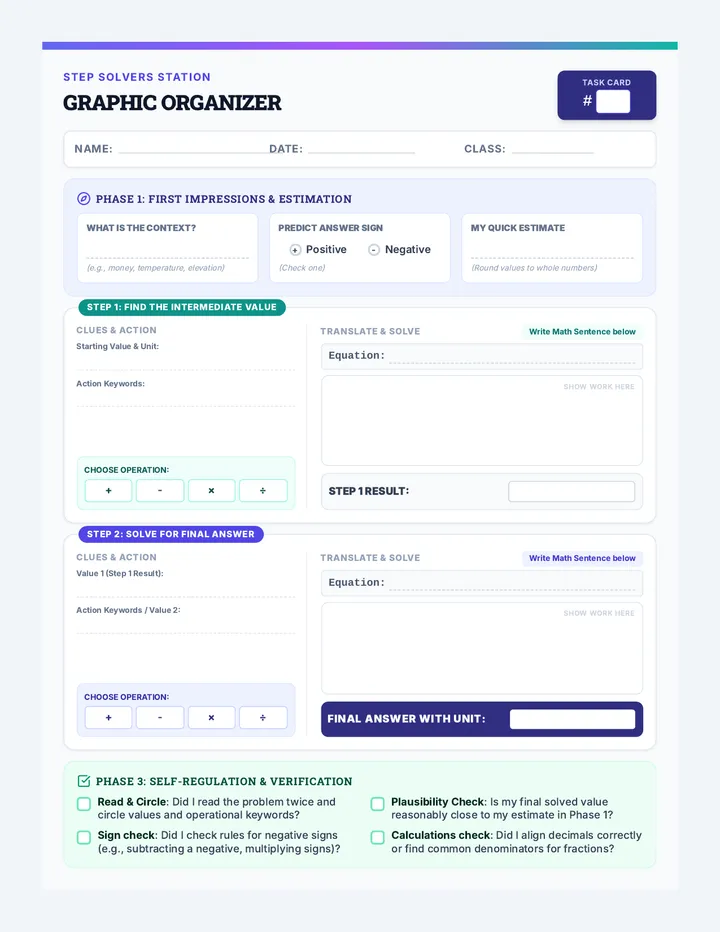
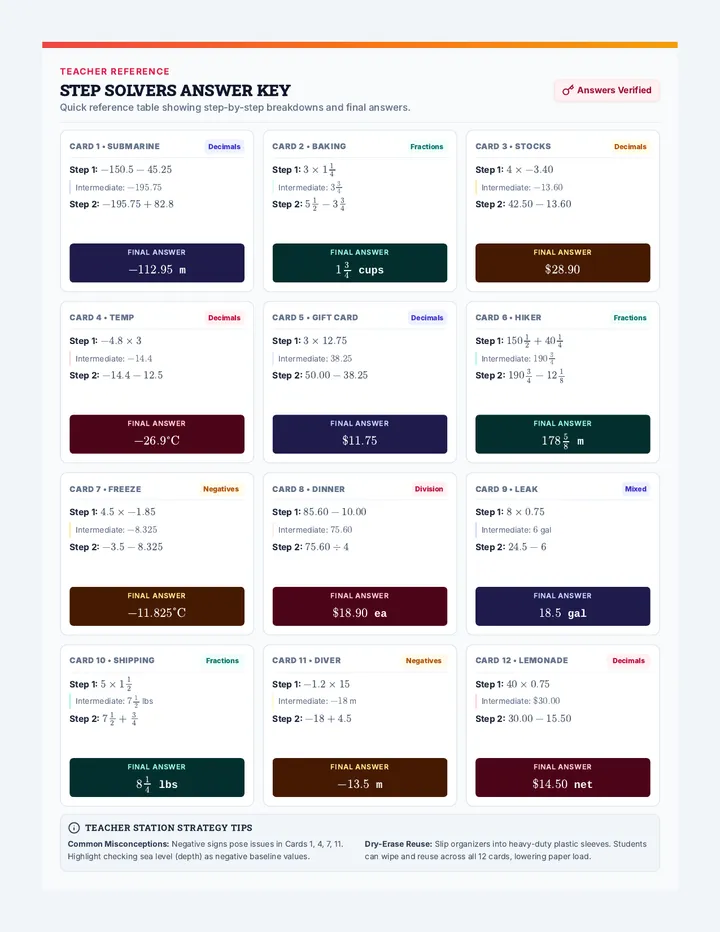
A targeted task card station activity focused on decomposing and solving two-step real-world problems with rational numbers. Students use a structured graphic organizer that scaffolds word-to-equation translation and incorporates self-regulation checklists.
A clean, streamlined student worksheet focused on interpreting components of linear equations with minimal word count and high visual structure.
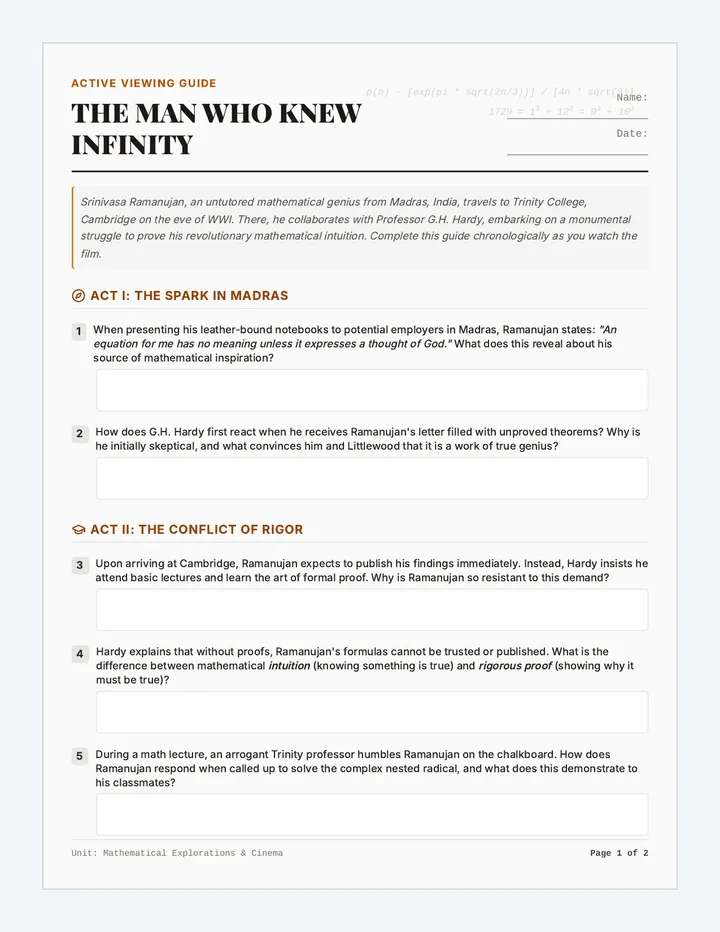
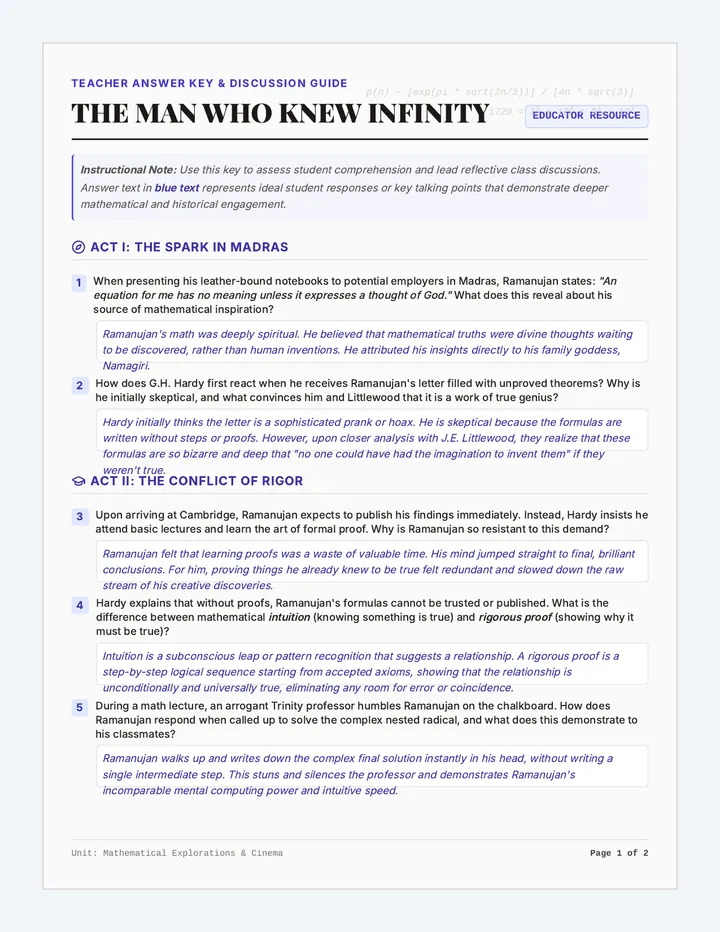
A cinematic and mathematical exploration of the life of Srinivasa Ramanujan through the film "The Man Who Knew Infinity." Students engage in active viewing and explore key mathematical concepts such as integer partitions, Hardy-Ramanujan taxicab numbers, and the philosophical debate between mathematical intuition and formal proof.
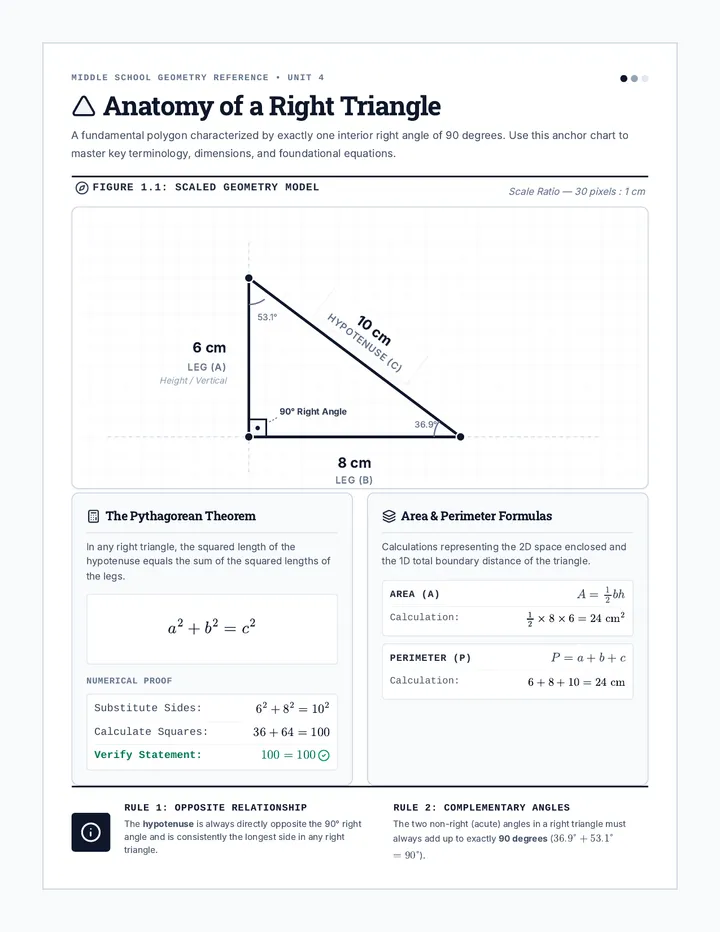
An introductory lesson exploring the properties, parts, and key formulas of right triangles for middle school students.
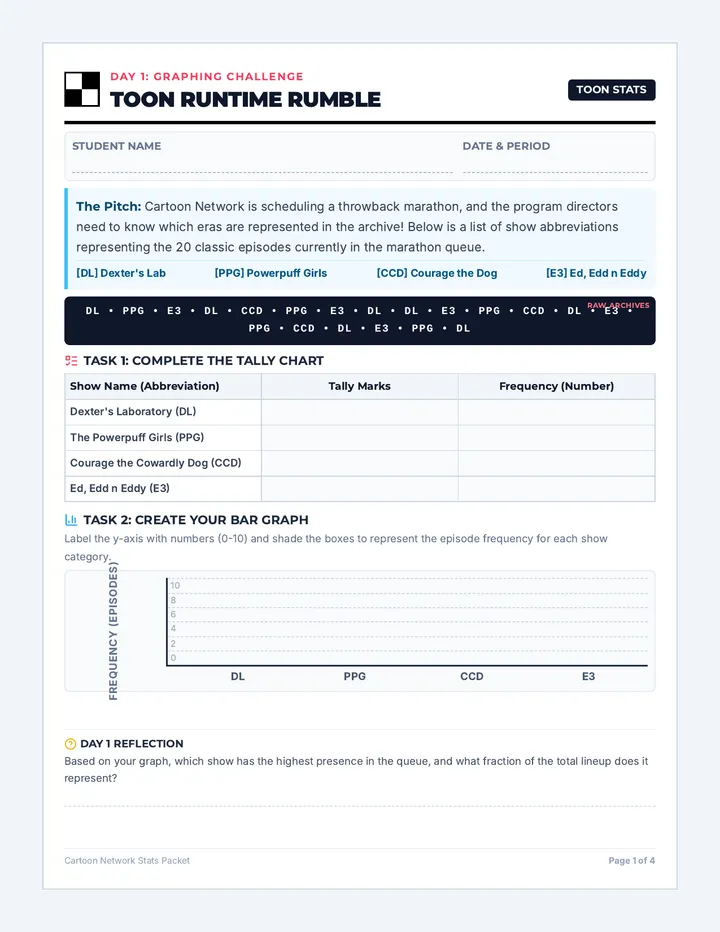
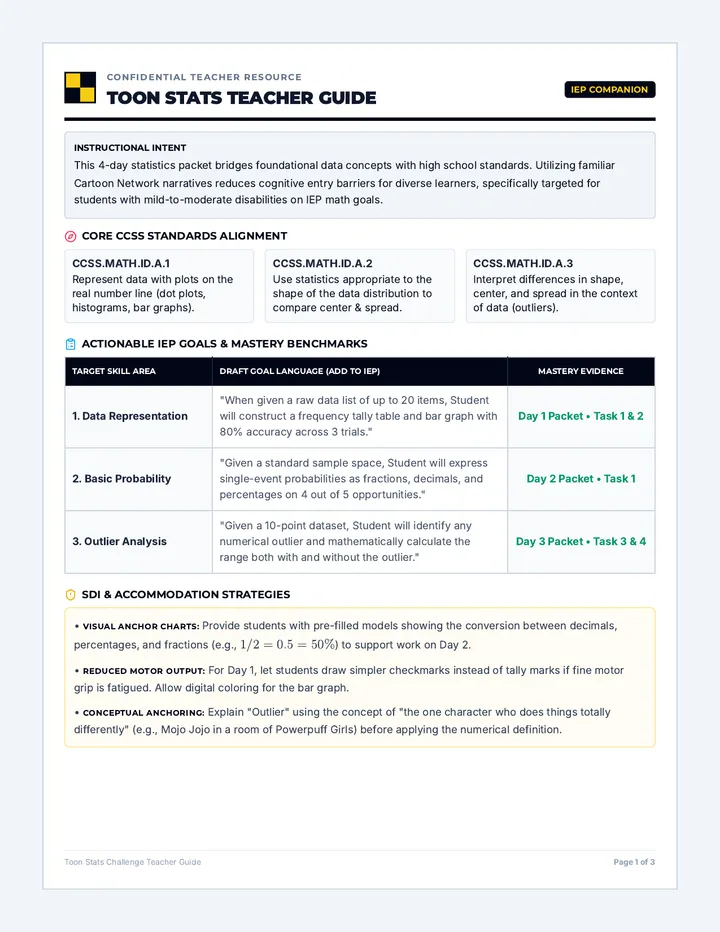
A four-day statistics packet using Cartoon Network shows to teach tallying, graphing, probability, range, and outliers, complete with a comprehensive teacher guide for IEP tracking.
A practical vocational math lesson where students learn to calculate daily earnings by multiplying hours worked by hourly wages. Designed with real-world job-card contexts and supported by structured visual skip-counting.