Develops proficiency in estimating and measuring length, area, volume, and mass using standard units and unit conversions. Integrates time, money, angle measurement, and data classification through counting and arithmetic applications.
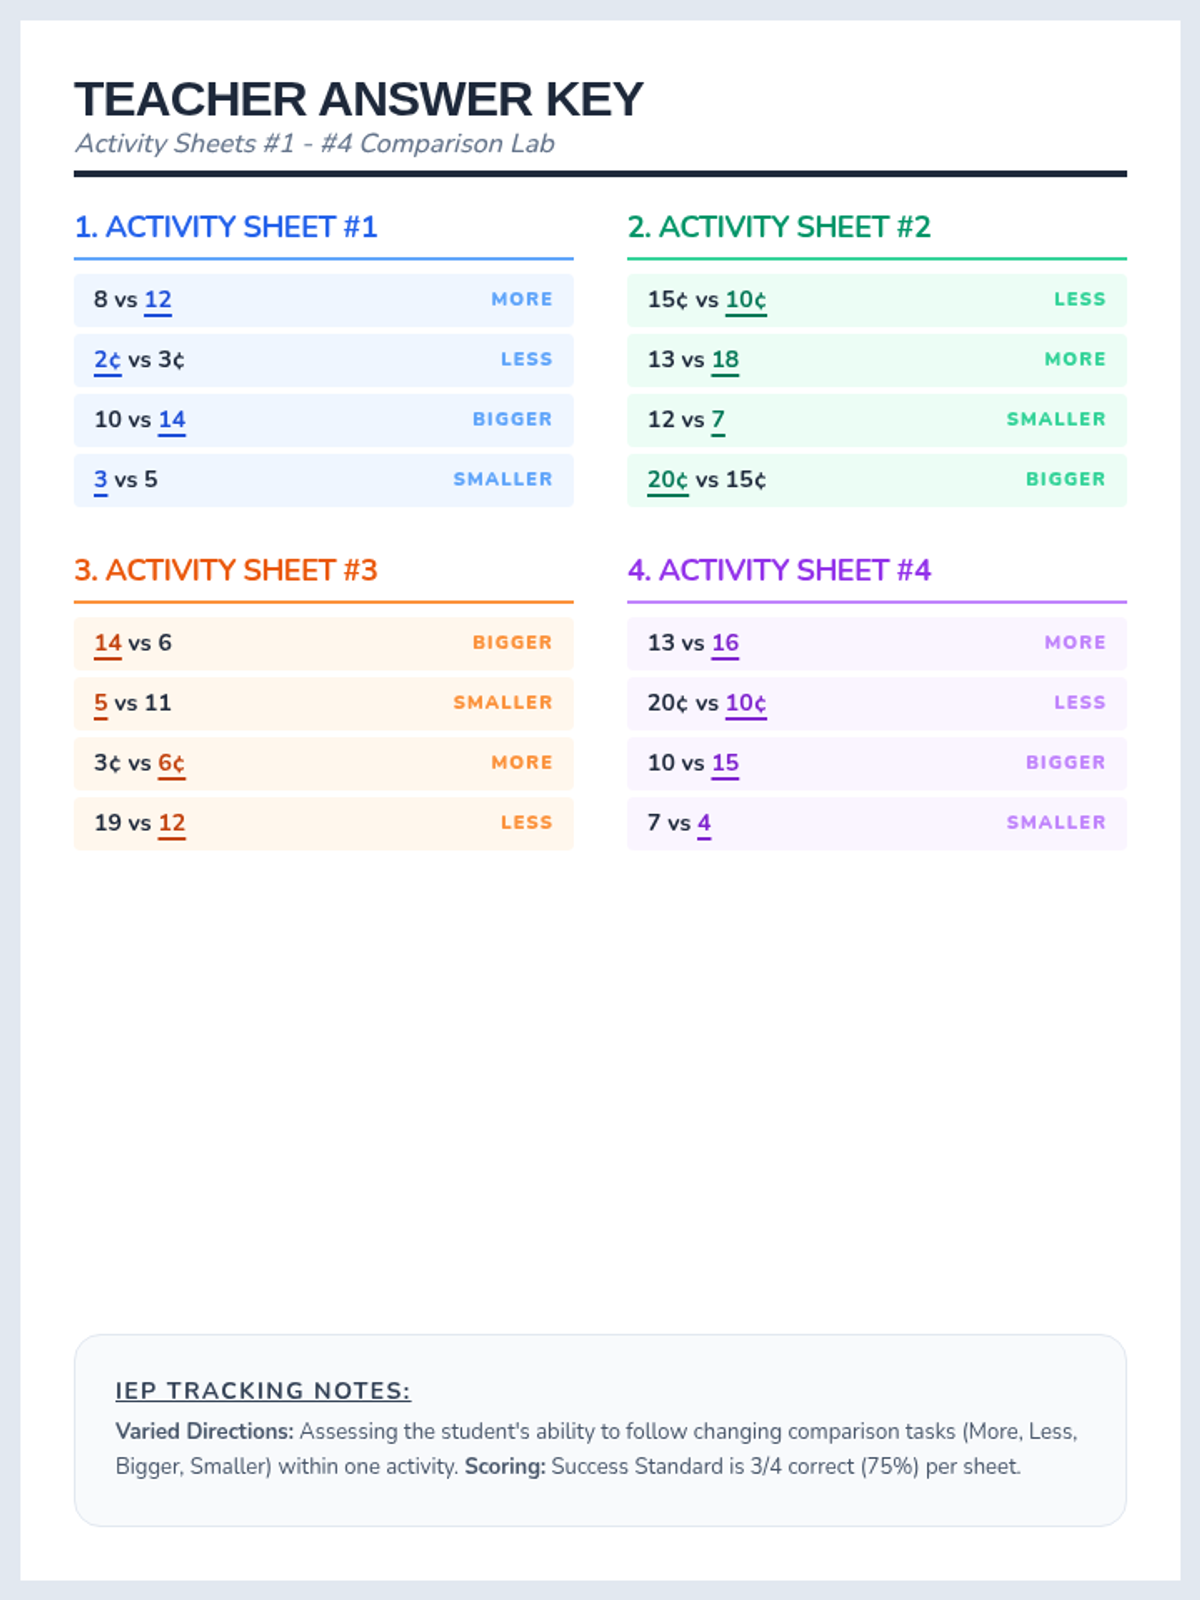
A teacher answer key for the revised Comparison Lab series, now reflecting the varied instructions for each question.
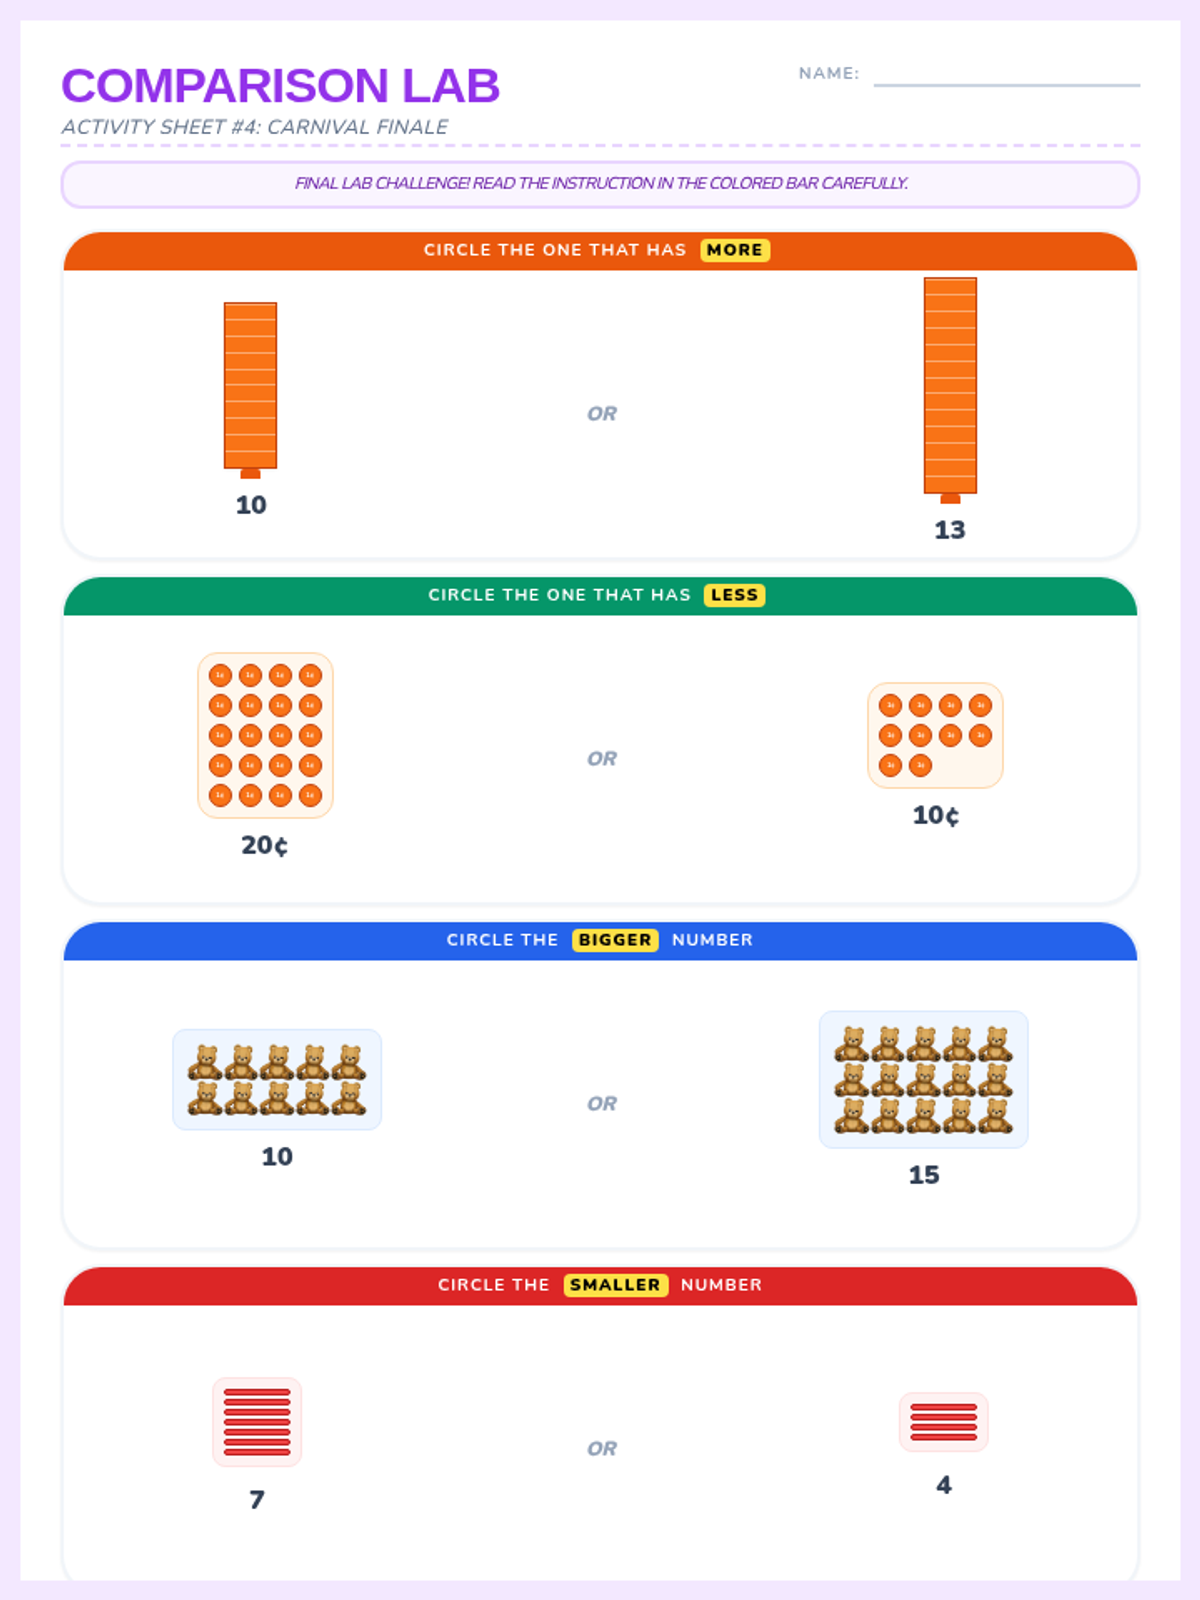
Activity Sheet #4: A mixed practice worksheet featuring bears, coins, and cubes with varied instructions and structured layouts.
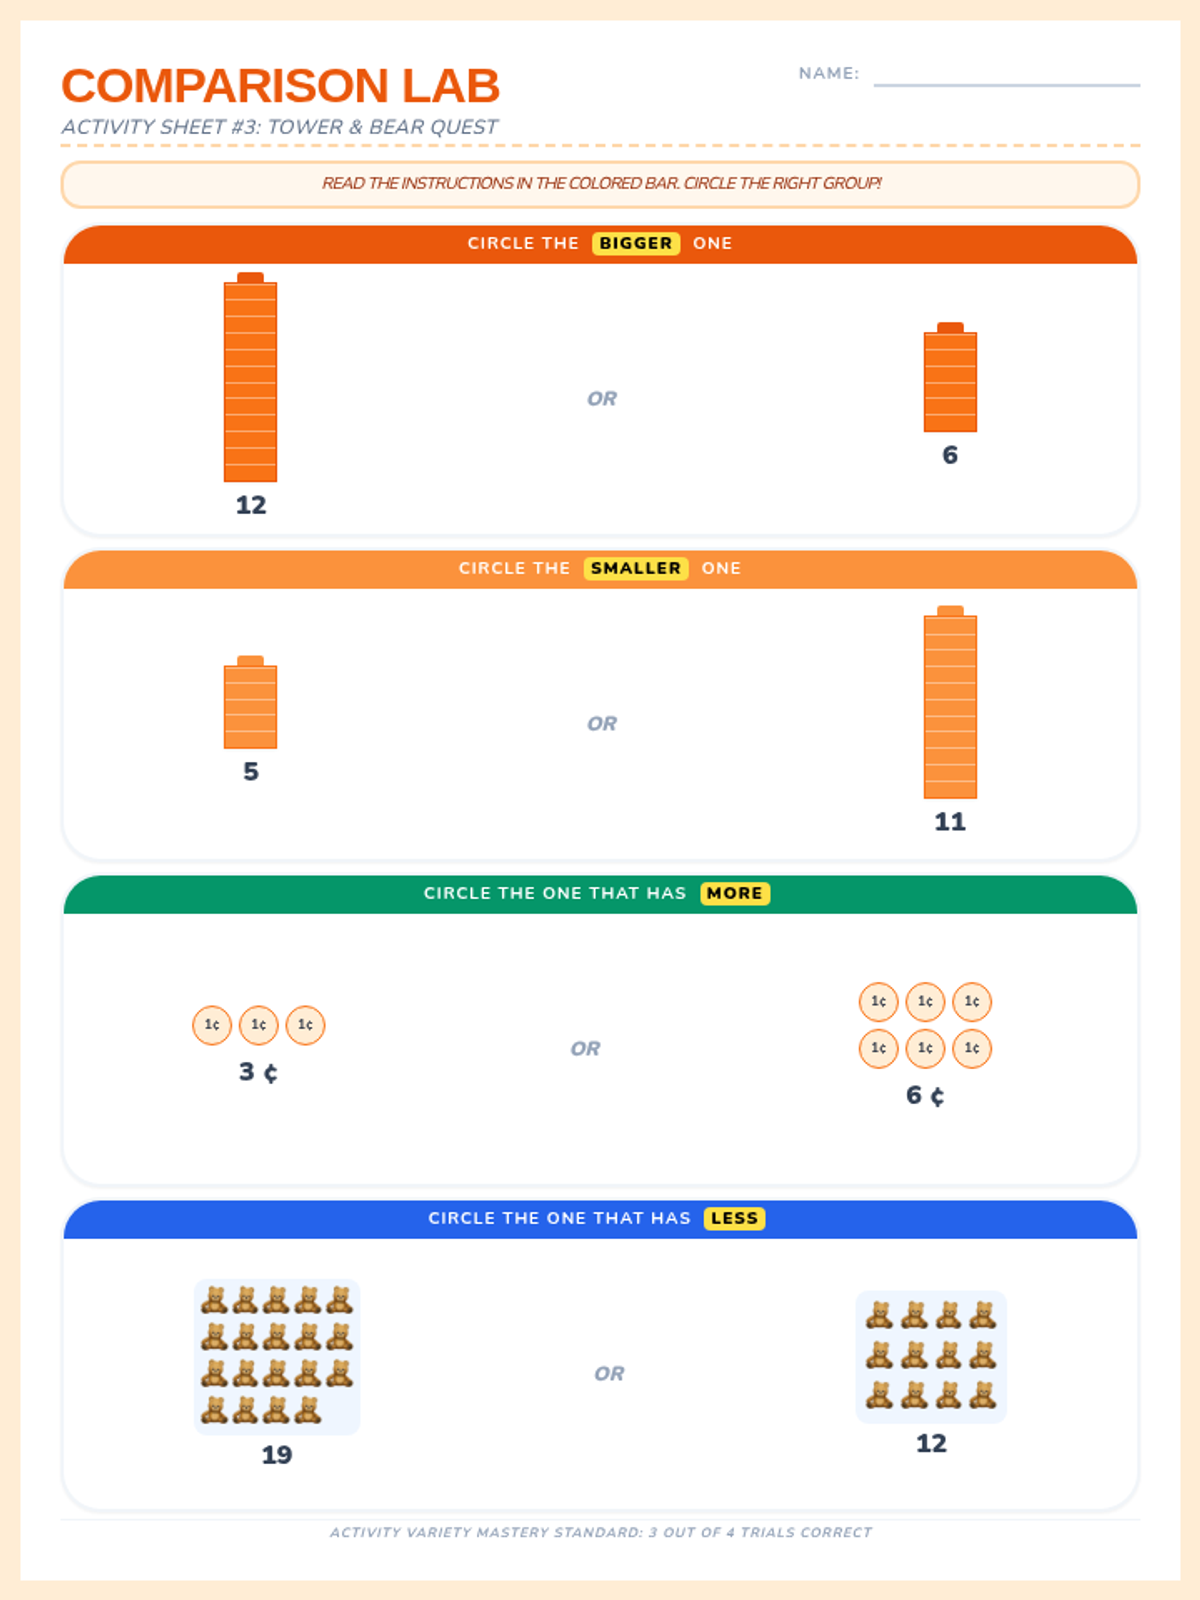
Activity Sheet #3: A mixed practice worksheet featuring bears, coins, and cubes with varied instructions and structured grids for easier counting.
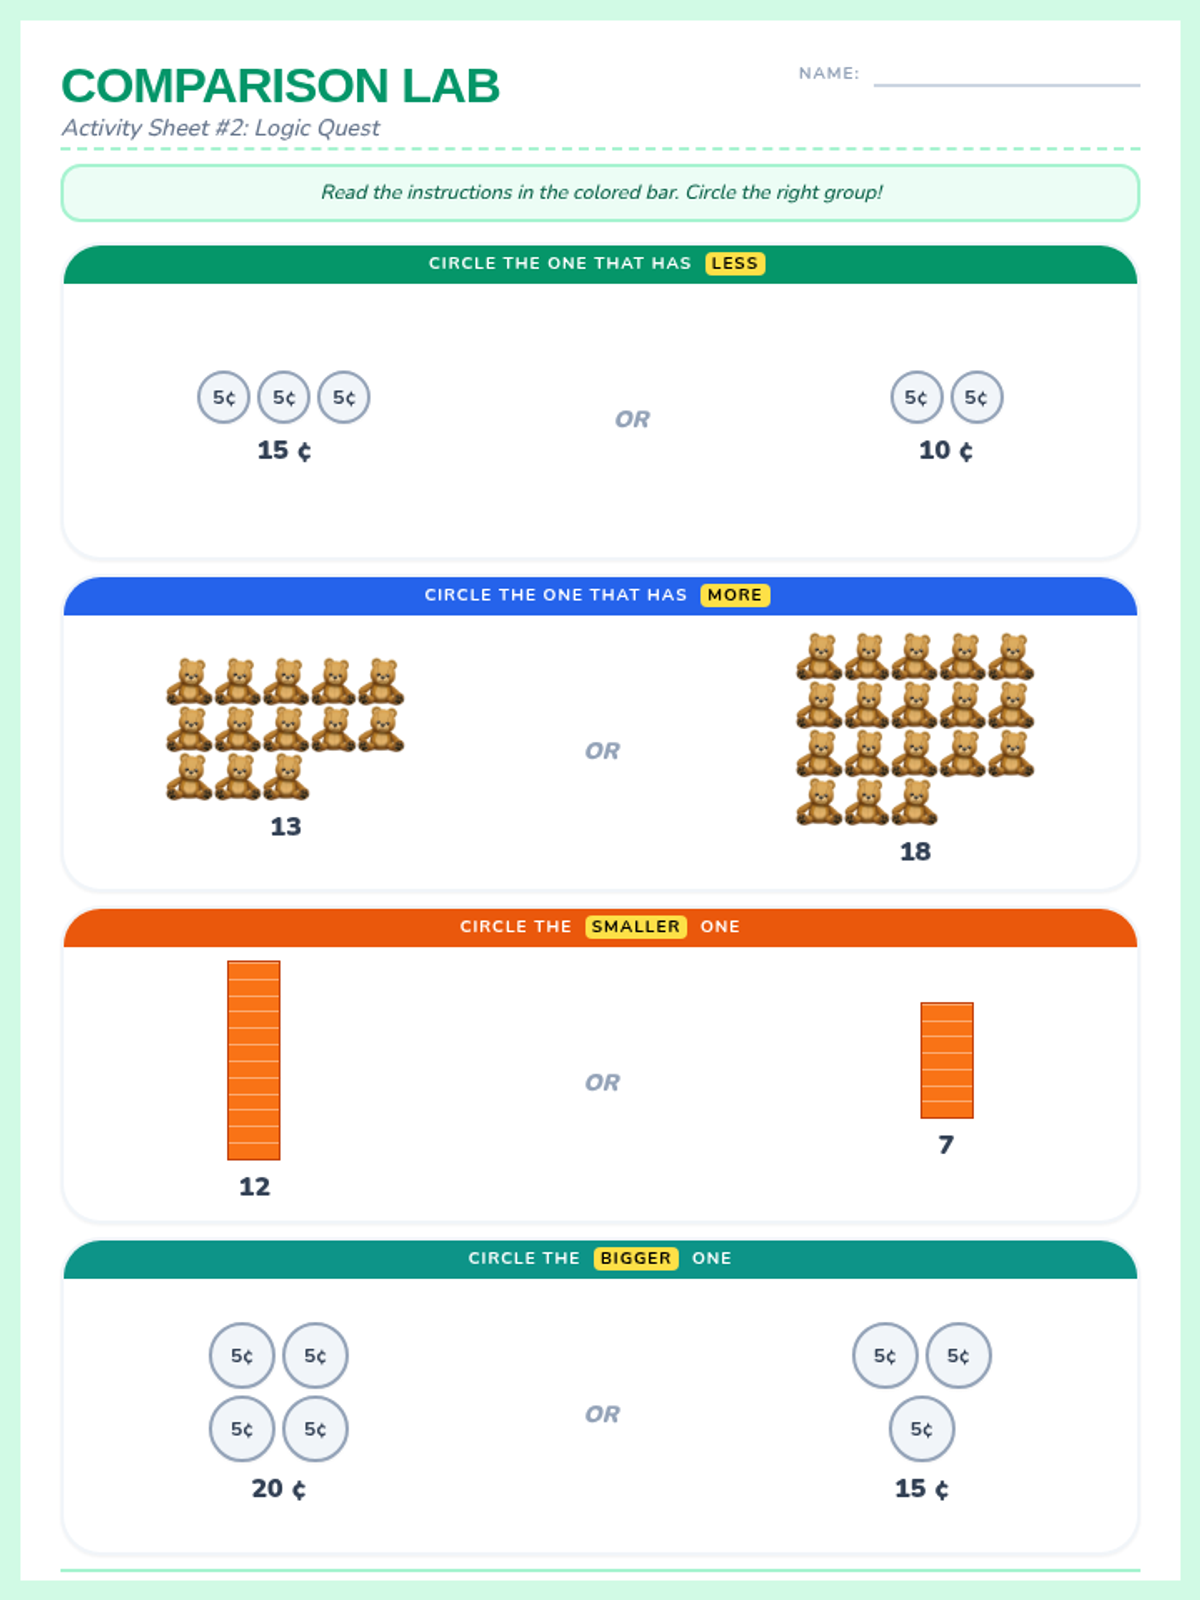
Activity Sheet #2: A mixed practice worksheet featuring bears, coins, and cubes with varied instructions.
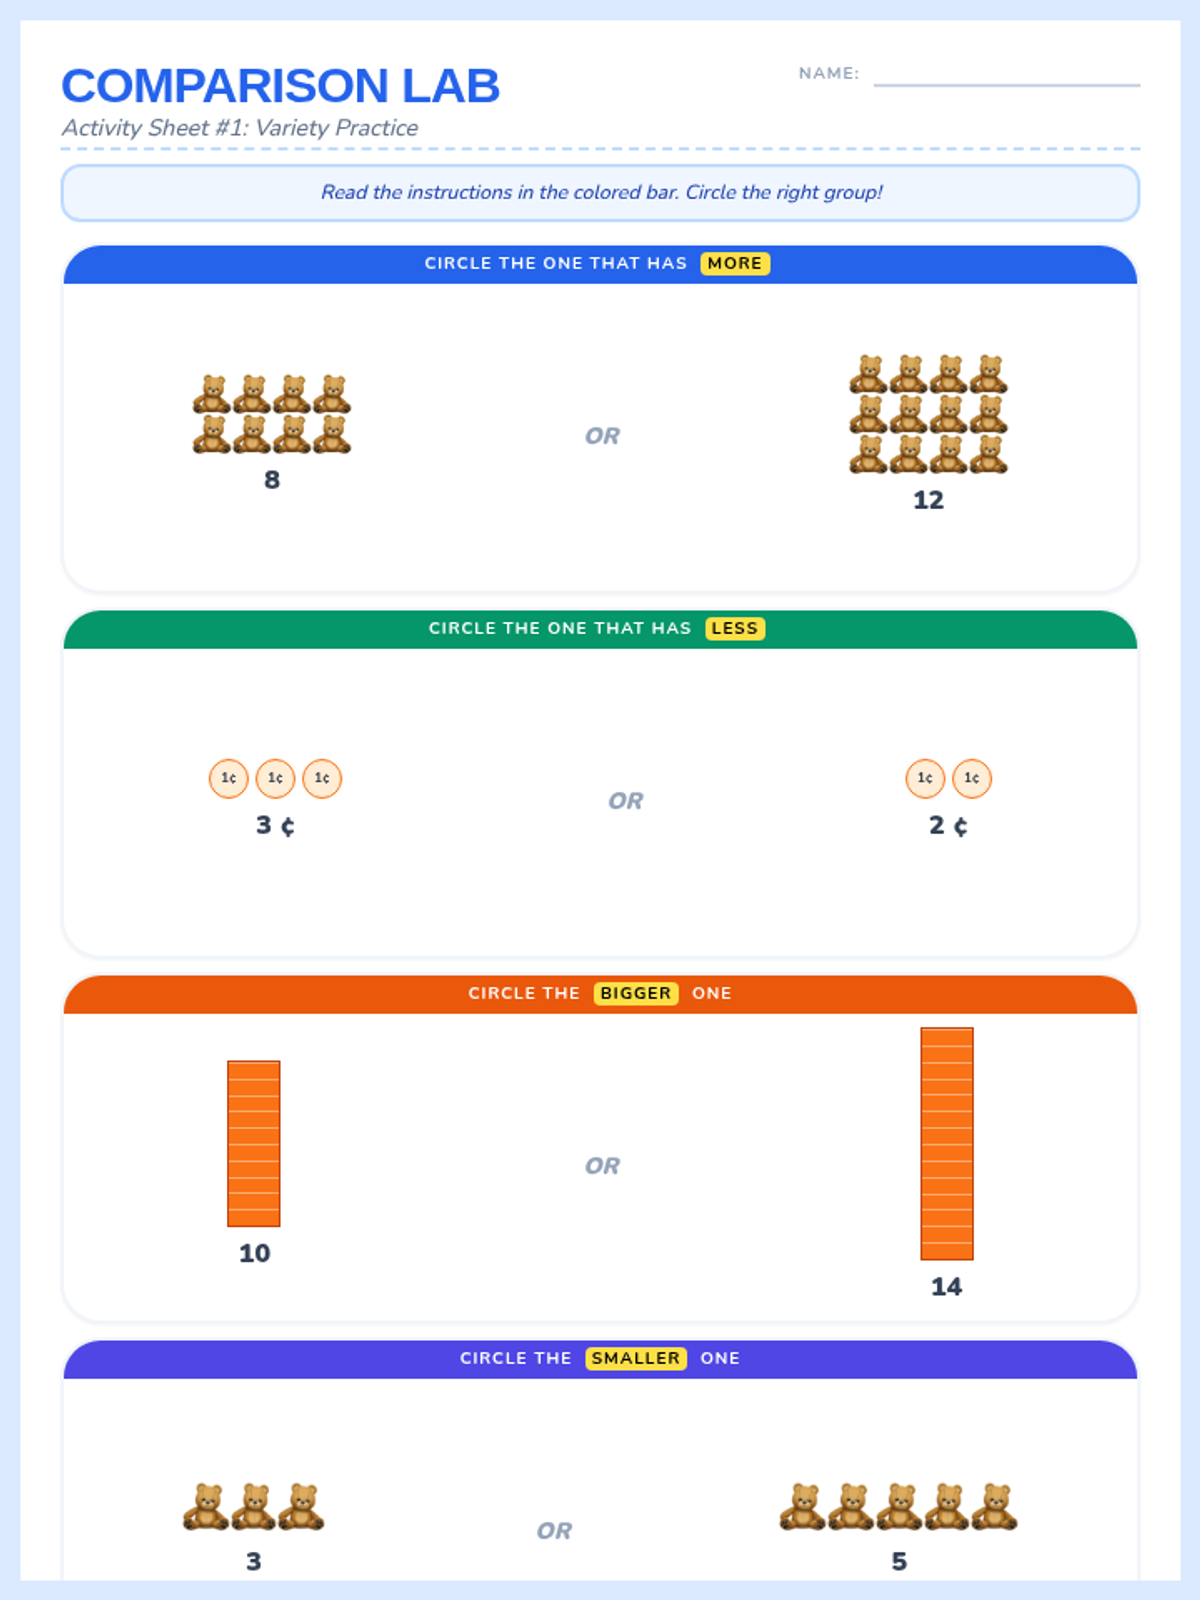
Activity Sheet #1: A mixed comparison lab worksheet featuring bears, coins, and cubes with varied instructions.
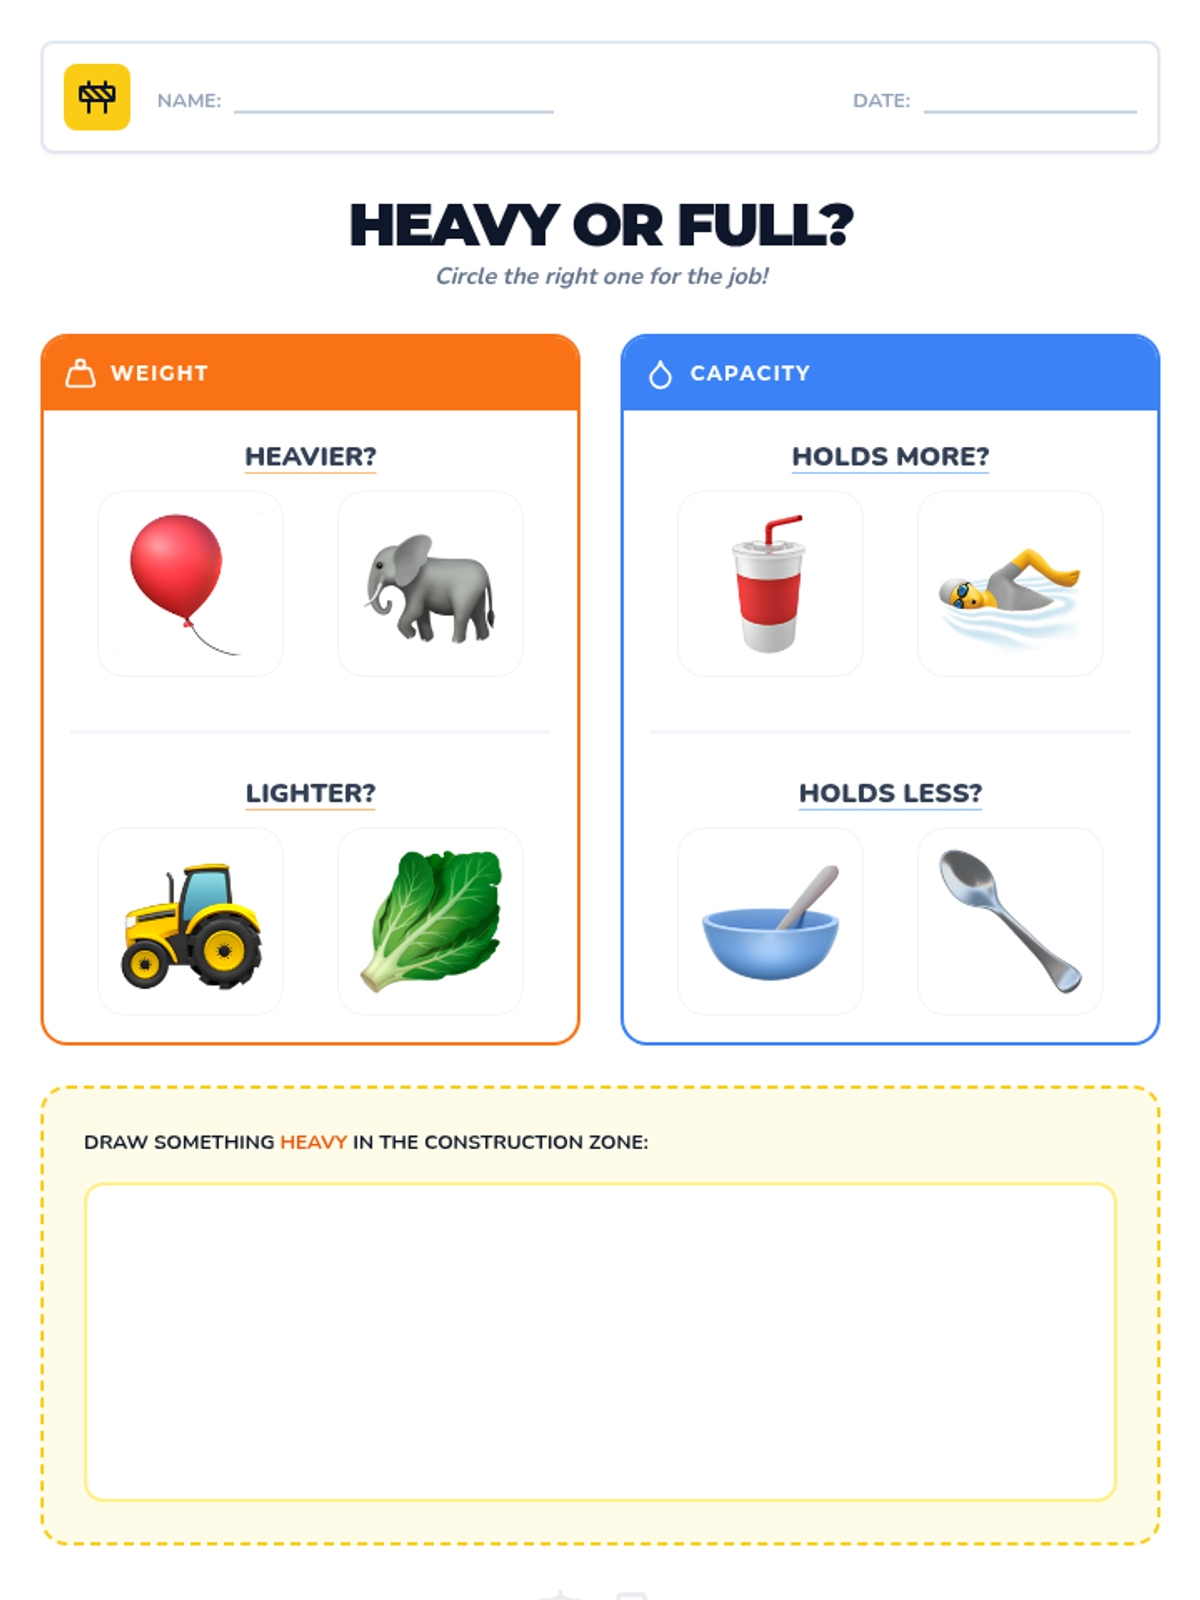
A student-facing activity worksheet where kindergarteners identify objects that are heavier, lighter, or have more/less capacity through visual selection and a drawing prompt.
An engaging slide deck for kindergarteners that defines weight and capacity through bold visuals, interactive comparison challenges, and relatable emoji examples.
A comprehensive teacher facilitation guide for a kindergarten lesson on weight and capacity, featuring learning objectives, key definitions, and a detailed instructional sequence.
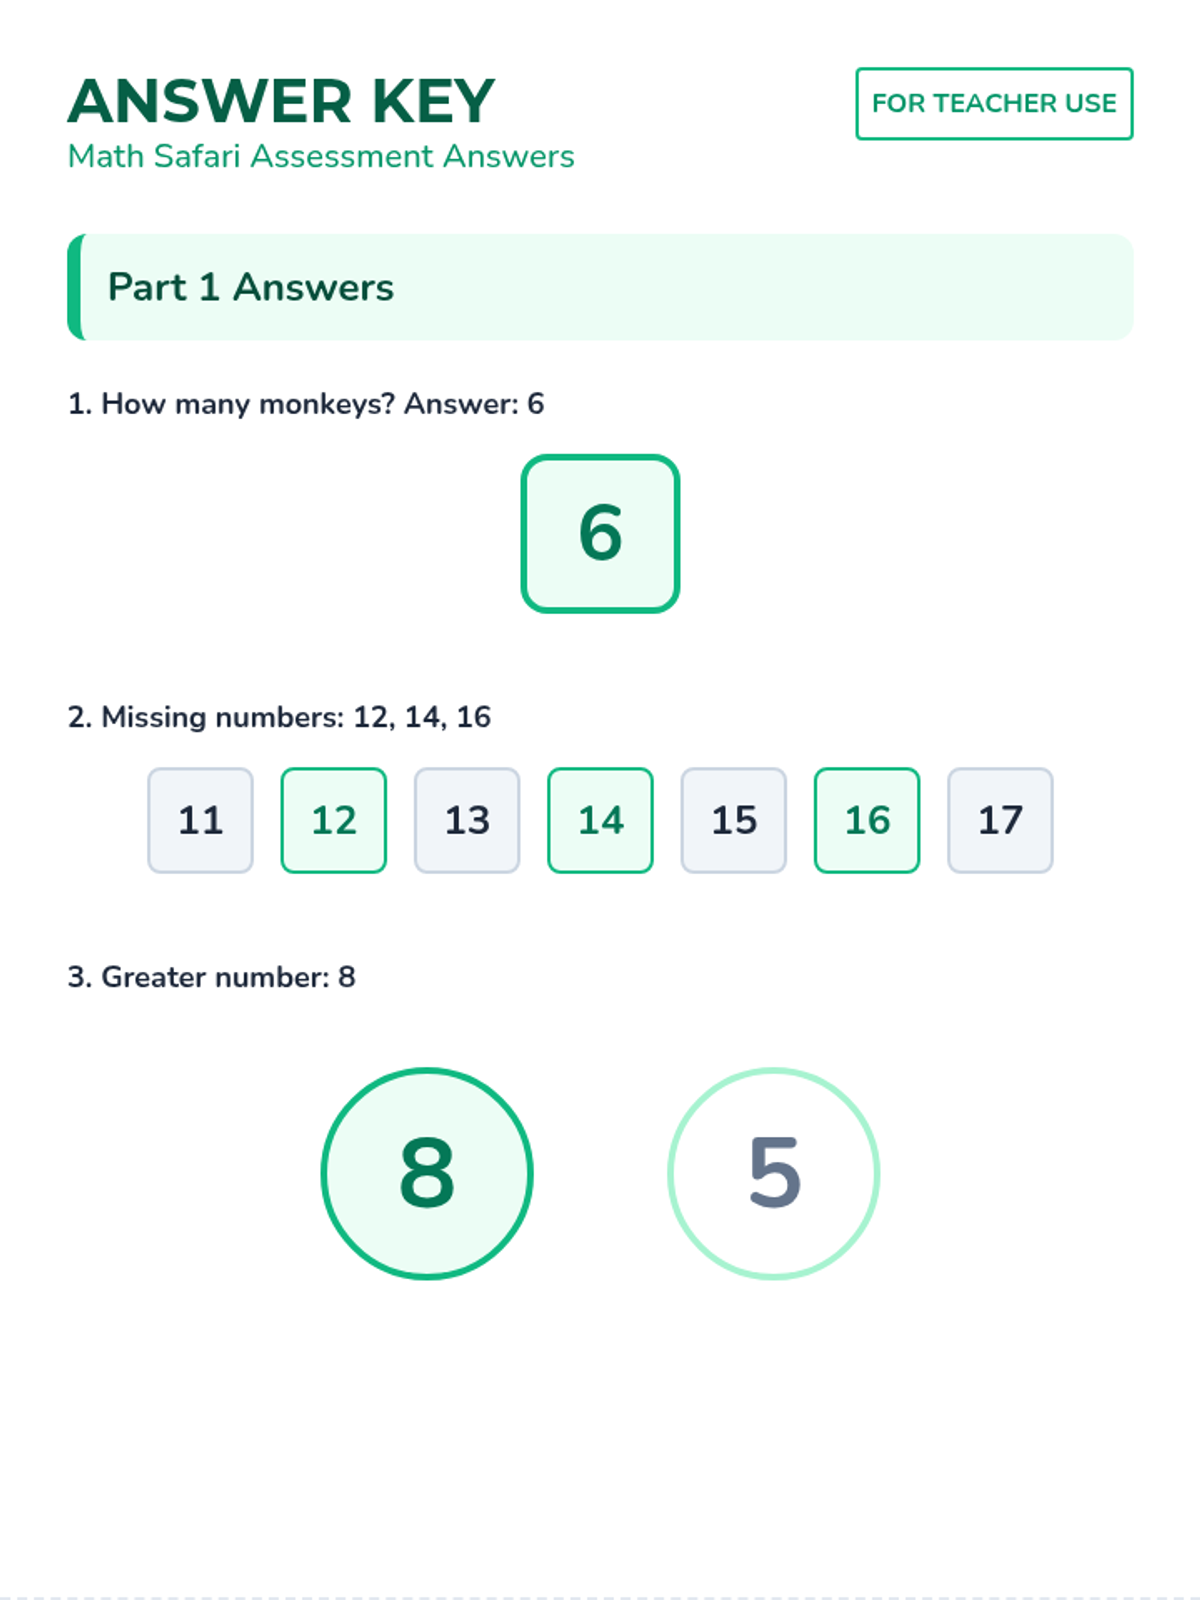
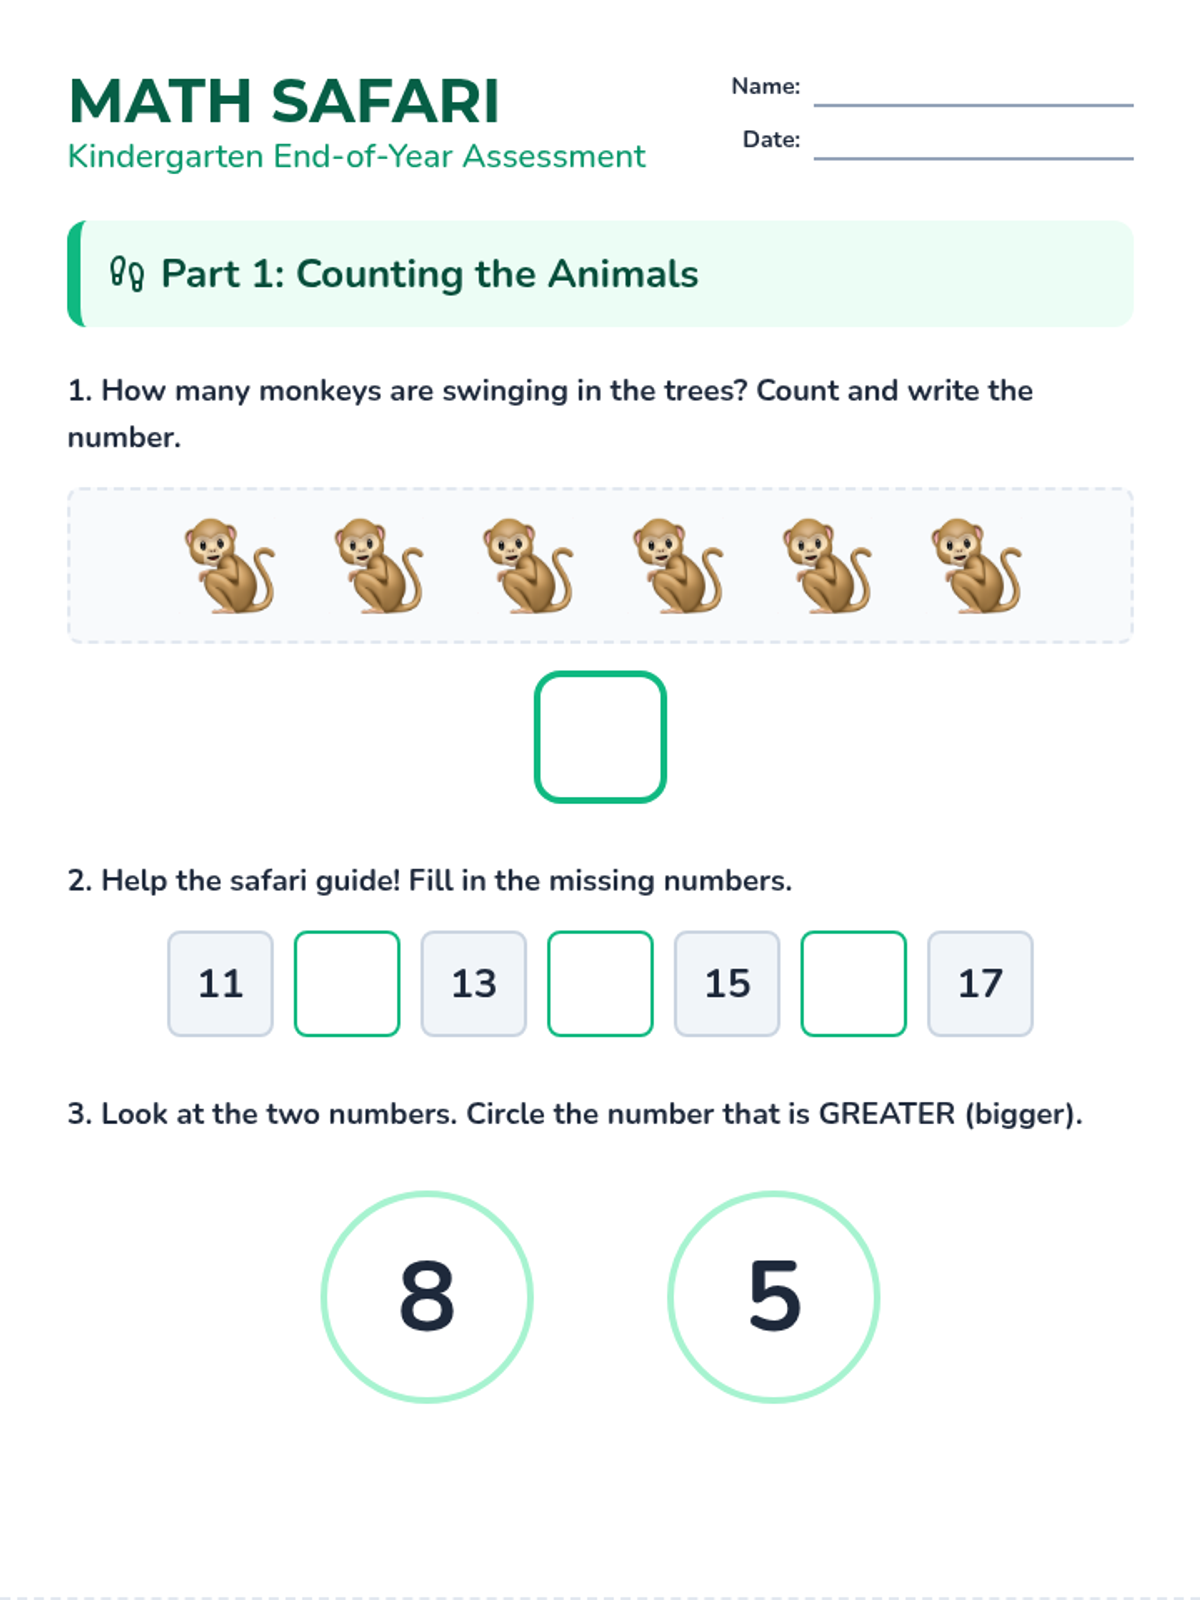
The answer key for the Math Safari assessment, clearly indicating correct responses for every question to streamline grading for teachers.
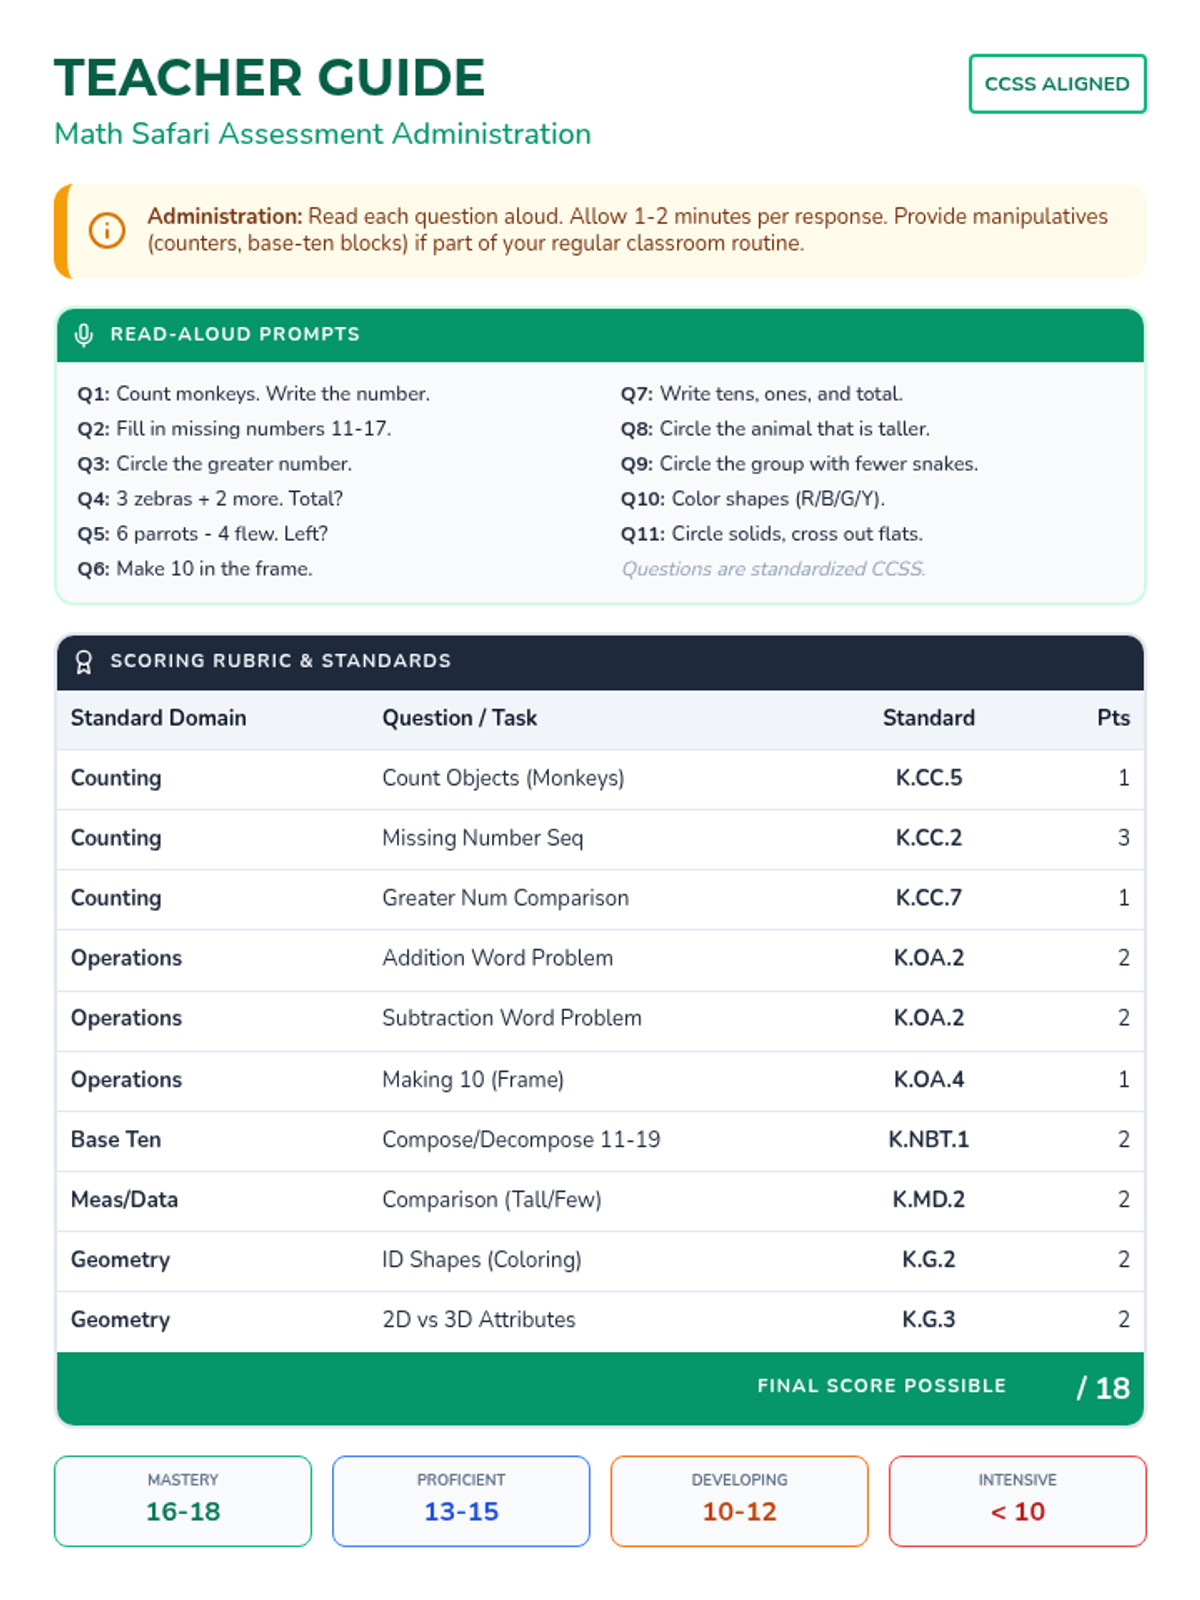
The teacher guide for the Math Safari assessment, providing read-aloud prompts, administration tips, and a detailed scoring rubric aligned with Common Core standards.
The student version of the Math Safari assessment, featuring engaging animal themes and clear workspaces for kindergarten students to demonstrate their math proficiency.
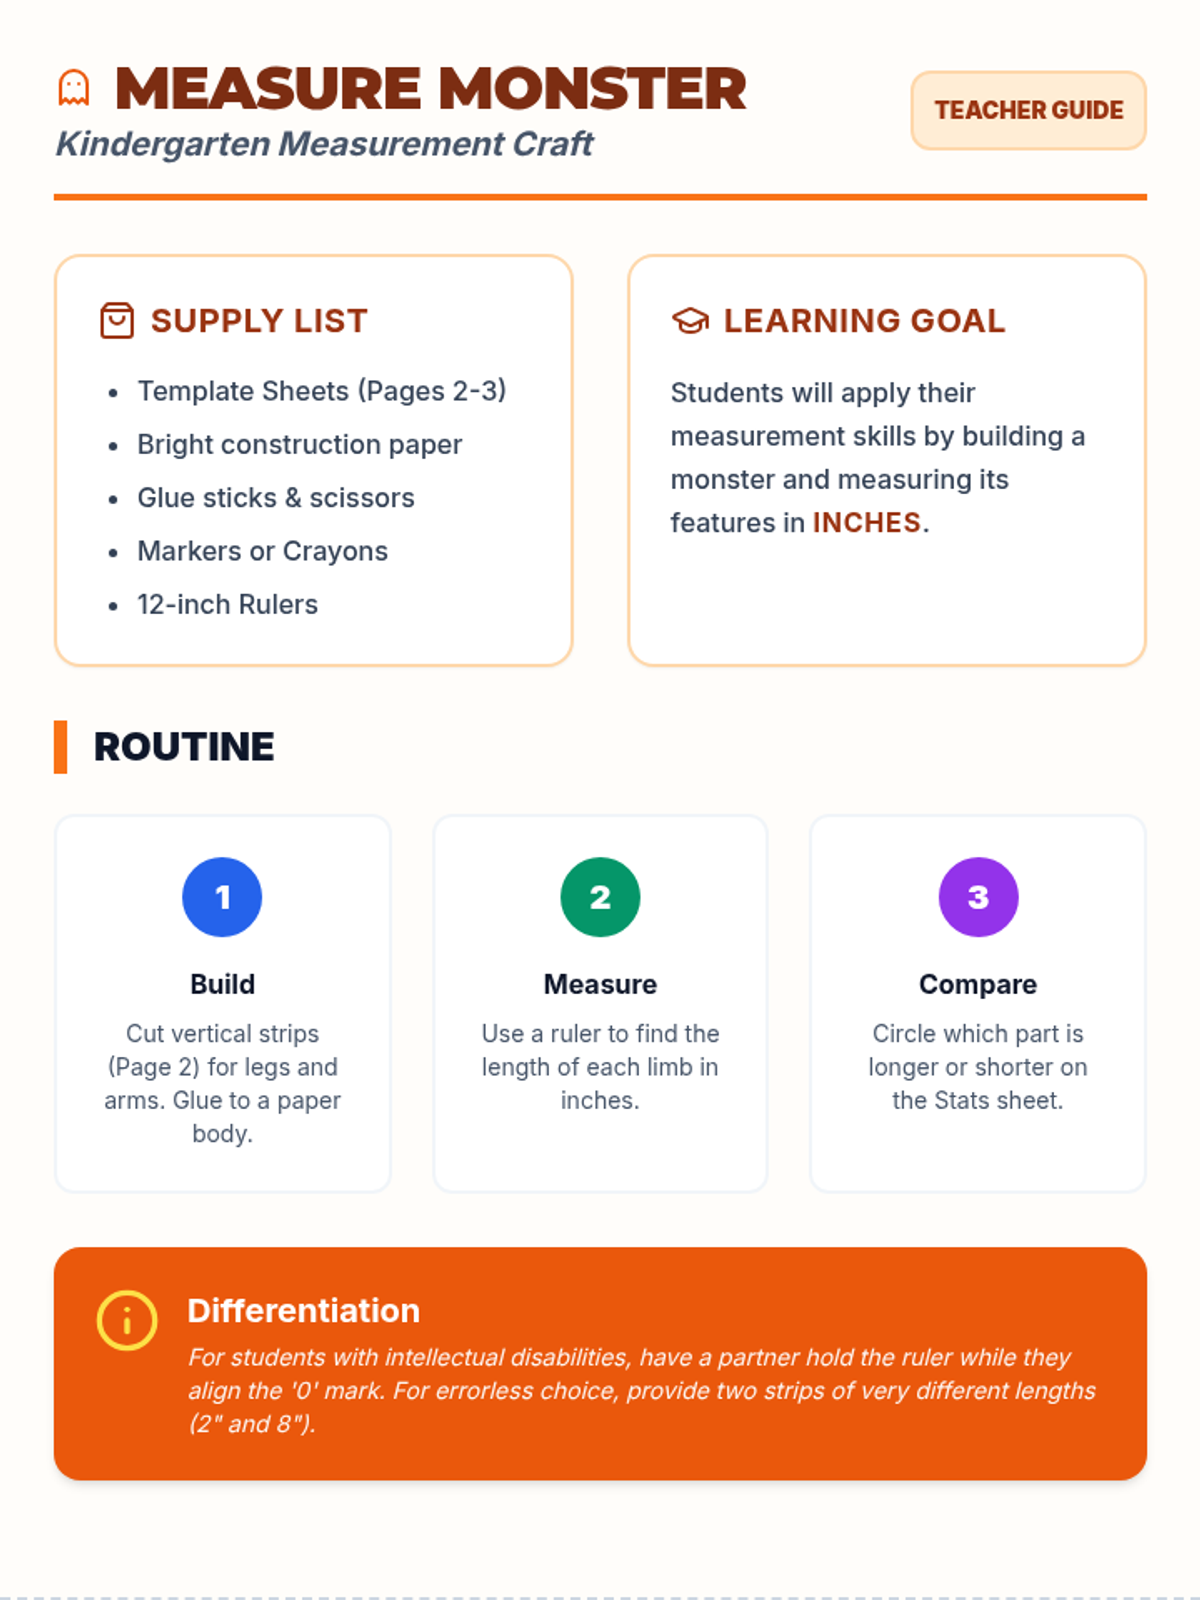
A three-page creative craft activity where students build a 'Measure Monster' and record its dimensions in inches, designed for kindergarten and supported for students with disabilities.
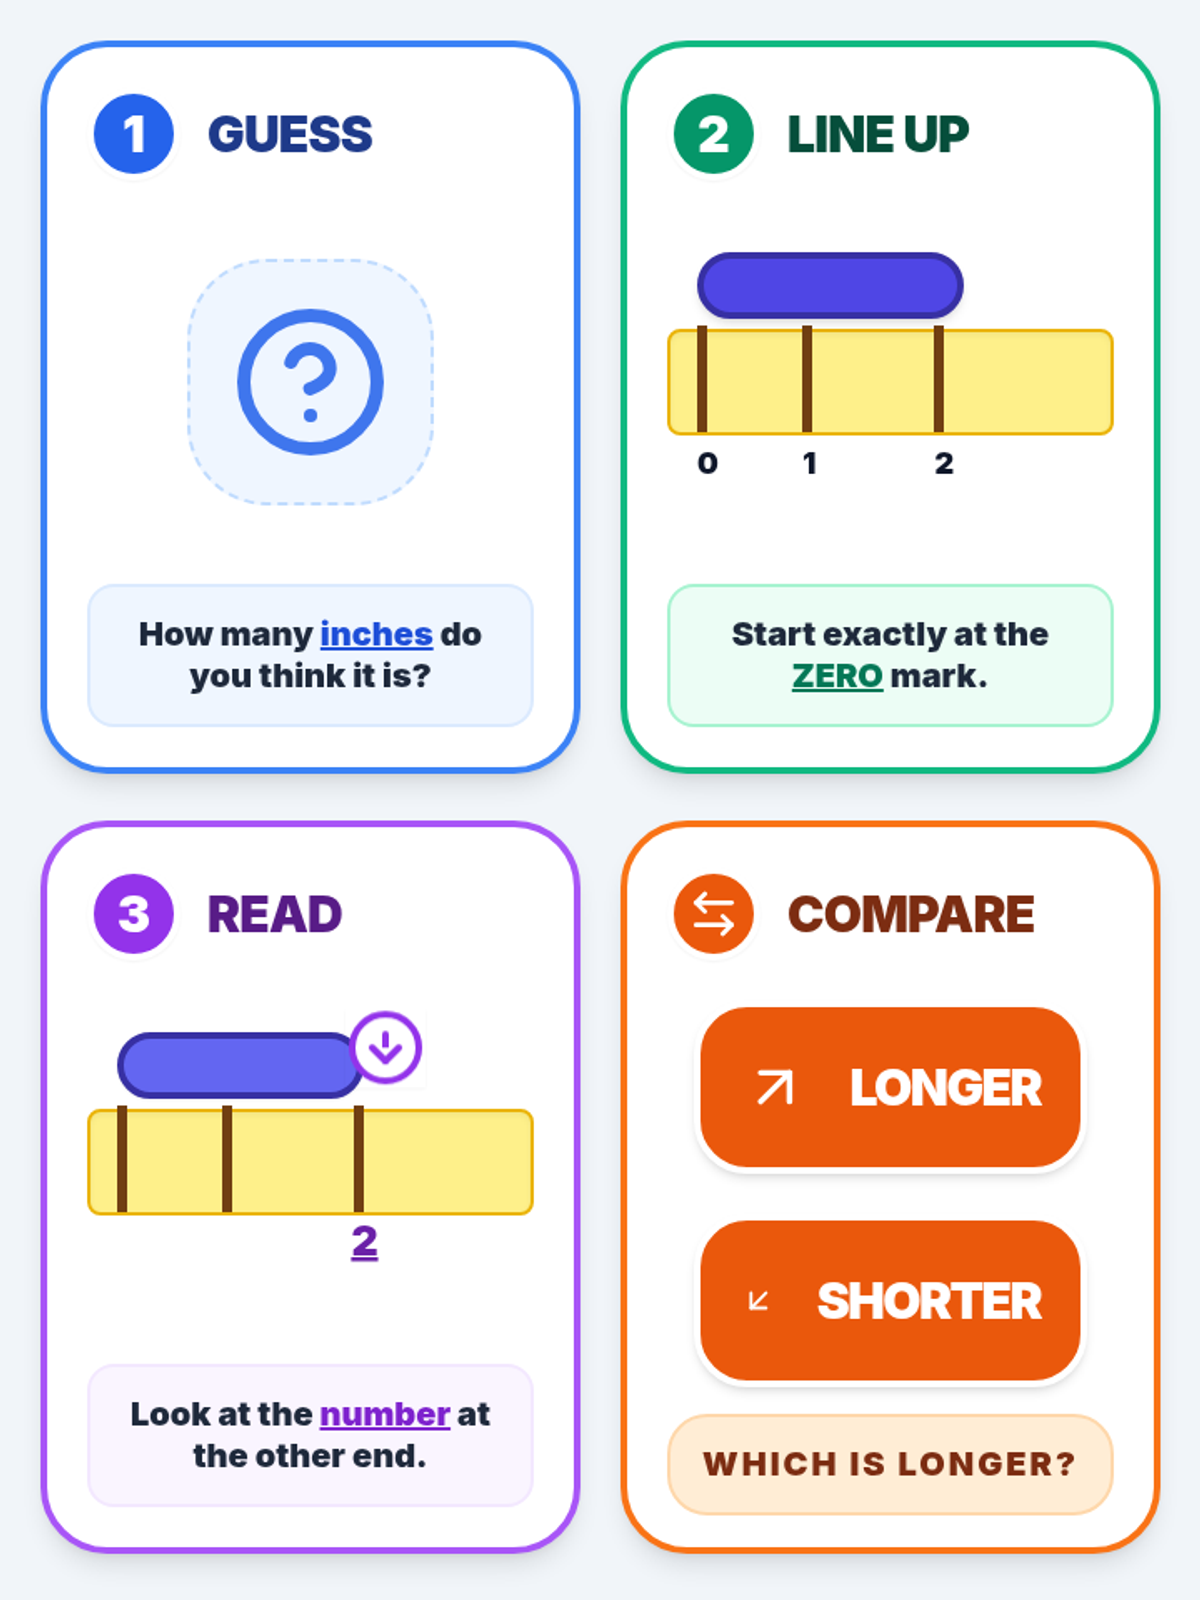
A set of four visual task cards for students to use during measurement activities, reinforcing the step-by-step process of using a ruler.
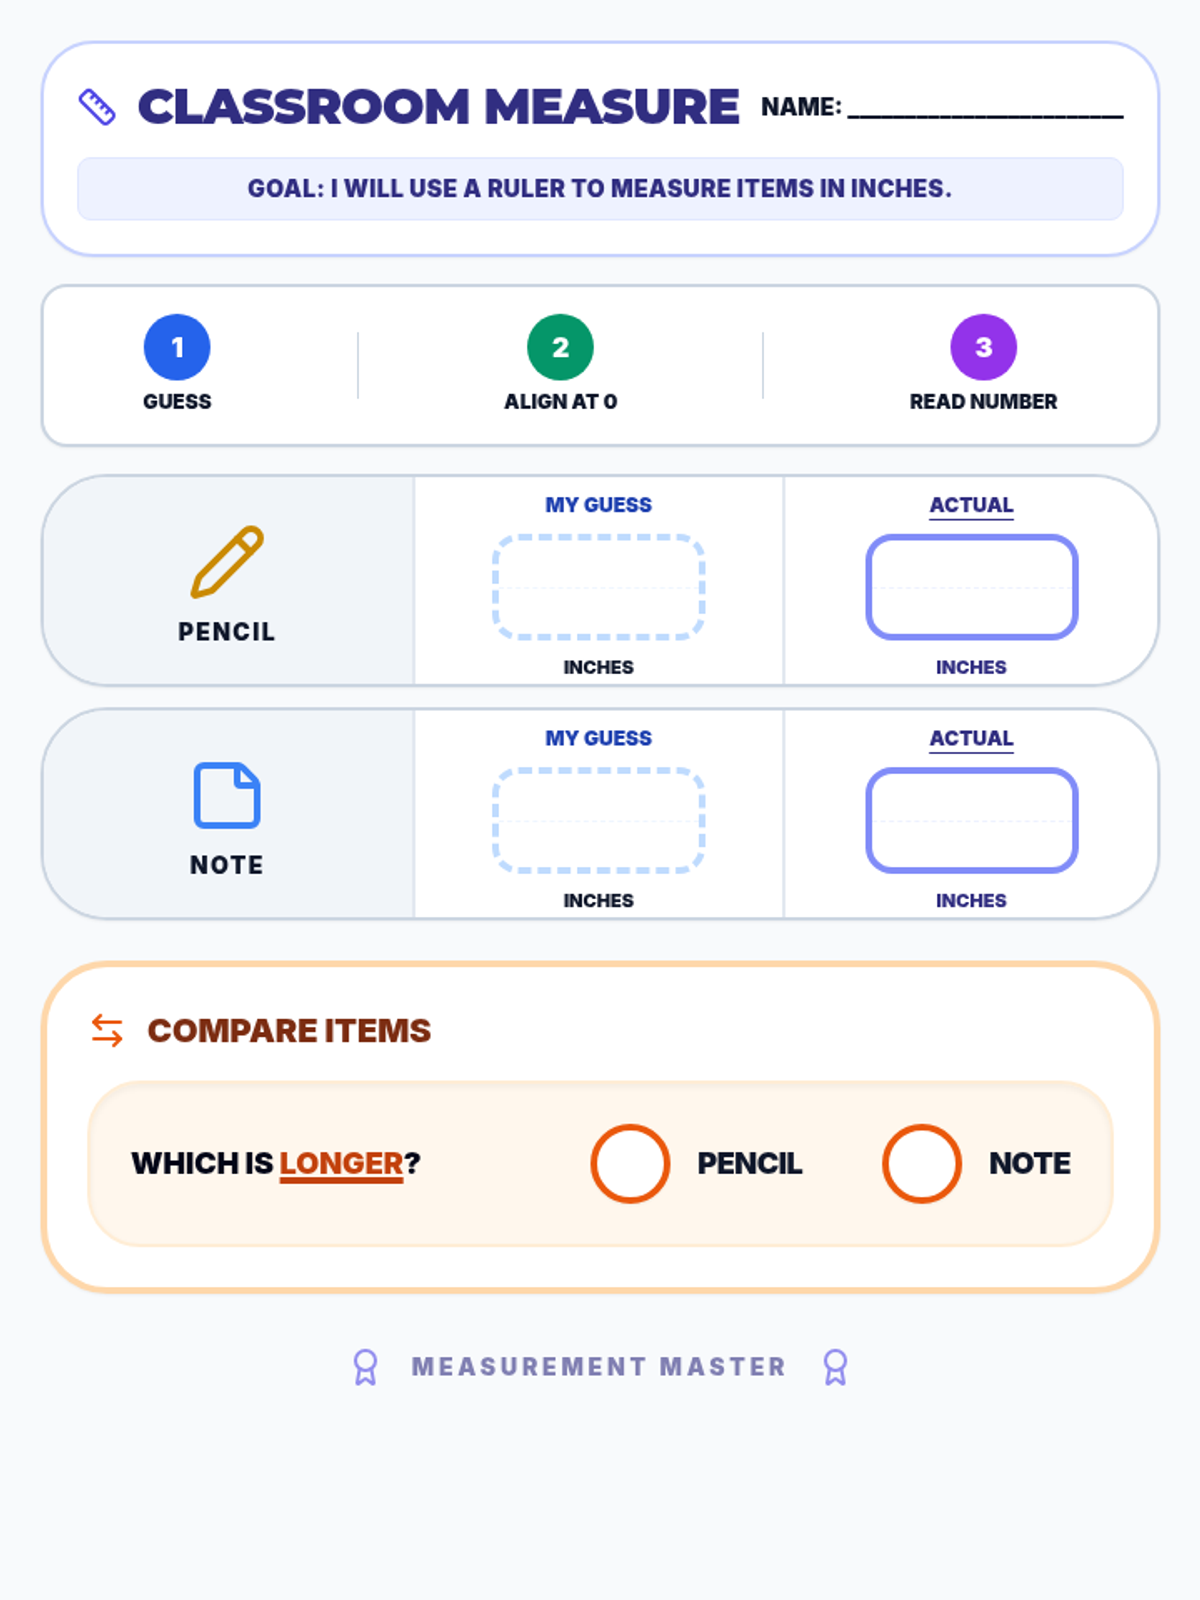
A structured student worksheet for measuring classroom objects with a ruler, featuring estimation boxes, actual measurement fields, and comparison prompts.
Instructional slides for measuring with a ruler, featuring step-by-step visuals for estimating, lining up at zero, and reading inch markings.
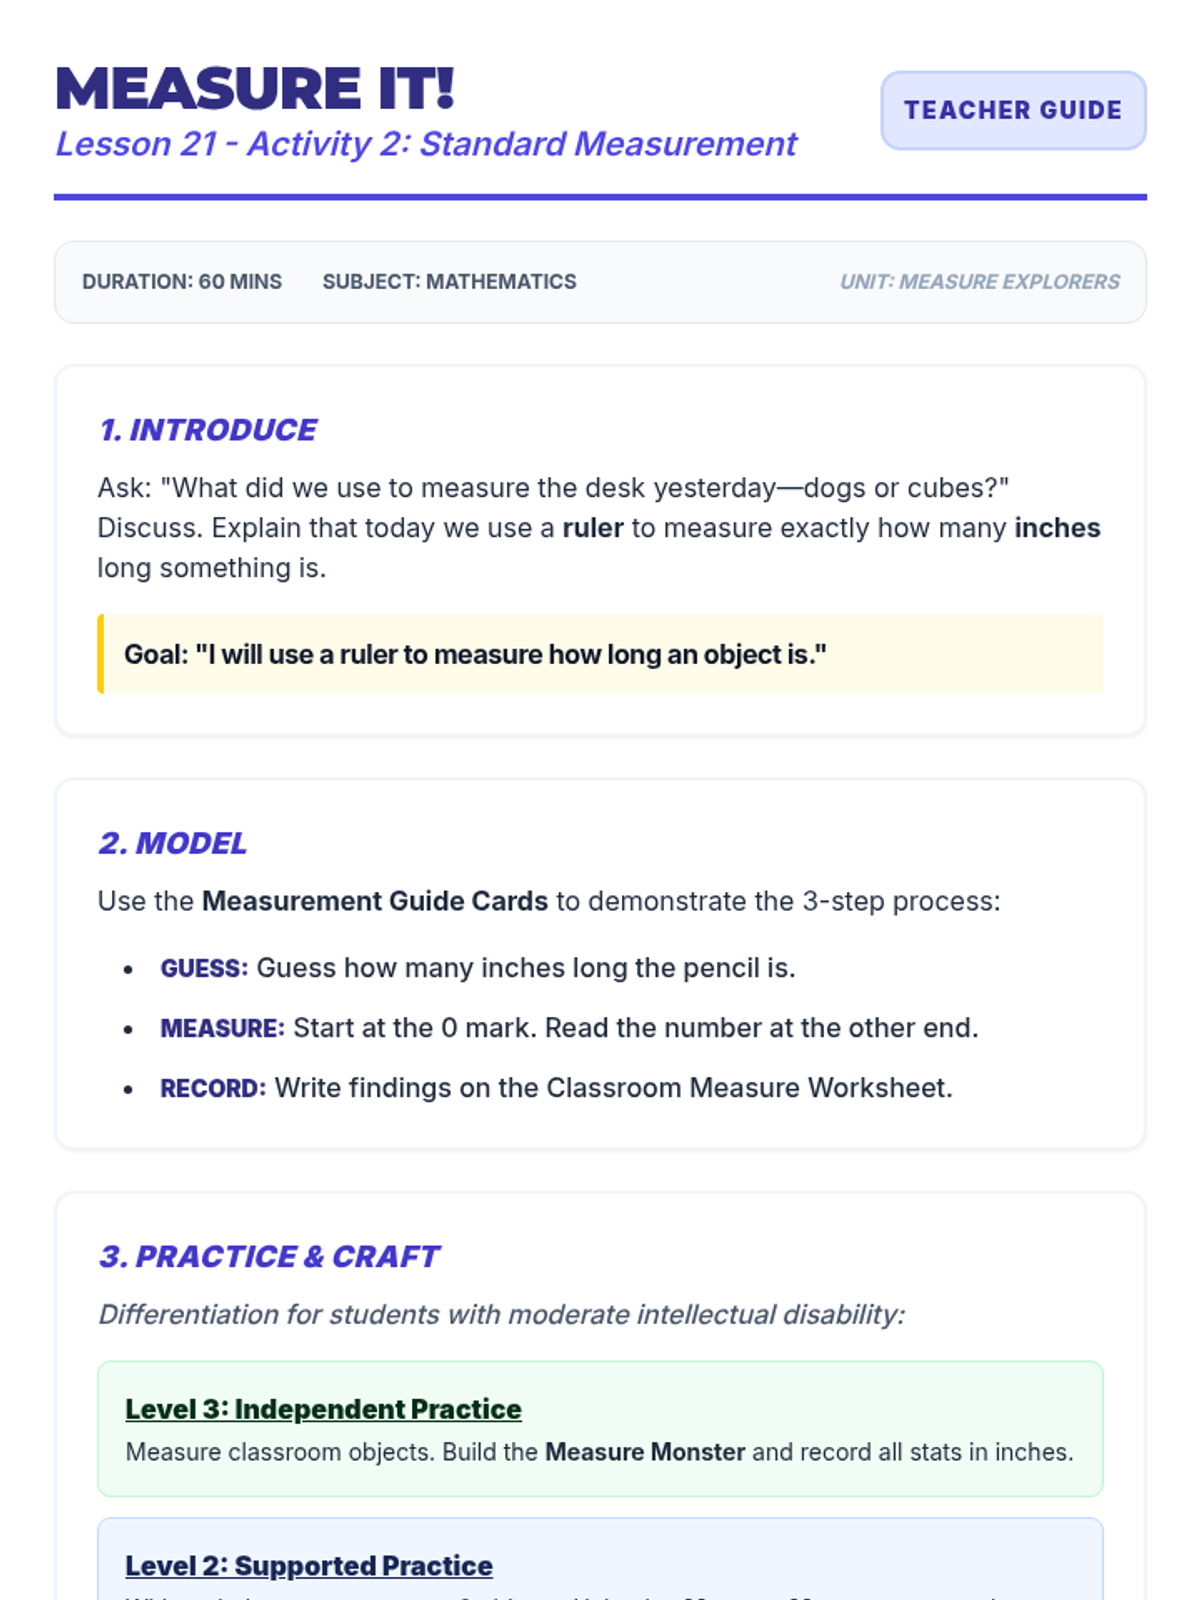
Teacher-facing lesson plan for standard measurement, including tiered support levels for students with moderate intellectual disabilities.
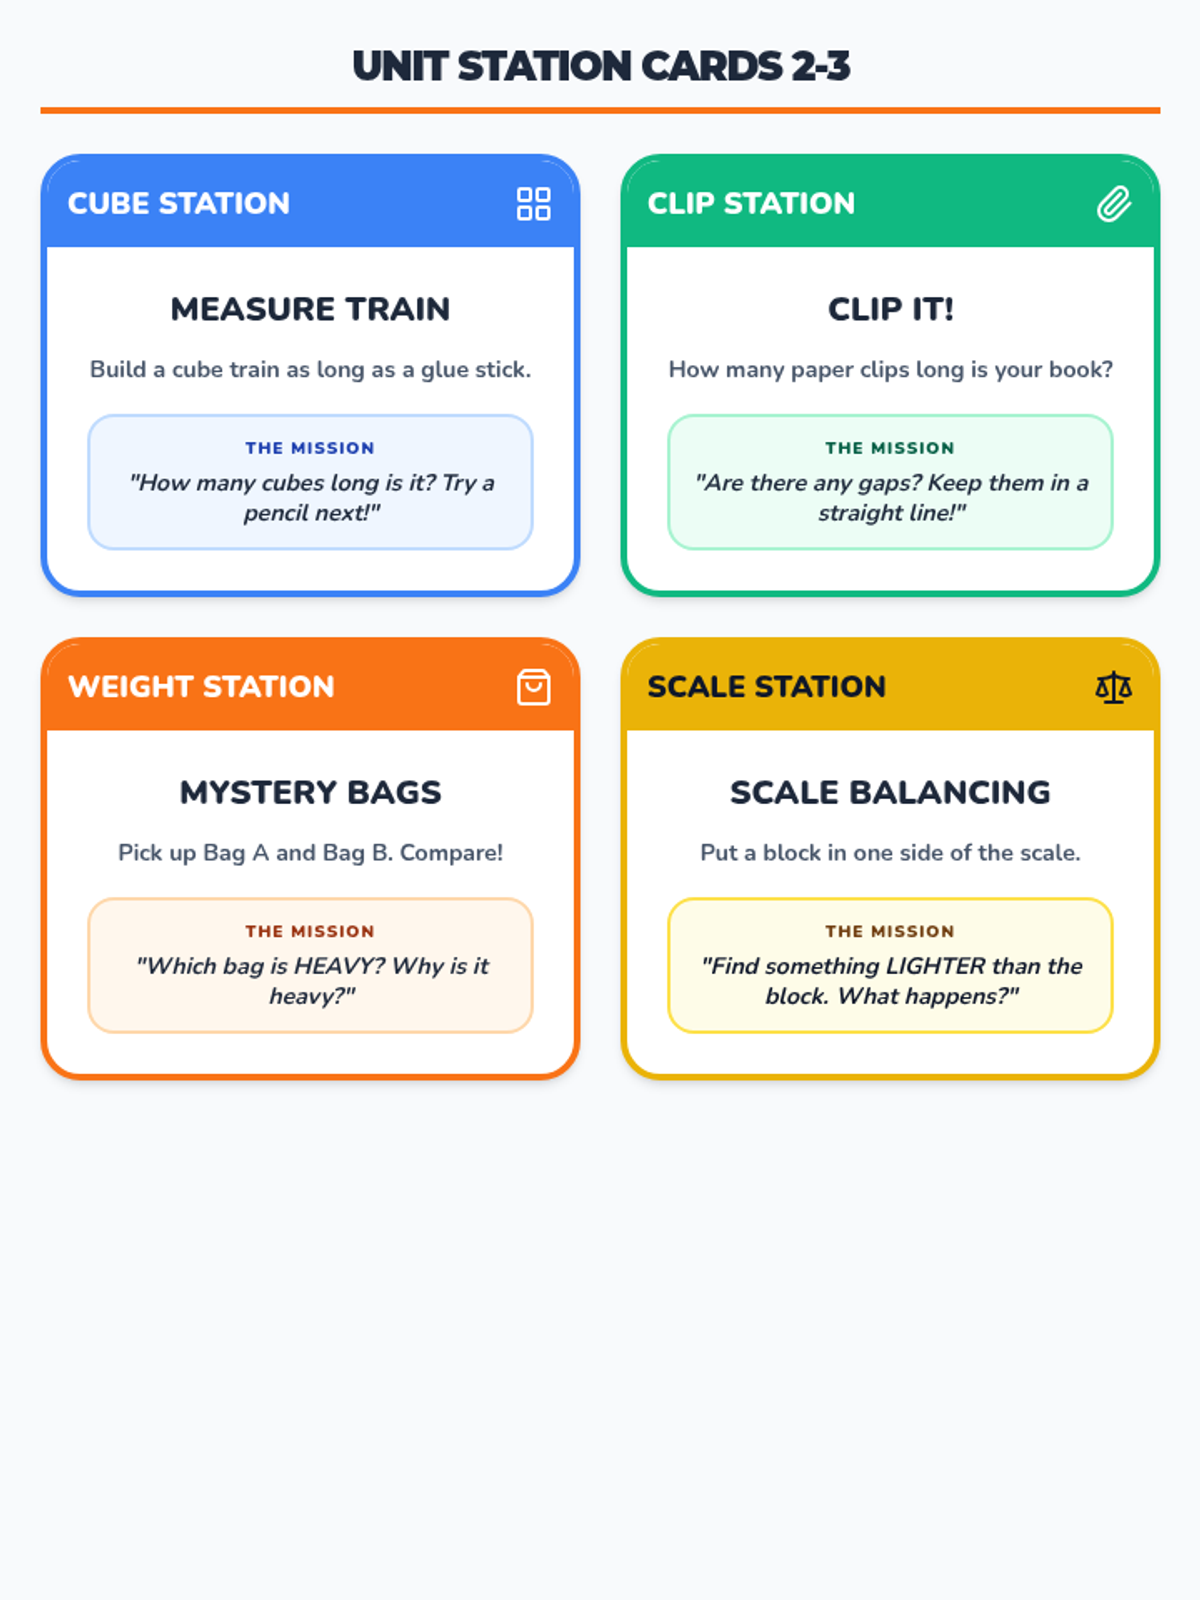
Additional station cards for Lessons 2 and 3, focusing on non-standard unit measuring and weight comparison using bags and scales.
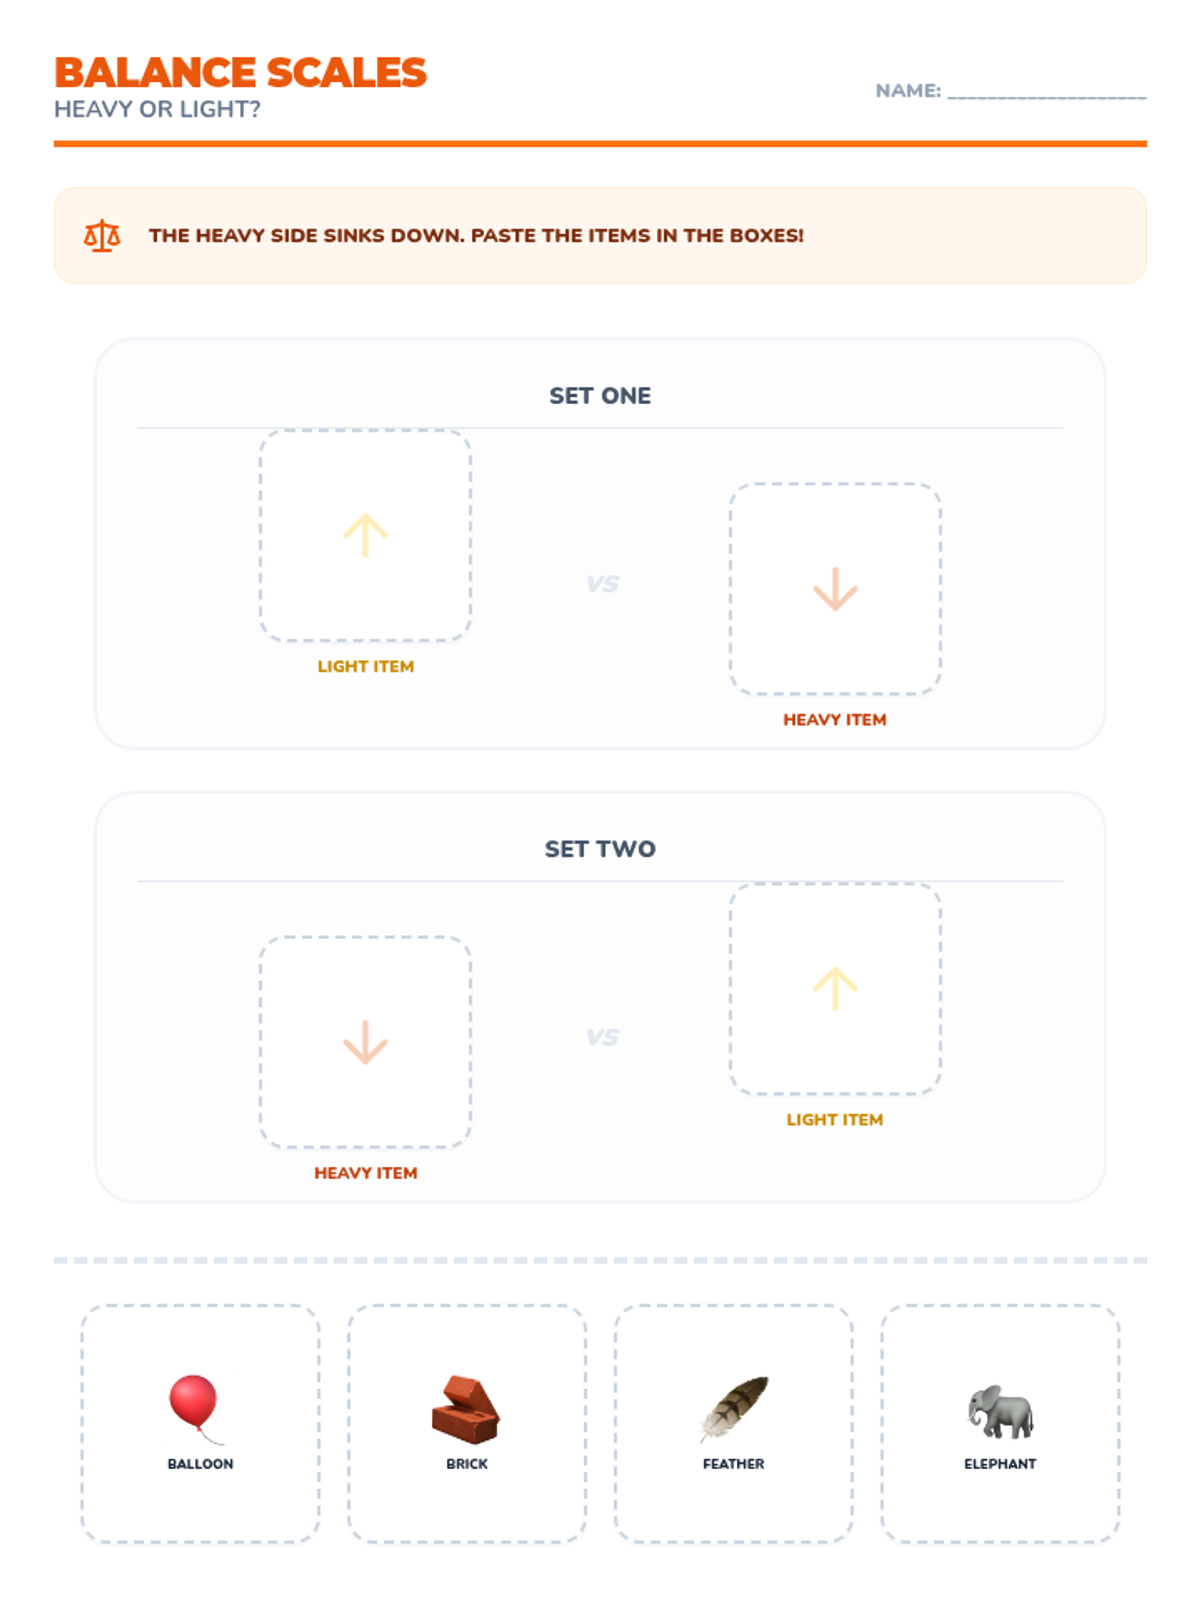
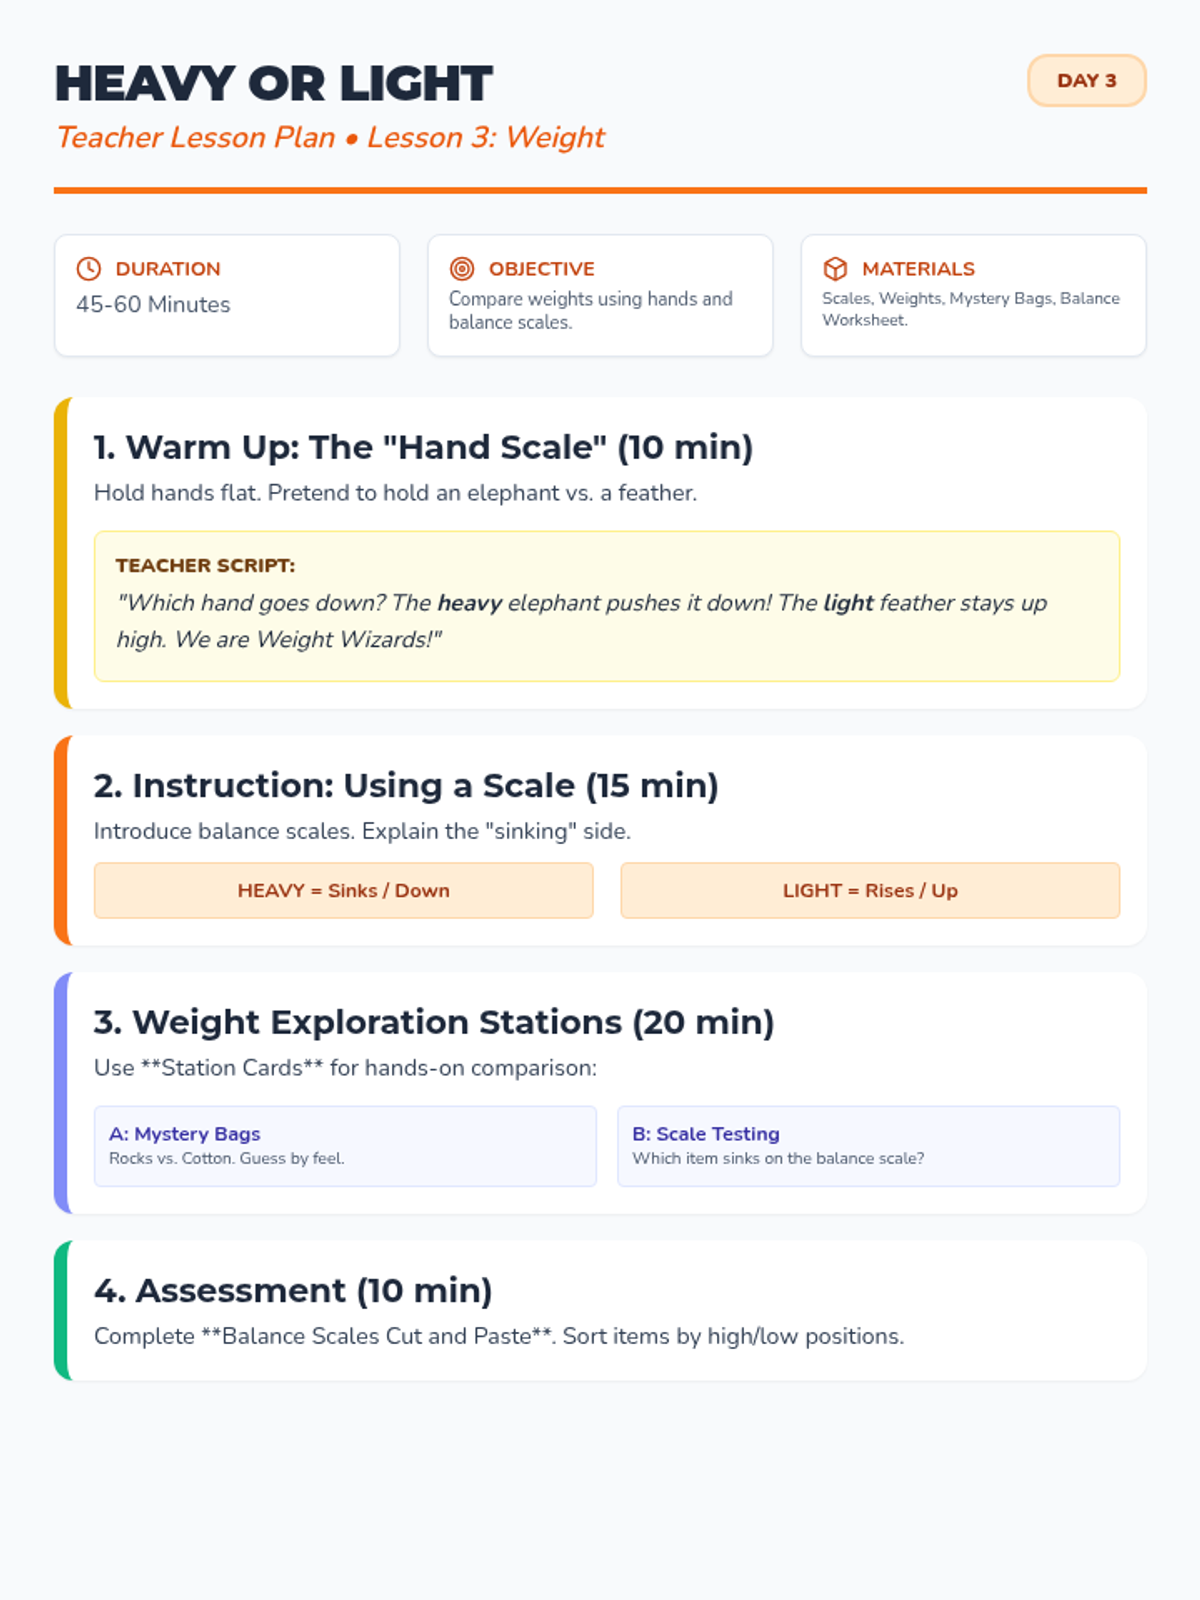
A cut-and-paste worksheet for Lesson 3 where students sort heavy and light objects onto the correct sides of a balance scale.
Instructional slides for Lesson 3, demonstrating how weight affects a balance scale and engaging students with "hand scale" activities.
Teacher lesson plan for Lesson 3, exploring weight through tactile activities and the use of balance scales.
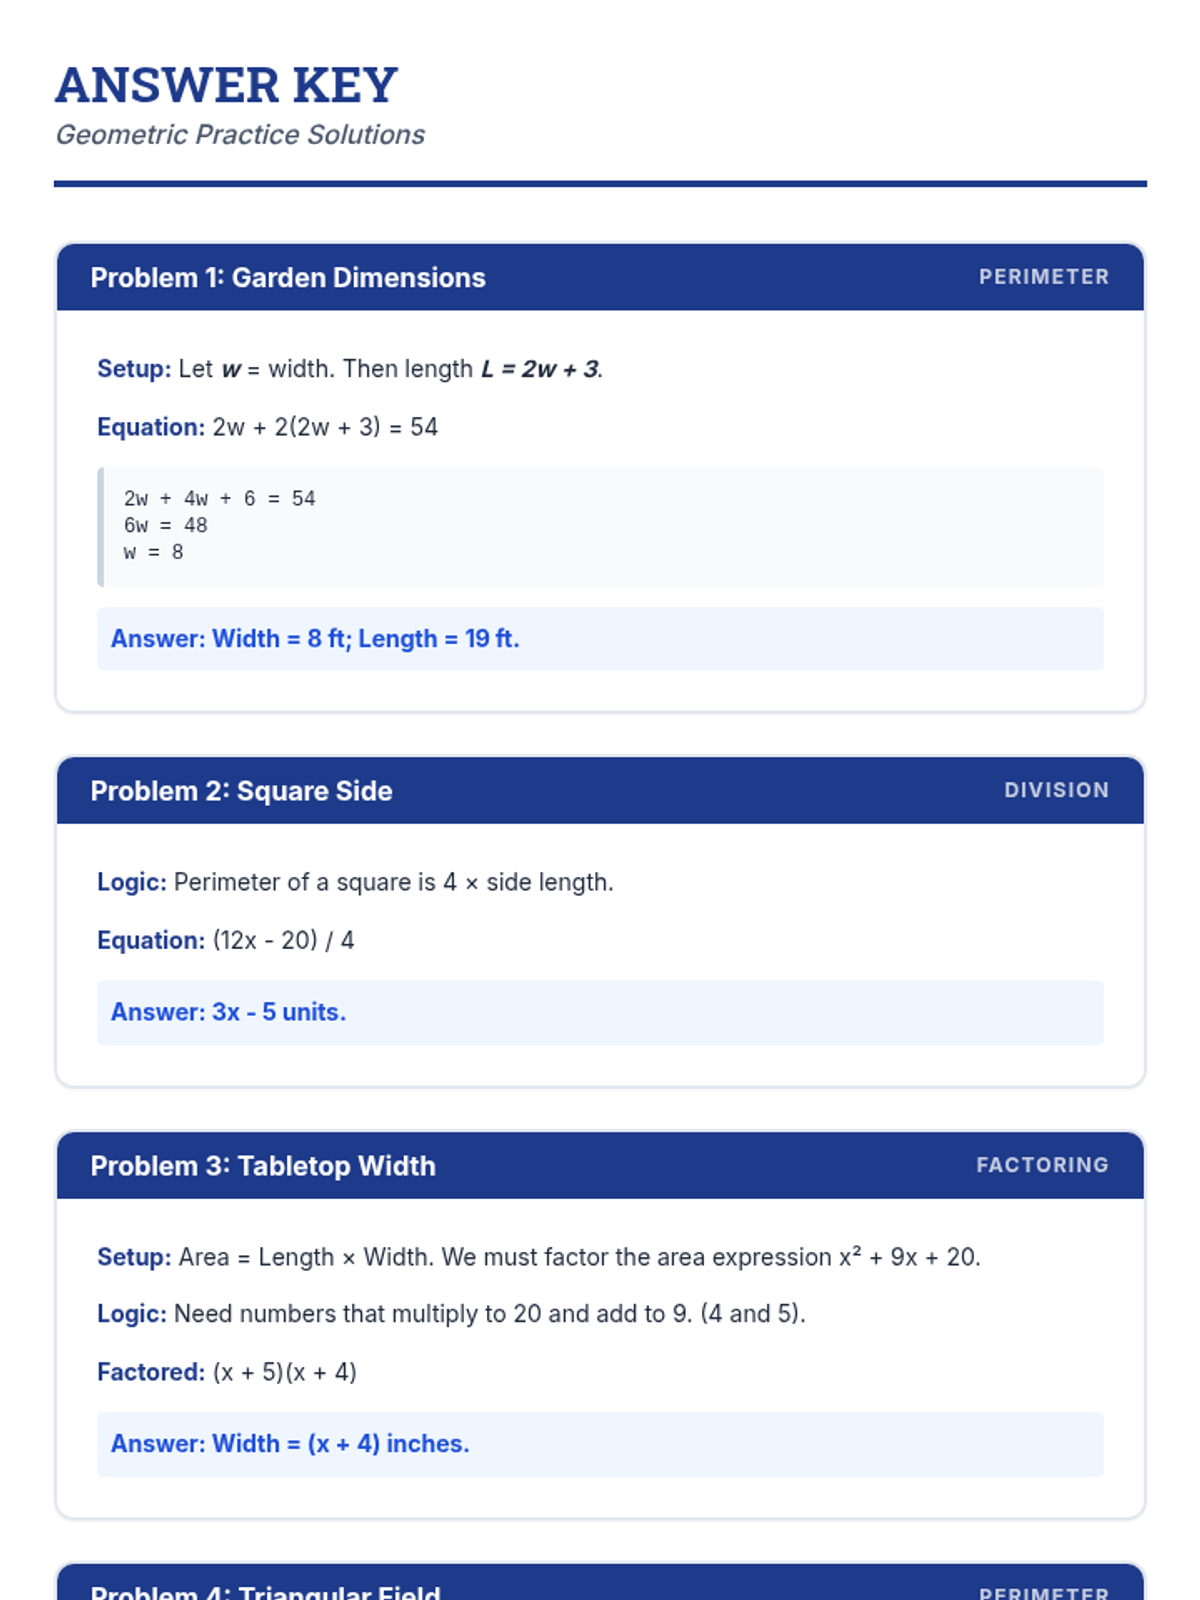
Complete teacher answer key for the summer geometry supplement. Includes equation setups, logic steps, and final solutions for all 6 word problems, presented in a high-contrast, professional format.
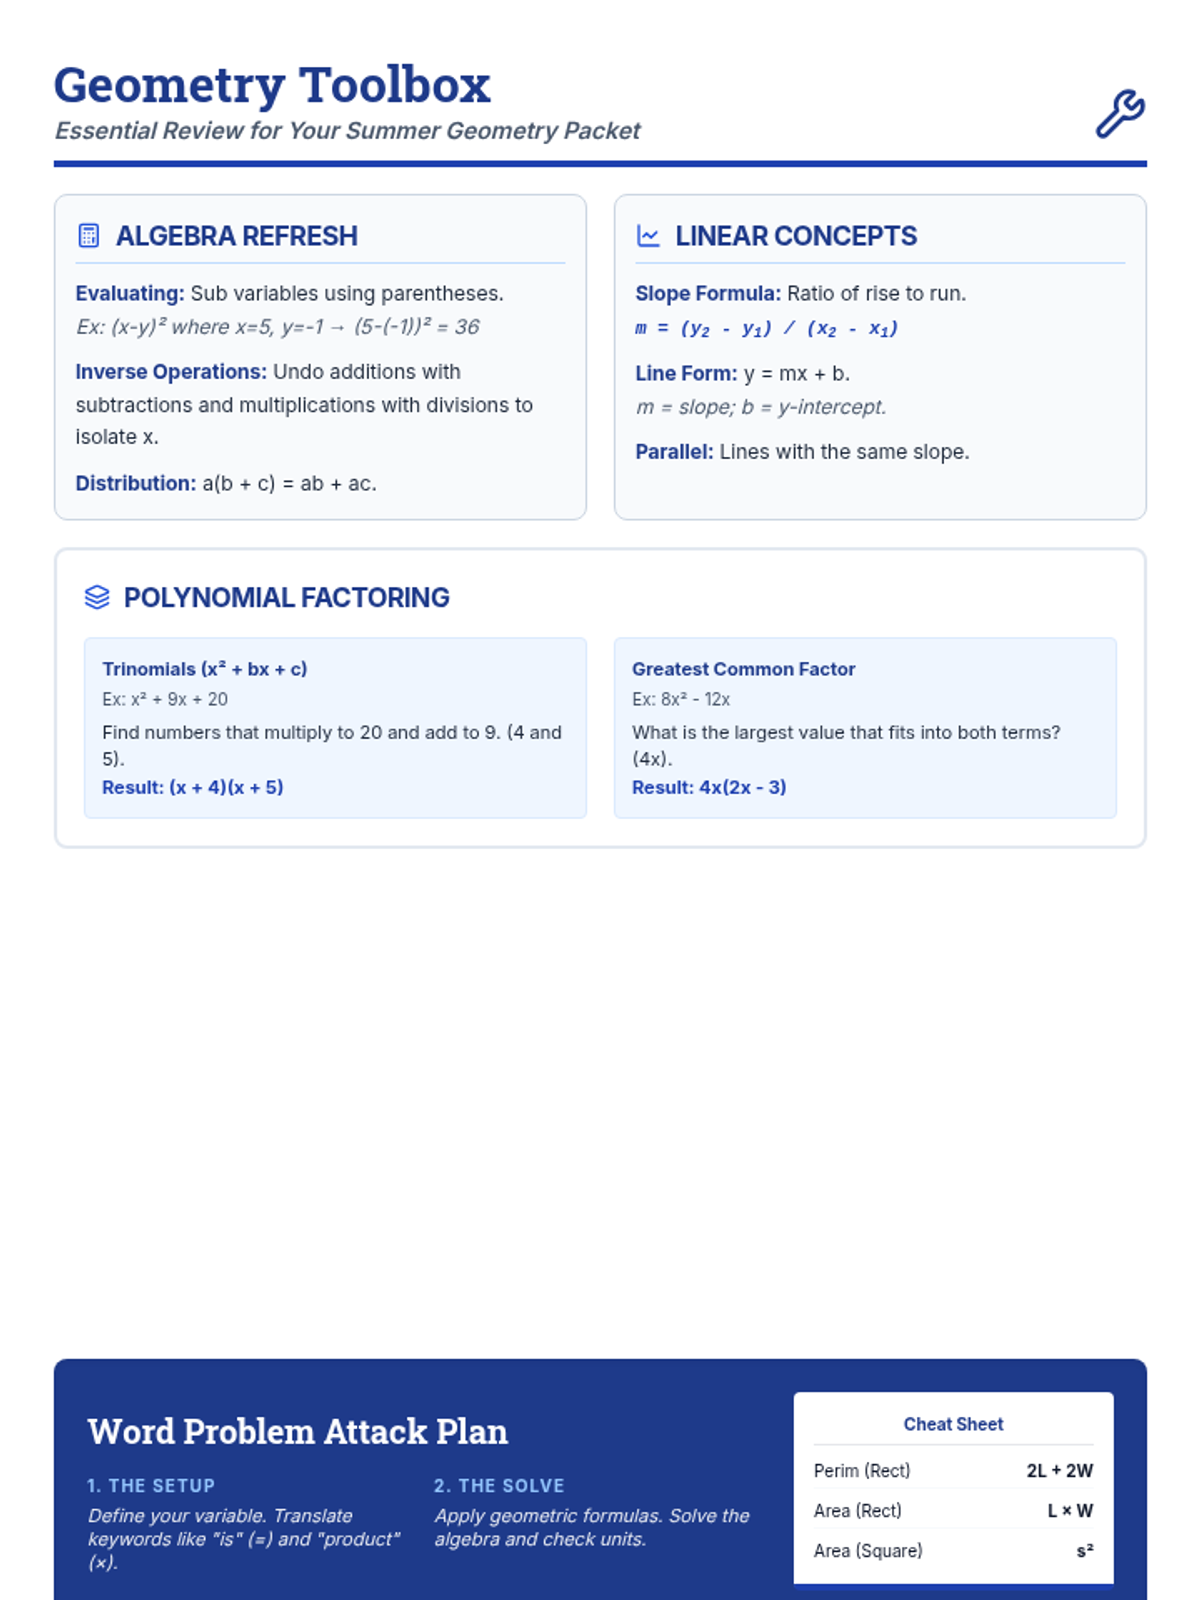
An updated summer geometry supplement featuring a toolbox with PEMDAS/GEMDAS, definitions for Area/Perimeter, and a 10x10 multiplication table. Includes 6 geometric word problems with structured workspace. Layout optimized for print across 4 pages.
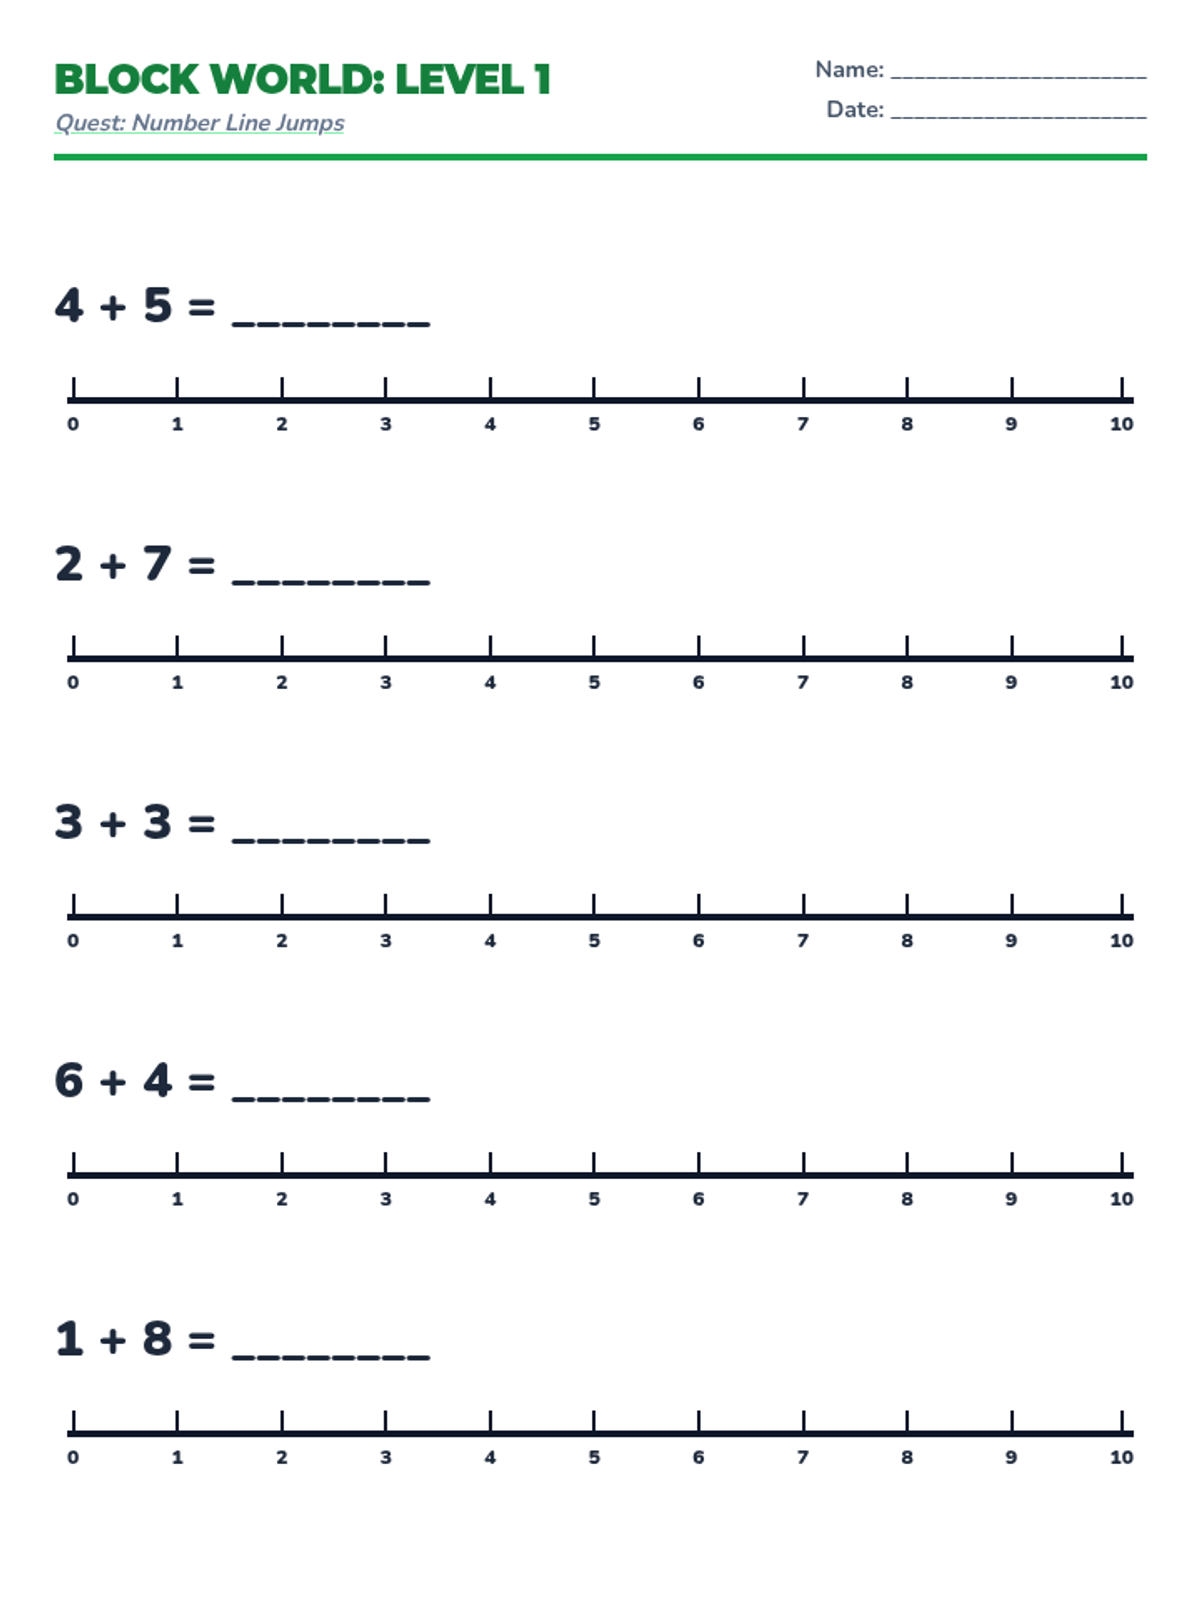
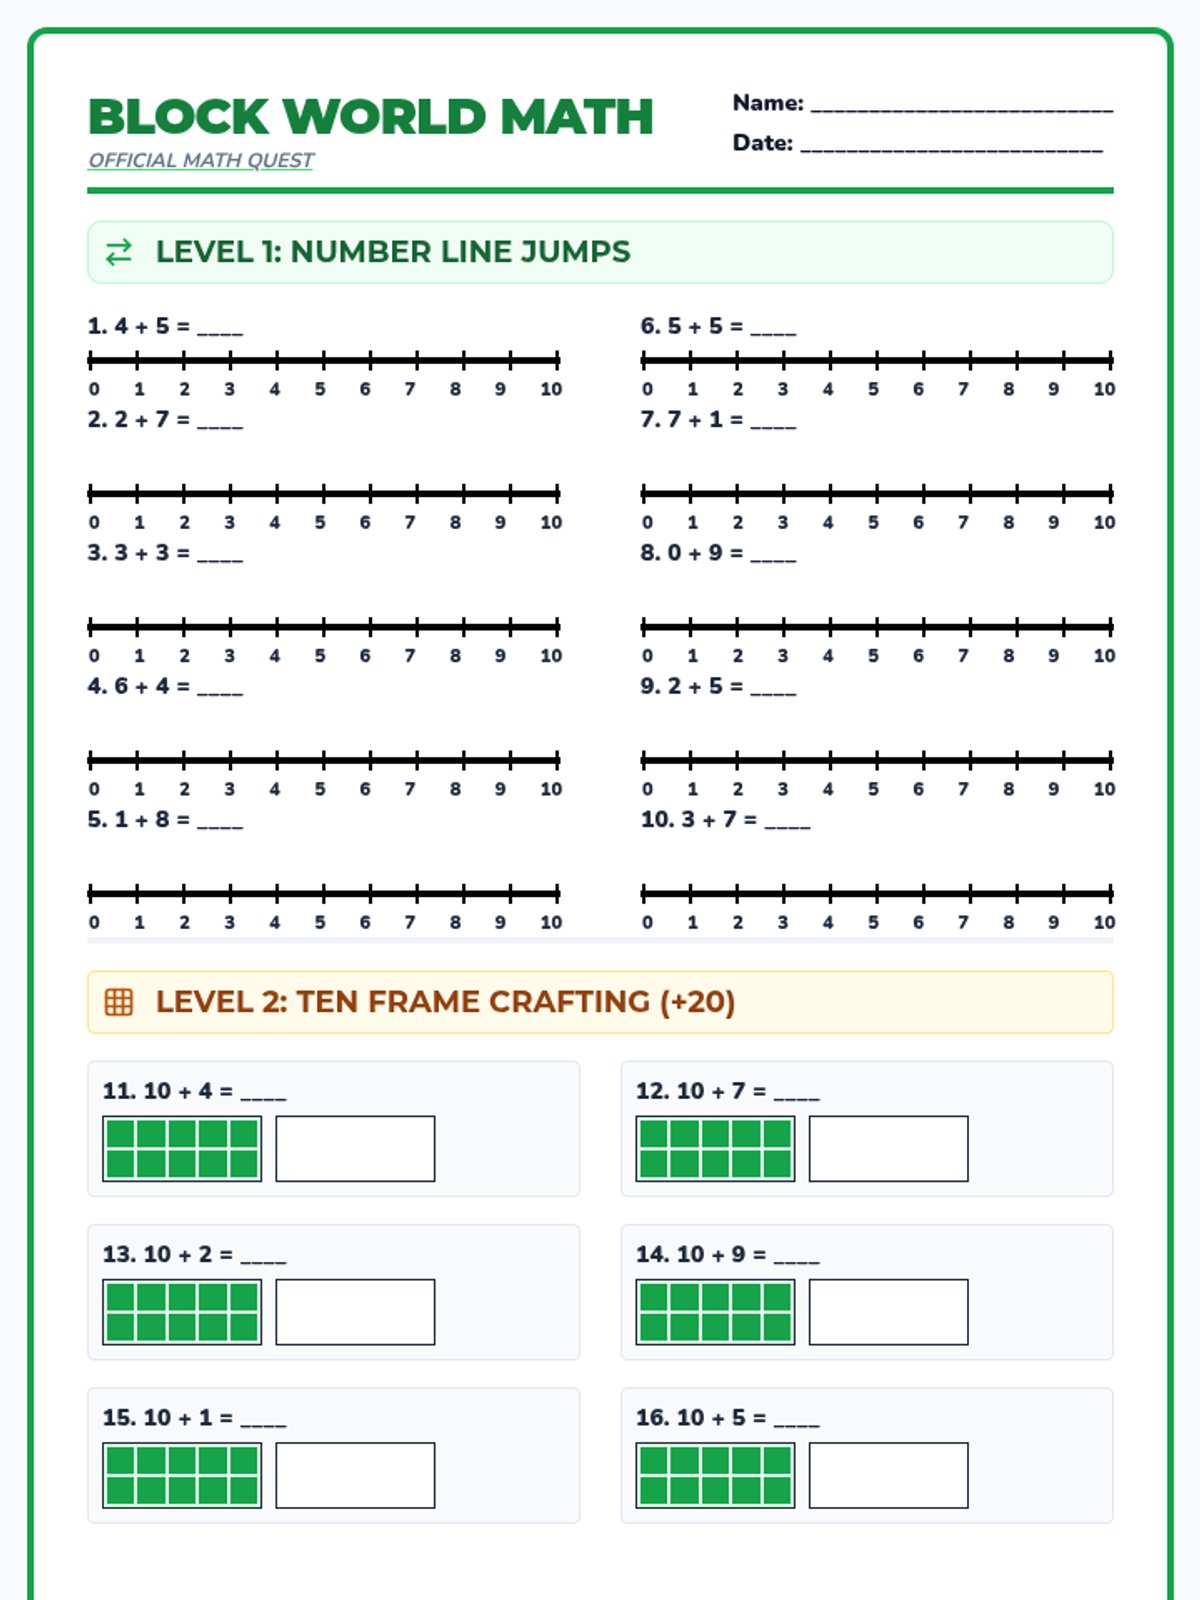
A 4-page Minecraft-themed math worksheet set featuring improved, larger ten frames for the 'addition to 20' level. The ten frames now include thicker dividers, 'grass block' filled cells, and high-visibility empty cells for student drawing. Overall consistency and visual polish maintained throughout all levels.
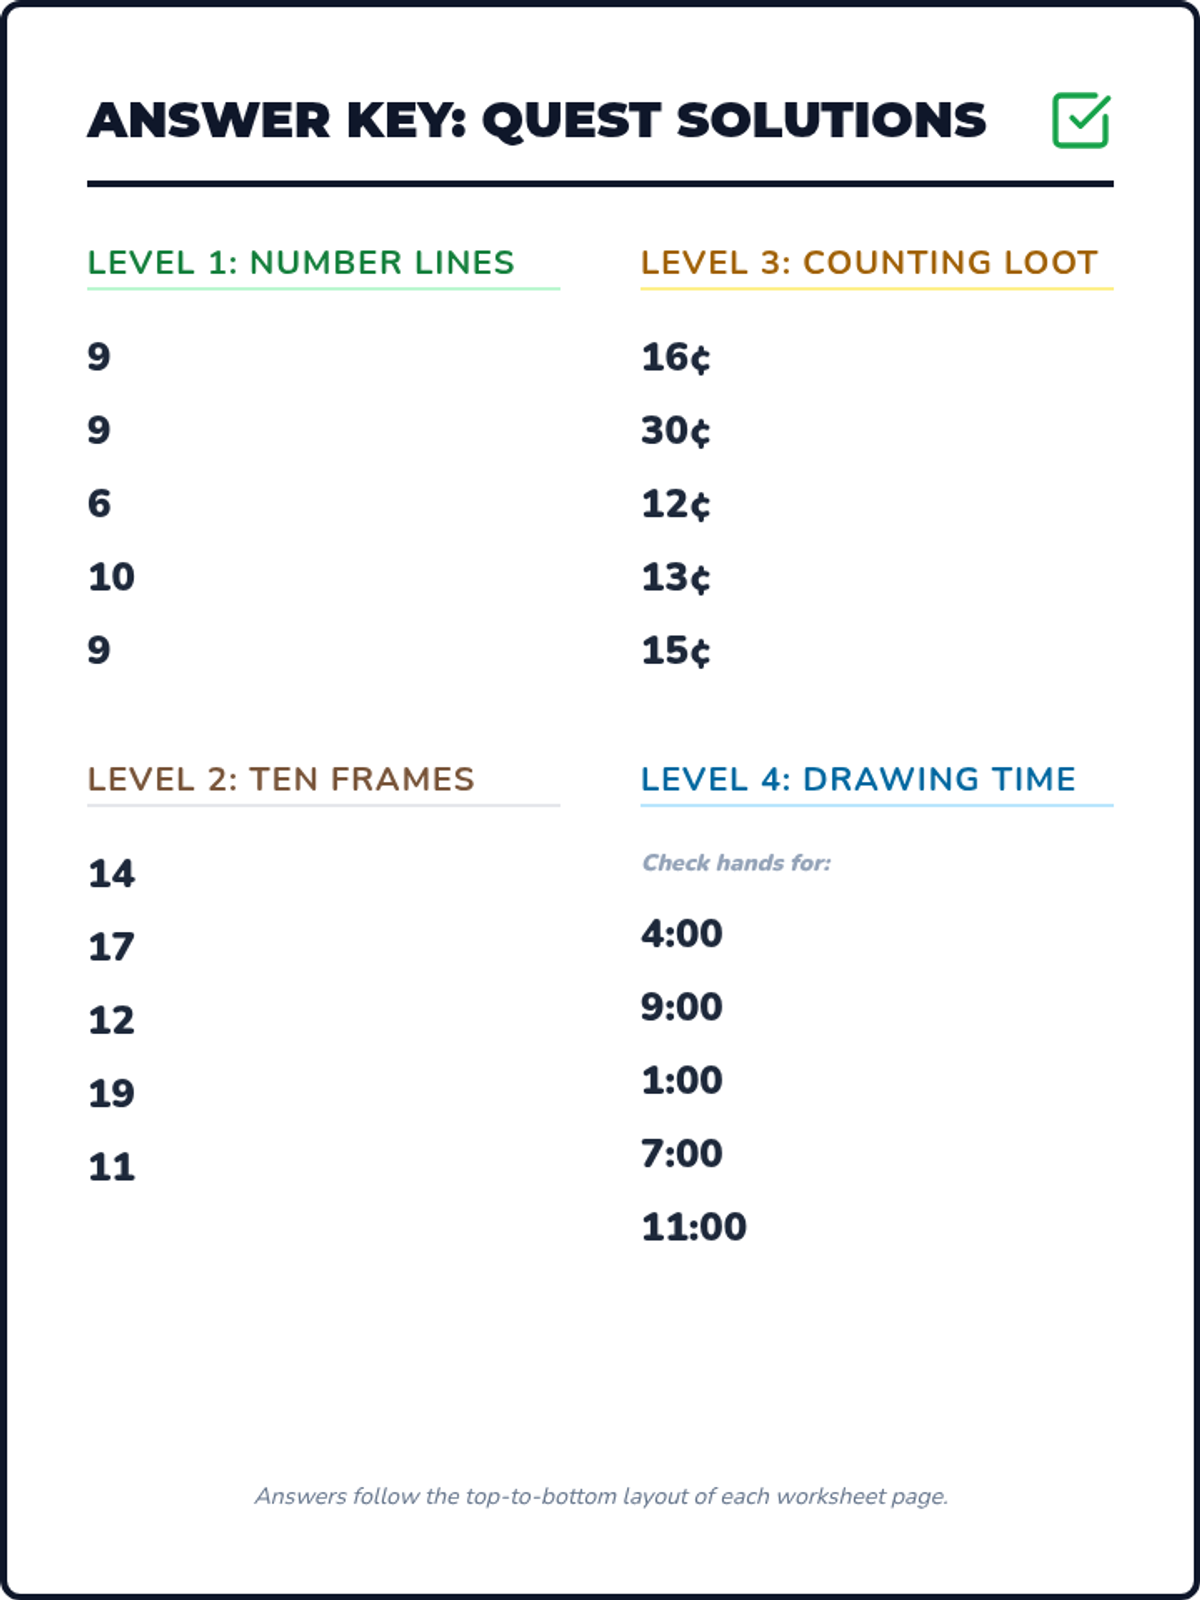
A single-page answer key for the Block Math Adventure worksheet, perfectly sized for 8.5x11 inch printing. Answers follow the layout of the worksheet pages with 5 problems per section. Labels updated to matchQuest names. Corrected contrast and variety. Standard reading order.
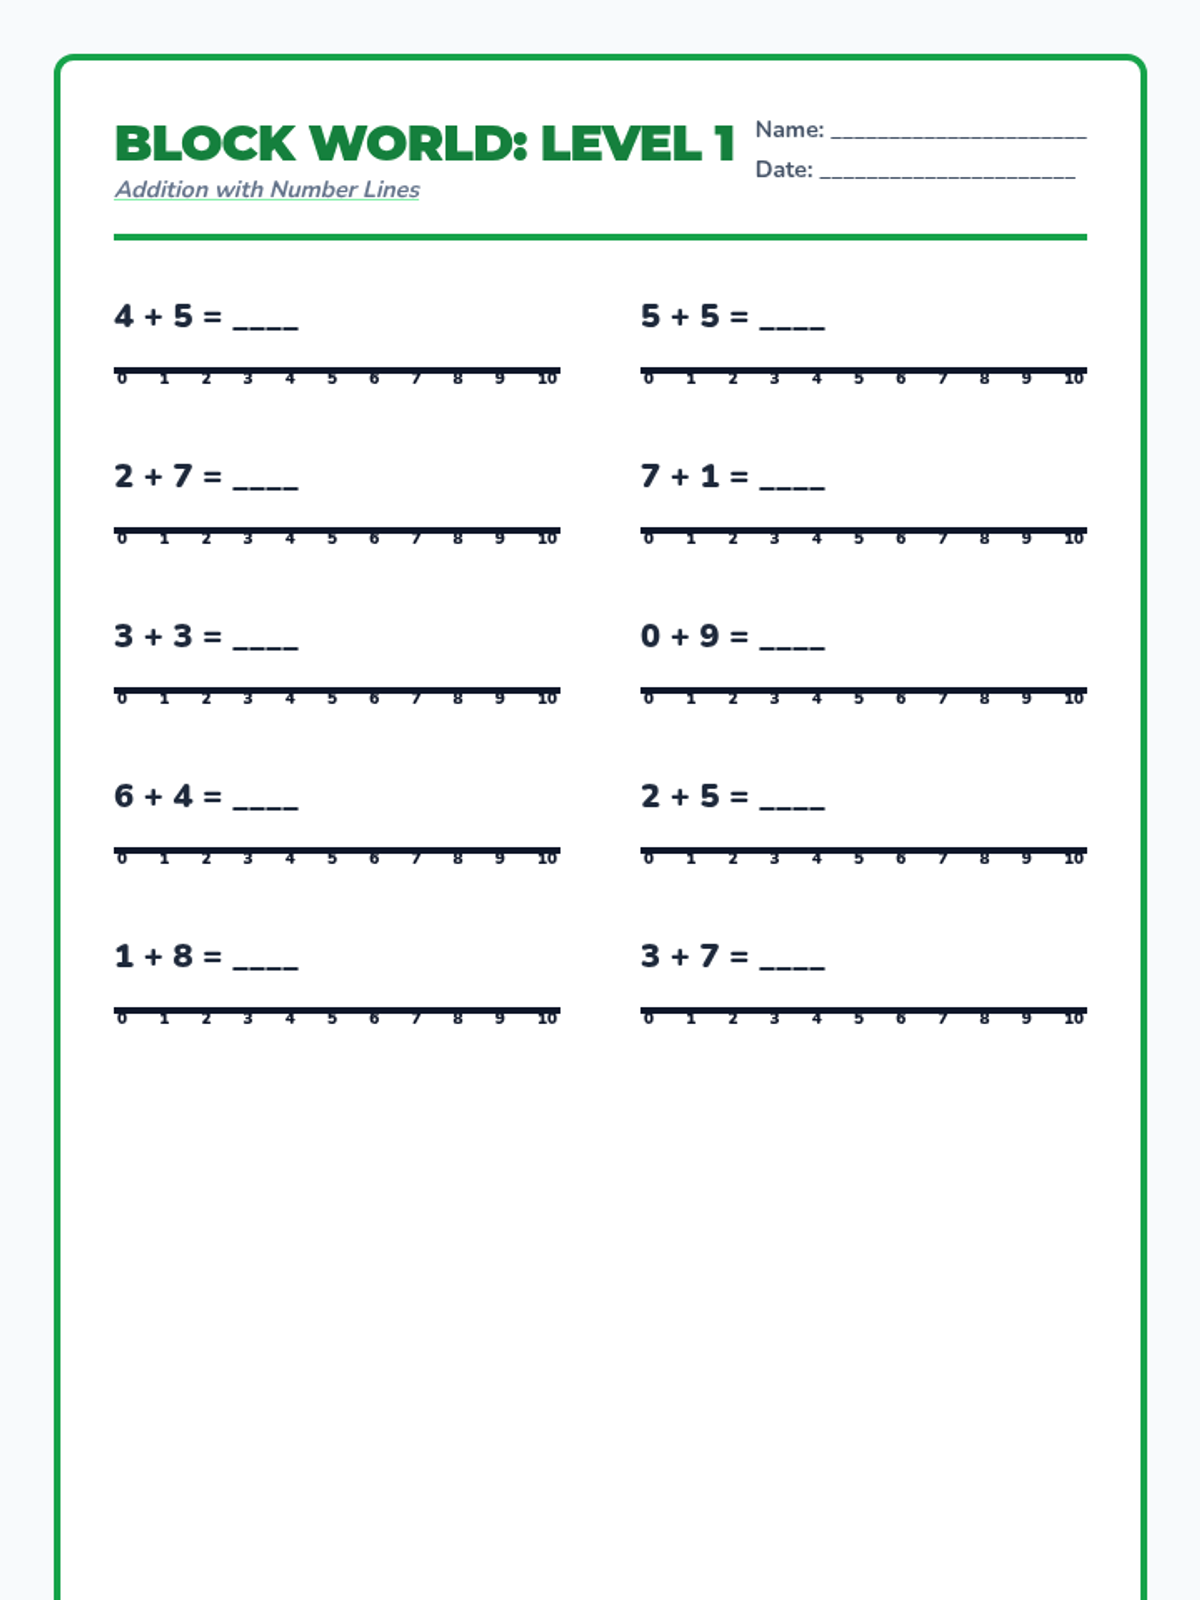
A comprehensive four-page Minecraft-themed worksheet, with each page dedicated to a specific level: addition to 10, addition to 20, counting coins with labels, and clocks. No problem numbering included.
An engaging presentation with 20 individual practice slides (5 per level) covering addition, money, and time. Redesigned with corrected number lines (with tick marks), populated ten frames, and clear clock drawing slides. Darkened answer areas and high-contrast work zones for classroom smartboard use. Exact quantity of 5 problems per level.
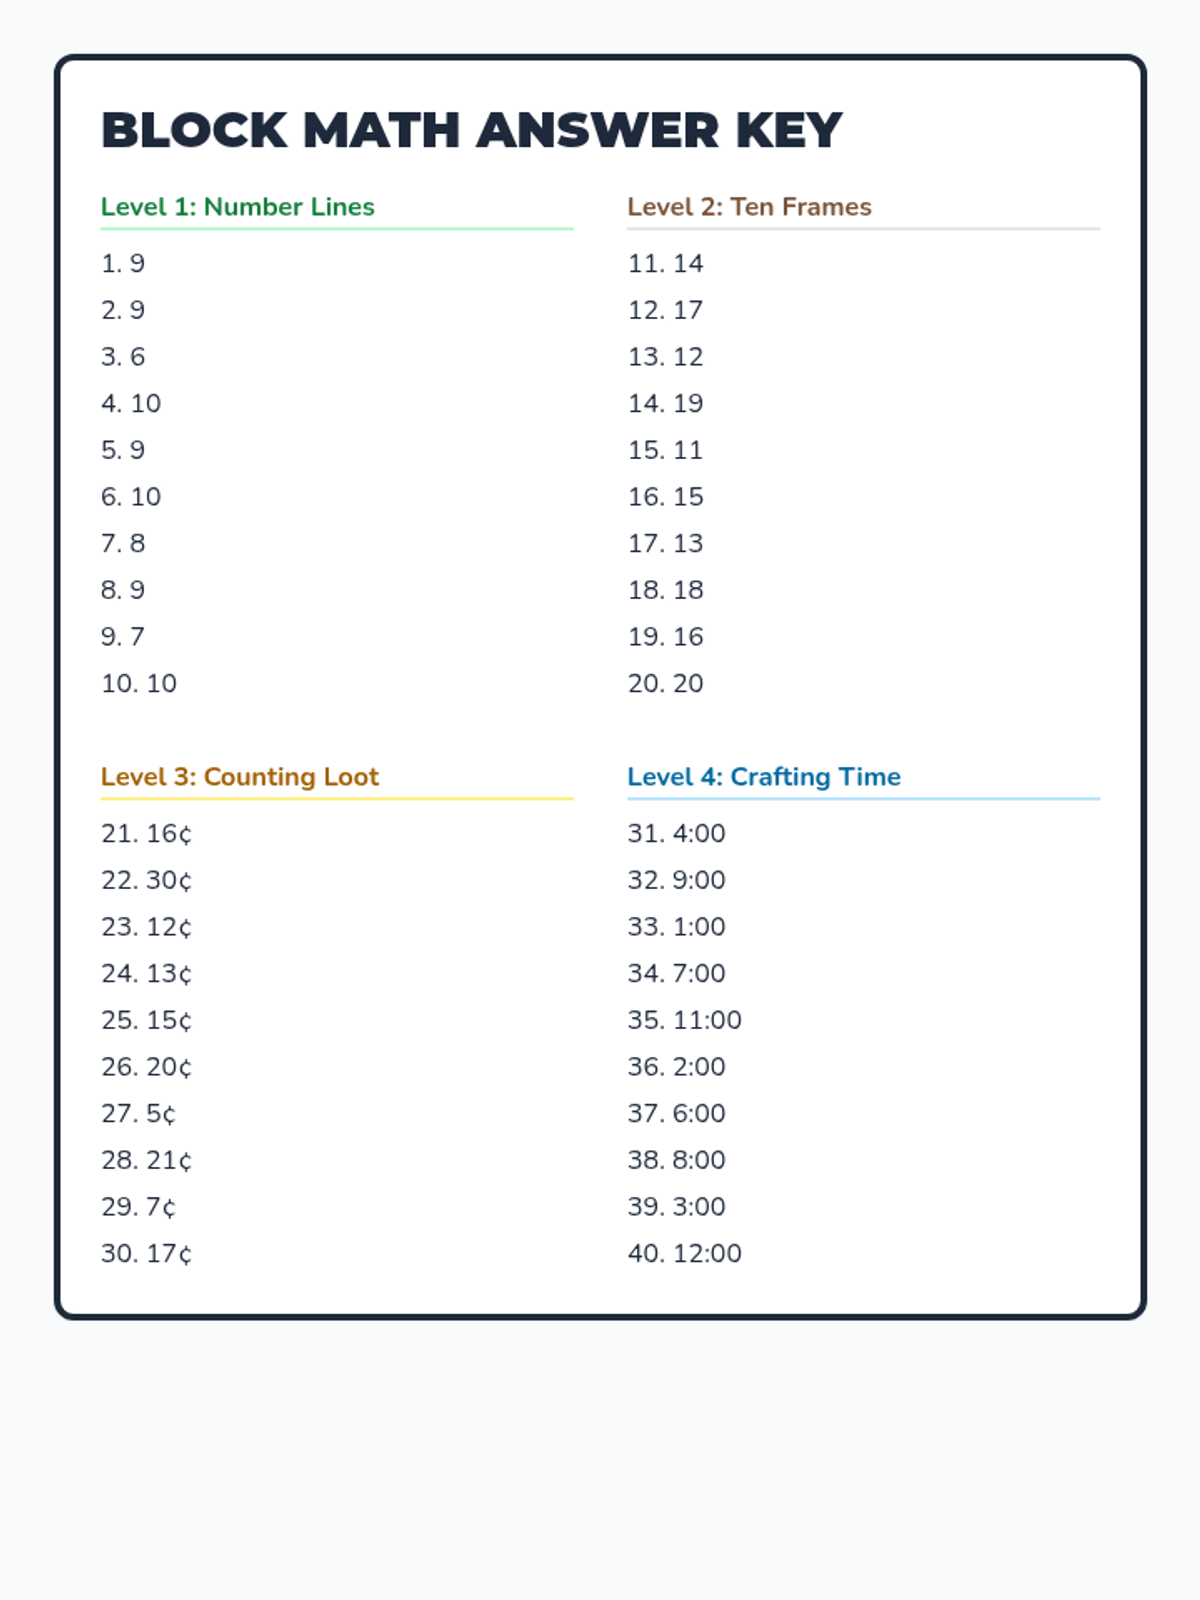
Teacher's answer key for the Block Math Worksheet, providing quick-reference solutions for all 40 problems.
A comprehensive two-page Minecraft-themed worksheet containing 40 problems covering number lines, ten frames, counting coins, and telling time. Round coins labeled with amounts replace the lettered icons. Corrected ten-frame and clock visuals.
An engaging slide deck introducing four key math skills using a cohesive Minecraft-inspired aesthetic. Includes all 40 practice problems from the worksheet for smartboard demonstration, with coins updated to round icons labeled with amounts and corrected clock visuals.
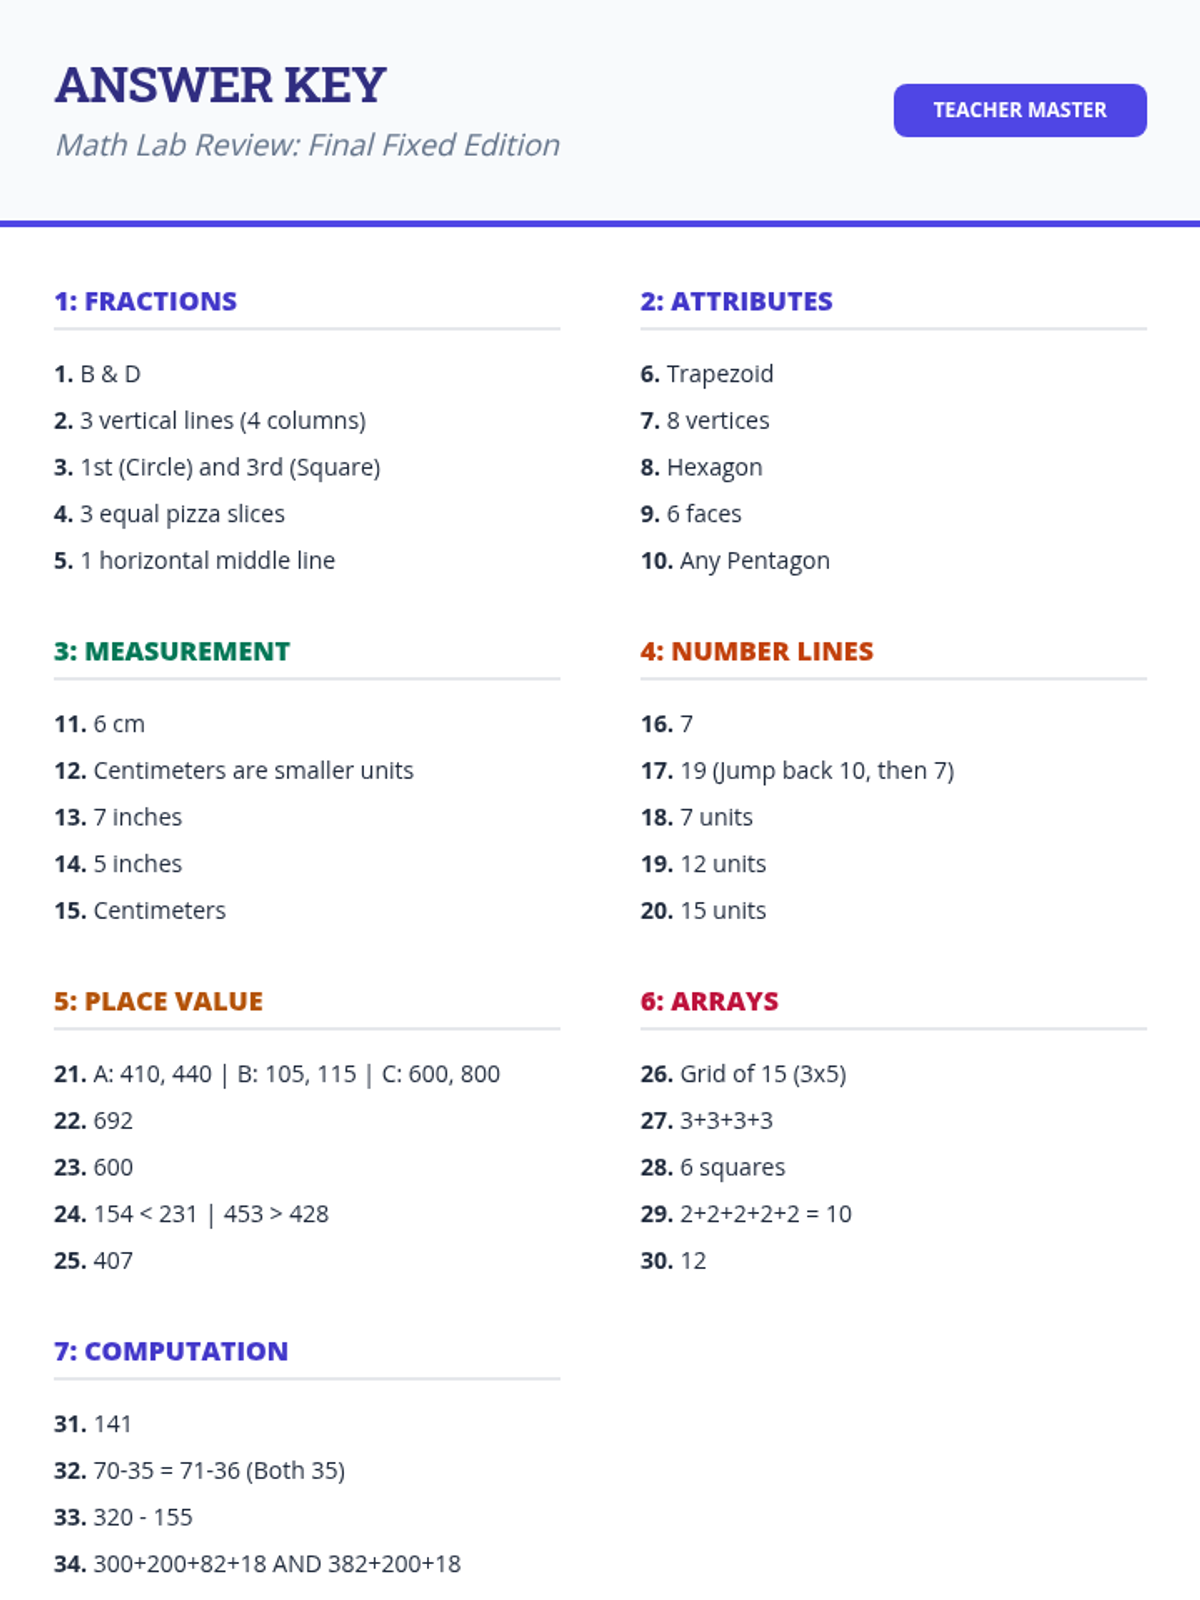
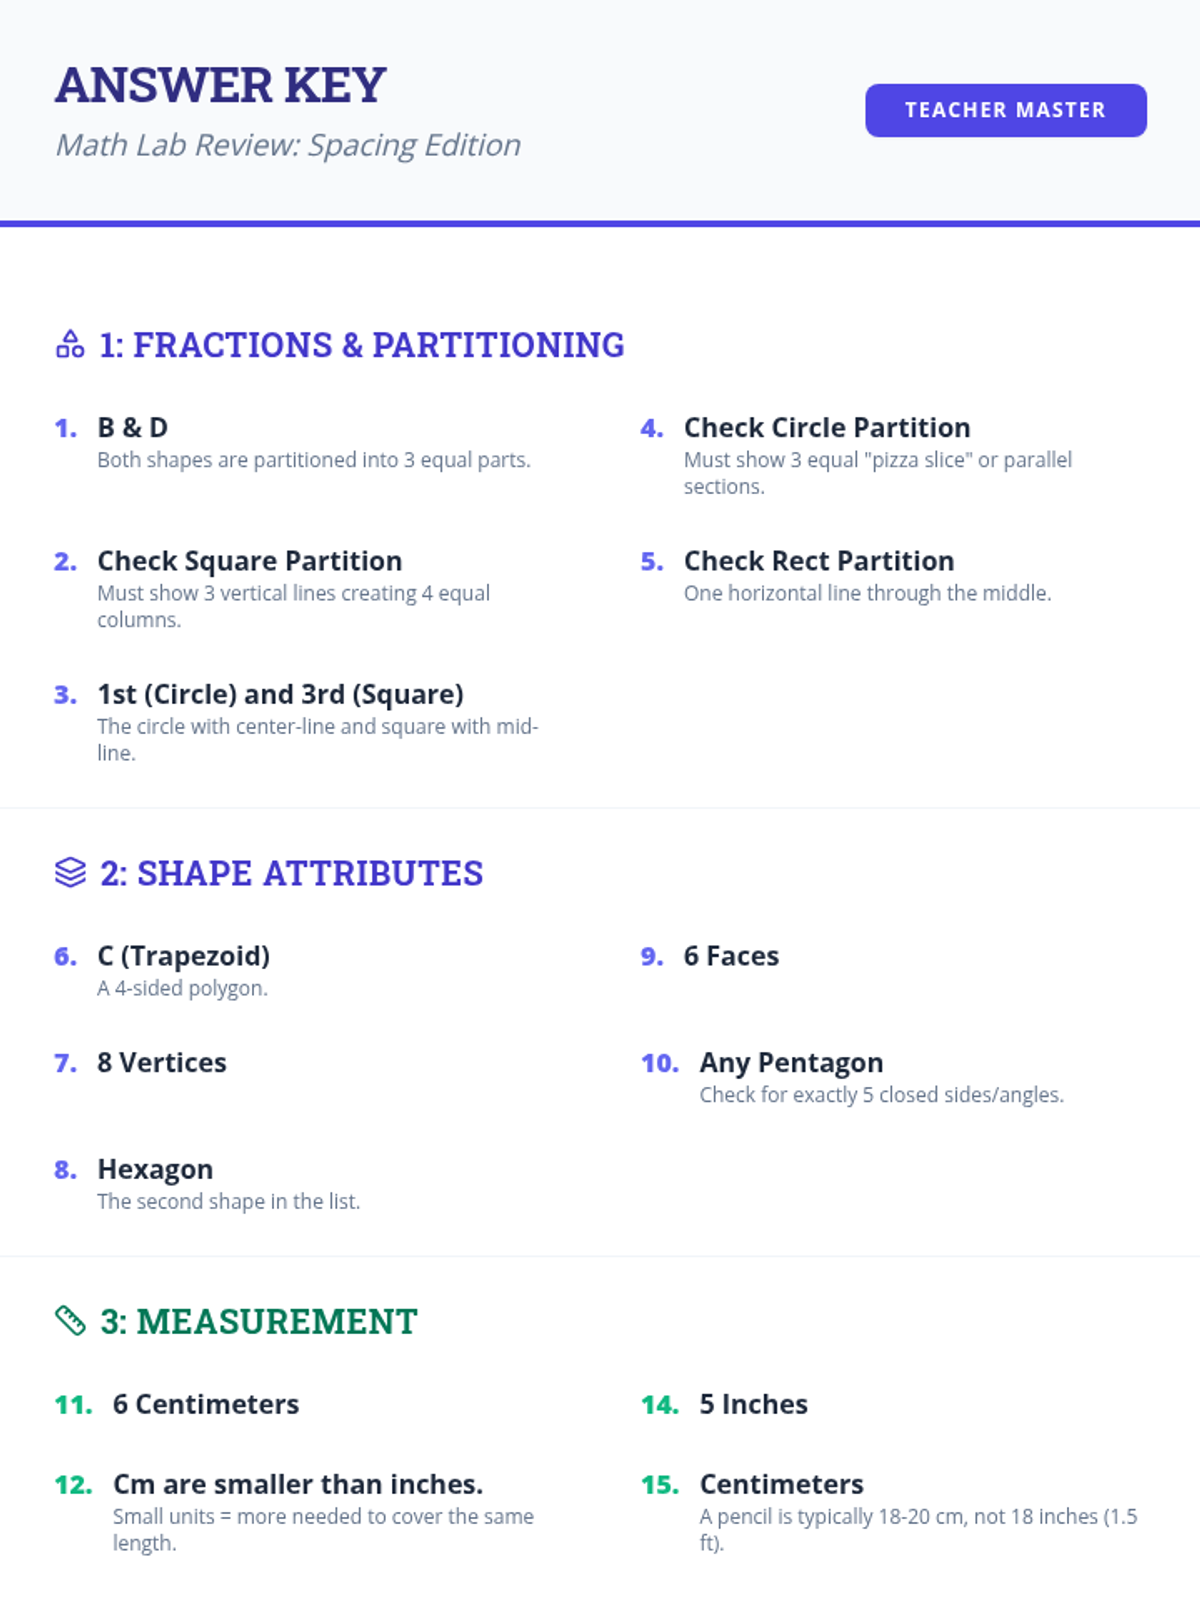
A revised answer key for the final polished version of the Math Lab Review Packet, ensuring perfect alignment with the corrected questions and strategies.
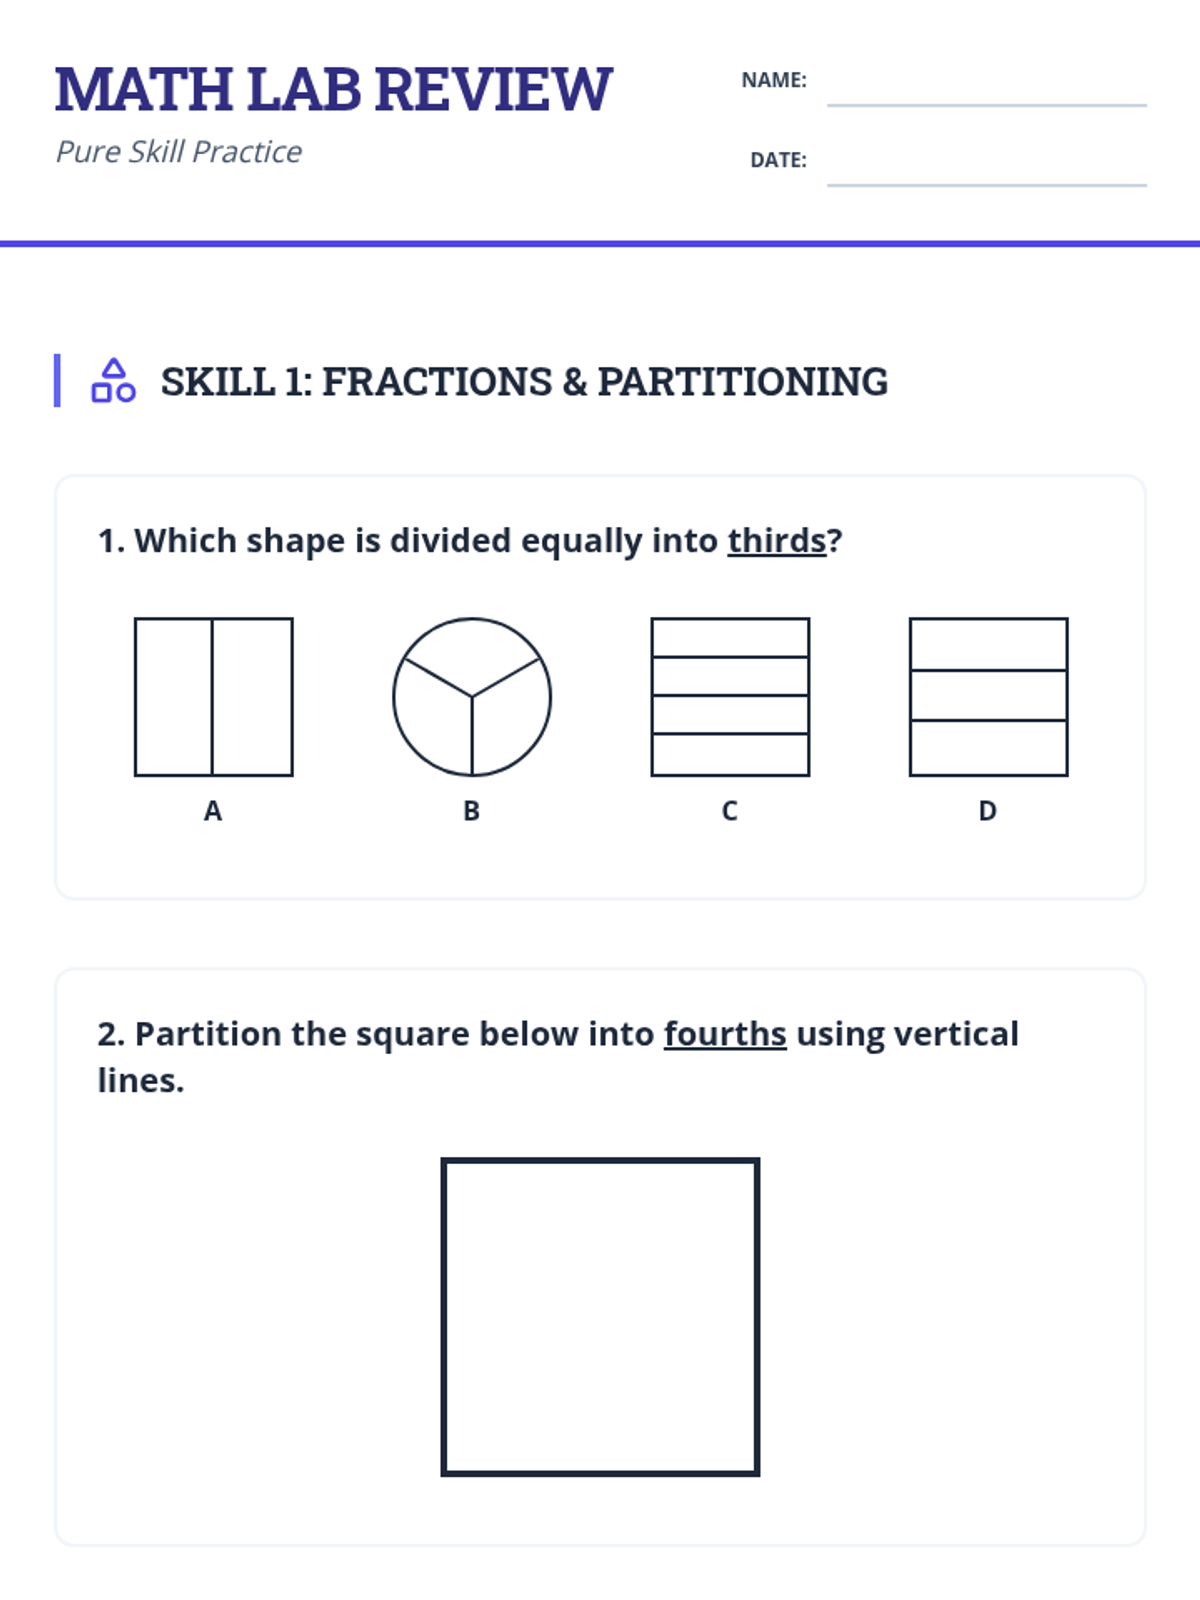
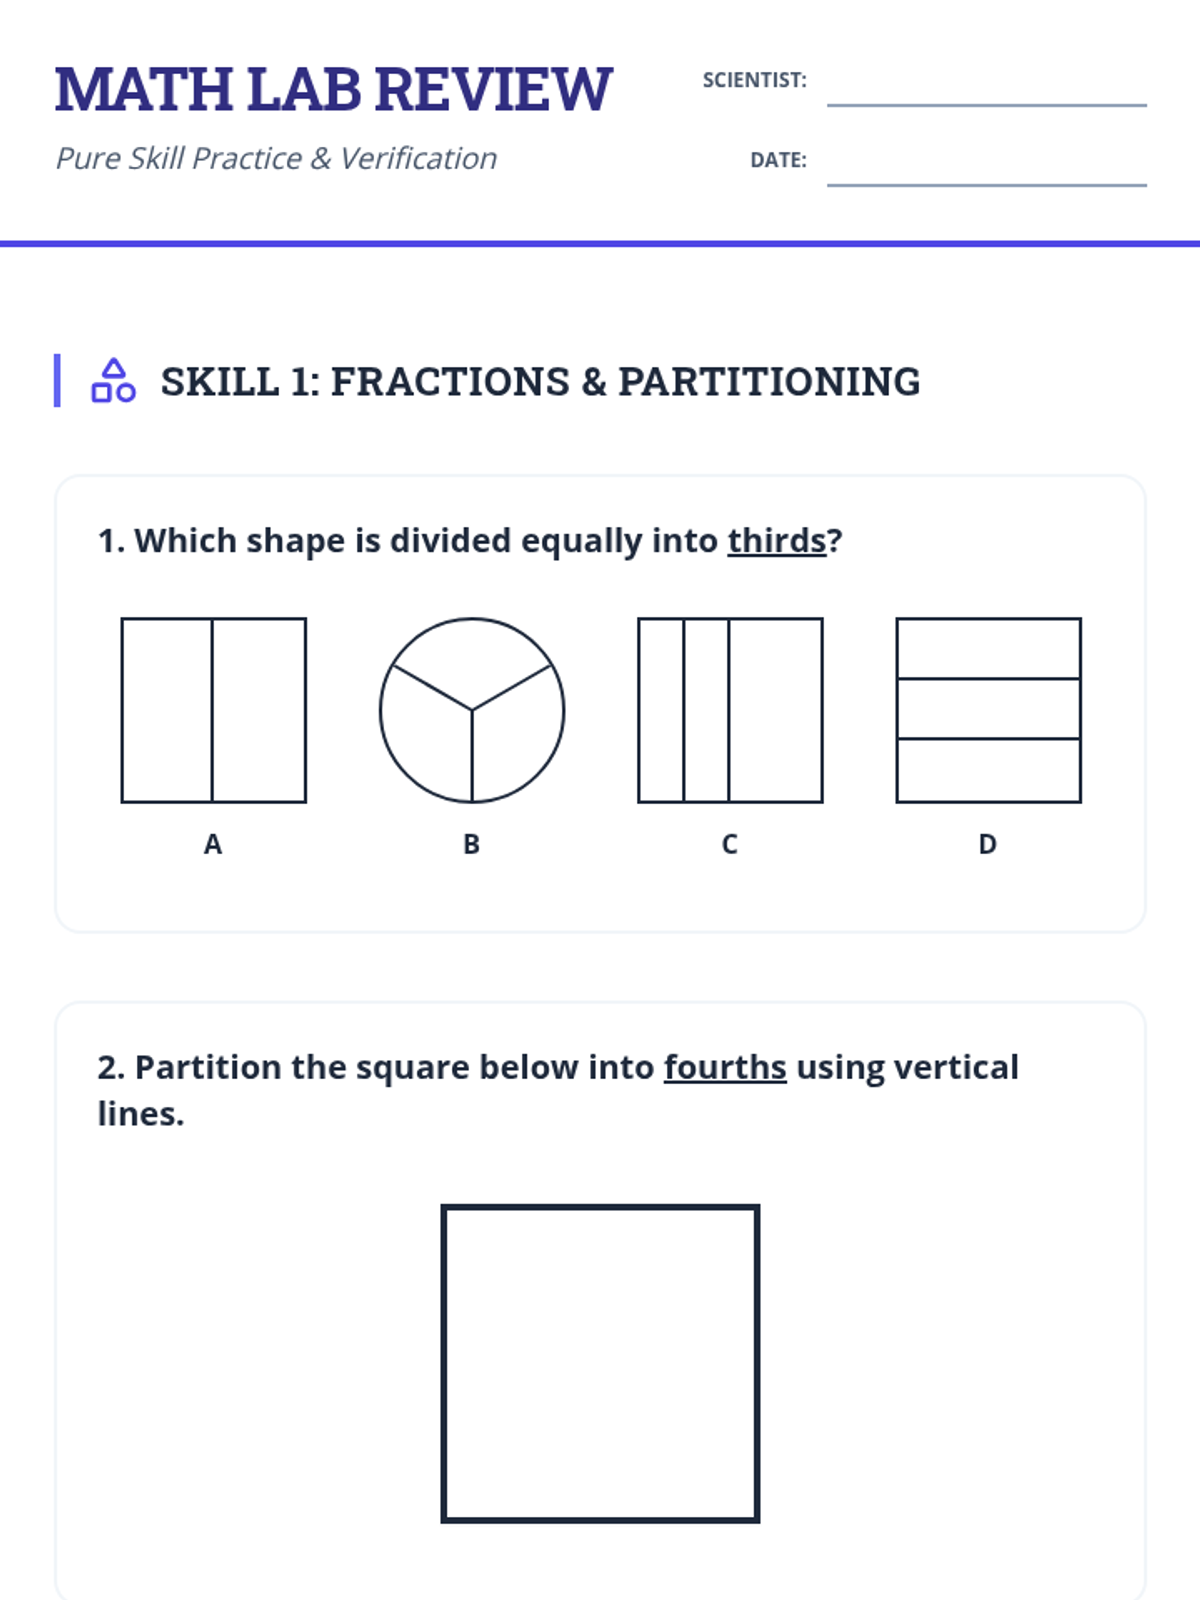
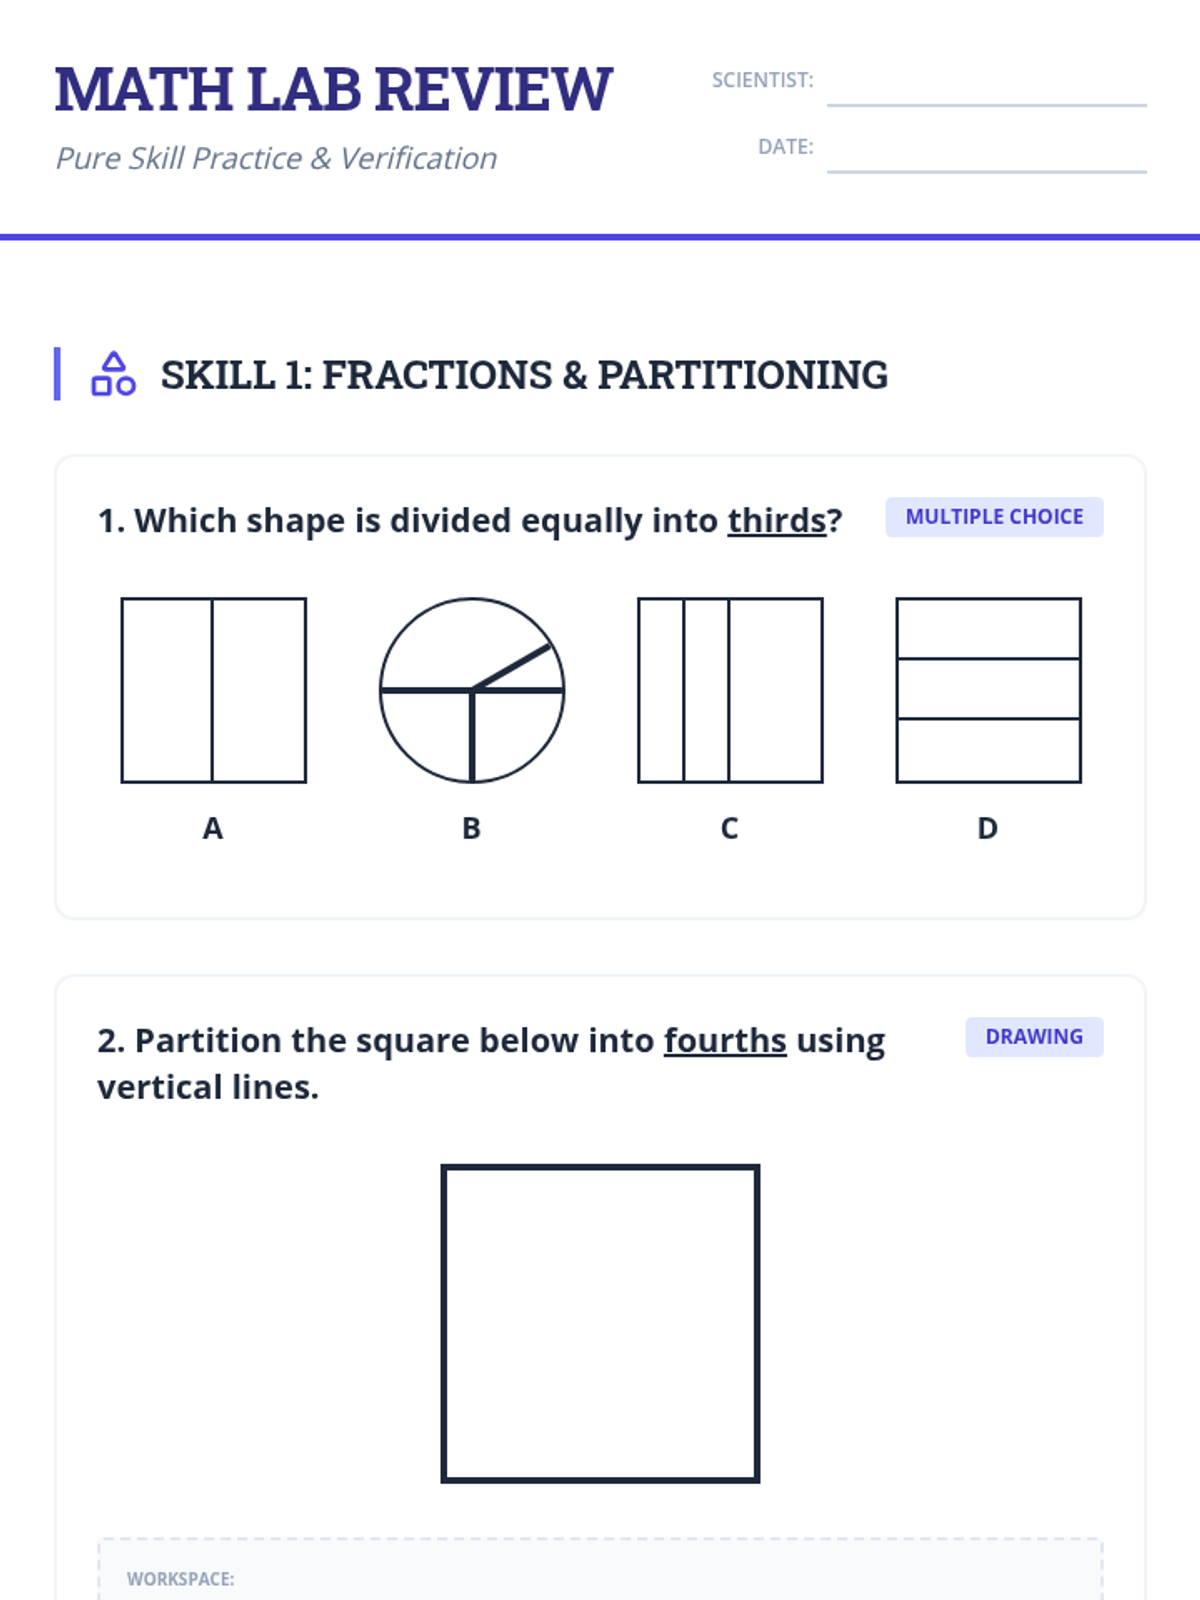
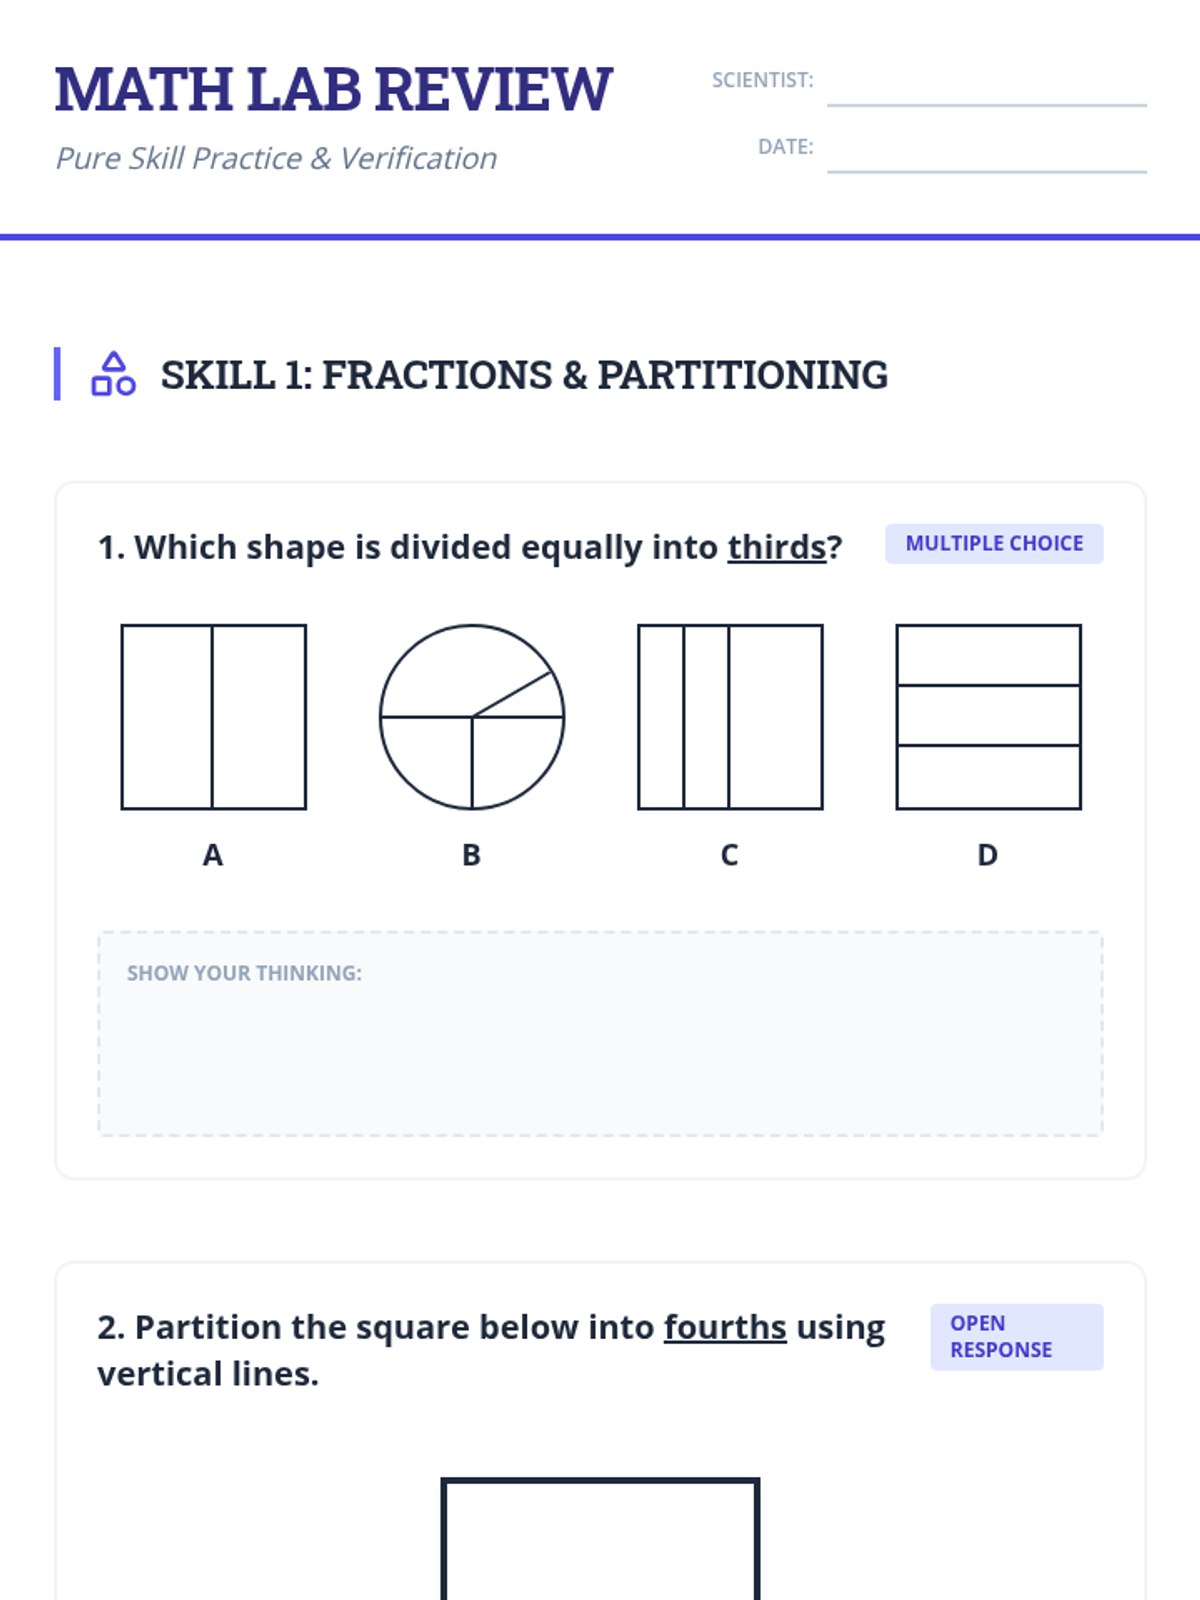
A finalized 35-question practice packet for 2nd grade math with improved mathematical accuracy, efficient layout to reduce page count, and large, dark-bordered workspace areas for clear handwriting and print quality.
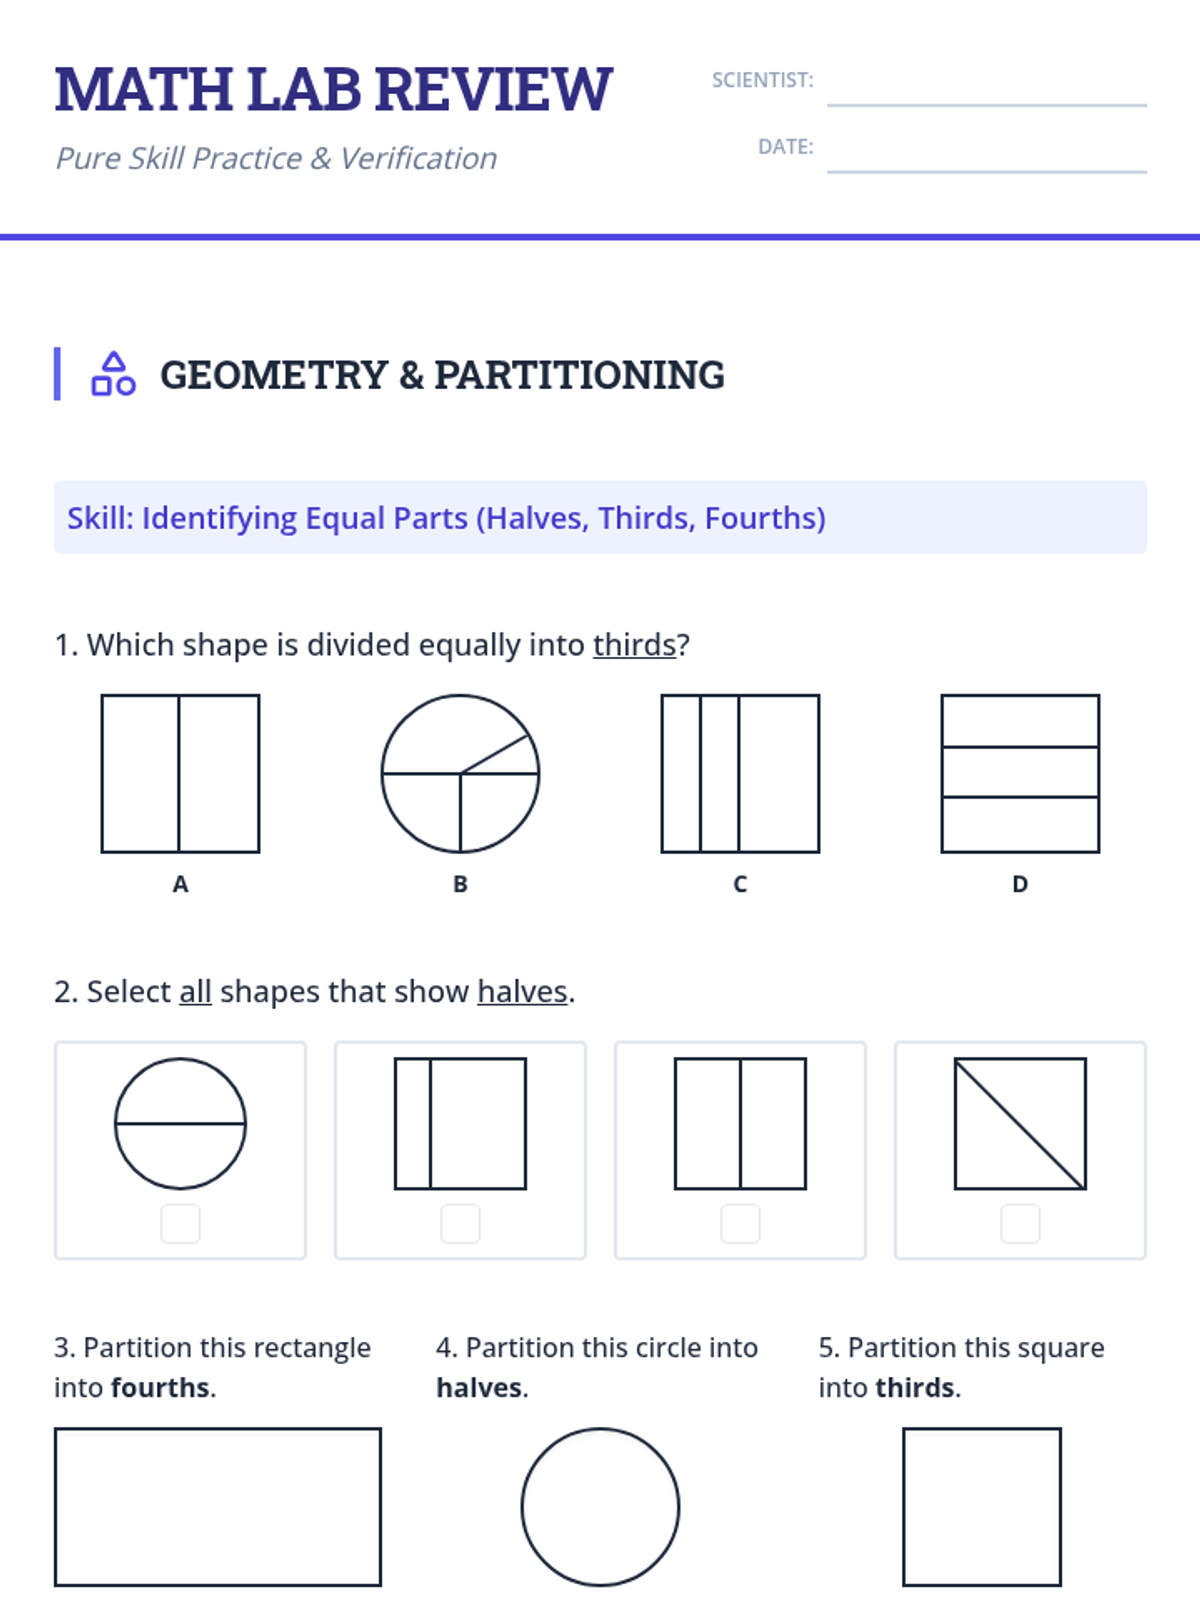
An expanded 35-question practice packet for 2nd grade math, featuring dedicated workspace boxes for every problem, large geometric diagrams, and ample handwriting space for students to show their thinking.
A revised answer key for the Spacing edition of the Math Lab Review Packet, featuring detailed solution notes and strategy checks for educators.
A revised answer key for the Math Lab Review Packet with improved alignment and complete solutions.
A revised 35-question practice packet for 2nd grade math, organized by skill sets with improved visual clarity, larger answer areas, and accurate geometric diagrams.
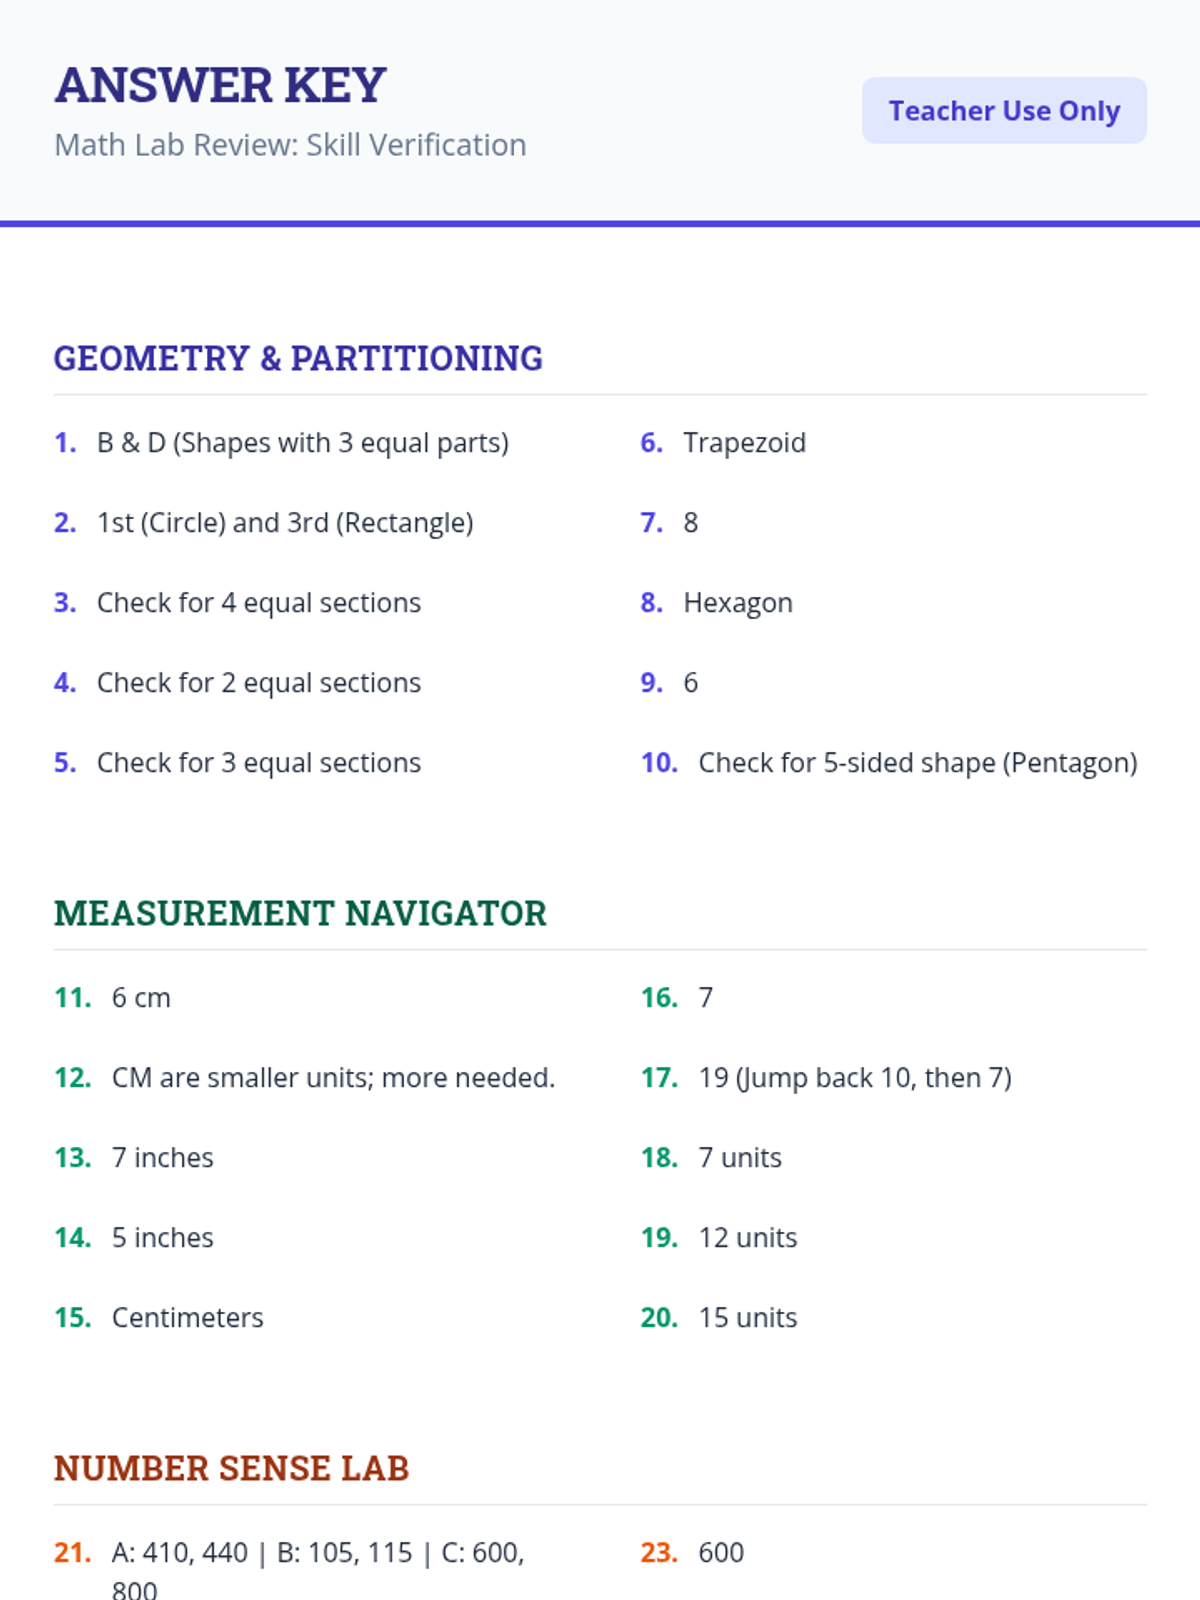
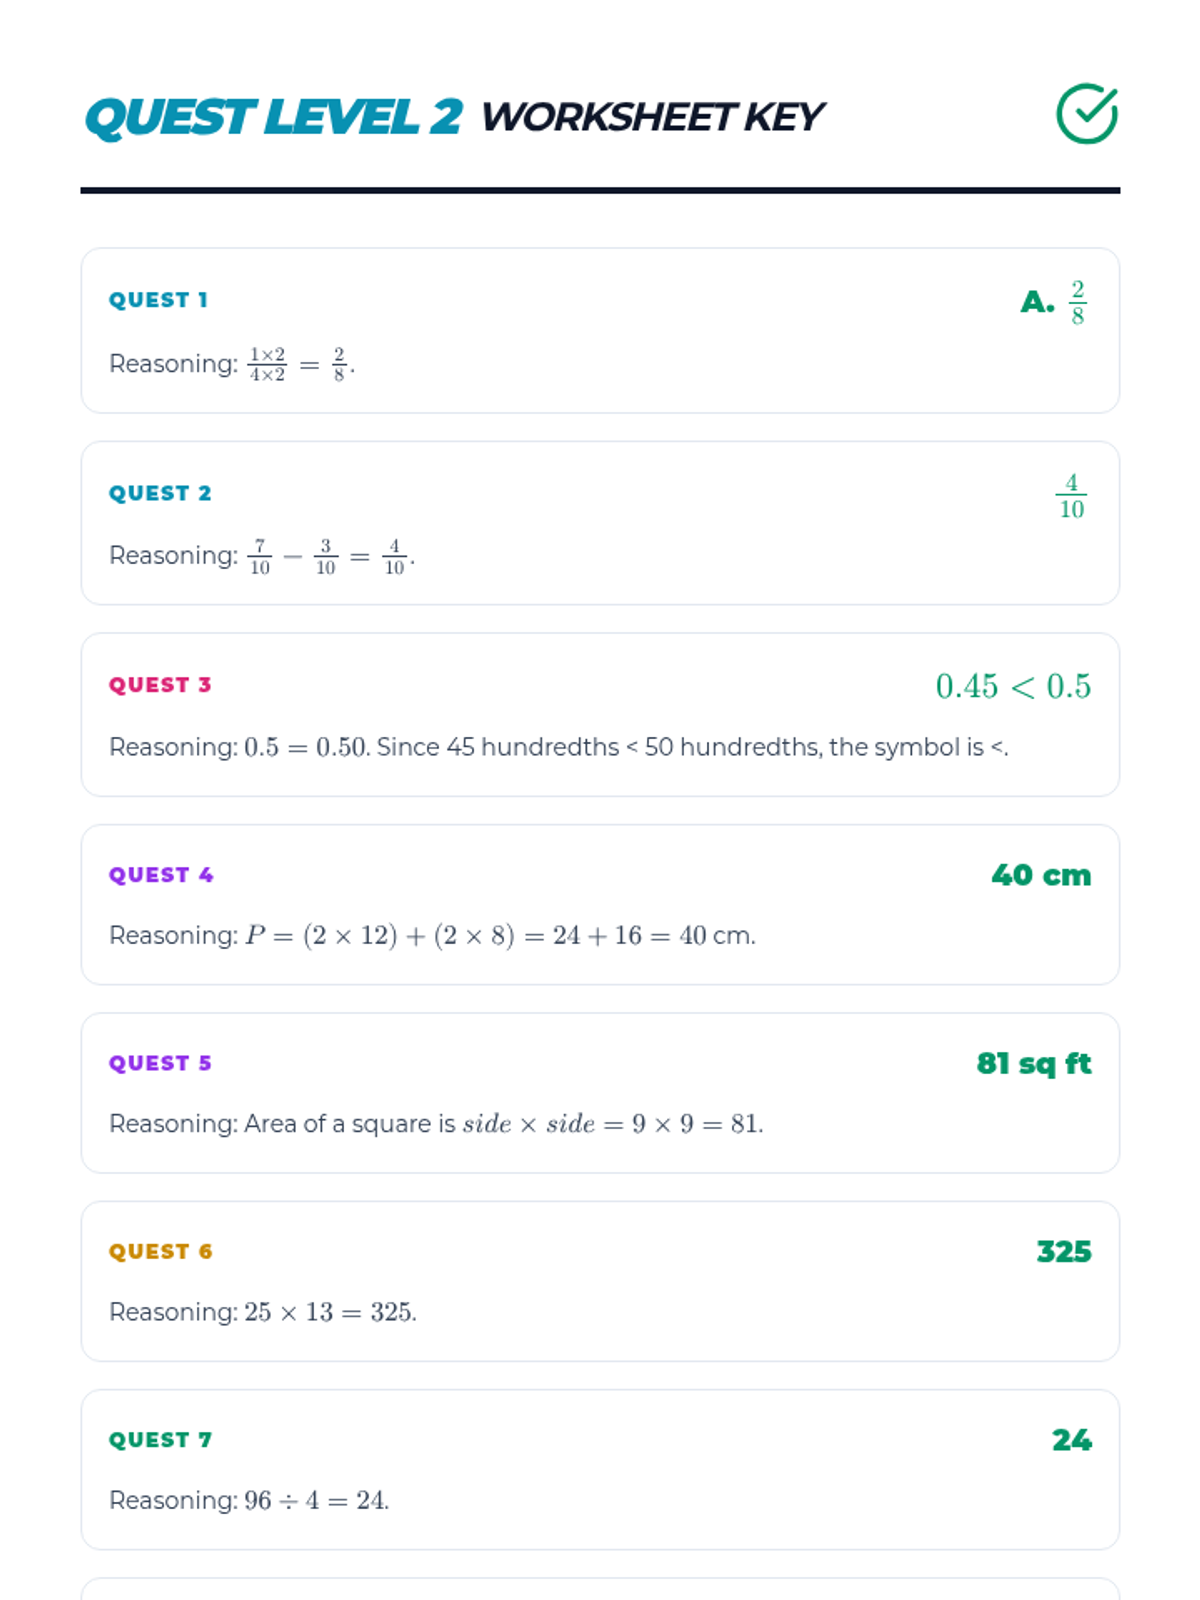
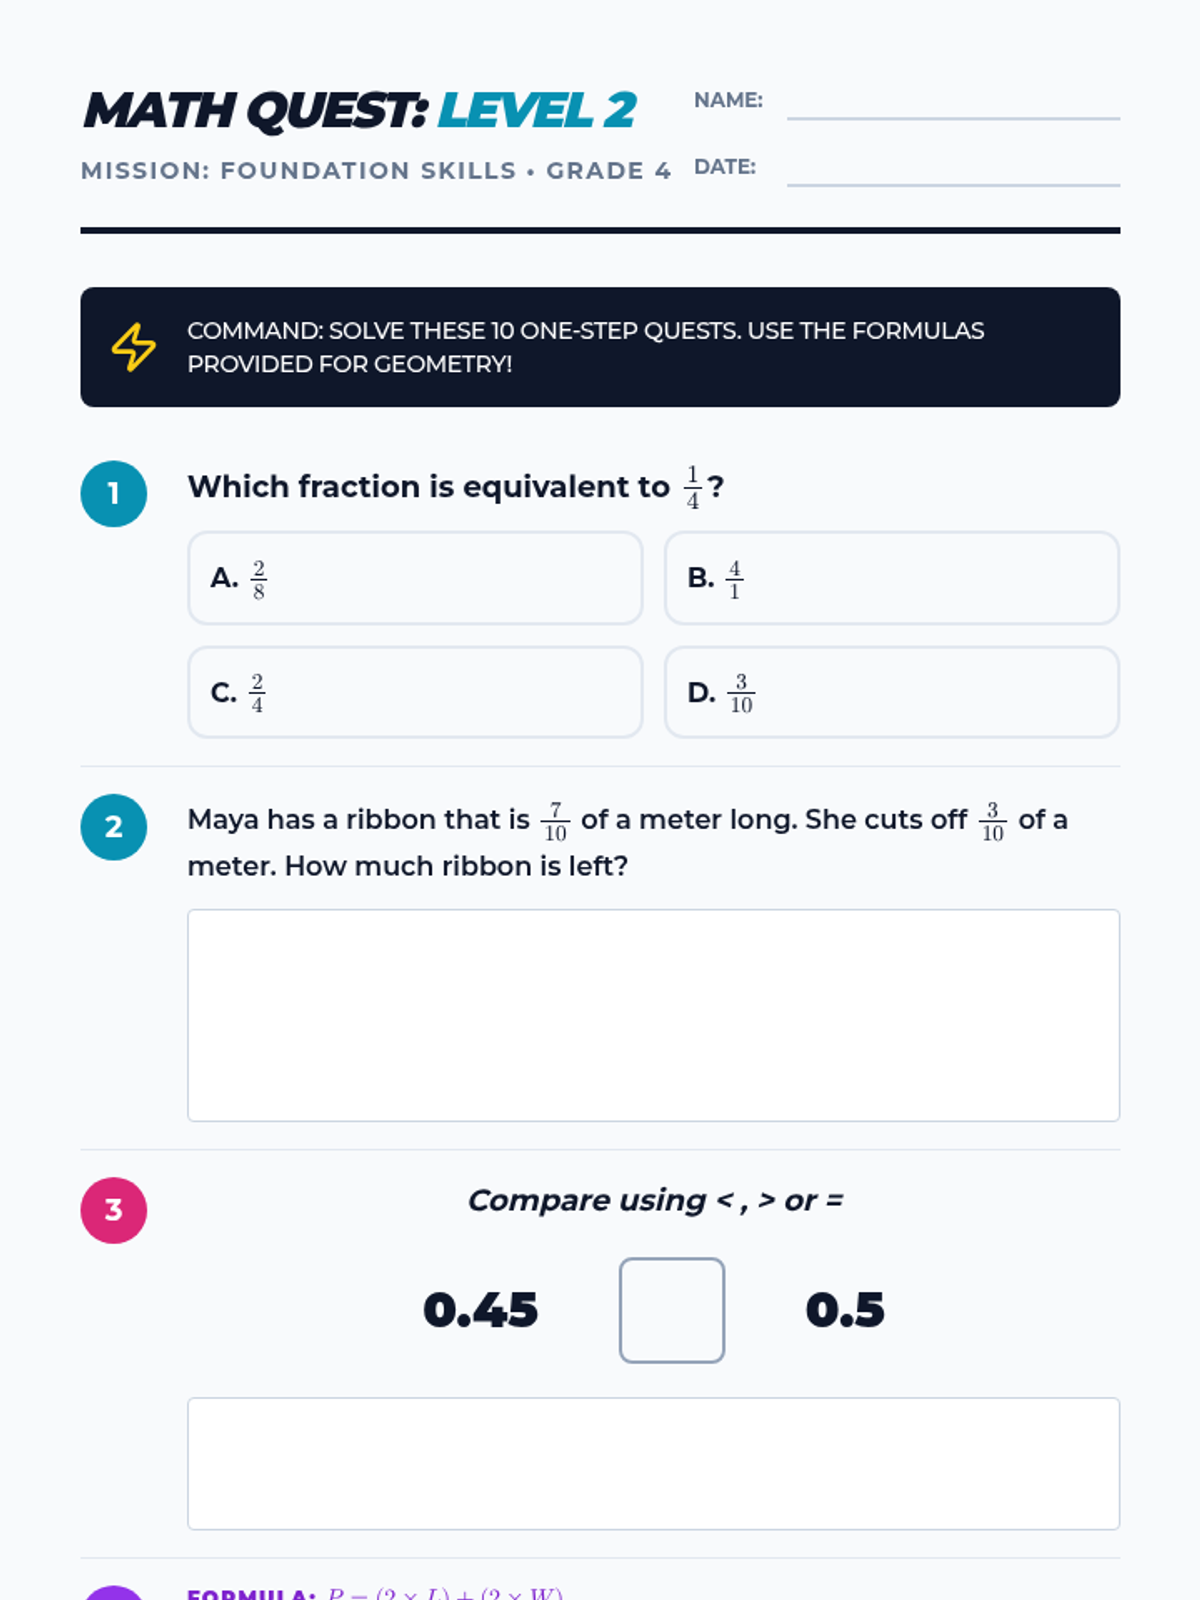
Teacher answer key for the second Math Quest worksheet. Includes correct answers and clear reasoning for all 10 one-step and geometry problems.
A second 10-question math worksheet focusing on one-step word problems and geometry formulas (perimeter and area). It covers fractions, decimals, geometry, multiplication, division, and place value. (Revised for layout and content fixes)
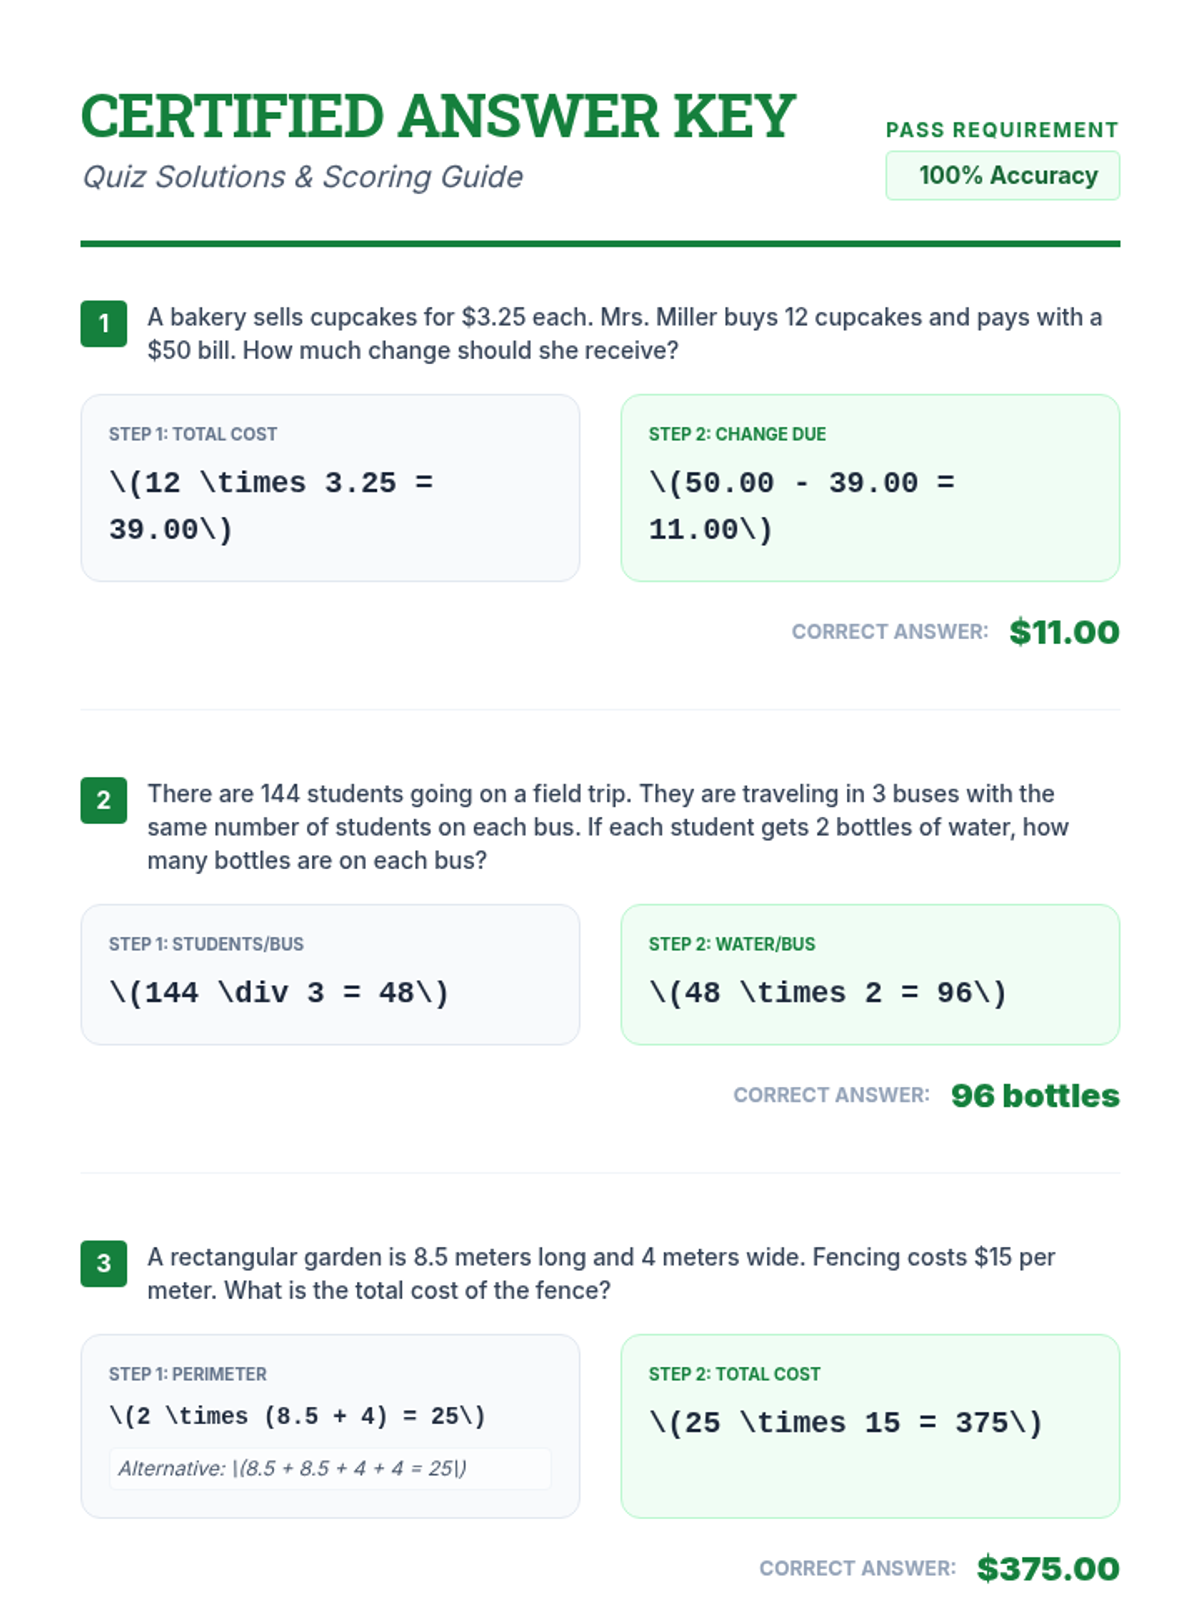
Detailed answer key for the Certification Mission quiz, including step-by-step calculations and alternative solution paths for teachers.
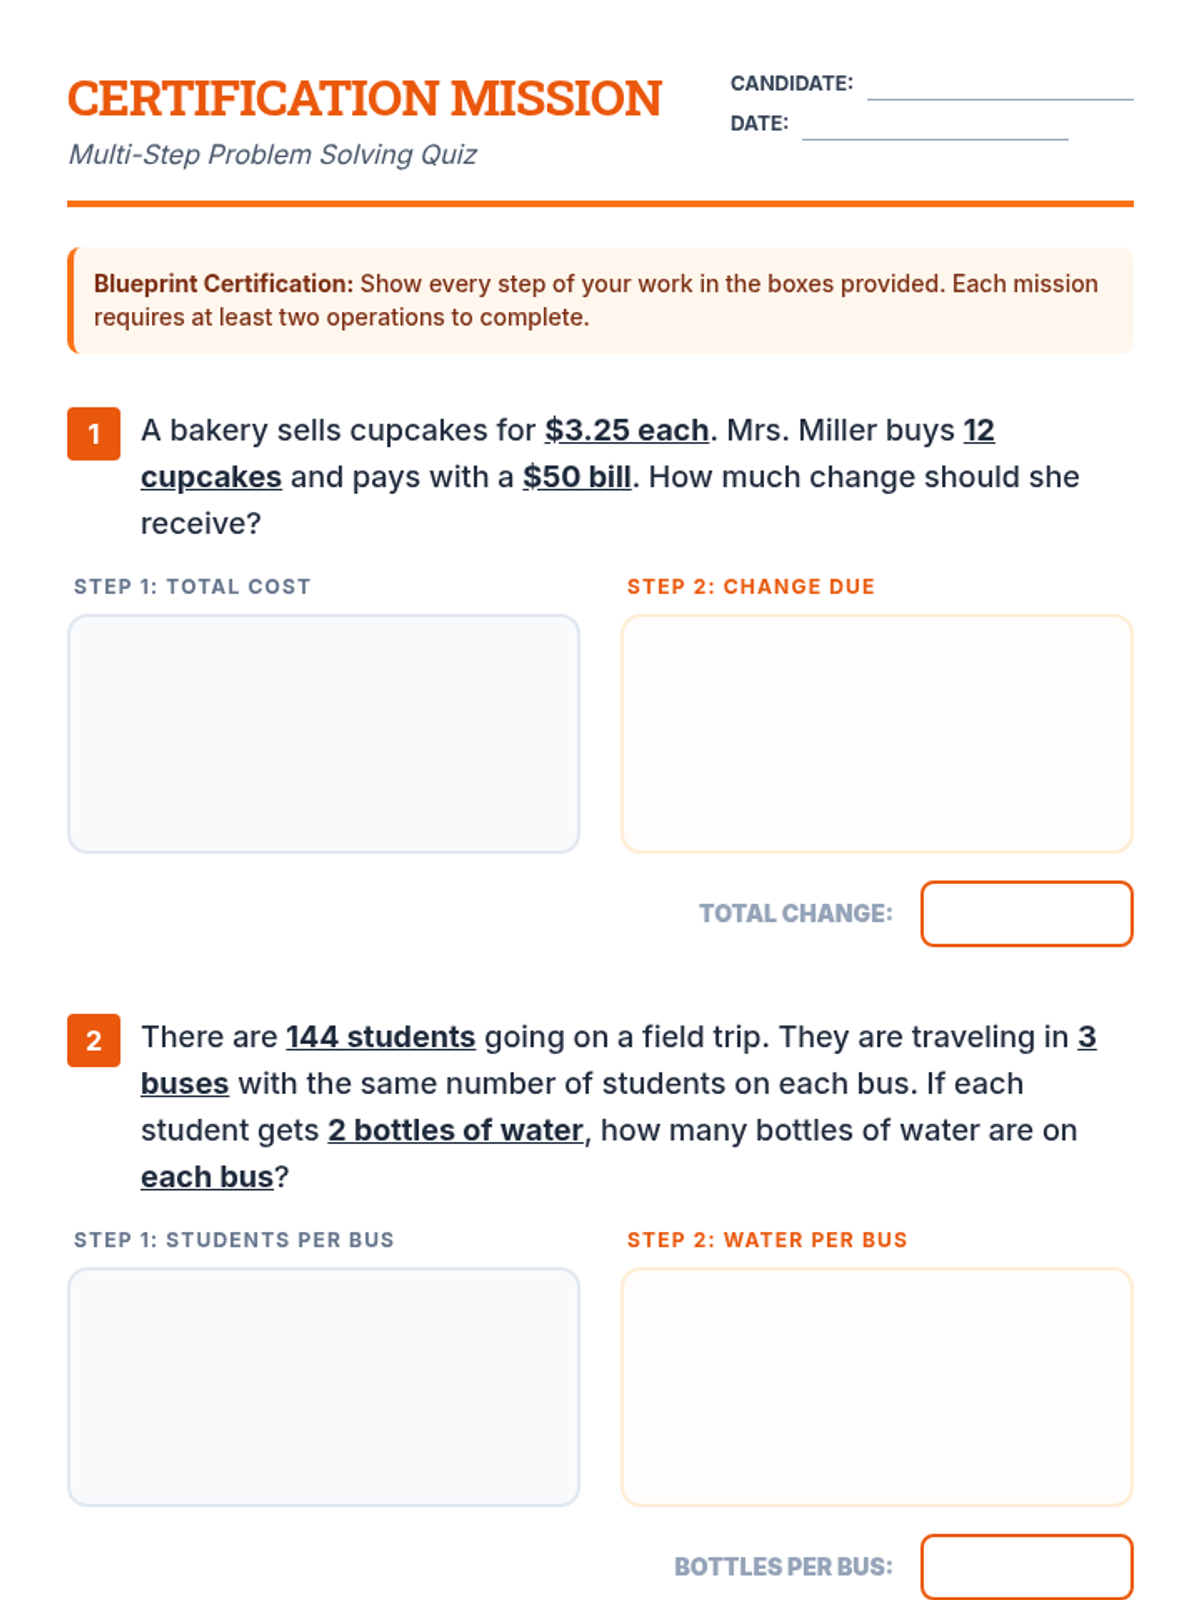
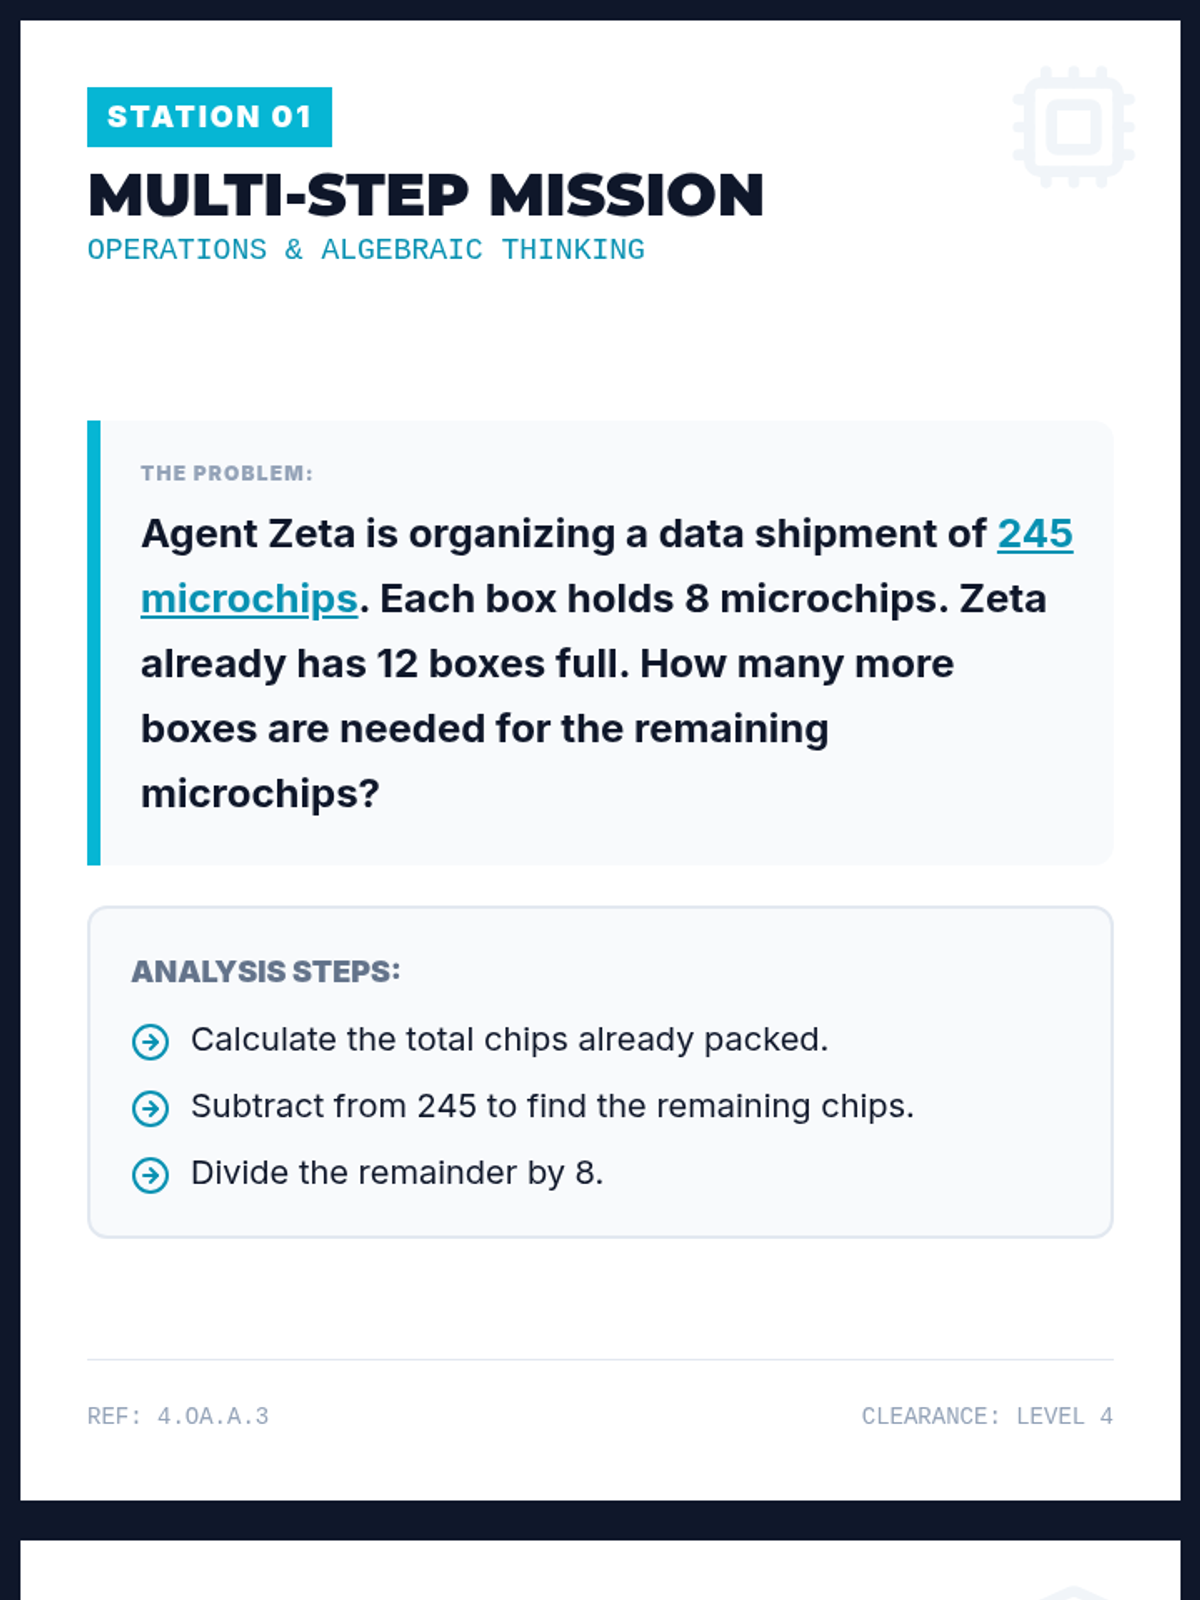
A summative assessment quiz requiring students to solve multi-step word problems using integrated graphic organizer boxes to demonstrate their mathematical reasoning.
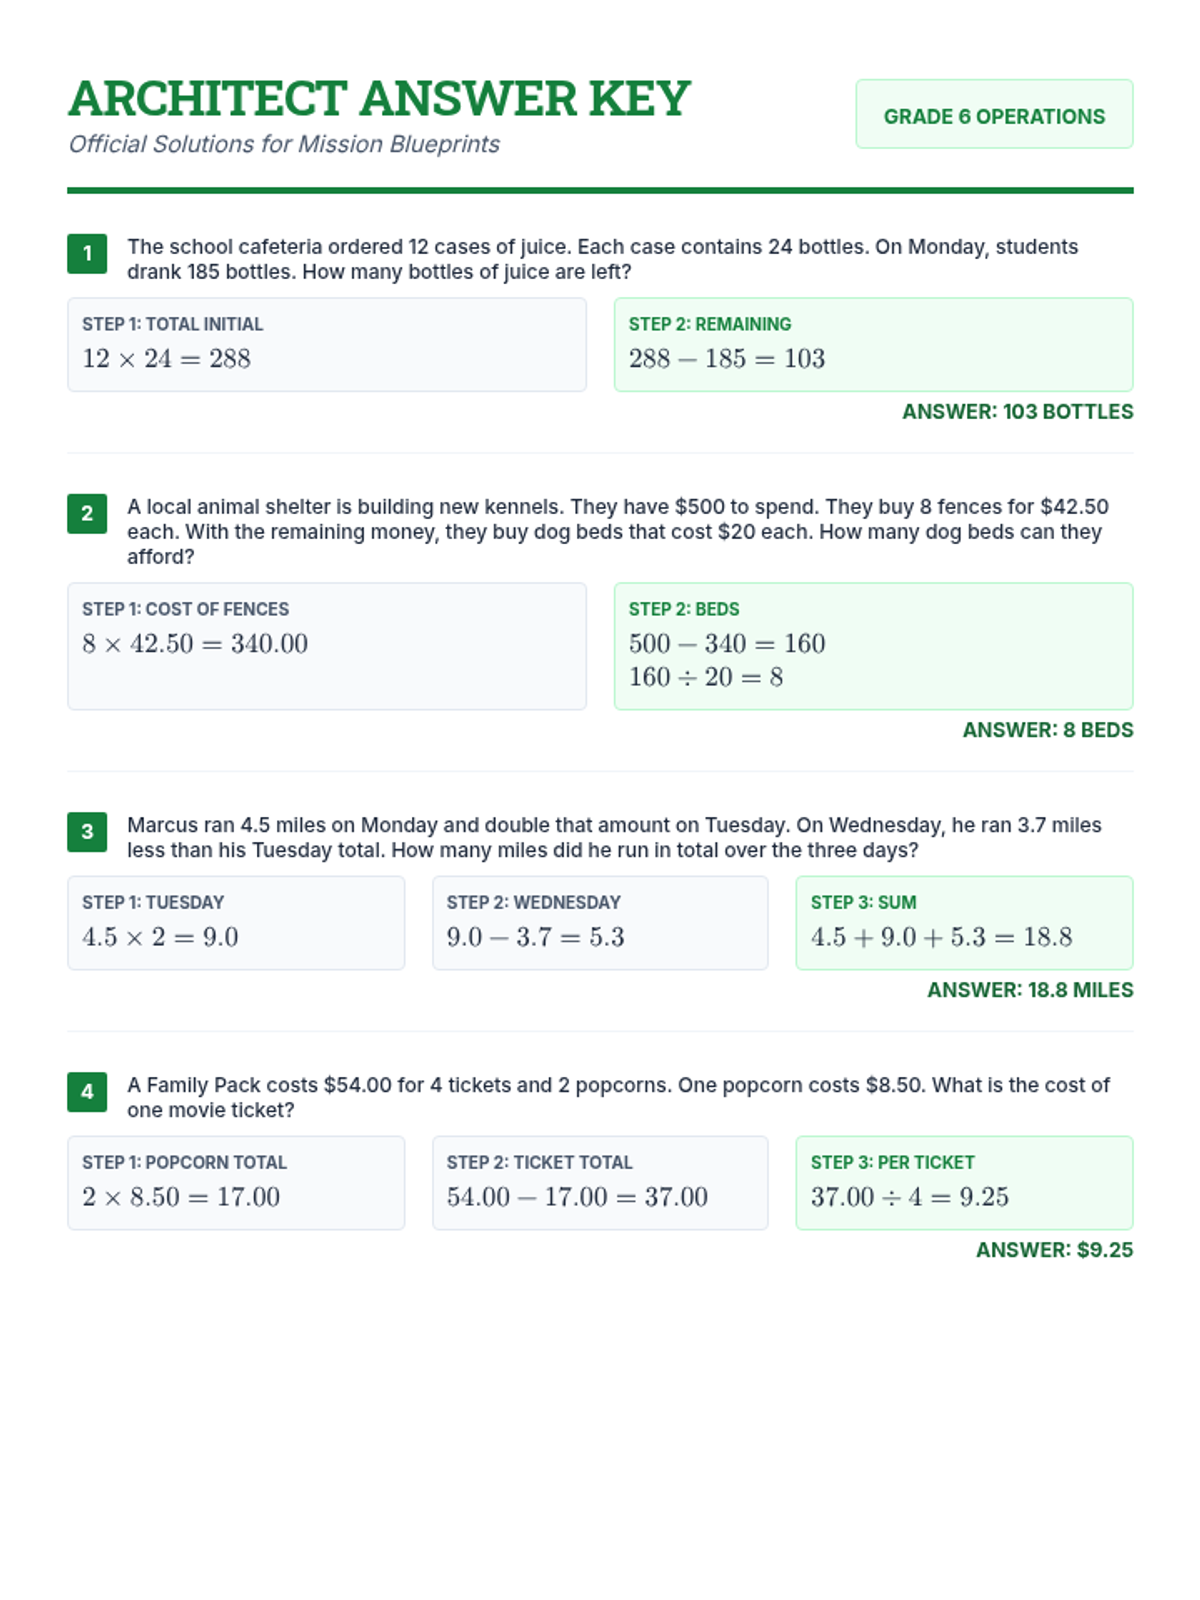
Comprehensive answer key for the Mission Blueprints worksheet, providing step-by-step solutions and mathematical breakdowns for all problems.
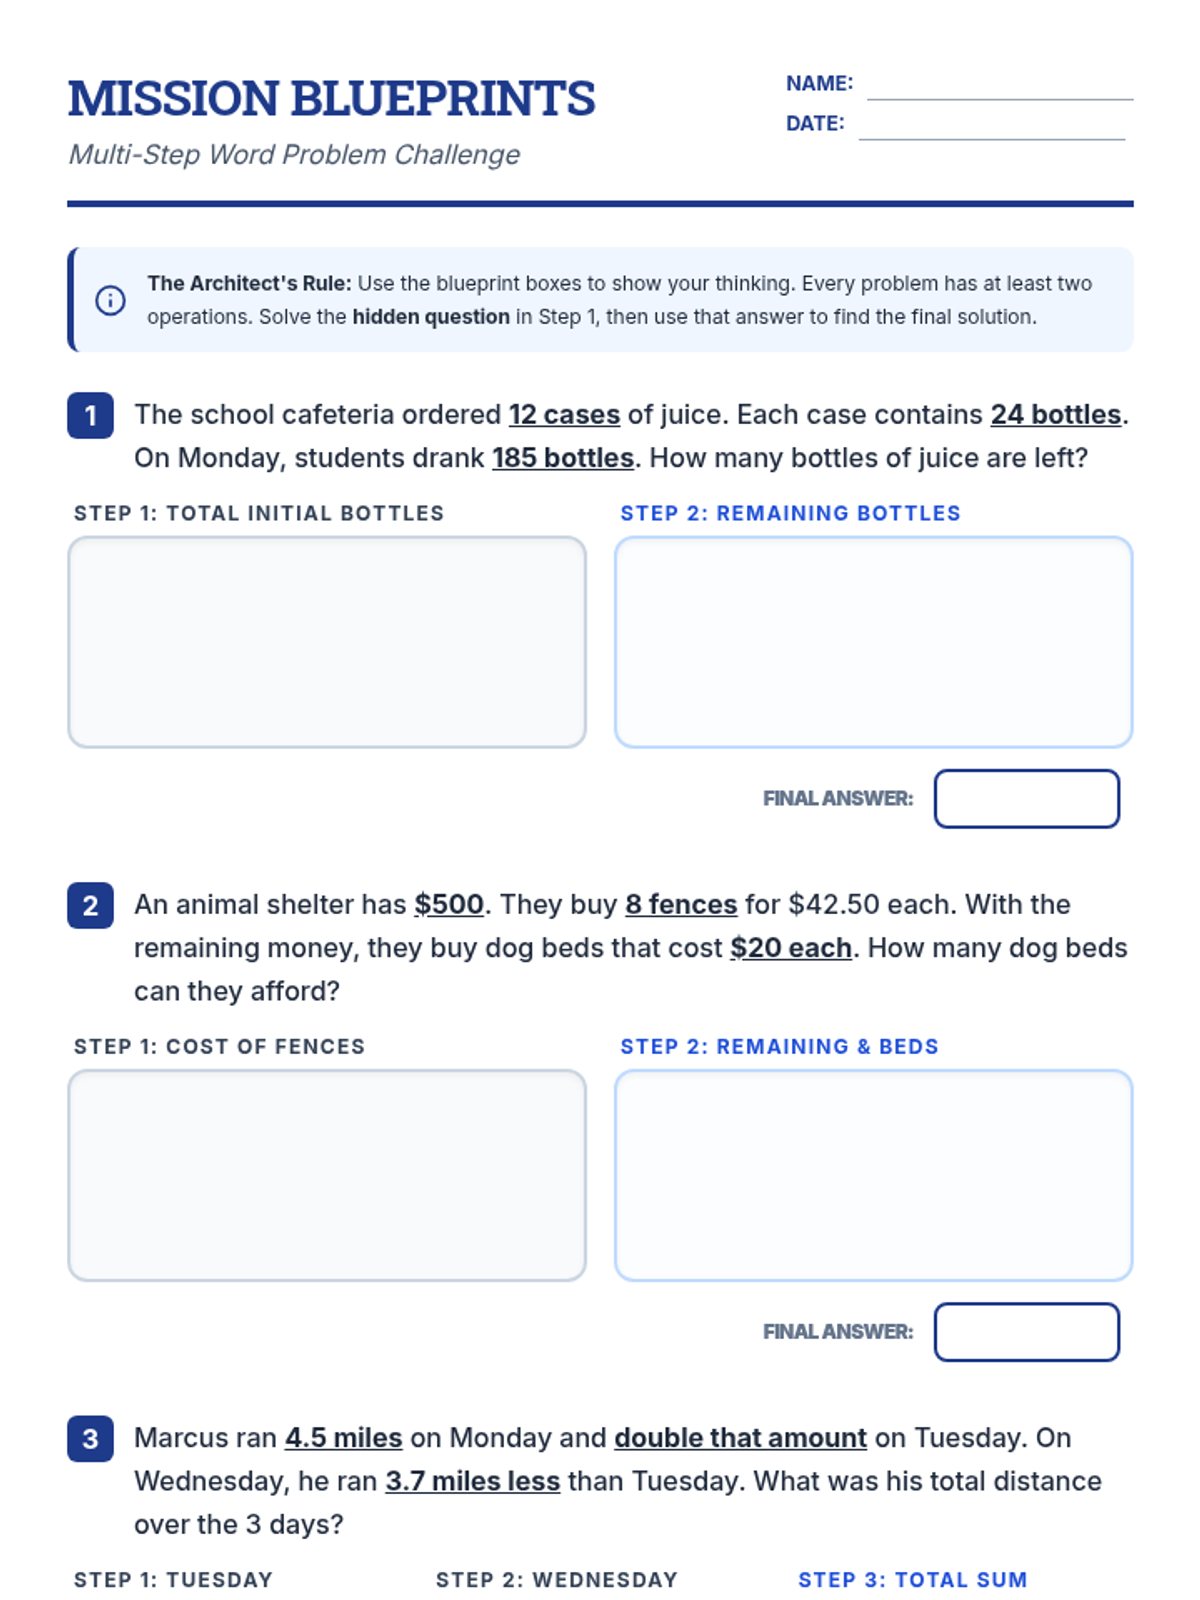
A student worksheet featuring four challenging multi-step word problems with integrated graphic organizer 'blueprints' to support visual problem-solving steps.
A presentation guiding students through the process of using visual graphic organizers to solve multi-step math problems using 6th-grade operations.
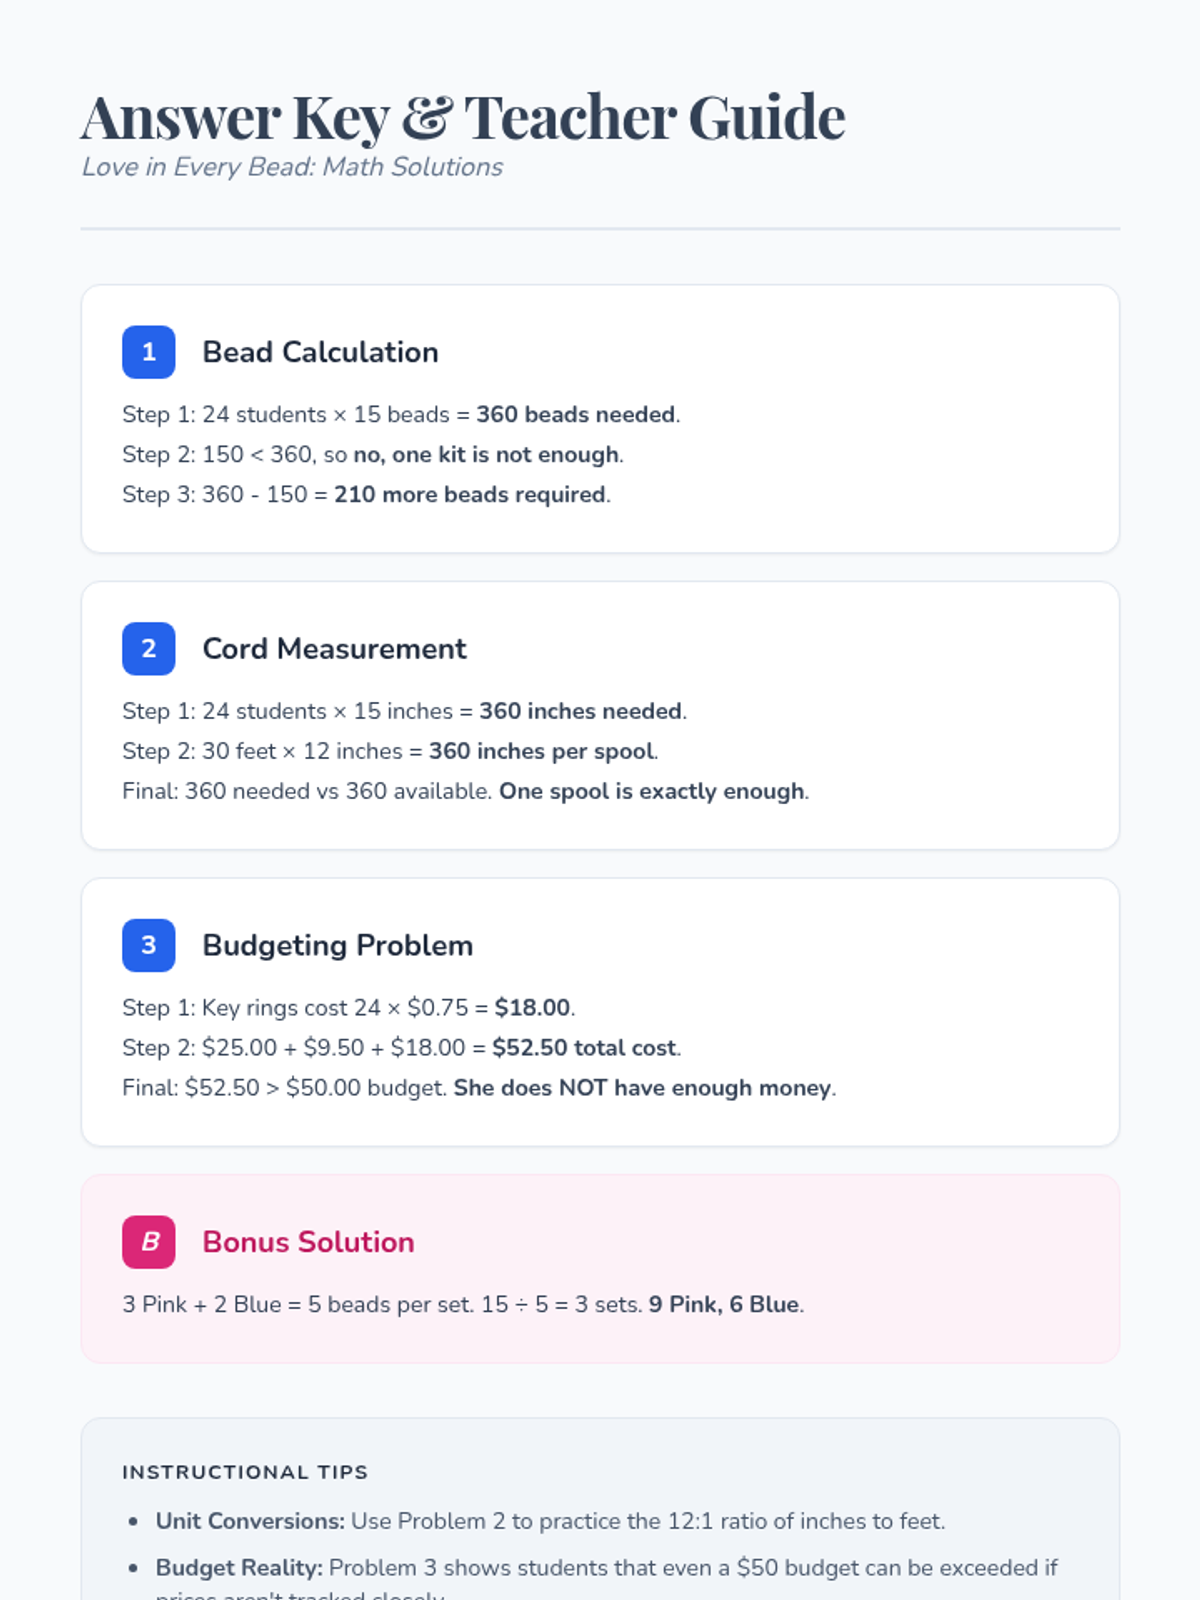
Teacher-facing answer key and instructional guide. Solutions now match updated numbers in the student worksheet and include unit conversion guidance.
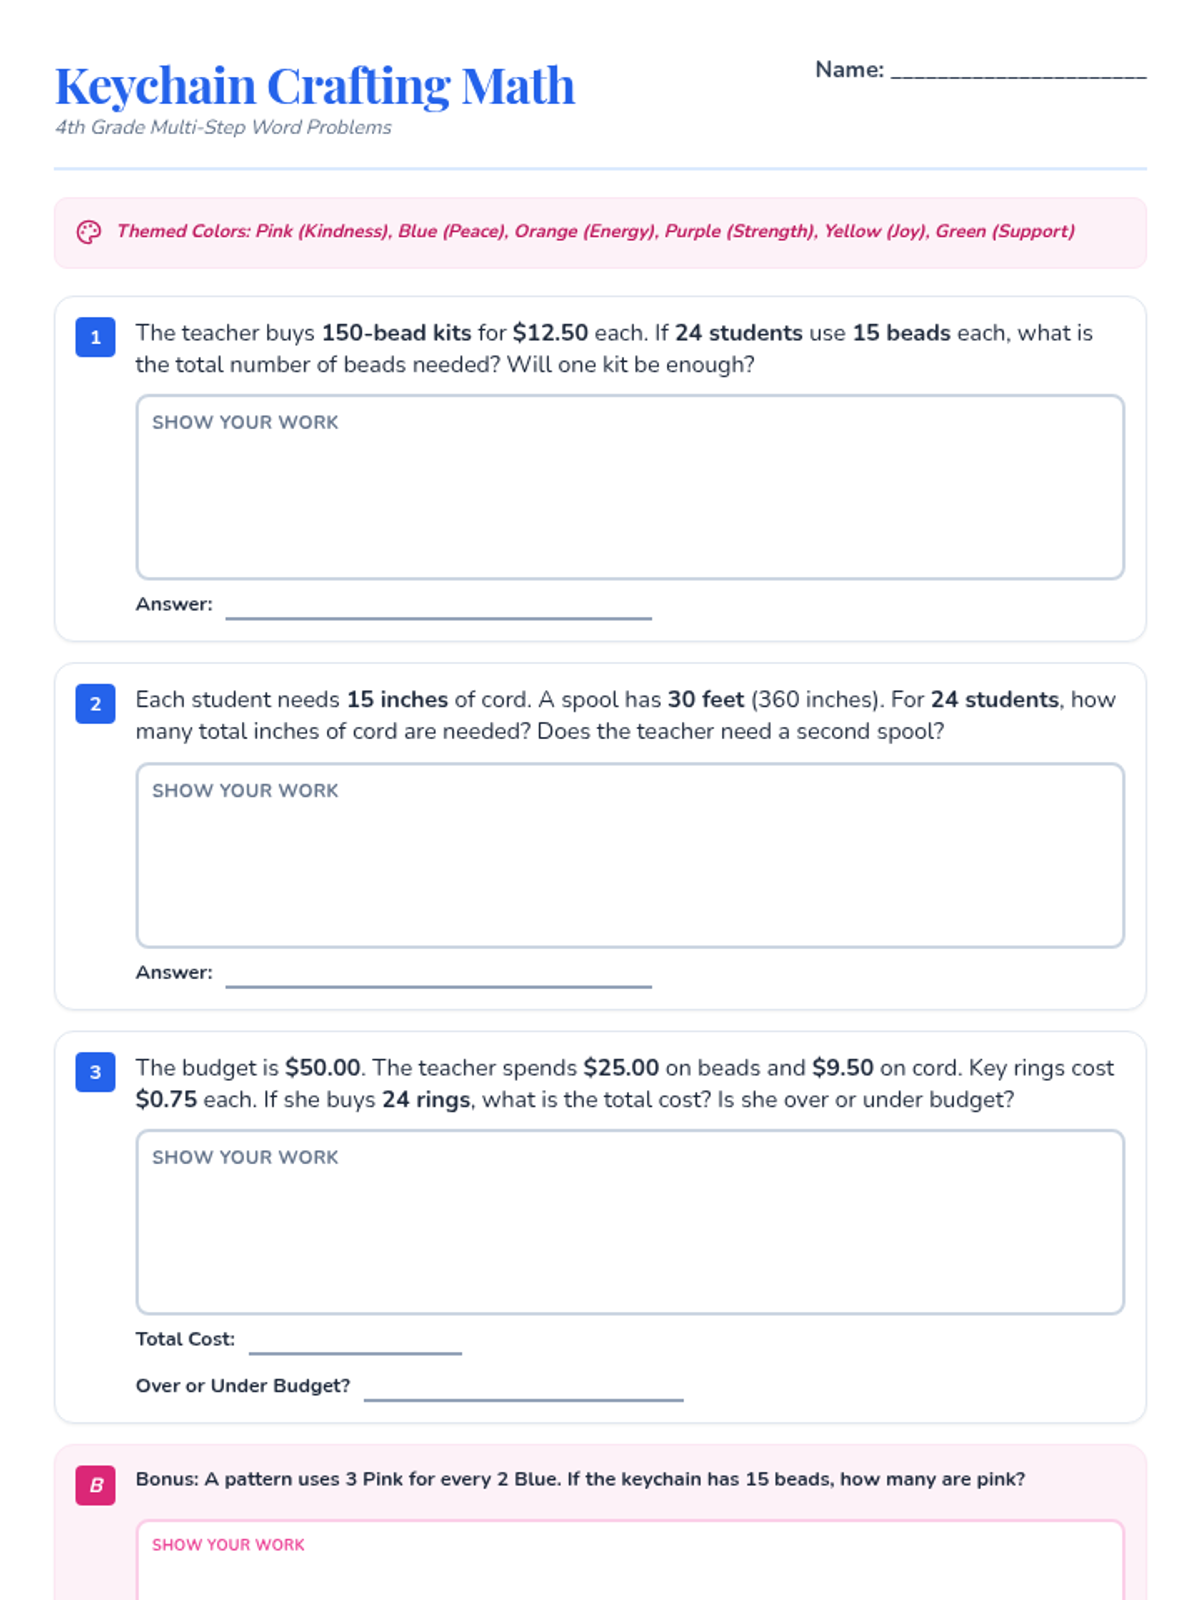
A math worksheet featuring multi-step word problems for 4th graders. Layout optimized to fit all problems and work areas on a single page with high-contrast work spaces. Now includes themed color context.
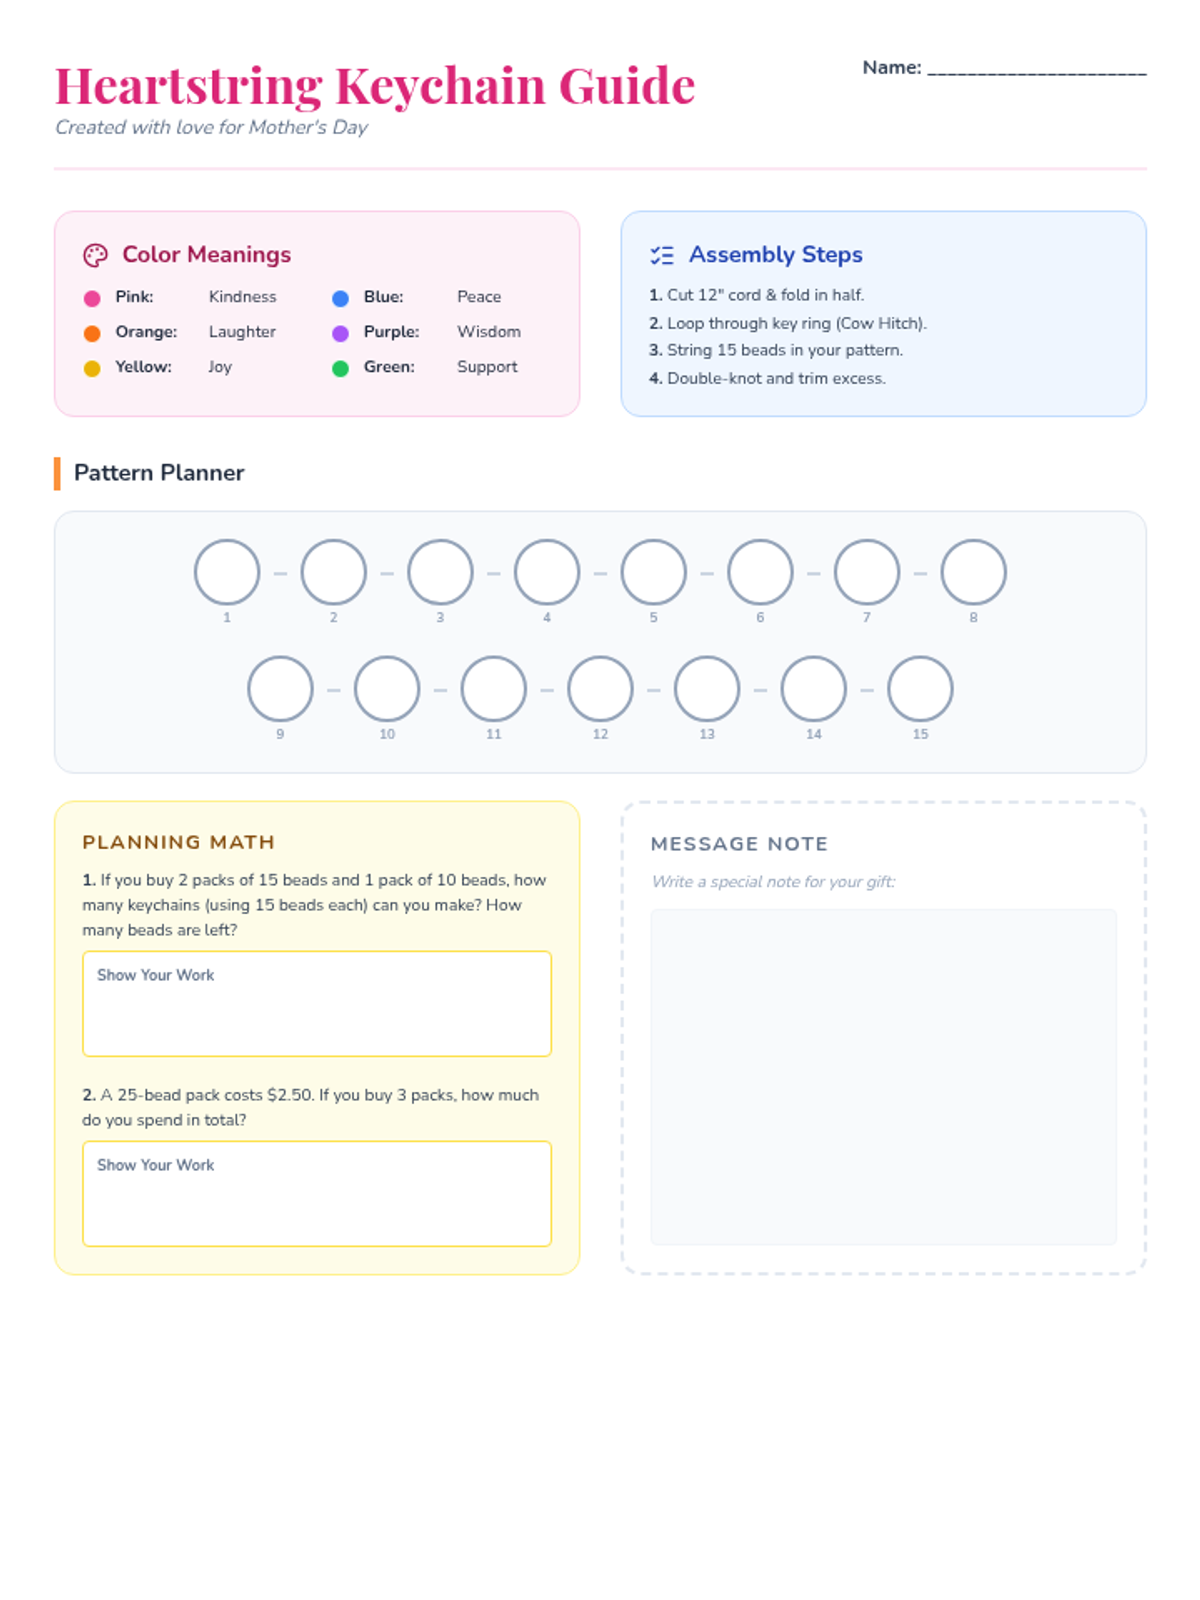
A comprehensive step-by-step guide for students to create their beaded keychains, including a color meaning key and an improved, larger bead planning template. Now includes specific math problems as requested.
A vibrant slide presentation introducing the Mother's Day keychain project, explaining the symbolic meanings of different bead colors, and outlining the crafting steps. Now includes specific math problems for classroom discussion.
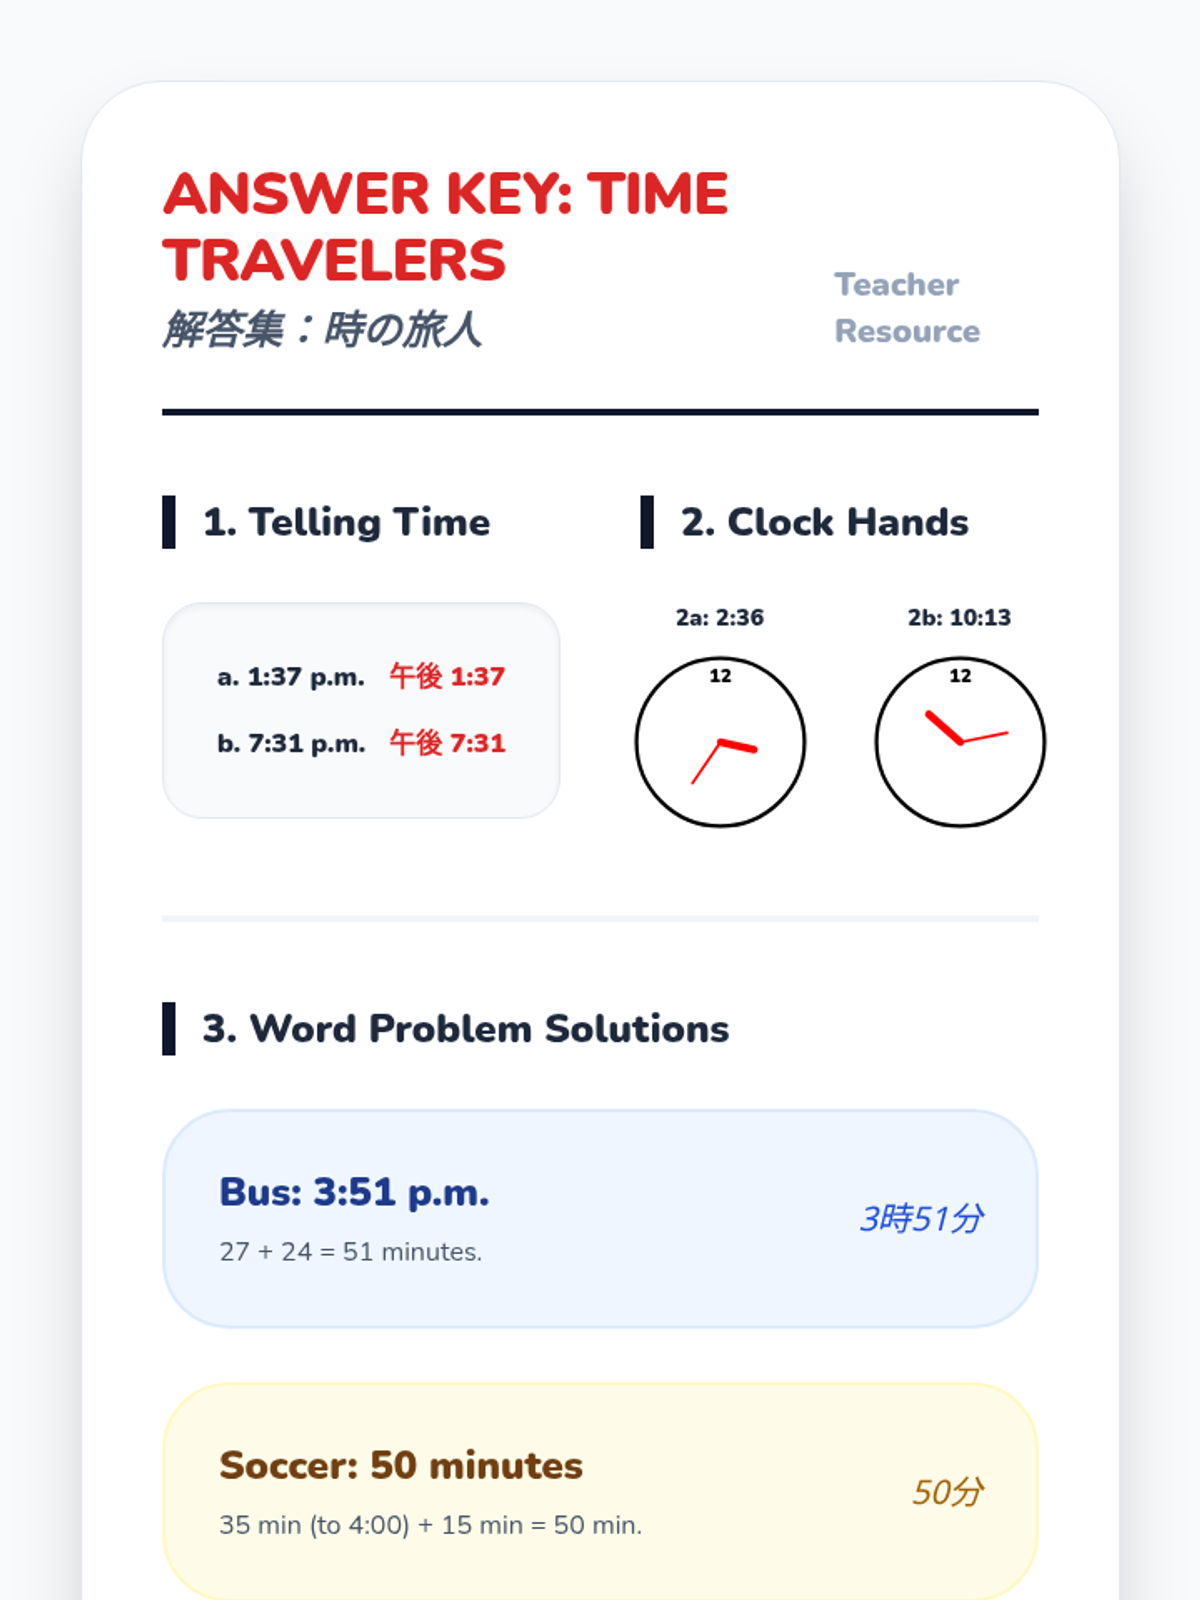
A bilingual answer key and teacher guide for the Time Travelers worksheet, providing solutions and instructional strategies for both English and Japanese speaking environments.
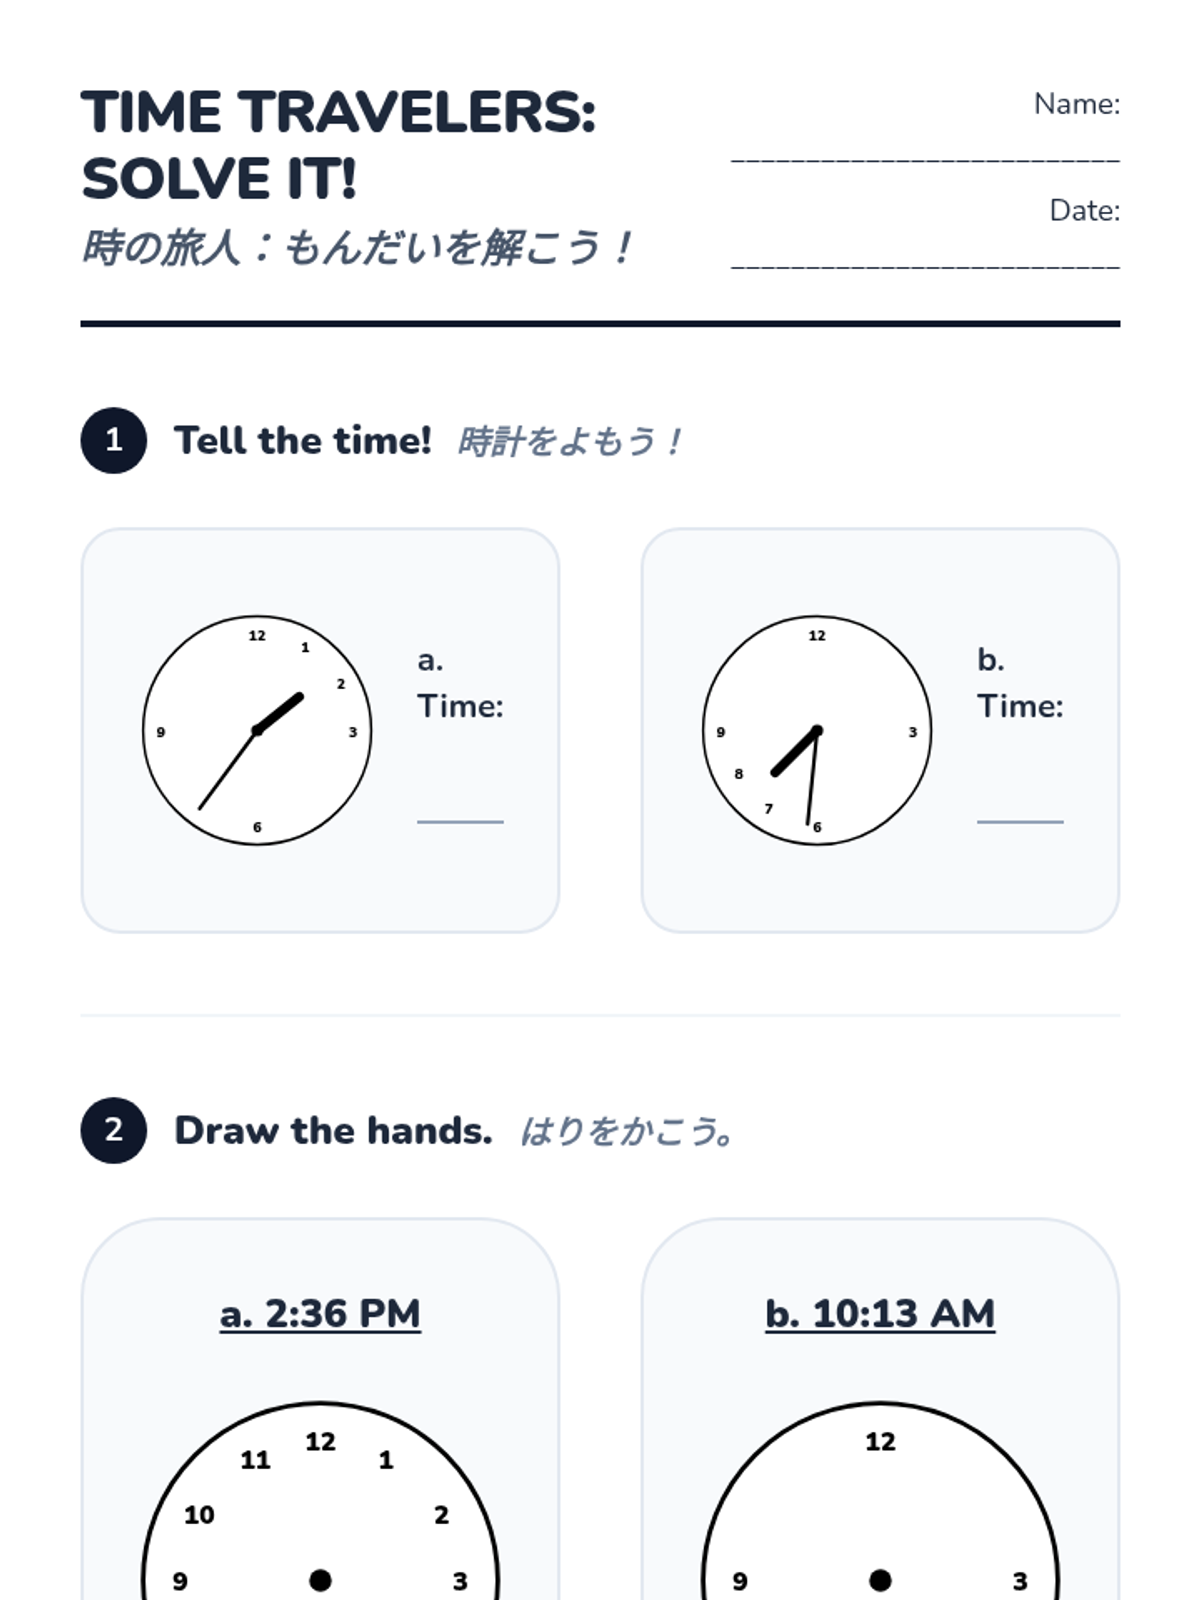
A bilingual (English and Japanese) worksheet for students to practice telling time to the minute, drawing clock hands, and solving time interval word problems. Includes generous work spaces for handwriting.
A bilingual (English and Japanese) slide deck for a lesson on solving word problems involving time intervals and telling time to the nearest minute. It features clear, kid-friendly visuals including SVG clock faces and animal motifs.
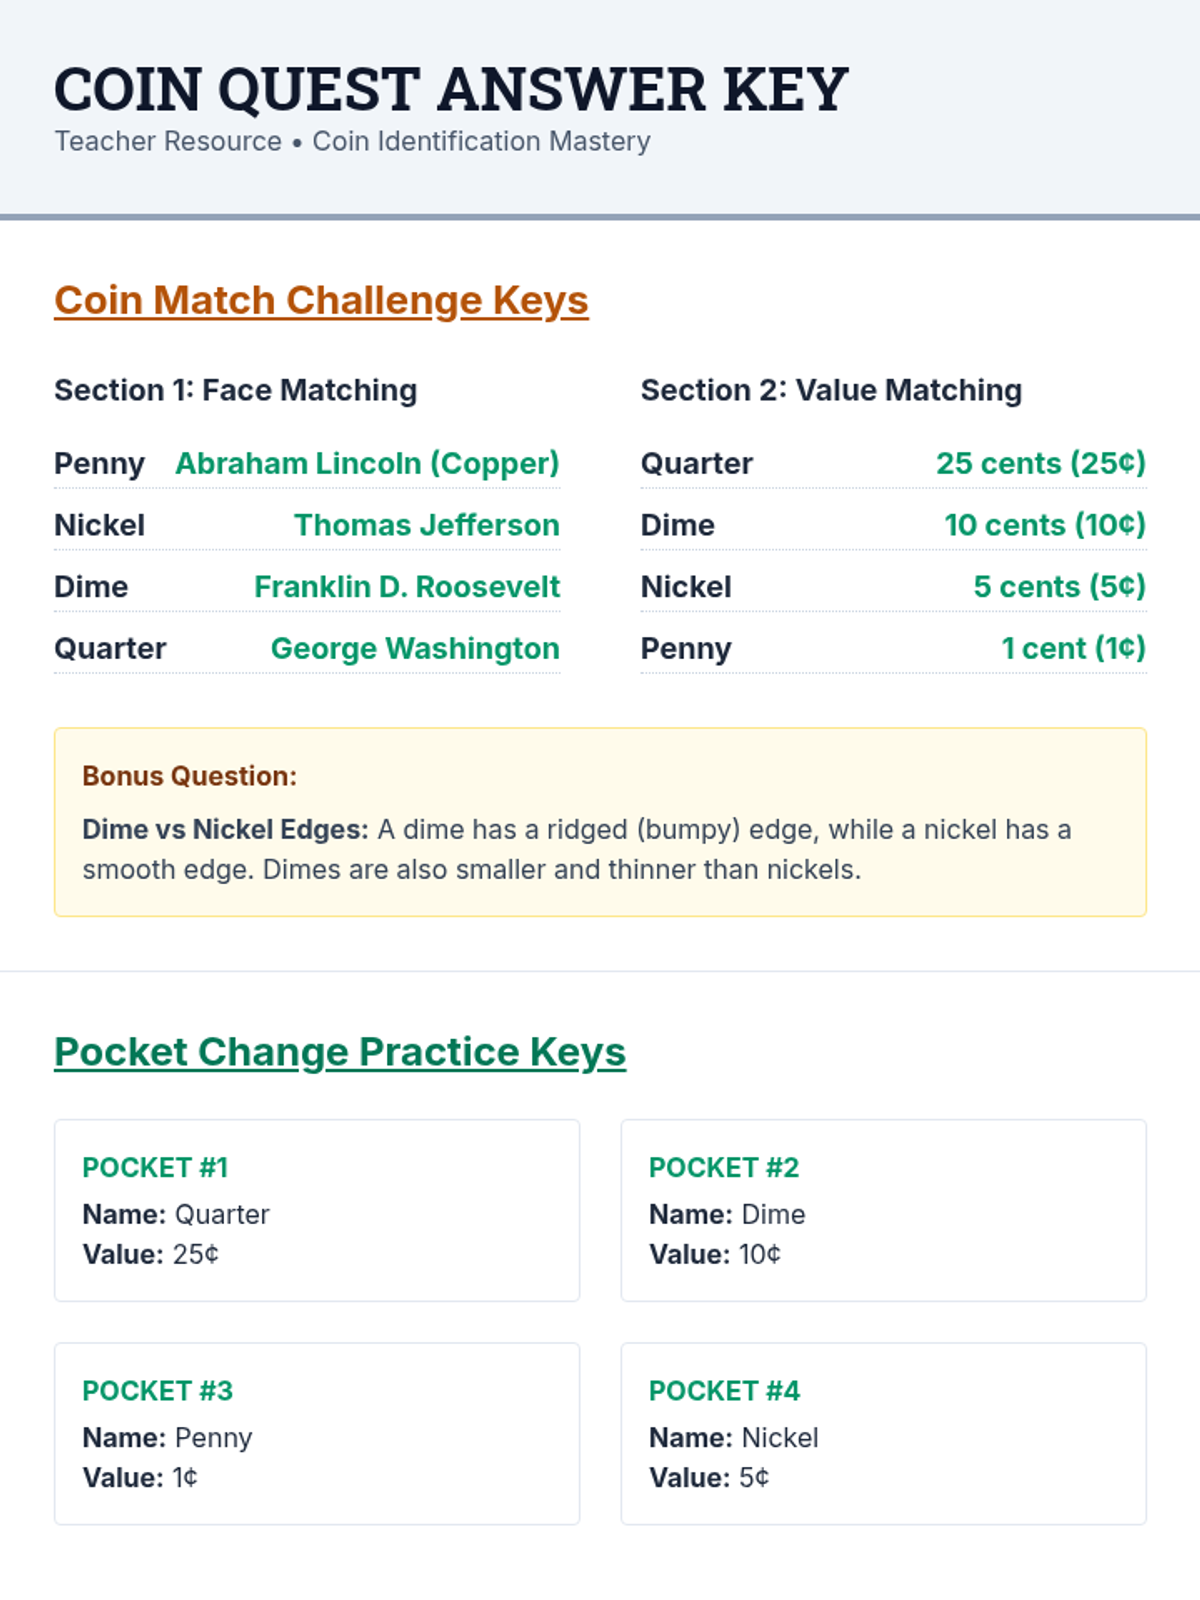
A comprehensive answer key for both the Coin Match Challenge and Pocket Change Practice worksheets, ensuring easy grading for educators.
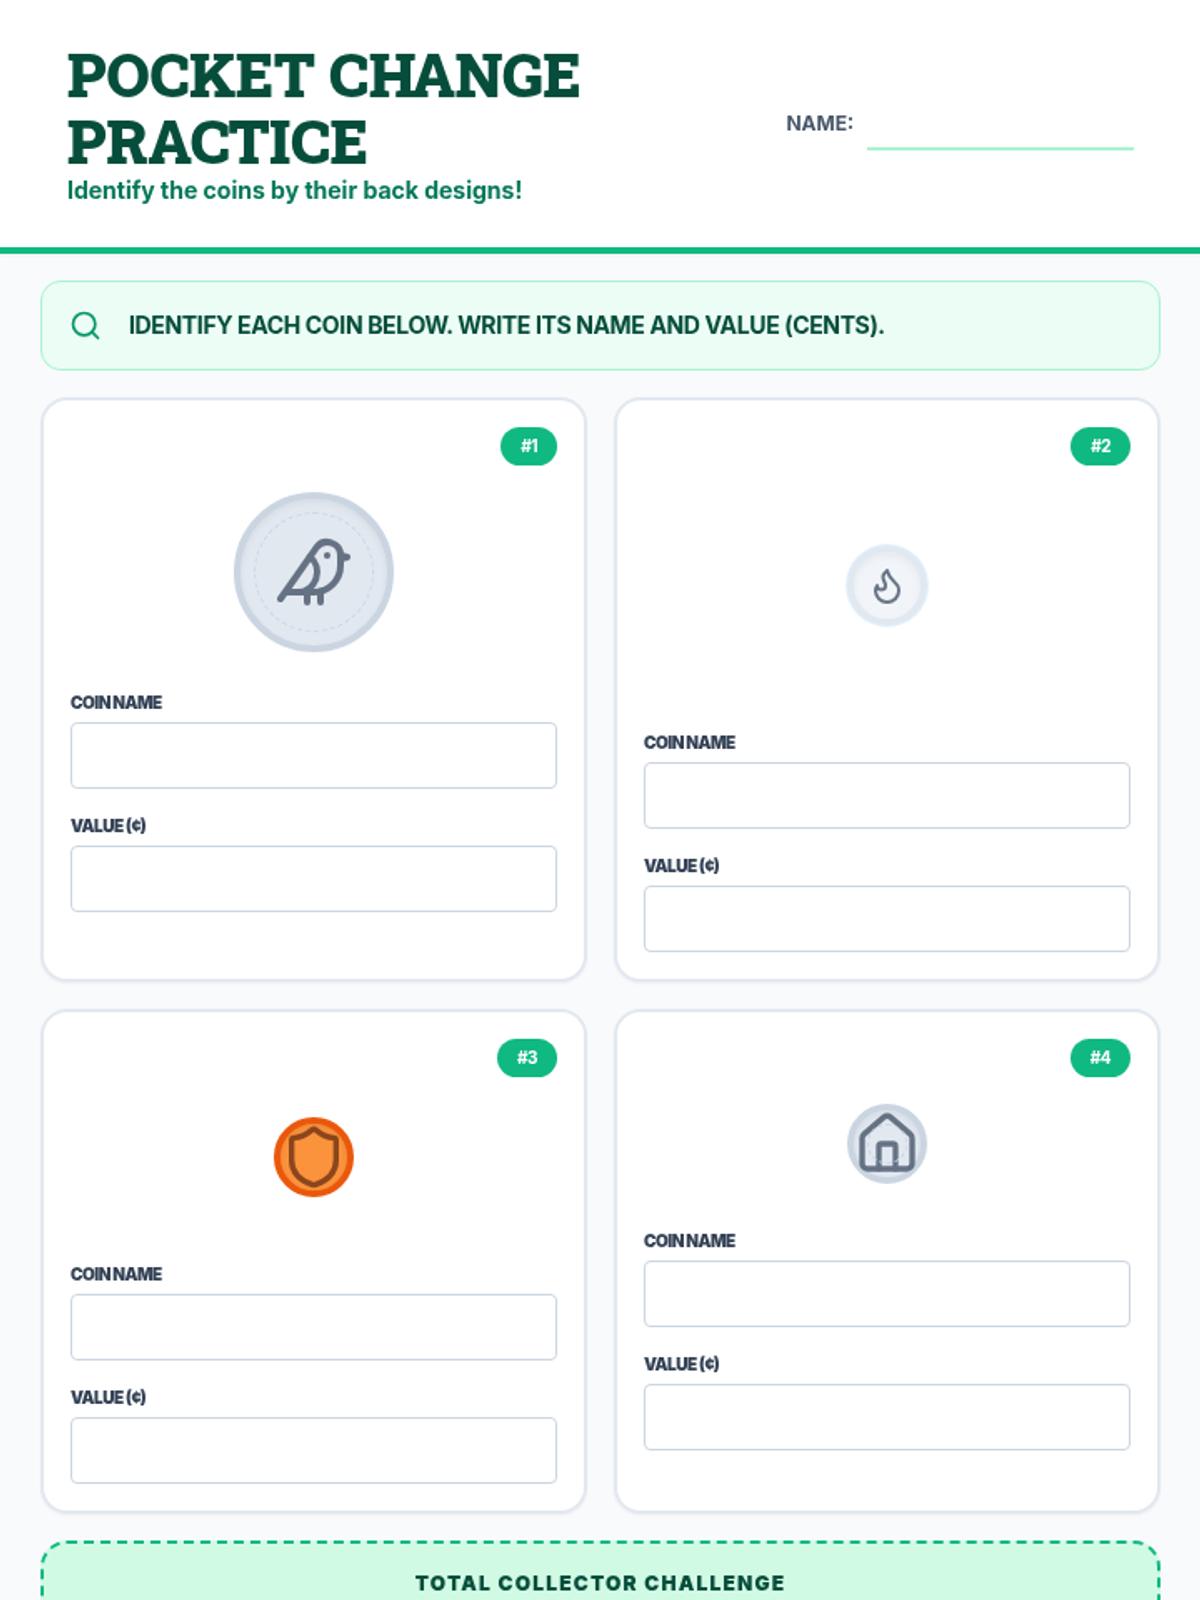
A practical identifying activity where students examine stylized coin representations in "pockets" and label them by name and numerical value.
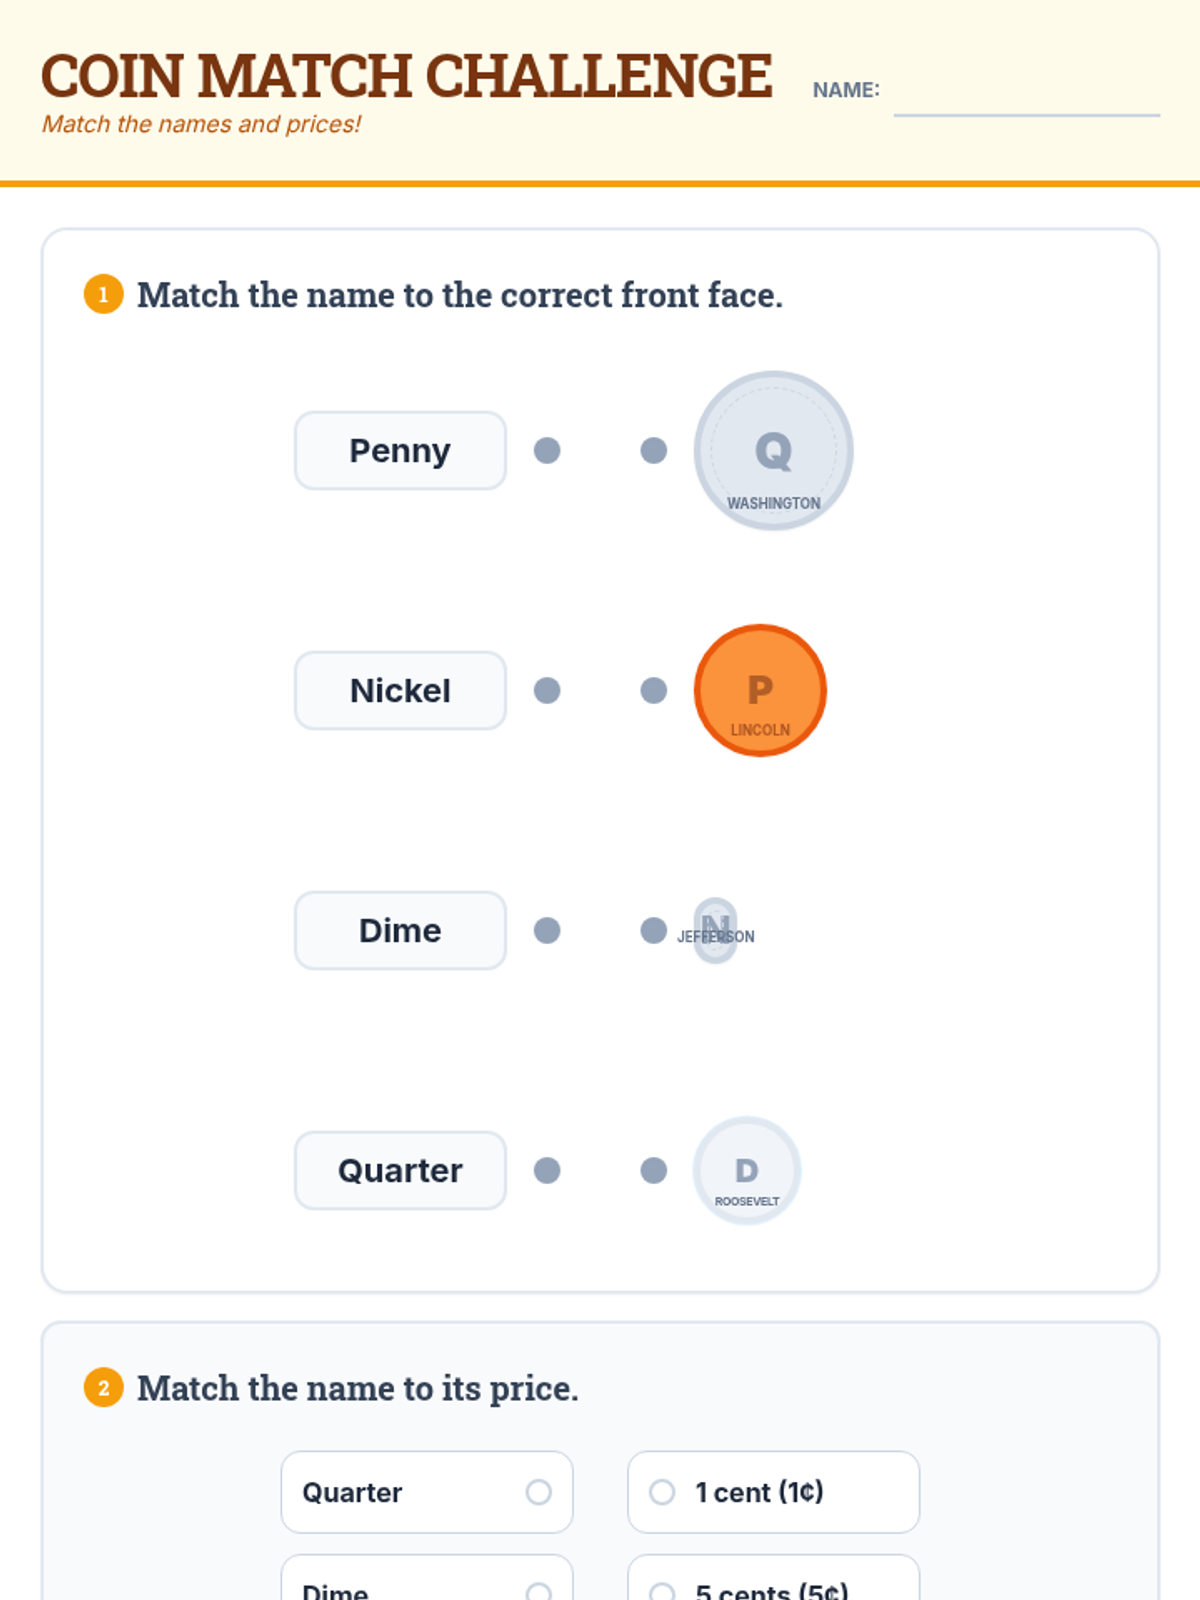
A matching worksheet where students connect coin names to their respective faces and monetary values, including a reflective question on coin edges.
A vibrant slide deck that introduces students to pennies, nickels, dimes, and quarters through visual comparisons, historical figures, and key physical features.
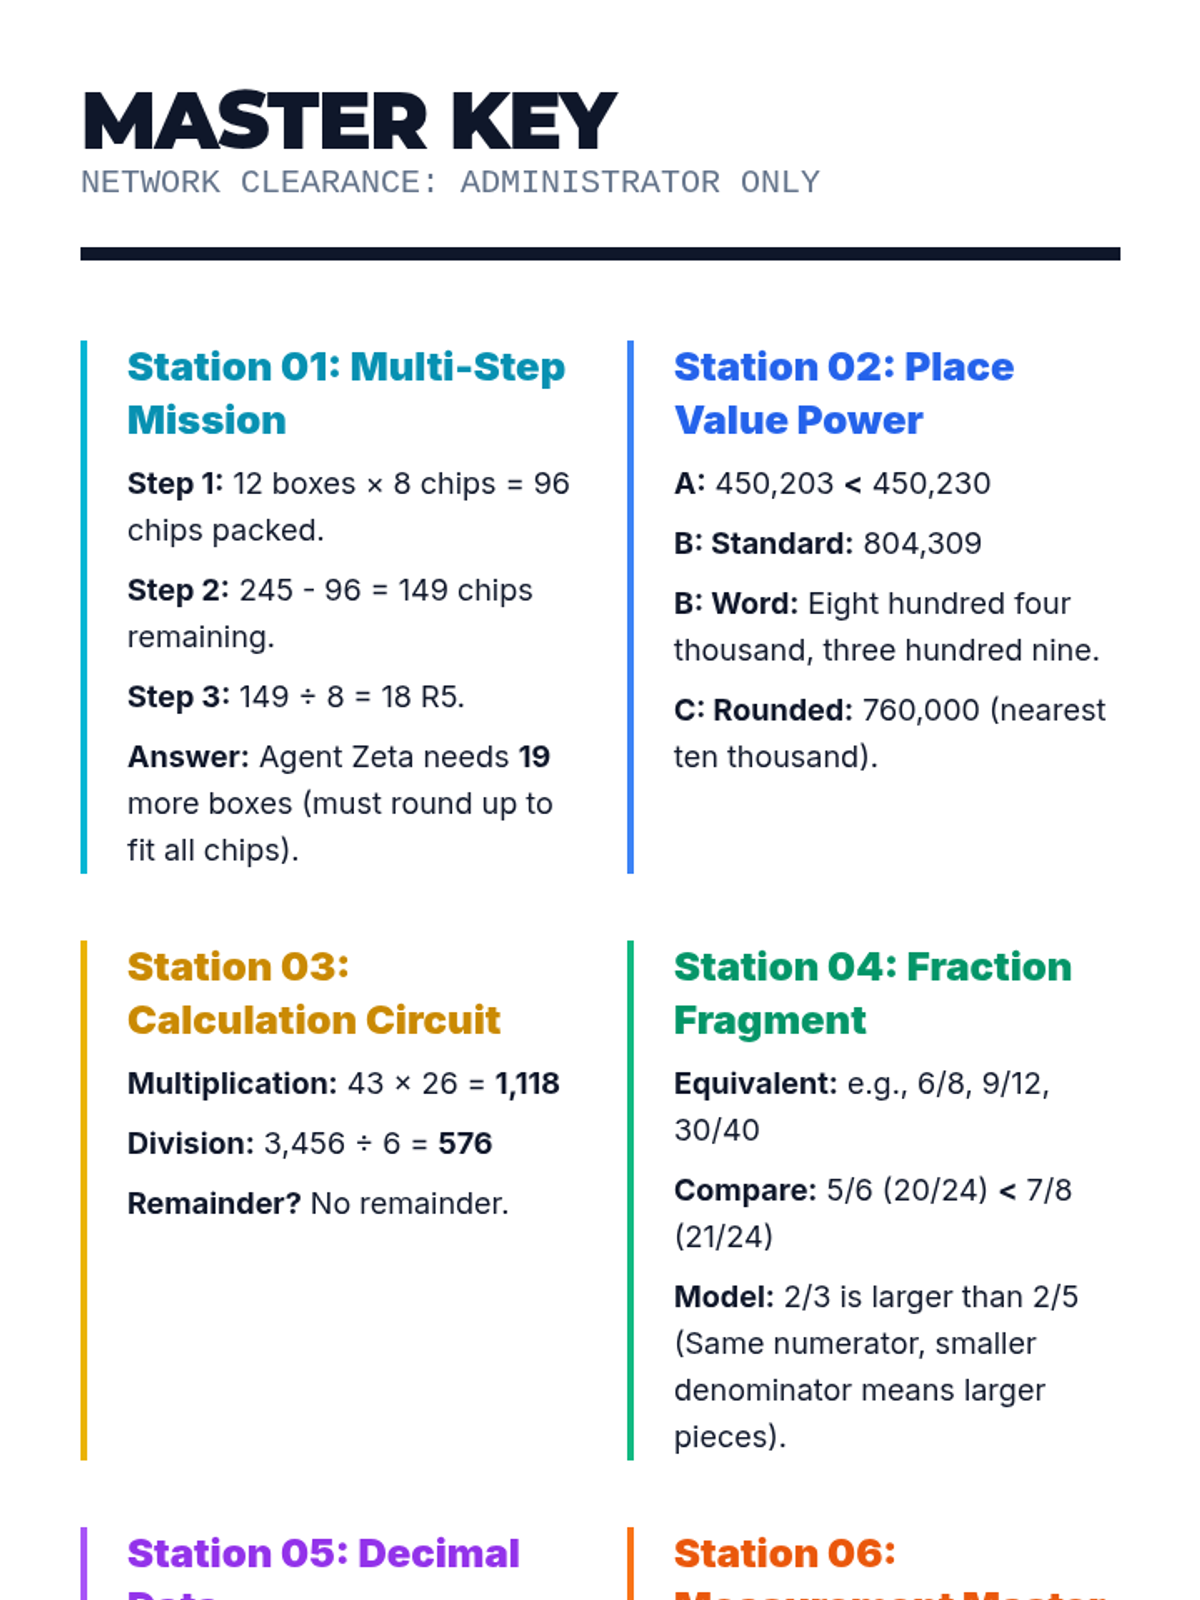
Comprehensive answer key and scoring guide for the Number Network Gallery Walk. Includes step-by-step solutions for complex problems and clear final answers for all stations.
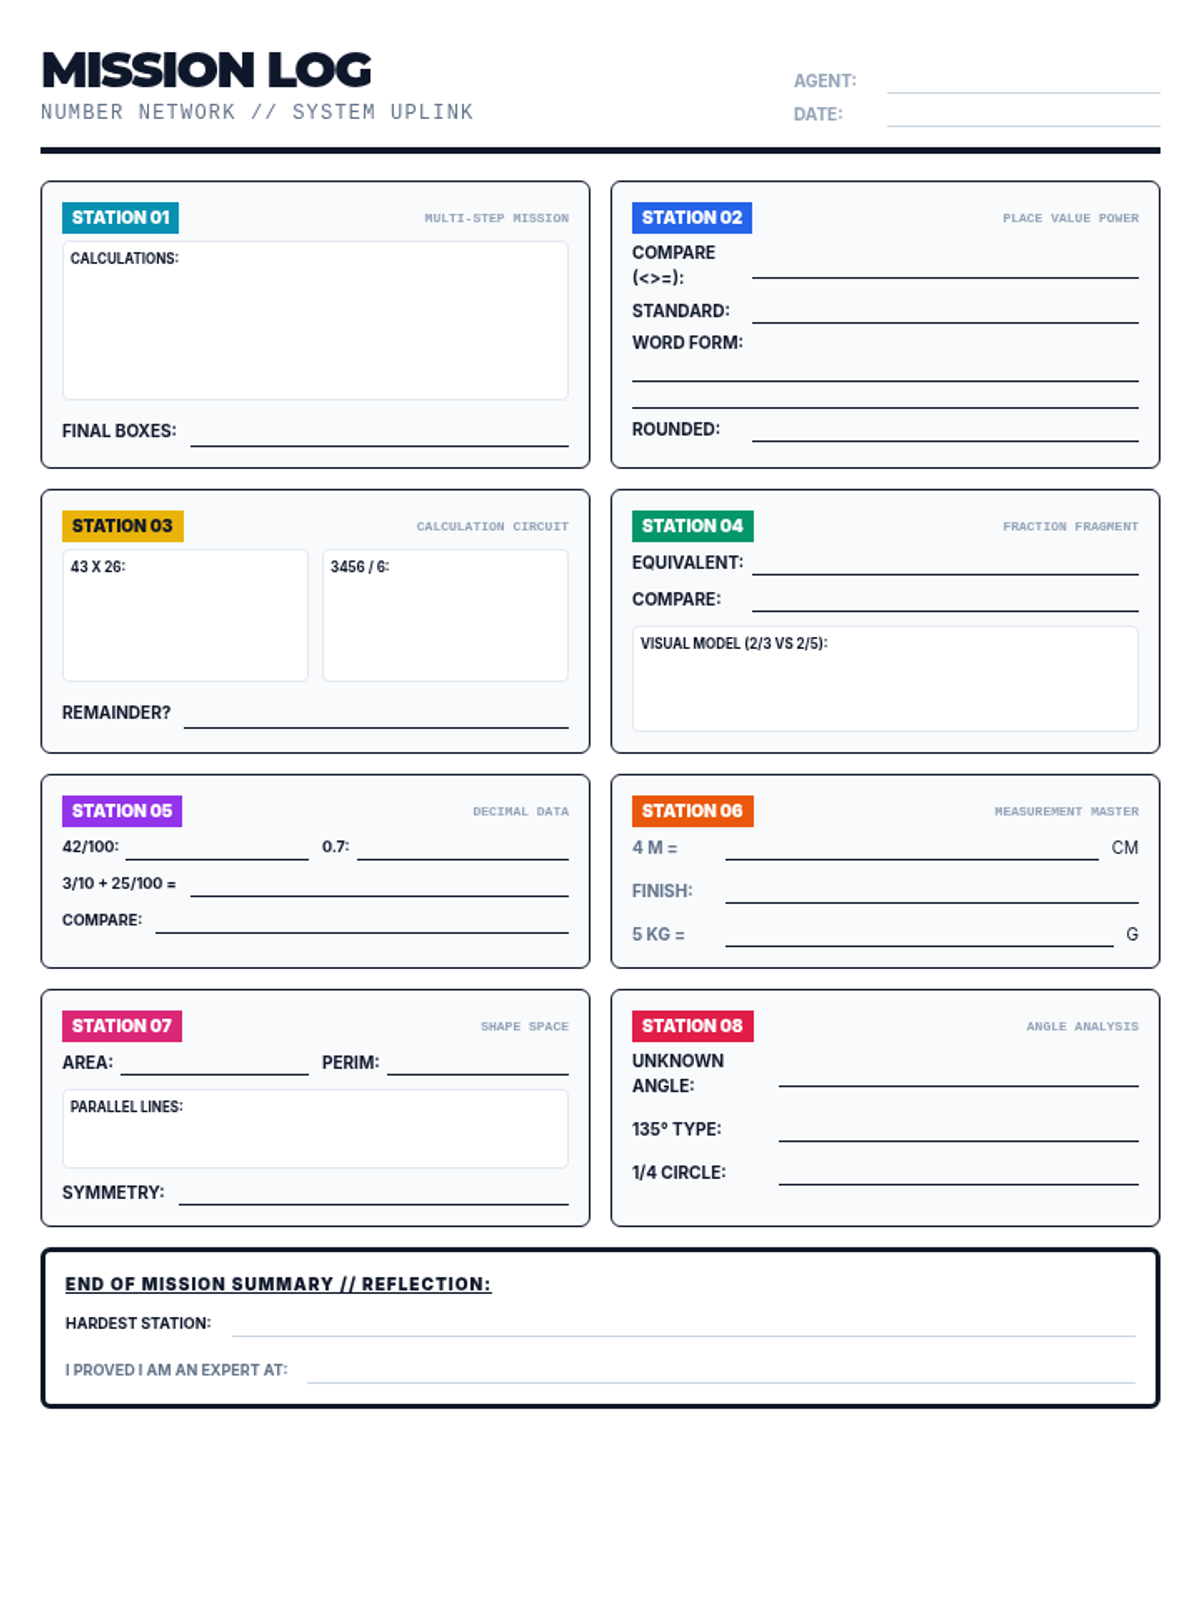
Student recording sheet for the Number Network Gallery Walk. Organized by station with specific work areas and answer slots to ensure structured data collection during the activity.
8 printable station cards for the Number Network Gallery Walk. Each card features high-contrast design, clear problem sets, and specific domain references for 4th-grade math standards.
Introductory slide deck for the Number Network Gallery Walk. Includes session objectives, rules (protocols), and a countdown/timer visual for classroom atmosphere.
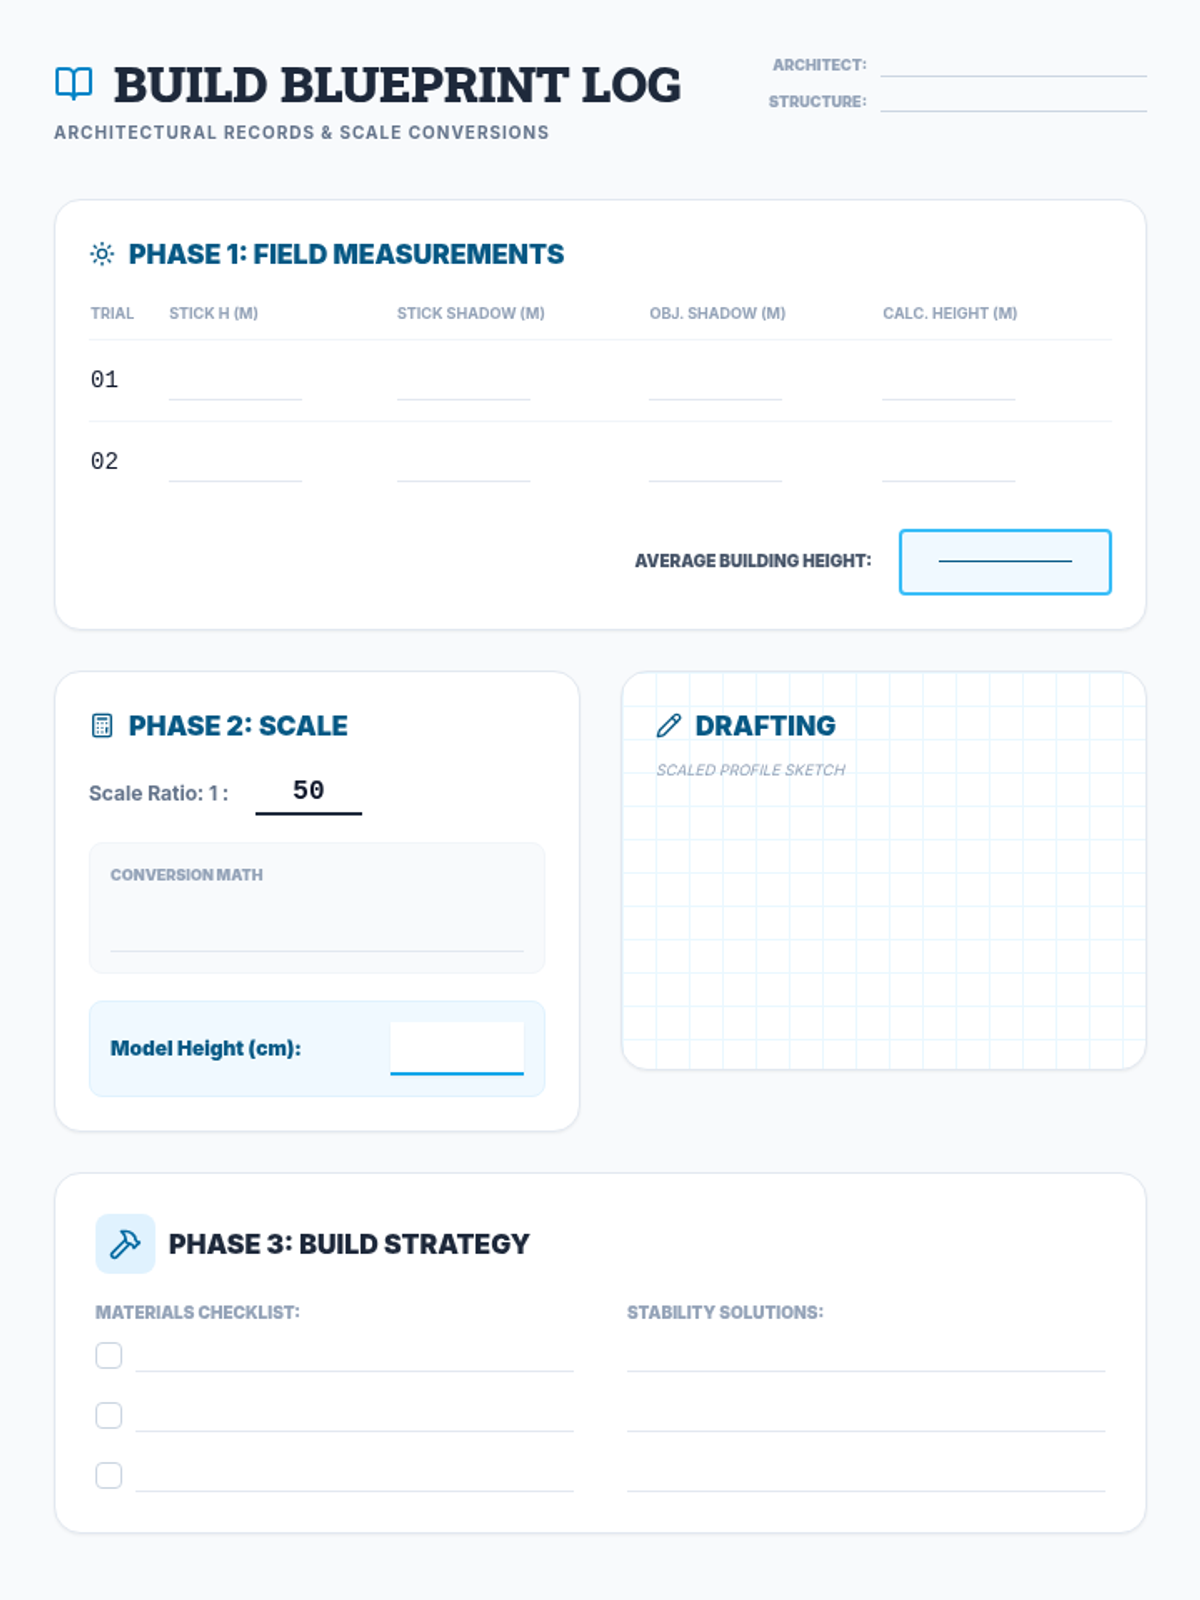
A student project log for recording field data, performing scale conversions, and sketching initial blueprints for their 3D scale model.
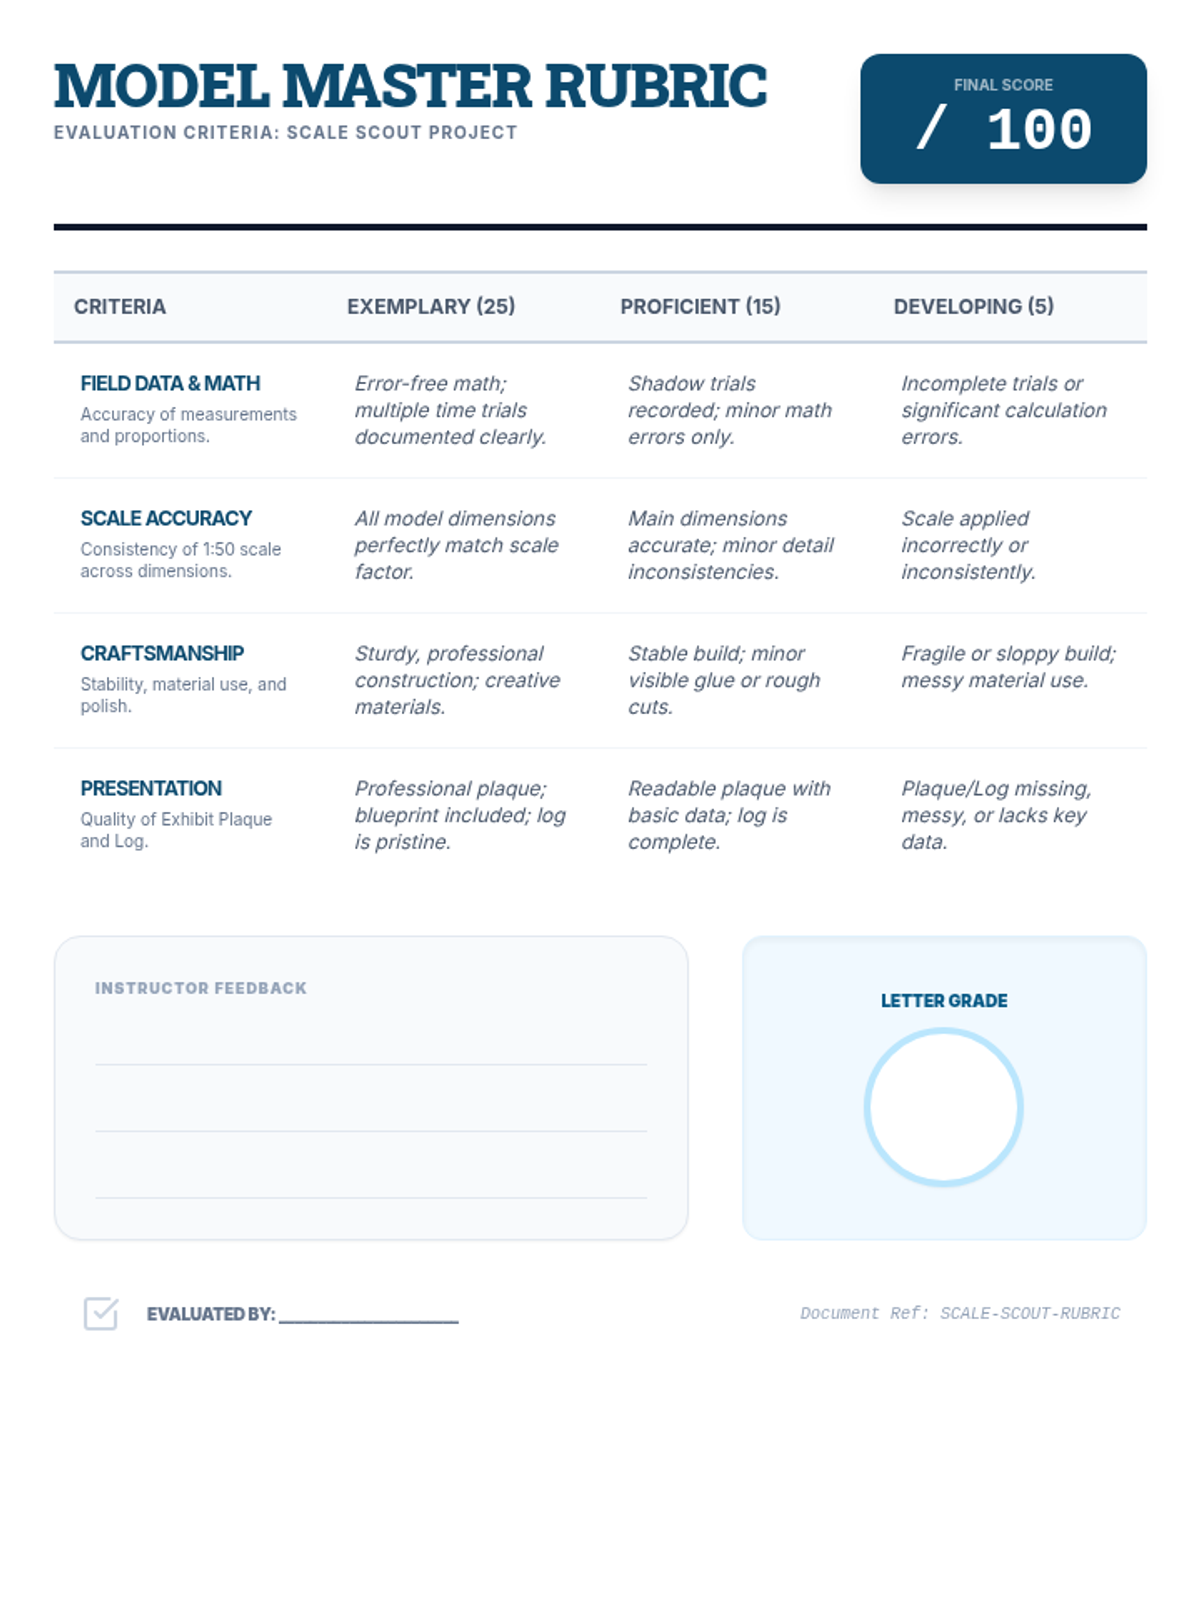
An assessment rubric for the Scale Scout Project, evaluating field data accuracy, scale precision, craftsmanship, and presentation.
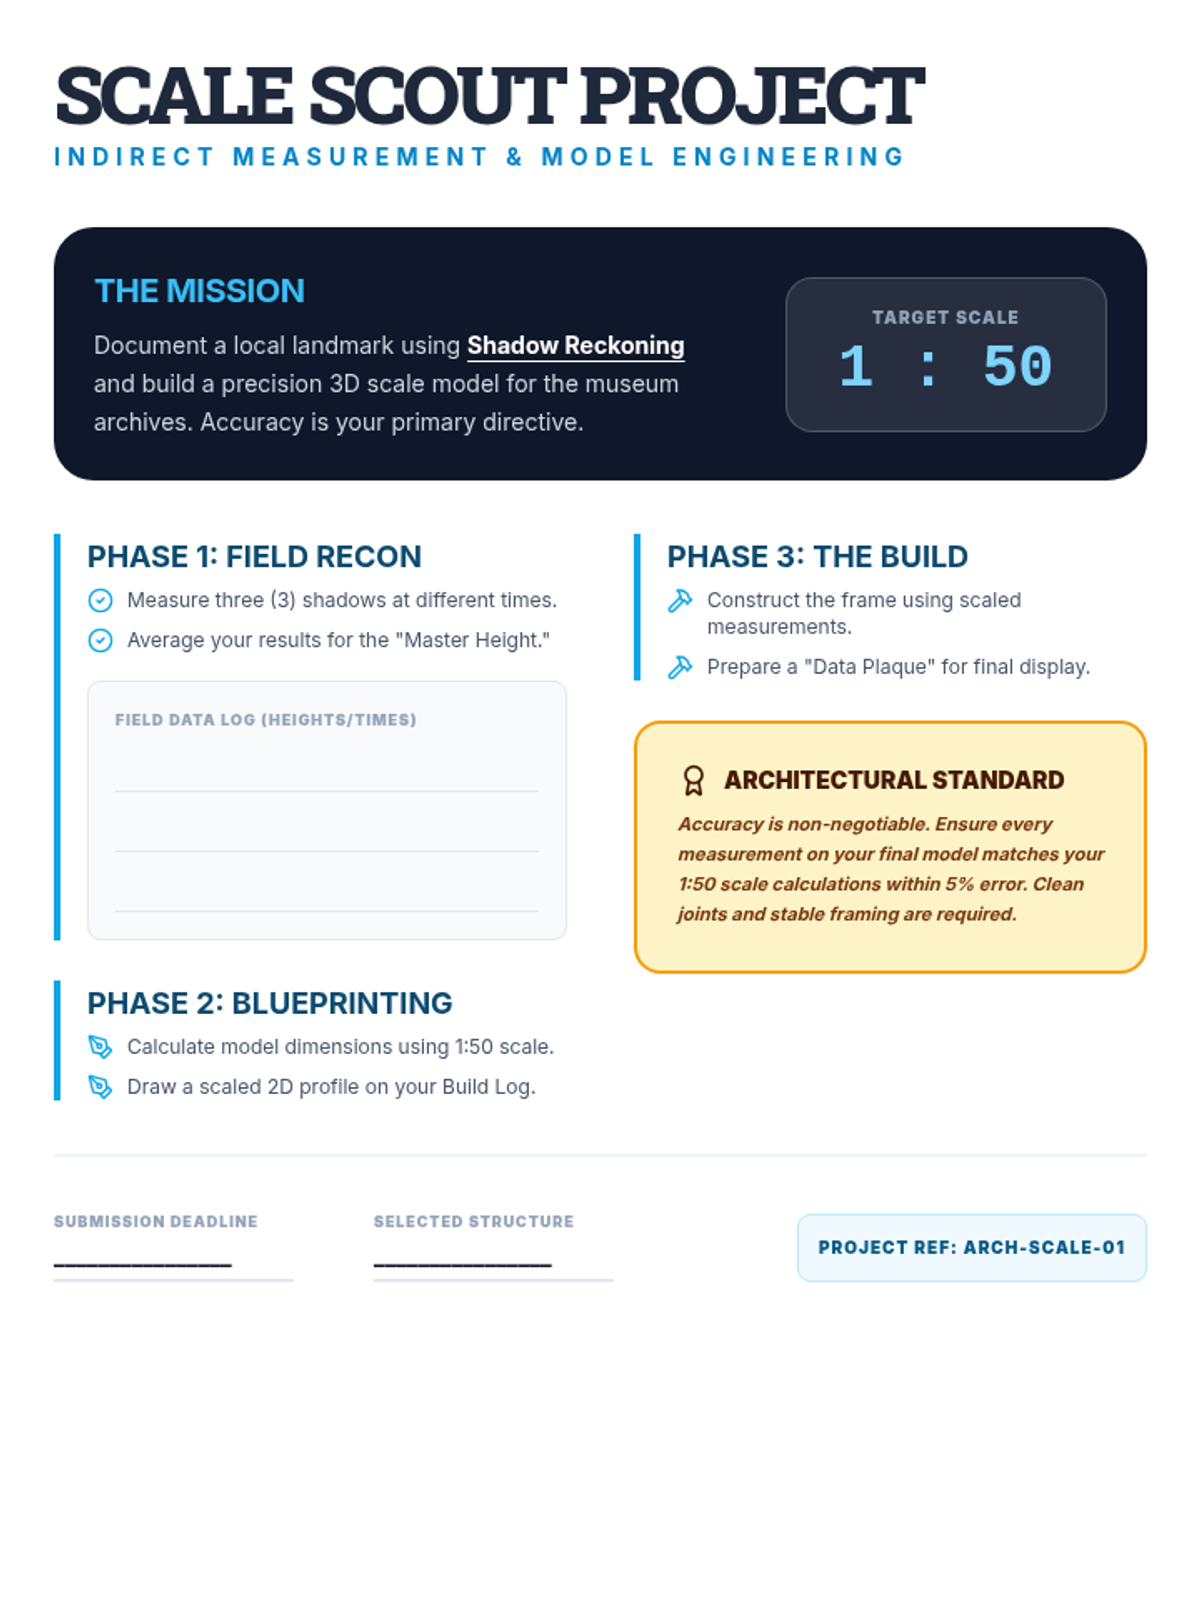
A comprehensive project guide for students, outlining the requirements for measuring a structure using shadow reckoning and building an accurate 3D scale model.
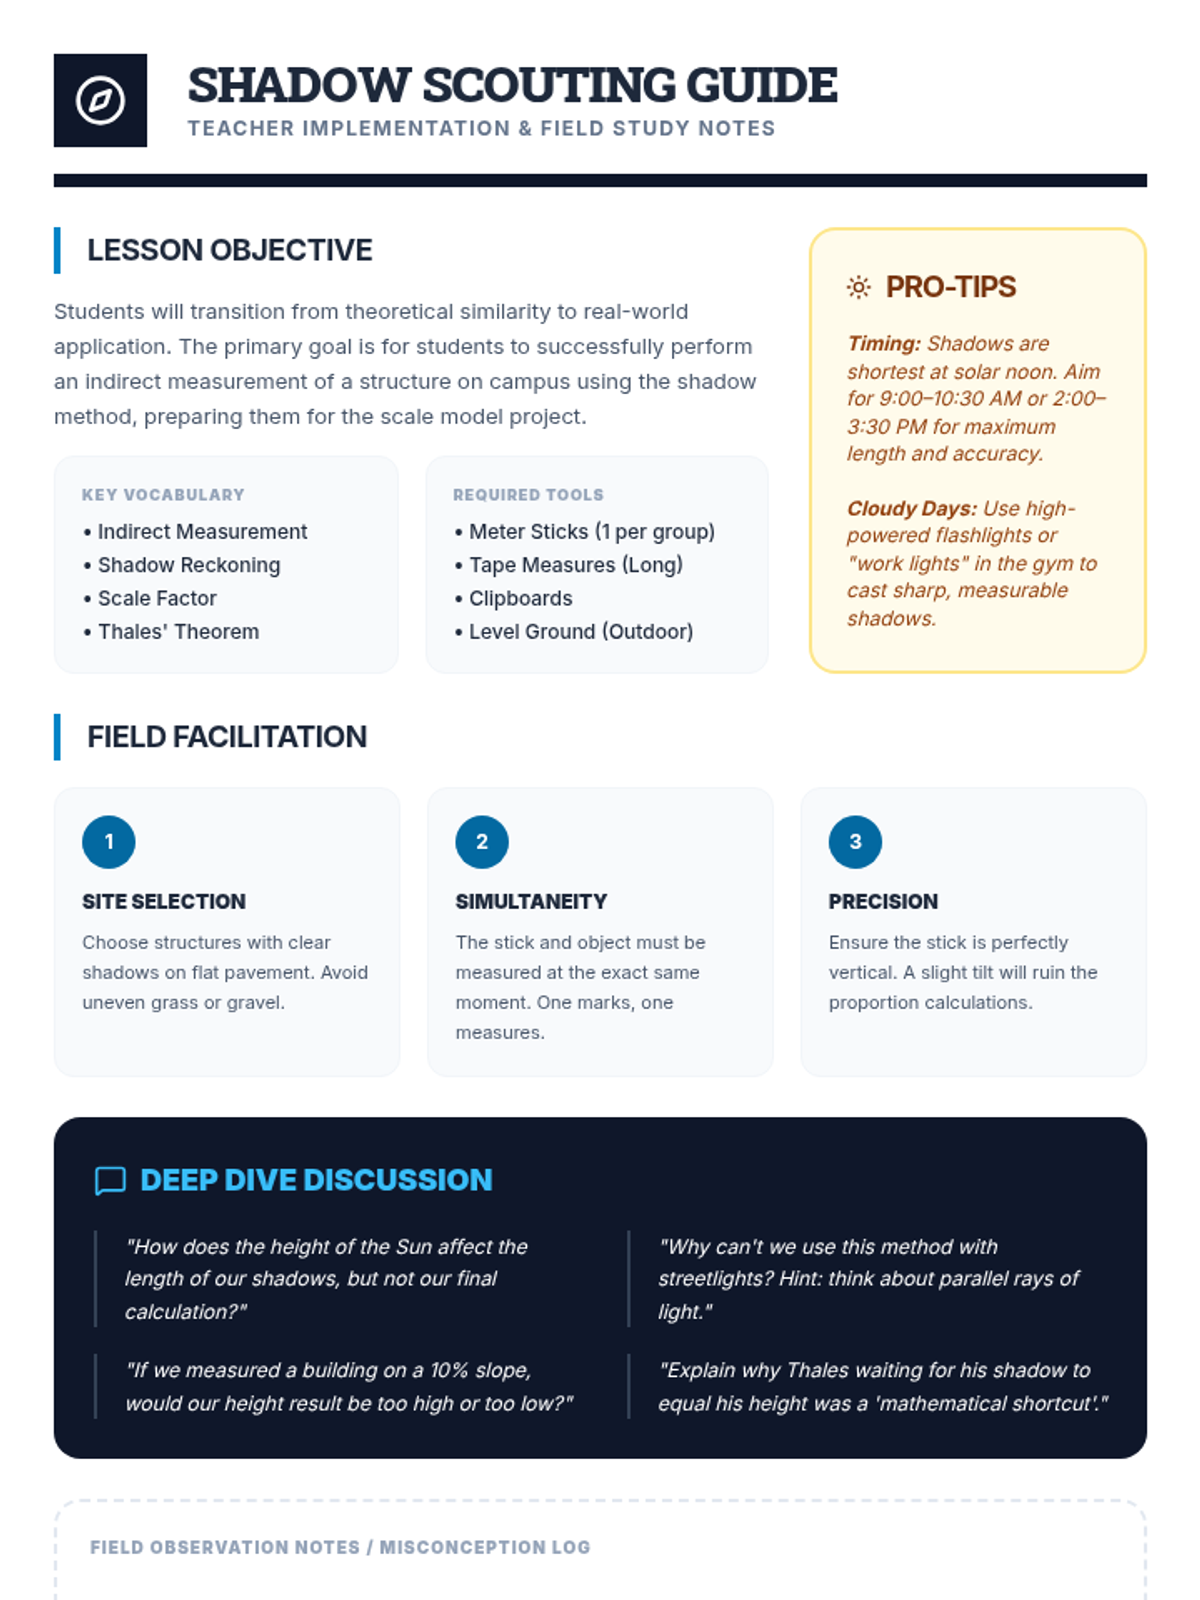
A teacher-facing guide for facilitating outdoor indirect measurement activities, including timing tips, site selection advice, and discussion prompts.
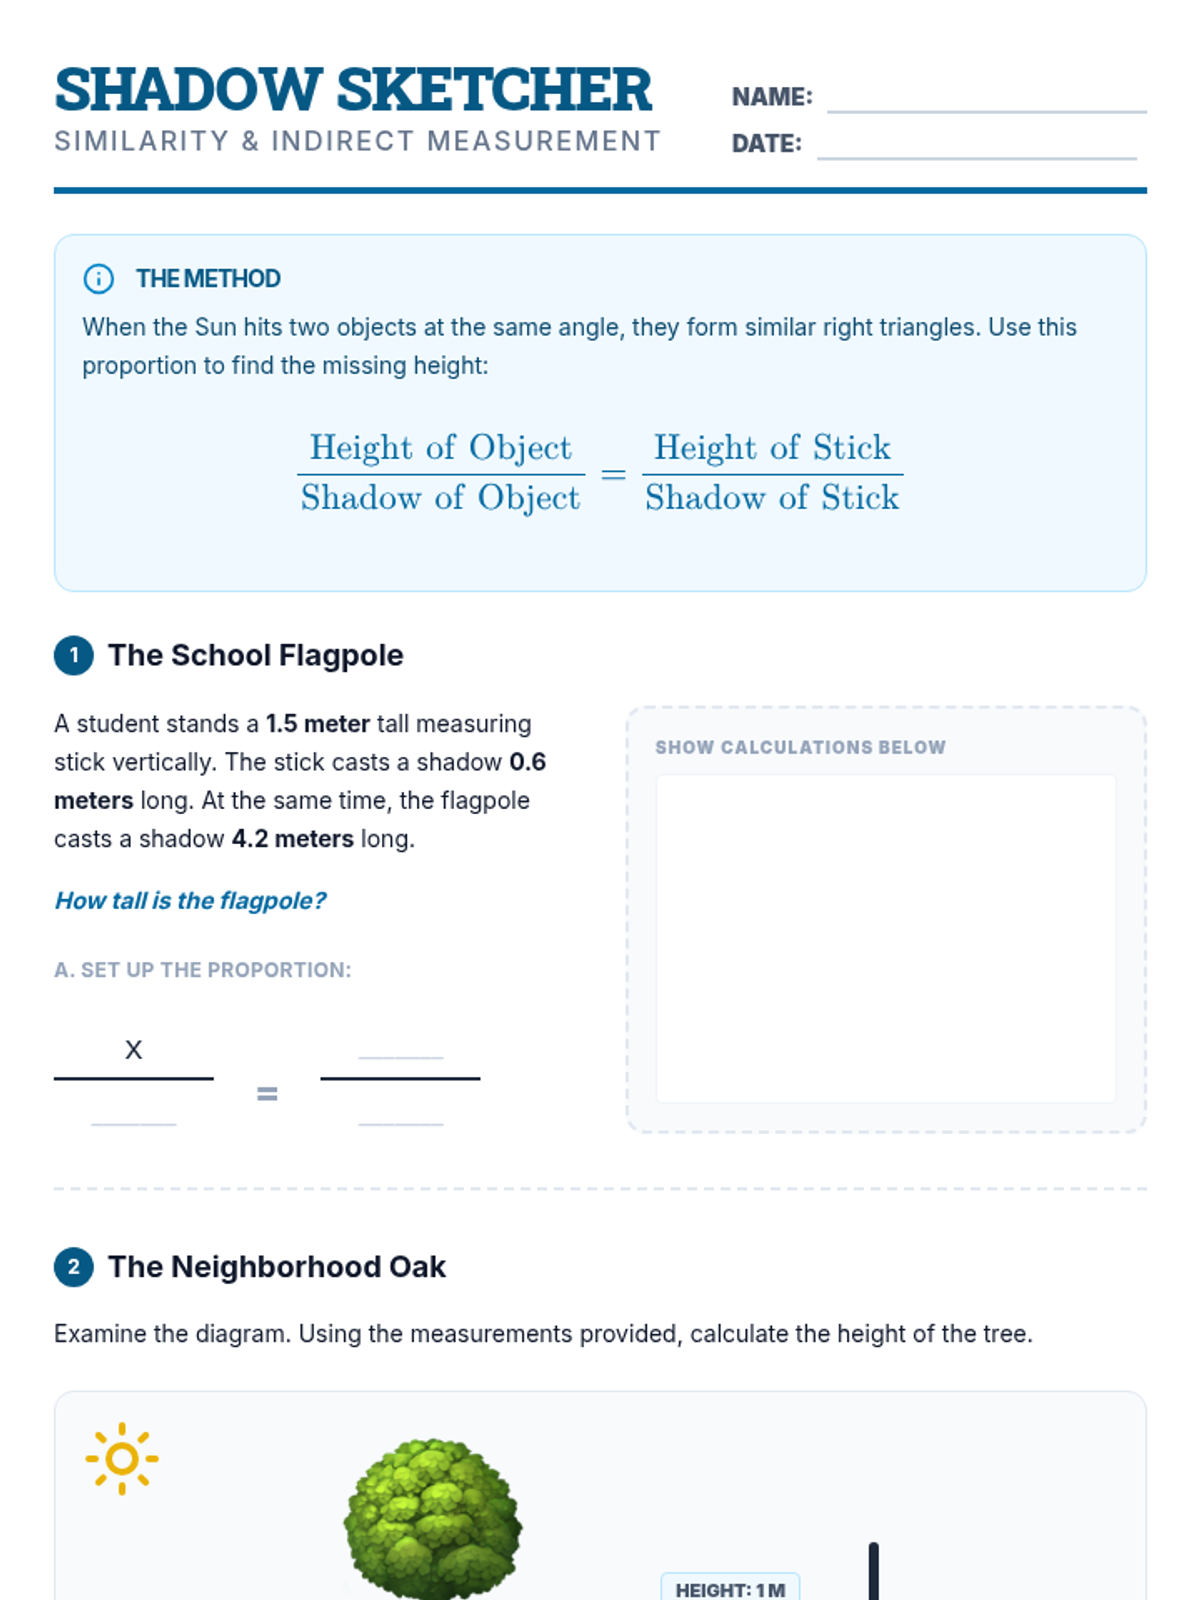
A worksheet for practicing indirect measurement calculations using shadows and similarity proportions, featuring scaffolded problems and a critical thinking challenge.
An instructional slide deck introducing the concept of similarity and the history and mathematics of the shadow reckoning method for indirect measurement.
A Japanese slide deck covering Unit 6: Measurement. It includes mental math, unit goals, lessons on measuring in halves and fourths of an inch, mixed numbers, and interpreting data on line plots.
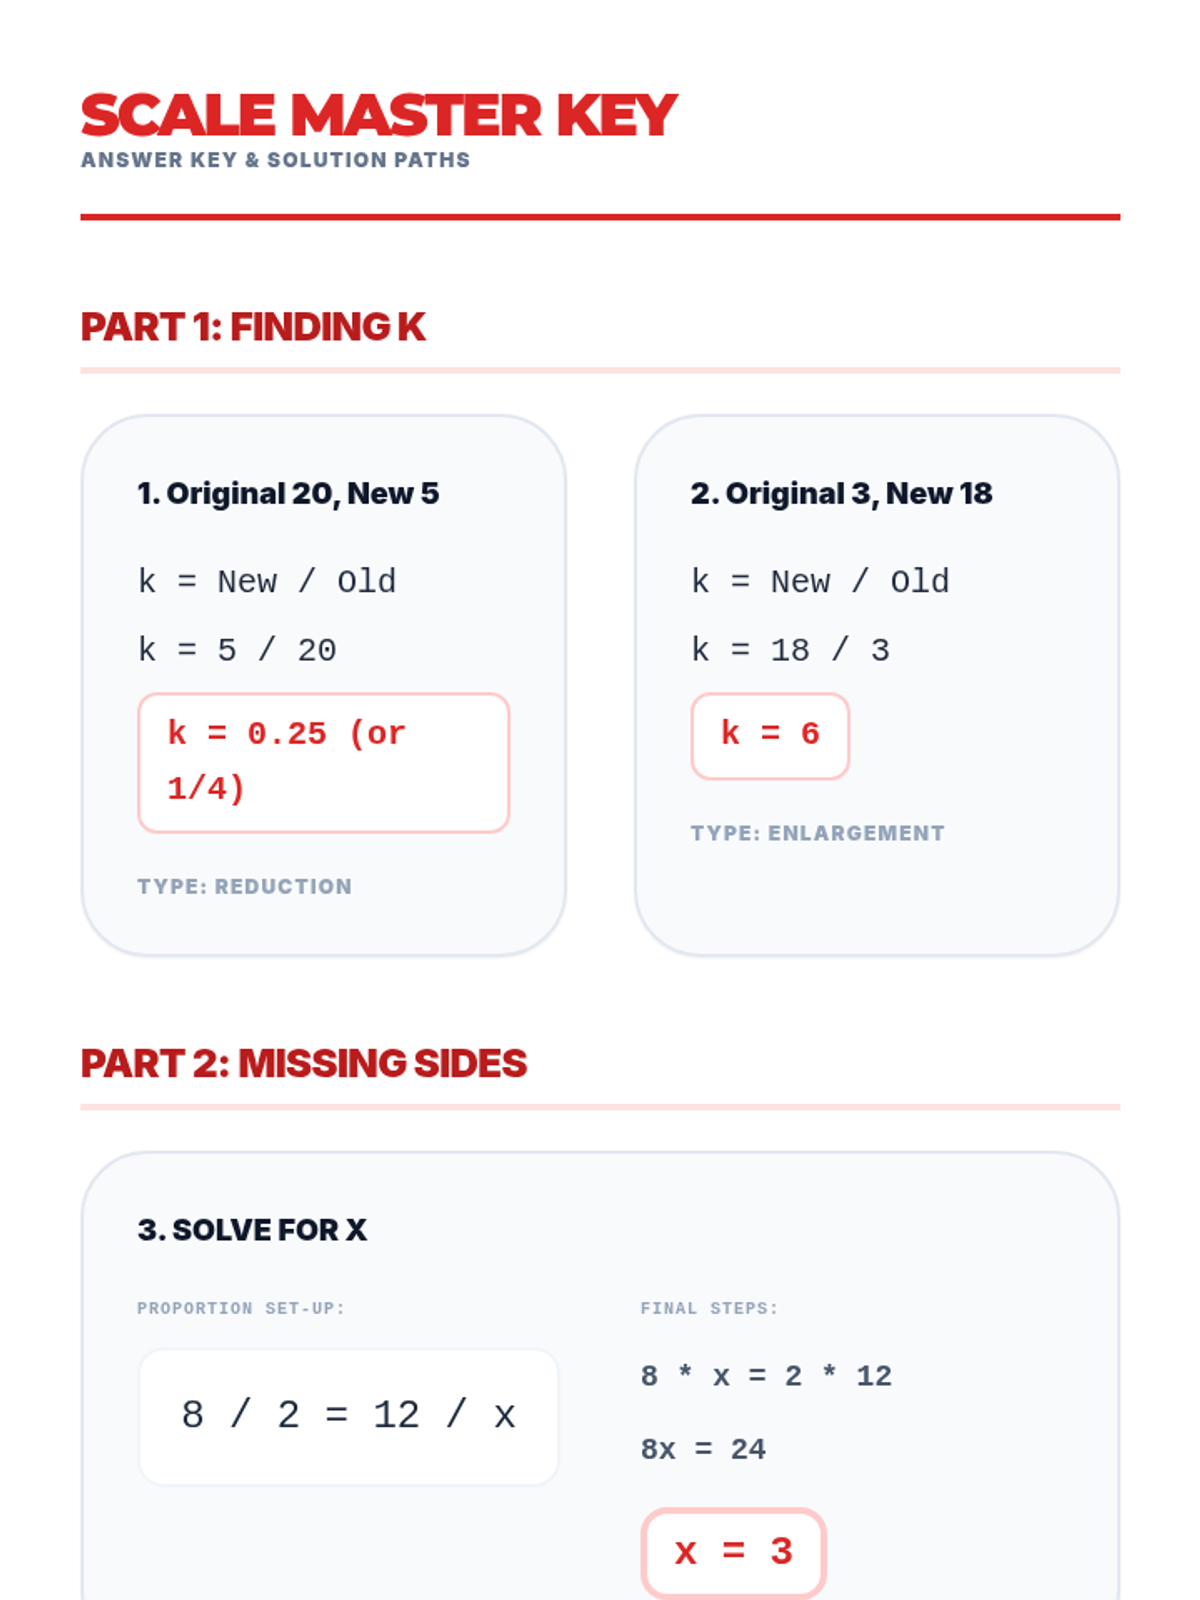
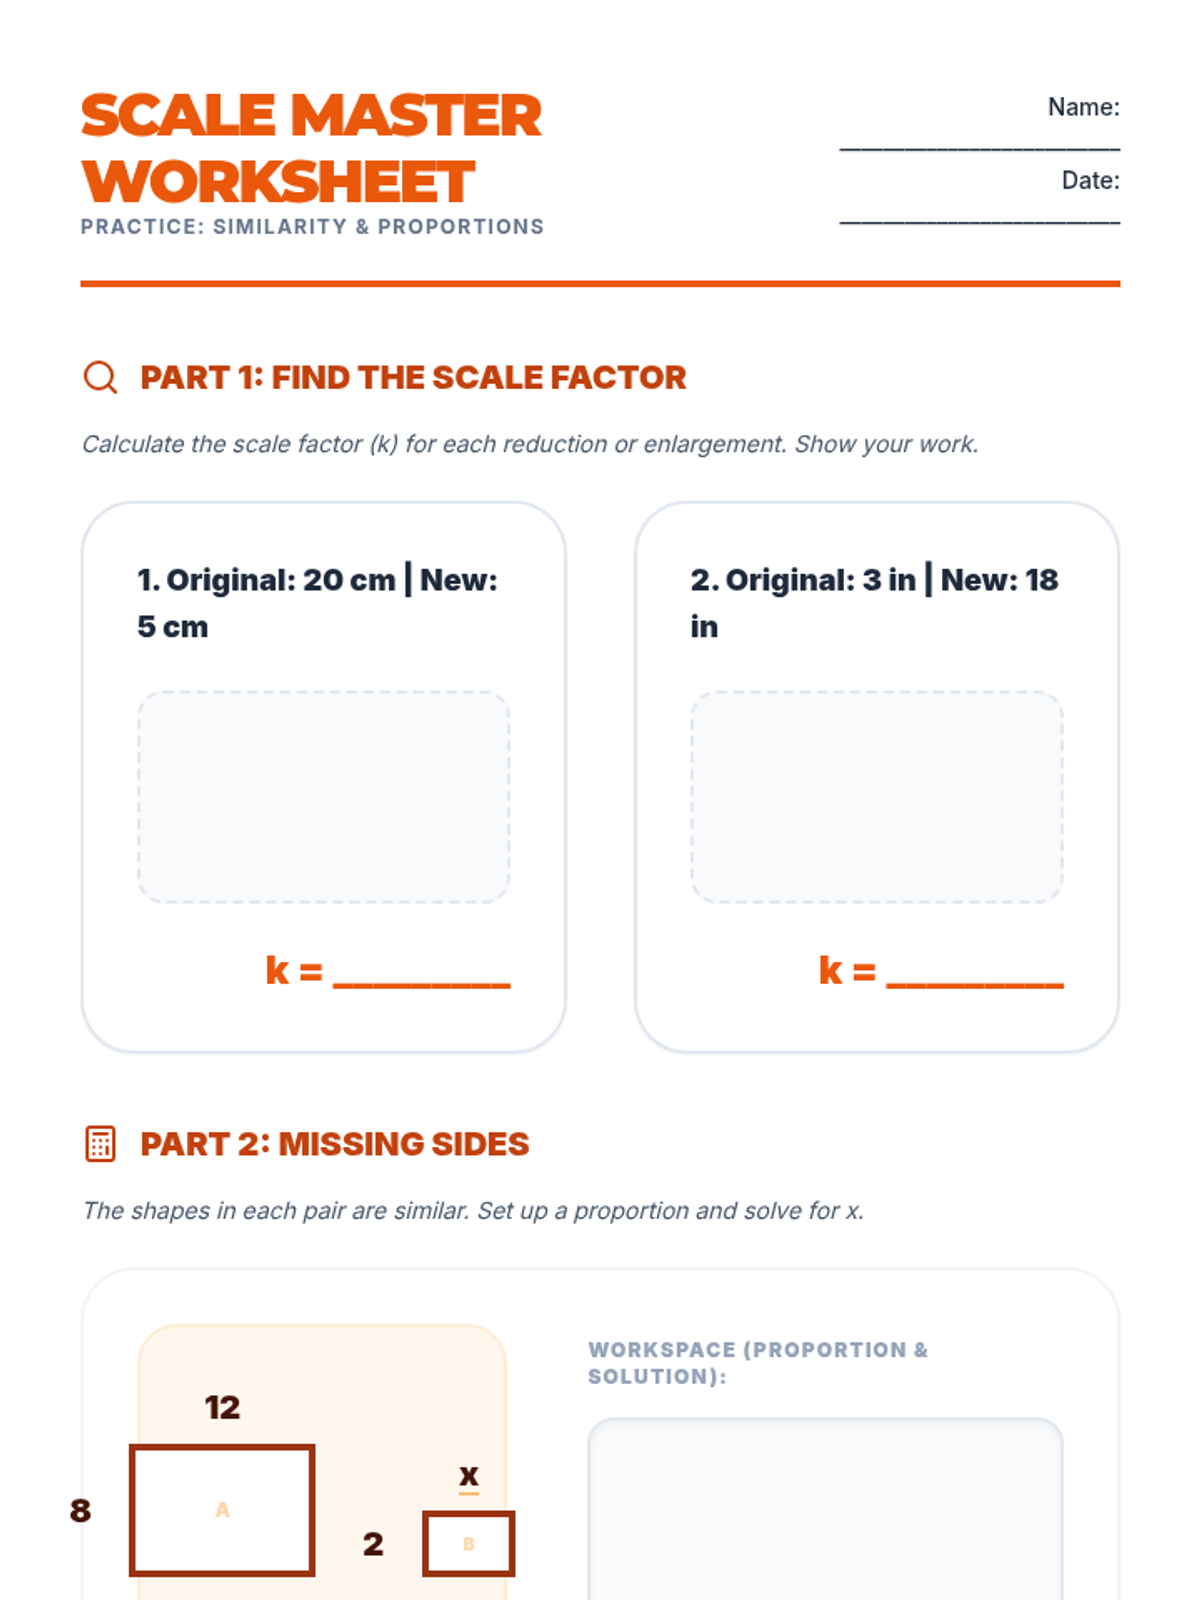
Answer key for the 'Scale Master Worksheet'. Revised with 'break-inside-avoid' for all problems, improved text contrast for labels, and clear step-by-step solution paths.
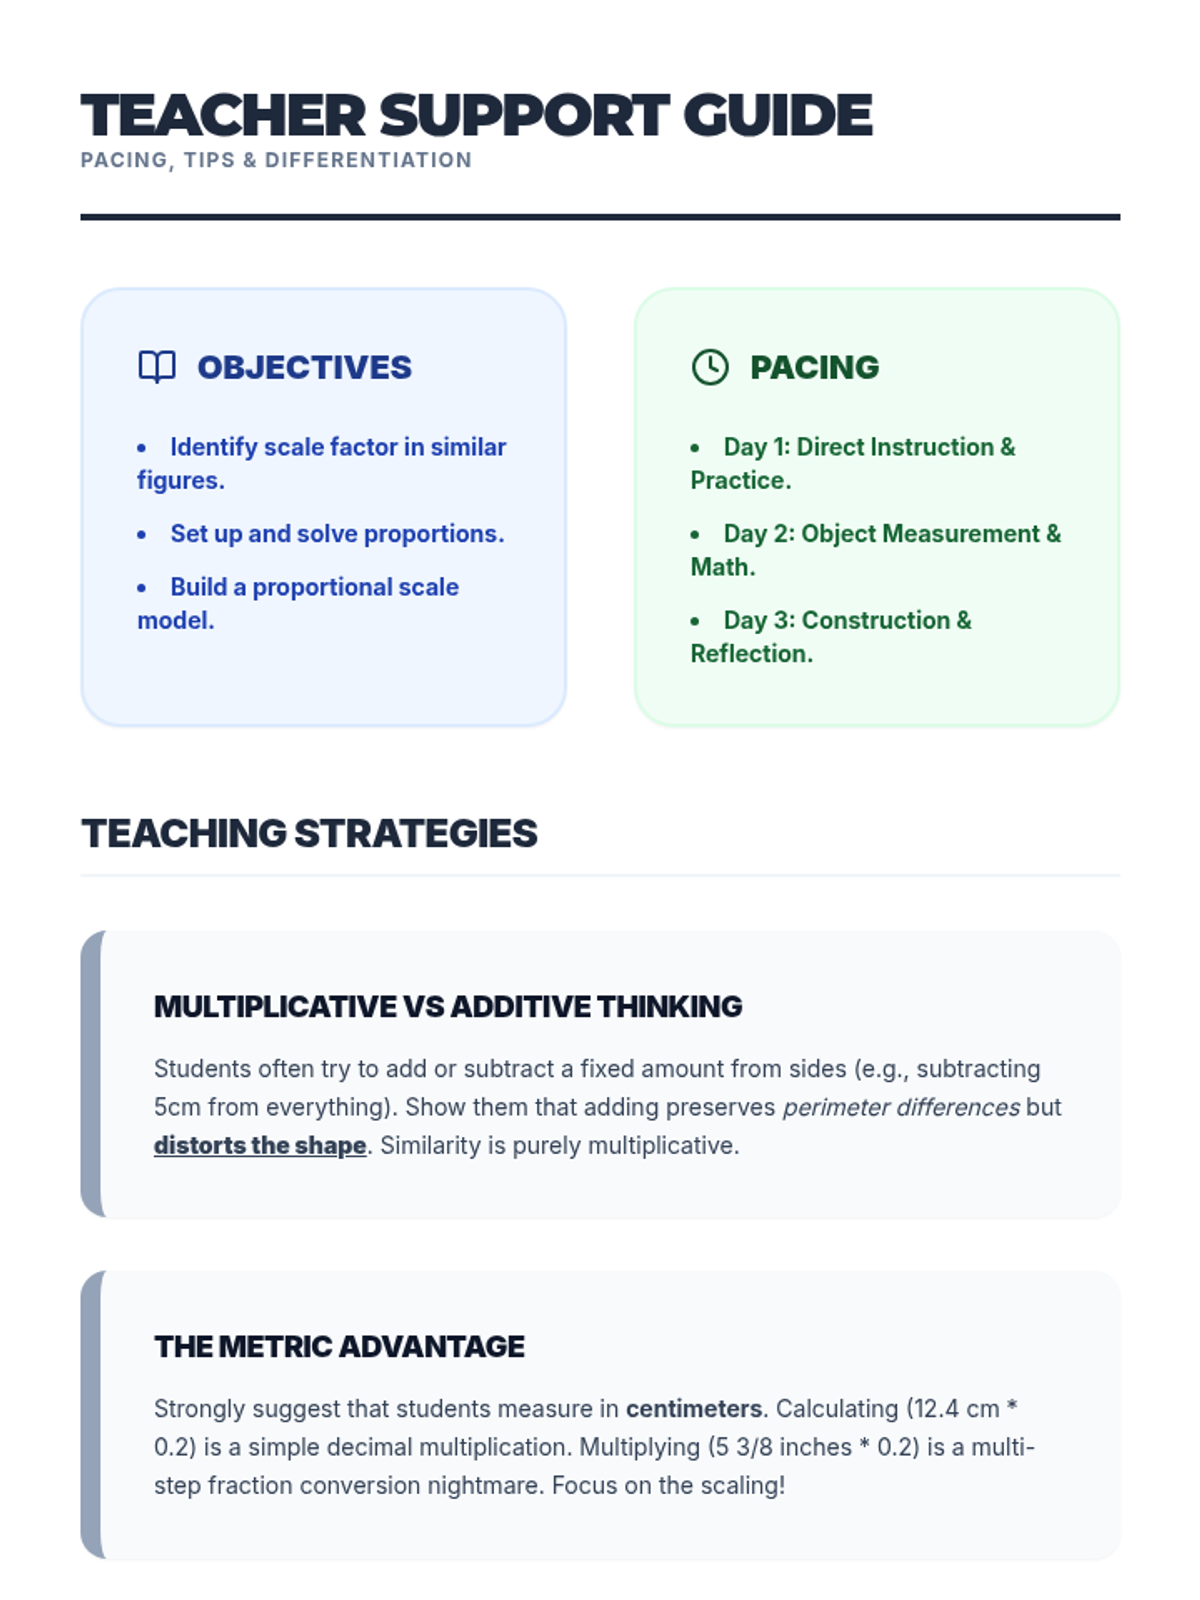
Teacher resource for 'The Great Shrink'. Revised with balanced content, larger font sizes for tips, and robust math notation rendering.
A practice worksheet for similarity and proportions. Revised with 'break-inside-avoid' to prevent problem splitting, larger work areas, and significantly improved diagram clarity and font sizing.
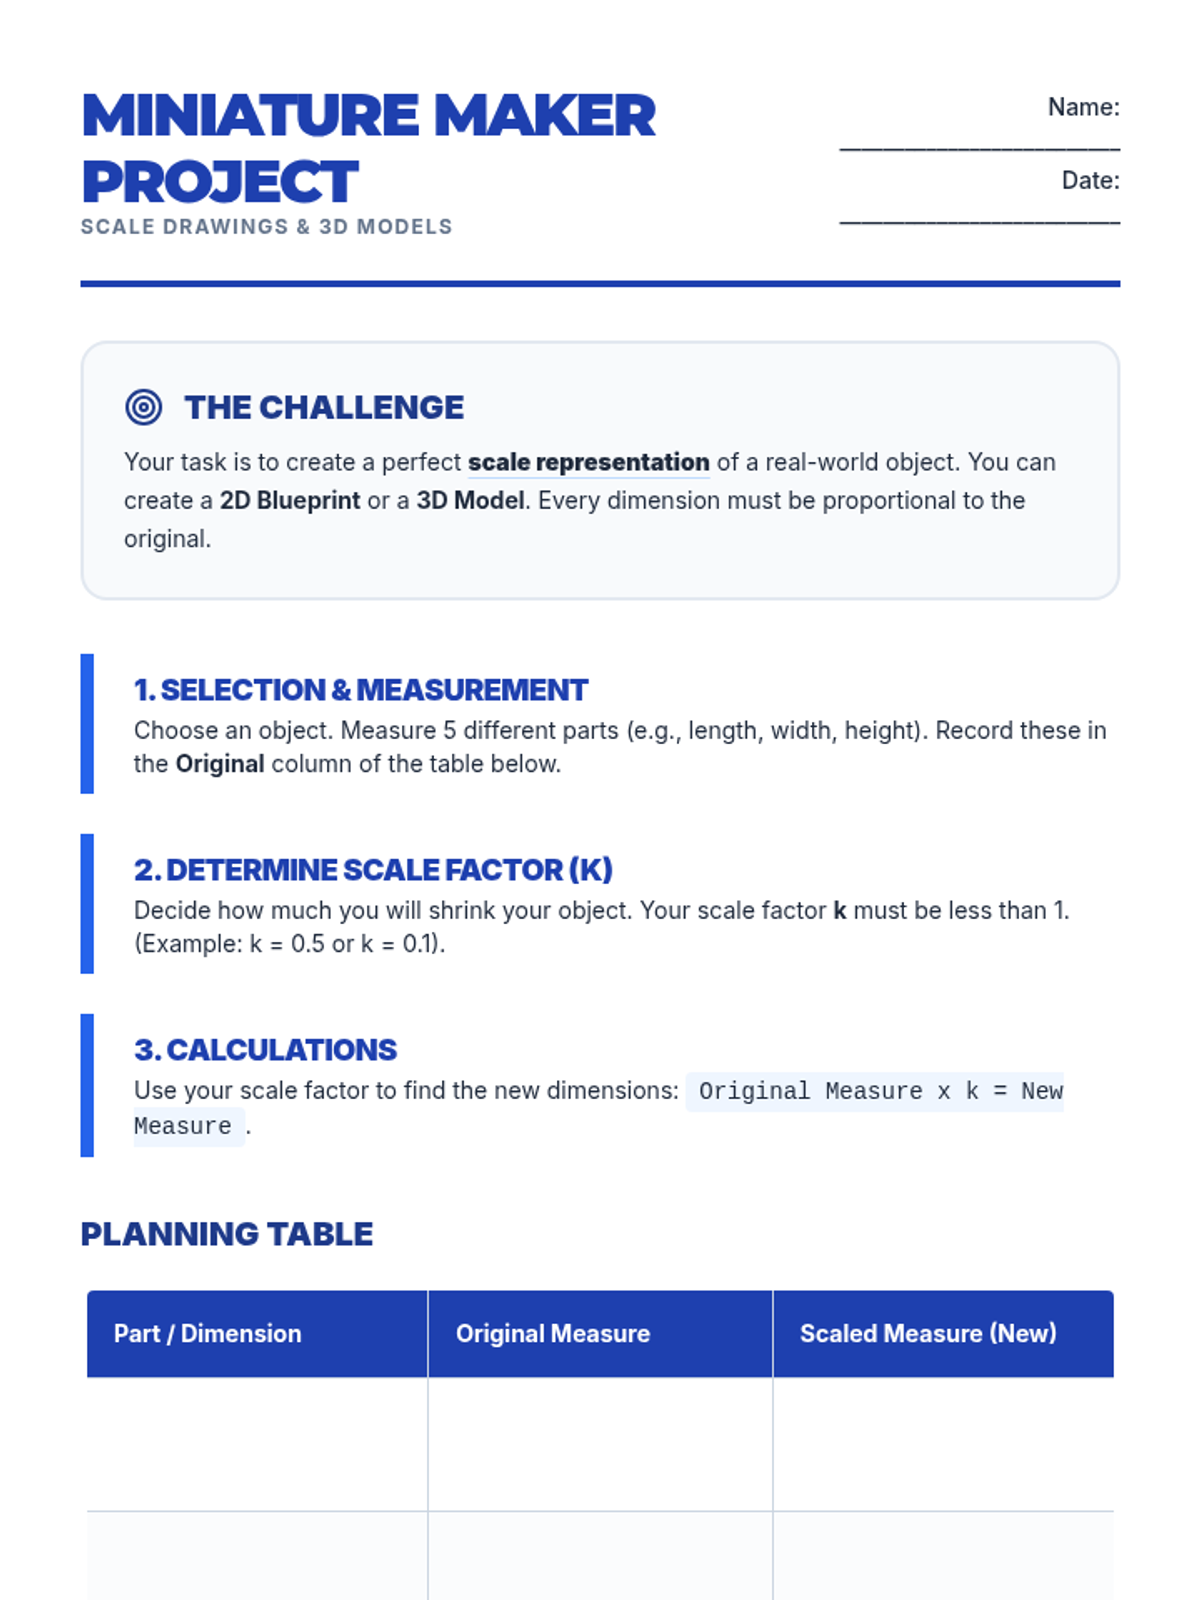
A comprehensive project guide and rubric for 'Miniature Maker Project'. Revised to keep tables together on one page, increase student work areas, and ensure consistent math rendering.
An introductory slide deck for 'The Great Shrink' lesson, covering the fundamentals of similarity, scale factor, and proportions, and introducing the project challenge. Revised with improved layout, larger fonts, and better technical rendering.
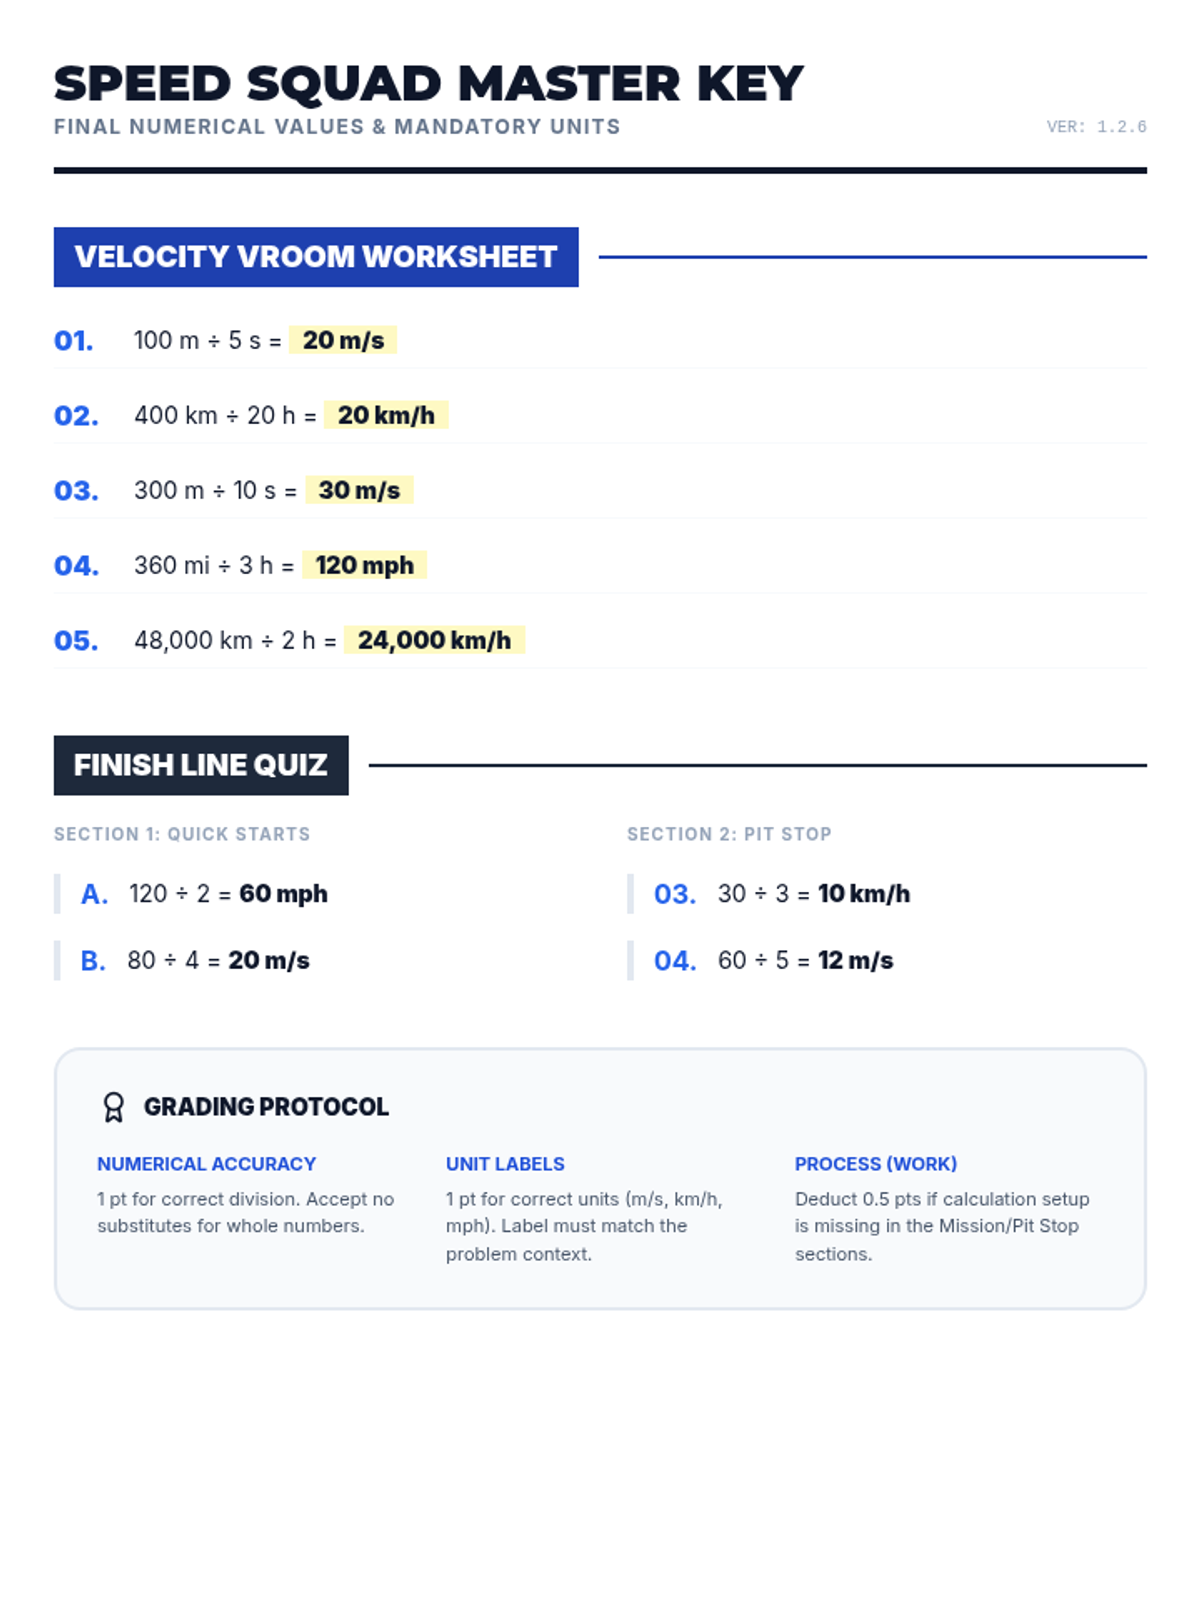
A standardized answer key for the Speed Squad lesson, providing final answers with consistent unit formatting and numerical values. Includes a specific grading protocol for teachers to assess numerical accuracy, unit labels, and calculation work.
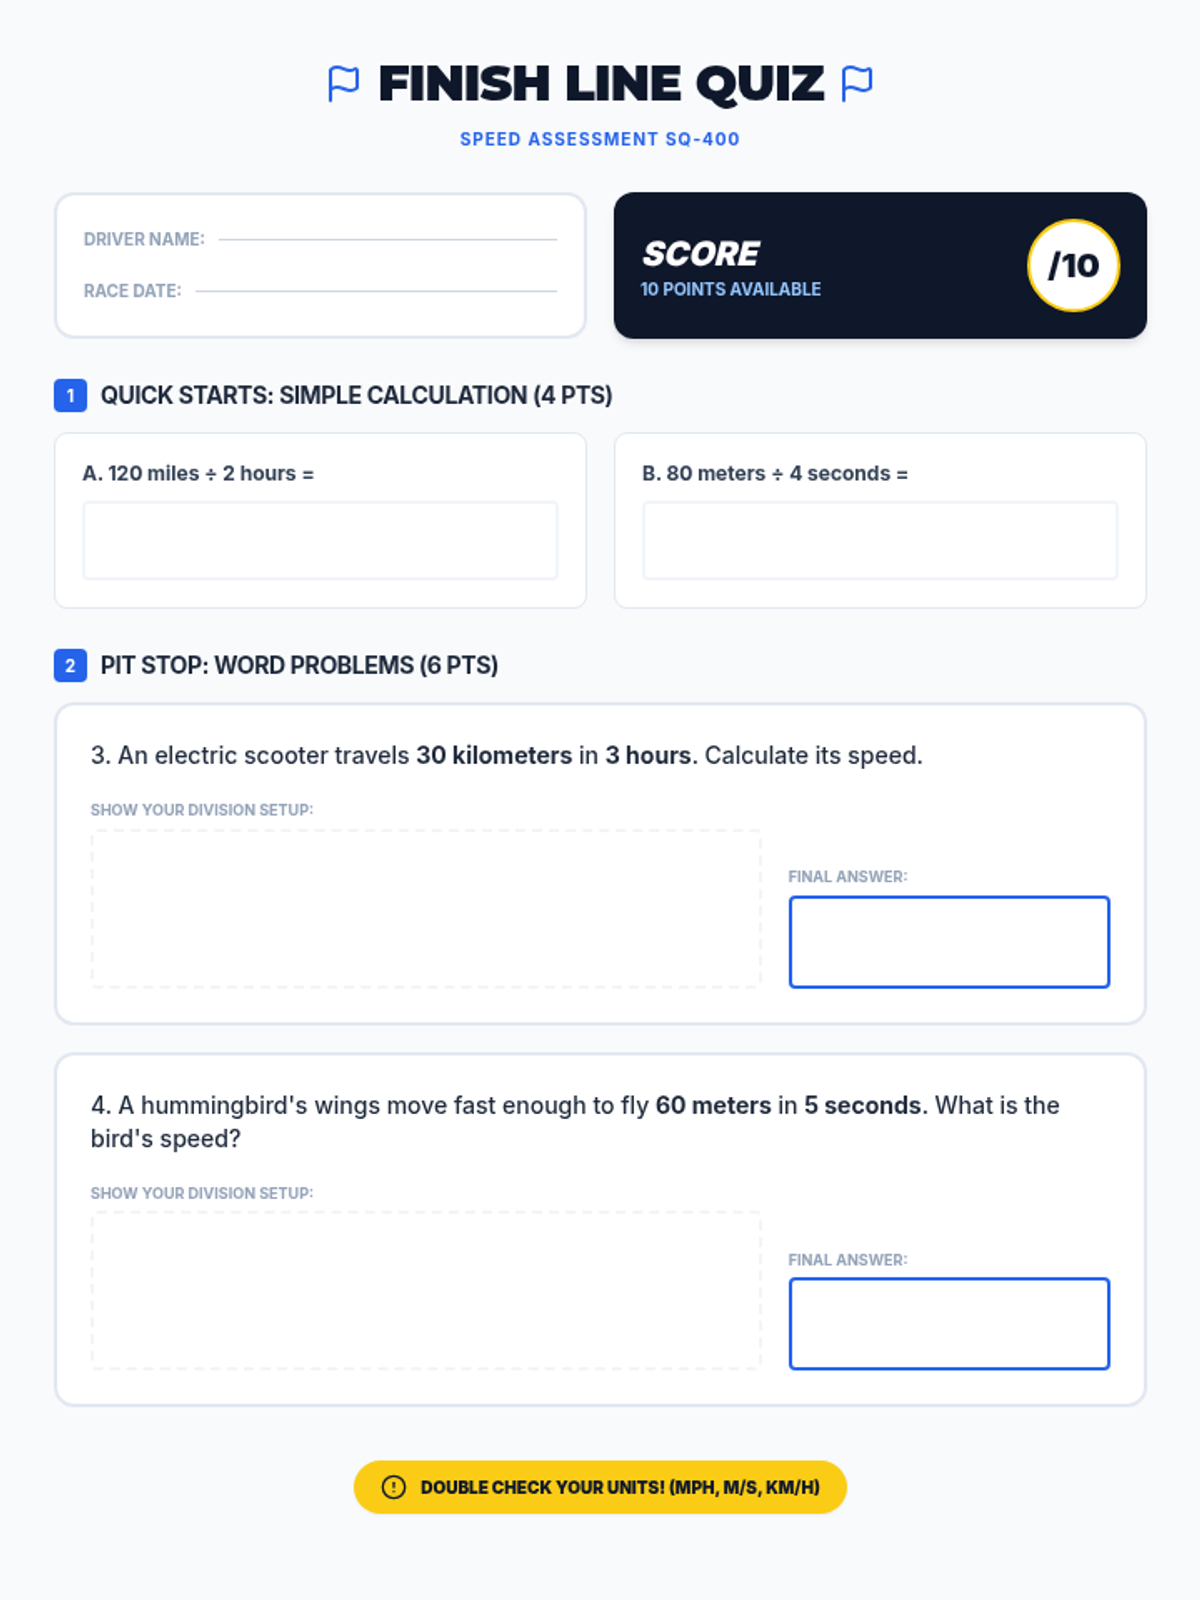
A scaffolded speed calculation quiz featuring direct division problems and racing-themed word problems. Includes dedicated work areas for division setup and final answers with units, optimized to fit on a single page with high-contrast work areas.
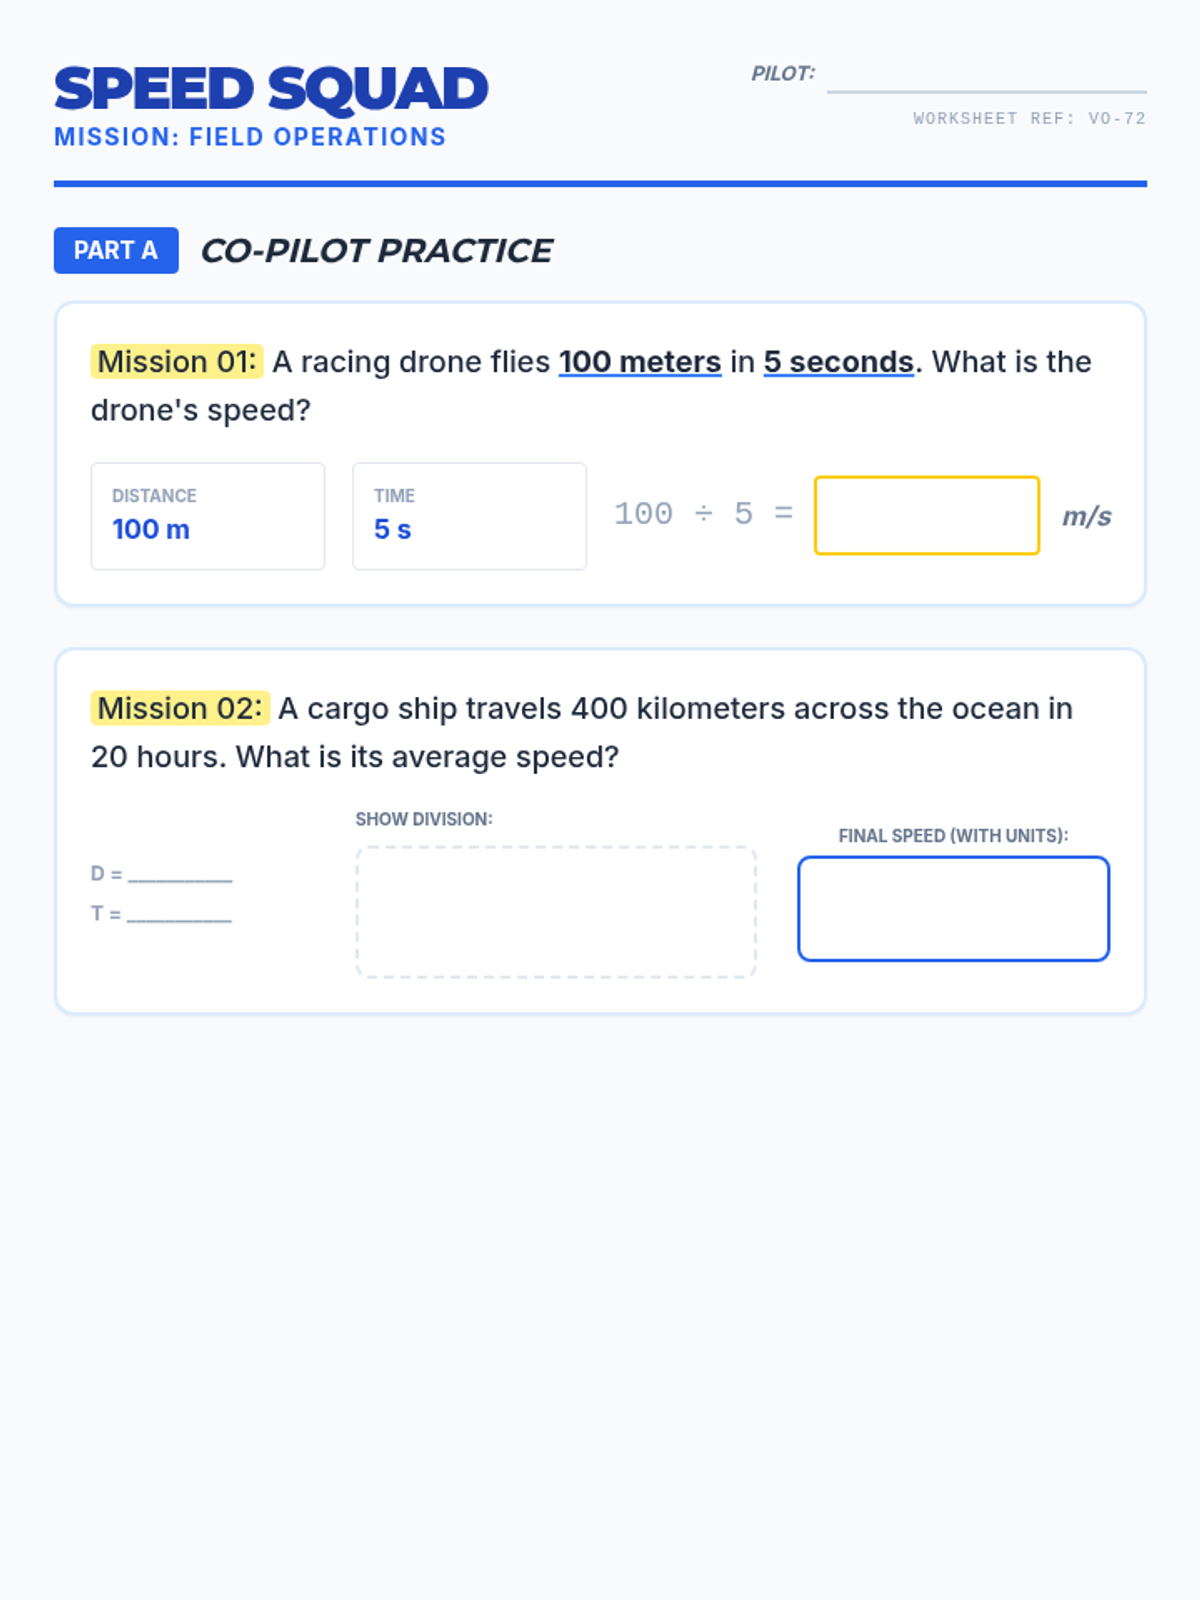
A multi-page guided practice worksheet featuring racing-themed word problems. Page one provides high-scaffold support with prompt-based inputs, while page two moves to independent missions with larger work areas for division calculations and final answers with units. Optimized with page-break protection and high-contrast labels.
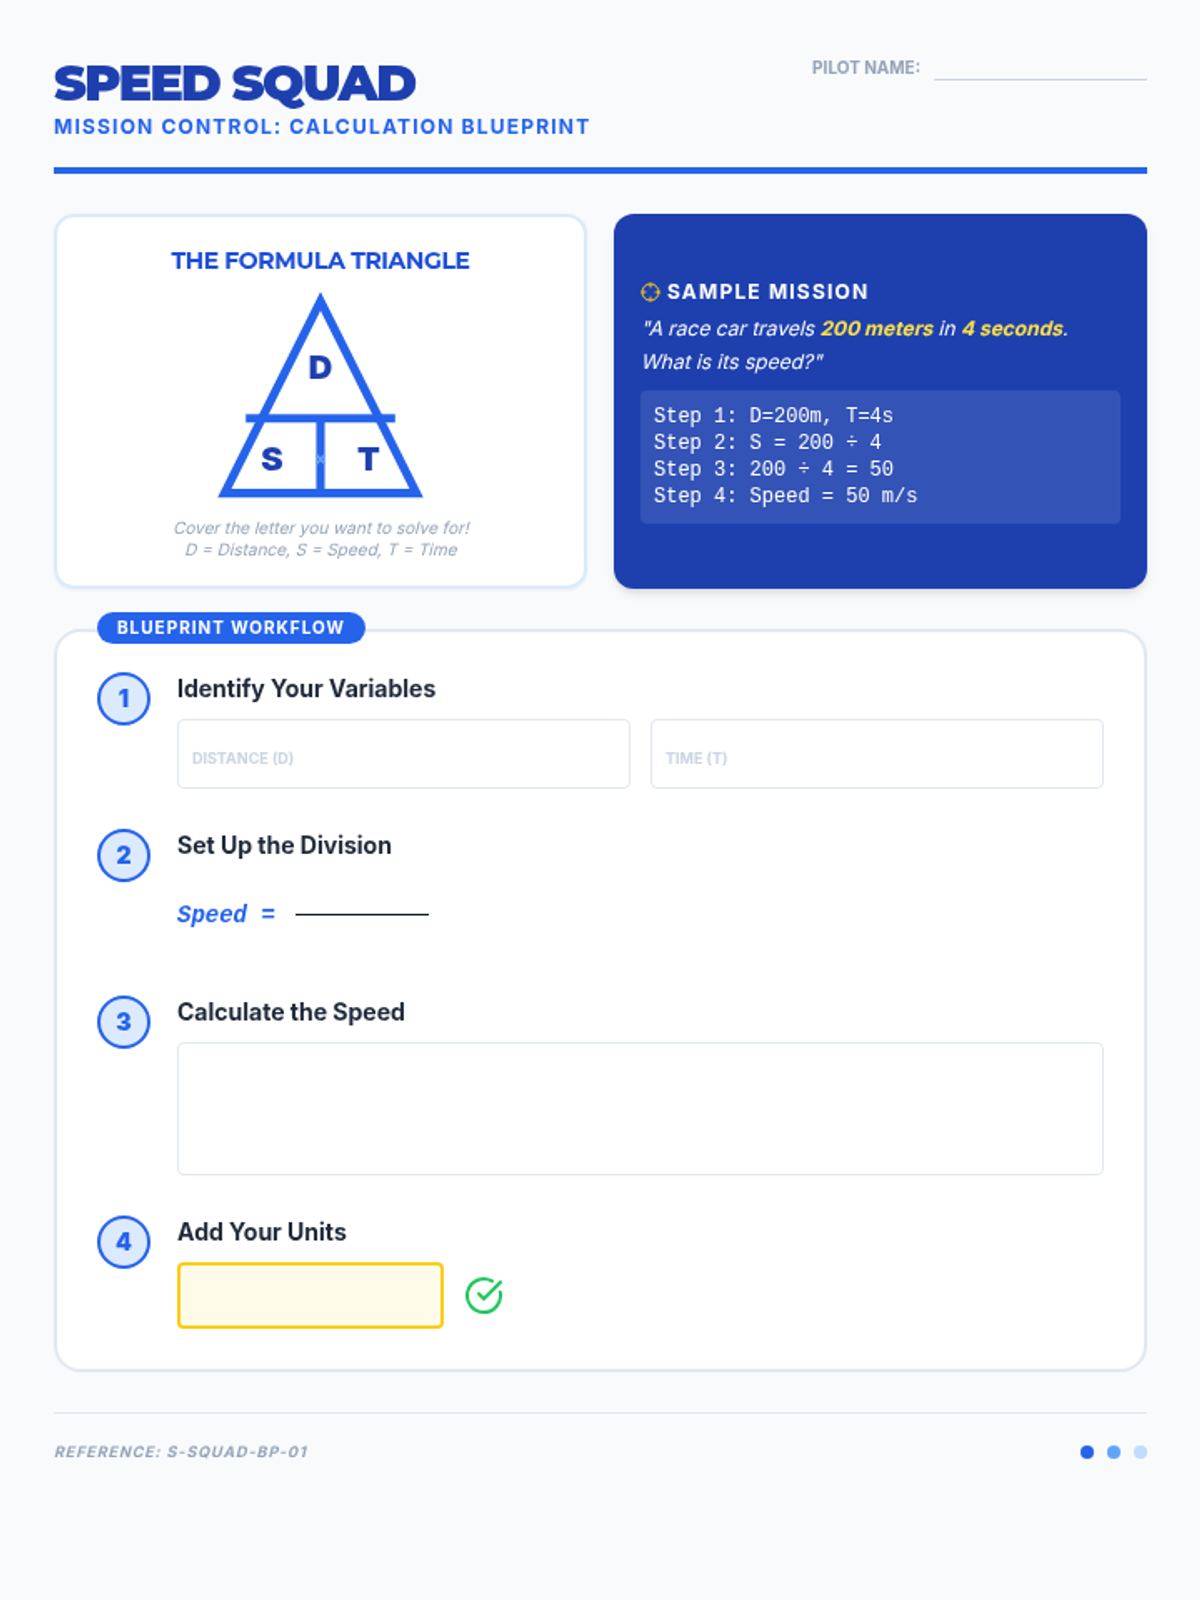
A revised step-by-step graphic organizer featuring a corrected SVG formula triangle, a sample calculation mission, and optimized spacing to fit on a single page. It provides clear, white-background work areas for identifying variables, setting up division, and finalizing answers with units.
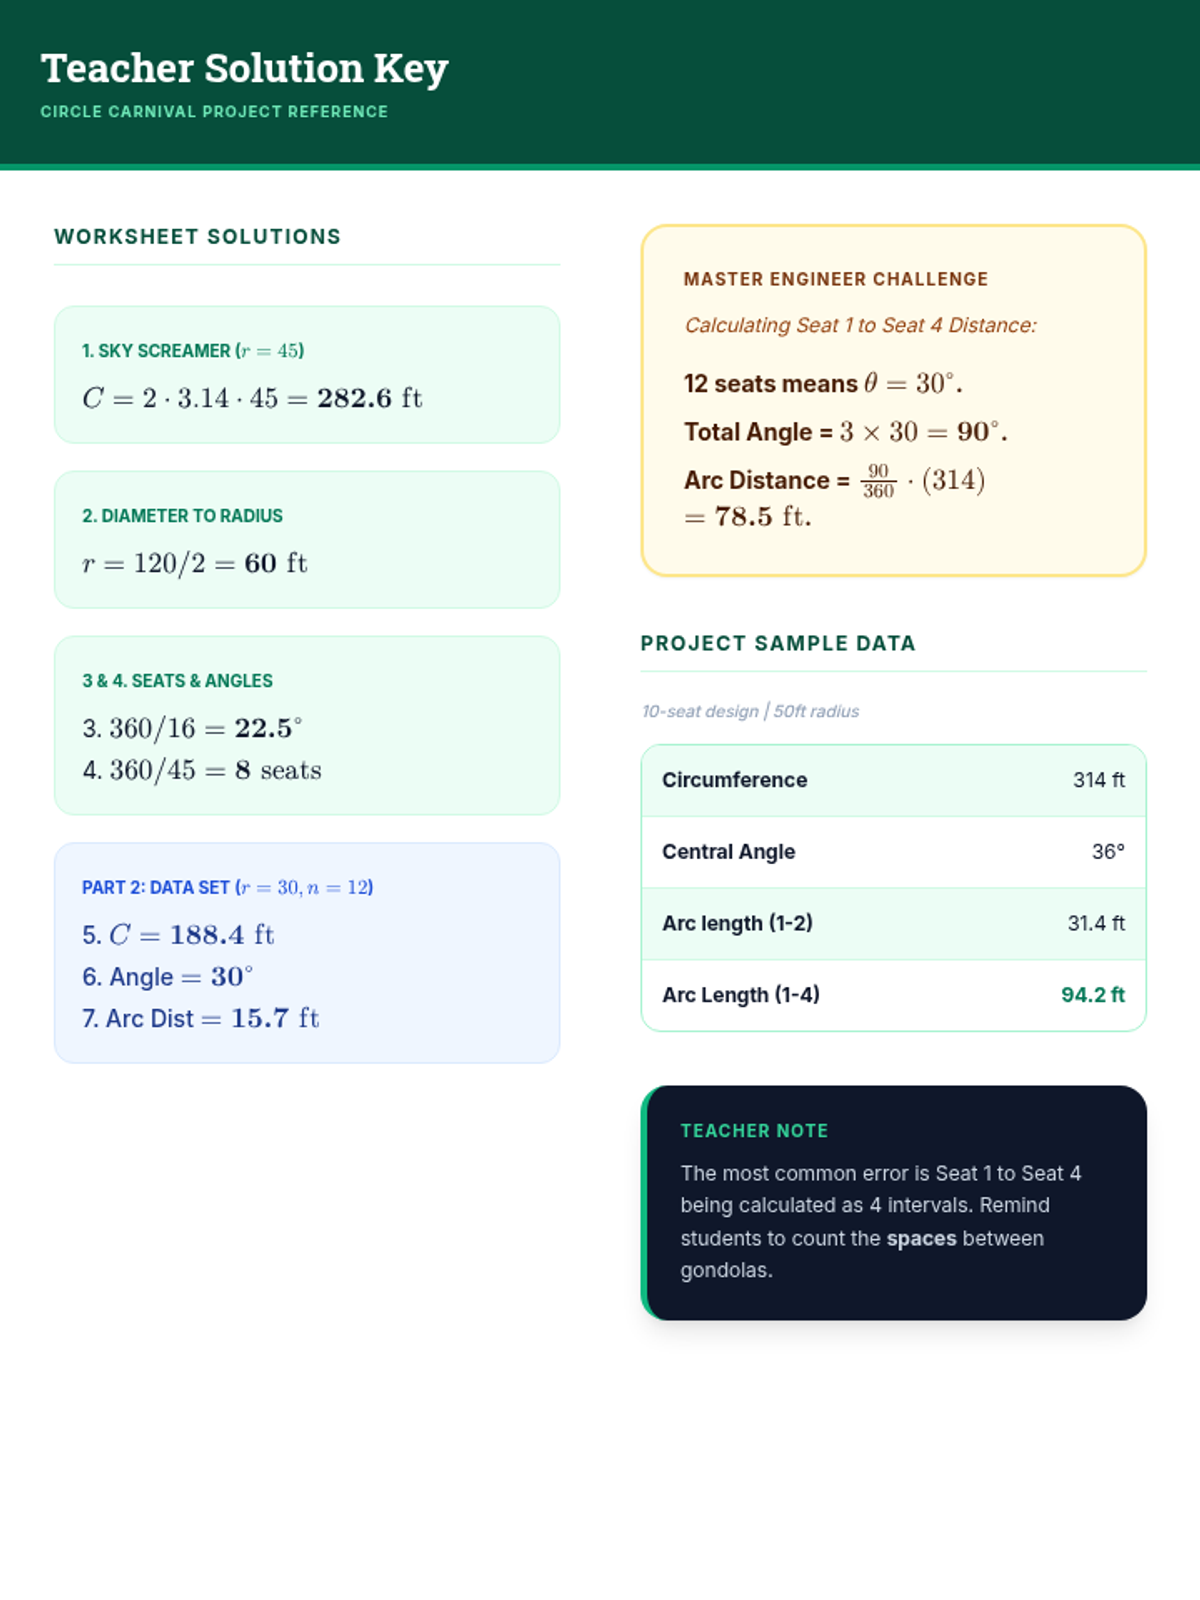
A teacher resource providing correct answers and sample data for the Ferris Wheel Physics worksheet and the design project.
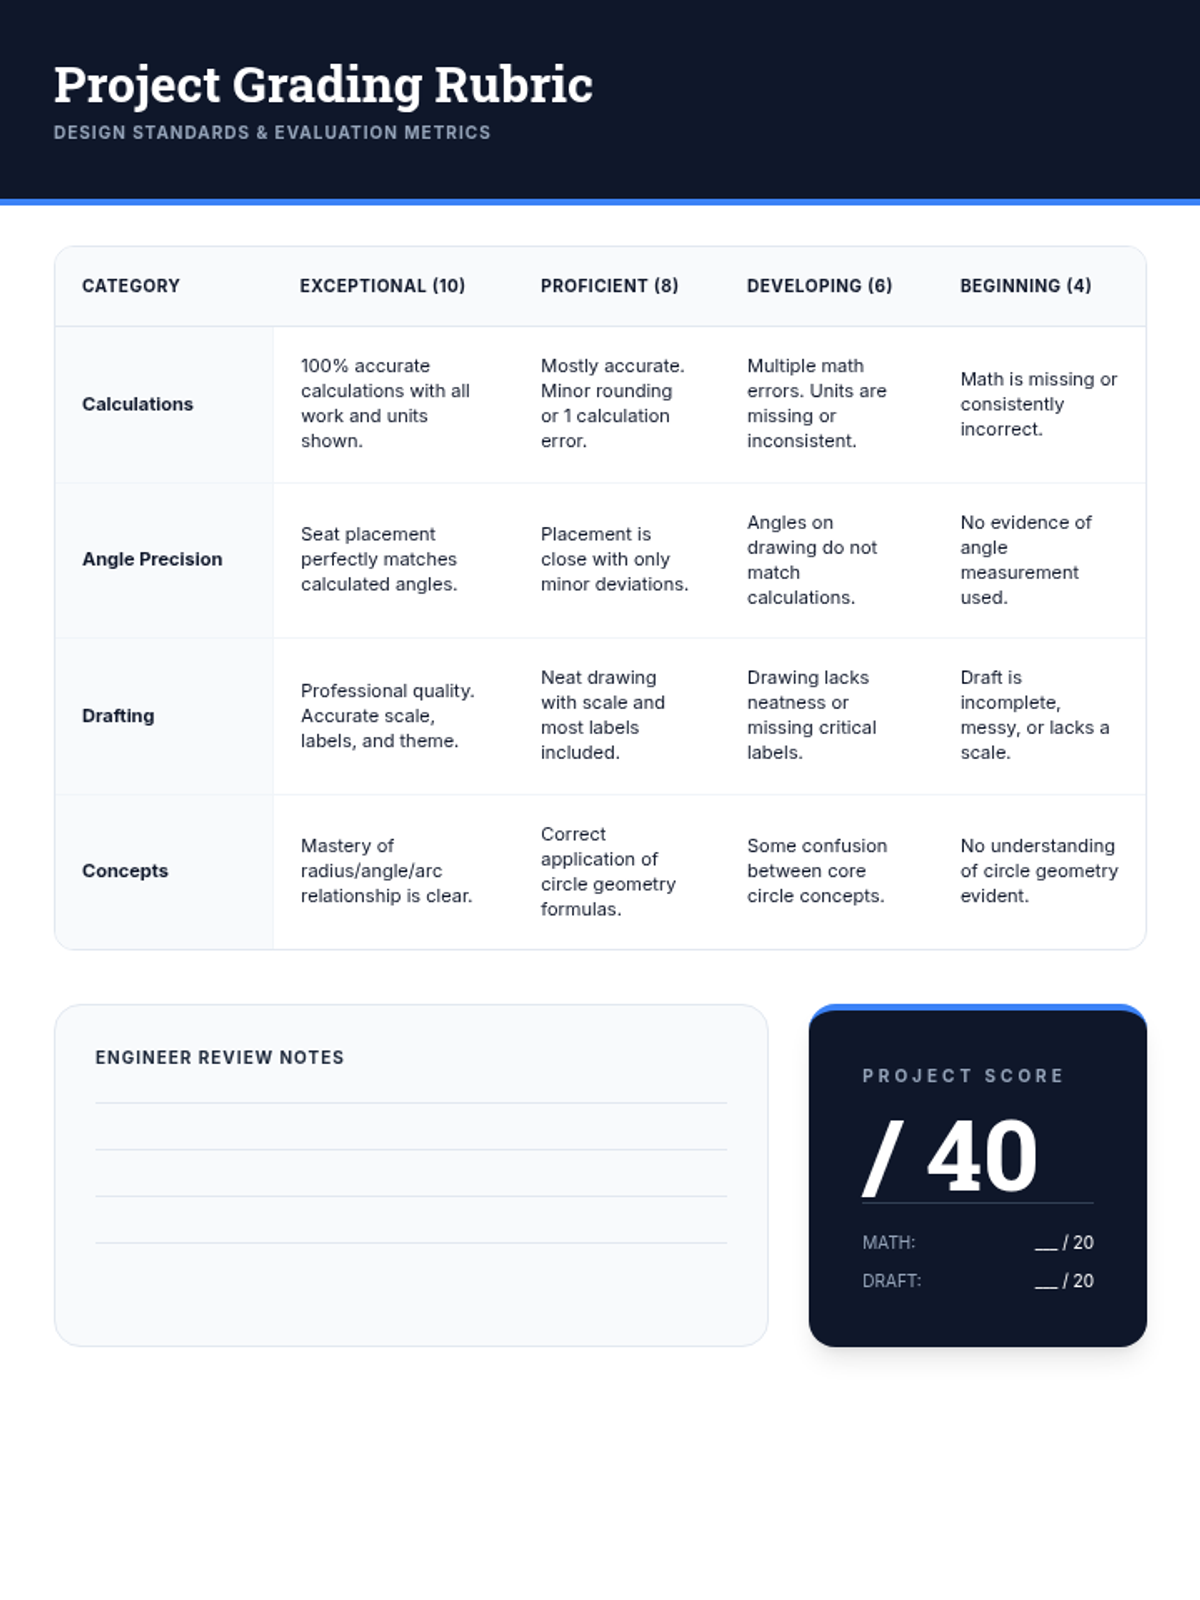
A grading rubric for the Ferris Wheel Project, assessing mathematical calculations, geometric accuracy, blueprint quality, and concept application.
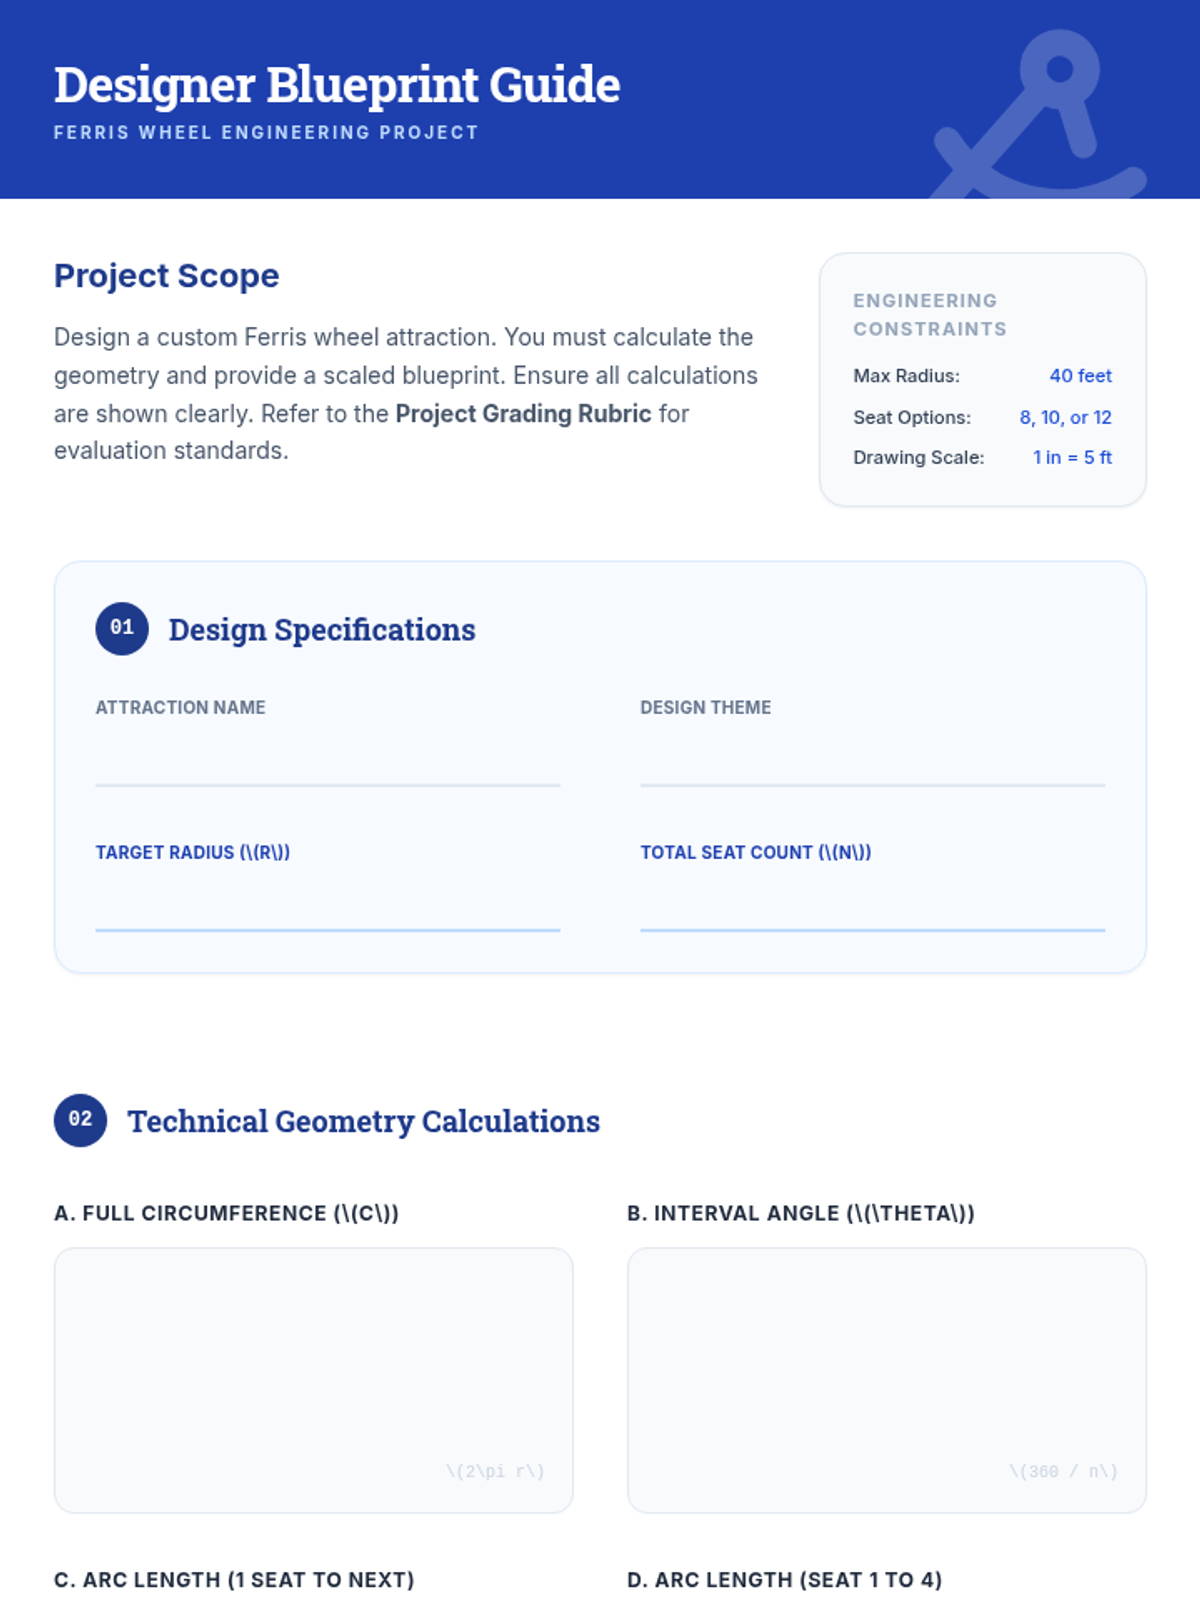
A project guide for students to design their own Ferris wheel, including space for calculations of circumference, central angles, and arc lengths, plus a drafting area.
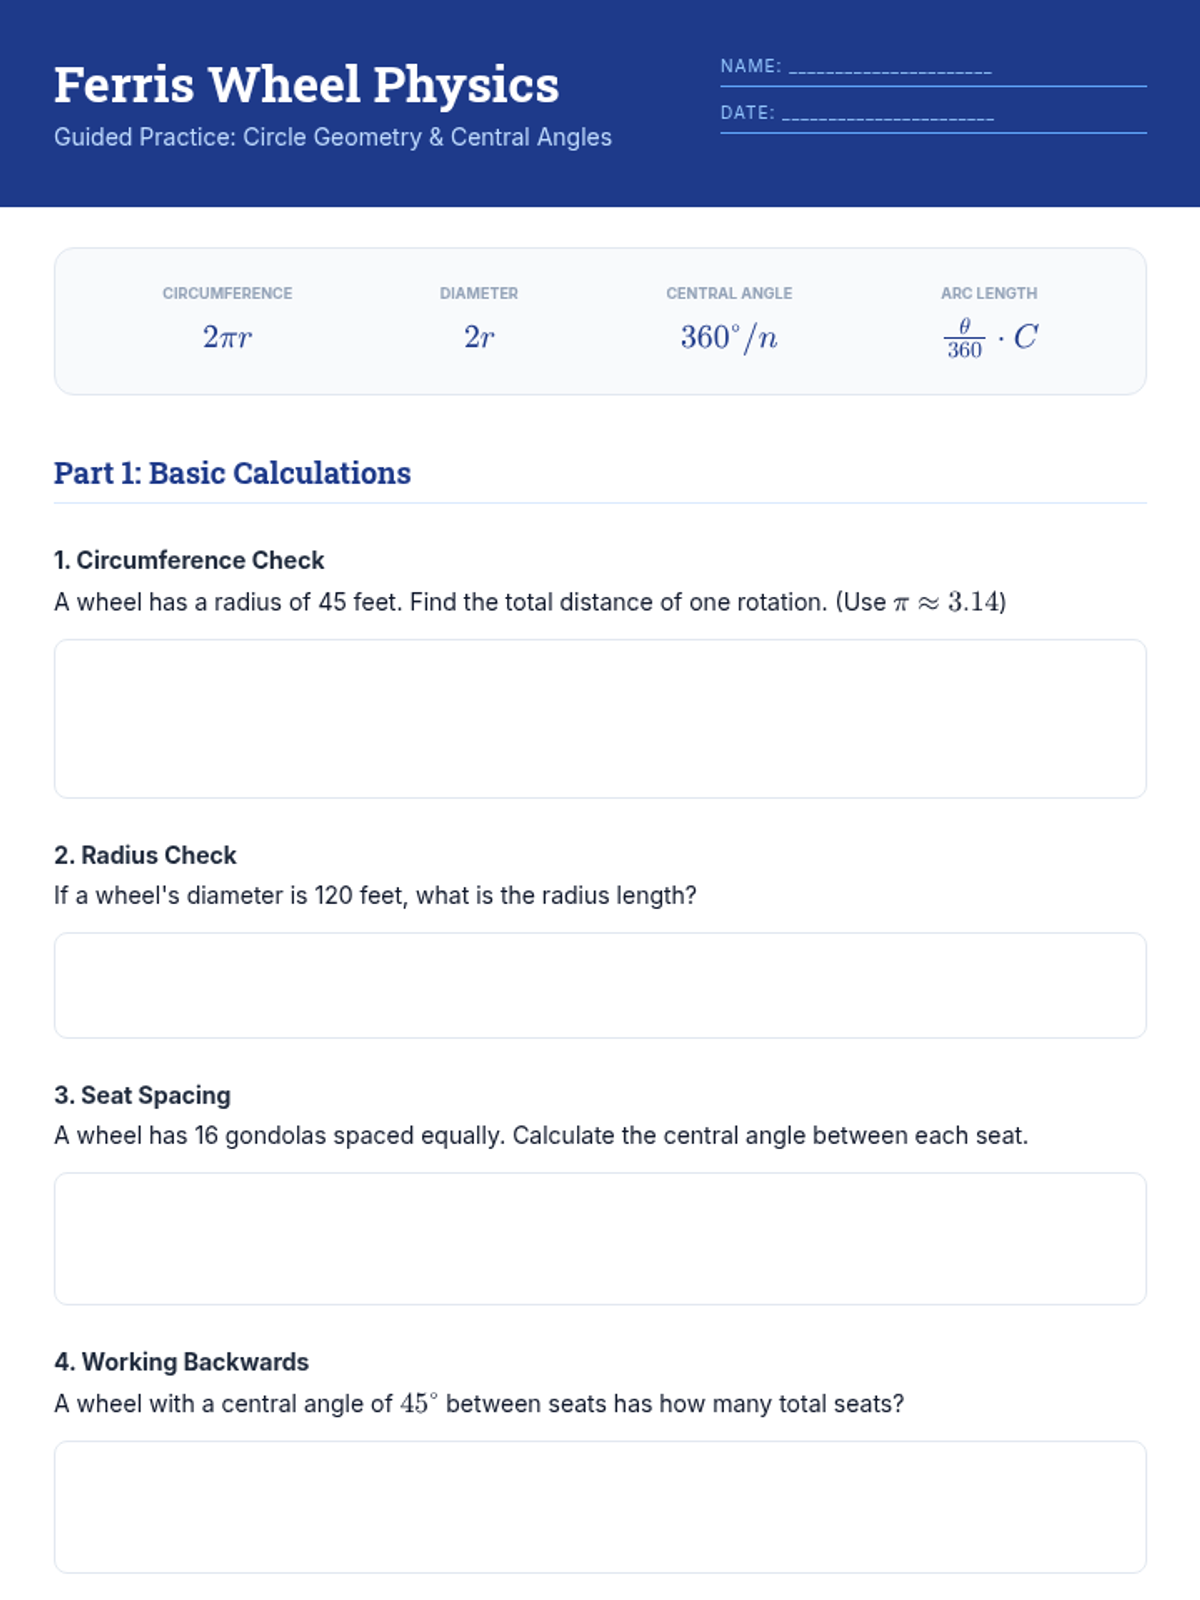
A worksheet providing guided math practice for calculating circumference, radius, central angles, and arc length in the context of Ferris wheels.
A presentation introducing the geometry of Ferris wheels, covering radius, circumference, central angles, and arc length.
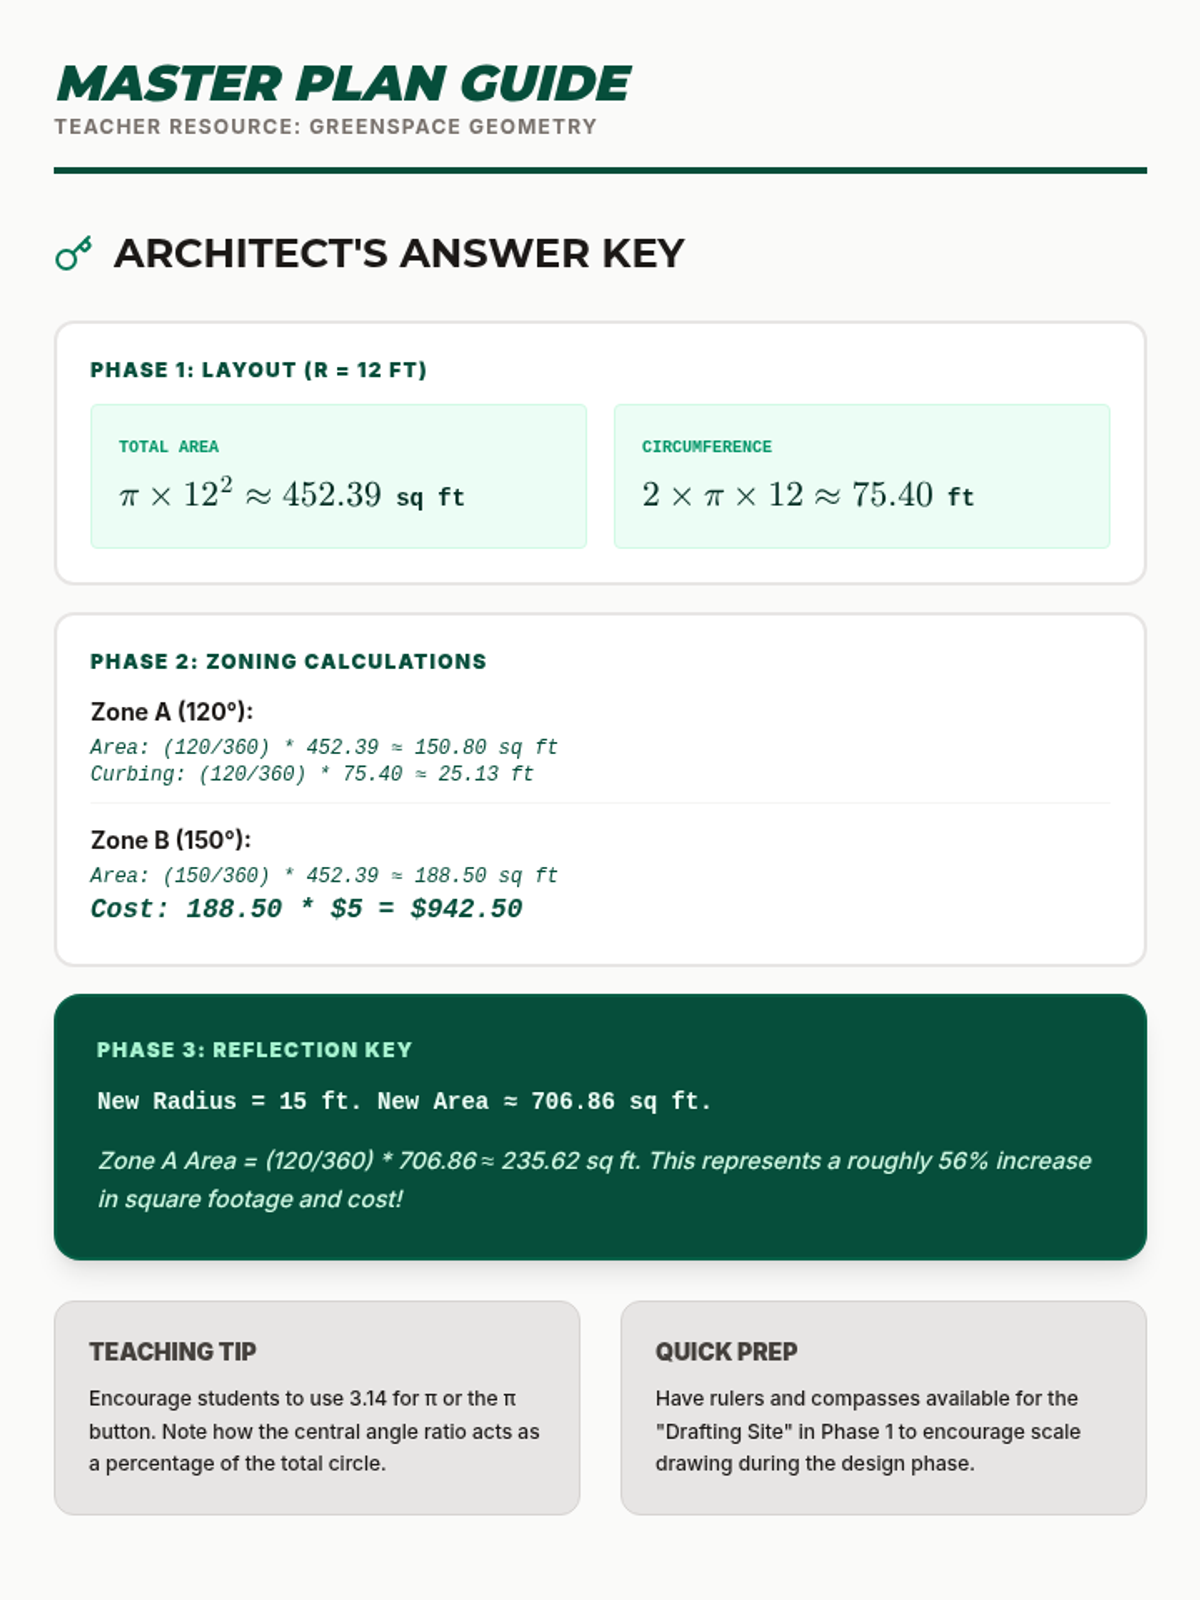
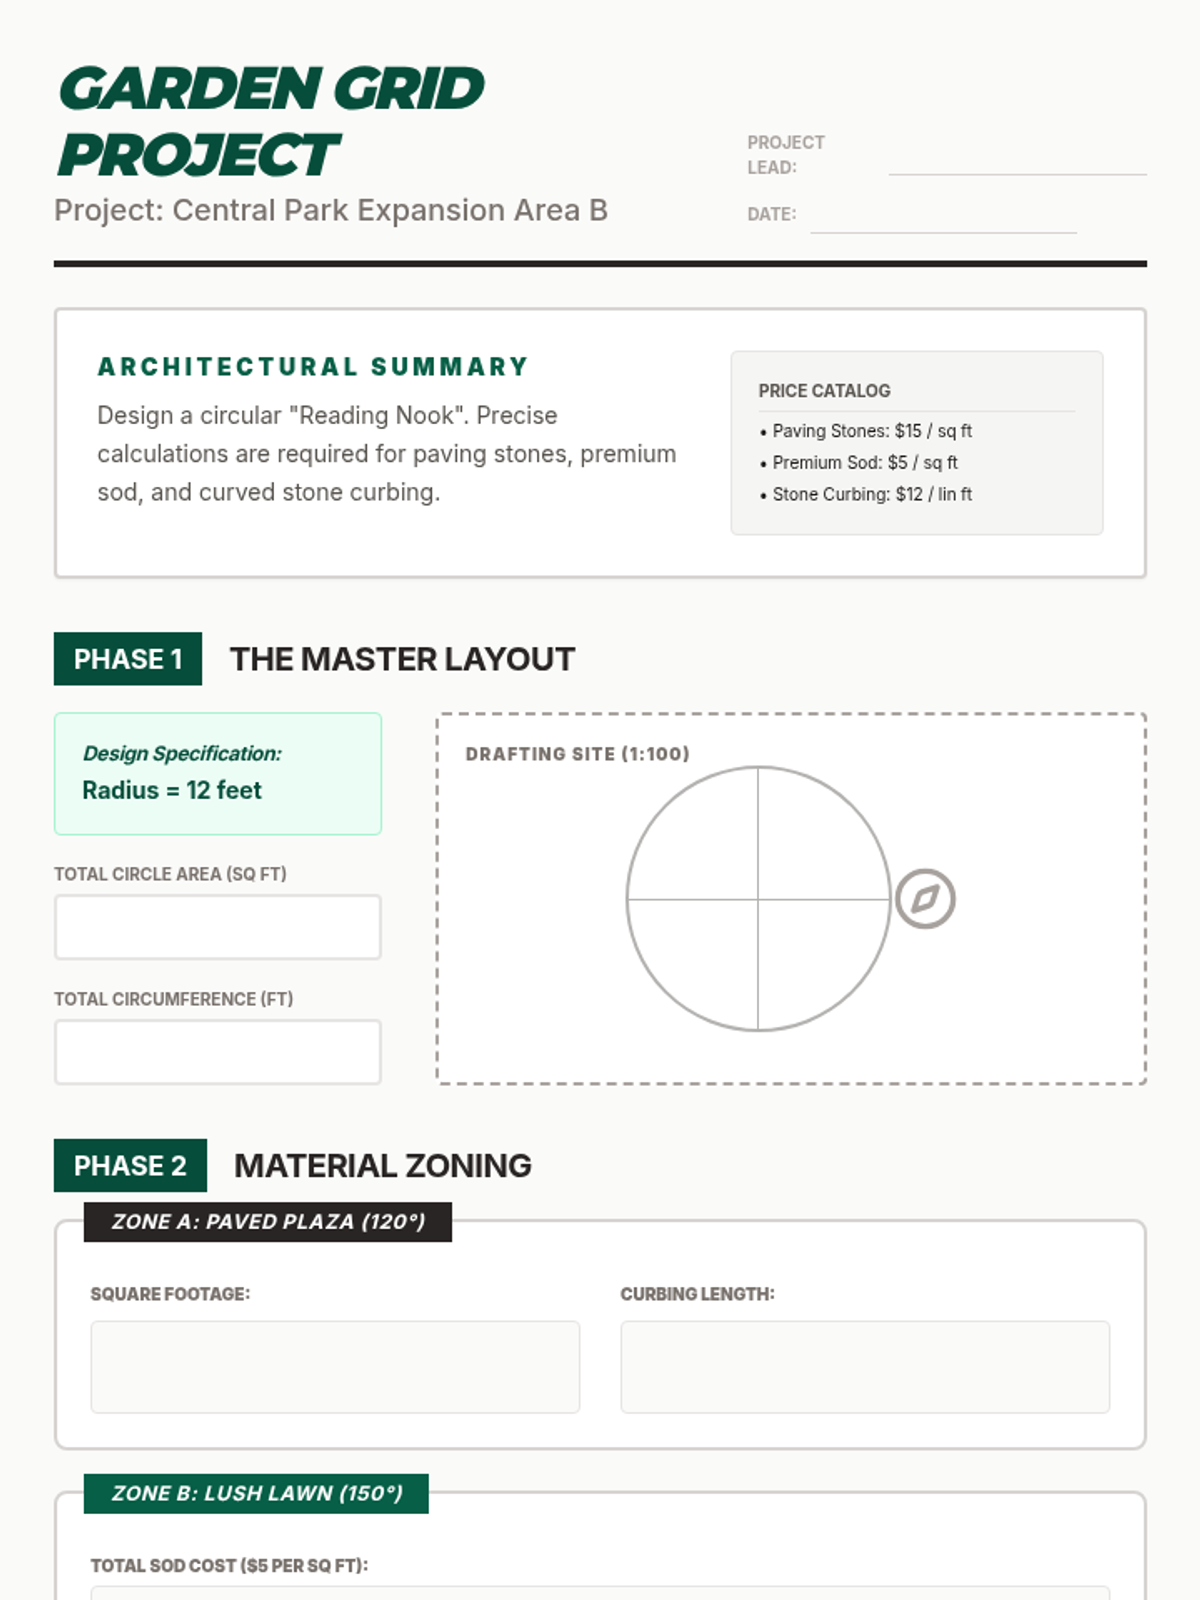
Teacher guide for the Greenspace Geometry lesson, providing detailed solutions for garden zone calculations, pricing analysis, and a conceptual guide for the final design reflection.
A landscape architecture project where students design a circular garden. Students calculate sector areas for sod and paving, and arc lengths for stone curbing and railings across different zones.
An instructional slide deck for landscape design geometry, teaching the application of sector area and arc length formulas in park planning and garden architecture.
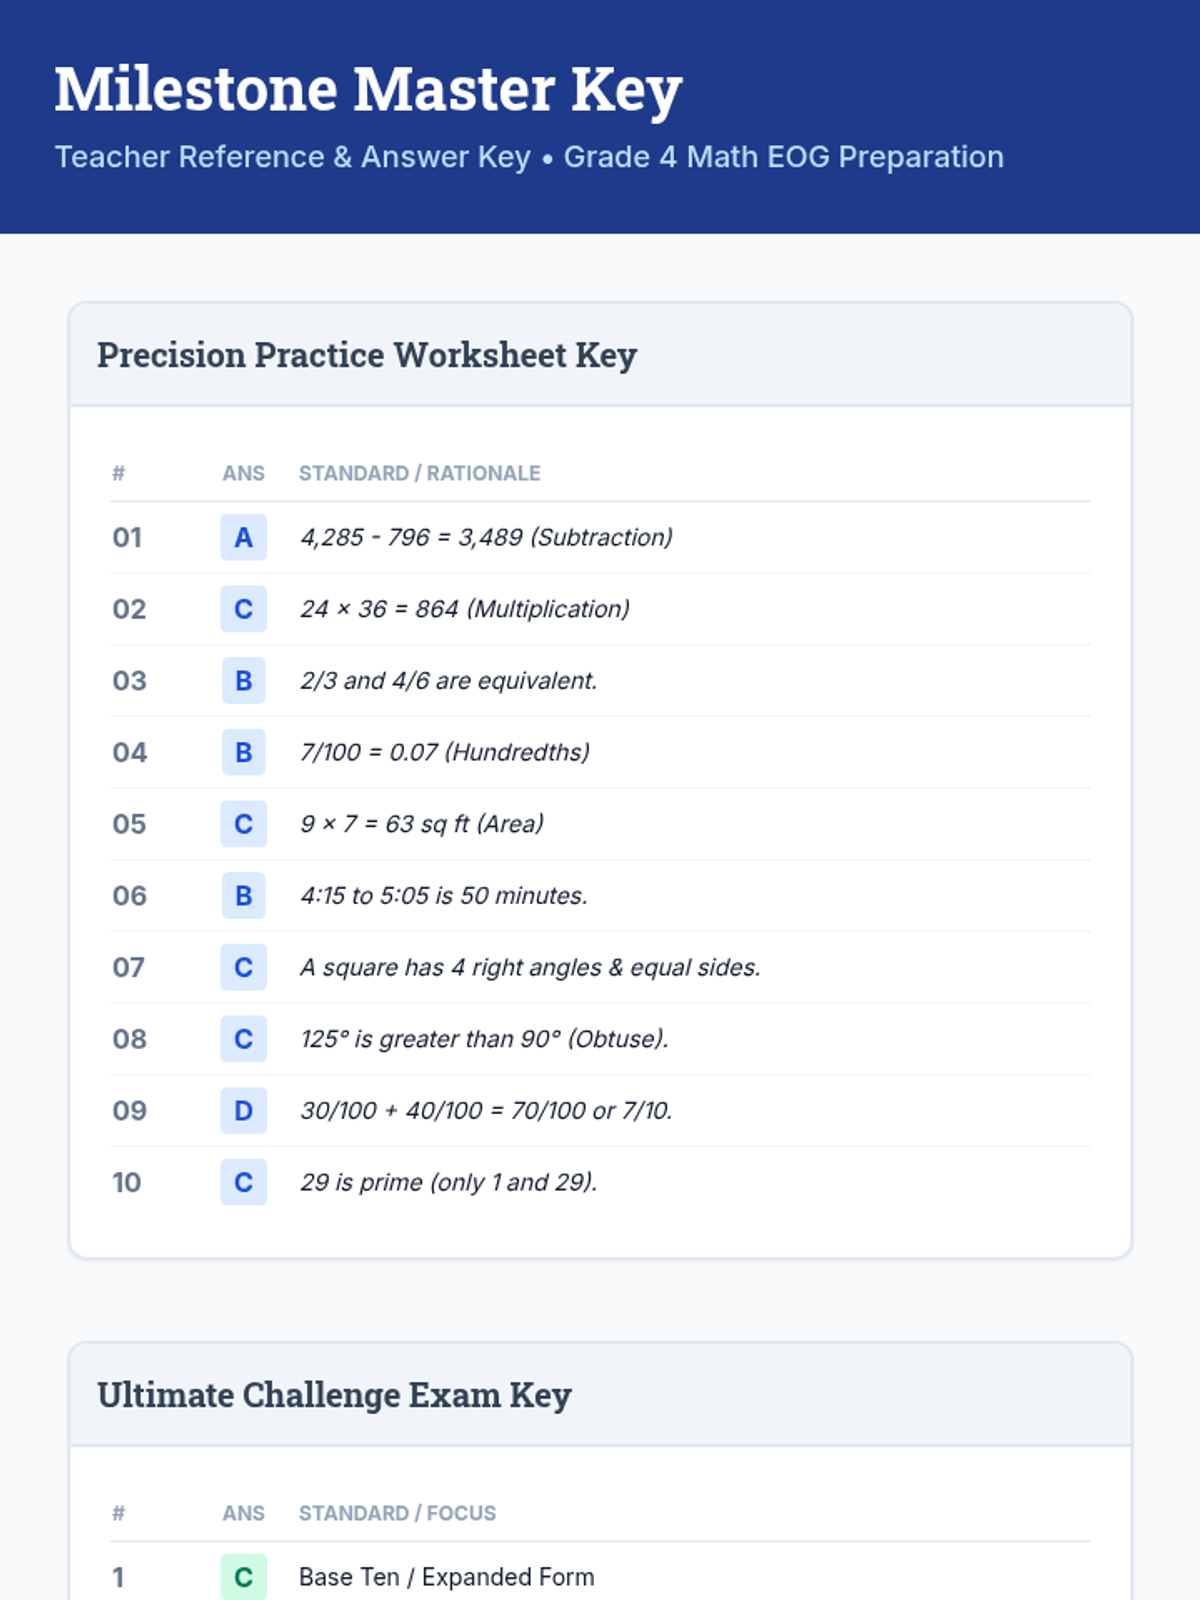
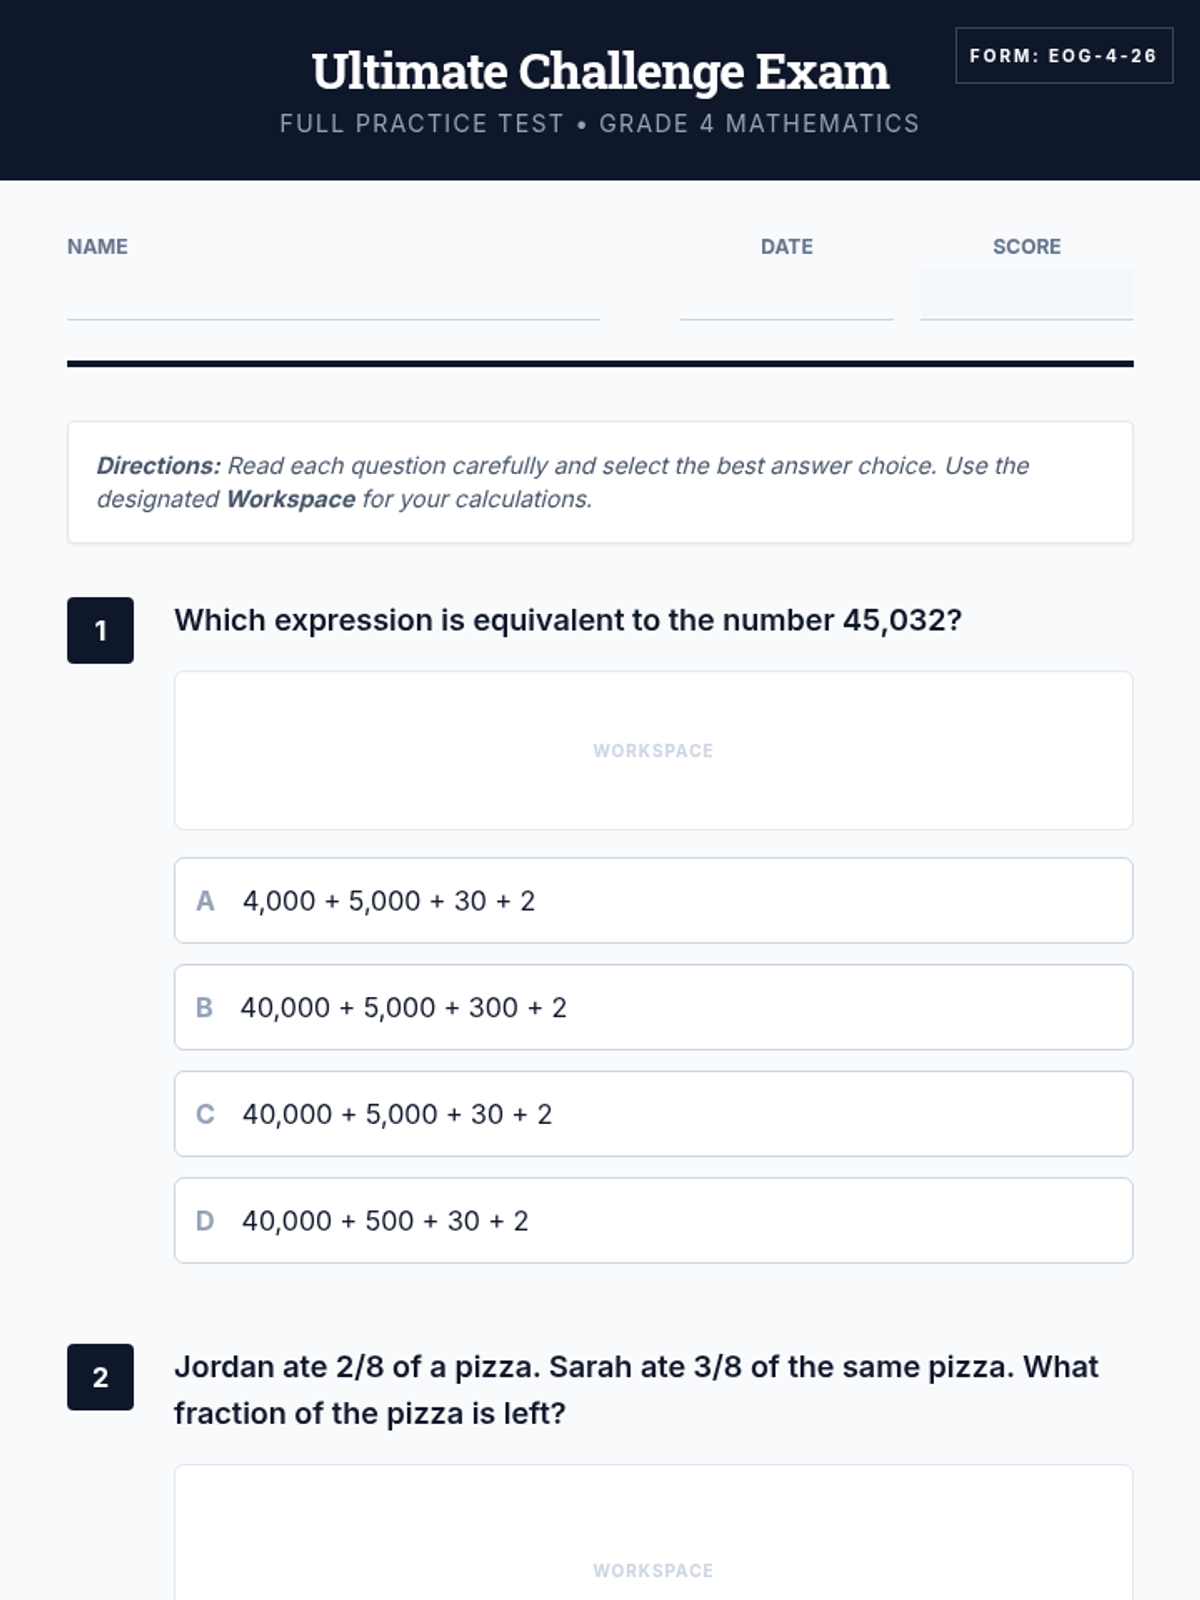
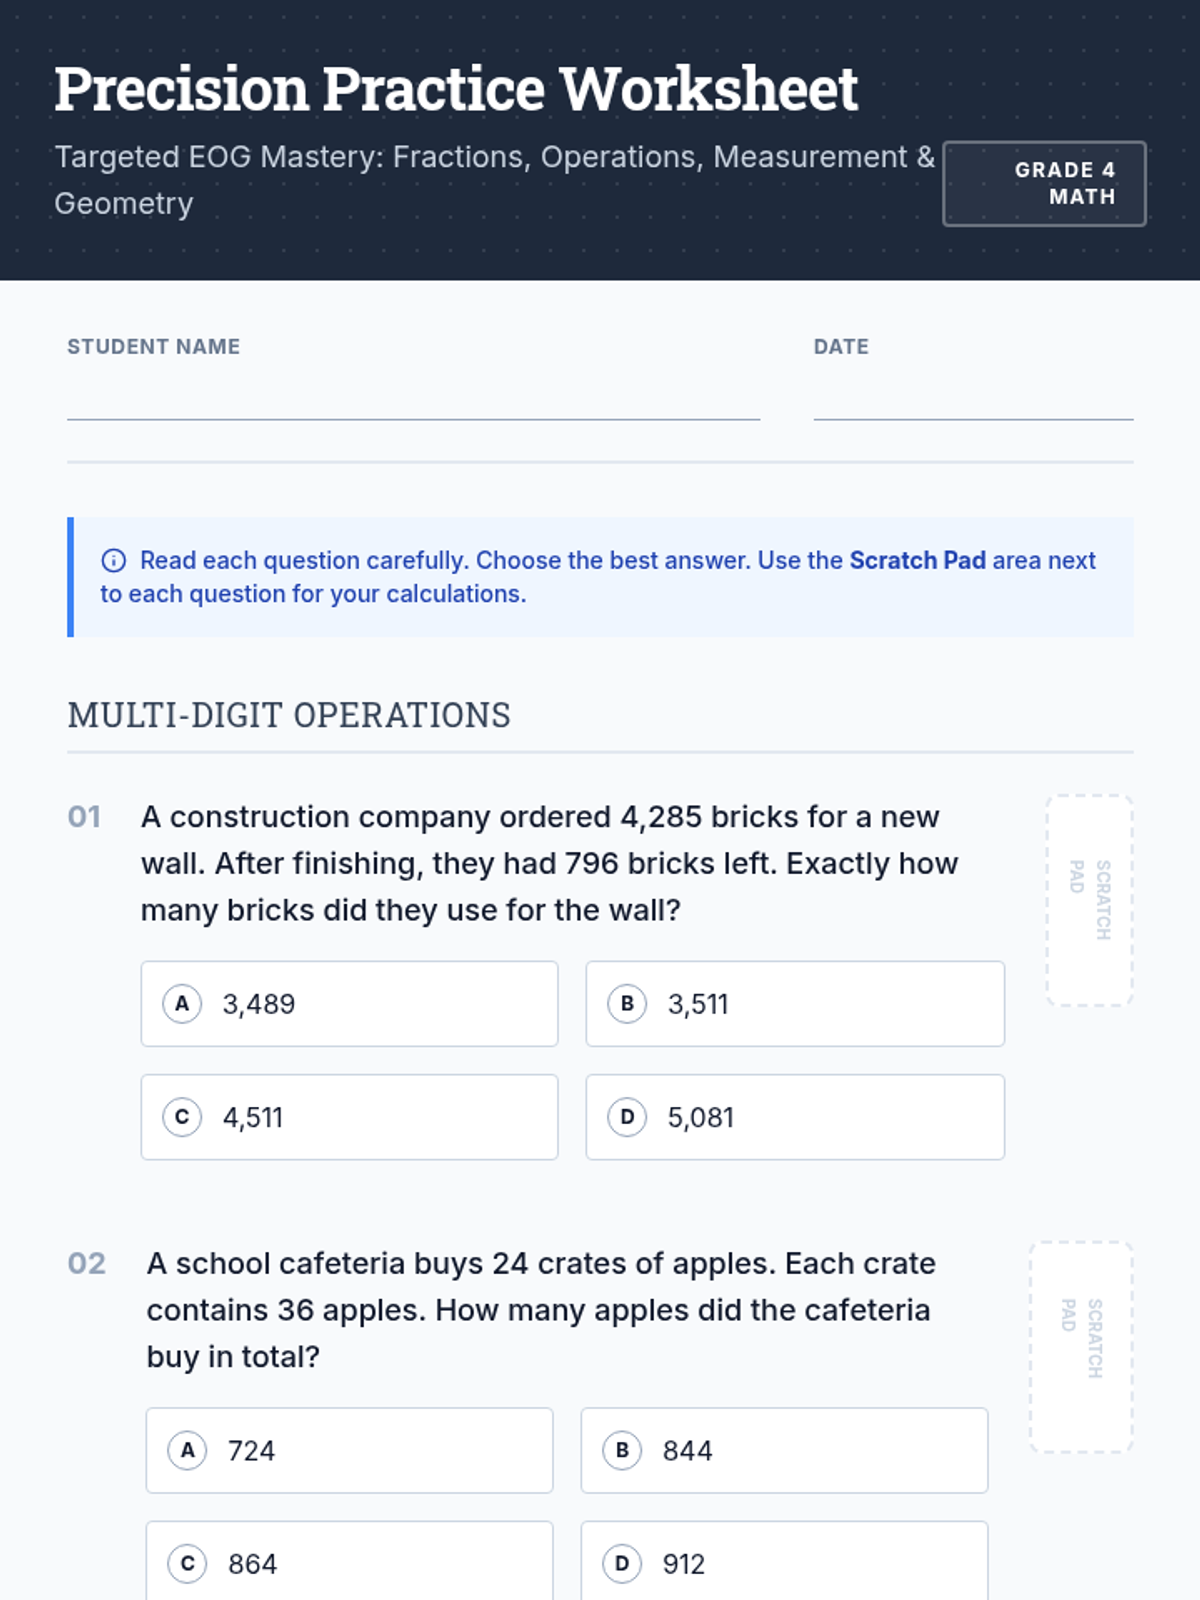
A comprehensive answer key and teacher resource for the EOG practice materials, including rationales for answers and instructional tips. Corrected layout to prevent table splitting.
A full-length 4th Grade Math EOG practice exam featuring a professional testing format, clear typography, and a variety of standards-based questions. Includes integrated workspace and prevents awkward page breaks. Corrected math rendering using text-based fractions.
A targeted multiple-choice worksheet for 4th Grade Math EOG prep, focusing on fractions, decimals, operations, measurement, and geometry with a clean blueprint-inspired layout. Questions are properly spaced with scratch pad areas.
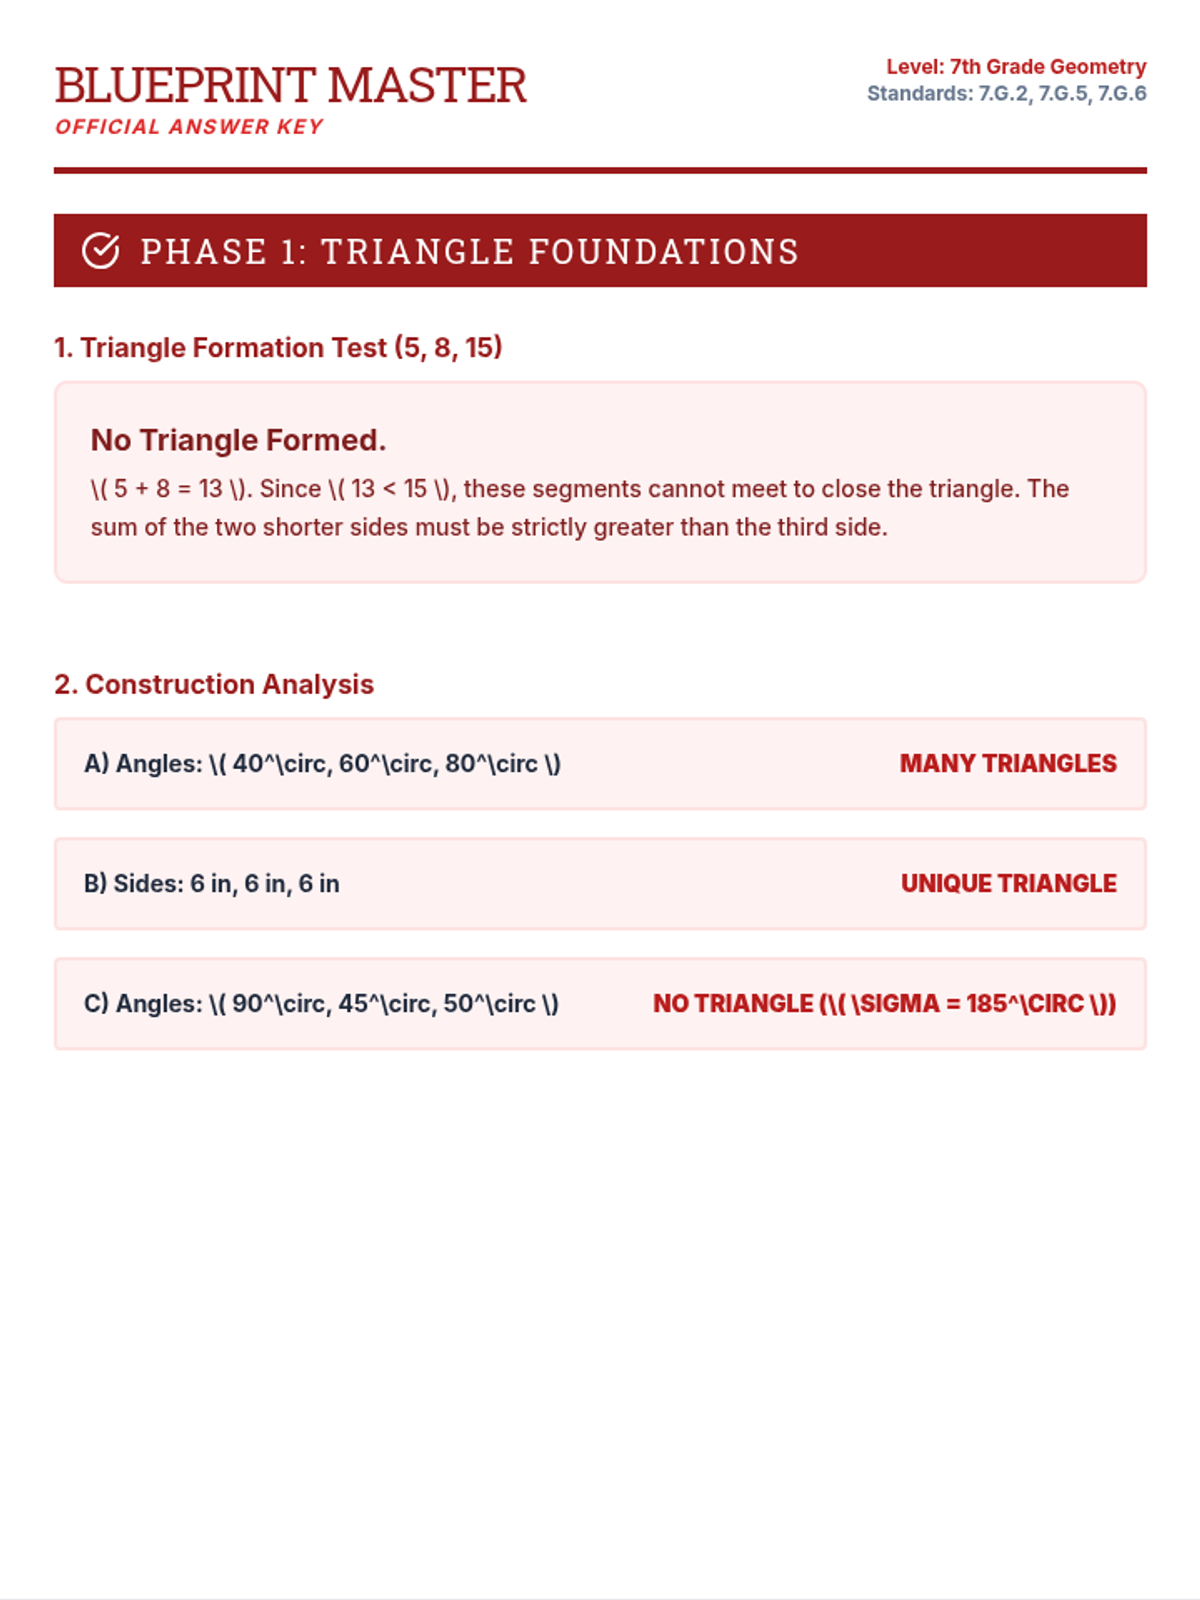
A complete teacher answer key for the Blueprint Master Study Guide, providing step-by-step solutions, equations, and mathematical explanations for all geometry problems.
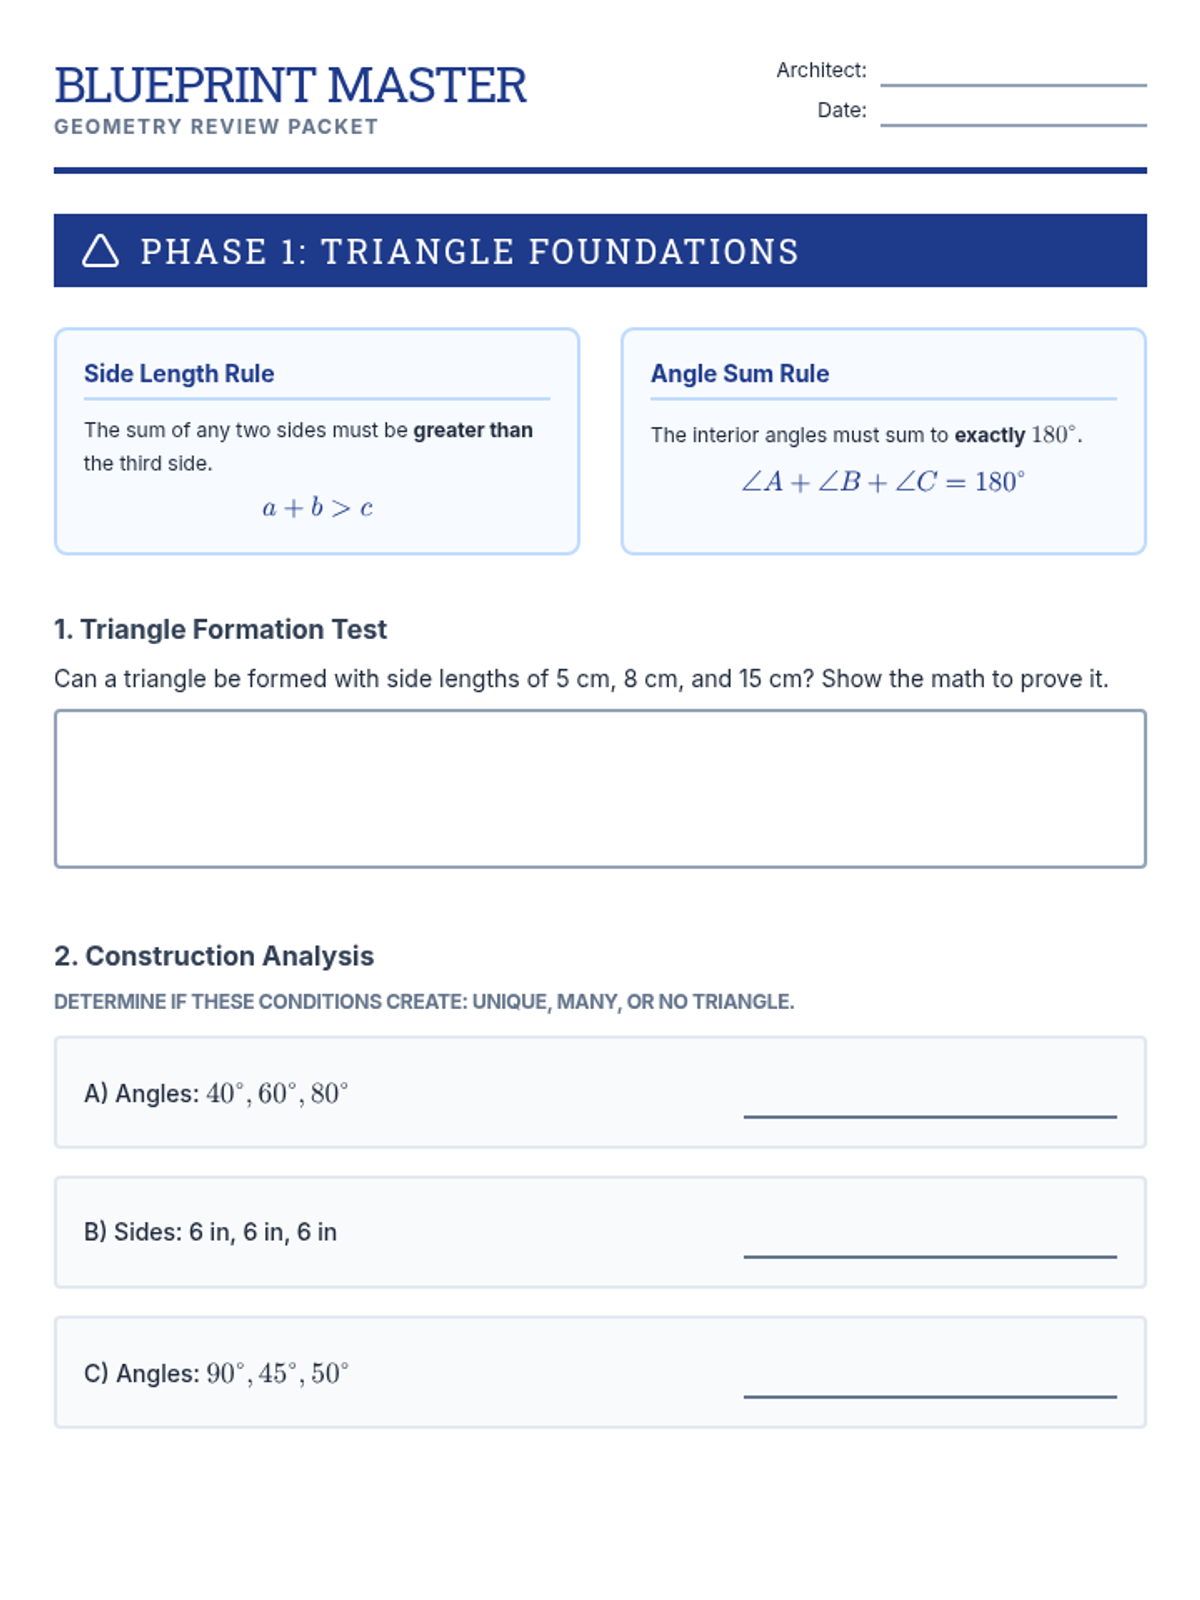
A comprehensive 4-page geometry study guide designed as an 'Architect's Blueprint'. It covers triangle construction rules, angle relationship equations, and real-world area, volume, and surface area problems aligned with 7.G.2, 7.G.5, and 7.G.6.
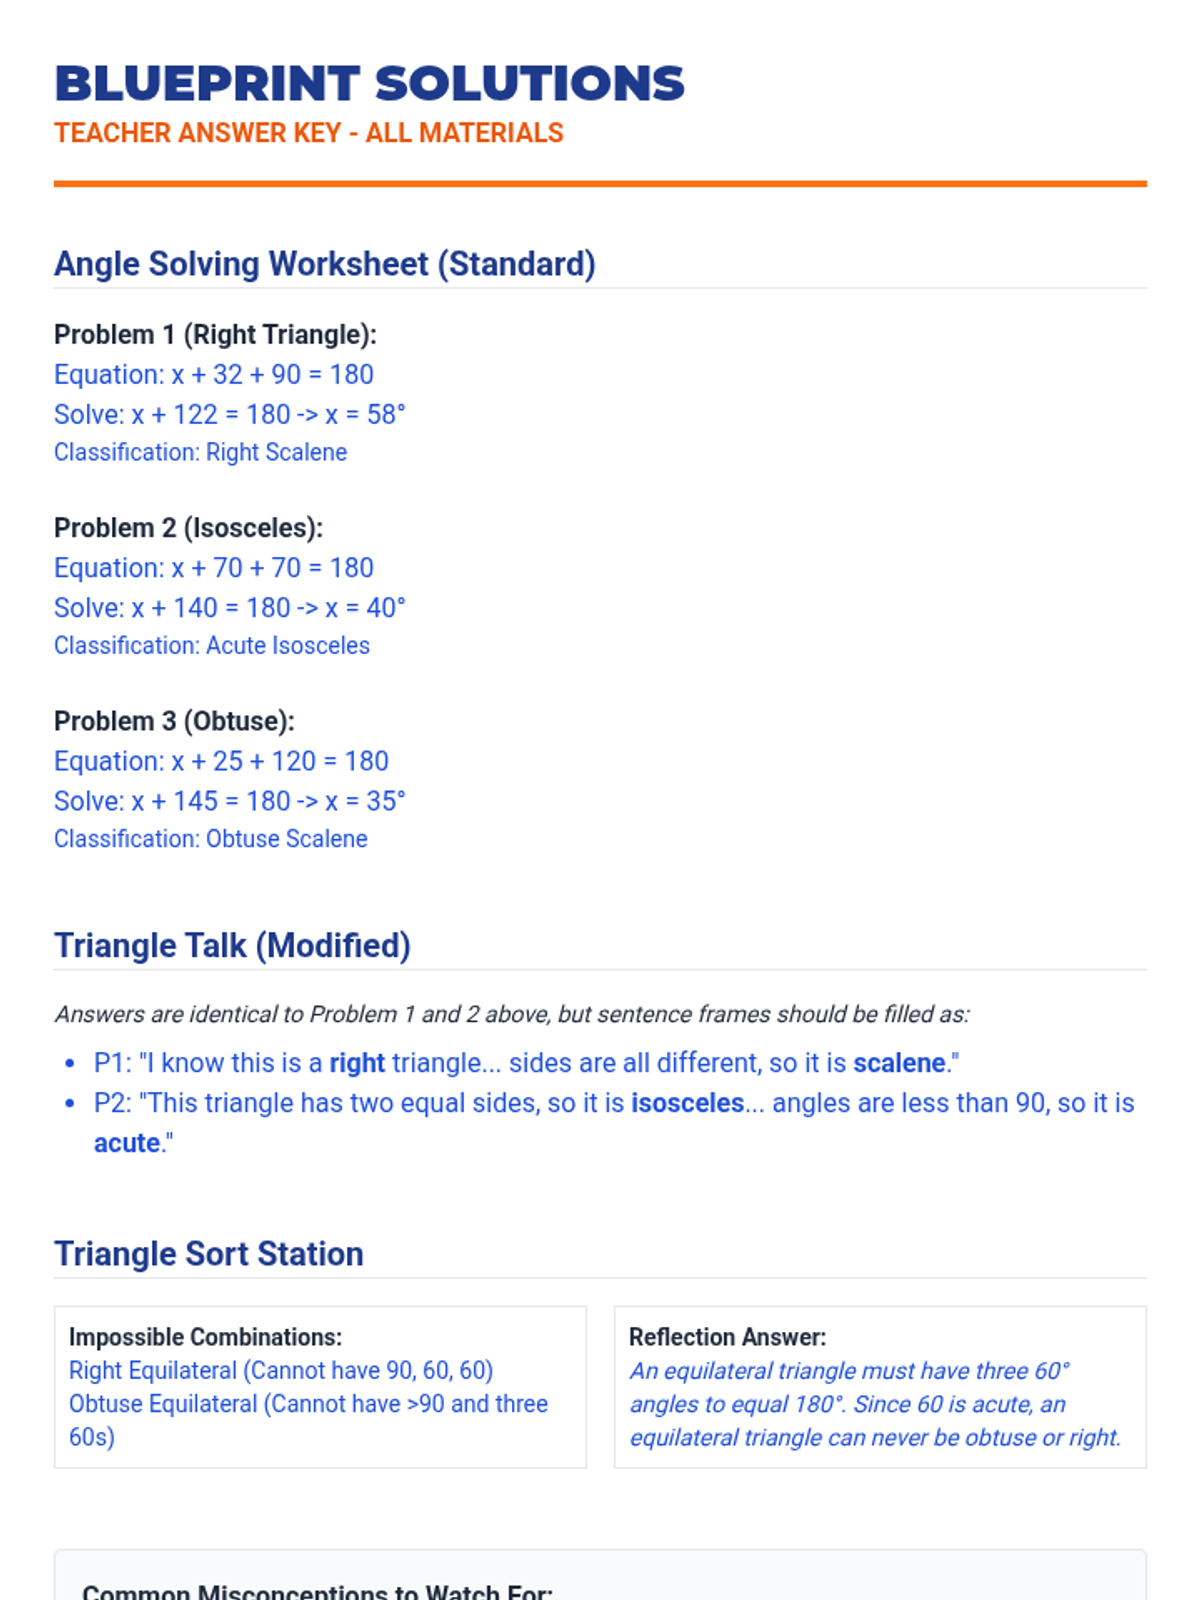
A comprehensive answer key for the teacher, covering the standard and modified worksheets as well as the center activities. Includes fully solved algebraic equations, correct classifications, and notes on common student misconceptions.
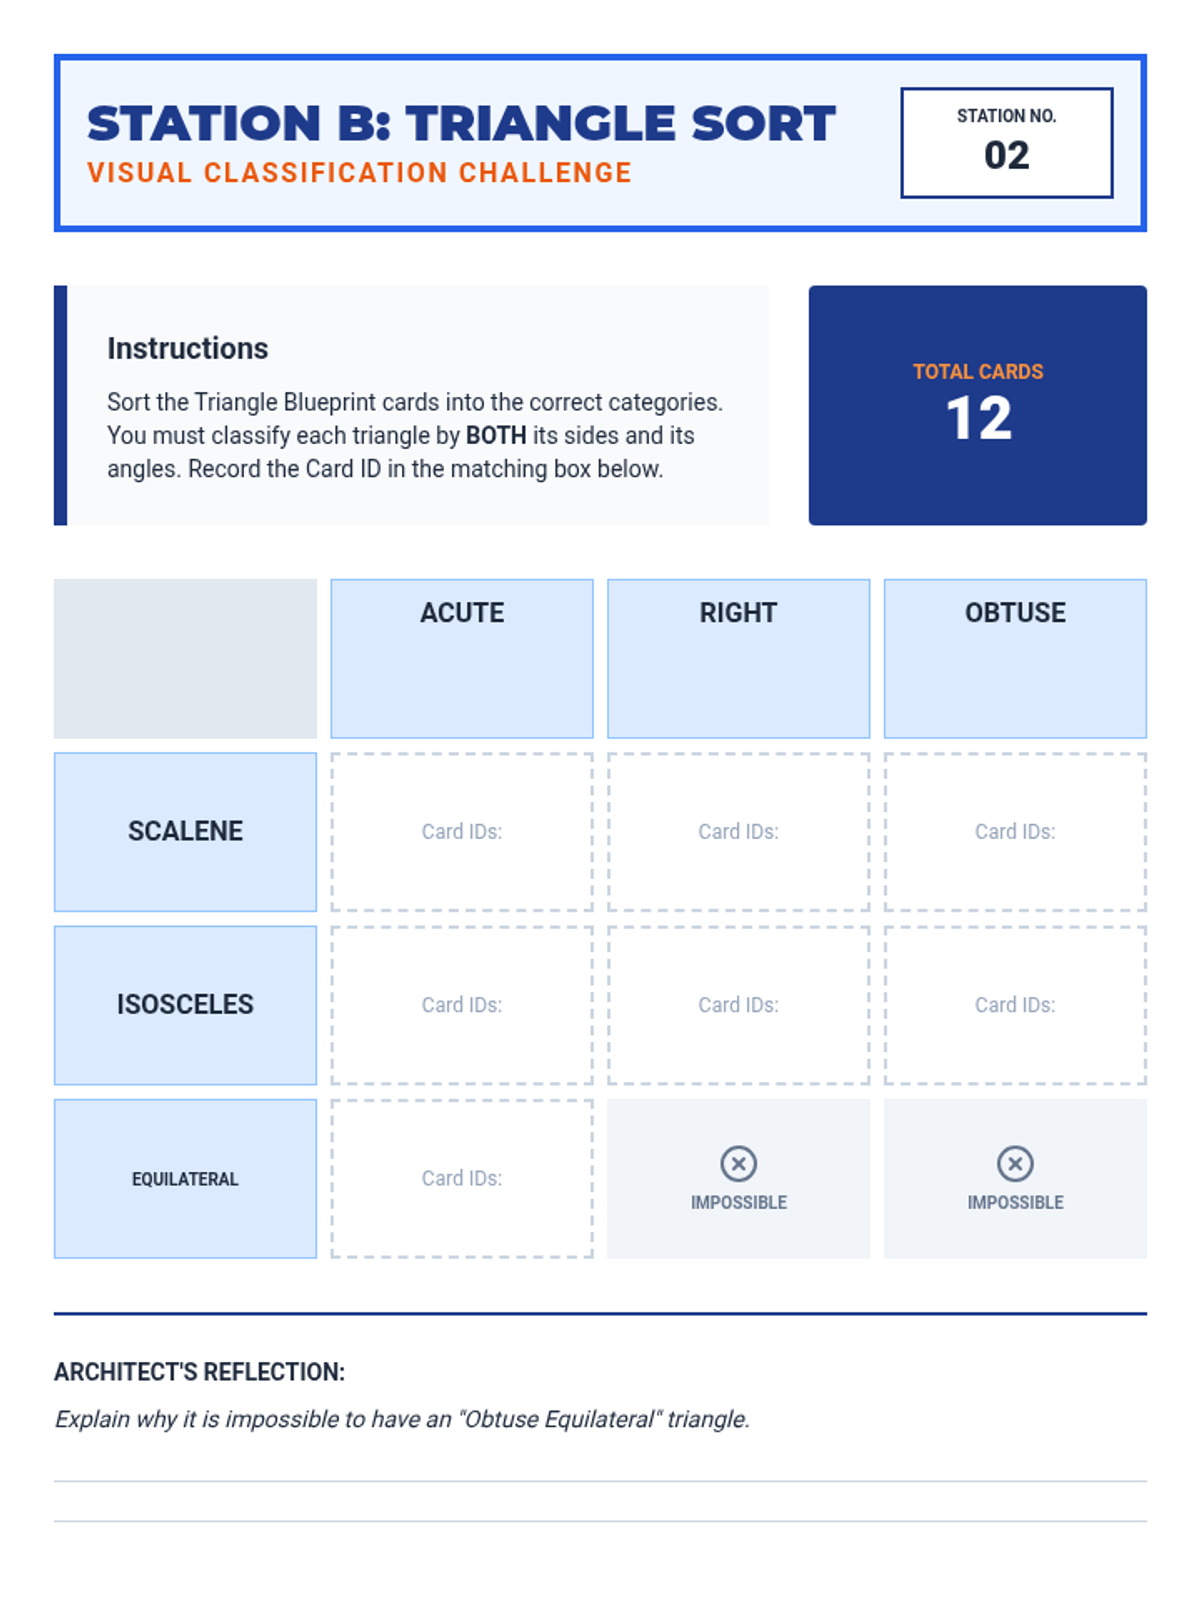
A sorting center activity where students classify triangle cards based on both their side lengths and angle measures. Includes a matrix for recording IDs and a reflection question on the geometric impossibility of certain triangle types.
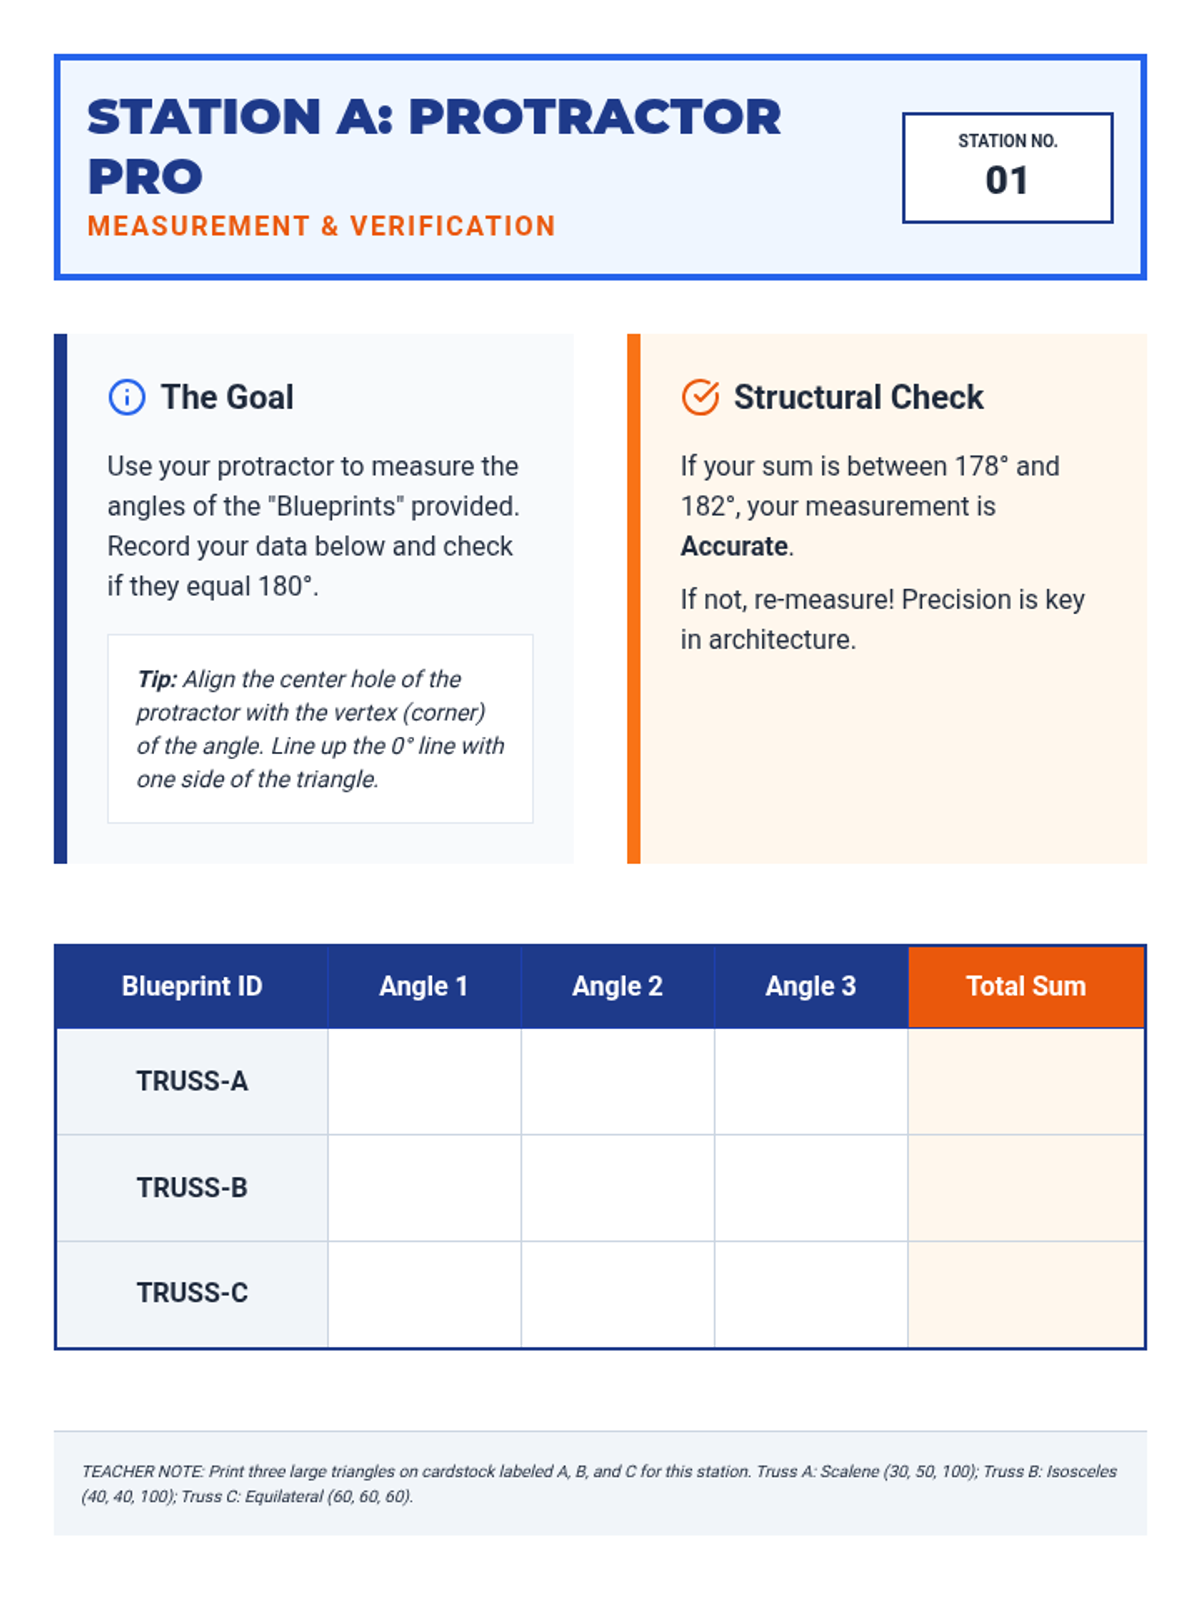
A hands-on center activity focusing on using protractors to measure angles in physical triangle models. Students record their measurements in a structural log and verify that the sum of the angles equals approximately 180 degrees.
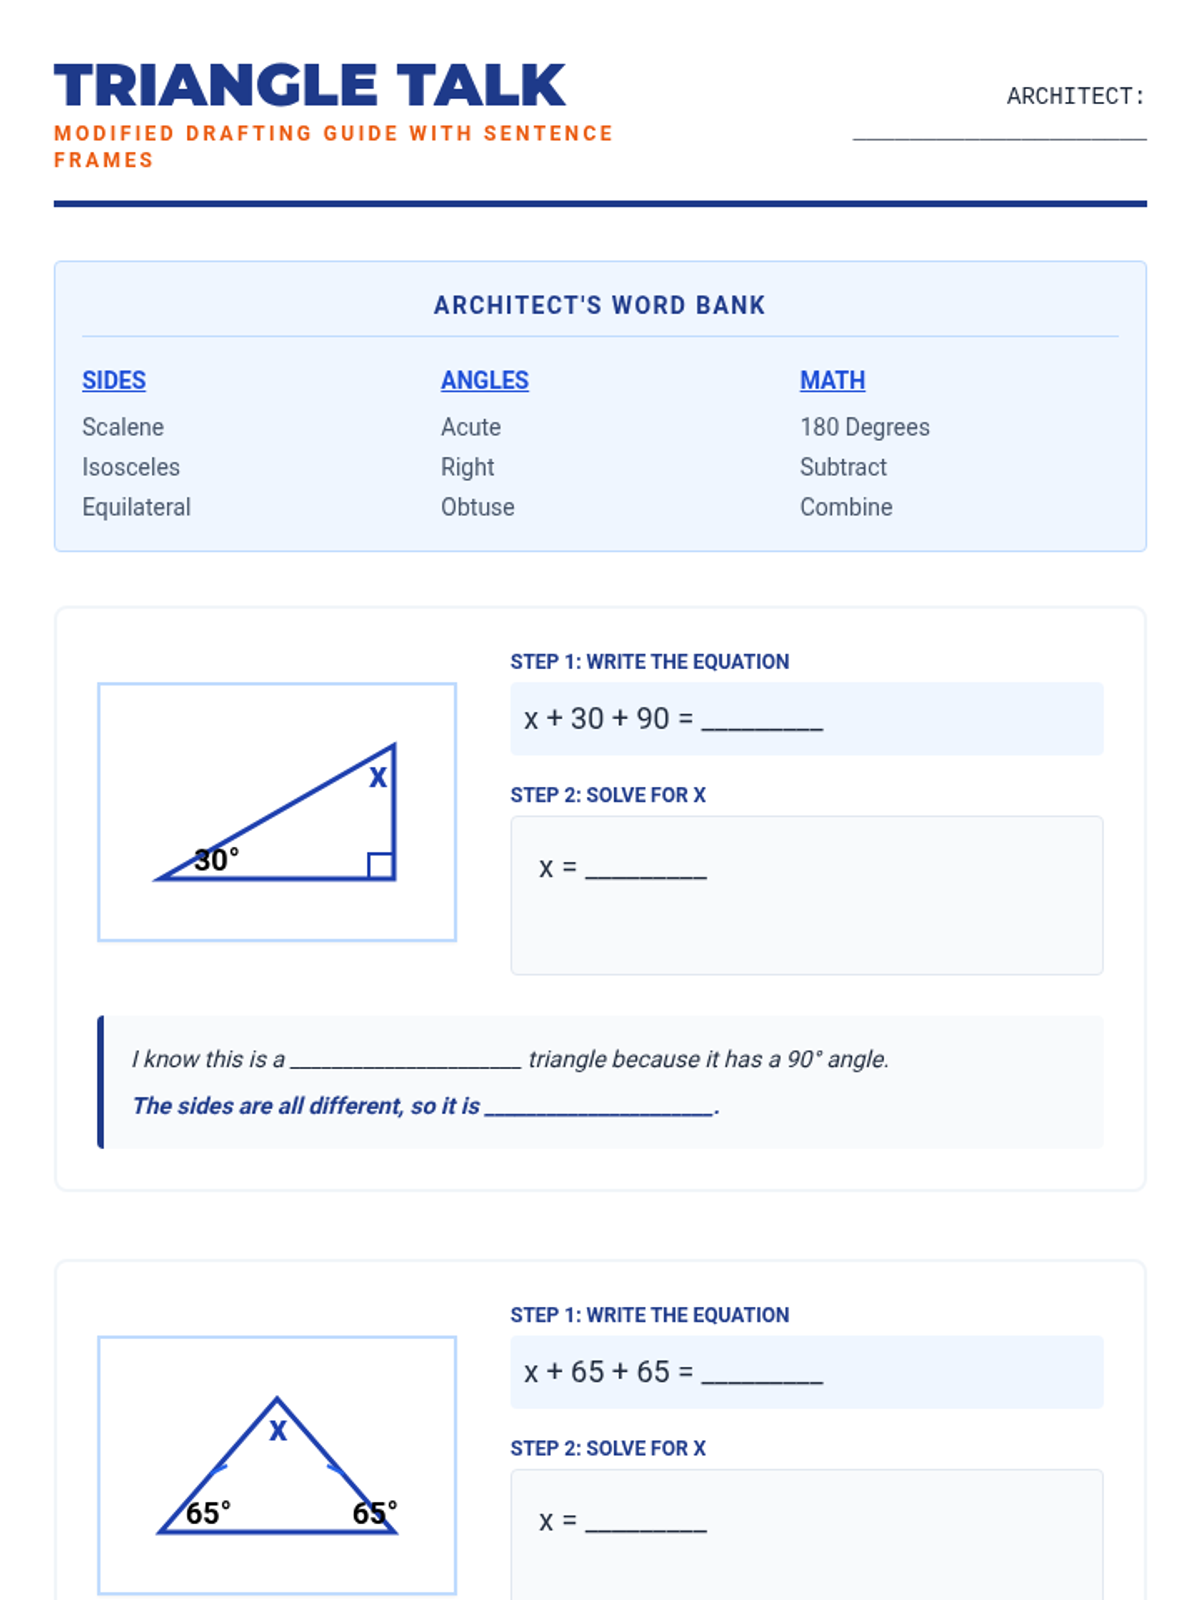
A modified version of the triangle worksheet designed for students requiring additional support. Includes a word bank, partially completed equations, and sentence frames to guide students in explaining their classification and solving process.
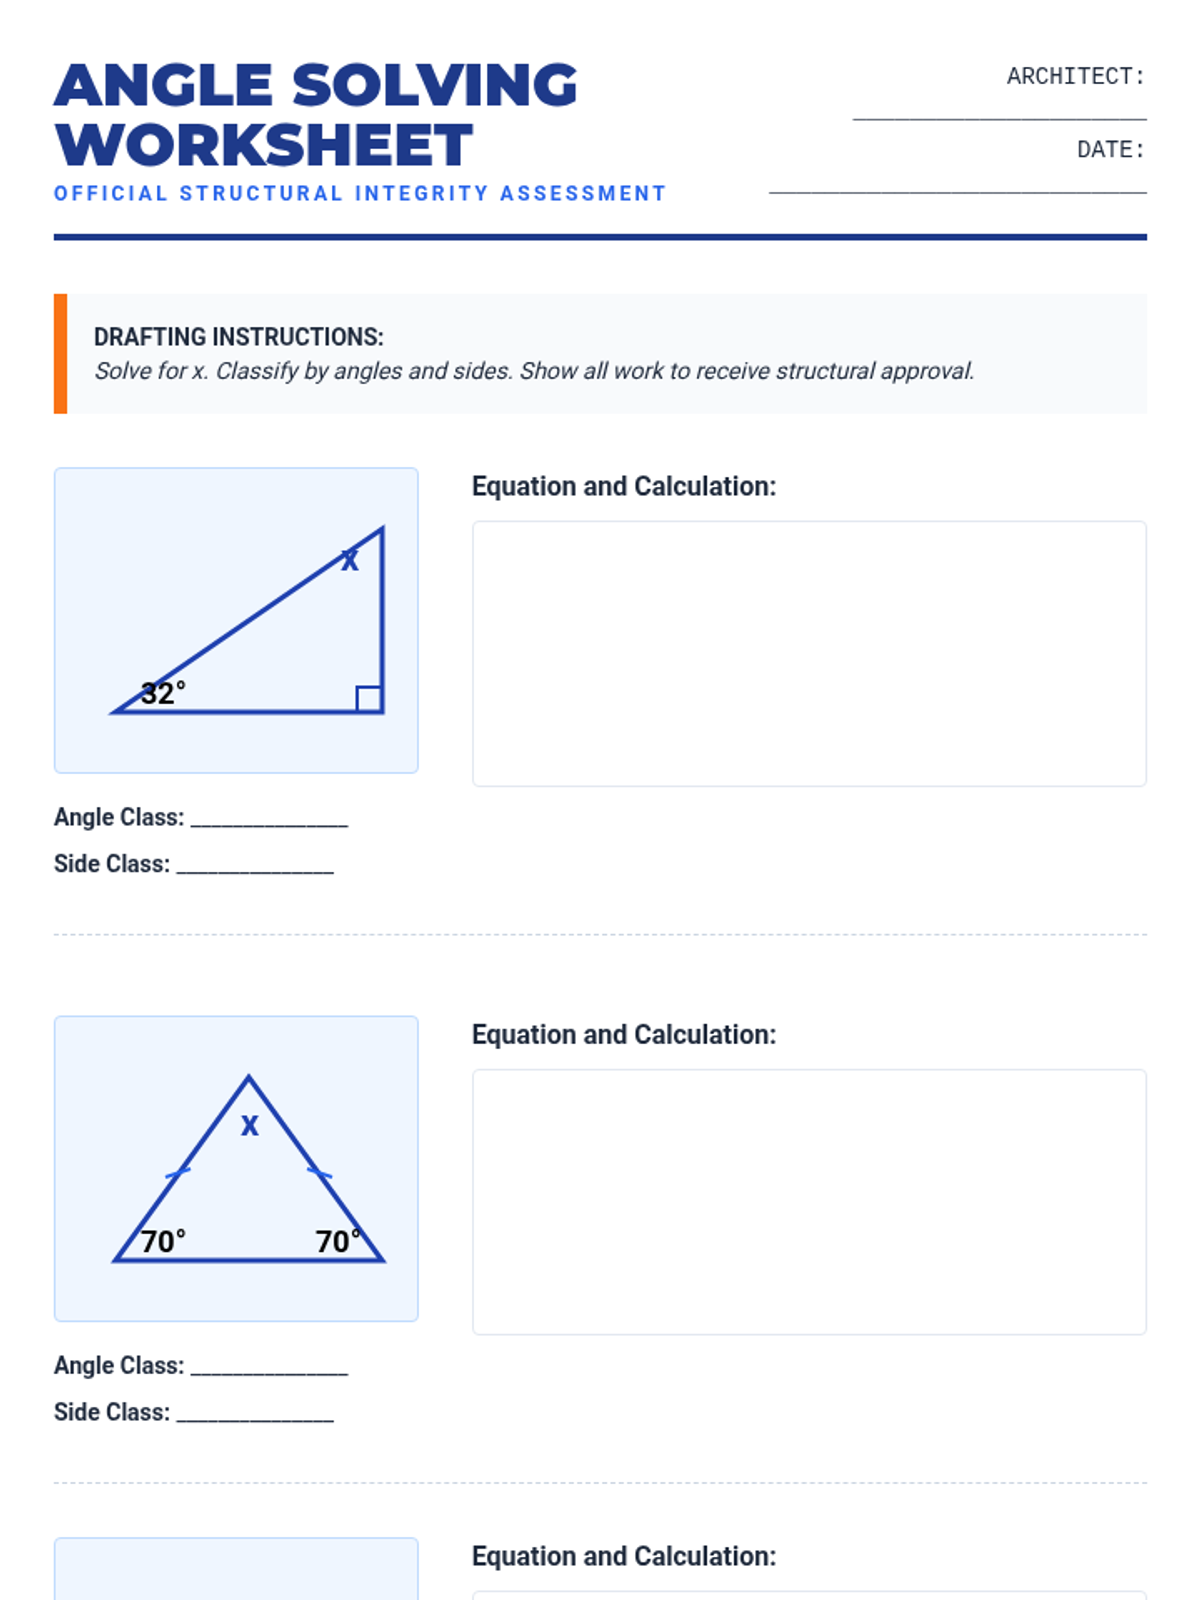
A standard 7th-grade math worksheet focused on solving for missing angles in triangles using algebraic equations. Students are required to write the equation, show their solving steps, and classify each triangle by both sides and angles.
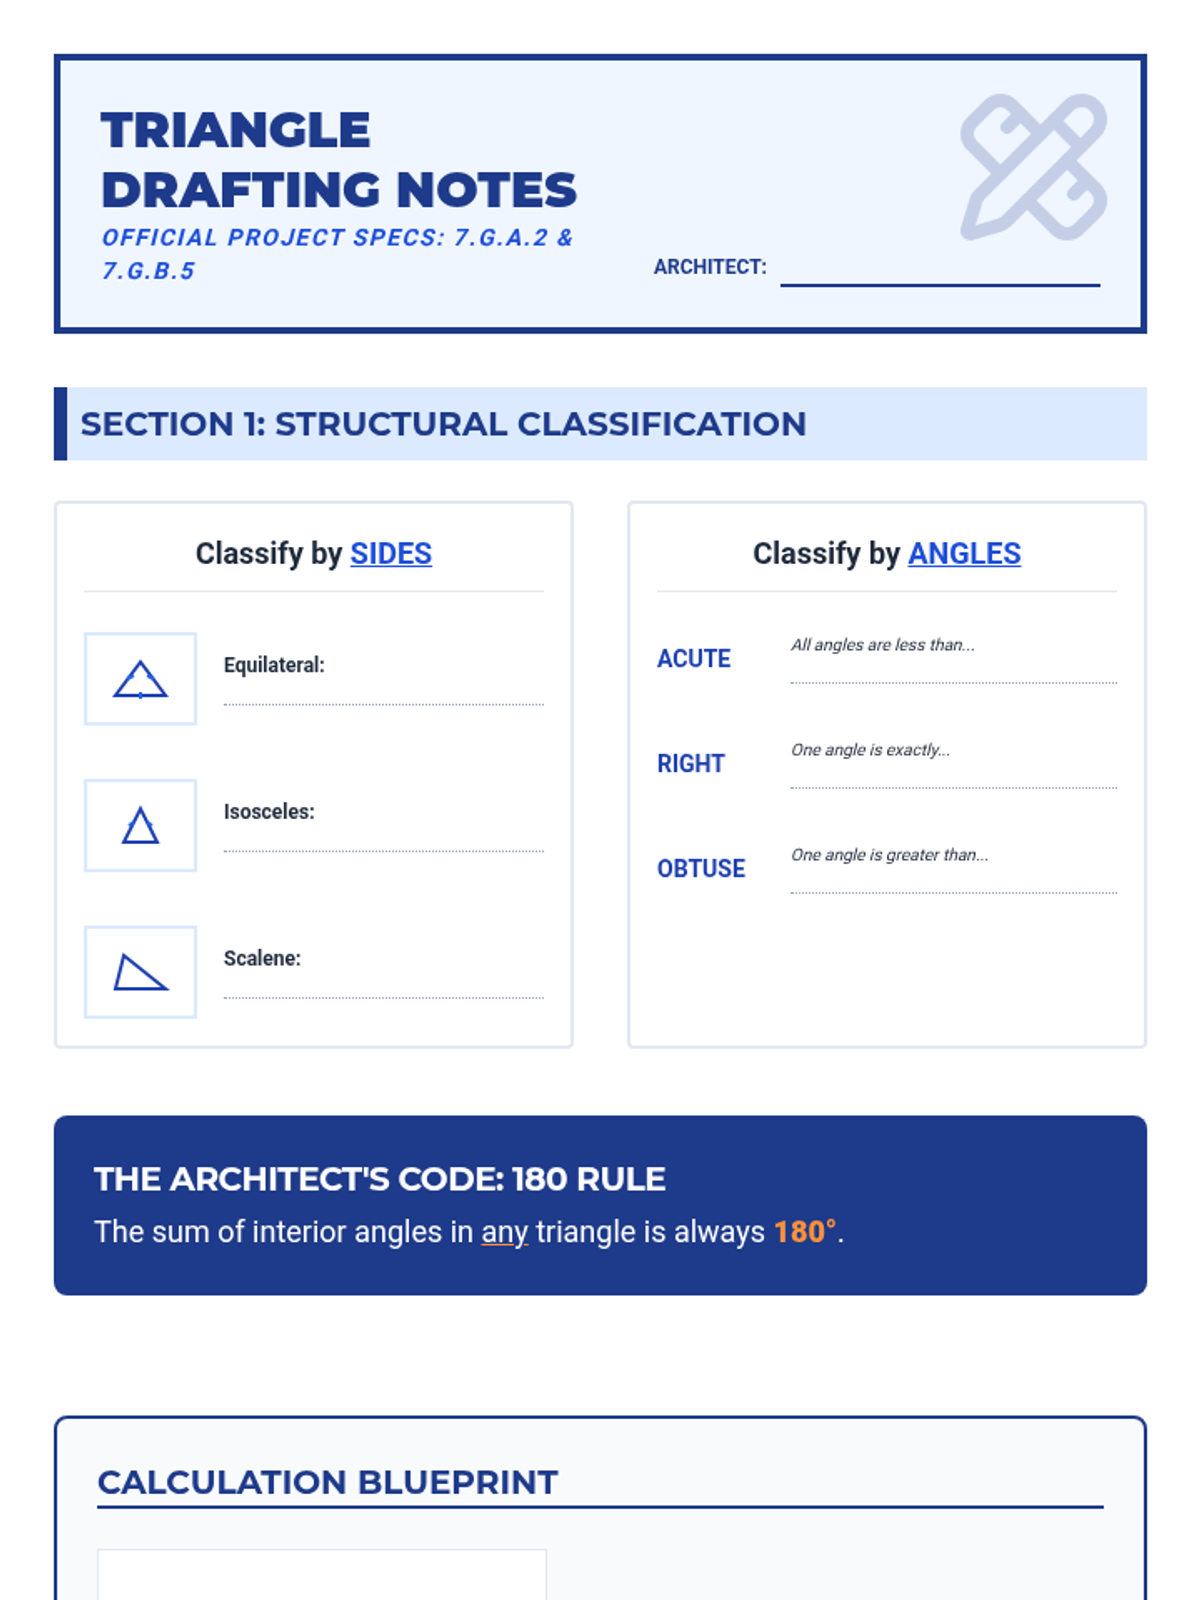
A blueprint-themed guided notes document for 7th-grade students to follow during instruction on triangle classification and the Triangle Sum Theorem. Includes fill-in-the-blank definitions, visual diagrams, and a dedicated workspace for solving algebraic equations.
An interactive slide deck for a 7th-grade geometry lesson using an architectural blueprint theme. Features visual classification aids, a step-by-step breakdown of the Triangle Sum Theorem, and clear instructions for classroom center rotations.
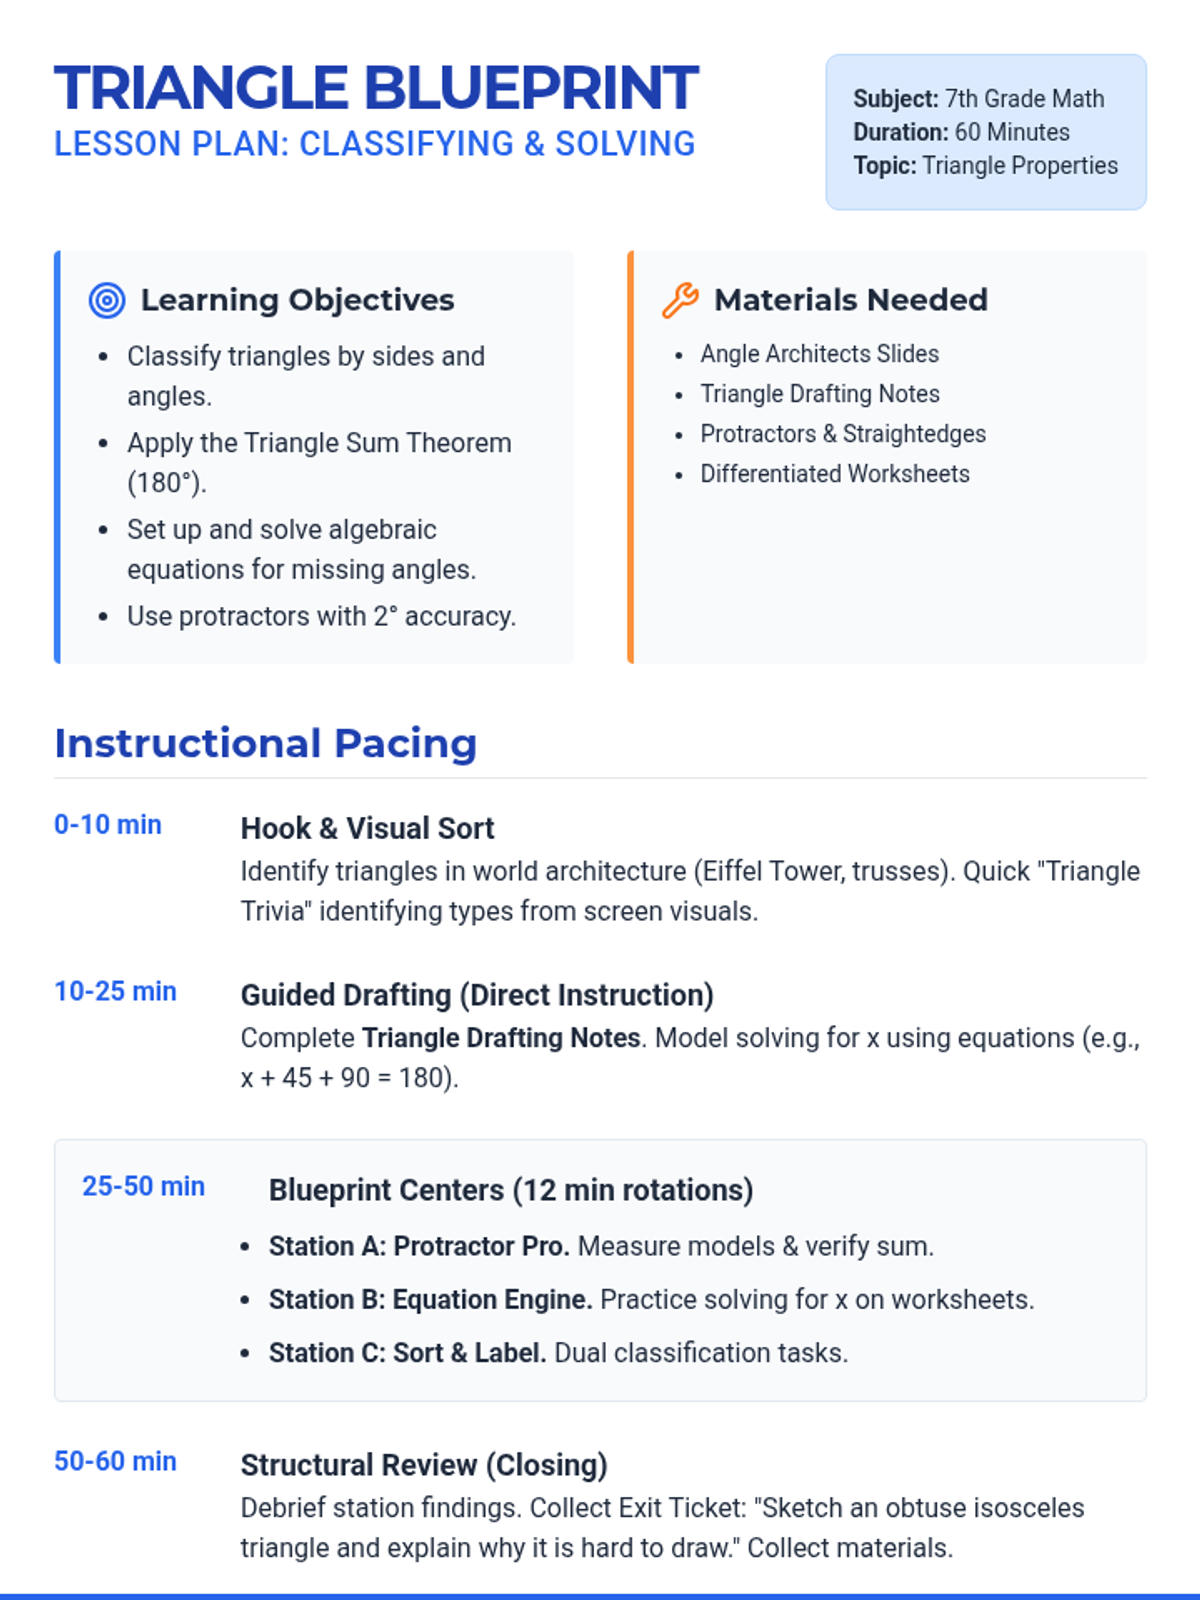
A detailed 60-minute lesson plan for teaching triangle classification and angle measures to 7th graders. Includes pacing, differentiation strategies for Tier 3 and ELL students, and key discussion prompts centered around a blueprint-inspired architectural theme.
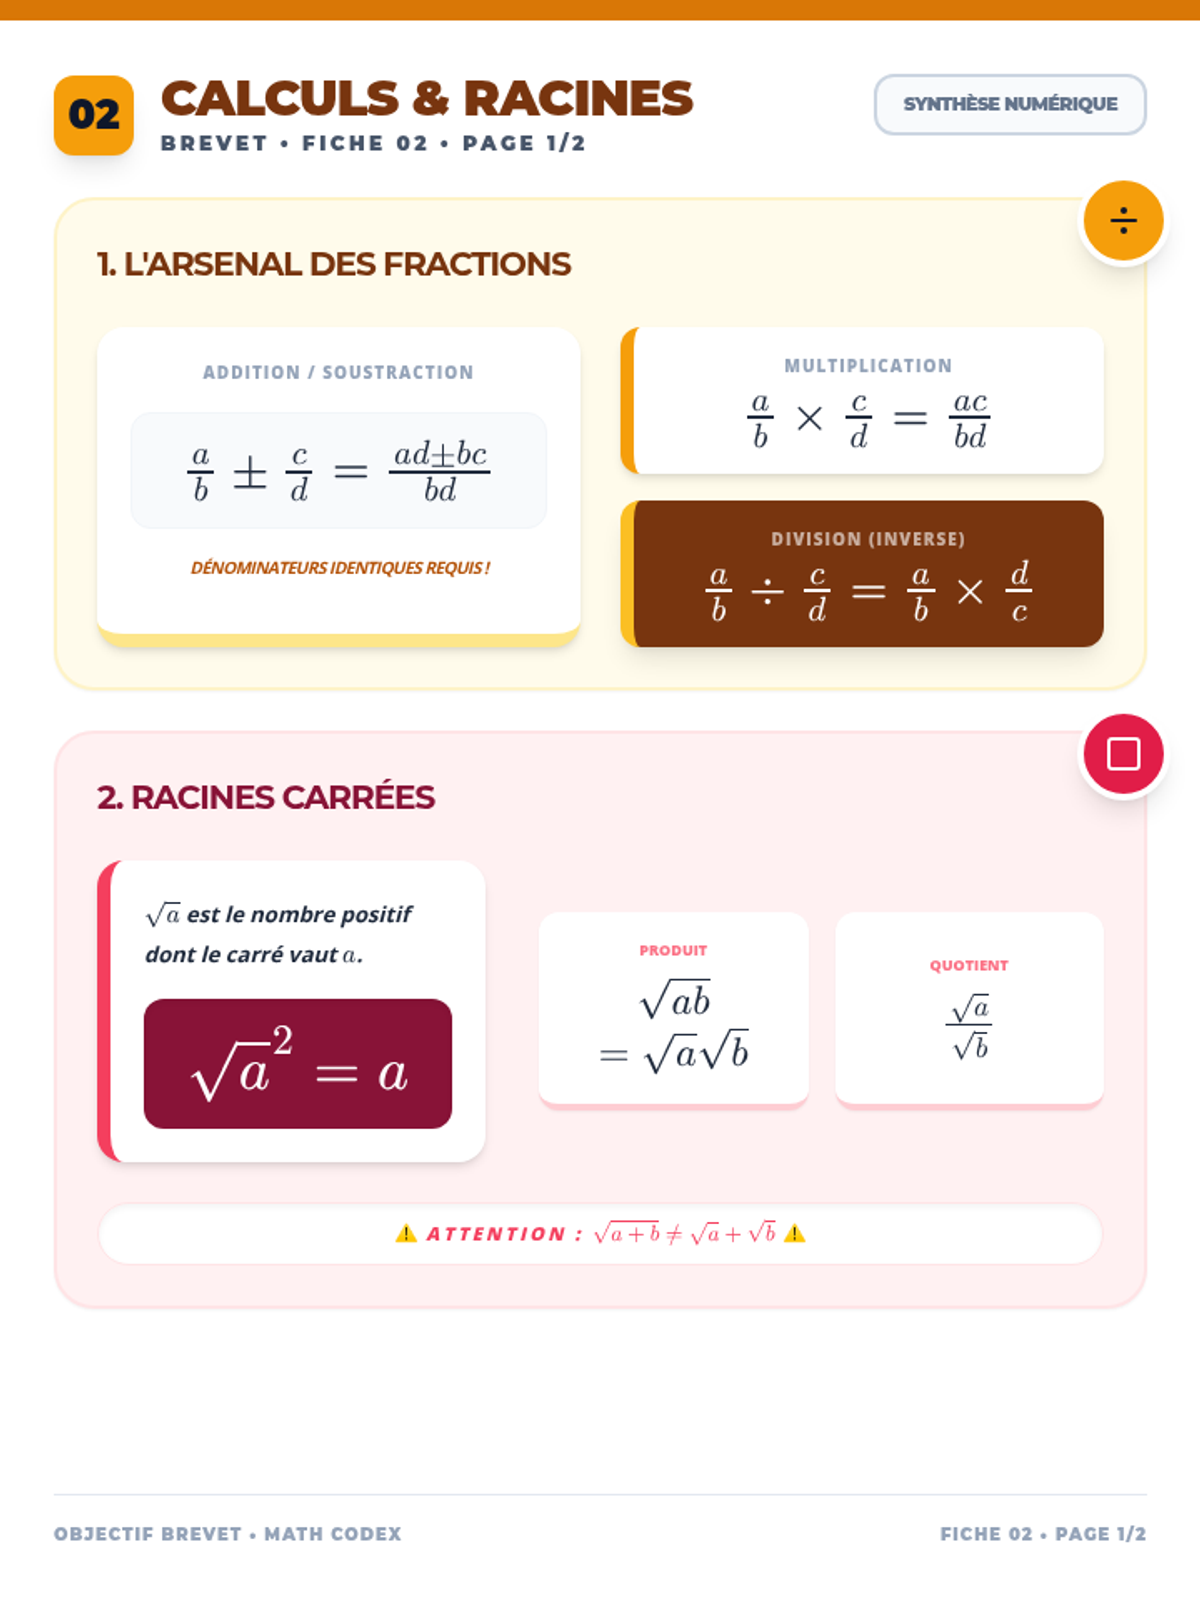
Une fiche de révision complète sur le calcul : fractions, puissances, notation scientifique et racines carrées. Regroupe les concepts des photos 1 et 4 avec une présentation aérée et détaillée sur 2 pages (cours). Synthèse pure. Correction des débordements de page.
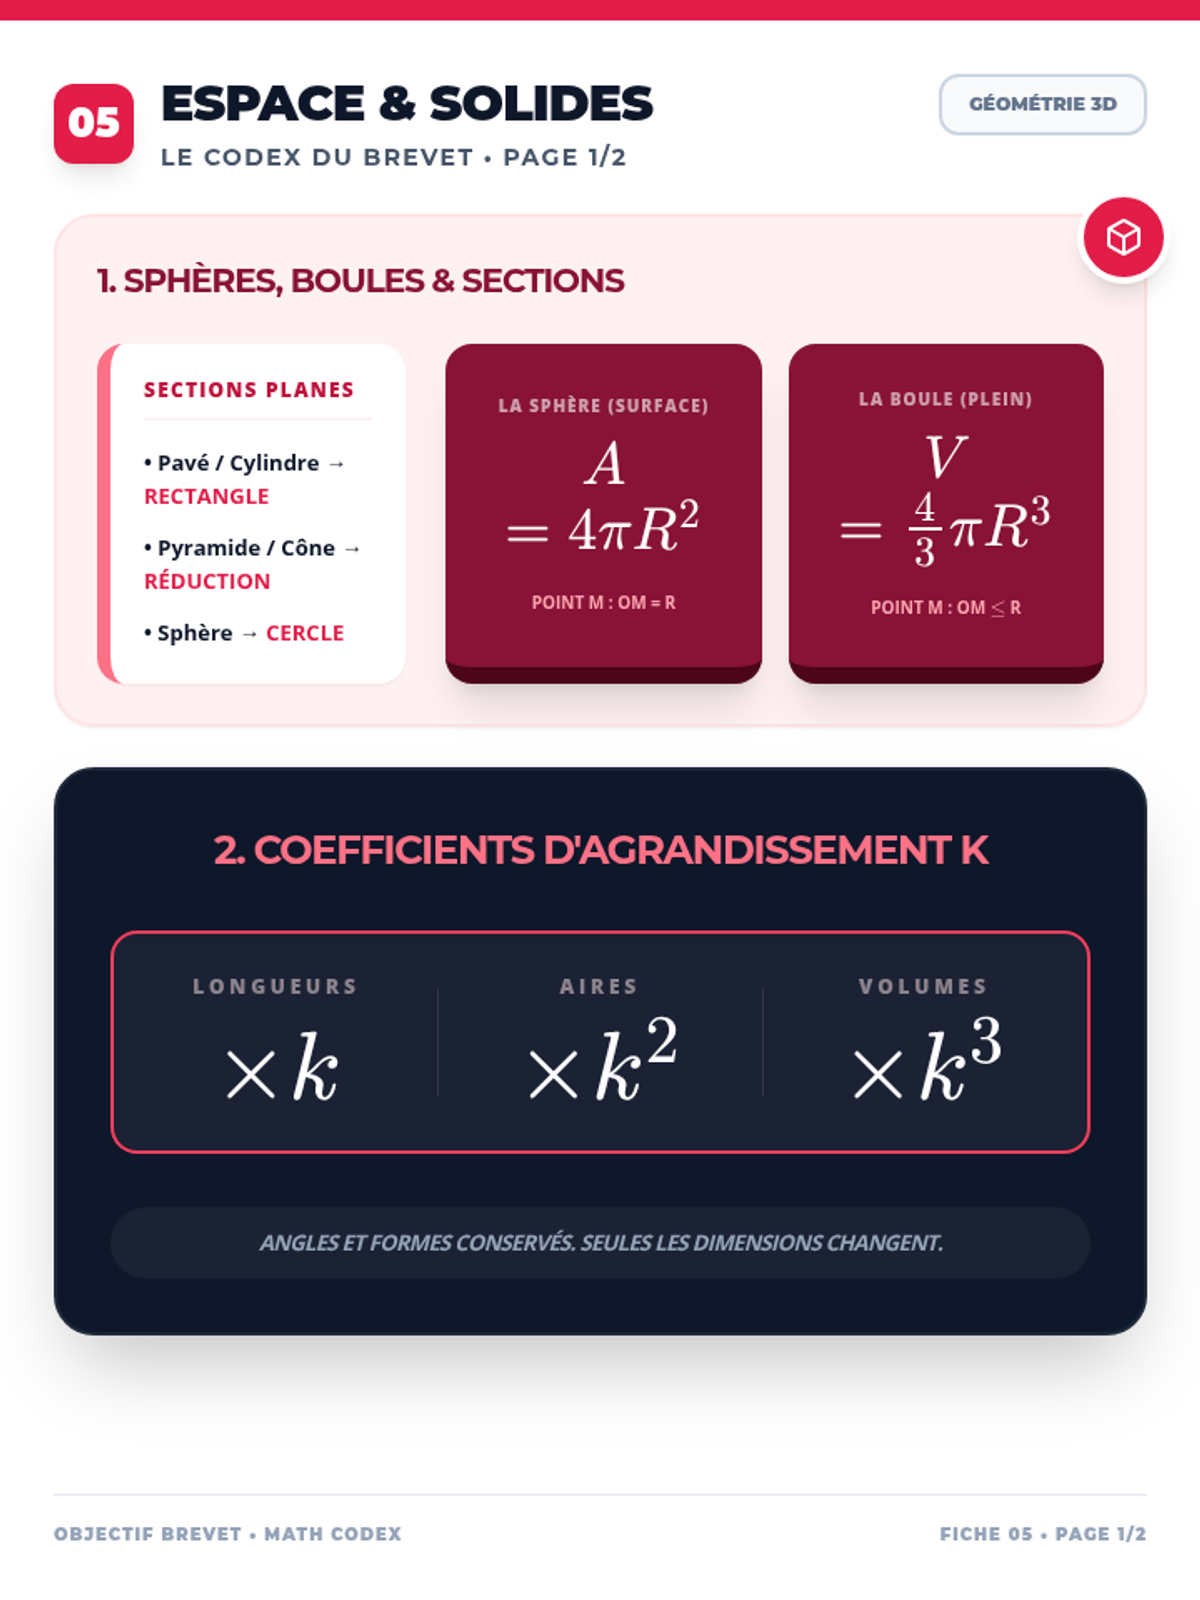
Une fiche de révision complète sur l'espace (solides, sphères, sections, agrandissements), les statistiques (n/N expliqués) et les probabilités. Regroupe les concepts des photos 6, 8, 10 et 11. Synthèse pure sans exercices sur 2 pages. Correction de la formule de la moyenne. Intègre la citation de Larson.
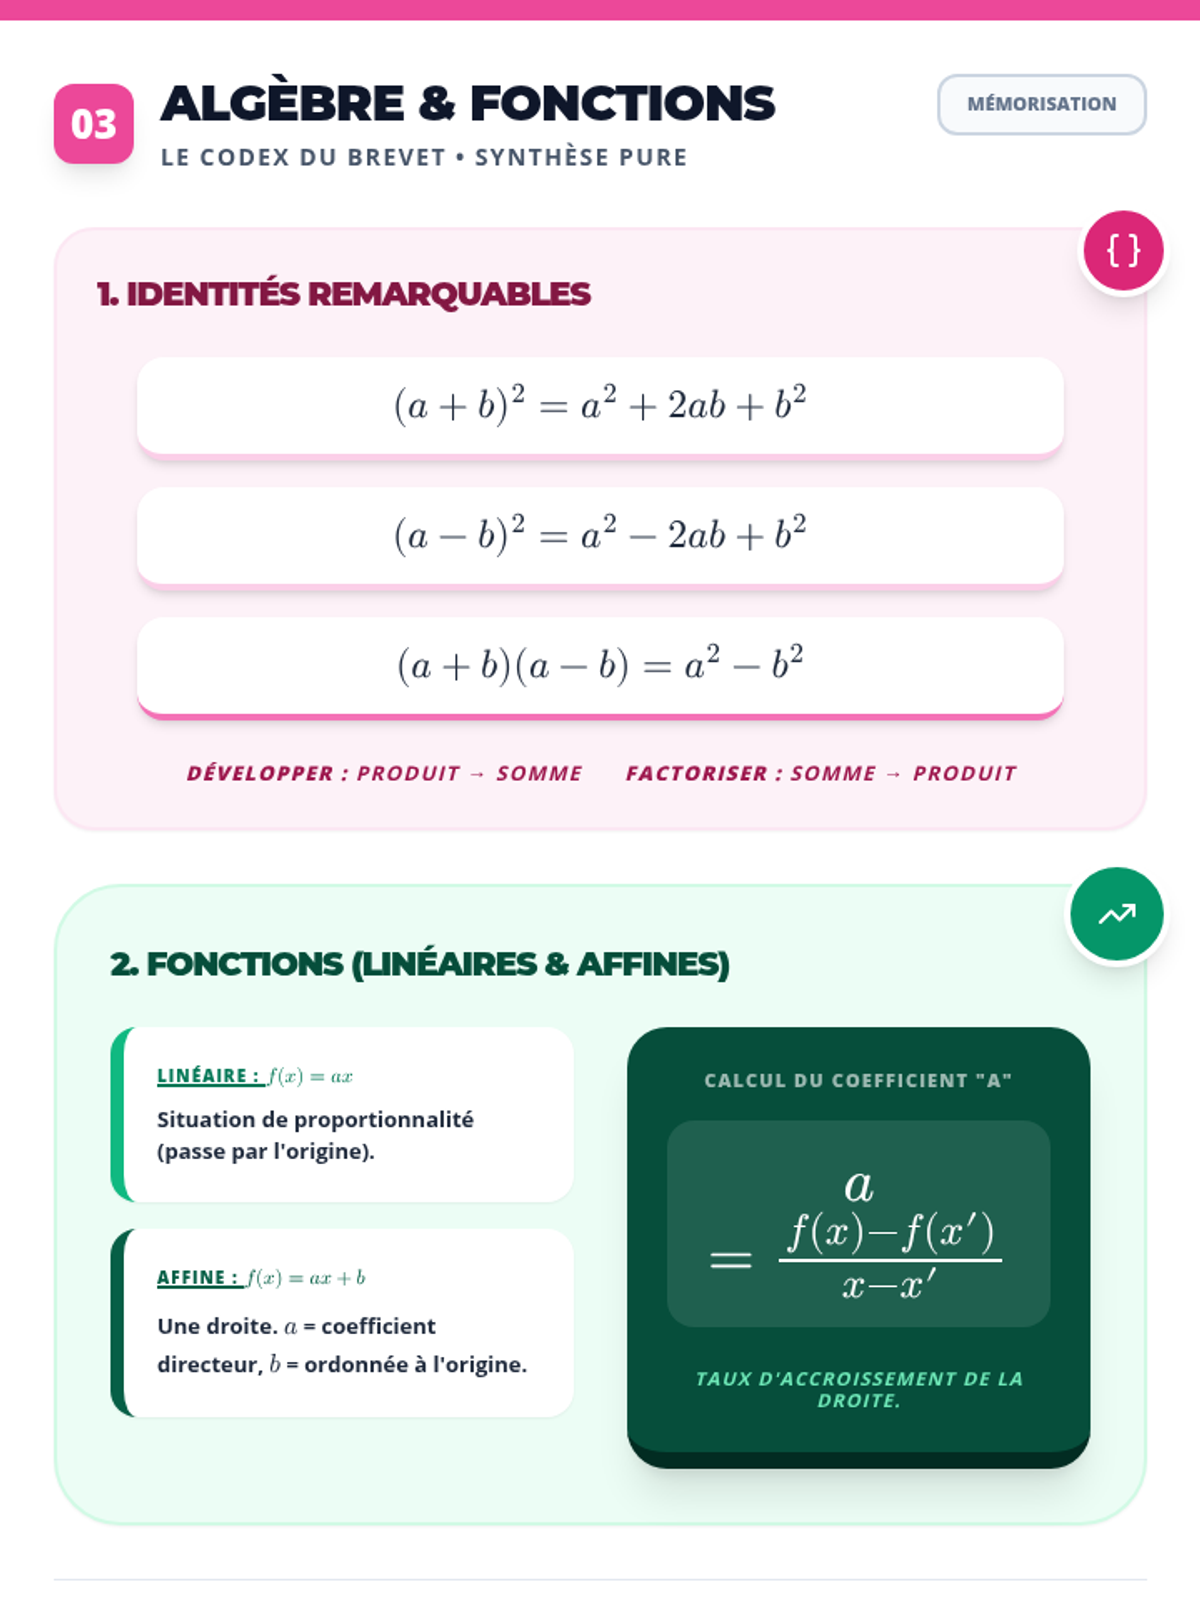
Une fiche de révision complète sur l'algèbre (identités, équations, systèmes) et les fonctions. Contient désormais une explication simplifiée des méthodes de substitution et de combinaison. Synthèse pure sans exercices sur 2 pages. Correction du débordement de page.
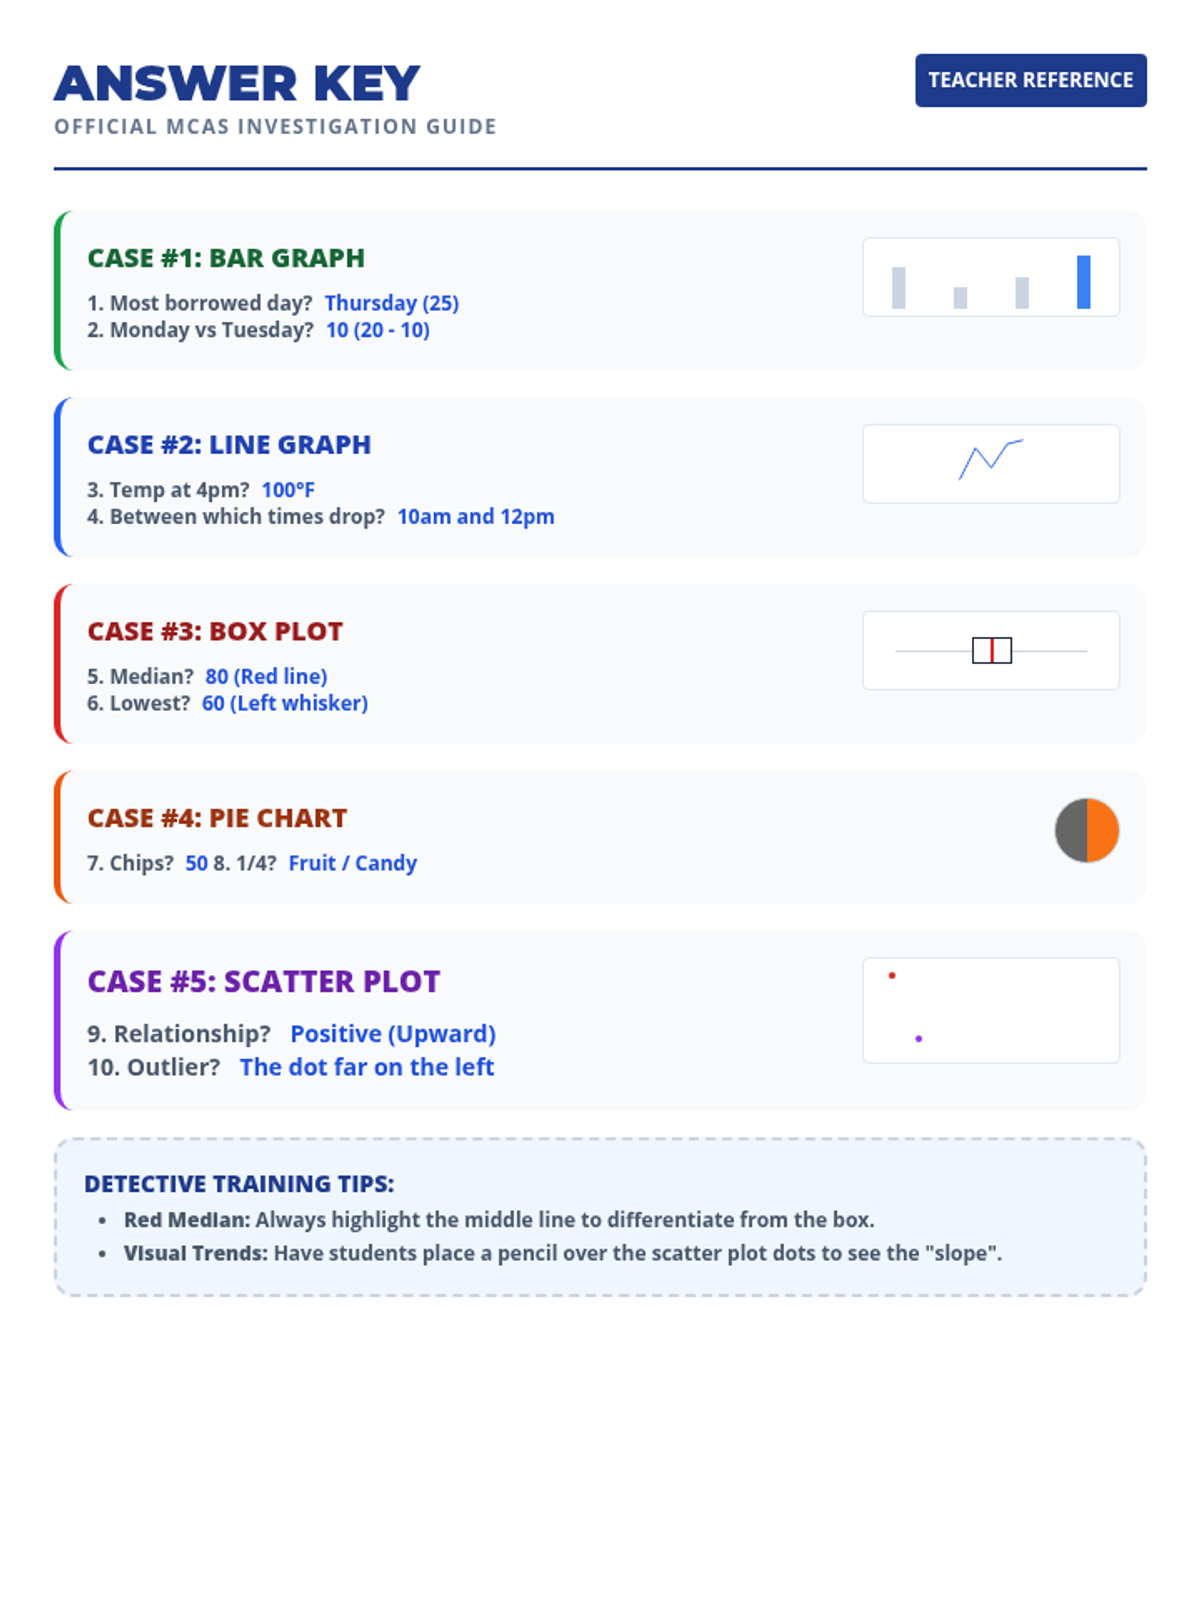
A teacher-facing answer key for the Data Hunt Worksheet. Includes clear answers with thumbnail visuals for quick reference and instructional tips for supporting SPED students. Categorized by case number and graph type. Now condensed to fit on fewer pages.
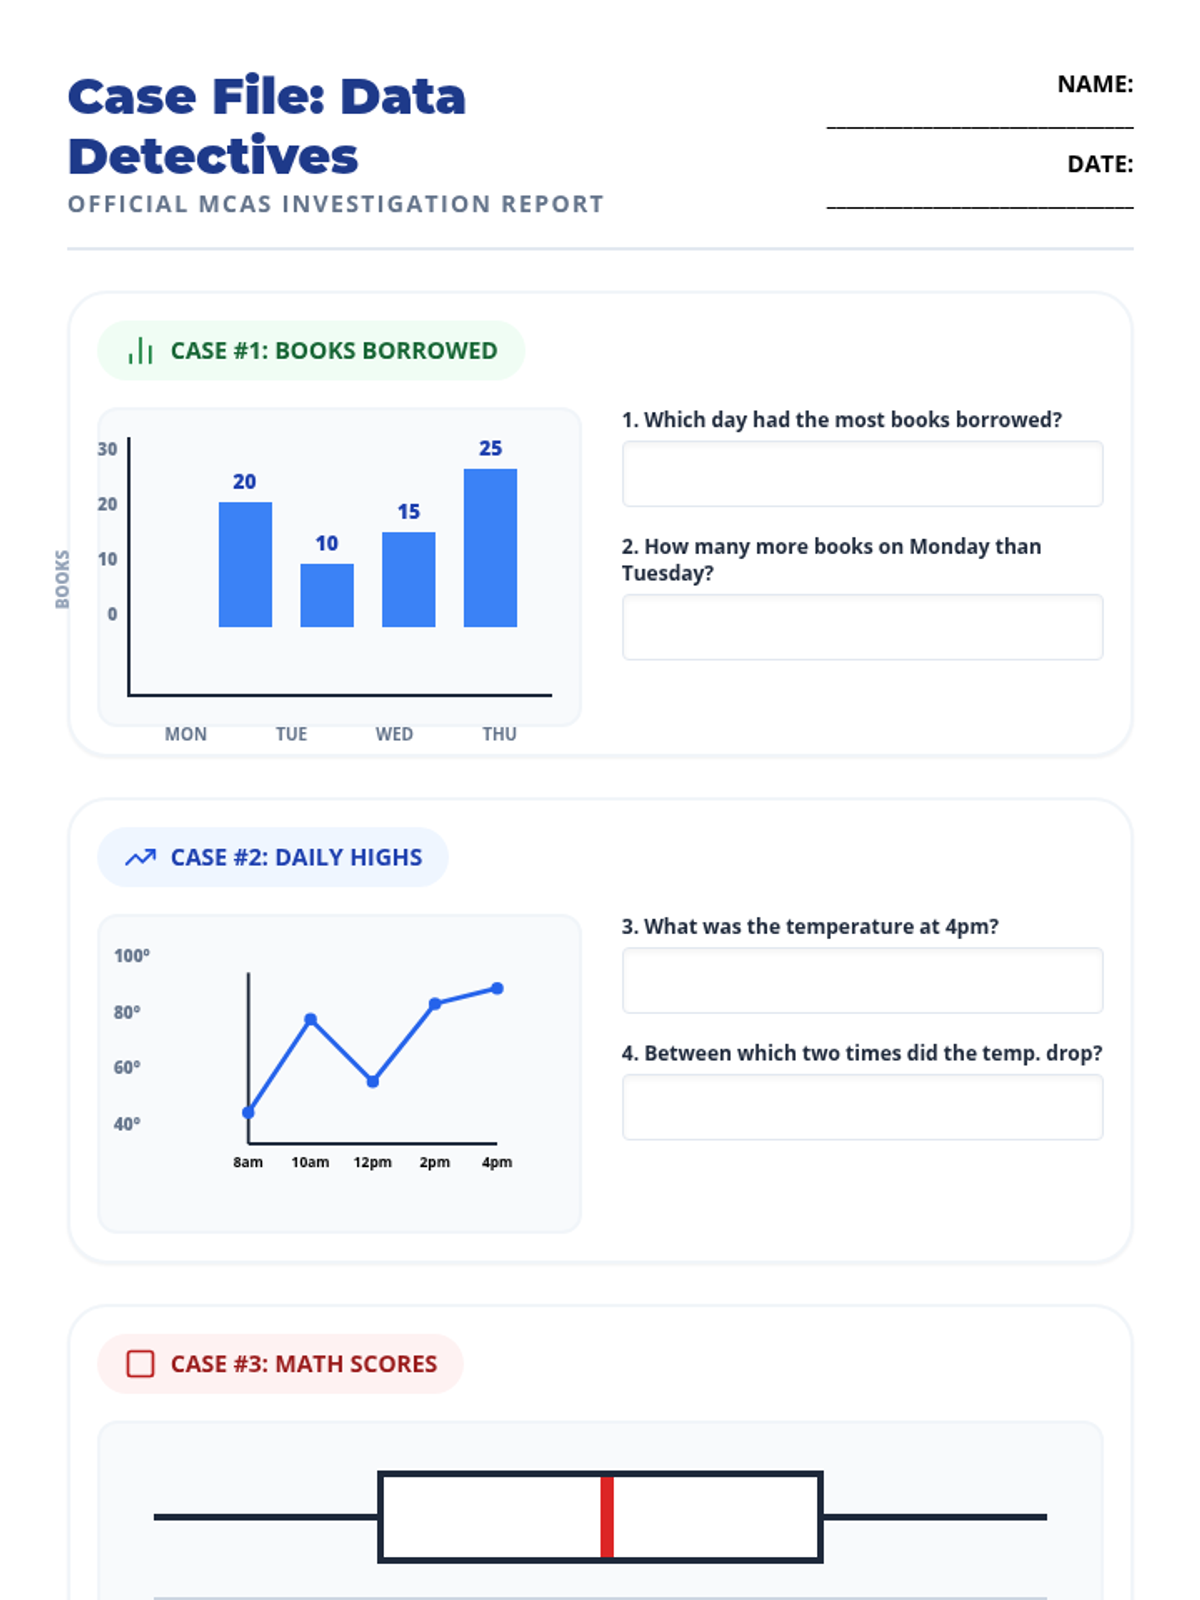
A scaffolded practice worksheet for 7th grade students to apply their data interpretation skills to various graph types. Designed with clear sections, visual aids, and generous writing space for SPED support. Now includes Bar, Line, Box Plot, Pie Chart, and Scatter Plot cases.
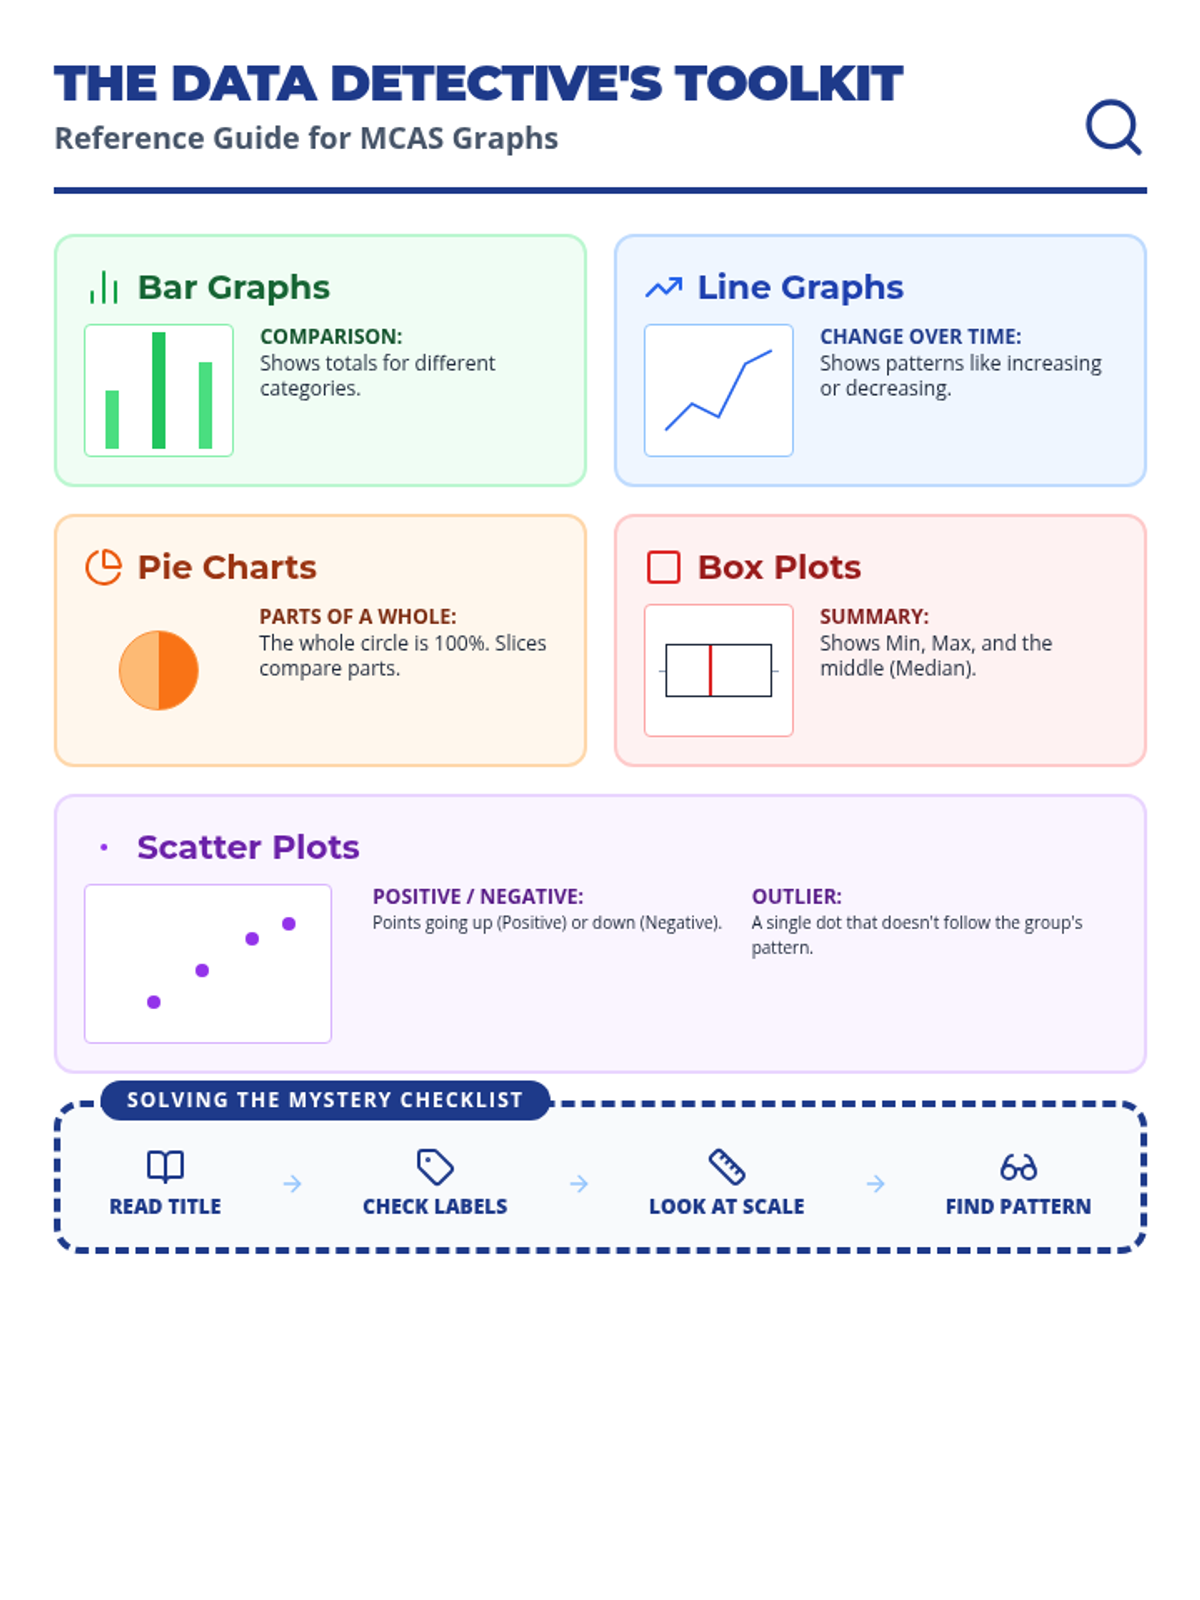
A comprehensive one-page anchor chart/reference guide for 7th grade students. It provides clear visual definitions, tips, and key features for bar graphs, line graphs, pie charts, box plots, and scatter plots, specifically tailored to support SPED students during data interpretation tasks.
A visually engaging slide deck designed for 7th grade students (including SPED support) to learn and practice interpreting various graph types commonly found on the MCAS assessment. Includes clear visuals and simplified steps for bar graphs, line graphs, pie charts, scatter plots, and box plots.
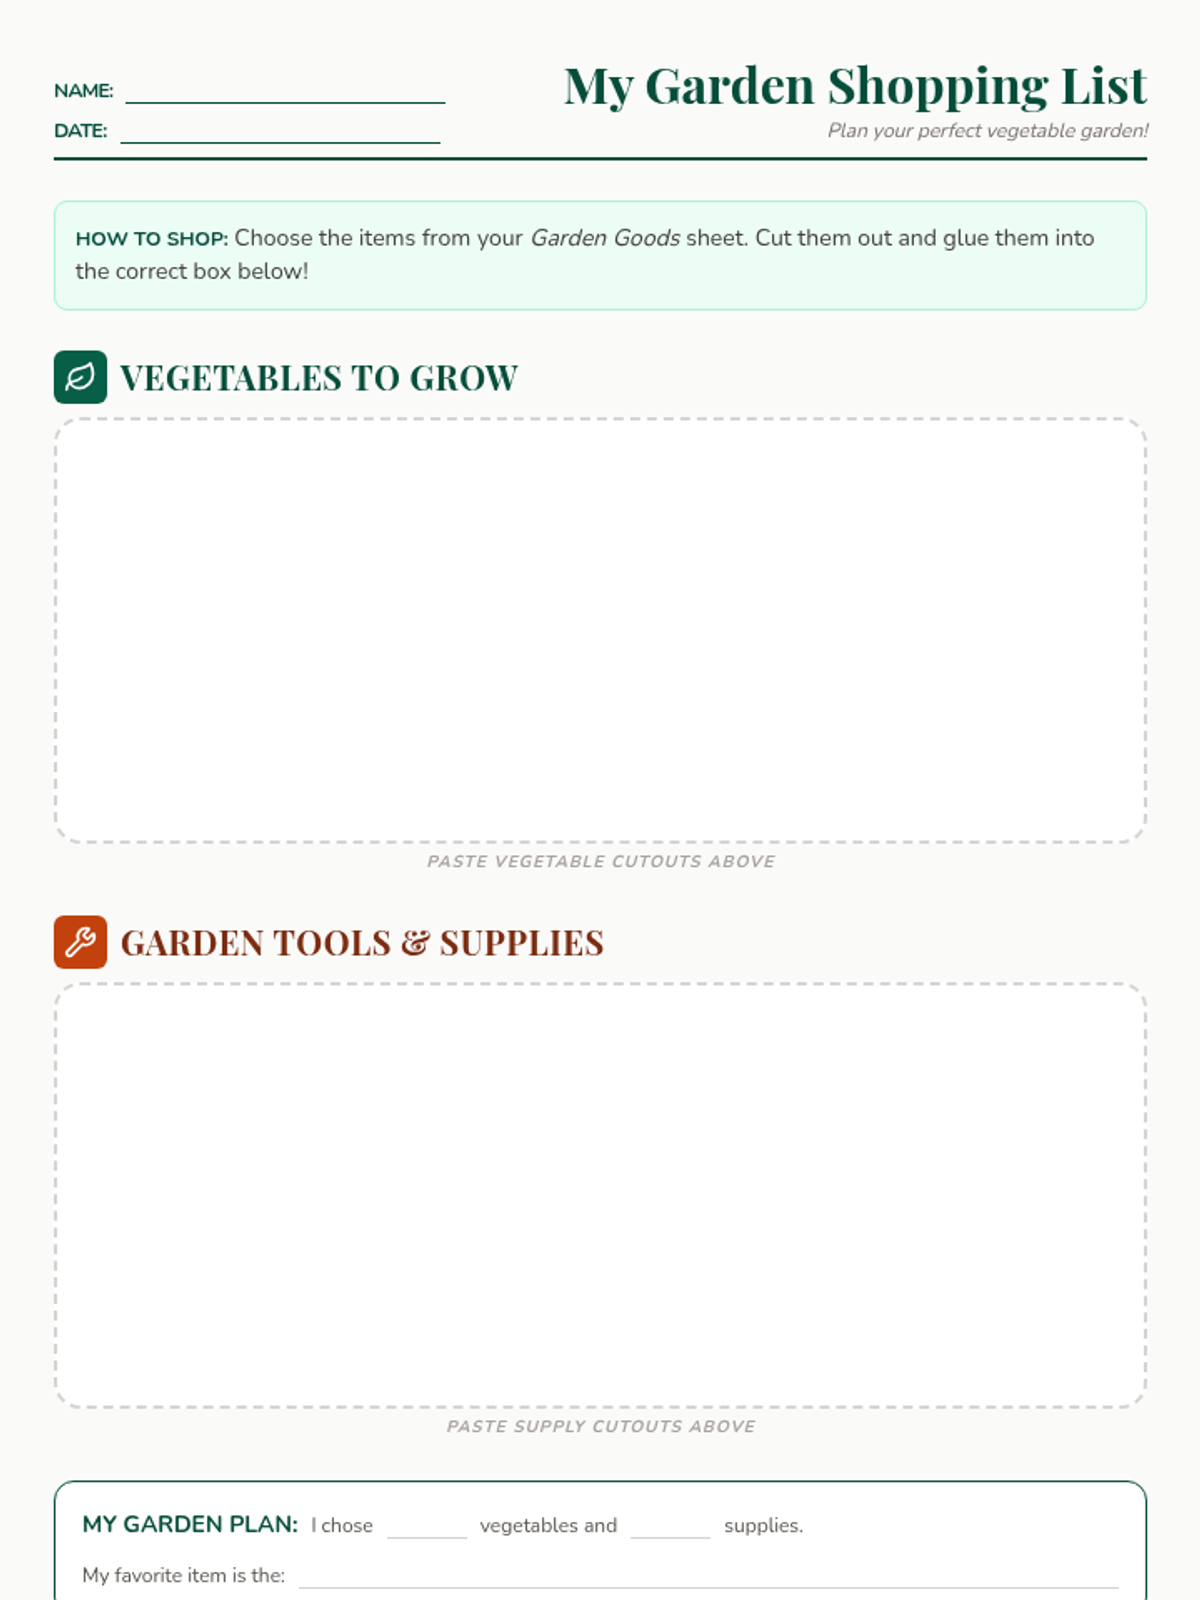
A shopping list organizer where students paste their chosen garden items.
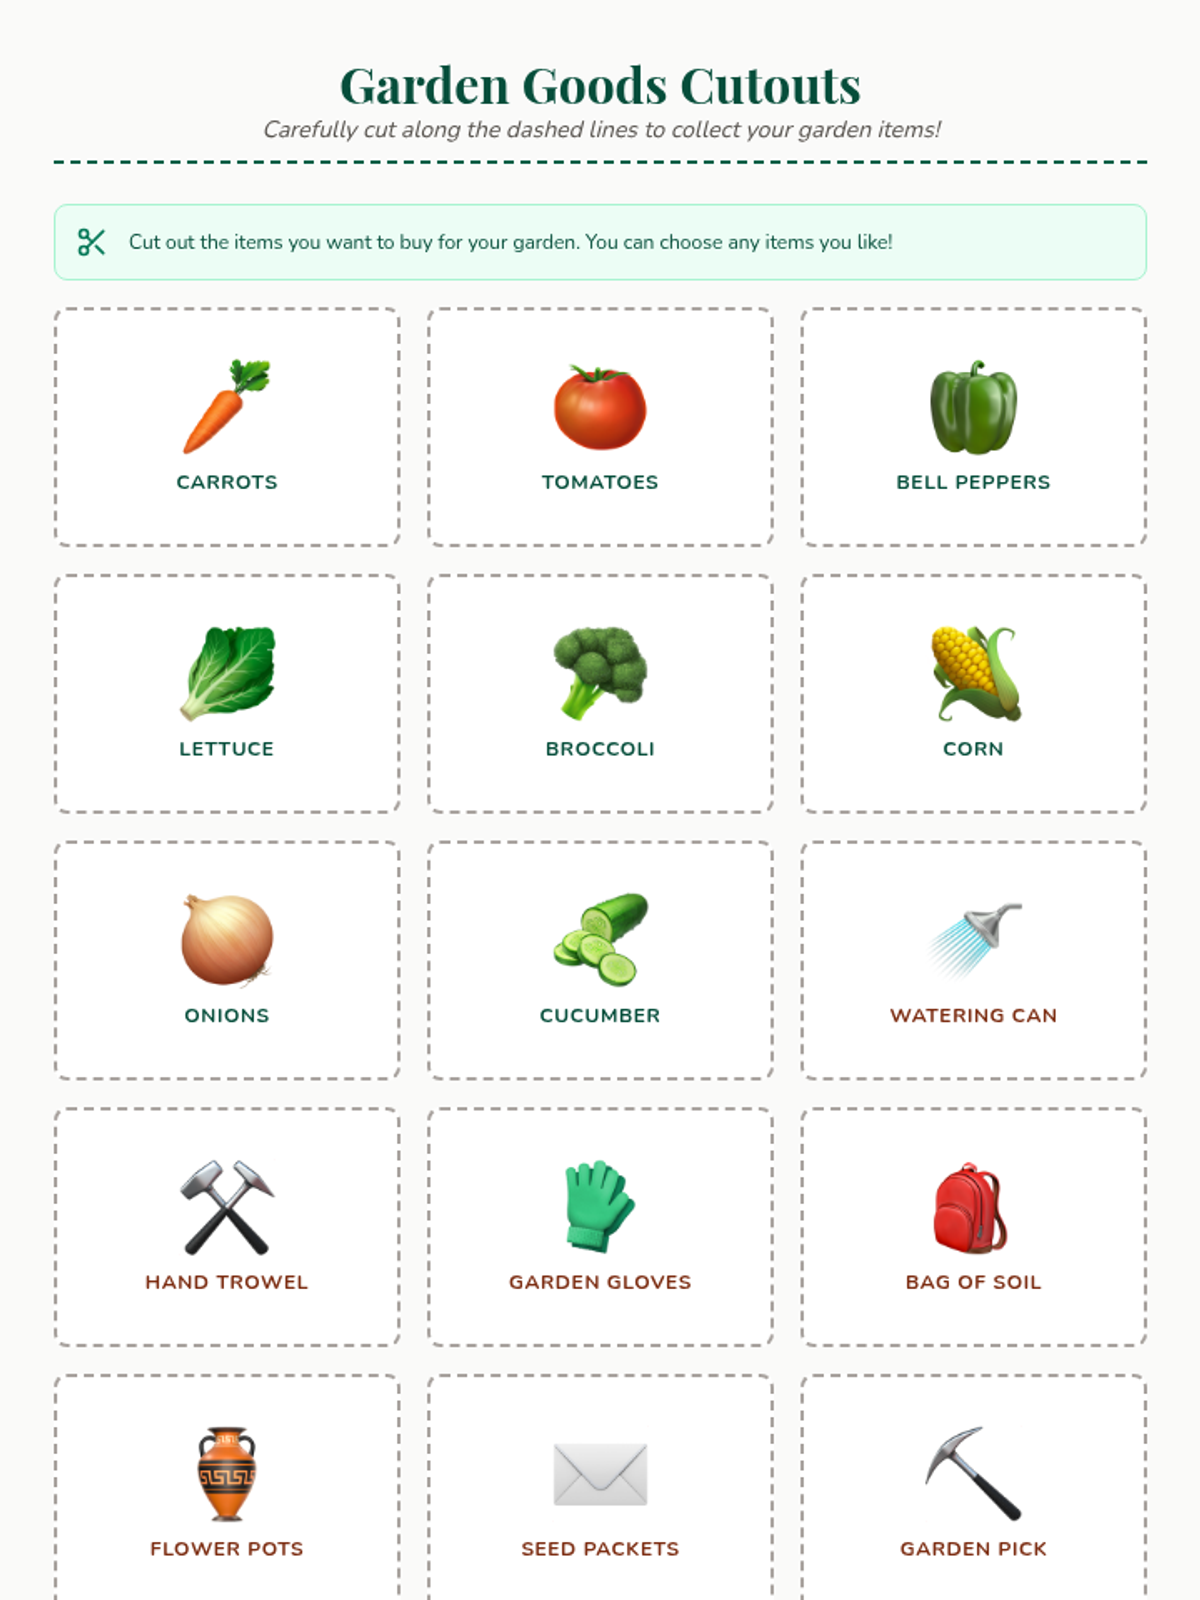
A sheet of vegetables and garden supplies for students to cut out and use for their shopping list activity.
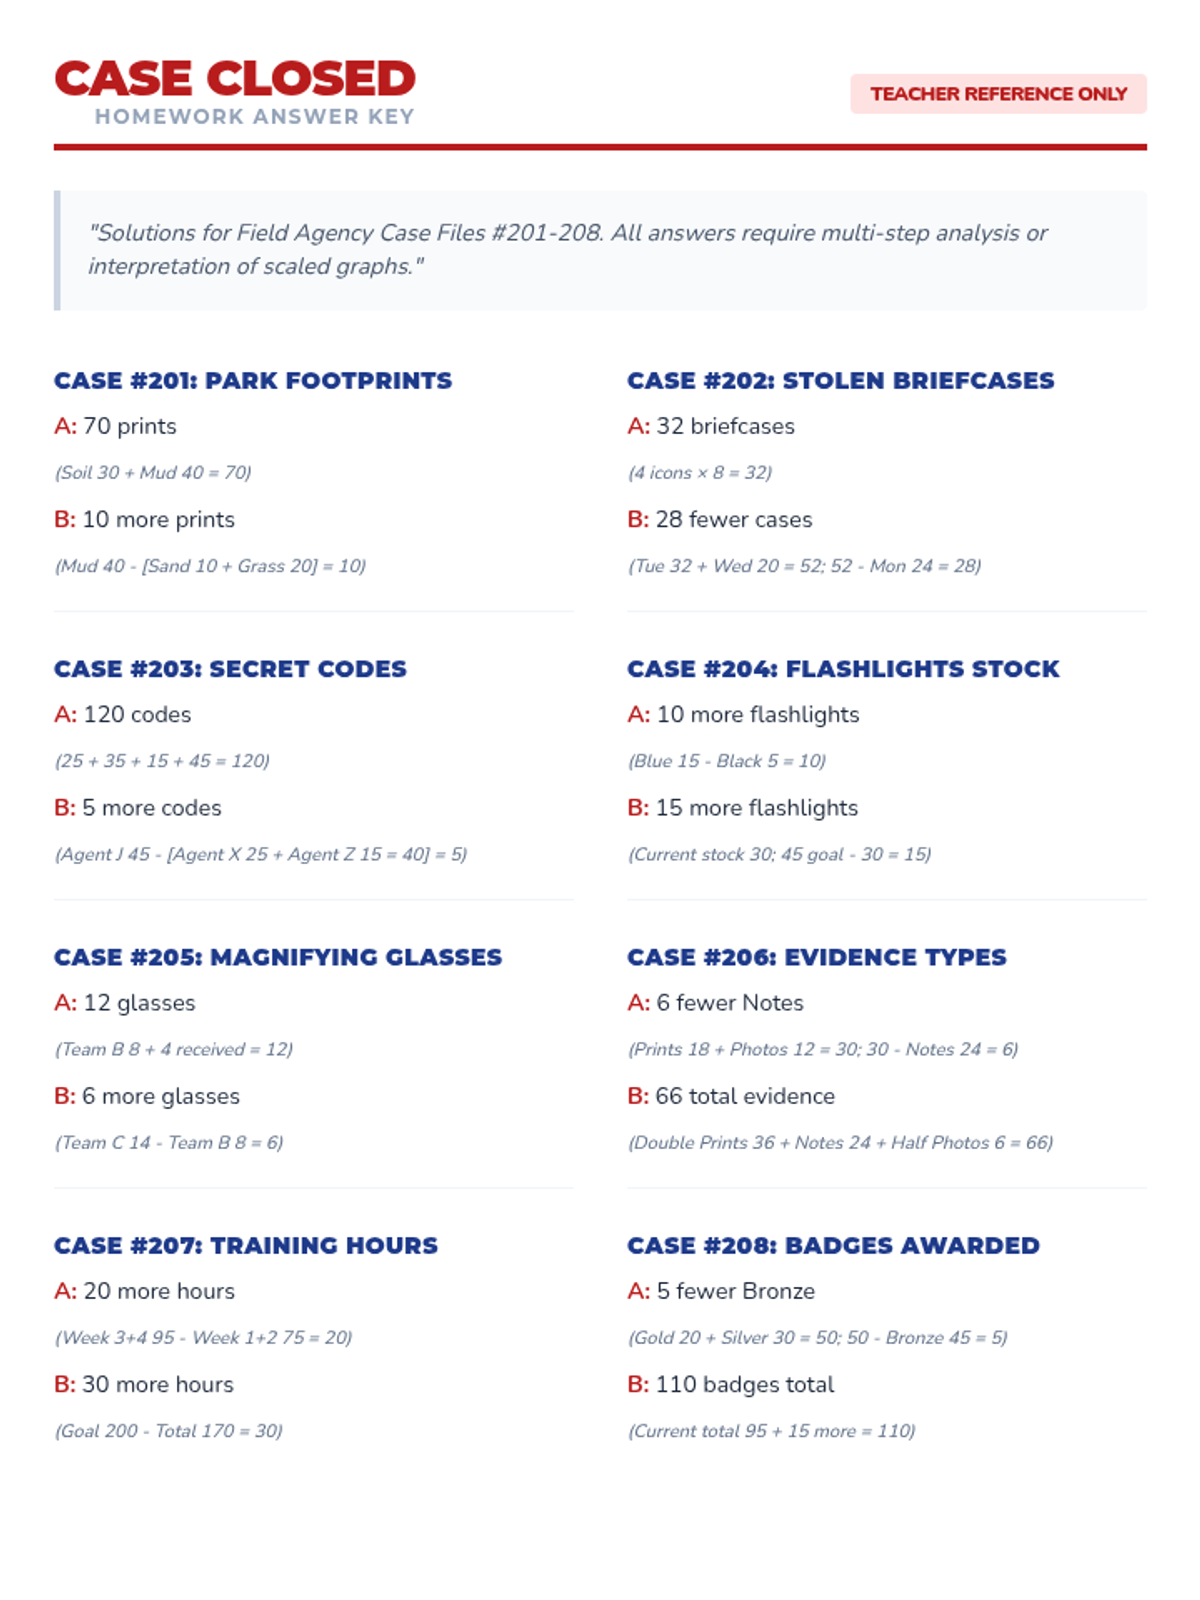
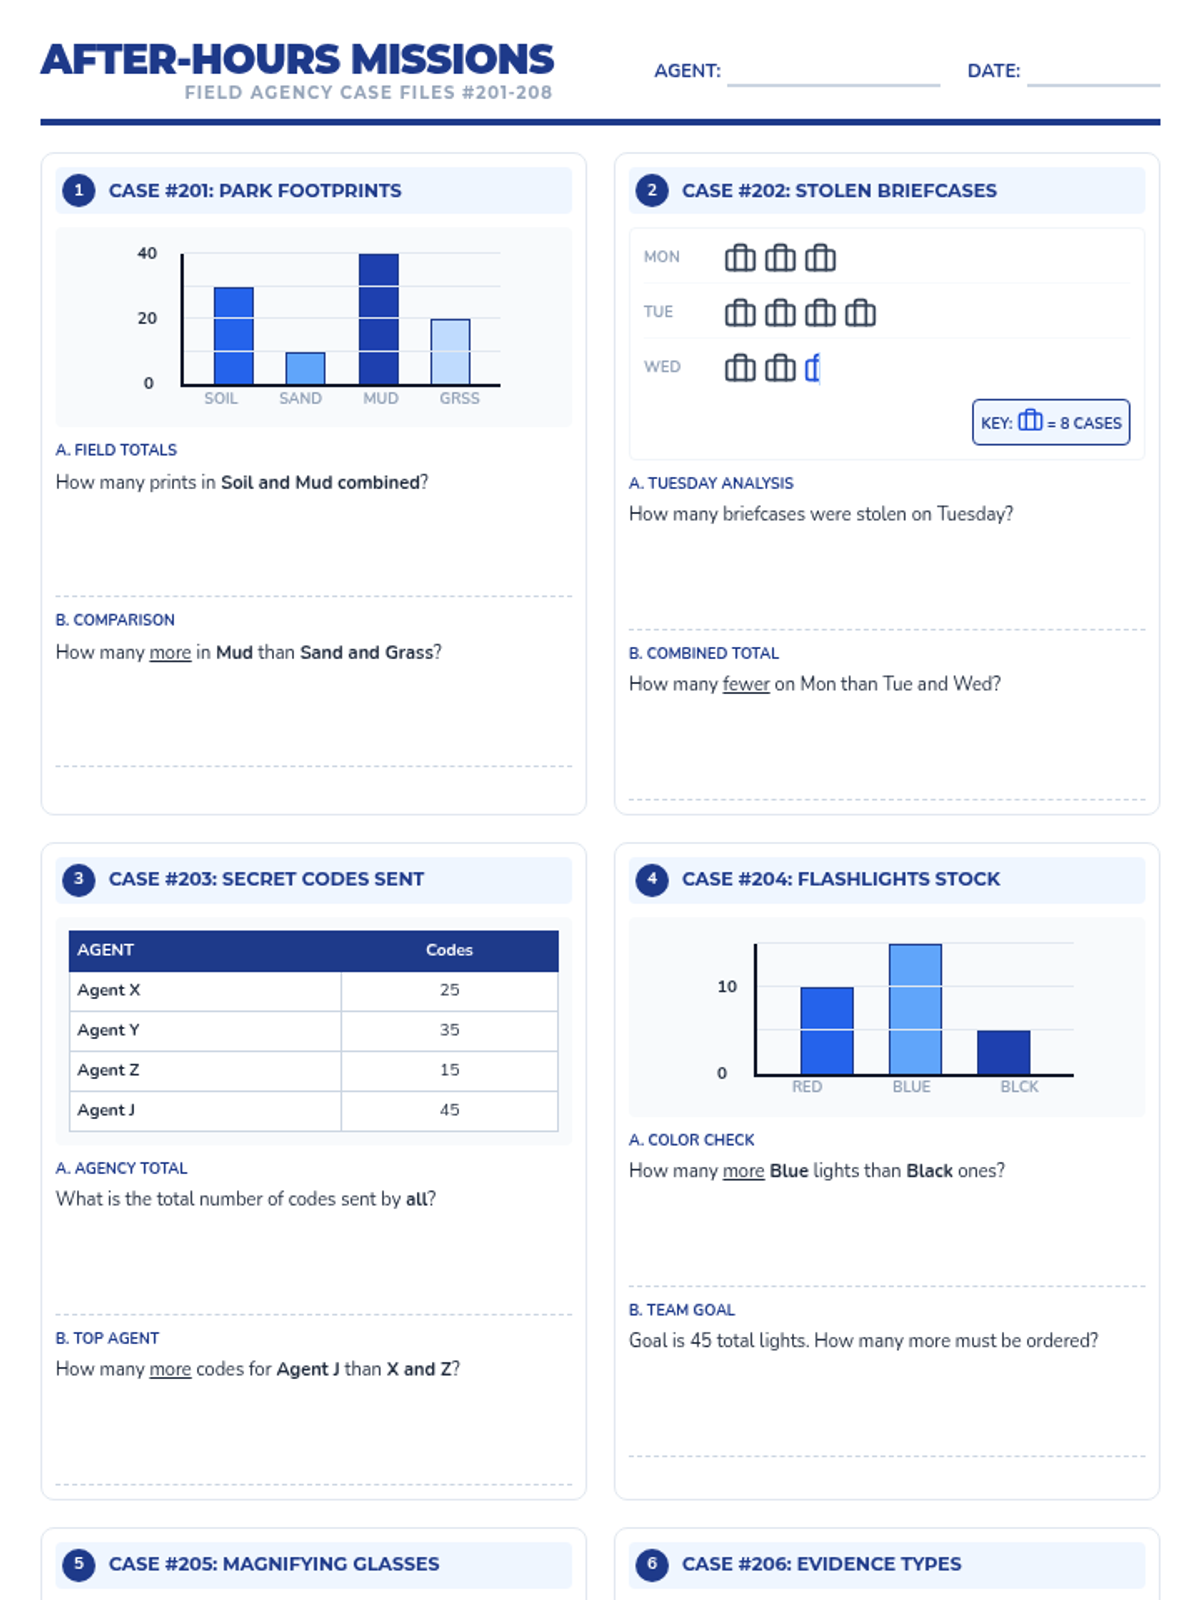
A dedicated answer key for the 'After-Hours Missions' homework sheet, providing clear multi-step solutions and mathematical justifications for all 8 detective cases.
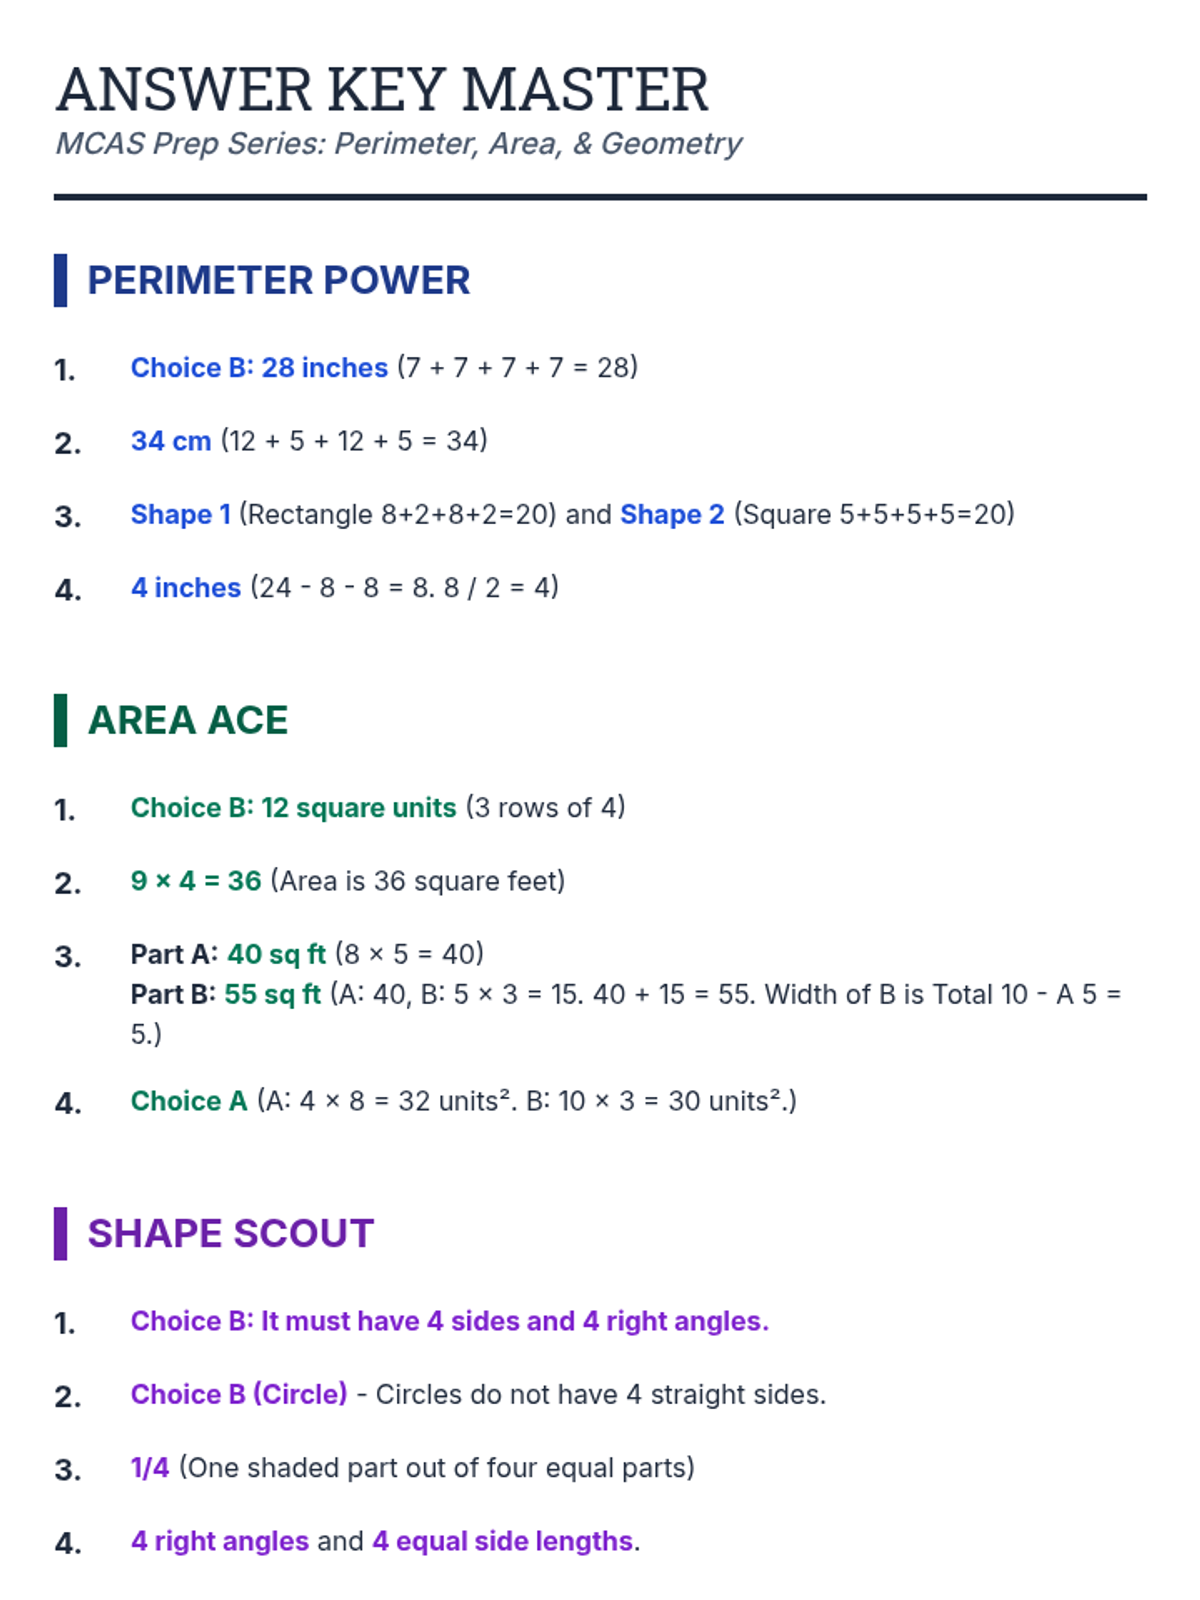
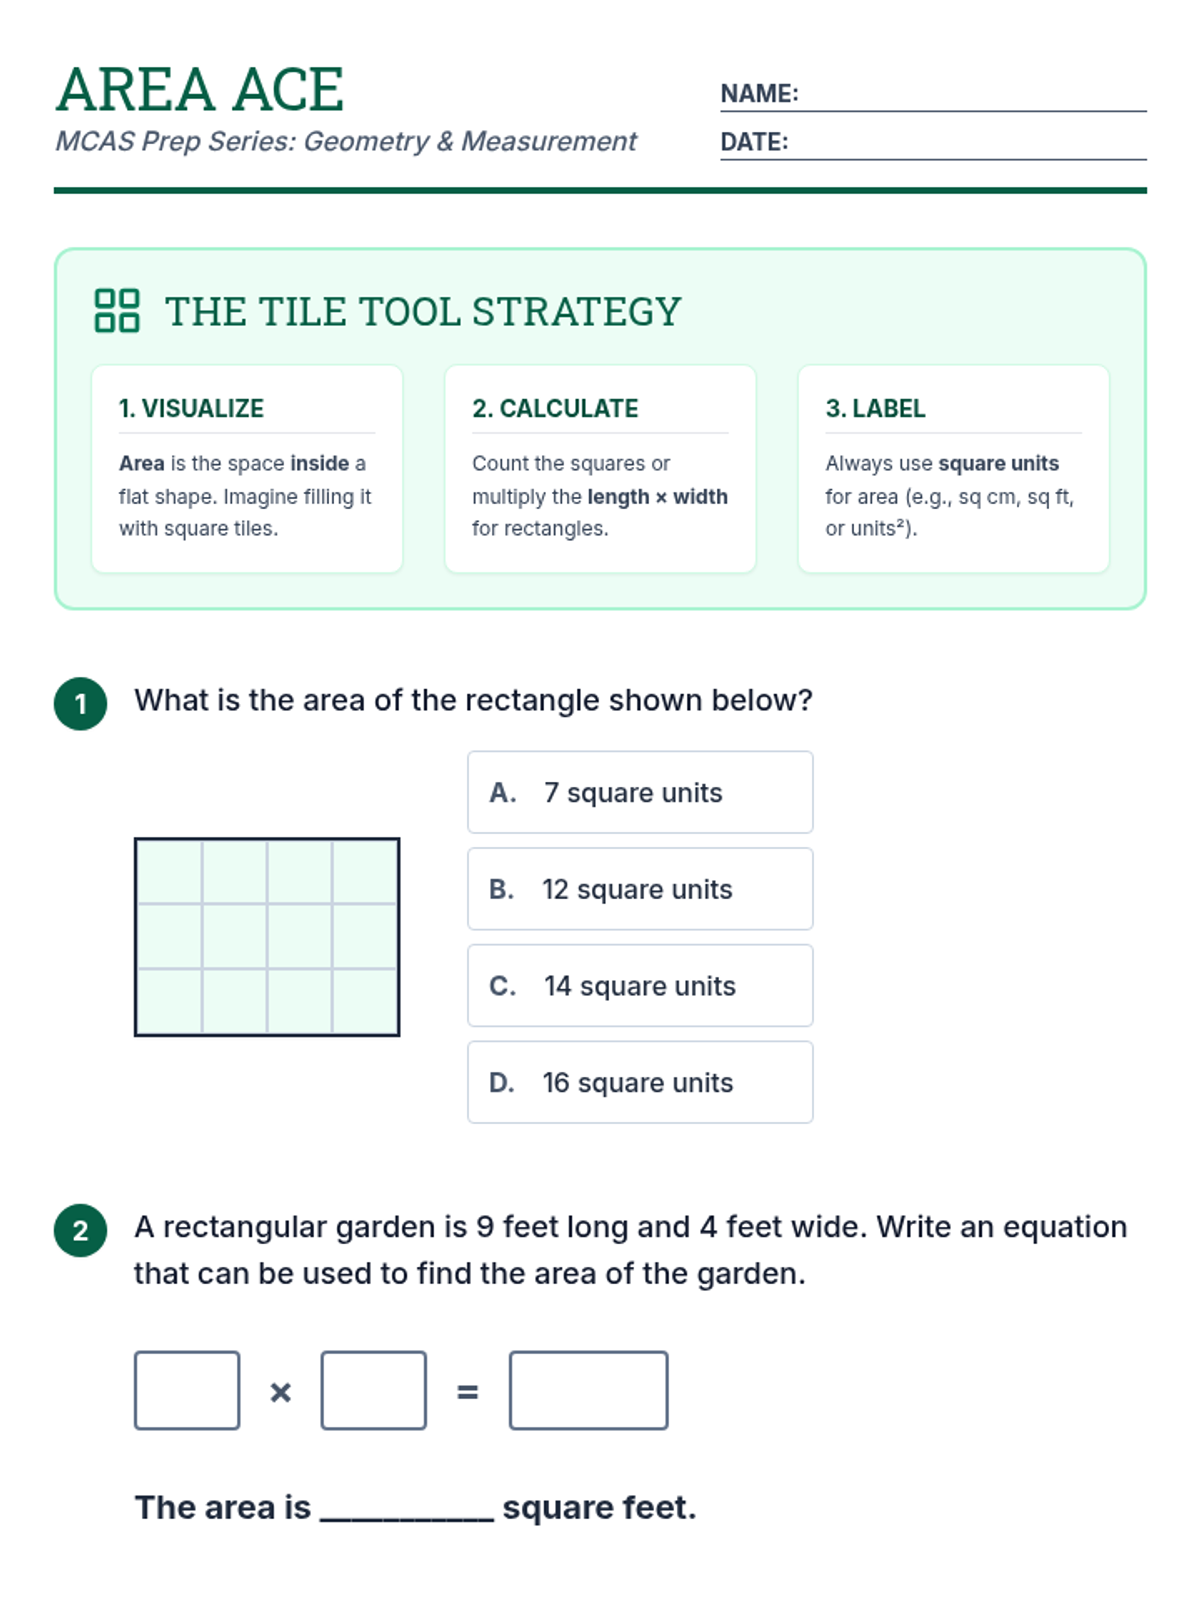
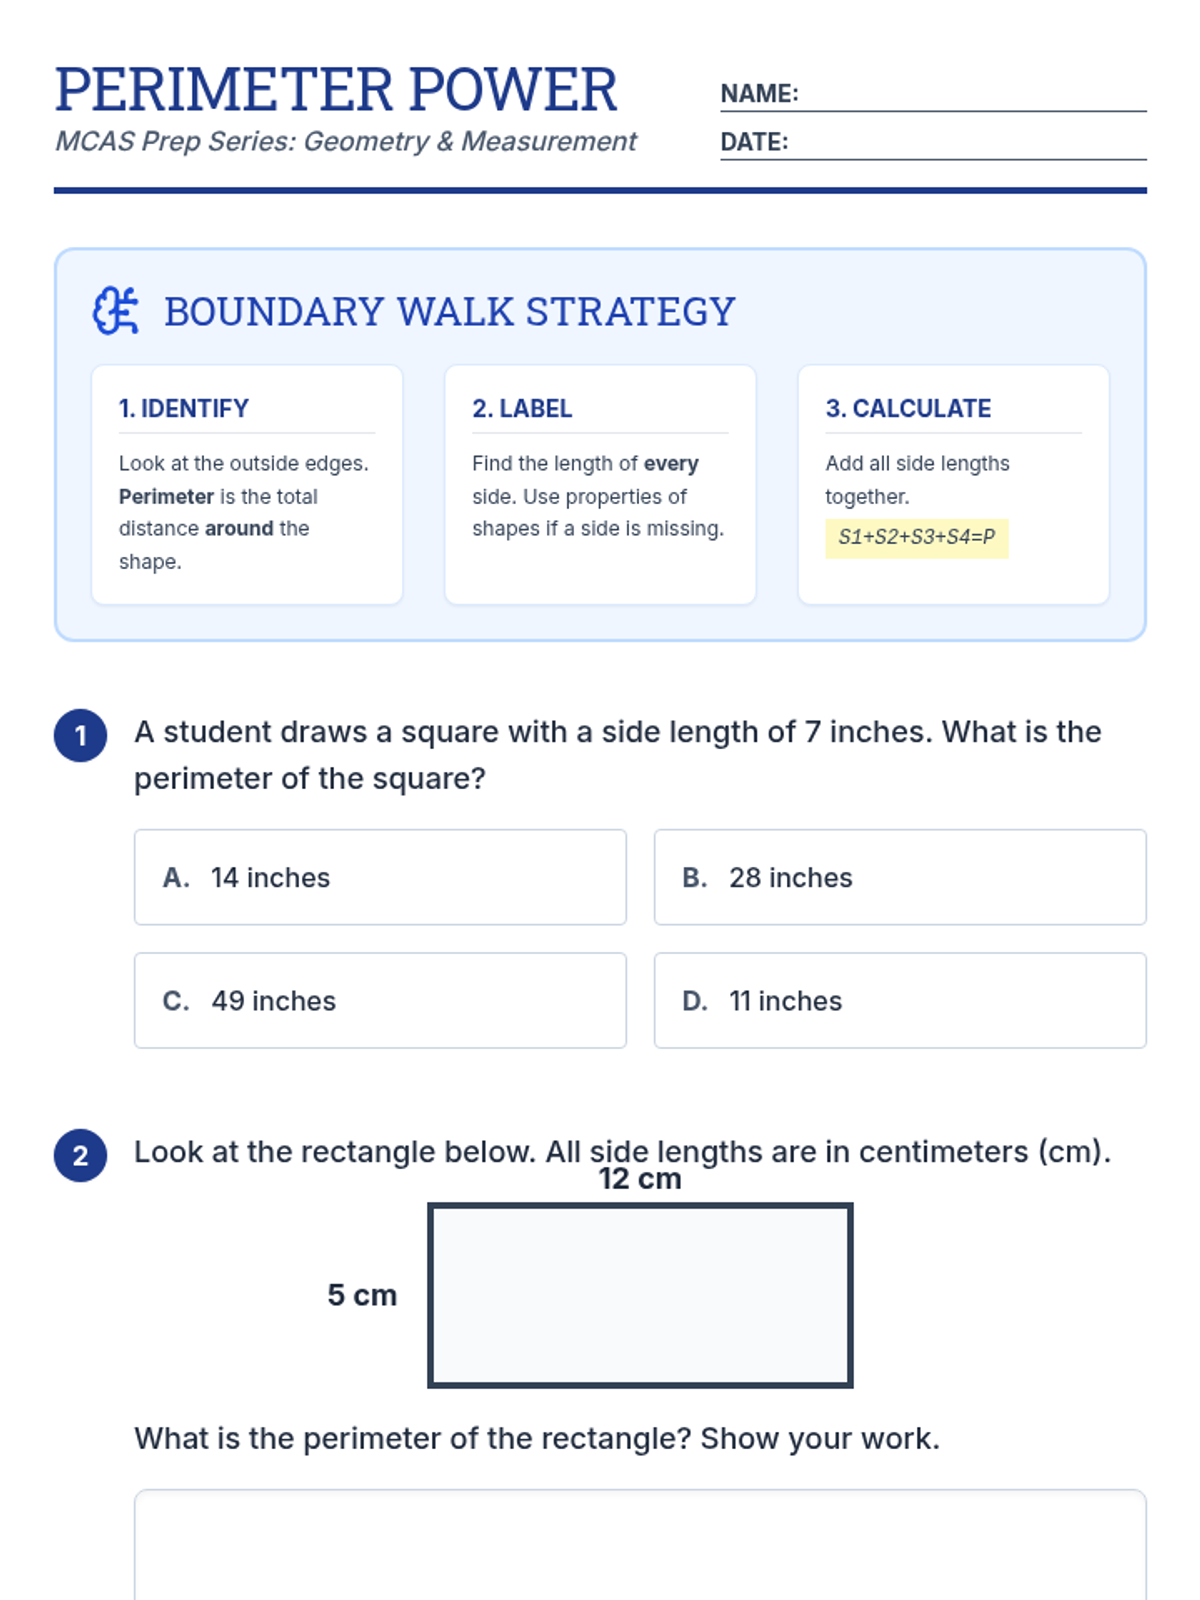
An updated comprehensive answer key for the MCAS Mastery series, now including solutions for the fourth practice problem on each worksheet: Perimeter Power, Area Ace, and Shape Scout.
A 2-page geometry review worksheet for 3rd grade students featuring an 'Attribute Anchor' strategy organizer and MCAS-style practice problems. Layout optimized for clean page breaks and efficient space usage.
A 2-page area review worksheet for 3rd grade students featuring a 'Tile Tool' strategy organizer and MCAS-style practice problems. Layout optimized for clean page breaks and efficient space usage. Question 3 diagram is clearly labeled.
A 2-page perimeter review worksheet for 3rd grade students featuring a 'Boundary Walk' strategy organizer and MCAS-style practice problems. Layout optimized for clean page breaks and efficient space usage.
A homework practice sheet for scaled graphs with a 'Data Detective' theme. Features eight sections of complex, multi-step graph interpretation (picture graphs, bar graphs, and frequency tables) designed to mirror the classroom practice. Each section focuses on analysis and solving two-step problems across two pages with expanded student work areas. Layout optimized for 2 pages.
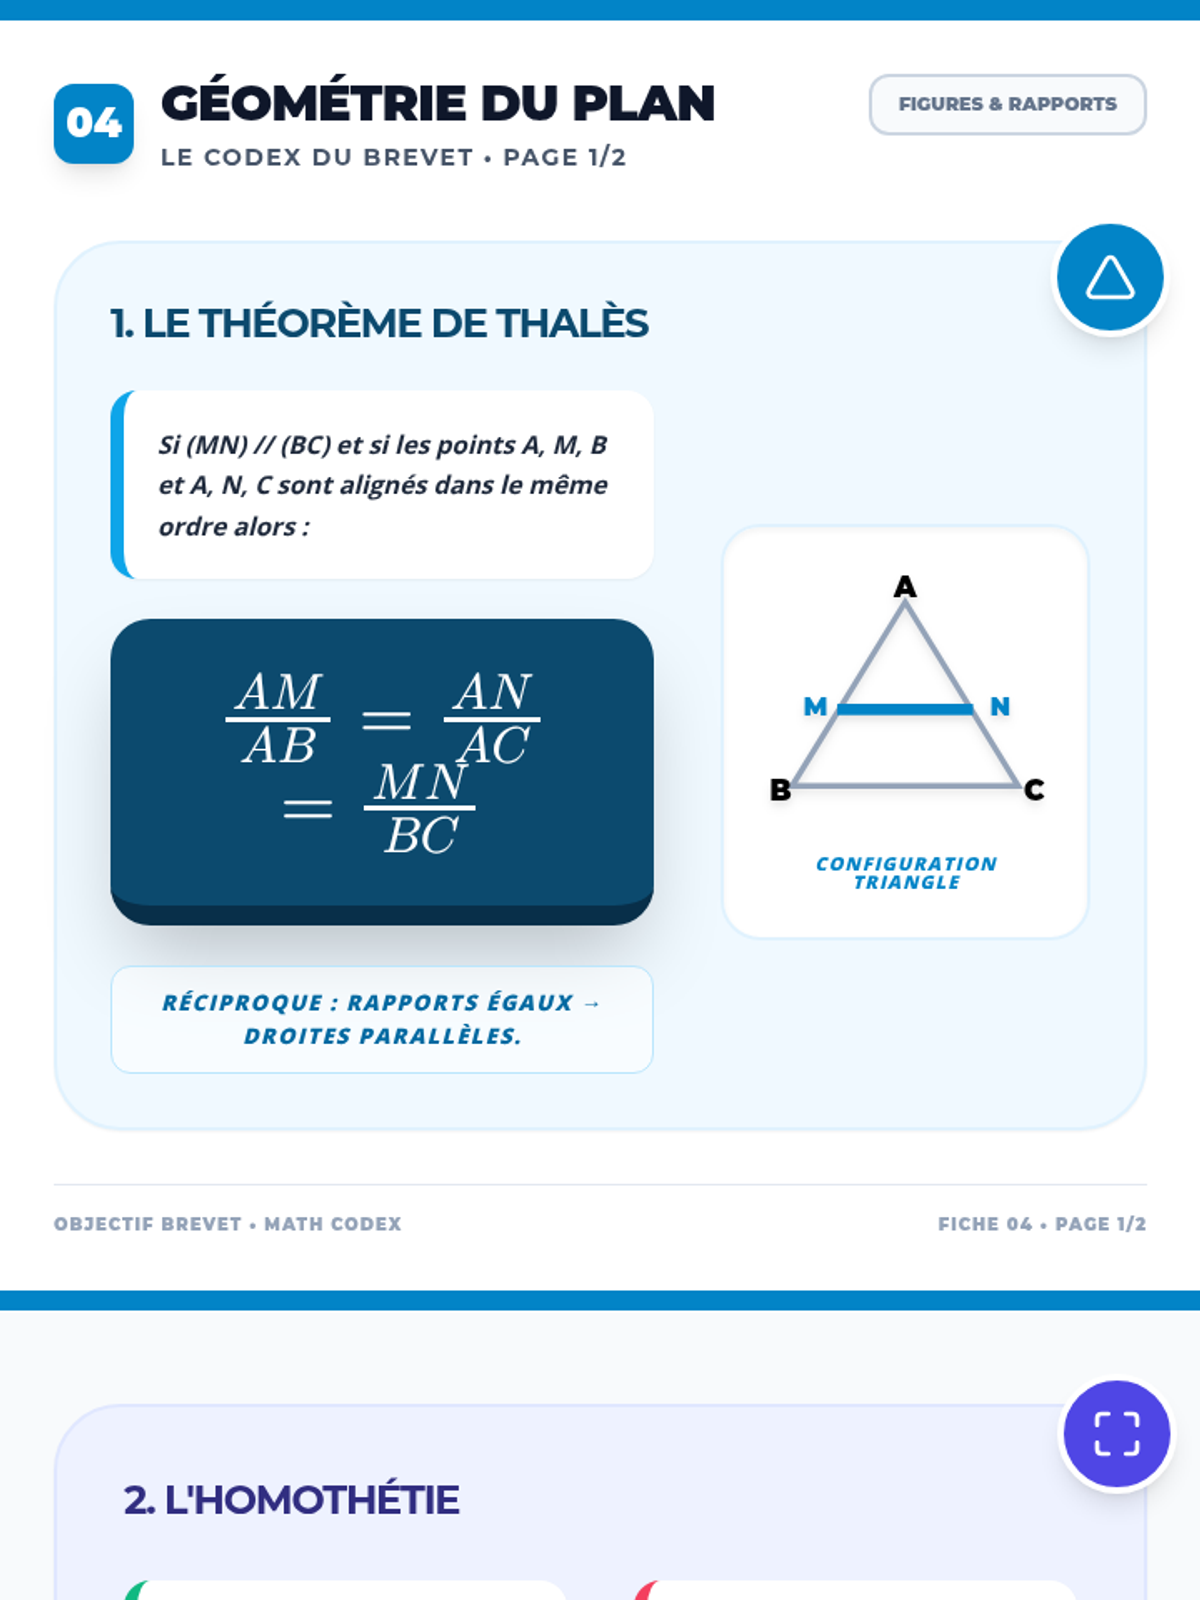
Une fiche de révision visuelle sur le théorème de Thalès, l'homothétie, les angles inscrits et les polygones réguliers pour les élèves de 3ème. Regroupe les concepts des photos 3, 5, 7 et 8. Synthèse pure sur 2 pages denses. Explique les lettres K, P, KL, KO, KS. Représentation du triangle avec les points B et C. Correction de la formule de l'homothétie et de la pagination.
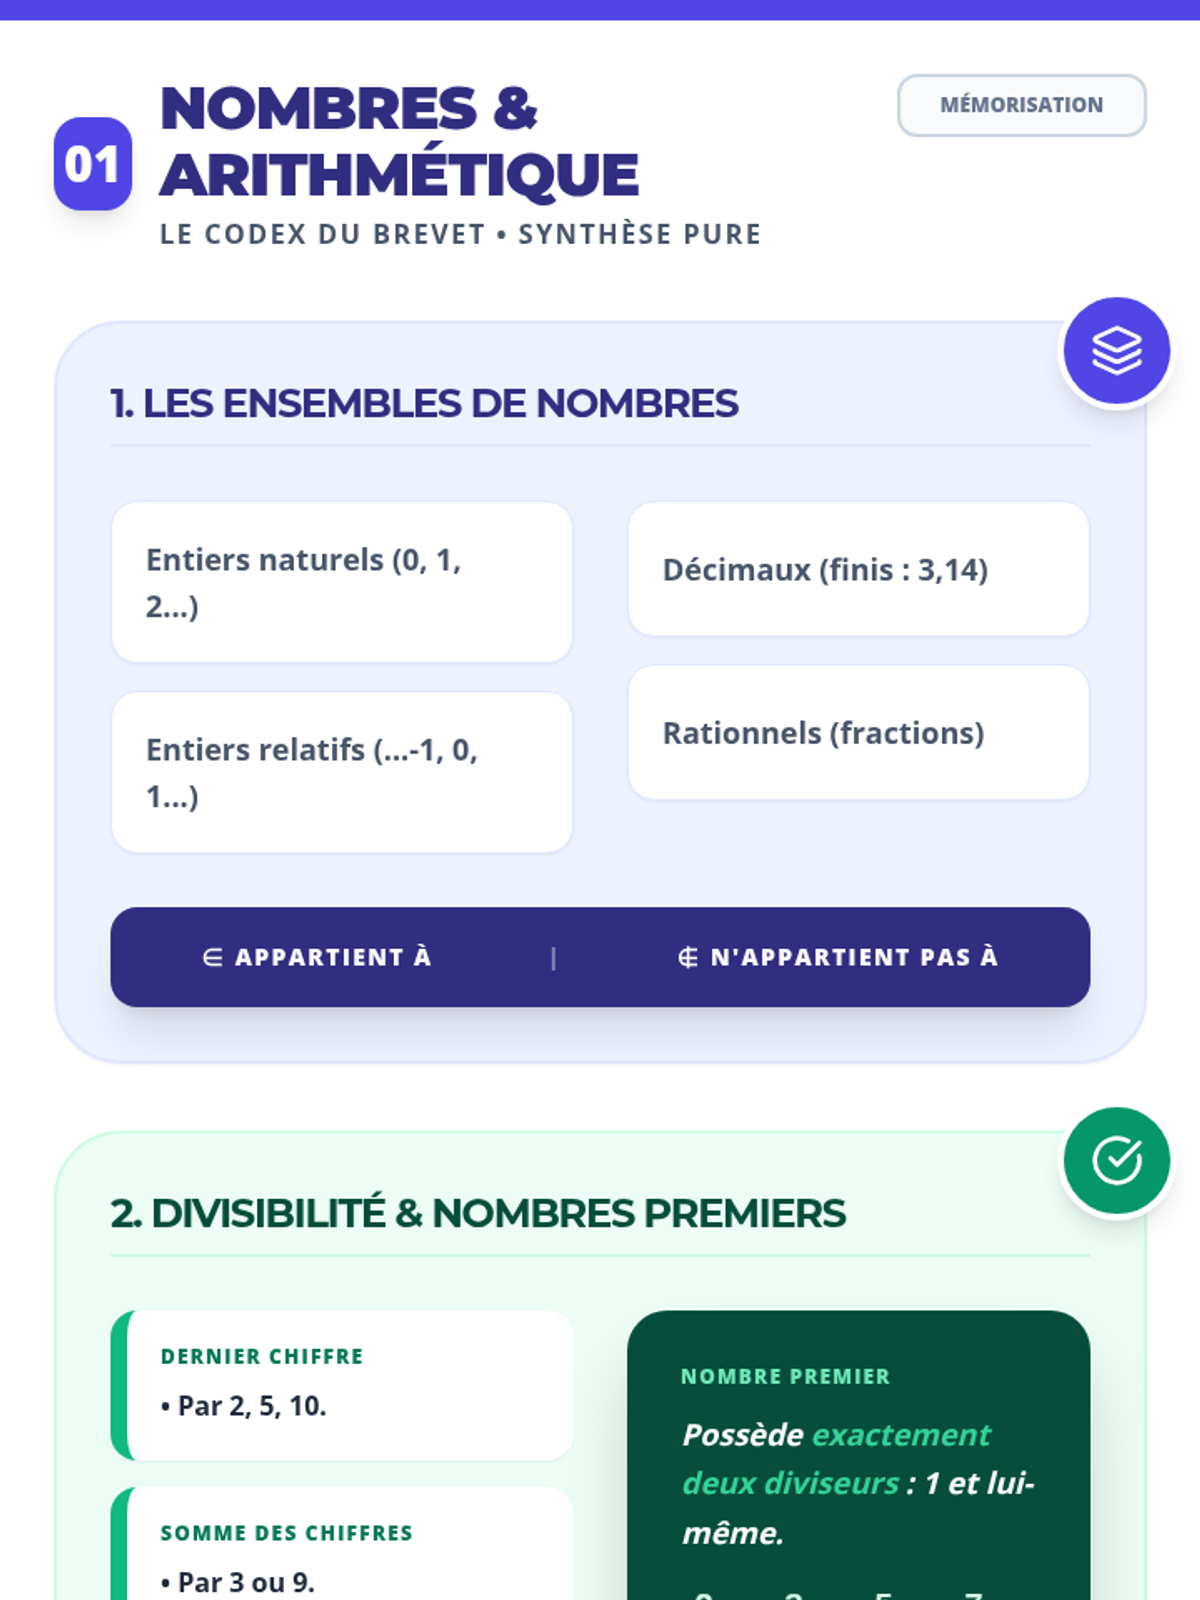
Fiche de révision 01 : Nombres et Arithmétique. Détaille l'algorithme d'Euclide et la méthode des différences pour le PGCD. Couvre les ensembles, la divisibilité et l'algorithmique. Synthèse pure. Correction des rendus de symboles et de la pagination.
Un diaporama ultra-complet et dynamique couvrant l'intégralité des 11 synthèses du programme de 3ème. La diapositive de conclusion inclut désormais la citation de Christian D. Larson. Fixation des affichages mathématiques et des espacements.
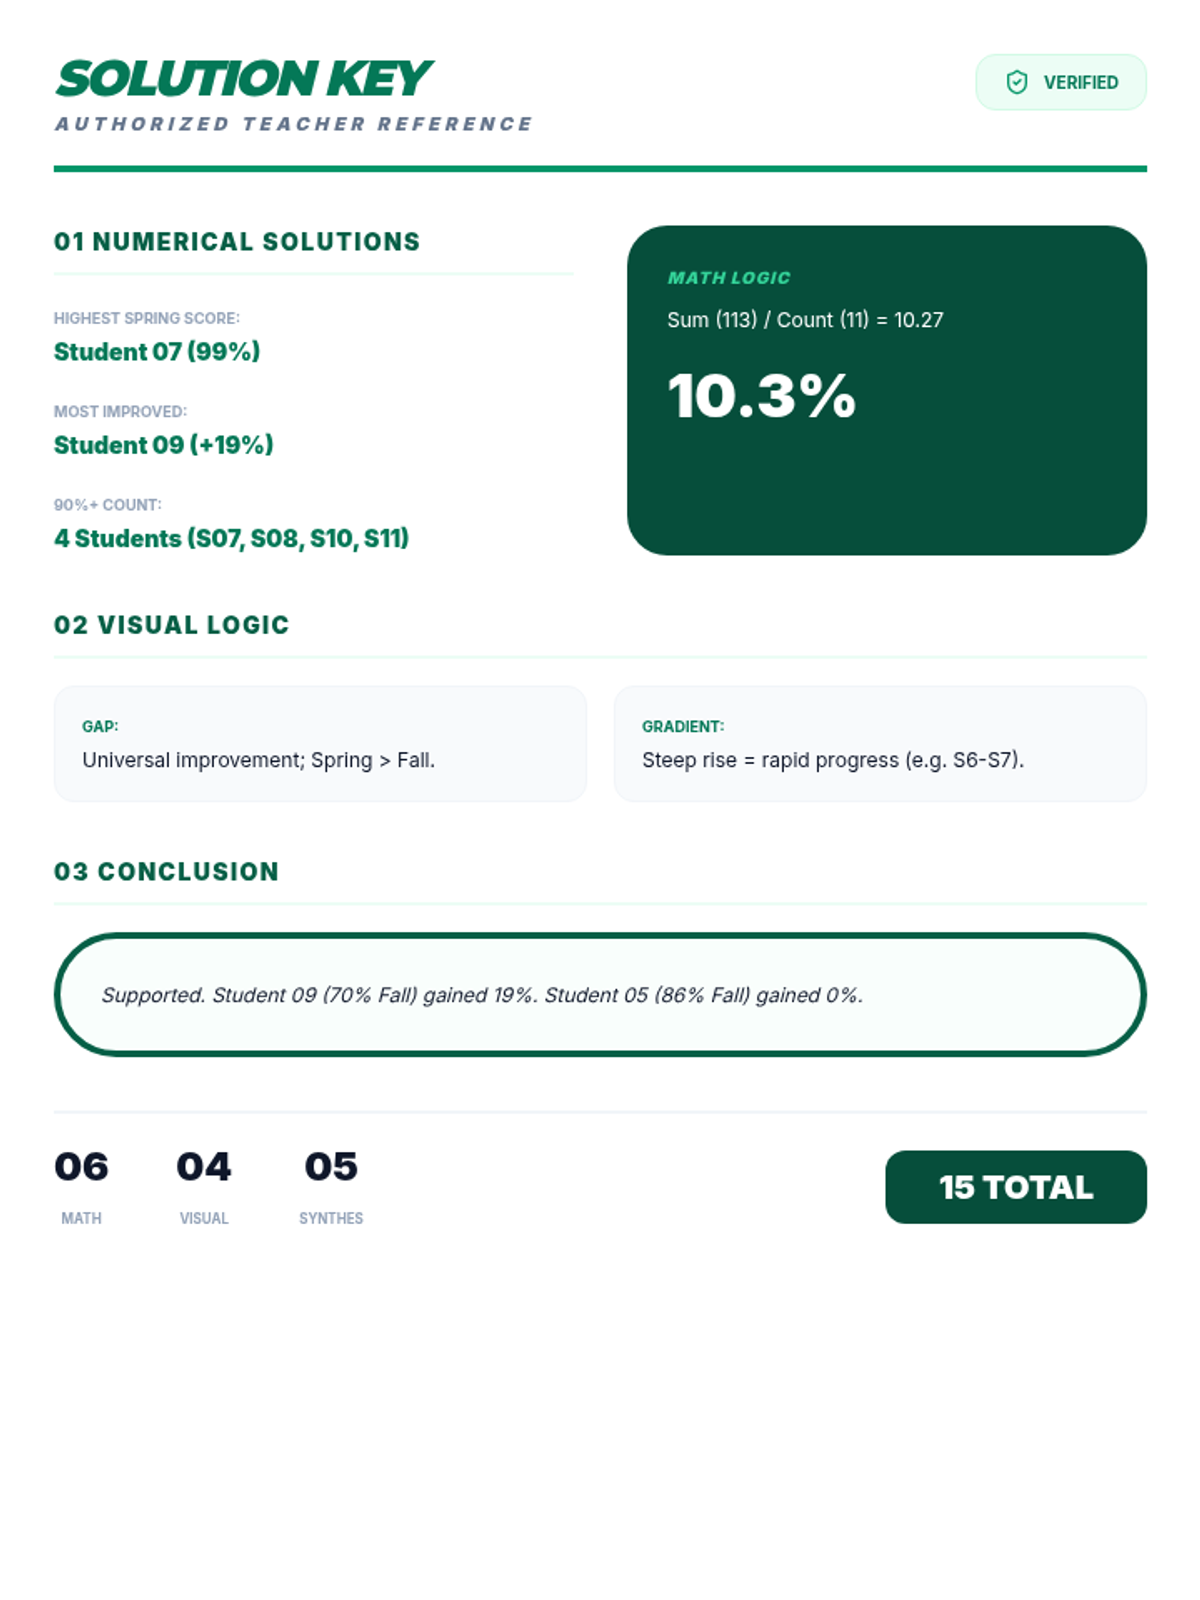
A teacher-facing answer key and scoring guide for the Growth Gauge Worksheet, providing model responses and calculation solutions.
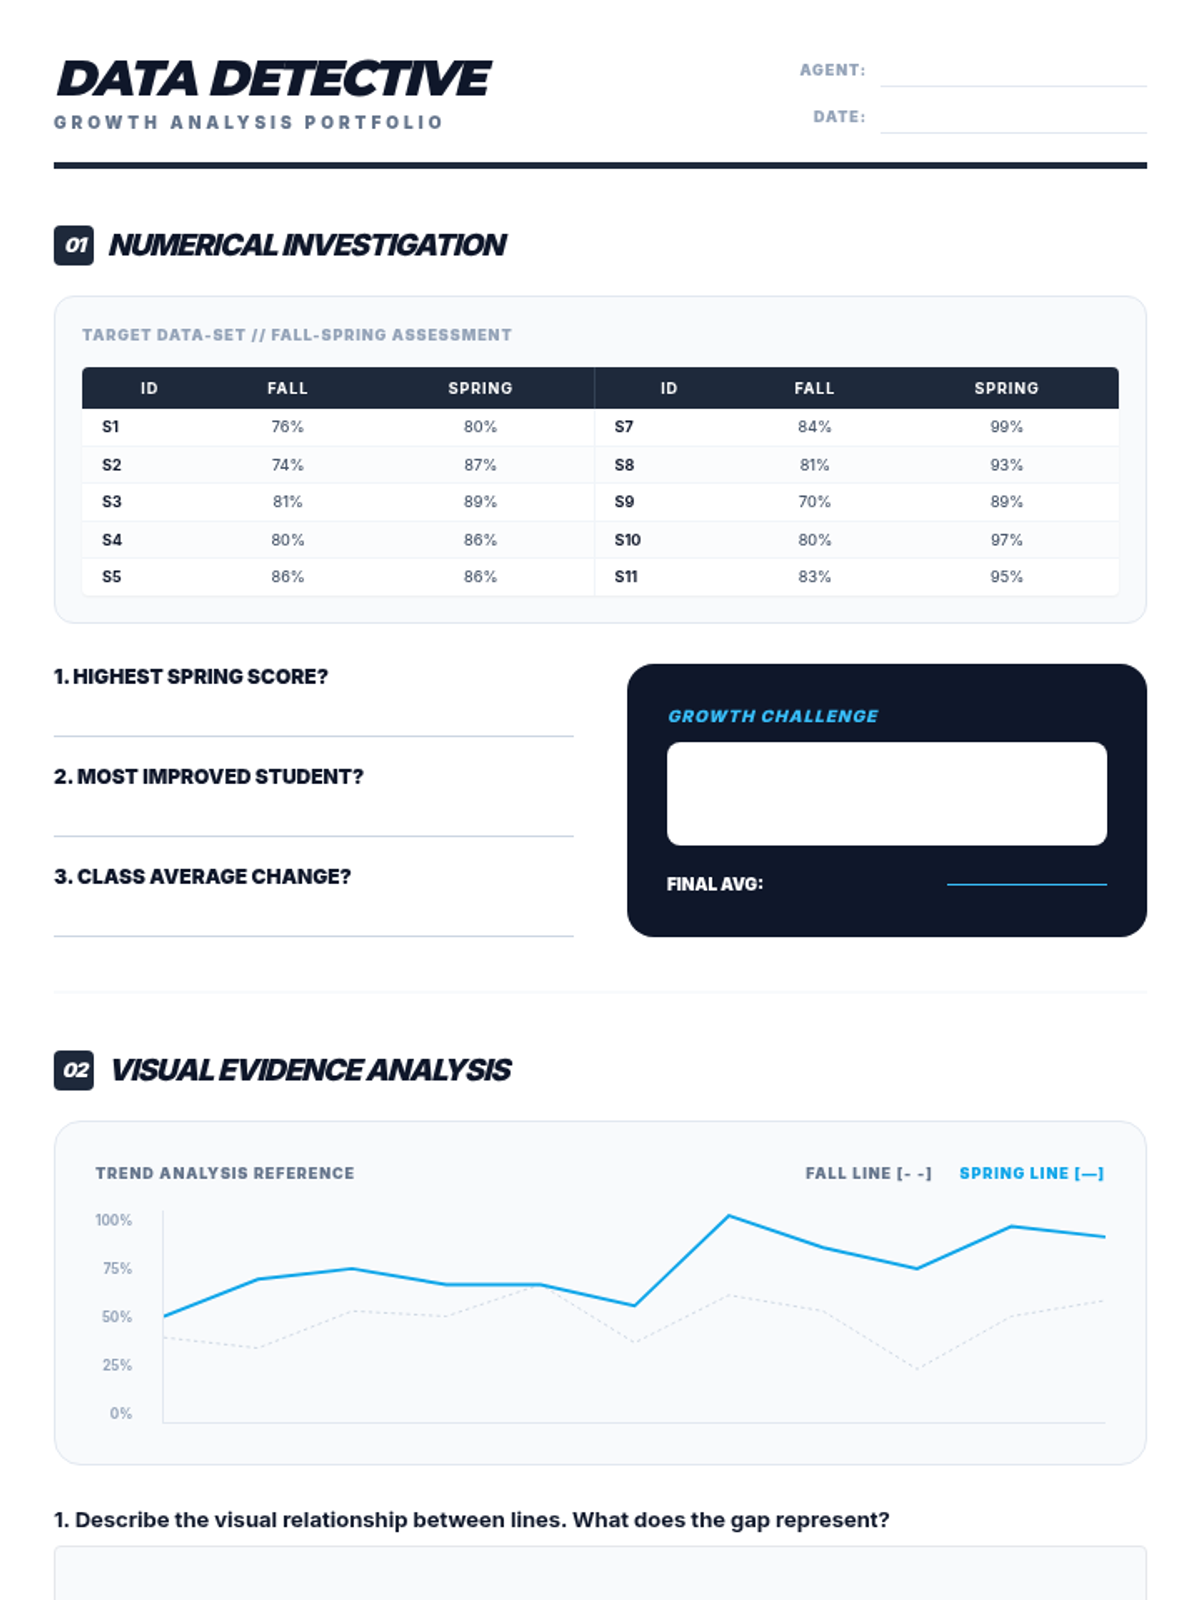
A student-facing worksheet designed to guide analysis of the performance data, including calculation challenges and interpretive questions.
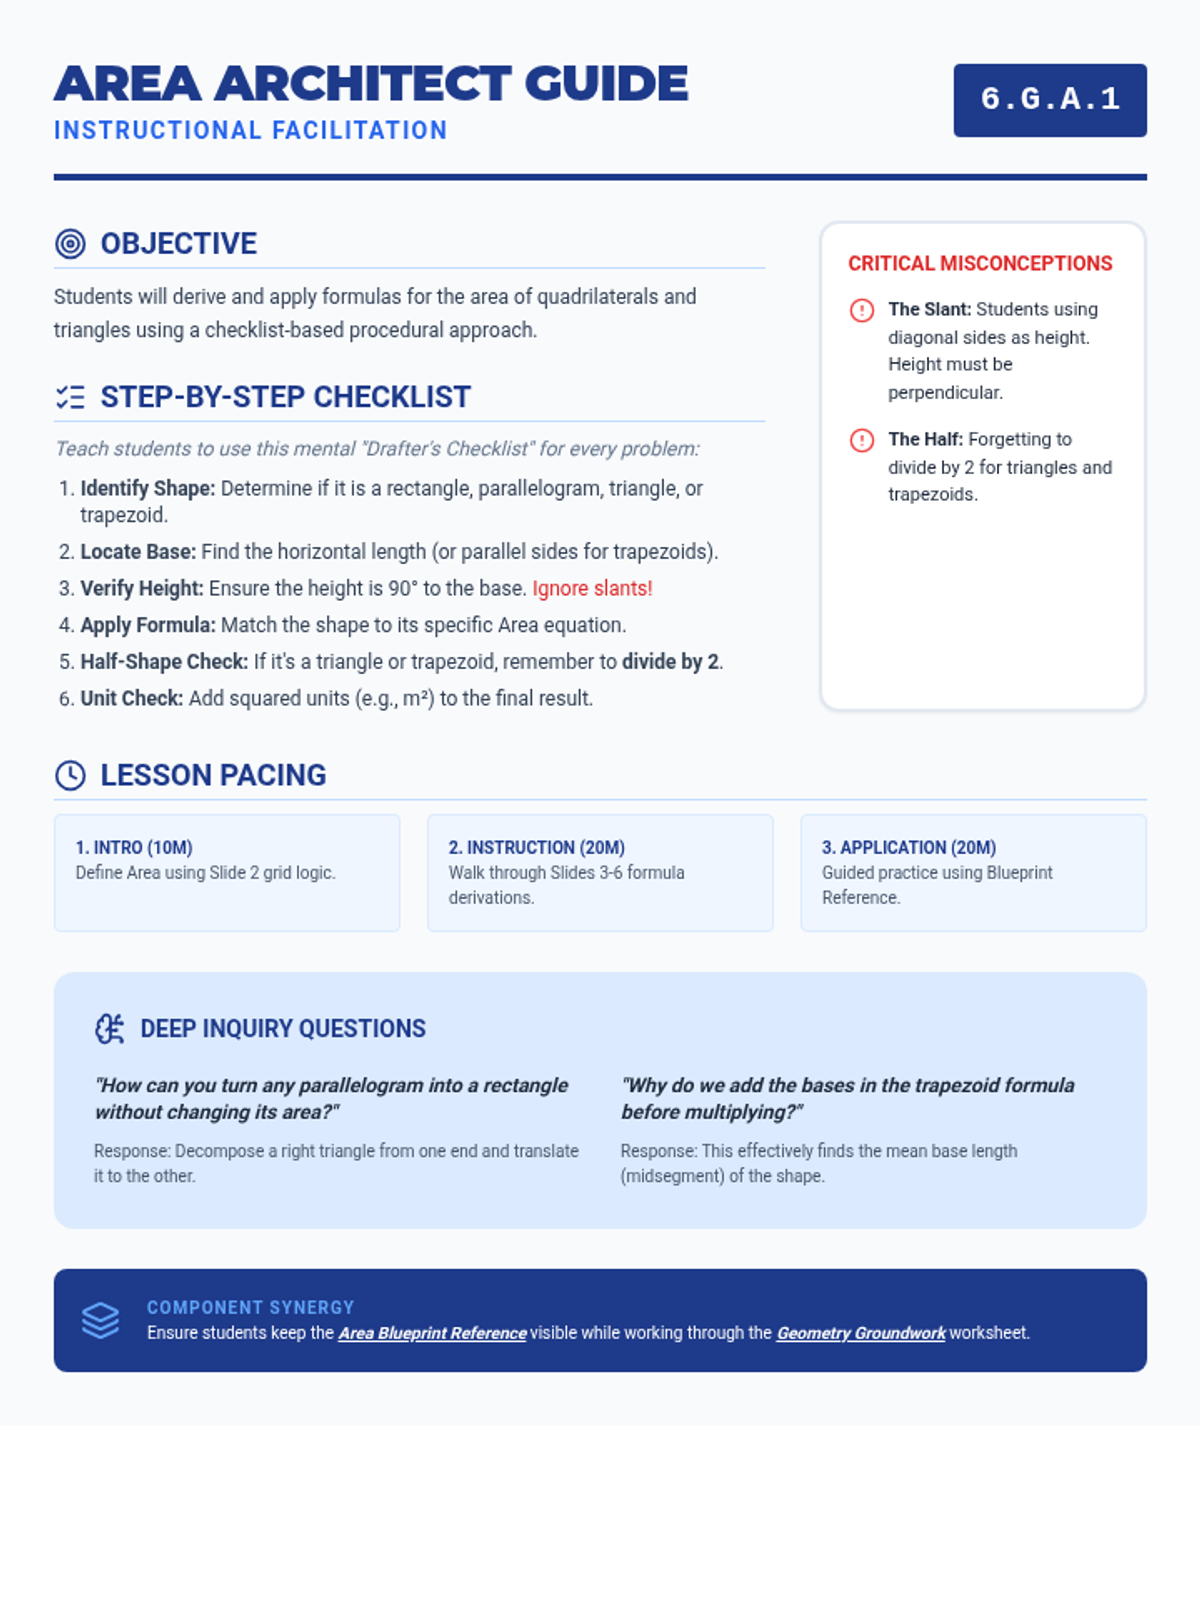
A teacher's facilitation guide with pacing, common misconceptions, and discussion questions to help deliver the Area Architect lesson.
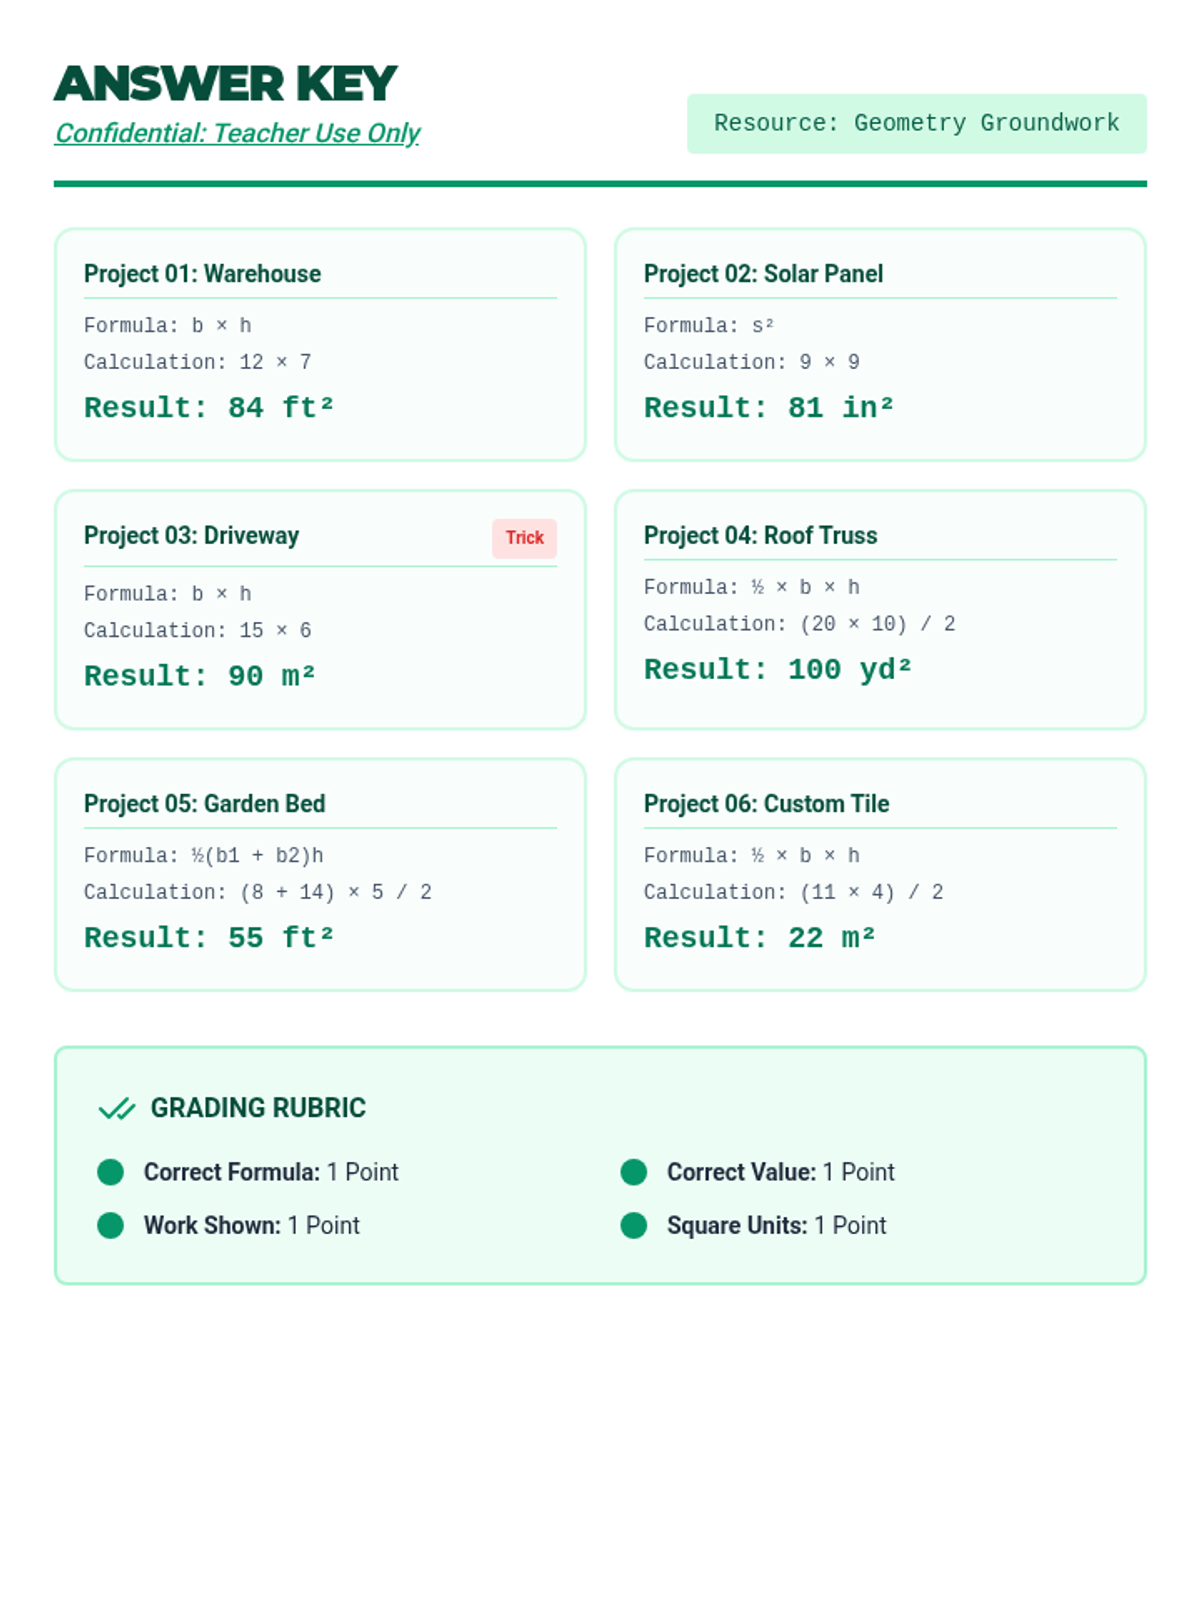
Complete answer key for the Geometry Groundwork Worksheet with step-by-step calculation breakdowns and a grading rubric.
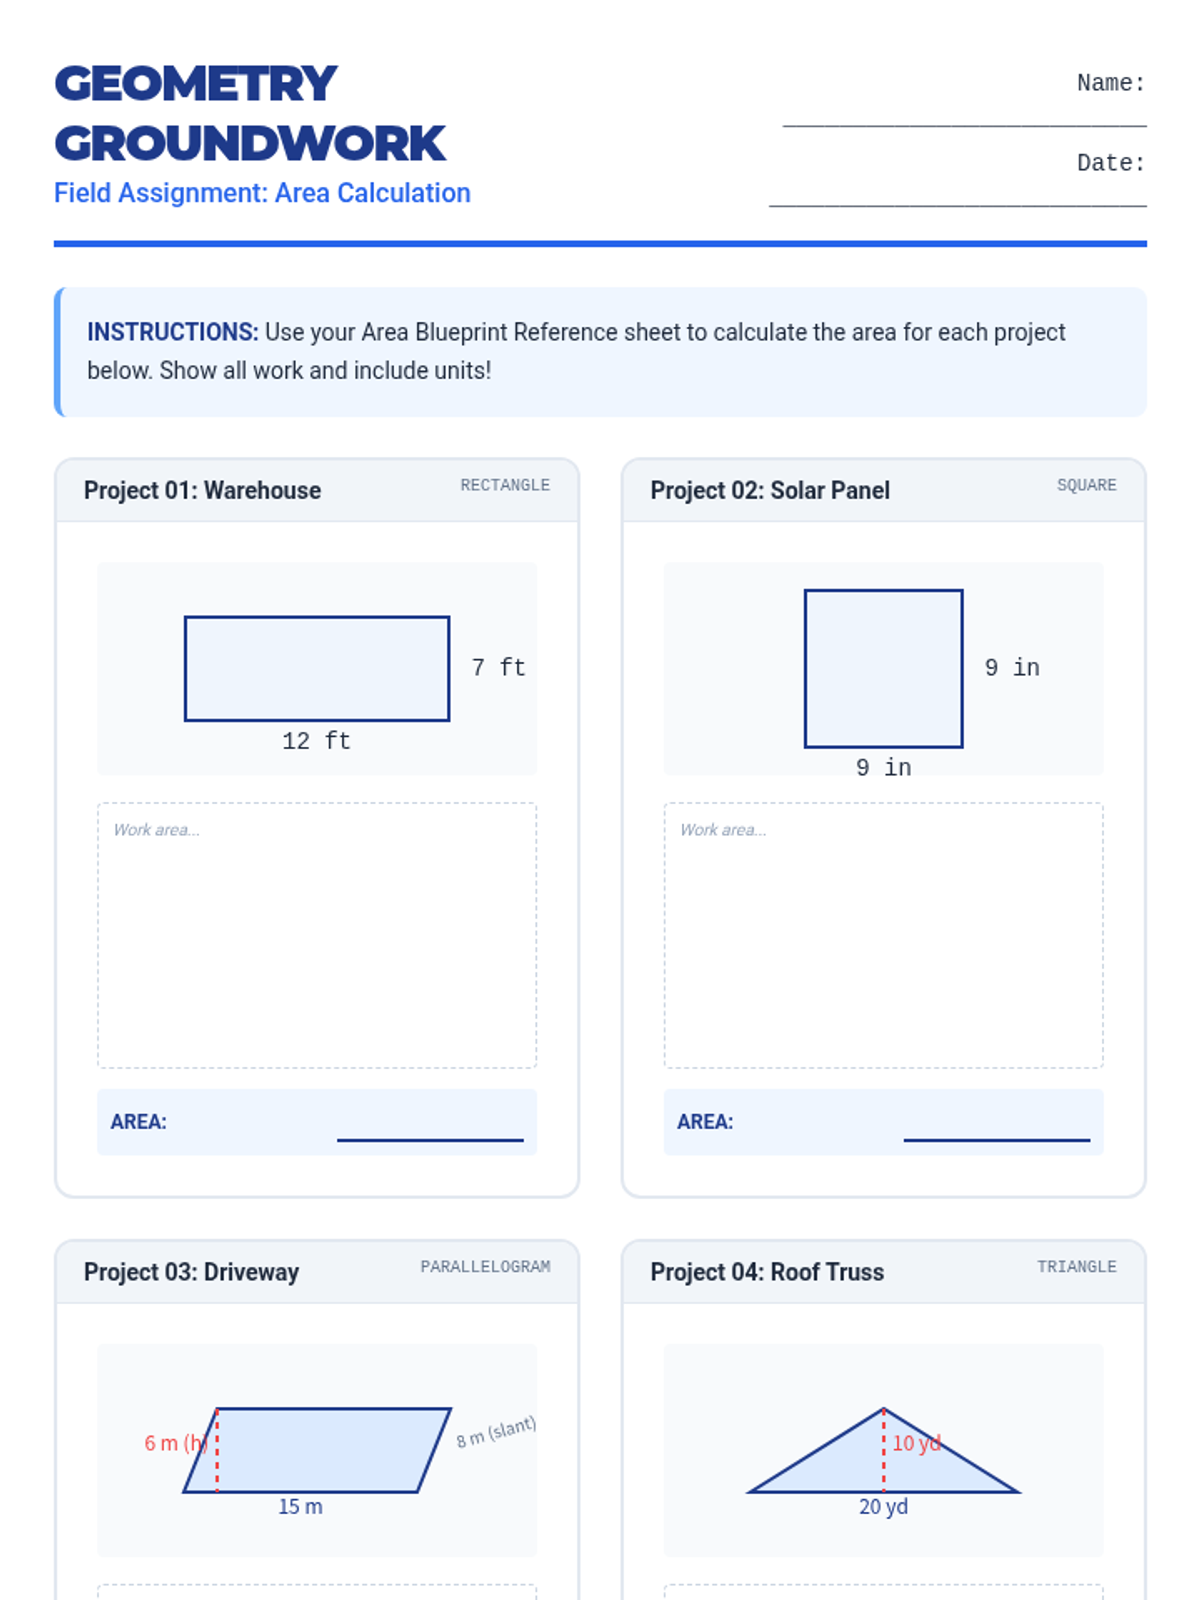
A practice worksheet where students apply area formulas to various real-world "blueprint" projects, with dedicated space for showing calculations.
A visual instructional slide deck with clear diagrams and step-by-step logic for calculating the area of squares, rectangles, parallelograms, triangles, and trapezoids.
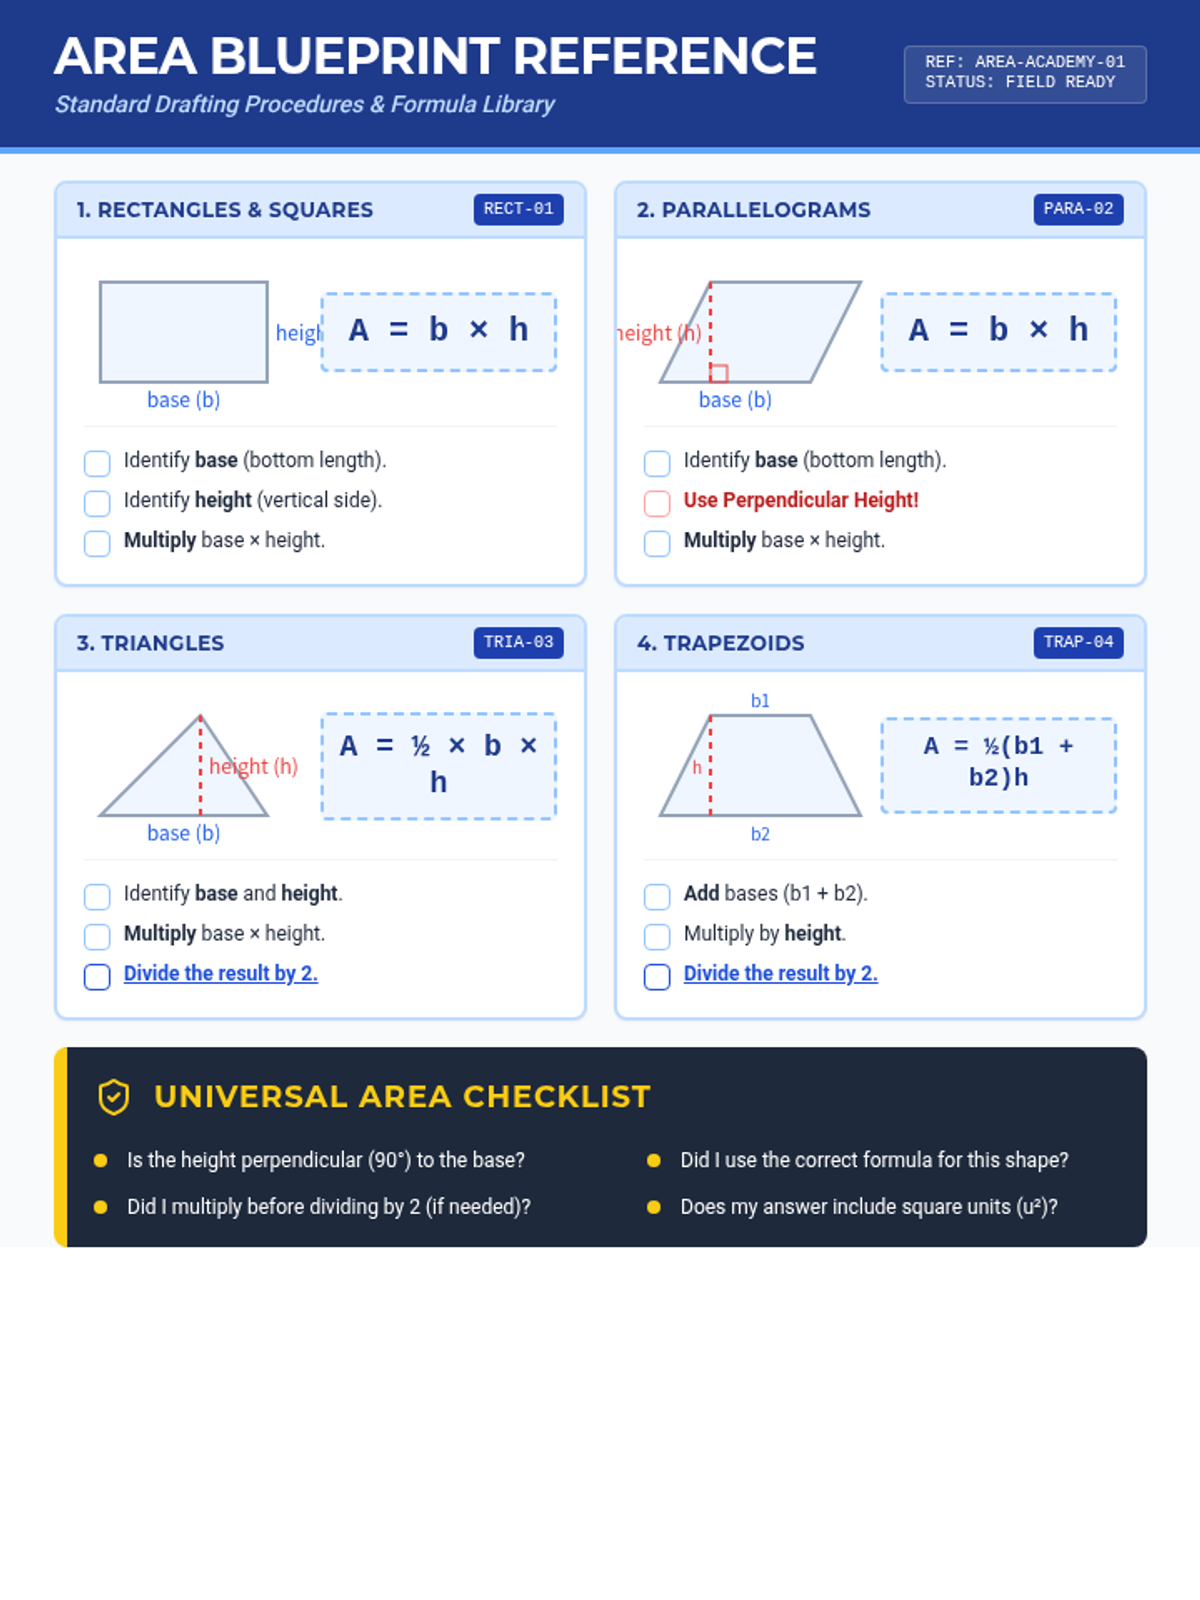
A student reference sheet featuring step-by-step checklists, formulas, and visual diagrams for calculating the area of rectangles, parallelograms, triangles, and trapezoids in a blueprint theme.
Final Executive Career Portfolio Handout. Professional summary document for students to synthesize their math evidence into a final career pitch. Features kid-friendly terminology ('Evidence Log', 'Calculation Summary'), high-contrast work areas, and a structured executive brief layout for the 2-hour final block. Improved font sizes and larger explanation boxes for better student usability. Consolidated to a more efficient layout to prevent page breaks. Header icons standardized. Cover page label legibility improved. Main background set to white for proper printer margins. Removed rigid height constraints to prevent fragmentation. Signature box enlarged. Header spacing corrected. Standardized to 'Executive Pitch Portfolio'.
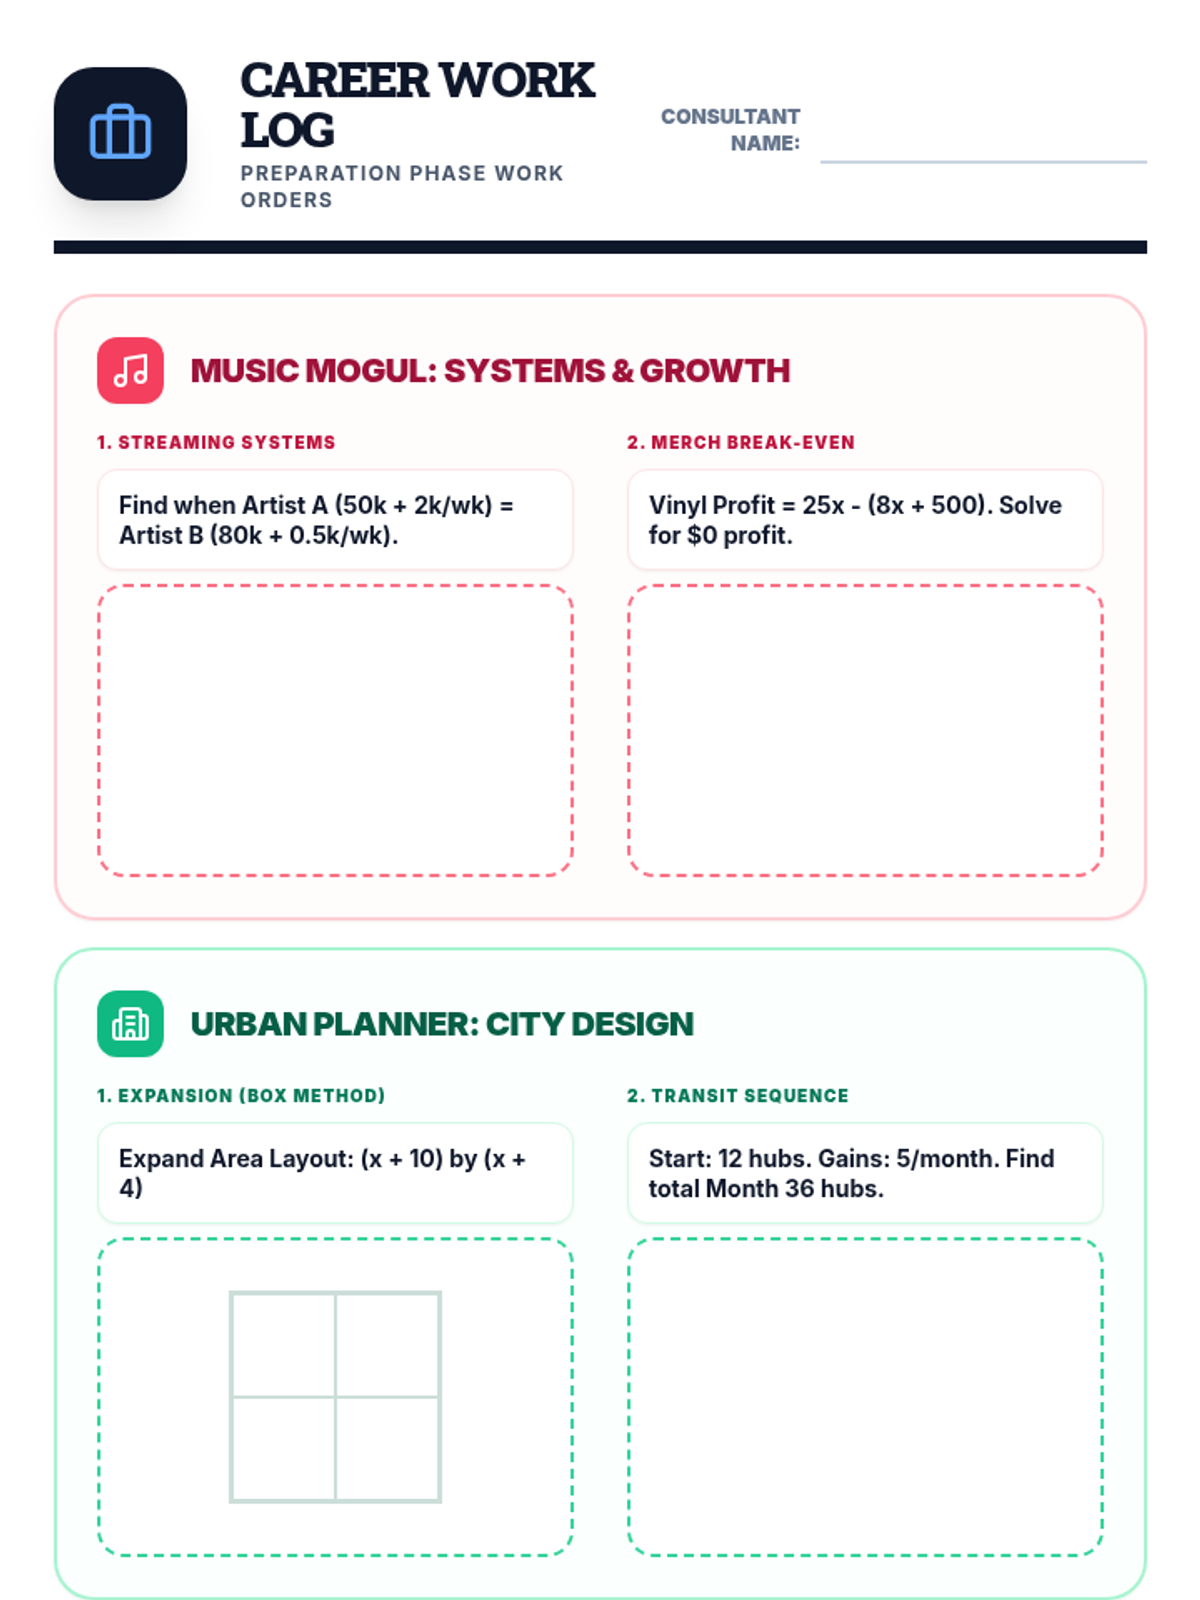
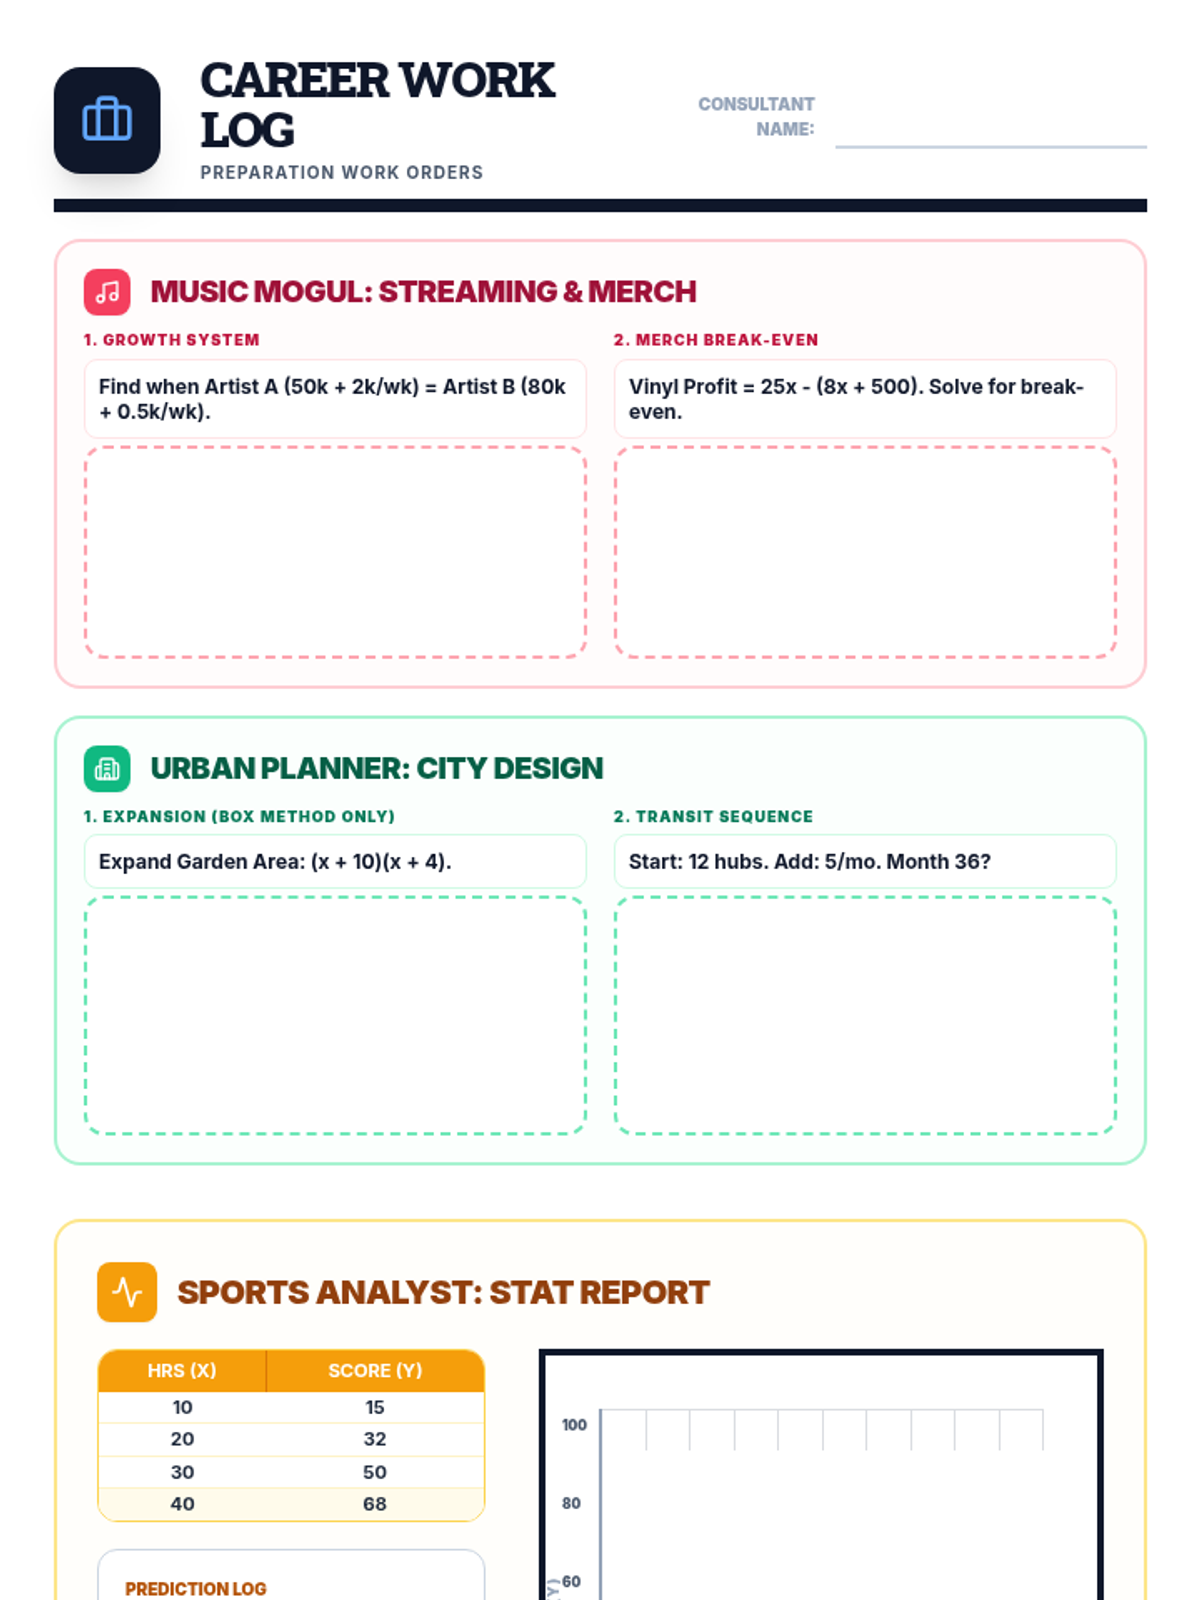
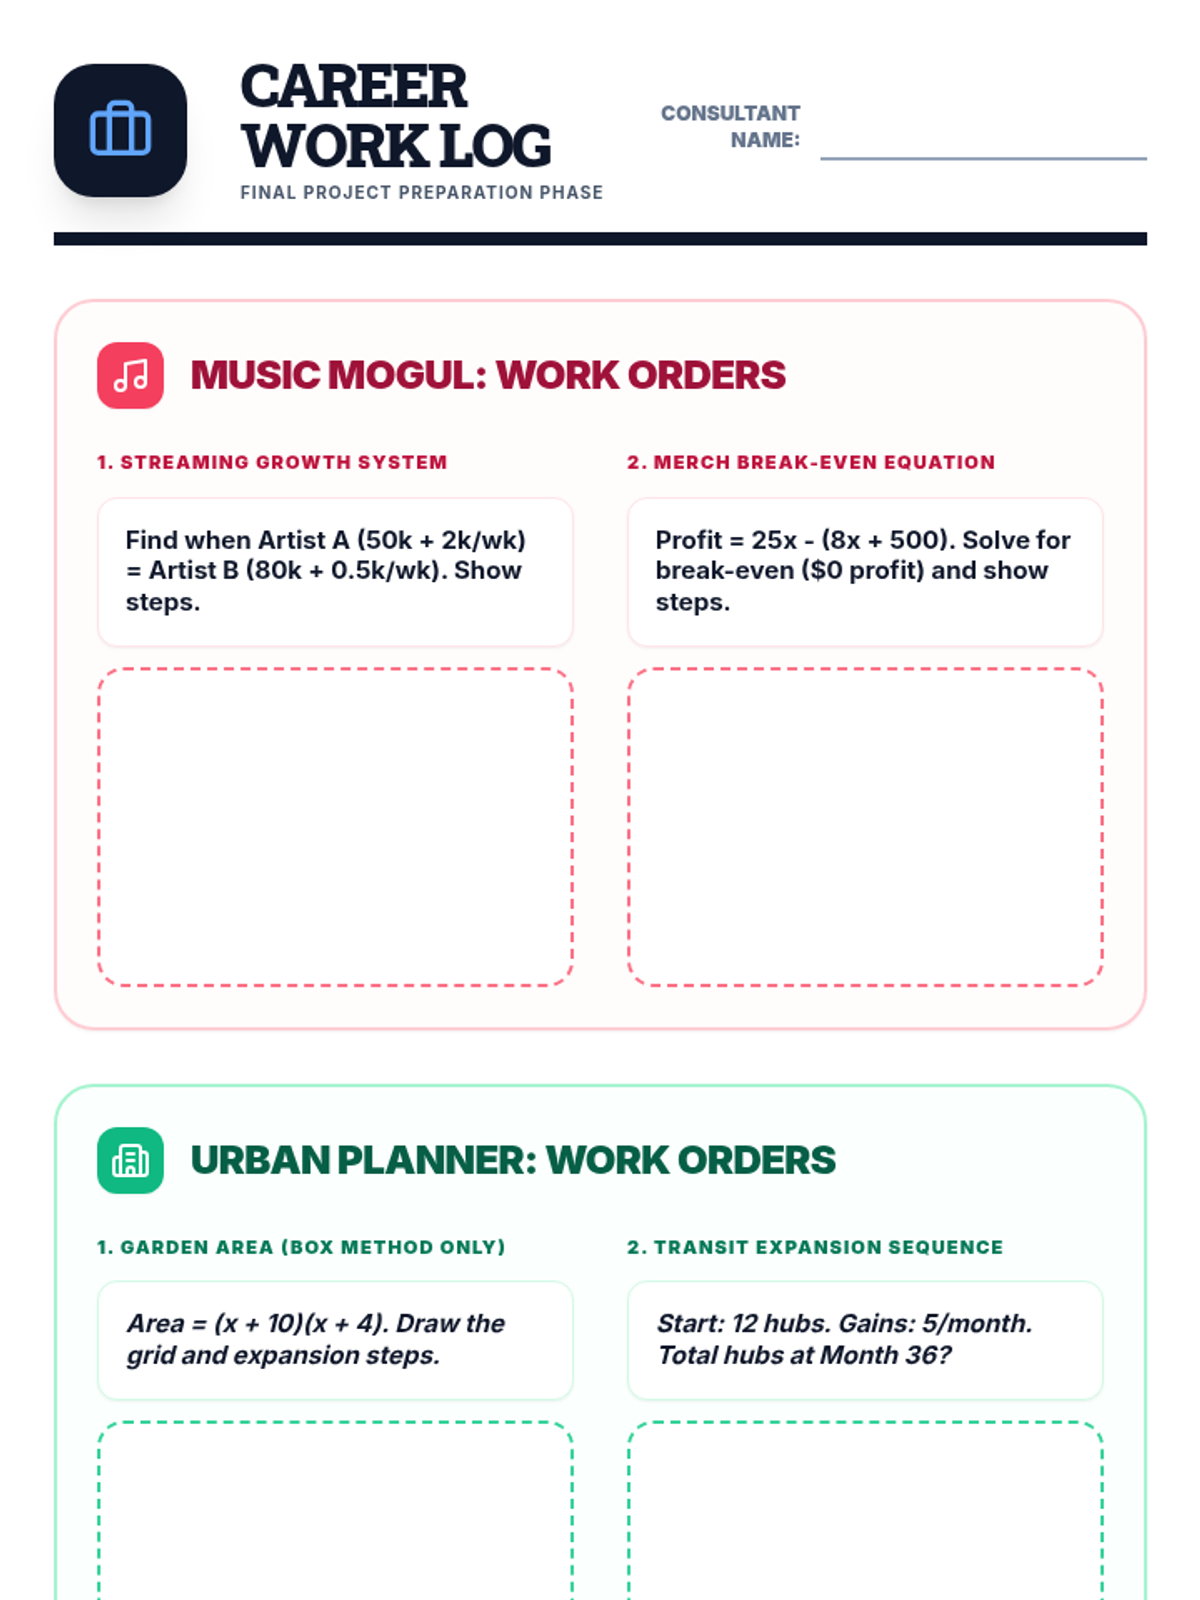
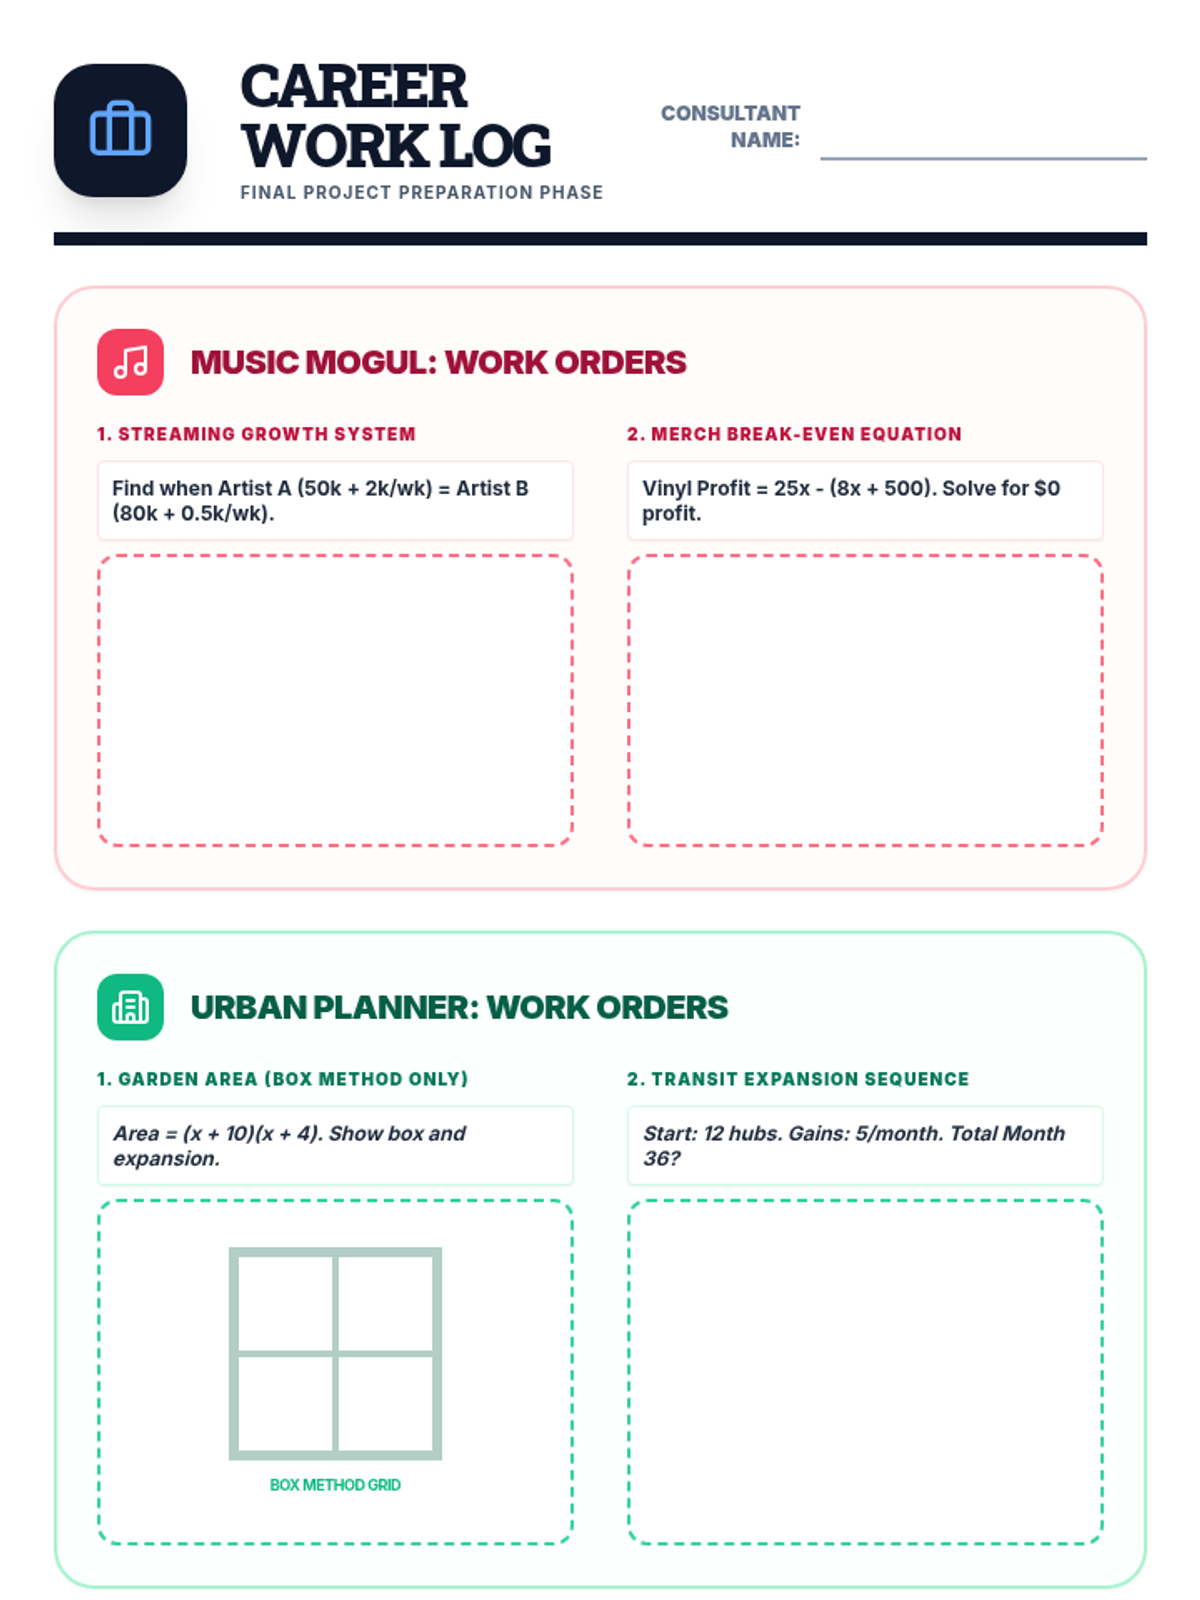
Revised Career Mission Log with large, dedicated work areas for the three professional paths. Each task is framed as a professional work order requiring the math skills learned in class (Systems, Polynomials, Sequences, and Data Analysis). Optimized for a 2-page layout with high-contrast text and corrected graph alignment. Prompts were enlarged for better readability. Y-axis labels fixed using standard rotation. Scatter plot grid spans full height. consolidated to 2 pages exactly. Vertical axis rotation fixed for legibility.
Revised Career Mission Log with large, dedicated work areas for the three professional paths. Each task is framed as a professional work order requiring the math skills learned in class (Systems, Polynomials, Sequences, and Data Analysis). Optimized for a 2-page layout with high-contrast text and corrected graph alignment. All placeholder text contrast improved for printing. Prompts were enlarged for better readability. Y-axis labels and header spacing fixed. Larger work areas for all phases. Fixed vertical text rotation. Consolidated to 2 pages exactly.
Final Career Pitch Portfolio Handout. Professional summary document for students to synthesize their math evidence into a final career pitch. Features kid-friendly terminology ('Evidence Log', 'Calculation Summary'), high-contrast work areas, and a structured executive brief layout for the 2-hour final block. Improved font sizes and larger explanation boxes for better student usability. Consolidated to a more efficient layout to prevent page breaks. Header icons standardized. Cover page label legibility improved. Main background set to white for proper printer margins. Removed rigid height constraints to prevent fragmentation. Signature box enlarged. Header spacing corrected. Standardized to 'Executive Pitch Portfolio'.
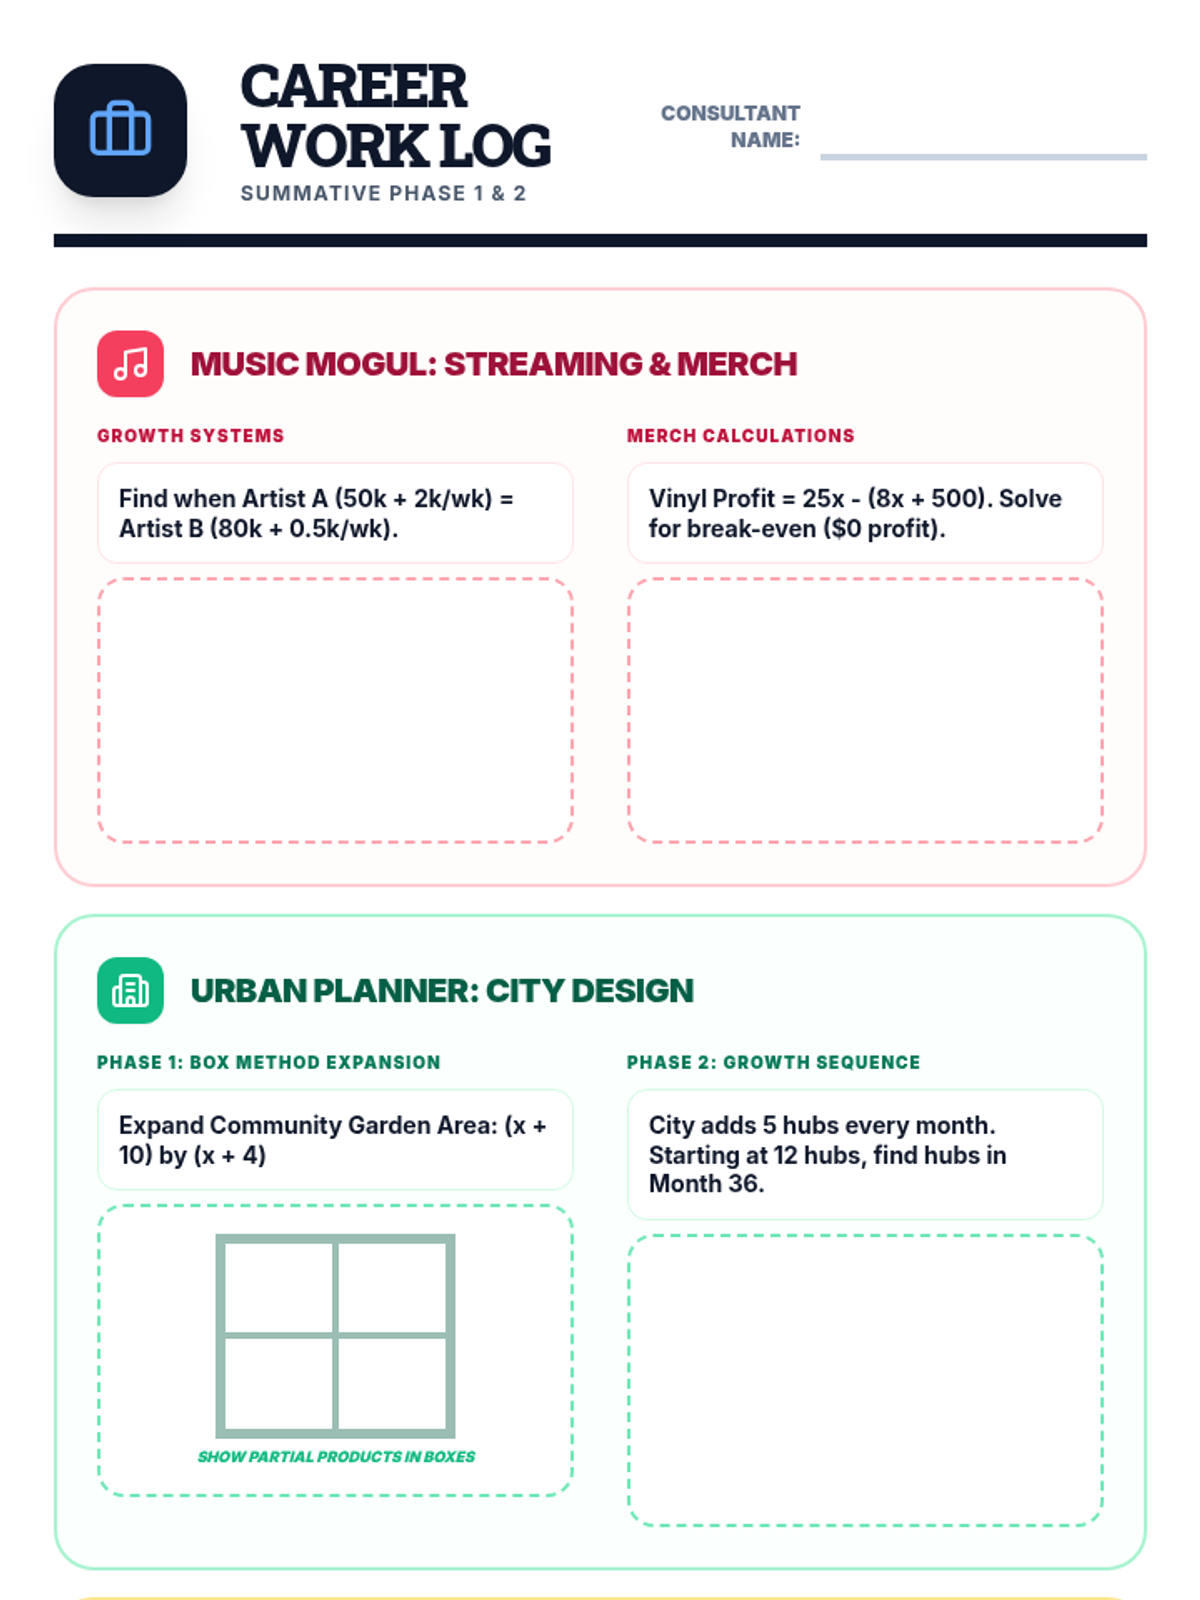
Revised Career Mission Log with large, dedicated work areas for the three professional paths. Each task is framed as a professional work order requiring the math skills learned in class (Systems, Polynomials, Sequences, and Data Analysis). Optimized for a 2-page layout with high-contrast text and corrected graph alignment. Prompts were enlarged for better readability. Y-axis labels fixed using standard rotation. Scatter plot grid spans full height. consolidated to 2 pages.
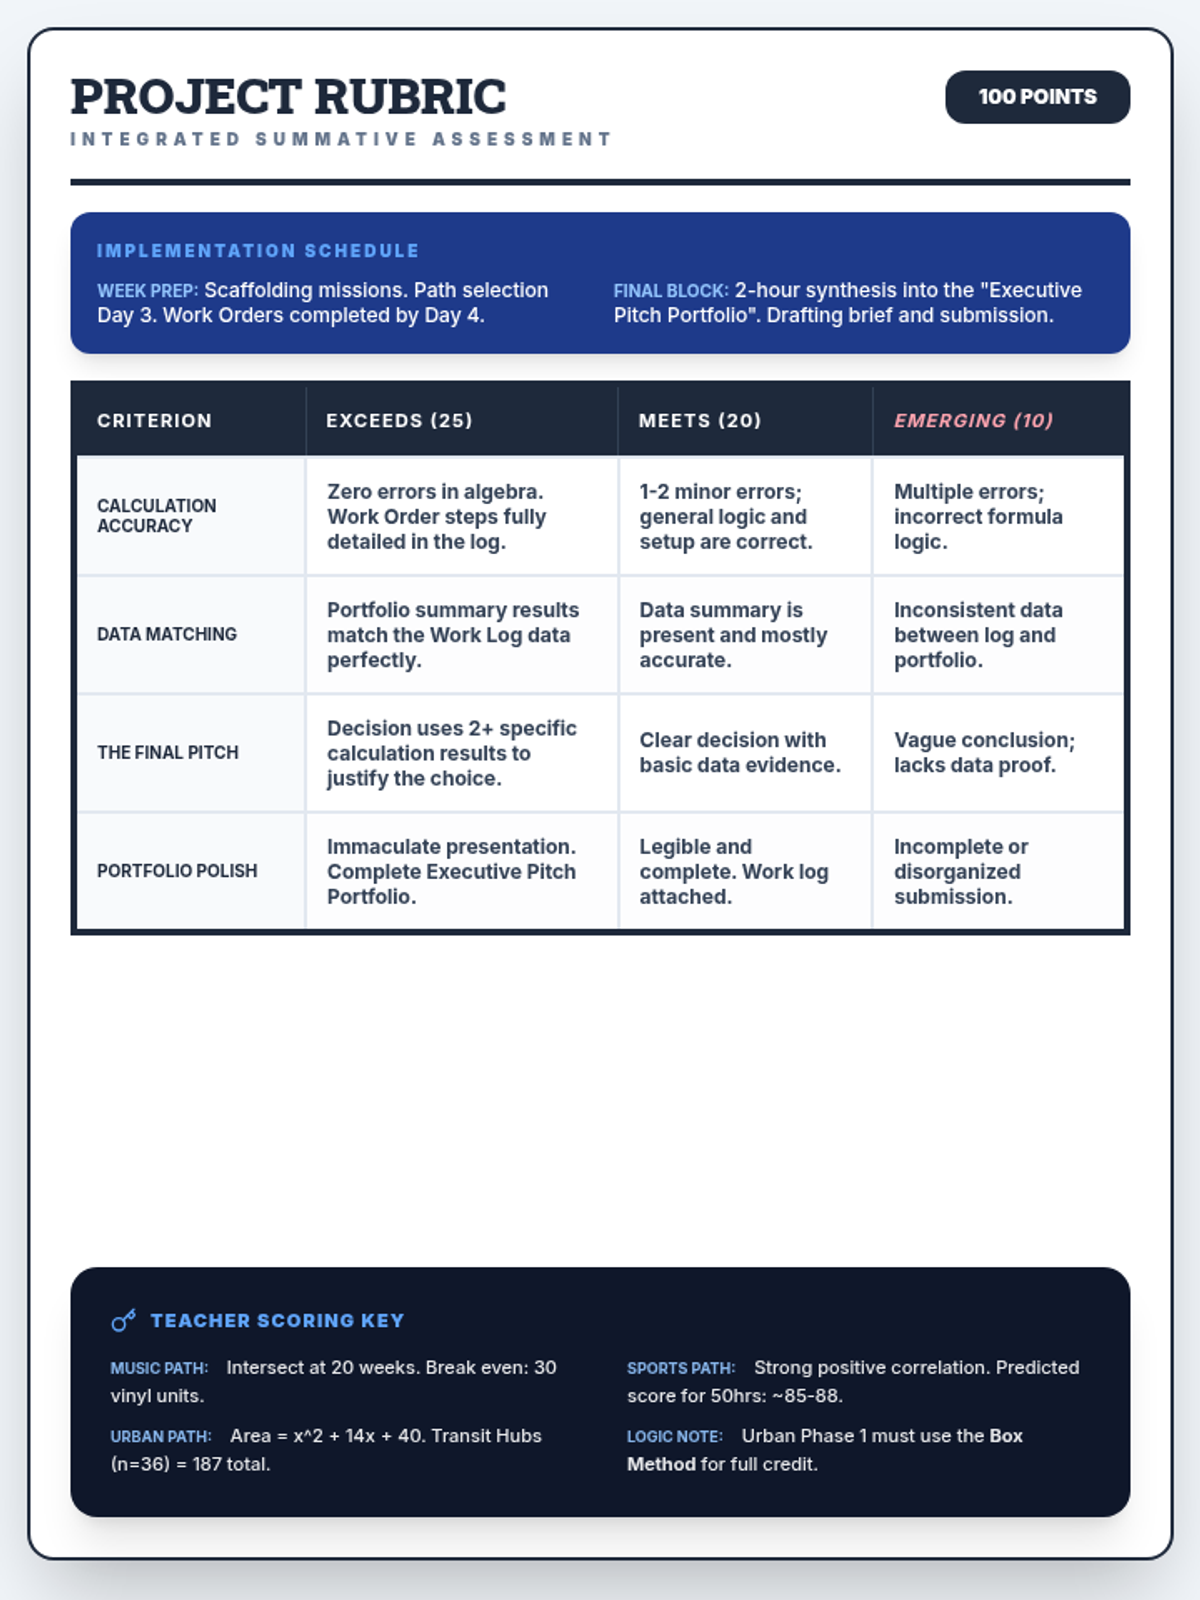
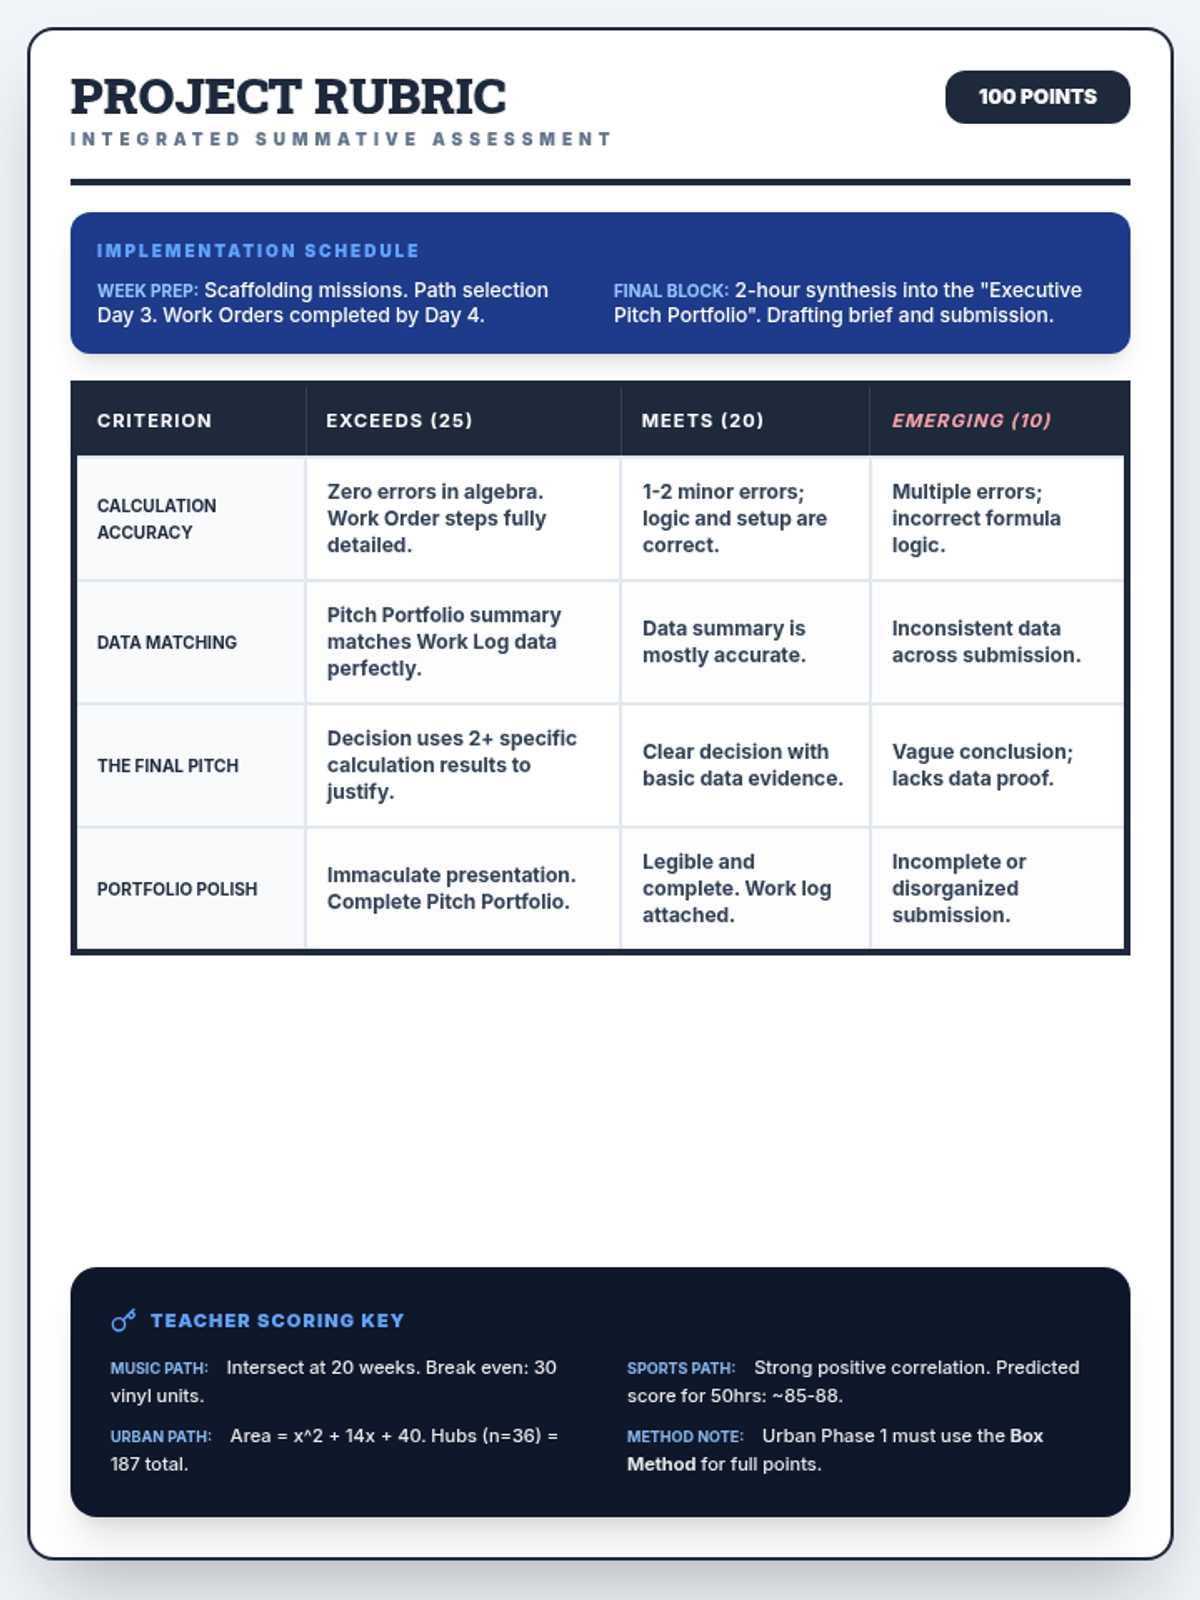
Revised Teacher Rubric updated with kid-friendly language. 'Math Accuracy' is now 'Calculation Accuracy', 'Proof Synthesis' is 'Data Matching', and 'Executive Brief' is 'The Final Pitch'. Maintains a clean one-page layout. Updated to explicitly reference the Box Method for the Urban Planner path. Naming standardized to 'Executive Pitch Portfolio'.
Final Executive Career Portfolio Handout. Professional summary document for students to synthesize their math evidence into a final career pitch. Features kid-friendly terminology ('Evidence Log', 'Calculation Summary'), high-contrast work areas, and a structured executive brief layout for the 2-hour final block. Improved font sizes and larger explanation boxes for better student usability. Consolidated to a more efficient layout to prevent page breaks. Header icons standardized. Cover page label legibility improved. Main background set to white for proper printer margins. Removed rigid height constraints to prevent fragmentation.
Revised Career Mission Log with large, dedicated work areas for the three professional paths. Each task is framed as a professional work order requiring the math skills learned in class (Systems, Polynomials, Sequences, and Data Analysis). Optimized for a 2-page layout with high-contrast text and corrected graph alignment. All placeholder text contrast improved for printing. Prompts were enlarged for better readability. Y-axis labels and header spacing fixed. Larger work areas for all phases. Fixed vertical text rotation.
Final Career Pitch Portfolio Handout. Professional summary document for students to synthesize their math evidence into a final career pitch. Features kid-friendly terminology ('Evidence Log', 'Calculation Summary'), high-contrast work areas, and a structured executive brief layout for the 2-hour final block. Improved font sizes and larger explanation boxes for better student usability. Consolidated to a more efficient layout to prevent page breaks. Fixed fixed height issues causing rendering errors. Signature box enlarged. Header spacing corrected. Header icons standardized. Cover page label legibility improved. Main background set to white for proper printer margins. Removed rigid height constraints to prevent fragmentation.
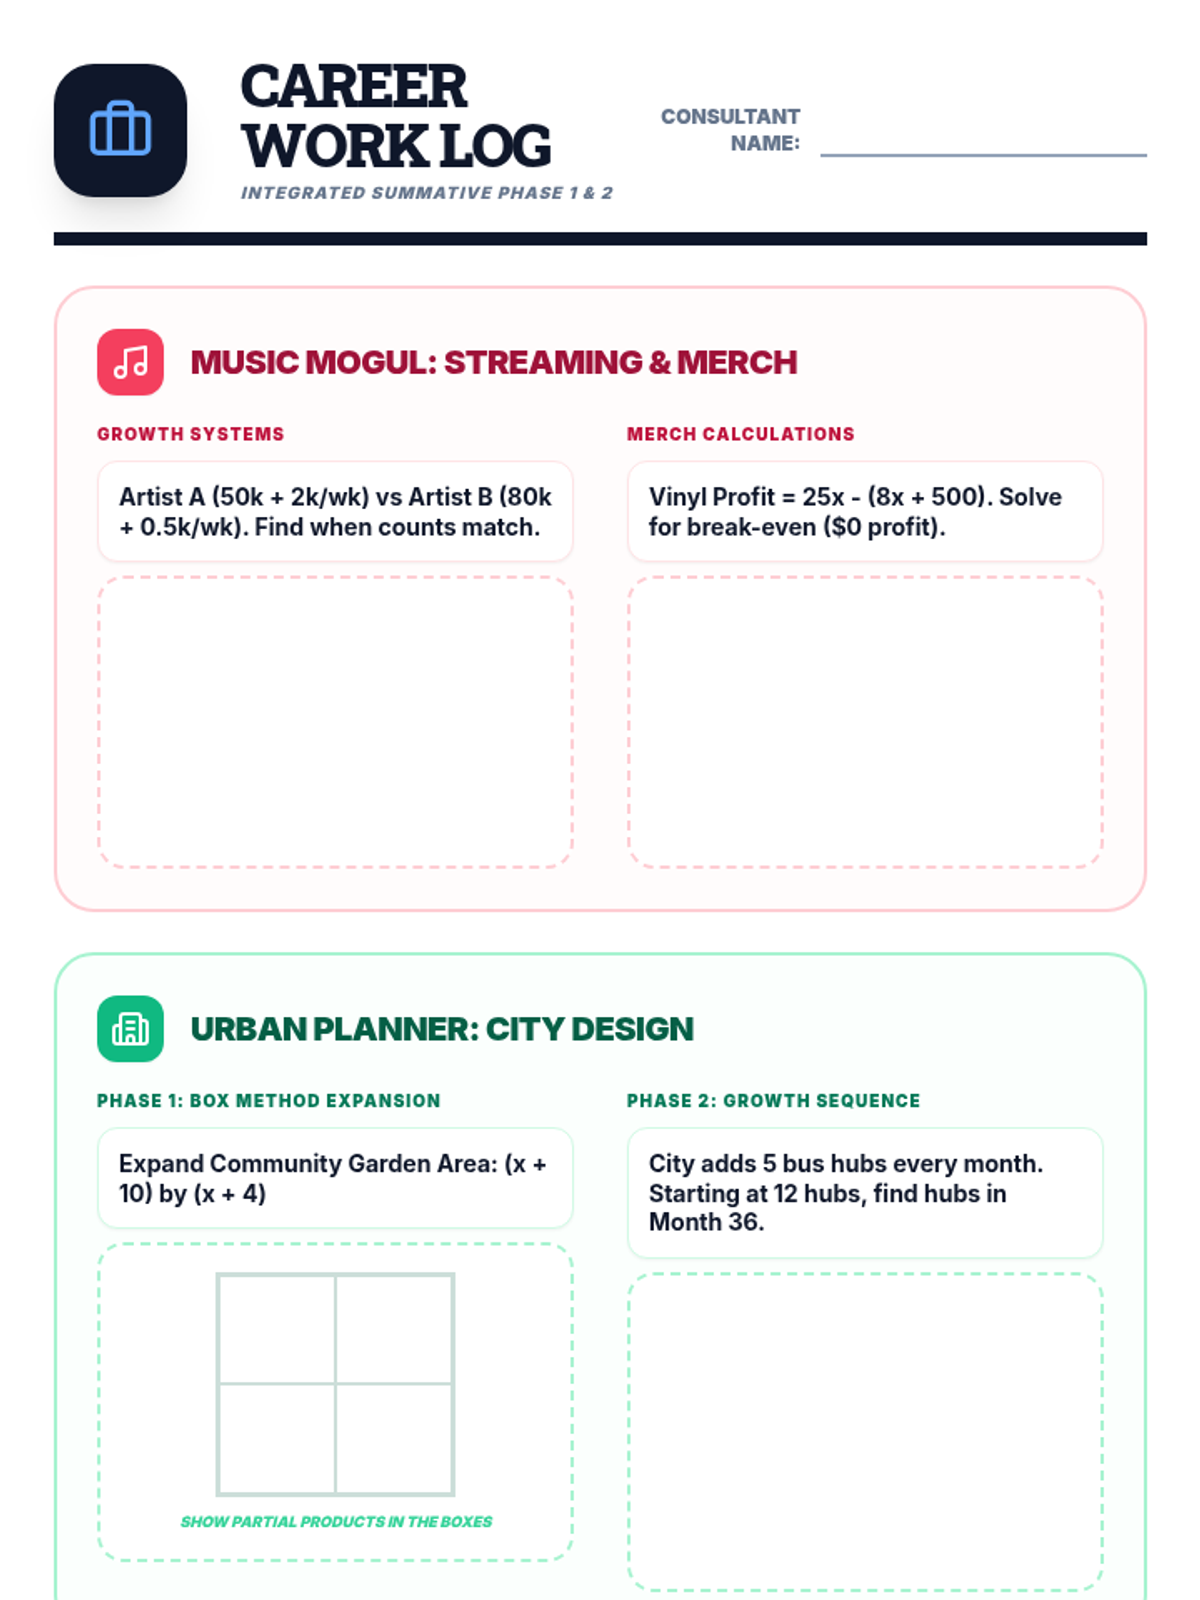
Revised Career Mission Log with large, dedicated work areas for the three professional paths. Each task is framed as a professional work order requiring the math skills learned in class (Systems, Polynomials, Sequences, and Data Analysis). Optimized for a 2-page layout with high-contrast text and corrected graph alignment. All placeholder text contrast improved for printing. Prompts were enlarged for better readability. Y-axis labels and header spacing fixed. Larger work areas for all phases.
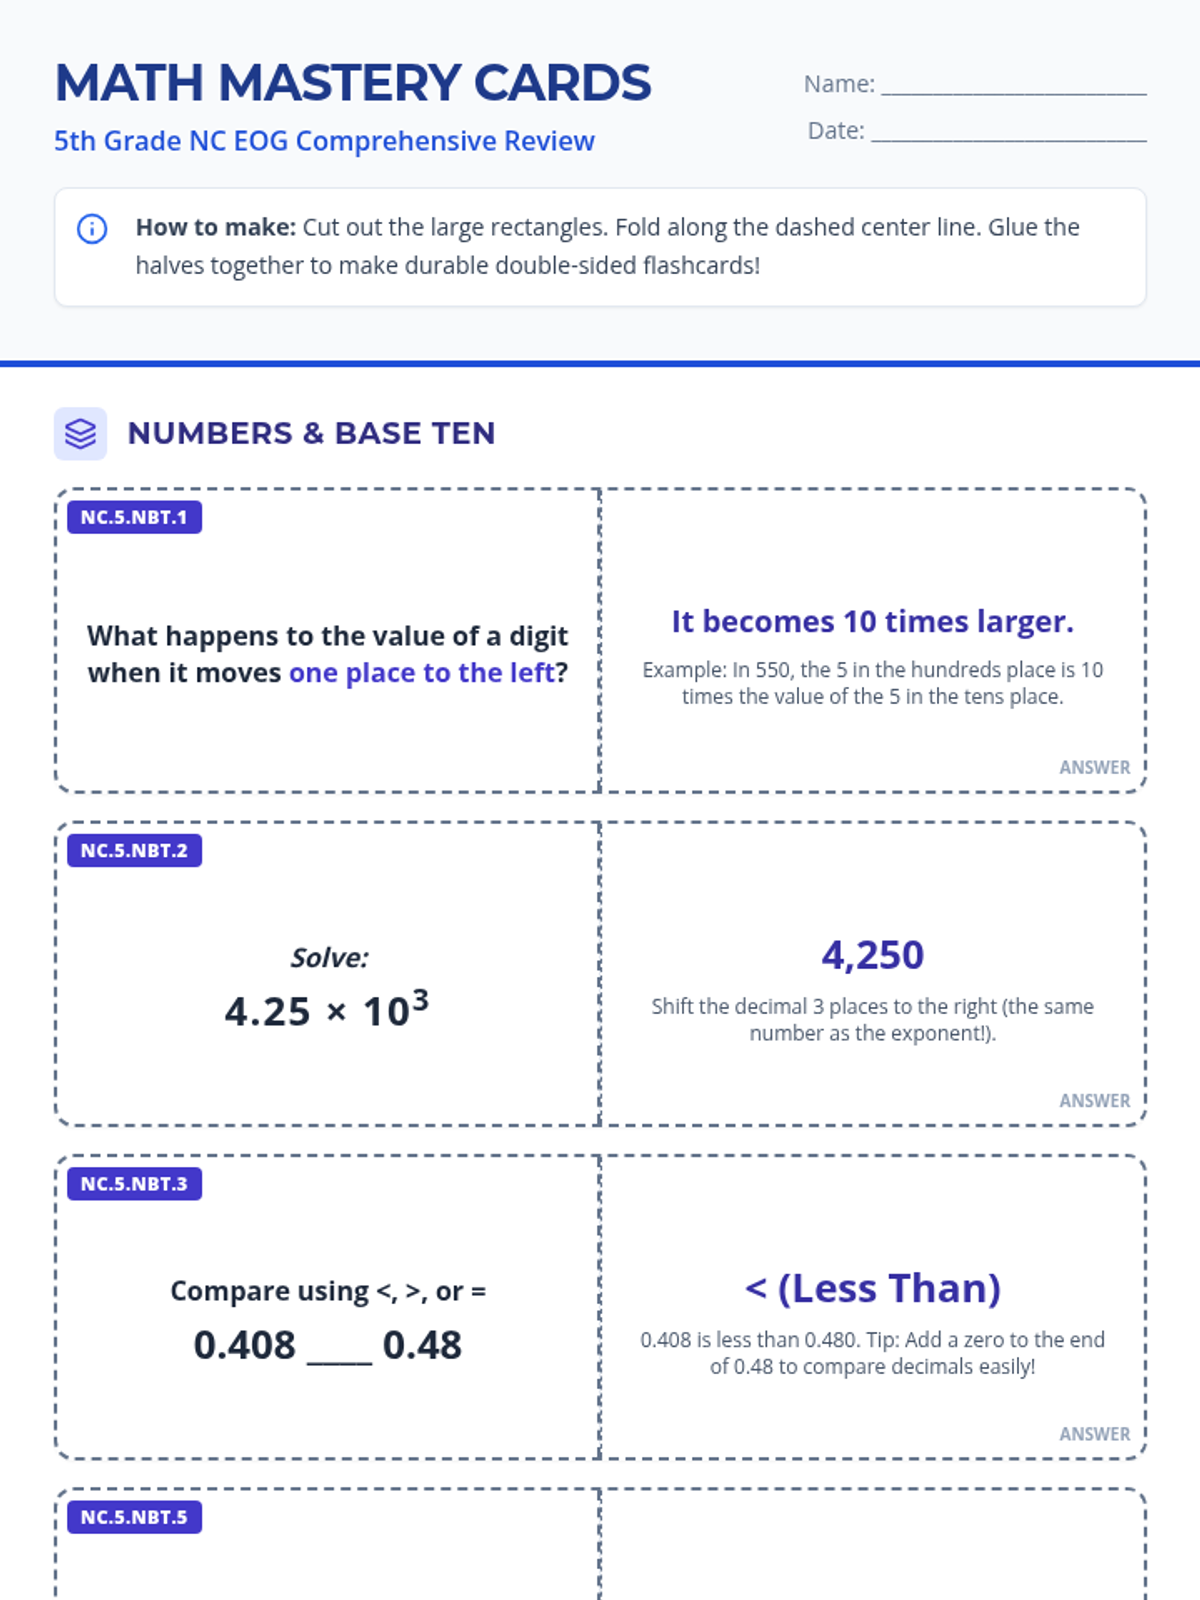
A set of printable flashcards covering all 5th-grade NC math standards (NBT, NF, OA, G, and MD) with a cut-and-fold design for student review. Revised to ensure cards do not split across pages.
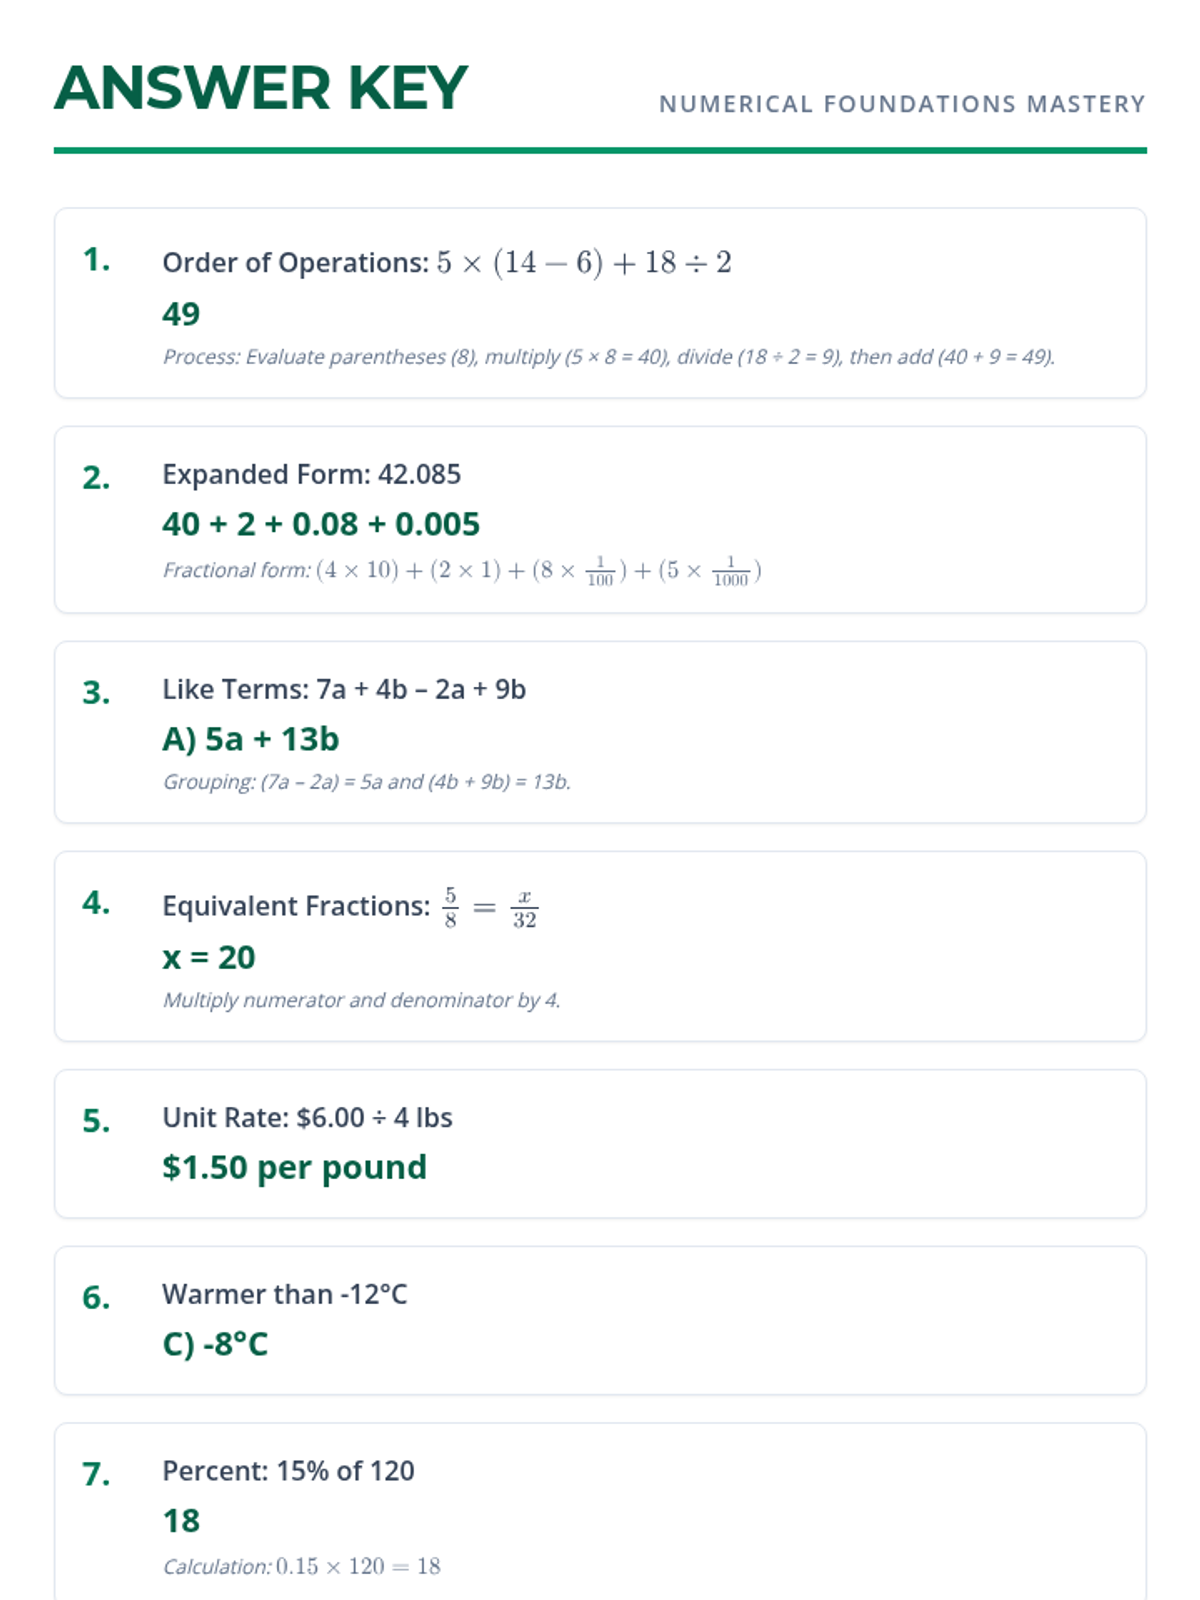
The official answer key for the Numerical Foundations Mastery quiz. Includes final answers and brief explanations/steps for each problem to assist in grading and student feedback.
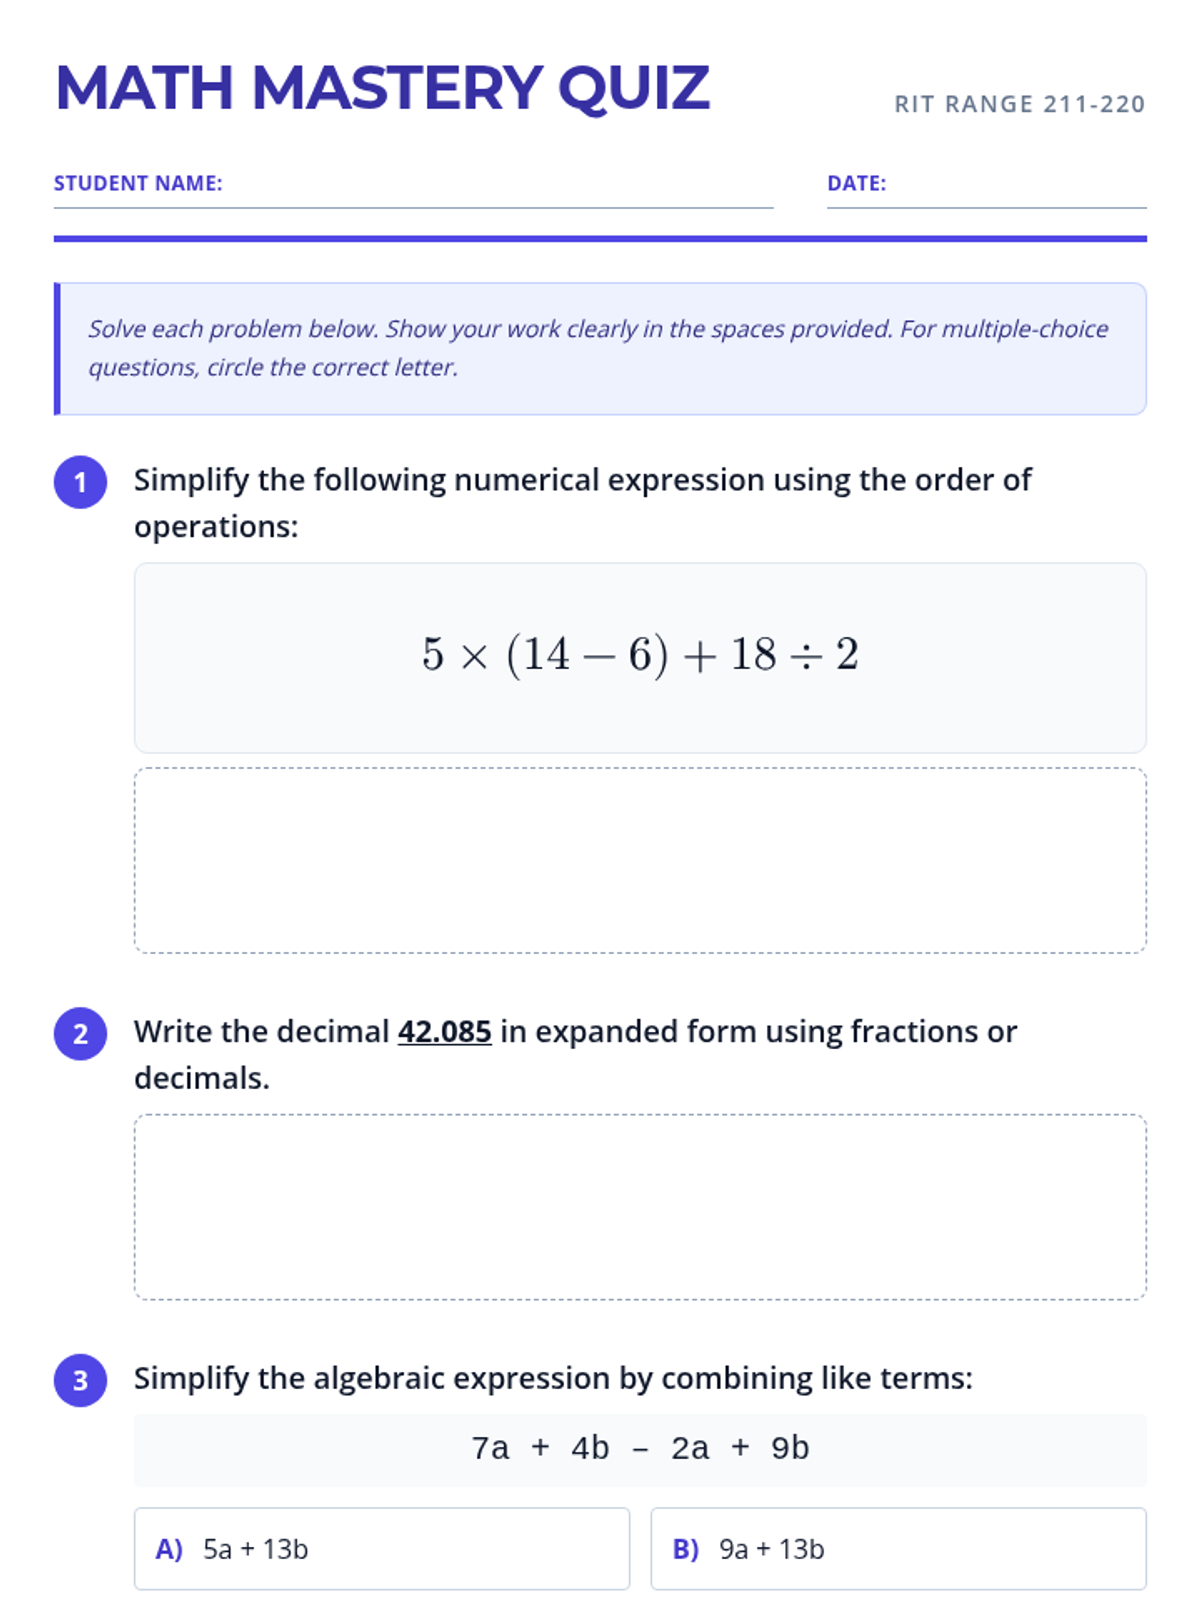
A 10-question math quiz designed for students in the RIT 211-220 range, covering order of operations, algebraic expressions, decimals, fractions, and geometry. Includes structured workspace for student calculations.
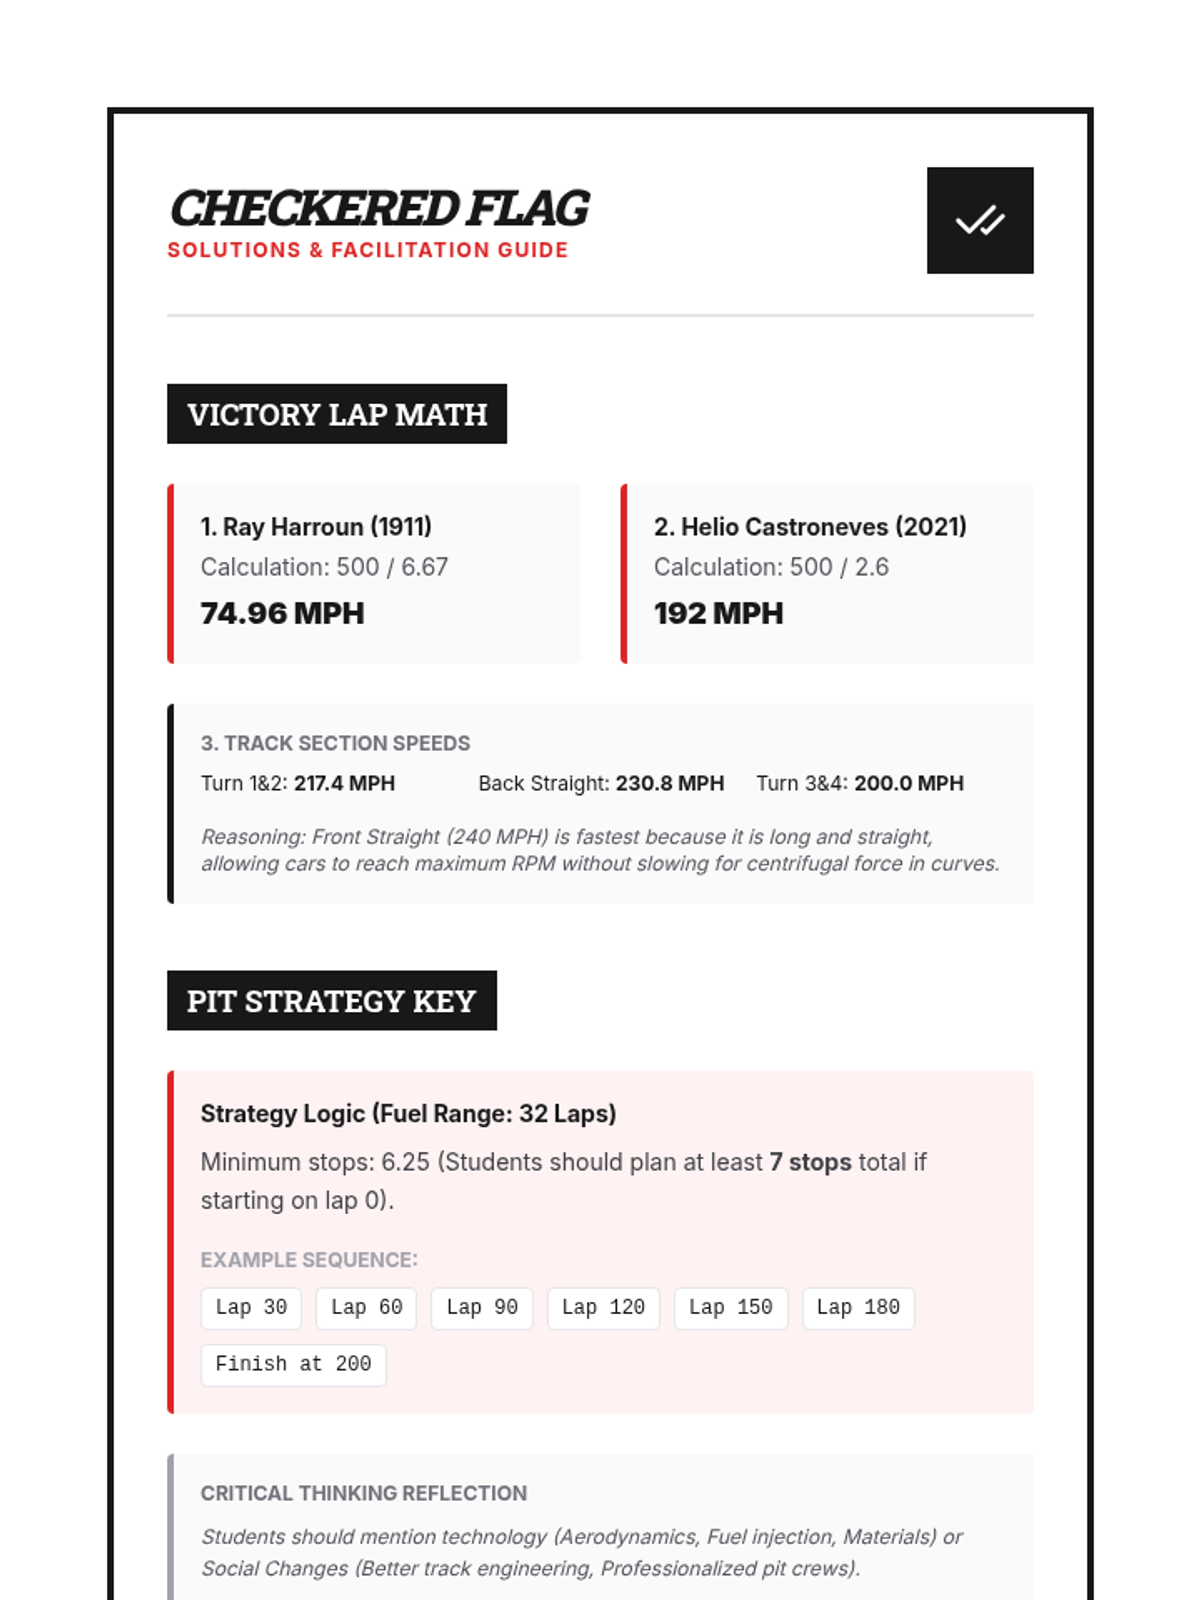
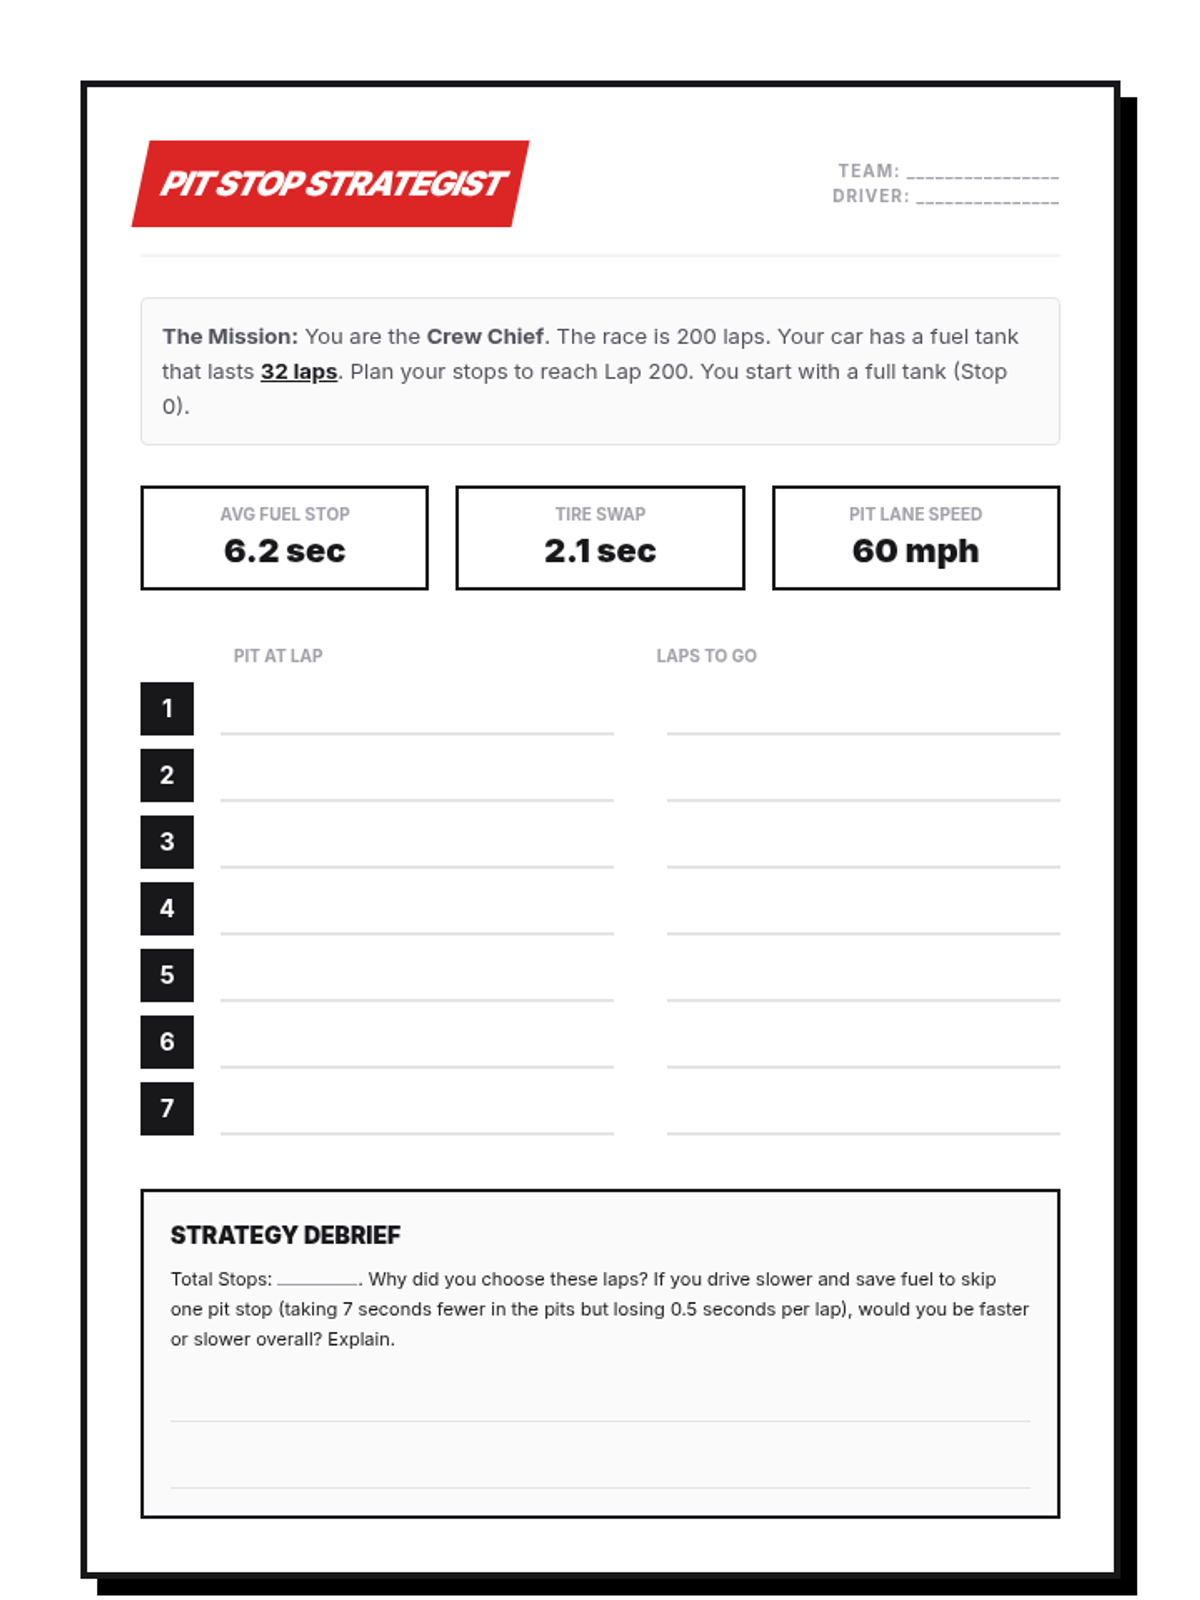
An answer key and teacher facilitation guide providing solutions to the math problems and strategic scenarios presented in the student materials. It includes step-by-step calculations and expected responses for critical thinking questions.
A strategic planning activity where students take on the role of an Indy 500 Crew Chief. They must calculate and plan fuel stops across the 200-lap race based on fuel tank capacity and historical pit data, balancing safety and speed.
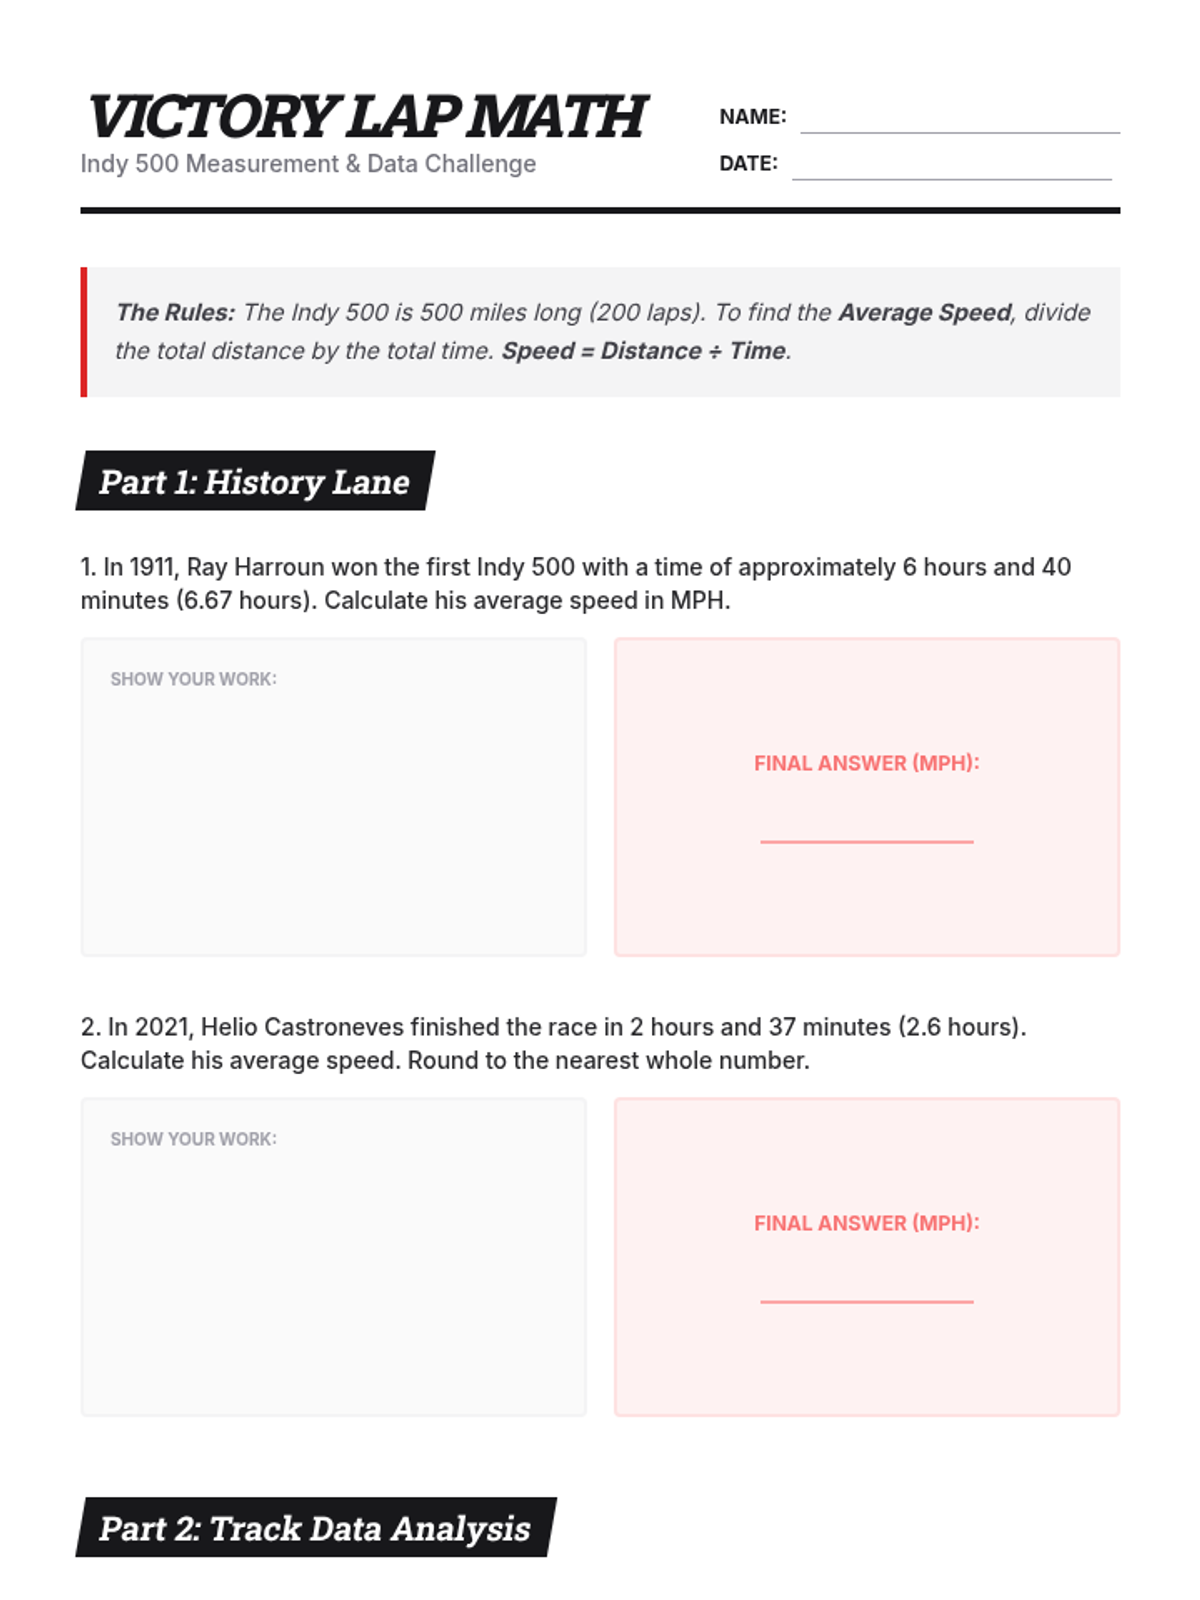
A math-focused student worksheet that requires students to calculate average speeds from historical Indy 500 data and track section statistics. It includes a critical thinking reflection on technological and social changes over time.
A high-energy visual presentation introducing the history, culture, and mathematics of the Indianapolis 500. Slides cover 'The Brickyard' origin, iconic traditions like drinking milk, and the fundamental Speed = Distance / Time formula.
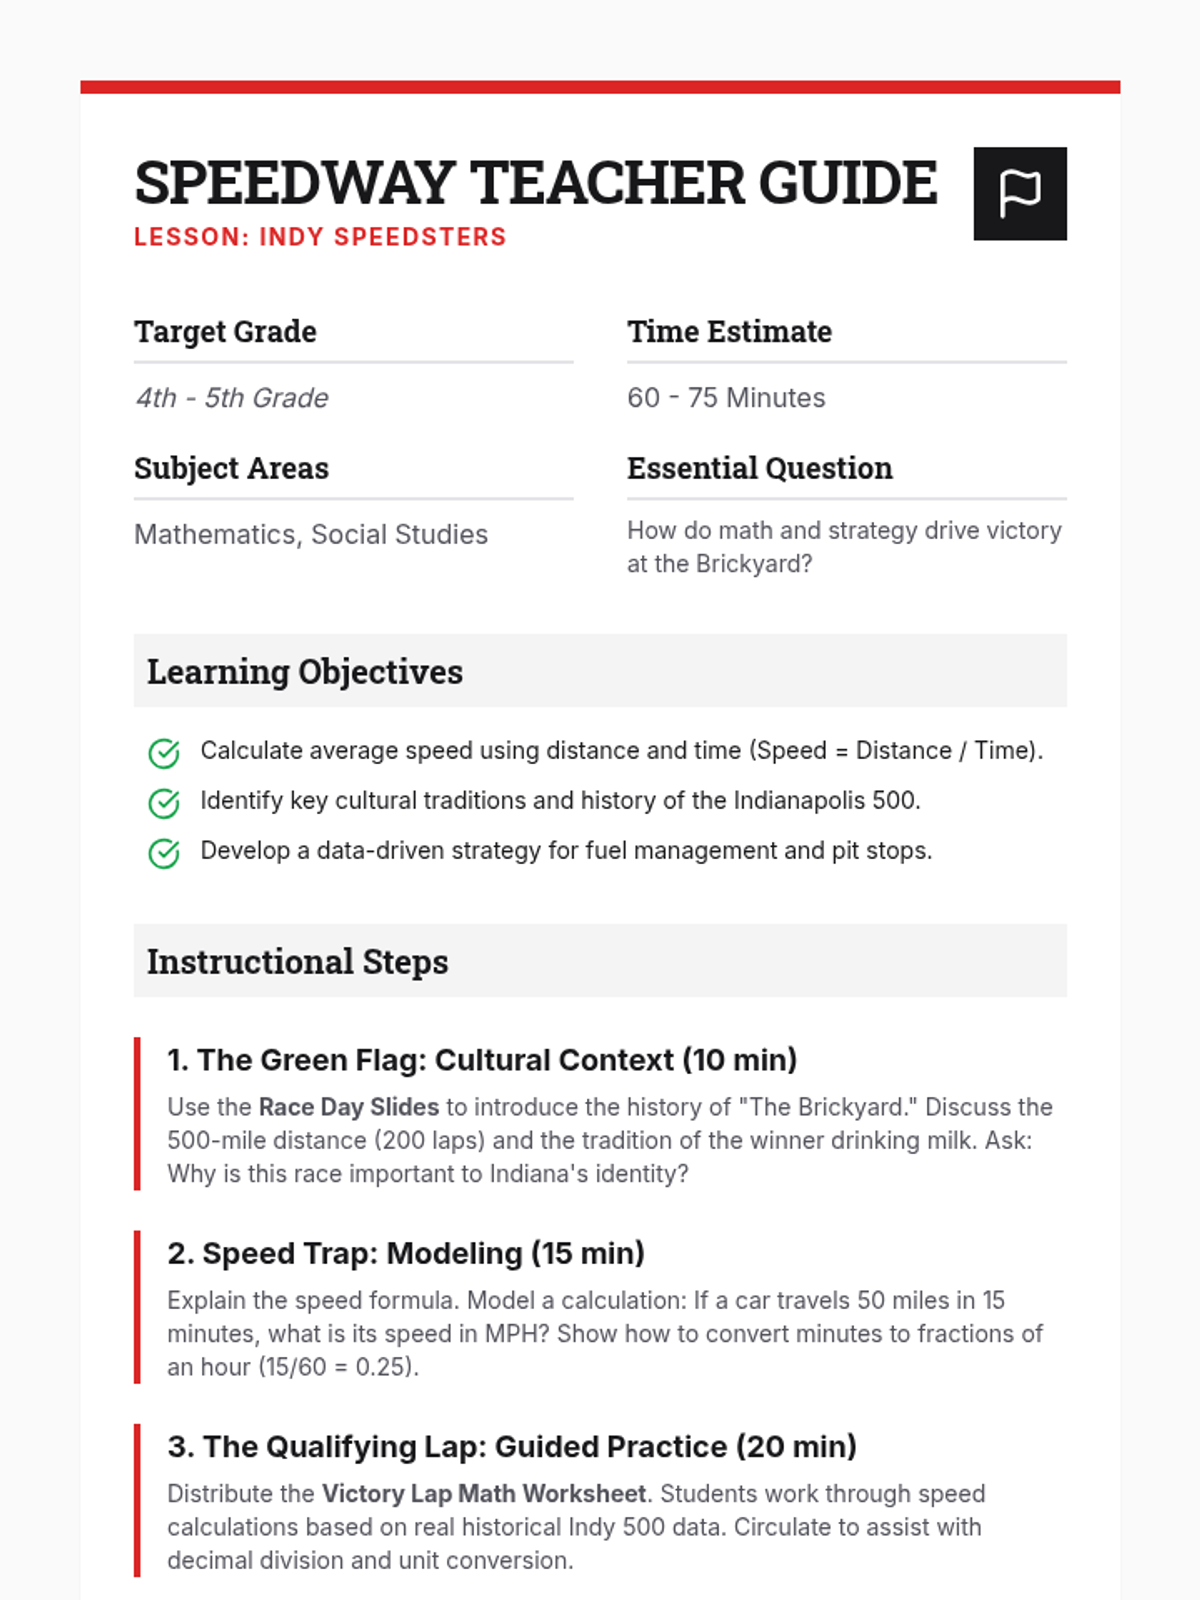
A comprehensive teacher guide for the Indy Speedsters lesson, including learning objectives, a detailed instructional sequence, and differentiation strategies. It bridges mathematical speed calculations with the cultural history of the Indianapolis 500.
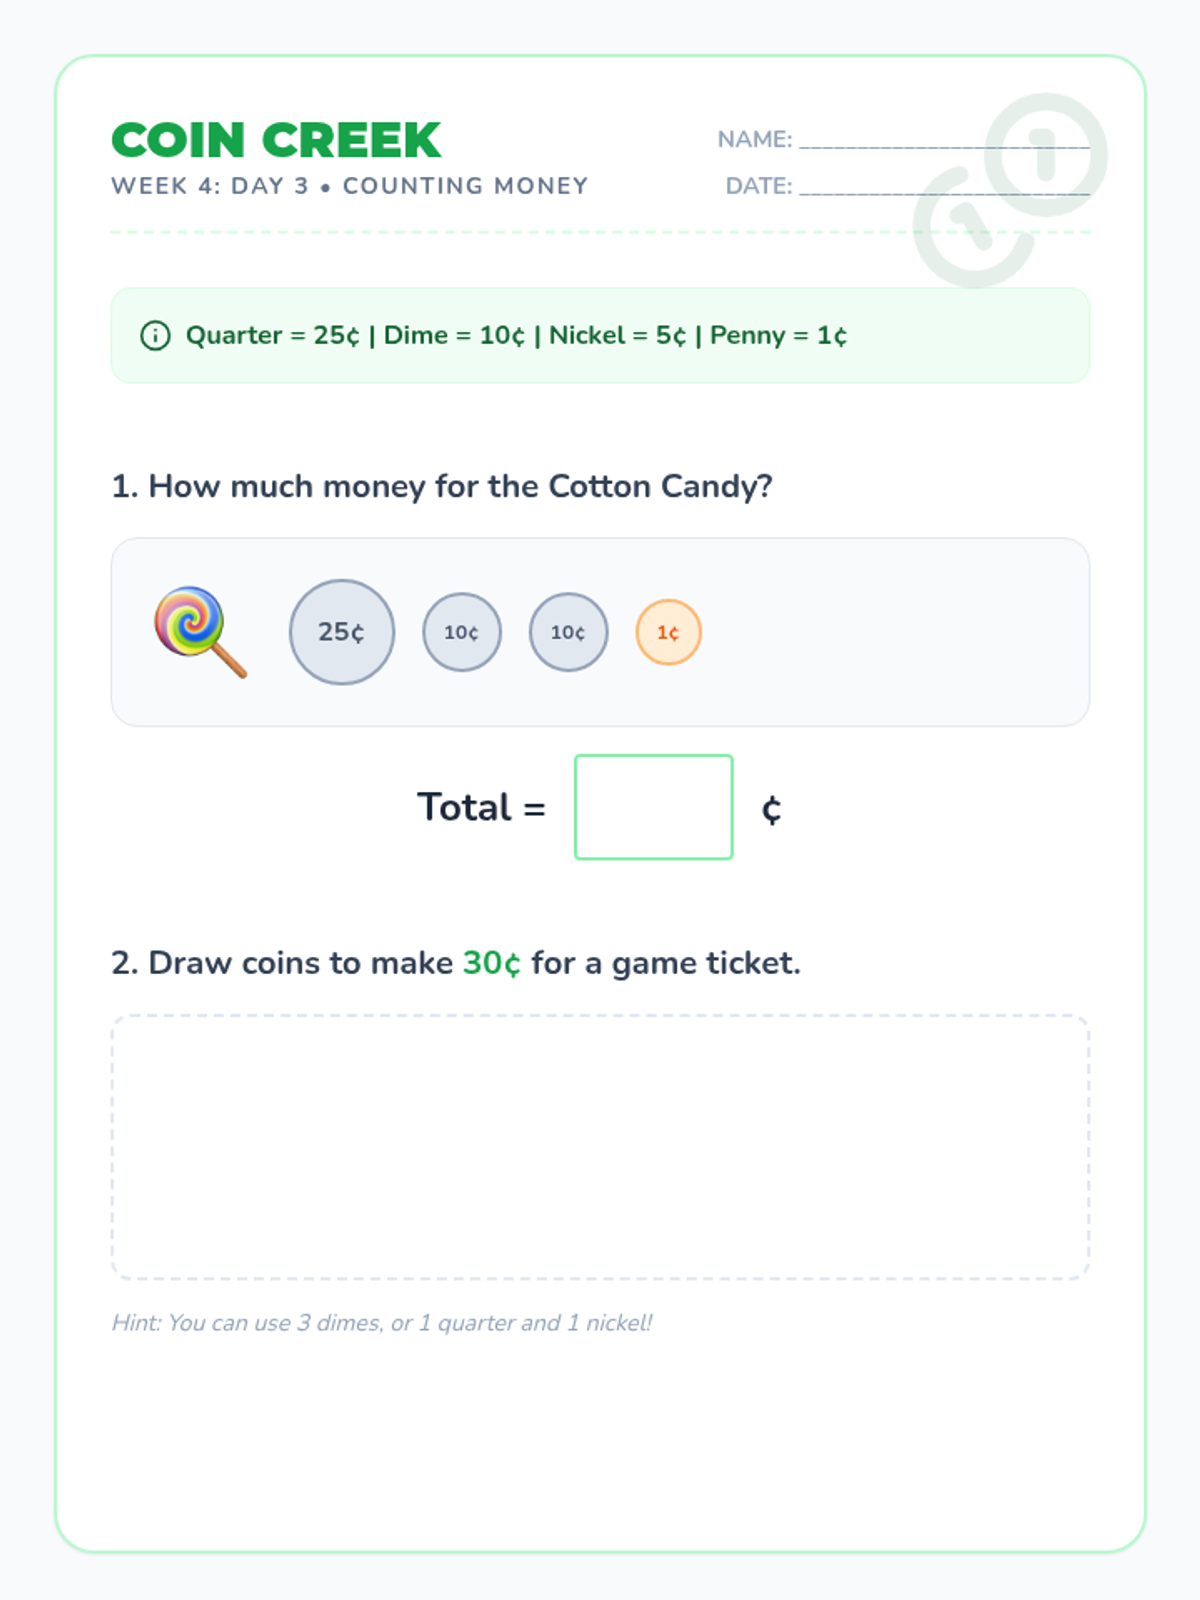
A Day 3 worksheet for the Carnival Fair unit, practicing coin counting and value representation with a cotton candy theme for IEP students.
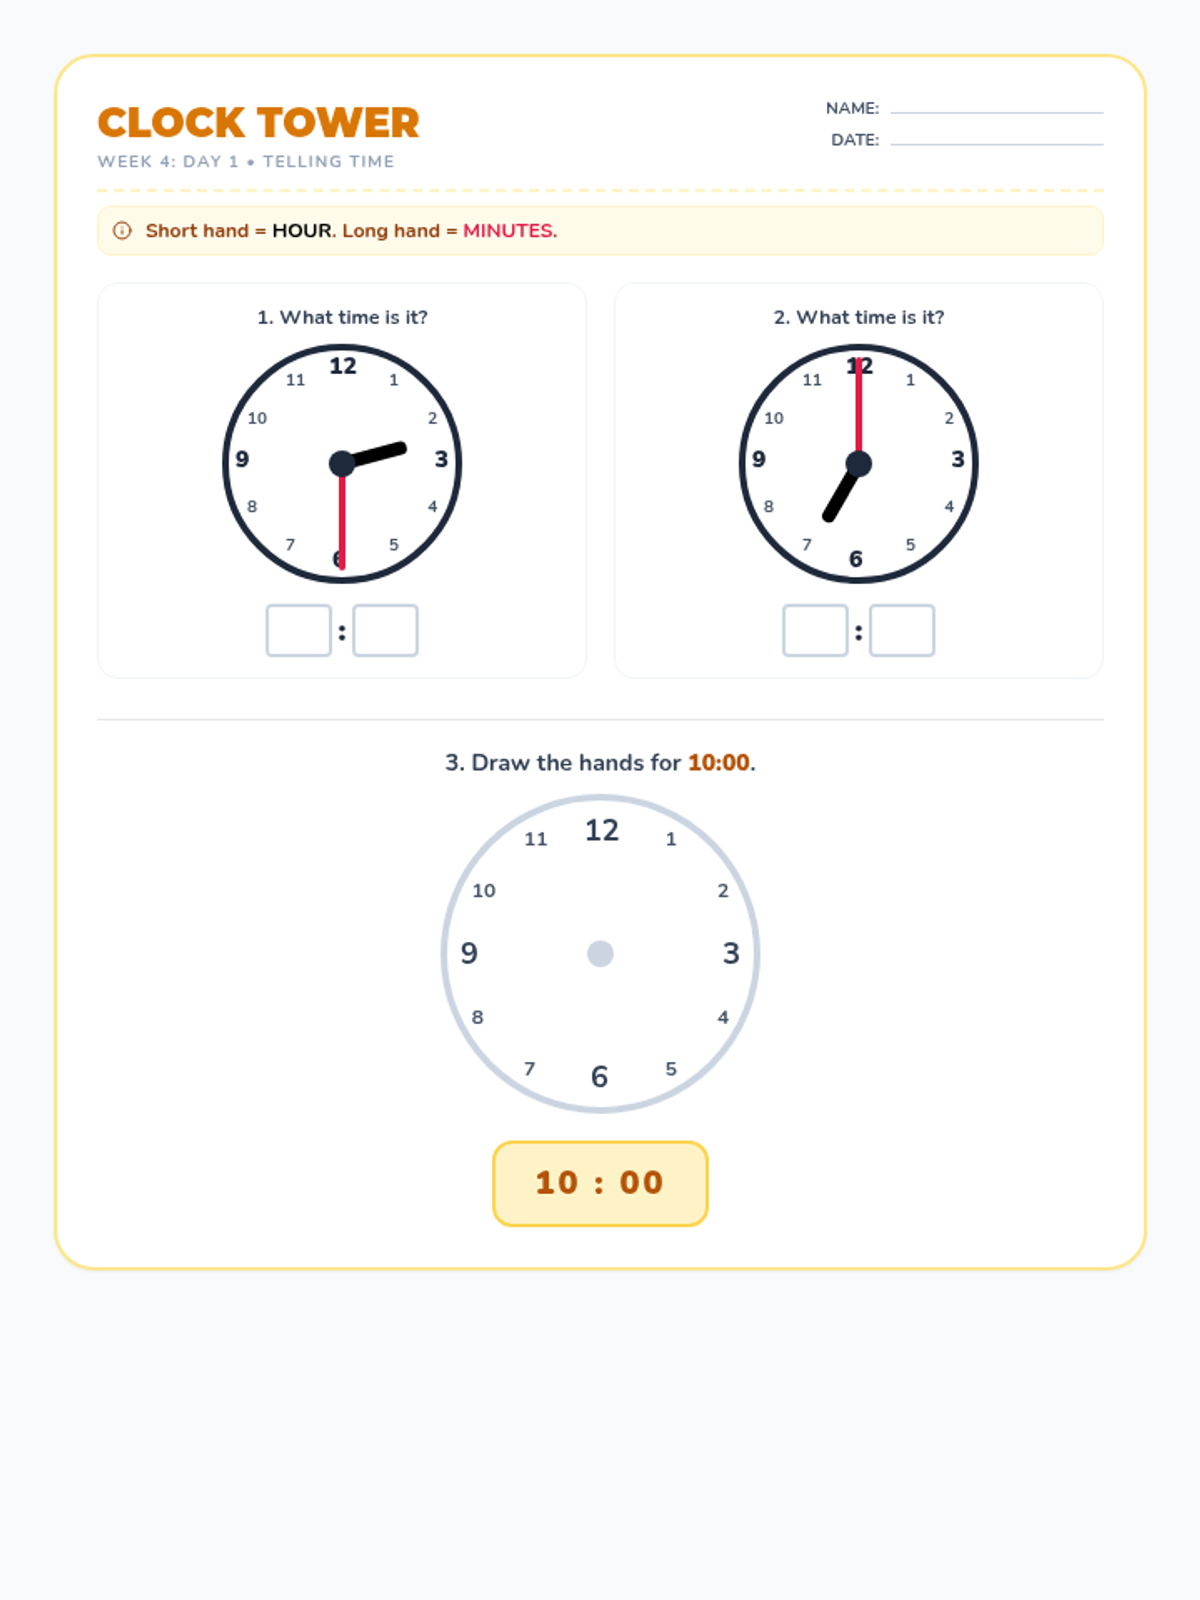
A Day 1 worksheet for the Carnival Fair unit, teaching analog time telling with large clock faces and digital conversion for IEP students.
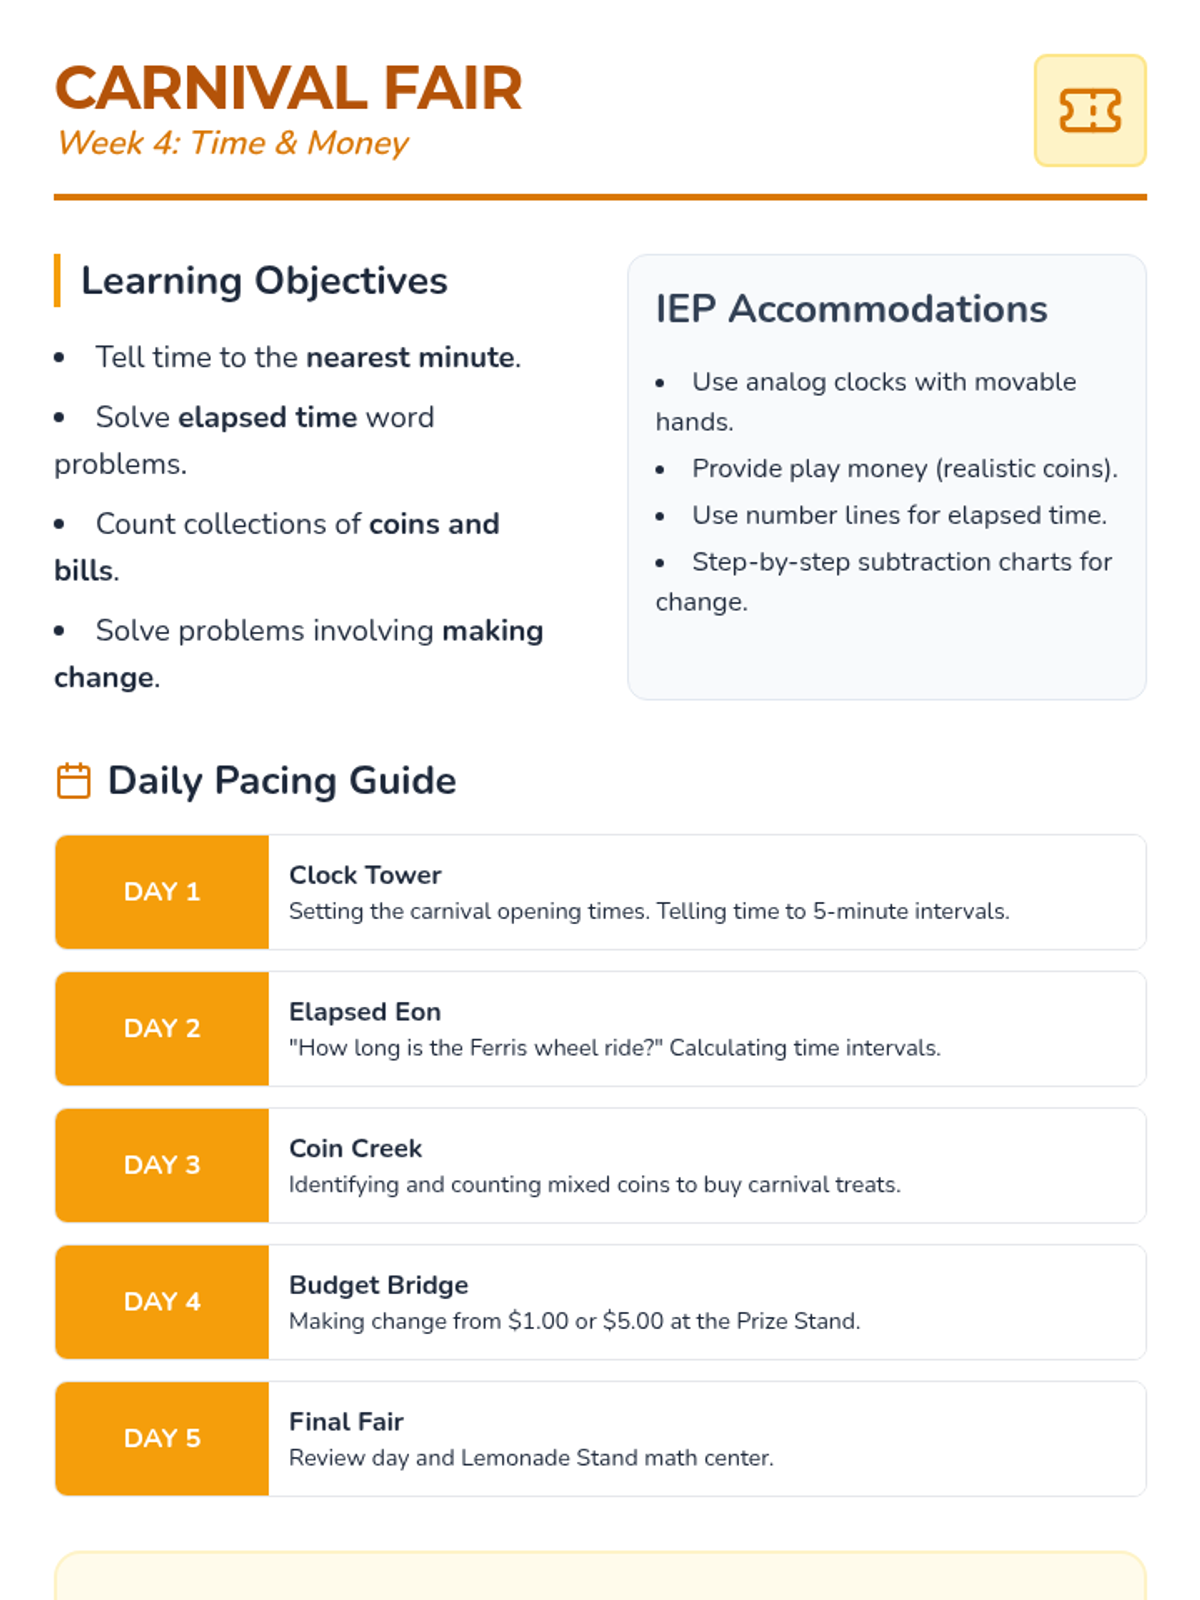
A teacher guide for Week 4 of the Summer Math Quest, focusing on carnival-themed time and money concepts for IEP students.
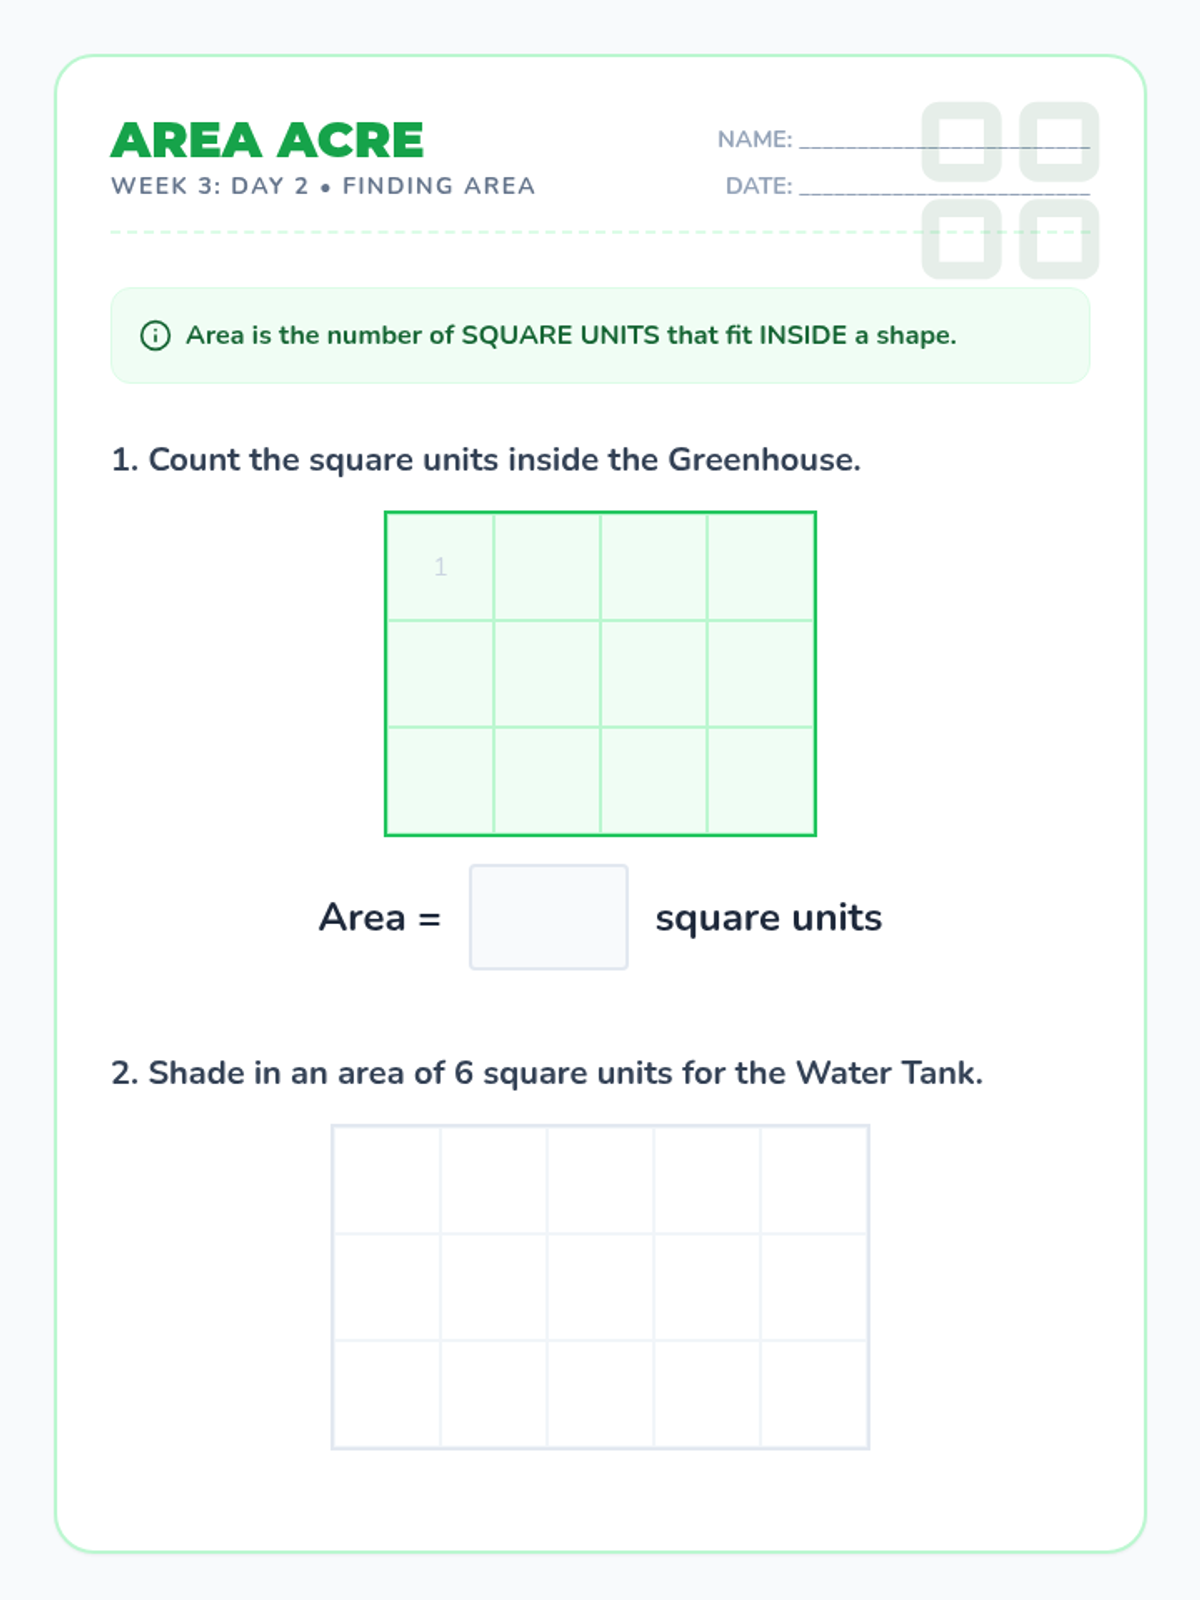
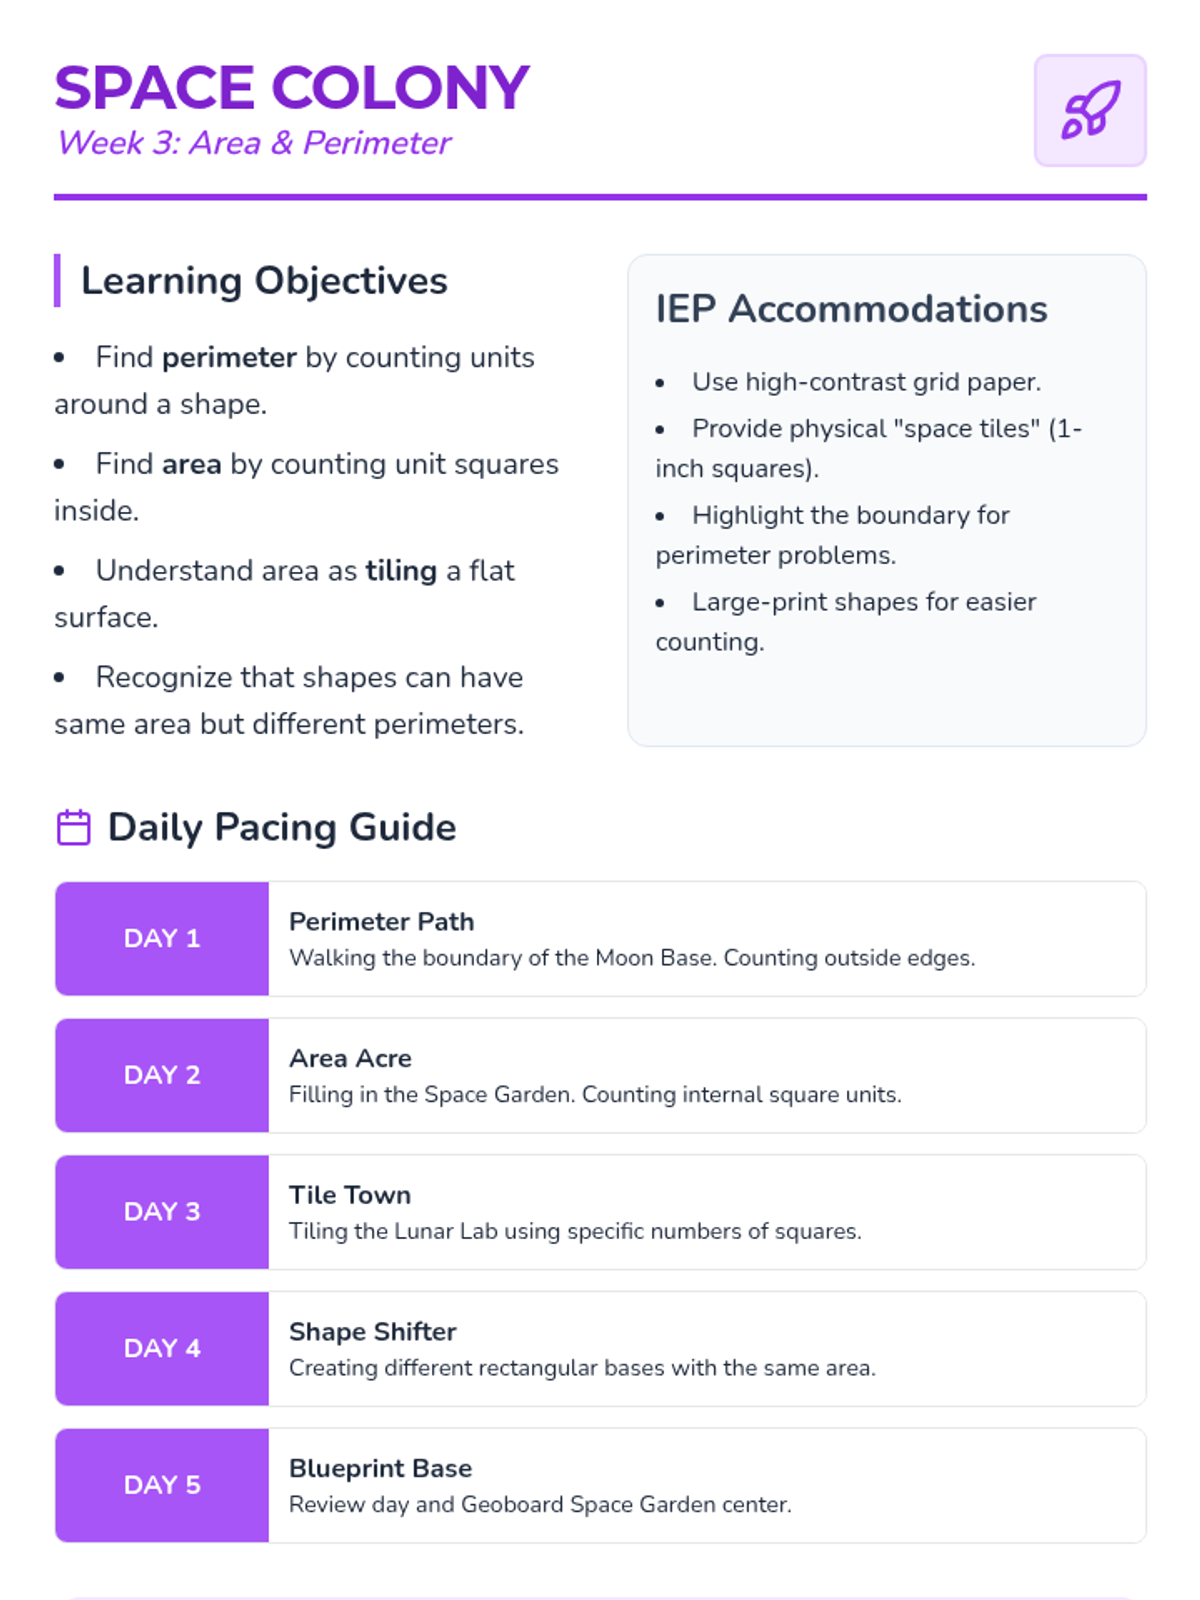
A Day 2 worksheet for the Space Colony unit, teaching area by counting and shading square units on a grid.
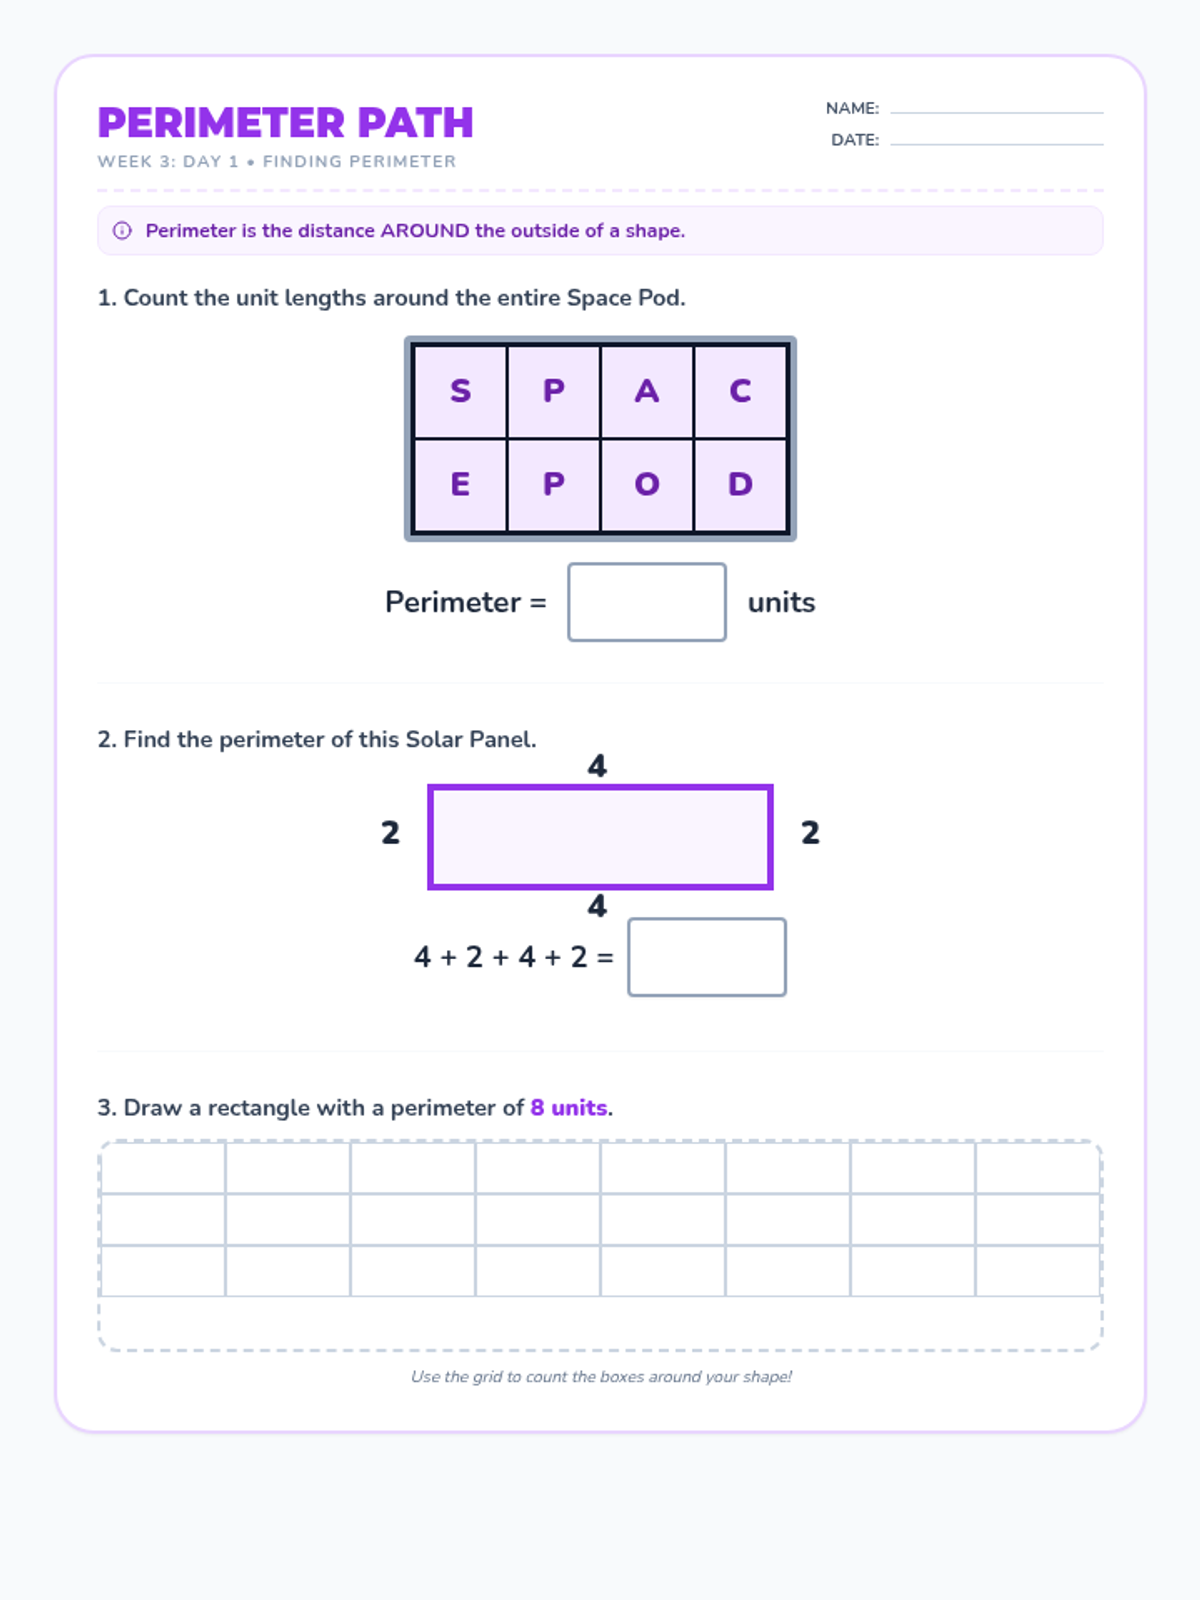
A Day 1 worksheet for the Space Colony unit, teaching perimeter through counting grid units and adding side lengths with large, clear visuals.
A teacher guide for Week 3 of the Summer Math Quest, focusing on space-themed area and perimeter concepts for IEP students.
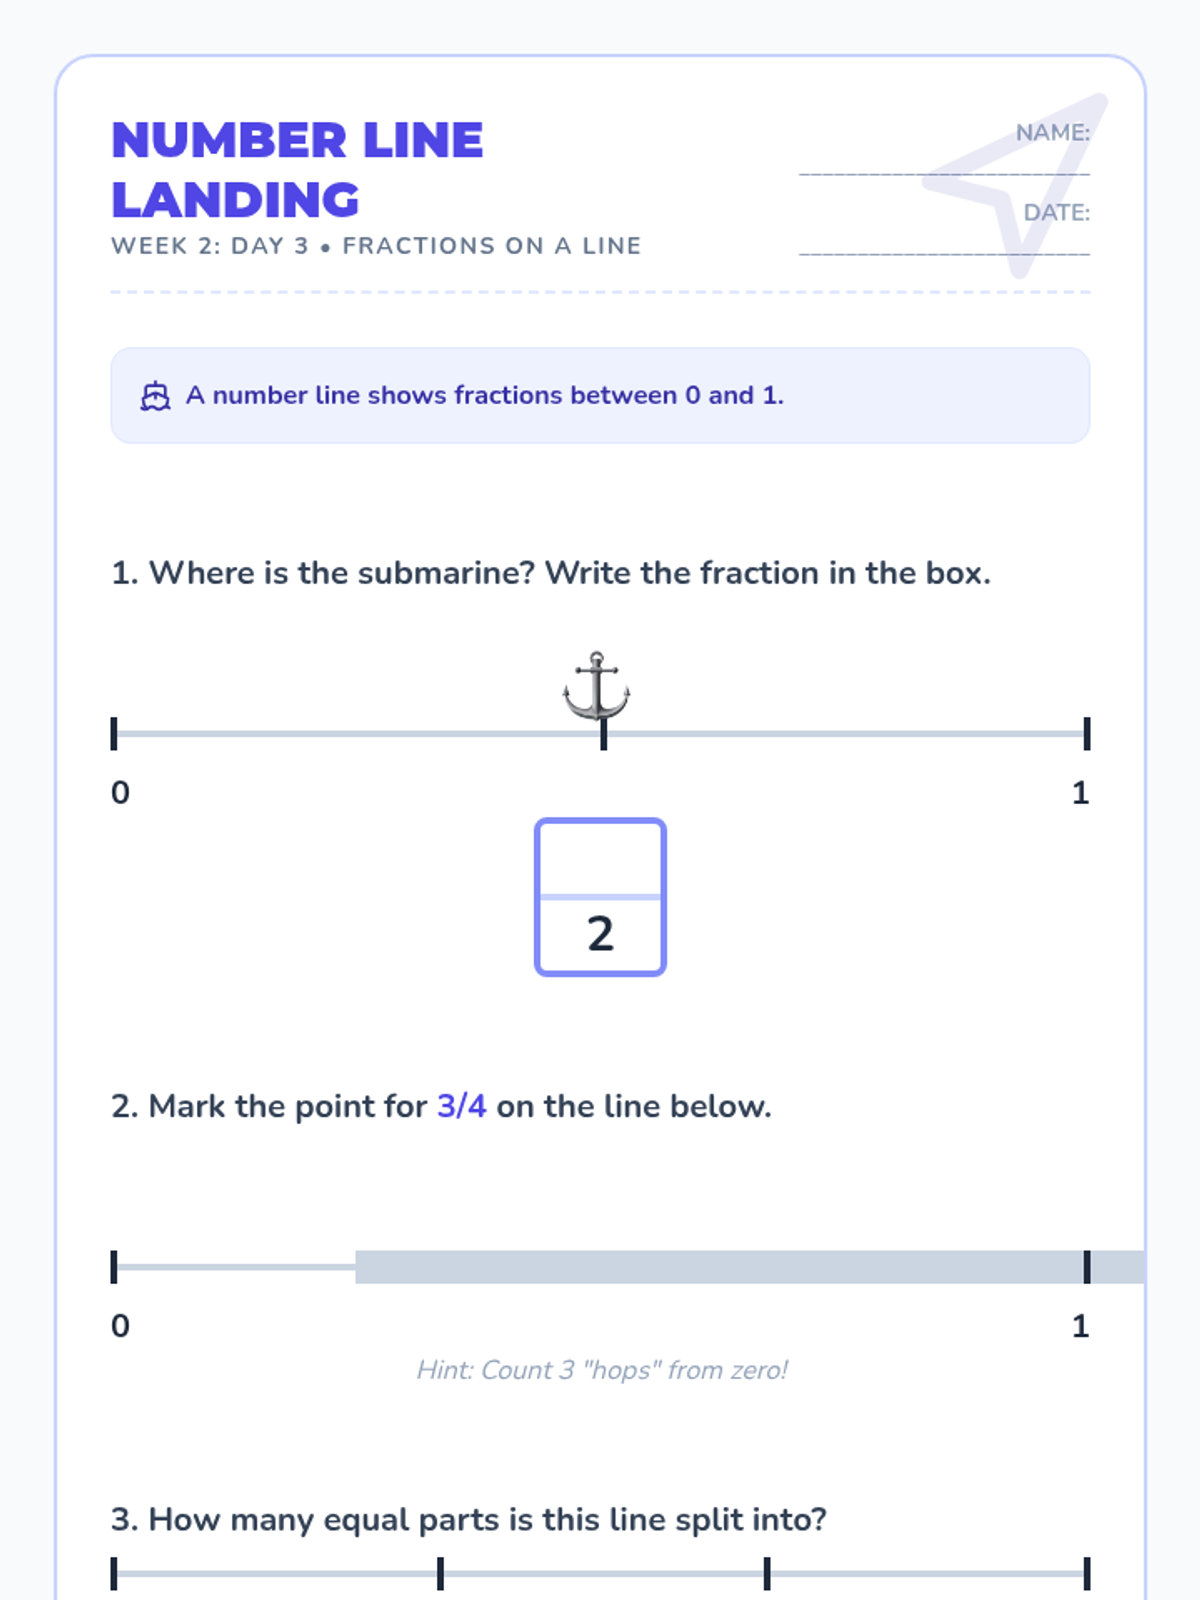
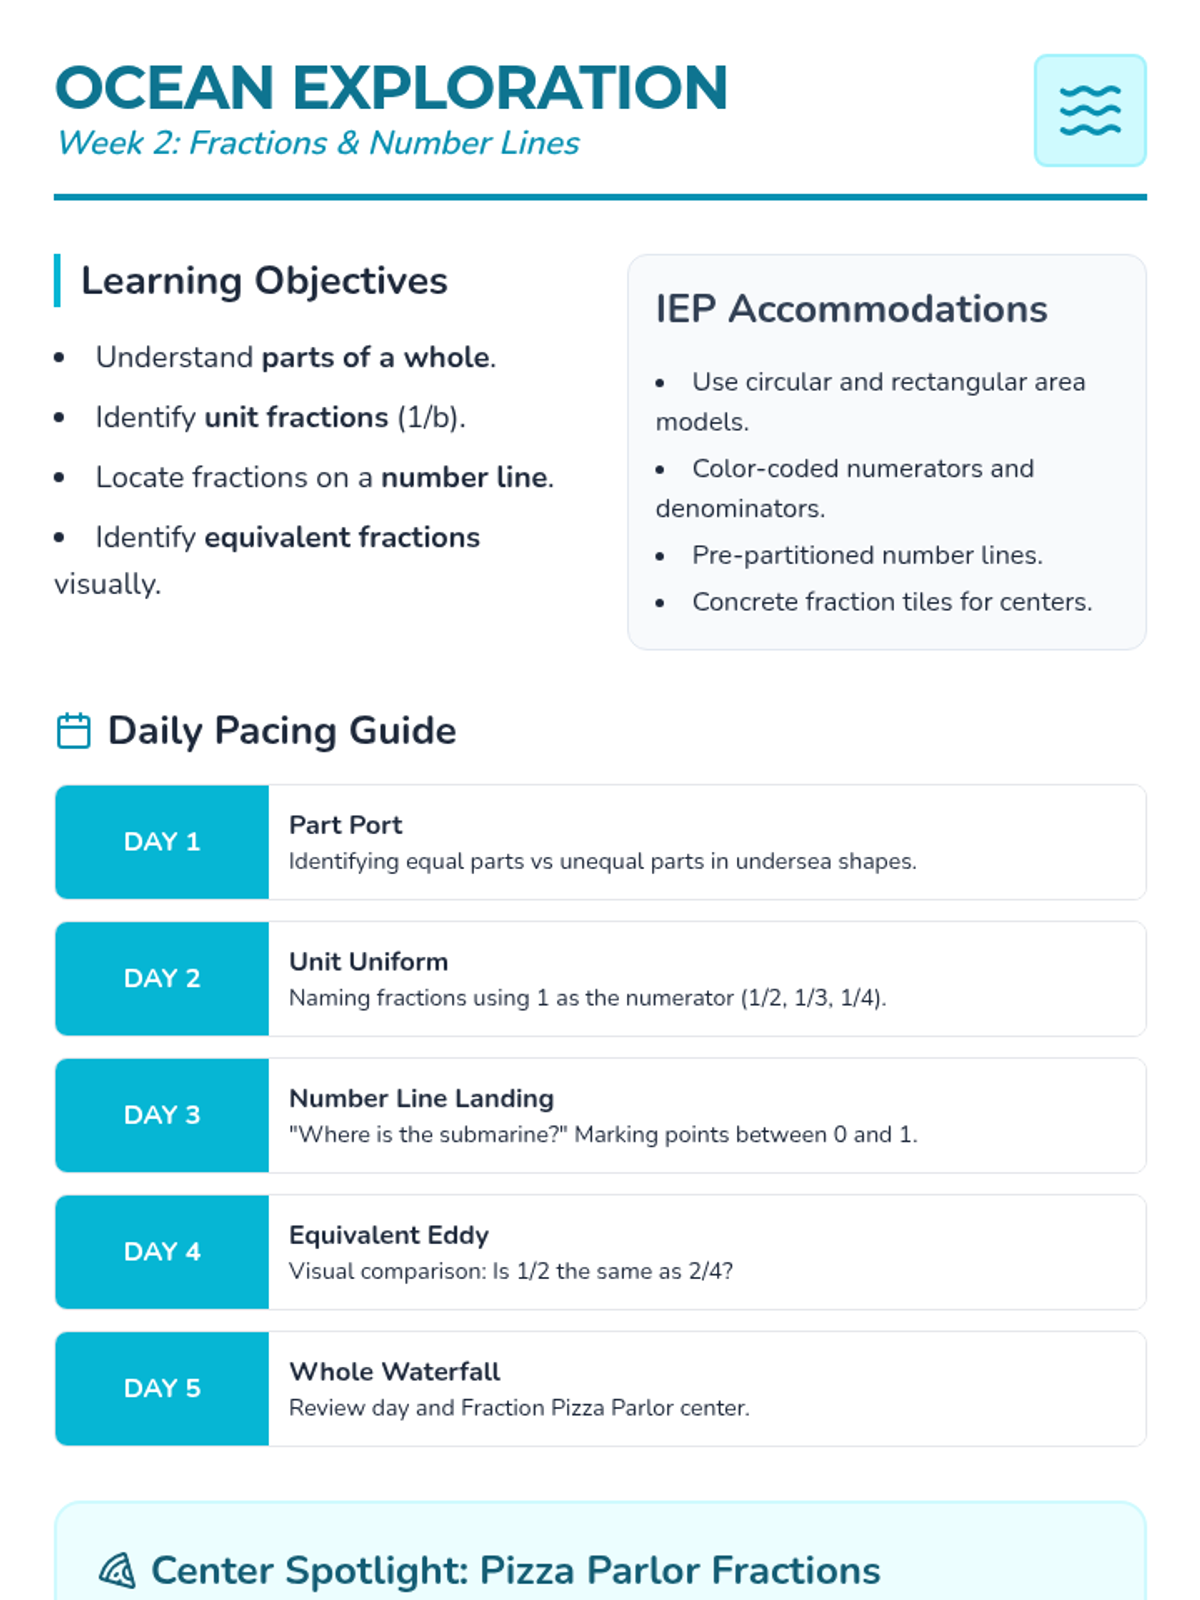
A Day 3 worksheet for the Ocean Exploration unit, helping IEP students locate and mark fractions on a number line with visual scaffolds.
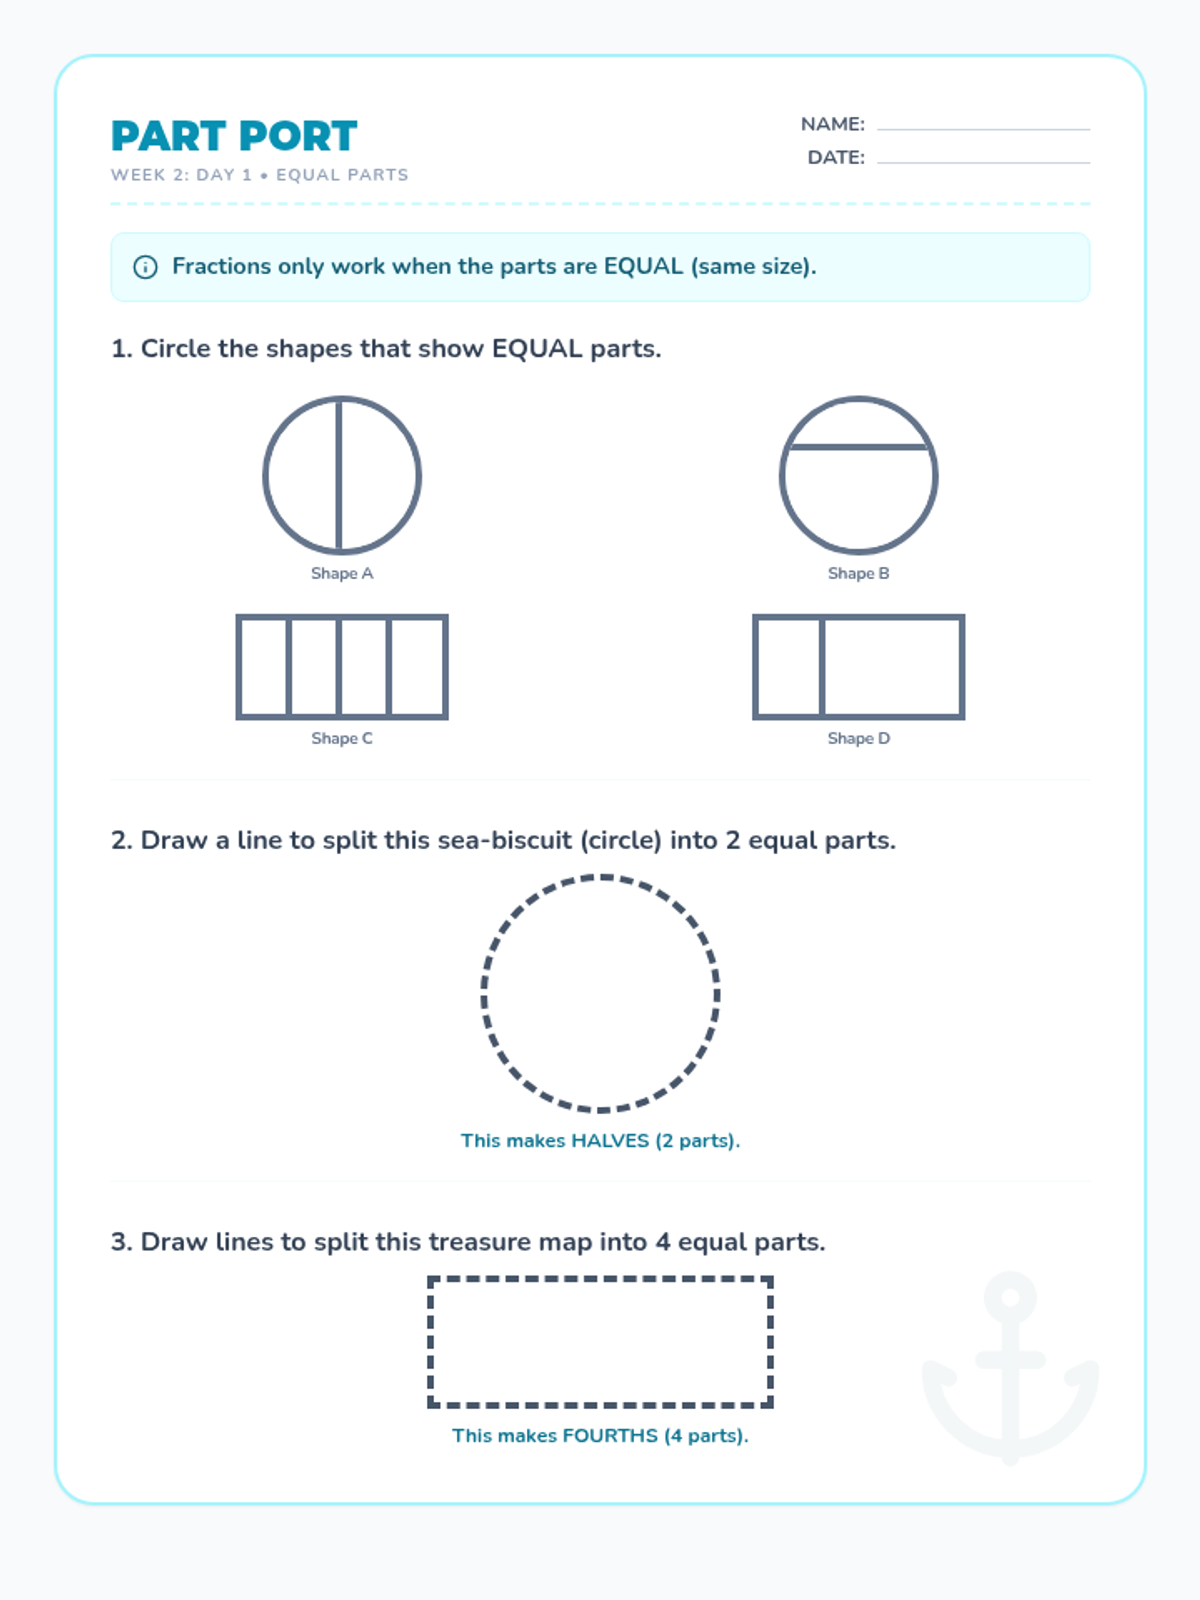
A Day 1 worksheet for the Ocean Exploration unit, focusing on identifying and creating equal parts (halves and fourths) for IEP students.
A teacher guide for Week 2 of the Summer Math Quest, focusing on ocean-themed fractions and number line instruction for IEP students.
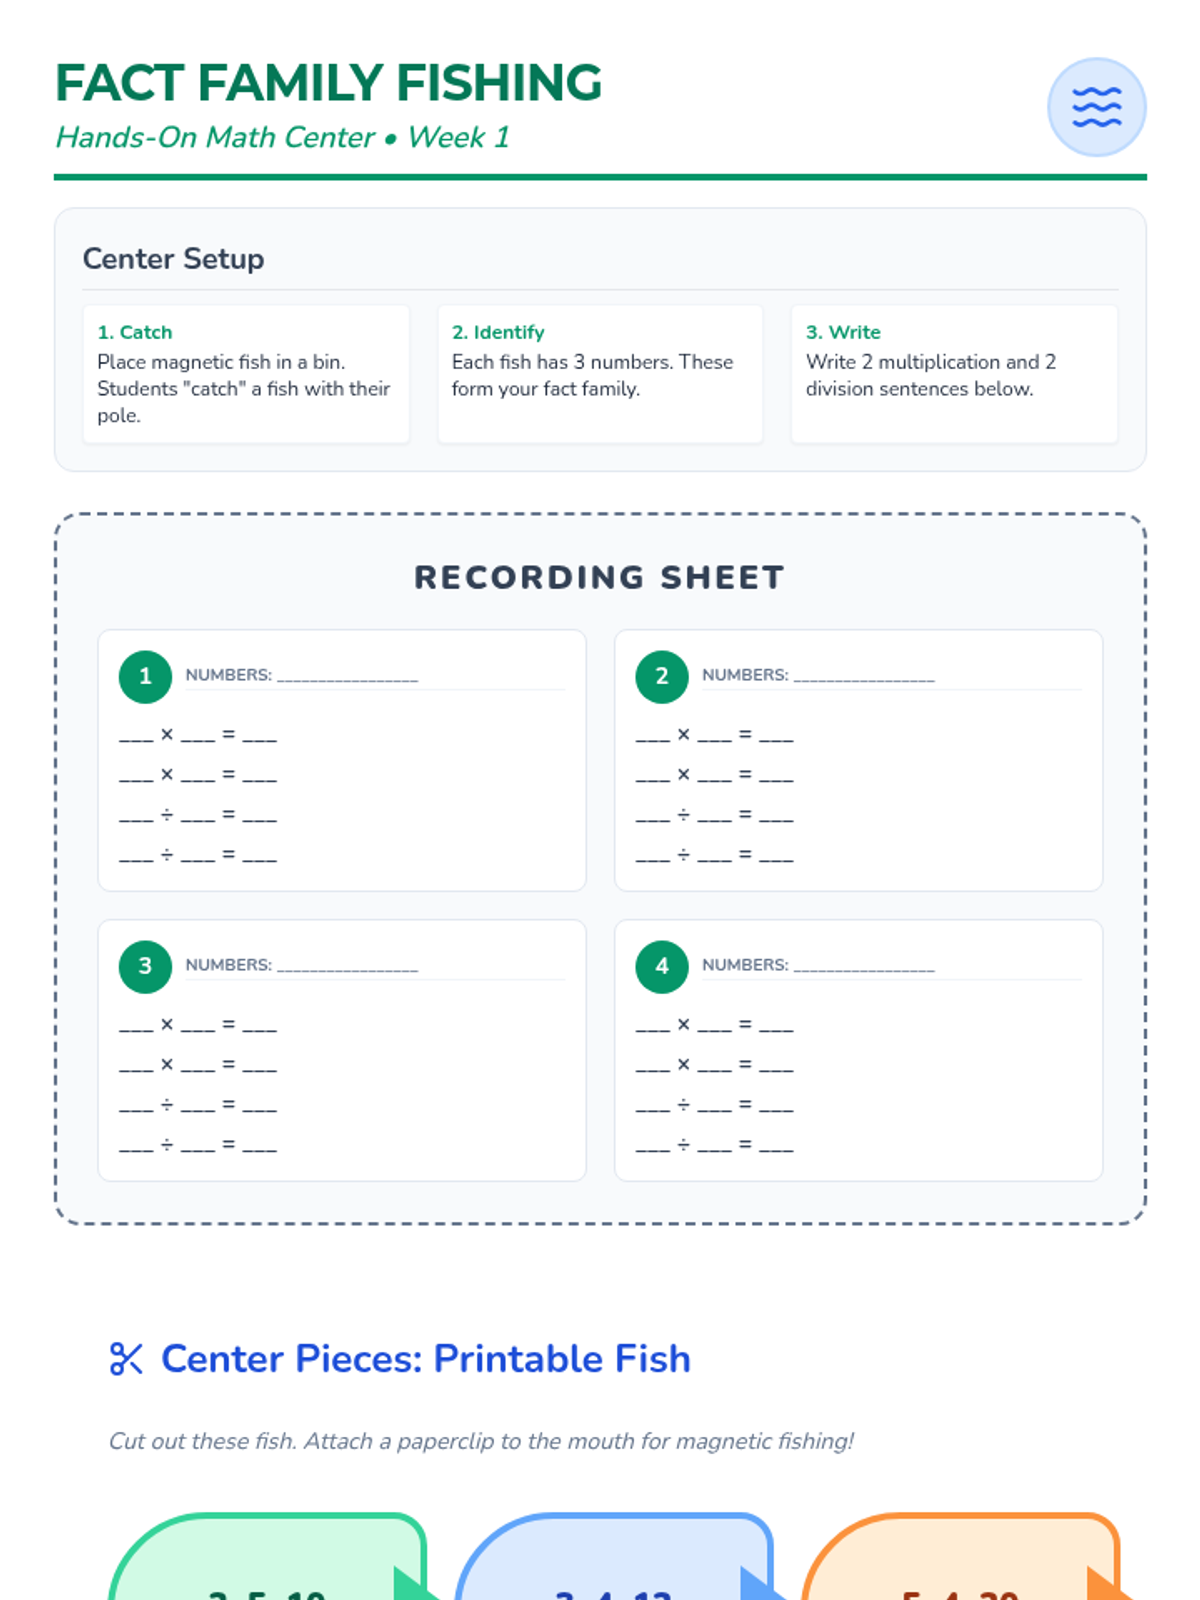
A hands-on math center activity for Week 1, providing a recording sheet and printable fish for fact family practice.
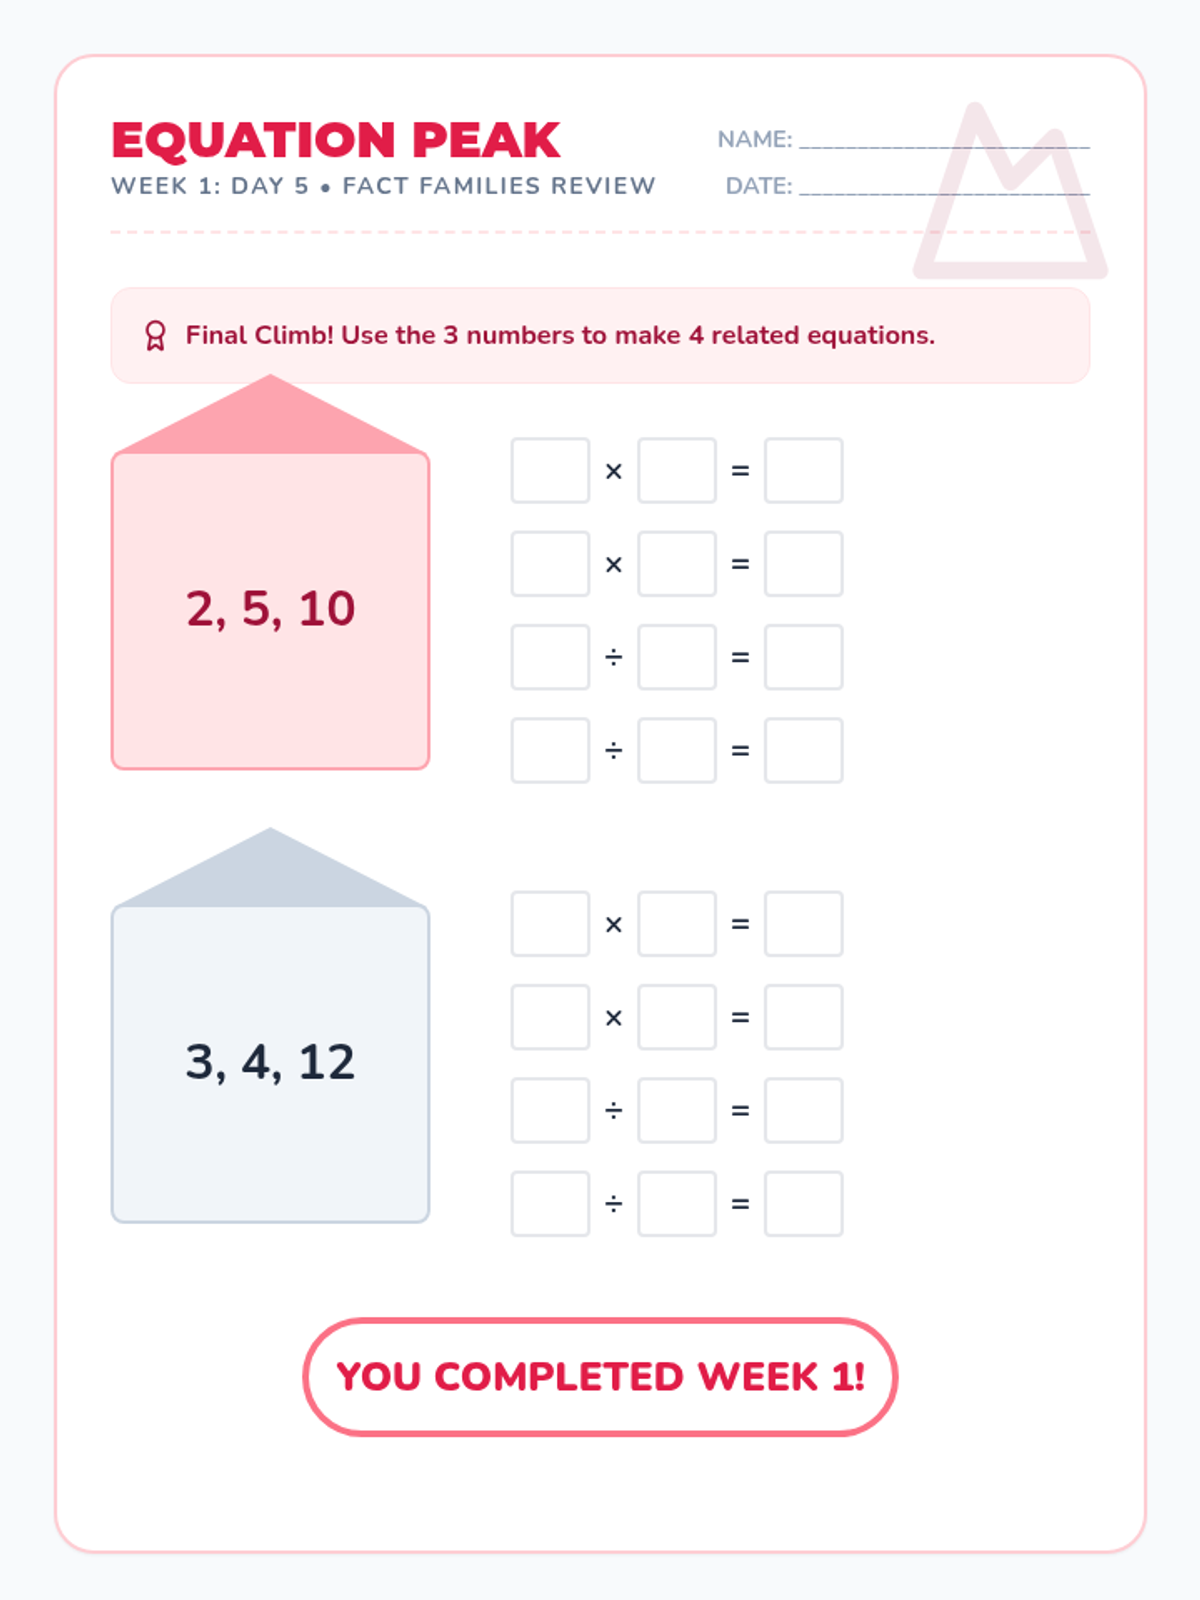
A Day 5 review worksheet for the Jungle Expedition unit, focusing on fact families and relationship between multiplication and division.
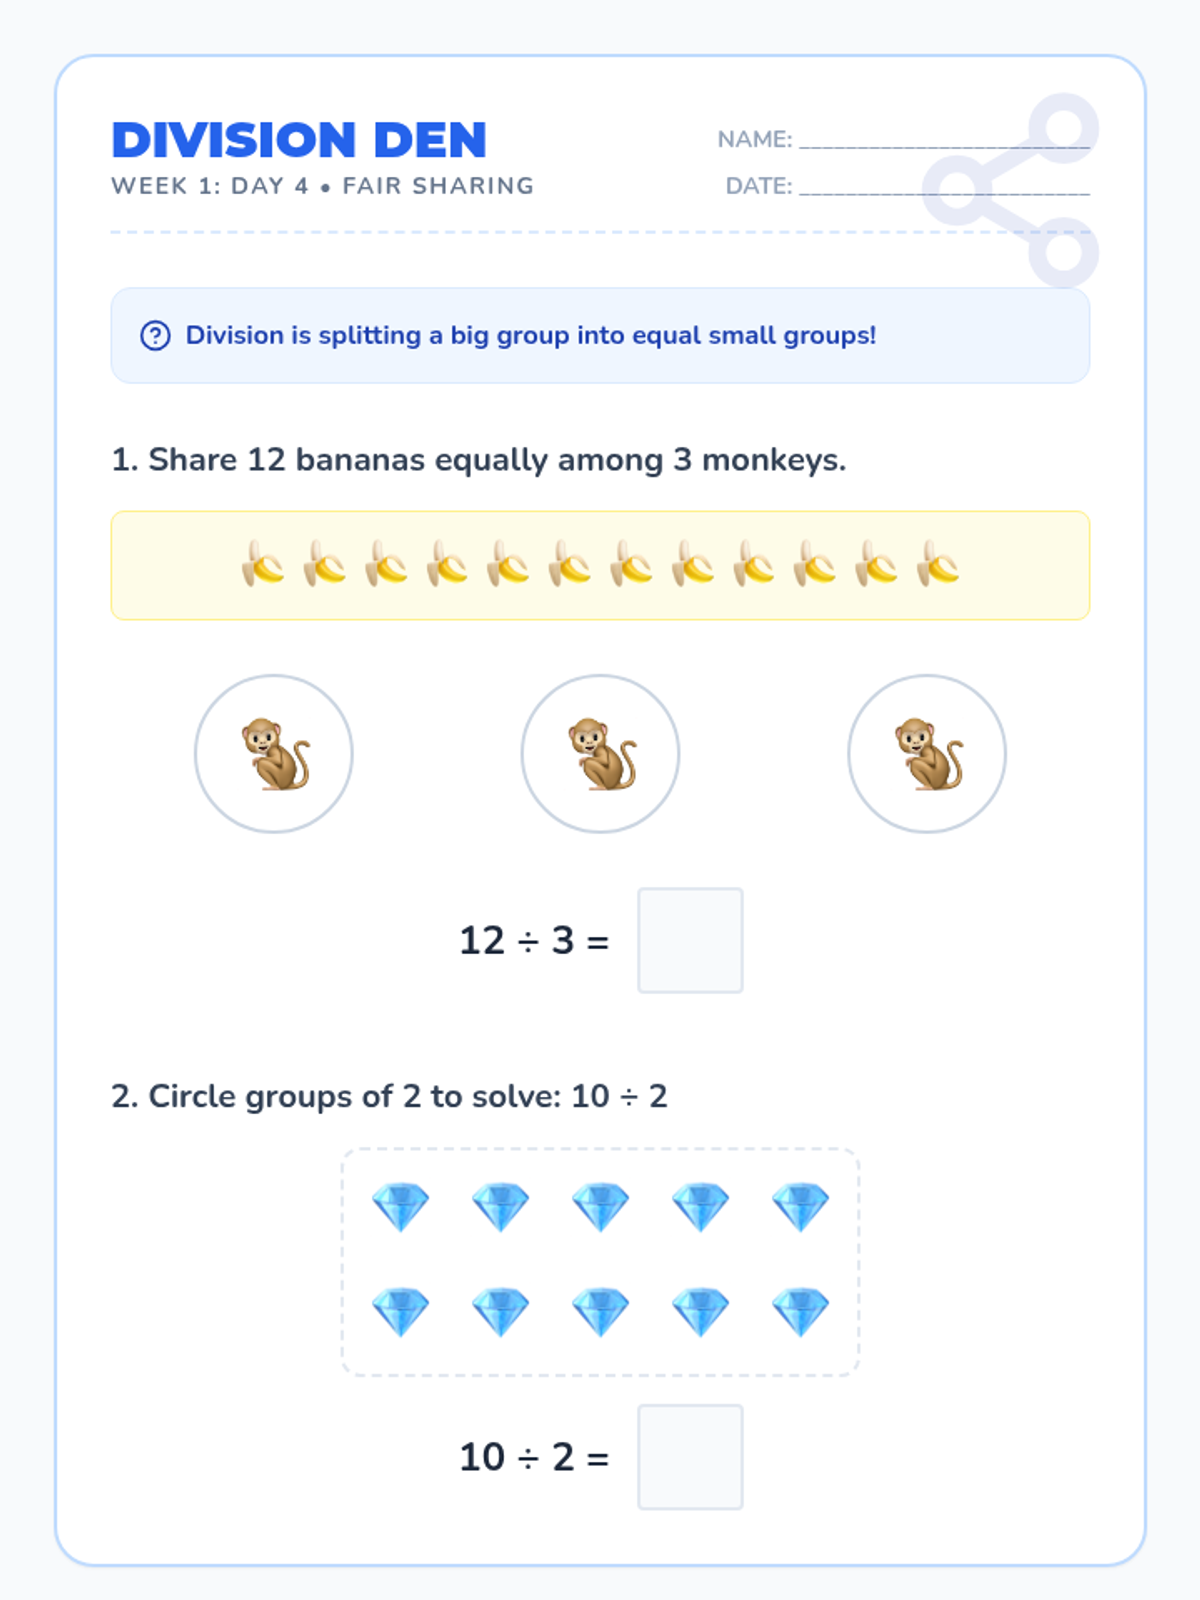
A Day 4 worksheet for the Jungle Expedition unit, introducing division as fair sharing using bananas and monkeys as a thematic visual.
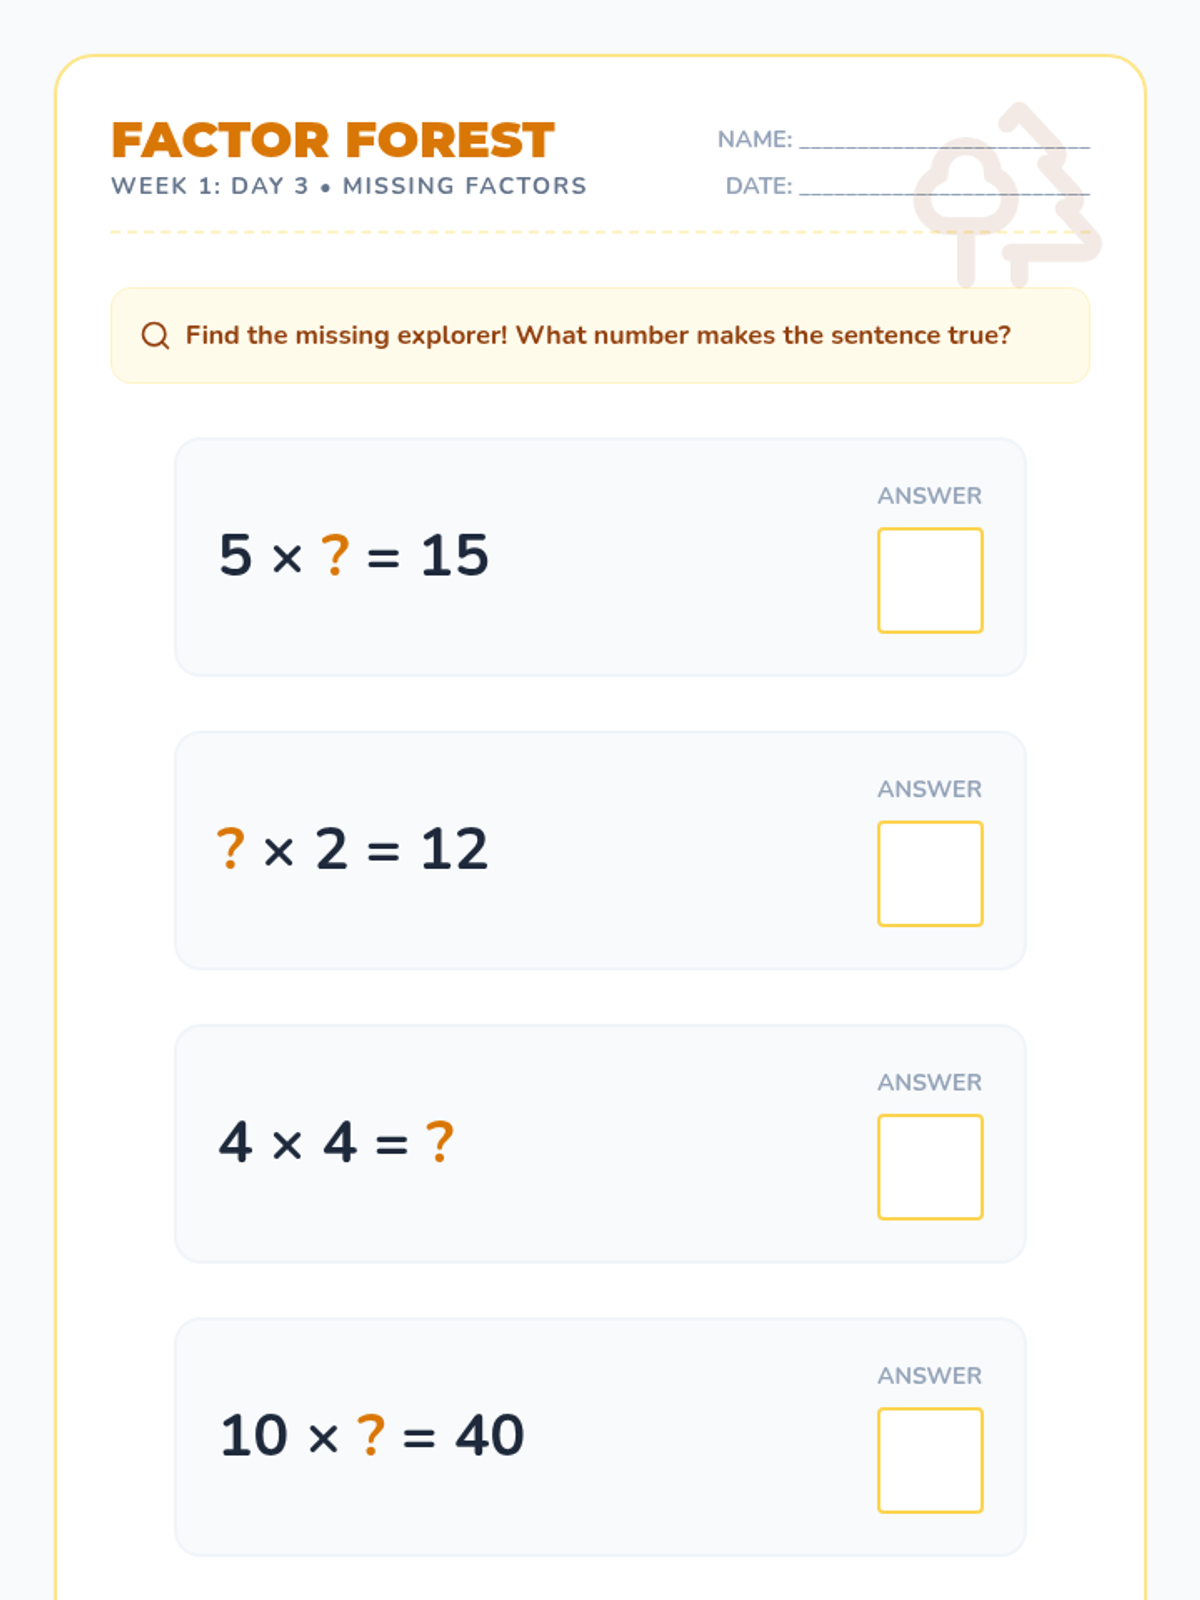
A Day 3 worksheet for the Jungle Expedition unit, focusing on finding missing factors with a clear, large-print layout for IEP students.