Data representation, distributions, and statistical variability using sampling and inference techniques. Integrates probability models, compound events, bivariate patterns, and linear models to guide data-driven decision making.
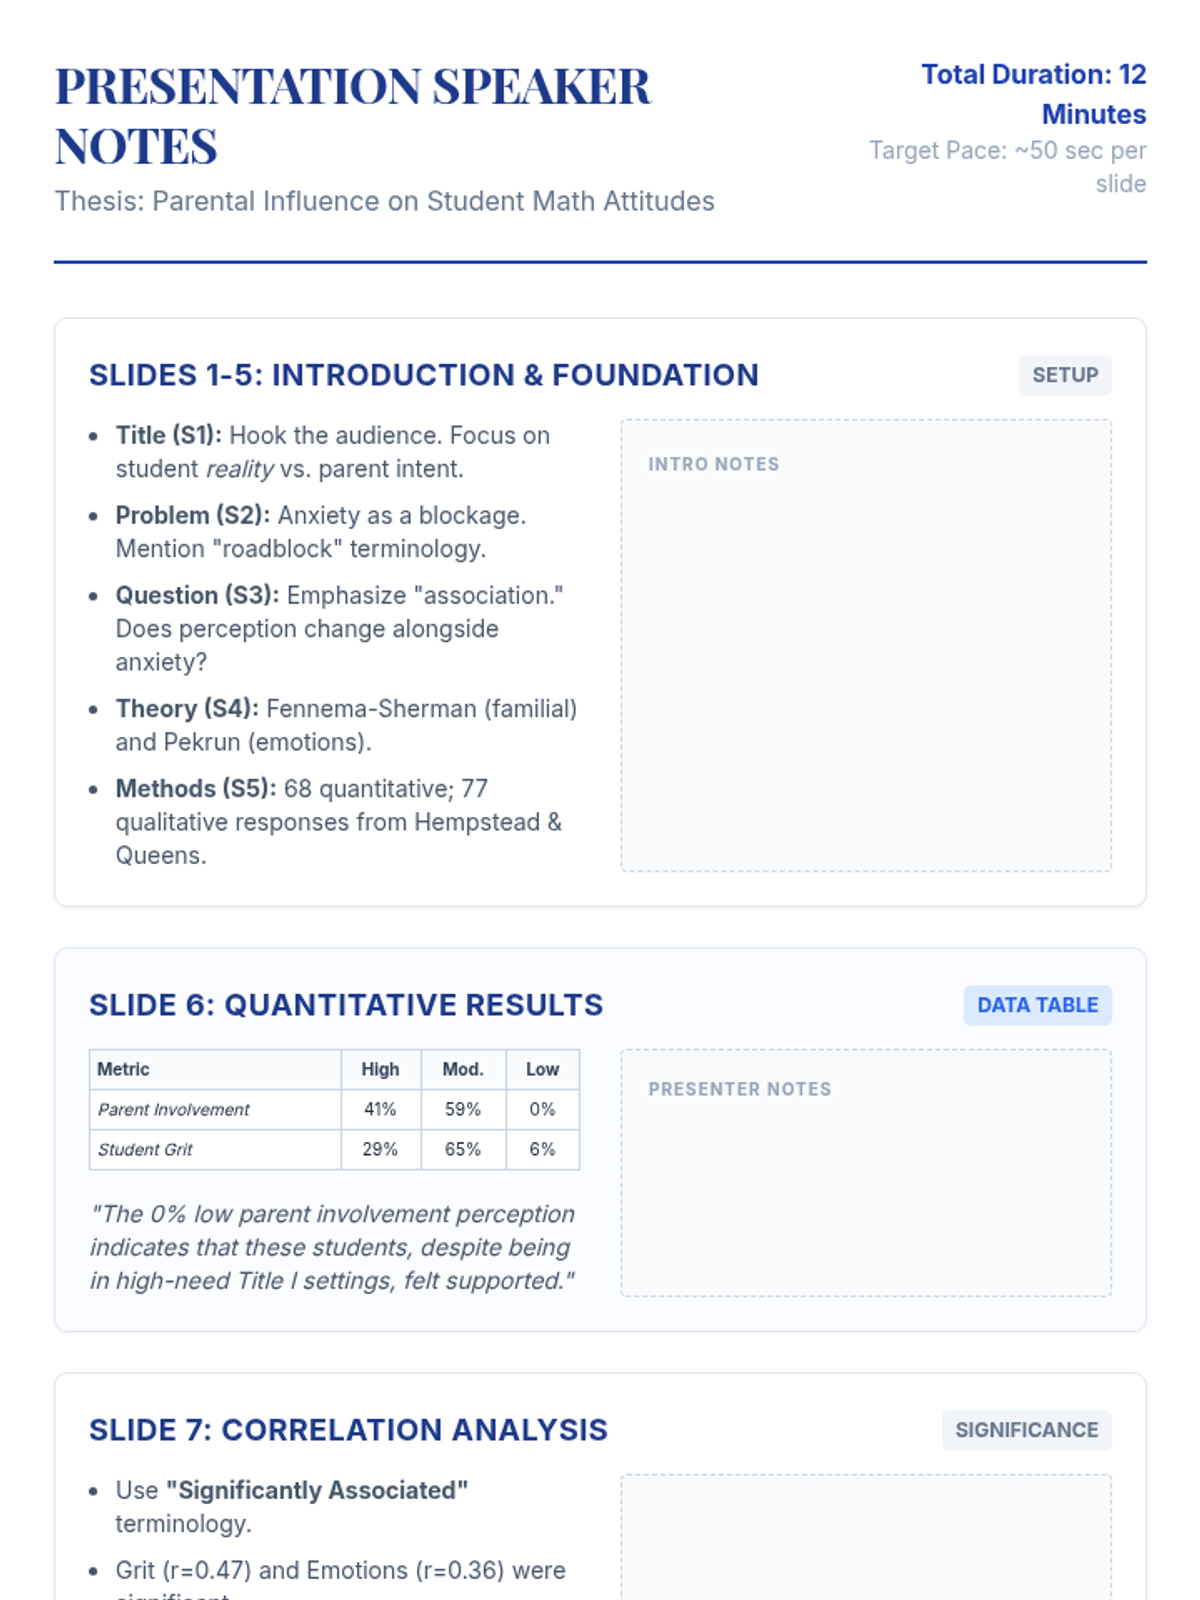
A updated presenter-facing document providing a slide-by-slide script, timing guide, and space for personal notes, with expanded sections for limitations, conclusions, and future research. Revised for handwriting legibility and visual consistency.
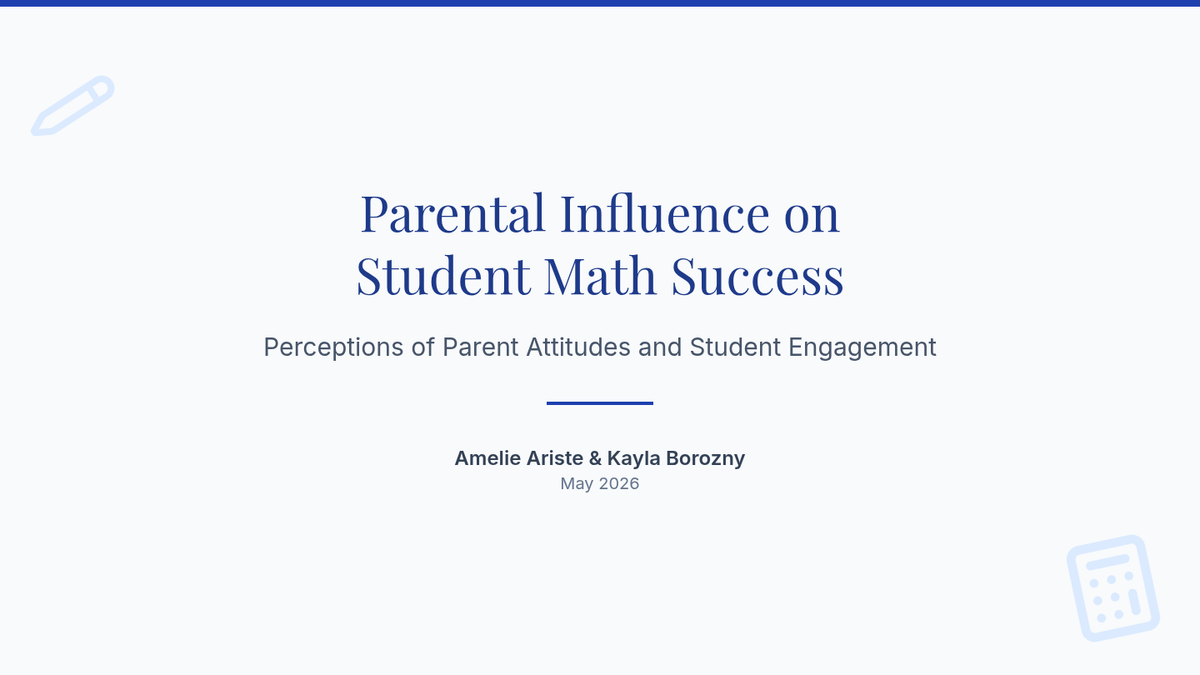
A updated 14-slide presentation based on the user's thesis, with expanded qualitative data slides, revised terminology for correlation findings, and significantly deeper detail in limitations and conclusions. Revised for high contrast and label clarity.
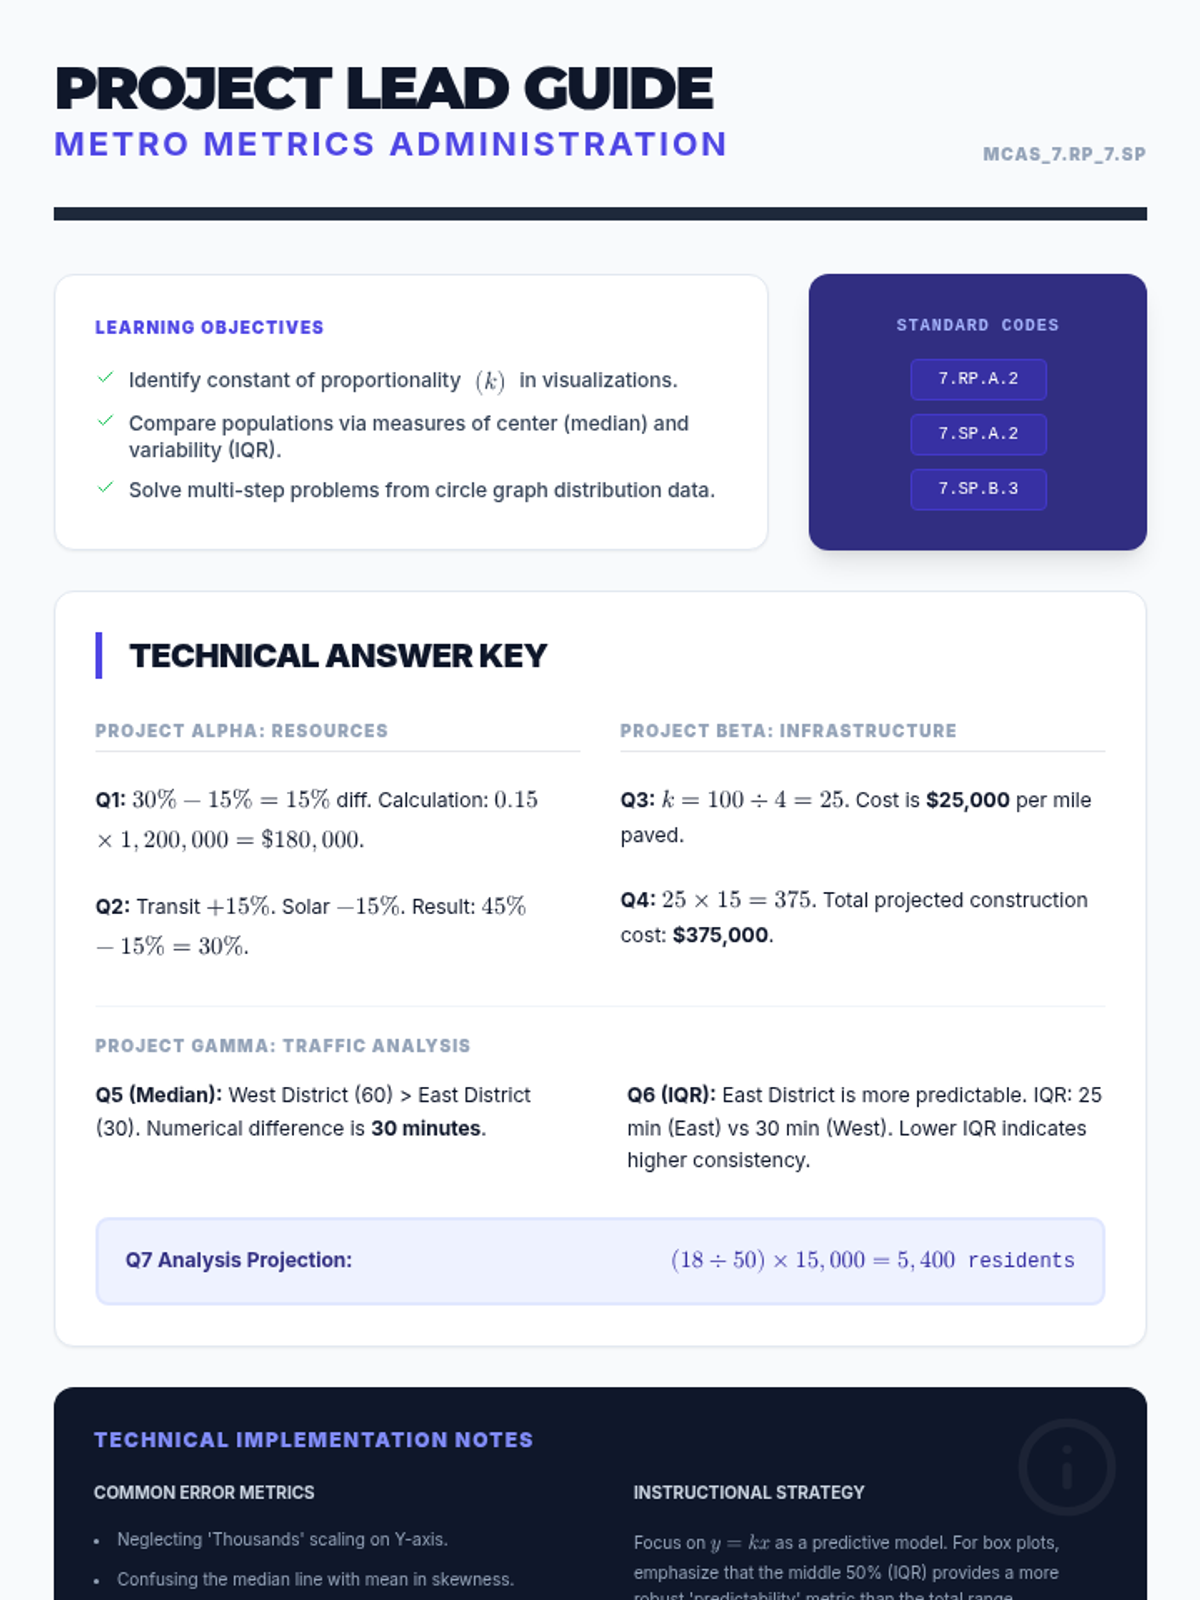
A professional teacher's guide for the Metro Metrics lesson, featuring detailed answer keys, technical implementation notes, and MCAS standards alignment.
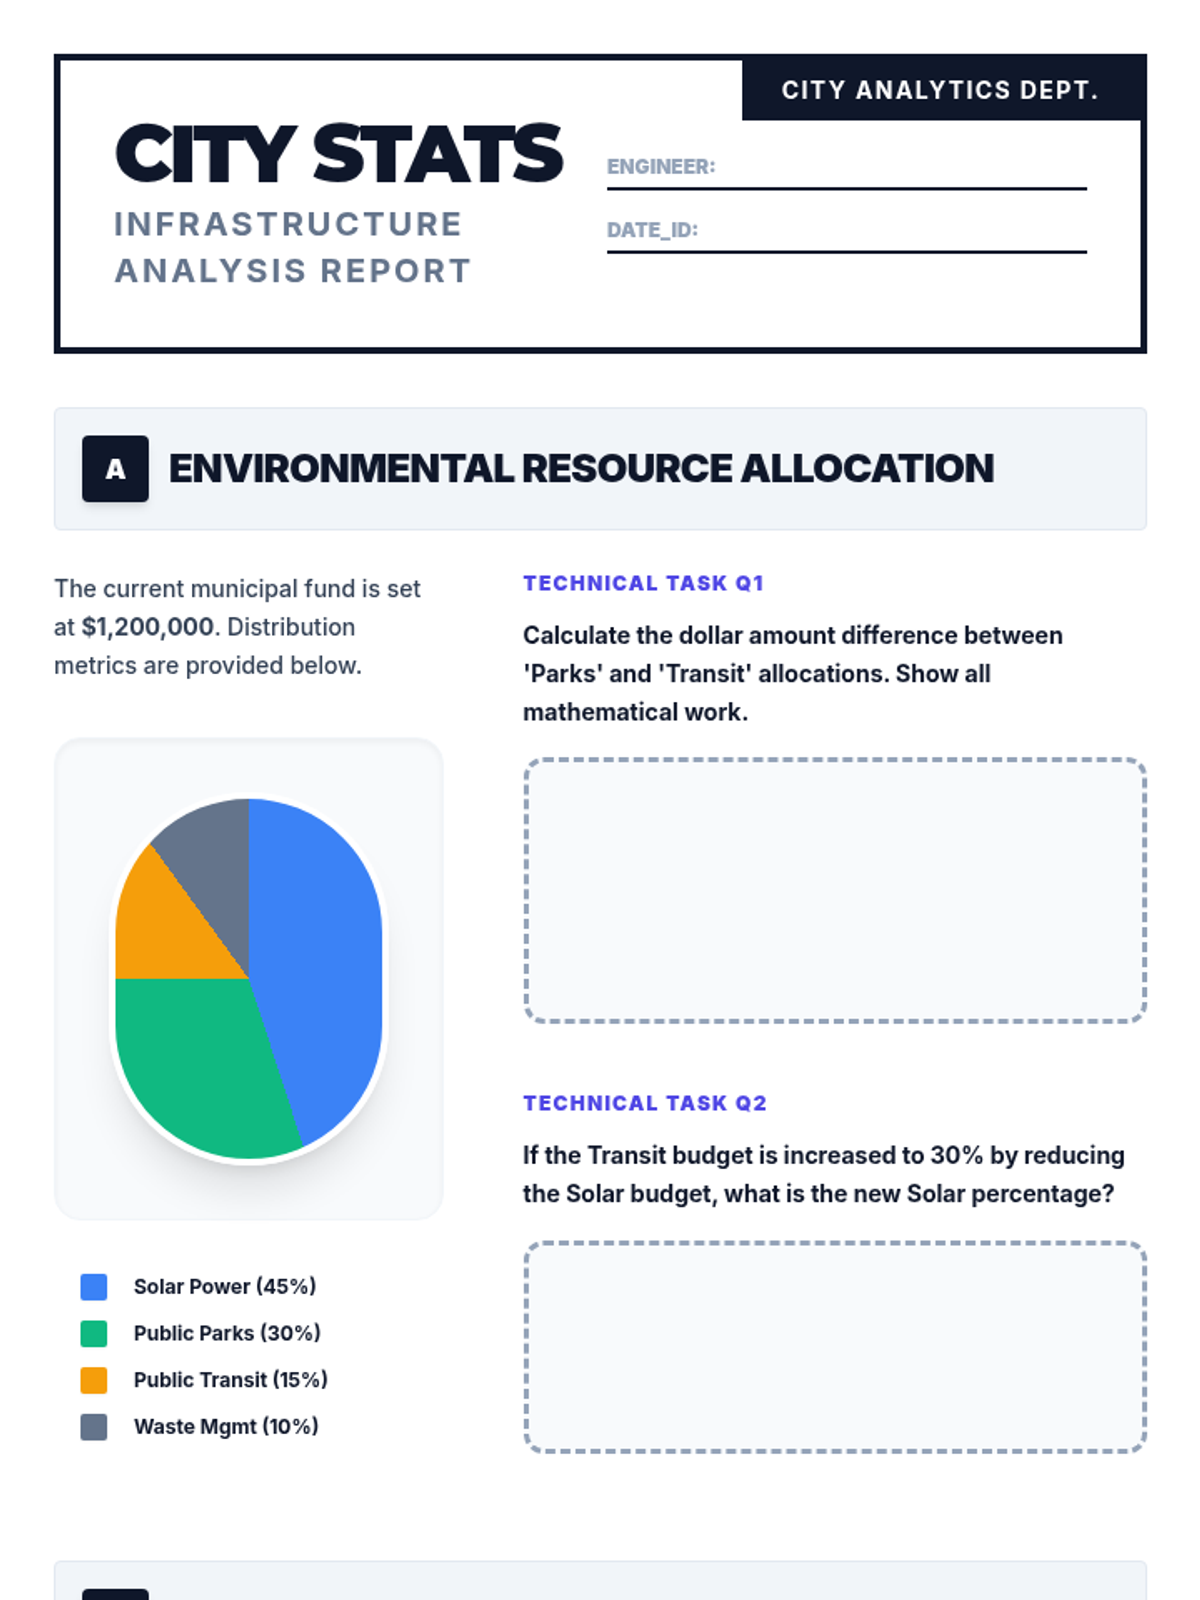
A technical practice worksheet for 7th grade students focusing on infrastructure data, including circle graphs, proportional relationships, and box plots. Designed for MCAS alignment.
A slide deck for teaching graph inferencing skills, focusing on circle graphs, box plots, and proportional relationships within an Urban Analytics context. Includes MCAS-aligned strategy slides.
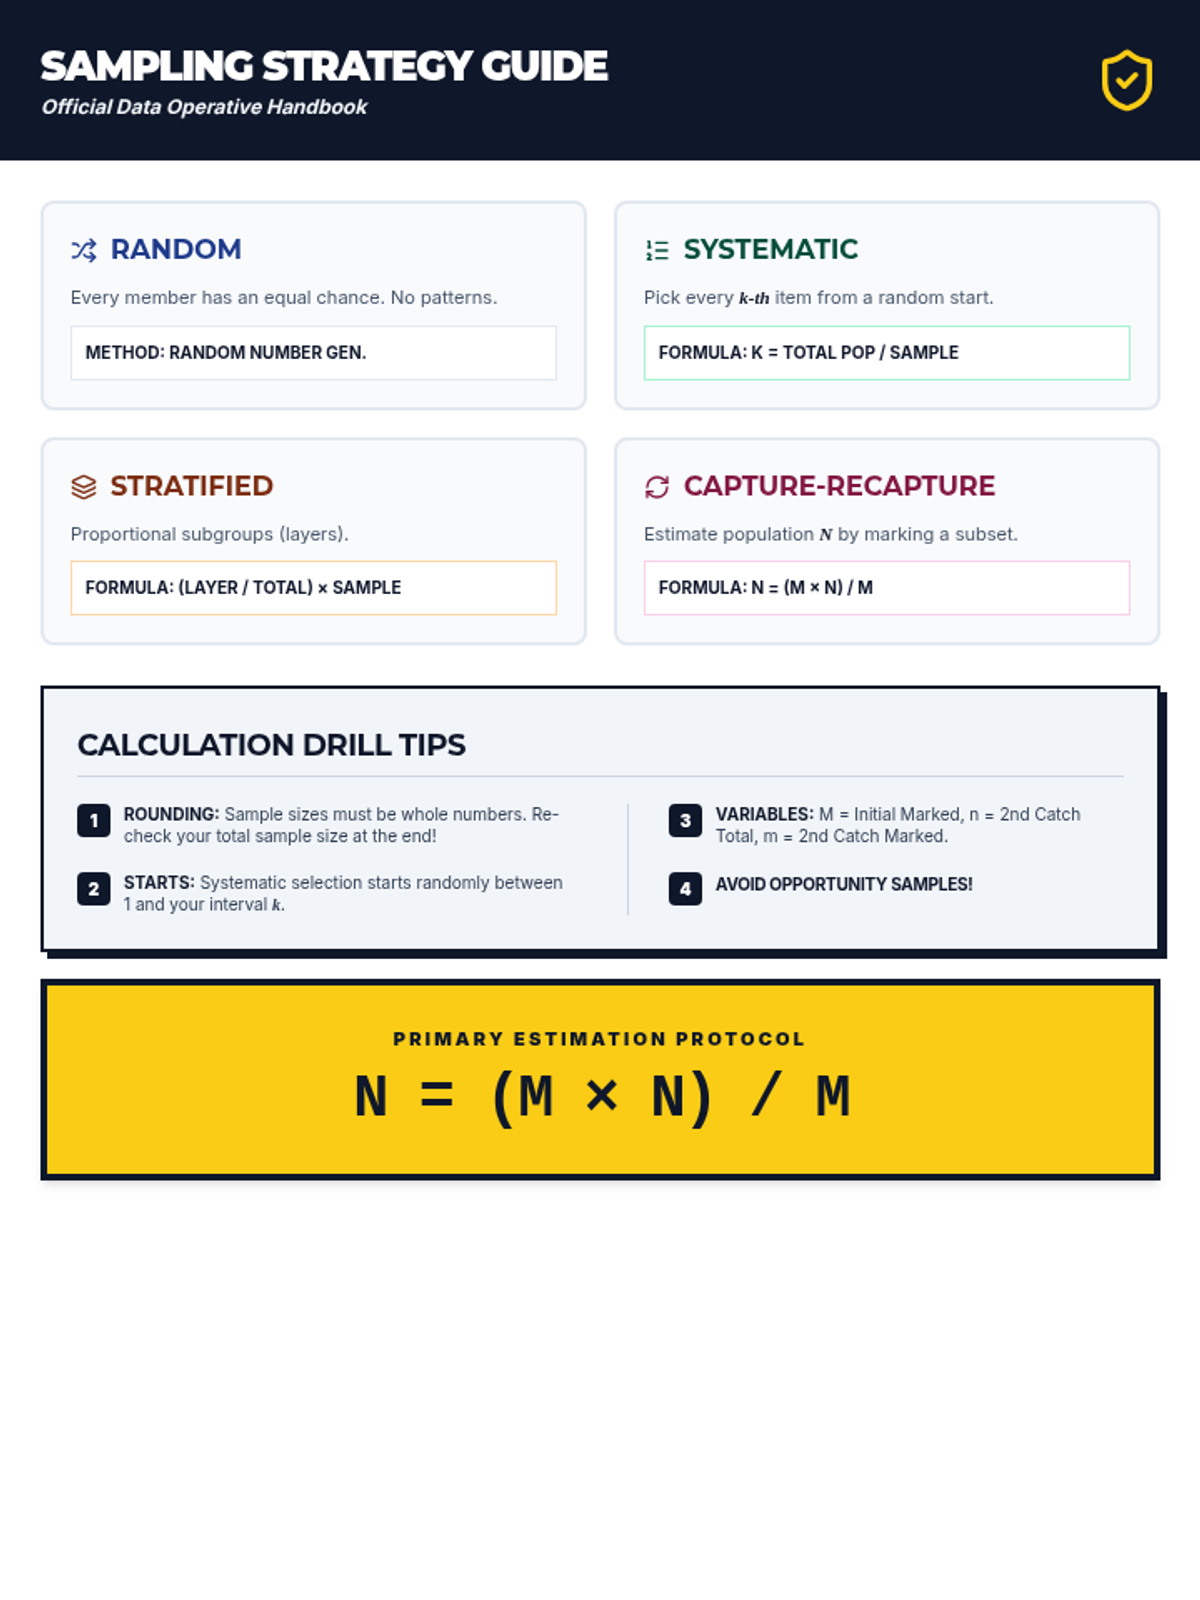
A quick-reference 'cheat sheet' for Year 8 students, summarizing the formulas and methods for random, systematic, stratified, and capture-recapture sampling.
A secret-agent themed slide deck for Year 8 students, explaining the theory and calculation methods for systematic, stratified, and capture-recapture sampling, featuring worked examples.
The answer key for the Sample Size Showdown worksheet, providing full solutions and calculations for all sampling problems.
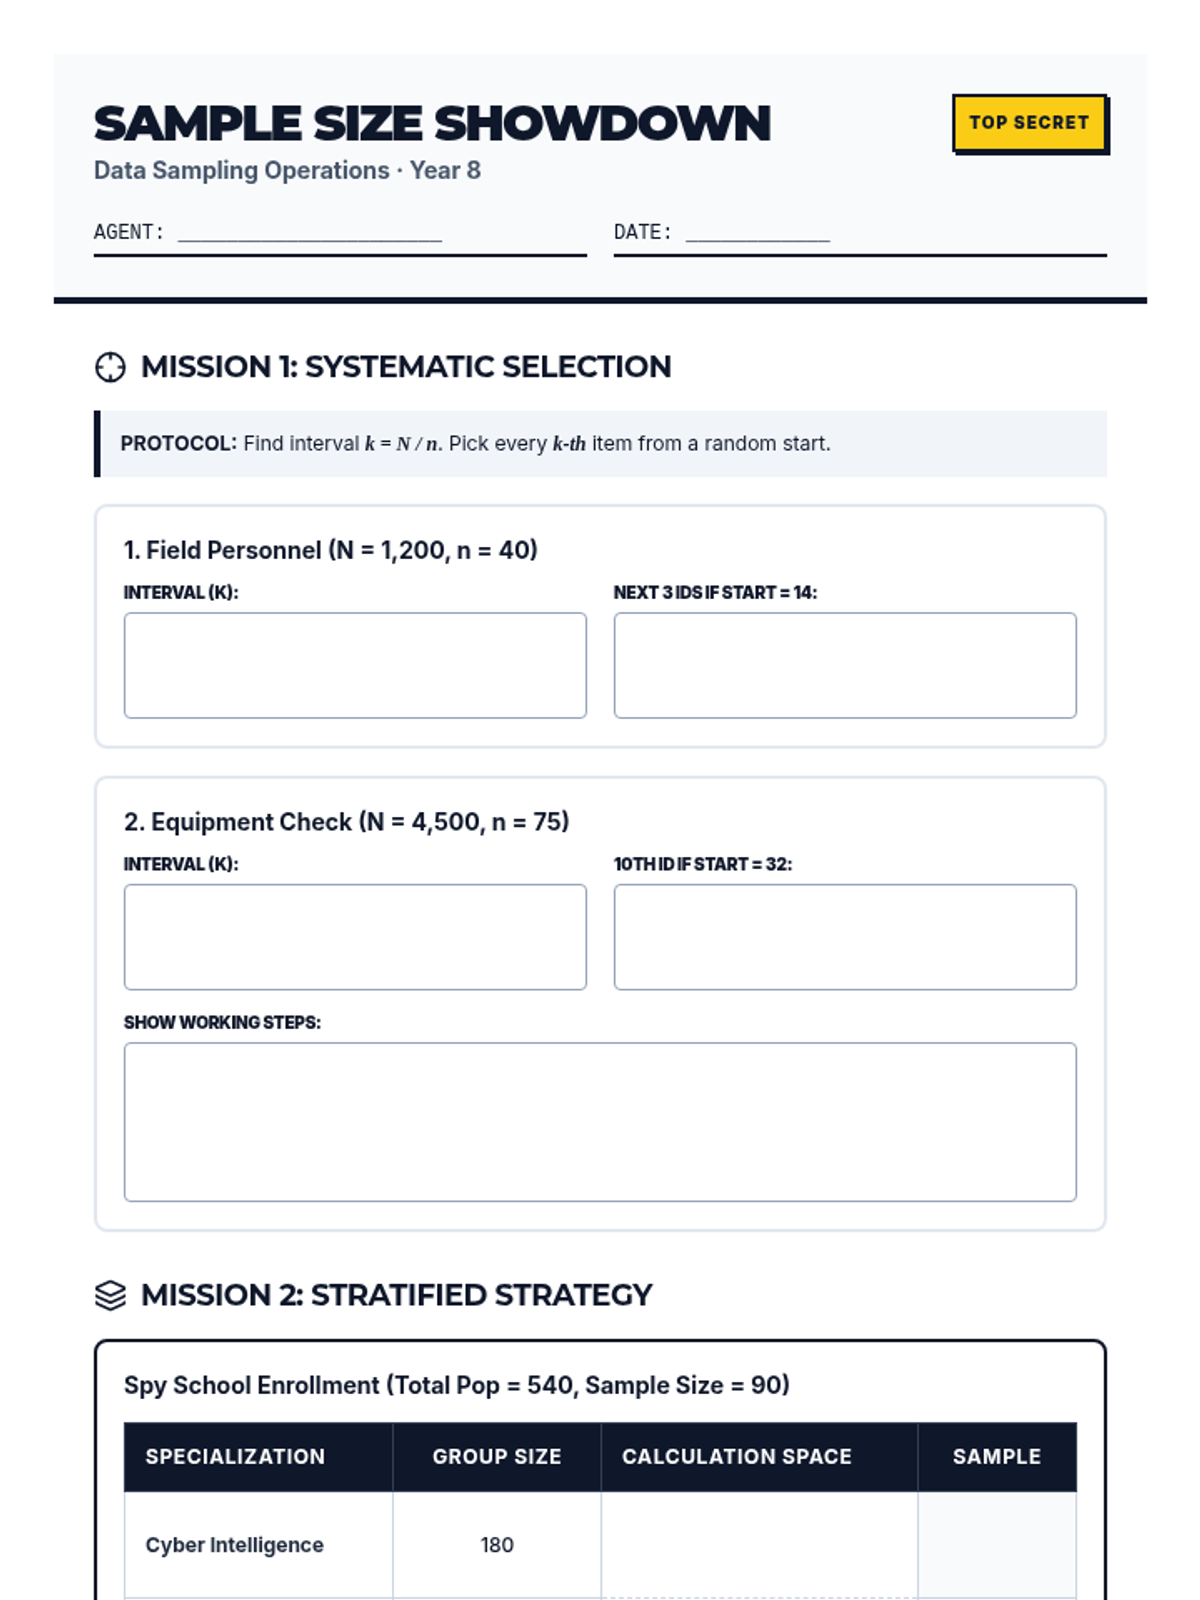
A Year 8 math worksheet titled 'Sample Size Showdown' focused on sampling calculations, including systematic, stratified, and capture-recapture methods, with a secret agent theme.
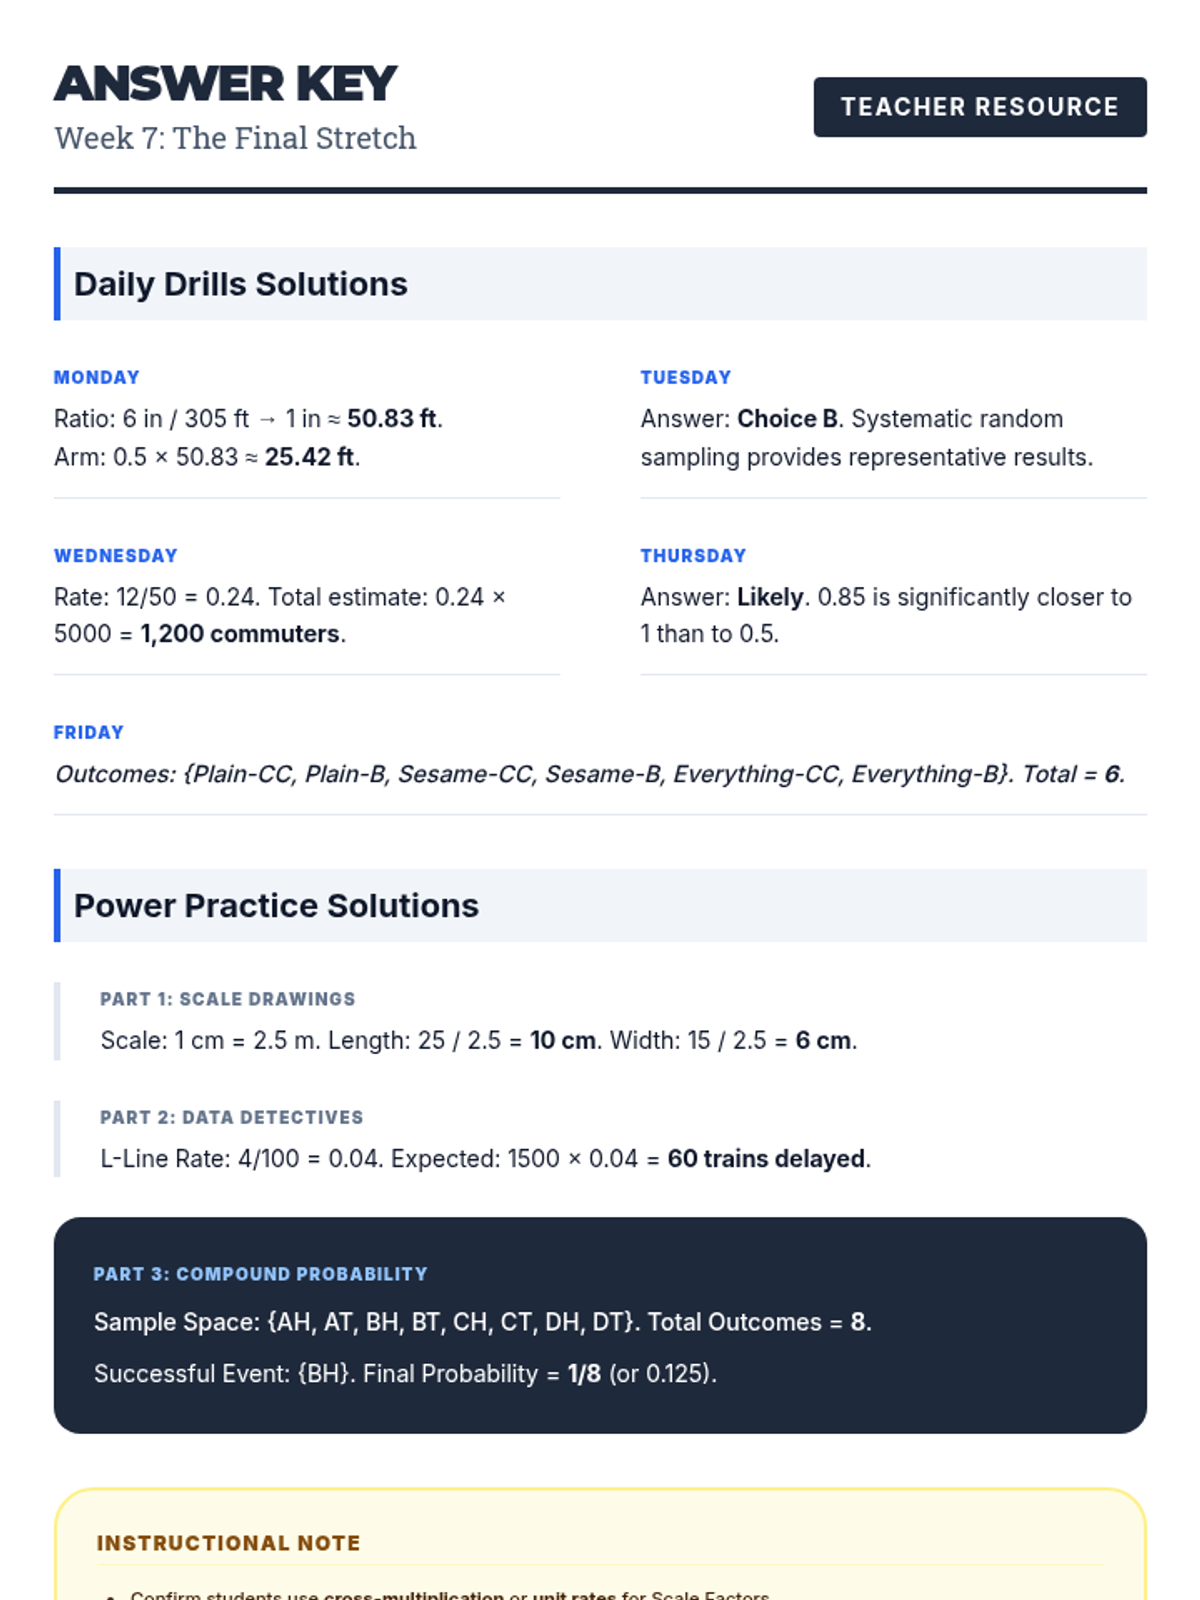
Teacher's answer key for Week 7 (Final Stretch) Daily Drills and Power Practice worksheets.
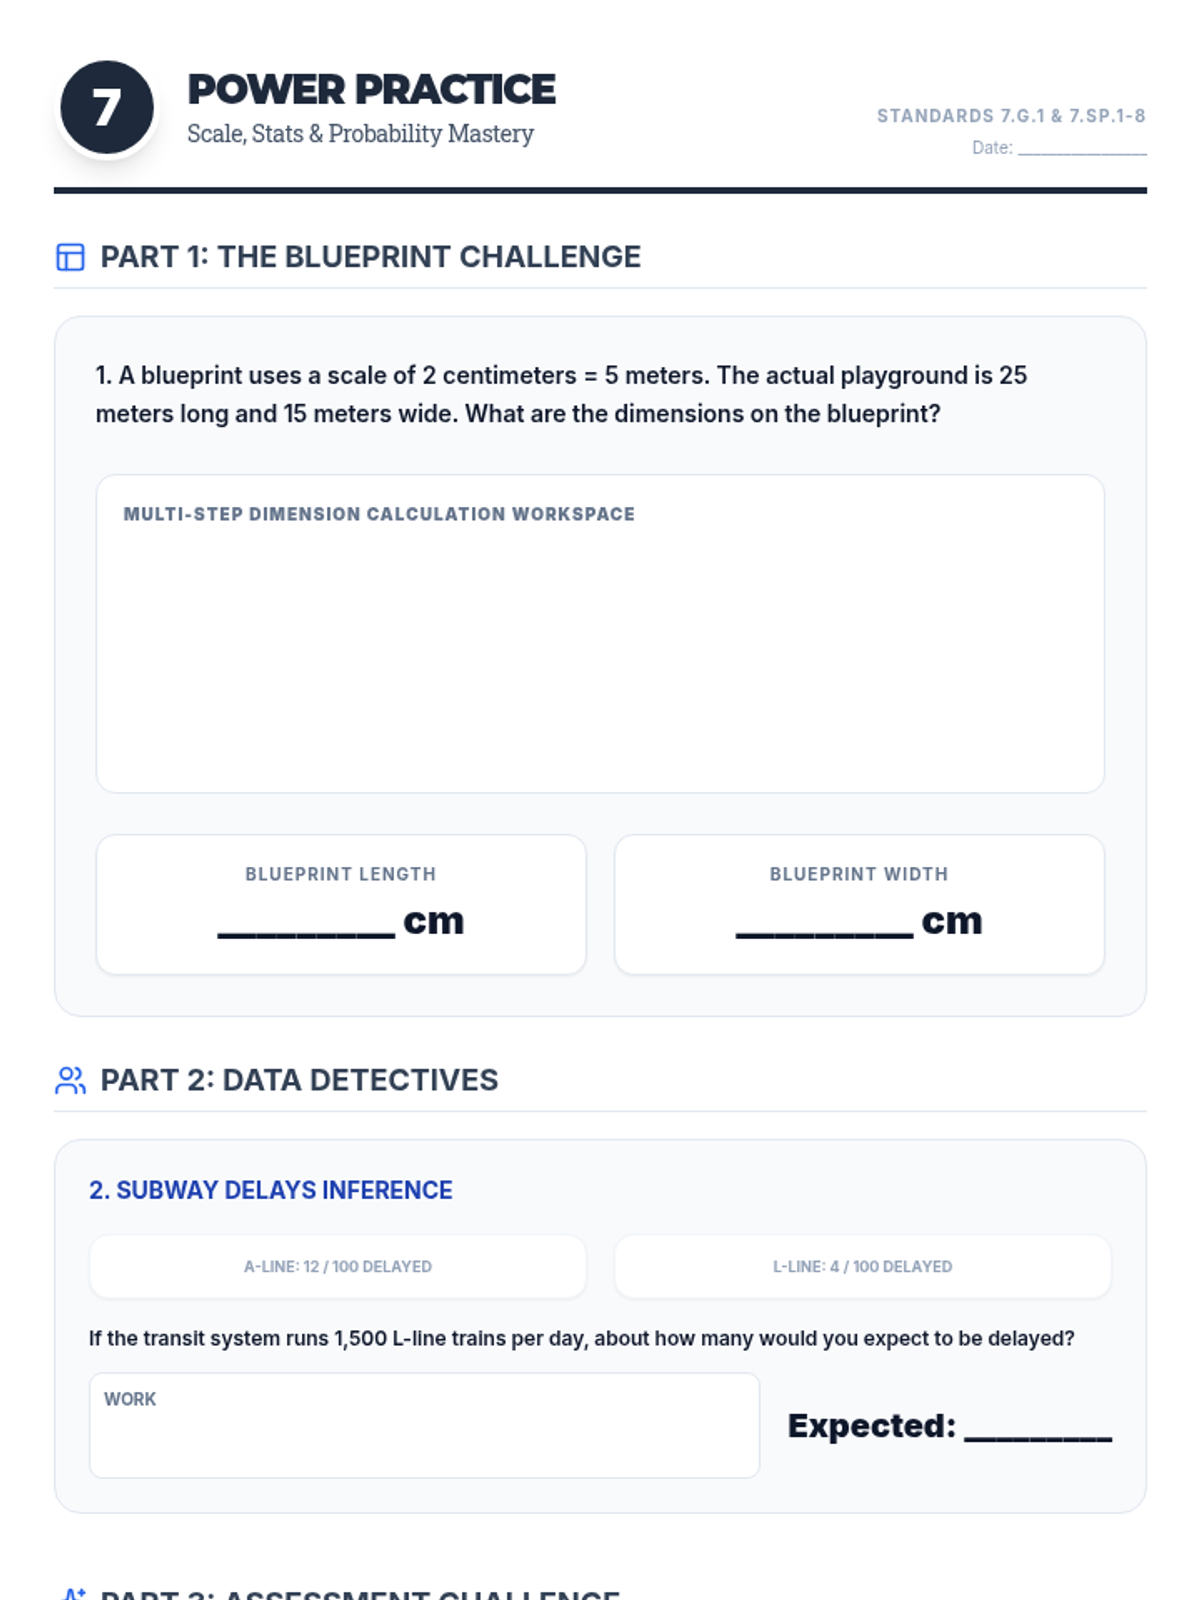
A comprehensive practice set for Week 7 (Final Stretch), covering scale drawings, comparative statistics, and compound probability.
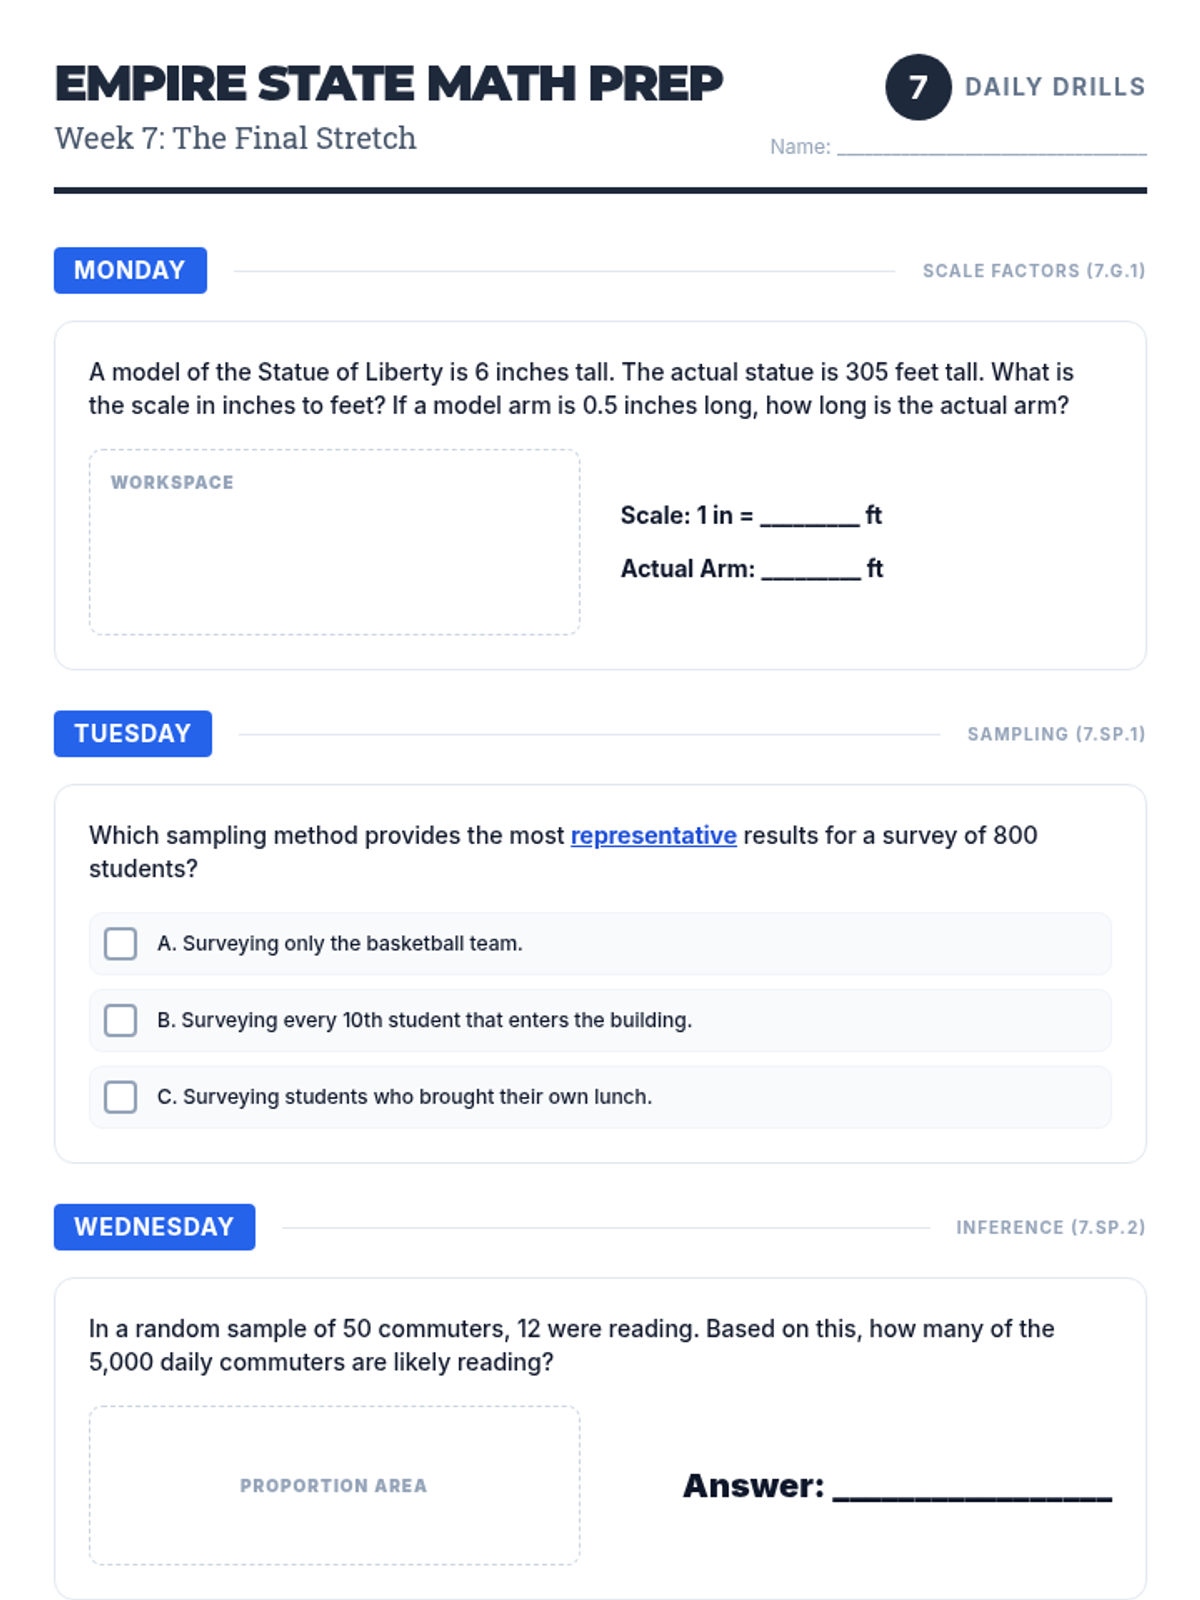
A 5-day warm-up worksheet for Week 7, covering scale factors, statistics sampling, inference, and probability basics.
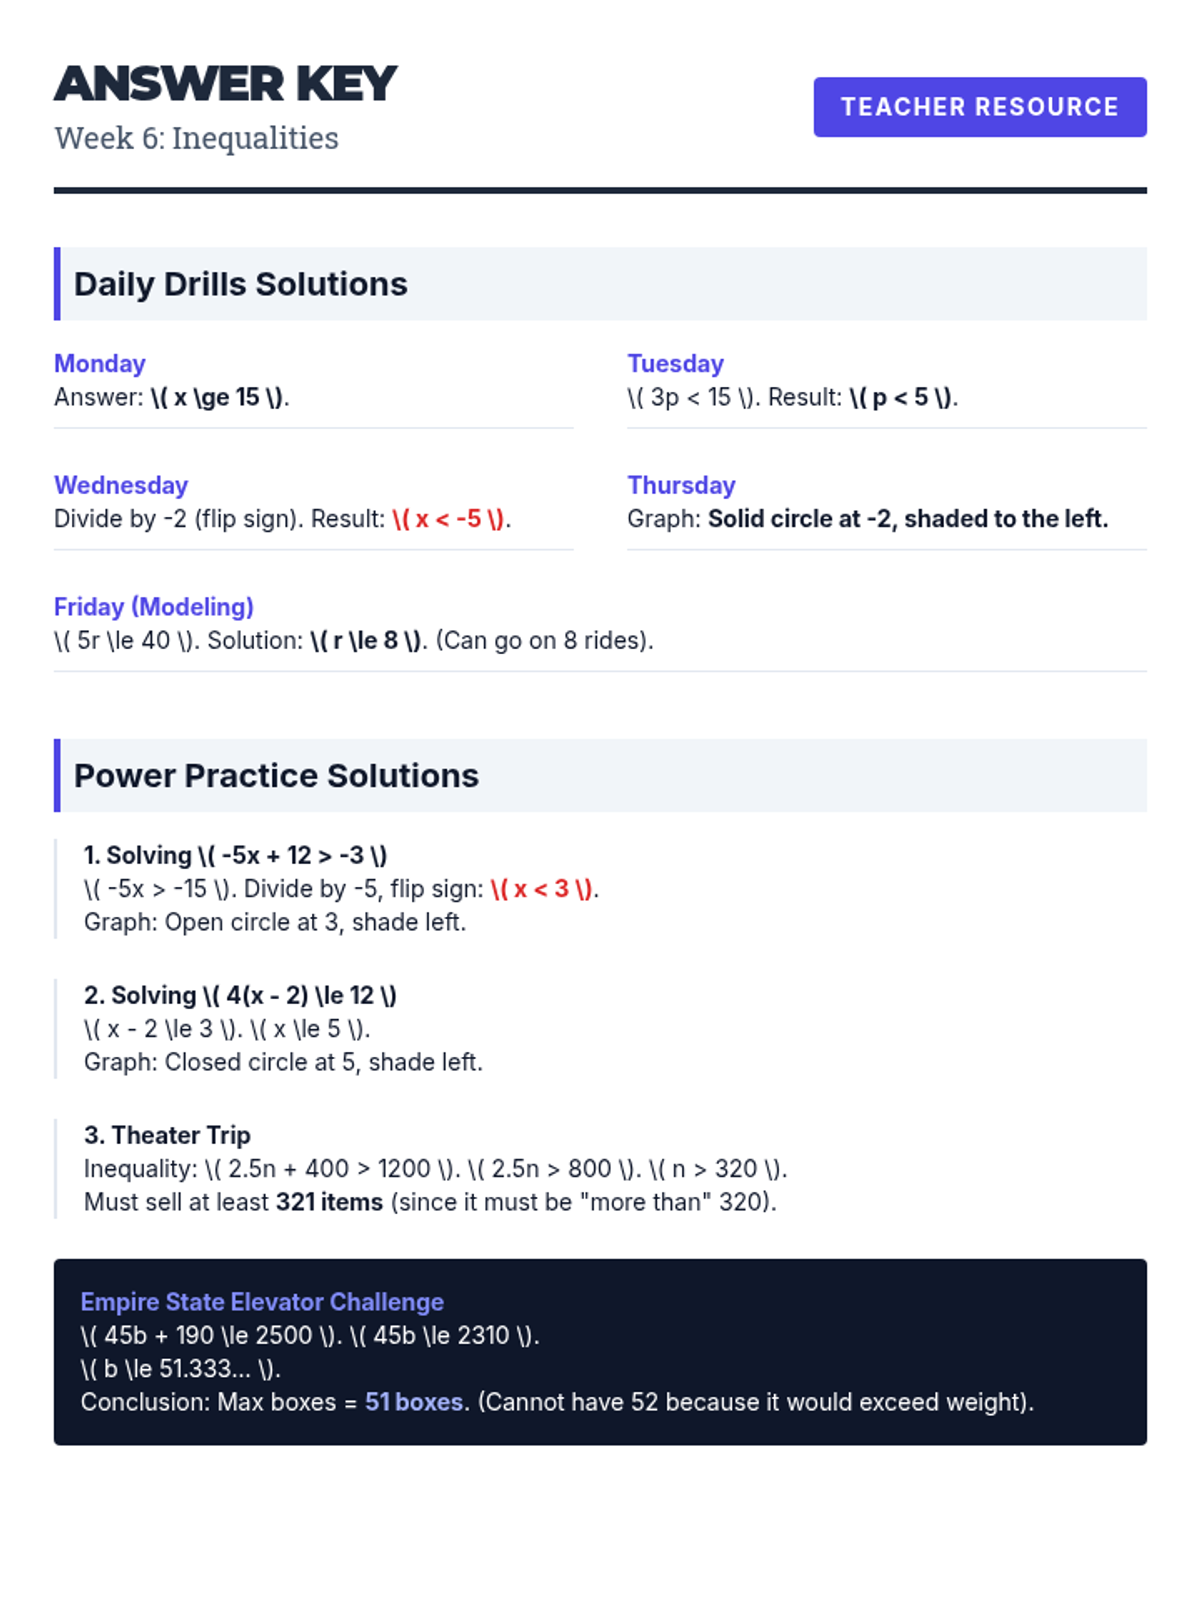
Teacher's answer key for Week 6 (Inequalities) Daily Drills and Power Practice worksheets.
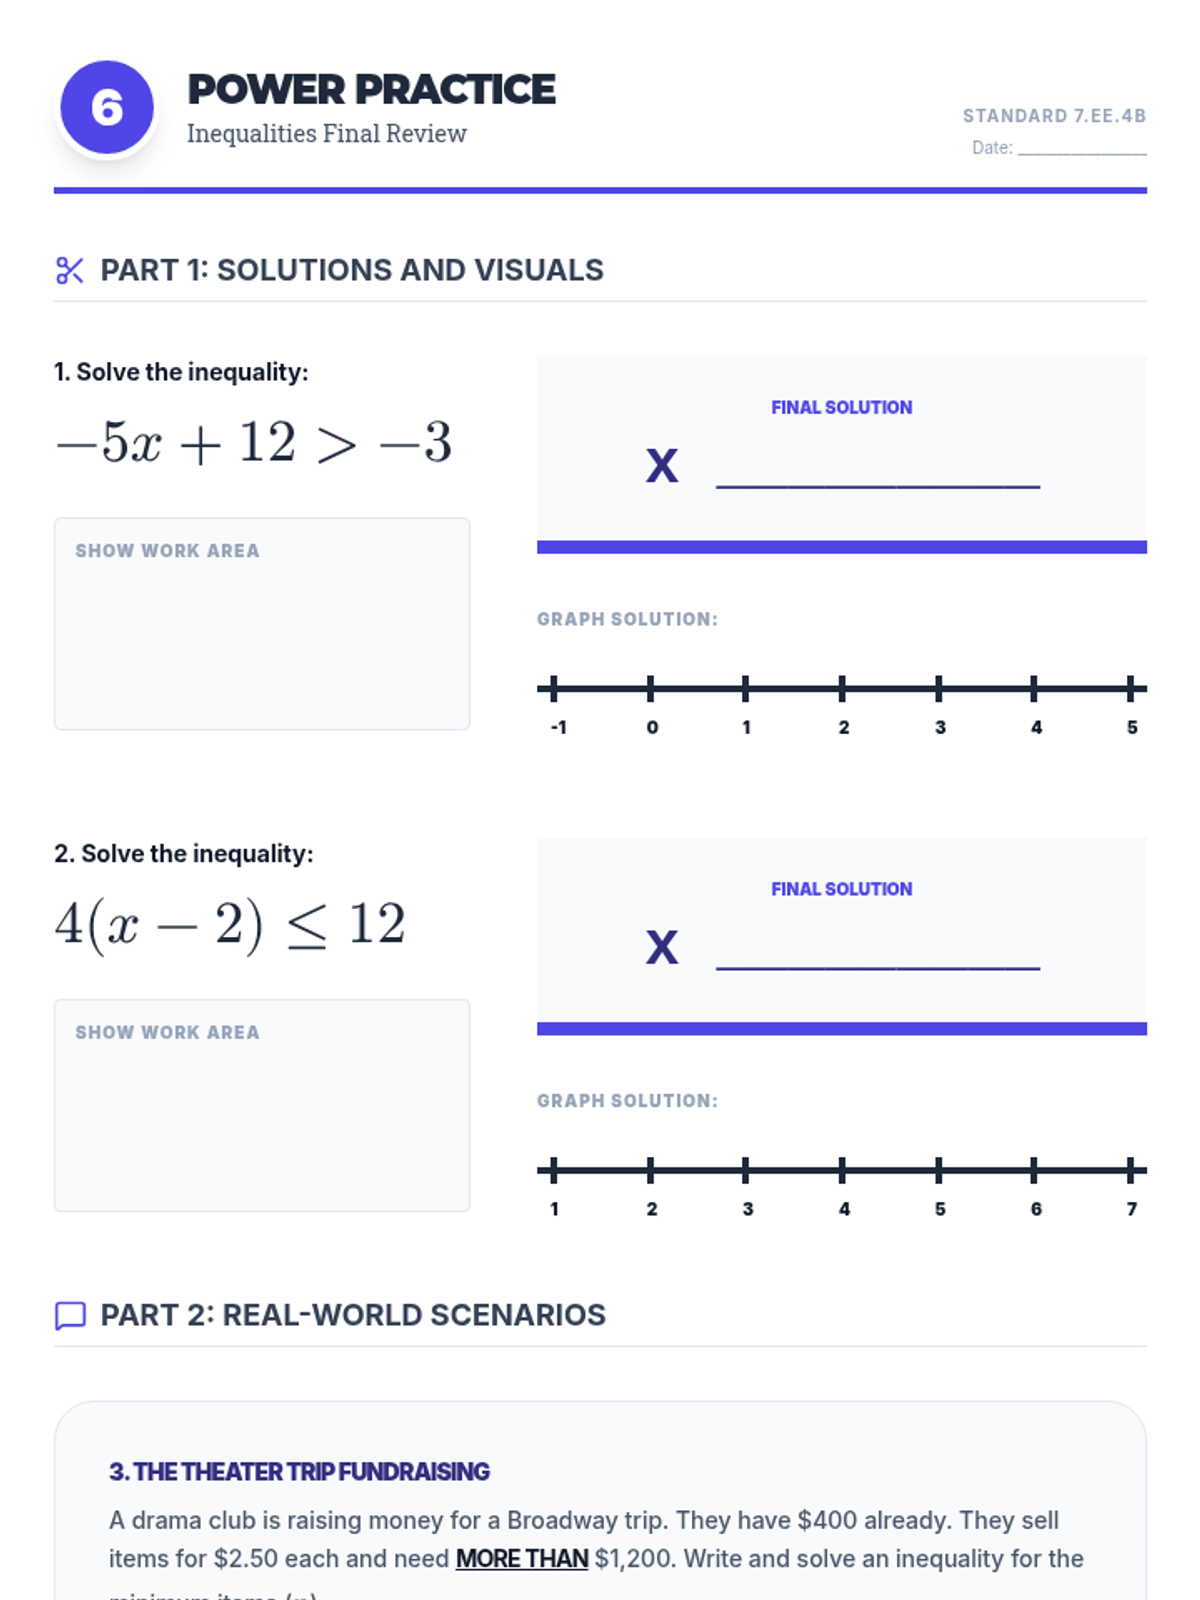
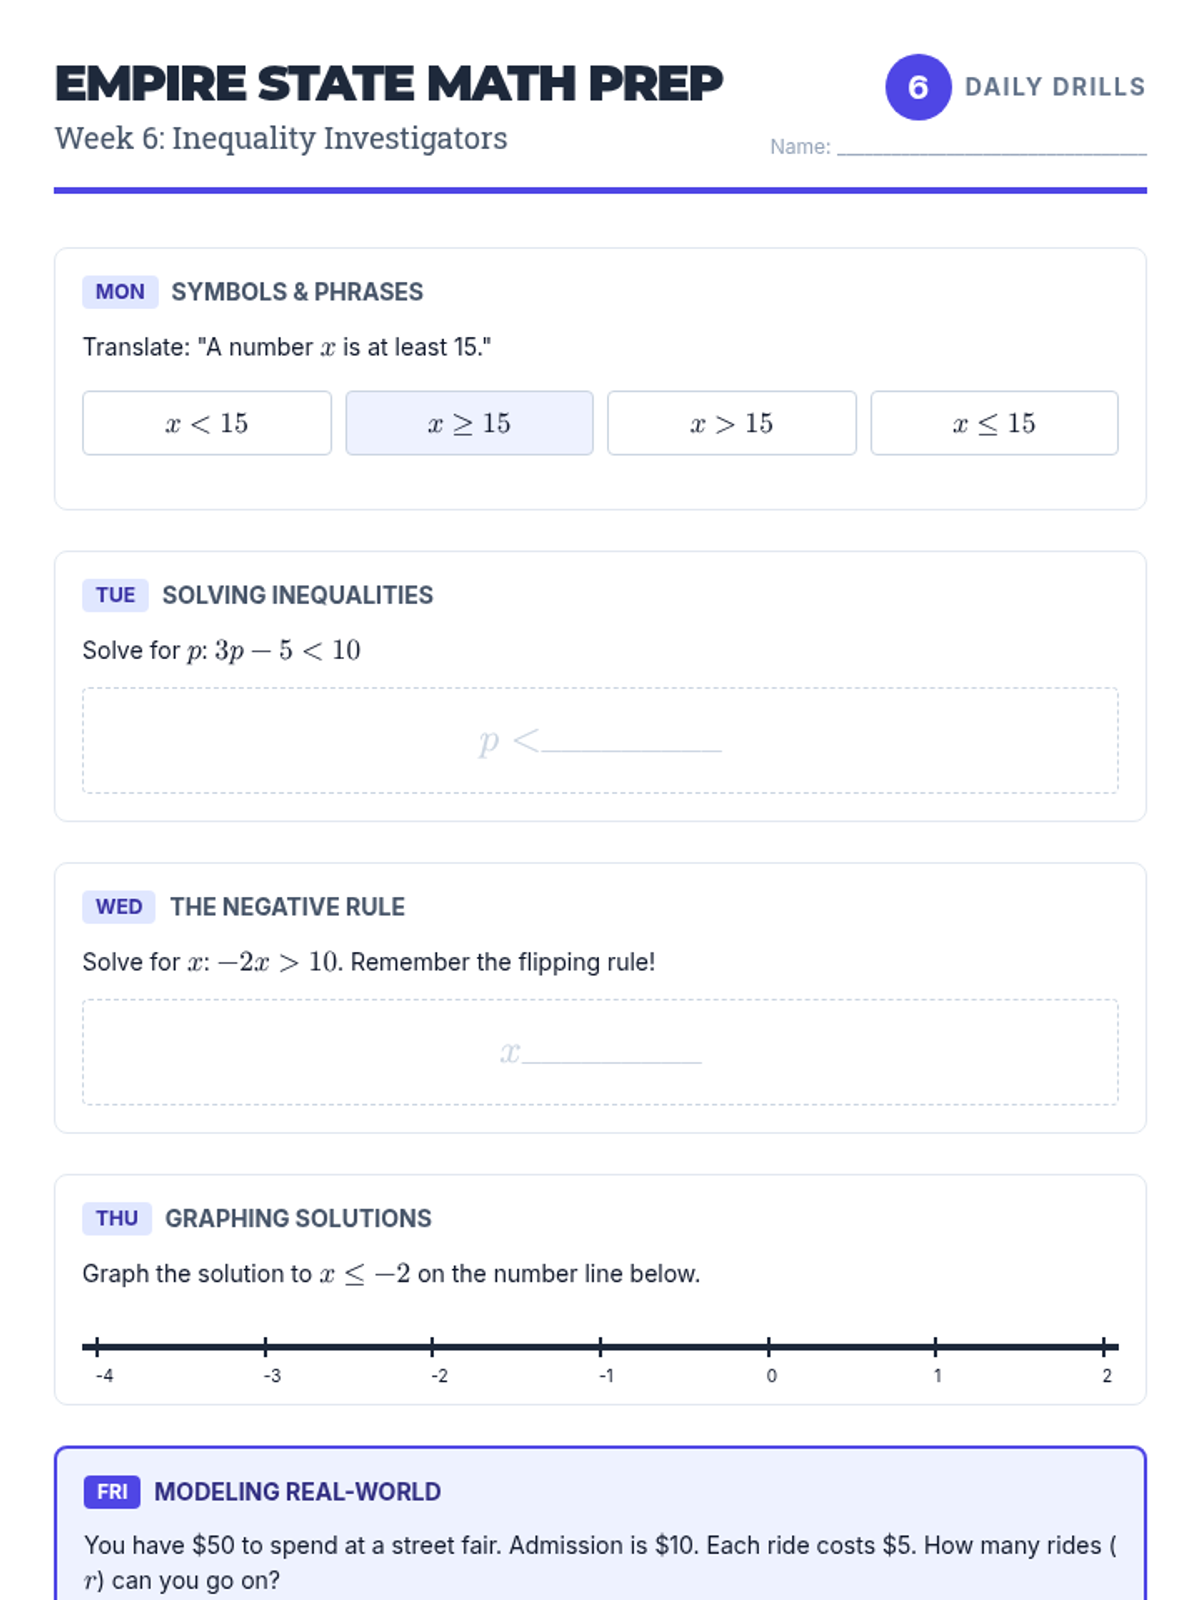
A final comprehensive practice set for Week 6 (Inequalities), including multi-step solving, graphing on number lines, and real-world New York-themed modeling.
A 5-day warm-up worksheet for Week 6, focusing on translating, solving, and graphing inequalities, with attention to the negative flipping rule.
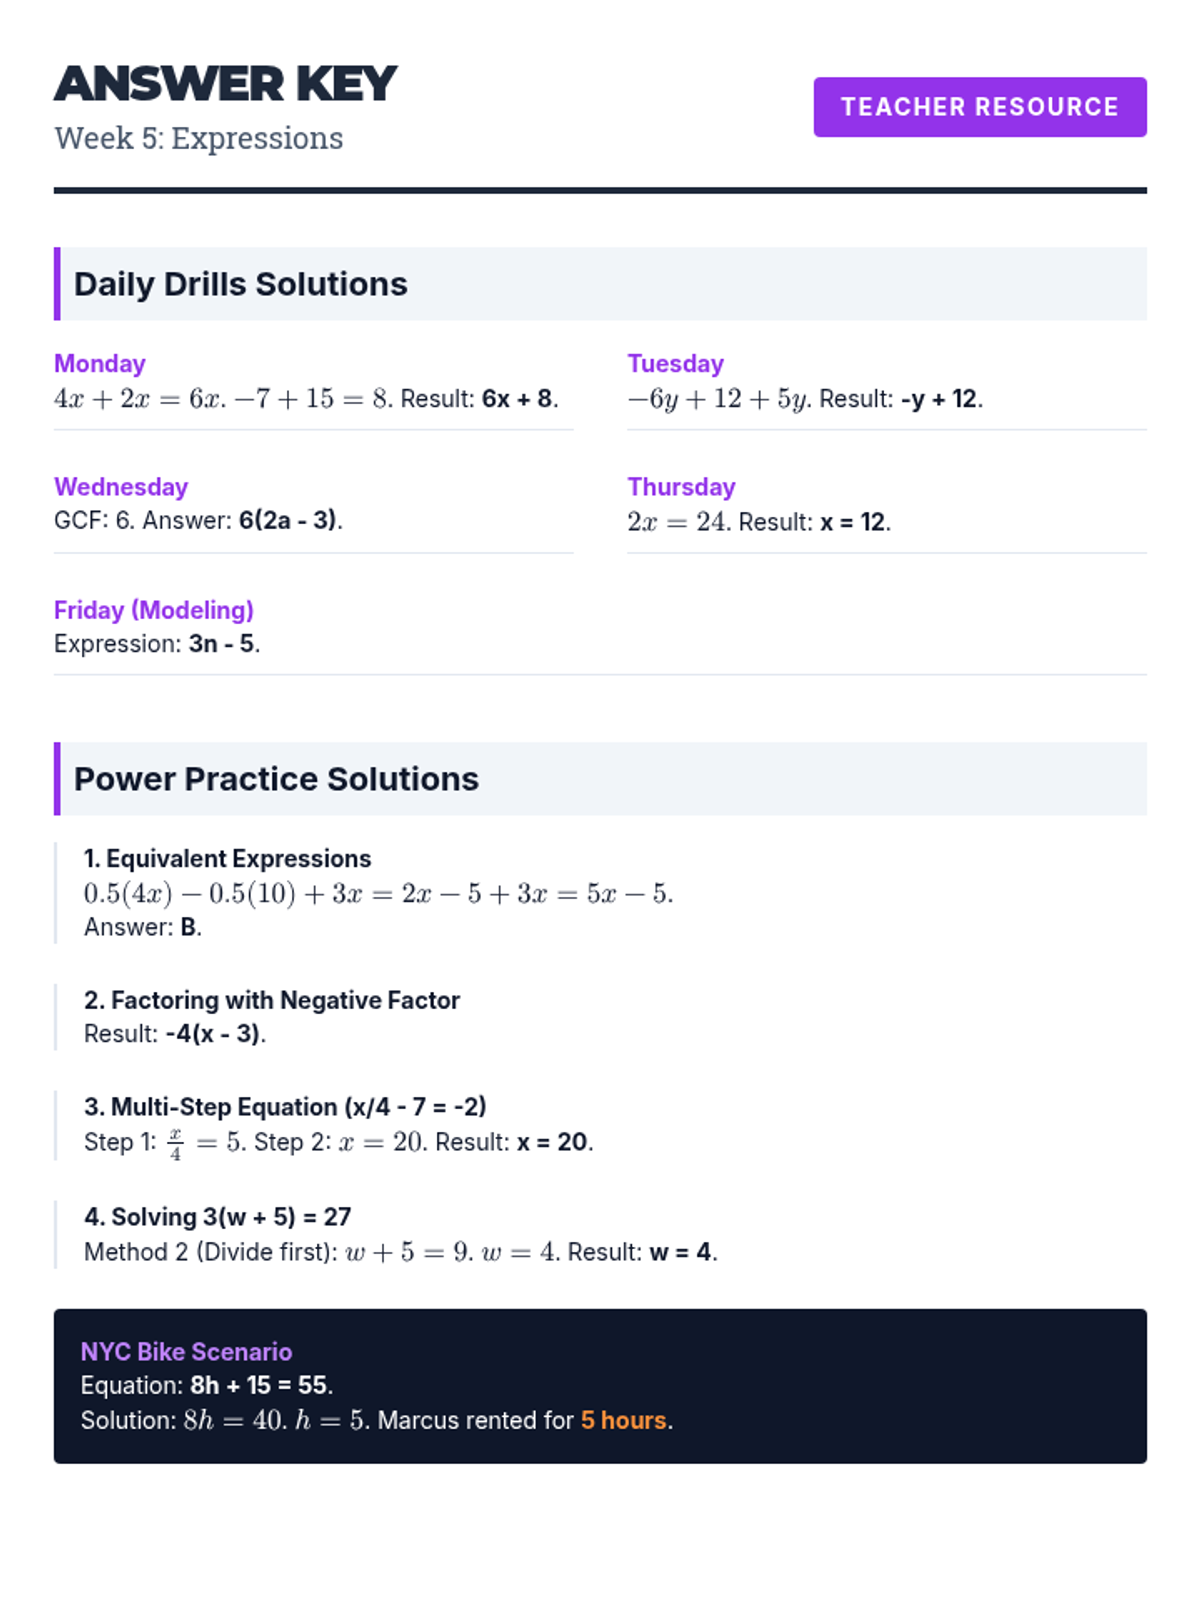
Teacher's answer key for Week 5 (Expressions) Daily Drills and Power Practice worksheets.
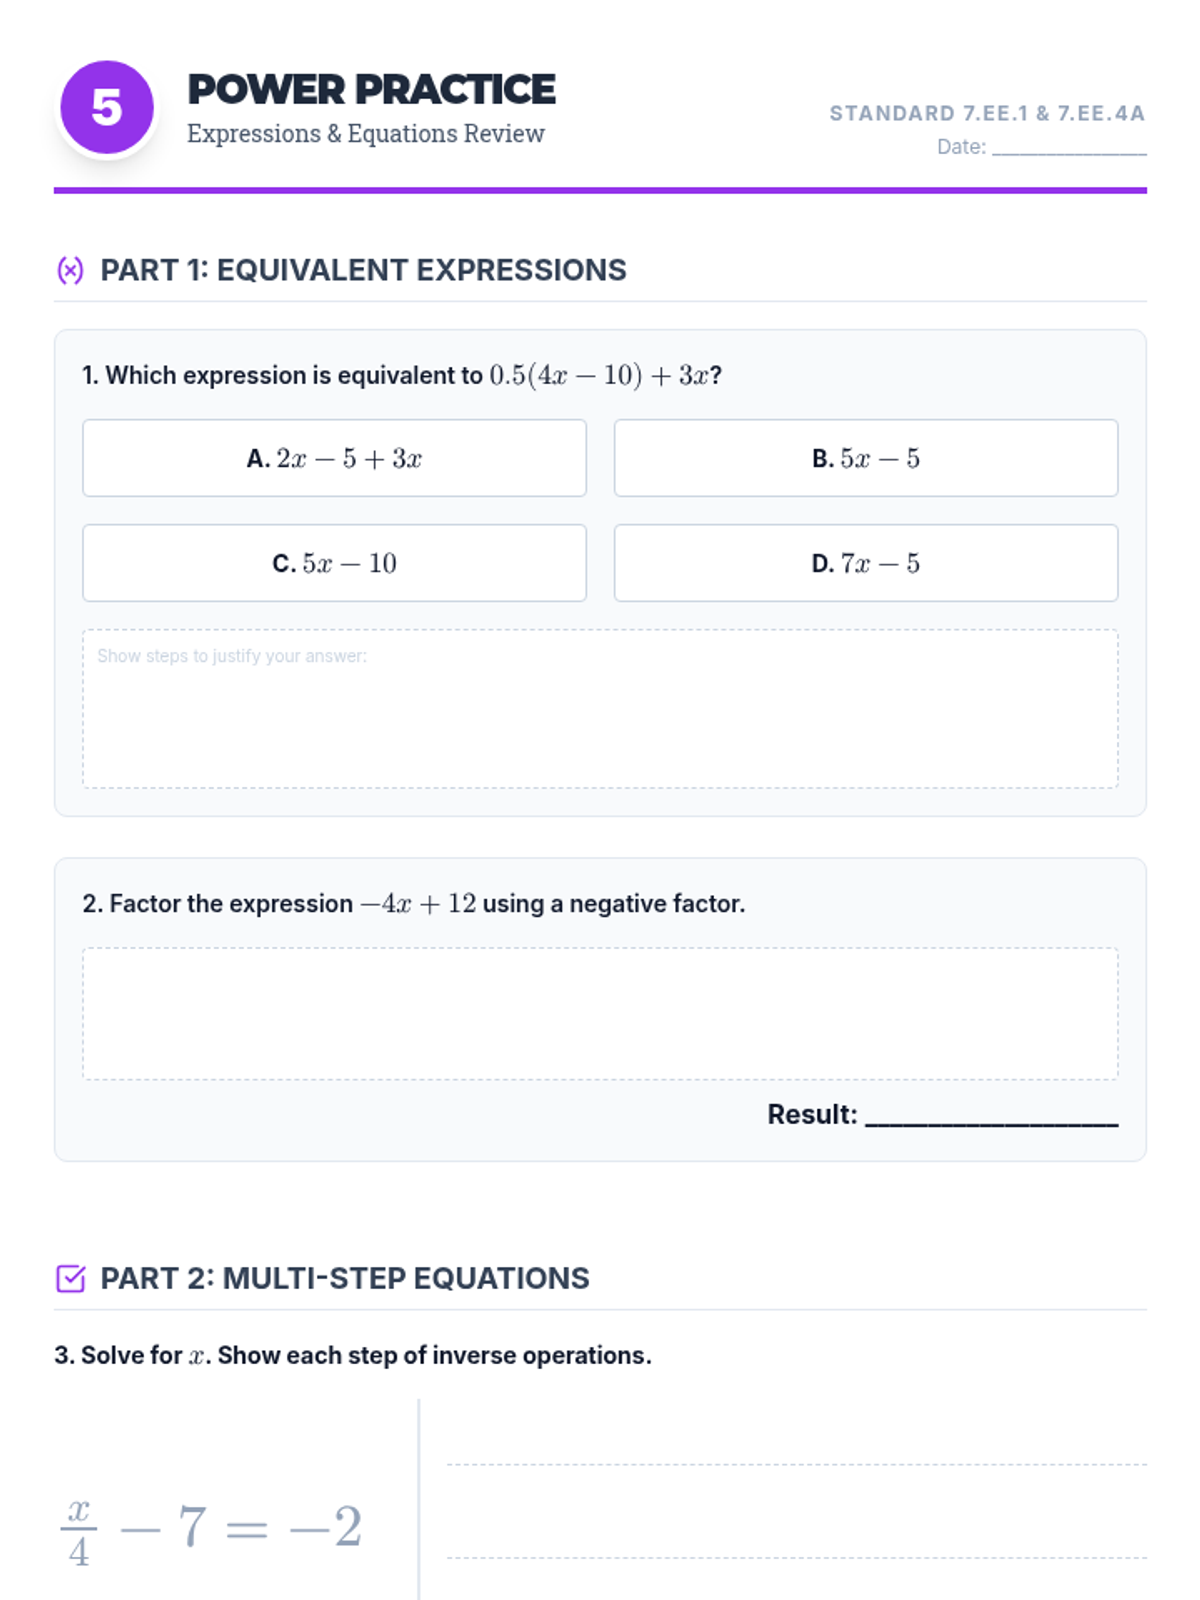
A comprehensive practice set for Week 5 (Expressions), including equivalent expressions, factoring, and solving multi-step equations in context.
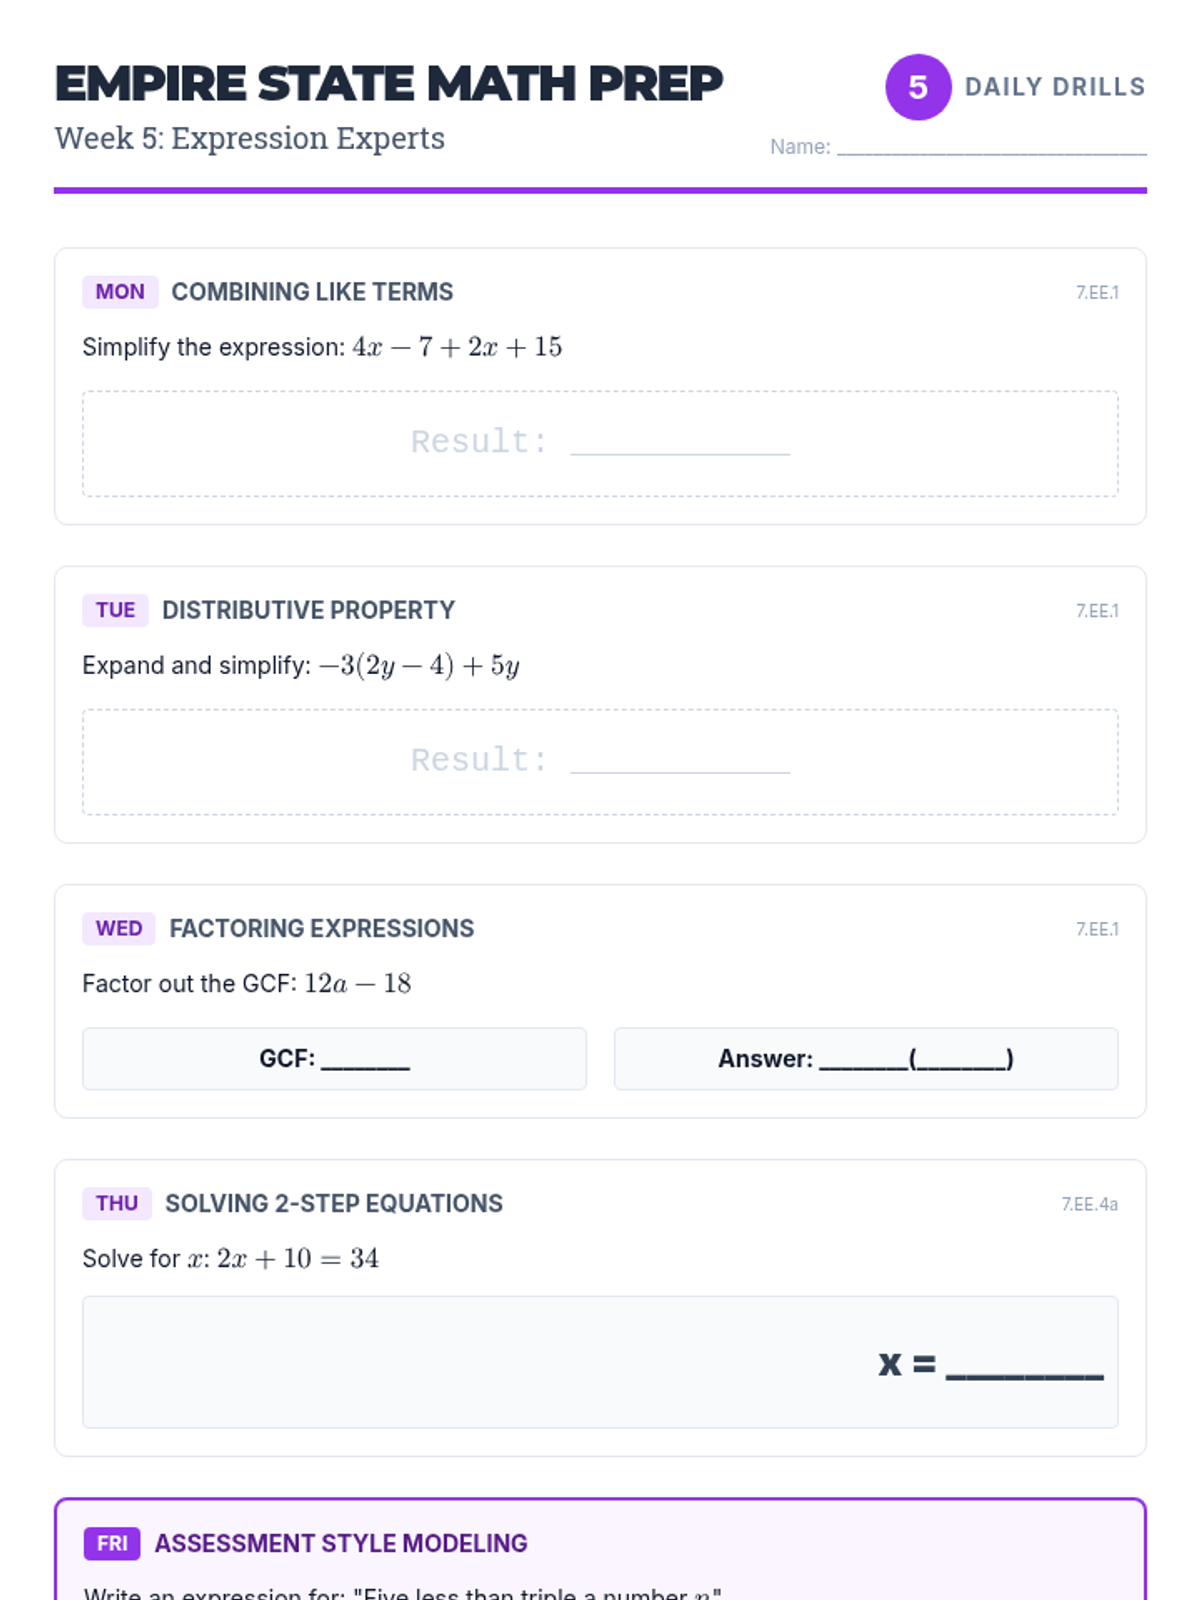
A 5-day warm-up worksheet for Week 5, focusing on simplifying, factoring, expanding expressions, and solving 2-step equations.
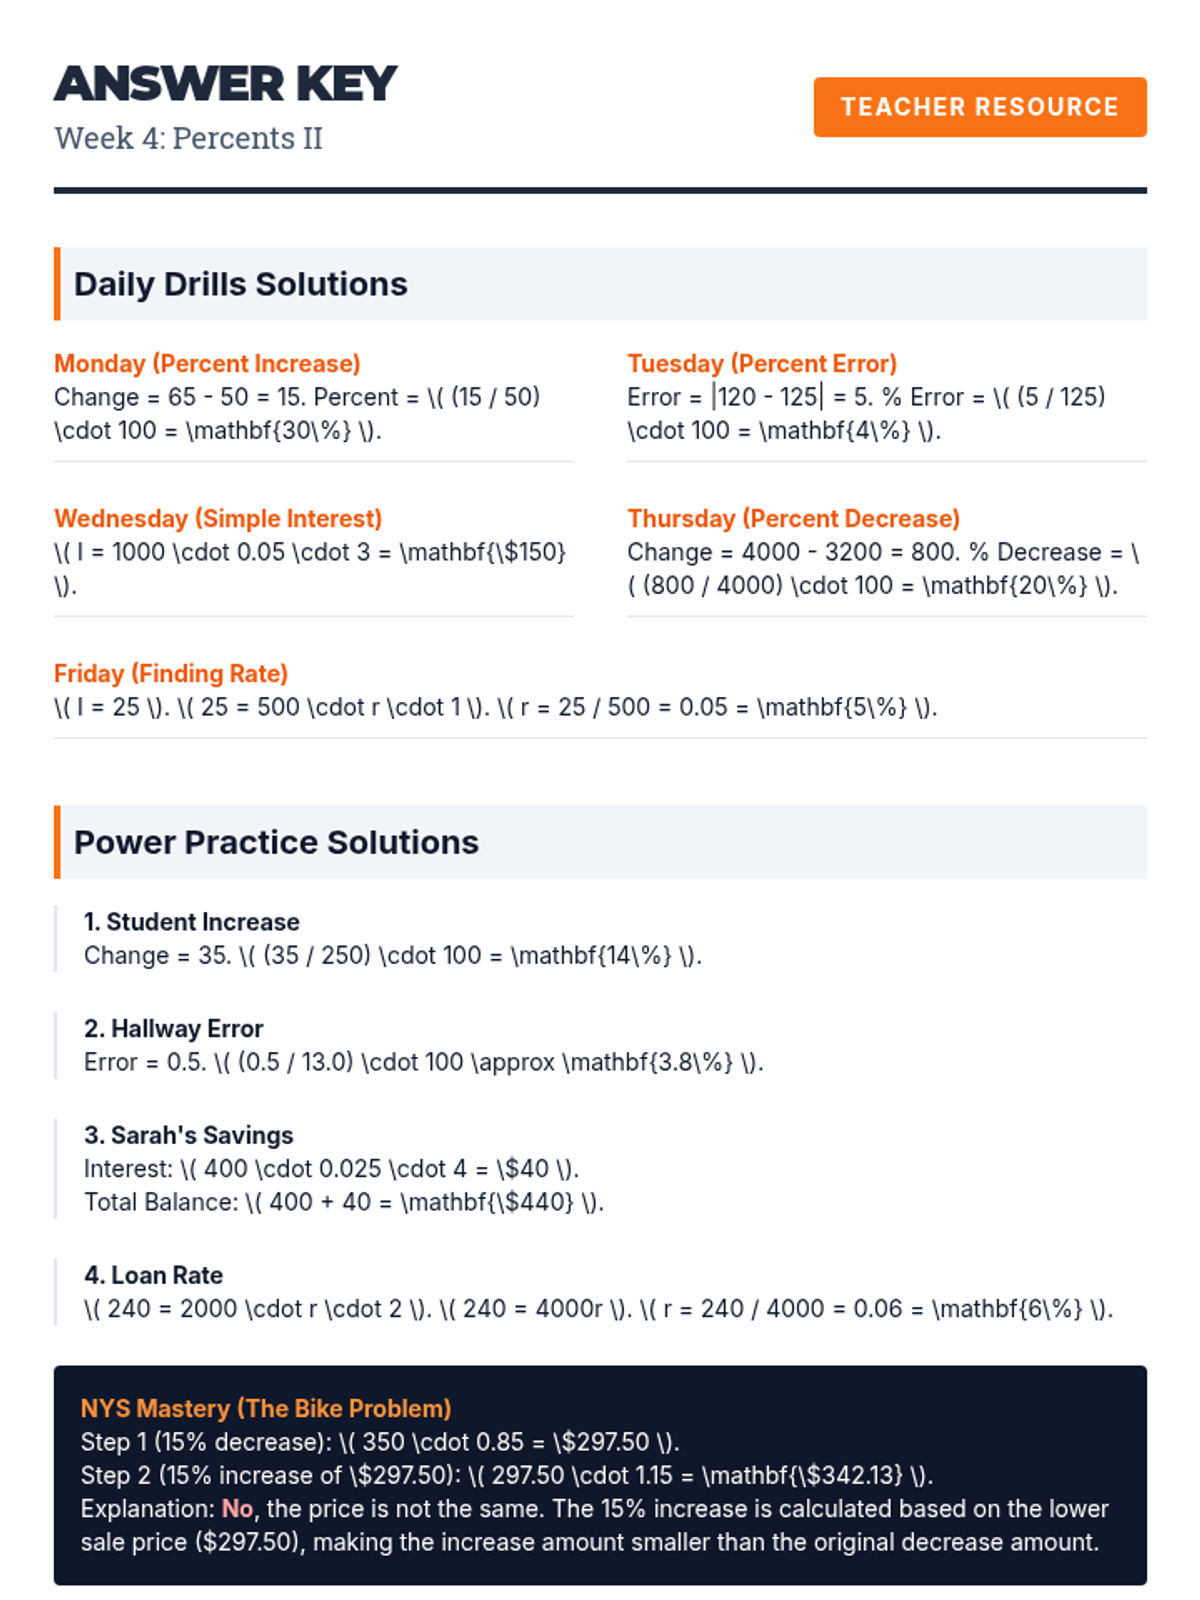
Teacher's answer key for Week 4 (Percents II) Daily Drills and Power Practice worksheets.
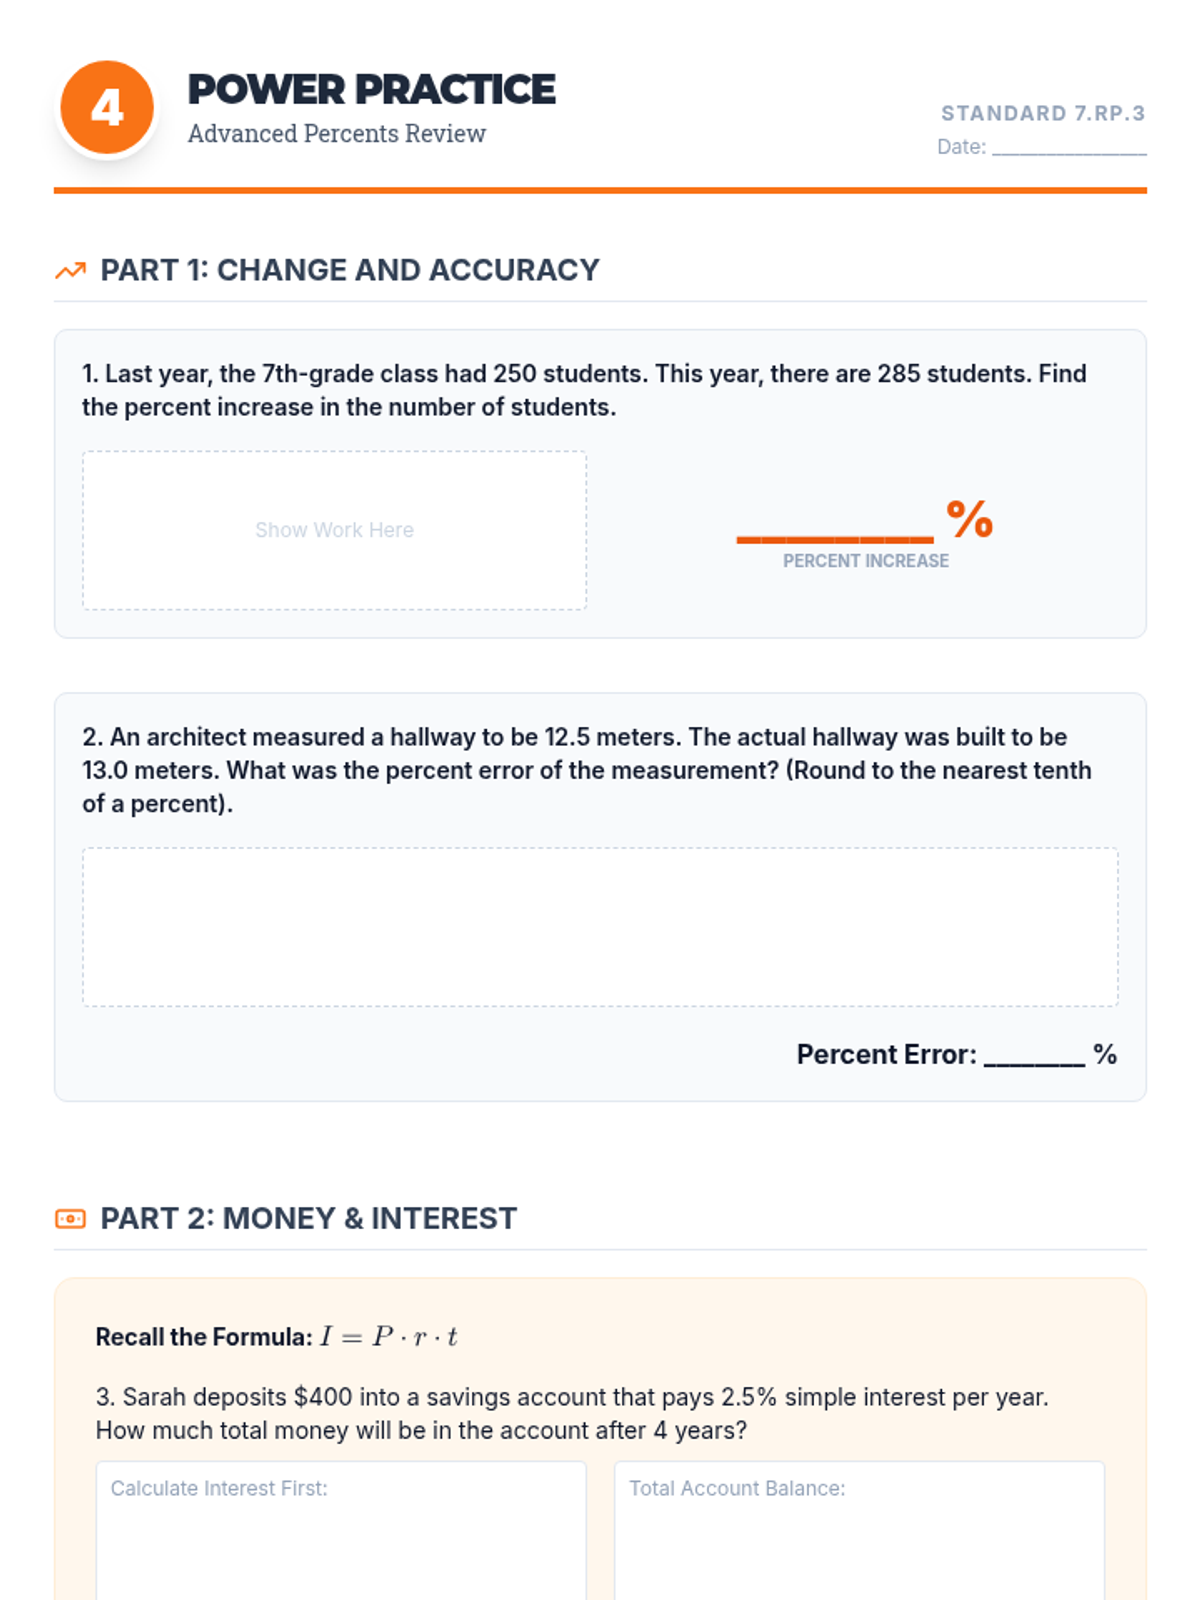
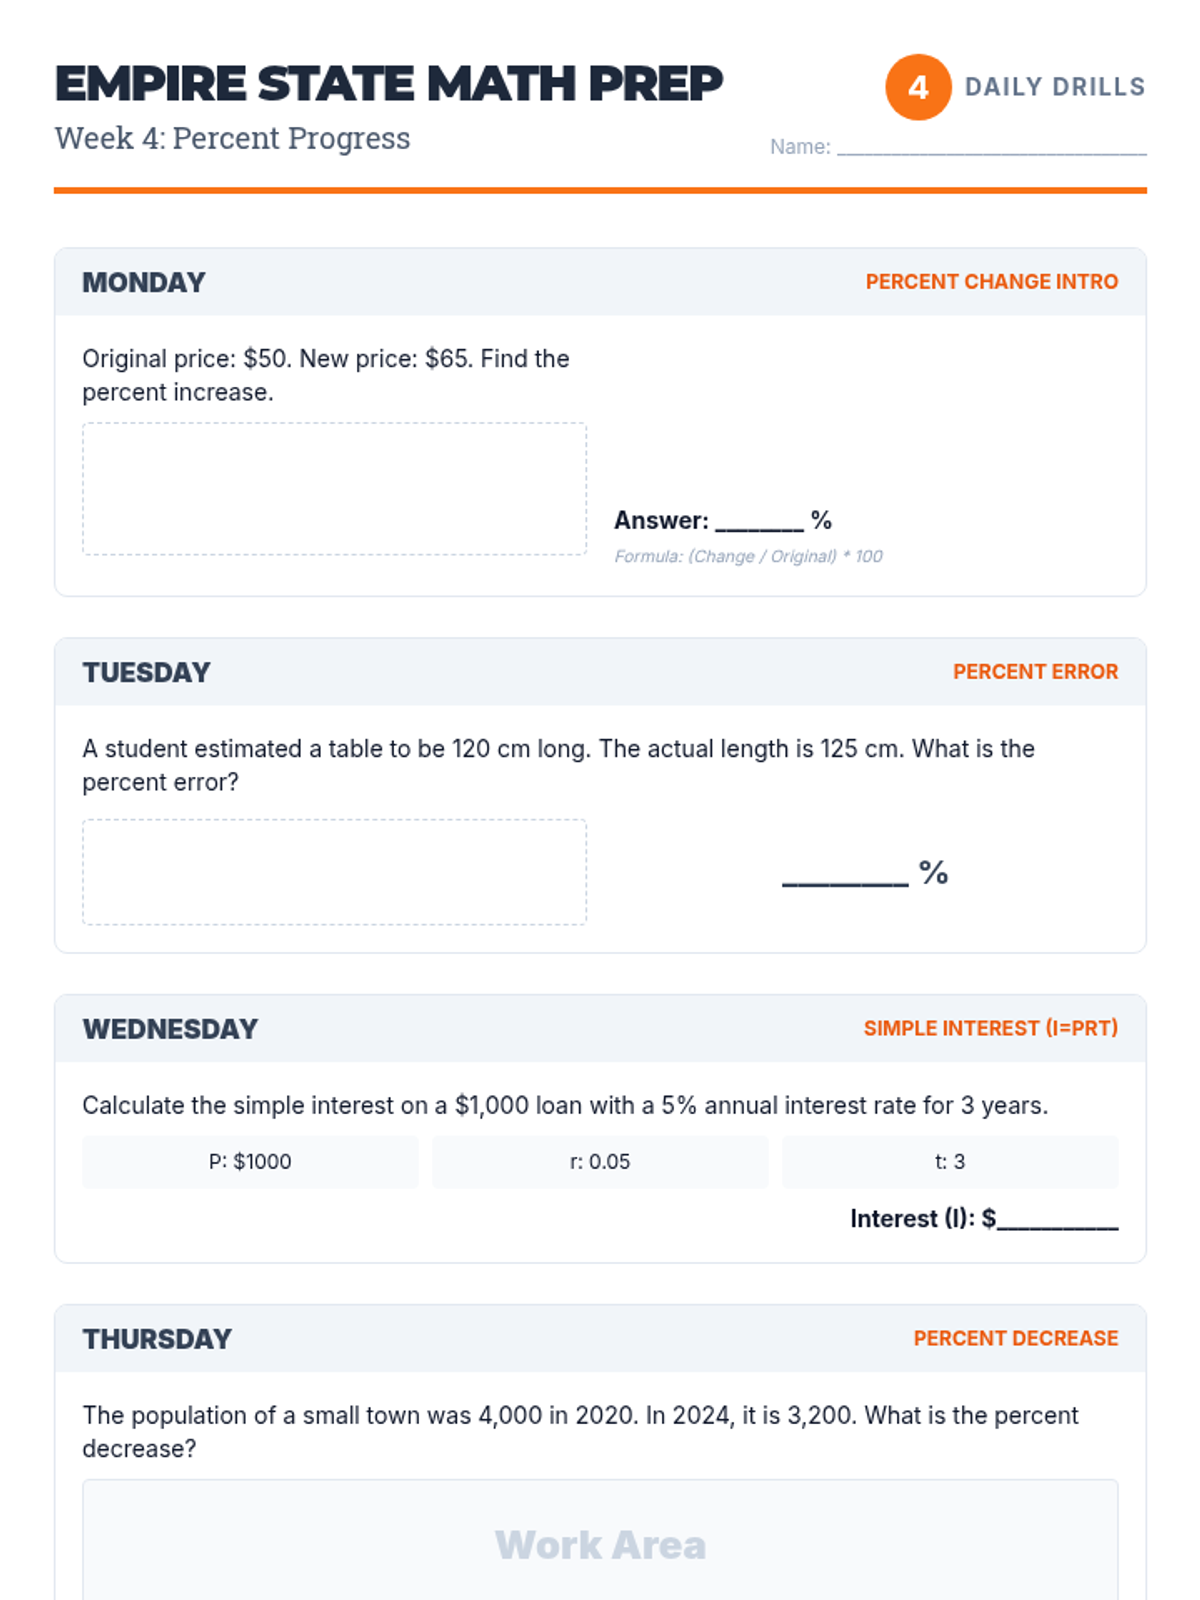
A comprehensive practice set for Week 4 (Percents II), covering percent increase/decrease, percent error, and multi-step simple interest problems.
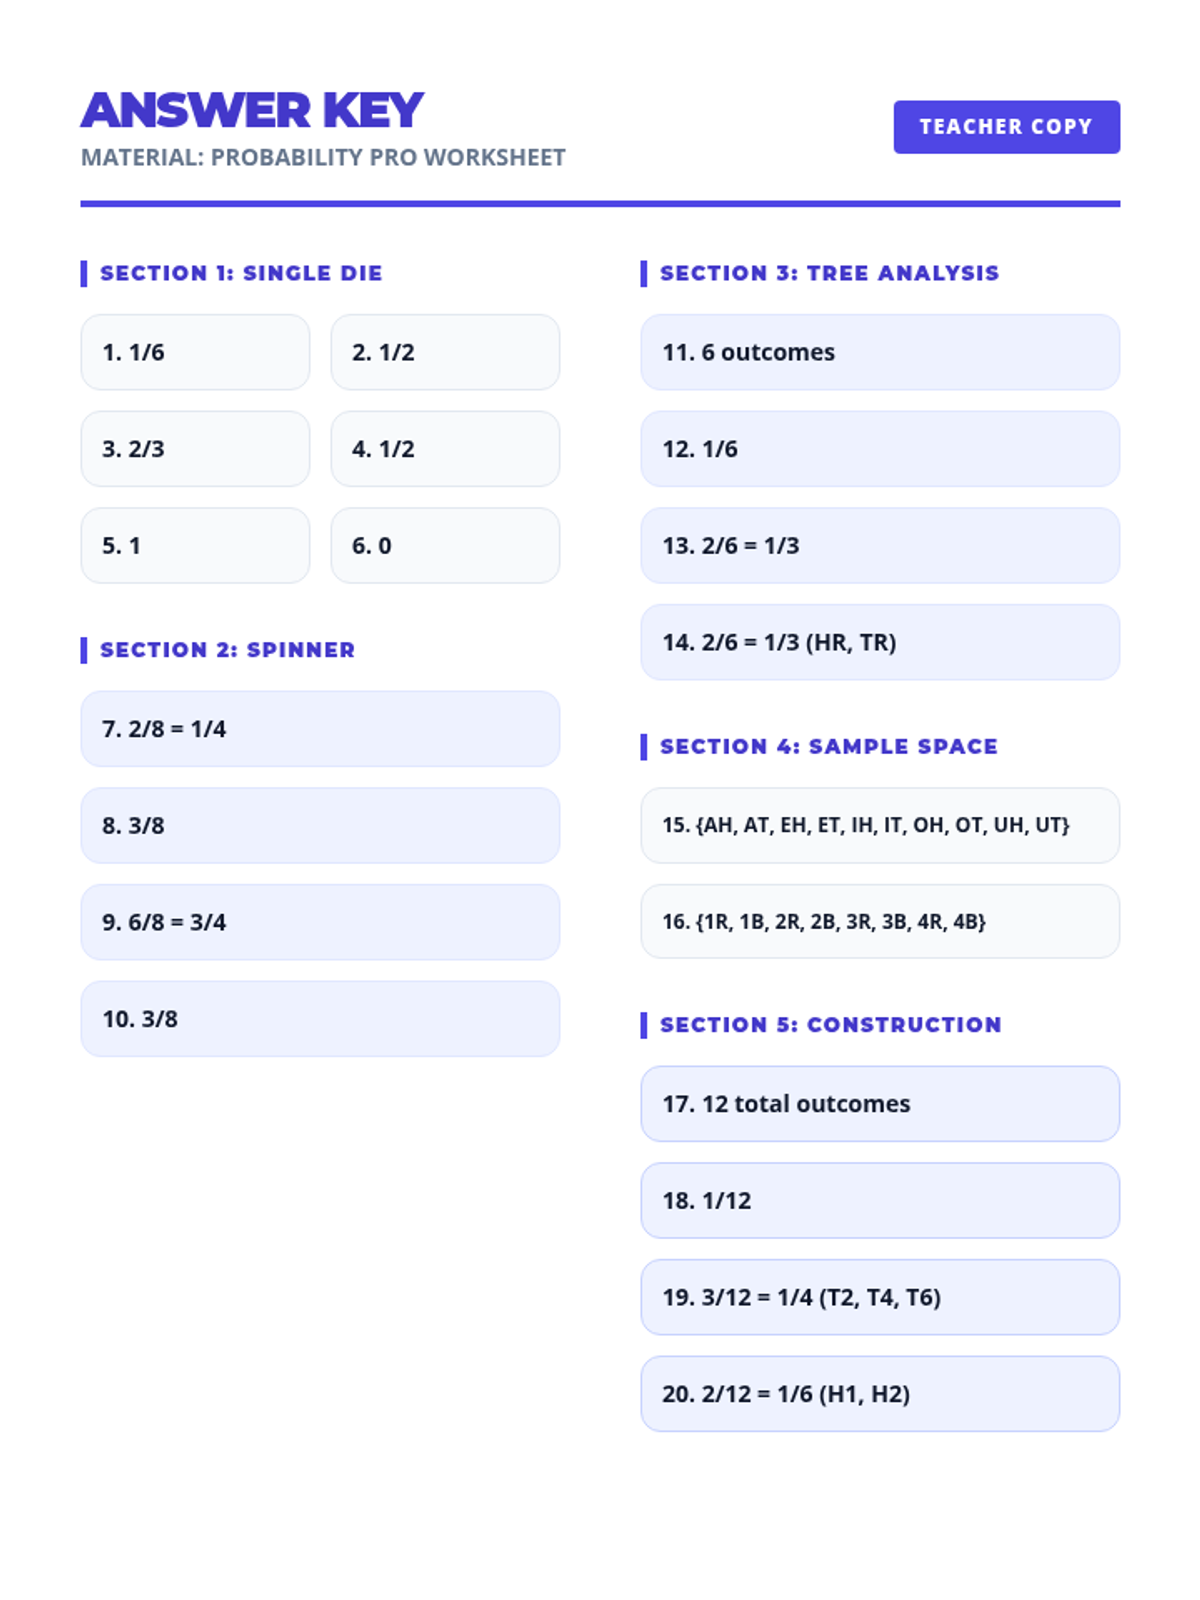
A complete answer key for the Probability Pro worksheet, featuring detailed breakdowns for analysis and construction problems. Removed all "Playground" references.
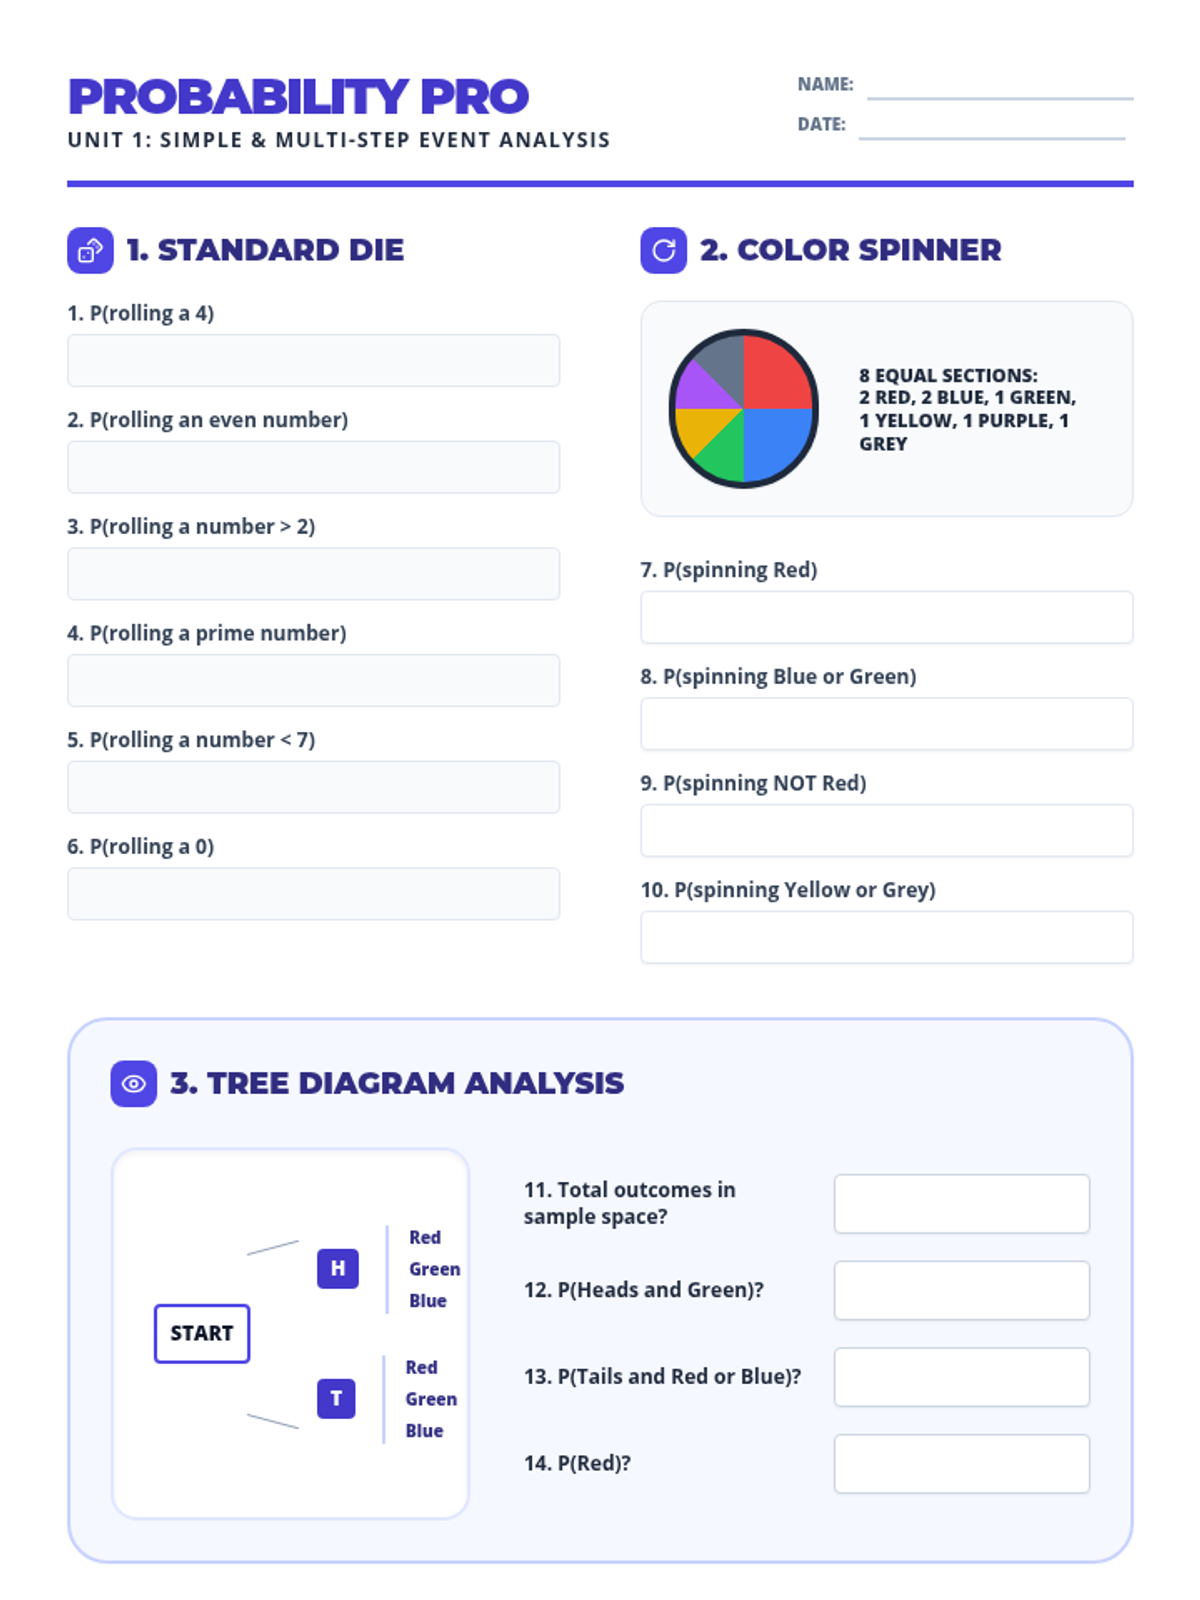
A 20-problem worksheet for 7th-grade students focusing on simple probability, analysis of provided tree diagrams, and constructing new ones. Removed all "Playground" references.
Instructional slides for teaching 7th-grade probability, covering basic terminology, the probability formula, and a visual introduction to tree diagrams using coins and dice. (Pro edition)
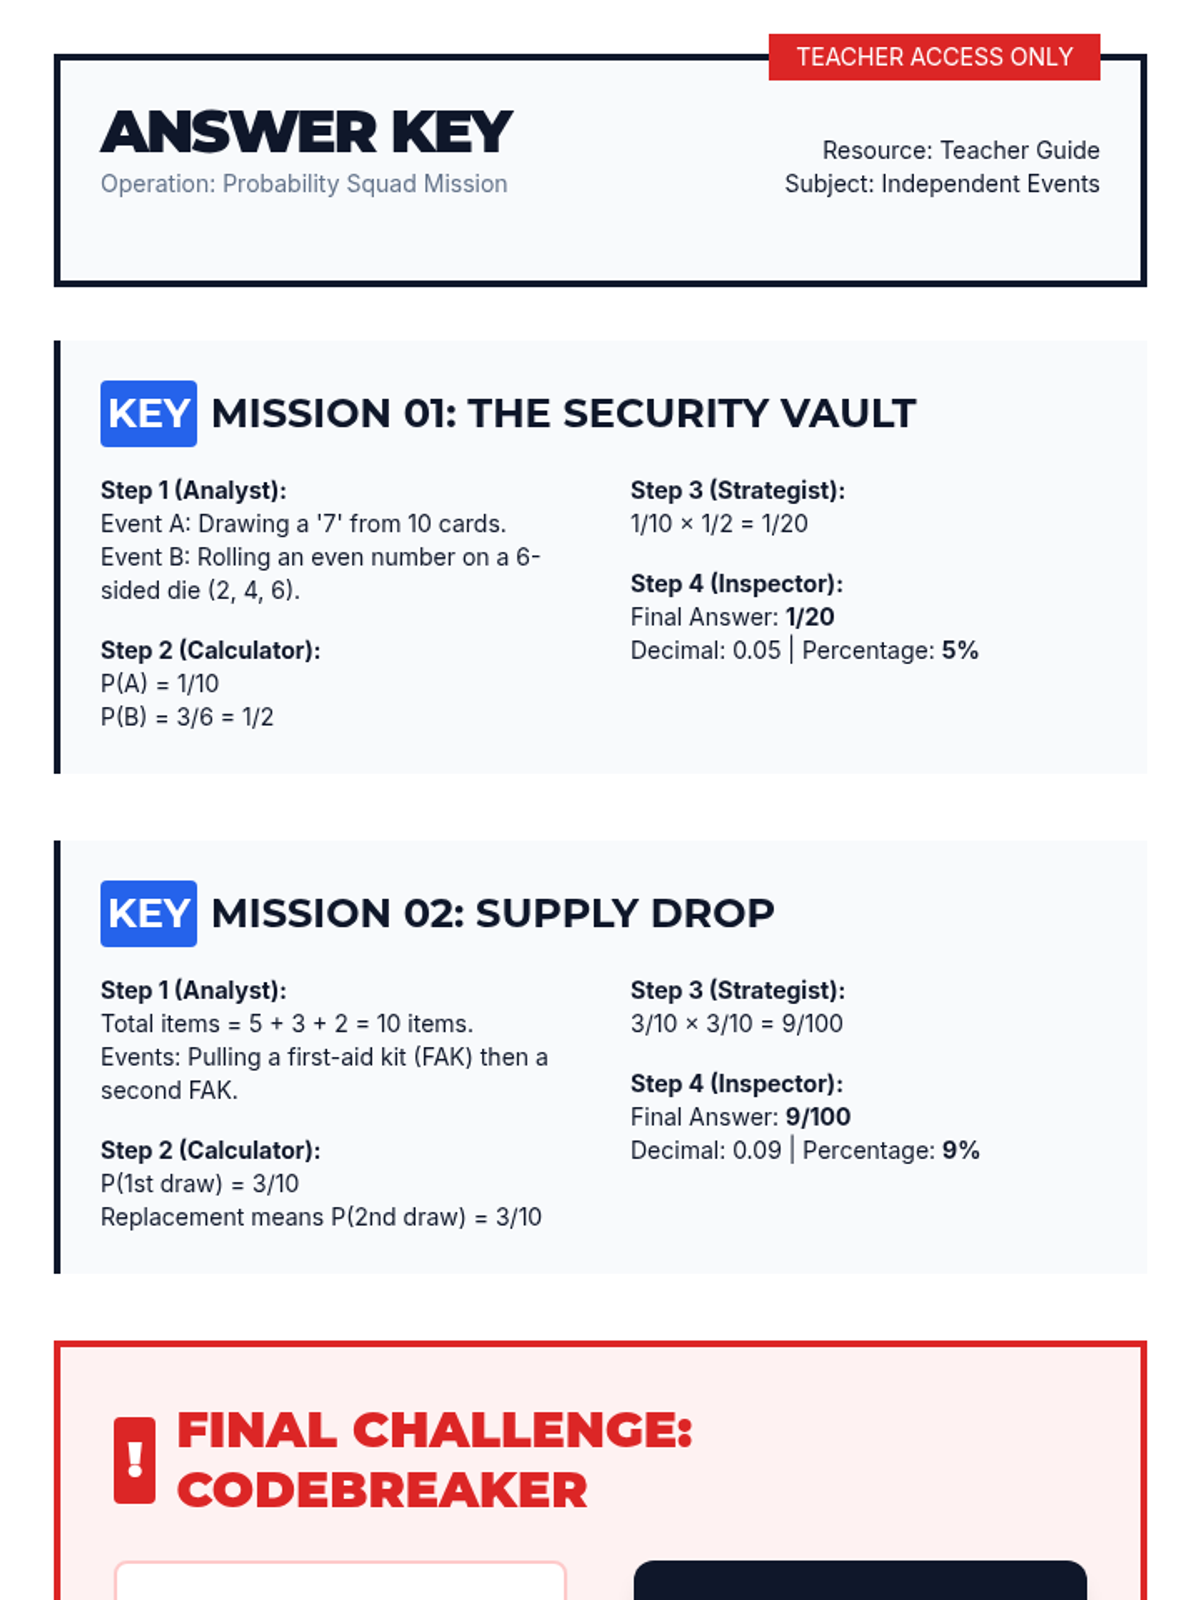
Comprehensive answer key for the Probability Squad Mission, providing step-by-step solutions for all worksheet scenarios.
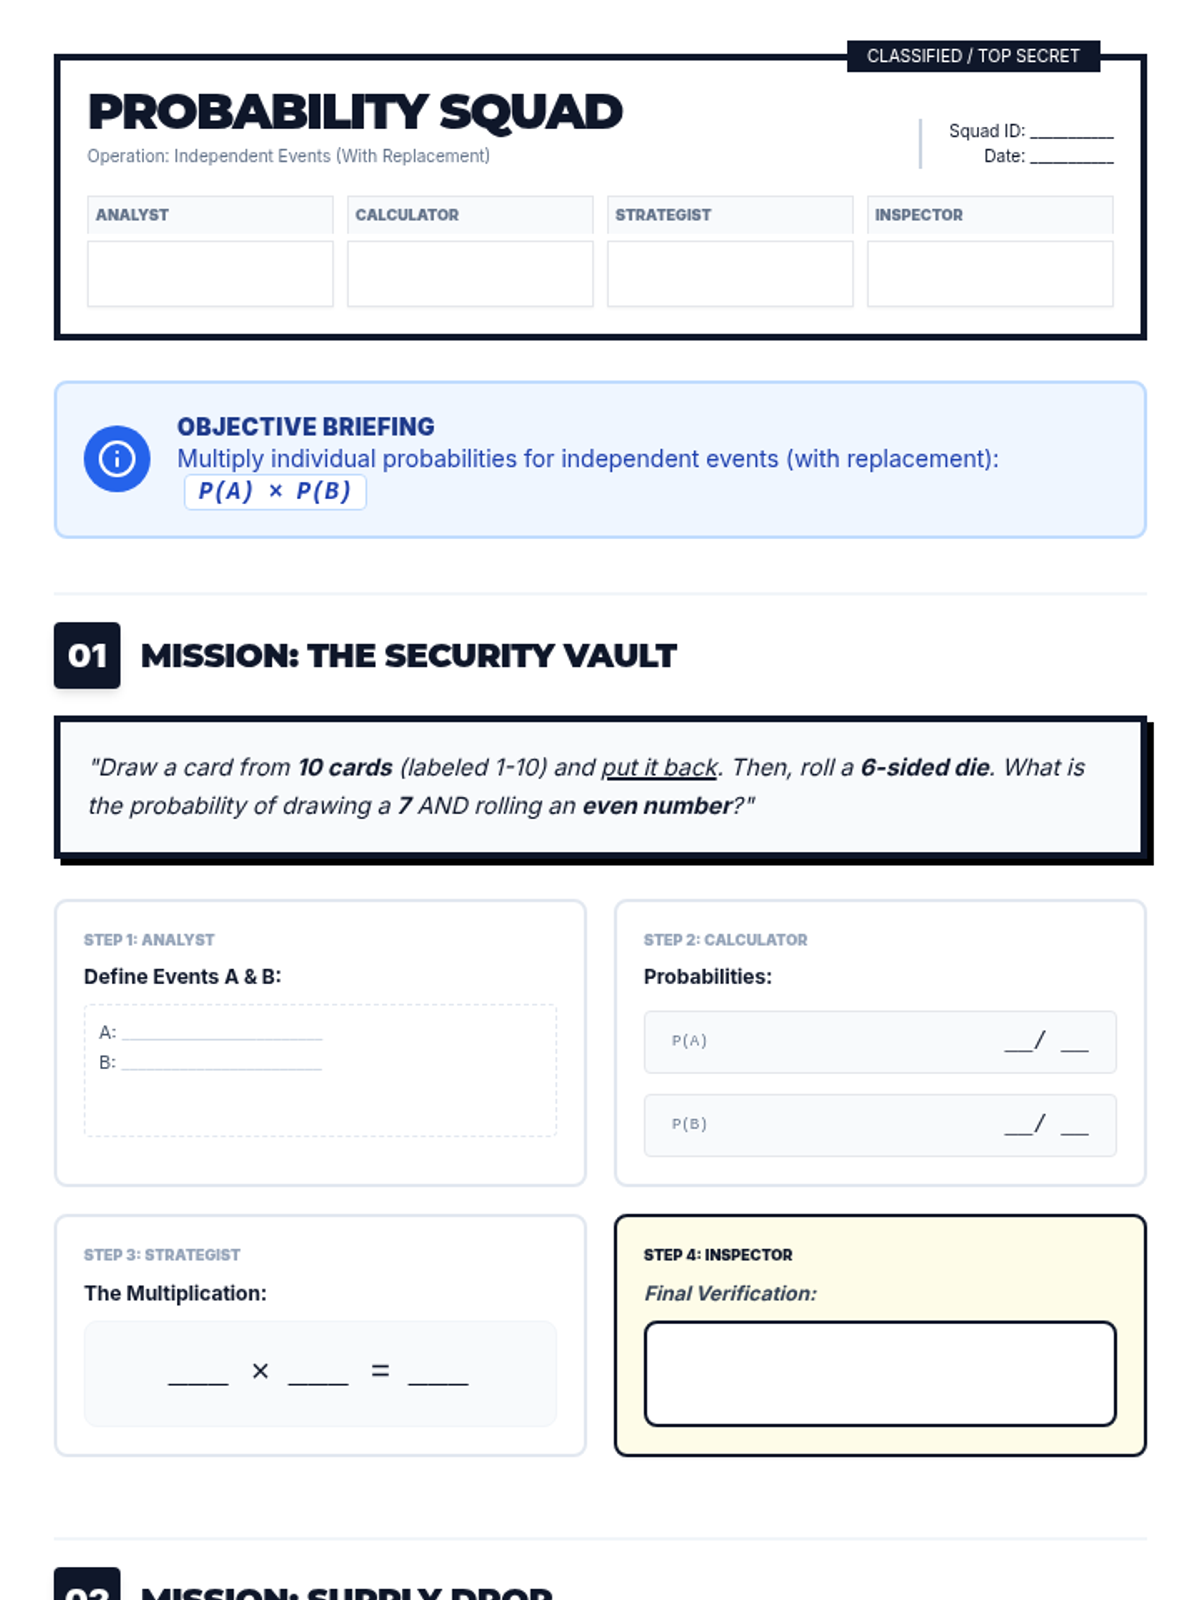
A structured group worksheet for compound probability, dividing work into 4 specialized roles (Analyst, Calculator, Strategist, Inspector) with a themed mission aesthetic.
A dynamic slide presentation introducing independent events and the multiplication rule with a mission-oriented theme for middle or high school math.
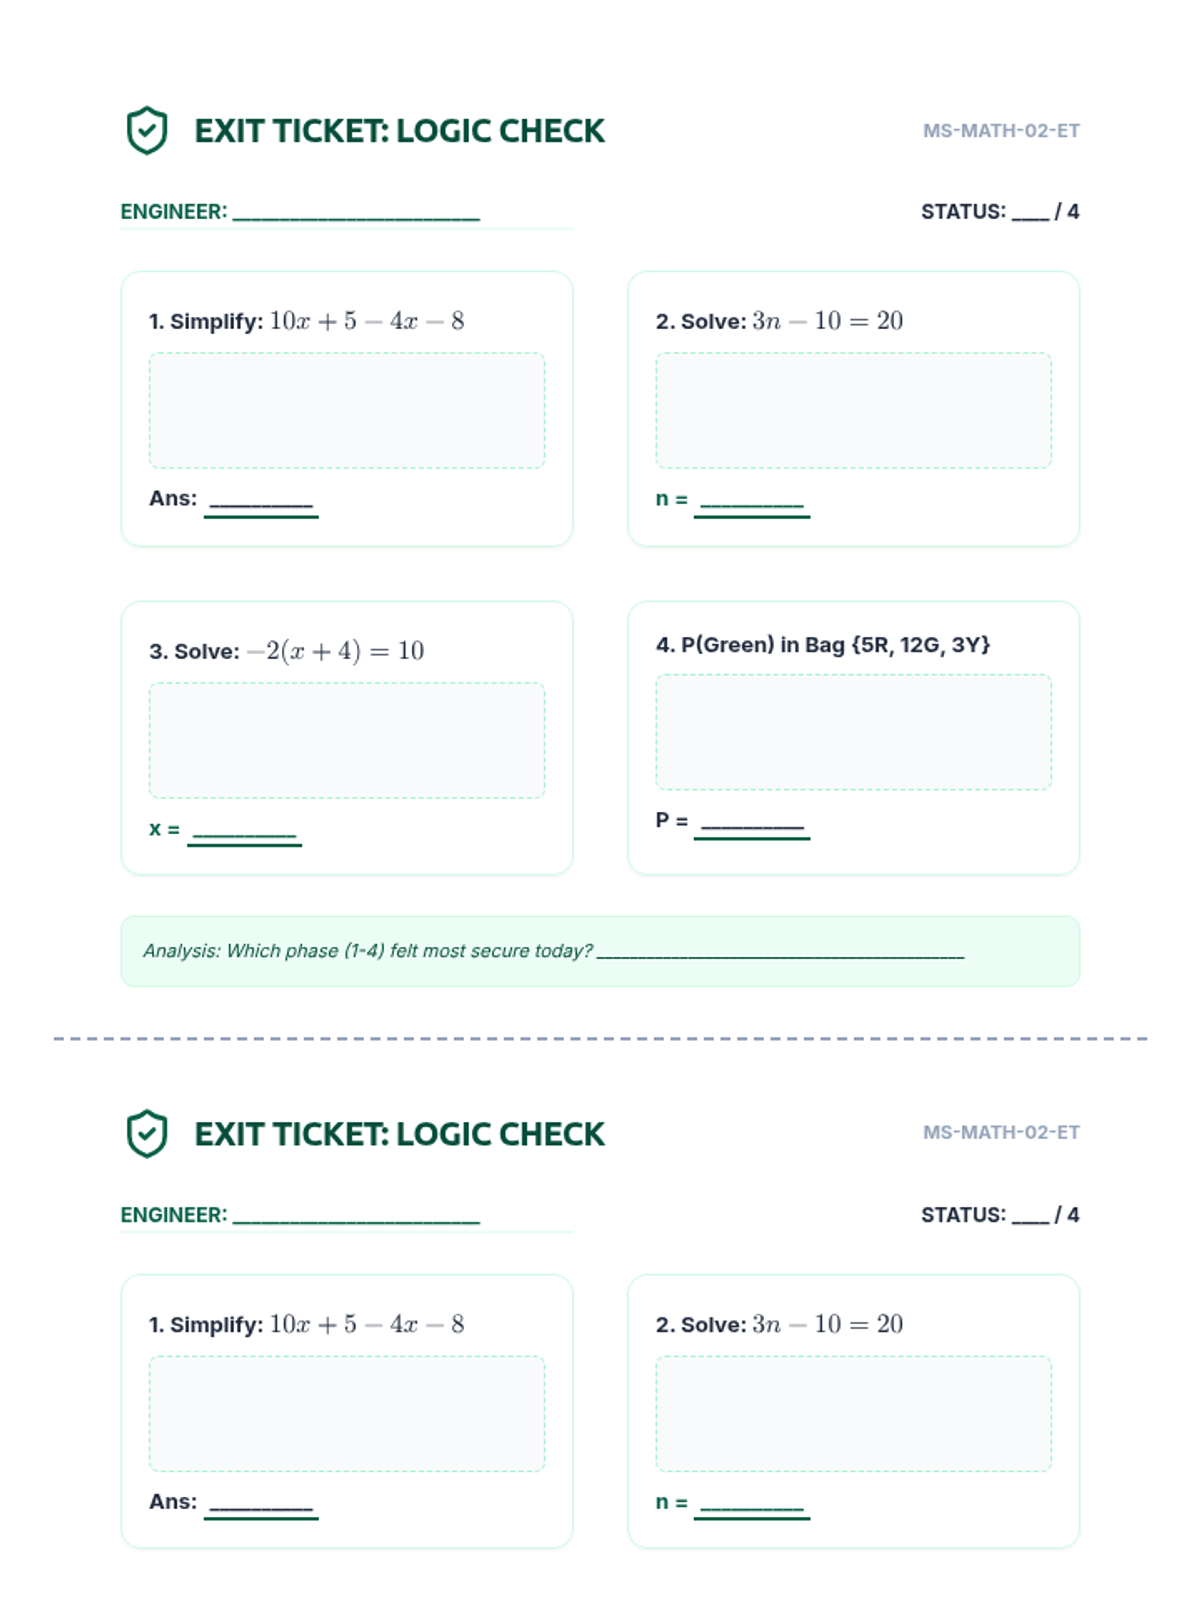
A double-up exit ticket (printable for two students per page) covering expression simplification and one-step equations from the Algebra Architects lesson. Reduced size to fit one page.
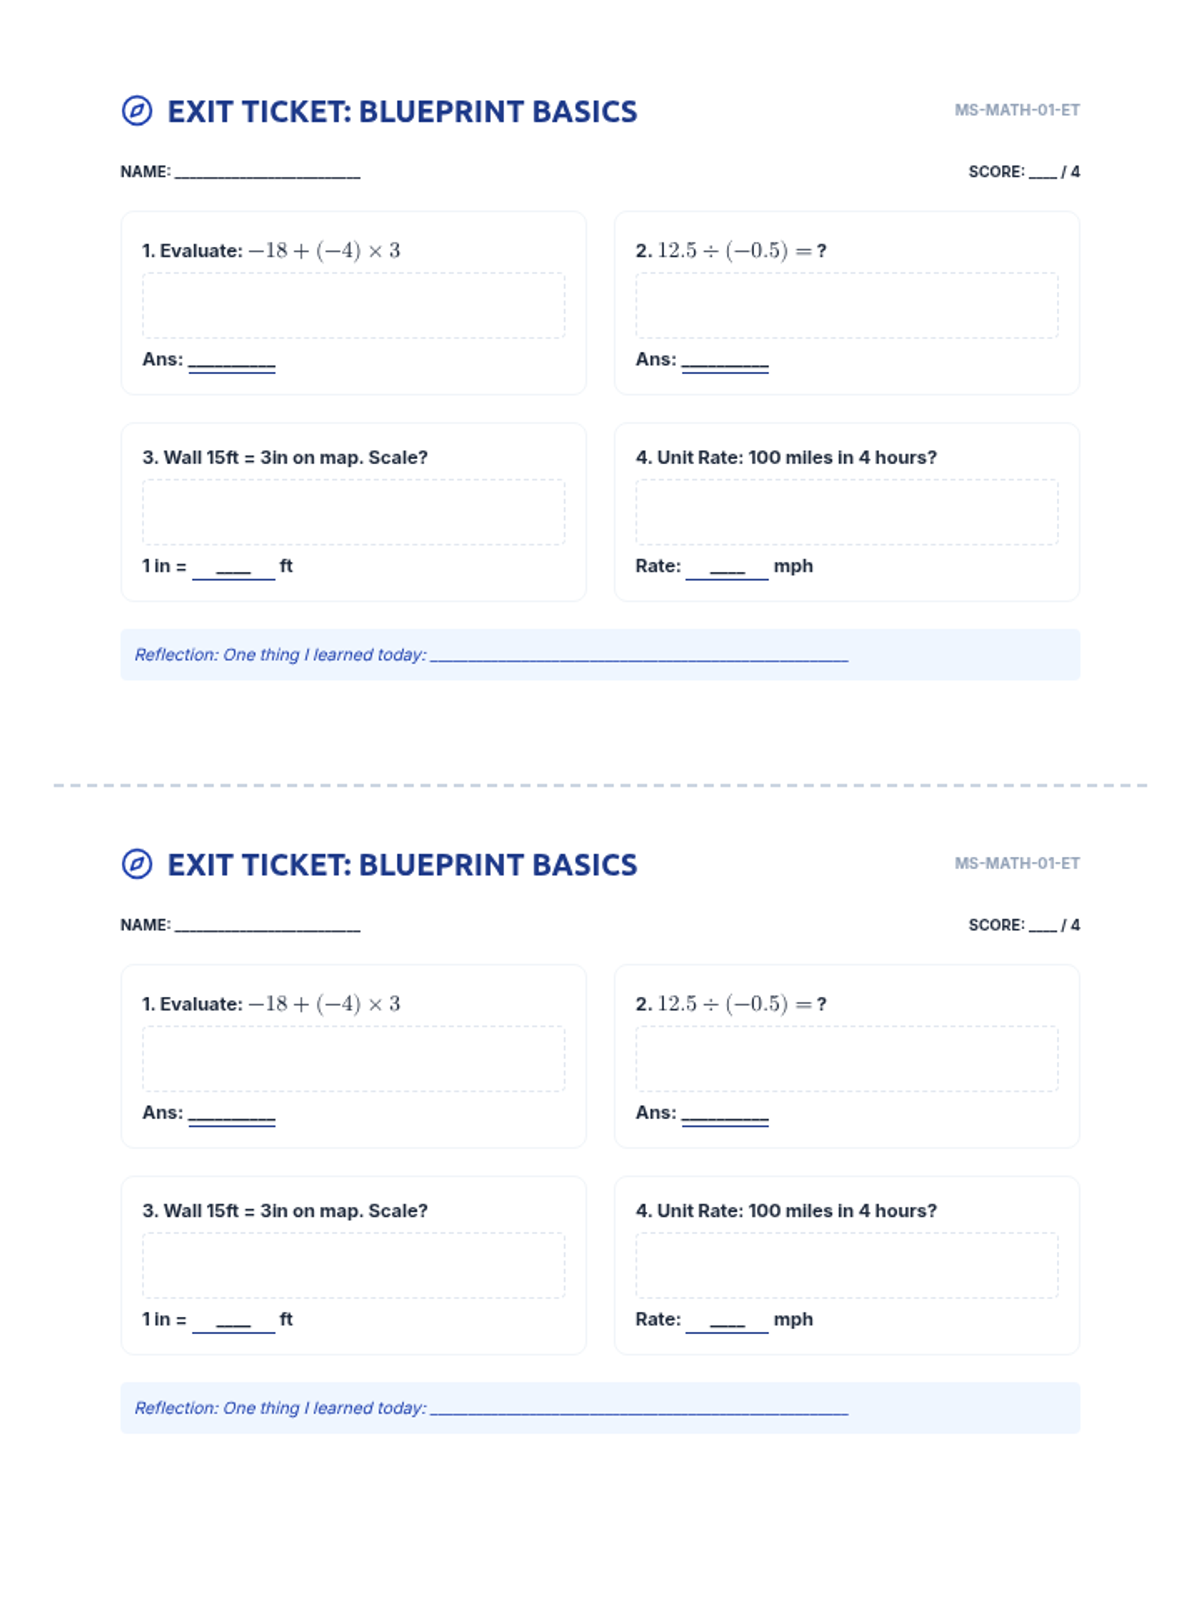
A double-up exit ticket (printable for two students per page) covering basic operations and scale factor from the Number Blueprints lesson. Reduced size to fit one page.
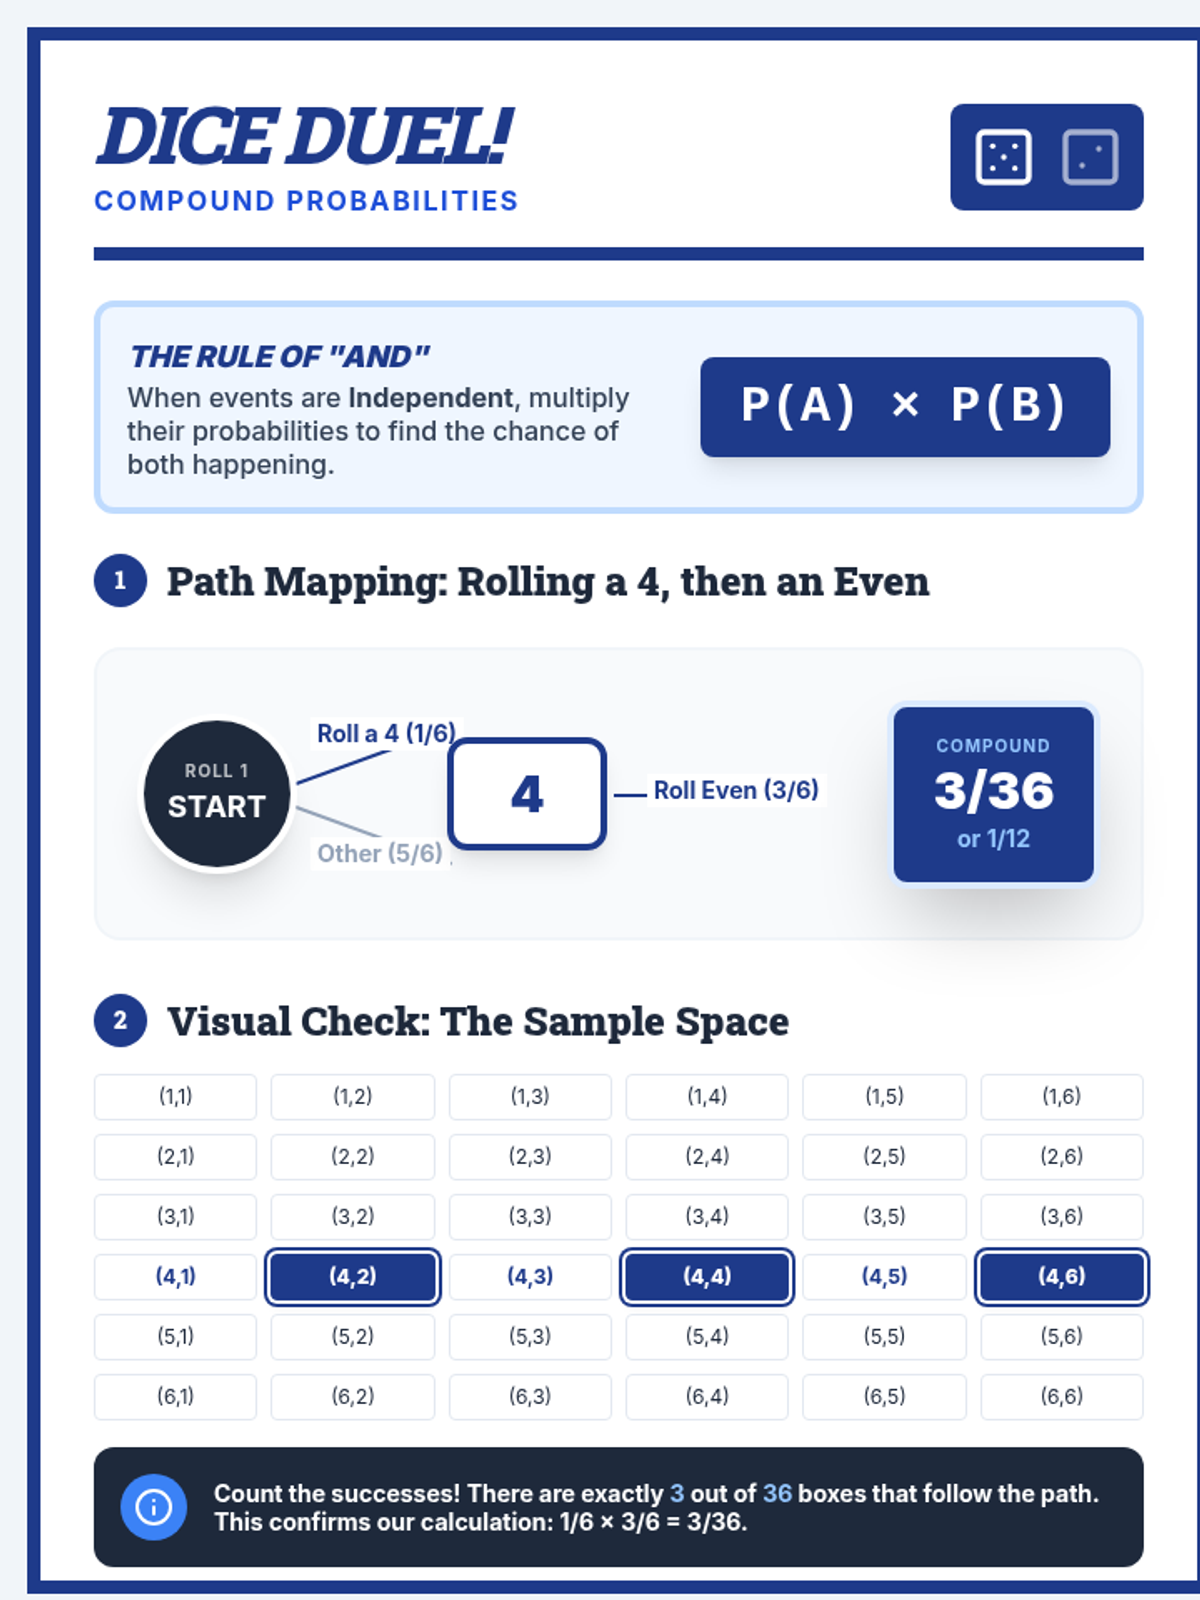
An anchor chart designed for classroom display that explains compound probability using two dice. It features a specific example with a tree diagram, a 6x6 sample space grid, and the clear mathematical formula for independent events.
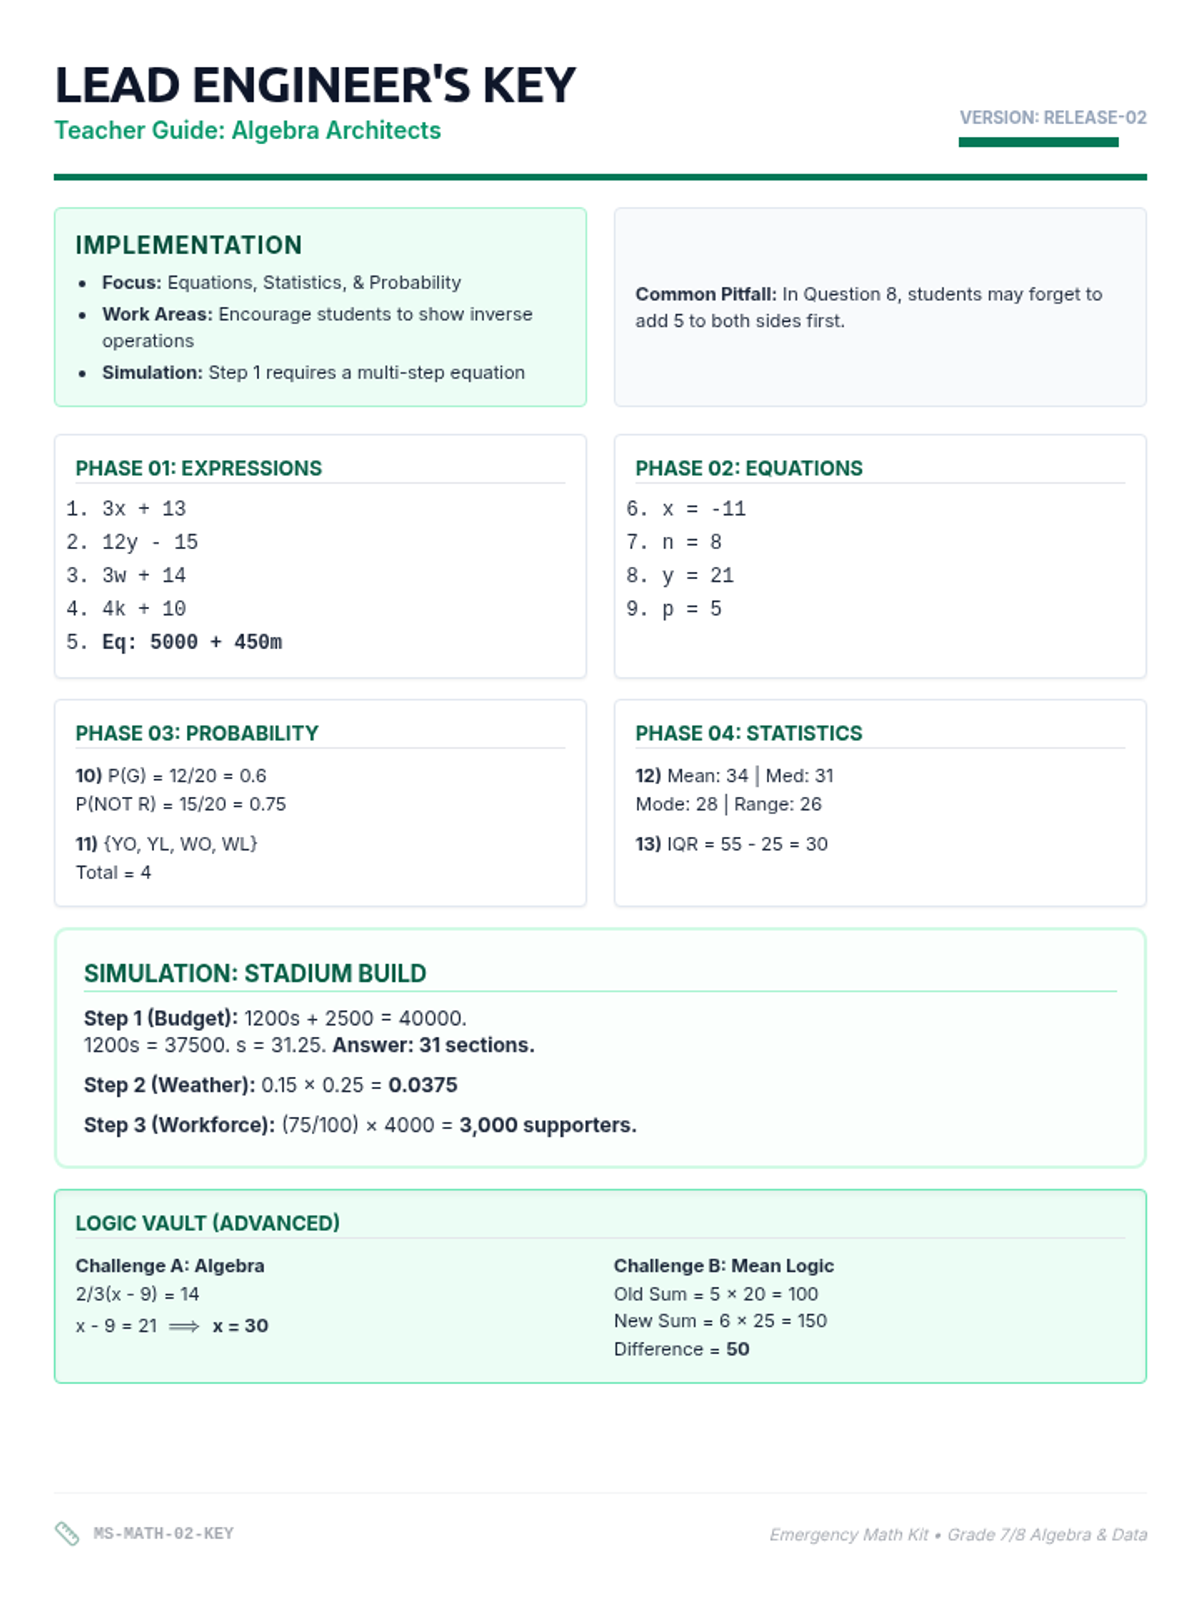
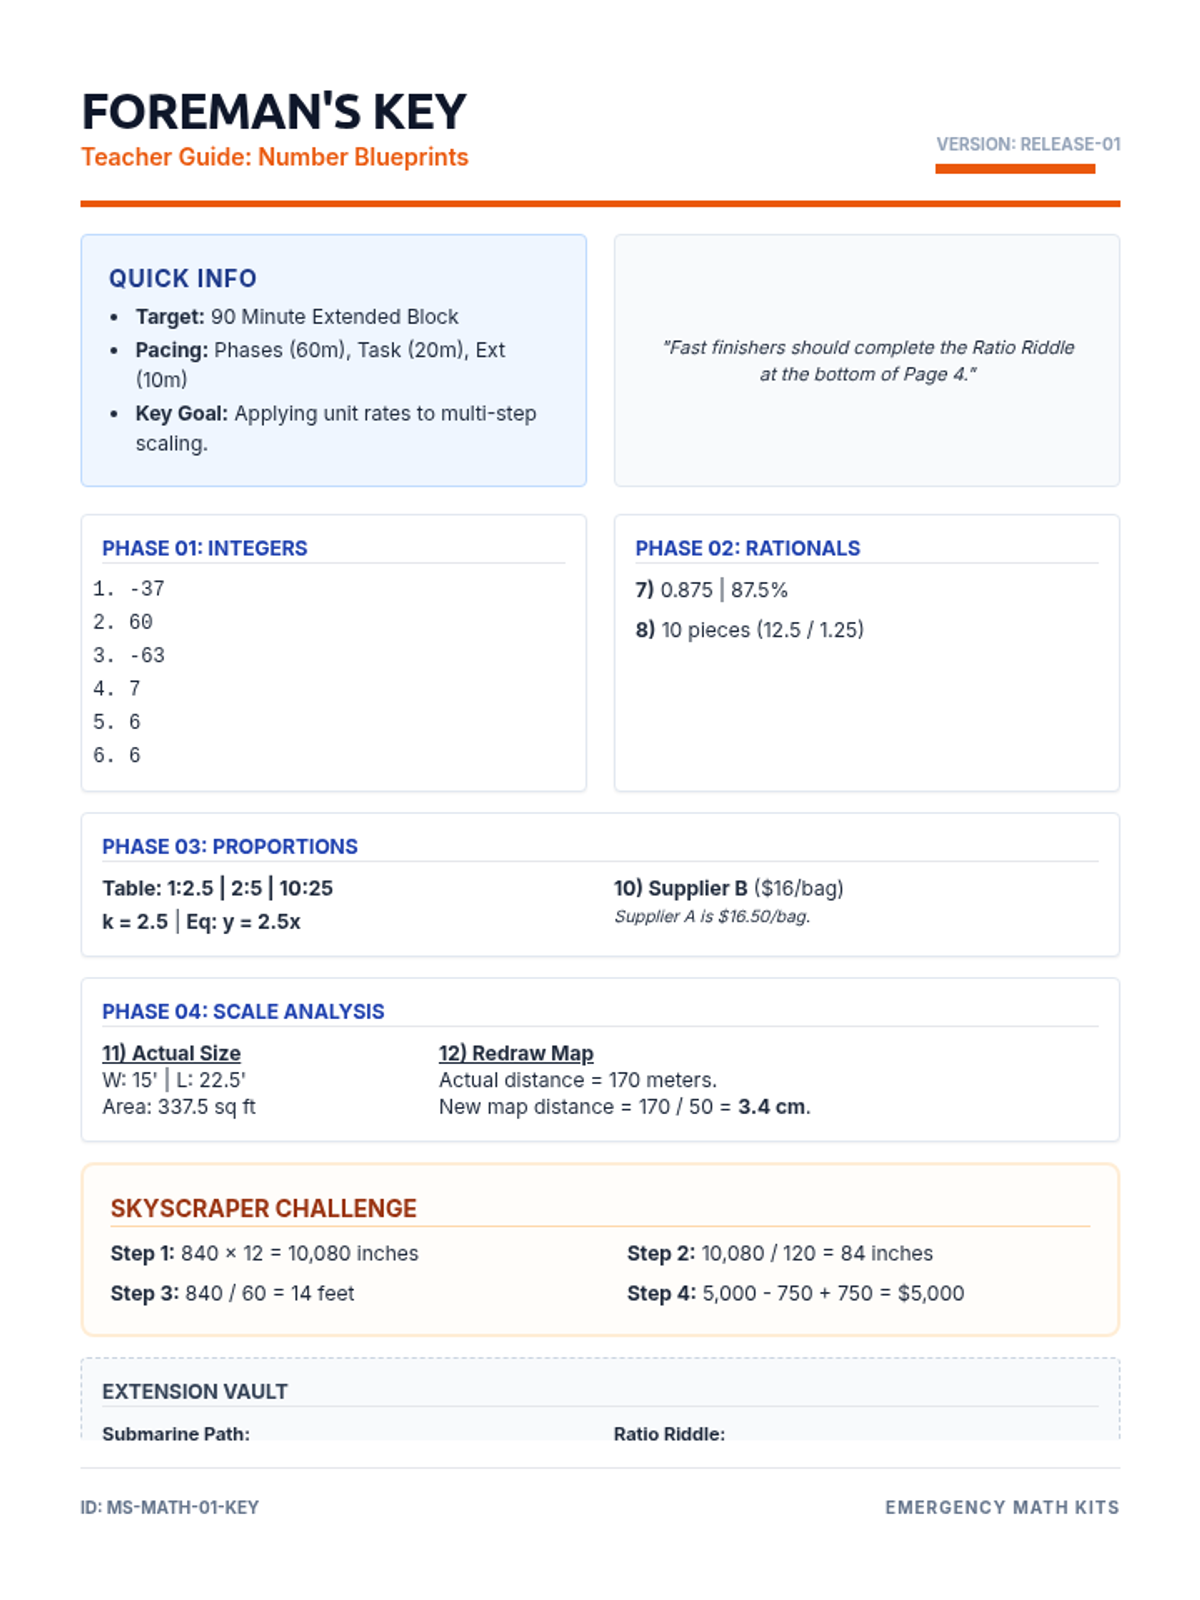
A detailed answer key and pedagogical guide for the Algebra Architects packet. Provides solutions for all phases, the simulation task, and the Logic Vault extensions.
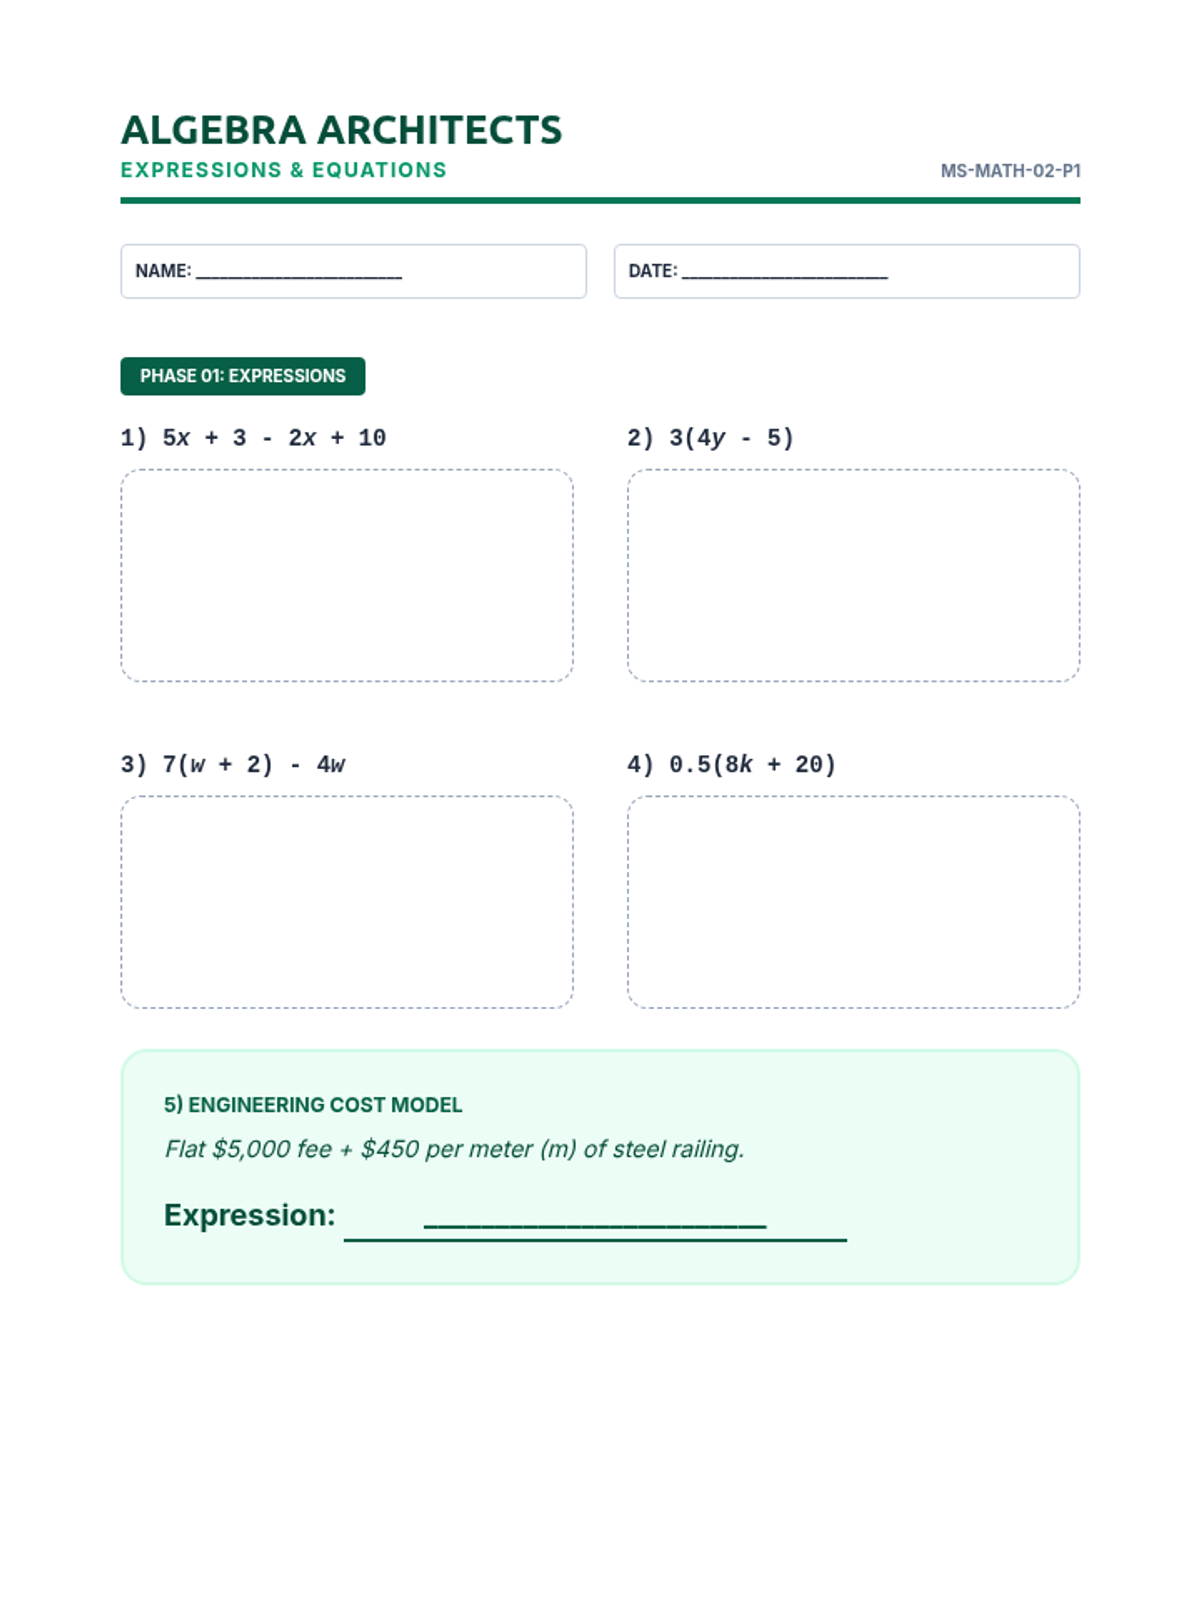
A 4-page student packet for a 90-minute substitute block covering linear expressions, equations, probability, and statistics. Includes application tasks and an "Engineering Vault" for fast finishers.
A concise answer key and instructional guide for the Number Blueprints packet. Includes step-by-step solutions and time management tips for the substitute teacher.
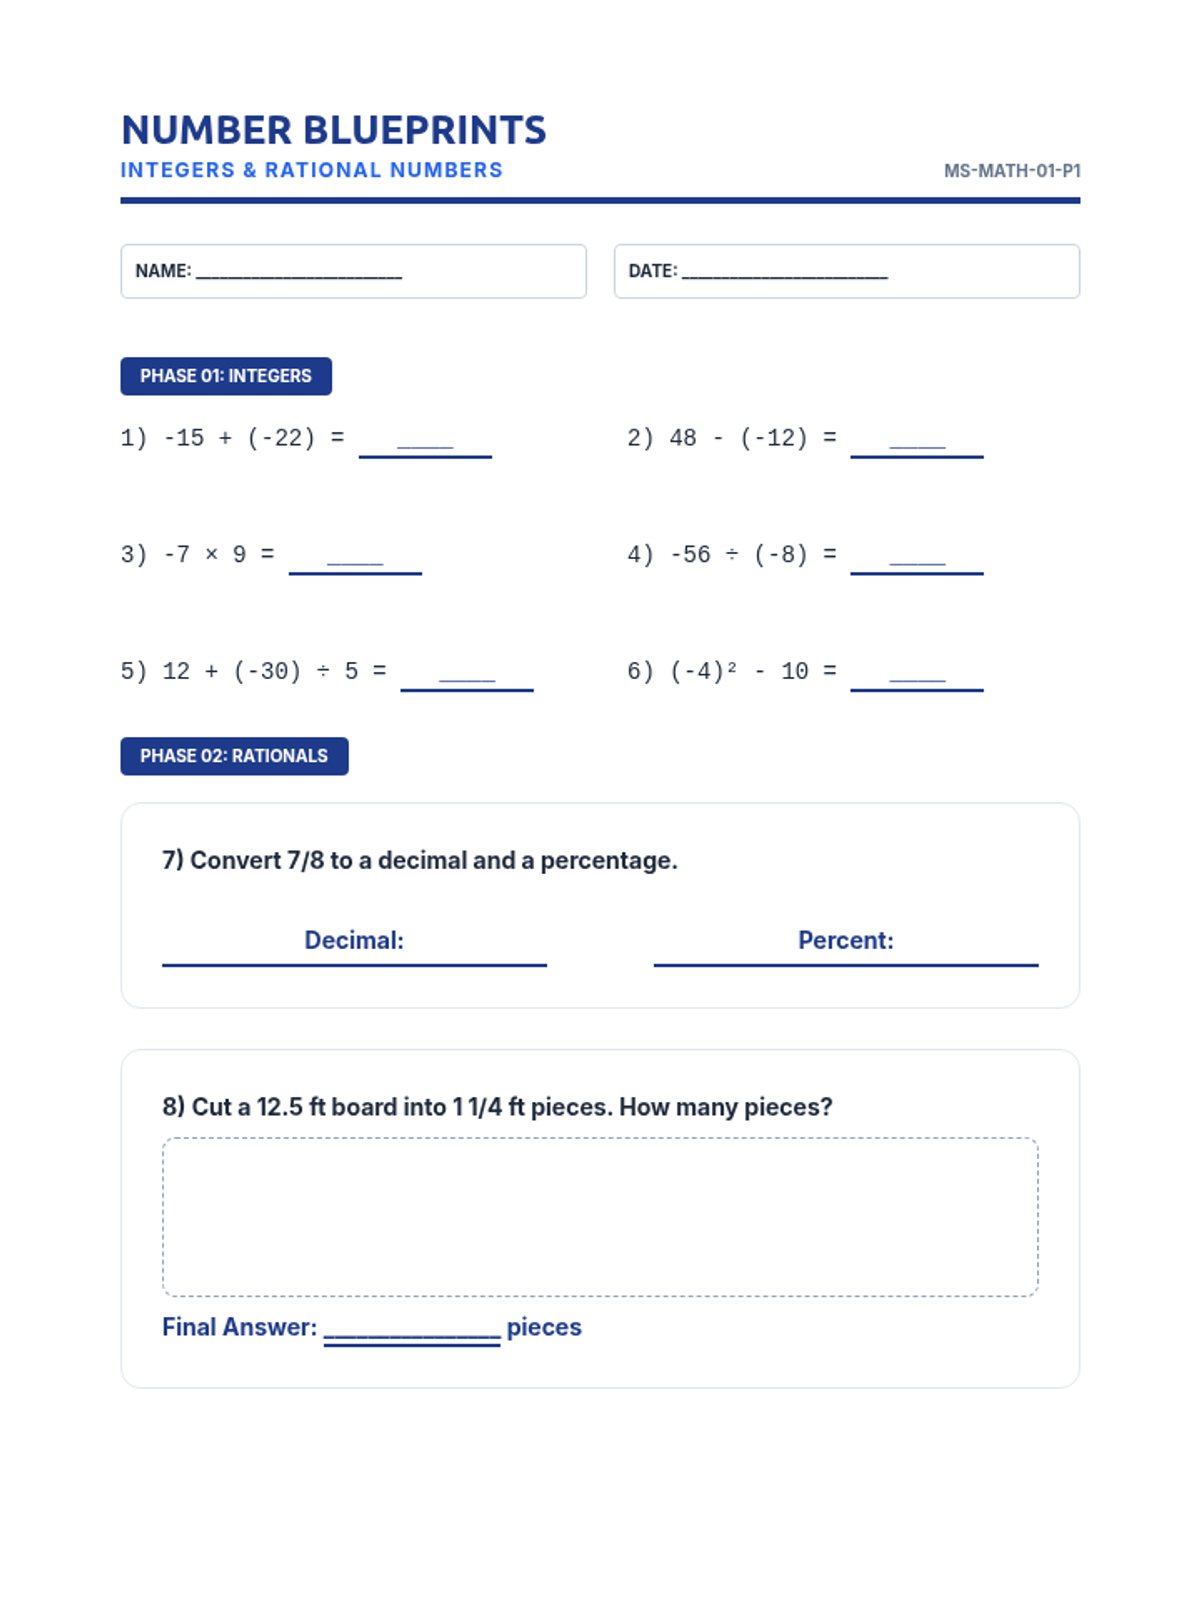
Expanded 4-page student packet for a 90-minute substitute block. Covers integers, rational operations, proportions, and scale factors with 20+ problems and an integrated performance task. Reduced side and padding to fix page breaks.
Final Executive Career Portfolio Handout. Professional summary document for students to synthesize their math evidence into a final career pitch. Features kid-friendly terminology ('Evidence Log', 'Calculation Summary'), high-contrast work areas, and a structured executive brief layout for the 2-hour final block. Improved font sizes and larger explanation boxes for better student usability. Consolidated to a more efficient layout to prevent page breaks. Header icons standardized. Cover page label legibility improved. Main background set to white for proper printer margins. Removed rigid height constraints to prevent fragmentation. Signature box enlarged. Header spacing corrected. Standardized to 'Executive Pitch Portfolio'.
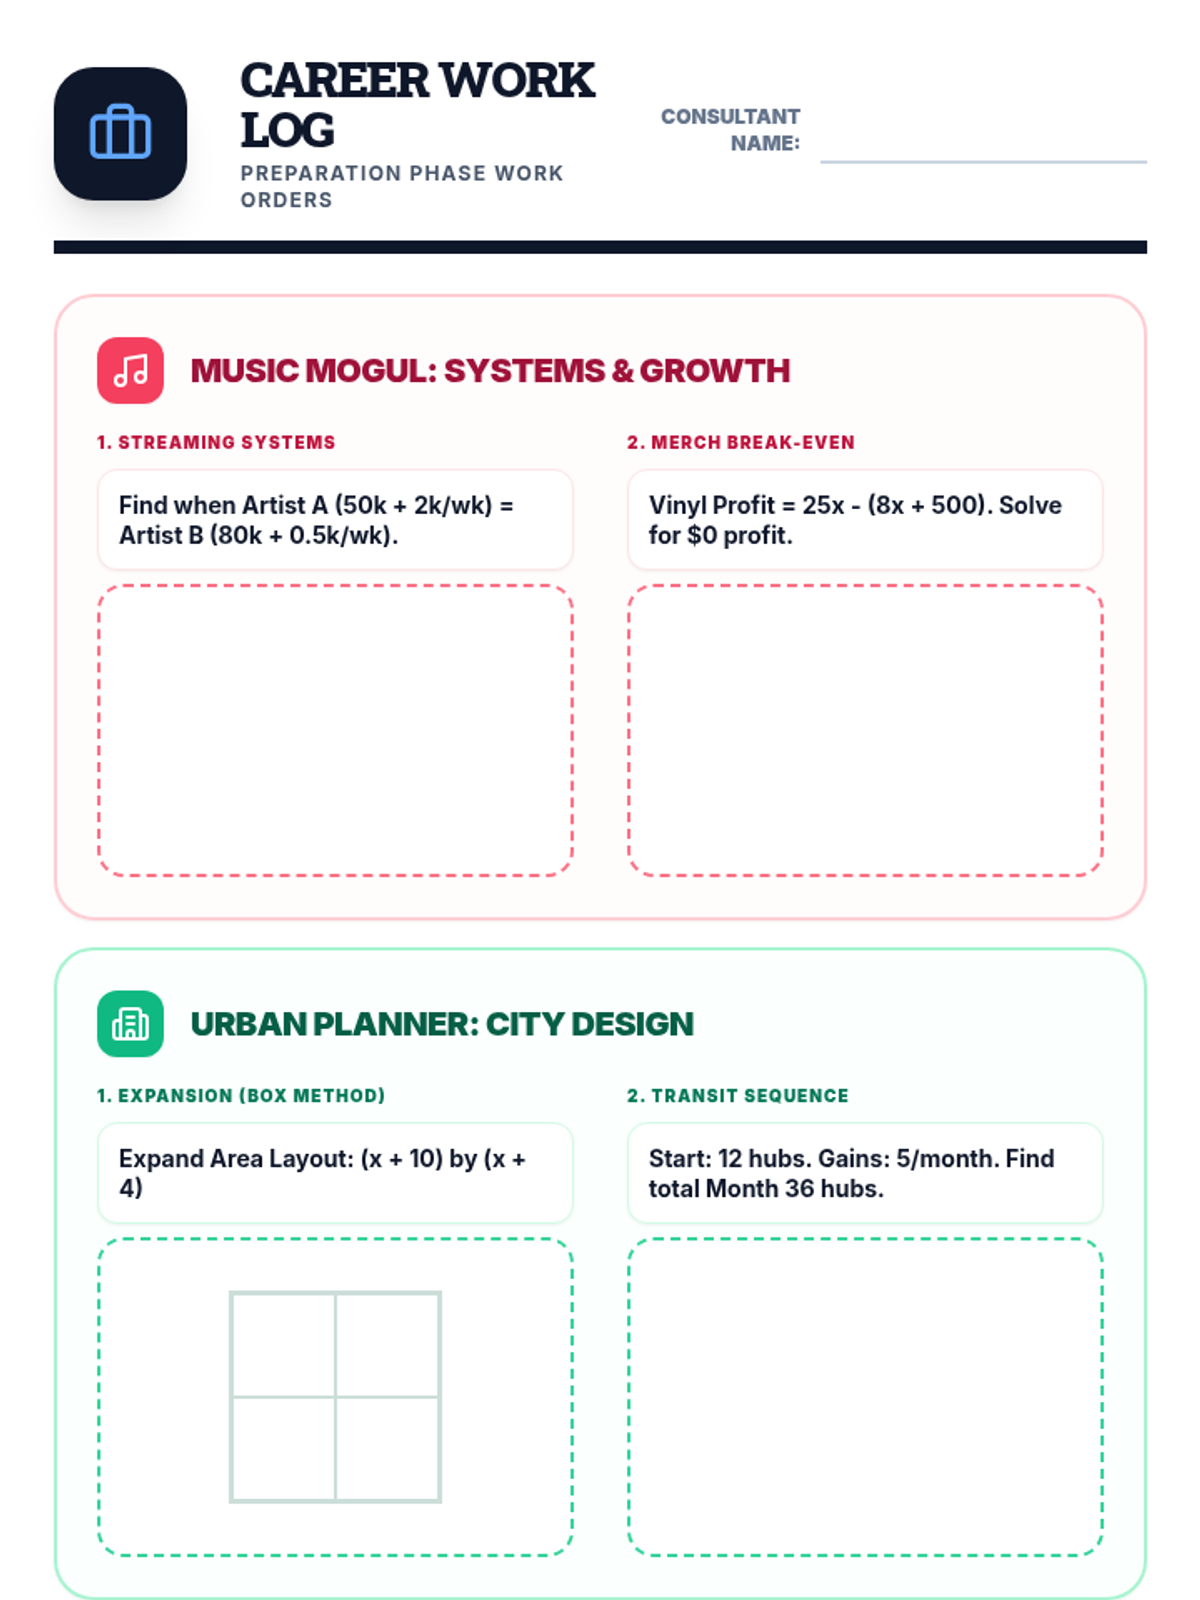
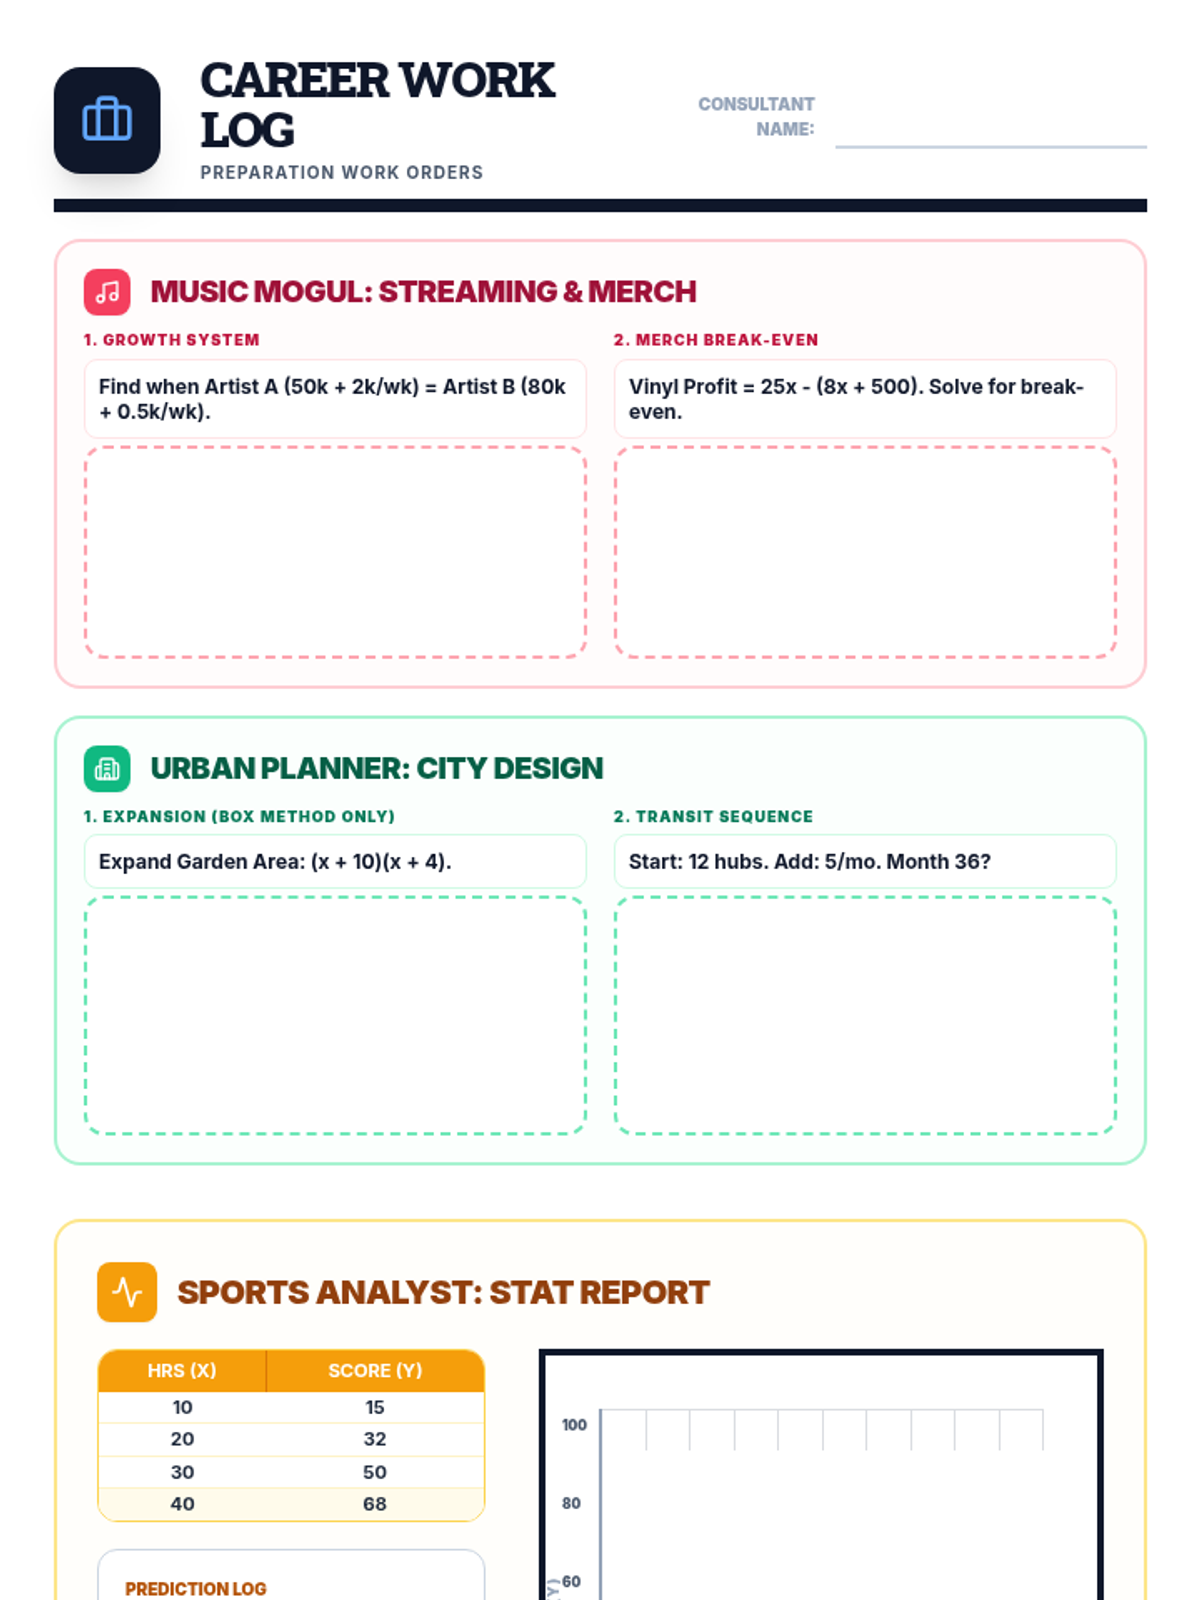
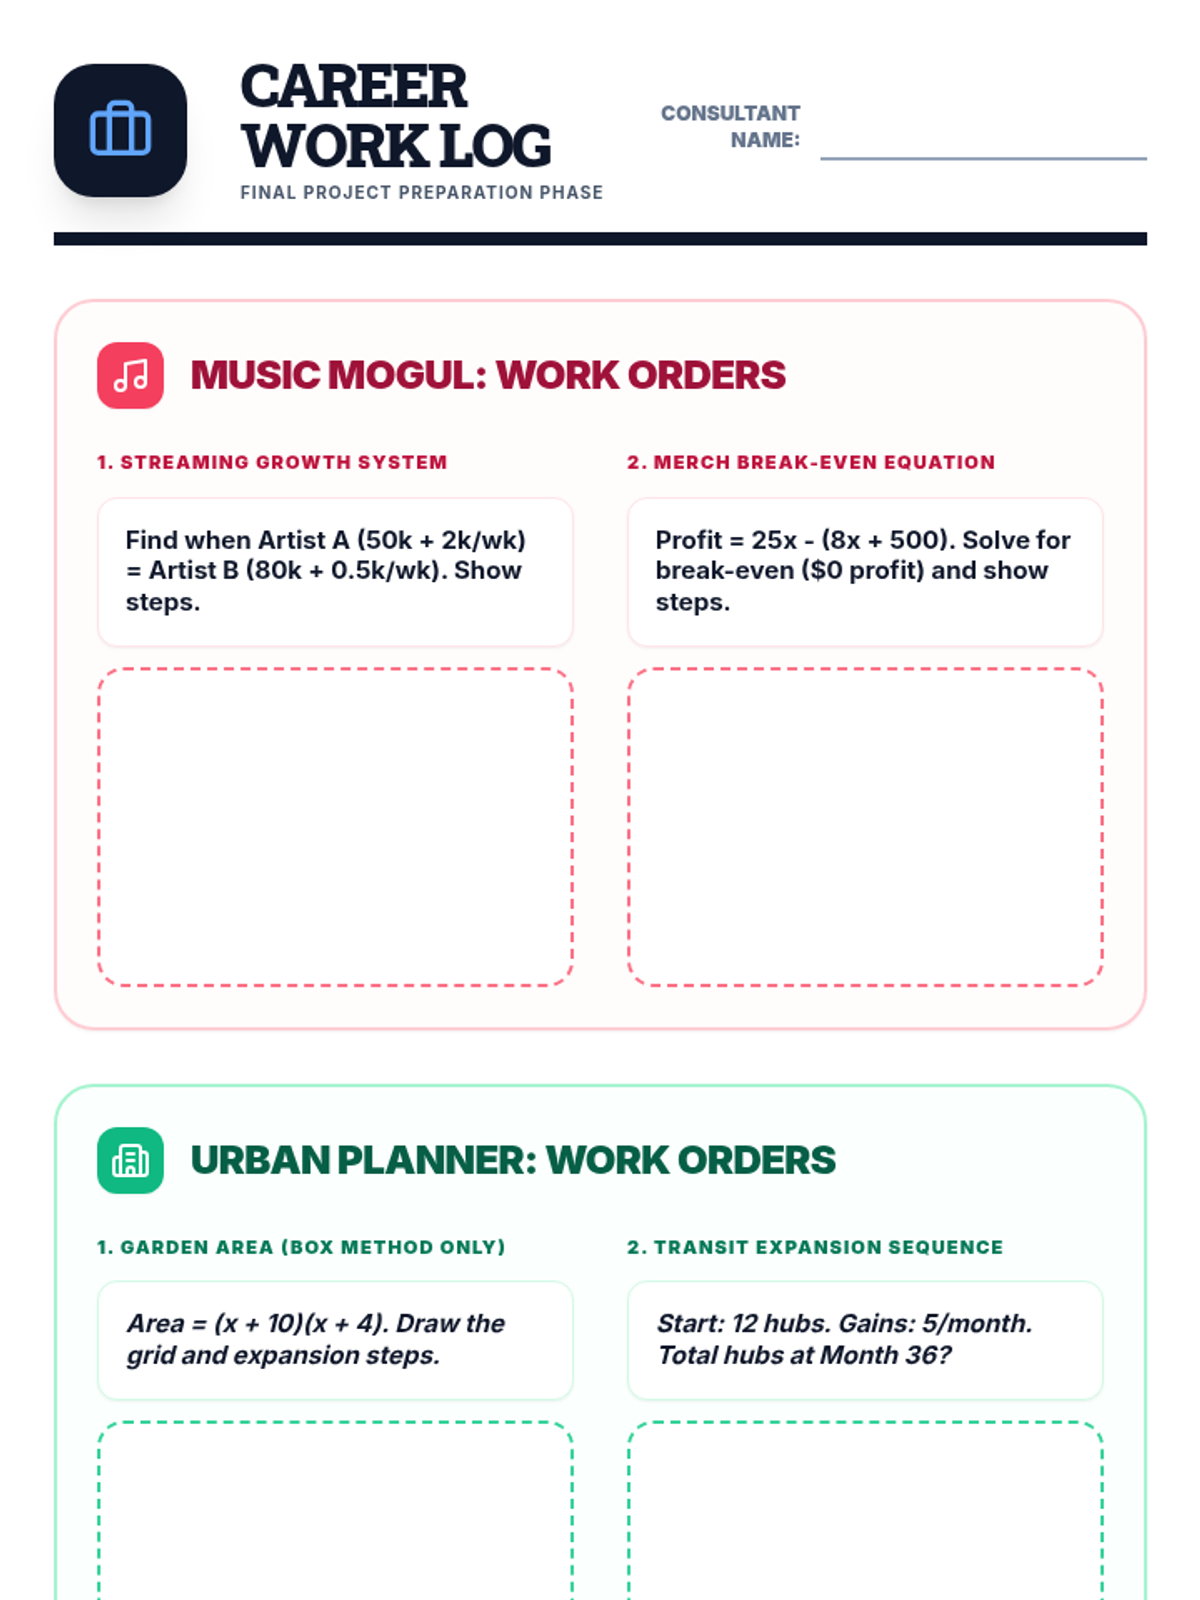
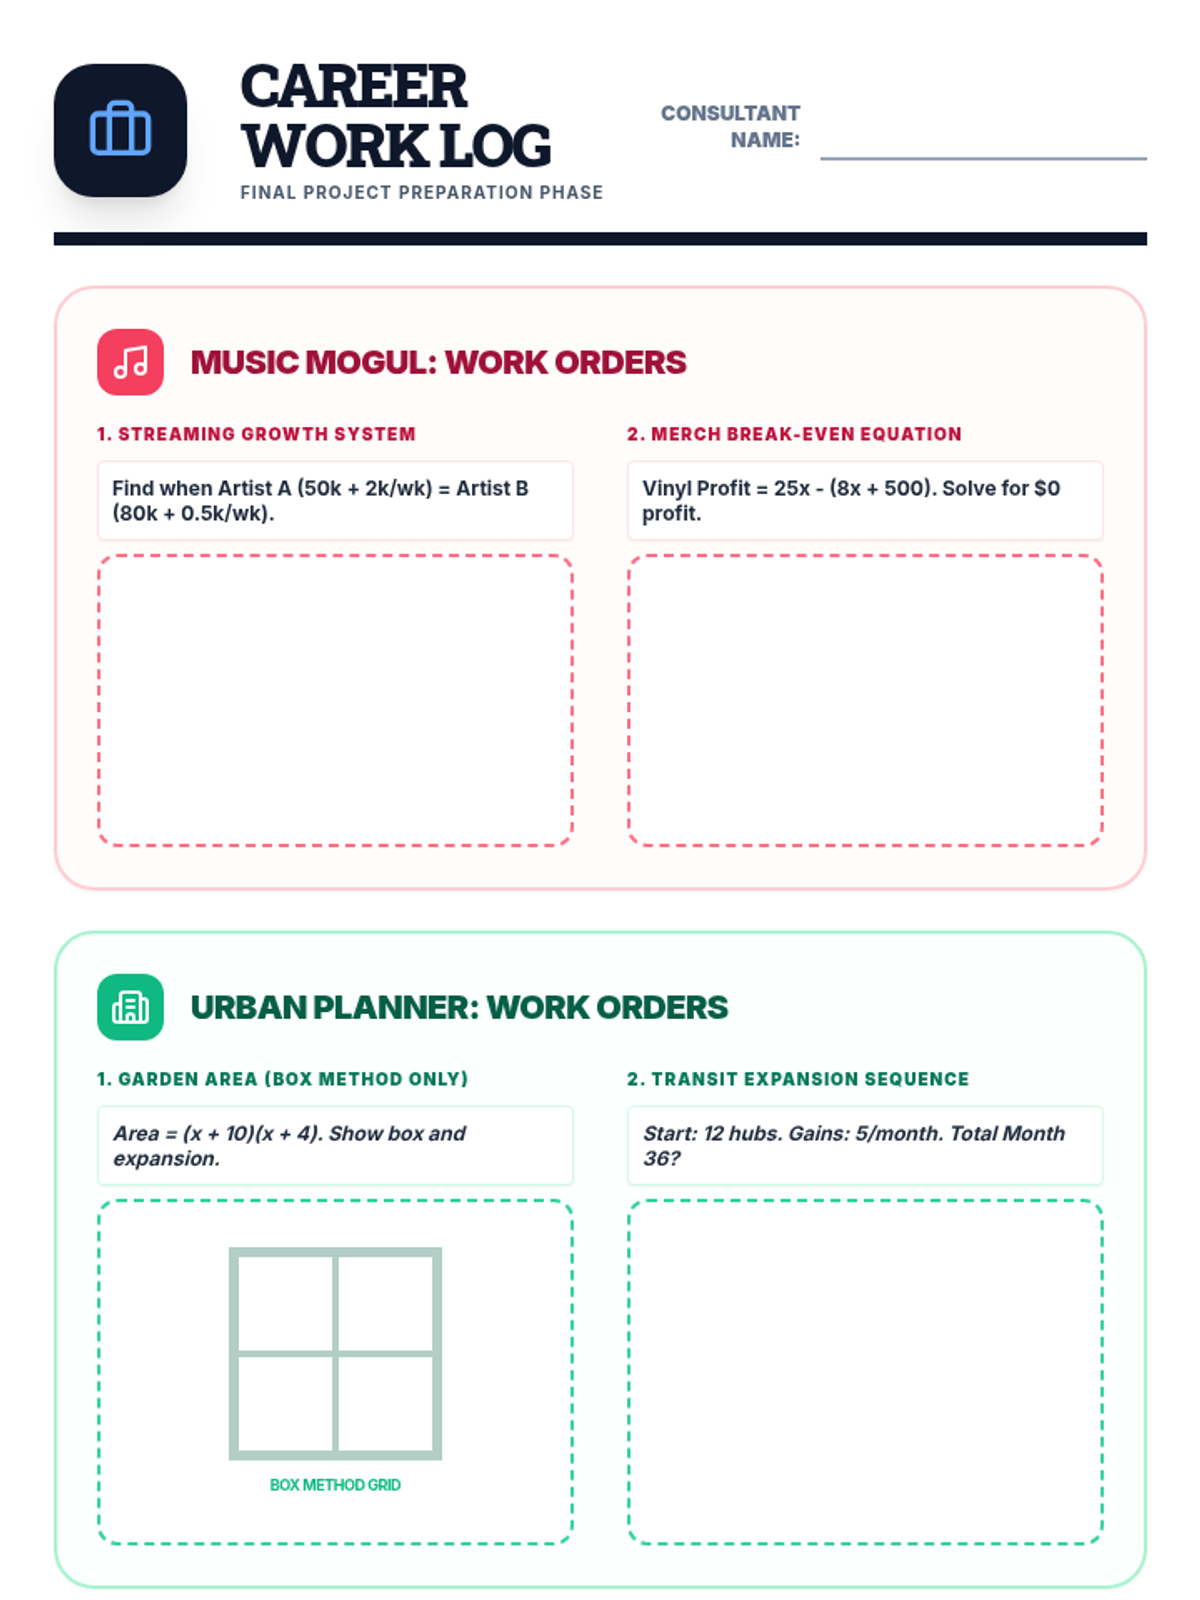
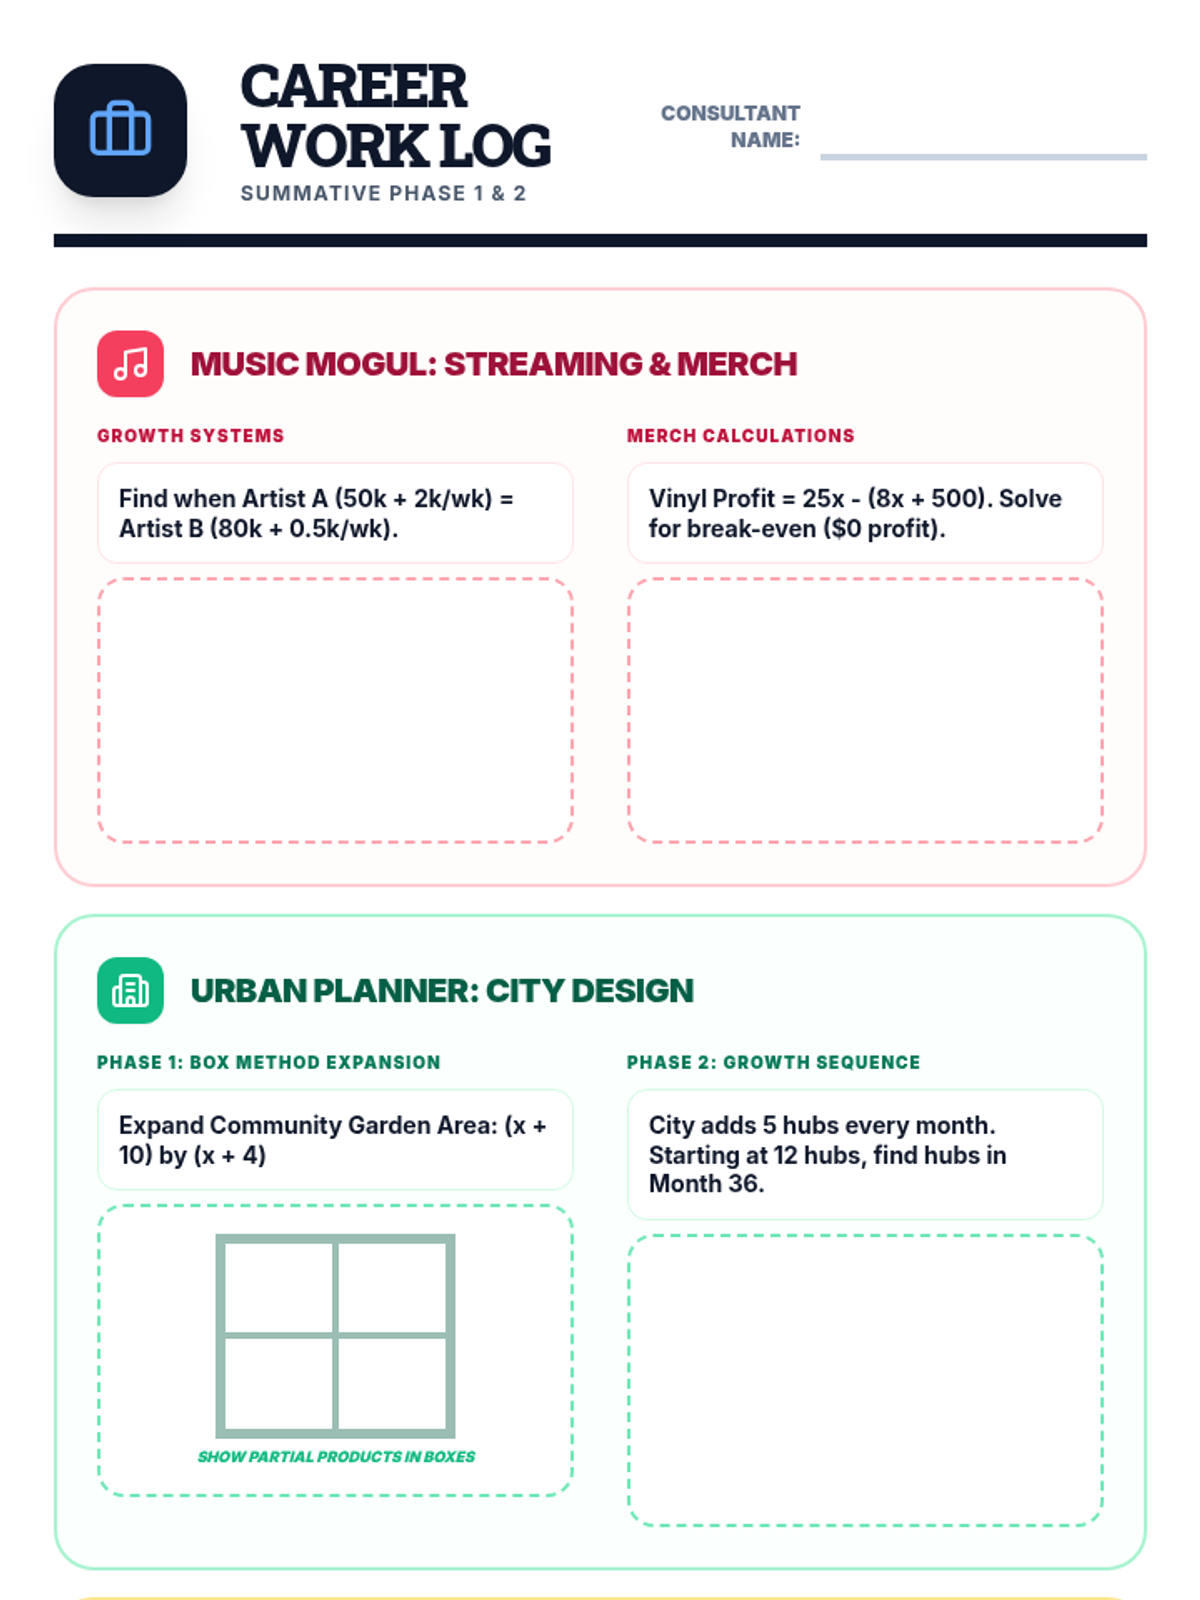
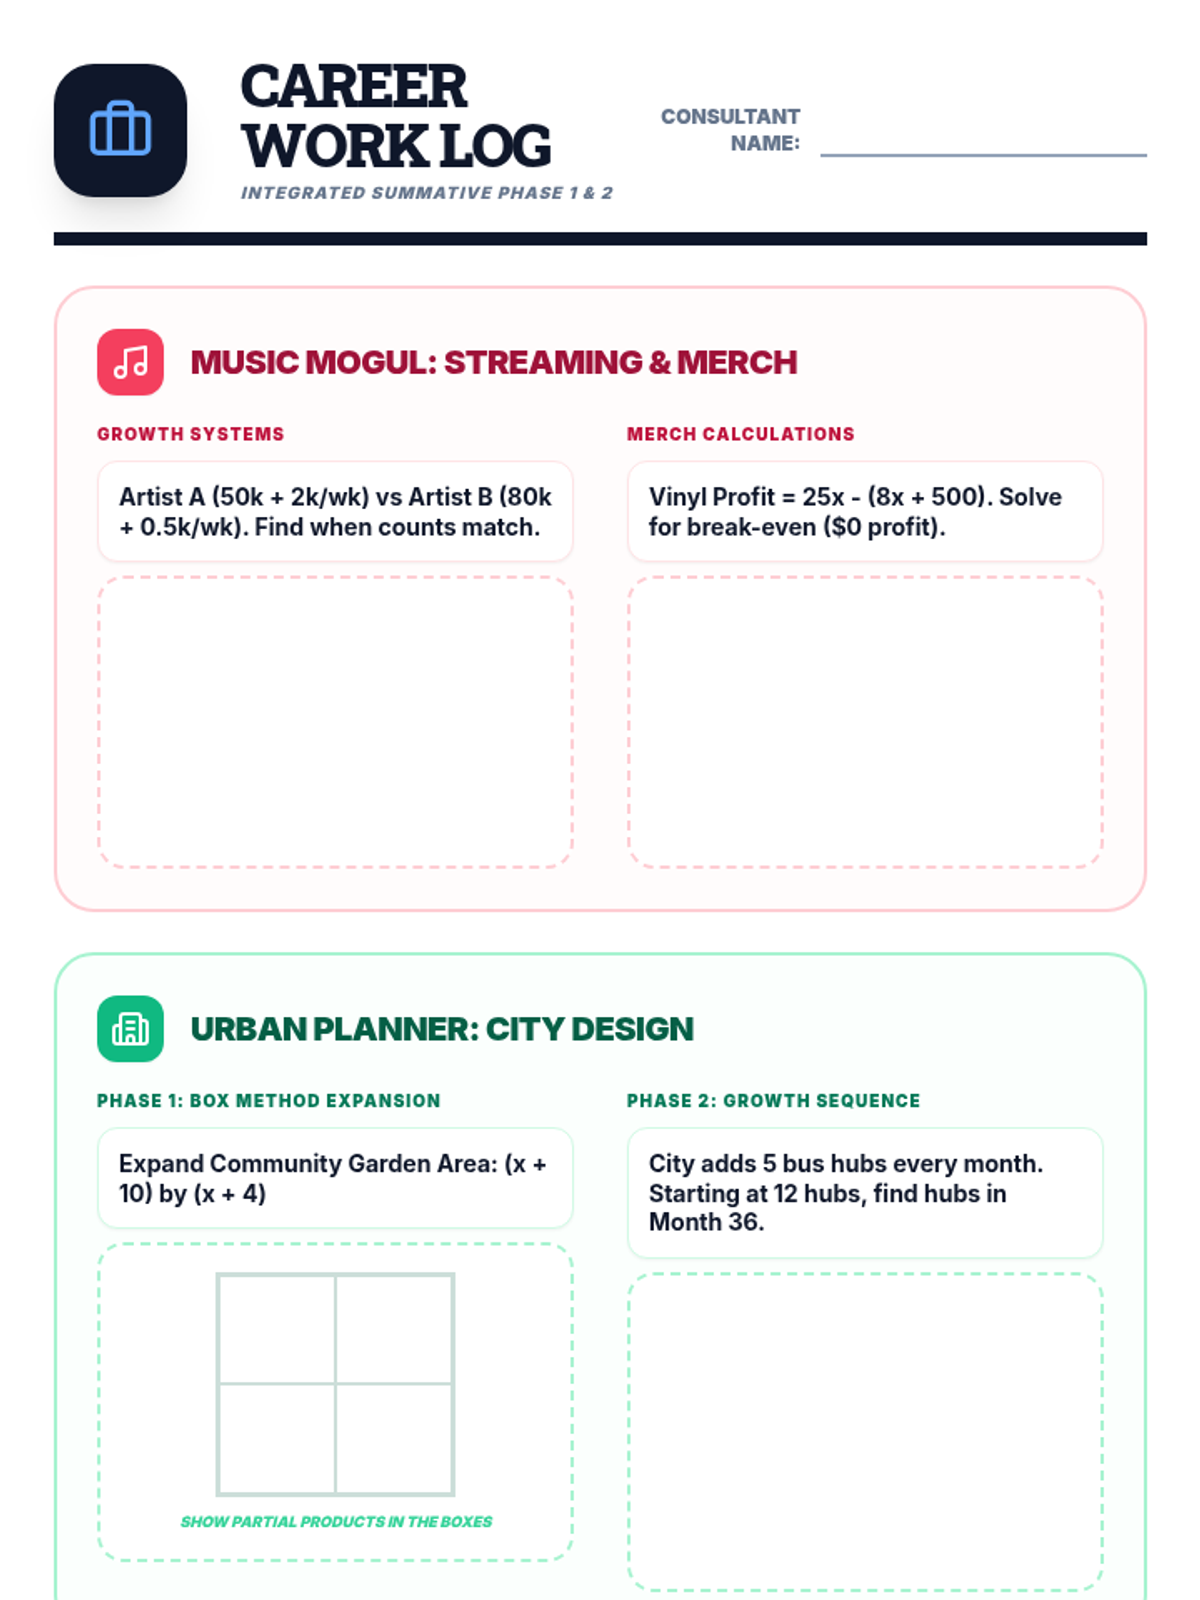
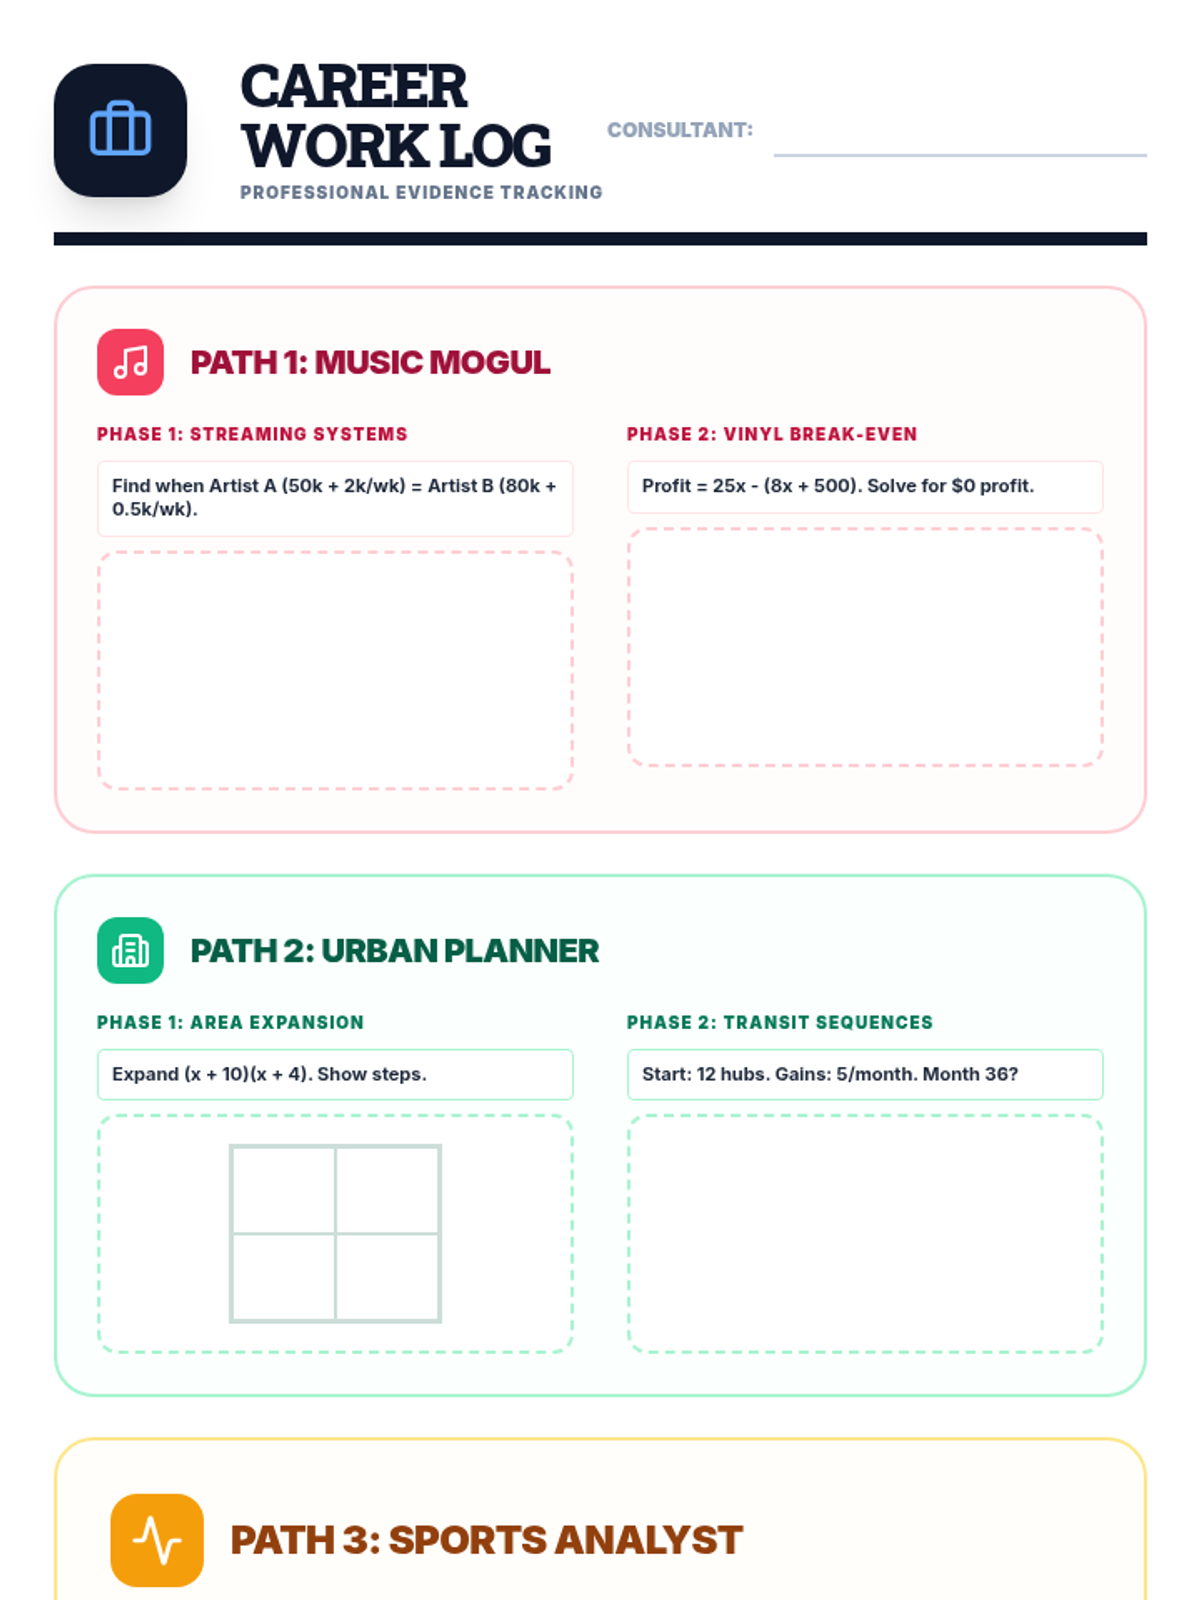
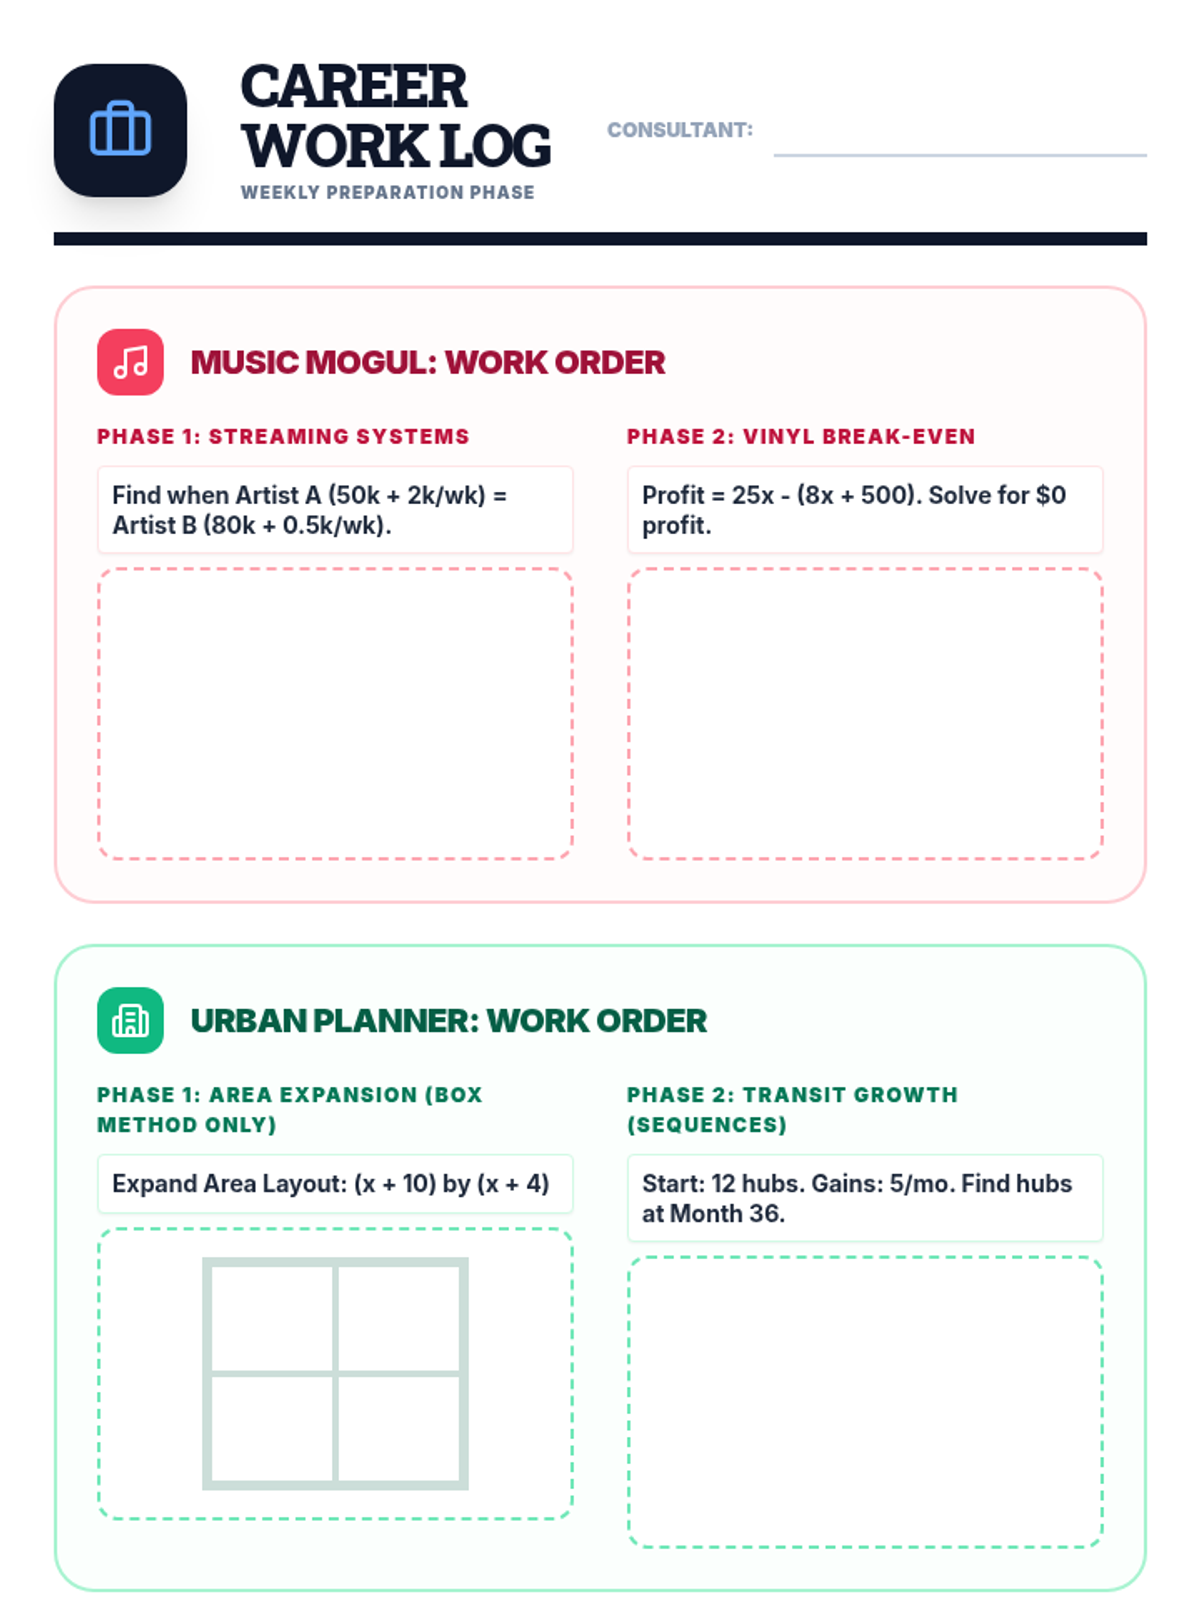
Revised Career Mission Log with large, dedicated work areas for the three professional paths. Each task is framed as a professional work order requiring the math skills learned in class (Systems, Polynomials, Sequences, and Data Analysis). Optimized for a 2-page layout with high-contrast text and corrected graph alignment. Prompts were enlarged for better readability. Y-axis labels fixed using standard rotation. Scatter plot grid spans full height. consolidated to 2 pages exactly. Vertical axis rotation fixed for legibility.
Revised Career Mission Log with large, dedicated work areas for the three professional paths. Each task is framed as a professional work order requiring the math skills learned in class (Systems, Polynomials, Sequences, and Data Analysis). Optimized for a 2-page layout with high-contrast text and corrected graph alignment. All placeholder text contrast improved for printing. Prompts were enlarged for better readability. Y-axis labels and header spacing fixed. Larger work areas for all phases. Fixed vertical text rotation. Consolidated to 2 pages exactly.
Final Career Pitch Portfolio Handout. Professional summary document for students to synthesize their math evidence into a final career pitch. Features kid-friendly terminology ('Evidence Log', 'Calculation Summary'), high-contrast work areas, and a structured executive brief layout for the 2-hour final block. Improved font sizes and larger explanation boxes for better student usability. Consolidated to a more efficient layout to prevent page breaks. Header icons standardized. Cover page label legibility improved. Main background set to white for proper printer margins. Removed rigid height constraints to prevent fragmentation. Signature box enlarged. Header spacing corrected. Standardized to 'Executive Pitch Portfolio'.
Revised Career Mission Log with large, dedicated work areas for the three professional paths. Each task is framed as a professional work order requiring the math skills learned in class (Systems, Polynomials, Sequences, and Data Analysis). Optimized for a 2-page layout with high-contrast text and corrected graph alignment. Prompts were enlarged for better readability. Y-axis labels fixed using standard rotation. Scatter plot grid spans full height. consolidated to 2 pages.
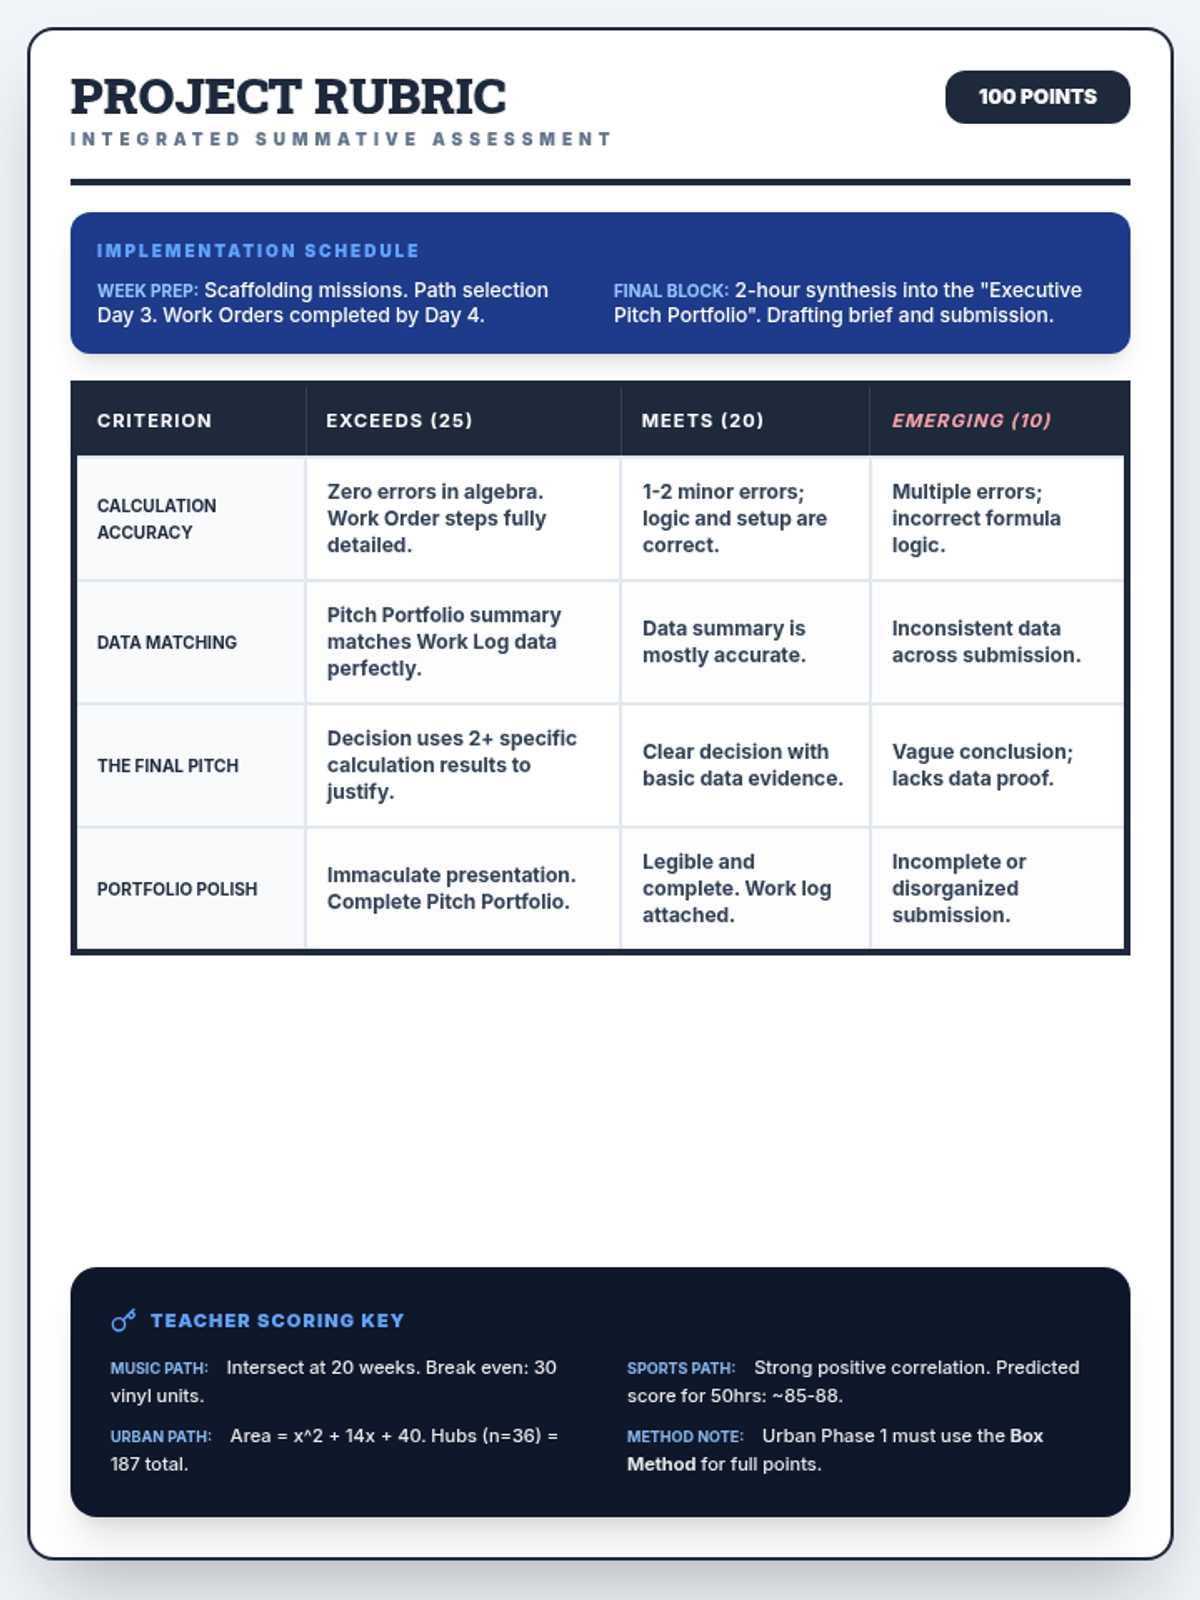
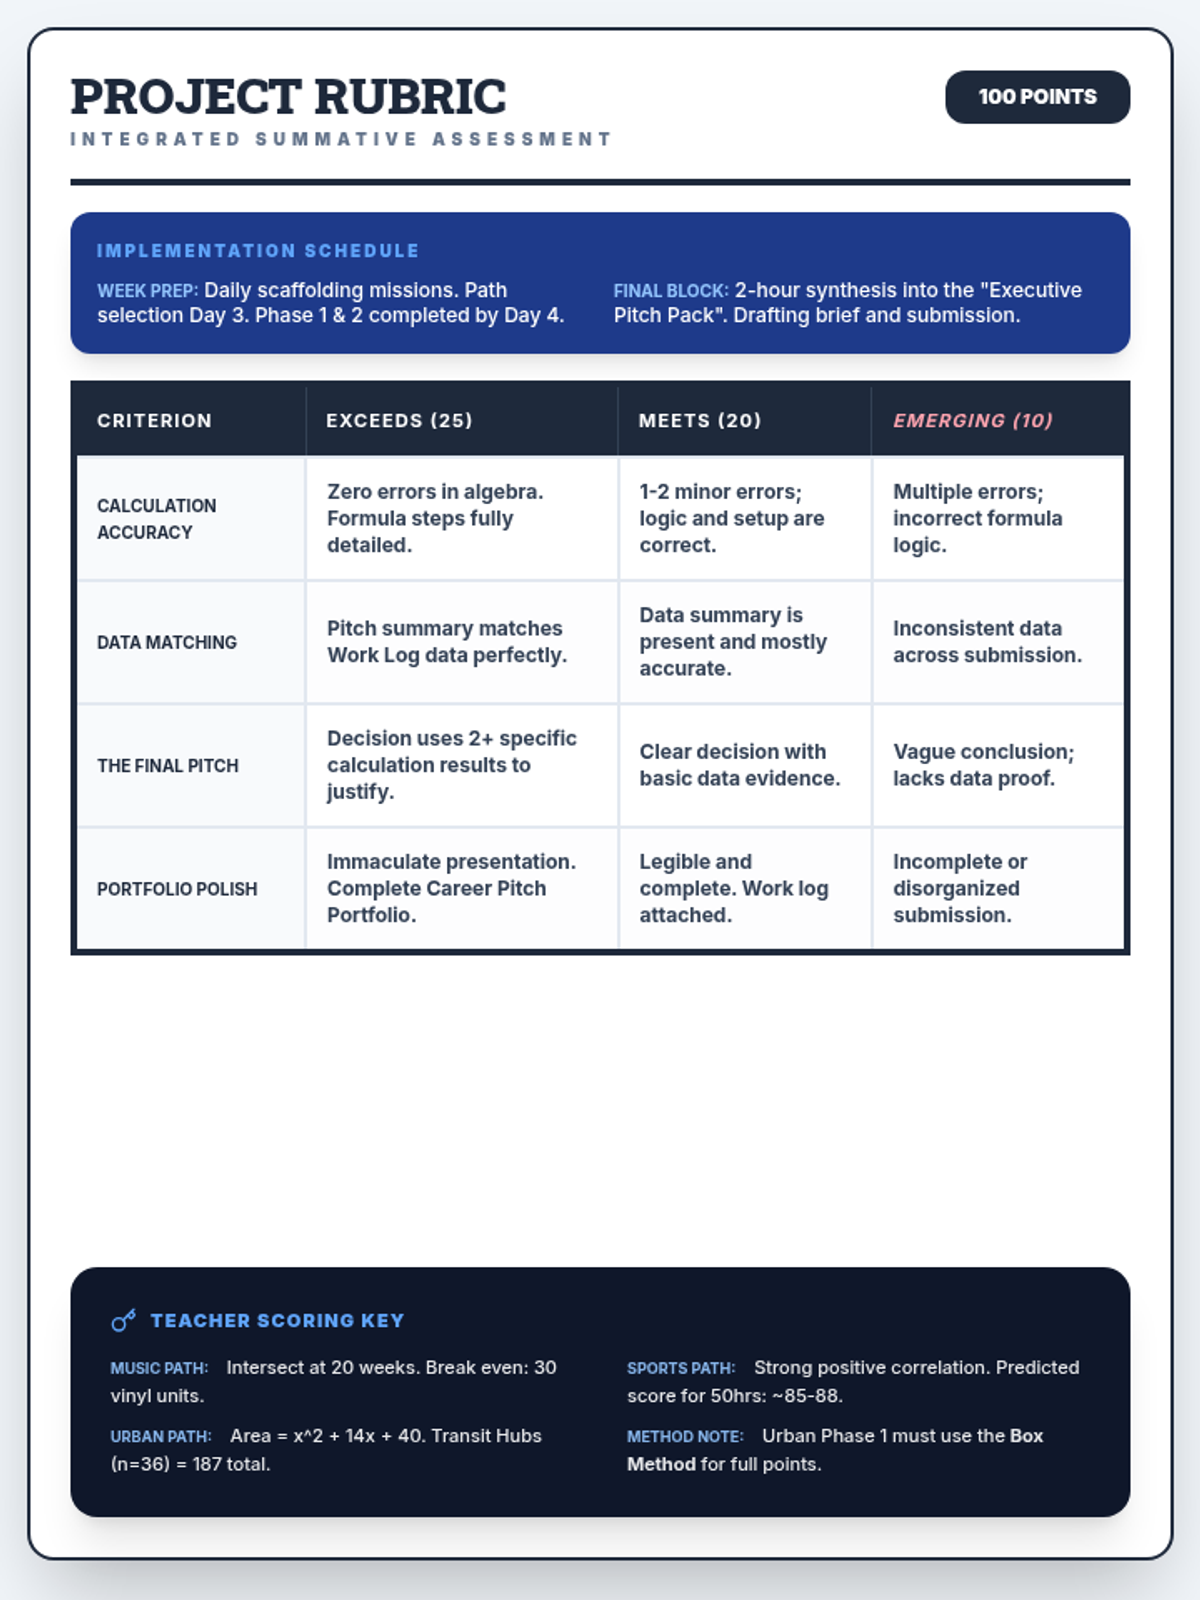
Revised Teacher Rubric updated with kid-friendly language. 'Math Accuracy' is now 'Calculation Accuracy', 'Proof Synthesis' is 'Data Matching', and 'Executive Brief' is 'The Final Pitch'. Maintains a clean one-page layout. Updated to explicitly reference the Box Method for the Urban Planner path. Naming standardized to 'Executive Pitch Portfolio'.
Final Executive Career Portfolio Handout. Professional summary document for students to synthesize their math evidence into a final career pitch. Features kid-friendly terminology ('Evidence Log', 'Calculation Summary'), high-contrast work areas, and a structured executive brief layout for the 2-hour final block. Improved font sizes and larger explanation boxes for better student usability. Consolidated to a more efficient layout to prevent page breaks. Header icons standardized. Cover page label legibility improved. Main background set to white for proper printer margins. Removed rigid height constraints to prevent fragmentation.
Revised Career Mission Log with large, dedicated work areas for the three professional paths. Each task is framed as a professional work order requiring the math skills learned in class (Systems, Polynomials, Sequences, and Data Analysis). Optimized for a 2-page layout with high-contrast text and corrected graph alignment. All placeholder text contrast improved for printing. Prompts were enlarged for better readability. Y-axis labels and header spacing fixed. Larger work areas for all phases. Fixed vertical text rotation.
Final Career Pitch Portfolio Handout. Professional summary document for students to synthesize their math evidence into a final career pitch. Features kid-friendly terminology ('Evidence Log', 'Calculation Summary'), high-contrast work areas, and a structured executive brief layout for the 2-hour final block. Improved font sizes and larger explanation boxes for better student usability. Consolidated to a more efficient layout to prevent page breaks. Fixed fixed height issues causing rendering errors. Signature box enlarged. Header spacing corrected. Header icons standardized. Cover page label legibility improved. Main background set to white for proper printer margins. Removed rigid height constraints to prevent fragmentation.
Revised Career Mission Log with large, dedicated work areas for the three professional paths. Each task is framed as a professional work order requiring the math skills learned in class (Systems, Polynomials, Sequences, and Data Analysis). Optimized for a 2-page layout with high-contrast text and corrected graph alignment. All placeholder text contrast improved for printing. Prompts were enlarged for better readability. Y-axis labels and header spacing fixed. Larger work areas for all phases.
Revised Career Mission Log with large, dedicated work areas for the three professional paths. Each task is framed as a professional work order requiring the math skills learned in class (Systems, Polynomials, Sequences, and Data Analysis). Optimized for a 2-page layout with high-contrast text and corrected graph alignment. All placeholder text contrast improved for printing. Y-axis labels and header spacing fixed. Larger work areas for all phases.
Revised Teacher Rubric updated with kid-friendly language. 'Math Accuracy' is now 'Calculation Accuracy', 'Proof Synthesis' is 'Data Matching', and 'Executive Brief' is 'The Final Pitch'. Maintains a clean one-page layout. Updated to explicitly reference the Box Method for the Urban Planner path.
Revised project introduction slides centered around a 'Job Board' theme. Each career path (Music Mogul, Urban Planner, Sports Analyst) explicitly requires the math skills learned in class, framed as professional requirements. Improved spacing, consistent alignment, and increased font sizes for legibility.
Revised Career Mission Log with large, dedicated work areas for the three professional paths. Each task is framed as a professional work order requiring the math skills learned in class (Systems, Polynomials, Sequences, and Data Analysis). Optimized for a 2-page layout with high-contrast text and corrected graph alignment. All placeholder text contrast improved for printing. Prompts were enlarged for better readability. Y-axis labels and header spacing fixed.
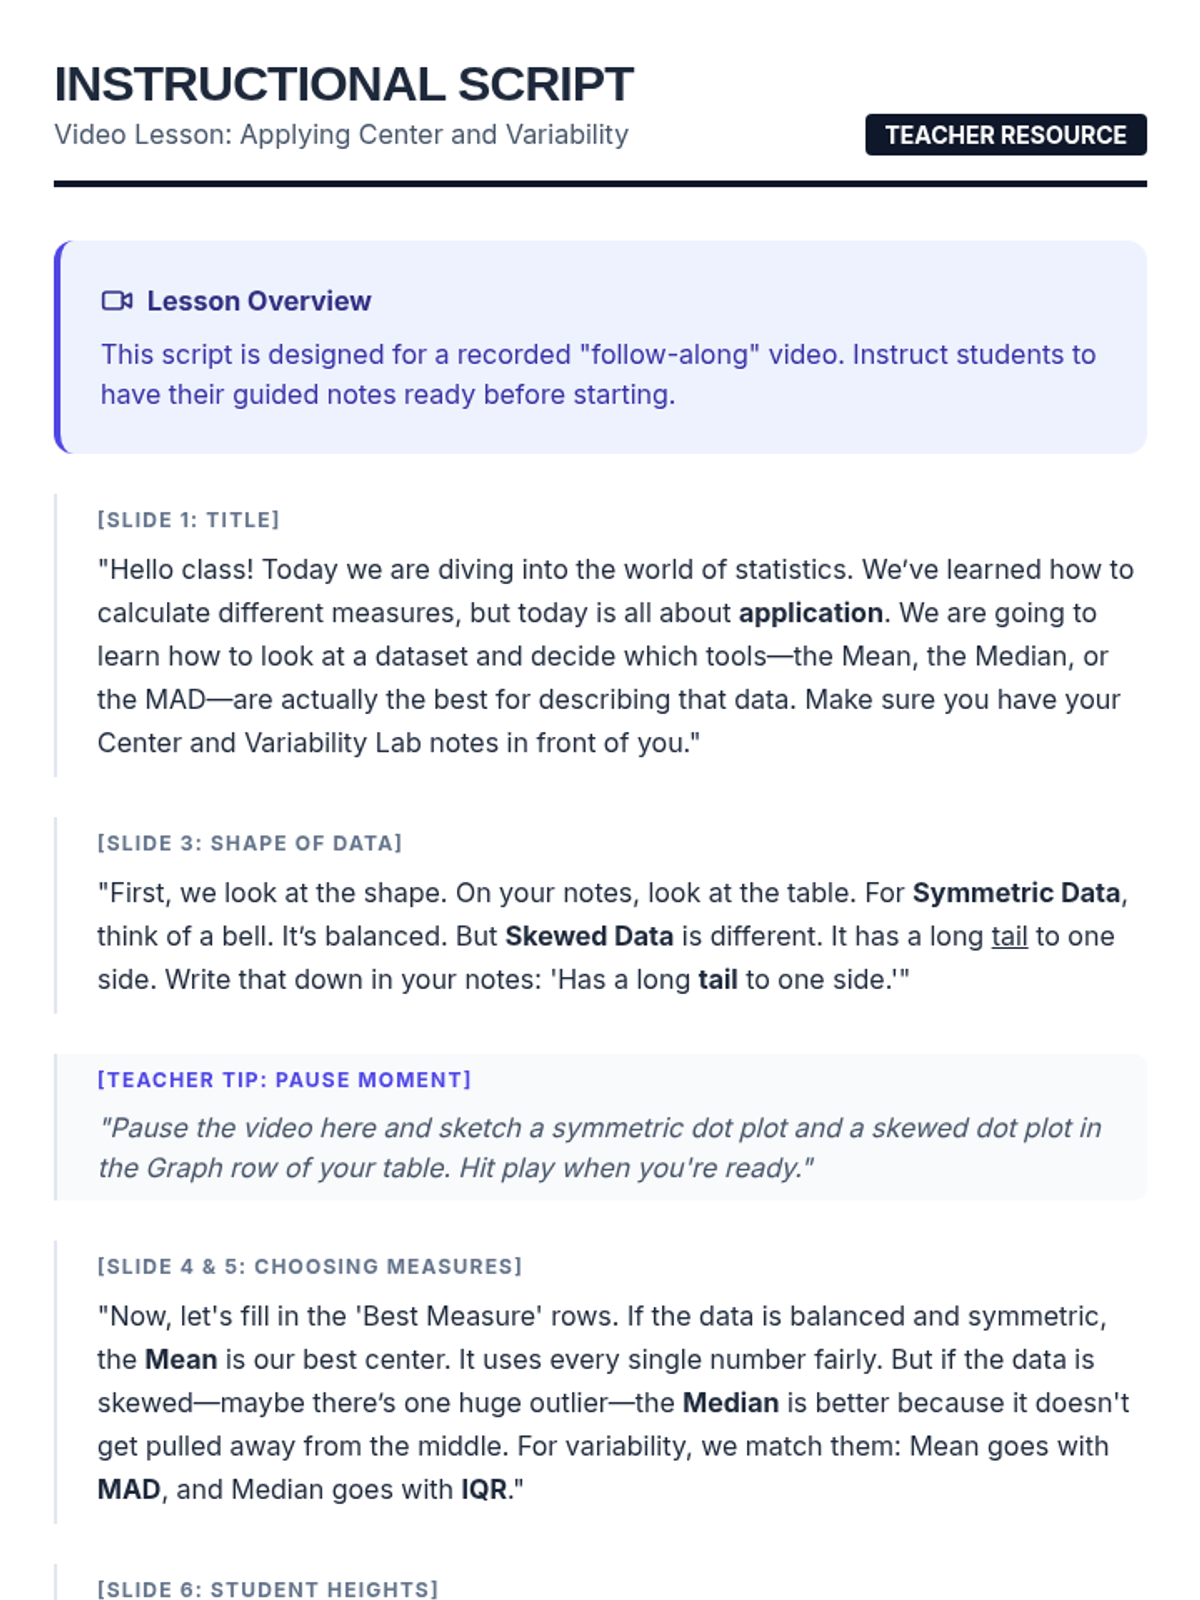
A detailed instructional script for a follow-along video, including specific slide cues and student-facing dialogue for a sub lesson.
High-engagement teaching slides that guide students through choosing appropriate statistical measures based on data distribution.
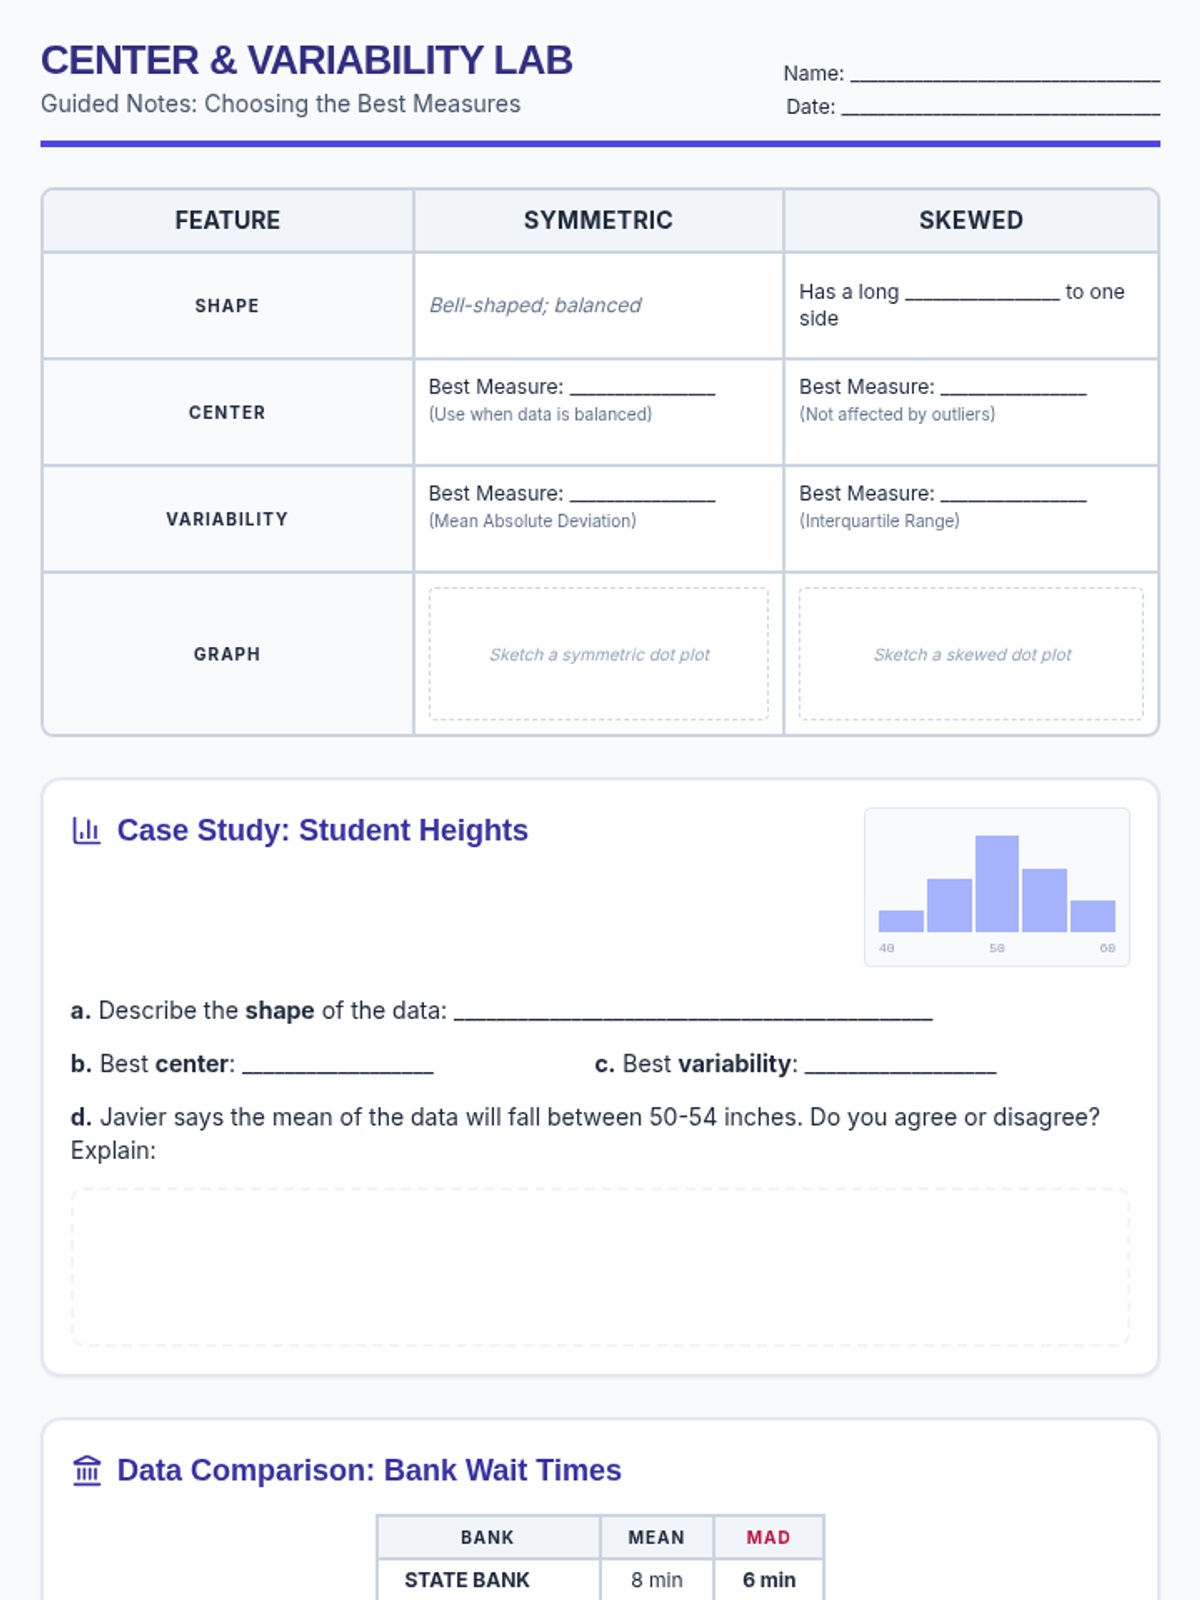
A fill-in-the-blank guided notes sheet designed for students to complete while watching a teaching video on center and variability.
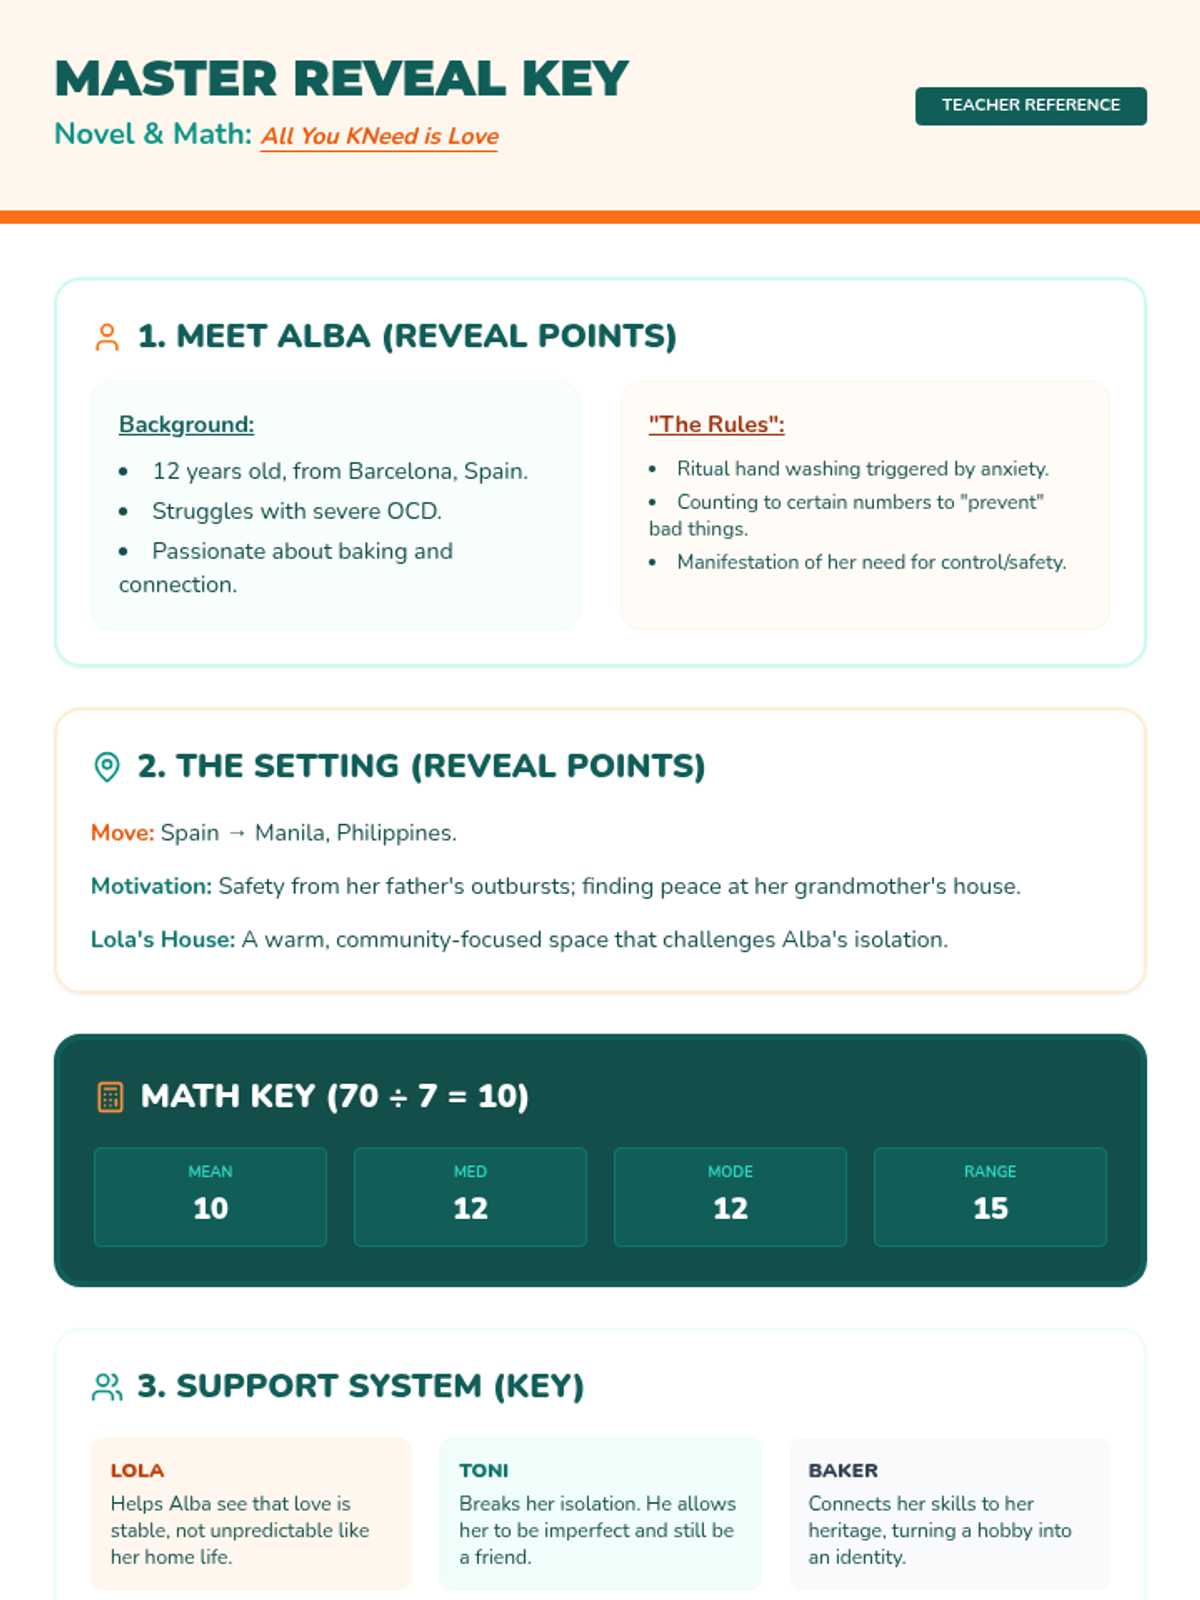
A master answer key for the 'Heart and Heritage' lesson. It provides the reveal points for the slide presentation, numerical solutions for the math integration, and character/thematic analysis for the teacher.
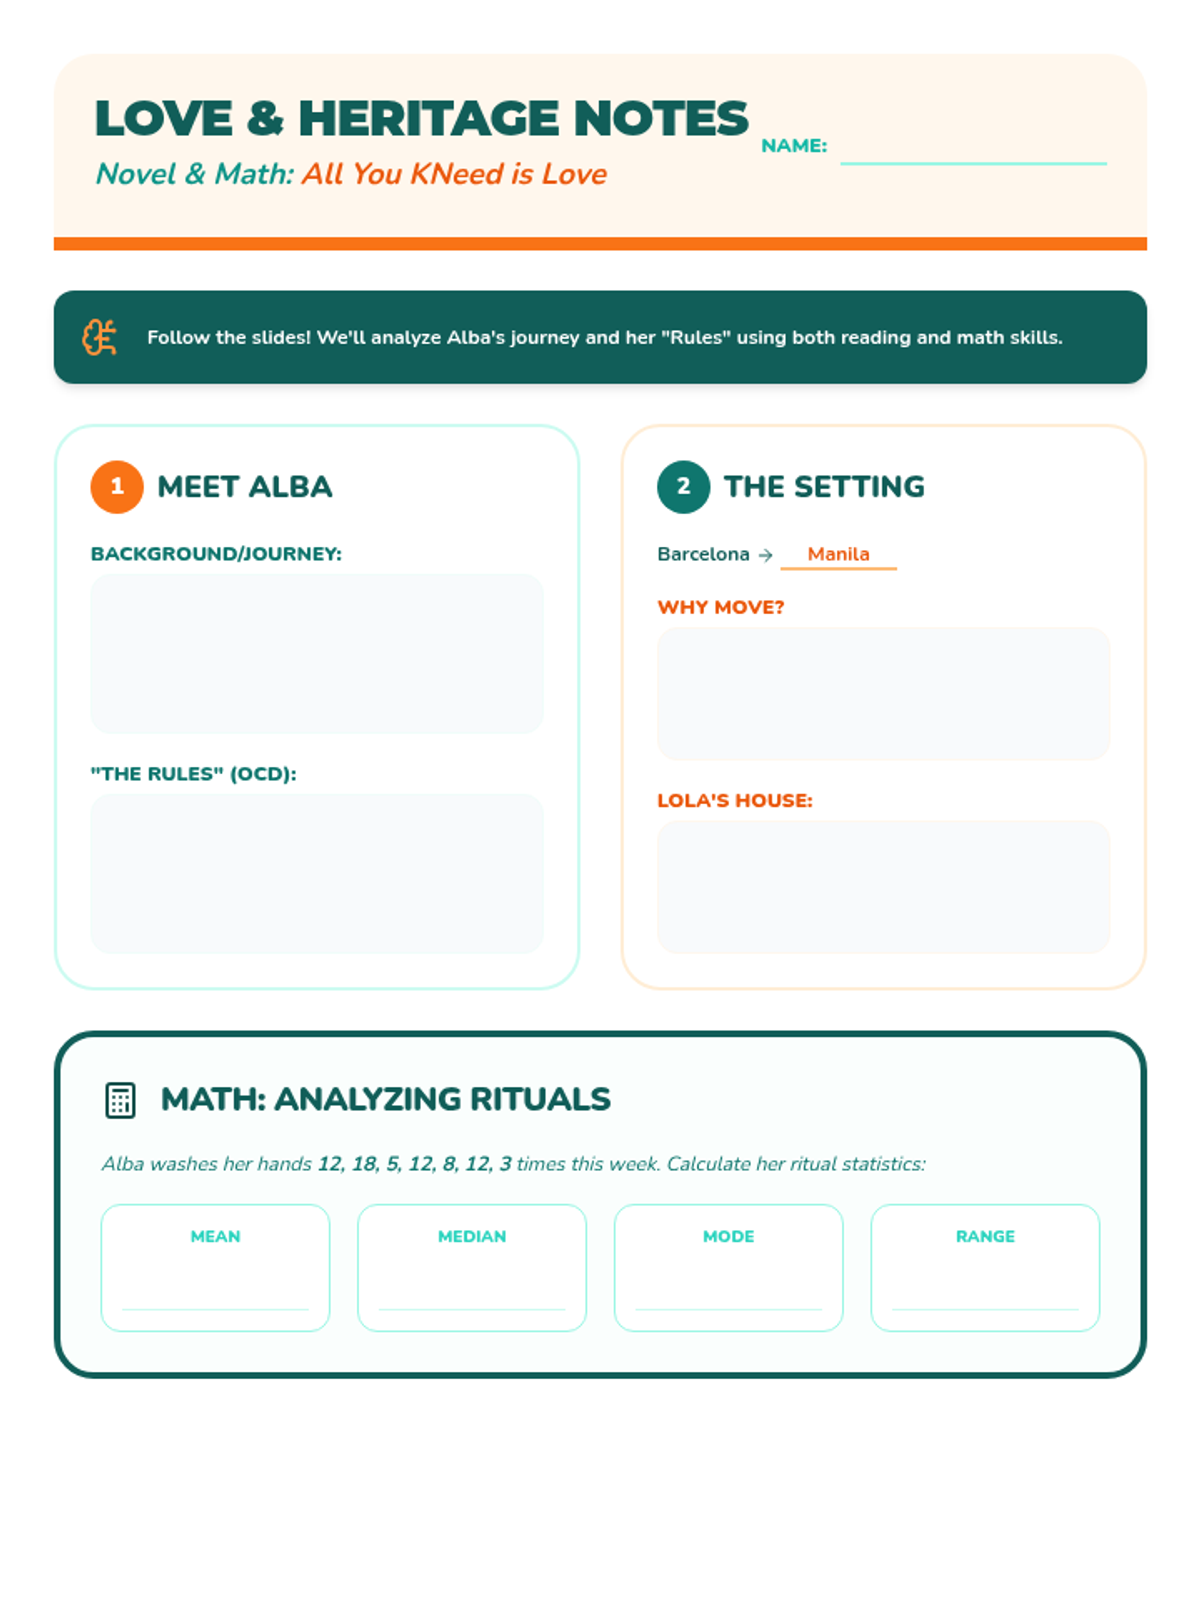
A scaffolded guided reading worksheet for the novel 'All You KNeed is Love'. It includes dedicated sections for character profiles, setting comparisons, and critical analysis of the novel's central pun and themes.
An introductory slide deck for 'All You KNeed is Love' designed with a sequential reveal strategy. Each slide uses visual transitions to simulate a button-reveal effect, allowing teachers to prompt discussion before showing key analytical points.
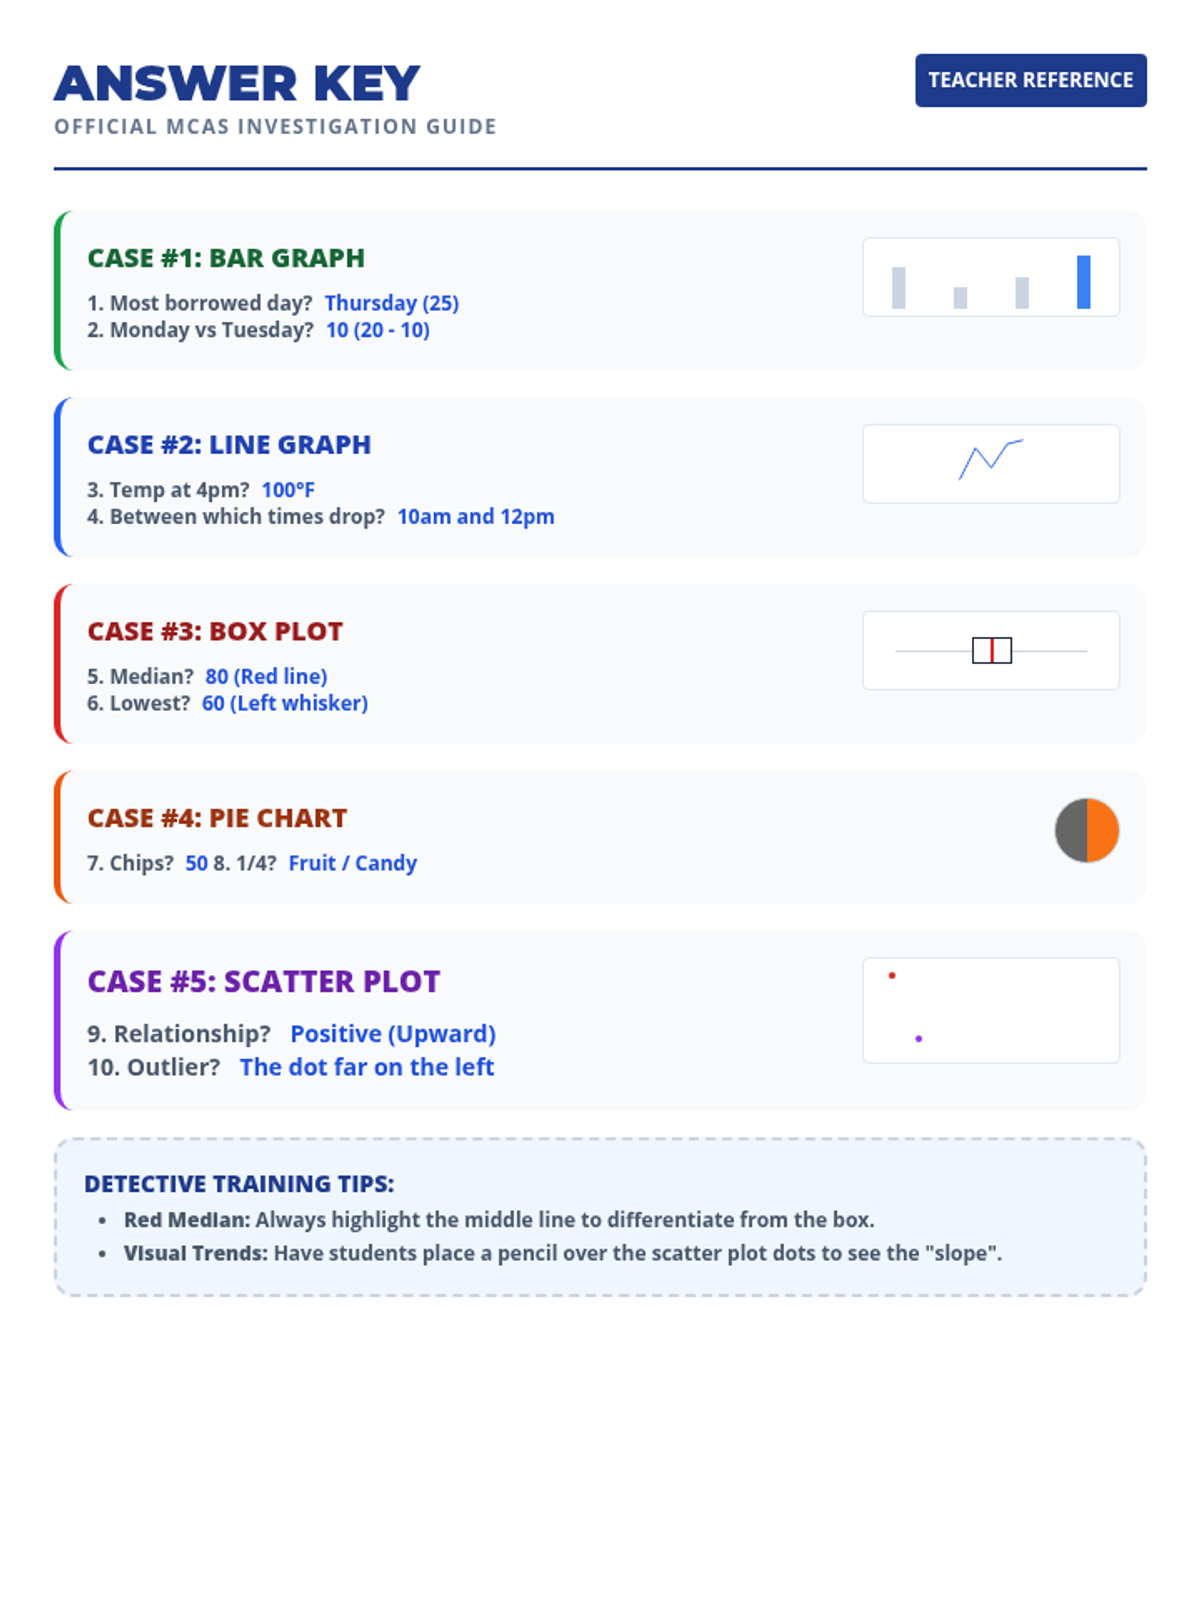
A teacher-facing answer key for the Data Hunt Worksheet. Includes clear answers with thumbnail visuals for quick reference and instructional tips for supporting SPED students. Categorized by case number and graph type. Now condensed to fit on fewer pages.
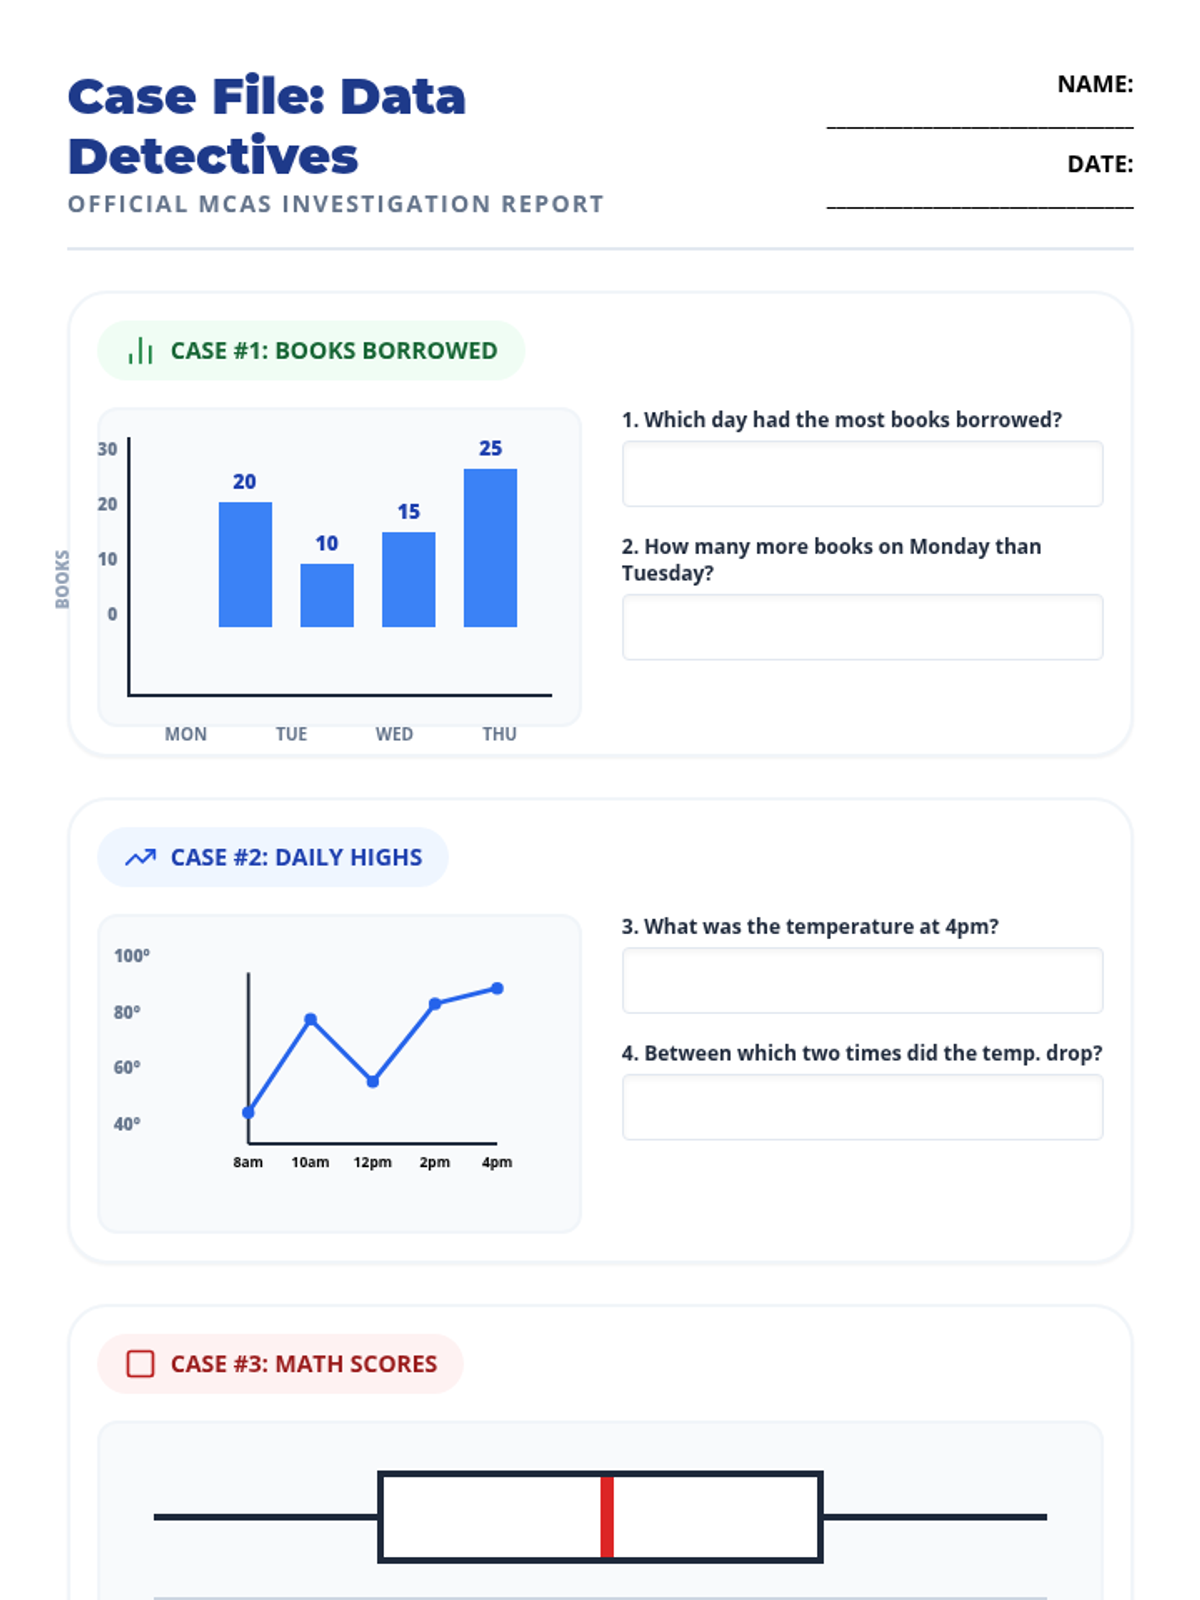
A scaffolded practice worksheet for 7th grade students to apply their data interpretation skills to various graph types. Designed with clear sections, visual aids, and generous writing space for SPED support. Now includes Bar, Line, Box Plot, Pie Chart, and Scatter Plot cases.
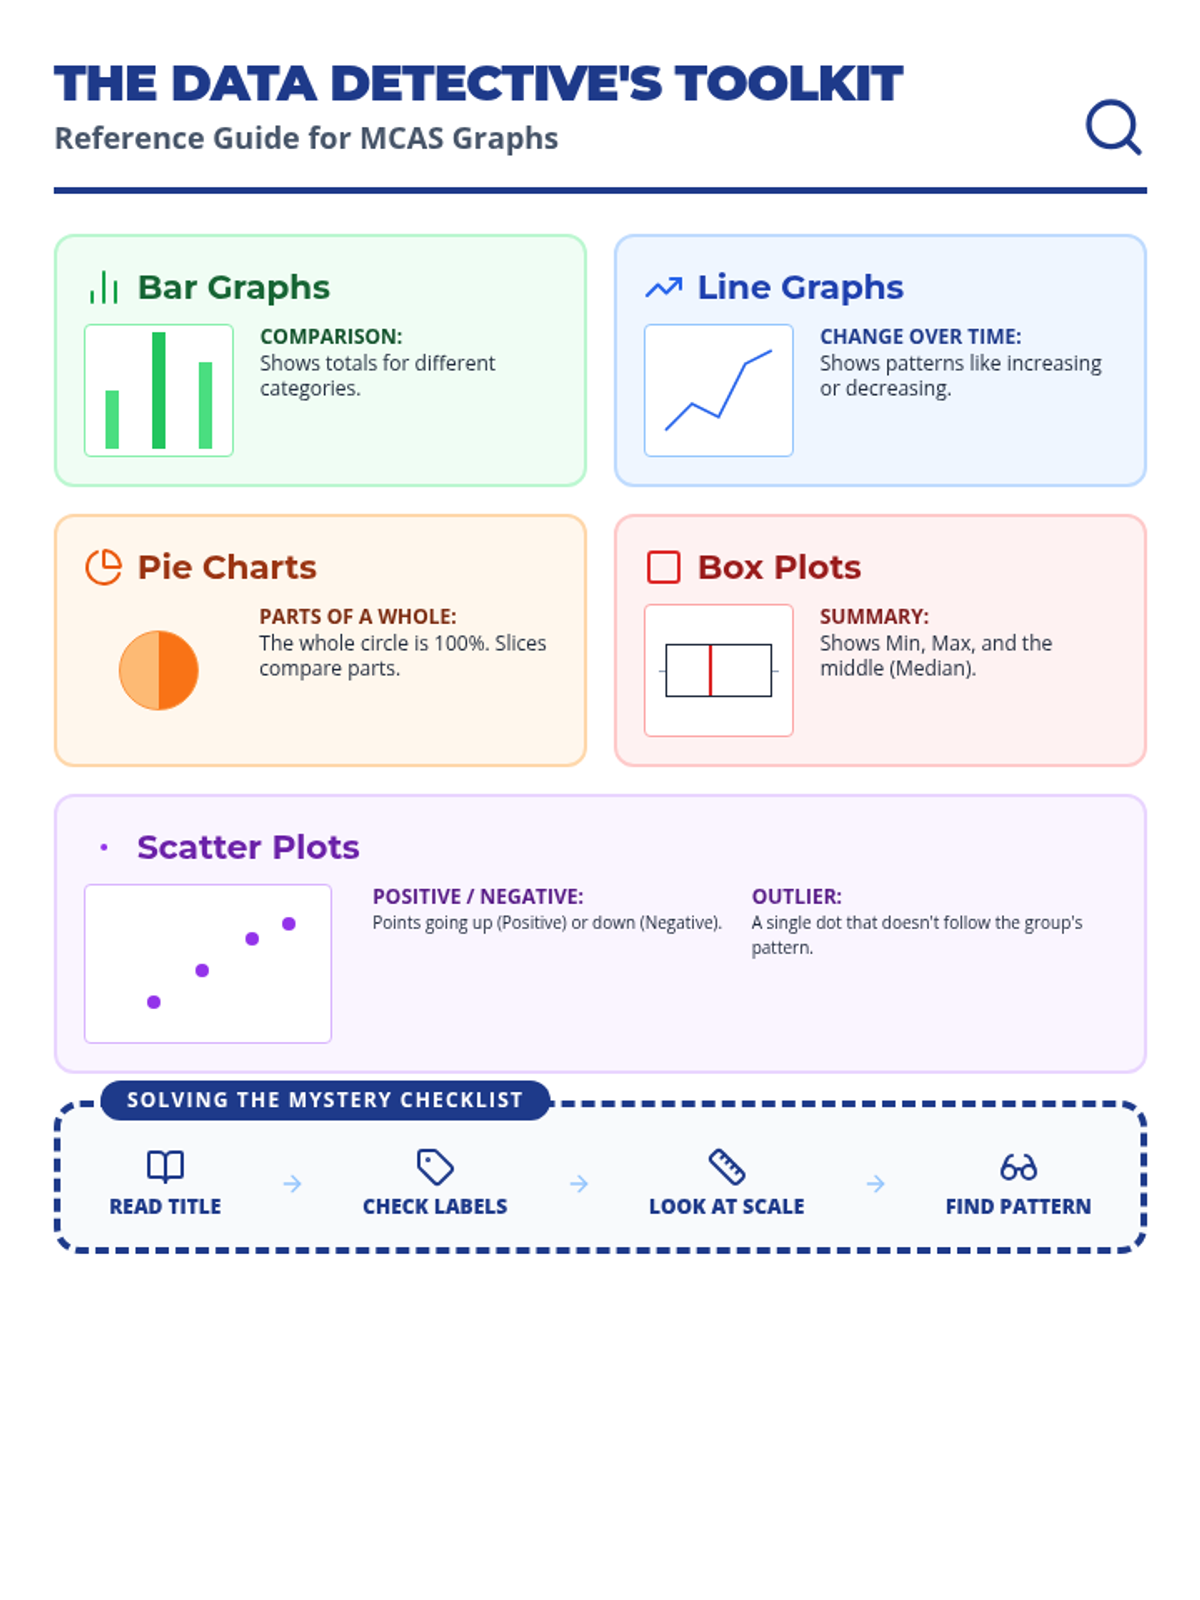
A comprehensive one-page anchor chart/reference guide for 7th grade students. It provides clear visual definitions, tips, and key features for bar graphs, line graphs, pie charts, box plots, and scatter plots, specifically tailored to support SPED students during data interpretation tasks.
A visually engaging slide deck designed for 7th grade students (including SPED support) to learn and practice interpreting various graph types commonly found on the MCAS assessment. Includes clear visuals and simplified steps for bar graphs, line graphs, pie charts, scatter plots, and box plots.
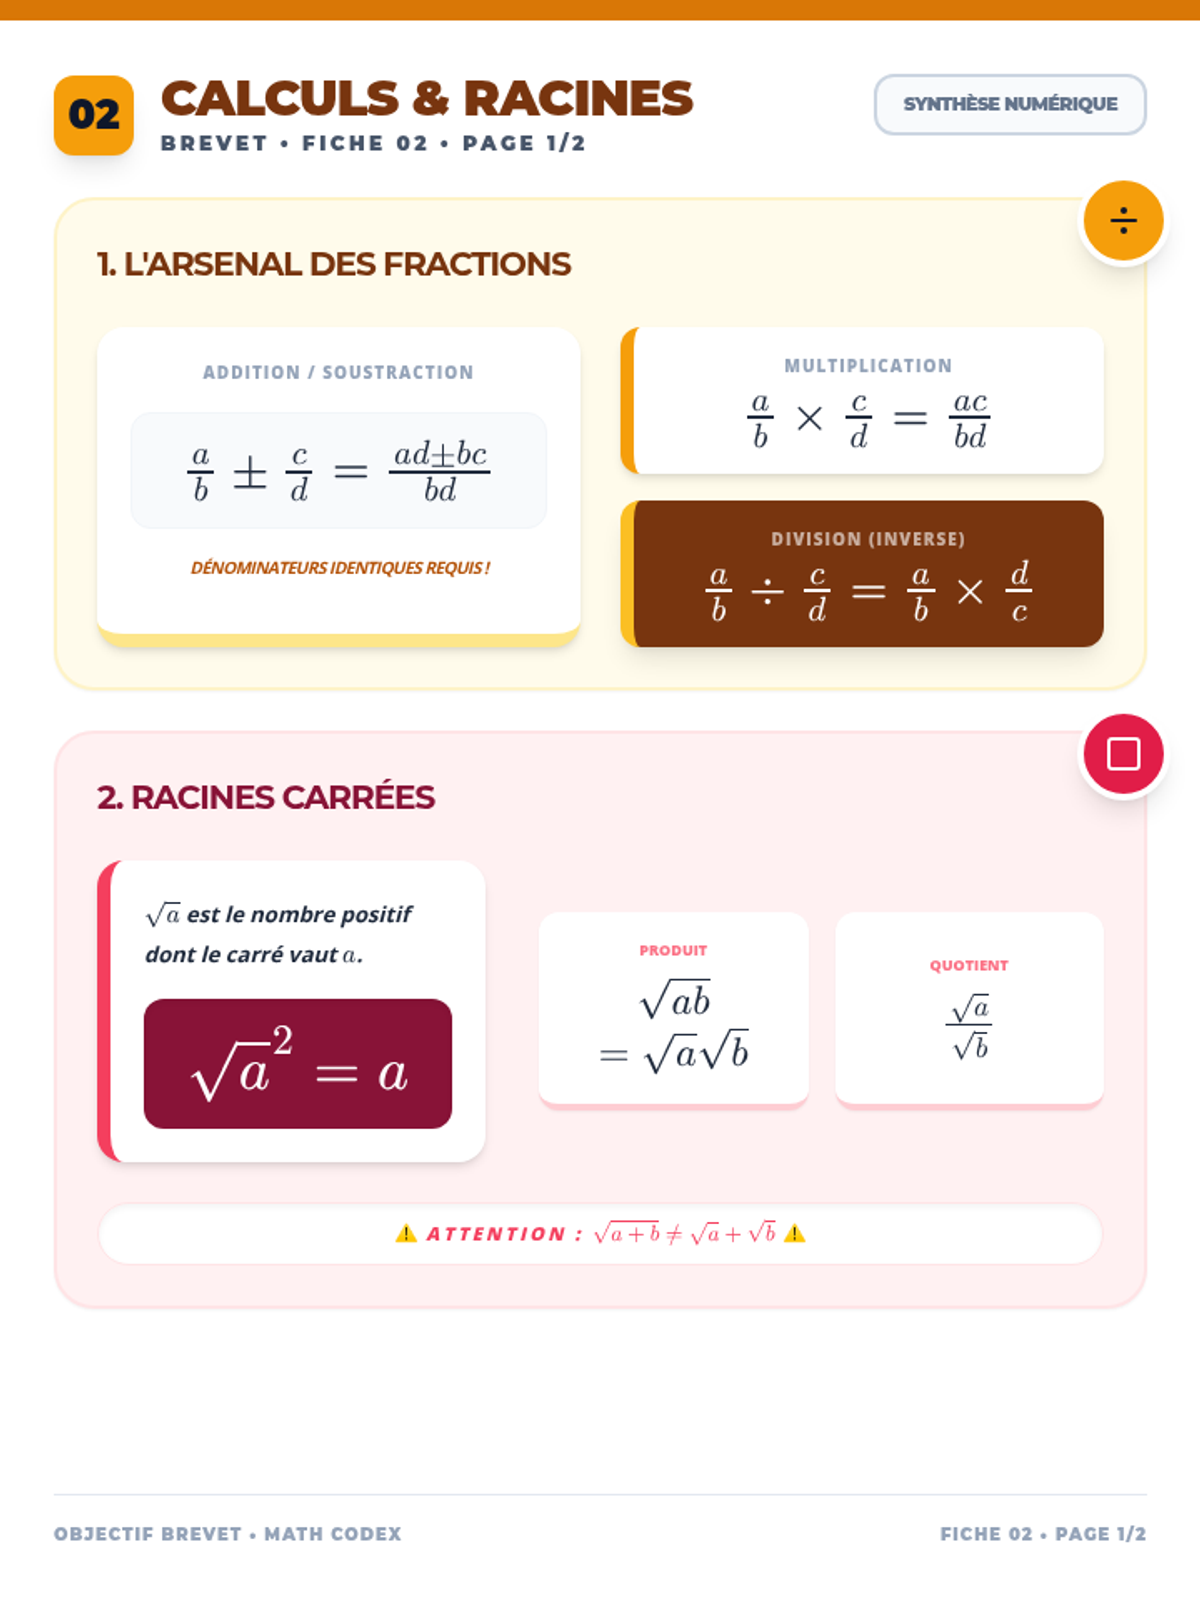
Une fiche de révision complète sur le calcul : fractions, puissances, notation scientifique et racines carrées. Regroupe les concepts des photos 1 et 4 avec une présentation aérée et détaillée sur 2 pages (cours). Synthèse pure. Correction des débordements de page.
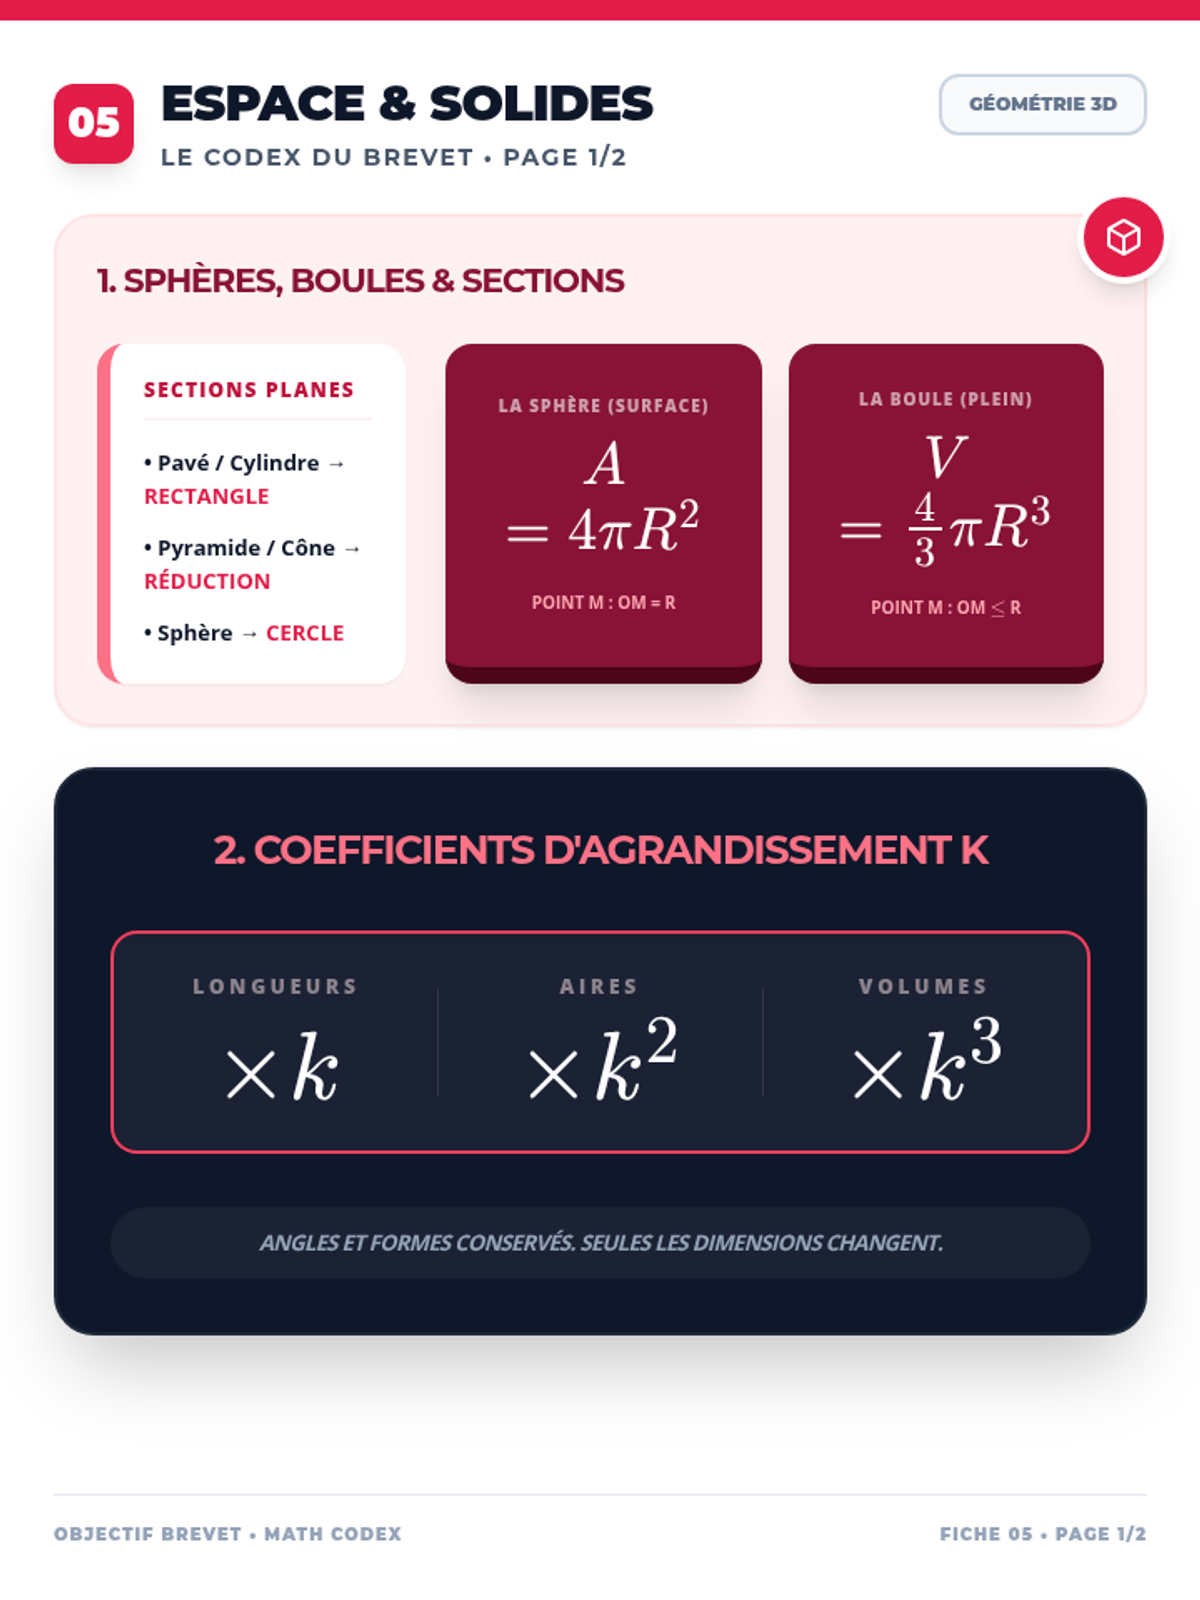
Une fiche de révision complète sur l'espace (solides, sphères, sections, agrandissements), les statistiques (n/N expliqués) et les probabilités. Regroupe les concepts des photos 6, 8, 10 et 11. Synthèse pure sans exercices sur 2 pages. Correction de la formule de la moyenne. Intègre la citation de Larson.
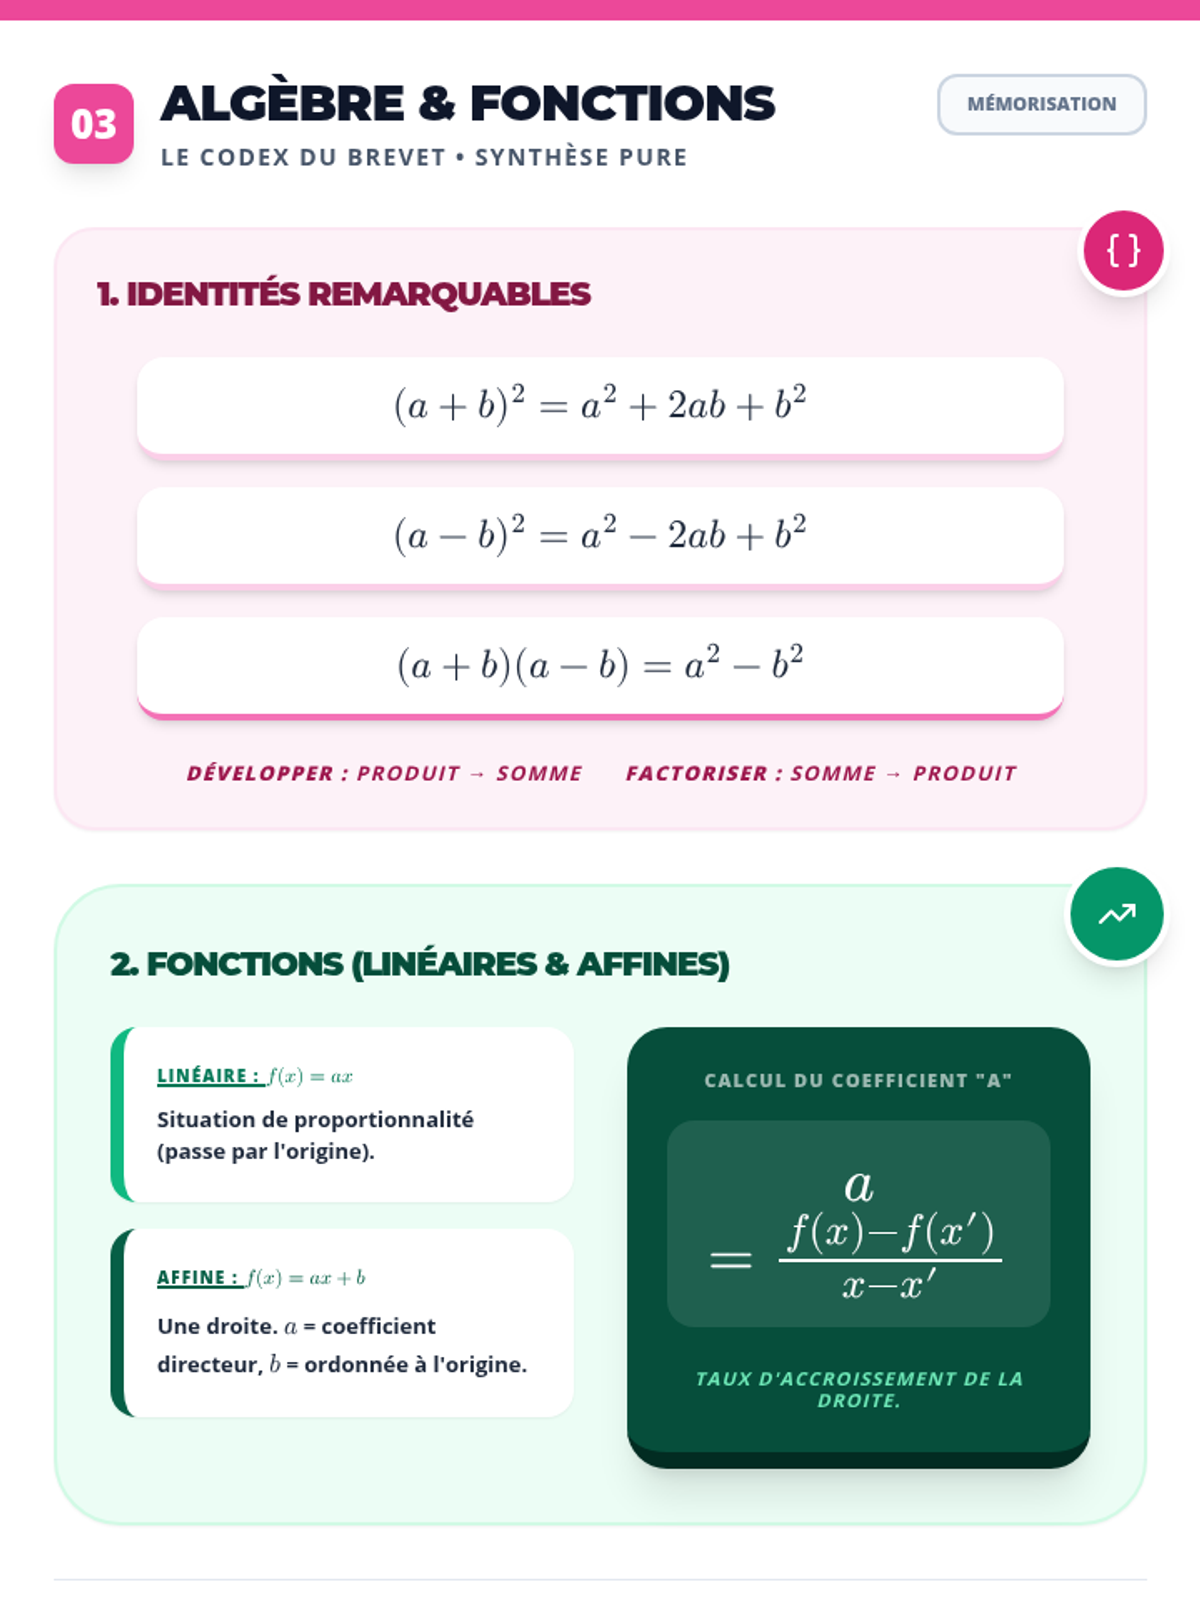
Une fiche de révision complète sur l'algèbre (identités, équations, systèmes) et les fonctions. Contient désormais une explication simplifiée des méthodes de substitution et de combinaison. Synthèse pure sans exercices sur 2 pages. Correction du débordement de page.
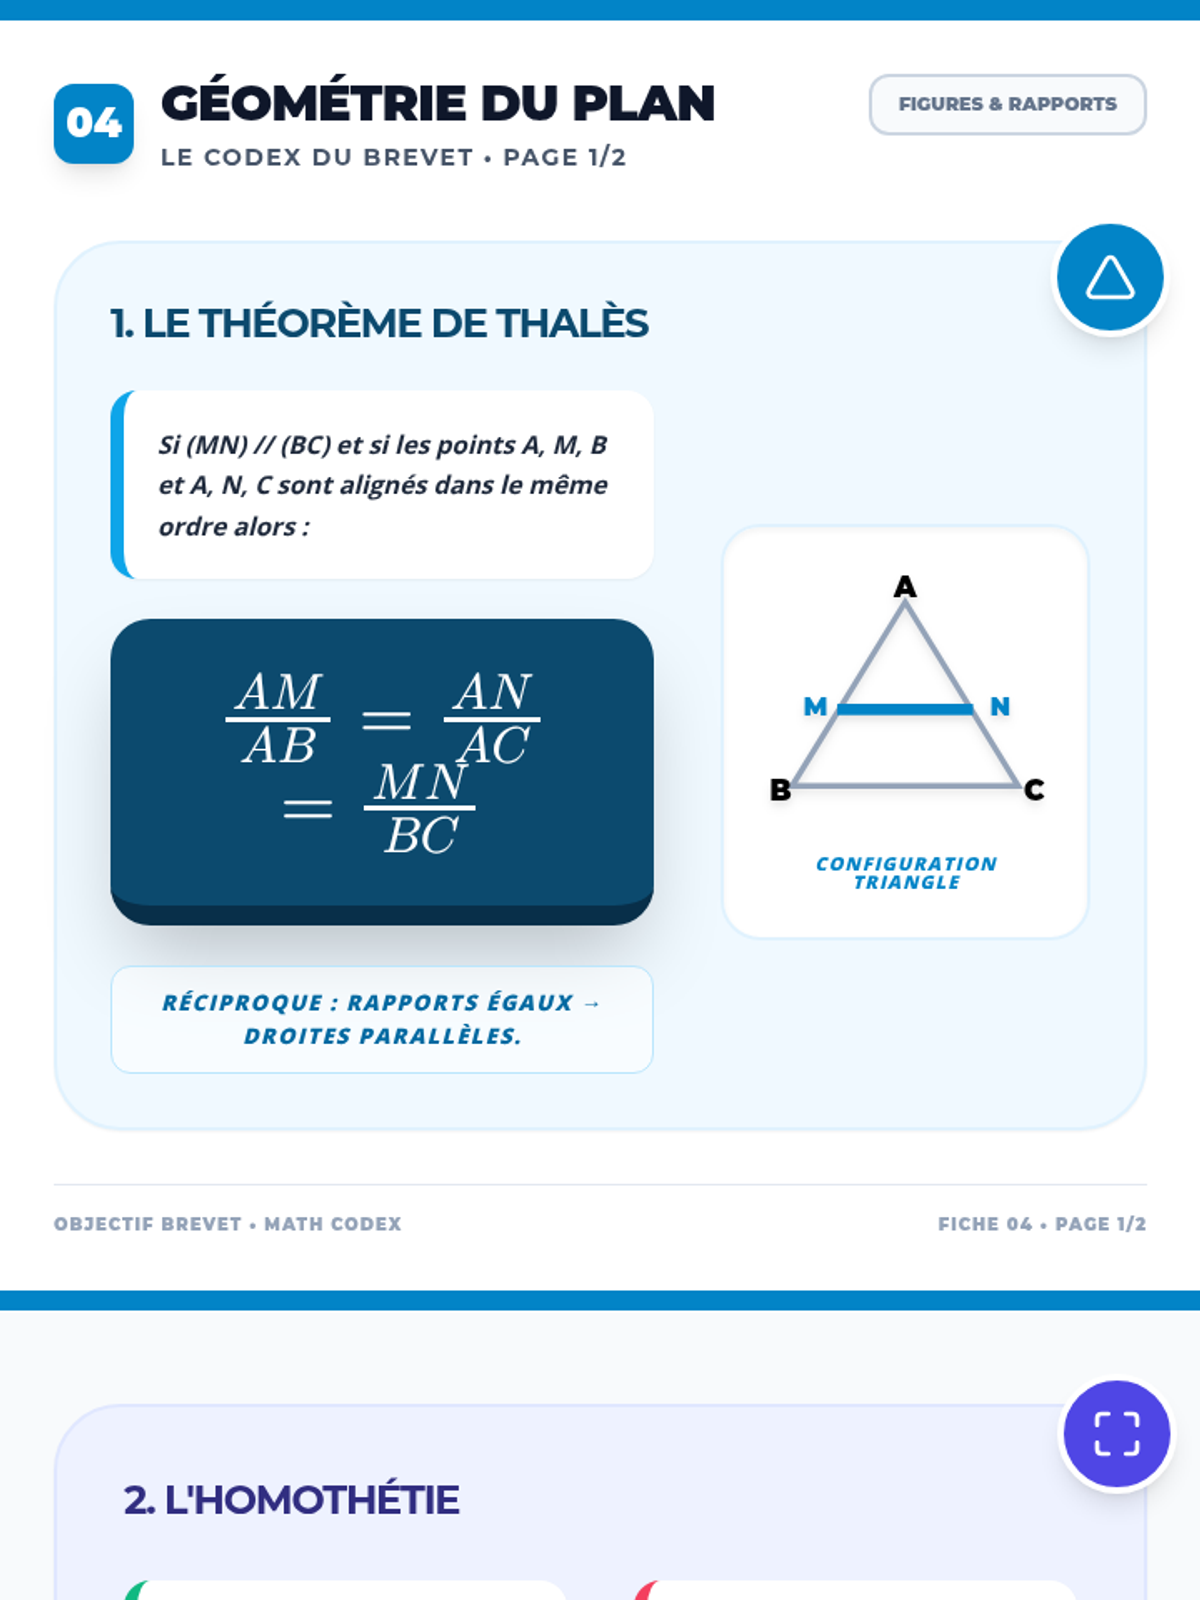
Une fiche de révision visuelle sur le théorème de Thalès, l'homothétie, les angles inscrits et les polygones réguliers pour les élèves de 3ème. Regroupe les concepts des photos 3, 5, 7 et 8. Synthèse pure sur 2 pages denses. Explique les lettres K, P, KL, KO, KS. Représentation du triangle avec les points B et C. Correction de la formule de l'homothétie et de la pagination.
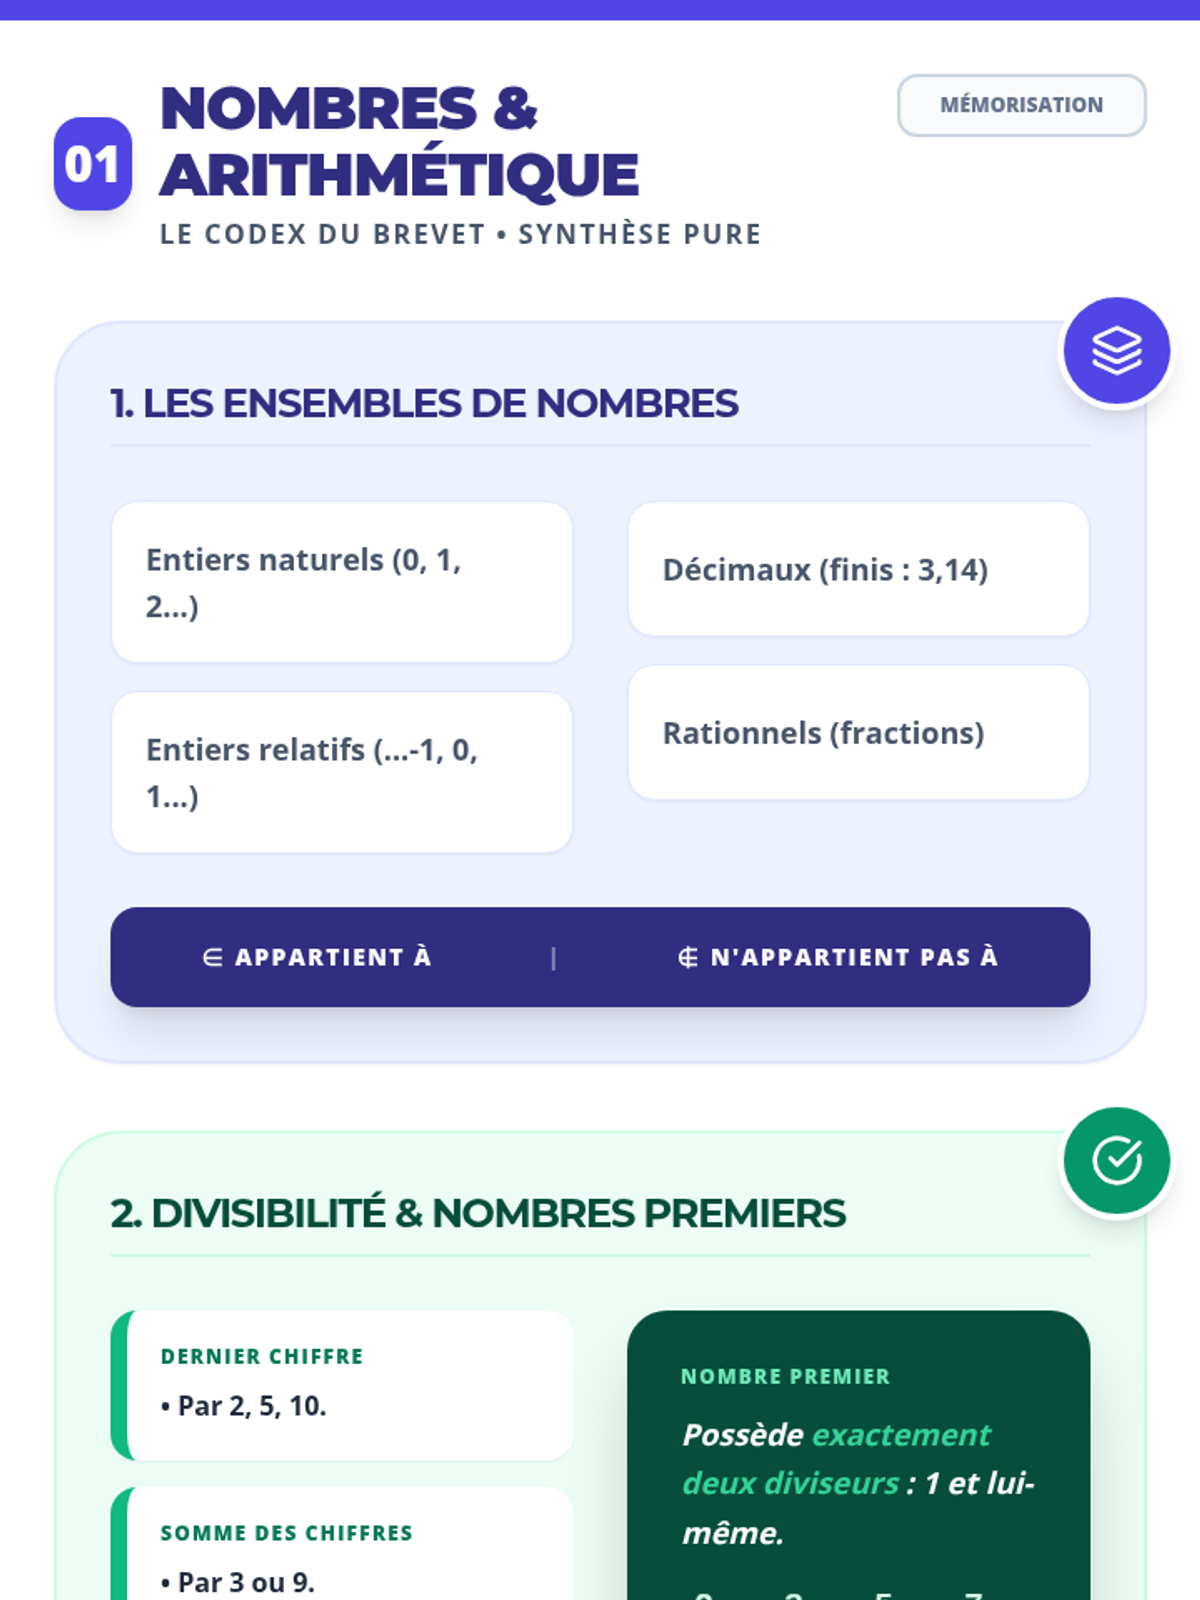
Fiche de révision 01 : Nombres et Arithmétique. Détaille l'algorithme d'Euclide et la méthode des différences pour le PGCD. Couvre les ensembles, la divisibilité et l'algorithmique. Synthèse pure. Correction des rendus de symboles et de la pagination.
Un diaporama ultra-complet et dynamique couvrant l'intégralité des 11 synthèses du programme de 3ème. La diapositive de conclusion inclut désormais la citation de Christian D. Larson. Fixation des affichages mathématiques et des espacements.
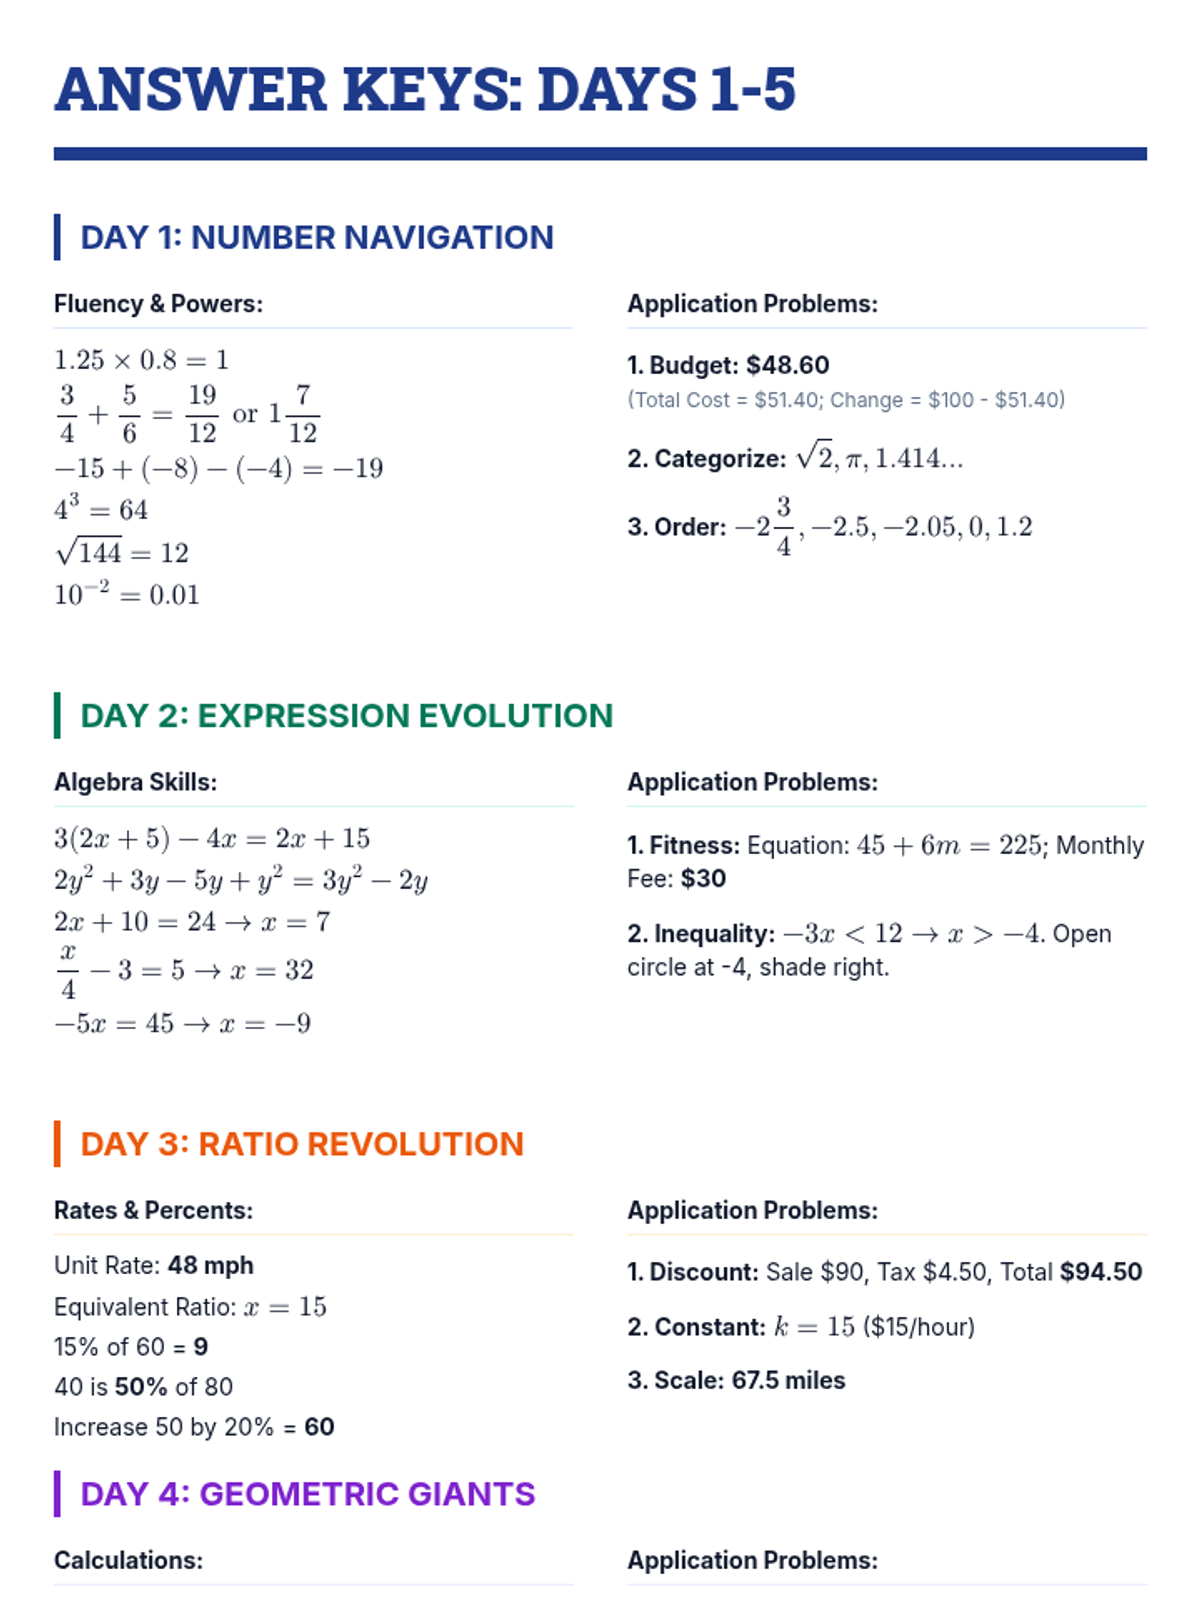
Full answer keys for the 5-day math morning work packet. Revised to fix math rendering, missing answers, and page flow.
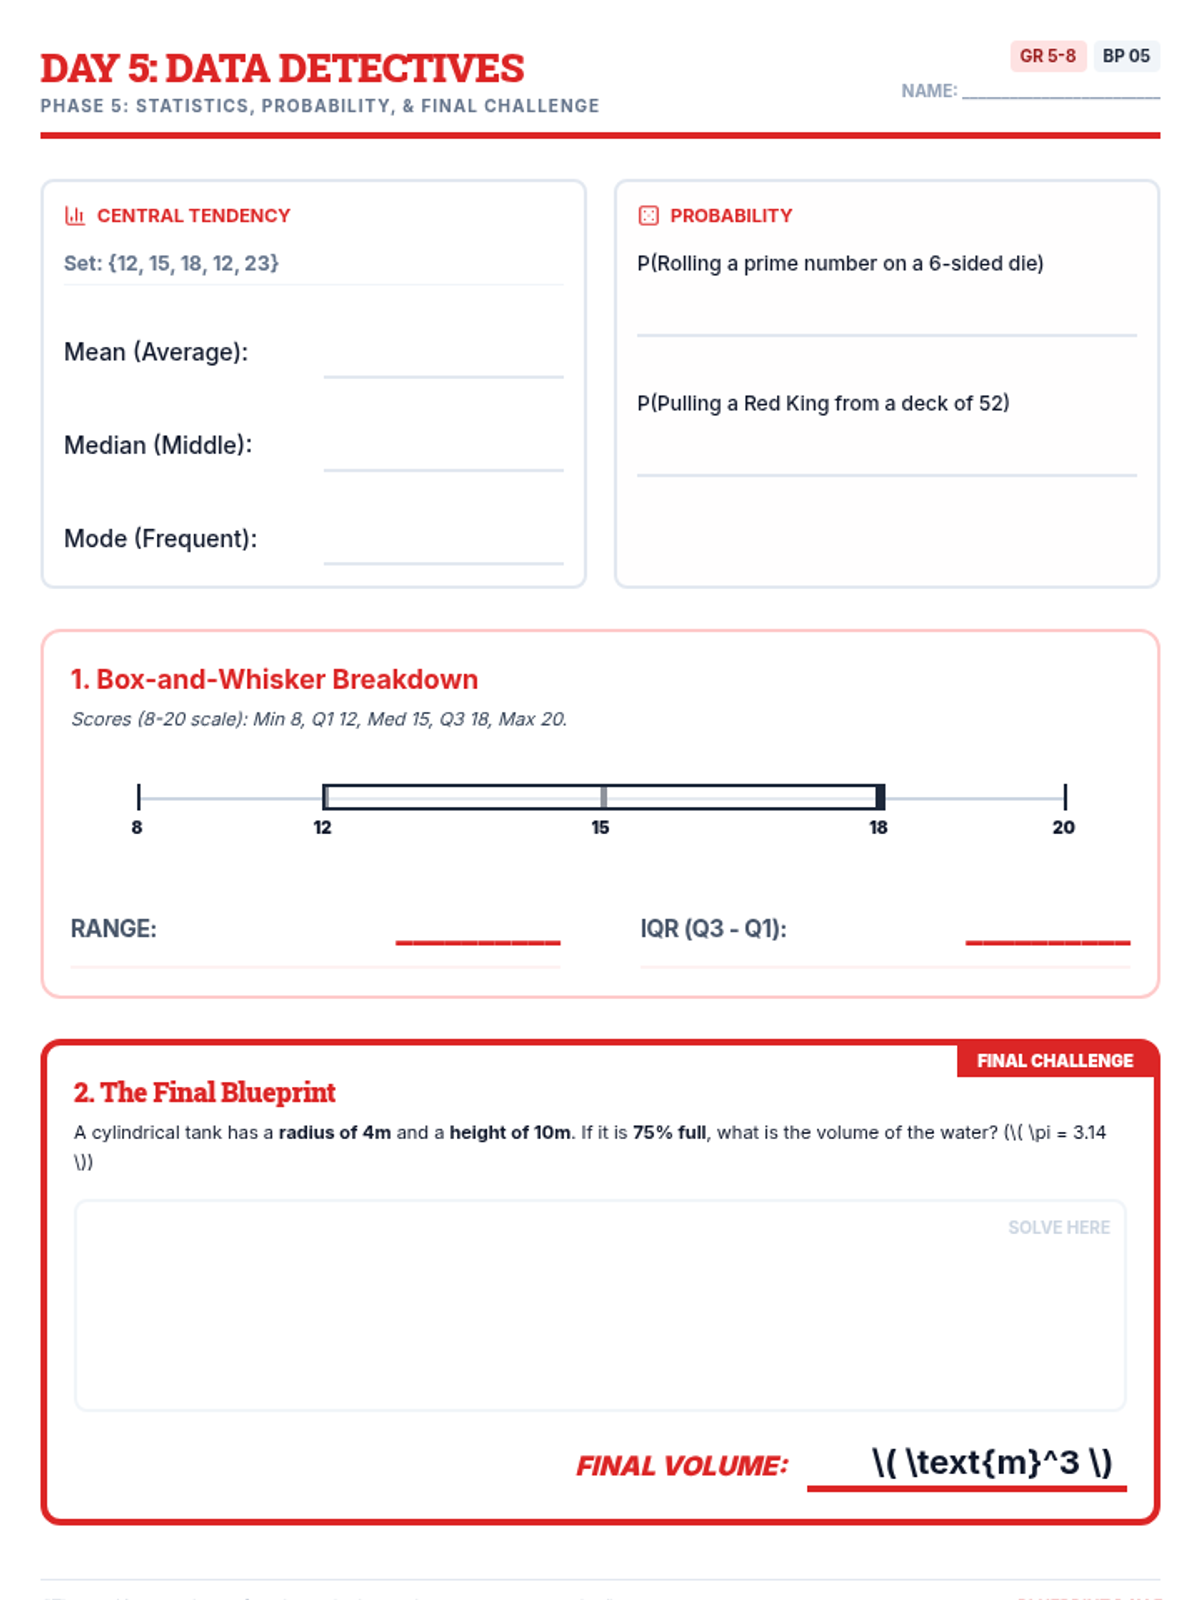
Day 5 Morning Work worksheet focusing on statistics and probability. Revised to fix math rendering, improve page breaks, and enlarge student work areas.
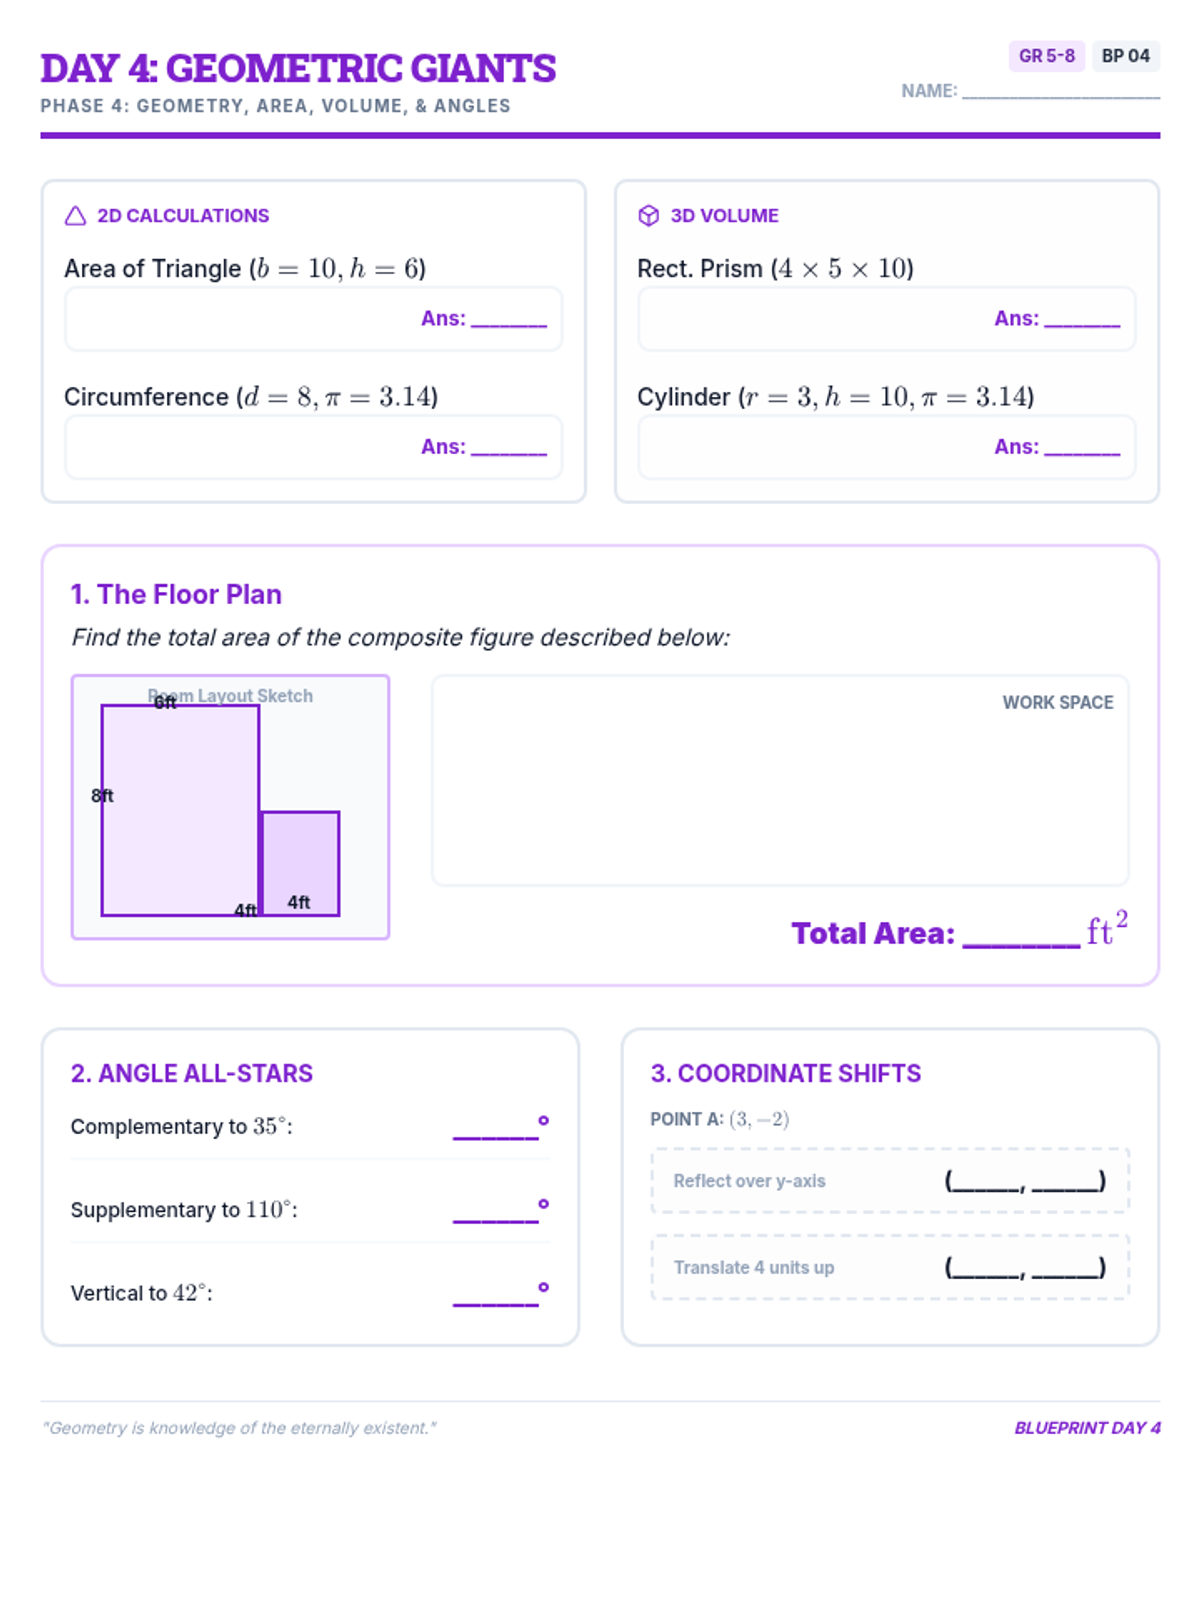
Day 4 Morning Work worksheet focusing on geometry. Revised to fix math symbol rendering, improve work space, and add a specific L-shaped room sketch.
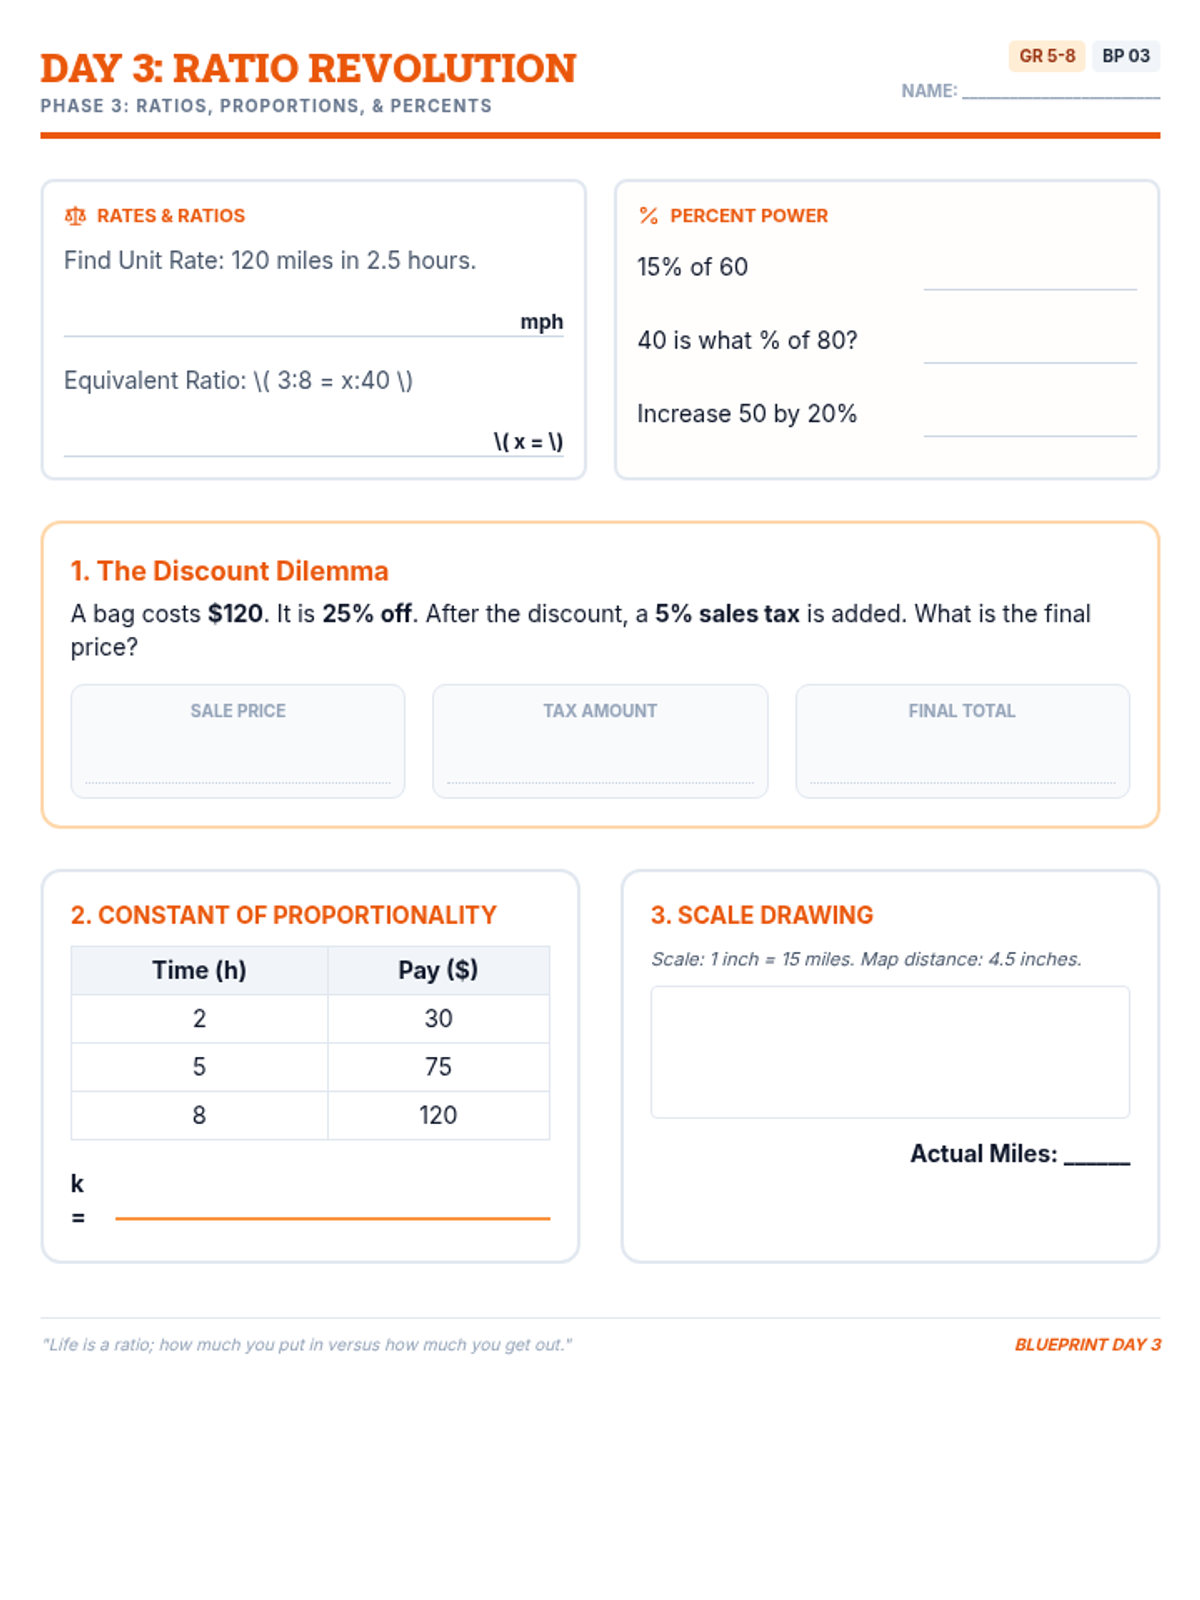
Day 3 Morning Work worksheet focusing on ratios and proportions. Revised to improve layout, fix page breaks, and ensure white backgrounds for student work.
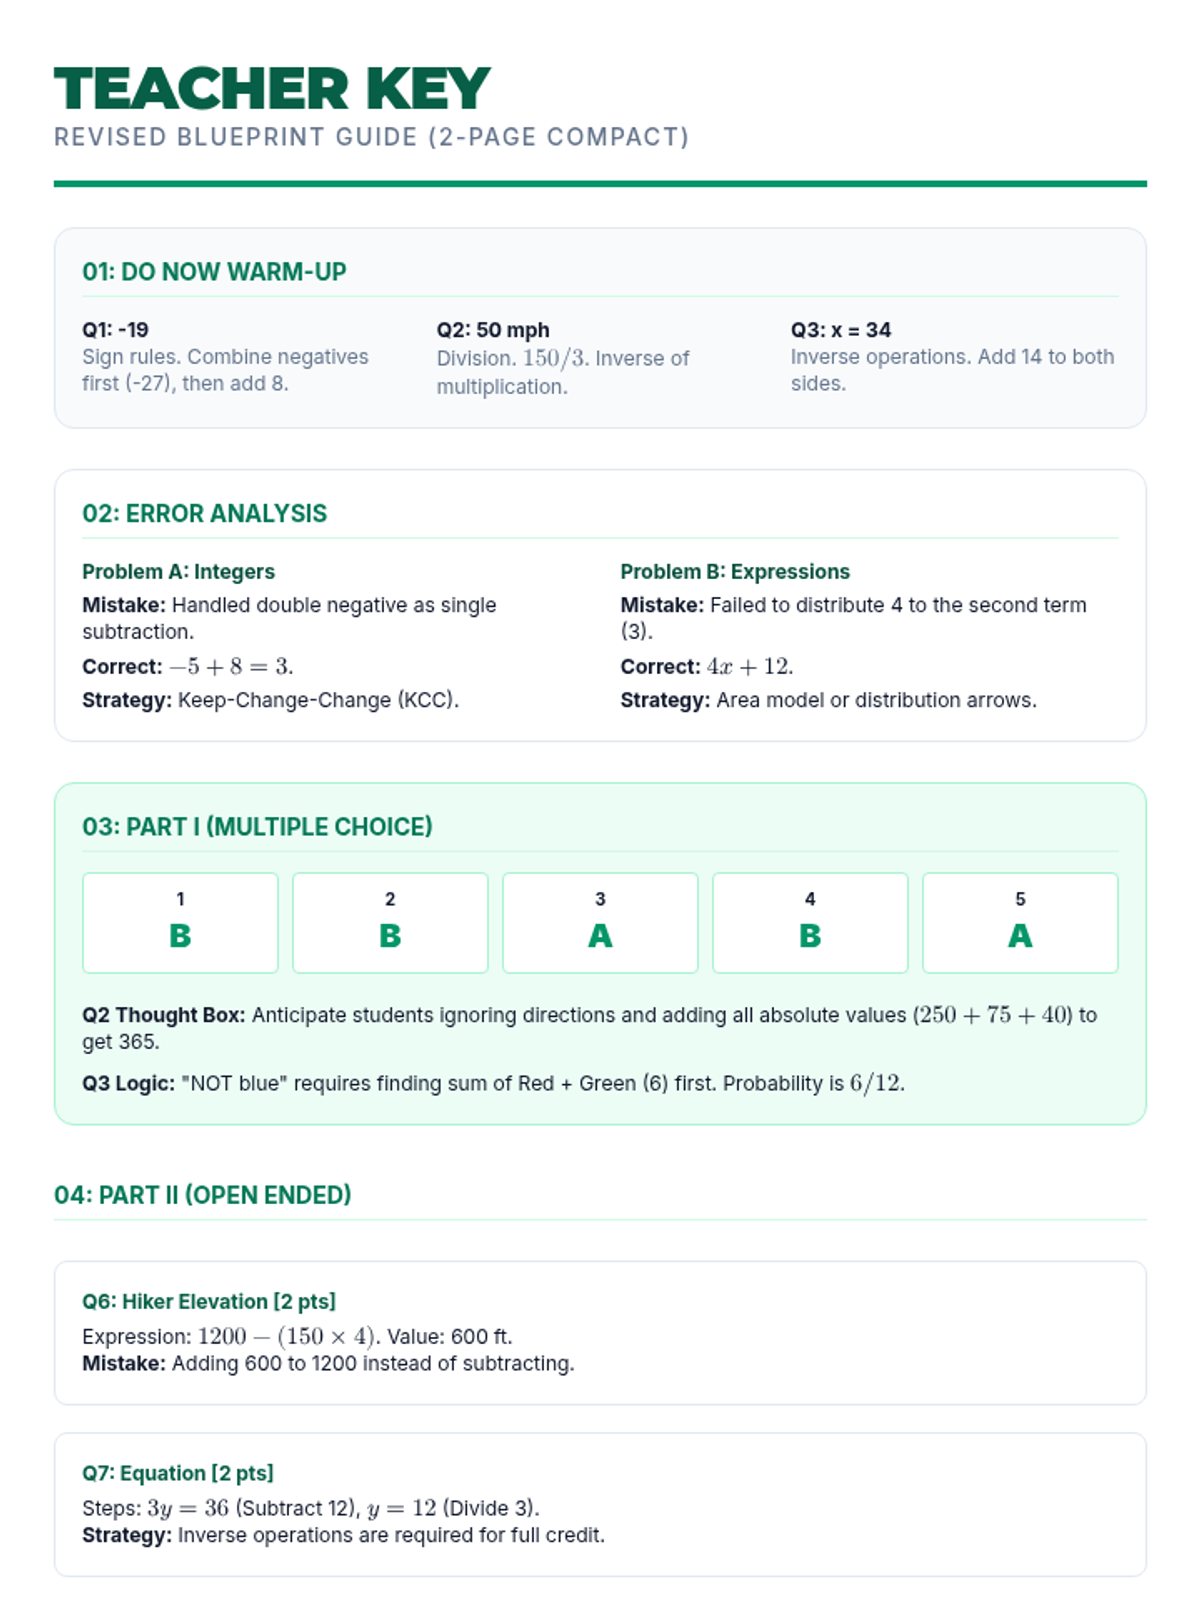
Revised teacher key for the 7th-grade math review, featuring strategy explanations, mistake anticipation guides, and student-friendly rationales for the modified packet. Condendsed to 1 page.
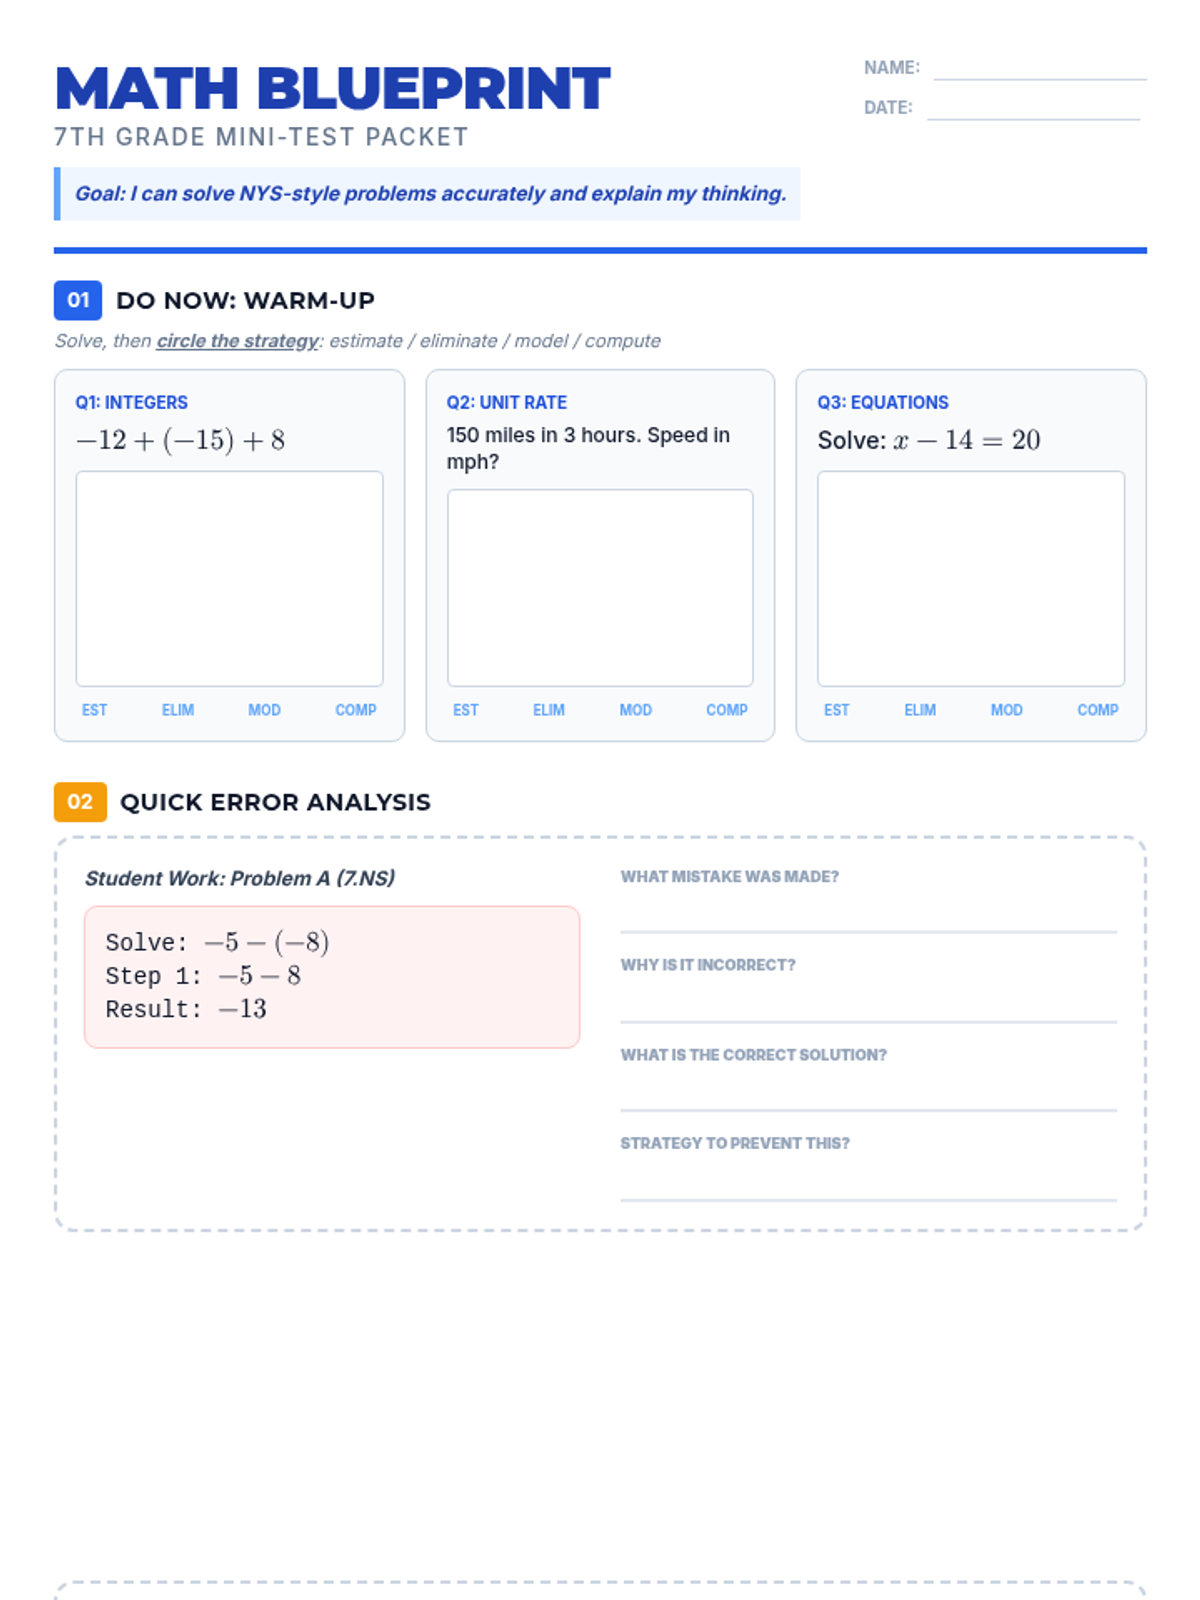
Revised 7th-grade math review packet with enhanced thinking prompts, strategy checks, and detailed error analysis to build test-taking proficiency for NYS standards. Compact 5-page layout.
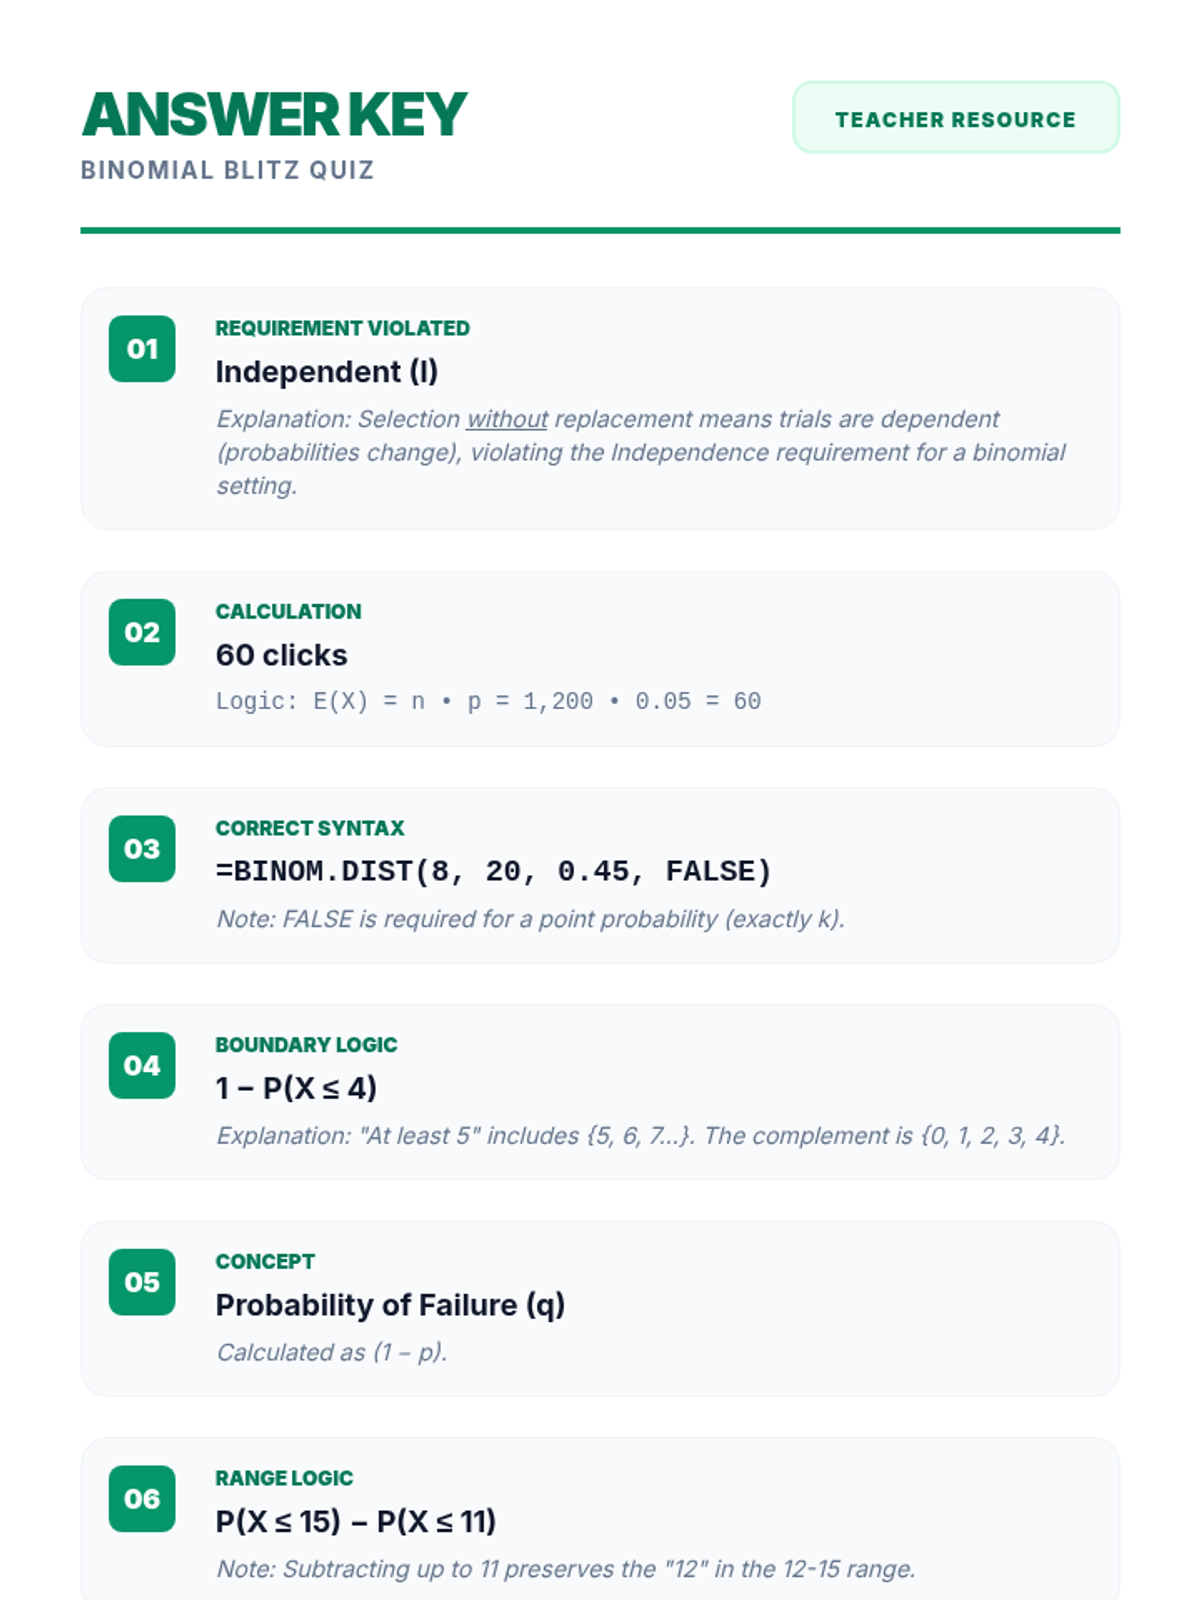
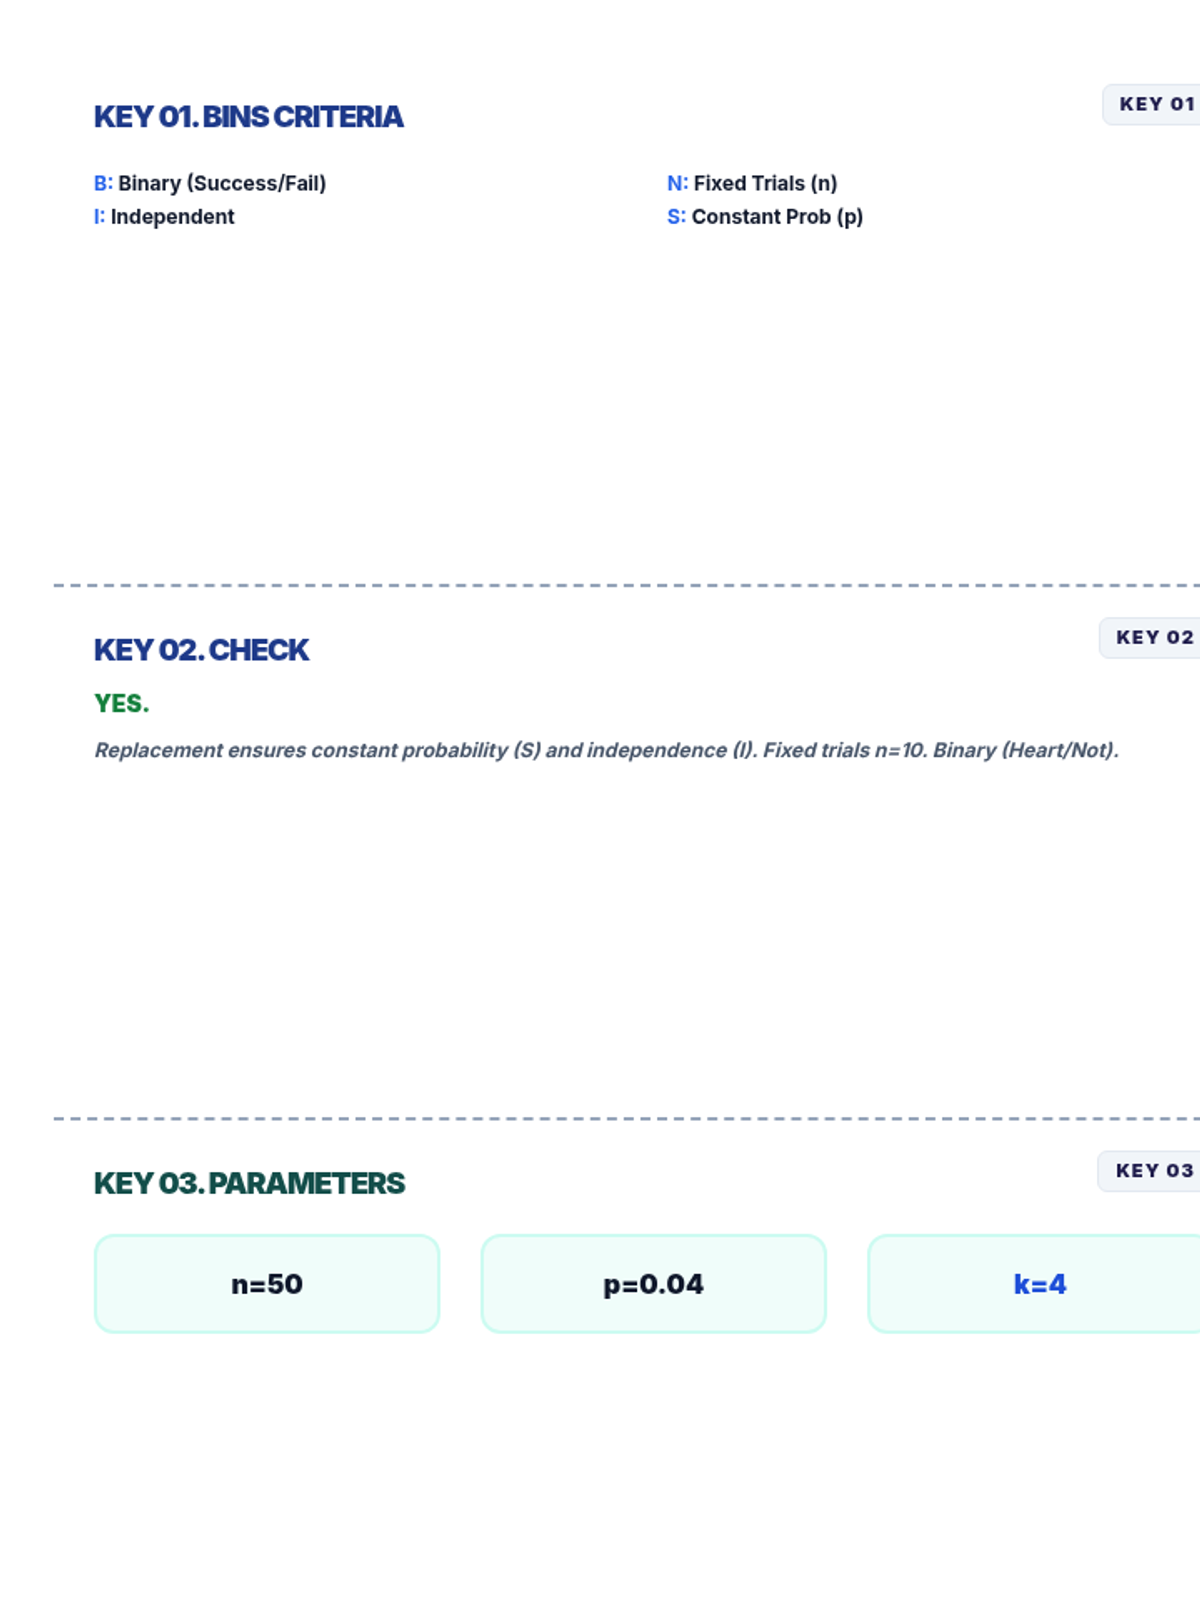
A comprehensive answer key for the Binomial Blitz Quiz, featuring detailed explanations, manual formula rendering, and logic breakthroughs for the assessment questions.
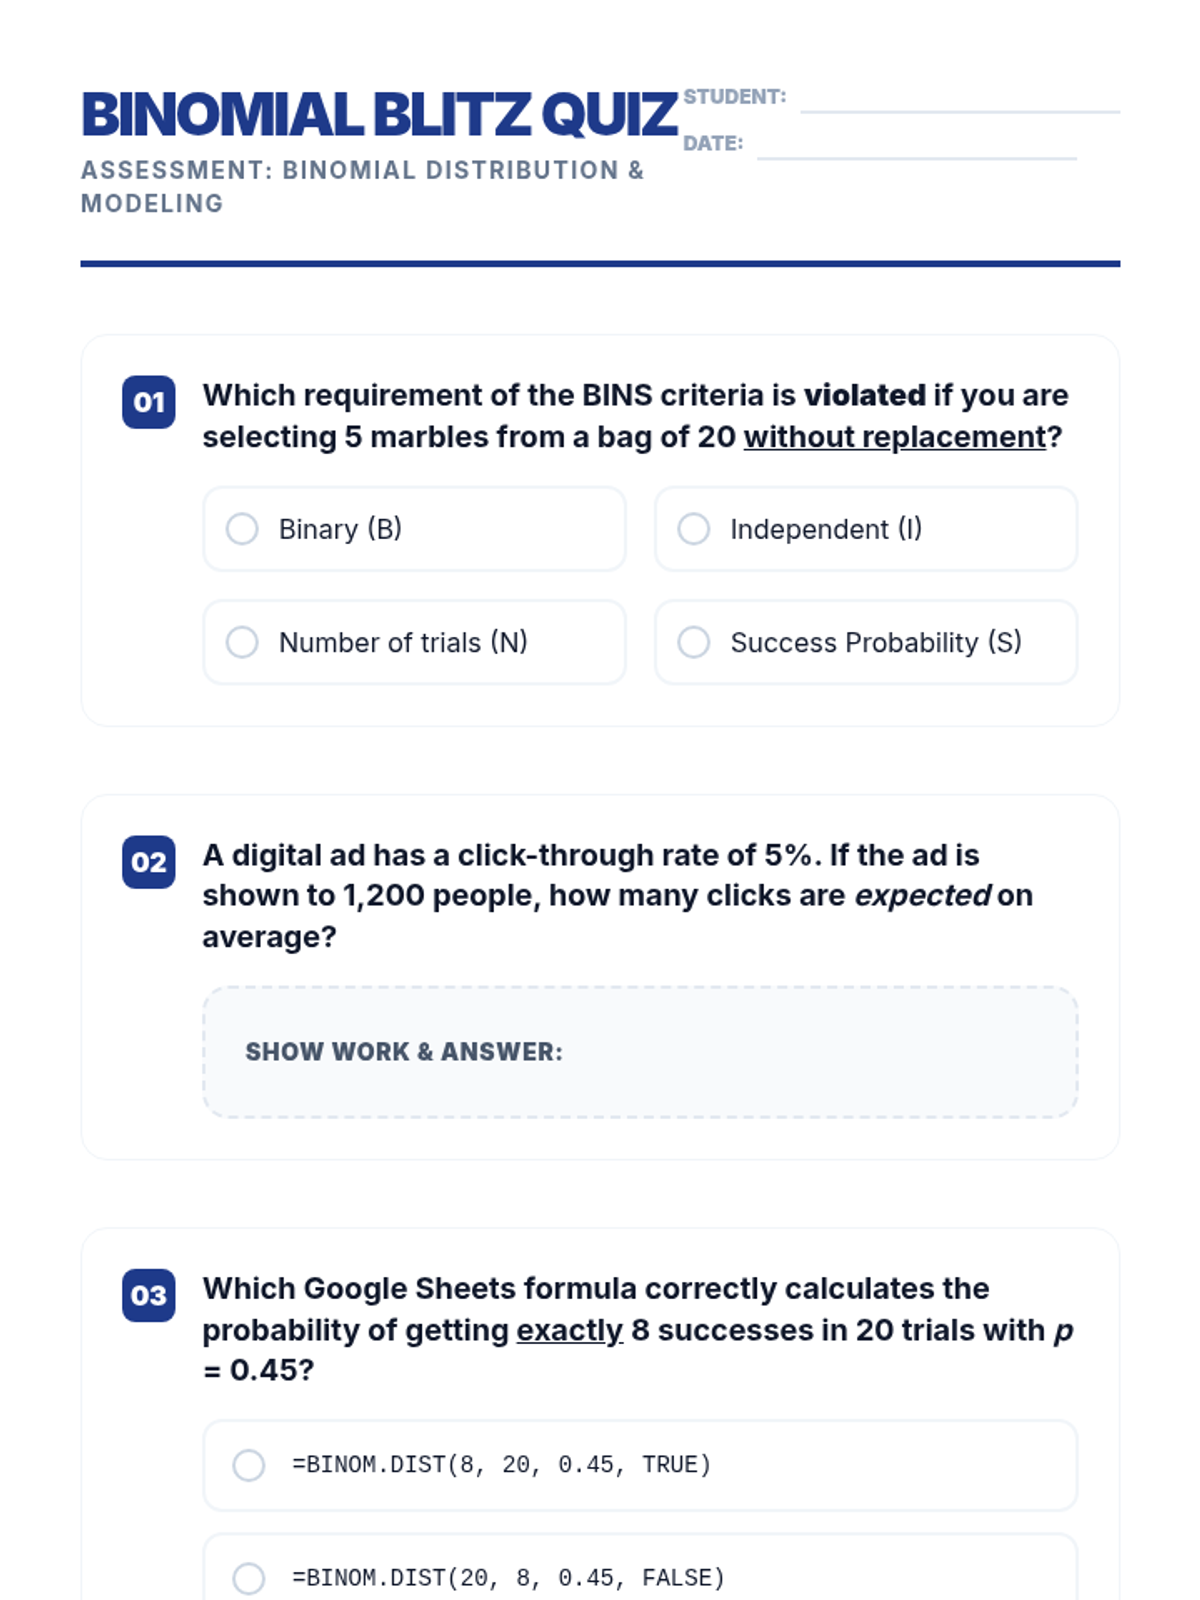
A 10-question assessment covering the BINS criteria, binomial parameters, spreadsheet formula syntax, hand-calculation theory, and expected value. Designed for 12th-grade statistics with high-quality visual formatting and clear student work areas. Updated with fixed math rendering and page break protections.
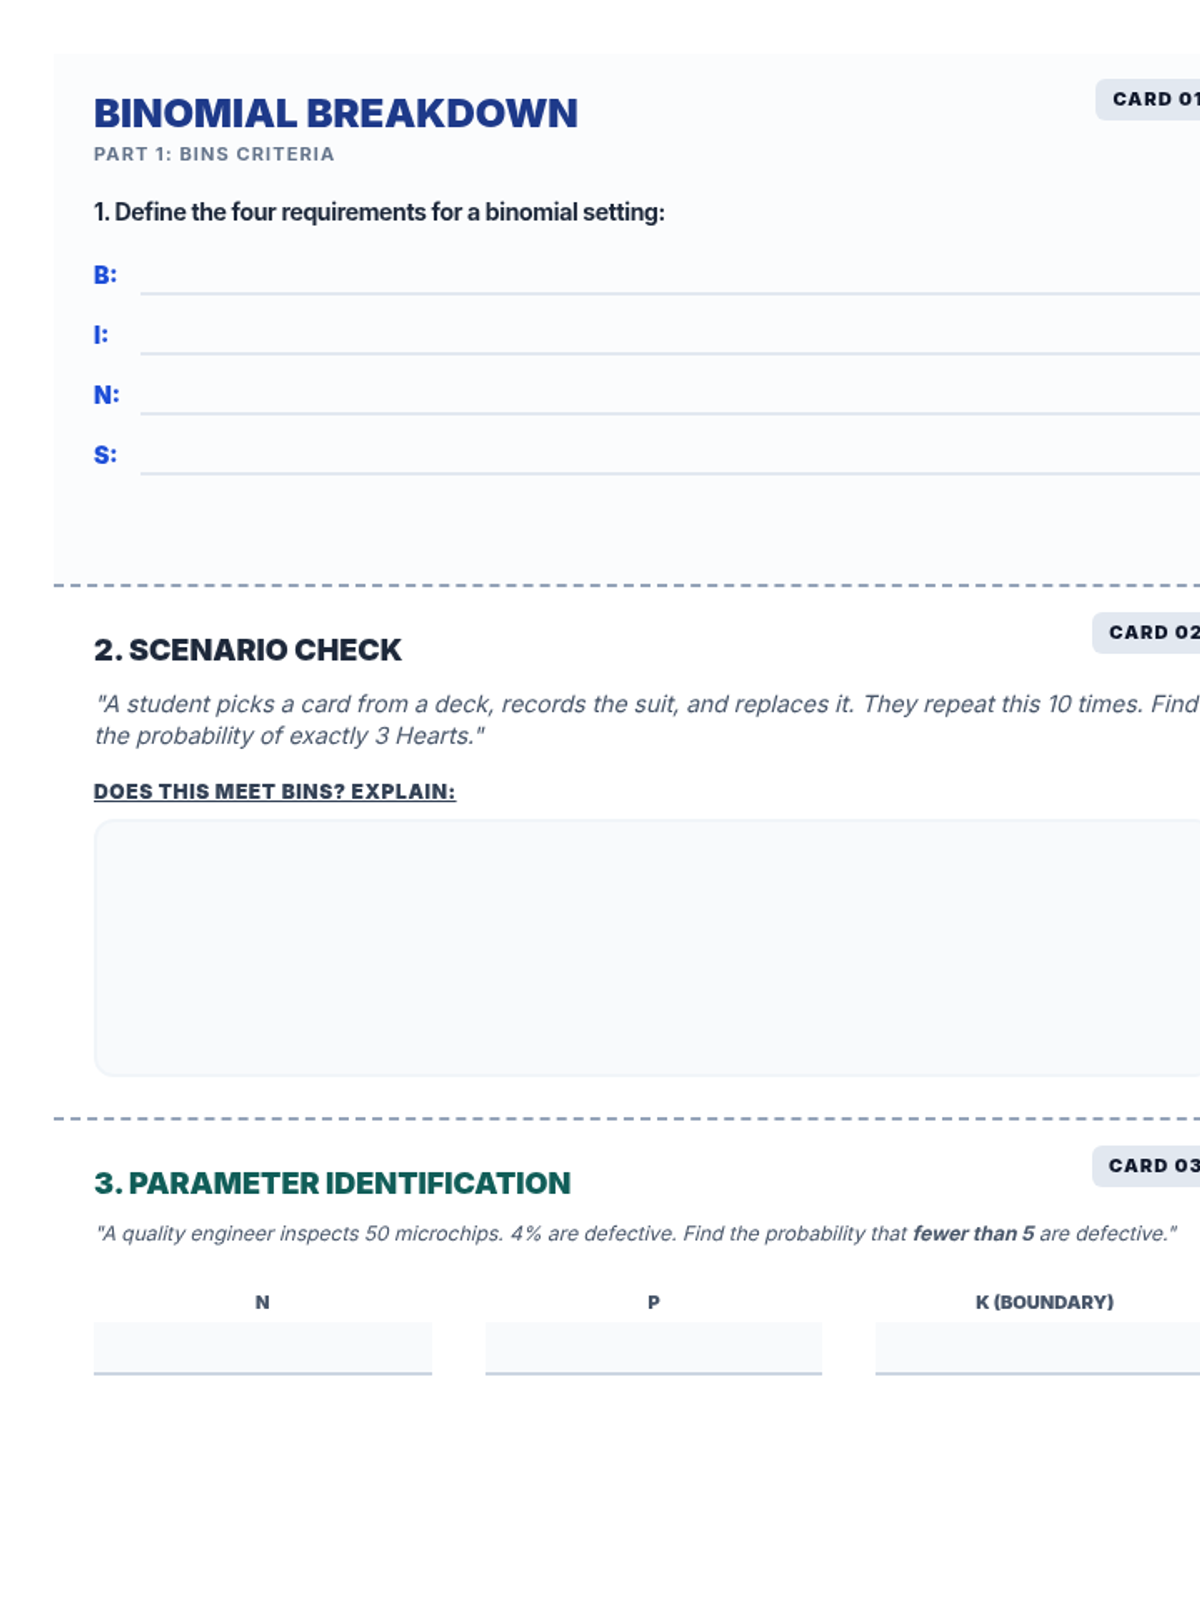
A set of 10 printable task cards featuring diverse binomial distribution scenarios. Perfect for station activities, group work, or extra practice bank. Includes integrated answer key. Now updated to include Expected Value (E[X]) calculations for every case.
A comprehensive answer key for the task-card edition of the Binomial Breakdown Worksheet, reformatted into individual 1/3-page cards to facilitate separate distribution or physical cutting. Each card provides detailed logic, modern BINOM.DIST syntax, and correctly rendered manual formulas. Updated for density and usability.
A 21-question practice worksheet for 12th-grade statistics, reformatted as a modular task-card bank. Designed with three horizontal cut-lines per page for easy physical division. Covers BINS criteria, spreadsheet formulas (BINOM.DIST), hand-calculation theory, and now includes questions on Expected Value (n*p). Card IDs and questions are aligned 1:1.
A visual presentation accompanying the Binomial Breakdown lesson. Covers BINS criteria, expected value (mean), spreadsheet formula syntax (BINOM.DIST), and the hand-calculation formula connection. Updated with a new slide for expected value (n*p) and improved summary visuals.
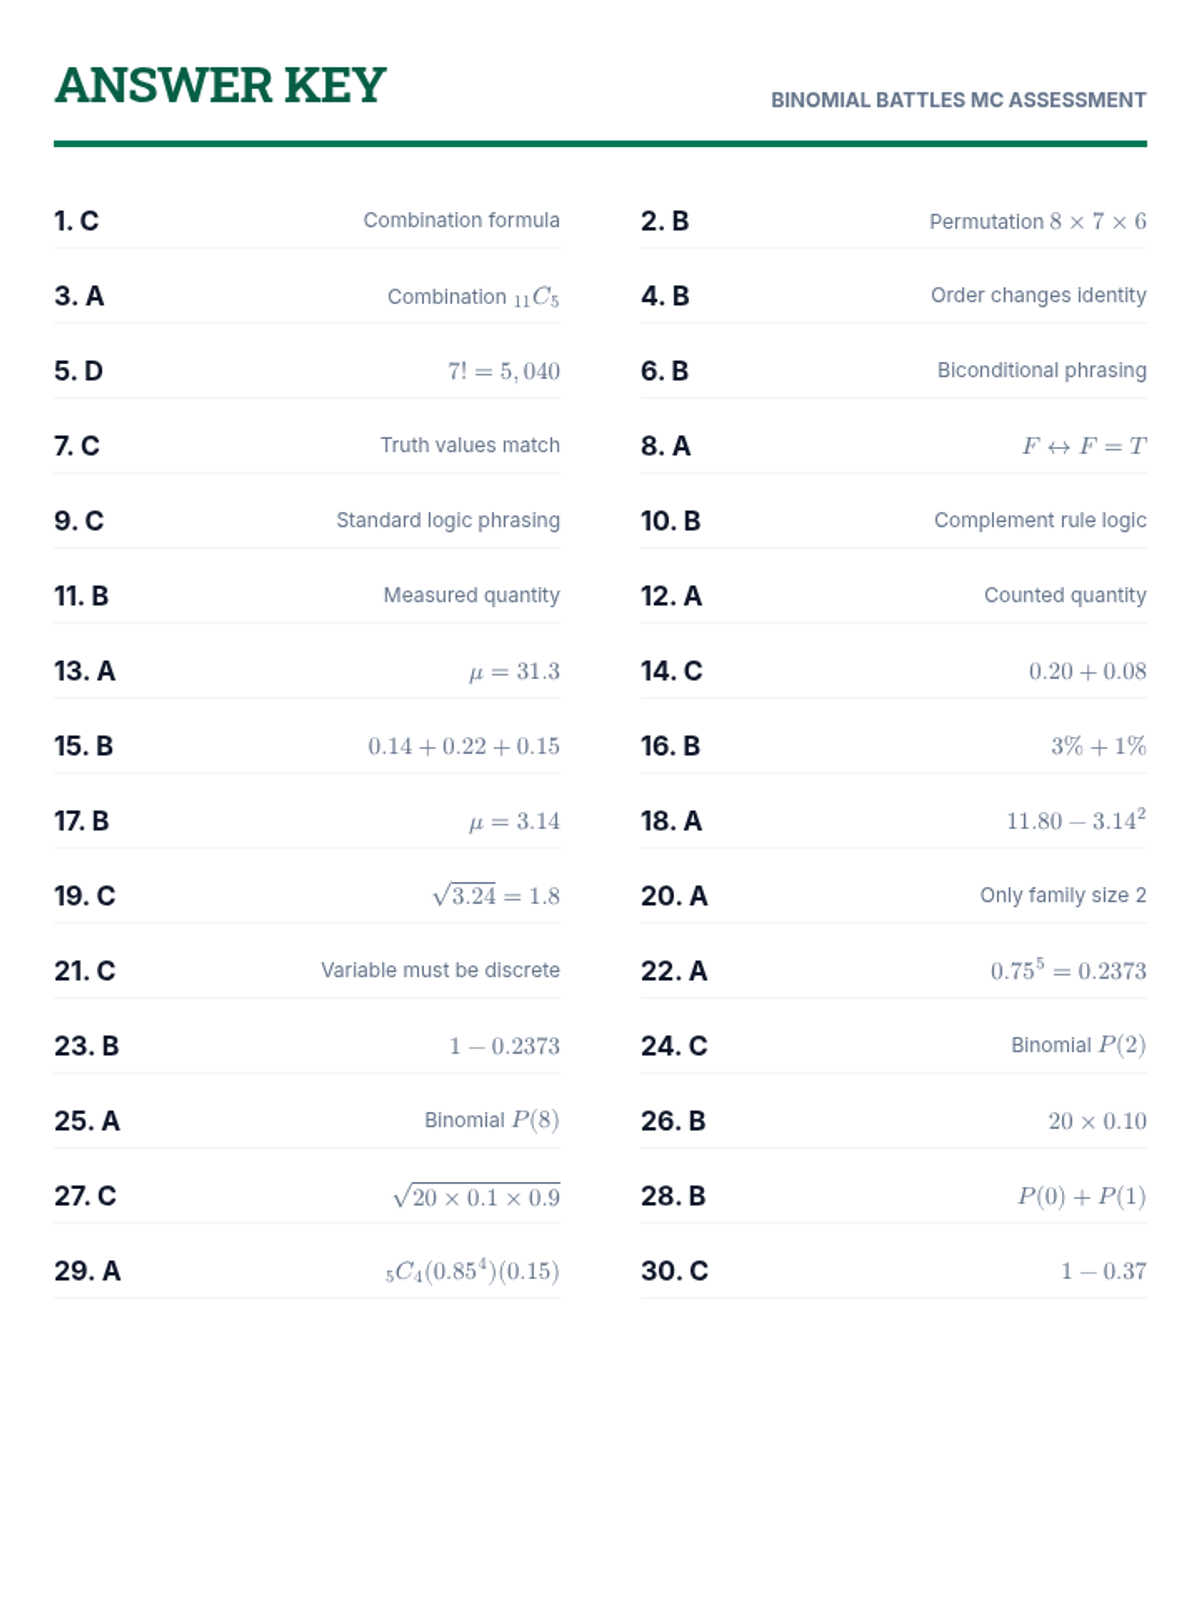
Answer key for the multiple-choice assessment, providing correct letters and brief conceptual justifications for all 30 questions.
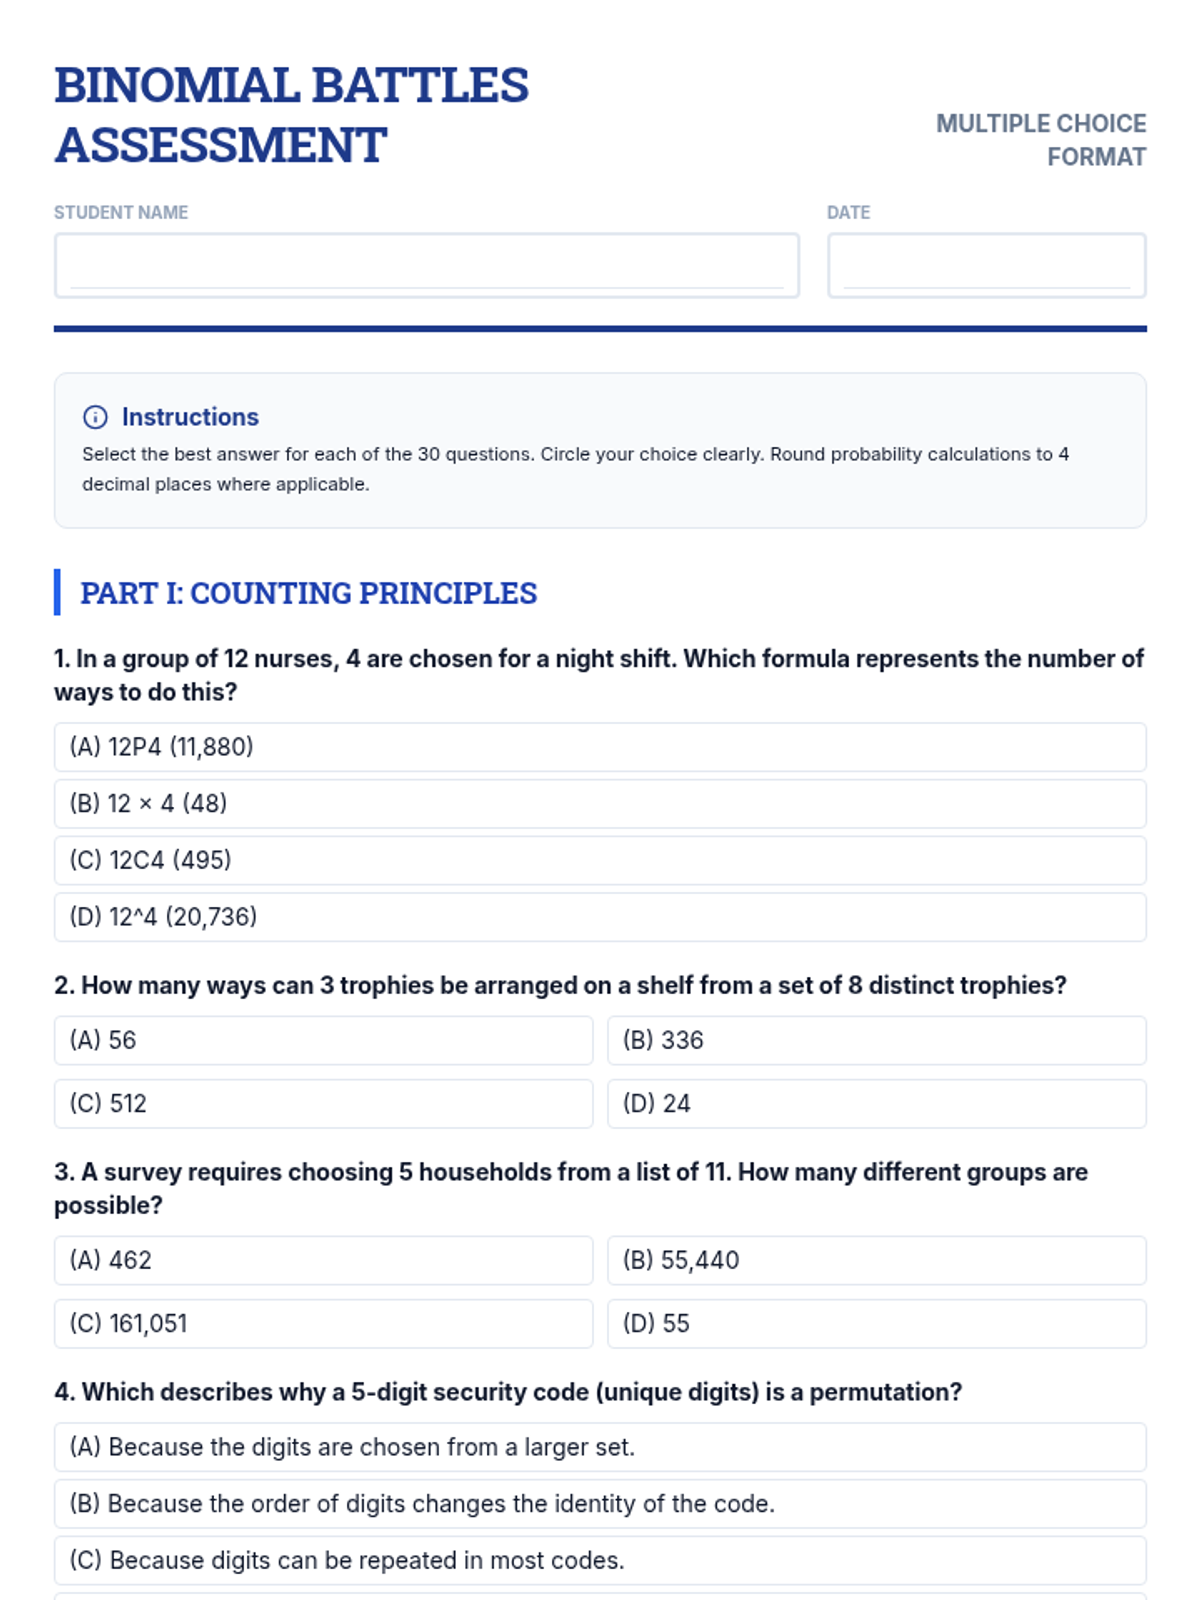
A 30-question multiple-choice assessment covering counting principles, biconditional logic, and probability distributions. Uses standard symbols for maximum compatibility across print and digital views.
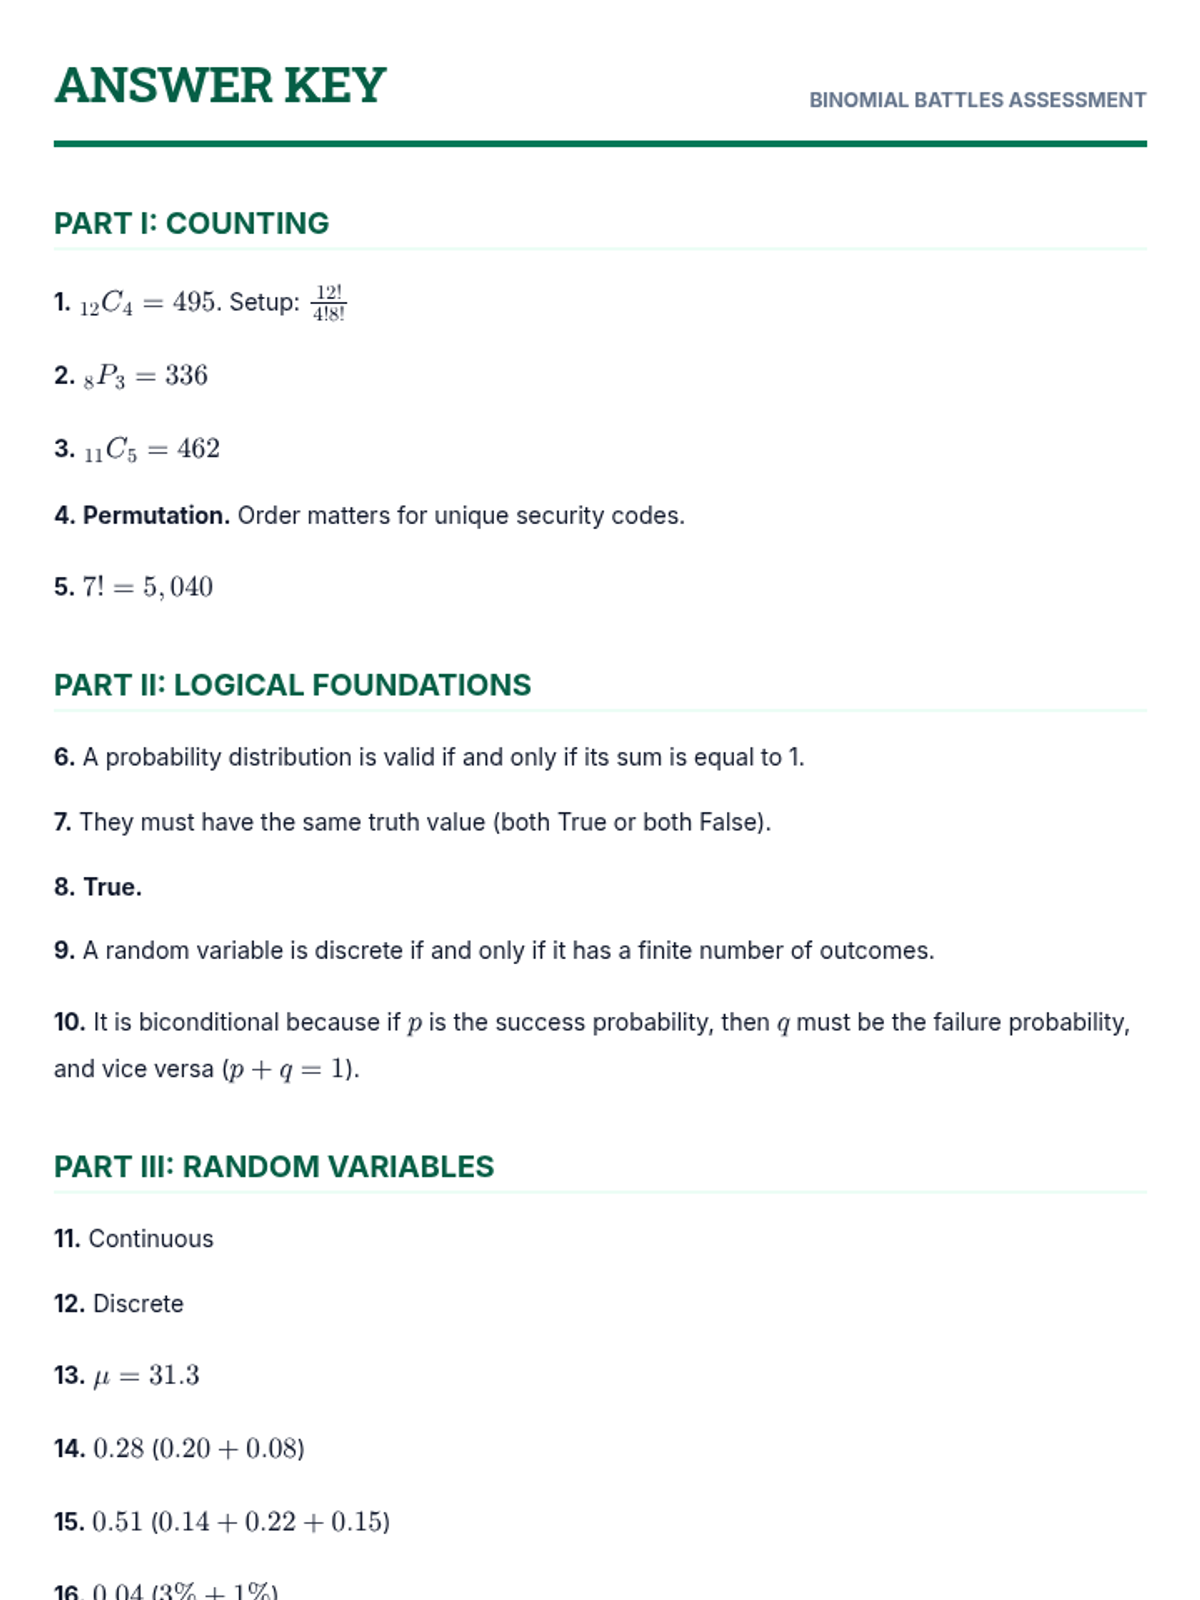
Teacher answer key for the comprehensive assessment. Includes formula setups, step-by-step calculations, and logical reasoning for all 30 questions.
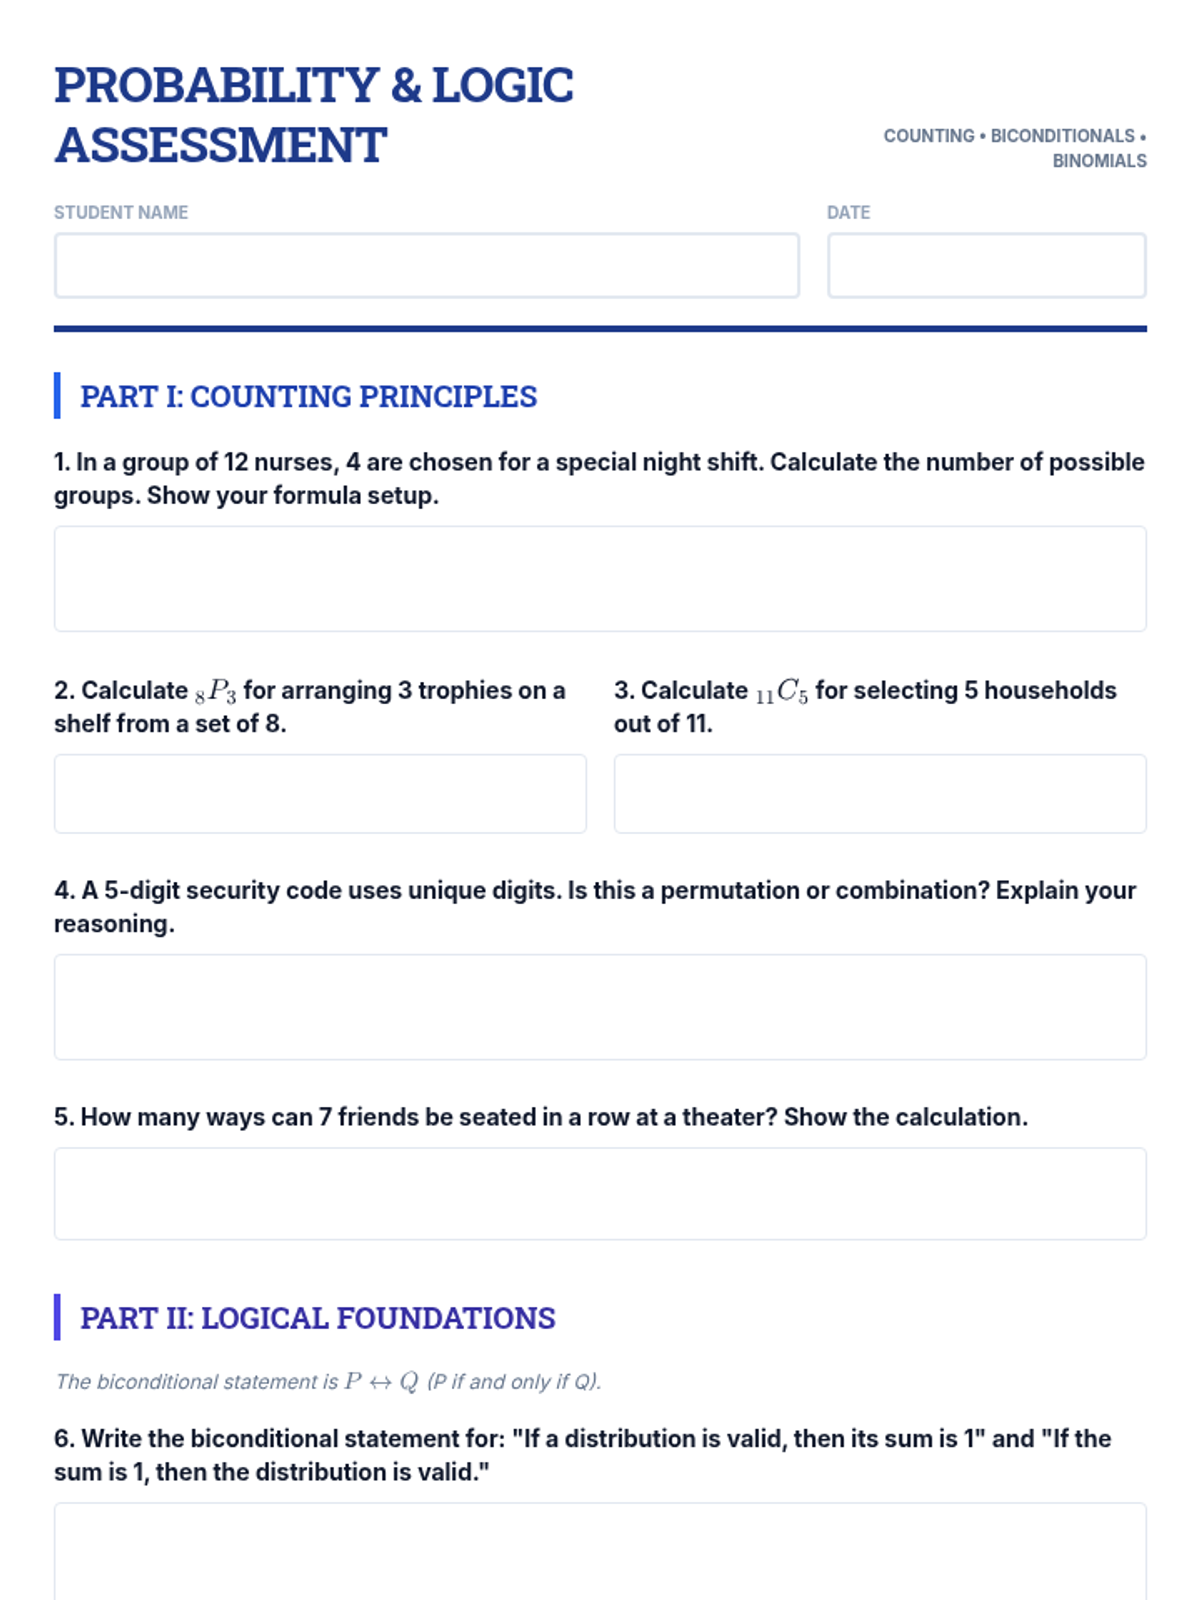
A polished 30-question assessment covering permutations, combinations, biconditional logic, and binomial distributions. Features generous work areas and real-world data scenarios.
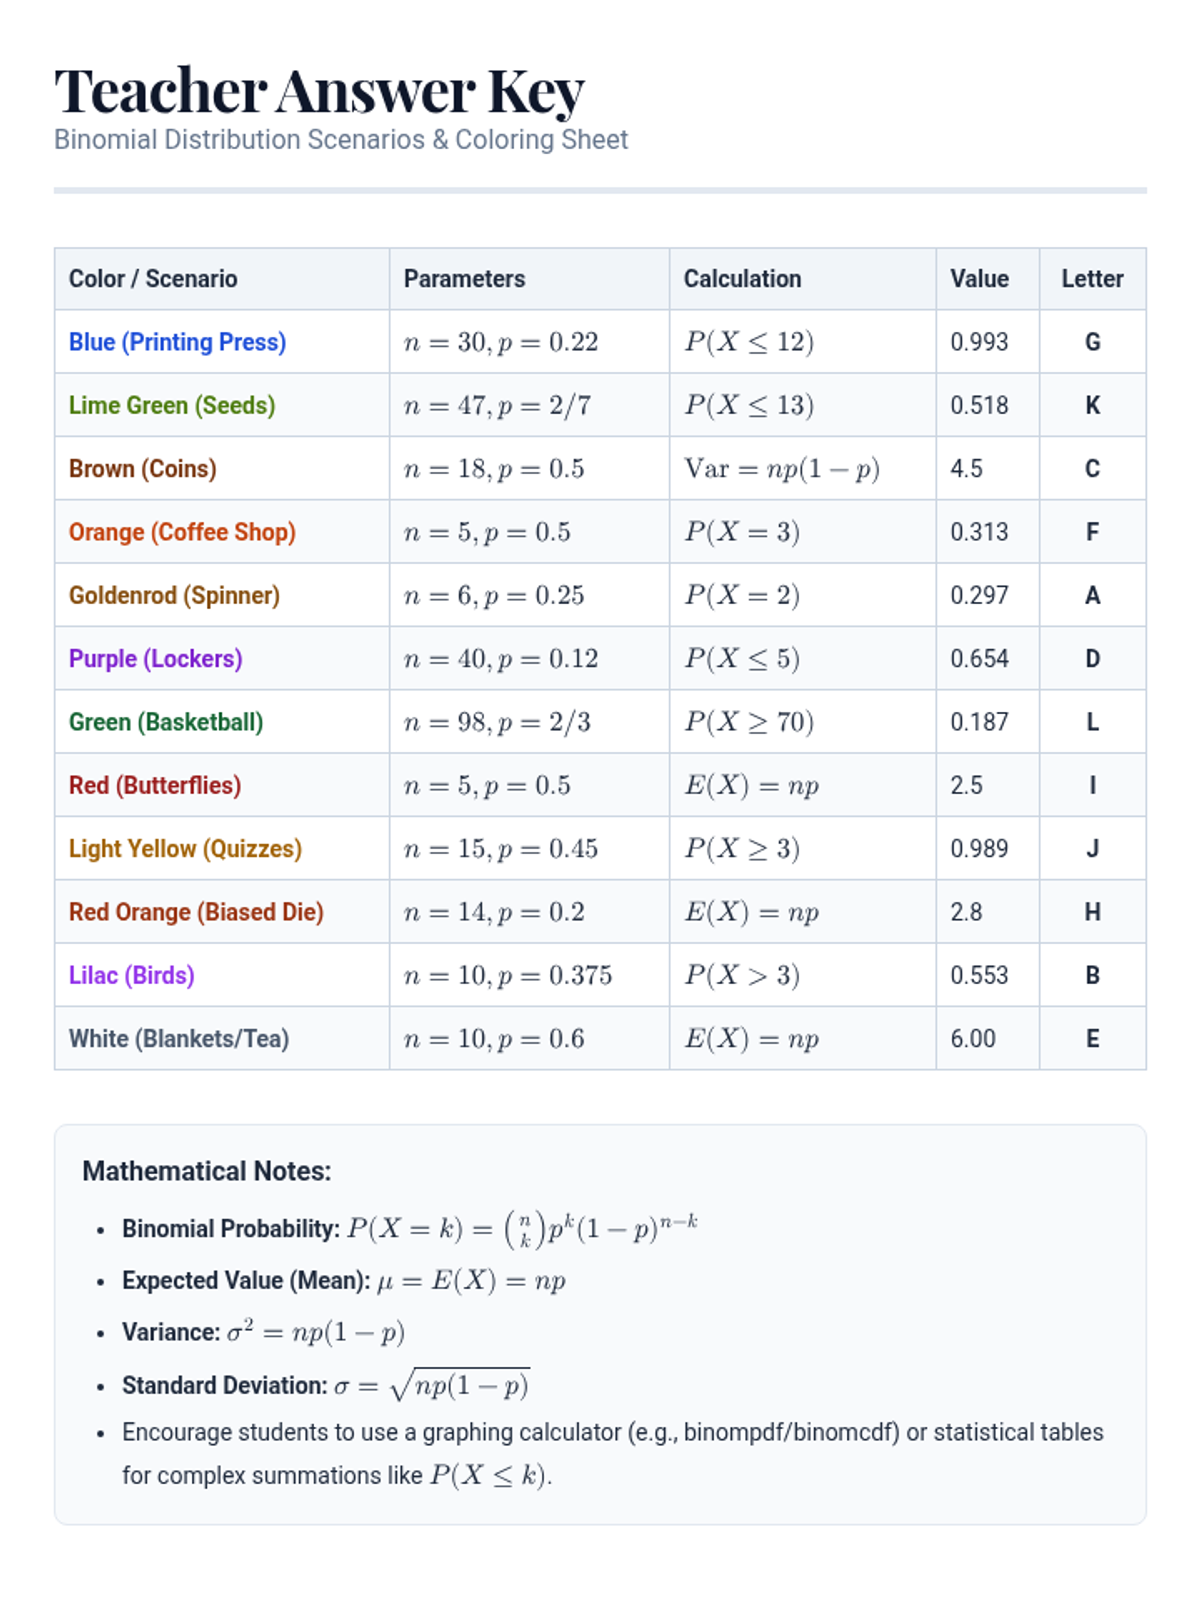
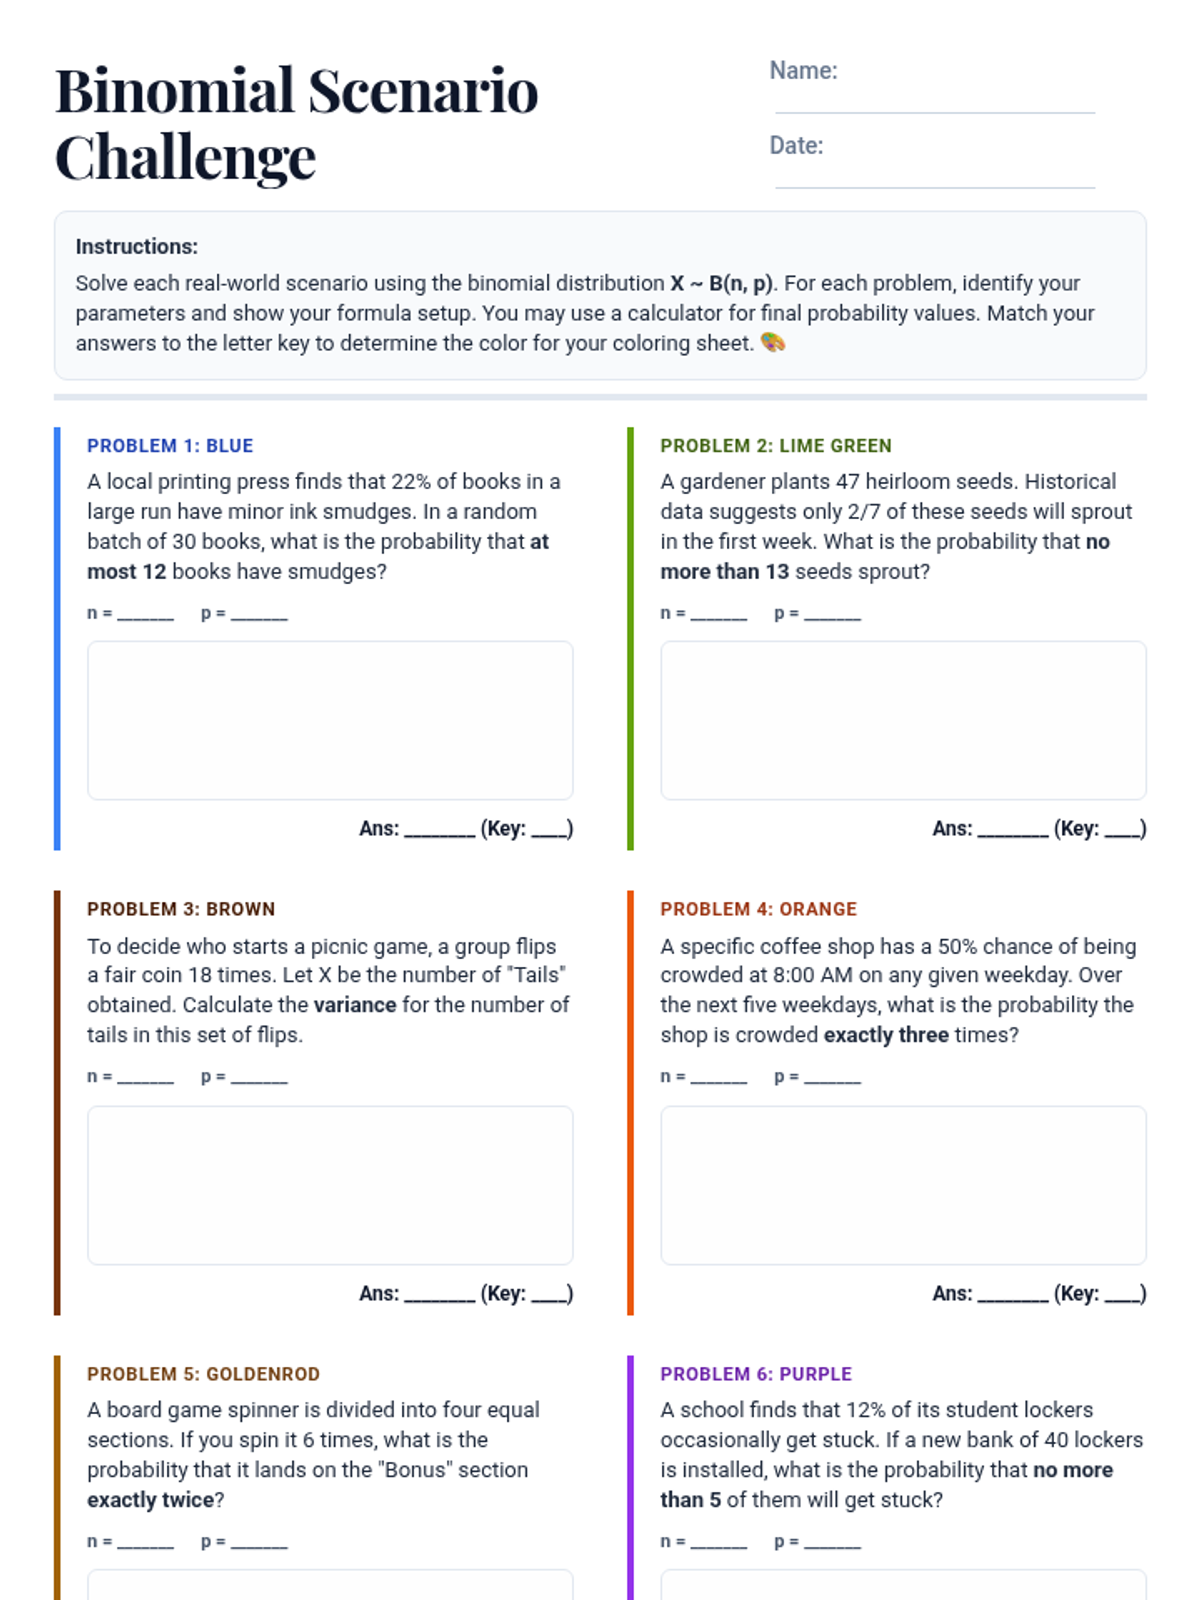
A complete answer key for the Binomial Scenarios worksheet, featuring parameter identification, calculation steps, final numerical values, and the corresponding letter for the coloring page.
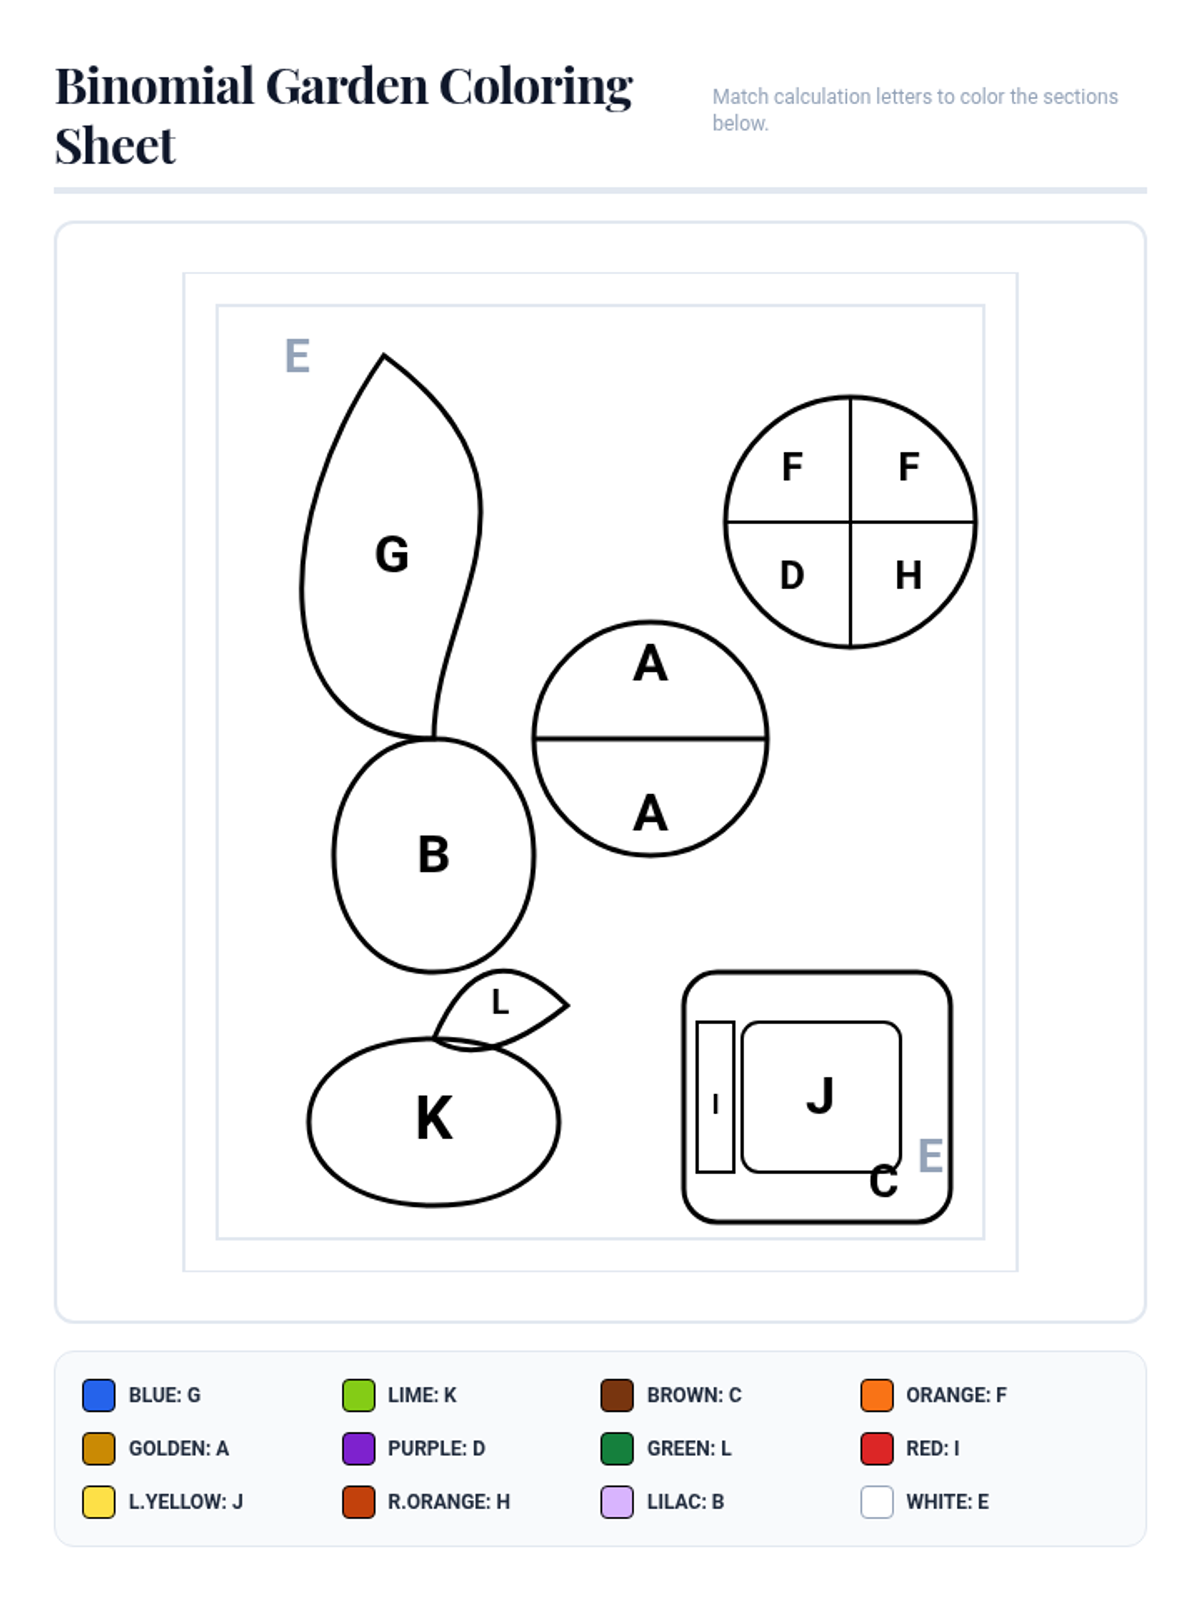
A corresponding coloring sheet for the Binomial Scenarios worksheet. Students use their calculated answers (Letters A-L) to color in the geometric garden-themed pattern using the designated colors.
A binomial distribution worksheet where students solve 12 word-problem scenarios to find probabilities, means, and variances. Each solution corresponds to a letter used for a matching coloring activity.
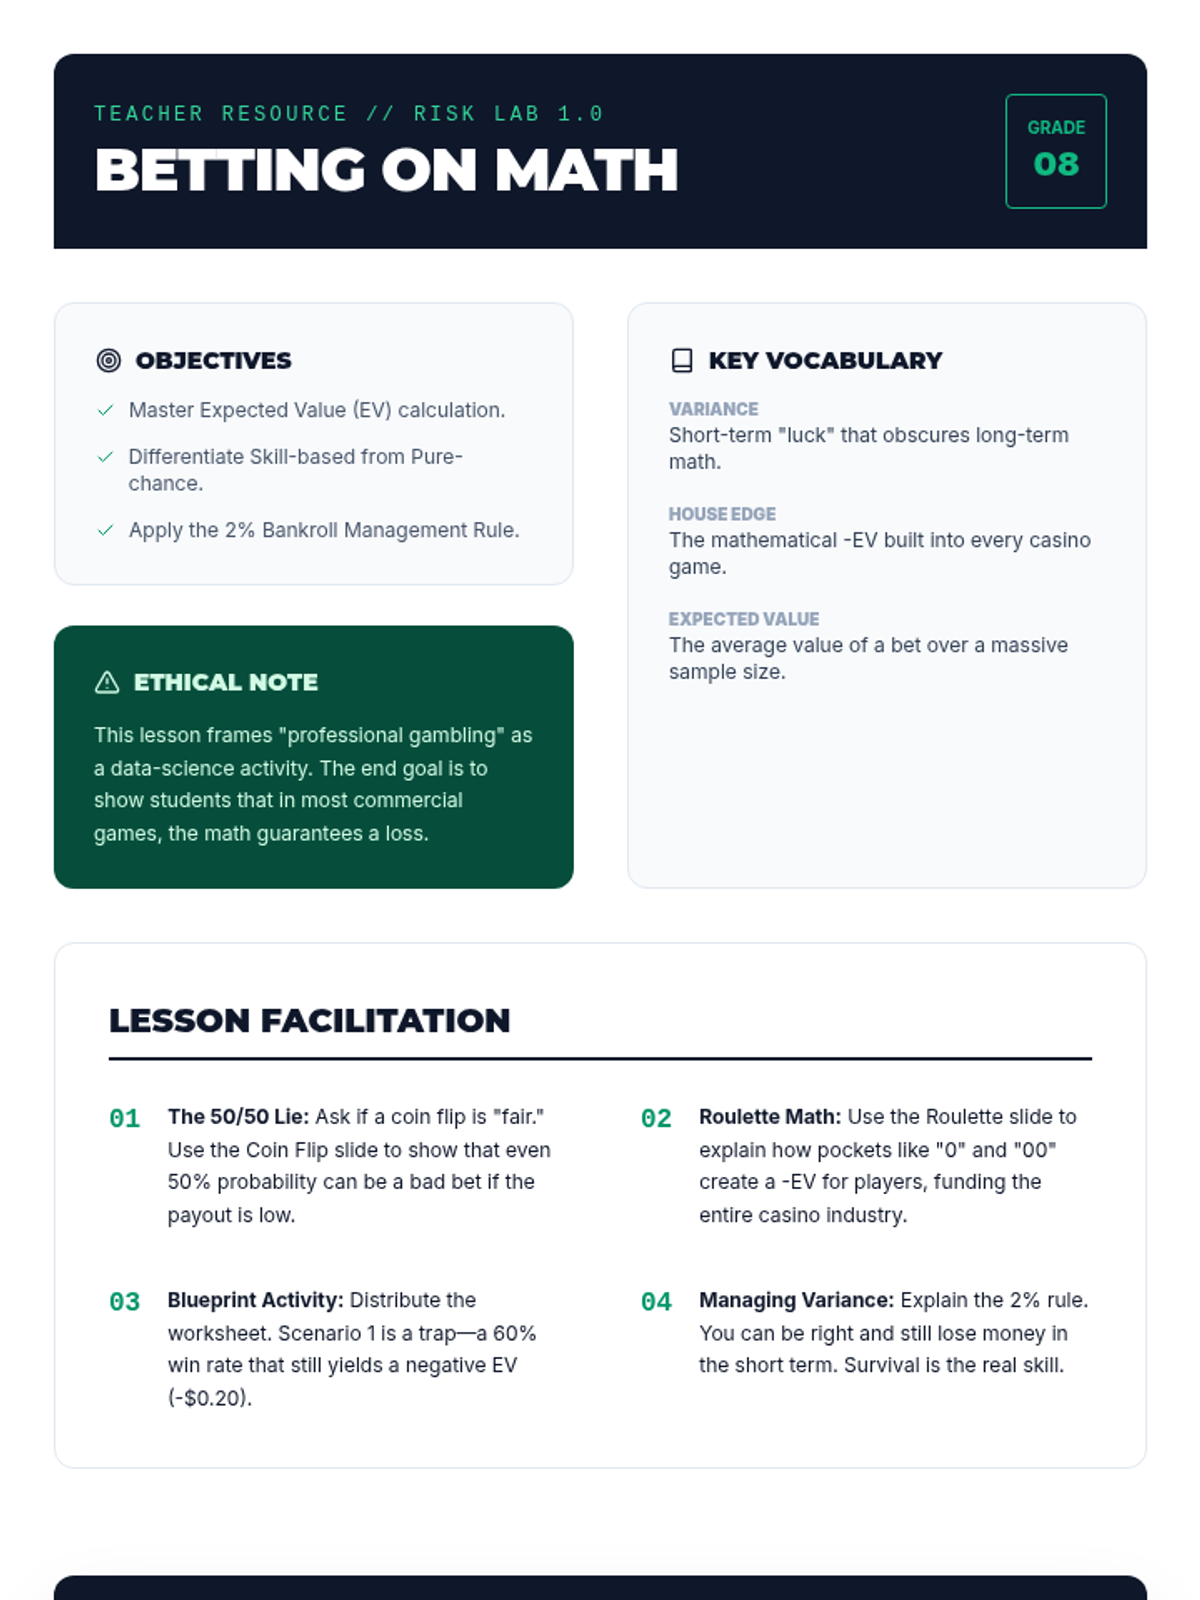
A comprehensive teacher's guide for the Risk Lab lesson, including learning objectives, instructional strategies, and a complete answer key.
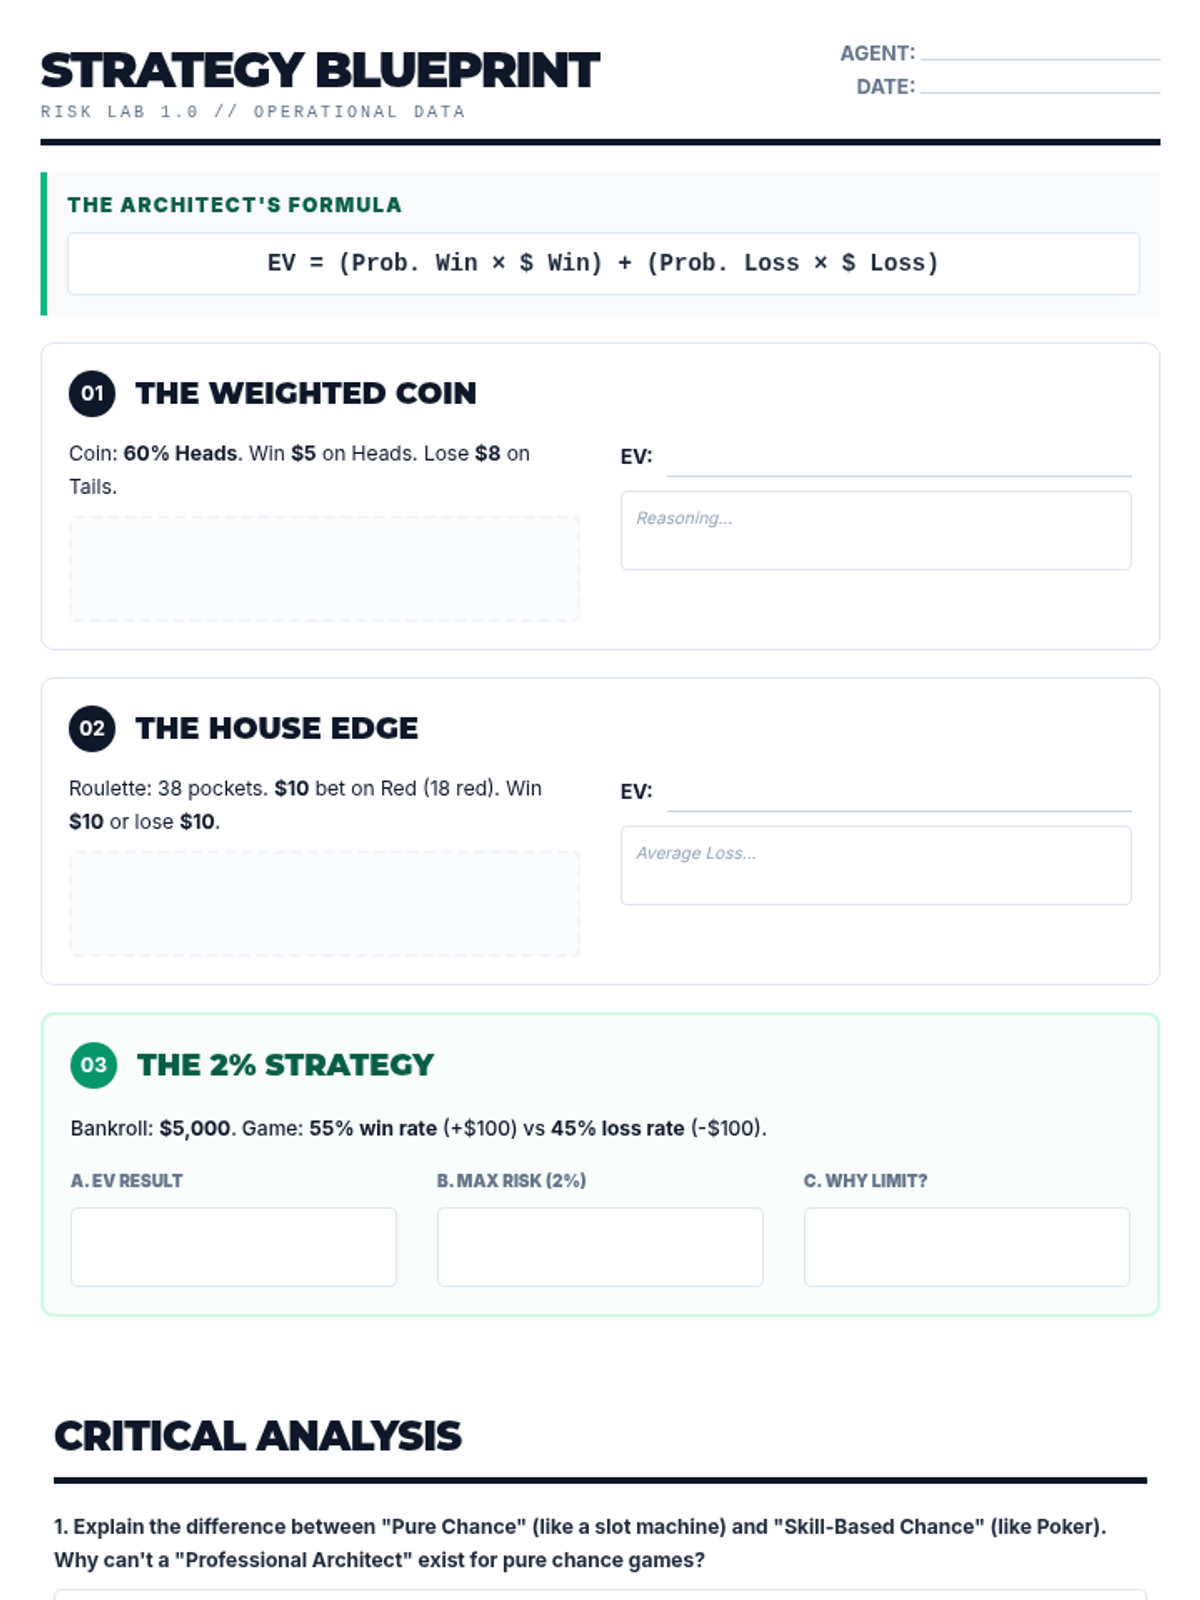
A two-page math worksheet where students calculate expected value and apply risk management strategies to various game scenarios.
A sleek, 16:9 presentation exploring the mathematics of risk, expected value, and the difference between luck and strategy in games of chance.
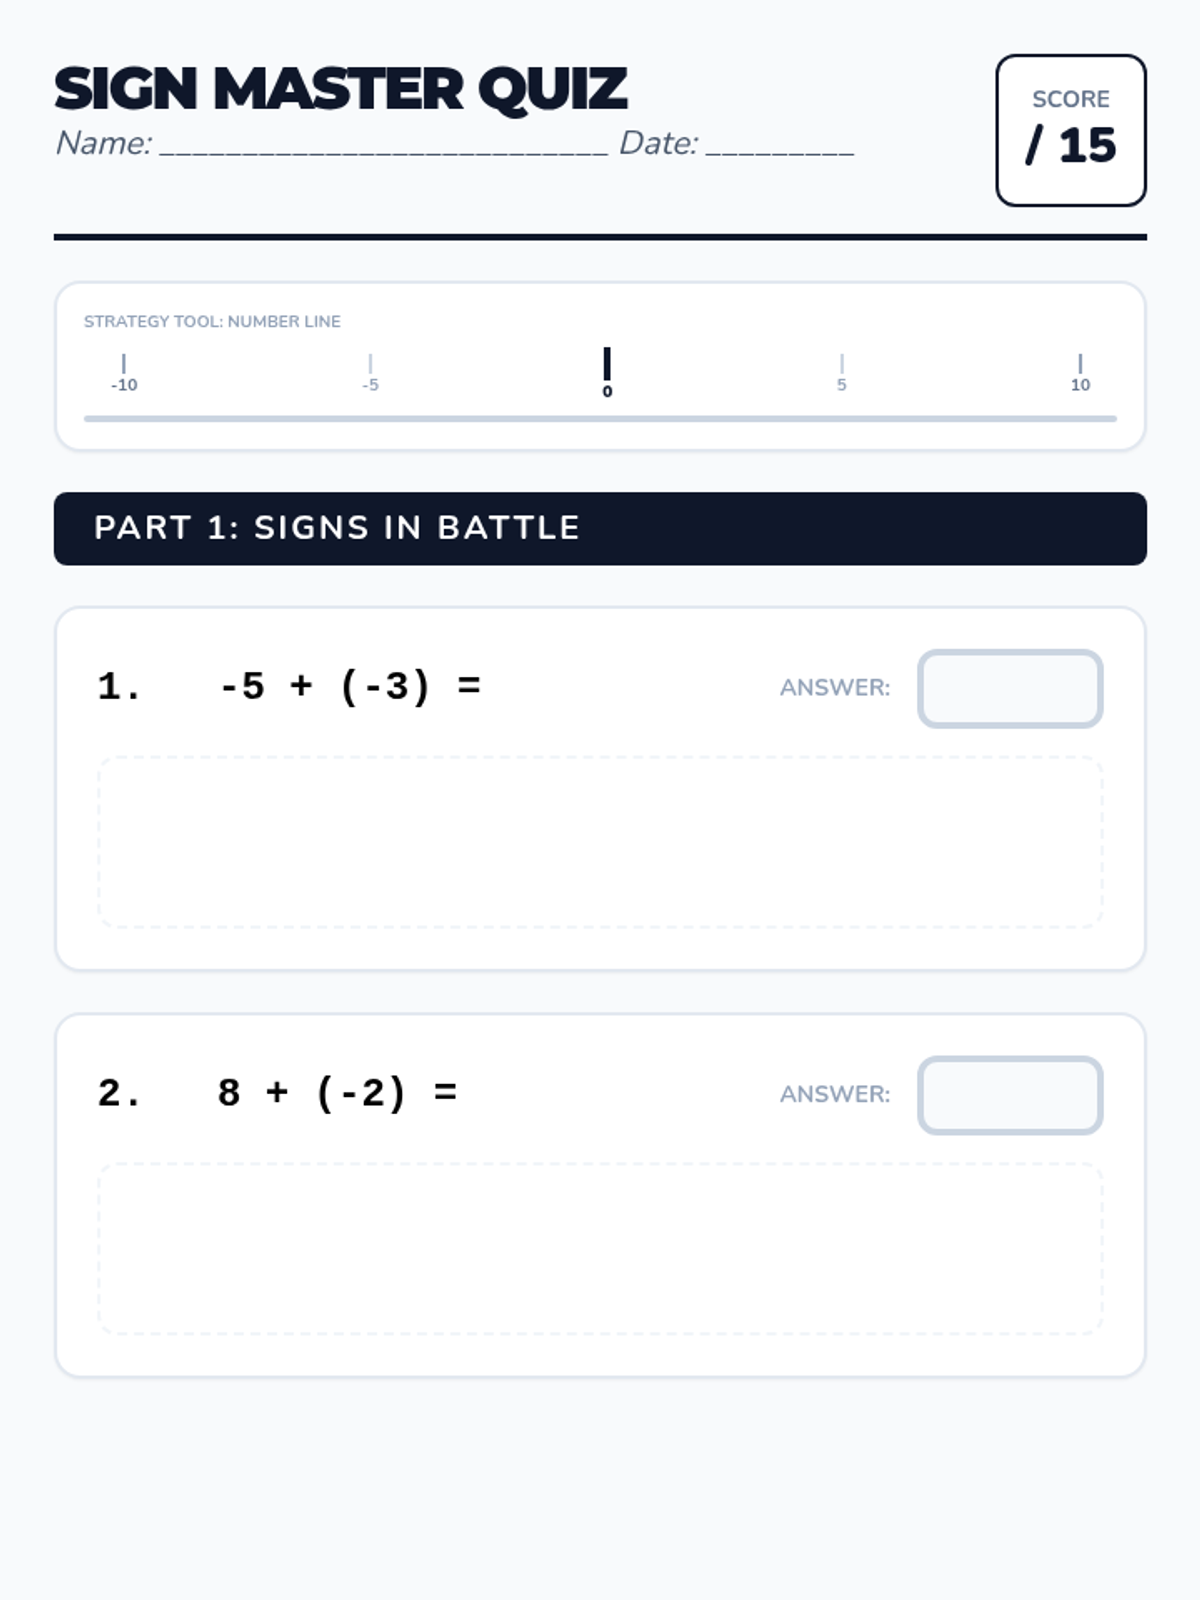
A revised 15-question quiz covering integer operations and positive mean calculations. Spacing has been corrected using strict viewport height sections to ensure each question and its workspace stay on the same page, with clear section breaks and large student work areas. Word problems for mean focus on positive values.
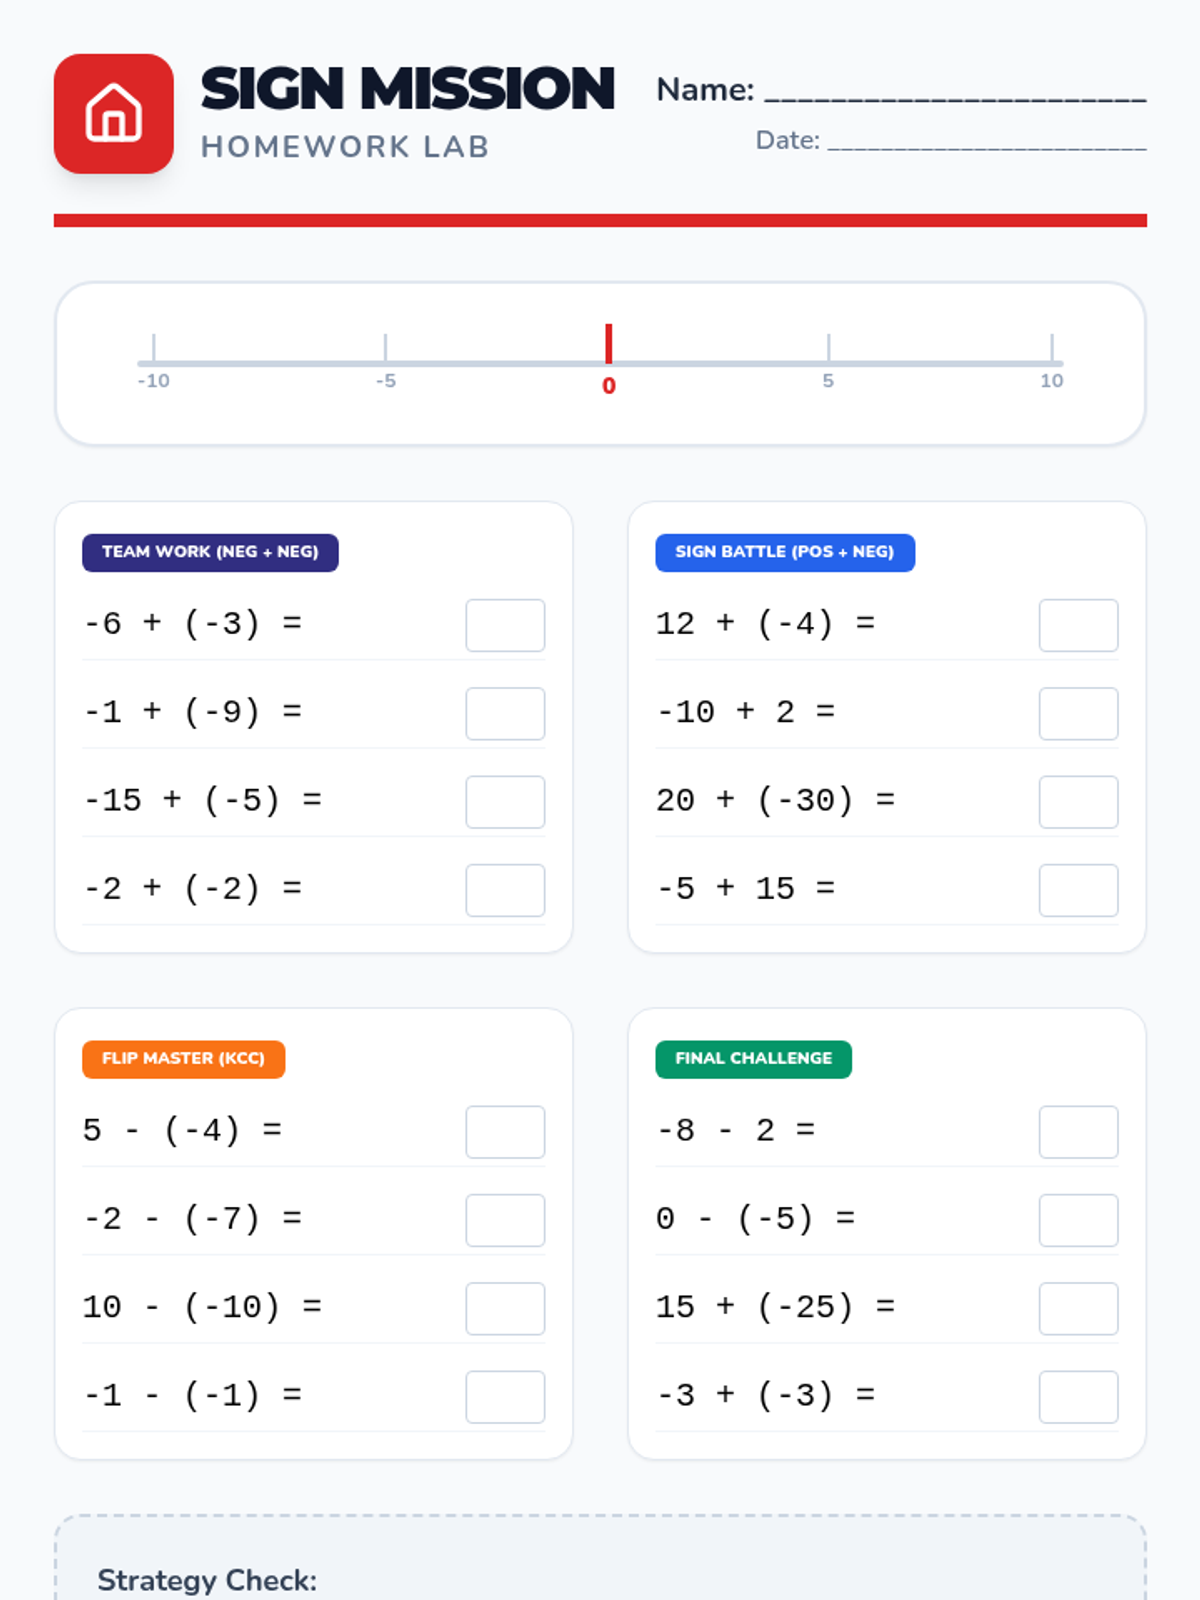
A single-page homework assignment focused on reinforcing the four integer rules with clear sections, visual supports, and space for reflection.
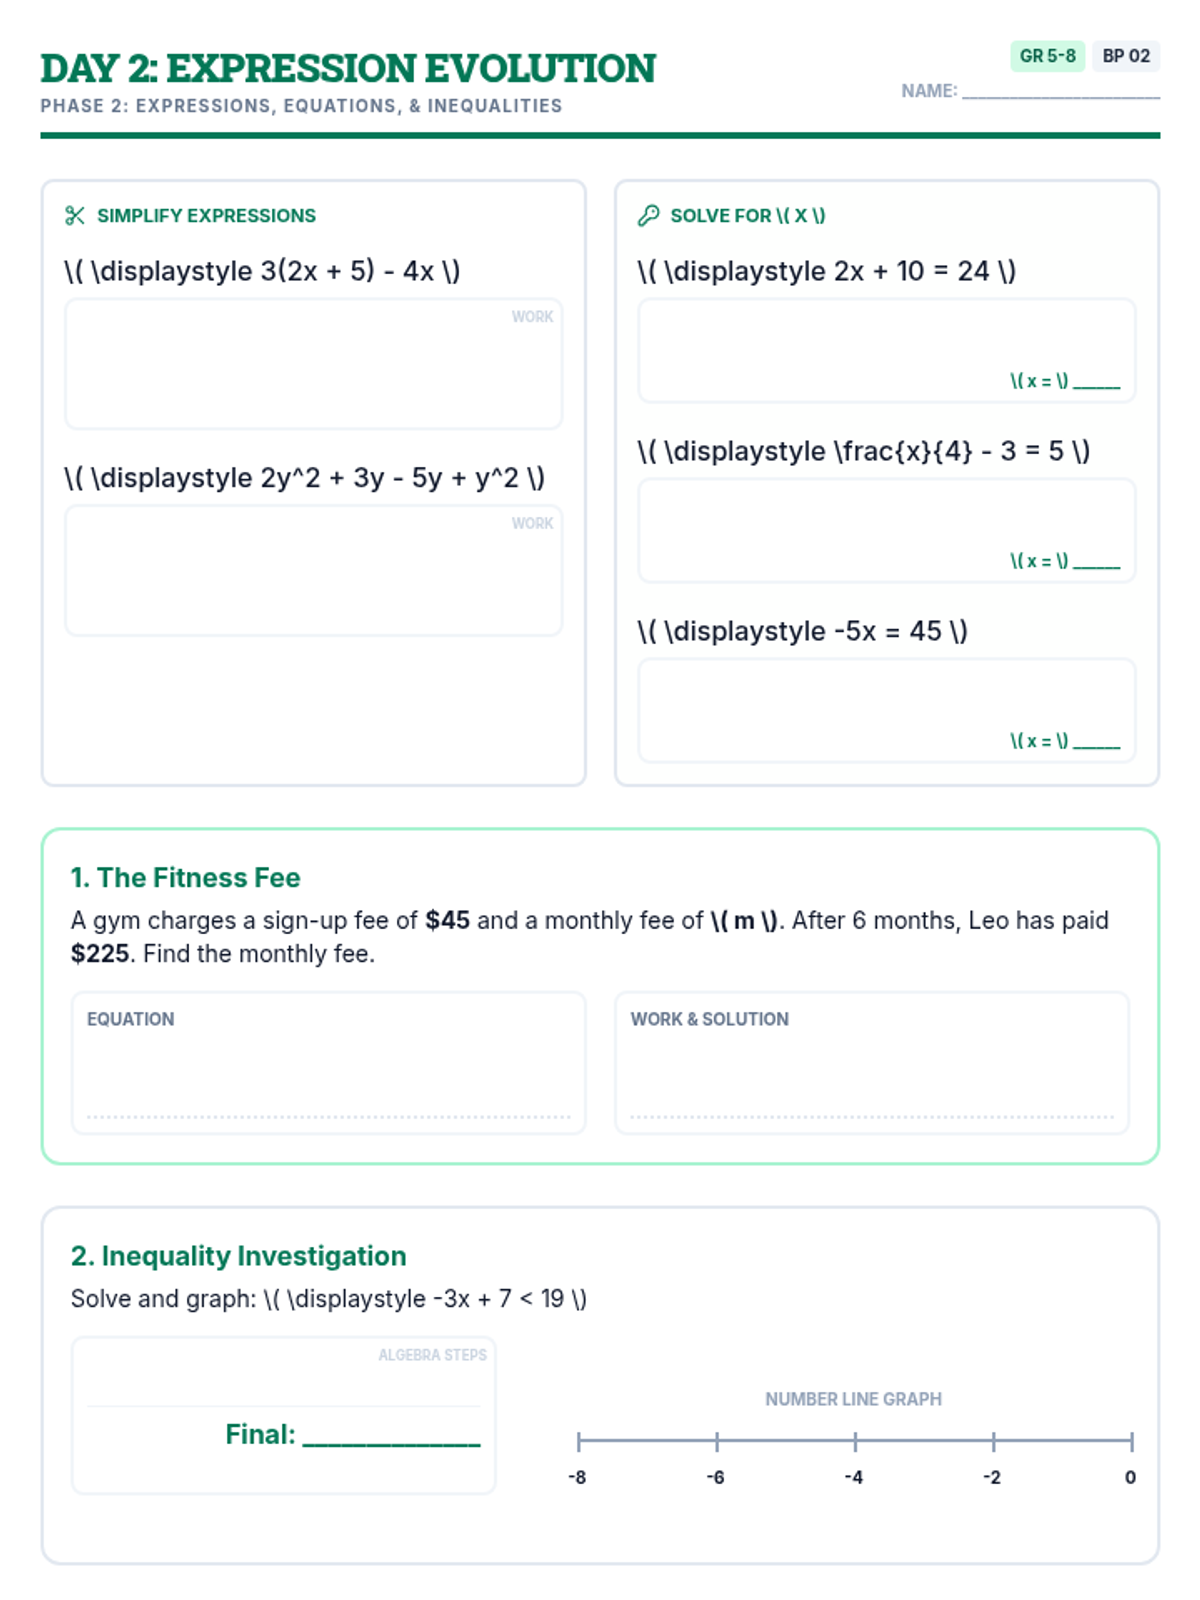
Day 2 Morning Work worksheet focusing on expressions and equations. Revised to improve work area sizing, math rendering, and section formatting.
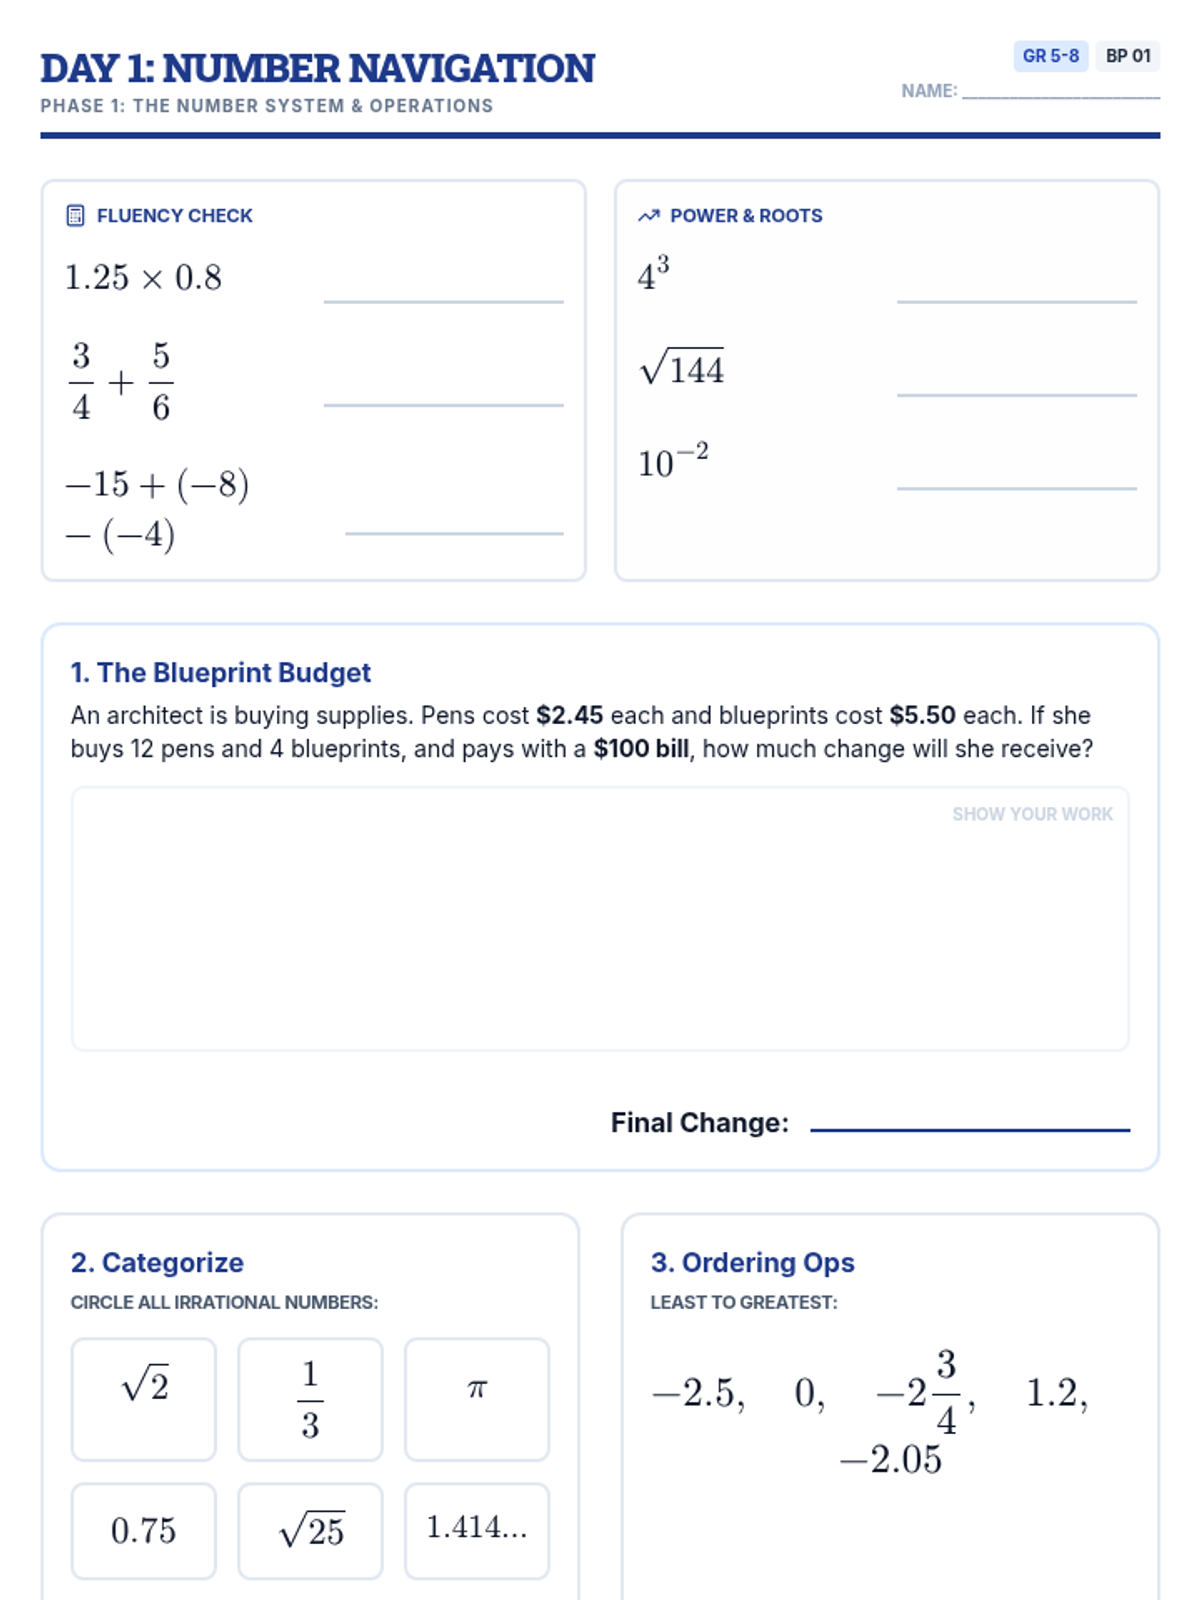
Day 1 Morning Work worksheet focusing on number systems, fractions, decimals, and basic operations. Revised to improve legibility of math, work area clarity, and formatting.
The cover page for the 5-day morning work math packet, featuring a 'Brain Blueprint' theme with space for student names.
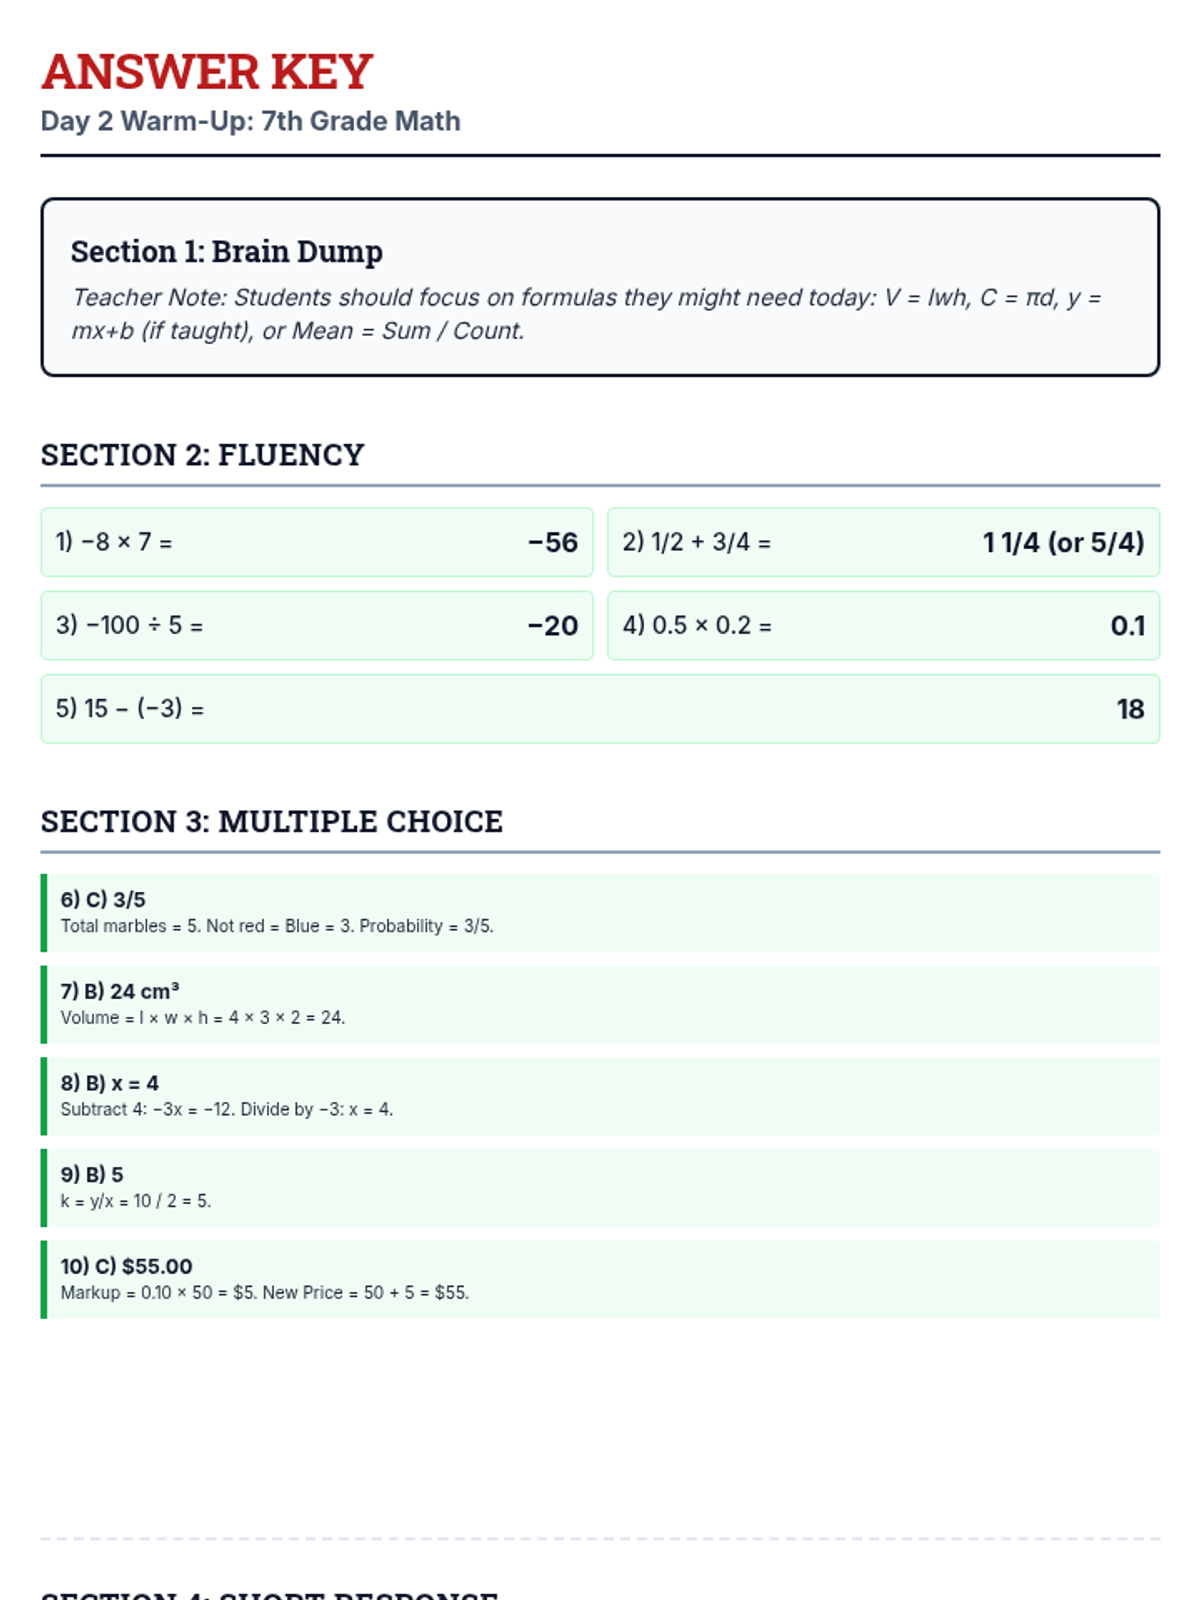
Answer key for the Day 2 Warm Up packet, including correct responses and brief teacher notes for the second day of the exam.
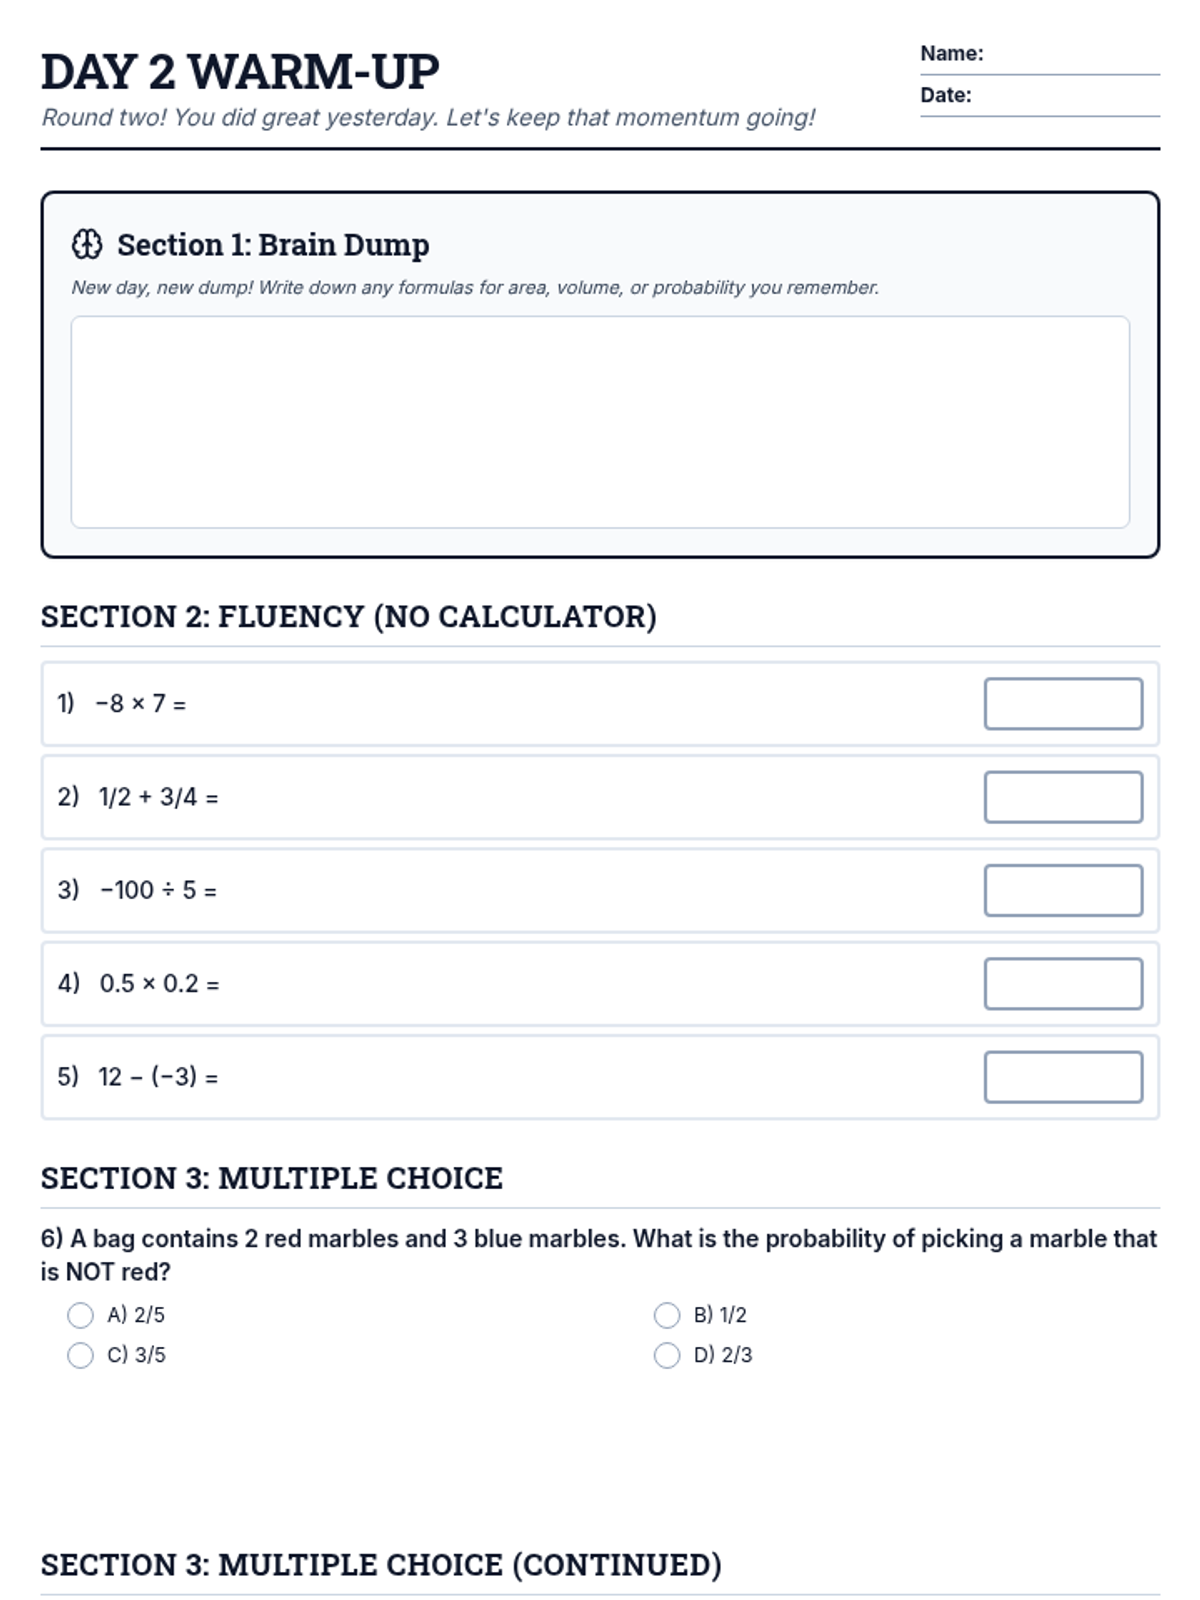
A 4-page student morning work packet for Day 2 of the 7th grade math exam, featuring fluency, multiple choice on probability and geometry, short response practice, and CBT skills. Consolidate to 4 pages. Optimized page balance and spacing.
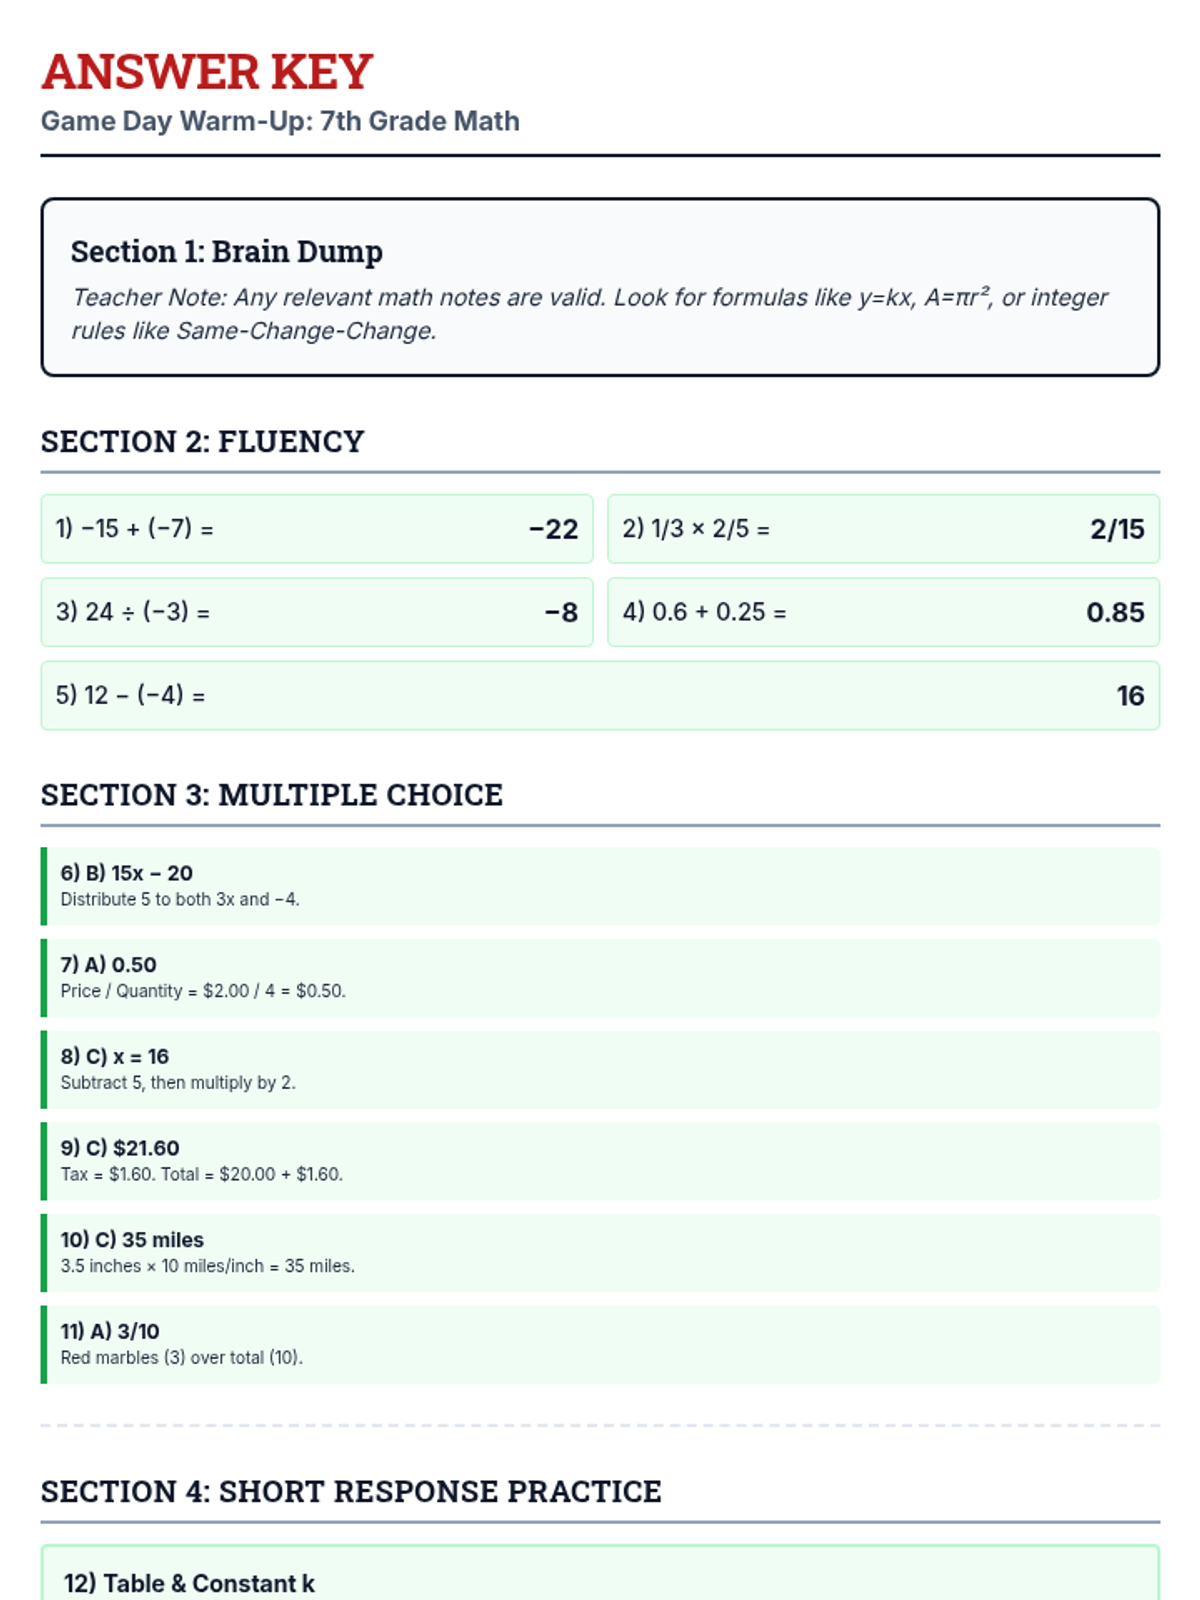
Answer key for the Game Day Warm Up packet, including correct responses and brief teacher notes for exam morning. Updated with letter choices and standardized metadata. Fixed LaTeX rendering and layout issues. Consolidate to 2 pages for efficient printing.
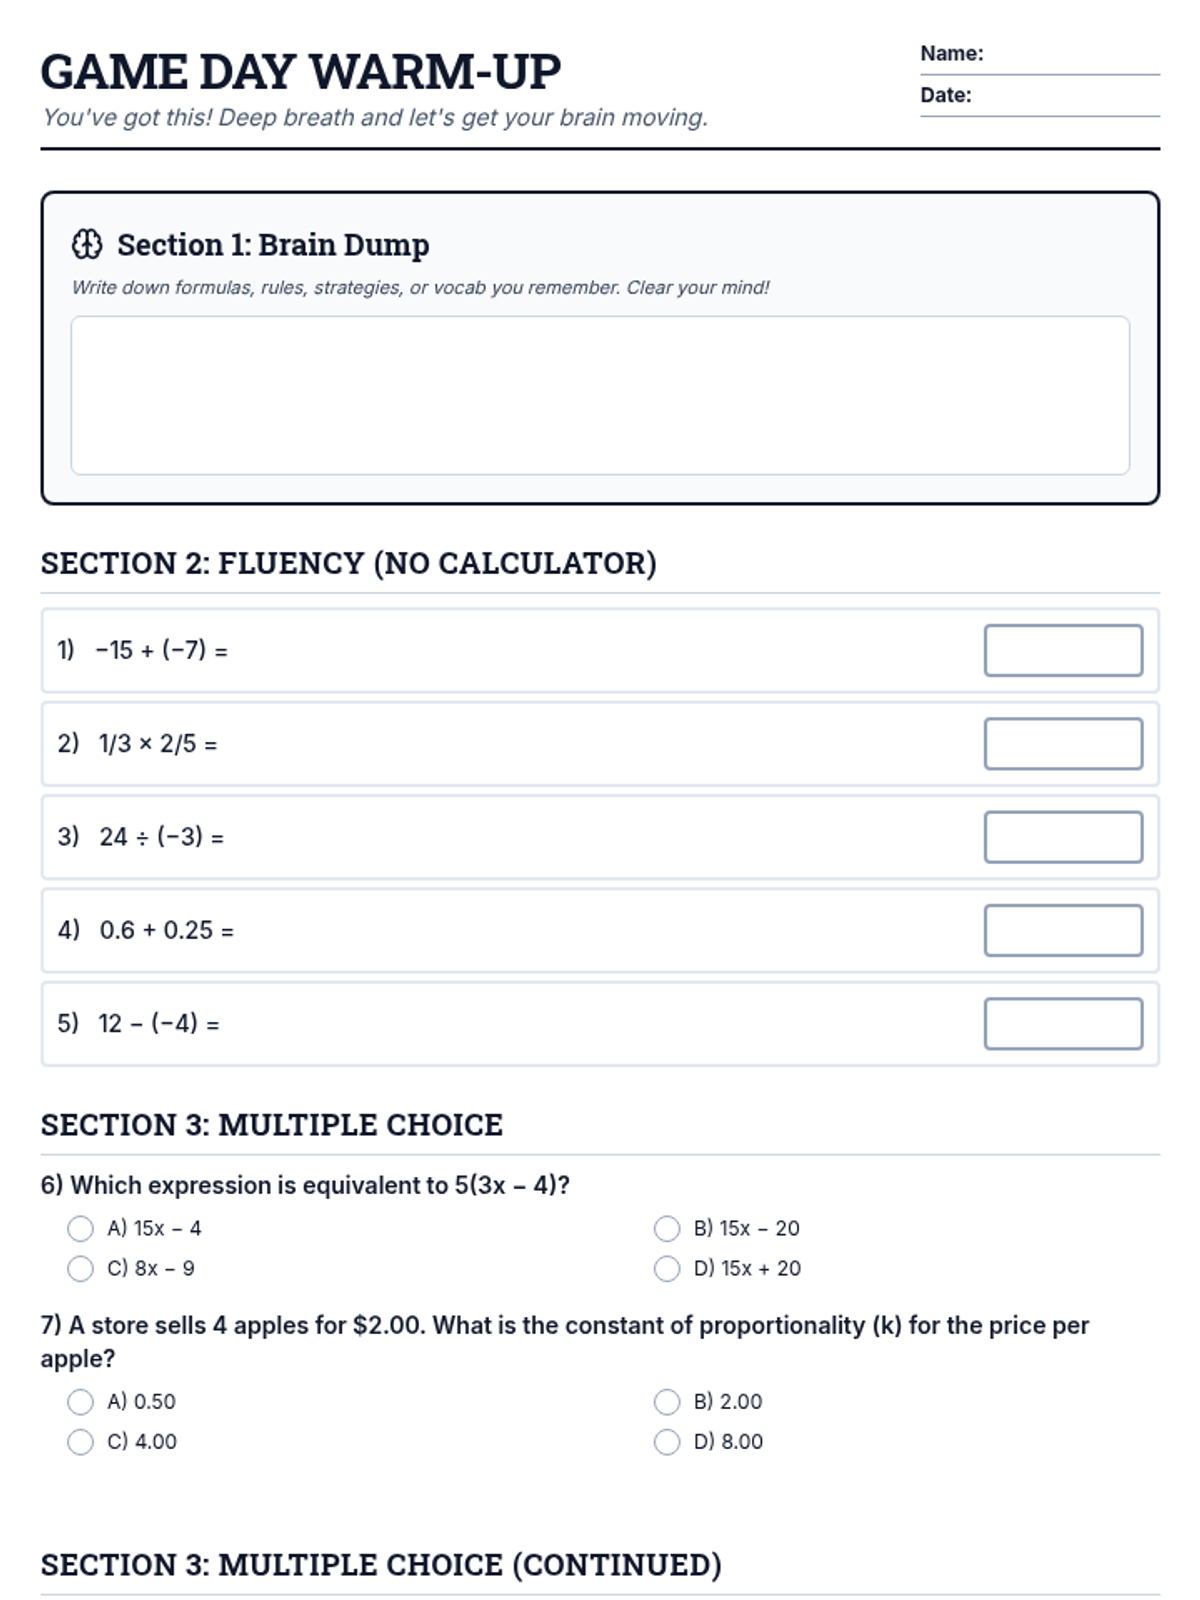
A 4-page student morning work packet for 7th grade math exam day, featuring fluency, extended multiple choice, short response practice, CBT skills, and reflection. Updated with letter choices and standardized metadata. Fixed LaTeX rendering and layout issues. Standardized answer boxes and headers for printing. Consolidate to 4 pages.
A 5-day warm-up worksheet for Week 4, focusing on percent change, percent error, and simple interest (I=PRT).
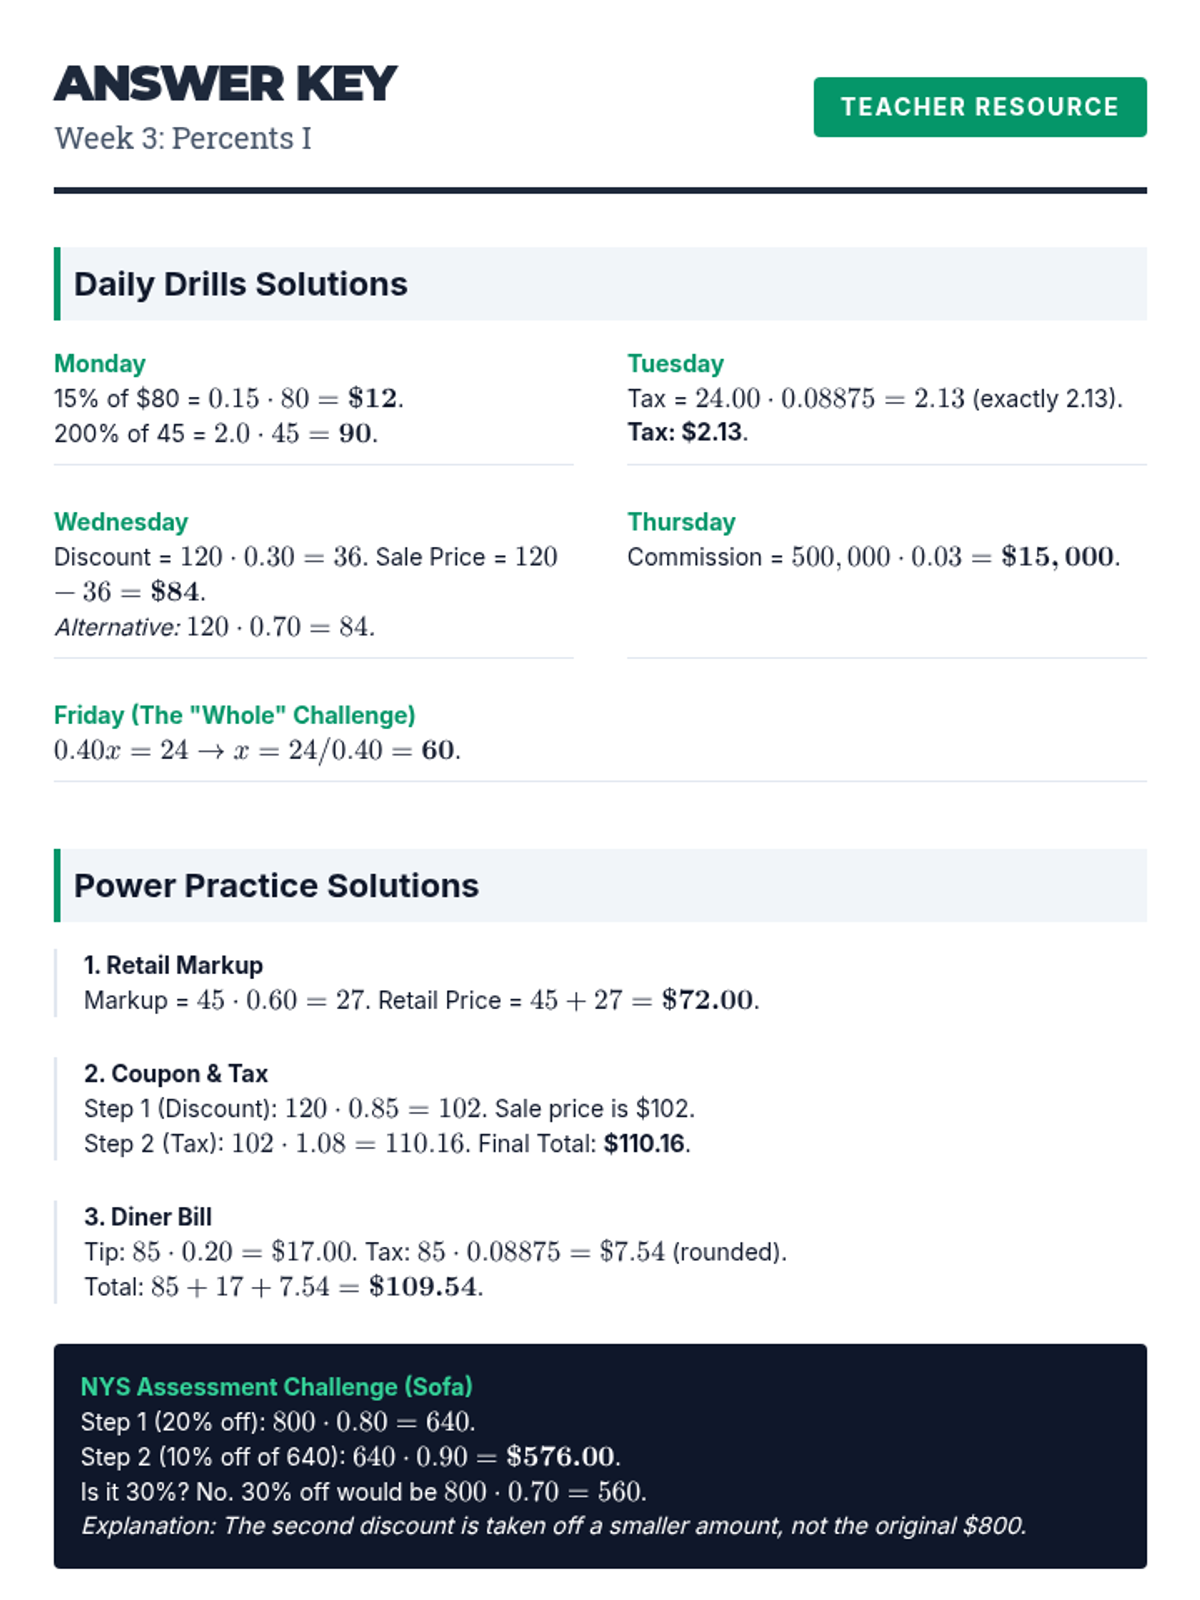
Teacher's answer key for Week 3 (Percents I) Daily Drills and Power Practice worksheets.
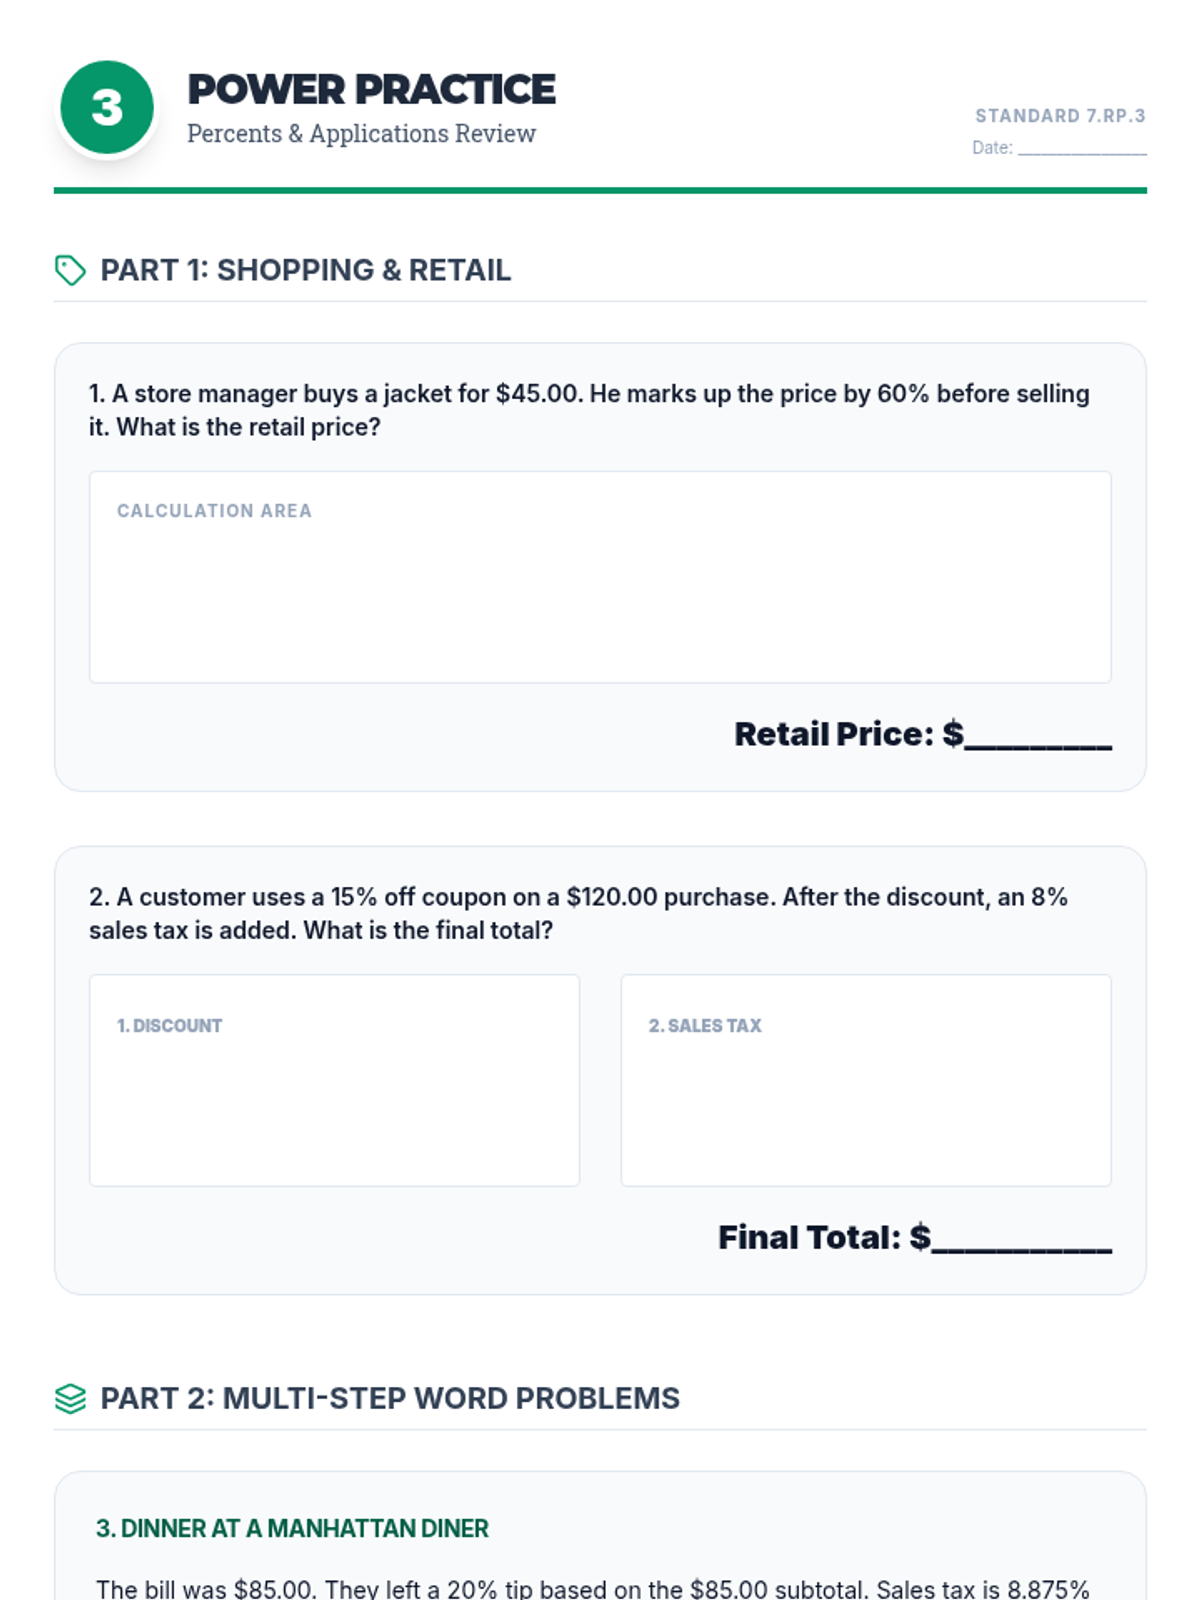
A comprehensive practice set for Week 3 (Percents), featuring markups, multiple discounts, tax, and tip problems in a retail context.
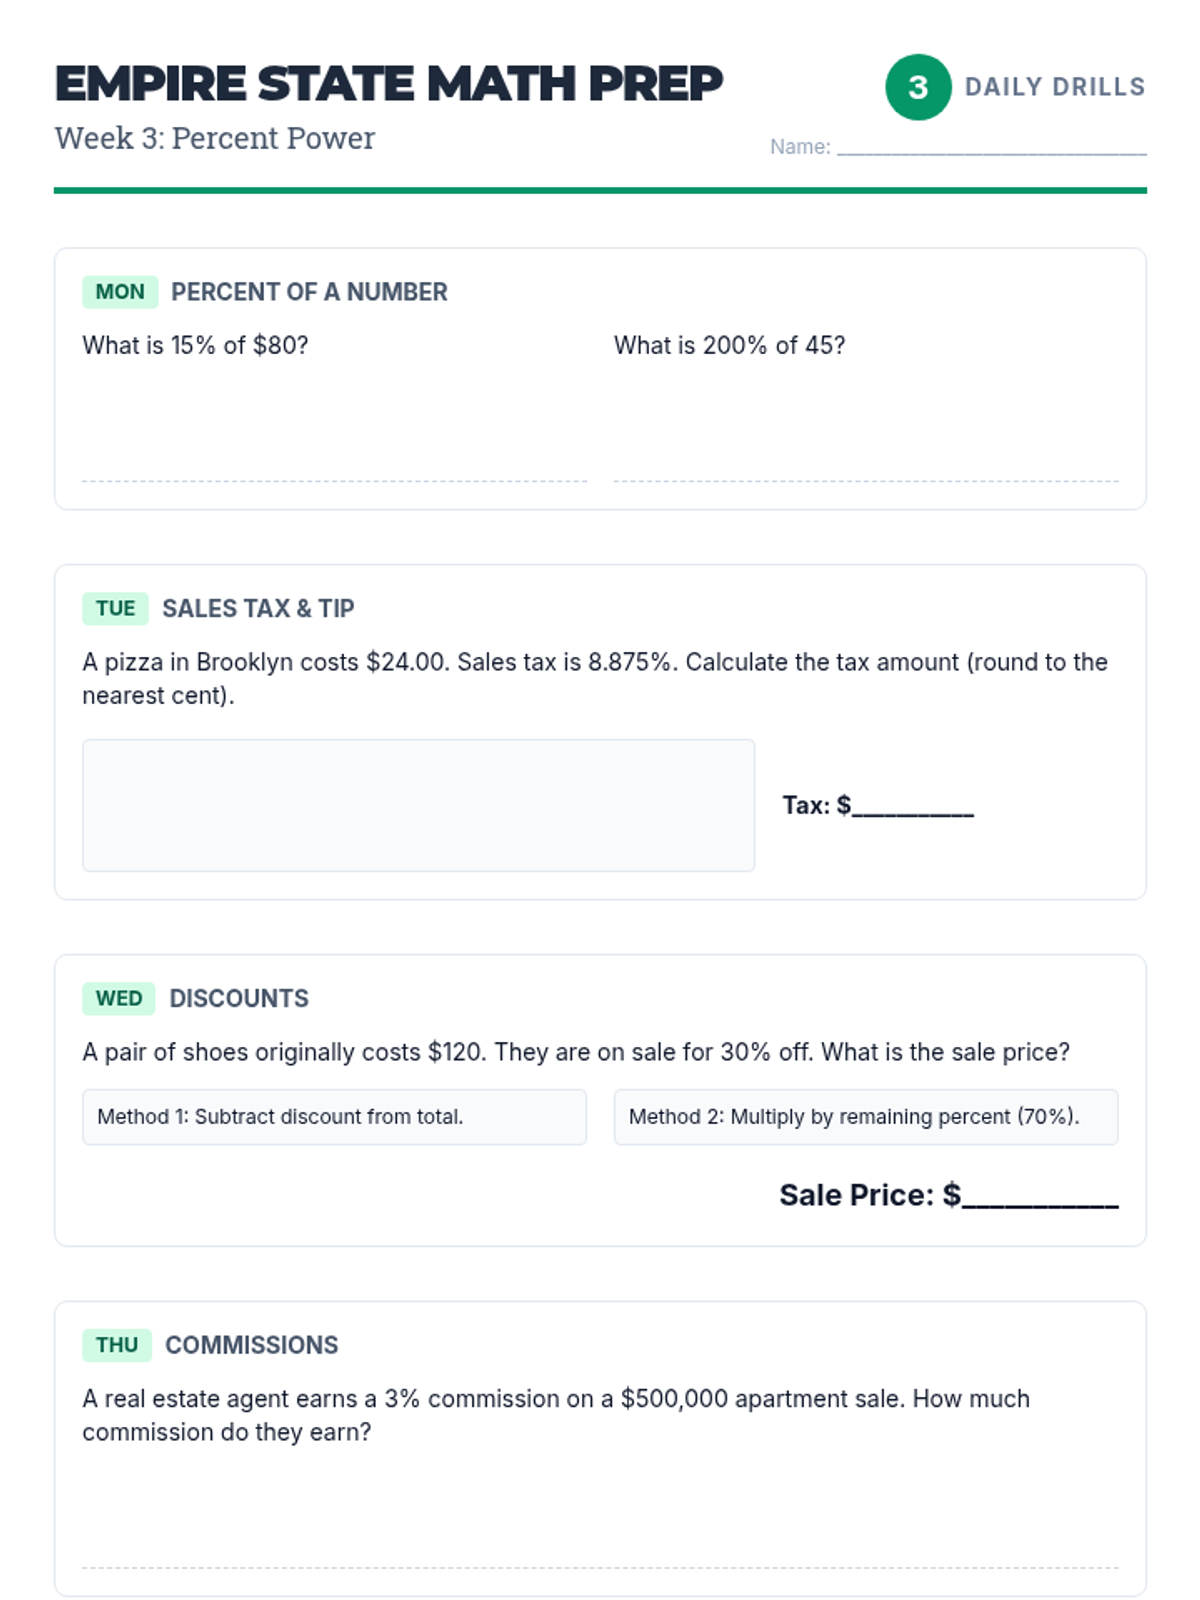
A 5-day warm-up worksheet for Week 3, focusing on basic percents, tax, tip, discounts, and commissions.
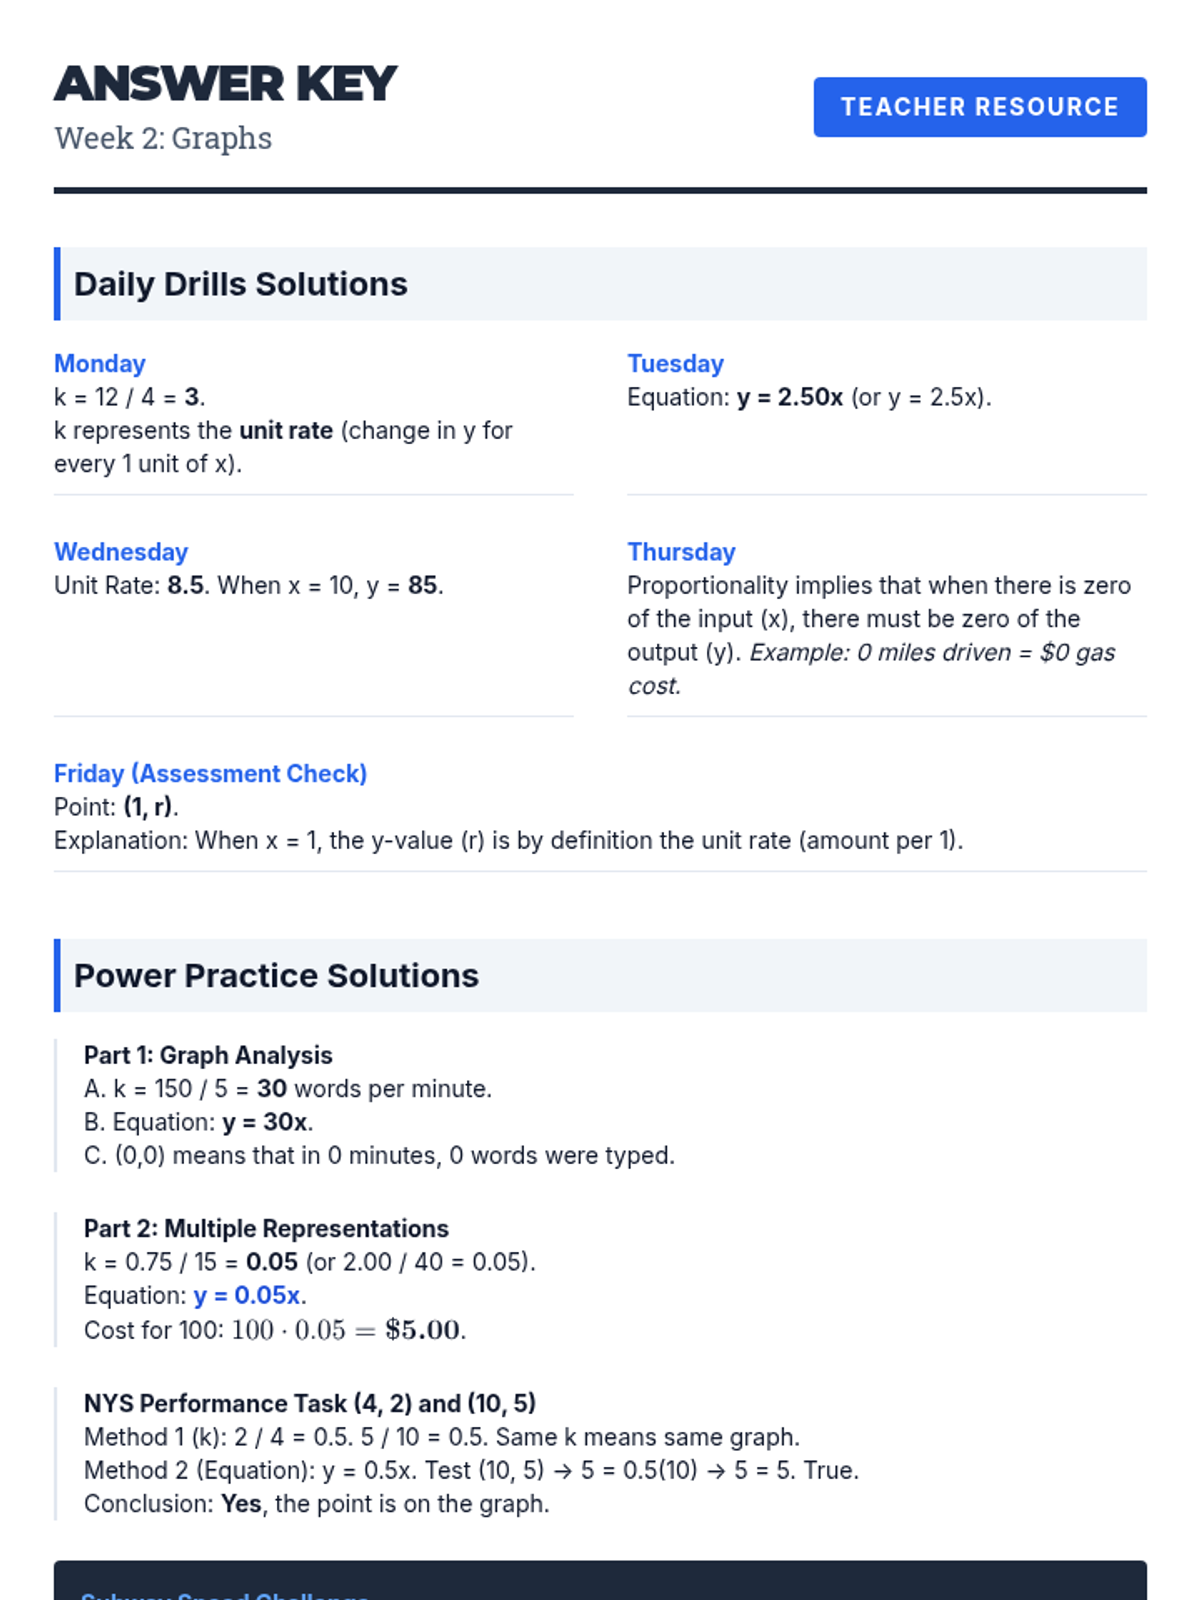
Teacher's answer key for Week 2 (Graphs) Daily Drills and Power Practice worksheets.
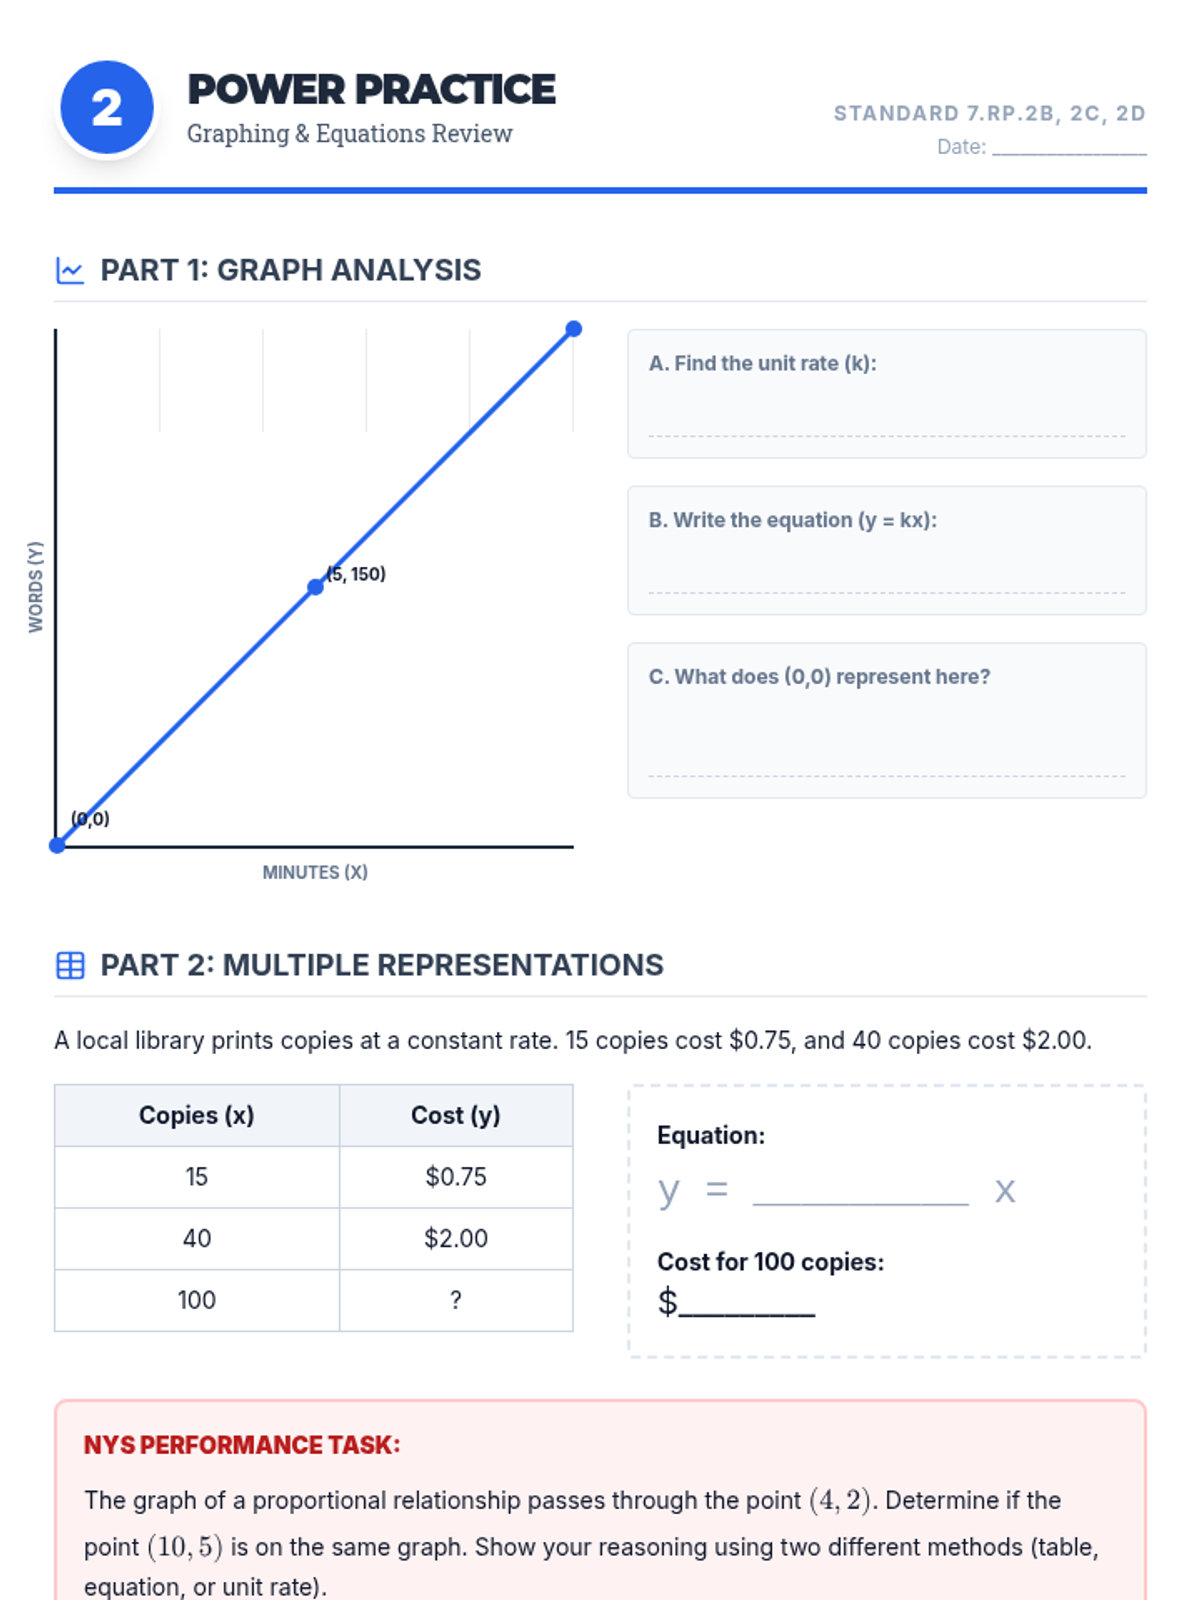
A comprehensive practice set for Week 2 (Graphs), featuring graph interpretation, equations, and comparing multiple representations.
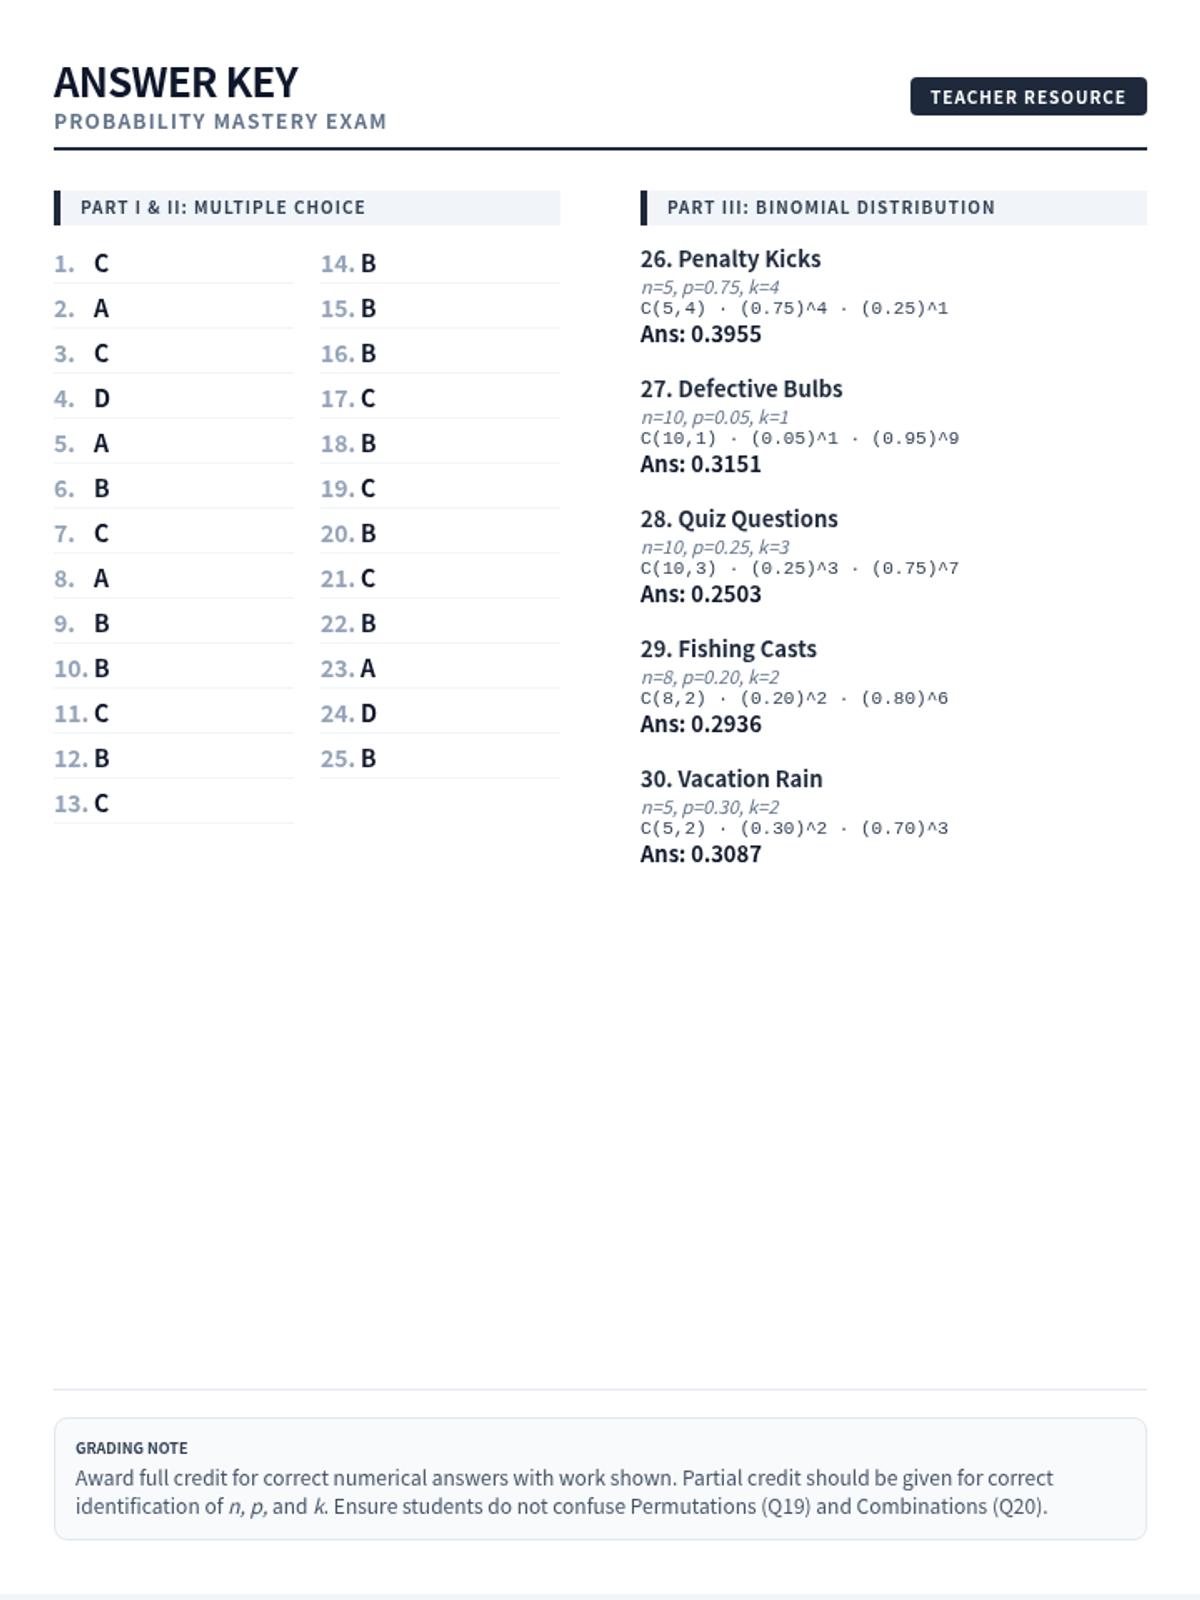
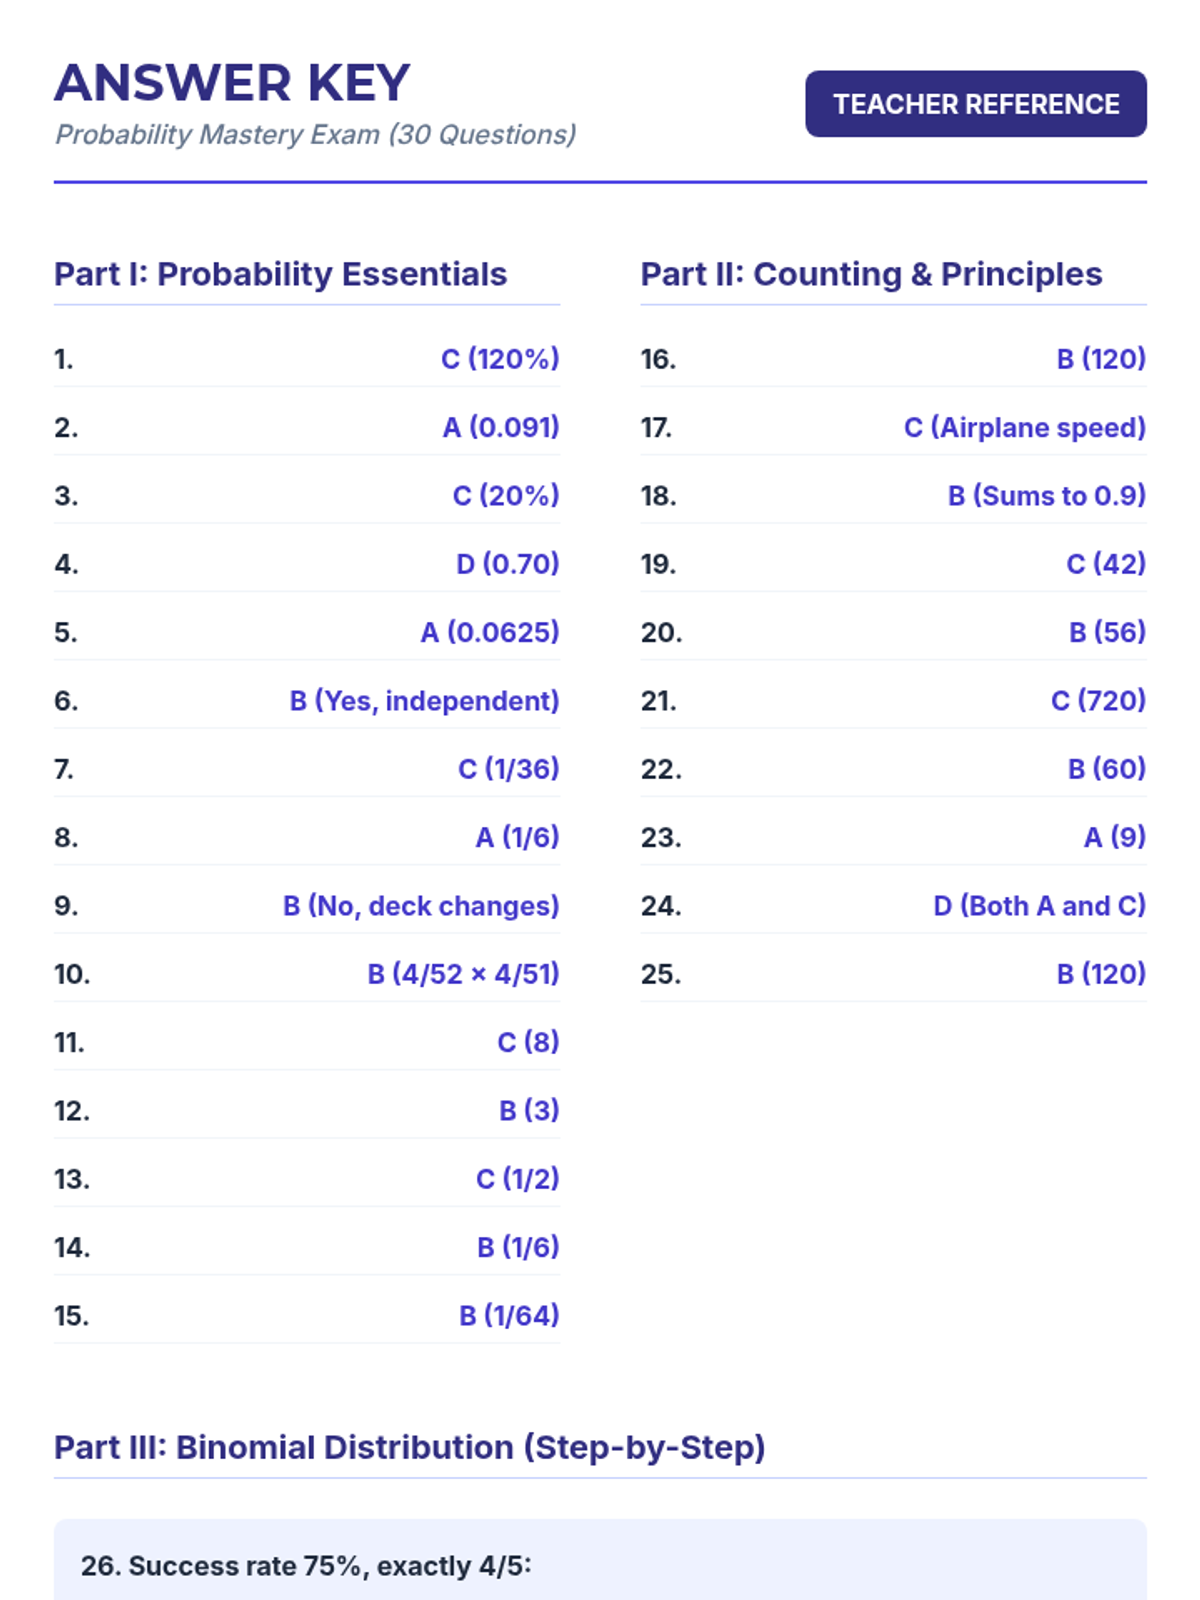
A comprehensive 1-page teacher answer key for the Probability Mastery Exam. It includes letter answers for all multiple-choice questions (Part I & II) and detailed setup and final numerical answers for the binomial distribution problems (Part III). Includes grading notes for open-ended sections.
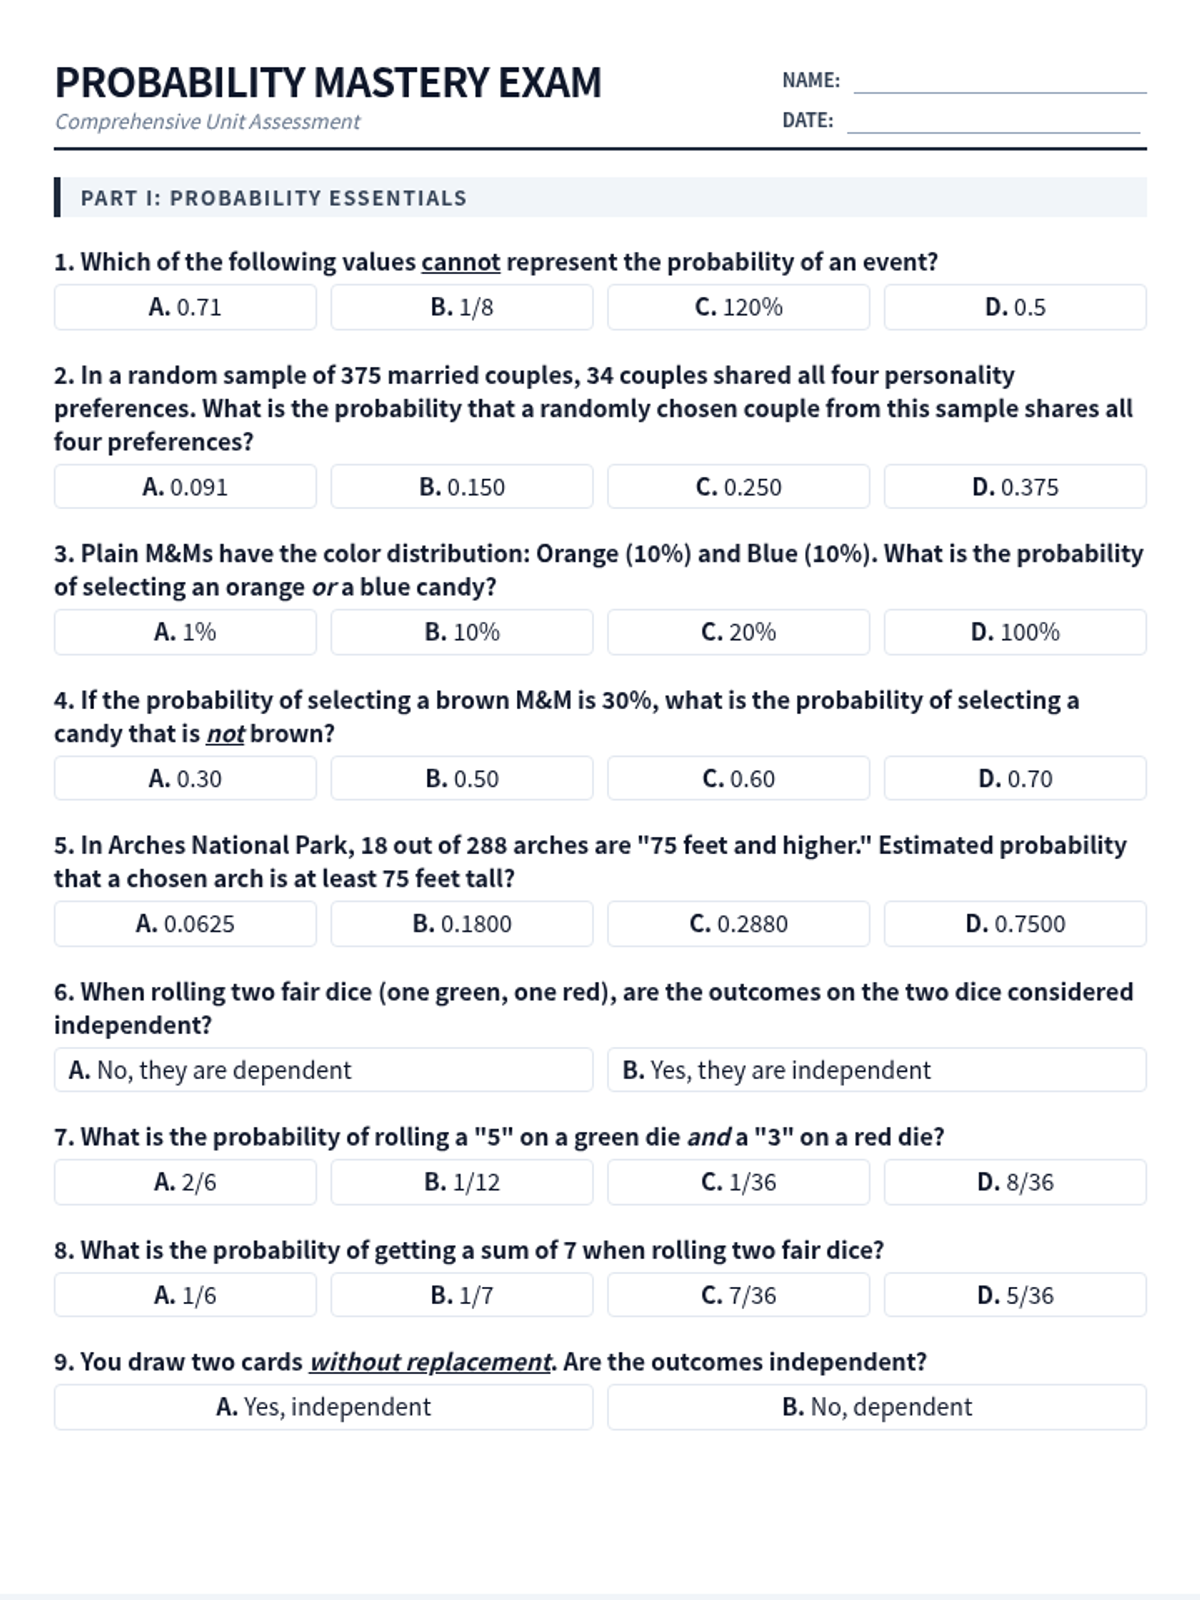
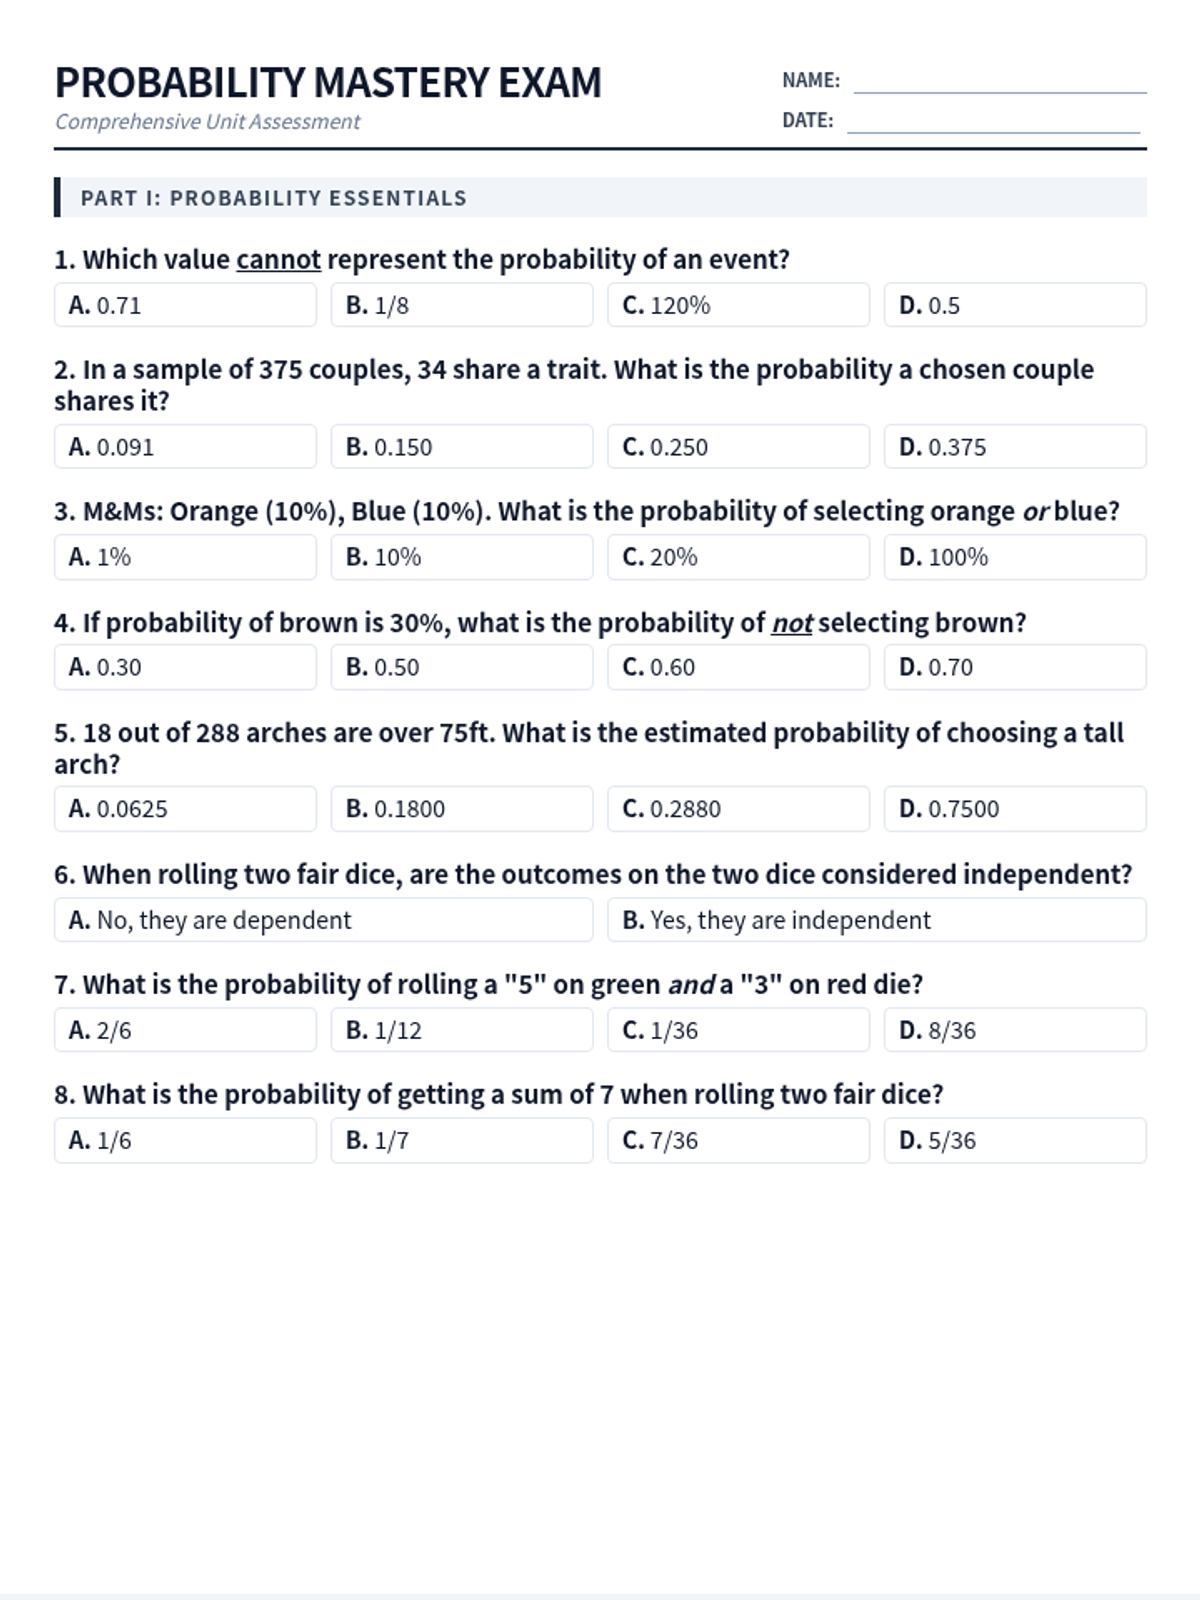
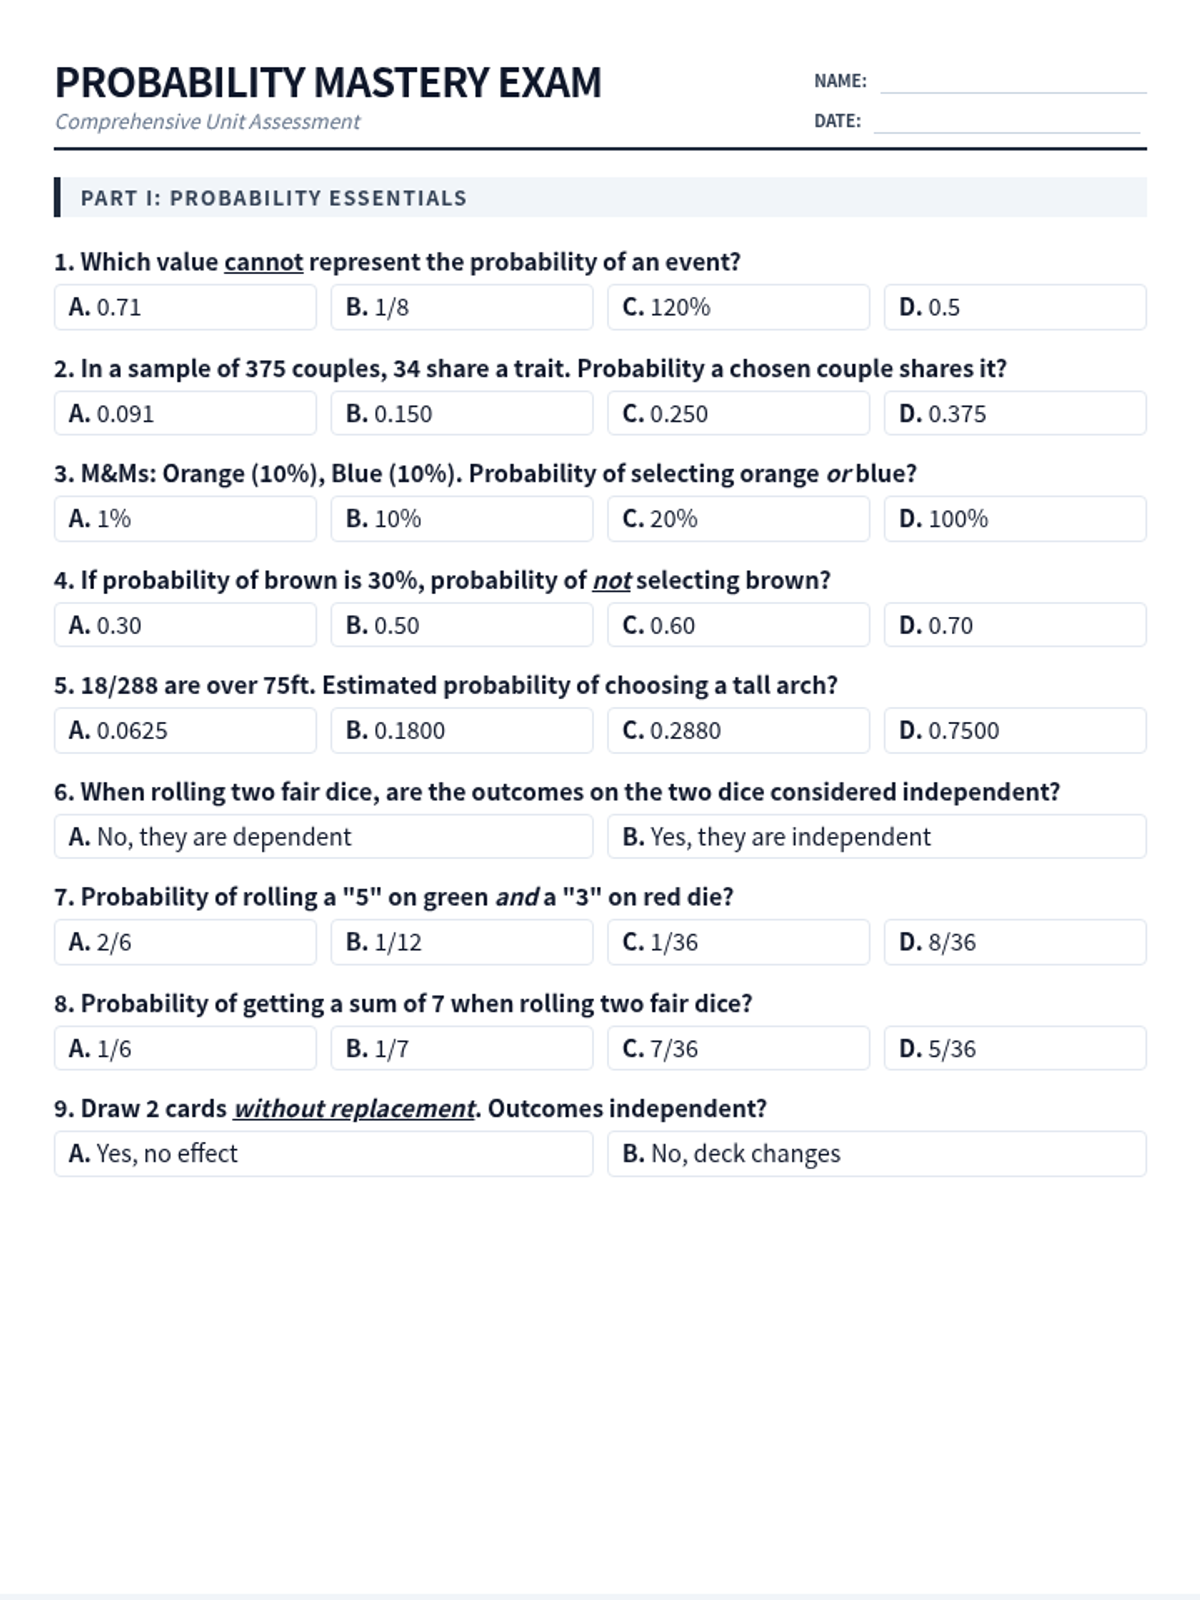
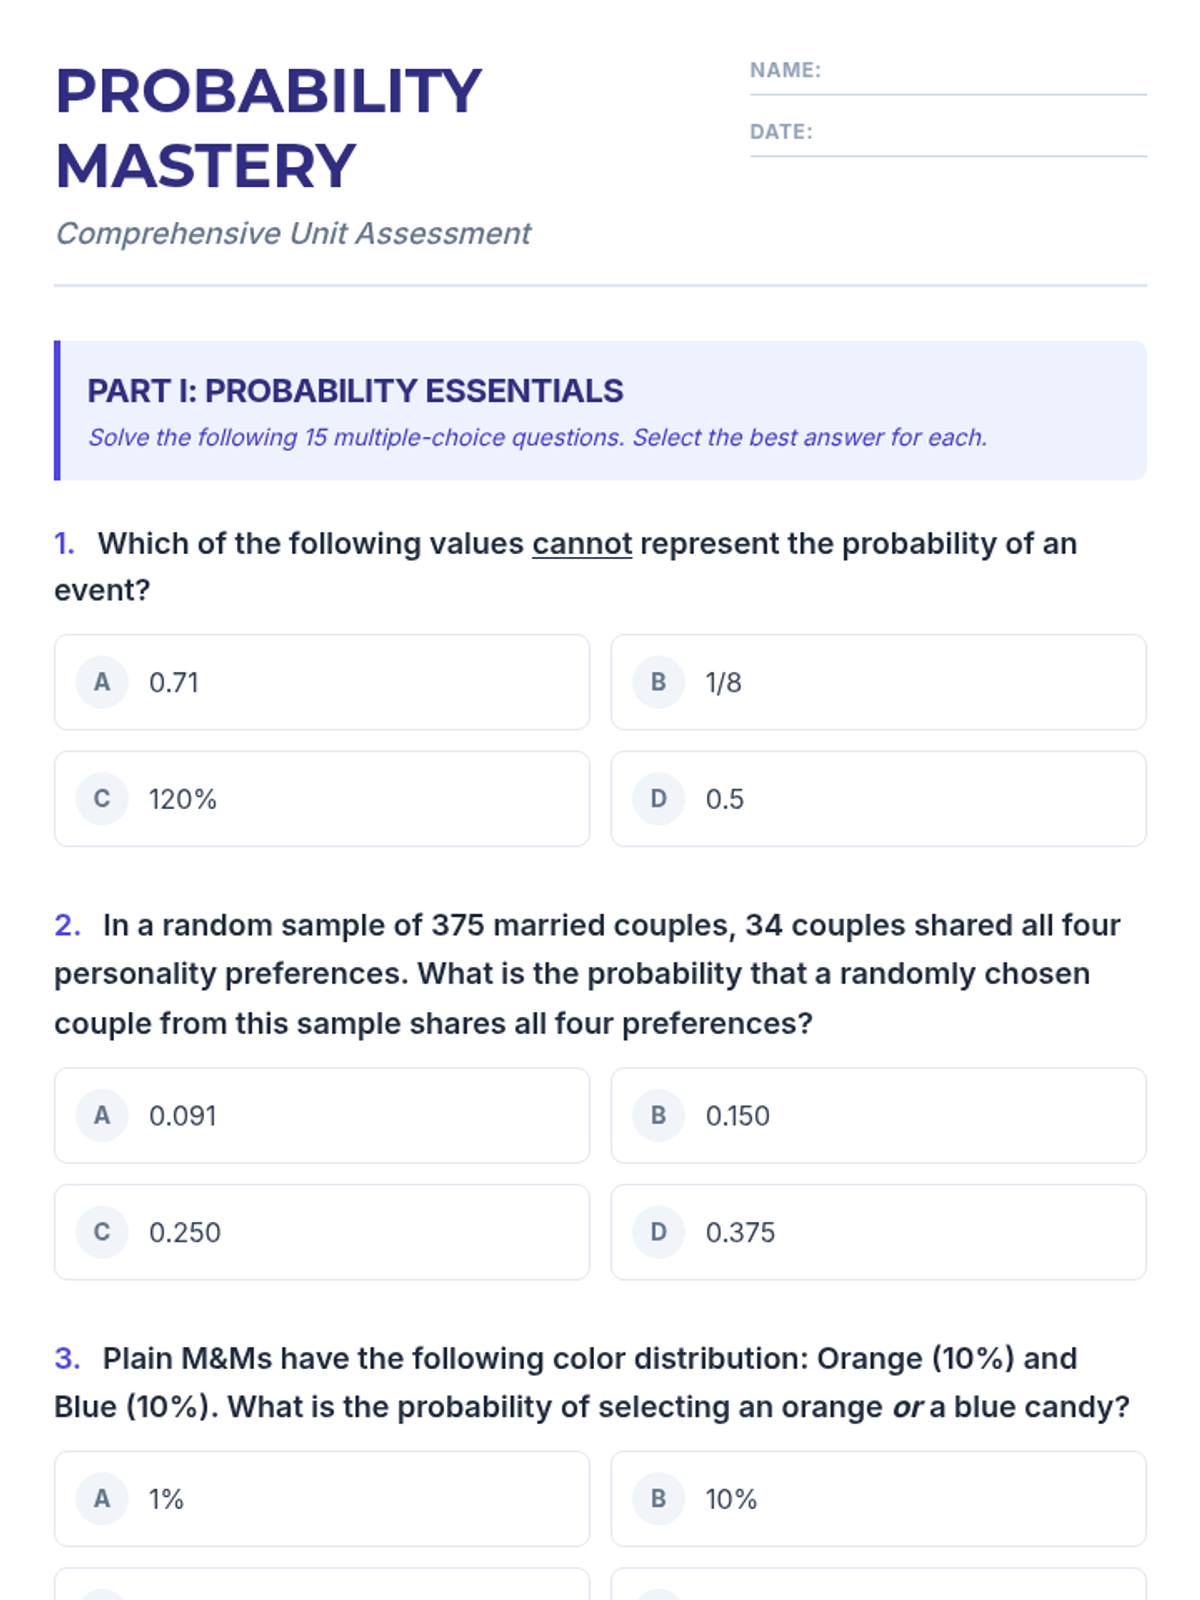
A complete 4-page Probability Mastery Exam with 30 questions. It features full multiple-choice options for Part I and II (including Q9 and Q10) and full word-problem text for Part III (Q26-30). The layout is professionally optimized with 12pt Arial-style font, single spacing, and compact h-16 work boxes. Formulas and subscripts are rendered for maximum compatibility.
A revised 4-page Probability Mastery Exam with a complete 4-option Question 18 and standardized, smaller student work boxes (h-24) for calculations. The layout remains efficient, using a 12pt Arial-style font with single spacing to ensure all 30 questions fit perfectly within the 4-page limit. Math notation has been simplified for consistent rendering.
A compact 4-page Probability Mastery Exam using standard sans-serif font (Arial stack) with 12pt (16px) text and single spacing. It features 30 questions organized with space-efficient 2-column answer grids and larger work boxes for the binomial distribution section. Question 18 has been updated to include all four probability distribution options.
A complete teacher's answer key for the Probability Mastery Exam. Includes final answers for multiple-choice questions and detailed, step-by-step solutions using the binomial probability formula for the final section.
A comprehensive 30-question math exam on probability and statistics, covering elementary probability, counting principles, and binomial distribution problems. The material features multiple-choice and short-answer sections with clear instructions and dedicated work areas.
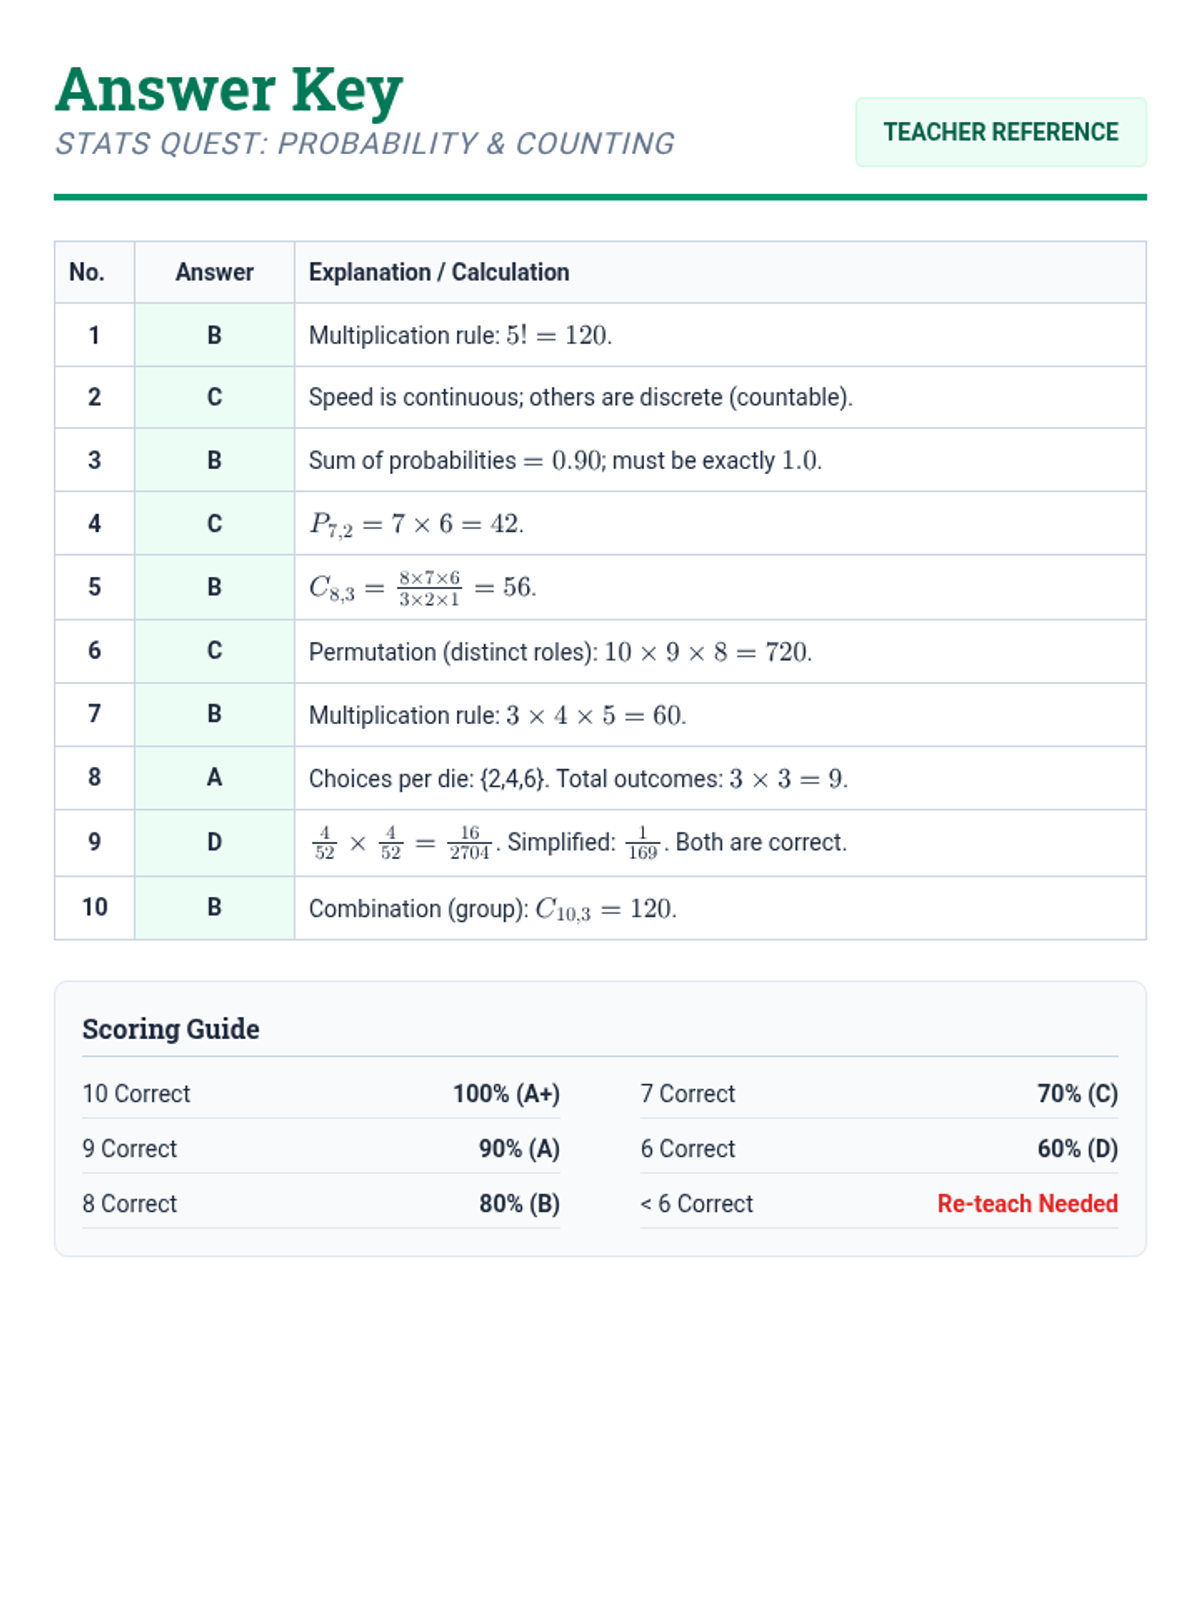
Detailed answer key for the Stats Quest Quiz. Revised to fit on a single page for instructor convenience.
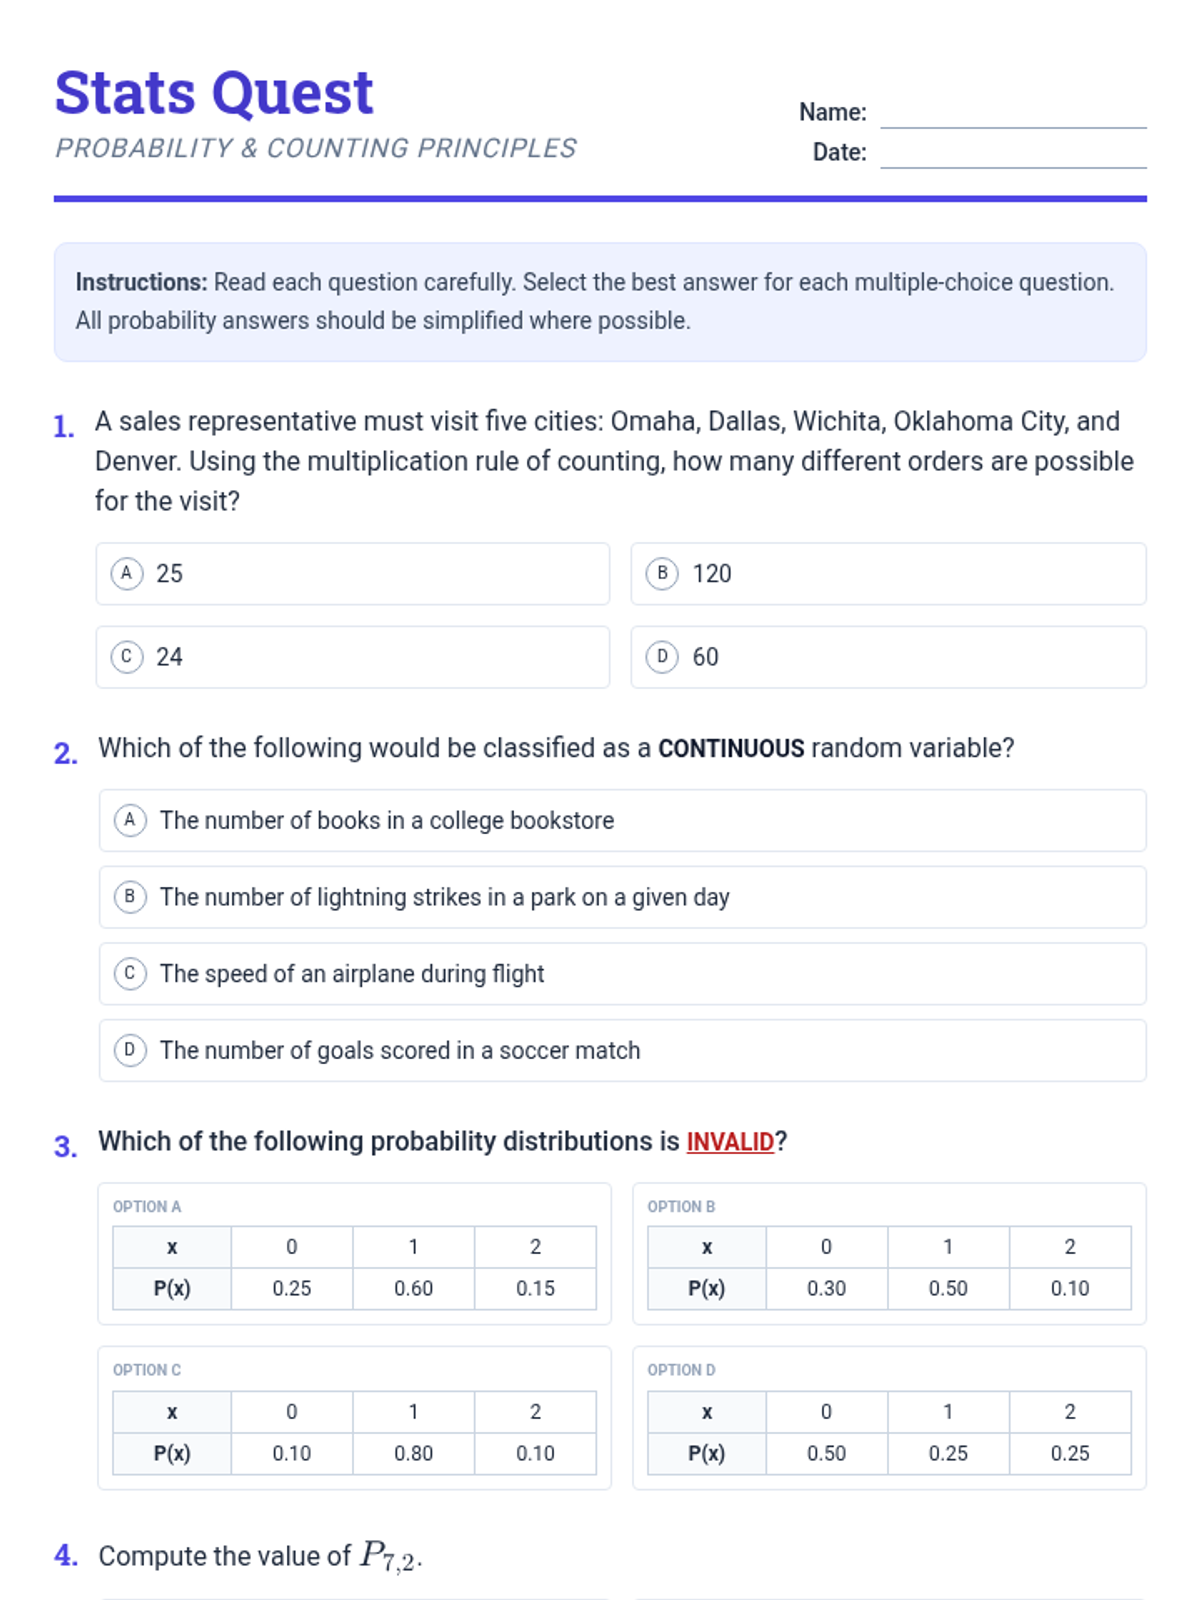
A 10-question multiple-choice quiz covering counting rules, permutations, combinations, and probability distributions. Revised for improved page breaks and math legibility. Tightened layout to fit on fewer pages.
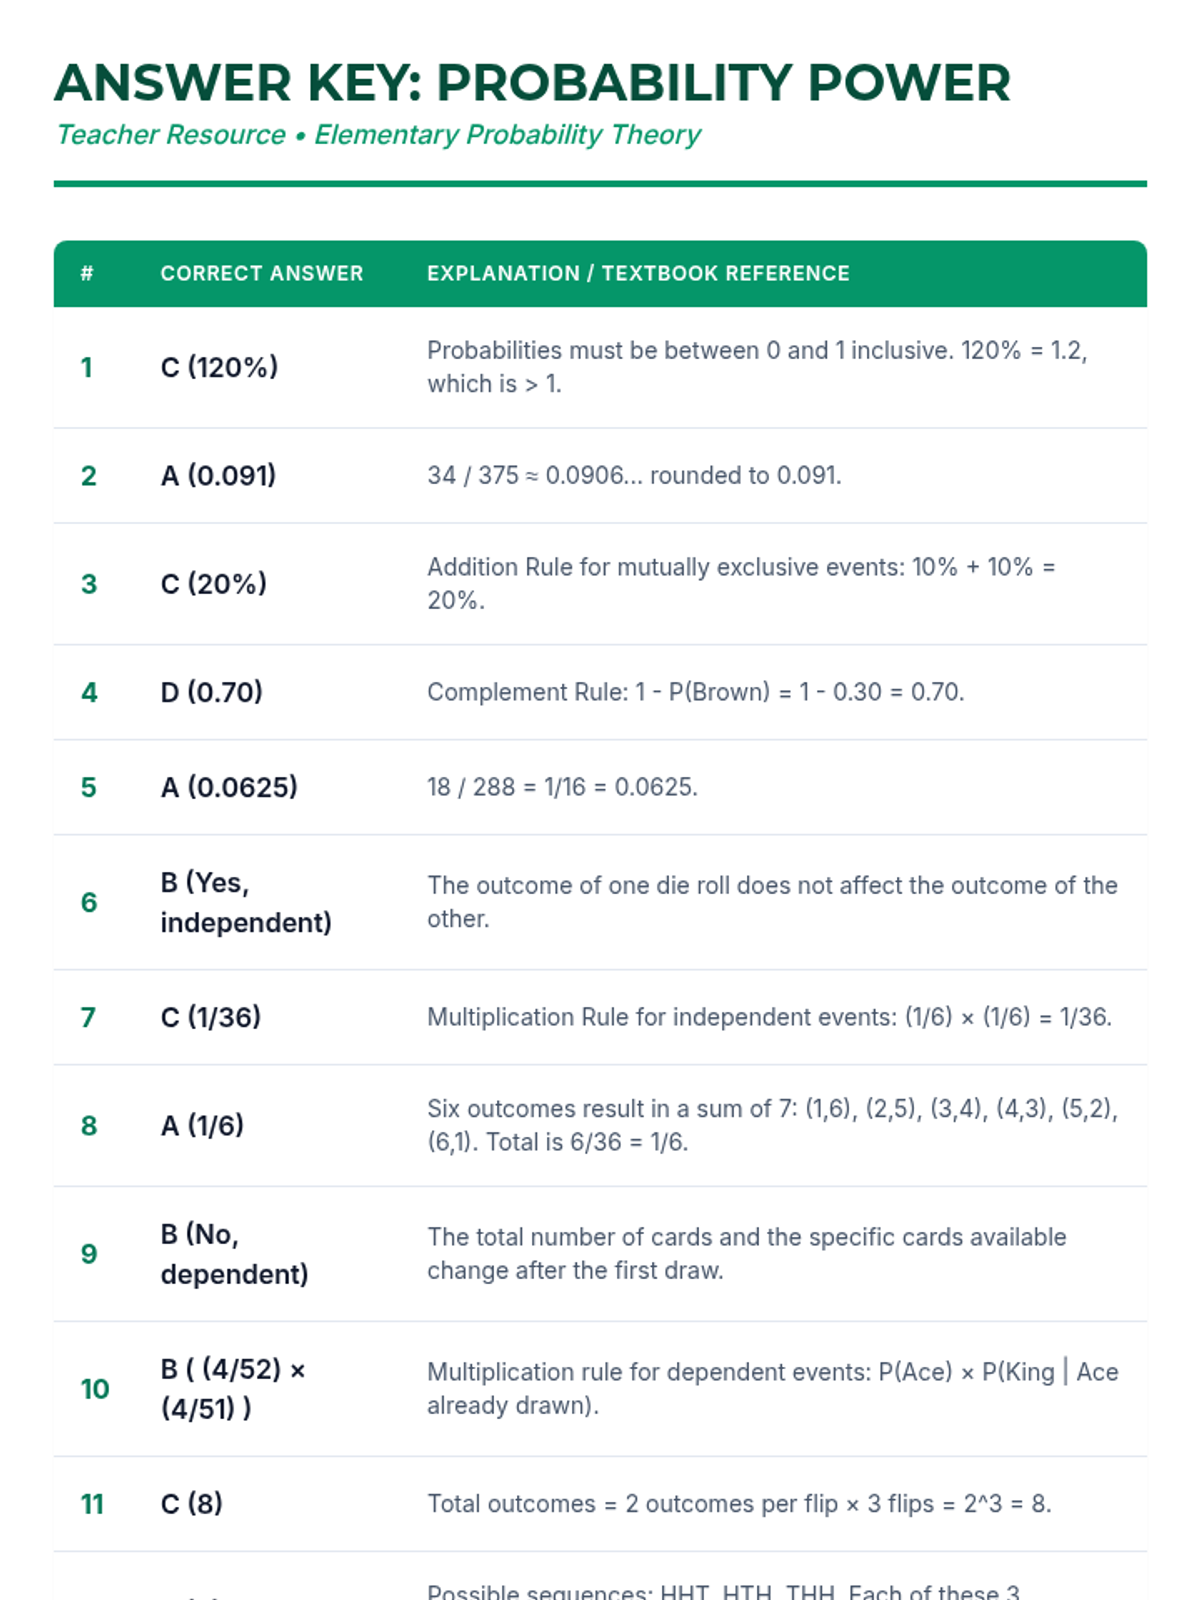
An answer key for the Probability Power Quiz, including detailed explanations and mathematical justifications for each of the 15 questions.
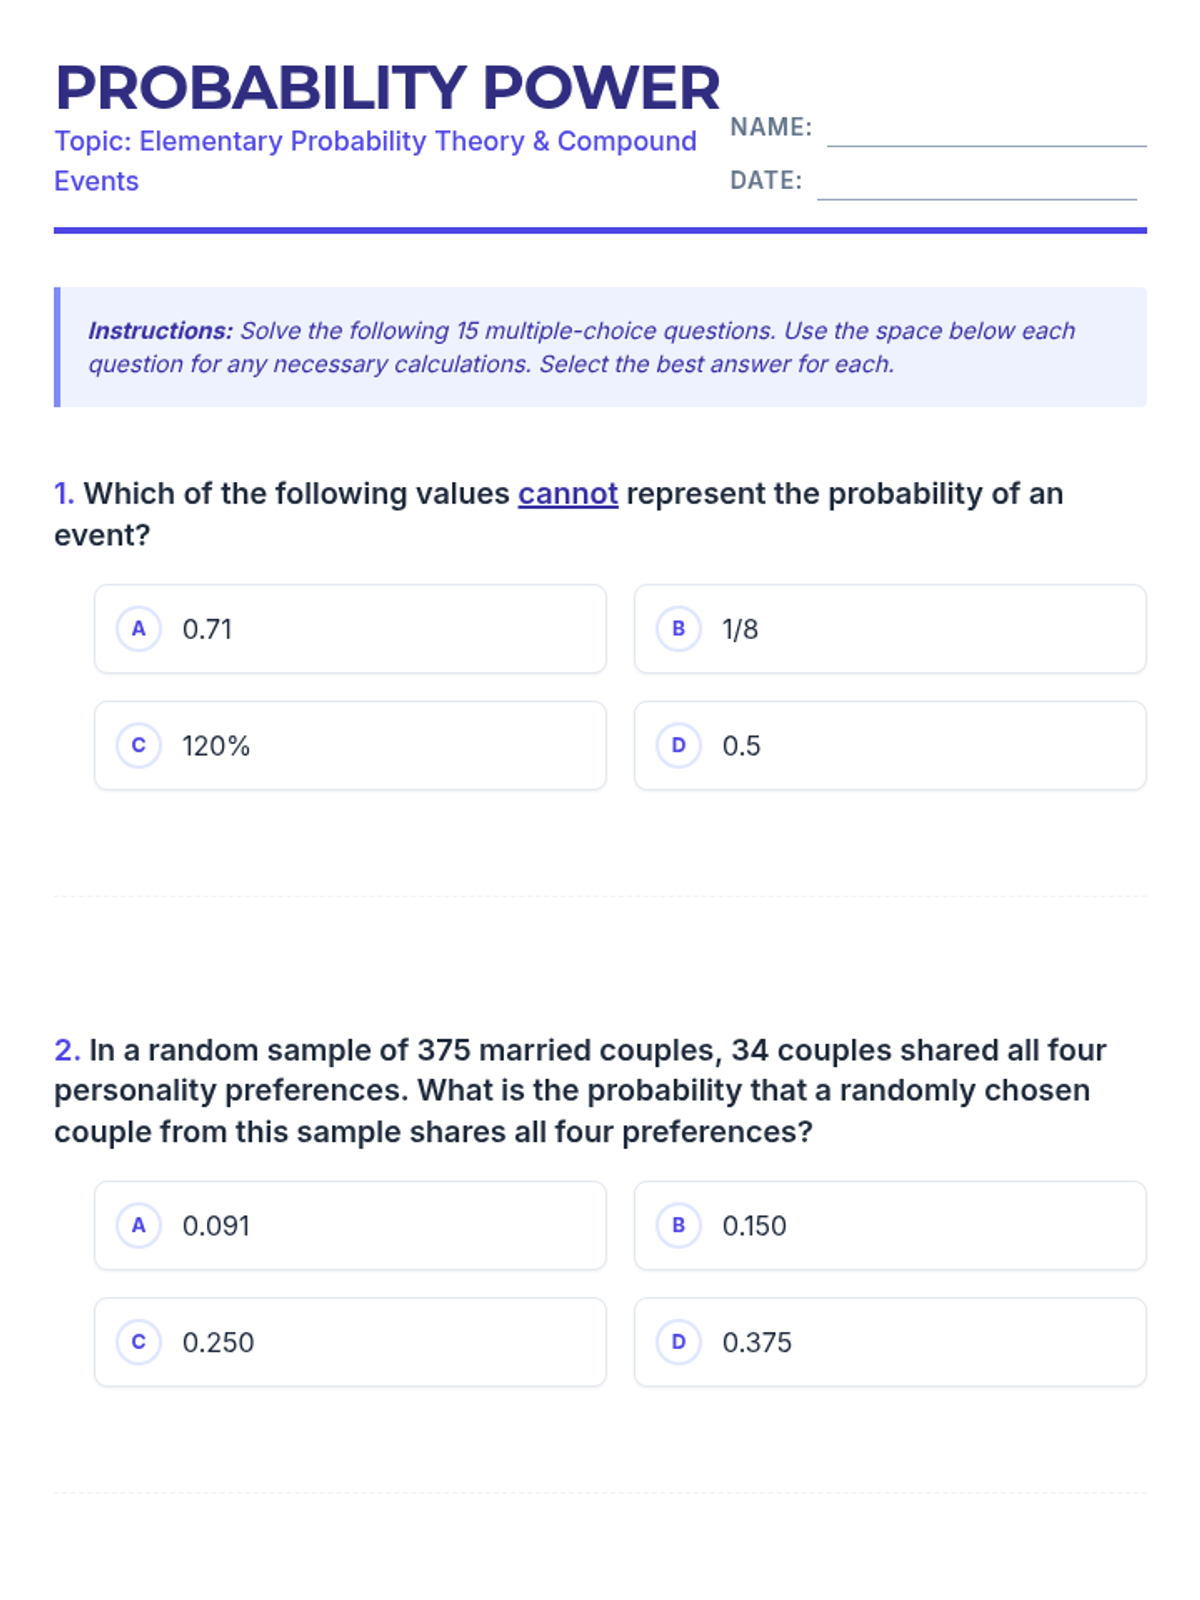
A 15-question multiple-choice worksheet on elementary probability theory. It covers concepts like valid probability ranges, compound events, and tree diagrams based on textbook problems. Includes designated scratch work areas.
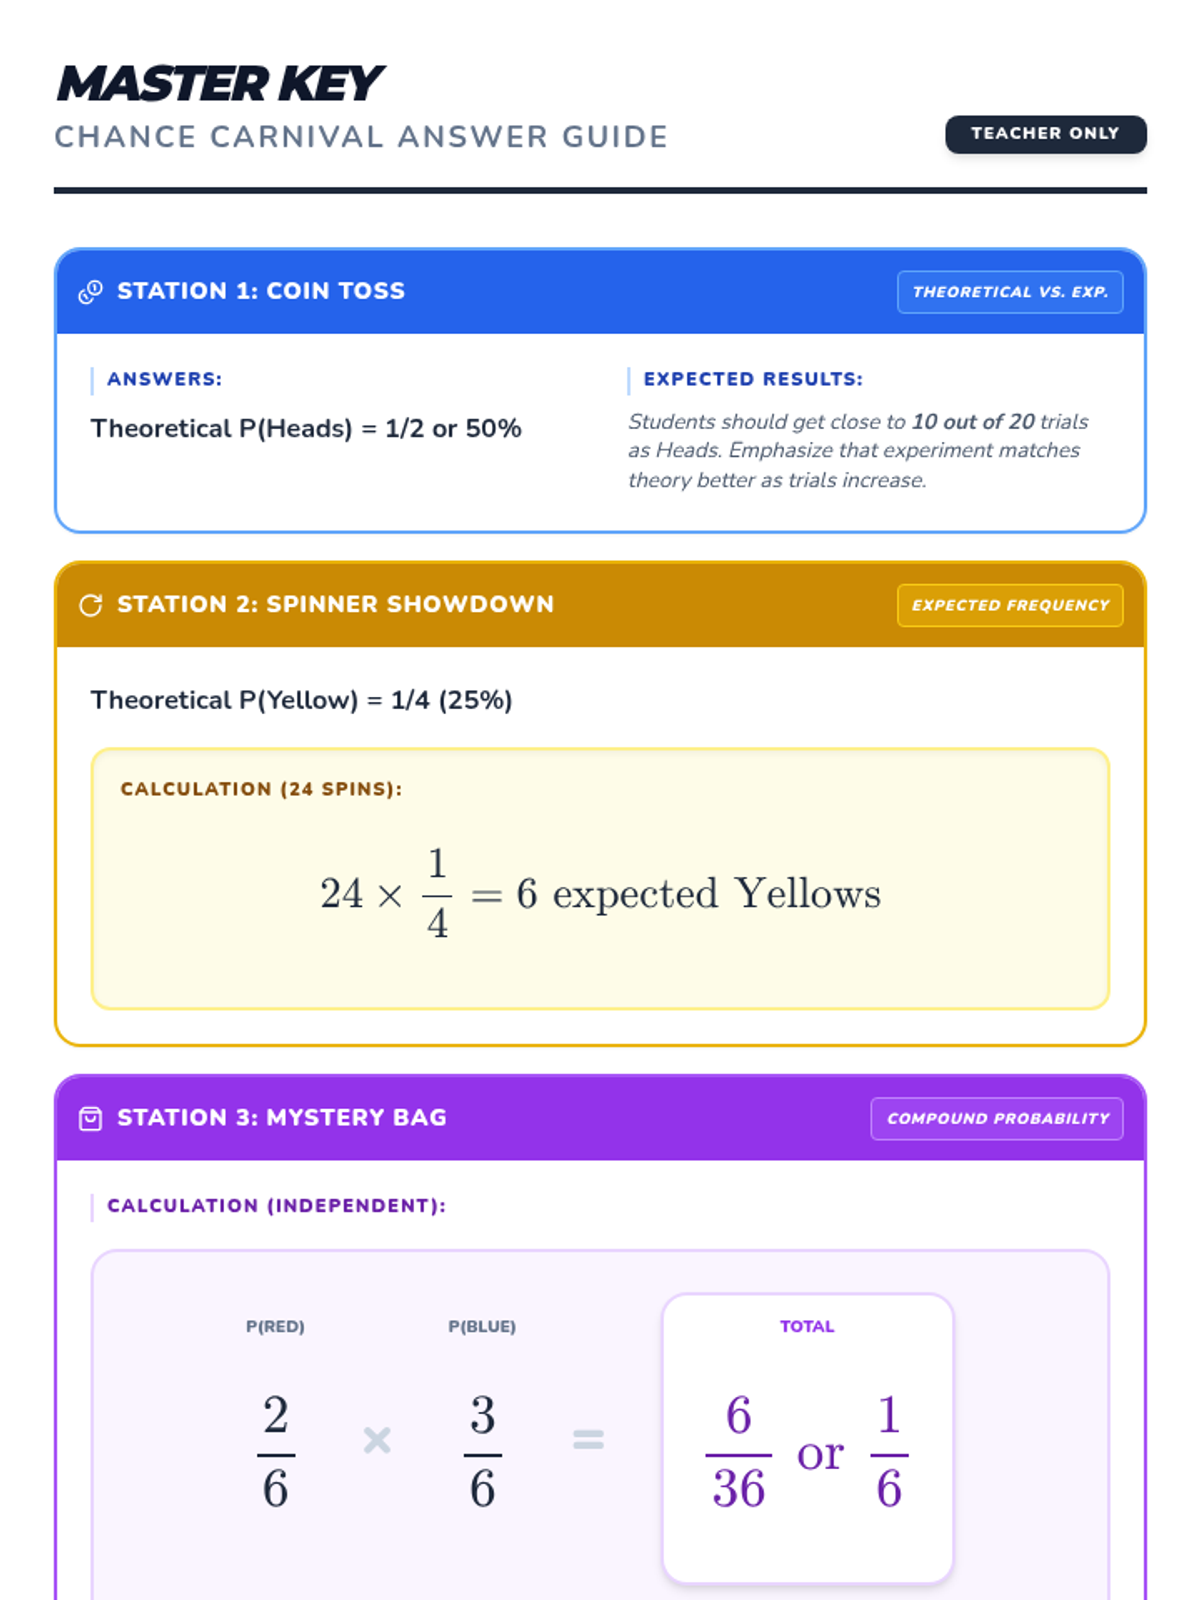
The answer key for the Chance Carnival lab, updated to reflect the change from marbles to colored blocks for Station 3. It provides theoretical probabilities, expected frequencies, and sample space breakdowns for teacher use.
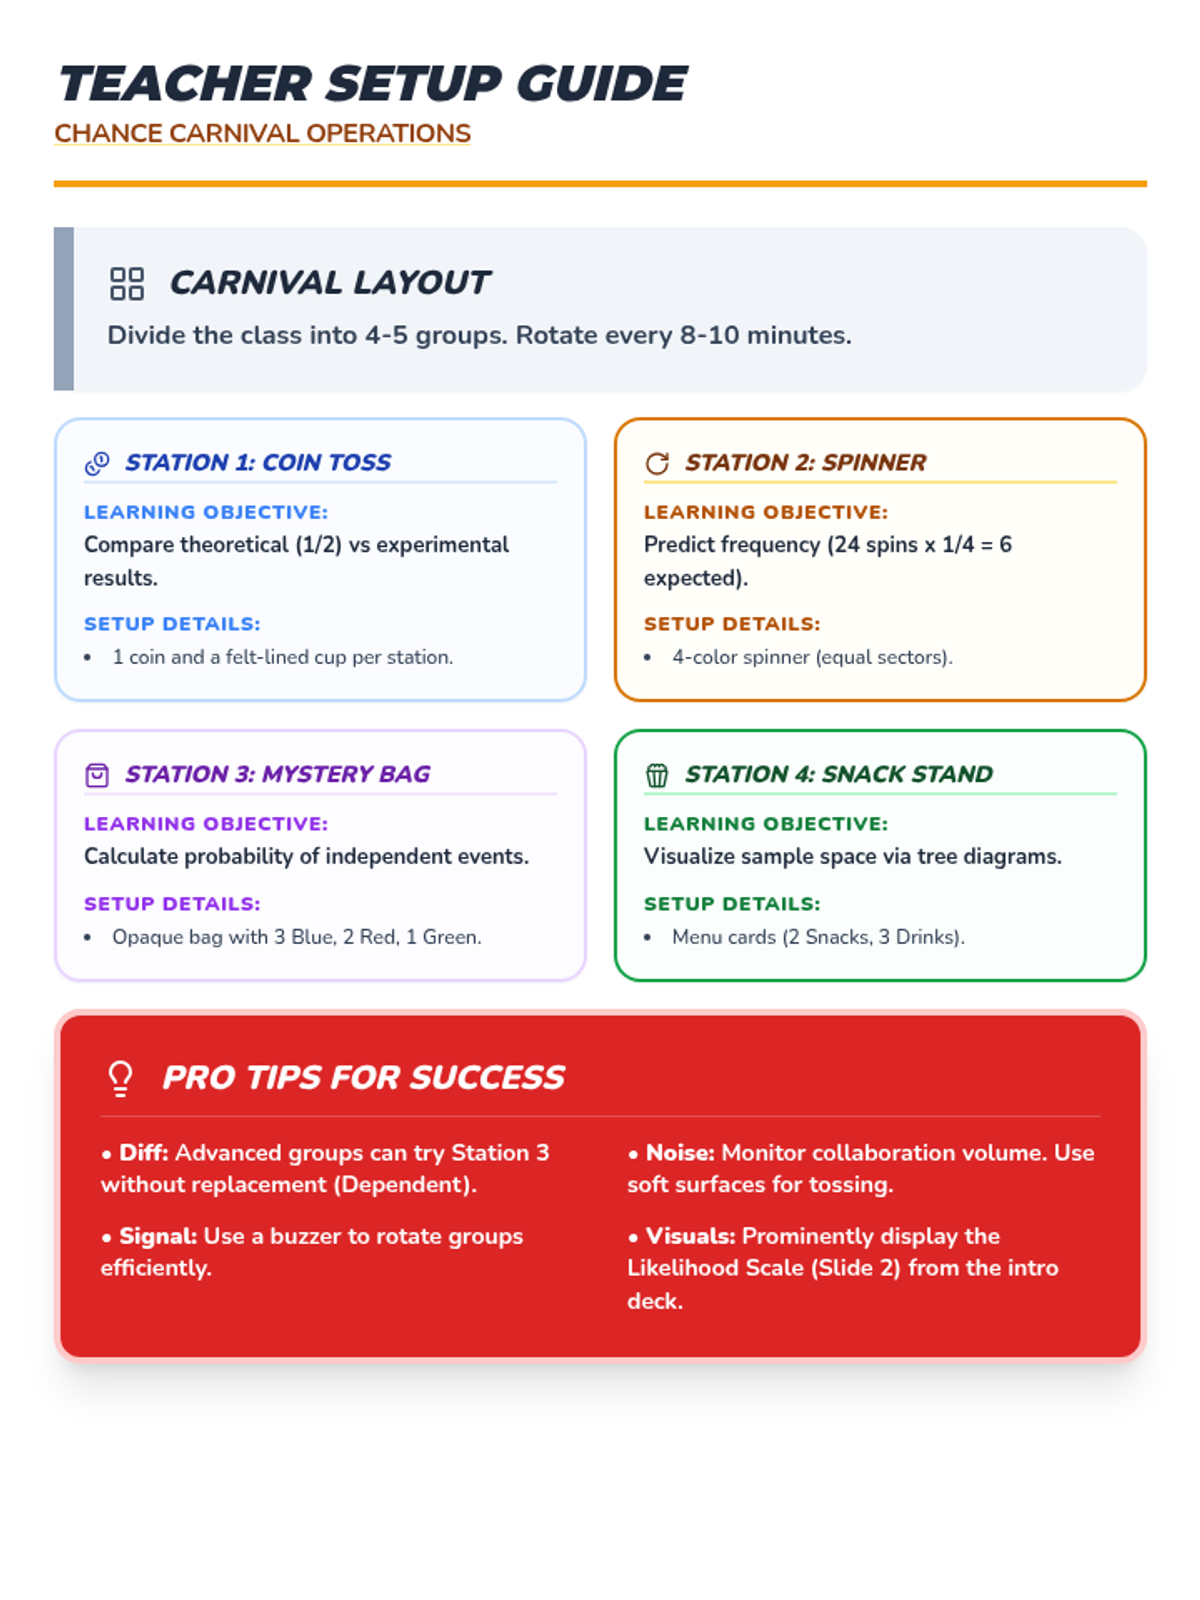
A comprehensive teacher resource providing instructions for setup, learning objectives, and facilitation tips for the probability rotation stations. Updated to reflect the change from marbles to colored blocks for Station 3.
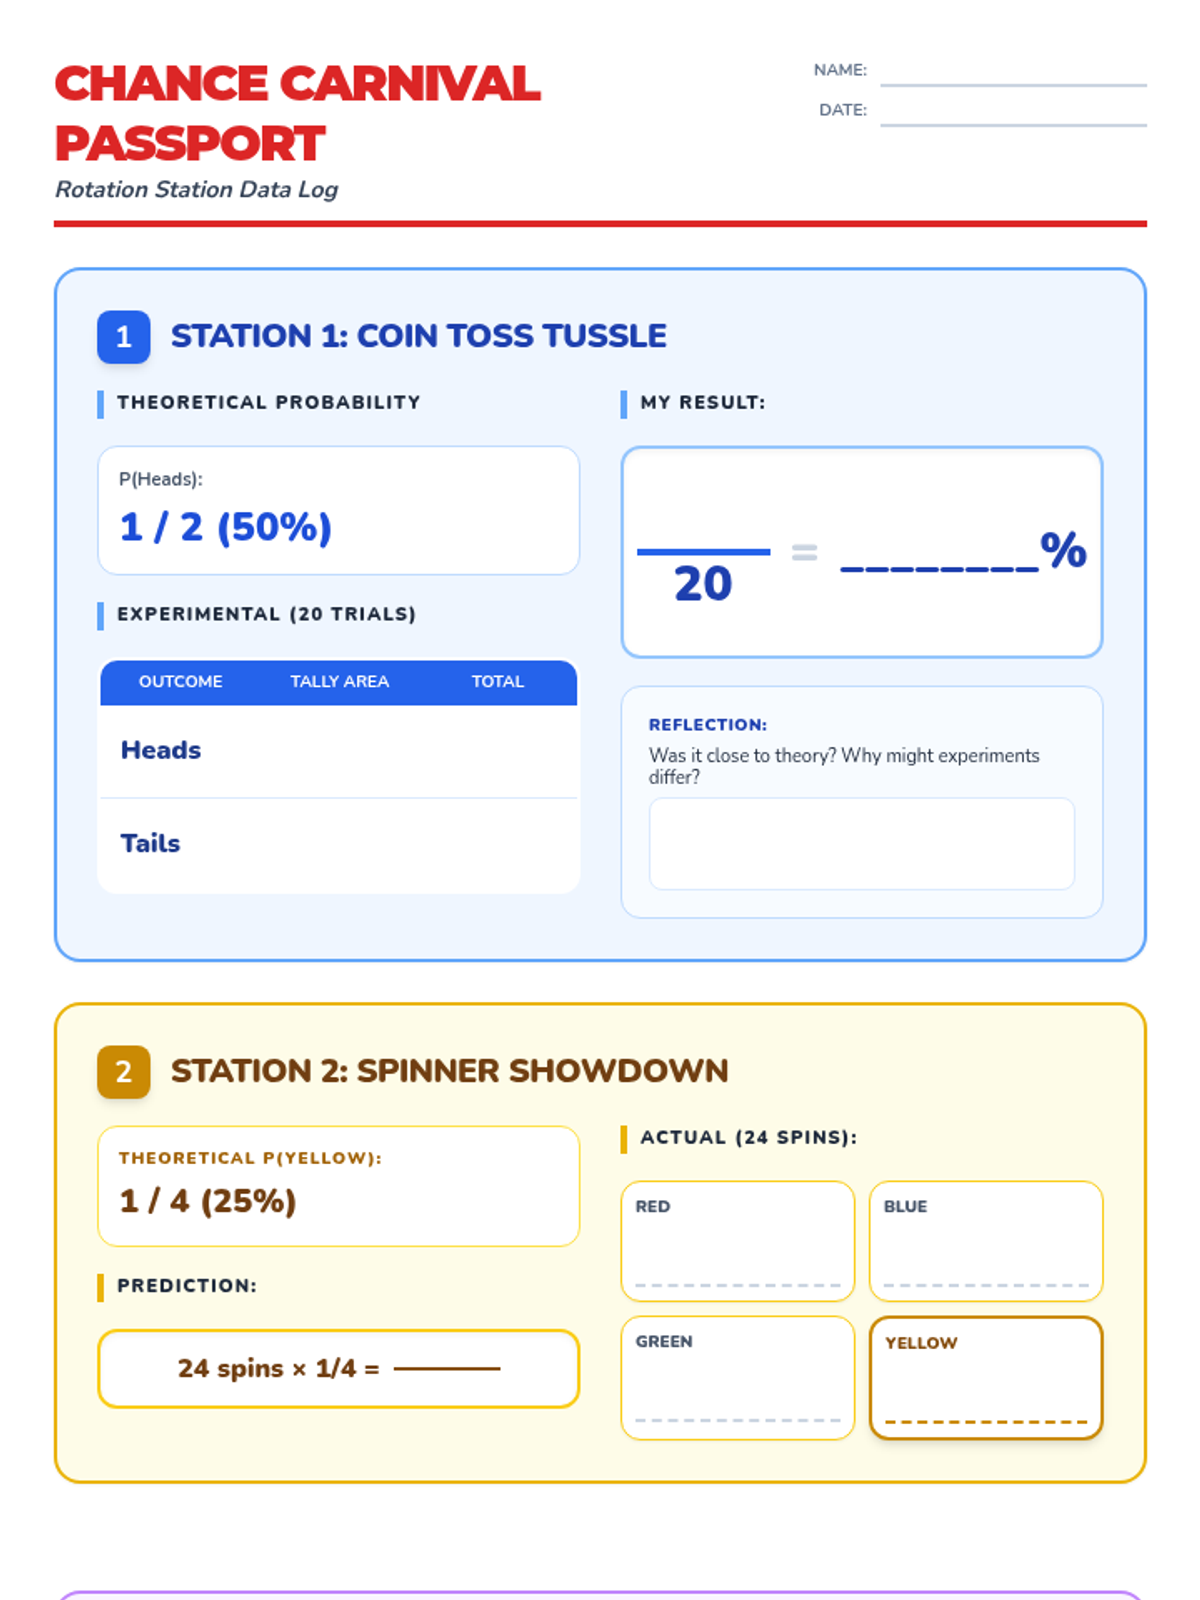
An updated student 'Passport' document where Station 2's tally area has been repurposed as a larger reflection space. Station 4 remains a challenge with no spoilers on outcomes, and Station 3 uses colored blocks with a visual guide. Refined layouts ensure maximum workspace and legibility for all probability rotations.
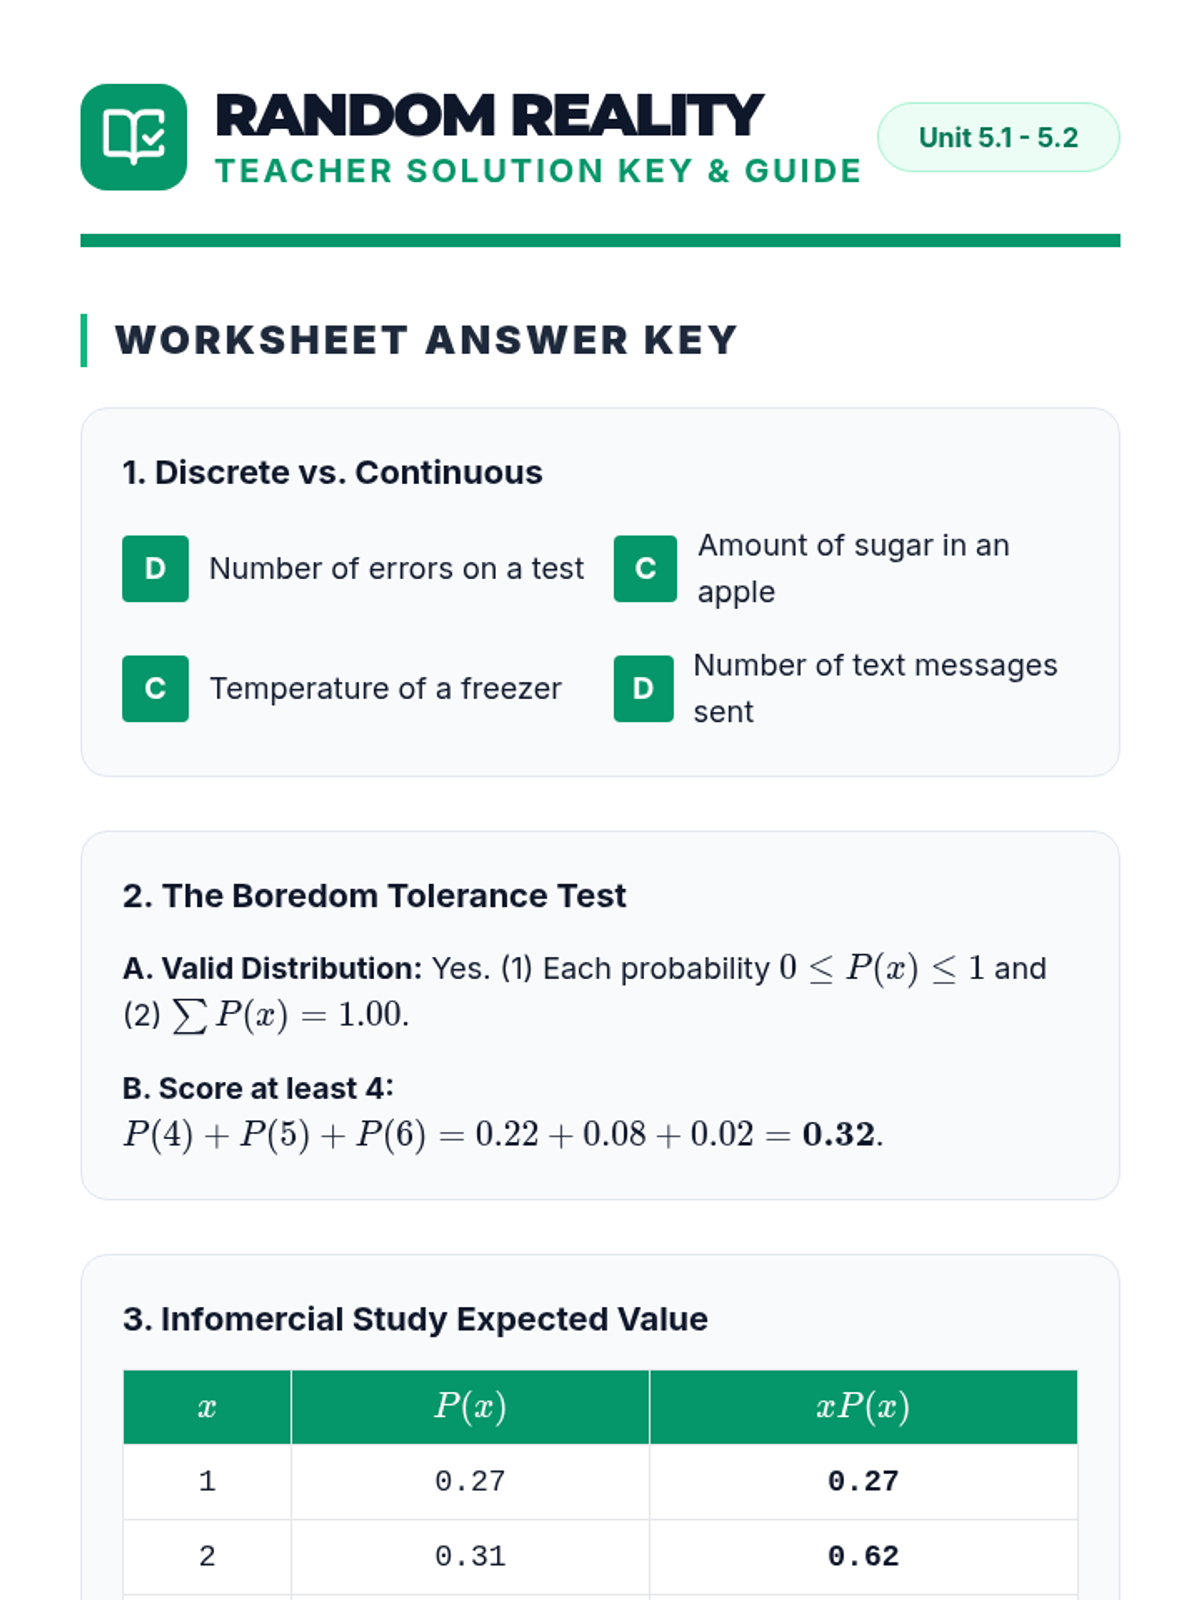
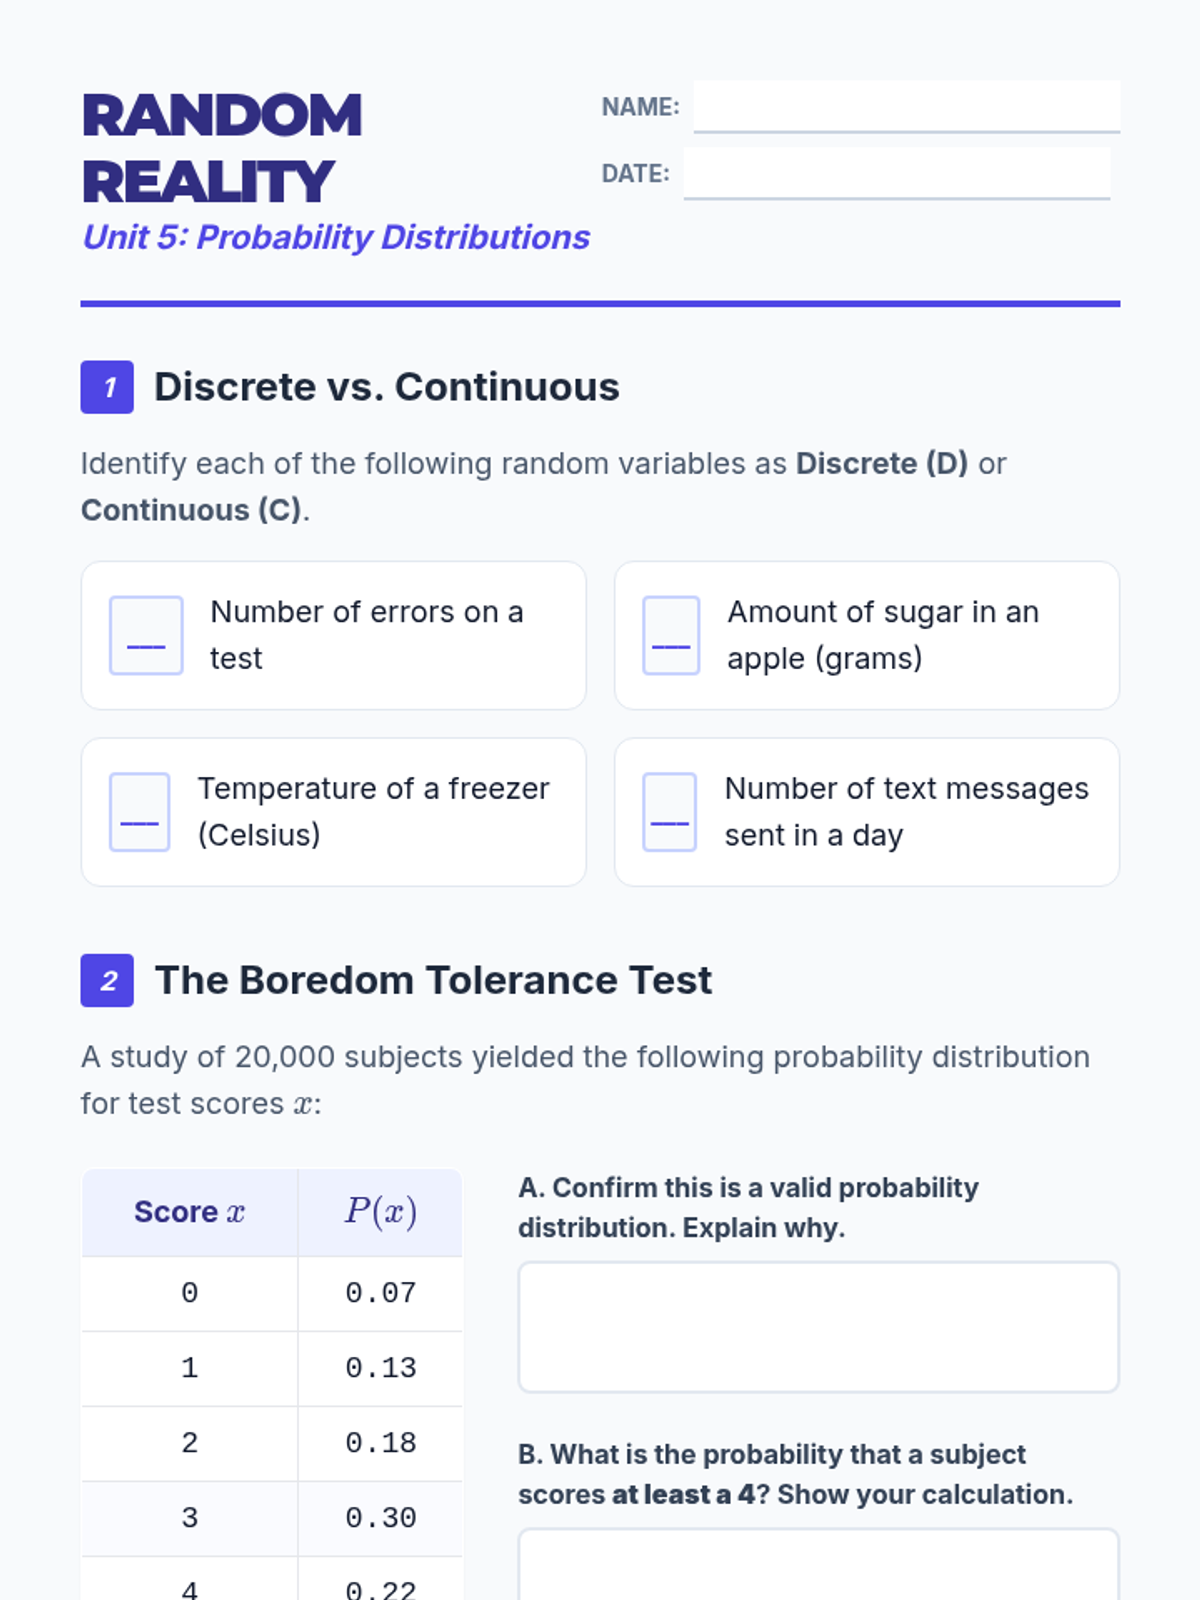
A comprehensive teacher's guide containing the answer key for the Random Reality Worksheet, along with teaching tips, common misconceptions, and pacing suggestions.
A student worksheet for practicing classification of random variables, verifying probability distributions, and calculating expected value using real-world case studies.
A comprehensive and visually engaging presentation covering random variables, probability distributions, histograms, and statistical calculations.
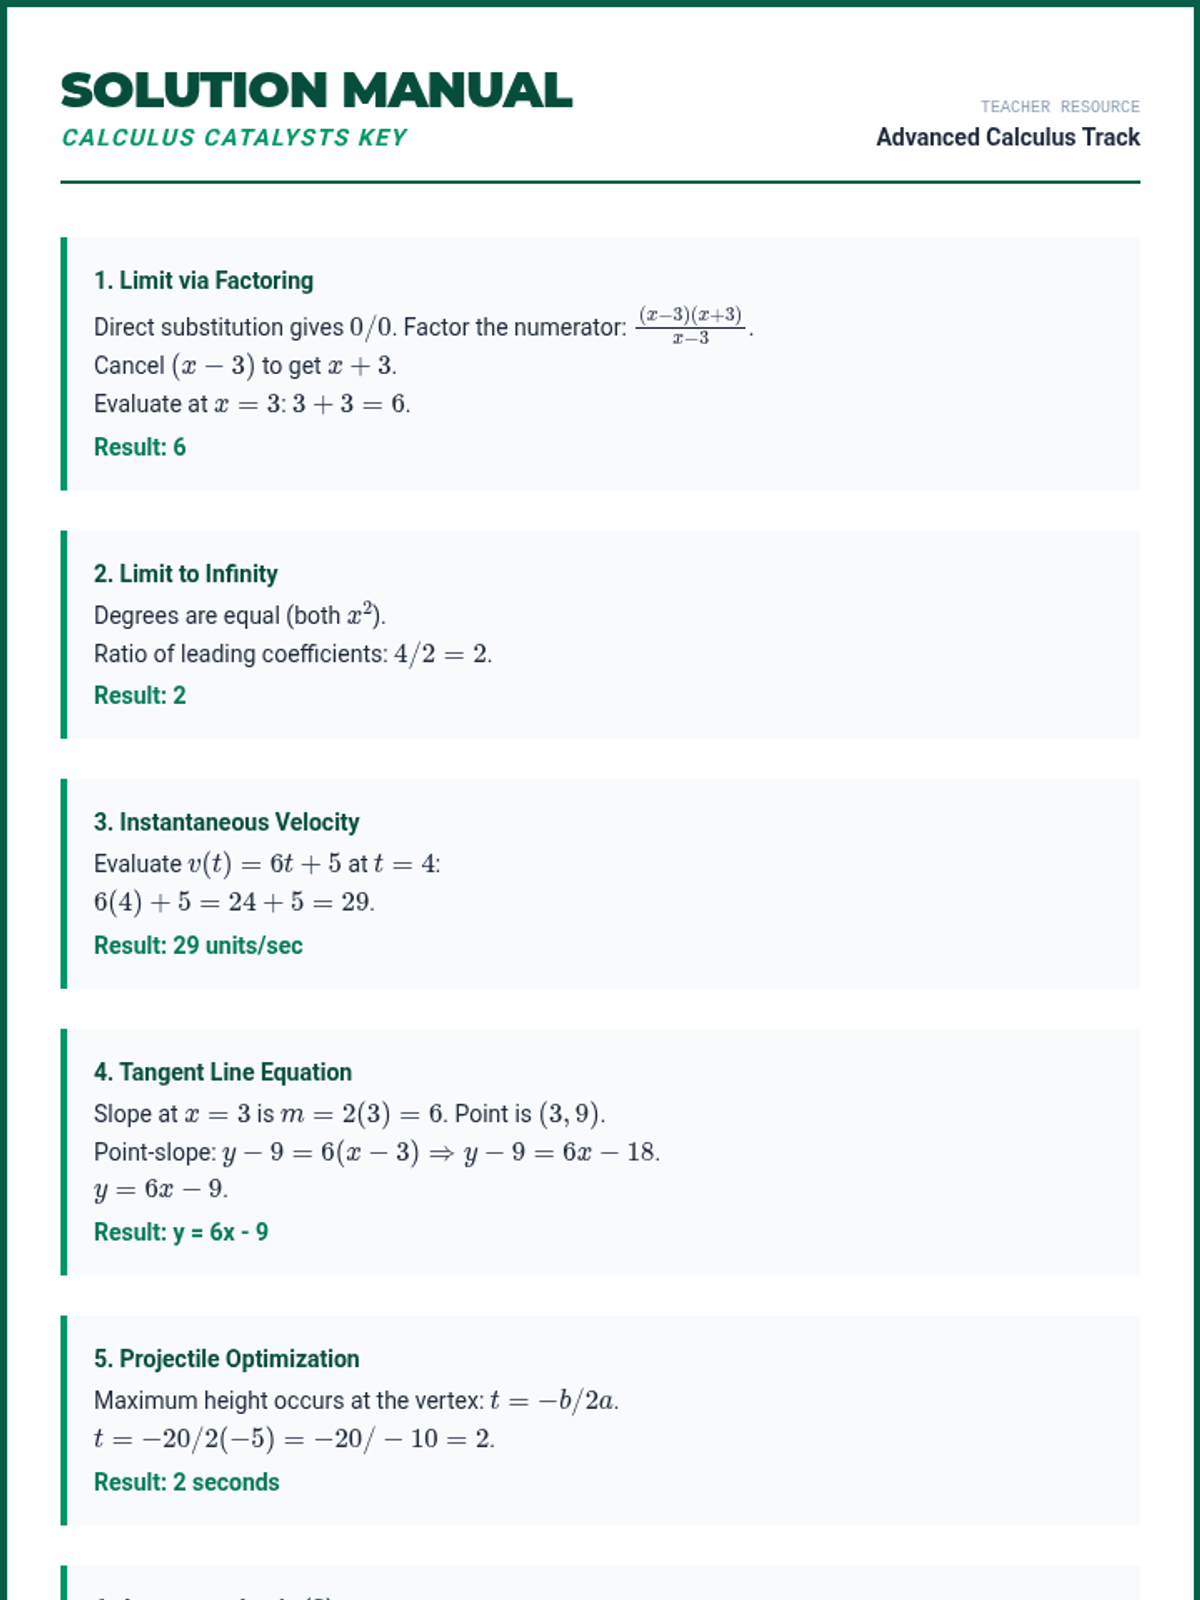
The detailed answer key for the Calculus Catalysts Workout, providing step-by-step solutions for limits, instantaneous rate of change, and basic function optimization problems.
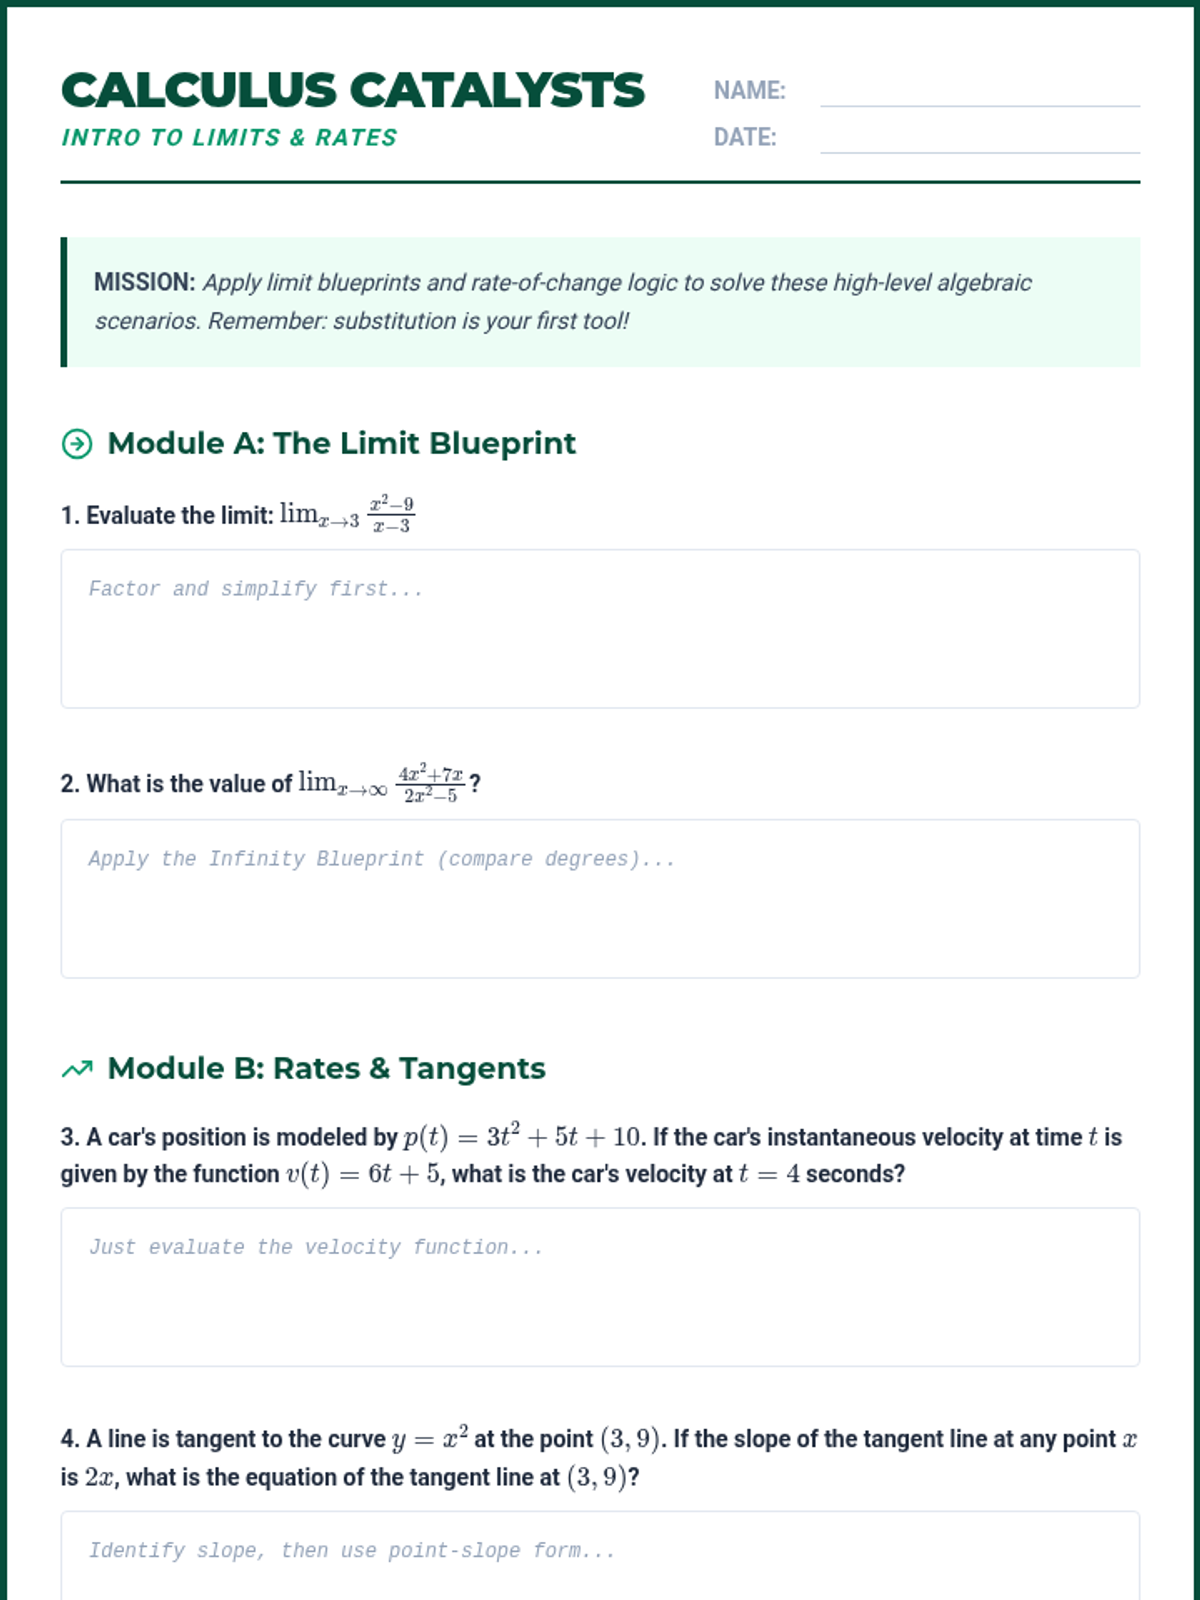
A student practice worksheet for calculus-adjacent ACT concepts, featuring limits, instantaneous rate of change logic, and function optimization problems.
A visual slide deck explaining introductory calculus concepts for the ACT, including limits, instantaneous rate of change, and basic function optimization using standard blueprints. Revised for font size compliance (min 24px).
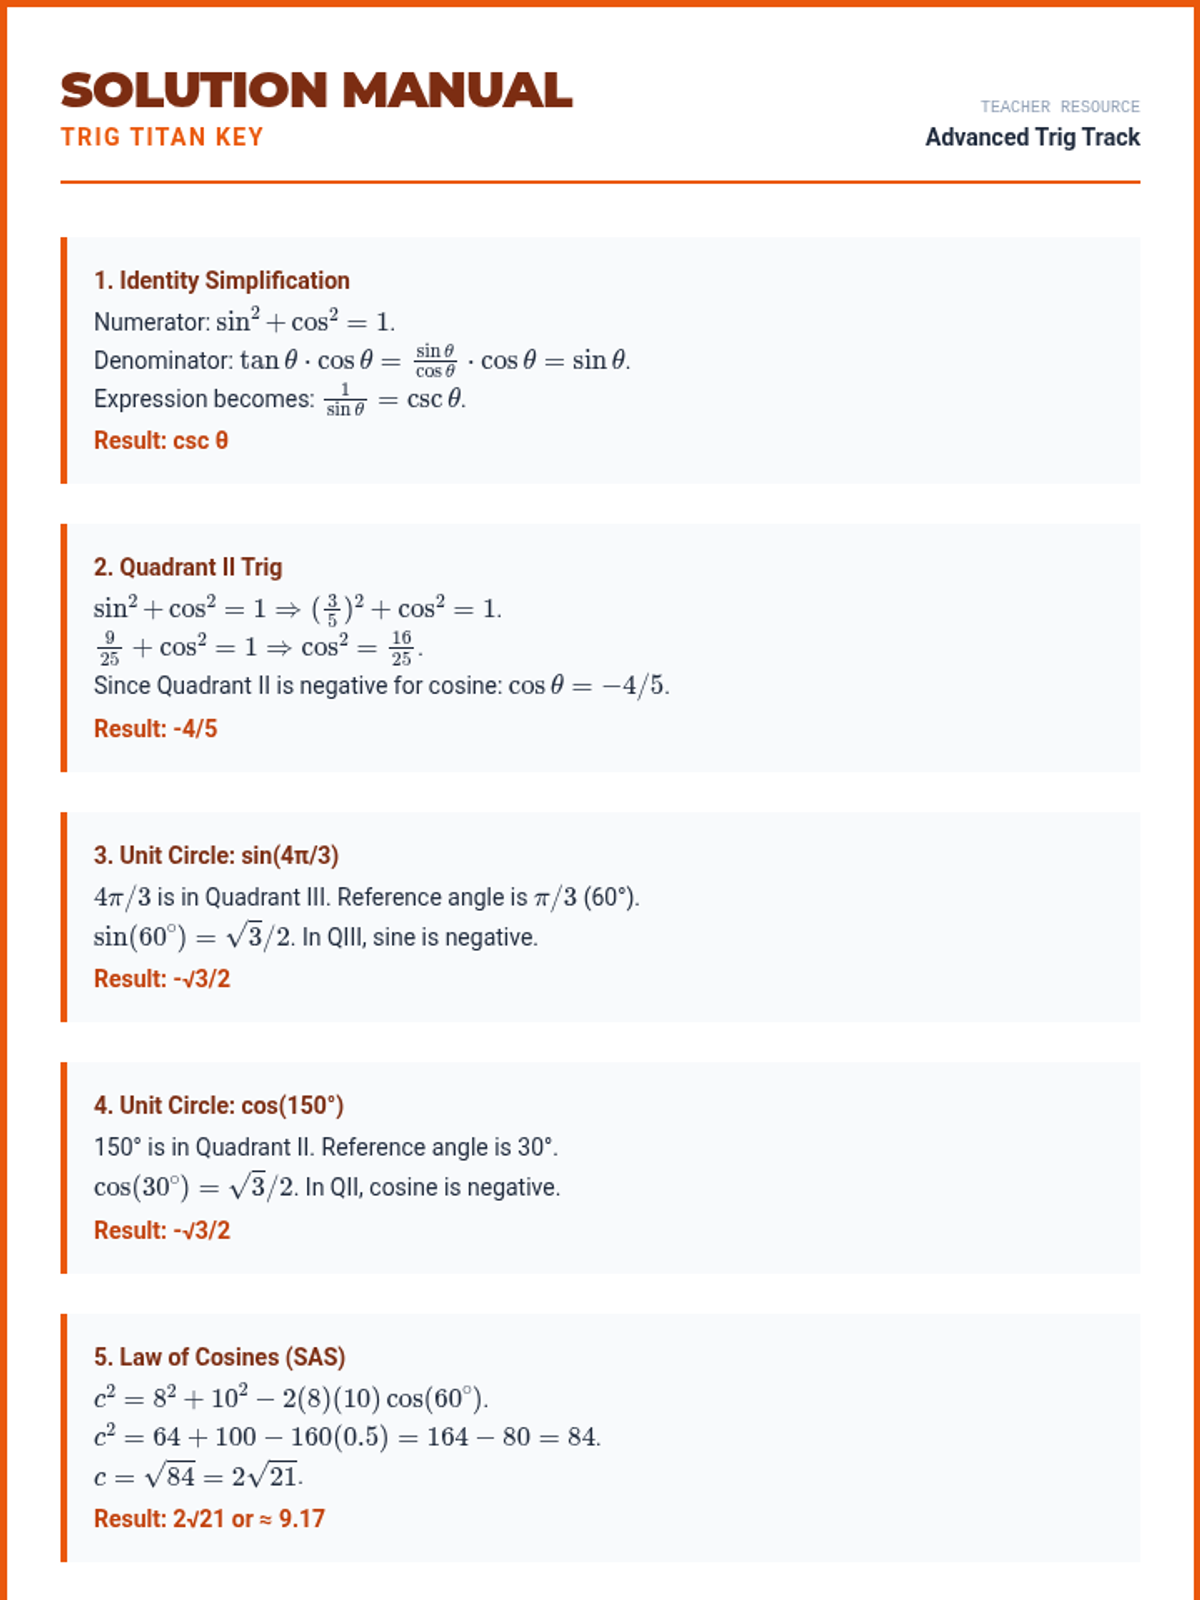
The detailed answer key for the Trig Titan Workout, including step-by-step solutions for identities, the unit circle, and non-right triangle problems.
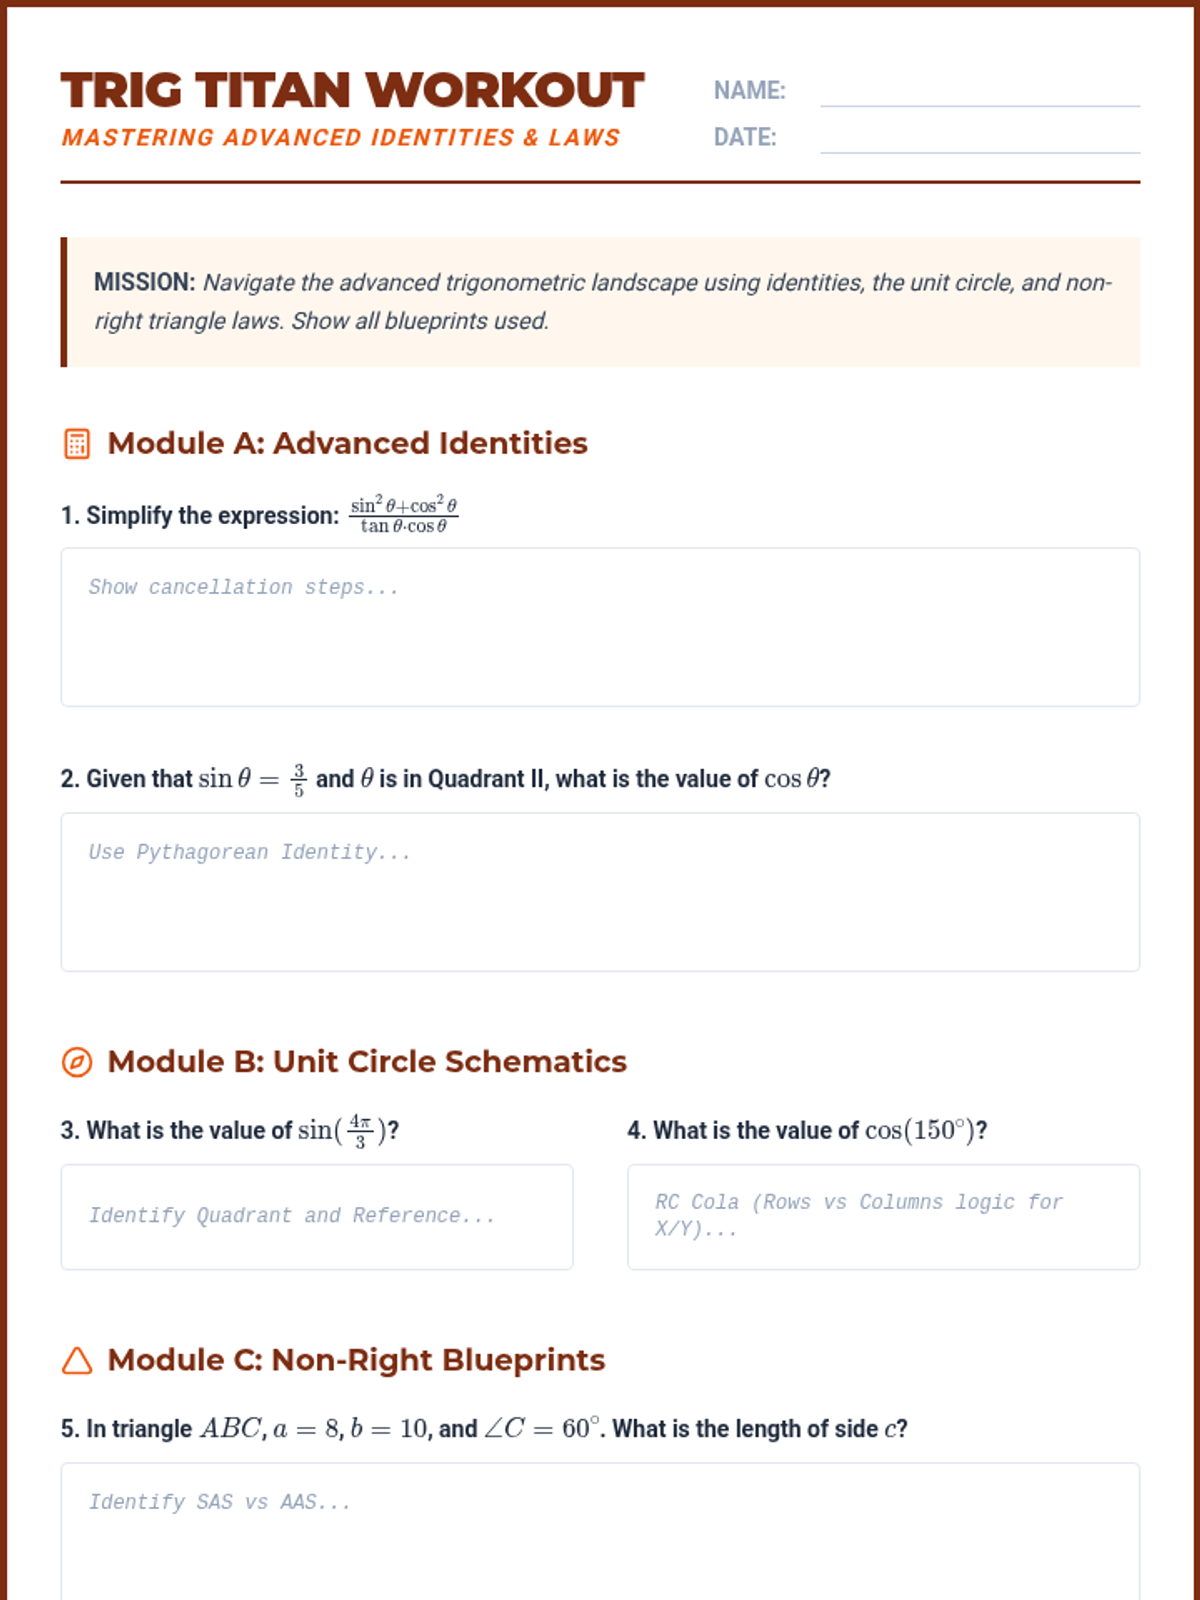
A comprehensive practice worksheet for advanced ACT trigonometry, featuring sections on identities, the unit circle, Law of Sines/Cosines, and 'Final Ten' challenge problems.
A visual slide deck covering advanced ACT trigonometry: Pythagorean identities, the unit circle, Law of Sines/Cosines, and the ambiguous SSA case. Revised for font size compliance (min 24px).
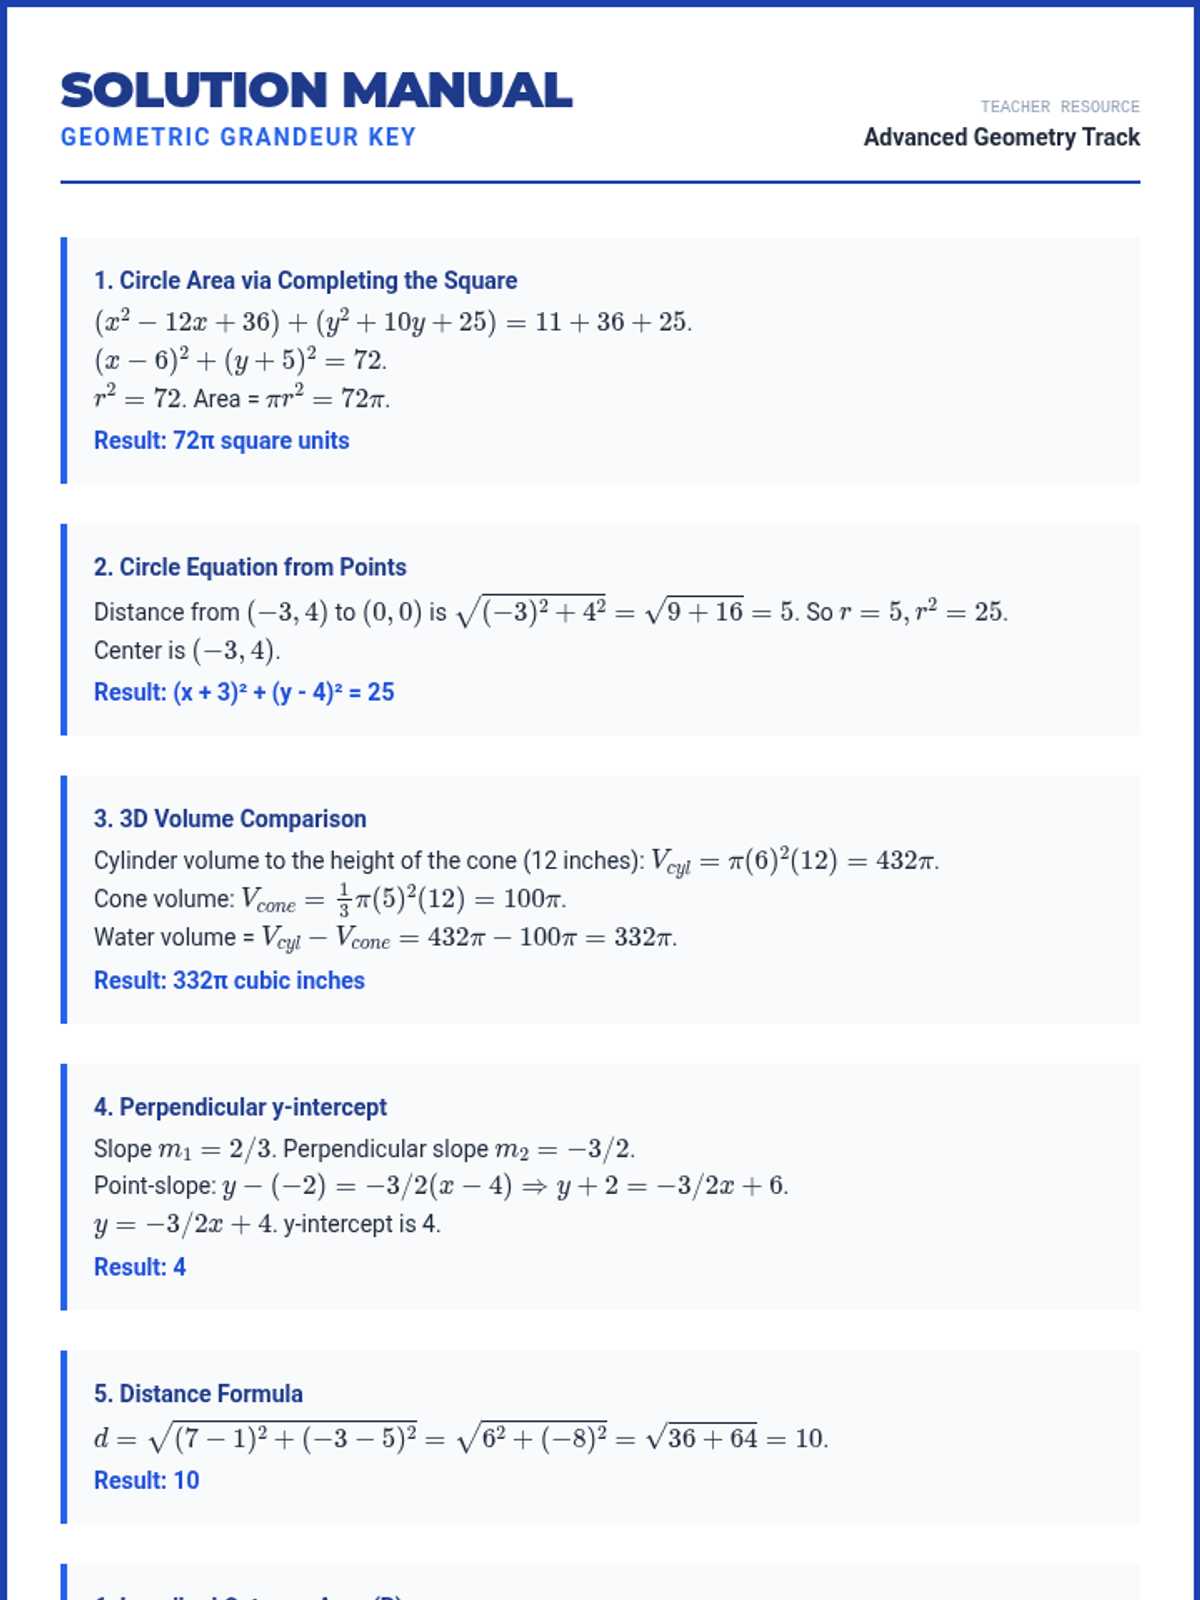
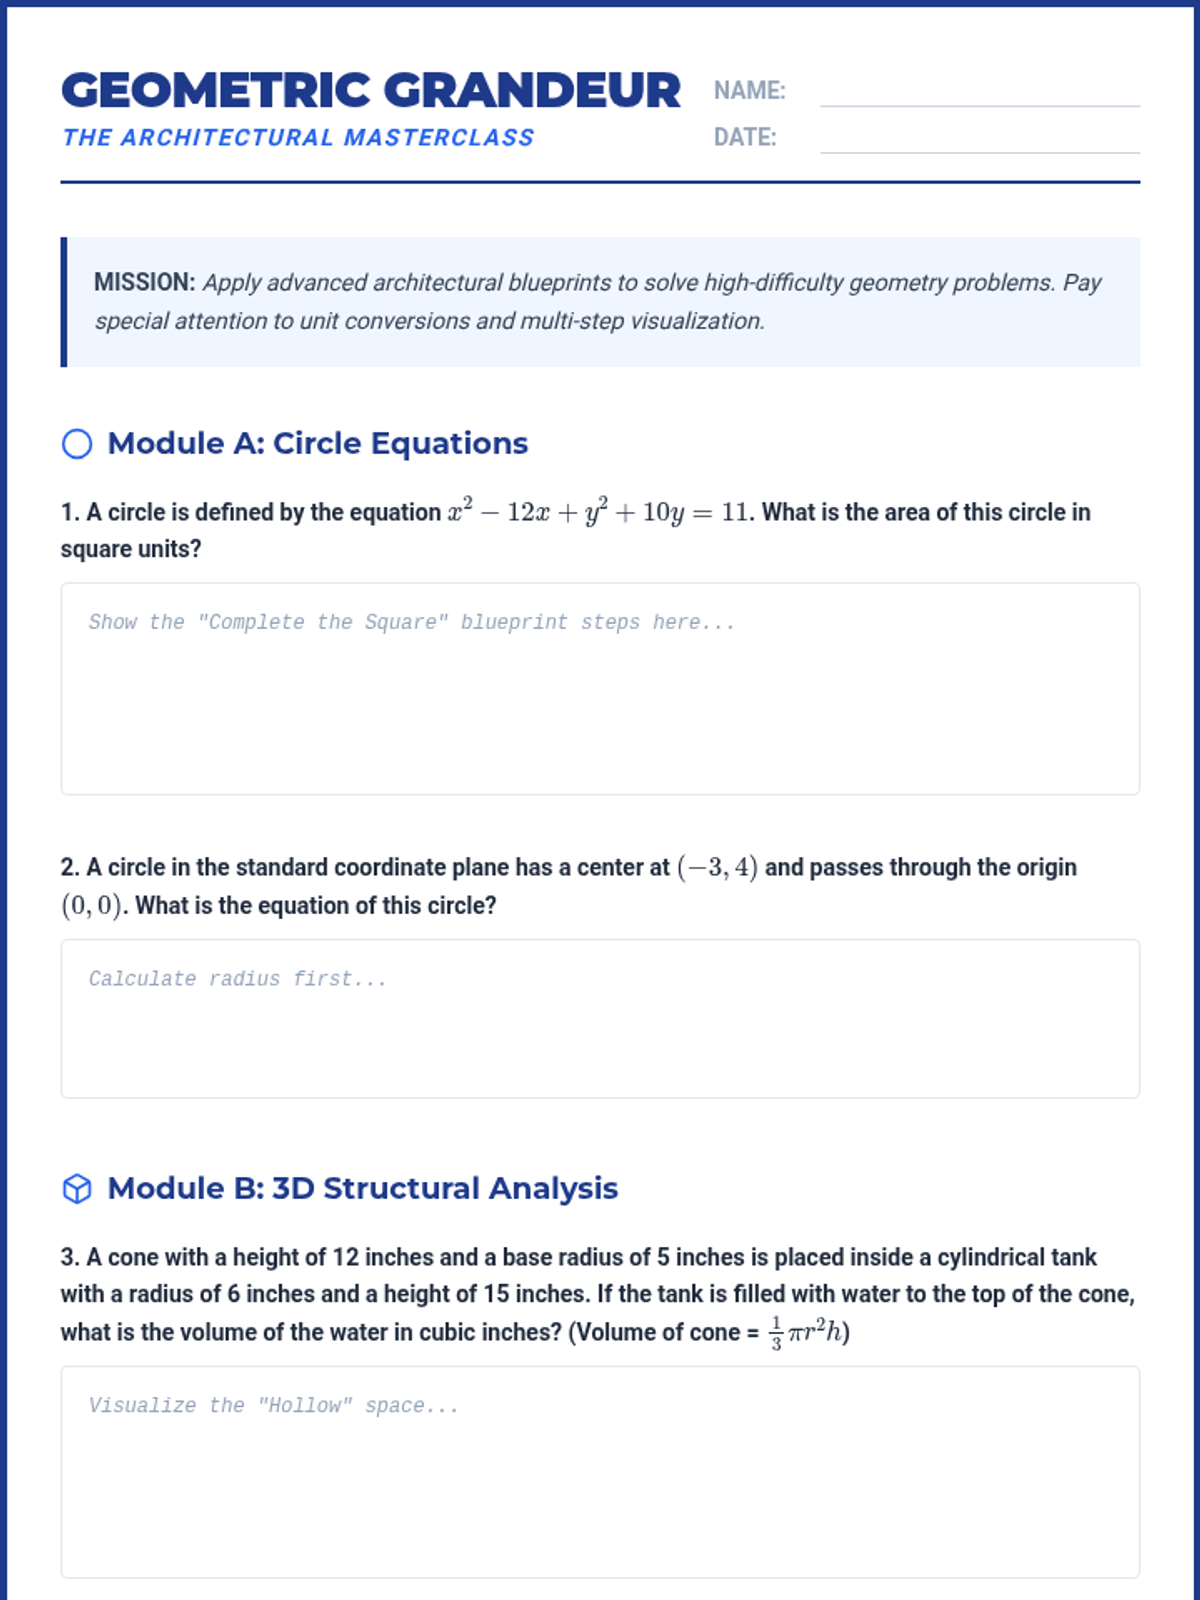
The detailed answer key for the Geometric Grandeur Workout, providing step-by-step solutions for circle equations, 3D volume, and coordinate geometry problems.
A specialized geometry workout featuring problems on circle equations, 3D volume visualization, and coordinate geometry, including advanced 'Final Ten' style challenges like inscribed octagons and 3D coordinate spheres.
A visual slide deck covering advanced ACT geometry topics: circle equations, 3D structural formulas, and coordinate geometry strategies. Revised for clarity and font size compliance.
A comprehensive 12-slide masterclass deck covering all 10 advanced subjects tested in the diagnostic quiz, including matrices, complex numbers, trig periods, circle equations, expected value, logs, remainder theorem, counting logic, vectors, and trig identities. Revised for font size compliance (min 24px).
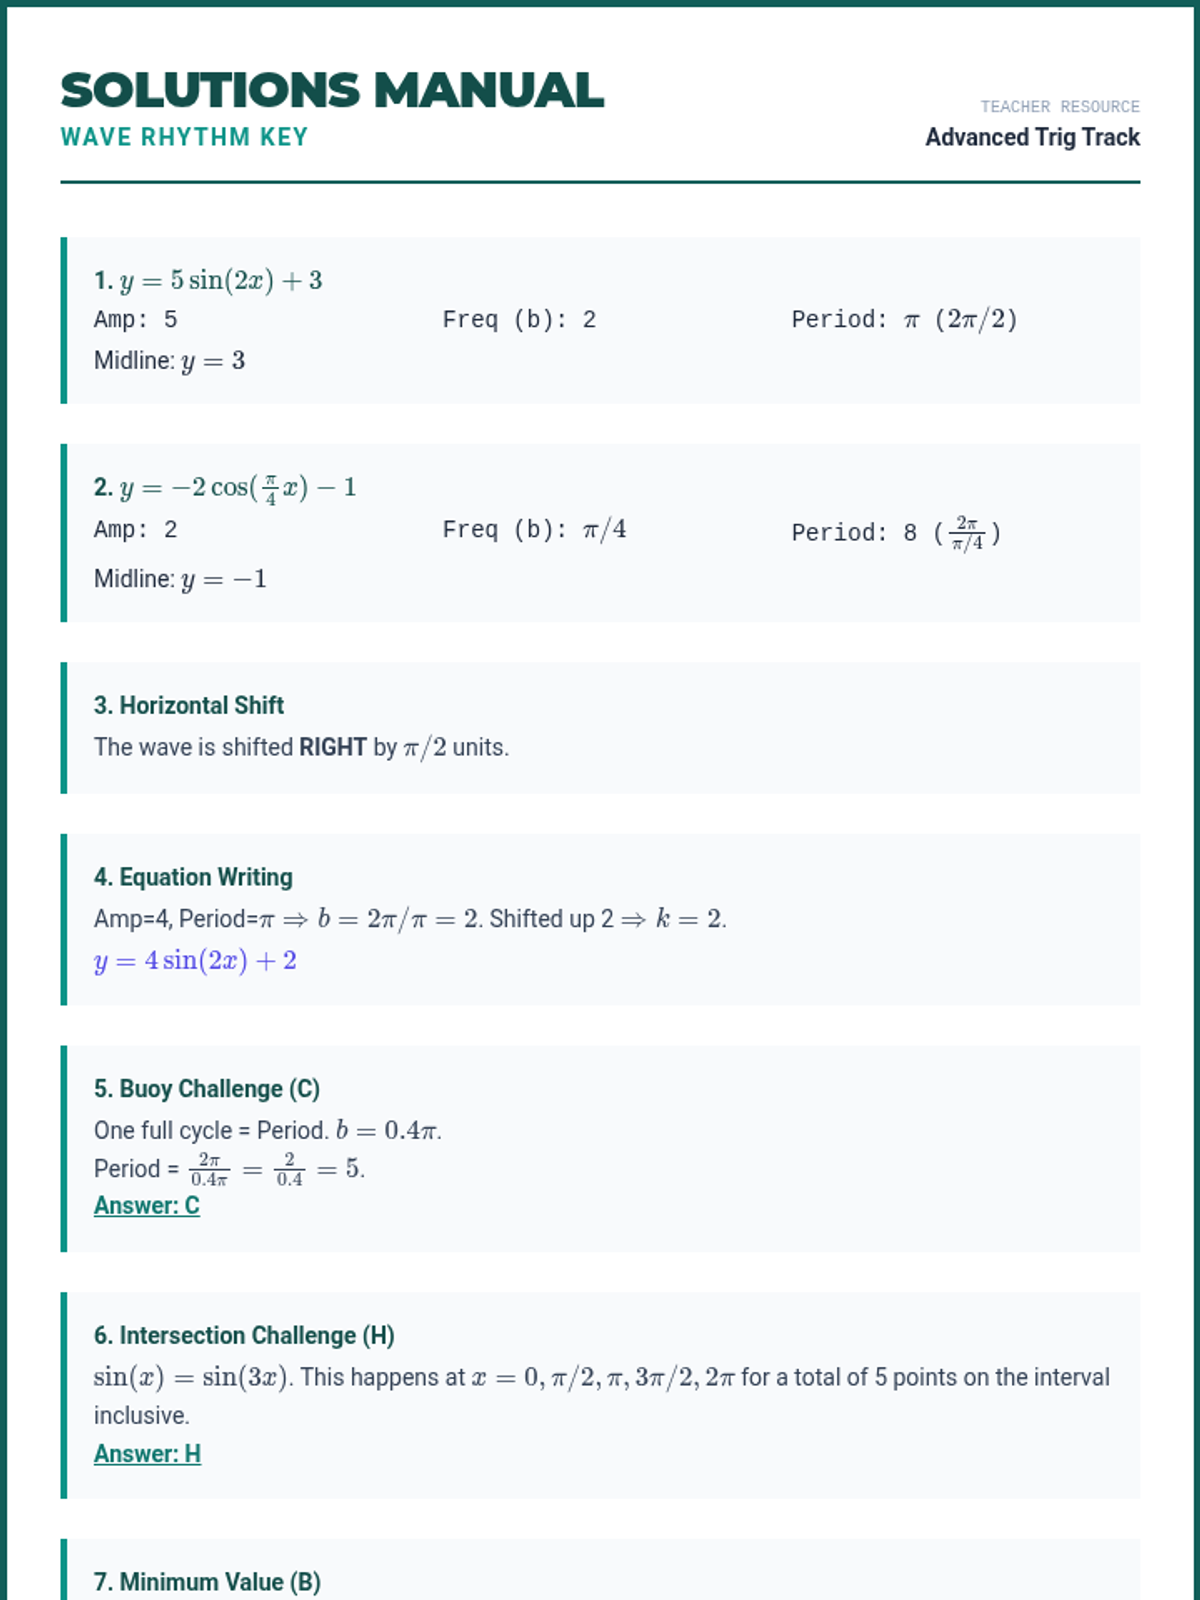
The detailed answer key for the Wave Rhythm Workout, featuring full step-by-step solutions and teacher insights for period, frequency, and wave modeling problems.
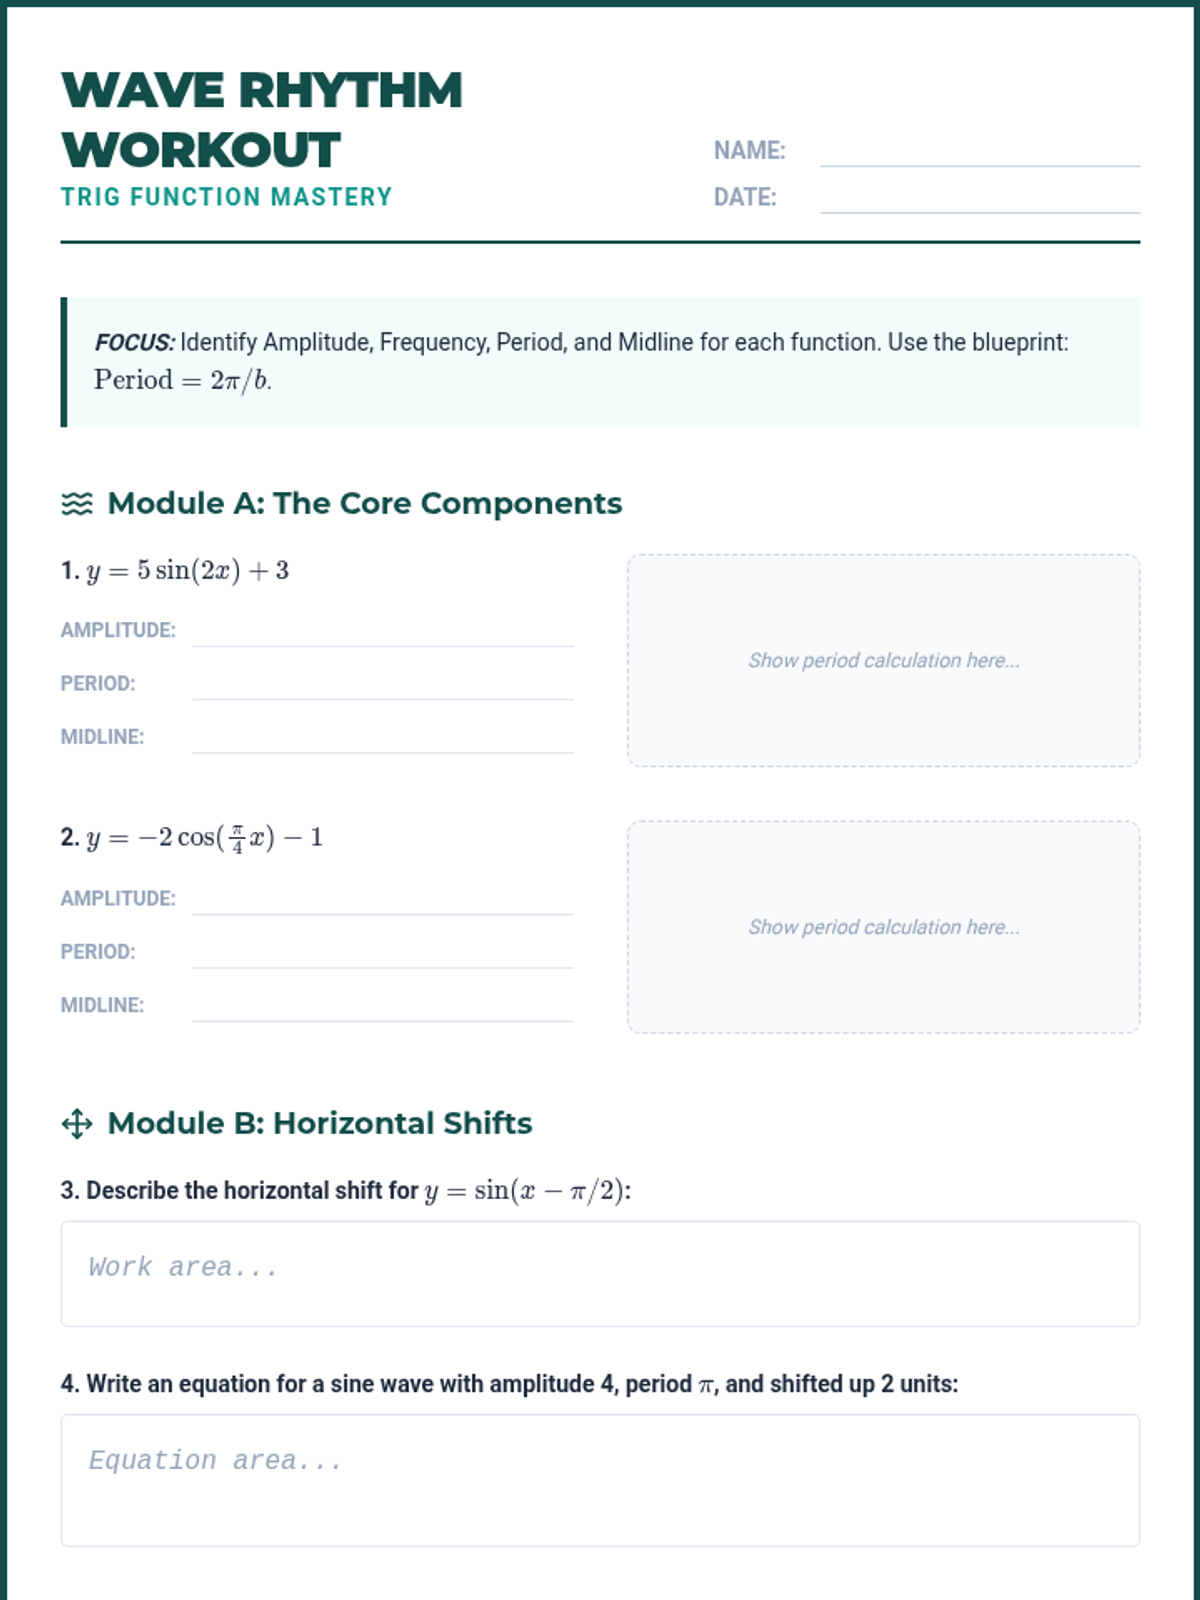
A specialized student worksheet focusing on trigonometric period, frequency, and wave components, featuring both basic identification and complex 'Final Ten' style scenario problems.
A visual slide deck explaining the components of trigonometric wave equations, with a specific focus on the 2π/b relationship for finding period from frequency. Revised for clarity and font size compliance.
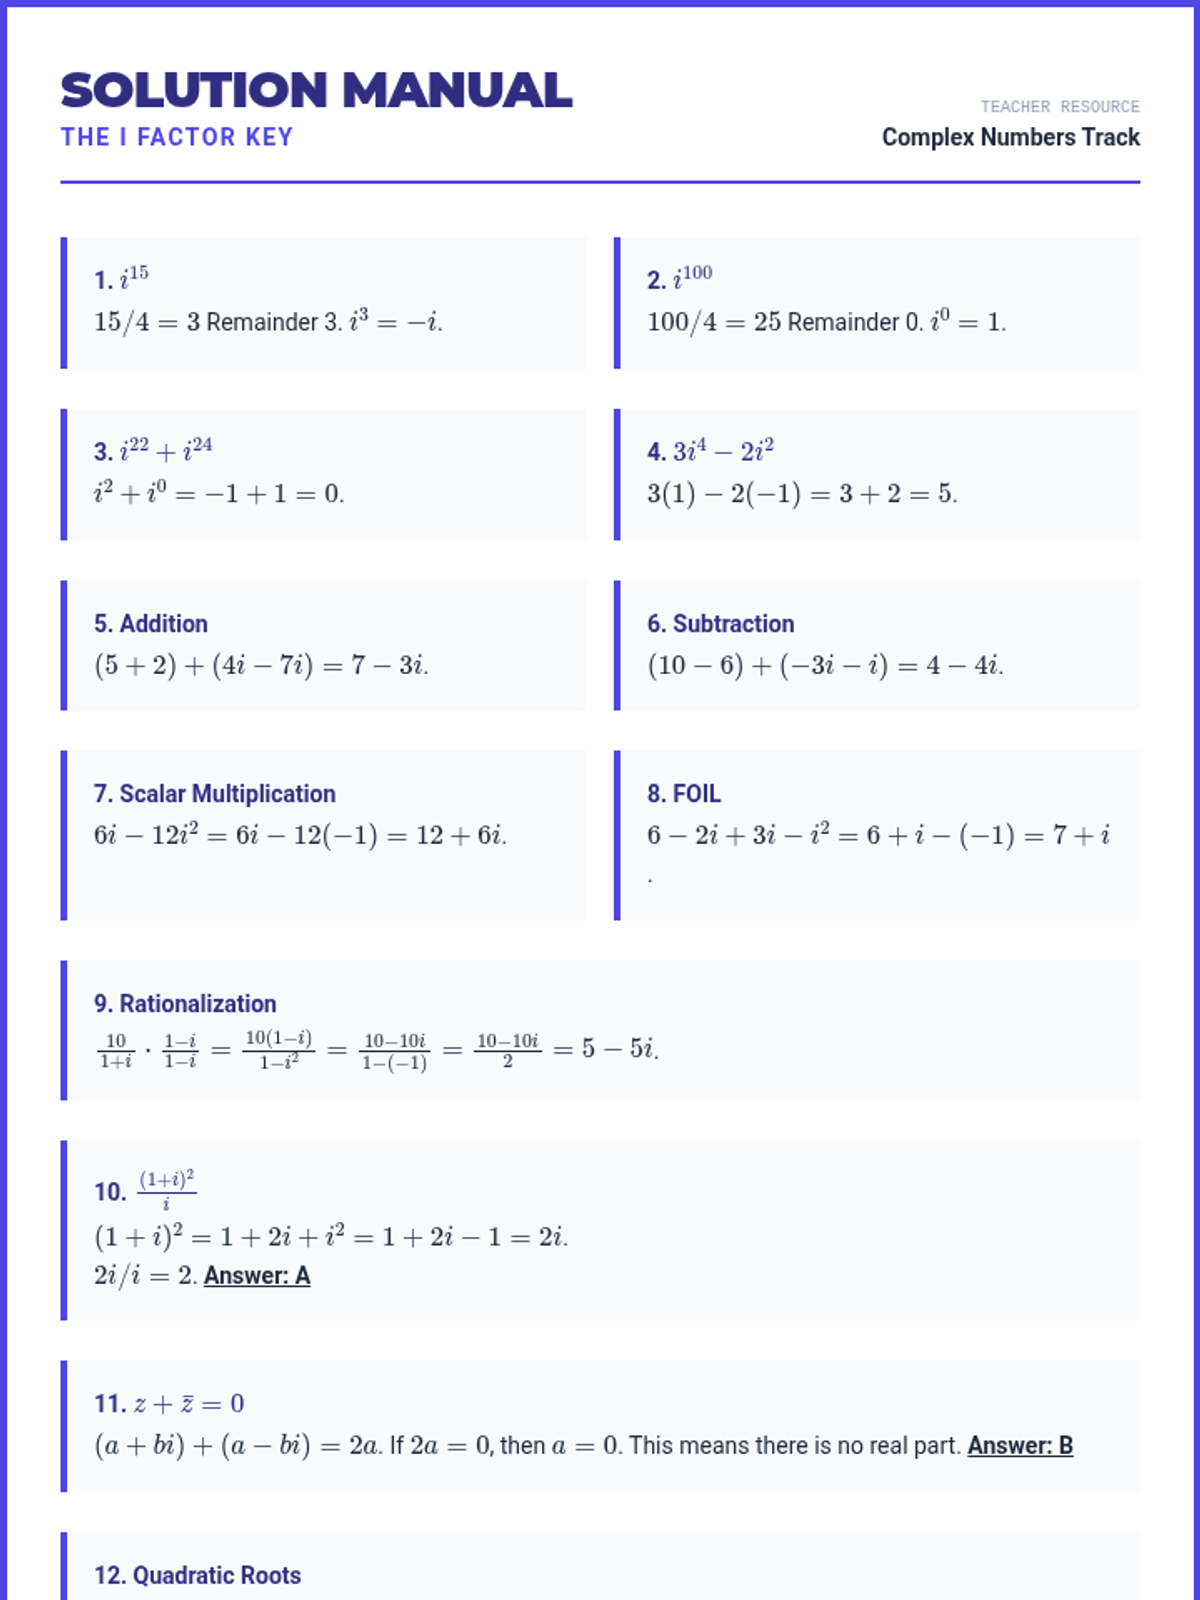
The detailed answer key for 'The i Factor Workout', featuring step-by-step solutions for powers of i, arithmetic operations, conjugates, and high-level ACT challenge problems.
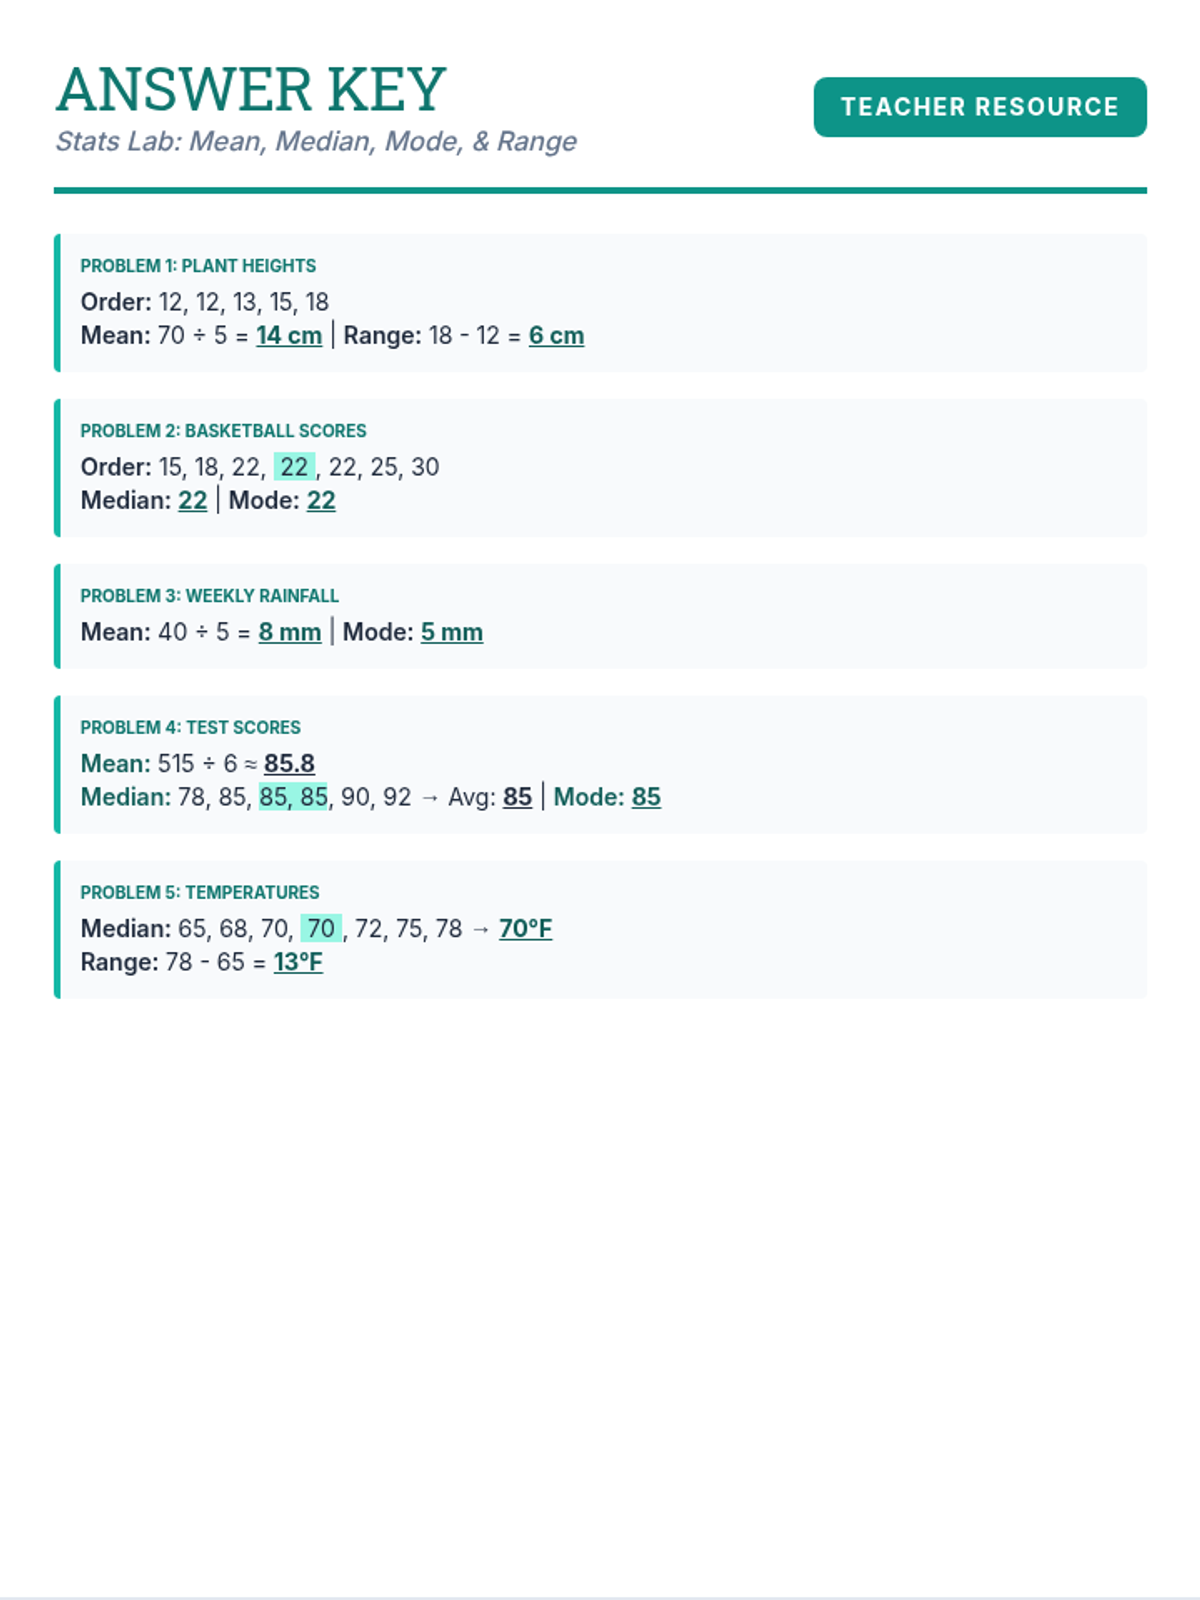
A 2-page answer key with standardized formatting and step-by-step solutions for all 10 scaffolded statistics problems.
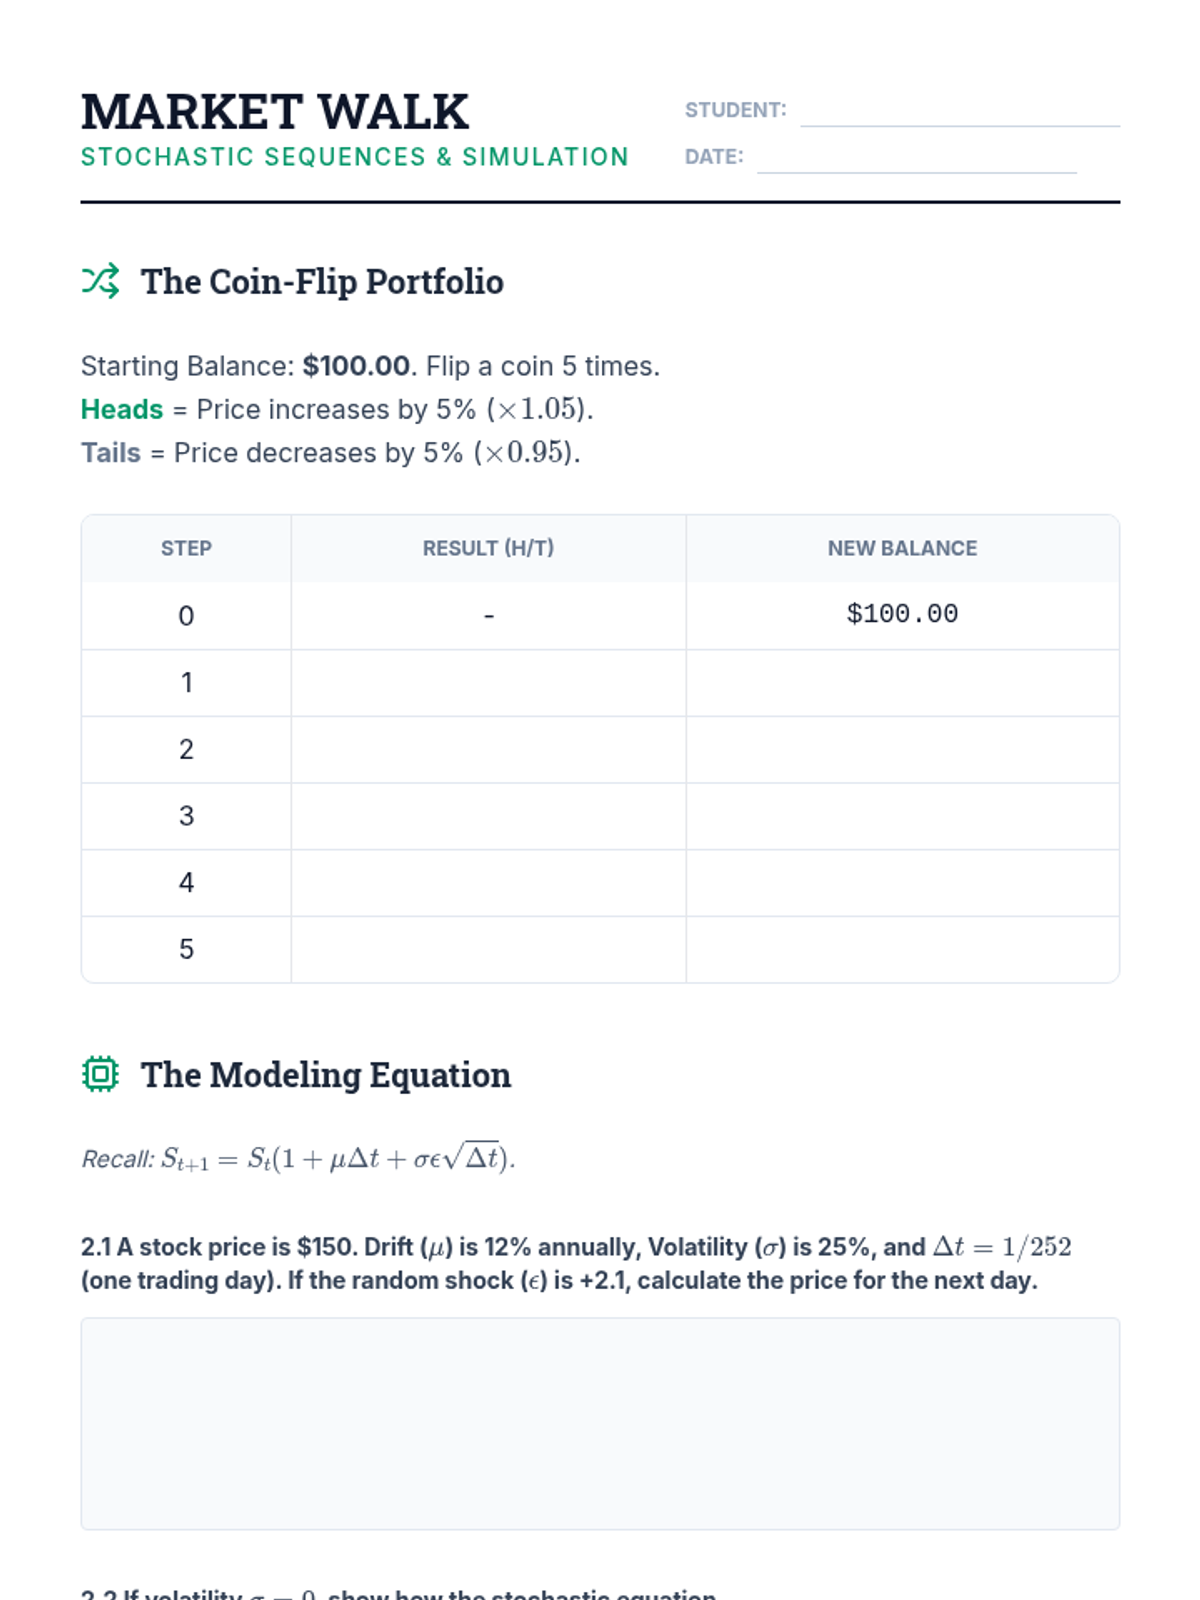
Student worksheet for Lesson 5, focusing on manual random walk simulations and the mathematical application of the stochastic price equation.
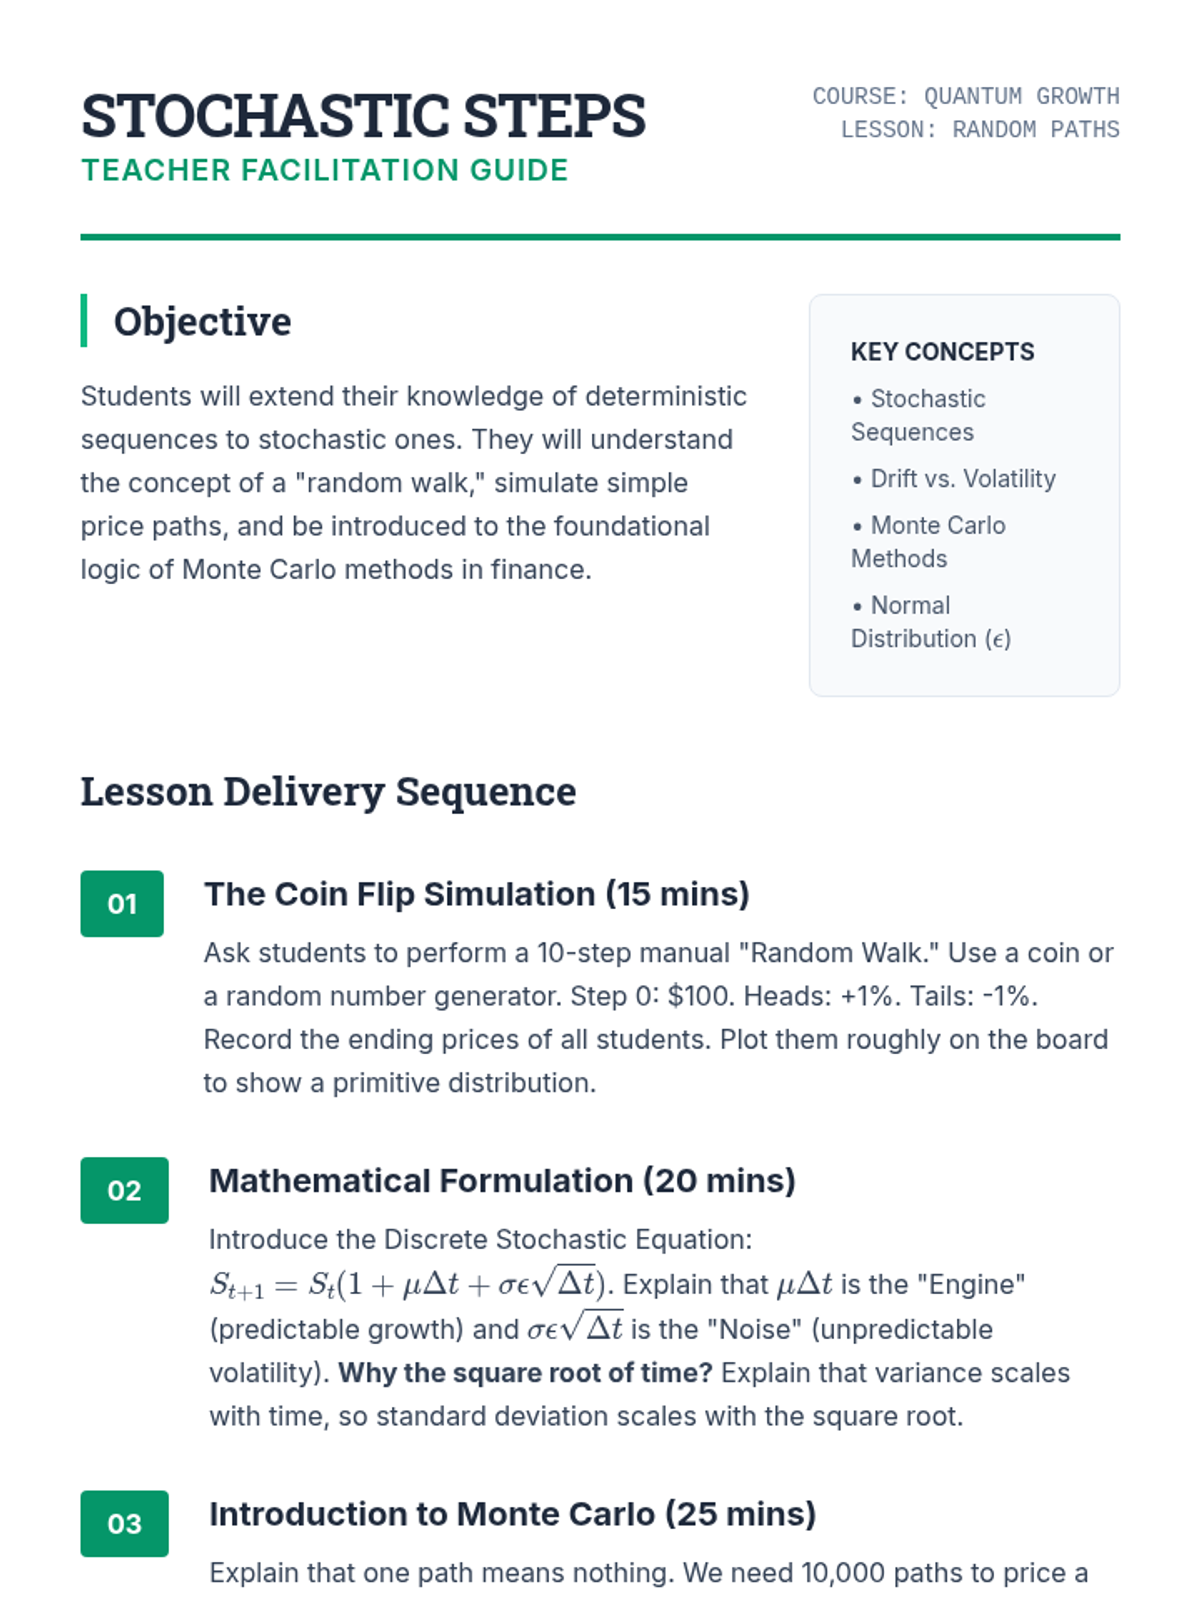
Teacher facilitation guide for Lesson 5, detailing the introduction to stochastic sequences, the drift/volatility model, and the concept of Monte Carlo simulations.
Slide deck for Lesson 5 introducing stochastic sequences, simulations of random walks, and their application to stock price modeling.
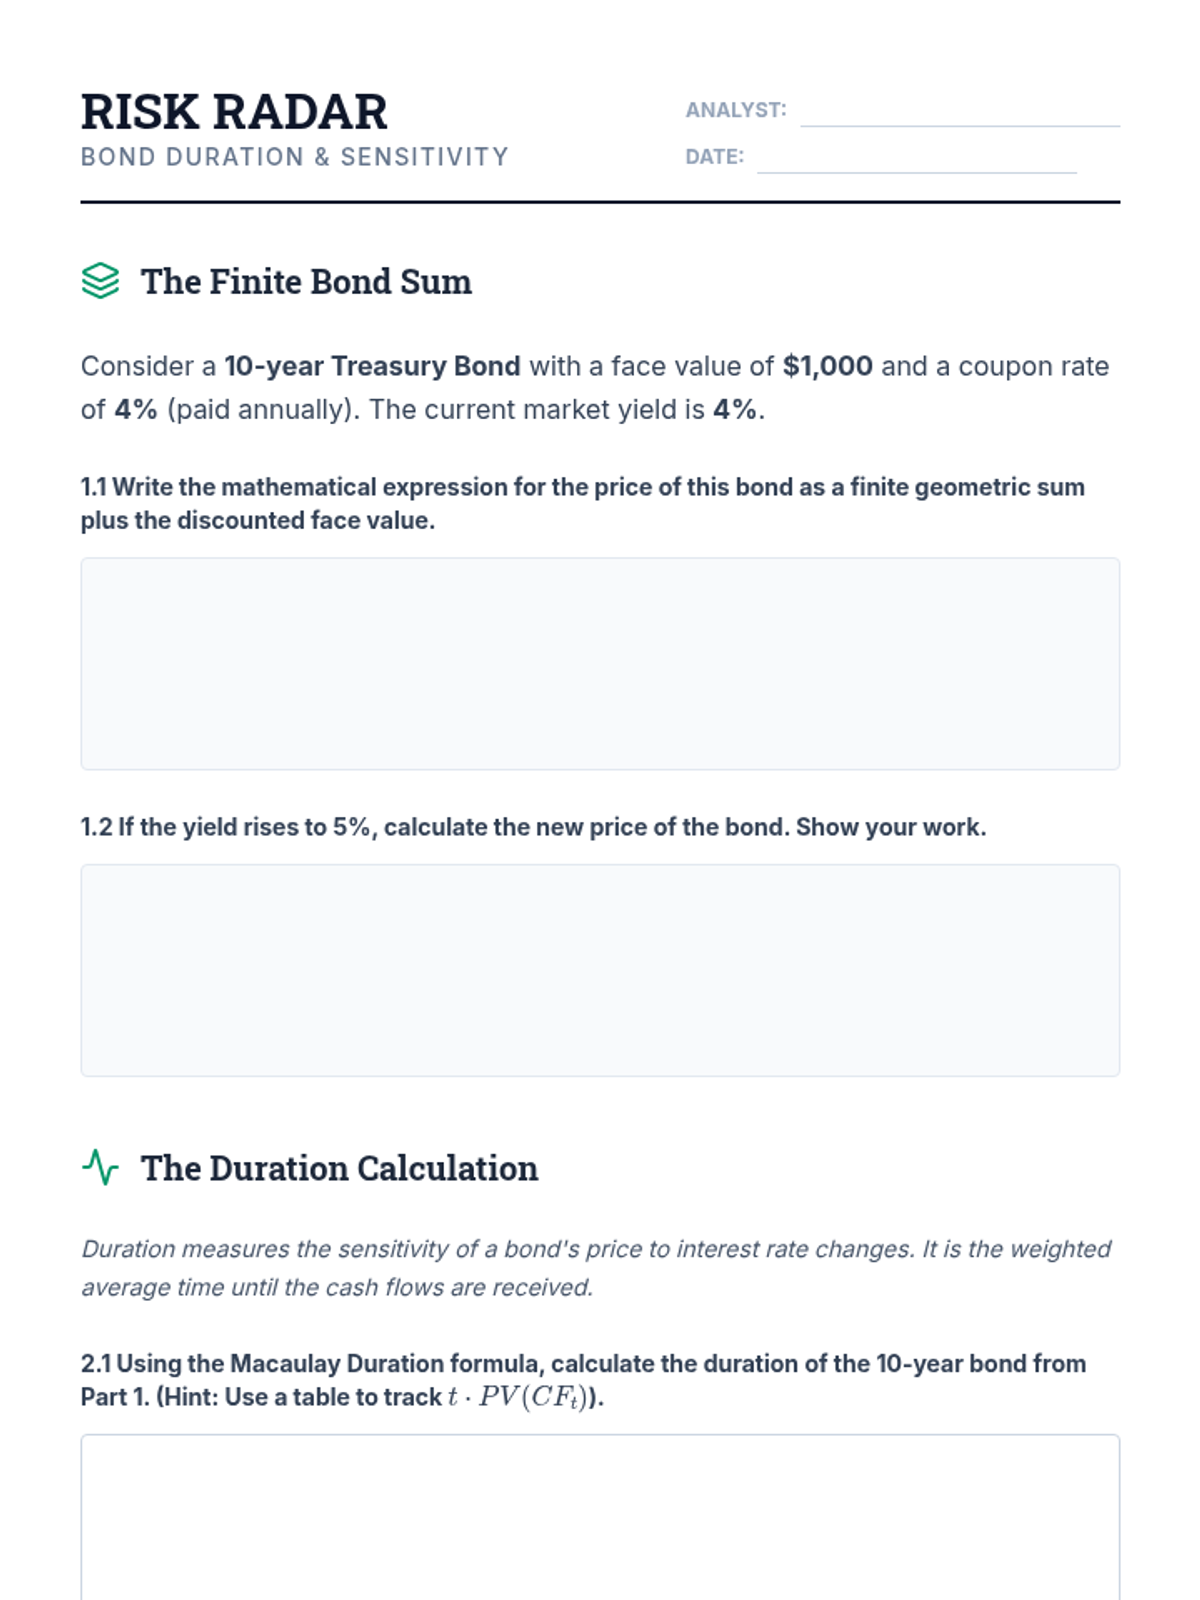
Student worksheet for Lesson 4, covering bond price calculations and the derivation of Macaulay and Modified duration to assess interest rate sensitivity.
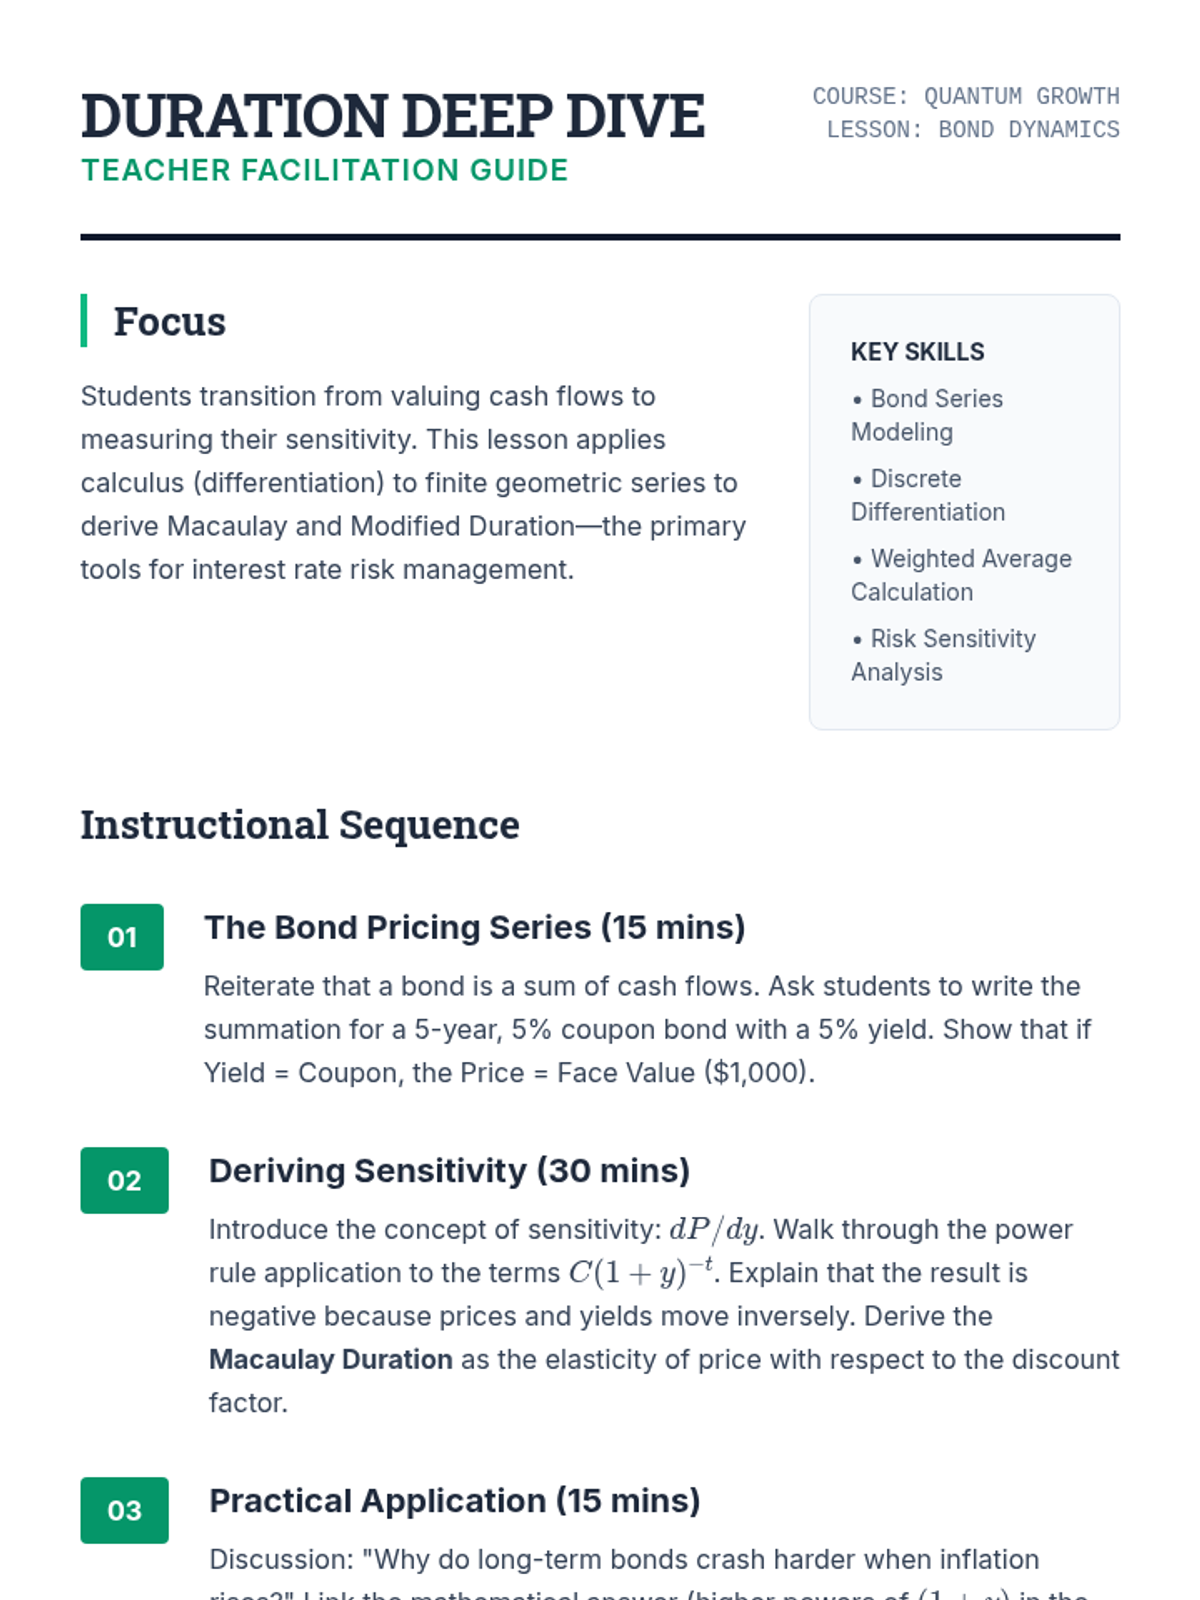
Teacher facilitation guide for Lesson 4, detailing the bond pricing series derivation and the calculus-based sensitivity analysis (duration).
Slide deck for Lesson 4 exploring bond pricing as a finite series and the derivation of Macaulay duration to measure interest rate risk.
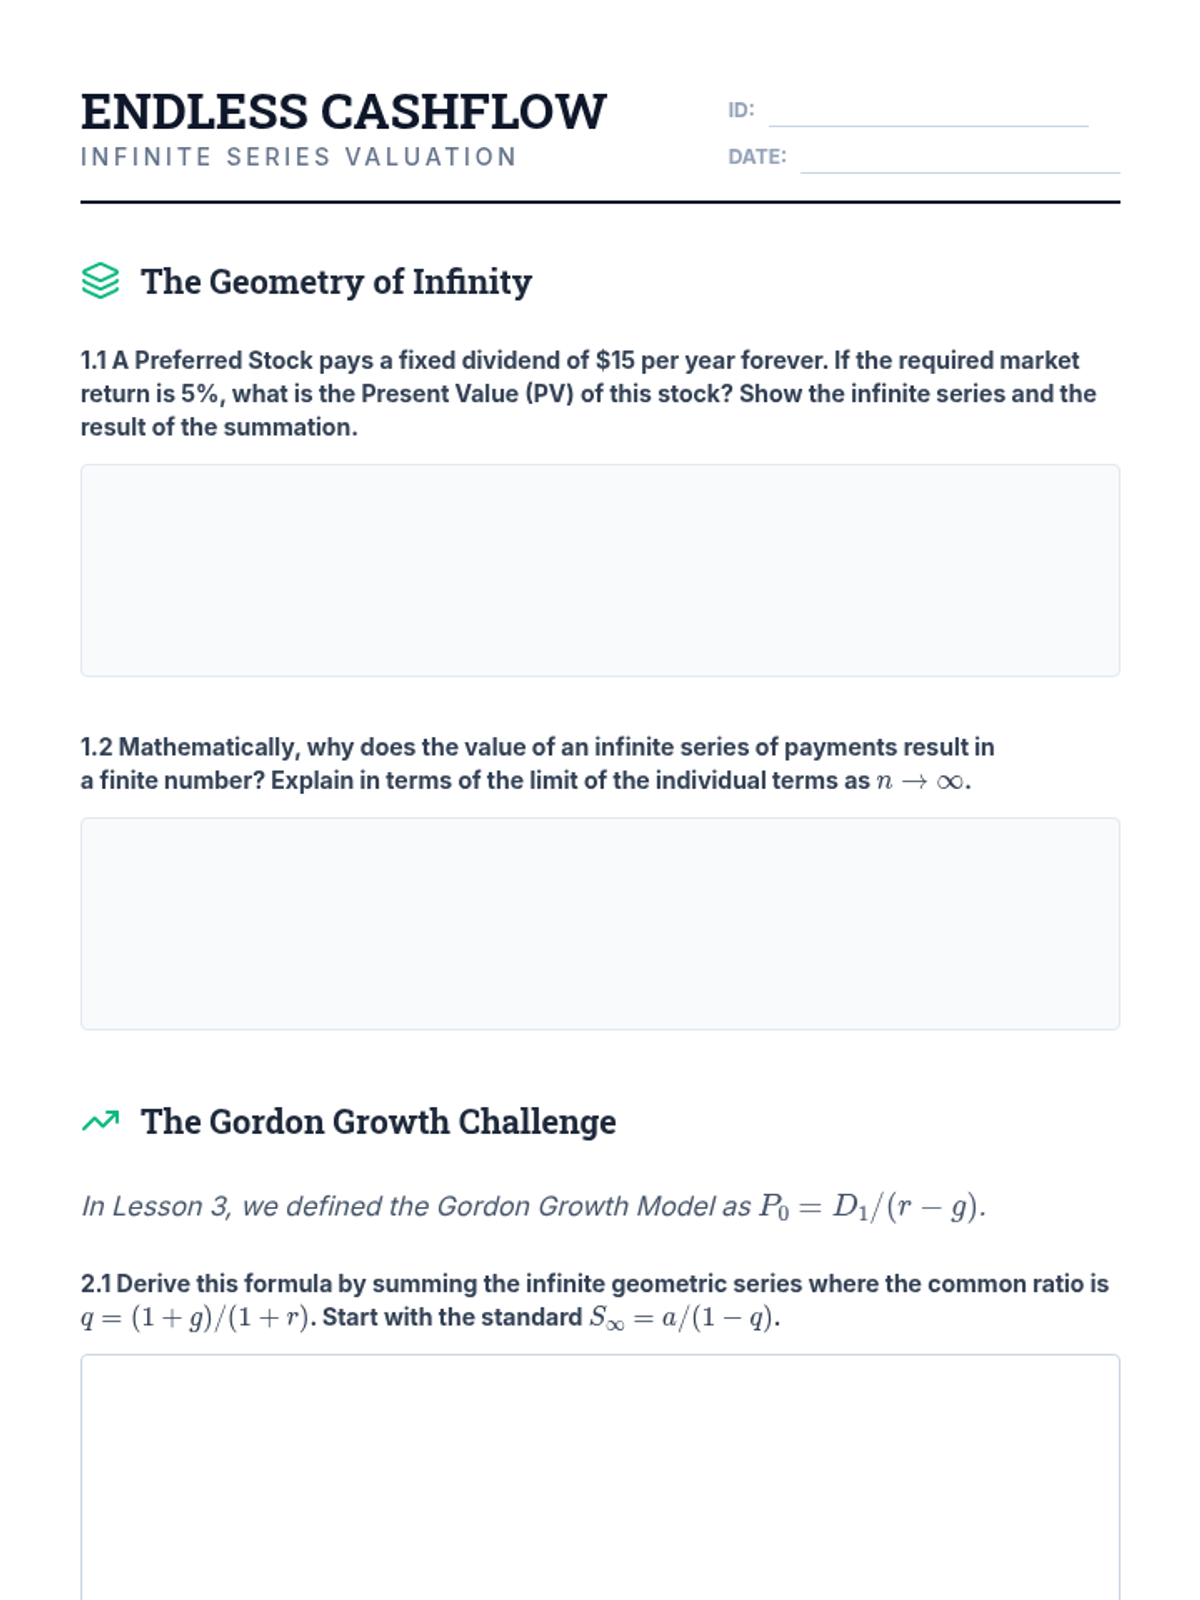
Student worksheet for Lesson 3, covering the pricing of perpetuities and the mathematical derivation/application of the Dividend Discount Model.
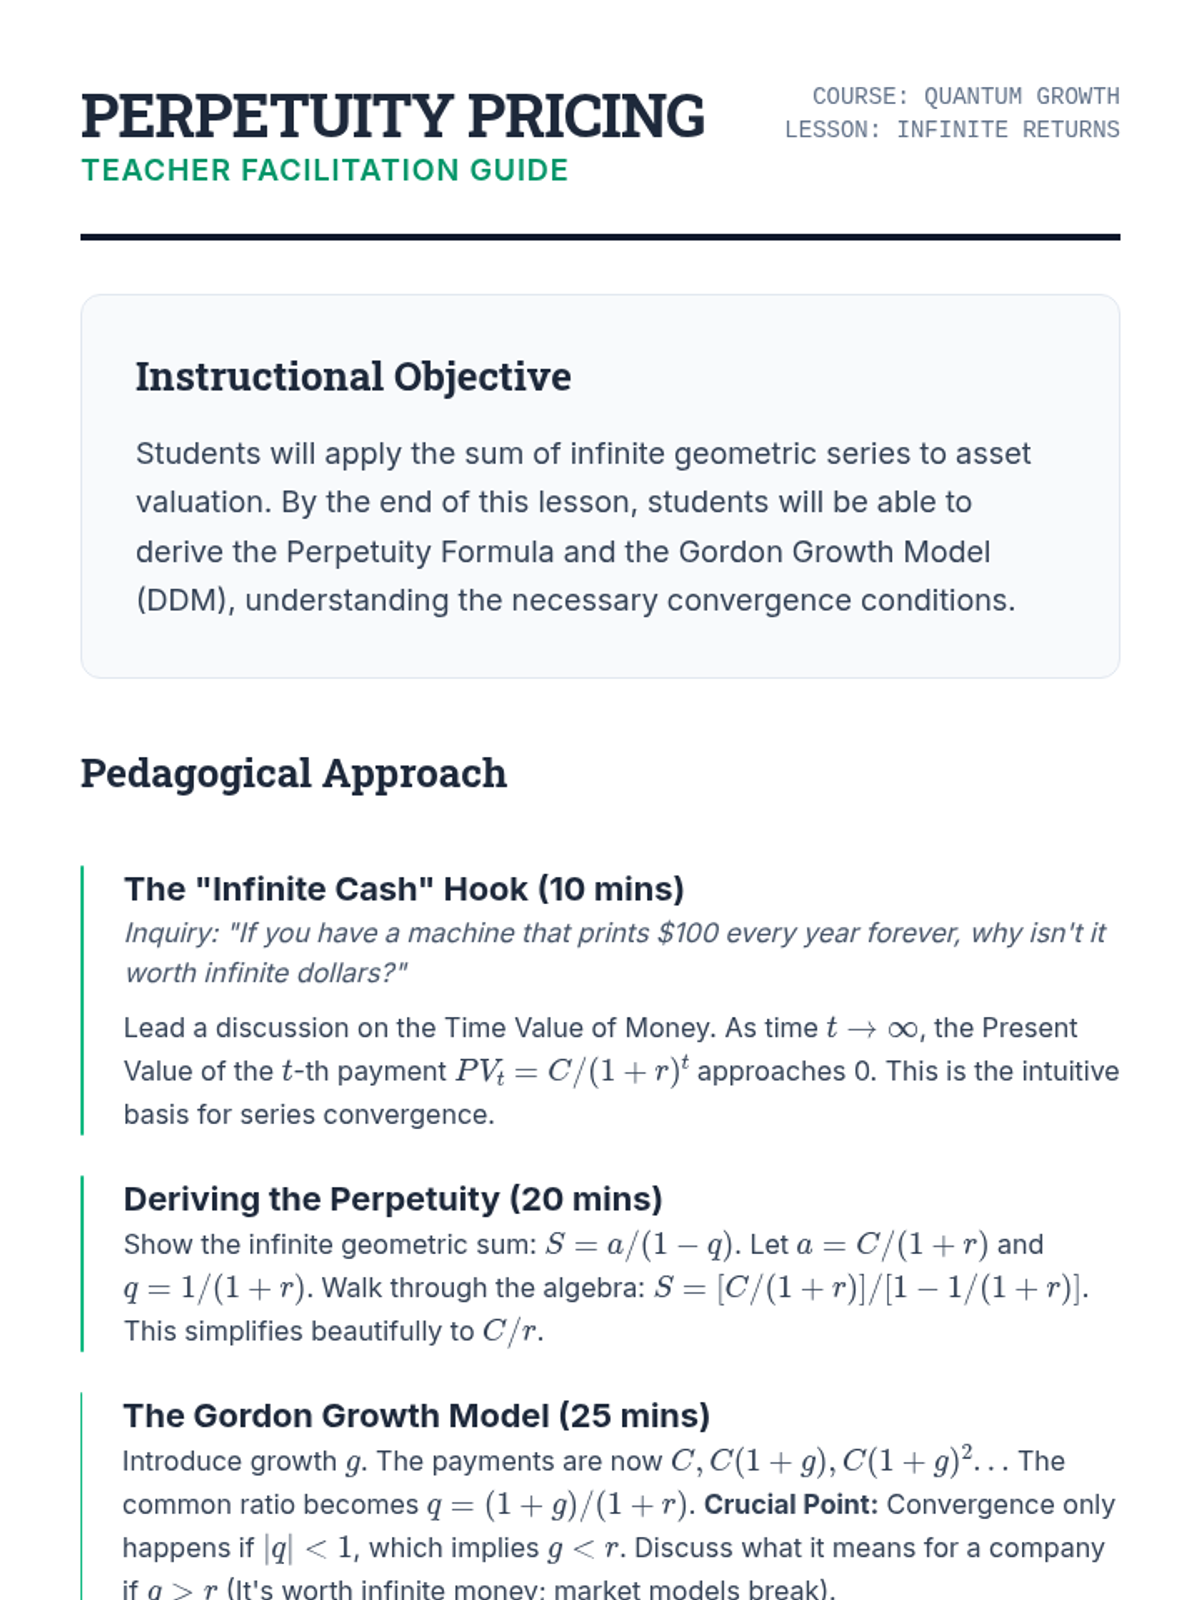
Teacher facilitation guide for Lesson 3, outlining the mathematical derivation of perpetuity valuation and the Dividend Discount Model convergence conditions.
Slide deck for Lesson 3 exploring the valuation of perpetuities and the Dividend Discount Model through the lens of infinite geometric series convergence.
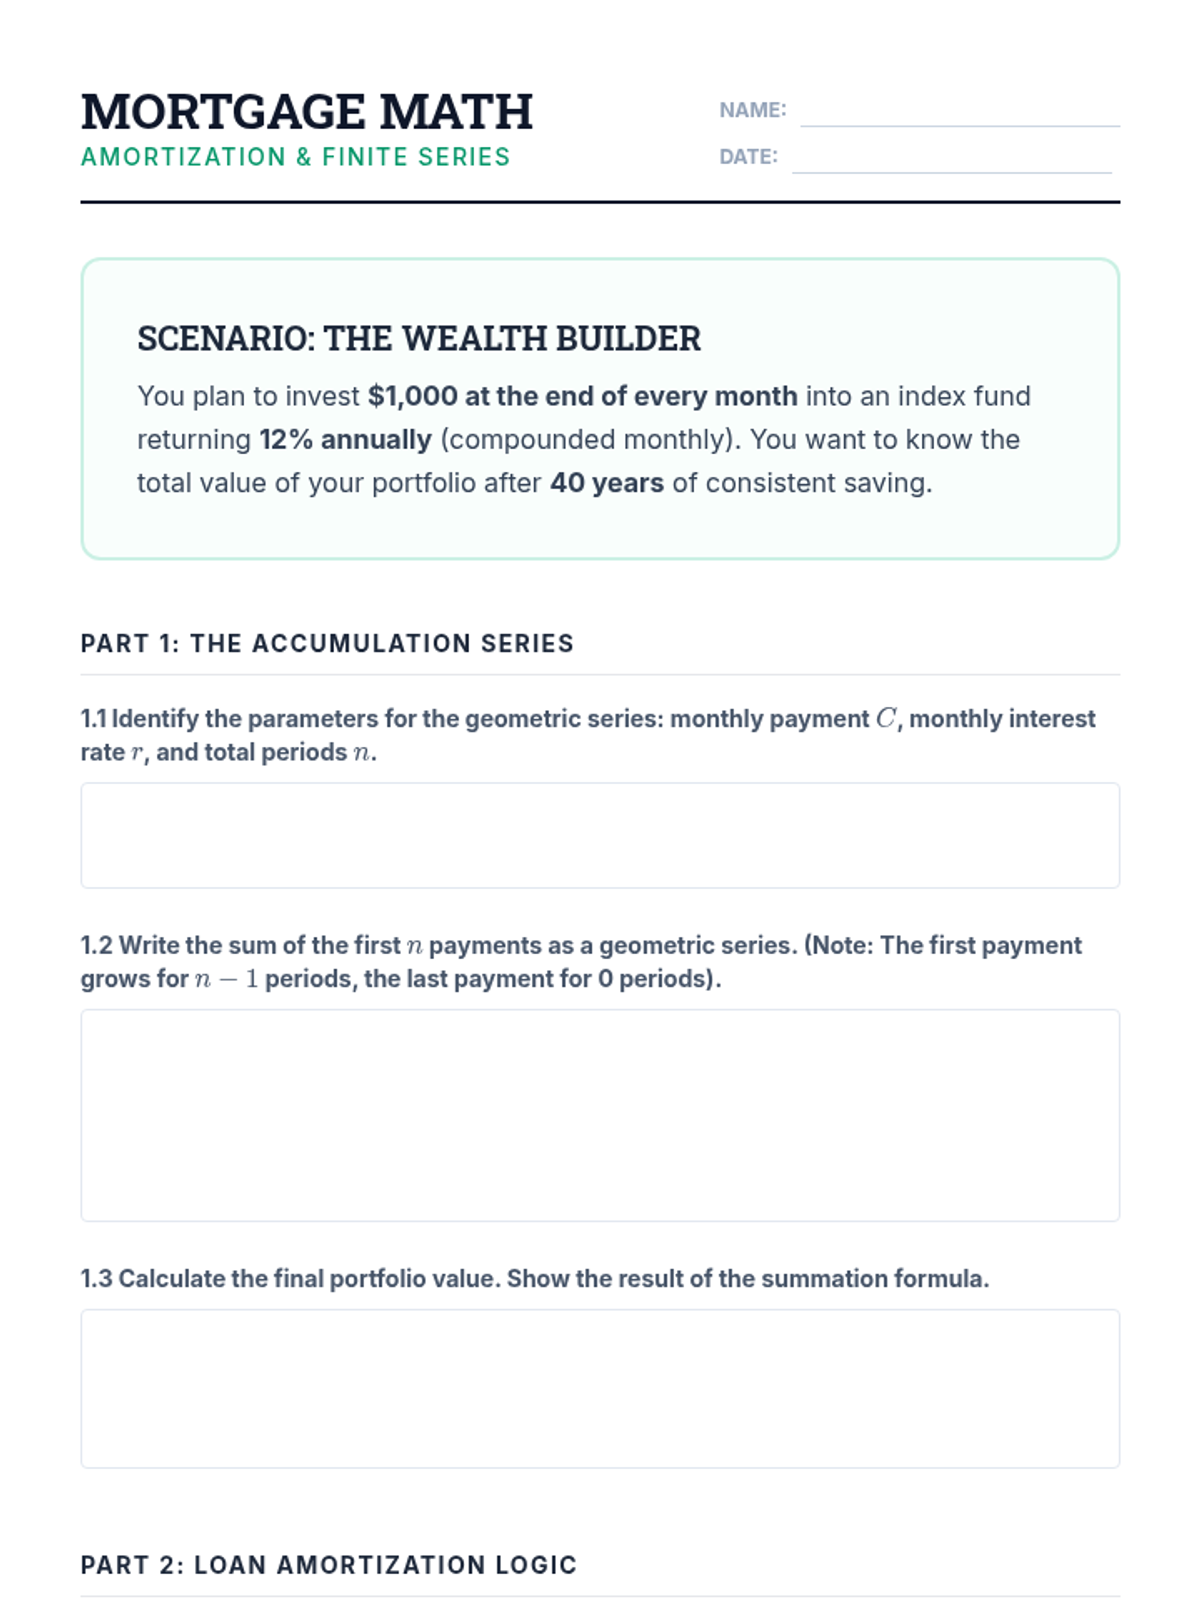
Student worksheet for Lesson 2, covering the calculation of future value for savings and the derivation of monthly mortgage payments using finite geometric sums.
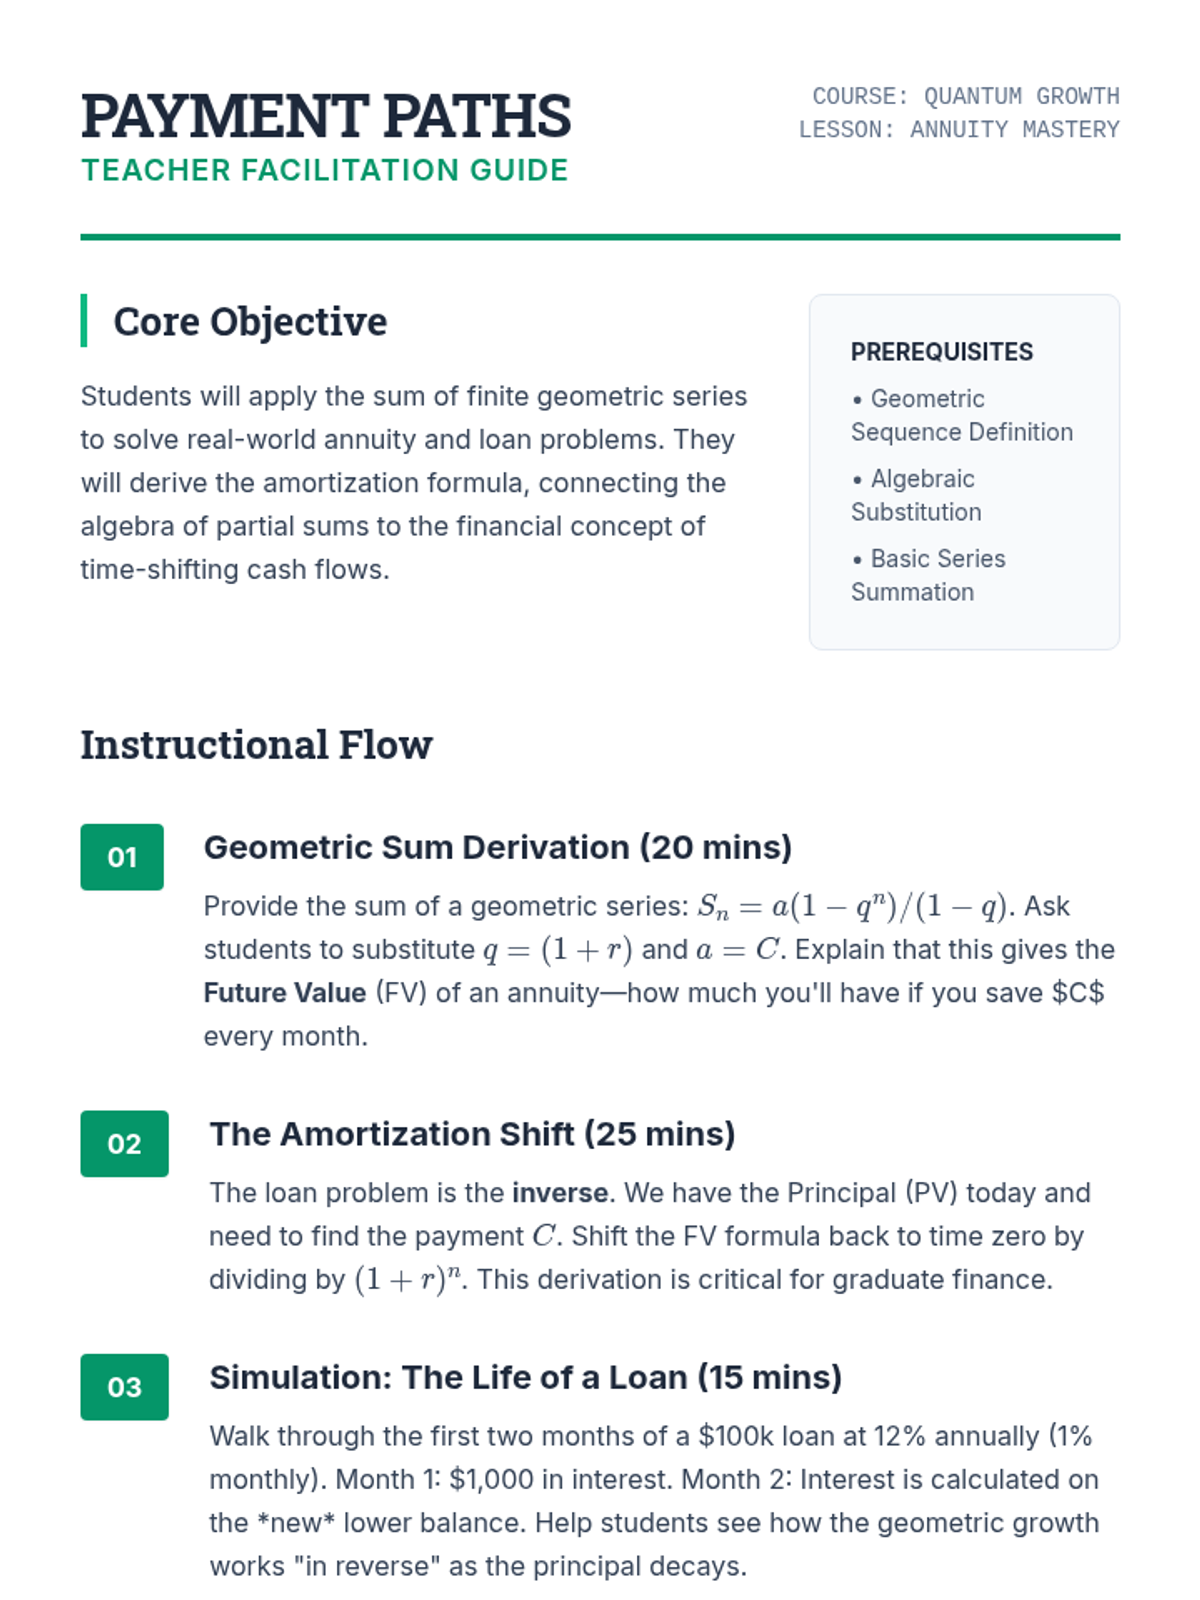
Teacher facilitation guide for Lesson 2, outlining the derivation of the annuity formula and providing guidance for the amortization simulation.
Slide deck for Lesson 2 focusing on finite geometric series and their application in calculating annuity values and loan amortization.
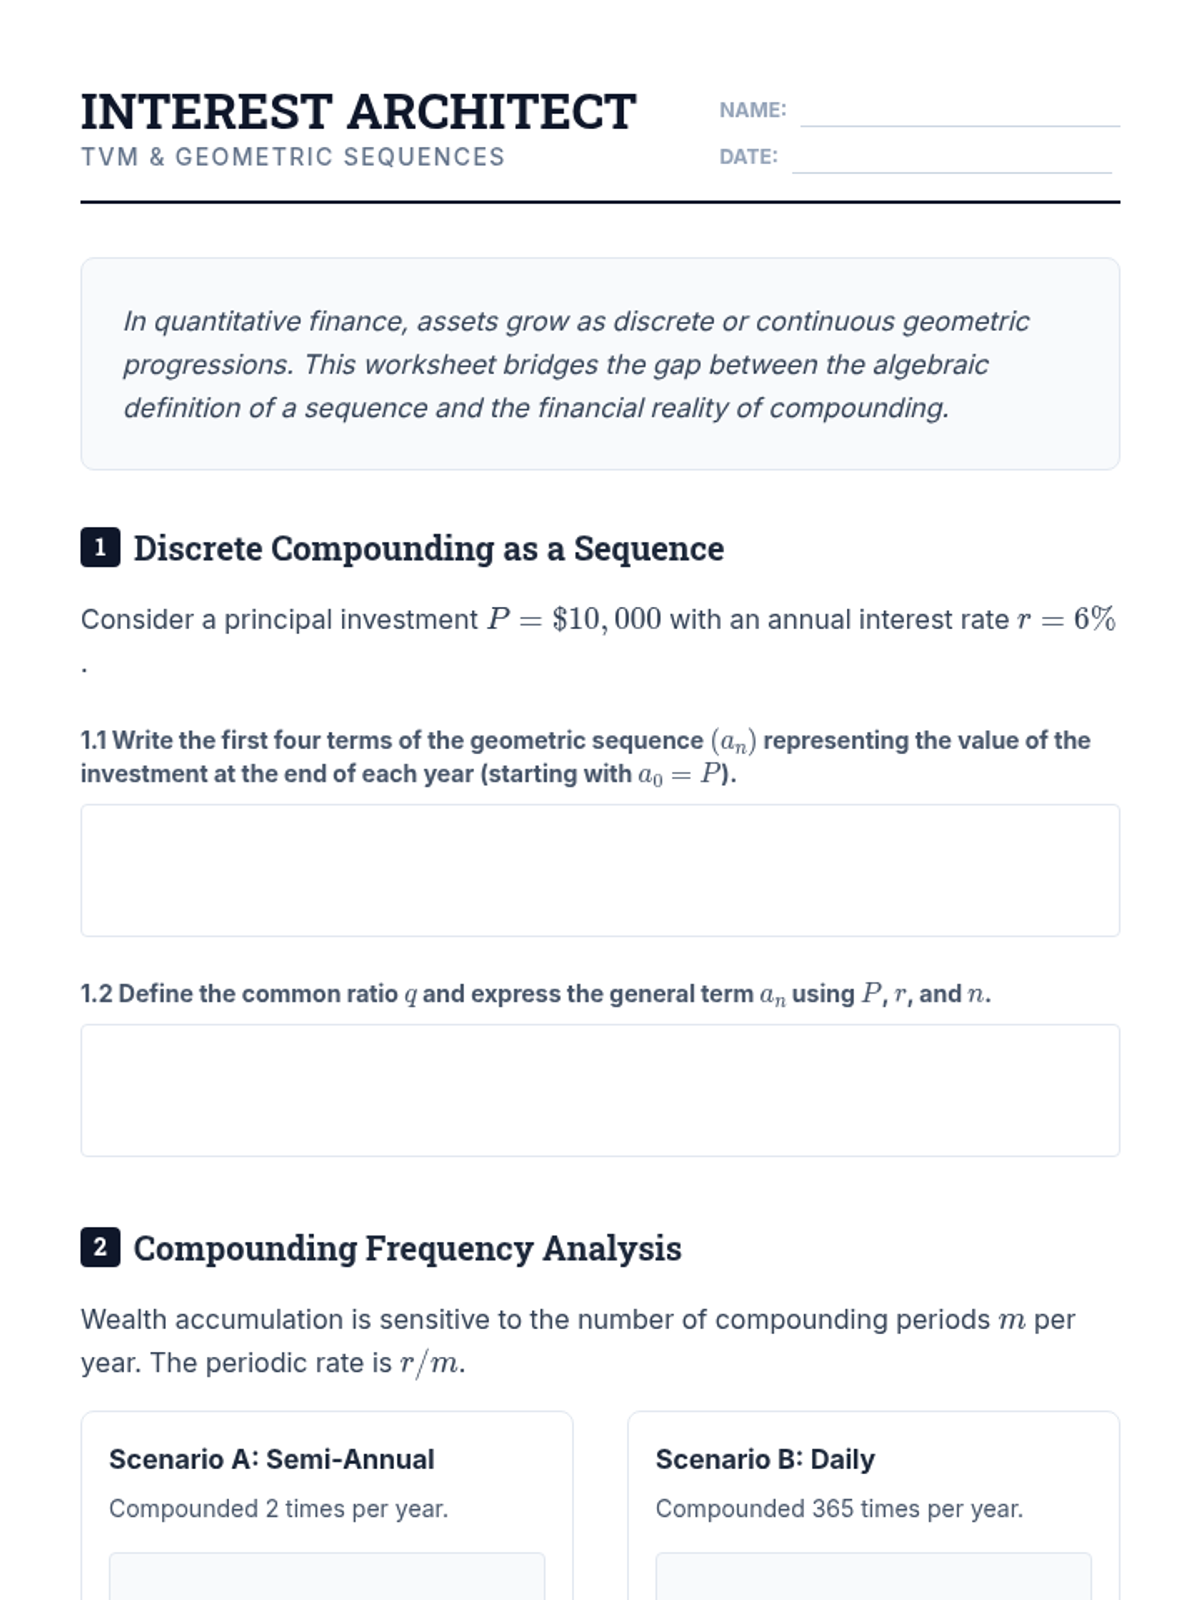
Student worksheet for Lesson 1, focusing on modeling interest as a geometric sequence and calculating the effects of different compounding frequencies.
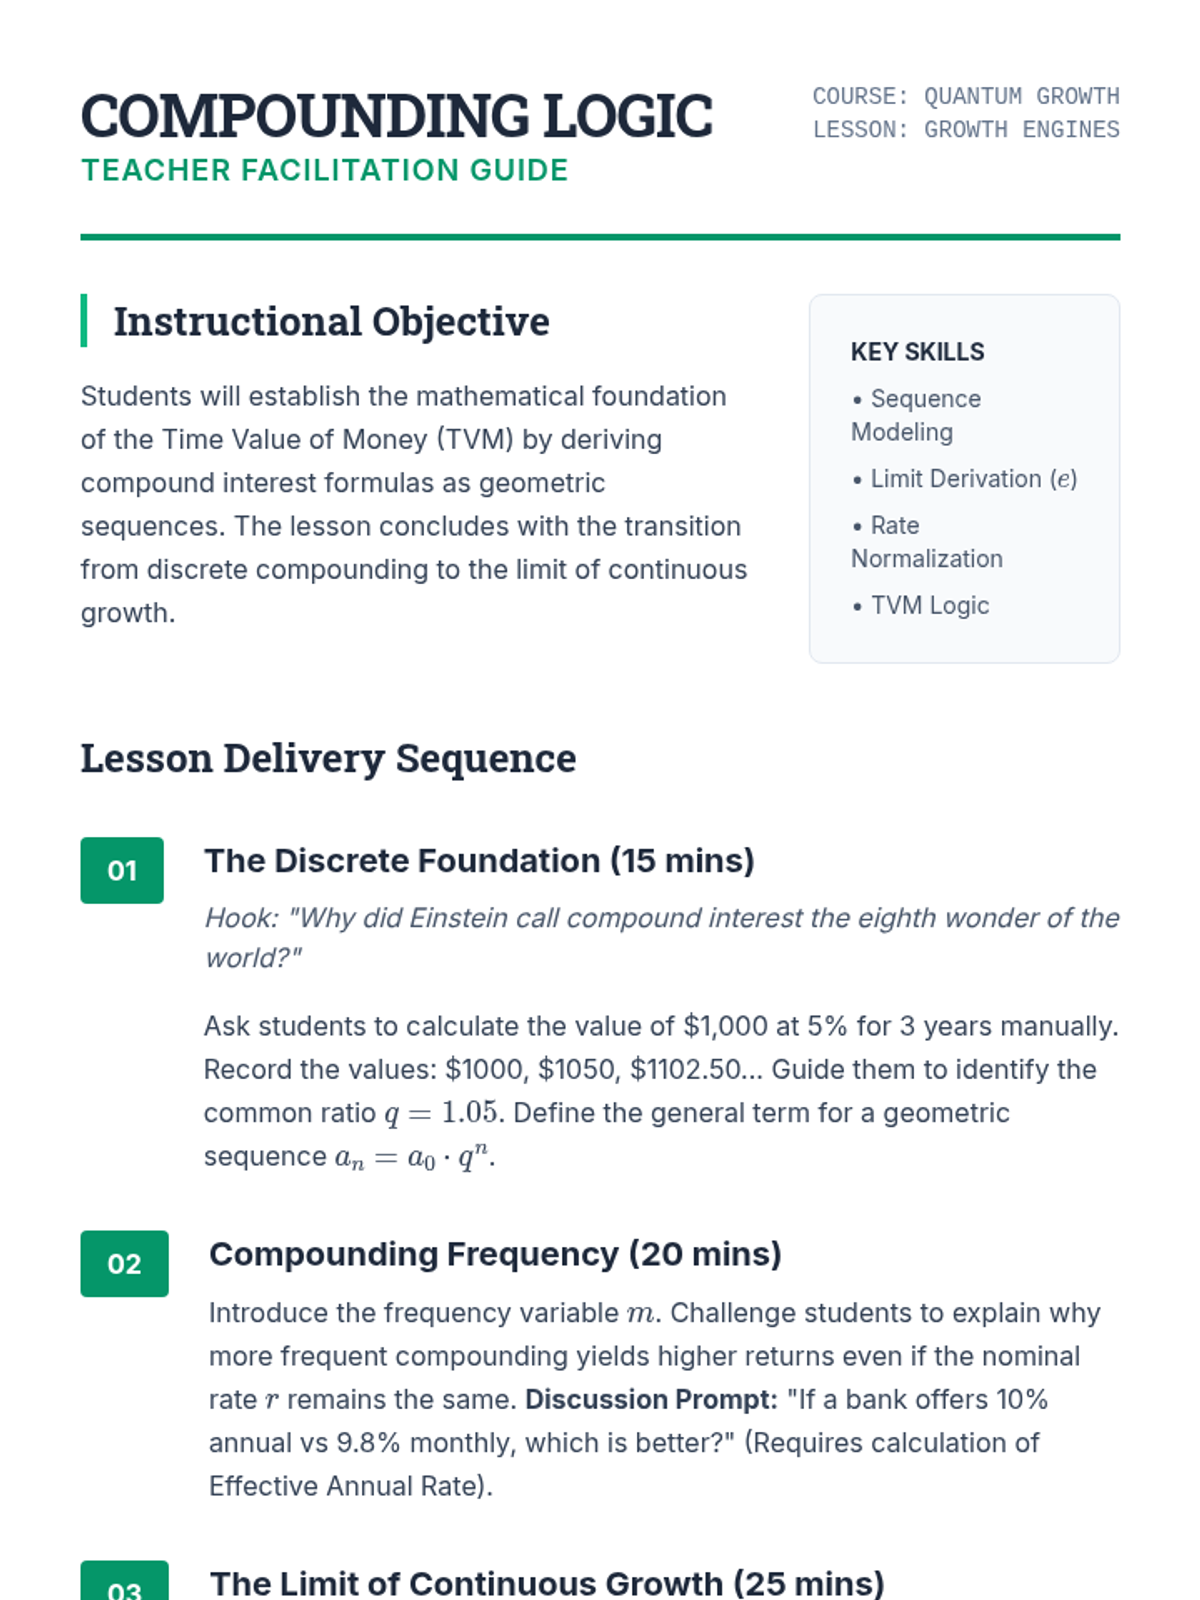
Teacher facilitation guide for Lesson 1, detailing the transition from discrete geometric growth to continuous compounding with lesson delivery steps and answer key highlights.
Introductory slide deck for Lesson 1 covering the derivation of compound interest as a geometric sequence and the limit definition of continuous compounding.
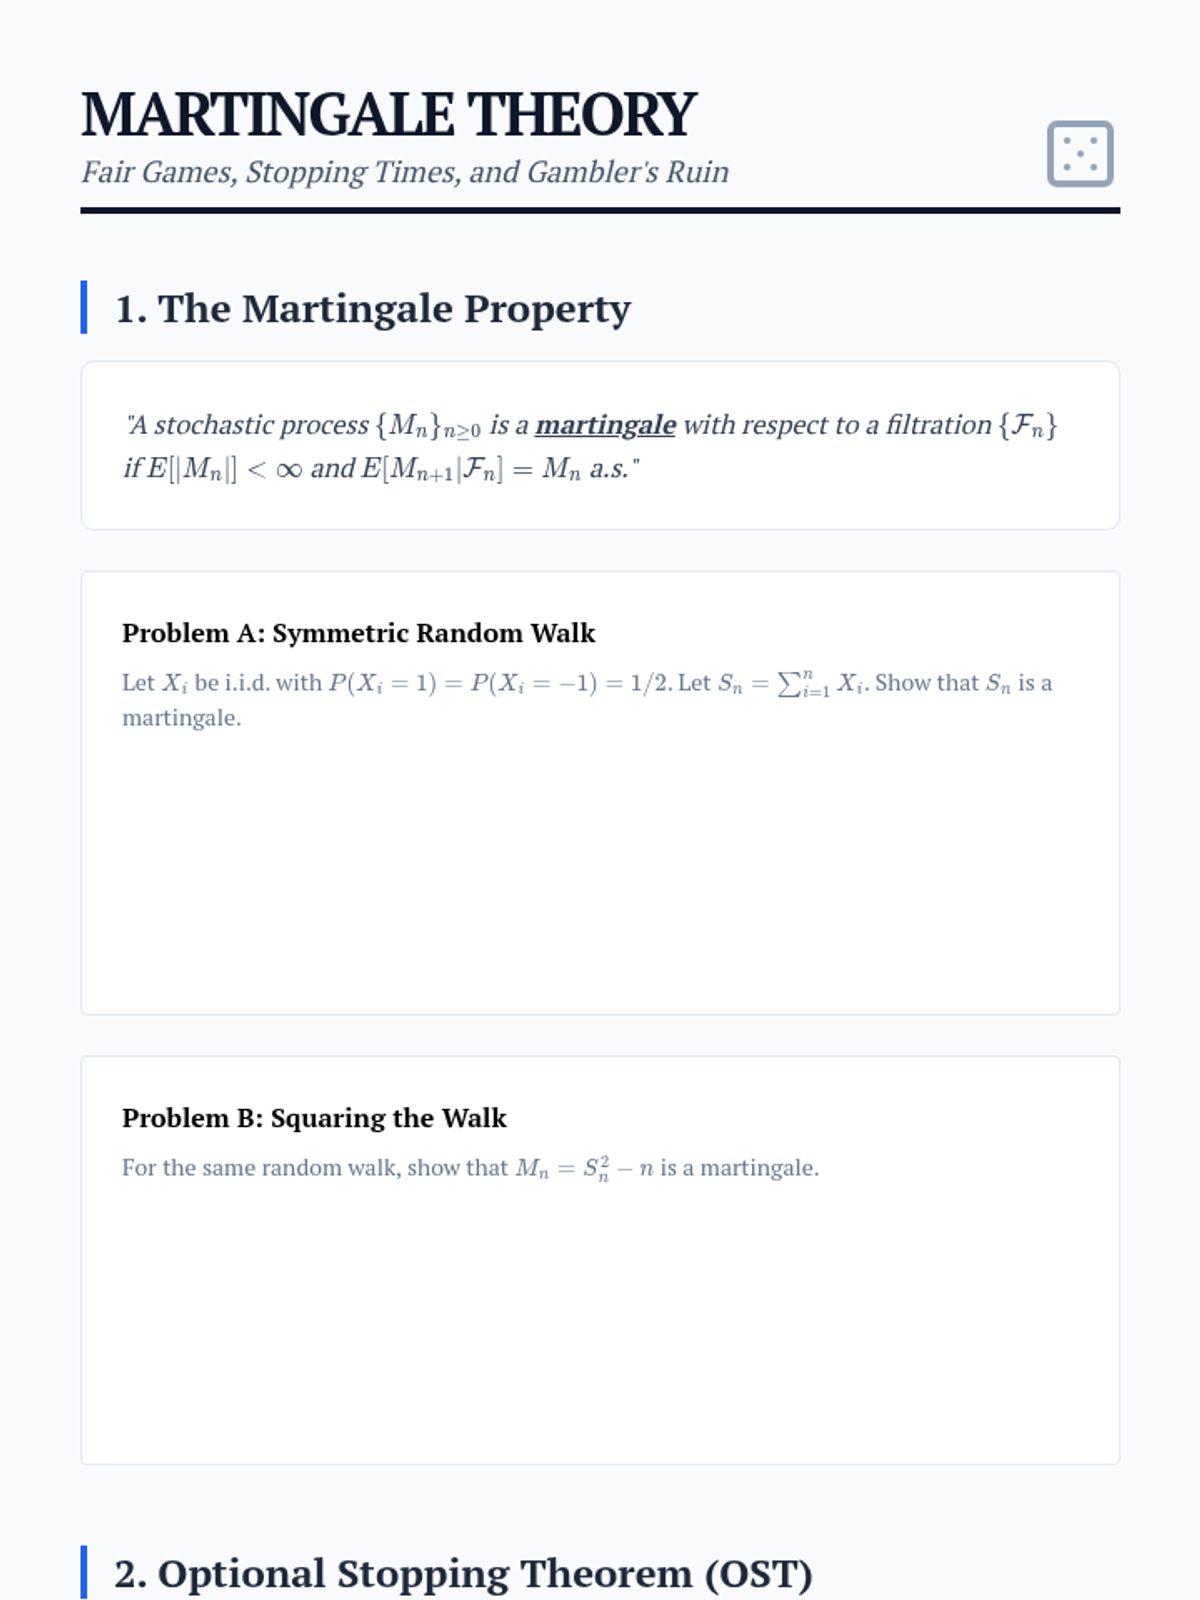
Graduate-level slides for Martingale theory, explaining the fair game concept, filtration, and the Optional Stopping Theorem.
A graduate worksheet on Martingale theory, focusing on the definition of martingales, the Optional Stopping Theorem, and its application to the Gambler's Ruin problem.
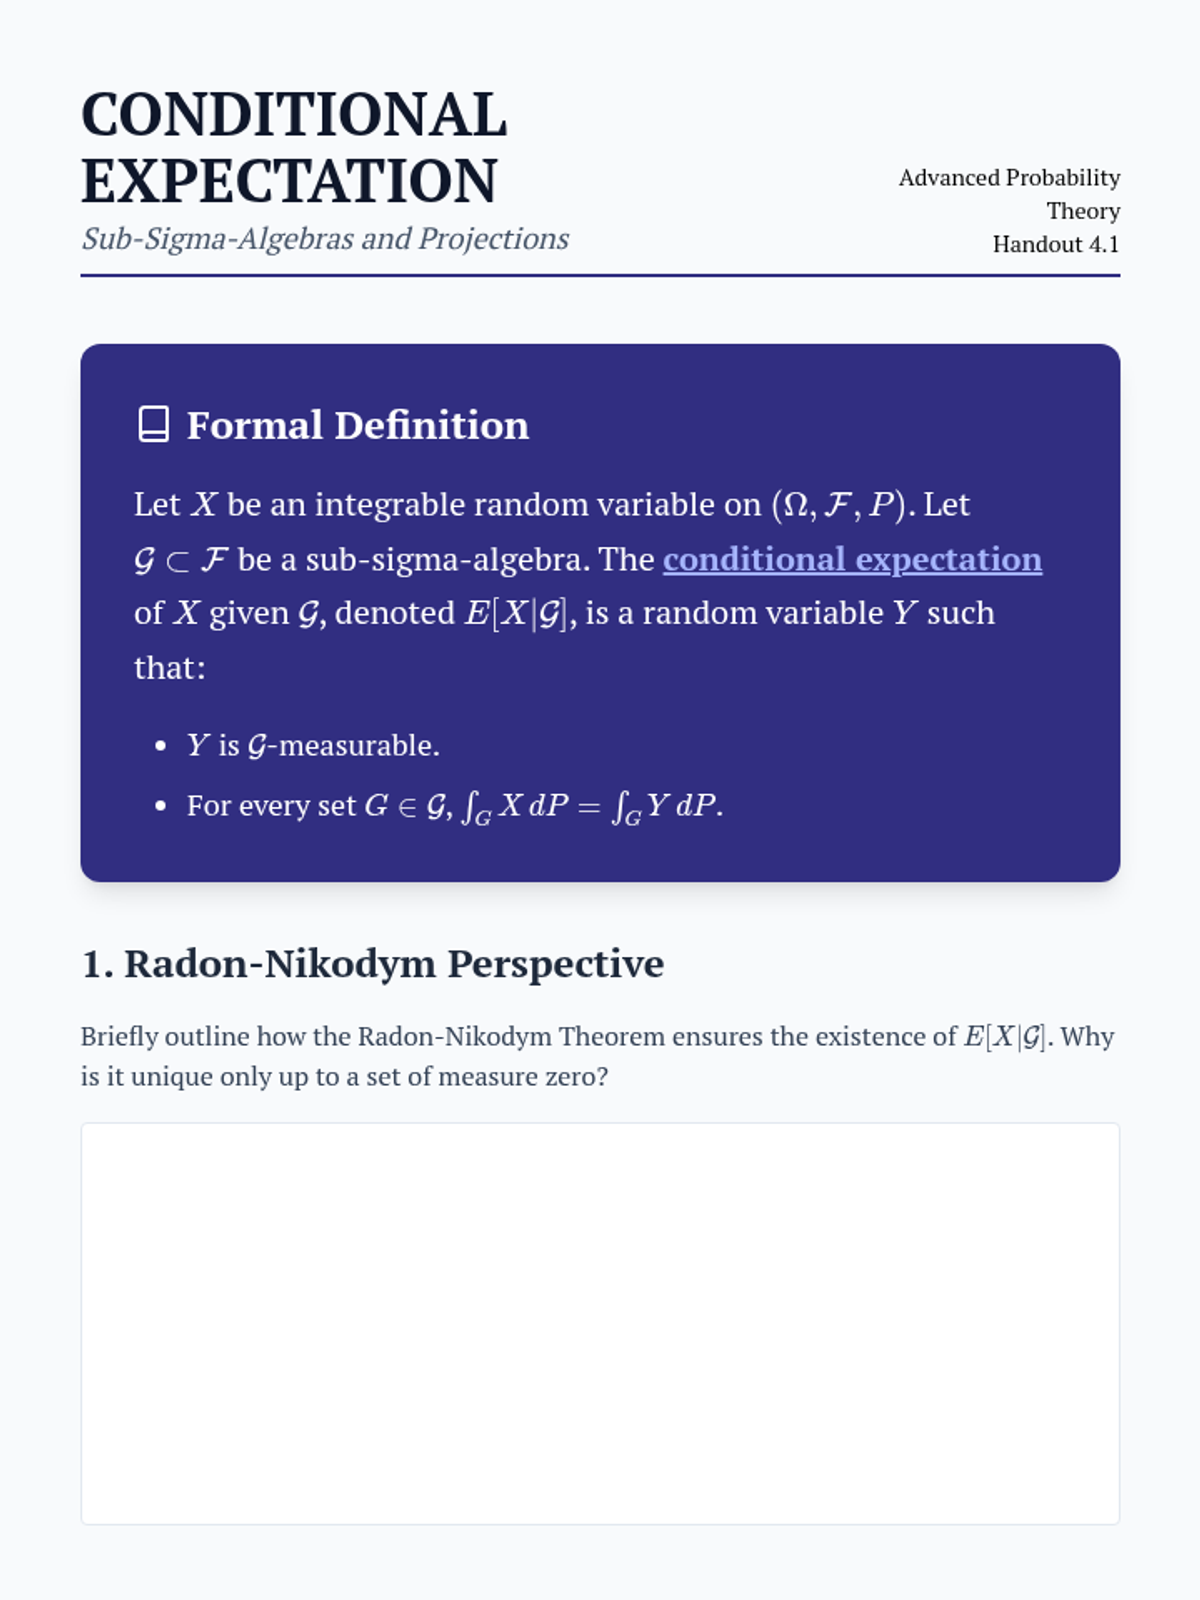
Graduate slides on conditional expectation as a projection in Hilbert space and its definition using sub-sigma-algebras.
A graduate worksheet on conditional expectation, covering its measure-theoretic definition, Radon-Nikodym foundation, and the projection property in Hilbert spaces.
Graduate slides covering MCT, Fatou's Lemma, and DCT with visual representations of the convergence requirements.
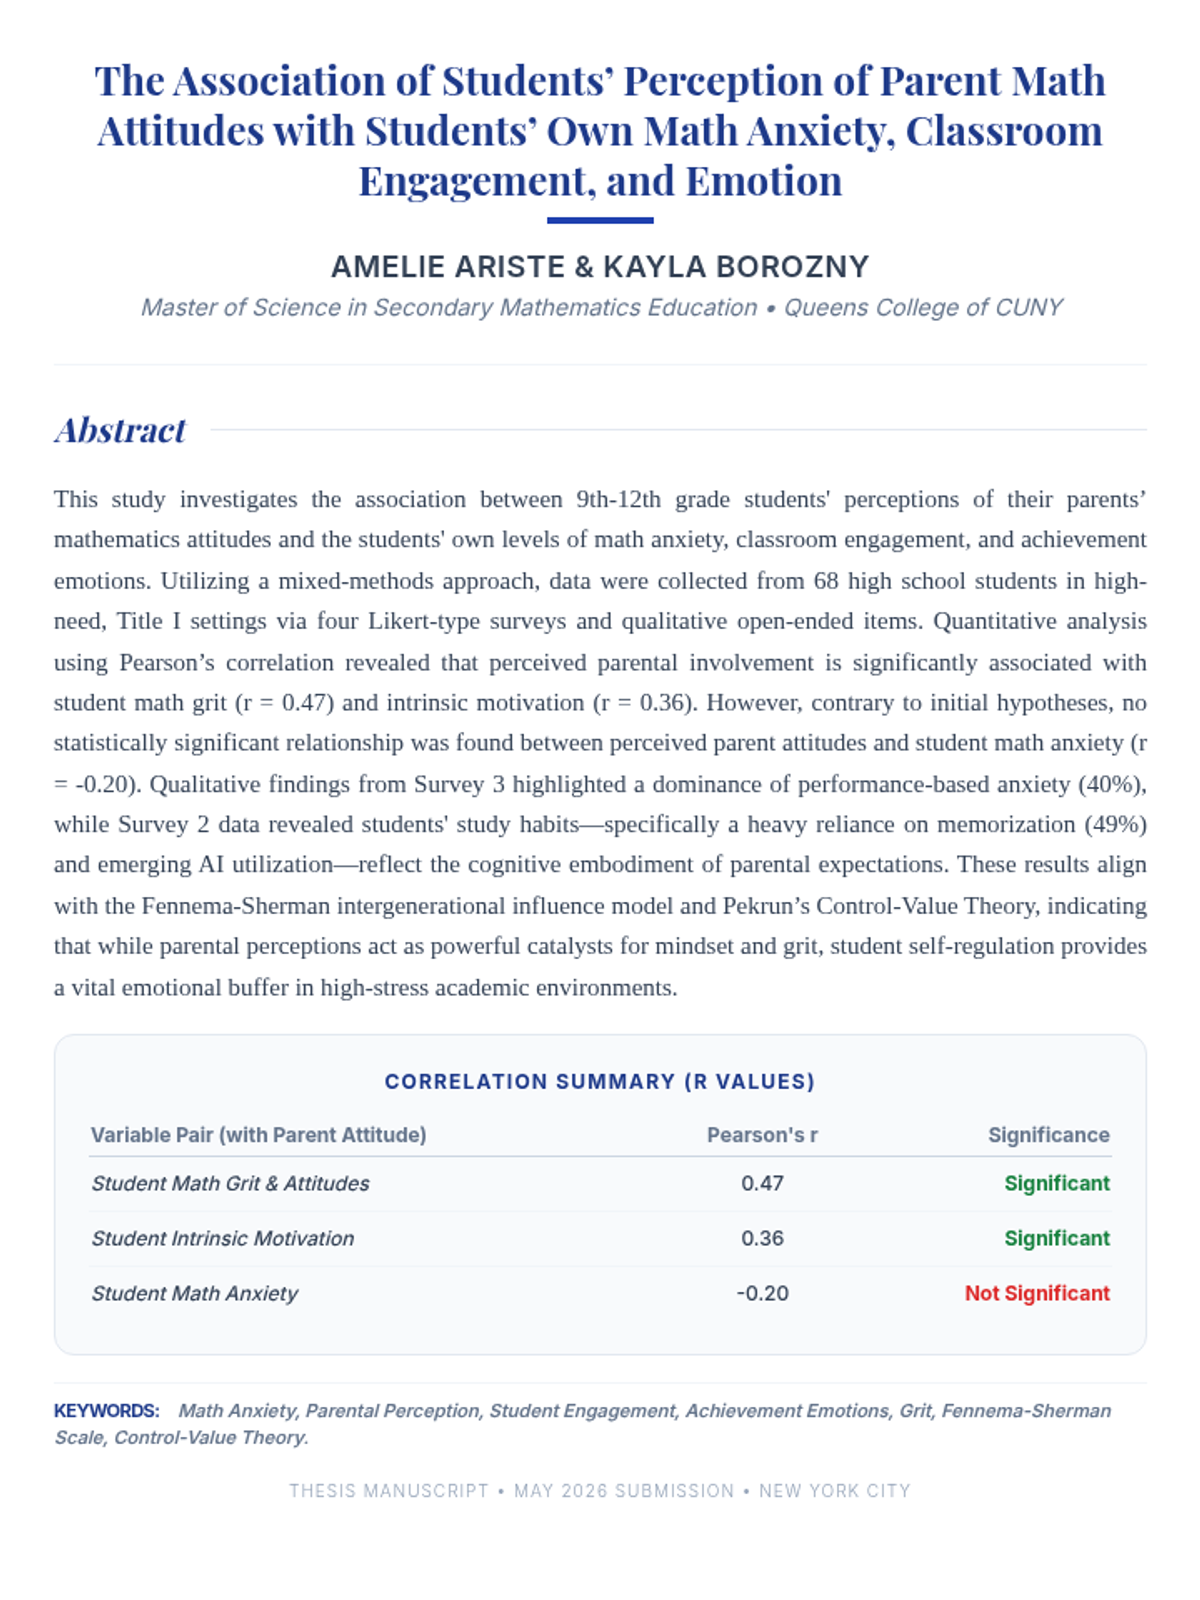
A formal academic abstract summarizing the purpose, methodology, results, and conclusions of the thesis study on parent math attitudes and student outcomes. Updated for page-break consistency and terminology matching.