Messy Data Handout MESSY DATA LAB
Hook Activity: Draw the Line
Name: __________________________
Date: ___________________________
Challenge: The Best Fit
Look at the scatter plot below. These data points represent the growth of a rare plant over 7 days. Notice they don't form a perfectly straight line! Using a ruler , draw one single straight line that you think "best" represents the trend of all the dots.
Height (cm)
Day 0
Day 1
Day 2
Day 3
Day 4
Day 5
Day 6
0
20
40
60
80
100
Time (Days)
The Exact Data
Day (x) Height (y) 0 10 1 16 2 32 3 48 4 60 5 84 6 96
My Line Equation
After drawing your line, try to estimate your equation in \( y = mx + b \) form.
\( y = \) _________ \( x + \) _________
Messy Math Slideshow MESSY MATH
Intro to Functions & Real-World Modeling
Pre-Algebra "Finding Order in Chaos"
The Human Factor
Observation Time
Look at your neighbor's "Line of Best Fit."
Do your lines start in the same place?
Is one slope steeper than the other?
The Problem
If everyone's line is different, whose line is "right"? How can we use math to be perfectly fair?
"Manual fitting is an opinion... regression is a calculation."
The Problem with "By Hand"
Embedded media
Watch 0:00 - 1:40
Listen for: Why manual fitting fails.
Tools of the Trade
Regression
A statistical technique that uses technology to find the function that fits messy data as perfectly as possible.
R-Squared (\(R^2\))
A "Score" from 0 to 1 that tells us how well our model fits the data.
0 (Terrible)
1 (Perfect)
"Regression is like a computer referee deciding the winner of the best-fit contest."
Phase 2: Computer Referee
Activity (20 min)
Steps
1. Open geogebra.org/calculator
2. Enter points as a List : L1 = {(0,10), (1,16), ...}
3. Command: FitLine(L1)
4. Command: RSquare(L1, f)
Compare Your Score!
The computer will calculate the Line of Best Fit. How close was your manual drawing to the optimal line?
My Line
y = ?x + ?
Computer Line
y = 15.04x + 6.36
Why Does It Matter?
Climate
Predicting sea level rise based on decades of "messy" temperature data.
Health
Modeling the spread of viruses when not every case is reported.
Business
Estimating how much stock to buy for Black Friday sales.
"In the real world, the dots never line up perfectly. Math builds the bridge."
Computer Referee Worksheet THE COMPUTER REFEREE
Data Analysis Lab
Name:
Date:
Video Evidence (0:00 - 1:40)
As you watch the intro, answer these two questions:
1. Why is it impossible to find a perfect function for real-world data?
2. In your own words, what is "Regression"?
The GeoGebra Challenge
The Code
1 Go to geogebra.org/calculator
2 Type: L1 = {(0,10), (1,16), (2,32), (3,48), (4,60), (5,84), (6,96)}
3 Find the line: Type FitLine(L1). This is the "True" best fit line.
4 Score it: Type RSquare(L1, f).
The Verdict
Computer's Equation (\(f(x)\))
\( y = \)
Computer's \(R^2\) Score
\( R^2 = \)
My Manual \(R^2\) Score (Optional Trial)
If you have time, try to type your manual line into GeoGebra as g(x) = ... and then use RSquare(L1, g).
\( R^2 = \)
Final Reflection: Choosing the Model
3. Looking at the \(R^2\) score from GeoGebra, how "perfect" was the computer's line? (Closer to 0 or 1?)
The Expert Move
In the video (6:43), they try another command: FitGrowth(L1).
Enter this data into GeoGebra. What is the \(R^2\) for Exponential Growth?
\( R^2 = \)
Which model fits this specific data better: LINEAR or EXPONENTIAL?
Final Thought:
Scientists don't just "guess" lines anymore. They use these tools to make predictions that affect millions of people. If your \(R^2\) score is 0.40, would you trust your model to predict the future? Why or why not?
Data Lab Teacher Guide TEACHER GUIDE
Messy Math: Intro to Regression
Grade 8 Pre-Algebra
Duration: 45-50 min
Learning Objectives
Understand that real-world data rarely fits perfect functions.
Learn the definition of Regression and R-Squared .
Use GeoGebra to calculate lines of best fit and evaluate model strength.
Materials Needed
Messy Data Handout
Computer Referee Worksheet
Devices with GeoGebra
Rulers (1 per student)
Pacing
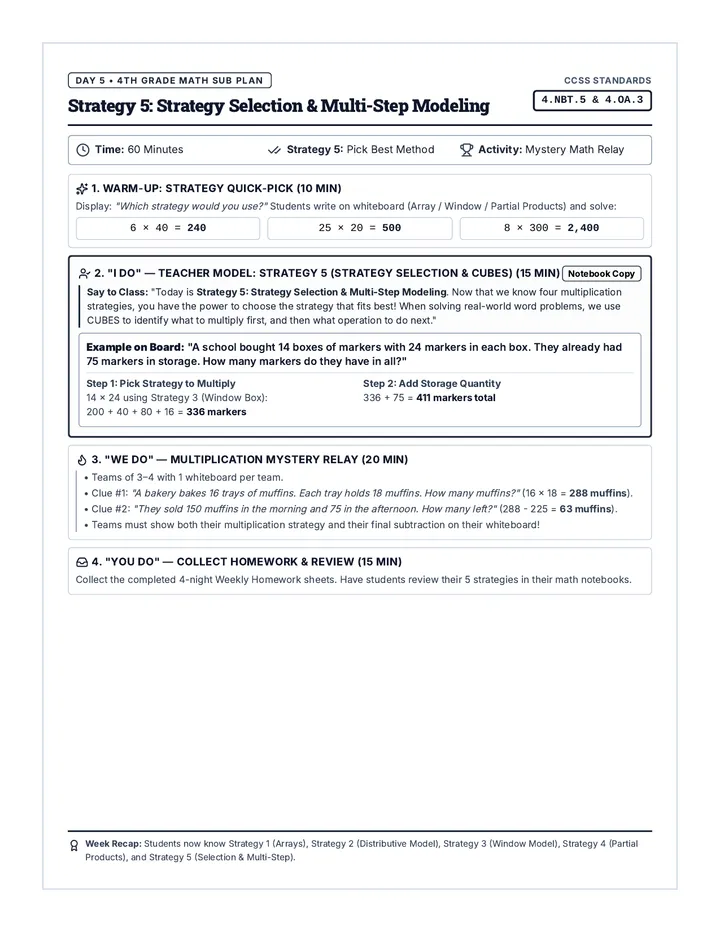
Hook: Draw the Line 10 min
Video Discussion 10 min
GeoGebra Activity 20 min
Reflection & Closure 10 min
"Model selection is the bridge between pure math and applied science."
Lesson Procedure
1
Hook: Draw the Line (10 min)
Hand out the "Messy Data Handout". Students use a physical ruler to draw what they think is the "Best Fit Line".
Teacher Tip:
Walk around and point out the variety. "Sam's line is lower at Day 0 but steeper. Maya's line hits Day 3 perfectly but misses Day 6. Who is right?"
2
The "Opinion" Problem (10 min)
Show the video (0:00 - 1:40). Use the Slideshow for visual support. Discuss the concept that regression removes human bias.
Vocab Check: Regression, R-Squared.
3
Phase 2: Computer Referee (20 min)
Students open GeoGebra and follow the worksheet instructions. They will enter the data points from the handout and compare their manual line to the computer's line.
Common Pitfall:
In GeoGebra, students must use curly braces for lists: L1 = {(x1,y1), (x2,y2)...}. Ensure they use commas correctly between coordinates.
4
Model Selection & Reflection (5-10 min)
Have students try the FitGrowth(L1) command. For this dataset, the Exponential model (\(R^2 \approx 0.995\)) beats the Linear model (\(R^2 \approx 0.909\)). Discuss why a "curved" model fits biological growth (plants) better than a straight line.
Answer Key & Key Metrics
Linear Regression Metrics
Best Fit Equation: \( y = 15.04x + 6.36 \)
R-Squared (\(R^2\)): 0.9091
Exponential Growth Metrics
Best Fit Equation: \( y = 8.95(1.49)^x \)
R-Squared (\(R^2\)): 0.9954
Discussion Prompt:
"We saw the exponential model has a much higher R-Squared score. Why does that make sense for a plant? Do plants grow exactly 15cm every day (linear), or do they grow faster as they get more leaves (exponential)?"