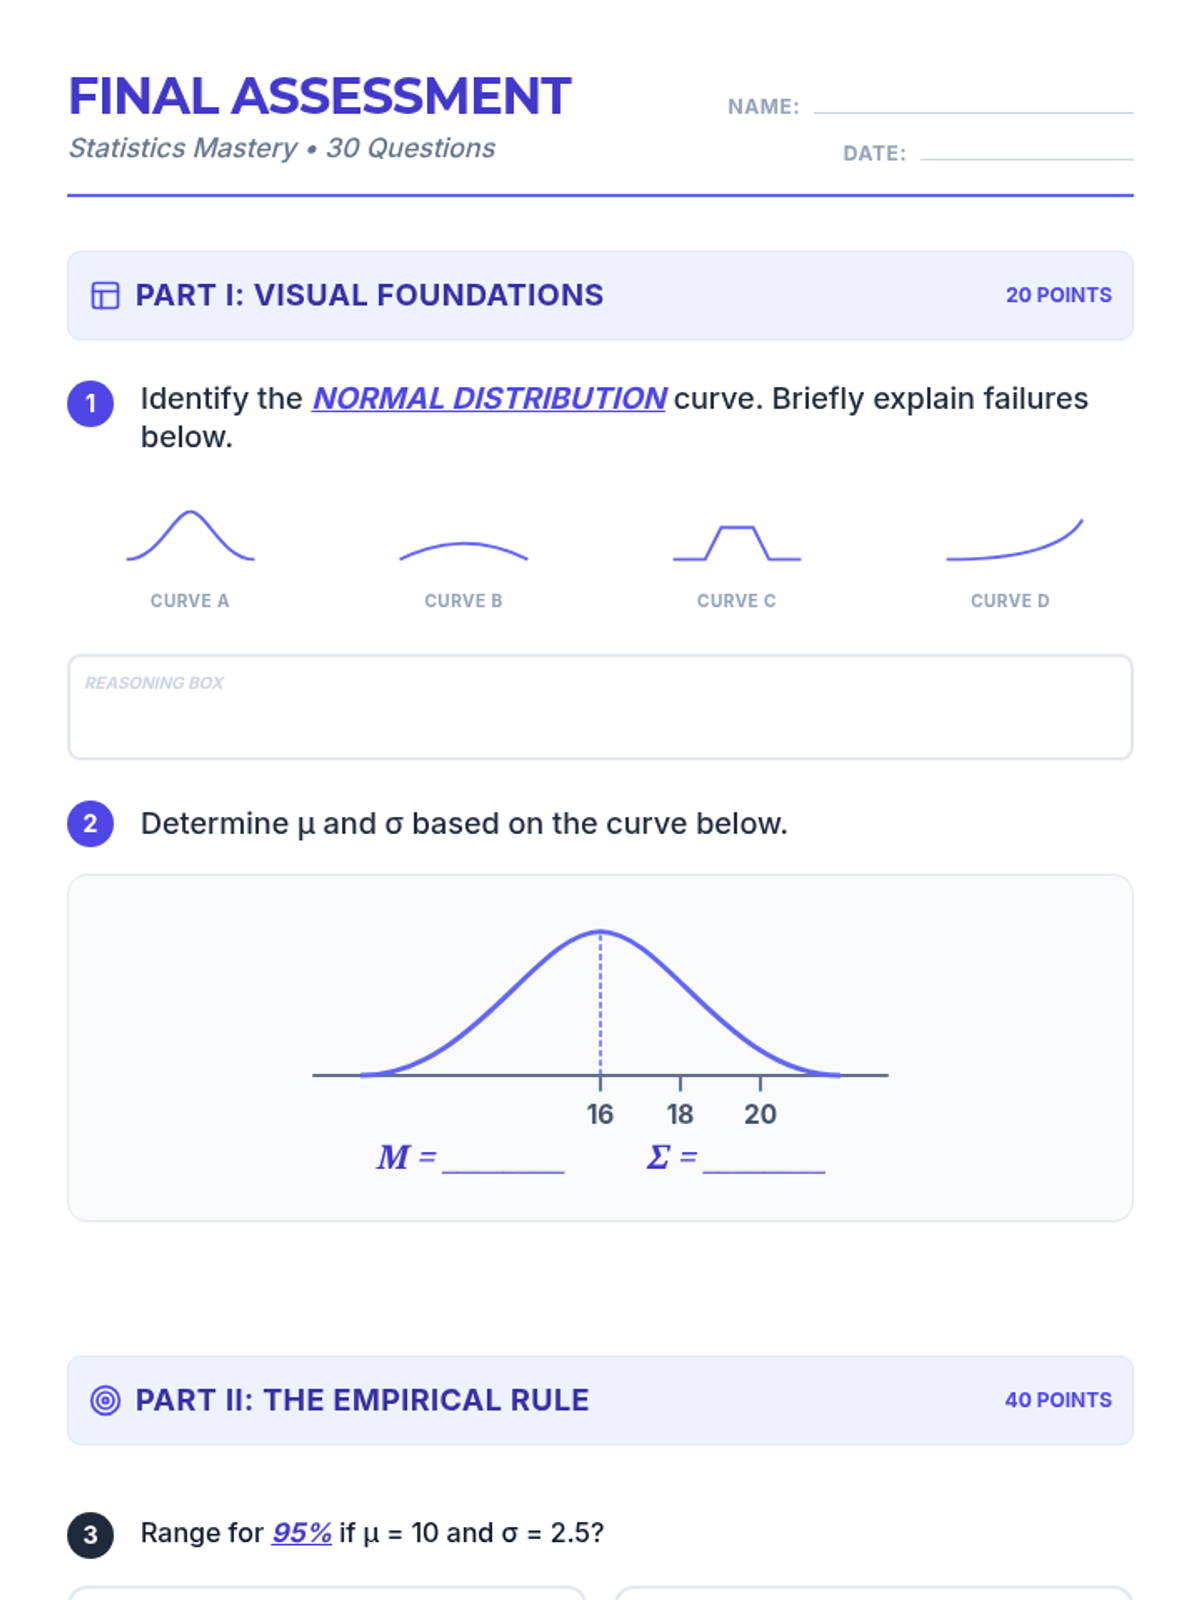
This lesson covers the fundamentals of normal distributions, including identifying bell curves, applying the empirical rule, and interpreting control charts for real-world data analysis.
A summative assessment lesson focusing on visual foundations, probability calculations, and the application of the Central Limit Theorem to sampling distributions.
A comprehensive lesson covering the properties of normal distributions, the empirical rule, and z-score calculations through various real-world scenarios.
Students interpret the meaning of the point of intersection, surplus, and shortage in the context of a real-world market.
Students create and compare multiple sets of data tables for supply and demand to identify the market equilibrium price where quantities match.
A comprehensive lesson on calculating the area and circumference of circles using the radius, featuring blueprint-themed instructional materials and practice.
In this hands-on simulation, third graders become pizza chefs to master equivalent fractions and partitioning. Students will fulfill custom orders, compare topping amounts, and visualize fractions as parts of a delicious whole.
A comprehensive introduction to one-to-one correspondence for numbers 1-10 using a friendly garden theme. Students will practice matching, counting, and representing quantities through visual aids and hands-on worksheets.
A focused lesson on the Central Limit Theorem (CLT) and its application to real-world datasets. Students practice calculating Z-scores for sample means and using Z-tables to determine probabilities.
A lesson focused on fundamental statistical concepts including sampling distributions and the visual representation of data using histograms.
A concise lesson reviewing advanced statistical concepts including population parameters, sample statistics, and the behavior of sampling distributions.
A focused practice session on calculating probabilities and z-values for normal distributions, based on medical and abstract data.
A focused lesson on calculating and interpreting z-scores and normal distributions using real-world scenarios from the textbook. Students will practice converting between raw scores and z-scores and determine the "unusualness" of specific data points.
An immersive, station-based experience where students rotate through various cryptographic challenges, using letter ciphers, symbol keys, and logic puzzles to earn their 'Shadow Agent' status.
Students plot two linear equations on a single coordinate plane to find the point of intersection and identify the equilibrium price and quantity visually.
A 9th grade Algebra lesson focused on translating real-world scenarios (media, sports, food) into a system of two linear equations, specifically designed for Special Education students with IEP supports.
A collection of addition and subtraction word problems themed around a local town fair. Includes one-step practice and multi-step challenge problems designed for 3rd-grade students to build fluency with regrouping and logical reasoning up to 100.
Students define supply and demand and learn to solve for the point of intersection algebraically by setting equations equal.
Students learn the requirements for the Price Patrol project and begin planning their grocery catalog, including selecting categories, items, and pricing strategies.
A high-energy 'Scoot' game where students solve two-step equations with fractional coefficients, using a construction-blueprint theme to build algebraic fluency.
A 9th grade Algebra lesson focused on interpreting the intersection point of a system of equations in a real-world context (media, sports, food), specifically designed for Special Education students with IEP supports.
Students synthesize their design and financial data into a final statistical report and presentation for a hypothetical city council.
Focusing on procurement, students manage a complex budget using multi-step decimal operations for material costs, labor, and taxes.