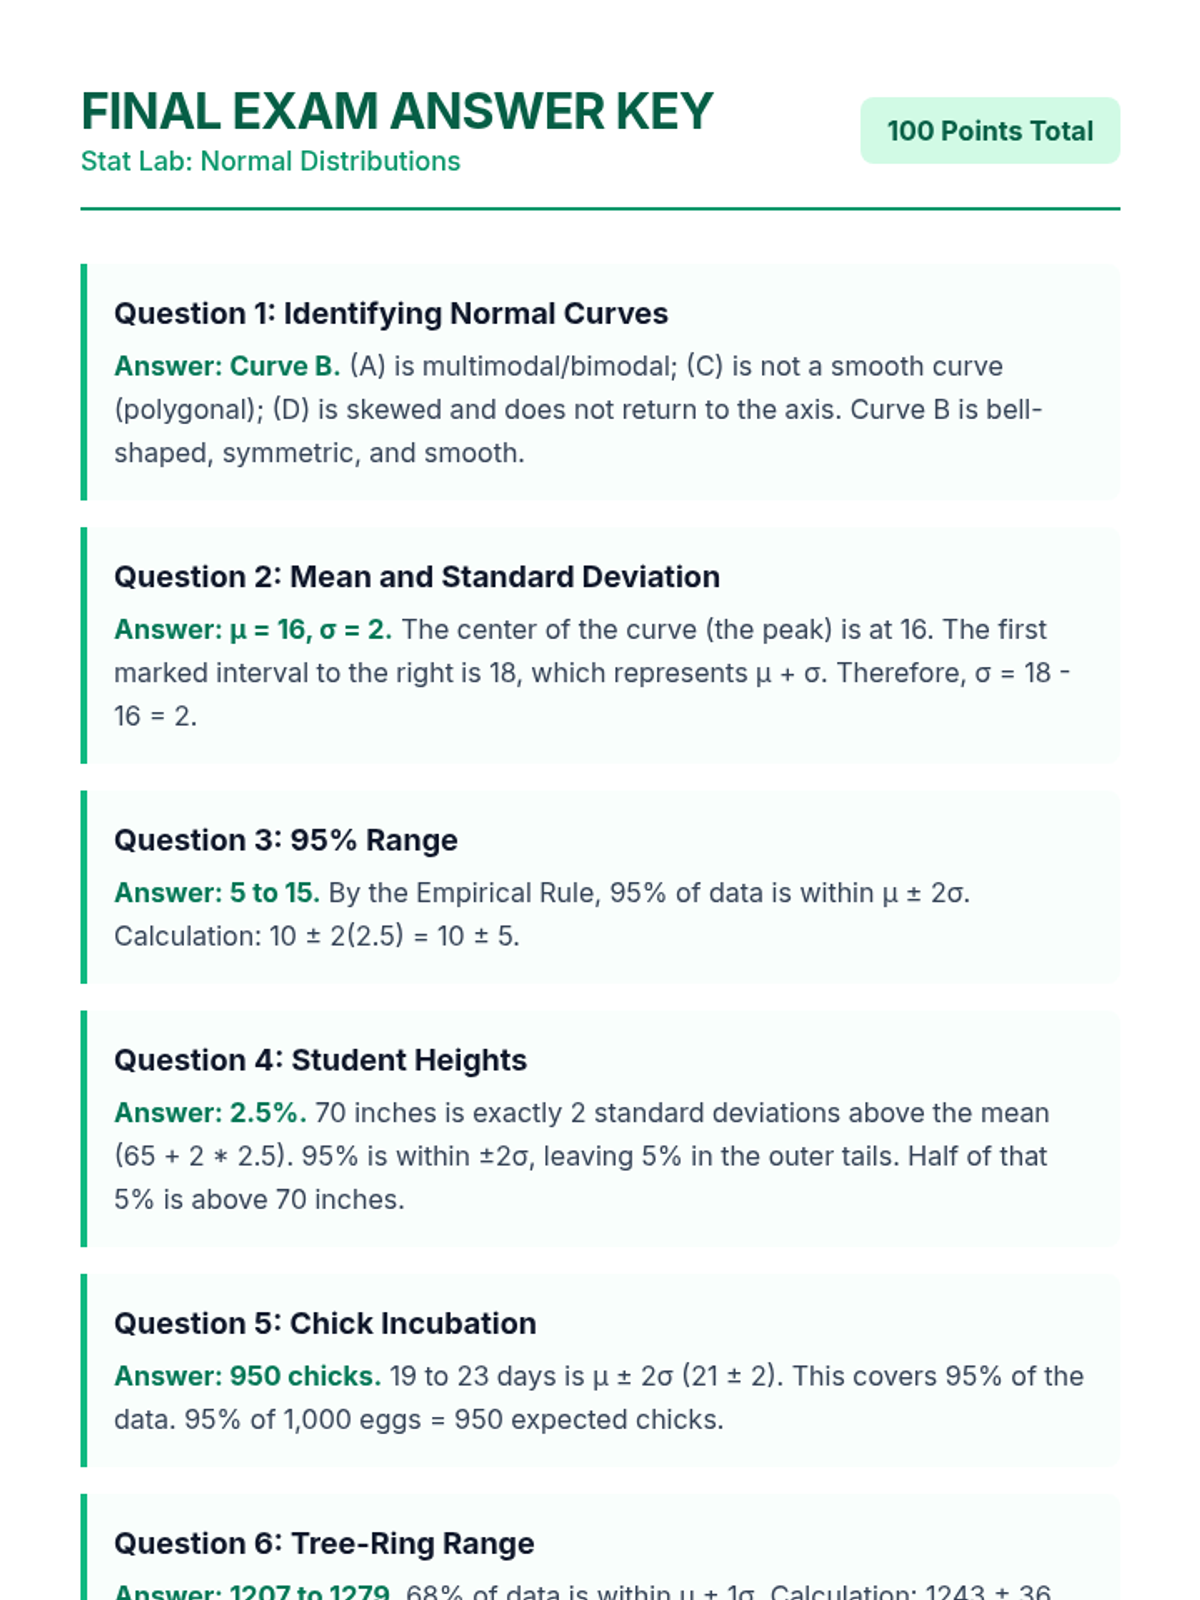
A comprehensive lesson covering the properties of normal distributions, the empirical rule, and z-score calculations through various real-world scenarios.
A summative assessment lesson focusing on visual foundations, probability calculations, and the application of the Central Limit Theorem to sampling distributions.
Students interpret the meaning of the point of intersection, surplus, and shortage in the context of a real-world market.
Students create and compare multiple sets of data tables for supply and demand to identify the market equilibrium price where quantities match.
A focused lesson on the Central Limit Theorem (CLT) and its application to real-world datasets. Students practice calculating Z-scores for sample means and using Z-tables to determine probabilities.
A lesson focused on fundamental statistical concepts including sampling distributions and the visual representation of data using histograms.
A concise lesson reviewing advanced statistical concepts including population parameters, sample statistics, and the behavior of sampling distributions.
A focused practice session on calculating probabilities and z-values for normal distributions, based on medical and abstract data.
A focused lesson on calculating and interpreting z-scores and normal distributions using real-world scenarios from the textbook. Students will practice converting between raw scores and z-scores and determine the "unusualness" of specific data points.
This lesson covers the fundamentals of normal distributions, including identifying bell curves, applying the empirical rule, and interpreting control charts for real-world data analysis.
Students plot two linear equations on a single coordinate plane to find the point of intersection and identify the equilibrium price and quantity visually.
Students define supply and demand and learn to solve for the point of intersection algebraically by setting equations equal.
Students synthesize their design and financial data into a final statistical report and presentation for a hypothetical city council.
Focusing on procurement, students manage a complex budget using multi-step decimal operations for material costs, labor, and taxes.
Students translate statistical findings into physical dimensions, applying decimal multiplication and division to manage scale and area calculations.
Students launch the project by analyzing demographic data using decimal operations to identify community needs for their architectural design.
A clear, step-by-step lesson on writing equations for parallel and perpendicular lines in slope-intercept form, featuring visual guides and structured practice.
A lesson focused on distinguishing between rigid transformations (isometries) and non-rigid transformations (dilations) using visual diagrams and geometric properties.
A comprehensive lesson on adding, subtracting, multiplying, and dividing rational expressions with linear and quadratic terms, themed around structural engineering and blueprints.
A comprehensive introduction to graphing quadratic functions using tables of values and identifying key features like the vertex and axis of symmetry.