Graph Stories Task Worksheet
Task 1
Trend Spotter
Name: ___________________ Date: __________
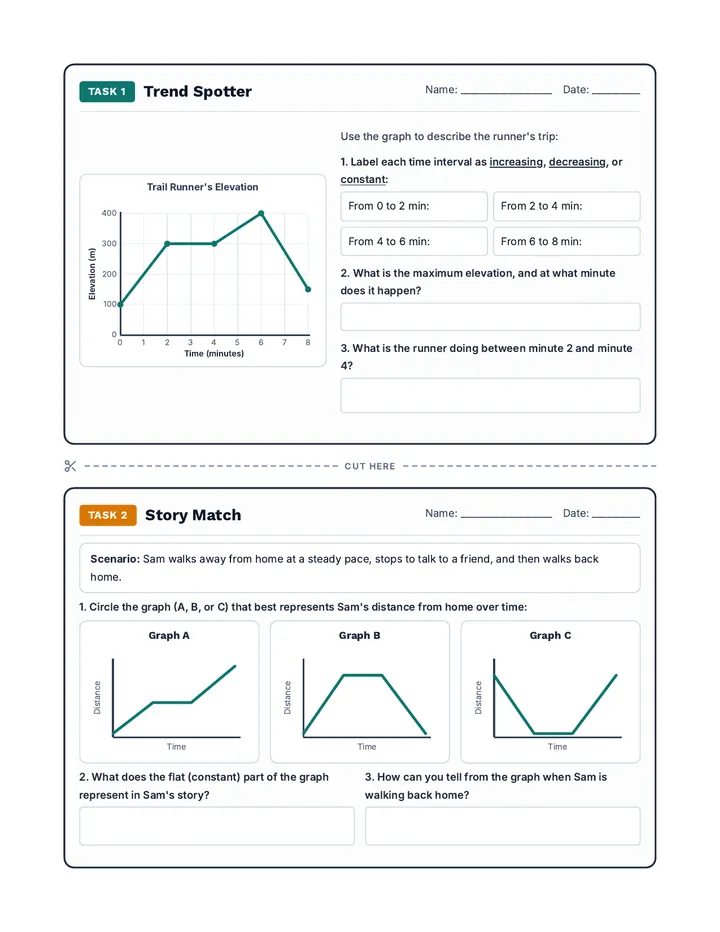
Trail Runner's Elevation
0 100 200 300 400 0 1 2 3 4 5 6 7 8 Time (minutes) Elevation (m)
Use the graph to describe the runner's trip:
1. Label each time interval as increasing, decreasing, or constant:
From 0 to 2 min:
From 2 to 4 min:
From 4 to 6 min:
From 6 to 8 min:
2. What is the maximum elevation, and at what minute does it happen?
3. What is the runner doing between minute 2 and minute 4?
Cut Here
Task 2
Story Match
Name: ___________________ Date: __________
Scenario: Sam walks away from home at a steady pace, stops to talk to a friend, and then walks back home.
1. Circle the graph (A, B, or C) that best represents Sam's distance from home over time:
Graph A Time Distance
Graph B Time Distance
Graph C Time Distance
2. What does the flat (constant) part of the graph represent in Sam's story?
3. How can you tell from the graph when Sam is walking back home?
Task 3
Interval Code
Name: ___________________ Date: __________
Rain Barrel Water Depth
0 10 20 30 40 50 60 70 0 1 2 3 4 5 6 Time, x (hours) Depth (cm)
1. Write an inequality (like \(0 < x < 2\)) for each interval:
Increasing:
Constant:
Decreasing:
2. Compare the steepness (rate of change) on \(0 < x < 2\) vs. \(2 < x < 3\). During which interval did it rain harder, and how do you know?
3. What is the total change in water depth on \(4 < x < 6\), and what does it mean in context?
Cut Here
Task 4
Double Feature
Name: ___________________ Date: __________
Metal Rod Temperature
0 10 20 30 40 50 60 70 0 1 2 3 4 5 6 7 8 Time, x (minutes) Temp (°C)
1. Classify each interval using both visual features (Increasing / Decreasing / Constant AND Straight [Linear] / Curved [Nonlinear]):
| Interval |
Direction |
Straight (Linear) / Curved (Nonlinear) |
| \(0 < x < 3\) |
|
|
| \(3 < x < 5\) |
|
|
| \(5 < x < 8\) |
|
|
2. Write 2 sentences describing the rod's temperature story, including its maximum temperature and where the graph is curved vs. straight:
Task 5
Graph Sketcher
Name: ___________________ Date: __________
Sketch a graph of a cyclist's speed (km/h) over a 10-minute ride that matches all of these features:
- Starts at \(0\text{ km/h}\) when \(t = 0\).
- For \(0 < t < 3\): speed increases in a curve (nonlinear—starting slowly, then getting steeper) up to \(20\text{ km/h}\).
- For \(3 < t < 6\): speed stays constant (flat) at \(20\text{ km/h}\).
- For \(6 < t < 8\): speed increases in a straight line (linear) to a maximum of \(28\text{ km/h}\).
- For \(8 < t < 10\): speed decreases in a straight line (linear) back to \(0\text{ km/h}\).
Cyclist's Speed Over Time
0 5 10 15 20 25 30 0 1 2 3 4 5 6 7 8 9 10 Time, t (minutes) Speed (km/h)
Cut Here
Task 6
Edge Case Detective
Name: ___________________ Date: __________
Candle Height (Bounded Segment)
0 2 4 6 8 10 0 1 2 3 4 5 6 7 Time, x (hours) Height (cm)
1. Identify the maximum and minimum candle heights and the \(x\)-values where they occur:
Maximum:
Minimum:
2. Write an inequality for the domain of this segment and classify it (increasing/decreasing & straight [linear]/curved [nonlinear]):
3. Why does this line segment have a maximum and minimum even though it never changes direction?
Graph Stories Answer Key
Teacher Resource & Task Check
Graph Stories Answer Key
Standard: 8.F.B.5 | Tasks: 1–6
Task 1
Trend Spotter
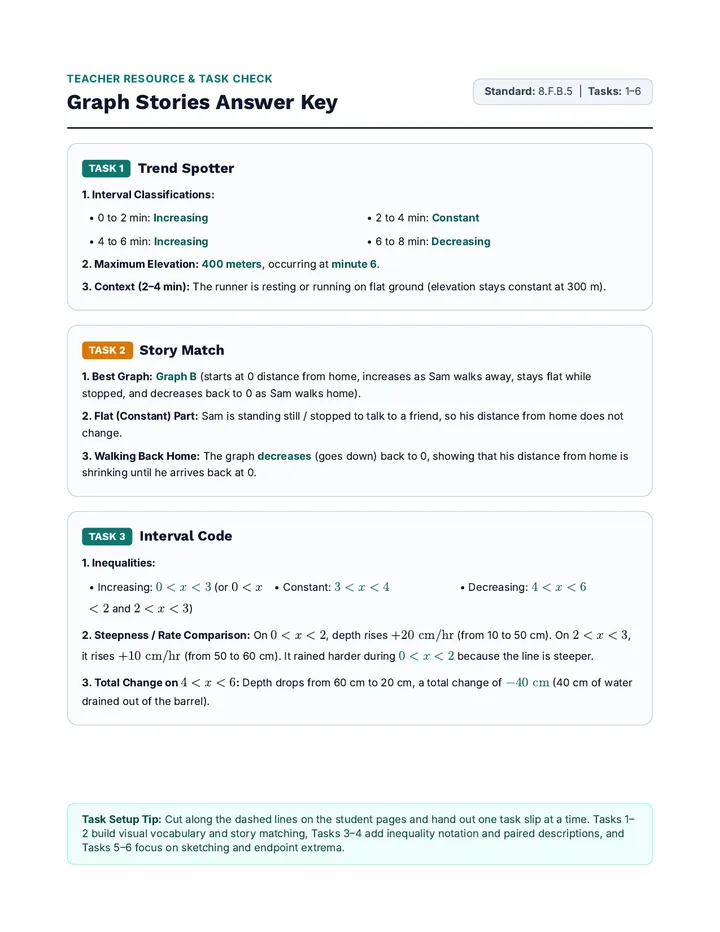
1. Interval Classifications:
• 0 to 2 min: Increasing
• 2 to 4 min: Constant
• 4 to 6 min: Increasing
• 6 to 8 min: Decreasing
2. Maximum Elevation: 400 meters, occurring at minute 6.
3. Context (2–4 min): The runner is resting or running on flat ground (elevation stays constant at 300 m).
Task 2
Story Match
1. Best Graph: Graph B (starts at 0 distance from home, increases as Sam walks away, stays flat while stopped, and decreases back to 0 as Sam walks home).
2. Flat (Constant) Part: Sam is standing still / stopped to talk to a friend, so his distance from home does not change.
3. Walking Back Home: The graph decreases (goes down) back to 0, showing that his distance from home is shrinking until he arrives back at 0.
Task 3
Interval Code
1. Inequalities:
• Increasing: \(0 < x < 3\) (or \(0 < x < 2\) and \(2 < x < 3\))
• Constant: \(3 < x < 4\)
• Decreasing: \(4 < x < 6\)
2. Steepness / Rate Comparison: On \(0 < x < 2\), depth rises \(+20\text{ cm/hr}\) (from 10 to 50 cm). On \(2 < x < 3\), it rises \(+10\text{ cm/hr}\) (from 50 to 60 cm). It rained harder during \(0 < x < 2\) because the line is steeper.
3. Total Change on \(4 < x < 6\): Depth drops from 60 cm to 20 cm, a total change of \(-40\text{ cm}\) (40 cm of water drained out of the barrel).
Task Setup Tip: Cut along the dashed lines on the student pages and hand out one task slip at a time. Tasks 1–2 build visual vocabulary and story matching, Tasks 3–4 add inequality notation and paired descriptions, and Tasks 5–6 focus on sketching and endpoint extrema.
Task 4
Double Feature
| Interval |
Direction |
Straight (Linear) / Curved (Nonlinear) |
| \(0 < x < 3\) |
Increasing |
Curved (Nonlinear) |
| \(3 < x < 5\) |
Constant |
Straight (Linear / Flat) |
| \(5 < x < 8\) |
Decreasing |
Straight (Linear) |
2. Sample Summary: The rod heats up in a curve (quickly at first, then slowing down) until reaching its maximum temperature of \(65^\circ\text{C}\) at minute 3, where it stays flat for 2 minutes. From minute 5 to 8, it cools back down to \(20^\circ\text{C}\) in a straight line.
Task 5
Graph Sketcher
0 10 20 30 0 3 6 8 10
Look-fors in Student Sketches:
- Starts at \((0, 0)\).
- \(0 < t < 3\): Curved upward (starts gentle, gets steeper) ending at \((3, 20)\).
- \(3 < t < 6\): Flat horizontal segment at \(20\text{ km/h}\).
- \(6 < t < 8\): Straight line segment rising to peak \((8, 28)\).
- \(8 < t < 10\): Straight line segment falling back to \((10, 0)\).
Task 6
Edge Case Detective
1. Extrema: Maximum height is 8 cm (at \(x = 1\)); Minimum height is 3 cm (at \(x = 6\)).
2. Domain & Classification: Domain is \(1 \le x \le 6\) (accept \(1 < x < 6\)). The graph is decreasing and straight (linear).
3. Reasoning: Because the line segment has closed endpoints (it starts at \(x = 1\) and stops at \(x = 6\)), its highest and lowest values occur at the endpoints \((1, 8)\) and \((6, 3)\) rather than at a turning point.