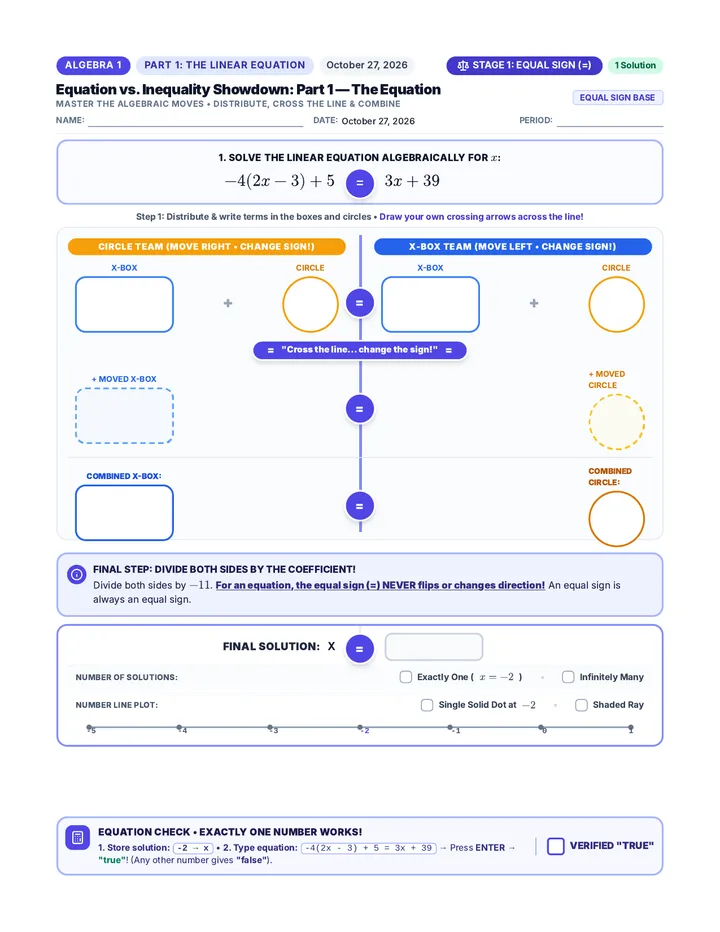
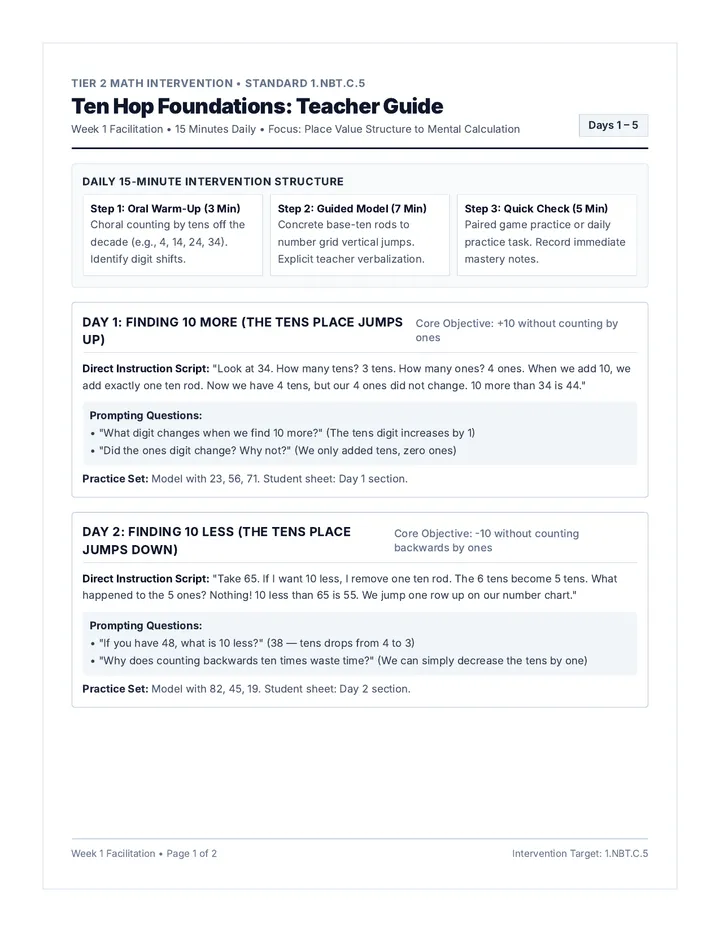
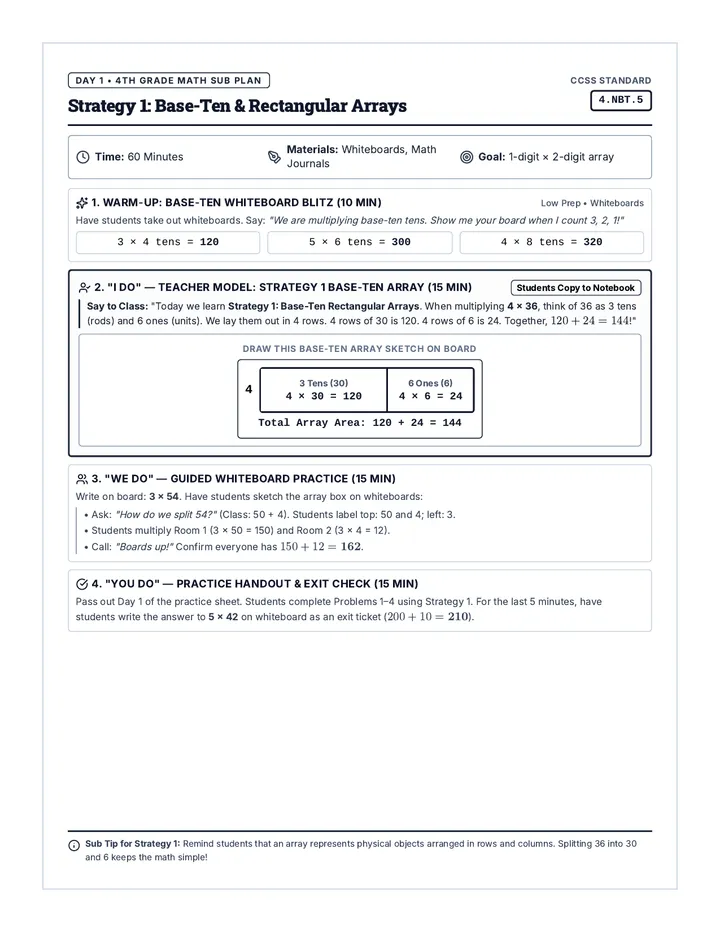
Functions and Graphs Review A comprehensive high school algebra review covering function characteristics, linear models, inequalities, and absolute value graphs. Features targeted multi-part practice worksheets and an extensive teacher solutions guide.
N ntobin
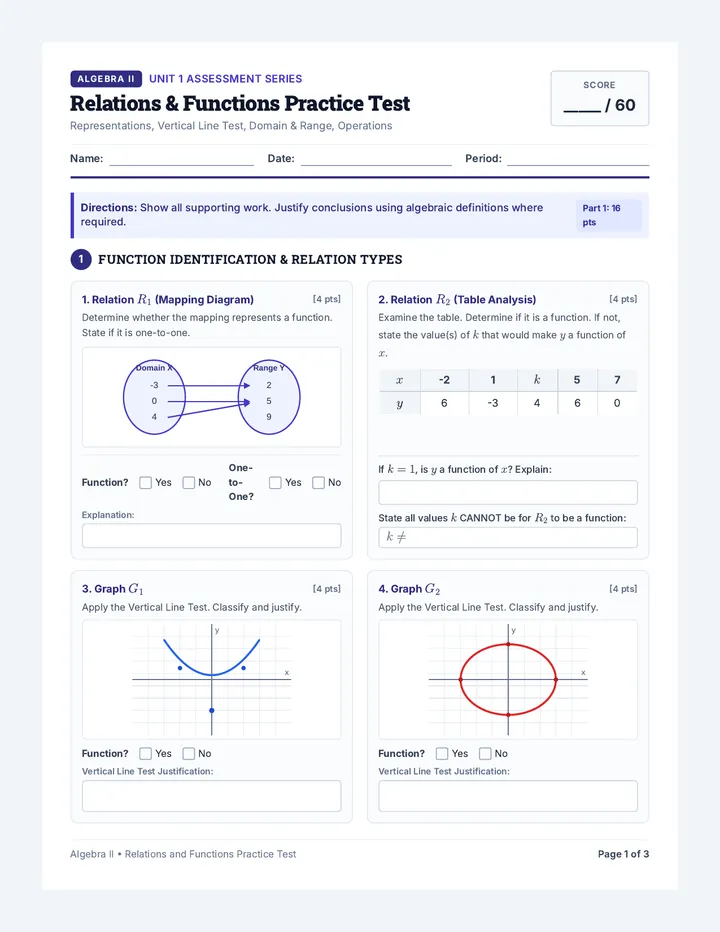
Function Features Practice Worksheet
Updated student practice worksheet with fresh numbers covering Sections 1.1 through 1.4: domain and range, linear versus nonlinear representations, even and odd symmetry, extrema, end behavior, and function comparisons.
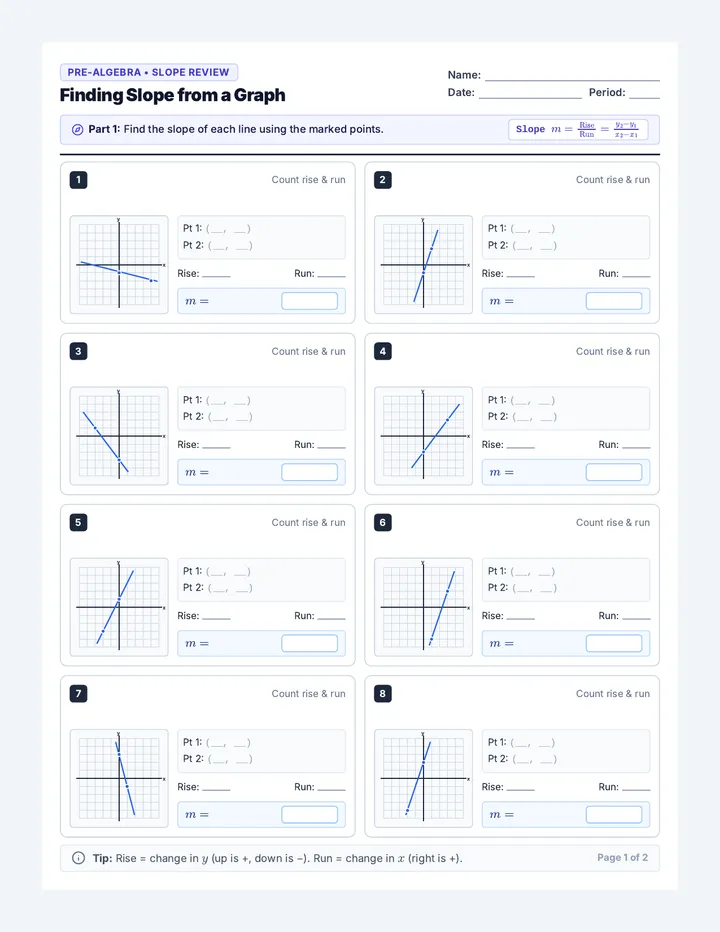
Lines and Transformations Practice Worksheet
Updated student practice worksheet with fresh numbers covering Sections 1.5 through 1.7: graphing lines by intercepts and slope-intercept form, linear inequalities, graphing and writing absolute value functions, and a real-world linear programming application.
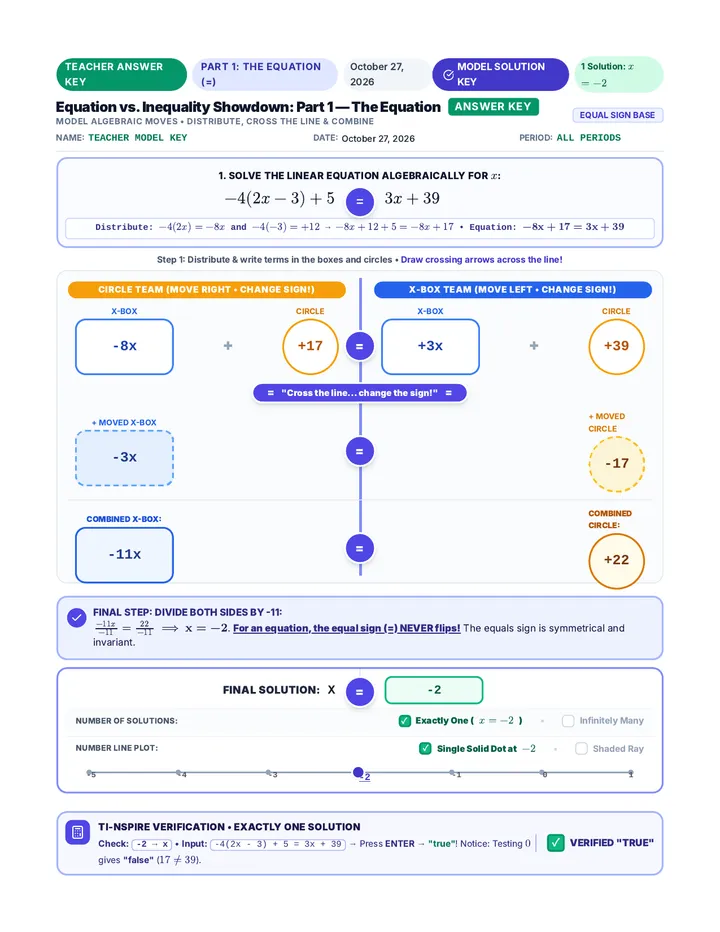
Functions Review Solutions Guide
Updated complete teacher answer key and step-by-step solutions guide for all 23 problems across both practice worksheets with the updated numerical values.
Functions and Graphs Review A comprehensive high school algebra review covering function characteristics, linear models, inequalities, and absolute value graphs. Features targeted multi-part practice worksheets and an extensive teacher solutions guide.
N ntobin
Function Features Practice Worksheet Unit 1 • Functions & Relations
Function Features & Analysis
Practice: Domain, Range, Linearity, and Intercepts (Sections 1.1 - 1.2)
Name:
Date:
Period:
1
Find domain and range in set-builder and interval notation. (Section 1.1)
Part a.
x y -5 4 3 -4
Set-Builder Notation:
Domain:
Range:
Interval Notation:
Domain:
Range:
Part b.
x y -1 -3
Set-Builder Notation:
Domain:
Range:
Interval Notation:
Domain:
Range:
2
Write two equations that are linear and two equations that are non-linear. Explain your reasoning. (Section 1.2)
Linear Equations:
Reasoning:
Non-Linear Equations:
Reasoning:
3
Estimate the \(x\) and \(y\) intercept(s) of the graph.
x y -4 -1 3 2
\(x\)-intercept(s):
\(y\)-intercept(s):
Page 1 of 3 • Section 1.1 - 1.2
Unit 1 • Functions & Relations
Linearity, Parity & Symmetry Analysis
Section 1.2
4
Determine if the ordered pairs represent a linear or nonlinear function. Explain your reasoning. (Section 1.2)
Table a.
<table class="w-full text-center border-collapse bg-white rounded overflow-hidden shadow-sm text-[11px]"><tbody><tr class="bg-indigo-50 border-b border-indigo-100 font-semibold text-indigo-900"><td class="py-0.5 px-1 border-r border-indigo-100 font-bold">x</td><td class="py-0.5 px-1">5</td><td class="py-0.5 px-1">11</td><td class="py-0.5 px-1">17</td><td class="py-0.5 px-1">23</td><td class="py-0.5 px-1">29</td><td class="py-0.5 px-1">35</td></tr><tr class="text-slate-800"><td class="py-0.5 px-1 border-r border-indigo-100 font-bold bg-indigo-50/50">y</td><td class="py-0.5 px-1">14</td><td class="py-0.5 px-1">9</td><td class="py-0.5 px-1">4</td><td class="py-0.5 px-1">-1</td><td class="py-0.5 px-1">-6</td><td class="py-0.5 px-1">-12</td></tr></tbody></table>
Classification:
Linear Nonlinear
Reasoning / Rate of Change Work:
Table b.
<table class="w-full text-center border-collapse bg-white rounded overflow-hidden shadow-sm text-[11px]"><tbody><tr class="bg-indigo-50 border-b border-indigo-100 font-semibold text-indigo-900"><td class="py-0.5 px-1 border-r border-indigo-100 font-bold">x</td><td class="py-0.5 px-1">-6</td><td class="py-0.5 px-1">-2</td><td class="py-0.5 px-1">2</td><td class="py-0.5 px-1">6</td><td class="py-0.5 px-1">10</td></tr><tr class="text-slate-800"><td class="py-0.5 px-1 border-r border-indigo-100 font-bold bg-indigo-50/50">y</td><td class="py-0.5 px-1">-5</td><td class="py-0.5 px-1">-2</td><td class="py-0.5 px-1">1</td><td class="py-0.5 px-1">4</td><td class="py-0.5 px-1">7</td></tr></tbody></table>
Classification:
Linear Nonlinear
Reasoning / Rate of Change Work:
5
Even, odd, or neither? Confirm algebraically. (Section 1.2)
a. \(f(x) = 3x^4 - 5x^2 - 7\)
Evaluate \(f(-x)\):
Result:
b. \(f(x) = 4x^3 + 3x\)
Evaluate \(f(-x)\):
Result:
c. \(f(x) = 2x^3 - 4x^2 + 1\)
Evaluate \(f(-x)\):
Result:
6
Assume that \(f\) is a function that contains the point \((-3, 7)\). Which of the given points must be included in the function if \(f\) is:
(Hint: Graph or reflect the coordinates across the axes to help visualize symmetry.)
(-3, -7) (3, -7) (-7, -3) (3, 7) (7, 3)
even?
odd?
Page 2 of 3 • Section 1.2
Unit 1 • Functions & Relations
Extrema, End Behavior & Function Modeling
Sections 1.3 - 1.4
7
Identify extrema and end behavior for the following graphs: (Section 1.3)
Part a.
(-3, -2) (1, 5)
Relative Max:
Relative Min:
As \(x \to -\infty\), \(y \to\)
As \(x \to \infty\), \(y \to\)
Part b.
(-2, -3) (1, 3) (4, -1)
Rel Max:
Abs Min:
Rel Min:
As \(x \to -\infty\), \(y \to\)
As \(x \to \infty\), \(y \to\)
8
Sketch the graph from the given criteria (Section 1.4)
Part a.
• Nonlinear
• Positive when \(x > 4\)
• Rel Min at \((-2, -3)\)
• Rel Max at \((2, 2)\)
• \(y\)-intercept at \((0, -0.5)\)
• As \(x \to -\infty, y \to -\infty\)
• As \(x \to \infty, y \to \infty\)
x y
Part b.
• Linear
• Negative when \(x < -1.5\)
• \(y\)-intercept at \((0, 3)\)
• As \(x \to -\infty, y \to -\infty\)
• As \(x \to \infty, y \to \infty\)
x y
9
Which statements about \(f(x)\) and \(g(x)\) are true? Select all that apply. (Section 1.4)
Function \(f(x)\)
<table class="w-full text-center border-collapse bg-white rounded border border-slate-200 text-[10px]"><tbody><tr class="bg-indigo-50 border-b border-indigo-100 font-bold text-indigo-900"><td class="py-0.5 border-r border-indigo-100">x</td><td class="py-0.5">f(x)</td></tr><tr class="border-b border-slate-100"><td class="py-0.5 border-r border-slate-200">-3</td><td class="py-0.5">7</td></tr><tr class="border-b border-slate-100"><td class="py-0.5 border-r border-slate-200">0</td><td class="py-0.5">3</td></tr><tr class="border-b border-slate-100"><td class="py-0.5 border-r border-slate-200">3</td><td class="py-0.5">-1</td></tr><tr><td class="py-0.5 border-r border-slate-200">6</td><td class="py-0.5">-5</td></tr></tbody></table>
(0, -2) (4, 0) g(x)
\(f(x)\) has a faster rate of change than \(g(x)\) The \(x\)-intercept of \(f(x)\) is greater than the \(x\)-intercept of \(g(x)\) \(f(x)\) is decreasing and \(g(x)\) is increasing The \(y\)-intercept of \(g(x)\) is less than the \(x\)-intercept of \(f(x)\)
Page 3 of 3 • Sections 1.3 - 1.4
Lines and Transformations Practice Worksheet Unit 1 • Functions & Relations
Lines & Absolute Value Functions
Practice: Linear Forms, Inequalities, and Absolute Value (Sections 1.5 - 1.7)
Name:
Date:
Period:
Plot key points, show all boundary lines clearly (solid vs. dashed), and shade feasible regions where appropriate. Section 1.5
10
Graph using the \(x\) and \(y\) intercepts only.
\(\frac{1}{2}x + 3y = 3\)
\(x\)-int:
\(y\)-int:
x y
11
Graph using slope-intercept form.
\(-4x + 2y = -6\)
Form \(y = mx + b\):
x y
12
Graph the inequality.
\(y \le -\frac{2}{3}x + 1\)
Boundary: [ ] Solid [ ] Dashed Shade: [ ] Above [ ] Below
x y
13
Graph the inequality.
\(y > \frac{3}{2}x\)
Boundary: [ ] Solid [ ] Dashed Shade: [ ] Above [ ] Below
x y
Page 1 of 4 • Section 1.5
Unit 1 • Functions & Relations
Absolute Value & Graphic Analysis
Sections 1.6 - 1.7
14
Graph the absolute value function.
\(y = -|x - 2| + 4\)
Vertex \((h, k)\): ________ Opens: [ ] Up [ ] Down
x y
15
Graph the absolute value function.
\(y = \frac{3}{4}|x + 2| - 3\)
Vertex \((h, k)\): ________ Slope of sides: \(a = \) _____
x y
16
Write the absolute value function. (1.7)
Identify vertex and stretch factor \(a\) from graph:
(-1, 4) (1, 0)
Function Equation:
17
Write the inequality for the graph. (1.5)
Examine slope, intercept, line style, and shaded region:
(0, -2) (3, 0)
Linear Inequality:
Page 2 of 4 • Sections 1.5 - 1.7
Unit 1 • Functions & Relations
Graphing Absolute Value Functions
Section 1.6 Practice Set
18
Graph the function.
\(y = 3|x| - 4\)
Vertex: (____, ____) Slope \(a = \) _____
x y
19
Graph the function.
\(y = -\frac{1}{3}|x + 3| + 2\)
Vertex: (____, ____) Slope \(a = \) _____
x y
20
Functions Review Solutions Guide Teacher Resource • Answer Key
Functions Review Solutions Guide
Worked Solutions • Part 1: Sections 1.1 - 1.2 (Questions 1 - 6)
Algebra & Functions Master Reference
1 Domain and Range (Section 1.1) Correct Notations
Part a (Segmented Curve with Endpoints):
Set-Builder Domain: \(\{x \mid -5 \le x < 4\}\)Set-Builder Range: \(\{y \mid -4 \le y \le 3\}\)Interval Domain: \([-5, 4)\)Interval Range: \([-4, 3]\)
Note: Closed dot at \(x = -5\) includes endpoint; open dot at \(x = 4\) excludes it. Minimum at \(y = -4\), peak at \(y = 3\).
Part b (Upward Parabola):
Set-Builder Domain: \(\{x \mid x \in \mathbb{R}\}\) (All Reals)Set-Builder Range: \(\{y \mid y \ge -3\}\)Interval Domain: \((-\infty, \infty)\)Interval Range: \([-3, \infty)\)
Note: Parabola vertex at \((-1, -3)\) is a global minimum; curve expands horizontally and vertically to \(+\infty\).
2 Linear vs. Non-Linear Equations & Reasoning (Section 1.2)
Sample Linear Equations:
\(y = 4x - 7\) 2) \(3x + 2y = 12\)
Required Reasoning:
All variables are raised strictly to the first power (\(x^1, y^1\)), with no variable products or variables in denominators, resulting in a constant rate of change.
Sample Non-Linear Equations:
\(y = 3x^2 + 1\) 2) \(y = \frac{5}{x}\) (or \(y = \sqrt{x + 2}\))
Required Reasoning:
Variables have exponents other than 1, reside inside radicals, or are in the denominator, causing the rate of change to vary continuously.
3 Intercept Estimation (Section 1.2)
\(x\)-intercepts: \((-4, 0), (-1, 0), (3, 0)\) (or \(x = -4, -1, 3\))
\(y\)-intercept: \((0, 2)\) (or \(y = 2\))
4 Table Rate of Change Analysis (Section 1.2)
Table a: NONLINEAR
\(\Delta x = +6\) throughout. Differences in \(y\): \(9 - 14 = -5\), \(4 - 9 = -5\), \(-1 - 4 = -5\), \(-6 - (-1) = -5\), but \(-12 - (-6) = \mathbf{-6}\). Because the rate of change shifts from \(-\frac{5}{6}\) to \(-\frac{6}{6} = -1\), it is not constant.
Table b: LINEAR
\(\Delta x = +4\) throughout. Differences in \(y\): \(-2 - (-5) = 3\), \(1 - (-2) = 3\), \(4 - 1 = 3\), \(7 - 4 = 3\). The rate of change is strictly constant: \(m = \frac{3}{4} = \mathbf{0.75}\).
Graph the function. Vertex: (____, ____) Slope \(a = \) _____
Graph the function. Vertex: (____, ____) Slope \(a = \) _____
Page 3 of 4 • Section 1.6
Unit 1 • Functions & Relations
Linear Systems & Real-World Modeling Sections 1.5 Applications
Write an equation of the line that has the same slope as \(3x + 6y = 11\) and the same \(y\)-intercept as \(4x - 3y = 9\). (Section 1.5 HW) Step 1: Find slope \(m\) from \(3x + 6y = 11\)
Step 2: Find \(y\)-intercept \(b\) from \(4x - 3y = 9\)
Final Equation (\(y = mx + b\)):
Real-World Concession Stand Modeling (Section 1.5) Marcus is selling hamburgers and sodas at the school carnival. Hamburgers are $4 each and sodas are $2 each. Marcus's goal is to earn at least $80 selling hamburgers and sodas.
a. Write an inequality that expresses how many hamburgers and sodas Marcus needs to sell to meet his goal.
Let \(x\) = the number of hamburgers sold. Let \(y\) = the number of sodas sold.
b. Graph the inequality that represents the money to be raised. (Hint: Each tick mark increases by 5.)
x (Burgers) y (Sodas) 10 20 30 20 40
c. If Marcus sold 12 hamburgers, how many sodas would he need to sell?
Show substitution & algebraic work:
Page 4 of 4 • Sections 1.5 - 1.7
5 Algebraic Parity Confirmations (Section 1.2)
a. \(f(x) = 3x^4 - 5x^2 - 7\)
\(f(-x) = 3(-x)^4 - 5(-x)^2 - 7\)
\(= 3x^4 - 5x^2 - 7 = f(x)\)
\(f(-x) = 4(-x)^3 + 3(-x)\)
c. \(f(x) = 2x^3 - 4x^2 + 1\)
\(f(-x) = -2x^3 - 4x^2 + 1\)
\(\neq f(x)\) and \(\neq -f(x)\)
Odd \((-x, -y)\): (3, -7)
Page 1 of 3 • Solutions Guide: Sections 1.1 - 1.2
Teacher Resource • Answer Key
Functions Review Solutions Guide Worked Solutions • Part 2: Sections 1.3 - 1.5 (Questions 7 - 13)
Extrema & Linear Forms Master Reference
7 Extrema & End Behavior (Section 1.3)
Graph a (Flipped Cubic Curve):
Relative Max: (1, 5) (value \(y = 5\) at \(x = 1\))
Relative Min: (-3, -2) (value \(y = -2\) at \(x = -3\))
As \(x \to -\infty, y \to \infty\) • As \(x \to \infty, y \to -\infty\)
Graph b (Quartic W-Curve Opening Up):
Relative Max: (1, 3) • Abs Min: (-2, -3)
As \(x \to -\infty, y \to \infty\) • As \(x \to \infty, y \to \infty\)
8 Sketch Criteria Verification (Section 1.4)
Graph must pass through \(x\)-intercept \((4, 0)\), dip to relative min at \((-2, -3)\), cross \((0, -0.5)\), crest at relative max \((2, 2)\), and exit with \(y \to -\infty\) as \(x \to -\infty\) and \(y \to \infty\) as \(x \to \infty\).
Straight line through \((-1.5, 0)\) and \((0, 3)\). Equation is \(y = 2x + 3\). Positive slope ensures negative values when \(x < -1.5\) and proper end behavior.
9 Comparing Functions \(f(x)\) and \(g(x)\) (Section 1.4)
[X] Statement 1 is TRUE: Rate of change of \(f(x)\) is \(m = -\frac{4}{3}\) (magnitude \(\approx 1.33\)), whereas \(g(x)\) has rate \(0.5\). \(1.33 > 0.5\).
[ ] Statement 2 is FALSE: \(x\)-intercept of \(f(x)\) is \(2.25\); \(x\)-intercept of \(g(x)\) is \(4\) (\(2.25 < 4\)).
[X] Statement 3 is TRUE: \(f(x)\) is decreasing (\(m = -1.33 < 0\)) and \(g(x)\) is increasing (\(m = 0.5 > 0\)).
[X] Statement 4 is TRUE: \(y\)-intercept of \(g(x)\) is \(-2\); \(x\)-intercept of \(f(x)\) is \(2.25\) (\(-2 < 2.25\)).
10-13 Linear Equations & Inequalities Graphing Key (Section 1.5)
10. \(\frac{1}{2}x + 3y = 3\)
\(y = 0 \implies \frac{1}{2}x = 3 \implies \mathbf{x\text{-int} = (6, 0)}\)
\(x = 0 \implies 3y = 3 \implies \mathbf{y\text{-int} = (0, 1)}\)
Solve: \(2y = 4x - 6 \implies \mathbf{y = 2x - 3}\)
Slope \(m = \mathbf{2}\), \(y\)-intercept \(\mathbf{(0, -3)}\).
12. \(y \le -\frac{2}{3}x + 1\)
Solid line through \((0, 1)\), \((3, -1)\), \((-3, 3)\).
Shading: Below the boundary line.
Dashed line through \((0, 0)\), \((2, 3)\), \((-2, -3)\).
Shading: Above the boundary line.
Page 2 of 3 • Solutions Guide: Sections 1.3 - 1.5
Teacher Resource • Answer Key
Functions Review Solutions Guide Worked Solutions • Part 3: Sections 1.6 - 1.7 (Questions 14 - 23)
Absolute Value & Applications Master Reference
14-17 Absolute Value Transformations & Reading Graphs
Vertex: \(\mathbf{(2, 4)}\) • Opens: Down
Slopes: \(a = -1\) • Intercepts: \((-2, 0), (6, 0), (0, 2)\).
15. \(y = \frac{3}{4}|x + 2| - 3\)
Vertex: \(\mathbf{(-2, -3)}\) • Opens: Up
Slopes: \(a = \pm \frac{3}{4}\) • Key points: \((-6, 0), (2, 0), (6, 3)\).
16. Write Absolute Value Function
Vertex at \((-1, 4)\), opens down through \((1, 0)\) and \((-3, 0)\).
\(0 = a|1 - (-1)| + 4 \implies 2a = -4 \implies a = -2\).
\(\mathbf{y = -2|x + 1| + 4}\)
17. Write Inequality from Graph
Solid boundary through \((0, -2)\) and \((3, 0)\) has slope \(m = \frac{2}{3}\).
Shading is above the line: \(\mathbf{y \ge \frac{2}{3}x - 2}\)
18-21 Targeted Graphing Set Parameters (Section 1.6)
Vertex: \(\mathbf{(0, -4)}\)
Points: \((\pm 1, -1), (\pm 2, 2)\)
19. \(y = -\frac{1}{3}|x + 3| + 2\)
Vertex: \(\mathbf{(-3, 2)}\)
Opens: Down , \(a = -\frac{1}{3}\)
Points: \((0, 1), (-6, 1), (3, 0)\)
Vertex: \(\mathbf{(4, -3)}\)
Points: \((1, 0), (7, 0), (0, 1)\)
21. \(y = -2|x + 1| + 5\)
Vertex: \(\mathbf{(-1, 5)}\)
Points: \((0, 3), (-2, 3), (1, 1)\)
22 Synthesizing Line Equation from Standard Forms (Section 1.5 HW)
Slope: \(3x + 6y = 11 \implies 6y = -3x + 11 \implies y = -\frac{1}{2}x + \frac{11}{6} \implies \mathbf{m = -\frac{1}{2}}\)
\(y\)-Intercept: \(4x - 3y = 9 \implies 4(0) - 3y = 9 \implies -3y = 9 \implies \mathbf{b = -3}\)
Final Equation: \(\mathbf{y = -\frac{1}{2}x - 3}\) (or \(x + 2y = -6\))
23 Concession Stand Real-World Modeling (Section 1.5)
\(\mathbf{4x + 2y \ge 80}\)
where \(x\) = hamburgers ($4) and \(y\) = sodas ($2).
• \(x\)-intercept: \((20, 0)\) [all burgers]
• \(y\)-intercept: \((0, 40)\) [all sodas]
• Solid boundary line; shaded above and right in quadrant 1.
\(48 + 2y \ge 80 \implies 2y \ge 32\)
\(\mathbf{y \ge 16}\) sodas
Marcus needs at least 16 sodas.
Page 3 of 3 • Solutions Guide: Sections 1.6 - 1.7