Lenny.com
Explore
Create
ActivitiesNewMathEnglish Language ArtsScience & EngineeringSocial StudiesGlobal LanguagesHealth & Physical EducationSpecial EducationCounseling & Life SkillsArts & CreativityESL
Lenny.com
Lenny.com
Explore
Create
ActivitiesNewMathEnglish Language ArtsScience & EngineeringSocial StudiesGlobal LanguagesHealth & Physical EducationSpecial EducationCounseling & Life SkillsArts & CreativityESL
Lenny.com
Lenny.com

Solutions

Lenny for EducatorsLenny for SchoolsLenny for Districts

Product

ExploreSign inCreateSupportAbout

Resources

Getting startedMTSS Acceleration Program

Newsletters

School Funding Newsletter

© 2026 Lenny Learning Inc.

TermsPrivacyAccessibility
LinkedInInstagramX
Lenny
MathNumbers & CountingCounting ObjectsNumber NamesComparing NumbersNumber OperationsCounting SequenceNumbers 0-10Place Value Understanding and SystemAdd and Subtract Within 20Addition and Subtraction ConceptsAddition and Subtraction EquationsAddition and Subtraction ProblemsFoundations for MultiplicationMultiplication and Division PropertiesMultiply and Divide Within 100Multiplication and Division ProblemsFactors and MultiplesProperties of OperationsPatterns and RelationshipsGenerate and Analyze PatternsMulti-Digit ArithmeticPlace Value OperationsMulti-Digit and Decimal OperationsNumerical ExpressionsFour Operations and PatternsFour Operations Problem SolvingMeasurement & DataMeasurable AttributesMeasuring LengthsMeasure and Estimate Lengths in Standard UnitsRelate Addition and Subtraction to LengthClassifying and Counting ObjectsTime and MoneyArea Concepts and MeasurementPerimeter and Area MeasuresAngle Concepts and MeasurementTime, Volume, and MassMeasurement Unit ConversionsGeometryIdentifying ShapesShapes and AttributesShape Attributes and ReasoningShapes and CompositionClassifying 2D FiguresGeometric Figures and RelationshipsLines, Angles, and ShapesAngle, Area, and VolumeGeometric MeasurementVolume of 3D ShapesCoordinate Plane ApplicationsTransformations in the PlaneCongruence and SimilarityUnderstand congruence in terms of rigid motionsSimilarity and TransformationsProve Theorems Involving SimilarityPythagorean TheoremTrigonometry for General TrianglesMake Geometric ConstructionsProve Geometric TheoremsTheorems About CirclesFind Arc Lengths And Areas of Sectors of CirclesVolume FormulasRelationships Between Two-Dimensional and Three-Dimensional ObjectsProve Simple Geometric Theorems AlgebraicallyTranslate Between Geometric Description and Equation for Conic SectionApply Geometric Concepts in Modeling SituationsFractions & DecimalsFractions as NumbersBuilding FractionsFraction Equivalence and OrderingAdding and Subtracting FractionsMultiplying and Dividing FractionsDividing FractionsDecimal FractionsMulti-Digit Computation and FactorsAdd, Subtract, Multiply, and Divide Rational NumbersRational Number SystemIrrational Numbers and ApproximationsRatiosRatios and ProportionsProportional RelationshipsUnit RateAlgebraAlgebraic ExpressionsGenerate Equivalent ExpressionsQuantitative RelationshipsProportional Relationships and Linear EquationsEquations and InequalitiesEquation Solving and ReasoningLinear Equations and SystemsGraph Equations and InequalitiesSystems of EquationsReal-World Algebraic ProblemsQuantitative Reasoning with UnitsExpression StructureEquivalent Expression FormsRadicals and Integer ExponentsRational ExponentsRational and Irrational NumbersPolynomial OperationsPolynomial IdentitiesPolynomial Zeros and FactorsRational ExpressionsComplex Number OperationsComplex Numbers in PolynomialsComplex Numbers on PlaneStatistics & ProbabilityRepresent and Interpret DataData DistributionsStatistical VariabilityProbability ModelsCompound Event ProbabilitiesStatistical SamplingInterpret Categorical and Quantitative DataBivariate Data PatternsInterpret Linear ModelsComparing Two PopulationsRandom Processes in StatisticsIndependence and Conditional ProbabilityExpected ValuesProbability-Based Decision MakingStatistical Inference and ConclusionsFunctionsFunction Concepts and NotationDefine and Compare FunctionsInterpret Functions in ContextAnalyze Function RepresentationsModel Relationships with FunctionsIdentify Linear vs Exponential GrowthDistinguish Between Function TypesCompare Growth RatesInterpret Function ExpressionsBuild Functions from RelationshipsConstruct and Model FunctionsTransform and Combine FunctionsModel Comparison and SelectionSolve Exponential EquationsTrigonometryTrigonometric Ratios Involving Right TrianglesTrigonometric Functions and Unit CircleModel with Trigonometric FunctionsTrigonometric IdentitiesVectors & MatricesIntroduction to Vectors and MatricesVector QuantitiesVector OperationsMatrix OperationsCalculusLimits and ContinuityDerivative Concepts and NotationDerivative Rules and TechniquesApplications of DerivativesOptimization ProblemsRelated RatesCurve Sketching and AnalysisIntegration Concepts and NotationAntiderivatives and Indefinite IntegralsDefinite Integrals and AreaFundamental Theorem of CalculusIntegration TechniquesApplications of IntegrationDifferential EquationsSequences and SeriesParametric and Polar FunctionsVector-Valued Functions

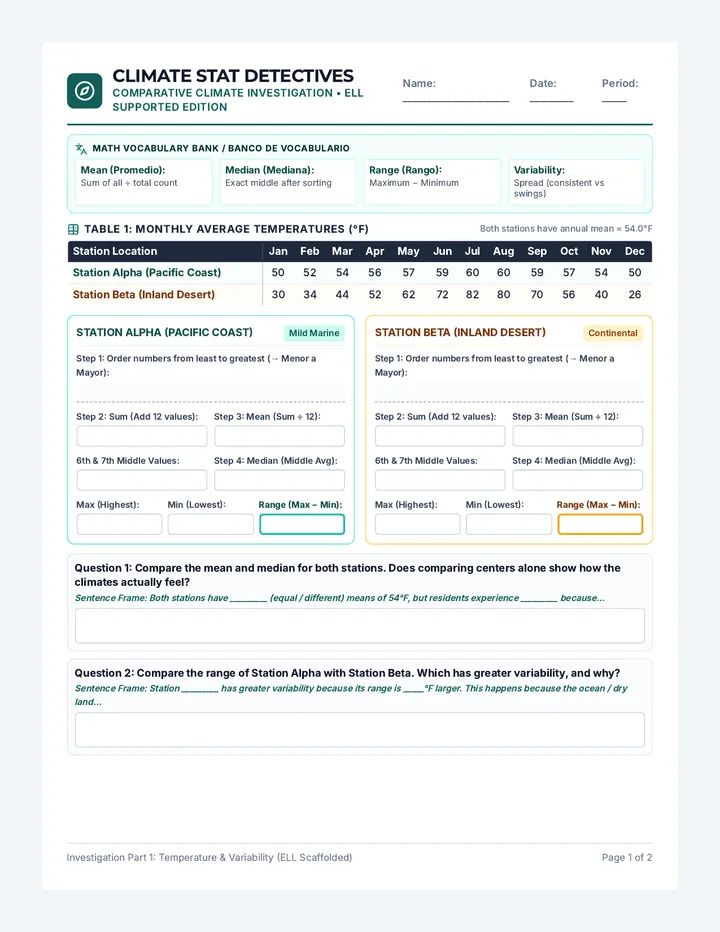
Climate Stat Detectives

A comprehensive middle school mathematics and earth science lesson where students analyze authentic temperature and rainfall datasets using mean, median, and range to uncover climate variability.

PSPaul Sieka

Climate Stat Detectives

A comprehensive middle school mathematics and earth science lesson where students analyze authentic temperature and rainfall datasets using mean, median, and range to uncover climate variability.

PSPaul Sieka

Investigation Part 1: Temperature & Variability (ELL Scaffolded) Page 1 of 2

PART 2: PRECIPITATION & EXTREME OUTLIERS

How Weather Outliers Distort Data • ELL Supported

Rainfall Analysis

Key Term: Outlier (Valor Atípico): An extreme data value that is significantly higher or lower than all the other numbers. In August, Station Beta recorded a record 6.8-inch monsoon flash flood.

Table 2: Monthly Precipitation (Inches / Pulgadas)

StationJanFebMarAprMayJunJulAugSepOctNovDec
Station Alpha (Coast)4.54.03.01.50.50.00.00.00.51.53.55.0
Station Beta (Inland)0.50.50.80.60.60.40.26.8*0.60.50.50.6

* 6.8 in: Tropical monsoon storm outlier.

Station Beta: WITH 6.8-inch Outlier (12 Months)

Sum of all 12 months:

Mean (Sum ÷ 12):

Median (Middle):

Range (6.8 − 0.2):

Station Beta: WITHOUT Outlier (11 Typical Months)

Sum of 11 months (Skip August):

Mean (Sum ÷ 11):

Median (Middle):

Range (0.8 − 0.2):

Question 3: How did the 6.8-inch flood affect the mean vs median? Which measure best shows "typical" rainfall?

Sentence Frame: The extreme rainstorm pulled the _________ (mean / median) from 0.53 in to 1.05 in. The _________ is the better measure of typical rainfall because...

Question 4: An investor wants to grow frost-sensitive lemon trees (freeze damage under 28°F). Which station should they choose?

Sentence Frame: The investor should choose Station _________ because its minimum temperature is _____°F. Station Beta is dangerous because...

Word Bank:

minimum / mínimo extreme flood / inundación resistant / resistente variability / variación

Investigation Part 2: Rainfall & Statistical Decision-Making (ELL Scaffolded) Page 2 of 2

Teacher Guide: Lesson Pacing & ELL Differentiation Page 1 of 2

COMPLETE ANSWER KEY & SOLUTIONS

Climate Comparison Worksheet • Detailed Scoring Rubric

Answer Key

Part 1: Temperature Calculations (Page 1 Solutions)

Station Alpha (Pacific Coast)

Ordered Data: 50, 50, 52, 54, 54, 56, 57, 57, 59, 59, 60, 60

Sum: 648  |  Mean: 648 ÷ 12 = 54.0°F

6th & 7th Values: 56 and 57

Median: (56 + 57) ÷ 2 = 56.5°F

Max: 60°F  |  Min: 50°F  |  Range: 60 − 50 = 10.0°F

Station Beta (Inland Plateau)

Ordered Data: 26, 30, 34, 40, 44, 52, 56, 62, 70, 72, 80, 82

Sum: 648  |  Mean: 648 ÷ 12 = 54.0°F

6th & 7th Values: 52 and 56

Median: (52 + 56) ÷ 2 = 54.0°F

Max: 82°F  |  Min: 26°F  |  Range: 82 − 26 = 56.0°F

Question 1 Sample Response (Centers Comparison): Both stations have equal mean temperatures (54°F) and similar medians (56.5°F vs 54°F), but residents experience very different weather. Station Alpha remains mild all year, while Station Beta swings from subfreezing winter conditions (26°F) to hot summer heat (82°F).

Question 2 Sample Response (Range & Variability): Station Beta has far greater variability because its range is 46°F larger (56°F vs 10°F). Station Alpha's temperatures are stabilized by the Pacific Ocean, which absorbs and releases heat slowly, whereas the inland desert landscape experiences rapid temperature swings.

Part 2: Precipitation & Outliers (Page 2 Solutions)

Station Beta: With Outlier (12 Months)

Sum: 12.6 in  |  Mean: 12.6 ÷ 12 = 1.05 in

Ordered: 0.2, 0.4, 0.5, 0.5, 0.5, 0.5, 0.6, 0.6, 0.6, 0.6, 0.8, 6.8

Median: (0.5 + 0.6) ÷ 2 = 0.55 in  |  Range: 6.8 − 0.2 = 6.60 in

Station Beta: Without Outlier (11 Months)

Sum: 5.8 in  |  Mean: 5.8 ÷ 11 ≈ 0.53 in

Ordered: 0.2, 0.4, 0.5, 0.5, 0.5, 0.5, 0.6, 0.6, 0.6, 0.6, 0.8

Median: 6th value = 0.50 in  |  Range: 0.8 − 0.2 = 0.60 in

Question 3 Sample Response (Outlier Impact): The 6.8-inch flood pulled the mean up from 0.53 in to 1.05 in (doubled), but the median barely changed (0.50 in to 0.55 in). The median is the best measure of typical monthly rainfall because it resists extreme, rare flood outliers.

Question 4 Sample Response (Agricultural Decision): The investor must choose Station Alpha. Although both have a 54°F mean, Station Alpha's lowest temperature is 50°F (well above the 28°F freeze threshold). Station Beta's minimum is 26°F with 3 winter months below 40°F, which would kill lemon trees.
Teacher Guide: Complete Answer Key & Scoring Criteria Page 2 of 2

You might also like

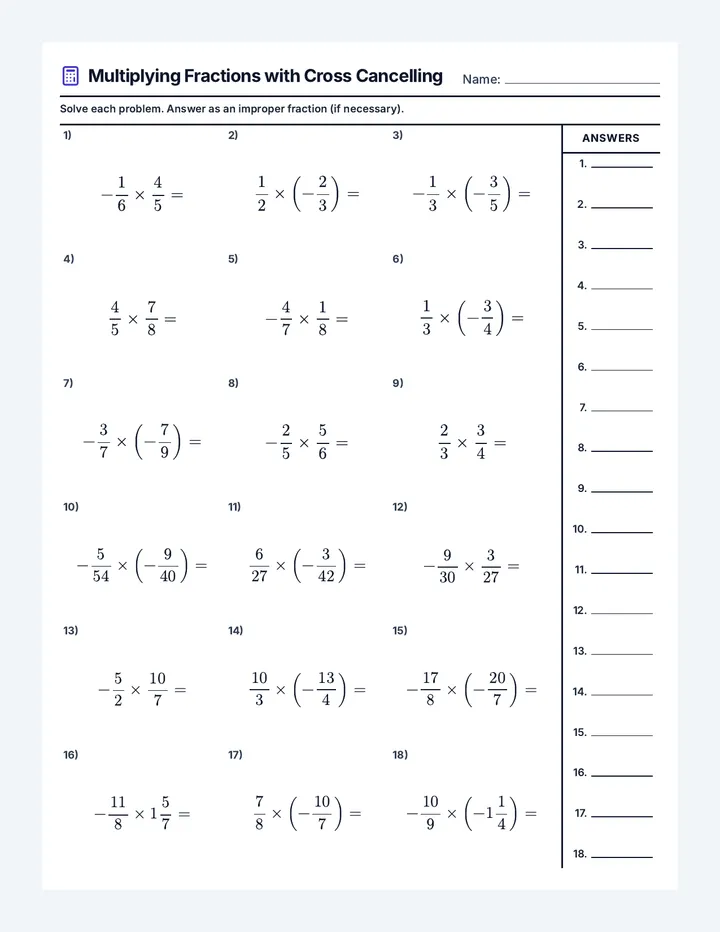
Cross Cancelling Fractions Worksheet

Fraction Operations

A comprehensive sequence covering fraction multiplication with cross-cancelling techniques and fraction division using reciprocals.

T

tsthibeault

11
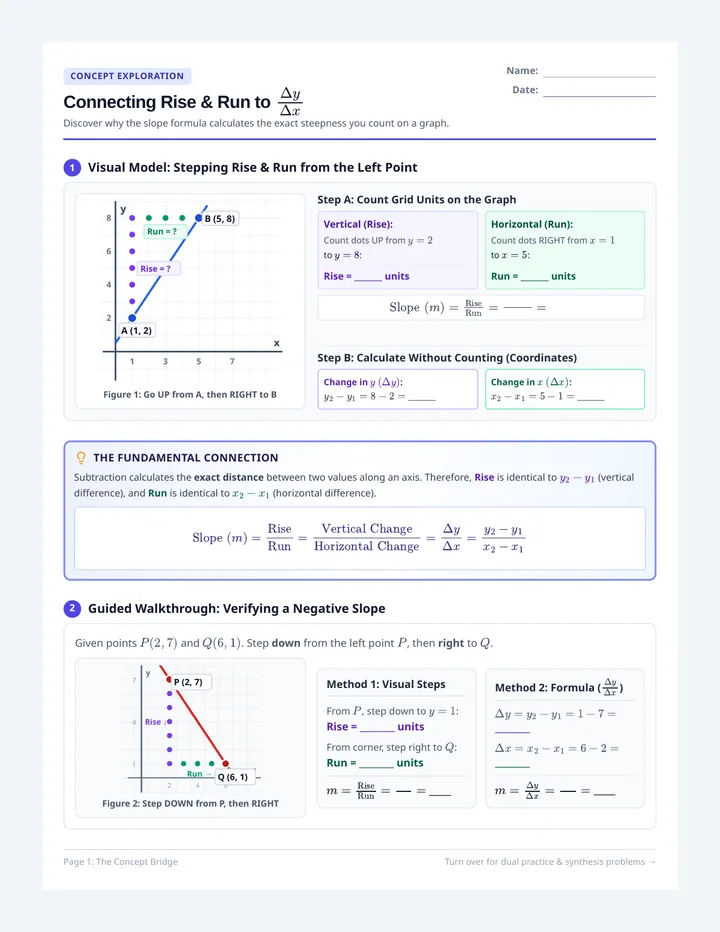
Slope Bridge Worksheet

Slope Connections

A guided exploratory lesson connecting the geometric steepness of lines (rise over run) to algebraic rates of change (\(\frac{\Delta y}{\Delta x}\)). Students explore coordinate models, verify negative and positive slopes, and discover the algebraic slope formula.

L

Logan-Greene

2
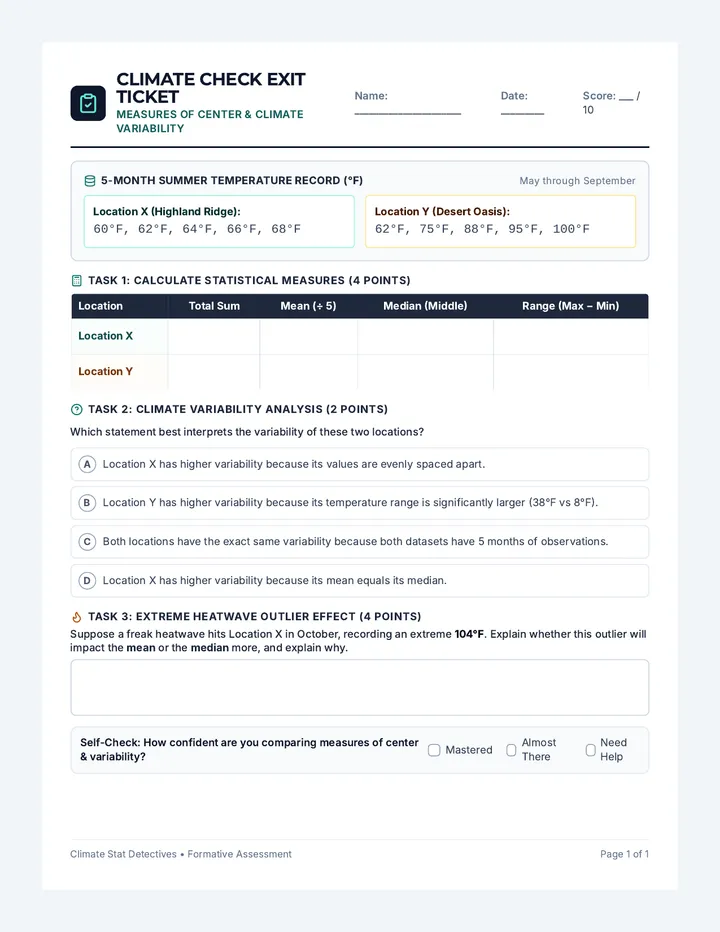
Climate Check Exit Ticket

Climate Check Exit Ticket

A focused single-page formative exit assessment where students calculate mean, median, and range from a 5-month meteorological dataset and evaluate variability and outlier impact.

PS

Paul Sieka

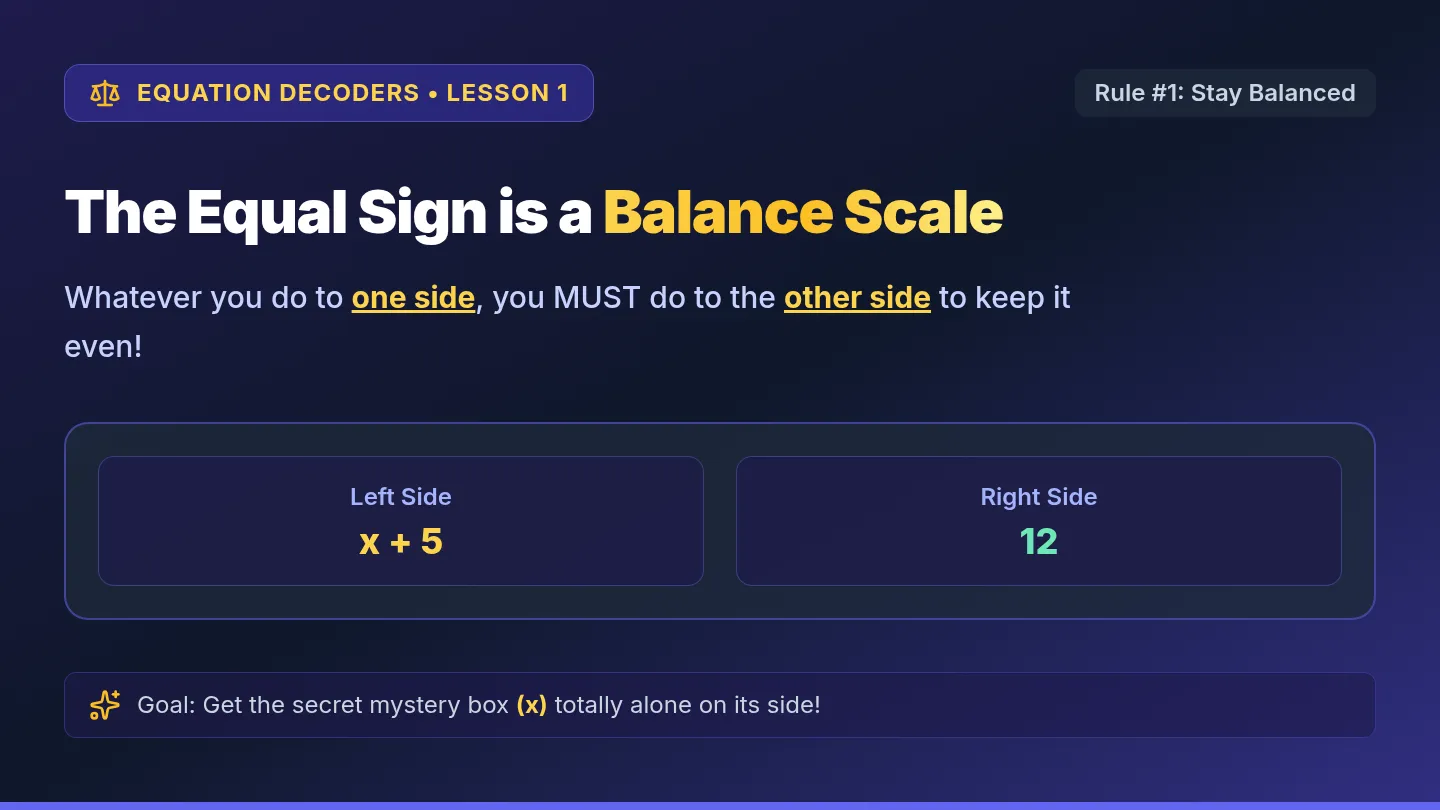
Balance Scale Slides

Equation Decoders

A scaffolded multi-day sequence engineered for 8th grade students with IEPs and math anxiety, demystifying linear equations through concrete balance models, visual inverse flowcharts, and structured routines.

DD

Darryl Davis

7
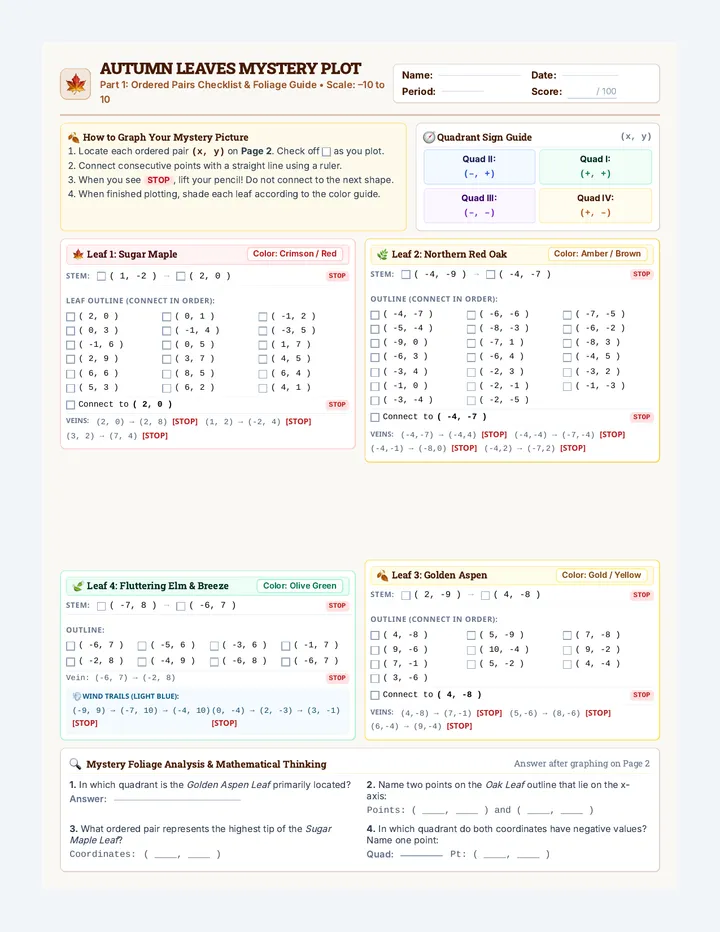
Autumn Leaves Coordinate Mystery

Autumn Foliage Mystery

A complete coordinate graphing unit resource where students plot points across all four quadrants to discover intricate autumn leaves. Contains a two-page student mystery worksheet and a teacher answer key with full visual solutions and pedagogical notes.

CD

Craig Davis

2
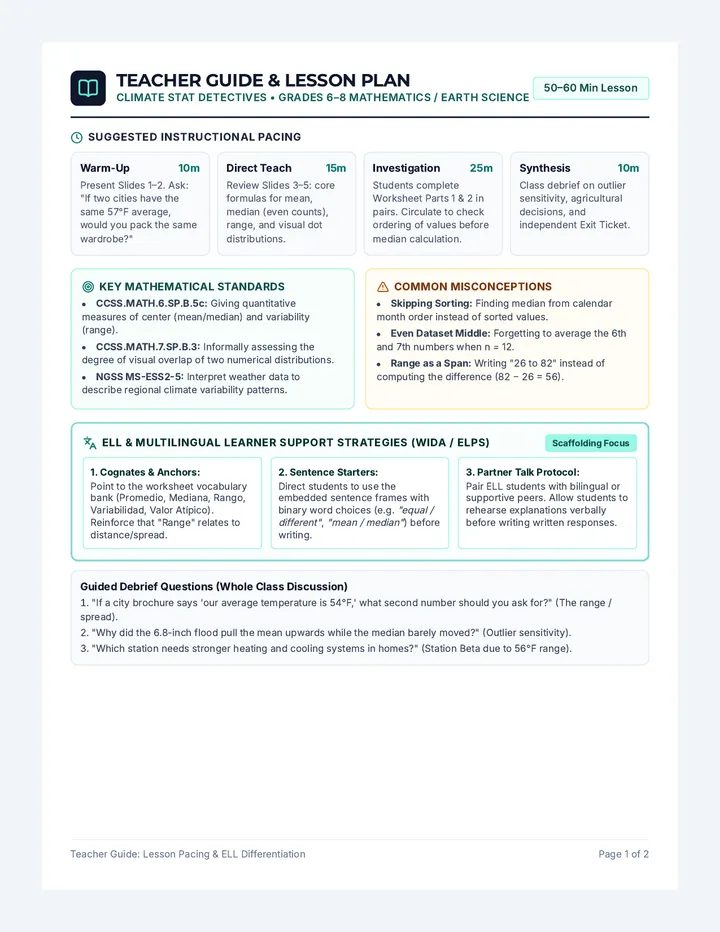
Climate Detectives Teacher Guide

Climate Detectives Teacher Guide

A comprehensive 2-page teacher guide and complete answer key detailing instructional pacing, common student misconceptions, step-by-step statistical solutions, and dedicated ELL / multilingual differentiation strategies.

PS

Paul Sieka

Critter Vision Lesson Plan

Animal Eyes Algebra

A two-part mathematics sequence exploring algebraic thinking through comparative animal vision. Students in elementary and middle school analyze fields of view, visual acuity, photoreceptor counts, and stereoscopic sight through graduated algebraic models.

Lenny Avatar
Lenny
6
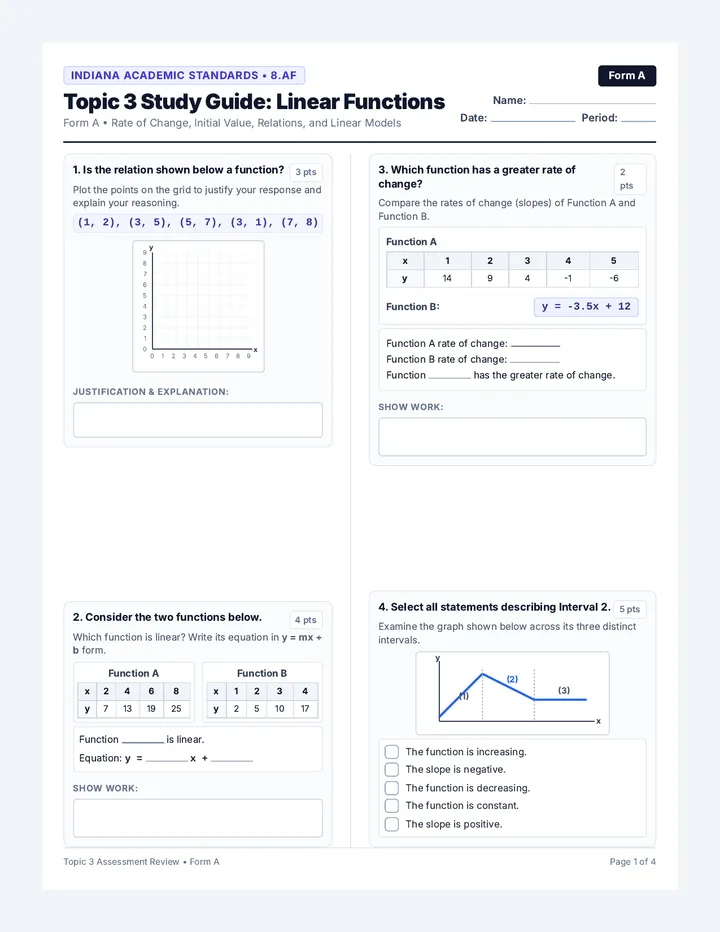
Function Focus Study Guide Form A

Function Focus

A comprehensive Grade 8 linear functions review unit aligned to Indiana Academic Standards (8.AF), featuring two paired 16-question study guide forms and fully worked teacher solutions.

K

Kyle.Nicholson

5
Climate Comparison Worksheet

Climate Comparison Worksheet

A 2-page print-ready investigation worksheet differentiated for English Language Learners, featuring bilingual math vocabulary cognates, structured step-by-step calculation cues, and academic sentence starters.

PS

Paul Sieka

Decimal Drive Slides

Texas Rational Roundup

A three-day high-energy math sequence where students master adding and subtracting positive rational numbers fluently. Each day features Lone Star adventures ranging from Buc-ee's road trips and rodeo ranching to the State Fair of Texas and NASA mission control.

LB

Lara Becker

9
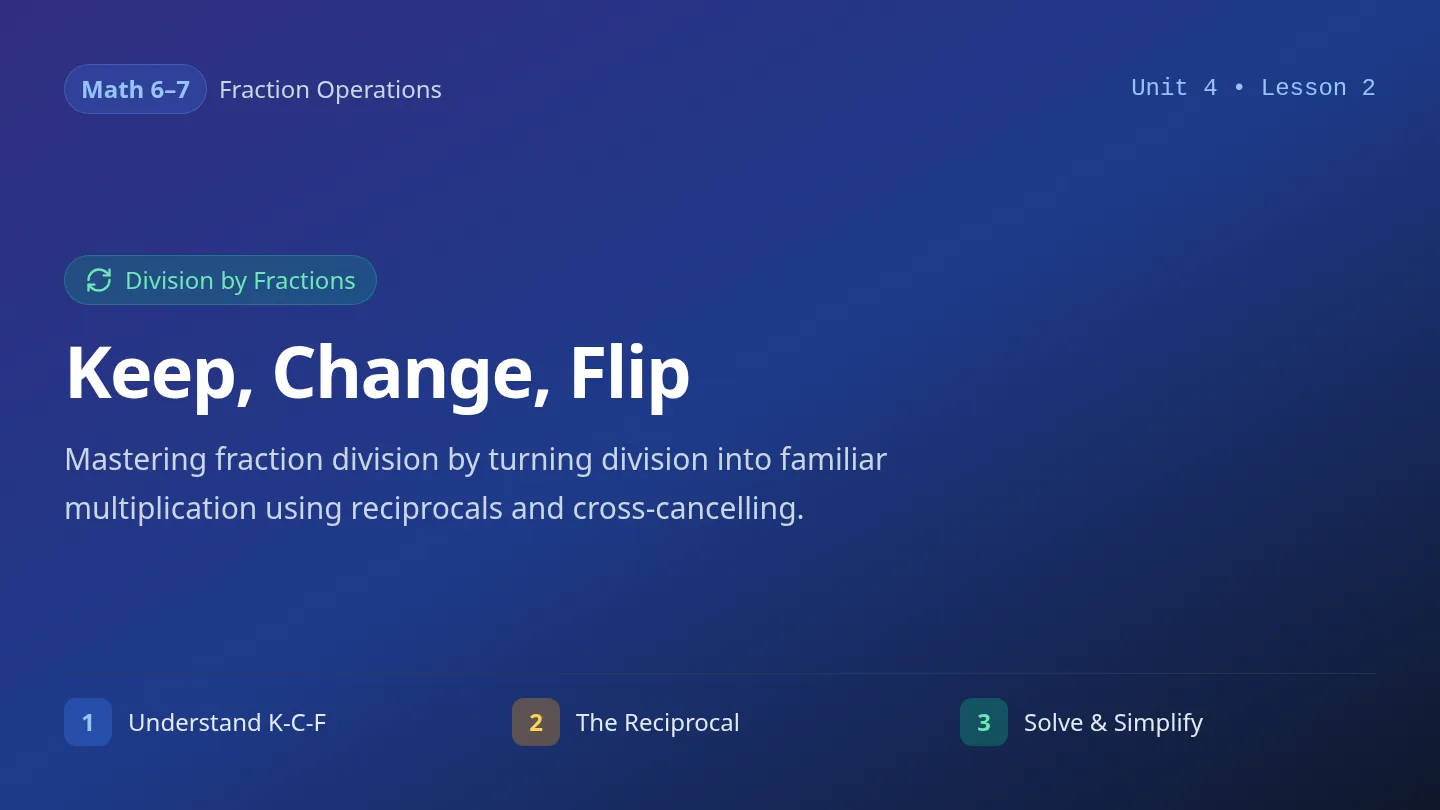
Fraction Division Slides

Dividing Fractions

Instructional materials introducing fraction division through reciprocal multiplication and the Keep Change Flip strategy.

T

tsthibeault

3
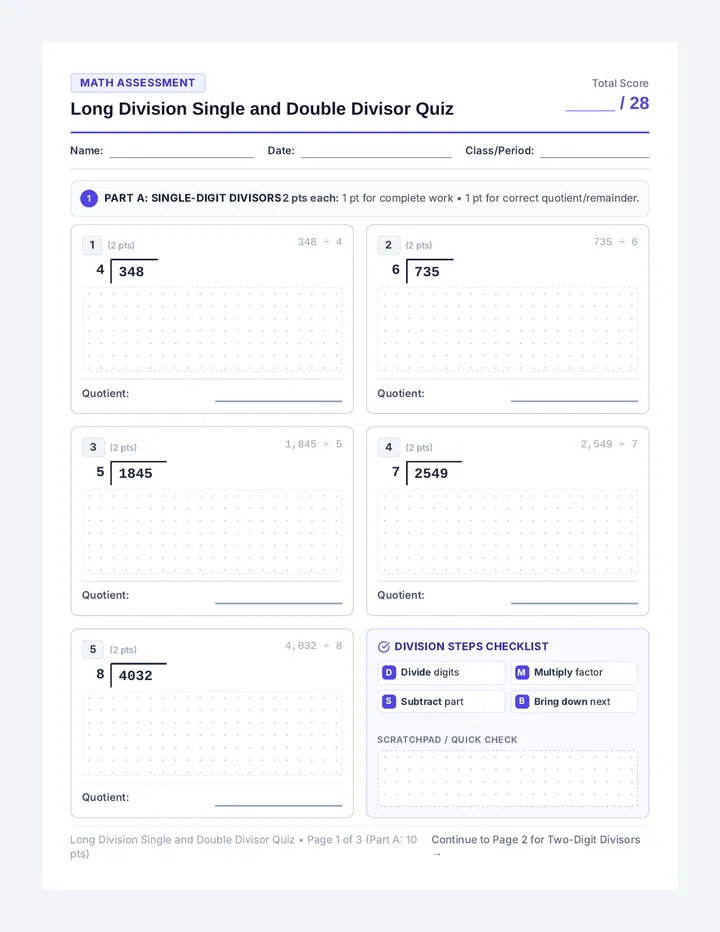
Long Division Single and Double Divisor Quiz

Math Mastery Series

A collection of middle school mathematics assessments and teacher resources covering arithmetic fluency and pre-algebra foundations.

S

Steve.Peters

4