Lenny.com
Explore
Create
ActivitiesNewMathEnglish Language ArtsScience & EngineeringSocial StudiesGlobal LanguagesHealth & Physical EducationSpecial EducationCounseling & Life SkillsArts & CreativityESL
Lenny.com
Lenny.com
Explore
Create
ActivitiesNewMathEnglish Language ArtsScience & EngineeringSocial StudiesGlobal LanguagesHealth & Physical EducationSpecial EducationCounseling & Life SkillsArts & CreativityESL
Lenny.com
Lenny.com

Solutions

Lenny for EducatorsLenny for SchoolsLenny for Districts

Product

ExploreSign inCreateSupportAbout

Resources

Getting startedMTSS Acceleration Program

© 2026 Lenny Learning Inc.

TermsPrivacyAccessibility
LinkedInInstagramX
Lenny

Statistical Sampling

Random, stratified, and cluster sampling methods for data collection and analysis. Addresses sample size determination, bias reduction, and the principles of making valid inferences about larger populations.

MathNumbers & CountingCounting ObjectsNumber NamesComparing NumbersNumber OperationsCounting SequenceNumbers 0-10Place Value Understanding and SystemAdd and Subtract Within 20Addition and Subtraction ConceptsAddition and Subtraction EquationsAddition and Subtraction ProblemsFoundations for MultiplicationMultiplication and Division PropertiesMultiply and Divide Within 100Multiplication and Division ProblemsFactors and MultiplesProperties of OperationsPatterns and RelationshipsGenerate and Analyze PatternsMulti-Digit ArithmeticPlace Value OperationsMulti-Digit and Decimal OperationsNumerical ExpressionsFour Operations and PatternsFour Operations Problem SolvingMeasurement & DataMeasurable AttributesMeasuring LengthsMeasure and Estimate Lengths in Standard UnitsRelate Addition and Subtraction to LengthClassifying and Counting ObjectsTime and MoneyArea Concepts and MeasurementPerimeter and Area MeasuresAngle Concepts and MeasurementTime, Volume, and MassMeasurement Unit ConversionsGeometryIdentifying ShapesShapes and AttributesShape Attributes and ReasoningShapes and CompositionClassifying 2D FiguresGeometric Figures and RelationshipsLines, Angles, and ShapesAngle, Area, and VolumeGeometric MeasurementVolume of 3D ShapesCoordinate Plane ApplicationsTransformations in the PlaneCongruence and SimilarityUnderstand congruence in terms of rigid motionsSimilarity and TransformationsProve Theorems Involving SimilarityPythagorean TheoremTrigonometry for General TrianglesMake Geometric ConstructionsProve Geometric TheoremsTheorems About CirclesFind Arc Lengths And Areas of Sectors of CirclesVolume FormulasRelationships Between Two-Dimensional and Three-Dimensional ObjectsProve Simple Geometric Theorems AlgebraicallyTranslate Between Geometric Description and Equation for Conic SectionApply Geometric Concepts in Modeling SituationsFractions & DecimalsFractions as NumbersBuilding FractionsFraction Equivalence and OrderingAdding and Subtracting FractionsMultiplying and Dividing FractionsDividing FractionsDecimal FractionsMulti-Digit Computation and FactorsAdd, Subtract, Multiply, and Divide Rational NumbersRational Number SystemIrrational Numbers and ApproximationsRatiosRatios and ProportionsProportional RelationshipsUnit RateAlgebraAlgebraic ExpressionsGenerate Equivalent ExpressionsQuantitative RelationshipsProportional Relationships and Linear EquationsEquations and InequalitiesEquation Solving and ReasoningLinear Equations and SystemsGraph Equations and InequalitiesSystems of EquationsReal-World Algebraic ProblemsQuantitative Reasoning with UnitsExpression StructureEquivalent Expression FormsRadicals and Integer ExponentsRational ExponentsRational and Irrational NumbersPolynomial OperationsPolynomial IdentitiesPolynomial Zeros and FactorsRational ExpressionsComplex Number OperationsComplex Numbers in PolynomialsComplex Numbers on PlaneStatistics & ProbabilityRepresent and Interpret DataData DistributionsStatistical VariabilityProbability ModelsCompound Event ProbabilitiesStatistical SamplingInterpret Categorical and Quantitative DataBivariate Data PatternsInterpret Linear ModelsComparing Two PopulationsRandom Processes in StatisticsIndependence and Conditional ProbabilityExpected ValuesProbability-Based Decision MakingStatistical Inference and ConclusionsFunctionsFunction Concepts and NotationDefine and Compare FunctionsInterpret Functions in ContextAnalyze Function RepresentationsModel Relationships with FunctionsIdentify Linear vs Exponential GrowthDistinguish Between Function TypesCompare Growth RatesInterpret Function ExpressionsBuild Functions from RelationshipsConstruct and Model FunctionsTransform and Combine FunctionsModel Comparison and SelectionSolve Exponential EquationsTrigonometryTrigonometric Ratios Involving Right TrianglesTrigonometric Functions and Unit CircleModel with Trigonometric FunctionsTrigonometric IdentitiesVectors & MatricesIntroduction to Vectors and MatricesVector QuantitiesVector OperationsMatrix OperationsCalculusLimits and ContinuityDerivative Concepts and NotationDerivative Rules and TechniquesApplications of DerivativesOptimization ProblemsRelated RatesCurve Sketching and AnalysisIntegration Concepts and NotationAntiderivatives and Indefinite IntegralsDefinite Integrals and AreaFundamental Theorem of CalculusIntegration TechniquesApplications of IntegrationDifferential EquationsSequences and SeriesParametric and Polar FunctionsVector-Valued Functions

Materials

Week 2 Morning Work Review Packet

Week 2 Morning Work Review Packet

An 8-page print-ready review packet for 8th-grade students in NYS, structured as "Week 2 Morning Work". It covers all 7th-grade math domains (The Number System, Ratios & Proportional Relationships, Expressions & Equations, Geometry, and Statistics & Probability) in a beautifully themed "Pixel Quest" retro-gaming review grid format with ample workspace.

AW

Austin WIllis

Research Reflection Narrative Essay

Research Reflection Narrative Essay

A formal narrative reflection essay meticulously aligned with the SEYS 776 rubric to achieve "Excellent" scores. It presents synthesized insights on research methodology, the research-practice loop, personal researcher growth, and pedagogical applications in cohesive paragraphs, incorporating specific examples and meaningful course feedback.

KB

Kayla Borozny

Sequences

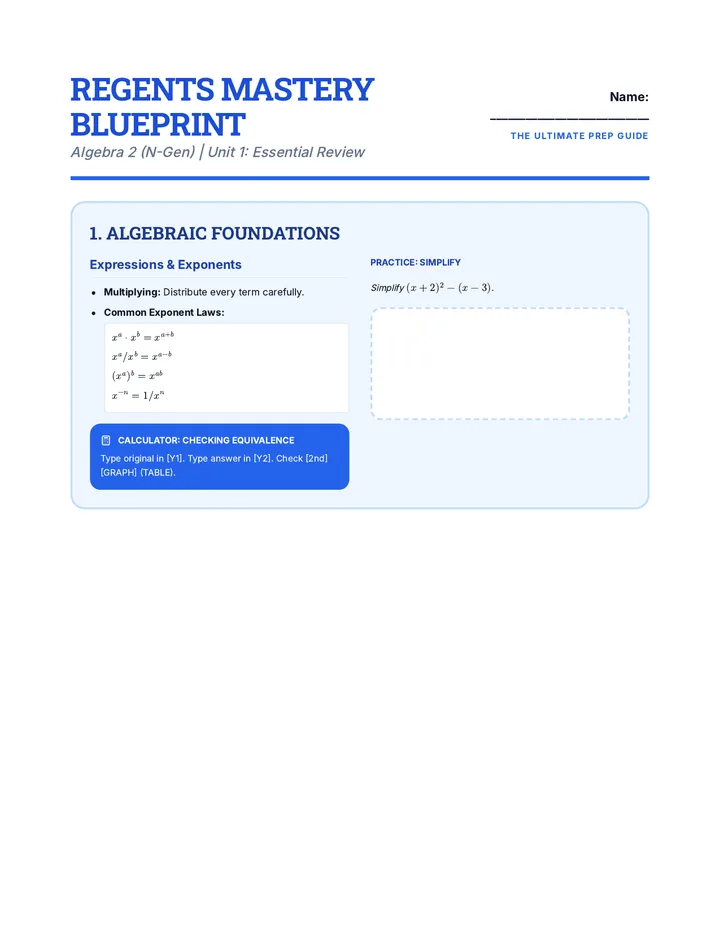
Regents Mastery Blueprint Study Guide

Regents Mastery Suite

A comprehensive review suite for the New York State Mathematics Regents exams, including Algebra 1, Geometry, and Algebra 2, featuring mastery blueprints, calculator strategies, and exam-taking tips.

KB

Kayla Borozny

15
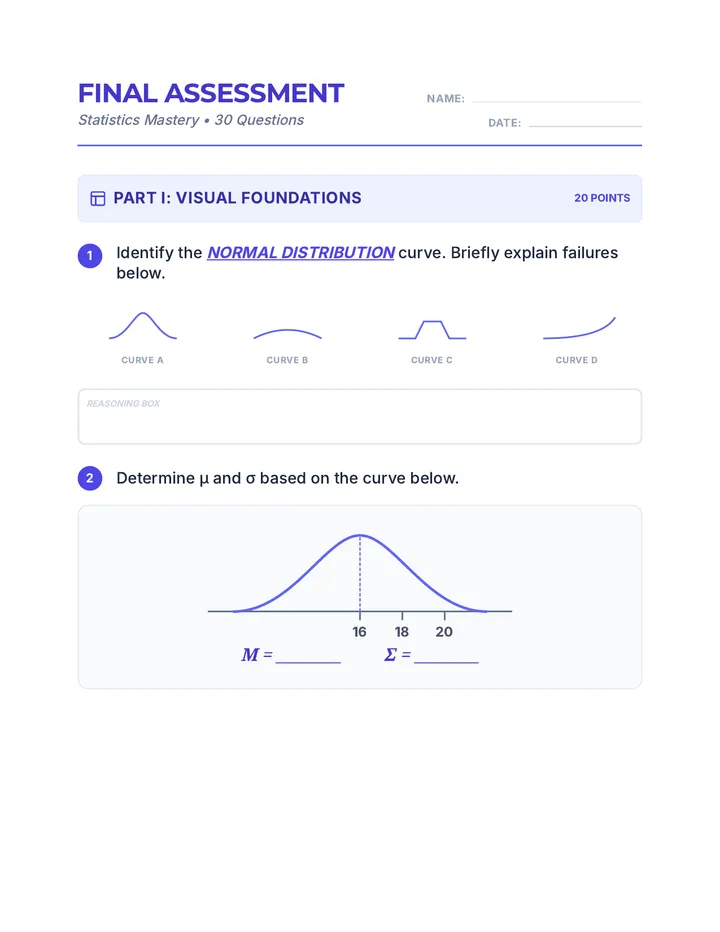
Normal CLT Mastery Test v3

Statistics Mastery

A comprehensive assessment sequence covering Normal Distributions, Z-scores, and the Central Limit Theorem.

AC

Anjoe Calamba

13
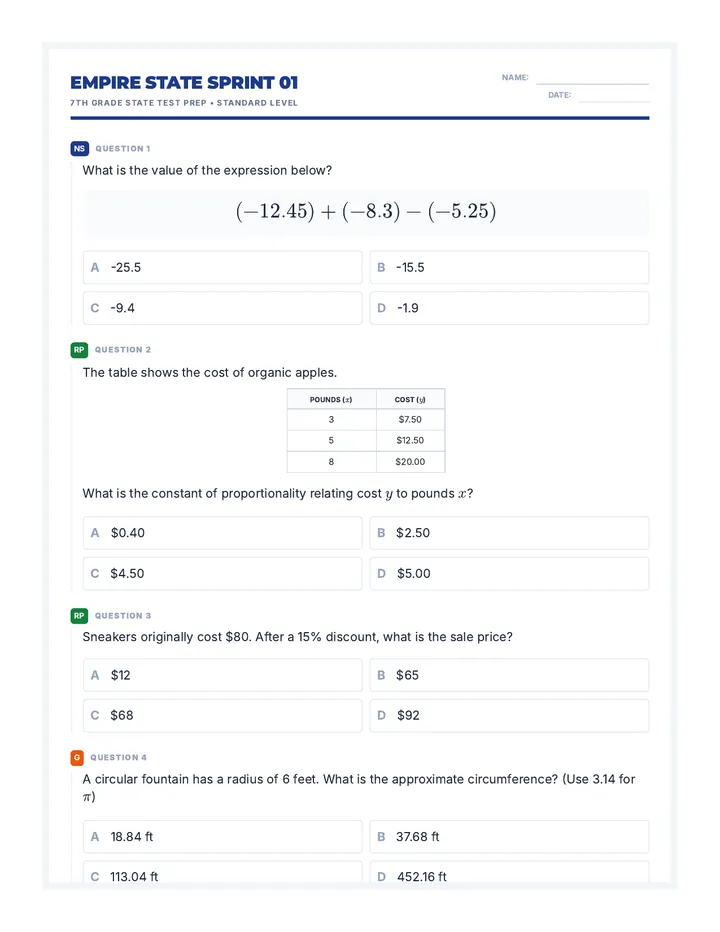
Sprint One Homework

Empire State Math Sprints

A series of four targeted homework assignments designed to prepare 7th-grade students for the New York State Mathematics Test. Each assignment covers key domains including Number Systems, Ratios and Proportions, Geometry, Statistics, and Probability in a standardized format.

CW

Cheyenne Watkins

5
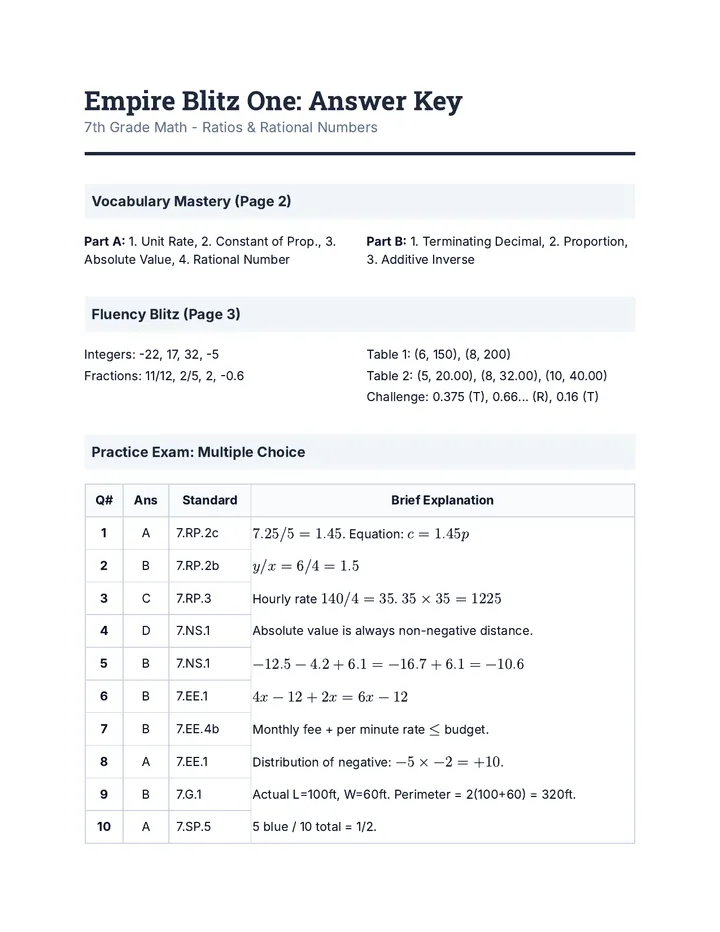
Empire Blitz One Answer Key

Metro Math Mastery

A comprehensive 3-packet New York State test prep series for 7th grade math, covering all major domains including Ratios, Number Systems, Expressions, Equations, Geometry, and Statistics. Each packet includes vocabulary, fluency, guided practice, and a 15-question mock exam.

CW

Cheyenne Watkins

12
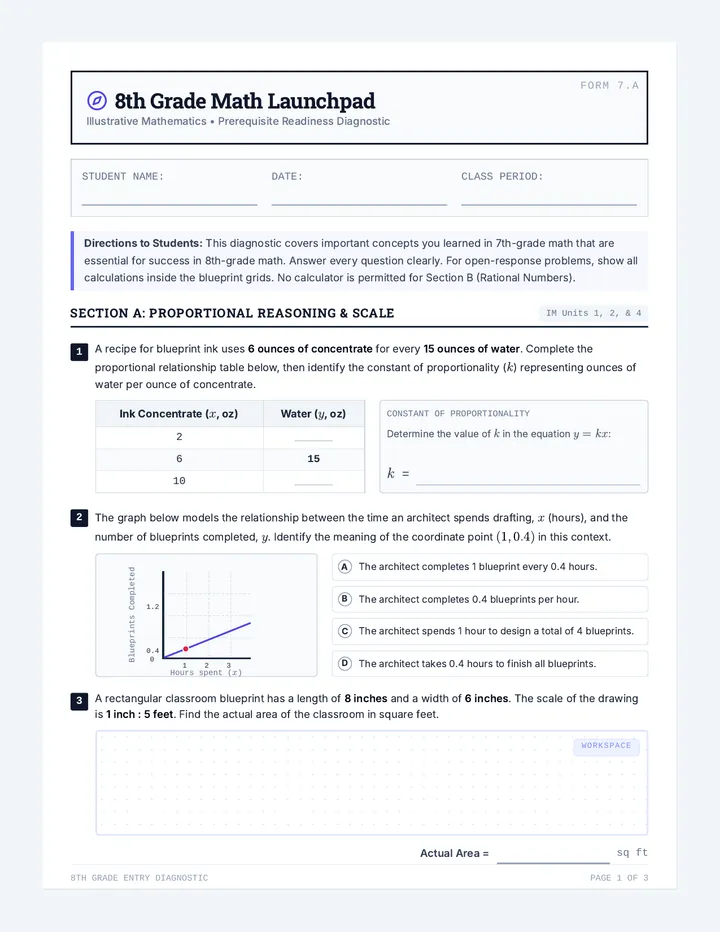
Launchpad Diagnostic Test

Launchpad Benchmarks

A collection of start-of-year diagnostics designed to baseline entering 8th graders. Includes math benchmark resources aligned with Illustrative Mathematics and reading benchmark resources aligned with the American Reading Company (ARC) curriculum.

MG

MICHELLE GRIMALDI

4
Investigation Introduction Slides

Data Detectives

An interdisciplinary unit for 7th and 8th graders that transforms students into 'Data Detectives'. They learn to collect, analyze, and visualize real-world data to uncover trends and communicate findings effectively.

MO

Michele Orr

9

Lessons

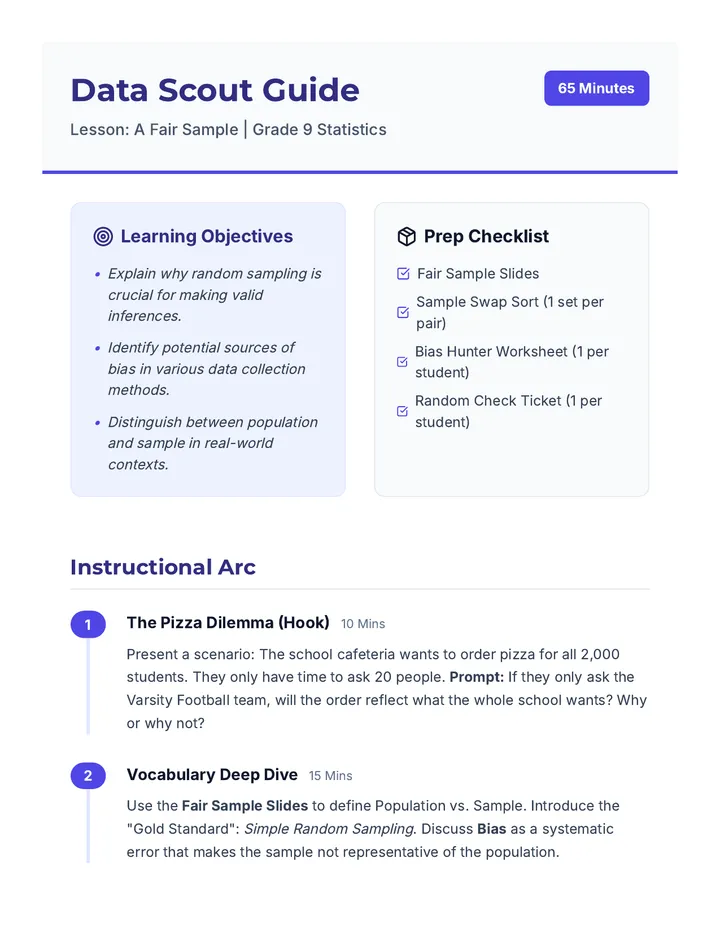
Data Scout Guide

Fair Sample Lesson

A 65-minute lesson for 9th Grade students exploring the fundamental concepts of population, sampling, and statistical bias. Students learn to distinguish between fair and biased collection methods through scenario analysis and sorting activities.

KC

Kris Coyne

5
Mean Confidence Worksheet

Mean Confidence Lab

A focused practice set on calculating confidence intervals for means, finding critical values, and determining minimum sample sizes for specific margins of error.

MR

Mahuya Roy Chowdhury

3
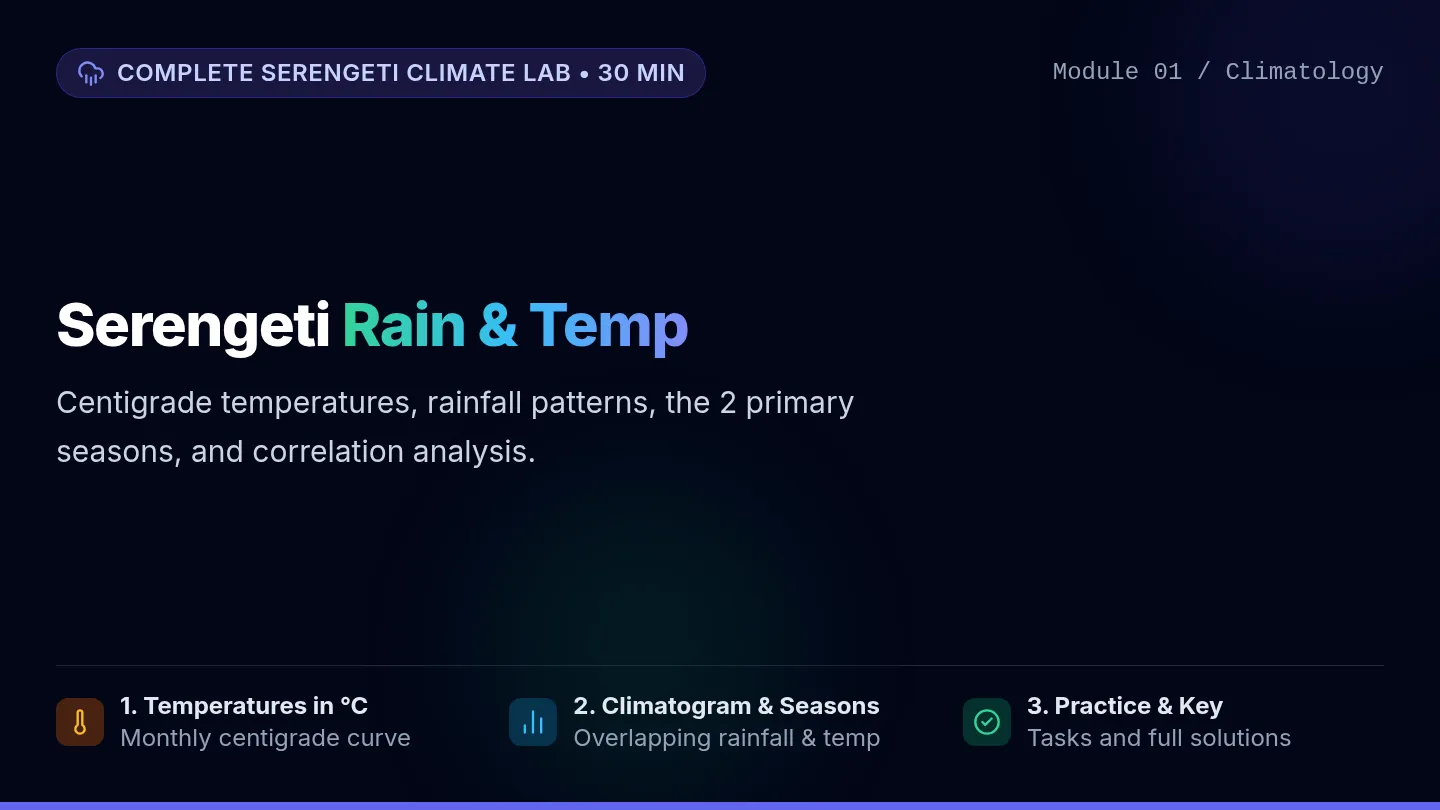
Correlation Clues Slides

Correlation Clues

A 30-minute lesson investigating whether monthly rainfall and temperature correlate in the Serengeti. Students analyze an overlapping dual-axis climatogram, evaluate statistical correlation versus causation, and audit representative sampling.

F

fradunsky

4
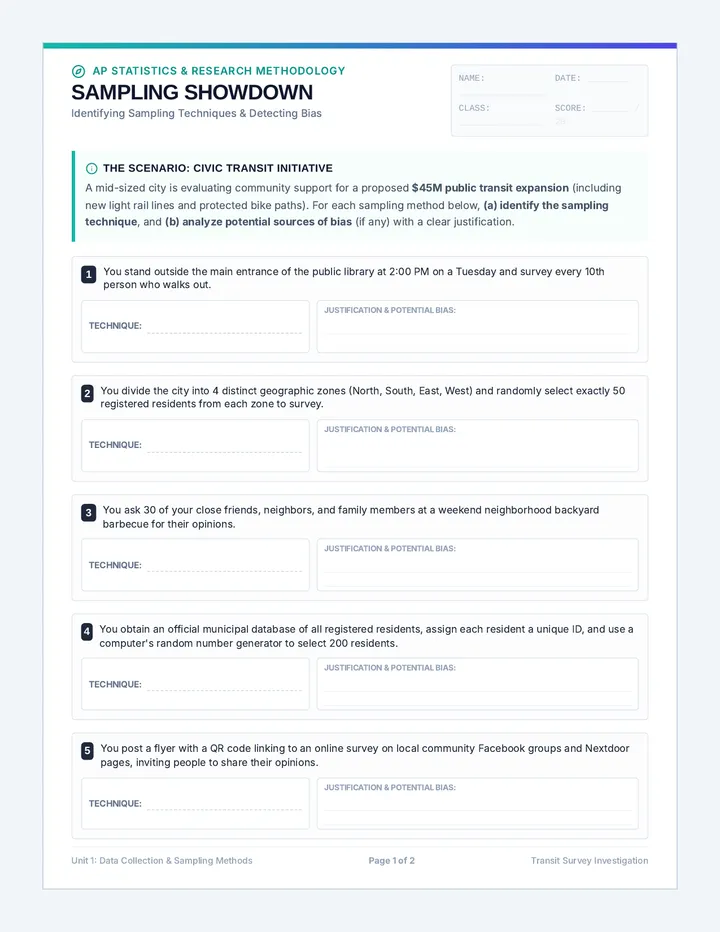
Sampling Showdown Worksheet

Sampling Showdown

A comprehensive statistics lesson focusing on identifying sampling methods (simple random, stratified, cluster, systematic, convenience, and voluntary response) and analyzing potential sources of bias. Includes a 10-problem printable practice worksheet and a detailed teacher solution guide.

MR

Mahuya Roy Chowdhury

2
Thesis Presentation Slides

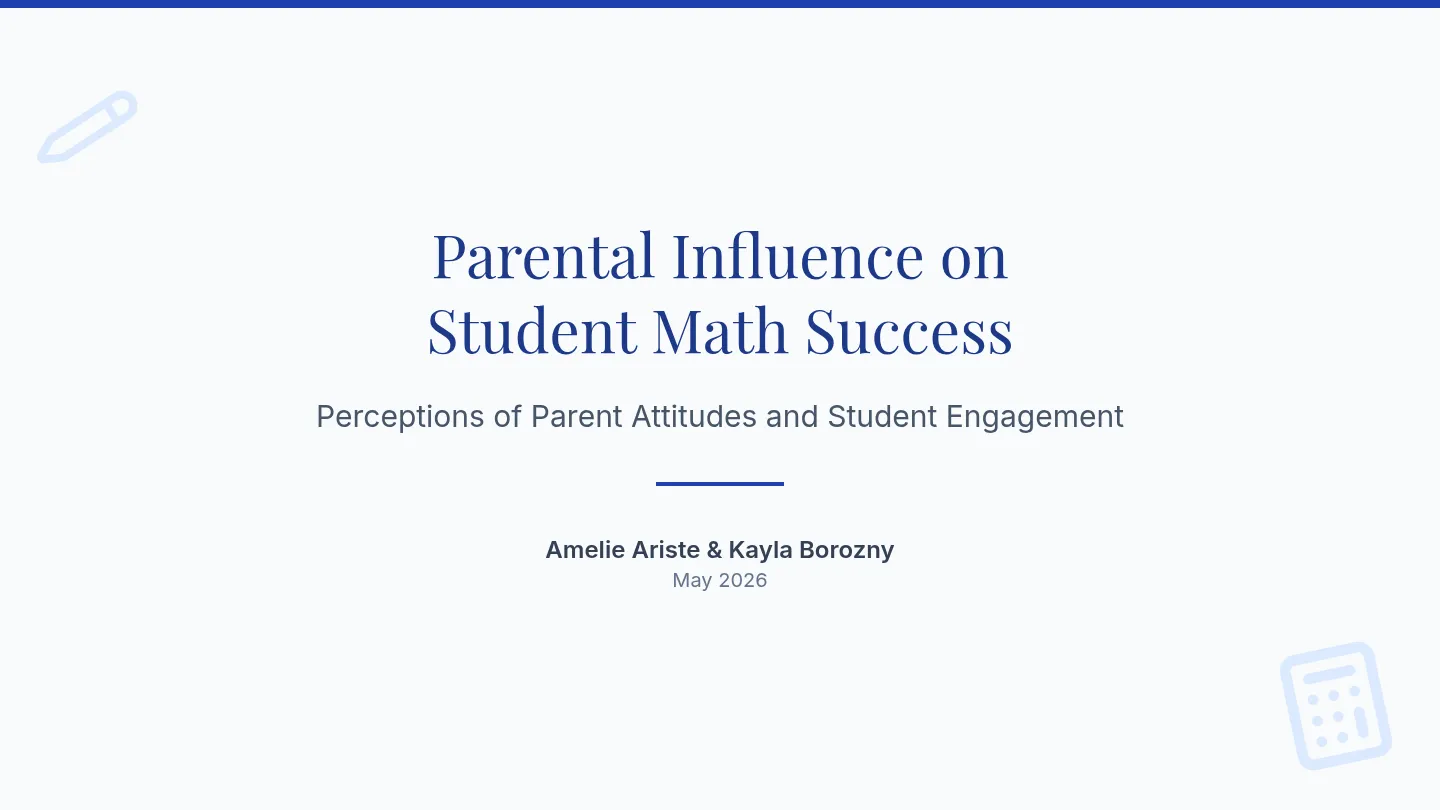
Math Perception Study

A comprehensive 12-minute presentation and speaker notes based on research investigating the link between parental attitudes and student math outcomes.

KB

Kayla Borozny

3
Stat Prep Blueprint Review Guide

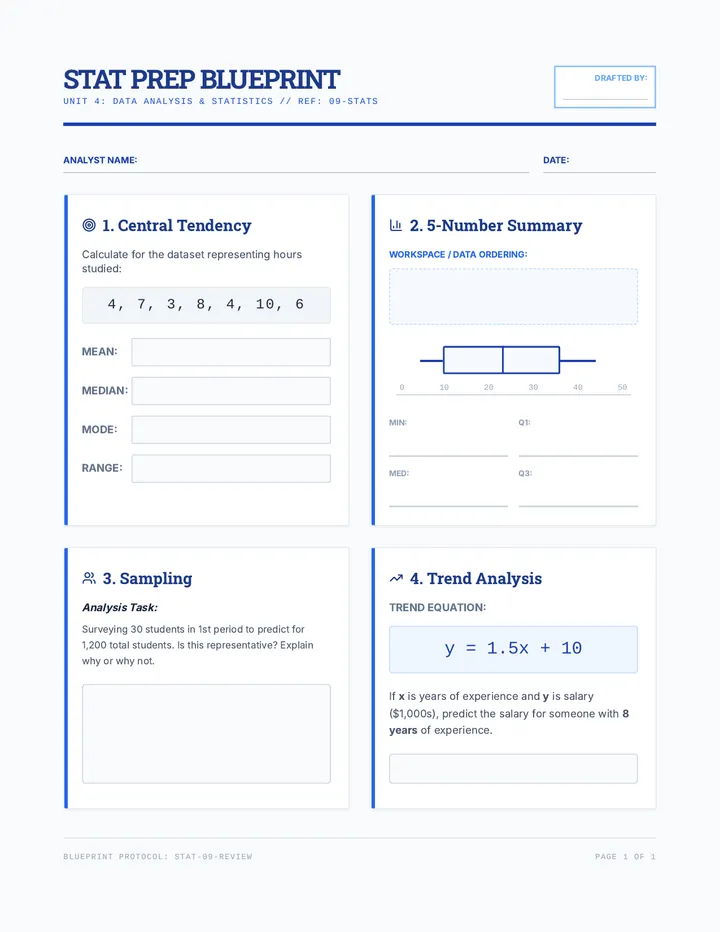
Stat Mastery Assessment

A comprehensive assessment lesson for 9th-grade statistics, covering central tendency, data visualization, sampling, and correlation through a blueprint-themed instructional arc.

KC

Kris Coyne

4