Lenny.com
Explore
Create
ActivitiesNewMathEnglish Language ArtsScience & EngineeringSocial StudiesGlobal LanguagesHealth & Physical EducationSpecial EducationCounseling & Life SkillsArts & CreativityESL
Lenny.com
Lenny.com
Explore
Create
ActivitiesNewMathEnglish Language ArtsScience & EngineeringSocial StudiesGlobal LanguagesHealth & Physical EducationSpecial EducationCounseling & Life SkillsArts & CreativityESL
Lenny.com
Lenny.com

Solutions

Lenny for EducatorsLenny for SchoolsLenny for Districts

Product

ExploreSign inCreateSupportAbout

Resources

Getting startedMTSS Acceleration Program

© 2026 Lenny Learning Inc.

TermsPrivacyAccessibility
LinkedInInstagramX
Lenny

Interpret Function Expressions

Analysis of terms and coefficients within algebraic expressions to assign contextual meaning to variables and constants. Targets the translation of mathematical relationships into practical, real-world scenarios.

MathNumbers & CountingCounting ObjectsNumber NamesComparing NumbersNumber OperationsCounting SequenceNumbers 0-10Place Value Understanding and SystemAdd and Subtract Within 20Addition and Subtraction ConceptsAddition and Subtraction EquationsAddition and Subtraction ProblemsFoundations for MultiplicationMultiplication and Division PropertiesMultiply and Divide Within 100Multiplication and Division ProblemsFactors and MultiplesProperties of OperationsPatterns and RelationshipsGenerate and Analyze PatternsMulti-Digit ArithmeticPlace Value OperationsMulti-Digit and Decimal OperationsNumerical ExpressionsFour Operations and PatternsFour Operations Problem SolvingMeasurement & DataMeasurable AttributesMeasuring LengthsMeasure and Estimate Lengths in Standard UnitsRelate Addition and Subtraction to LengthClassifying and Counting ObjectsTime and MoneyArea Concepts and MeasurementPerimeter and Area MeasuresAngle Concepts and MeasurementTime, Volume, and MassMeasurement Unit ConversionsGeometryIdentifying ShapesShapes and AttributesShape Attributes and ReasoningShapes and CompositionClassifying 2D FiguresGeometric Figures and RelationshipsLines, Angles, and ShapesAngle, Area, and VolumeGeometric MeasurementVolume of 3D ShapesCoordinate Plane ApplicationsTransformations in the PlaneCongruence and SimilarityUnderstand congruence in terms of rigid motionsSimilarity and TransformationsProve Theorems Involving SimilarityPythagorean TheoremTrigonometry for General TrianglesMake Geometric ConstructionsProve Geometric TheoremsTheorems About CirclesFind Arc Lengths And Areas of Sectors of CirclesVolume FormulasRelationships Between Two-Dimensional and Three-Dimensional ObjectsProve Simple Geometric Theorems AlgebraicallyTranslate Between Geometric Description and Equation for Conic SectionApply Geometric Concepts in Modeling SituationsFractions & DecimalsFractions as NumbersBuilding FractionsFraction Equivalence and OrderingAdding and Subtracting FractionsMultiplying and Dividing FractionsDividing FractionsDecimal FractionsMulti-Digit Computation and FactorsAdd, Subtract, Multiply, and Divide Rational NumbersRational Number SystemIrrational Numbers and ApproximationsRatiosRatios and ProportionsProportional RelationshipsUnit RateAlgebraAlgebraic ExpressionsGenerate Equivalent ExpressionsQuantitative RelationshipsProportional Relationships and Linear EquationsEquations and InequalitiesEquation Solving and ReasoningLinear Equations and SystemsGraph Equations and InequalitiesSystems of EquationsReal-World Algebraic ProblemsQuantitative Reasoning with UnitsExpression StructureEquivalent Expression FormsRadicals and Integer ExponentsRational ExponentsRational and Irrational NumbersPolynomial OperationsPolynomial IdentitiesPolynomial Zeros and FactorsRational ExpressionsComplex Number OperationsComplex Numbers in PolynomialsComplex Numbers on PlaneStatistics & ProbabilityRepresent and Interpret DataData DistributionsStatistical VariabilityProbability ModelsCompound Event ProbabilitiesStatistical SamplingInterpret Categorical and Quantitative DataBivariate Data PatternsInterpret Linear ModelsComparing Two PopulationsRandom Processes in StatisticsIndependence and Conditional ProbabilityExpected ValuesProbability-Based Decision MakingStatistical Inference and ConclusionsFunctionsFunction Concepts and NotationDefine and Compare FunctionsInterpret Functions in ContextAnalyze Function RepresentationsModel Relationships with FunctionsIdentify Linear vs Exponential GrowthDistinguish Between Function TypesCompare Growth RatesInterpret Function ExpressionsBuild Functions from RelationshipsConstruct and Model FunctionsTransform and Combine FunctionsModel Comparison and SelectionSolve Exponential EquationsTrigonometryTrigonometric Ratios Involving Right TrianglesTrigonometric Functions and Unit CircleModel with Trigonometric FunctionsTrigonometric IdentitiesVectors & MatricesIntroduction to Vectors and MatricesVector QuantitiesVector OperationsMatrix OperationsCalculusLimits and ContinuityDerivative Concepts and NotationDerivative Rules and TechniquesApplications of DerivativesOptimization ProblemsRelated RatesCurve Sketching and AnalysisIntegration Concepts and NotationAntiderivatives and Indefinite IntegralsDefinite Integrals and AreaFundamental Theorem of CalculusIntegration TechniquesApplications of IntegrationDifferential EquationsSequences and SeriesParametric and Polar FunctionsVector-Valued Functions

Videos

Finding Slope and Intercepts from Tables

Finding Slope and Intercepts from Tables

This math tutorial guides students through the process of extracting meaningful information from tables of values, treating them with the same analytical approach used for graphs. The narrator, Justin, demonstrates how to calculate slope (rate of change) and identify both y-intercepts (starting values) and x-intercepts (ending values) using three distinct real-world scenarios: an airplane taking off, a cleaning service, and a leaking swimming pool. The video focuses on two main skills: calculation and interpretation. First, it shows step-by-step how to compute the change in Y over the change in X to find the slope. Then, it uses that rate of change to extrapolate data backward to find the zero point (y-intercept). Crucially, the video doesn't just stop at the numbers; it translates these mathematical findings into plain English sentences, explaining what "0" means in the context of flight altitude or pool water levels. This resource is highly valuable for Algebra and Pre-Algebra classrooms as it connects abstract numbers to concrete situations. It models the critical skill of "working backward" in a table to find an initial value, a common hurdle for students. The clear, step-by-step visual breakdowns make it an excellent tool for introducing linear functions, reinforcing the concept of constant rate of change, or helping students transition from graphical to tabular representations of data.

Miacademy & MiaPrep Learning ChannelMiacademy & MiaPrep Learning Channel

3mins 54s

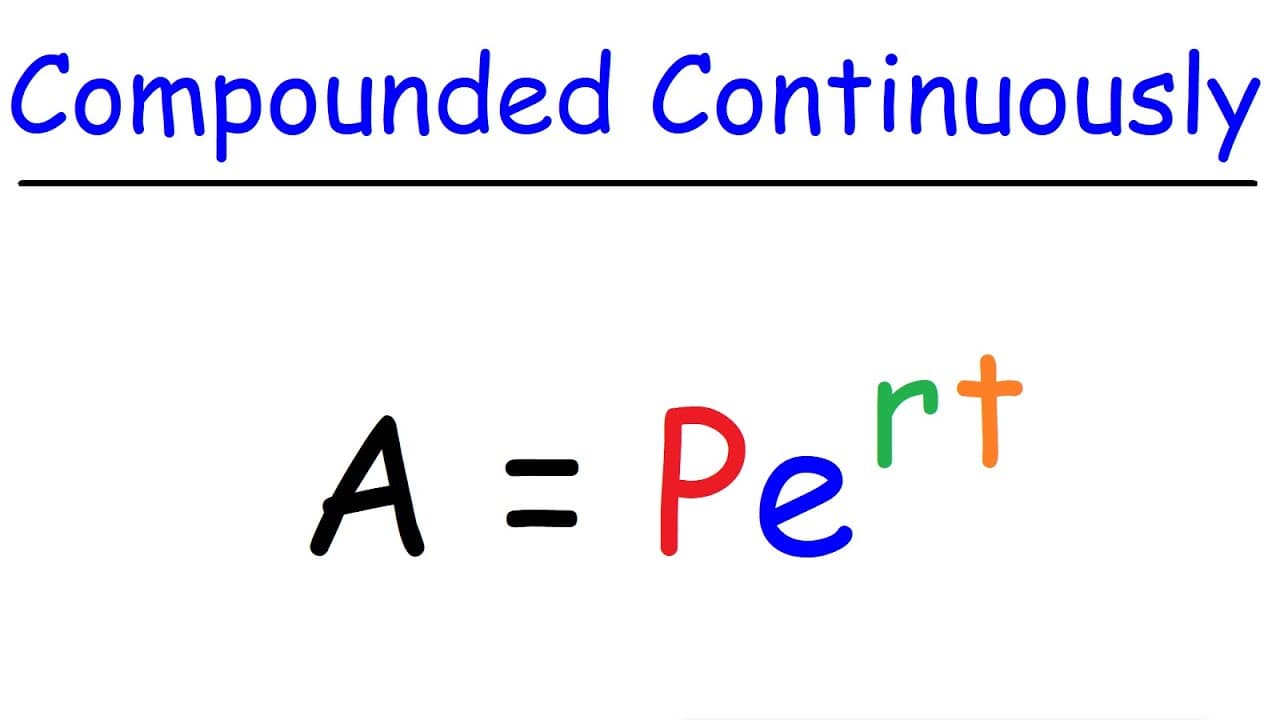
Solving Continuously Compounded Interest Problems with the PERT Formula

Solving Continuously Compounded Interest Problems with the PERT Formula

This math tutorial provides a clear, step-by-step guide on how to solve word problems involving continuously compounded interest. The video introduces the continuous compound interest formula, A = Pe^rt (often referred to as the "PERT" formula), and explains the significance of each variable: the future value (A), principal investment (P), Euler's number (e), interest rate (r), and time (t). Through two distinct examples, the narrator demonstrates how to calculate the future value of an investment and how to determine the time required for an investment to double in value. Key mathematical themes include exponential growth functions, algebraic manipulation of formulas, and the application of natural logarithms (ln) to solve for unknown variables in an exponent. The video carefully walks through the algebraic steps required to isolate the time variable 't' by taking the natural log of both sides, reinforcing the inverse relationship between exponential and logarithmic functions. Additionally, the video introduces the "Rule of 72," a mental math shortcut for estimating doubling time, and compares this approximation with the precise calculated result. This video is highly valuable for high school Algebra II, Pre-Calculus, and Financial Math classrooms. It bridges the gap between abstract algebraic concepts—like the number 'e' and logarithms—and practical financial literacy. Teachers can use this resource to scaffold lessons on exponential modeling, demonstrate the utility of logarithms in real-world scenarios, or introduce students to basic investment planning and the power of compound interest over time.

The Organic Chemistry TutorThe Organic Chemistry Tutor

5mins 32s

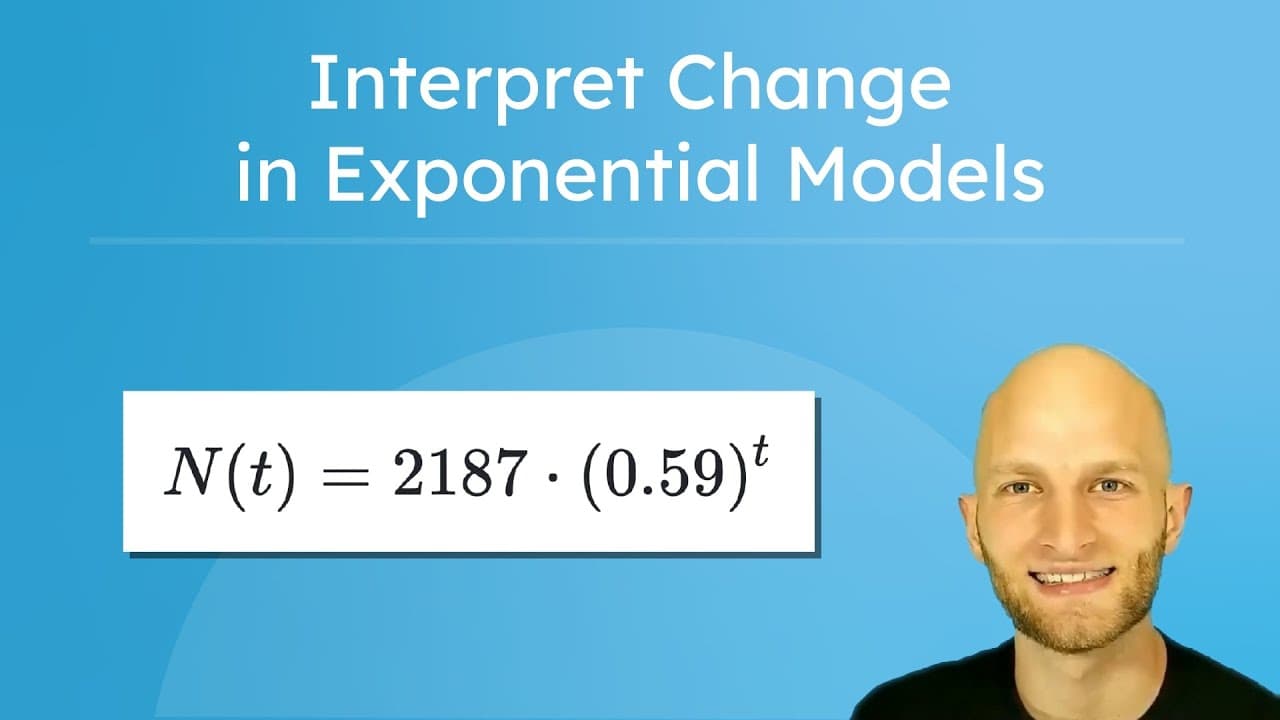
Interpreting Percent Rate of Change in Exponential Models

Interpreting Percent Rate of Change in Exponential Models

This instructional video guides students through the process of interpreting exponential models to determine percent rates of change. The presenter, Randy, breaks down two real-world scenarios—a ball's decreasing velocity and a tree's increasing branch count—to demonstrate how to extract growth and decay rates directly from exponential equations. By constructing tables of values and analyzing the mathematical patterns, the video demystifies the relationship between the base of an exponent and the percentage change it represents. The video explores key themes of exponential functions, specifically distinguishing between exponential growth and decay. It focuses heavily on understanding the base of the exponent as a factor and how it relates to the number 1 (representing 100%). Concepts covered include function notation, evaluating exponents, converting decimals to percentages, and interpreting mathematical models in practical contexts. For educators, this resource is an excellent tool for bridging the gap between abstract algebraic formulas and concrete understanding. It addresses the common student confusion between the decay factor (what remains) and the decay rate (what is lost). The step-by-step derivation of the "shortcut" method empowers students to quickly analyze equations without needing to perform repetitive calculations, making it valuable for Algebra I and Algebra II curriculums.

Miacademy & MiaPrep Learning ChannelMiacademy & MiaPrep Learning Channel

8mins 55s

Understanding Slope and Intercepts in Real-World Graphs

Understanding Slope and Intercepts in Real-World Graphs

This educational video demystifies the concepts of slope and intercepts by connecting them to real-world scenarios. Through two distinct examples—a hiking trip and trends in paper billing—the narrator demonstrates how abstract mathematical features on a graph translate into tangible information like speed, starting position, and rates of change over time. The video uses clear visuals and step-by-step calculations to bridge the gap between algebraic formulas and practical understanding. The content focuses on key algebraic themes including linear functions, calculating slope using the rise-over-run formula, and interpreting both x and y-intercepts in context. It specifically addresses how a positive slope represents an increase (hiking distance) while a negative slope represents a decrease (preference for paper bills), providing a well-rounded view of linear relationships. For educators, this video serves as an excellent tool for Algebra 1 or pre-algebra classrooms. It moves beyond rote calculation, encouraging students to analyze what specific points and lines on a graph actually mean. Teachers can use this to introduce the topic of linear modeling or as a reinforcement tool to help students struggling to extract meaning from word problems and their corresponding graphs.

Miacademy & MiaPrep Learning ChannelMiacademy & MiaPrep Learning Channel

3mins 11s

How to Solve Exponential Growth Word Problems

How to Solve Exponential Growth Word Problems

This educational video serves as a practical guide to solving word problems using exponential expressions. Narrated by Justin, the lesson begins by reviewing the core components of an exponential expression—initial value, growth factor, and exponent—before diving into three distinct real-world scenarios. The video transitions from simple doubling patterns to more complex compound interest calculations and biological growth cycles, demonstrating how to construct and solve equations for each situation.

Miacademy & MiaPrep Learning ChannelMiacademy & MiaPrep Learning Channel

5mins 46s

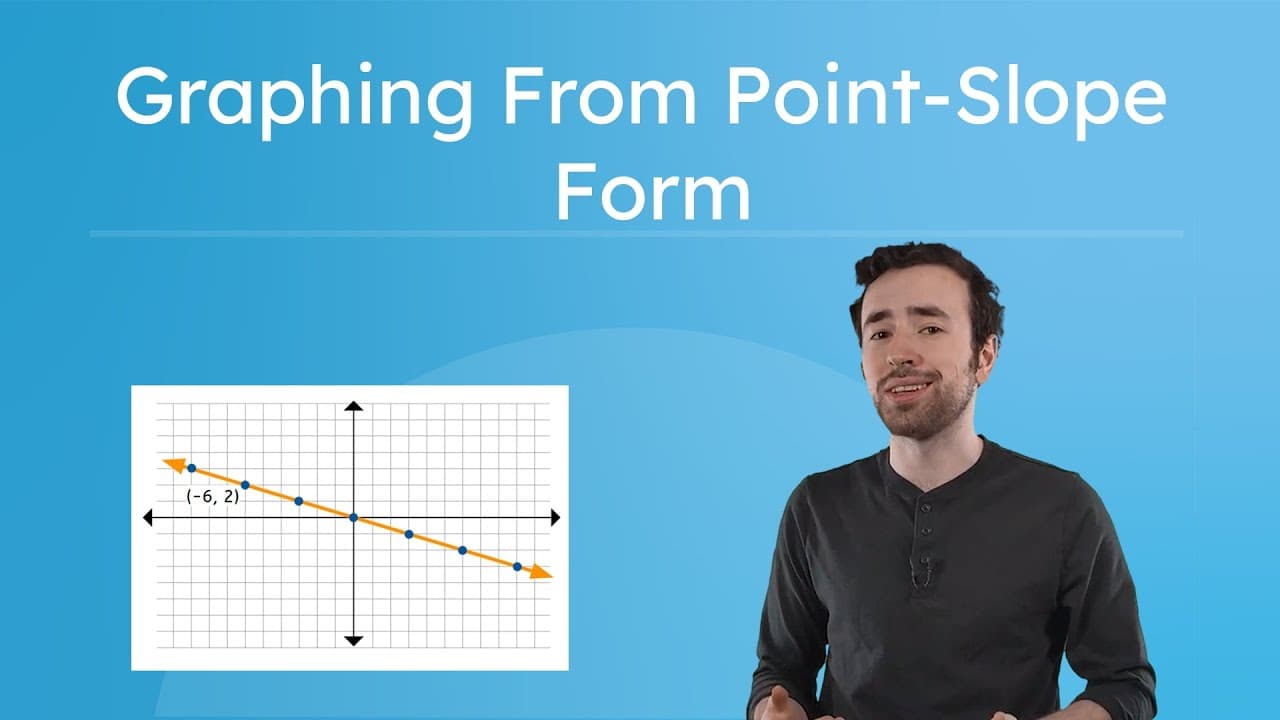
How to Graph a Line Using Point-Slope Form

How to Graph a Line Using Point-Slope Form

This educational math video teaches students how to graph linear equations directly from point-slope form without converting to other forms first. The narrator guides viewers through the process of reverse-engineering the equation $y - y_1 = m(x - x_1)$ to identify the slope ($m$) and a specific coordinate point $(x_1, y_1)$ on the line. Special emphasis is placed on interpreting positive and negative signs correctly within the equation parentheses. The video explores key themes of algebraic structure, coordinate geometry, and visual graphing techniques. It specifically breaks down the cognitive steps needed to extract numerical values from an algebraic formula, focusing on the common student stumbling block of recognizing that $(x + 6)$ implies an x-coordinate of $-6$. The lesson includes a guided example followed by an independent practice problem where students pause the video to test their understanding. For classroom application, this video is an excellent resource for Algebra 1 units on linear functions. It provides a procedural scaffold for students who struggle with multi-step algebraic manipulations, offering them a direct method to visualize equations. Teachers can use this to differentiate instruction, helping visual learners connect abstract formulas to concrete graphical representations.

Miacademy & MiaPrep Learning ChannelMiacademy & MiaPrep Learning Channel

5mins 3s

Materials

Figurative Patterns Slides Orientation Fix

Figurative Patterns Slides Orientation Fix

Fixed Slide 6 where the visualization of two paired triangular numbers forming a rectangle was missing. Replaced the previous layout with explicit flex rows to ensure the dots render correctly and clearly show how $T_4$ and its twin create a $4 \times 5$ rectangle. Label positioning and container sizing were also refined for better clarity. Adjusted Slide 4 to fill vertical space more effectively.

BC

Brenda Coombs

Fare Finder Chart

Fare Finder Chart

A high-resolution, full-page standalone math-accurate coordinate graph showing the linear cost of an Uber ride with base fare $2.50 and $1.50 per mile, with specific points highlighted and labeled at x = 3 ($7.00) and x = 12 ($20.50). Features minor gridlines at $1 increments.

PT

Patrick Timmons

Algebra Review Test

Algebra Review Test

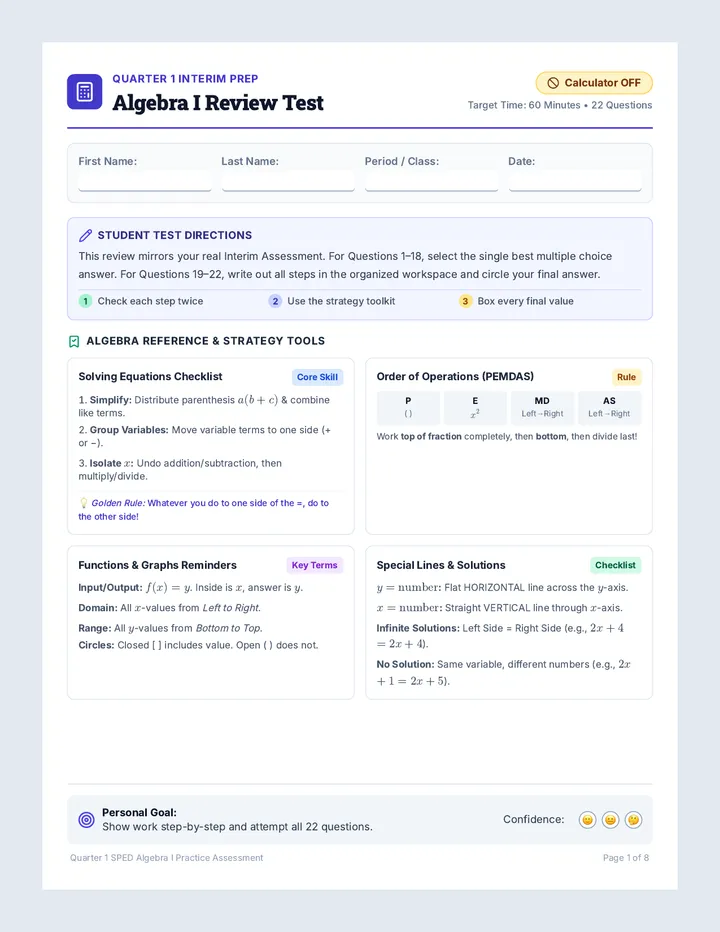
A comprehensive 8-page Quarter 1 Interim Review Assessment designed for 9th grade Special Education (SPED) Algebra 1 students, fully mirroring the 22-question assessment with built-in accommodations, reference toolkits, chunked questions, and scaffolded work spaces.

R

rubaiya.ahmed

Line Craft Worksheet

Line Craft Worksheet

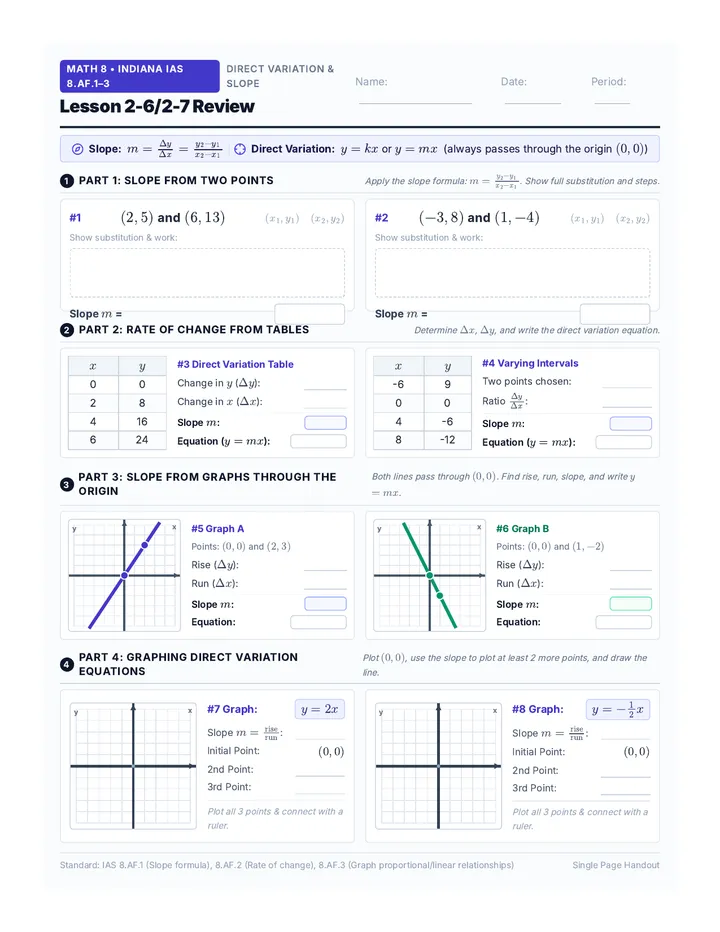
A Grade 8 review worksheet (Lessons 2-6/2-7) covering slope from ordered pairs with expanded work areas, rate of change from tables, slope from graphs through the origin, and graphing direct variation equations.

K

Kyle.Nicholson

Slope Sleuths Worksheet

Slope Sleuths Worksheet

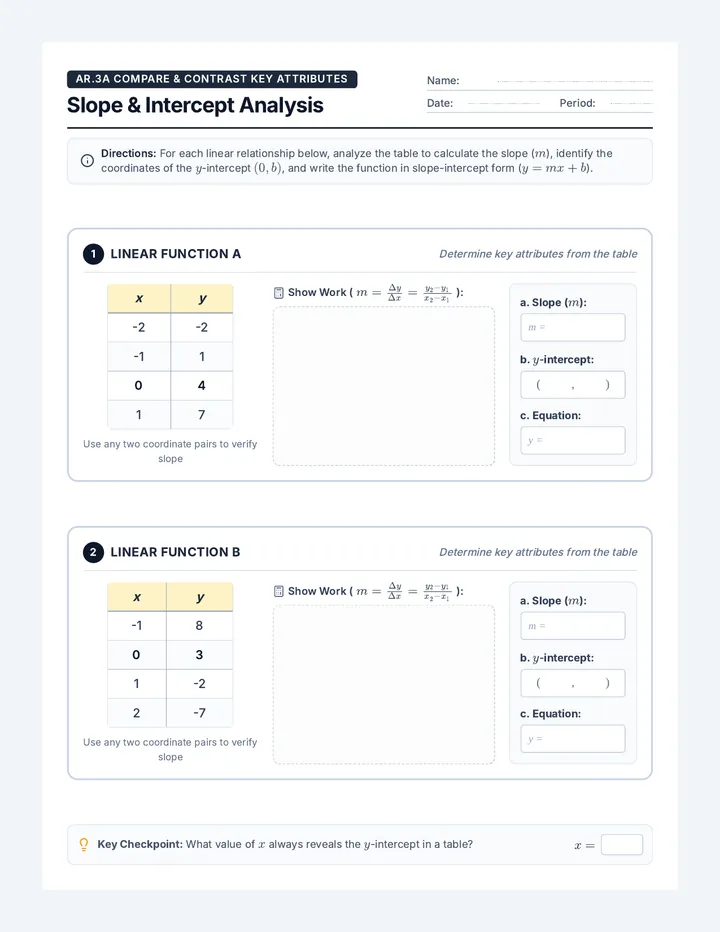
A two-problem practice worksheet focused on determining slope, y-intercept, and linear equations from tables of values. Includes structured show-your-work spaces and clear response templates for student mastery.

MR

Mahuya Roy Chowdhury

Linear Legend Formula Sheet Slice

Linear Legend Formula Sheet Slice

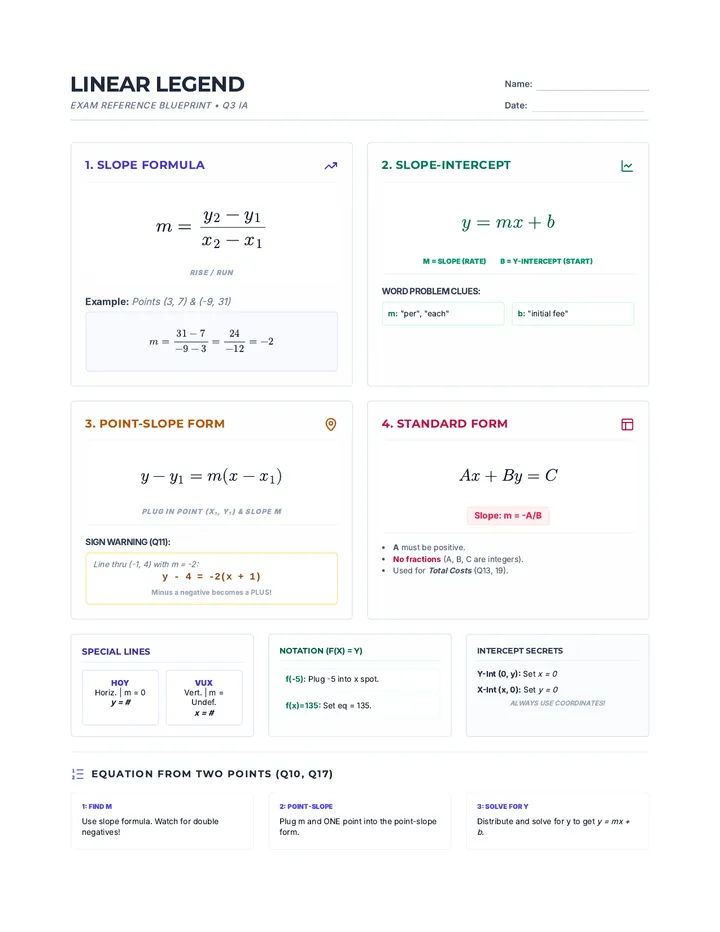
A print-optimized, one-page formula sheet for linear equations. Features reduced font sizes and a minimalist white-background design for high legibility and low ink usage. Includes slope formulas, all linear forms with examples, sign flip warnings, and step-by-step strategies.

D

david.marques

Sequences

Foundation Missions Part 1 Final

Math in Motion: The 2-Hour Summit

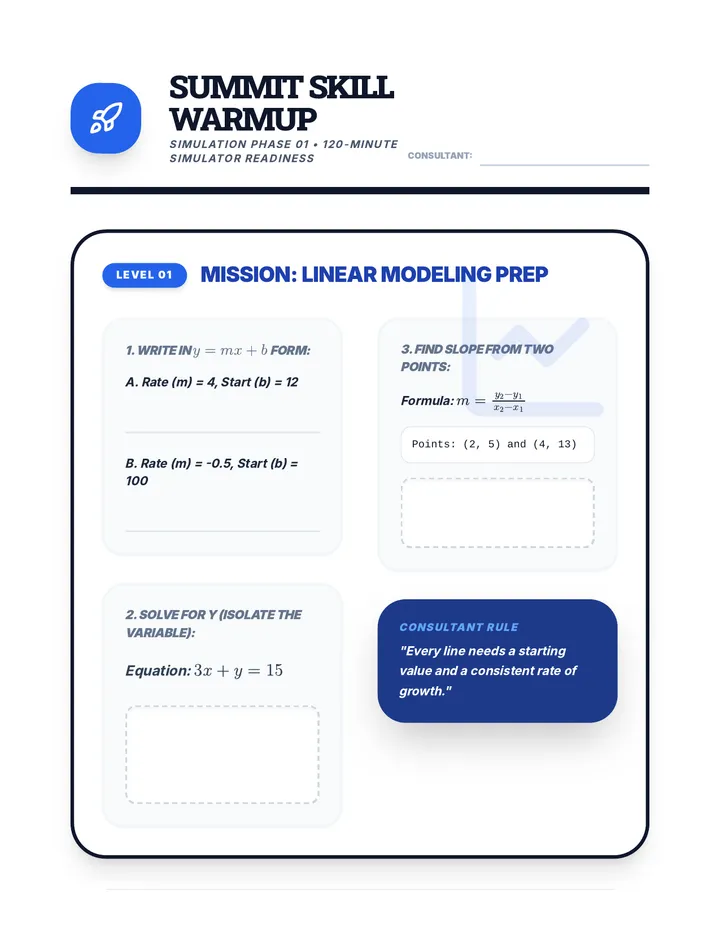
A high-intensity, 120-minute math simulation. Students act as lead consultants, completing a high-speed skill warmup before selecting a professional sector (Music, Urban Planning, Rocket Science, or Sports Analytics) to solve a series of complex work orders.

EL

Elsa LaLone

102
Project Mission Slides Final

Math in Motion: The 2-Hour Summit

A high-intensity, 120-minute math simulation. Students act as lead consultants, completing a high-speed skill warmup before selecting a professional sector (Music, Urban Planning, Rocket Science, or Sports Analytics) to solve a series of complex work orders.

EL

Elsa LaLone

102
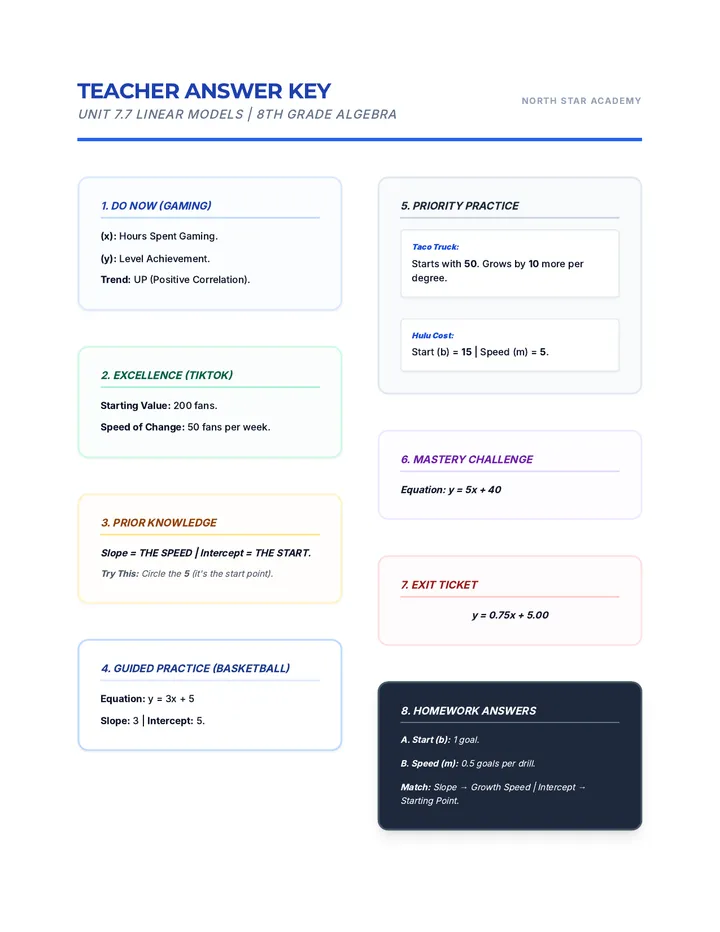
Trend Trackers Answer Key

Algebra Essentials Sequence

A series of 8th and 9th grade Algebra lessons focused on linear relationships and systems of equations, with a focus on SPED/IEP support.

D

deeohnny.jackson

55
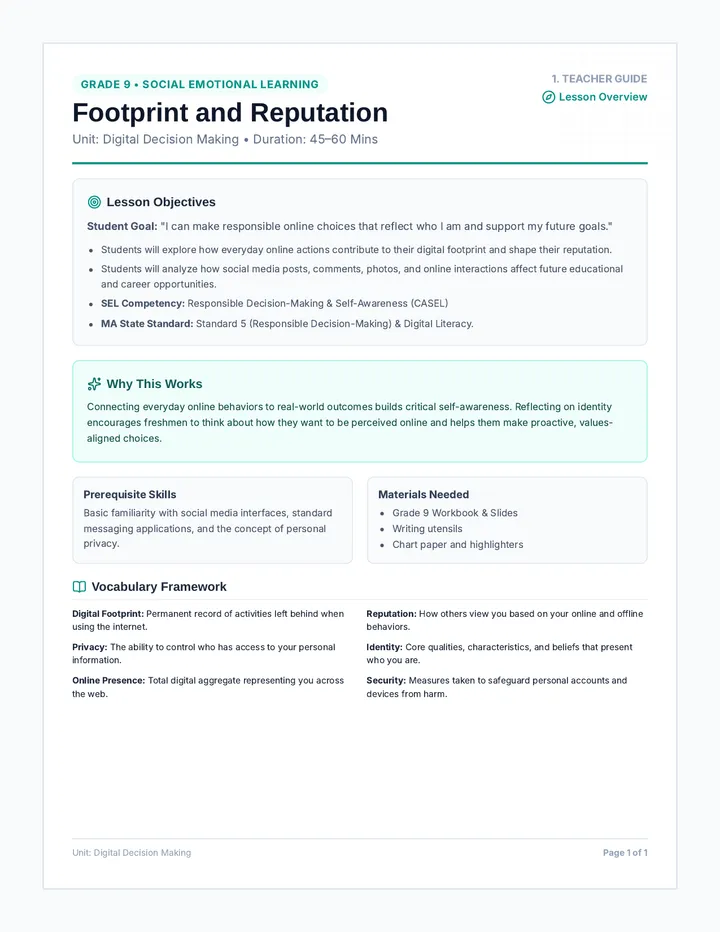
Footprint Teacher Guide

Digital Decision Making

A comprehensive four-year high school SEL unit focusing on responsible digital choices, critical evaluation of online sources, ethical interactions, and positive digital leadership.

J

jtoomey

44
Inequality Blueprint Student Packet

Algebra Blueprint Series

A 5-lesson Algebra series focused on linear inequalities and systems of equations, designed for 9th-grade special education students with scaffolded instruction, visual aids, and scripted teacher guidance.

D

deeohnny.jackson

18
Regents Mastery Blueprint Study Guide

Regents Mastery Suite

A comprehensive review suite for the New York State Mathematics Regents exams, including Algebra 1, Geometry, and Algebra 2, featuring mastery blueprints, calculator strategies, and exam-taking tips.

KB

Kayla Borozny

15

Lessons

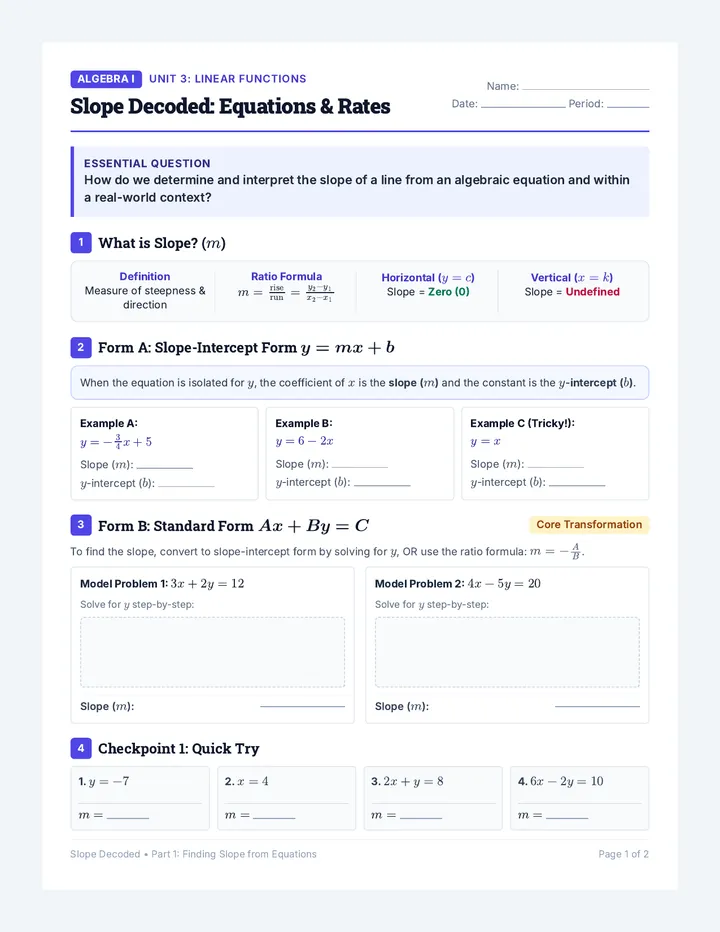
Slope Decoded Guided Notes

Slope Decoded

A comprehensive 100-minute high school algebra lesson exploring slope both algebraically from various equation forms and contextually as a real-world rate of change. Students transition from identifying and calculating slope in equations to interpreting unit rates, initial values, and contextual graphs.

LT

Lane Thompson

6
Blueprint Lesson Plan

Shortcut to the Graph

A 65-minute lesson for 9th-grade students on graphing linear equations efficiently using slope-intercept form (y = mx + b). Students move from the tedious method of tables to the 'shortcut' of using the y-intercept and slope as a blueprint for their lines.

KC

Kris Coyne

5
Slope Mastery Presentation

Steepness of a Story

This lesson introduces 9th-grade students to the concept of slope, enabling them to calculate it from graphs or two given points and interpret it as a rate of change in real-world scenarios.

KC

Kris Coyne

8
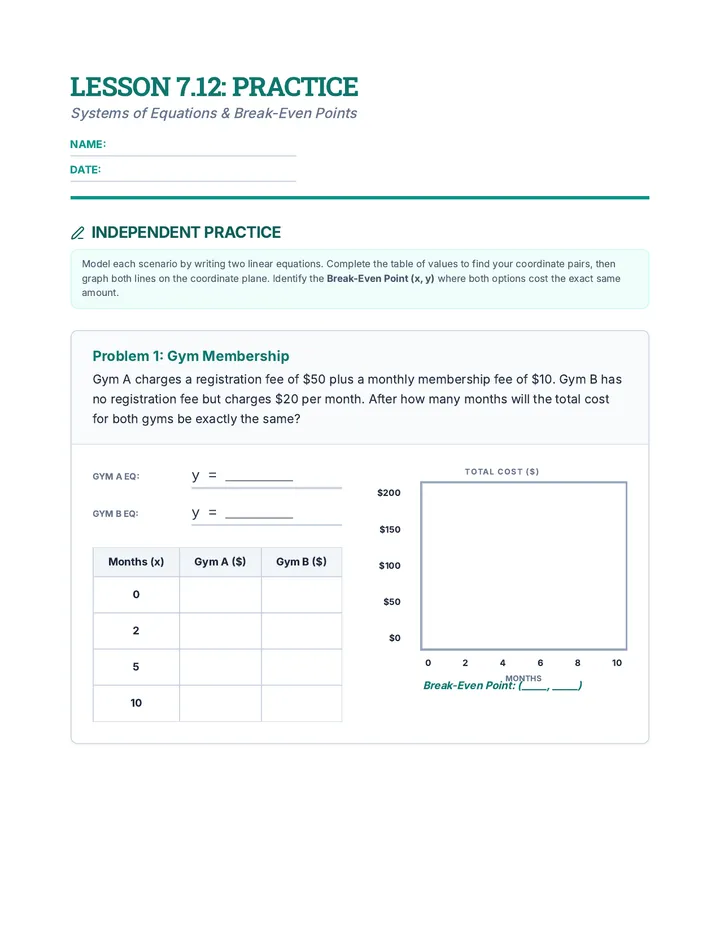
Lesson 7.12 Practice Worksheet

Lesson 7.12

A comprehensive series of activities where students learn to identify, model, and solve systems of linear equations to find the 'better deal' in real-world scenarios.

D

david.marques

4
Algebra 1 Formula Sheet

Algebra 1 Assessment

A comprehensive final assessment for Algebra 1 covering linear equations, systems, exponents, polynomials, and quadratic functions. Includes free response and graphing sections to evaluate deep understanding.

JF

Jim Fusaro

3
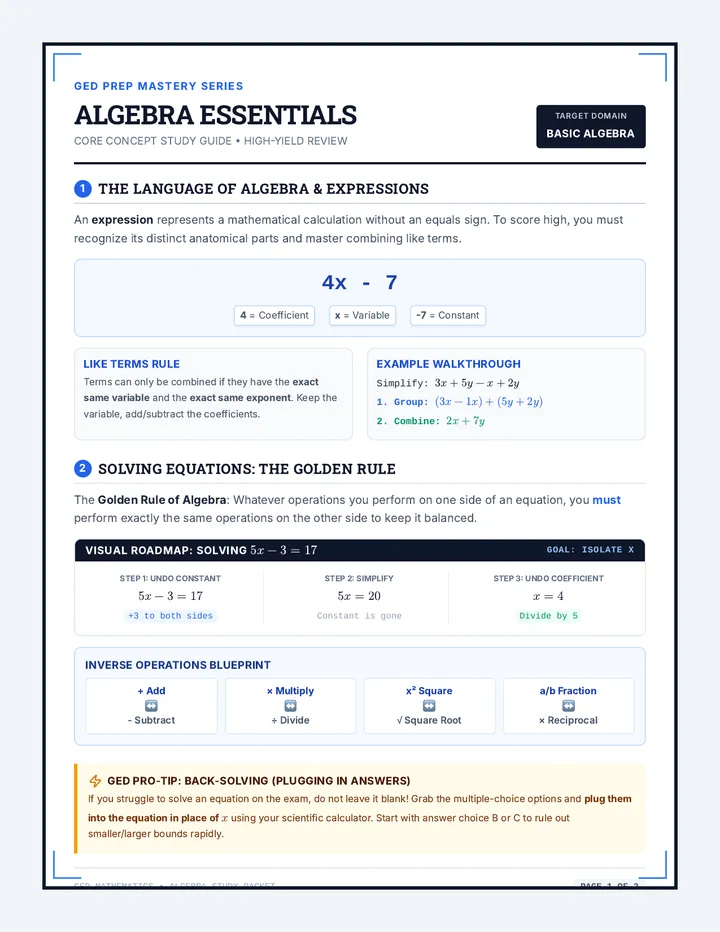
Algebra Essentials Study Guide

Algebra Essentials

A high-yield GED prep lesson targeting core algebraic reasoning, including linear equations, inequalities, simplifying expressions, and coordinate functions. Includes a comprehensive study guide, practice worksheet, and step-by-step explanatory answer key.

CJ

Cindy Jennings

3