Lenny.com
Explore
Create
ActivitiesNewMathEnglish Language ArtsScience & EngineeringSocial StudiesGlobal LanguagesHealth & Physical EducationSpecial EducationCounseling & Life SkillsArts & CreativityESL
Lenny.com
Lenny.com
Explore
Create
ActivitiesNewMathEnglish Language ArtsScience & EngineeringSocial StudiesGlobal LanguagesHealth & Physical EducationSpecial EducationCounseling & Life SkillsArts & CreativityESL
Lenny.com

Curve Sketching and Analysis

Analysis of function behavior using first and second derivatives to identify extrema, concavity, and points of inflection. Integrates limits, asymptotes, and intercepts to accurately visualize complex algebraic expressions graphically.

Lenny.com

Solutions

Lenny for EducatorsLenny for SchoolsLenny for Districts

Product

ExploreSign inCreateSupportAbout

Resources

Getting startedMTSS Acceleration Program

© 2026 Lenny Learning Inc.

TermsPrivacyAccessibility
LinkedInInstagramX
Lenny
MathNumbers & CountingCounting ObjectsNumber NamesComparing NumbersNumber OperationsCounting SequenceNumbers 0-10Place Value Understanding and SystemAdd and Subtract Within 20Addition and Subtraction ConceptsAddition and Subtraction EquationsAddition and Subtraction ProblemsFoundations for MultiplicationMultiplication and Division PropertiesMultiply and Divide Within 100Multiplication and Division ProblemsFactors and MultiplesProperties of OperationsPatterns and RelationshipsGenerate and Analyze PatternsMulti-Digit ArithmeticPlace Value OperationsMulti-Digit and Decimal OperationsNumerical ExpressionsFour Operations and PatternsFour Operations Problem SolvingMeasurement & DataMeasurable AttributesMeasuring LengthsMeasure and Estimate Lengths in Standard UnitsRelate Addition and Subtraction to LengthClassifying and Counting ObjectsTime and MoneyArea Concepts and MeasurementPerimeter and Area MeasuresAngle Concepts and MeasurementTime, Volume, and MassMeasurement Unit ConversionsGeometryIdentifying ShapesShapes and AttributesShape Attributes and ReasoningShapes and CompositionClassifying 2D FiguresGeometric Figures and RelationshipsLines, Angles, and ShapesAngle, Area, and VolumeGeometric MeasurementVolume of 3D ShapesCoordinate Plane ApplicationsTransformations in the PlaneCongruence and SimilarityUnderstand congruence in terms of rigid motionsSimilarity and TransformationsProve Theorems Involving SimilarityPythagorean TheoremTrigonometry for General TrianglesMake Geometric ConstructionsProve Geometric TheoremsTheorems About CirclesFind Arc Lengths And Areas of Sectors of CirclesVolume FormulasRelationships Between Two-Dimensional and Three-Dimensional ObjectsProve Simple Geometric Theorems AlgebraicallyTranslate Between Geometric Description and Equation for Conic SectionApply Geometric Concepts in Modeling SituationsFractions & DecimalsFractions as NumbersBuilding FractionsFraction Equivalence and OrderingAdding and Subtracting FractionsMultiplying and Dividing FractionsDividing FractionsDecimal FractionsMulti-Digit Computation and FactorsAdd, Subtract, Multiply, and Divide Rational NumbersRational Number SystemIrrational Numbers and ApproximationsRatiosRatios and ProportionsProportional RelationshipsUnit RateAlgebraAlgebraic ExpressionsGenerate Equivalent ExpressionsQuantitative RelationshipsProportional Relationships and Linear EquationsEquations and InequalitiesEquation Solving and ReasoningLinear Equations and SystemsGraph Equations and InequalitiesSystems of EquationsReal-World Algebraic ProblemsQuantitative Reasoning with UnitsExpression StructureEquivalent Expression FormsRadicals and Integer ExponentsRational ExponentsRational and Irrational NumbersPolynomial OperationsPolynomial IdentitiesPolynomial Zeros and FactorsRational ExpressionsComplex Number OperationsComplex Numbers in PolynomialsComplex Numbers on PlaneStatistics & ProbabilityRepresent and Interpret DataData DistributionsStatistical VariabilityProbability ModelsCompound Event ProbabilitiesStatistical SamplingInterpret Categorical and Quantitative DataBivariate Data PatternsInterpret Linear ModelsComparing Two PopulationsRandom Processes in StatisticsIndependence and Conditional ProbabilityExpected ValuesProbability-Based Decision MakingStatistical Inference and ConclusionsFunctionsFunction Concepts and NotationDefine and Compare FunctionsInterpret Functions in ContextAnalyze Function RepresentationsModel Relationships with FunctionsIdentify Linear vs Exponential GrowthDistinguish Between Function TypesCompare Growth RatesInterpret Function ExpressionsBuild Functions from RelationshipsConstruct and Model FunctionsTransform and Combine FunctionsModel Comparison and SelectionSolve Exponential EquationsTrigonometryTrigonometric Ratios Involving Right TrianglesTrigonometric Functions and Unit CircleModel with Trigonometric FunctionsTrigonometric IdentitiesVectors & MatricesIntroduction to Vectors and MatricesVector QuantitiesVector OperationsMatrix OperationsCalculusLimits and ContinuityDerivative Concepts and NotationDerivative Rules and TechniquesApplications of DerivativesOptimization ProblemsRelated RatesCurve Sketching and AnalysisIntegration Concepts and NotationAntiderivatives and Indefinite IntegralsDefinite Integrals and AreaFundamental Theorem of CalculusIntegration TechniquesApplications of IntegrationDifferential EquationsSequences and SeriesParametric and Polar FunctionsVector-Valued Functions

Videos

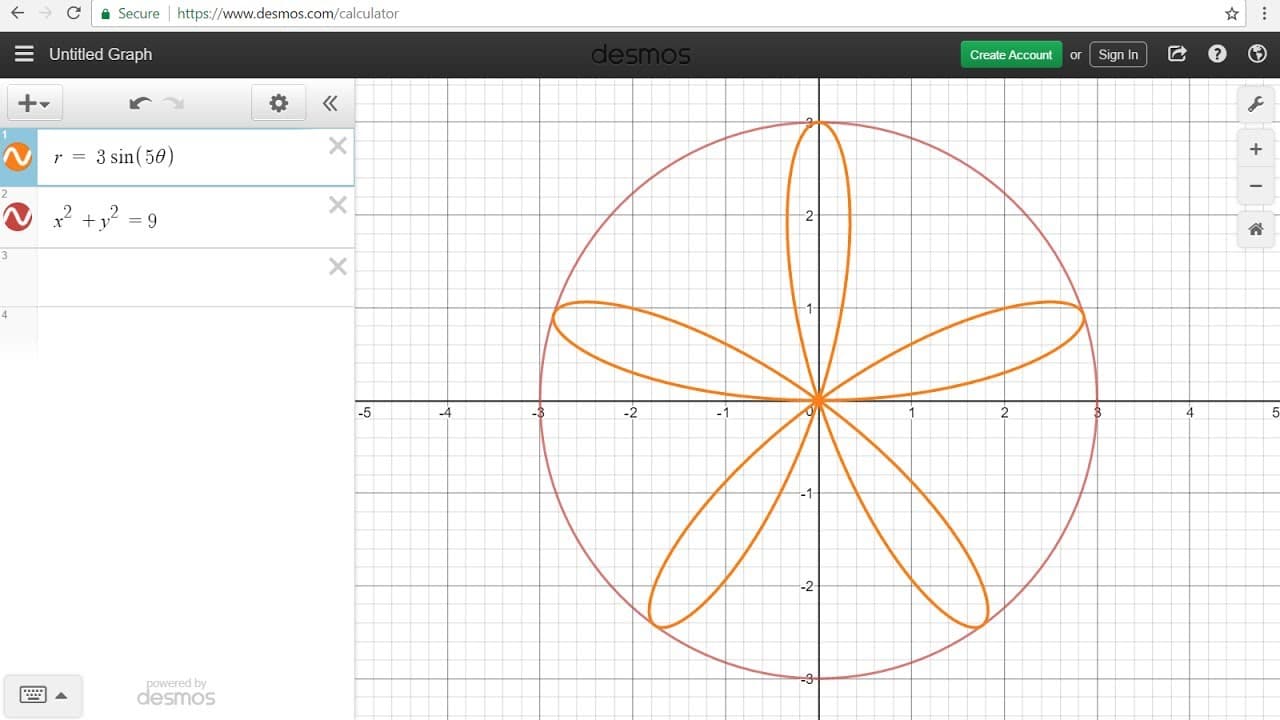
Mastering Math with the Desmos Online Graphing Calculator

Mastering Math with the Desmos Online Graphing Calculator

This comprehensive tutorial introduces students and educators to the Desmos online graphing calculator, a powerful and free tool for visualizing mathematics. The video begins with the basics of accessing the site and graphing simple functions like lines and parabolas, then progressively moves to more advanced topics including trigonometry, polar coordinates, and calculus operations. The narrator demonstrates not just how to plot graphs, but how to use the tool to solve equations, factor quadratics, and visualize systems of inequalities. Key mathematical themes include function families (linear, quadratic, cubic, absolute value, exponential, logarithmic), systems of equations and inequalities, trigonometry (degrees vs. radians), and statistical analysis (mean, standard deviation). The video also highlights the calculator's computational abilities, such as evaluating definite integrals, summations, and permutations, making it a versatile utility for various levels of math. For the classroom, this video serves as an excellent training resource for students transitioning from handheld calculators to computer-based tools. It allows teachers to show students how to verify their algebraic work visually, such as checking factors by looking at x-intercepts or solving systems by finding intersection points. The visual nature of the tool helps bridge the gap between abstract algebraic manipulation and concrete graphical understanding.
The Organic Chemistry TutorThe Organic Chemistry Tutor

13mins 58s

Materials

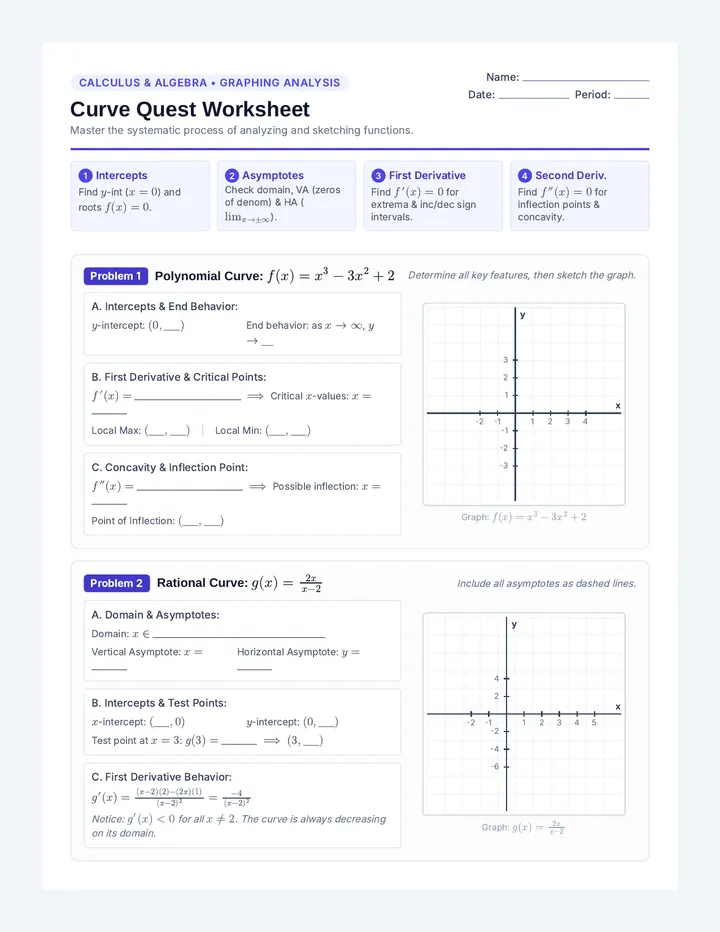
Curve Quest Worksheet

Curve Quest Worksheet

A two-page print-ready calculus and algebra worksheet guiding students through systematic curve sketching. Features analysis frameworks, polynomial and rational functions, property-based curve puzzles, and precise coordinate grids.

R

Robinson

Sequences

Growth Dynamics Slides

System Dynamics and Chaos

A graduate-level exploration of discrete dynamical systems, moving from linear growth models to the complex, chaotic behavior of the logistic map. Students apply recursive sequences to model biological and economic phenomena, emphasizing stability analysis and bifurcation theory.

10
Radial Slope Slides

Radial Calculus

A comprehensive unit for 12th Grade Calculus students focusing on the derivation and application of derivatives in polar coordinates. Students transition from Cartesian slope to polar slope, analyze horizontal and vertical tangency, investigate behavior at the pole, and solve optimization problems involving polar curves.

15
Coordinate Chronicles Worksheet

Vector Voyages

A comprehensive unit on parametric equations and their applications in modeling motion. Students move from the basics of parametric curves to advanced calculus concepts like derivatives, concavity, vectors, and arc length.

12
Polar Slope Slides

Polar Differentiation Techniques

This sequence explores the calculus of polar functions, focusing on differentiation techniques. Students will learn to calculate slopes of tangent lines, identify horizontal and vertical tangents, analyze behavior at the pole, and apply optimization to find maximum and minimum distances from the origin.

10
Cusps and Curves Slides

Rational Exponents Blueprint

A sequence for undergraduate students bridging pre-calculus and calculus by focusing on the analytical properties of functions with rational exponents. Students explore graphing, algebraic rewriting, rationalizing for limits, and growth comparison.

11
Tangent Slopes Worksheet

Curve Calculus

This sequence covers the calculus of parametric curves, including first and second derivatives, tangent lines, concavity, arc length, and surface area of revolution. Designed for undergraduate calculus students, it emphasizes direct parametric differentiation and integration techniques.

10

Lessons

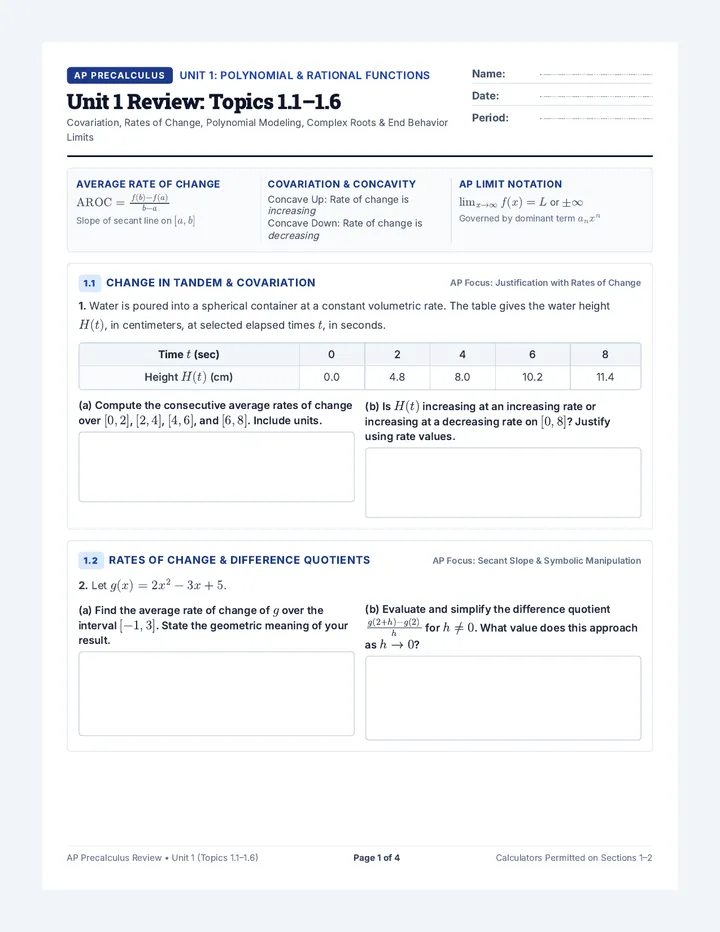
Polynomial Power Review Packet

Polynomial Power Review

A comprehensive AP Precalculus Unit 1 review covering Topics 1.1 through 1.6, featuring student practice problems with AP-style reasoning and a full teacher scoring guide.

2
Zoom Pente Slides

Zoom sur la Pente

Une leçon interactive de niveau Première générale sur la notion de nombre dérivé, s'appuyant sur des visualisations graphiques du passage de la sécante à la tangente, la lecture et le tracé de coefficients directeurs, et le lien avec le sens de variation.

3
Blueprint for Limits Lesson Plan

Blueprint for Limits

This AP Calculus review lesson bridges the gap between algebraic rational function rules and formal limit notation, using visual sketching as a framework for understanding asymptotic behavior and continuity. Students translate pre-calculus 'rules' into calculus 'logic' to prepare for the formal definition of limits.

4
Roller Coaster Design Worksheet

Roller Coaster Calculus

Students will learn to identify and describe intervals of increase, decrease, and constant behavior in functions using interval notation through a roller coaster design challenge. The lesson emphasizes using x-values to define these intervals and distinguishing between location and value.

4
Asymptote Limits Lesson Plan

Asymptote Blueprints

A 12th-grade Pre-Calculus lesson connecting the algebraic evaluation of infinite limits and limits at infinity to the visual behavior of vertical and horizontal asymptotes. Students analyze reciprocal functions from a video to bridge the gap between algebra and calculus.

5
Asymptote Analysis Lesson Plan

Asymptote Analysis

A comprehensive lesson plan and student activity connecting algebraic graphing rules to rigorous calculus limit definitions, centered around a detailed rational functions tutorial.

4