A visual presentation deck for the quadratic formula lesson, featuring vocabulary matching, a video embed, guided instruction for the Think-Pair-Share activity, and closure prompts. Font sizes updated to ensure readability.
A comprehensive summer bridge workbook for rising 8th graders transitioning to Algebra 1. Contains review of prerequisite topics, advanced pre-algebra skills, real-world application, and an Algebra Escape Challenge.
The second part of the Algebra 1 Summer Bridge Packet. It covers functions & patterns, linear relationships, geometric foundations, statistics & probability, and an advanced Algebra 1 preview.
A specialized 4-page student-facing support and accommodation packet designed specifically for students with expressive language challenges and focus difficulties. Includes visual schedules, 'First-Then' pacing boards, structured sentence frames, and simplified graphic organizers with rocket-themed visuals.
A high-intensity, 120-minute math simulation. Students act as lead consultants, completing a high-speed skill warmup before selecting a professional sector (Music, Urban Planning, Rocket Science, or Sports Analytics) to solve a series of complex work orders.
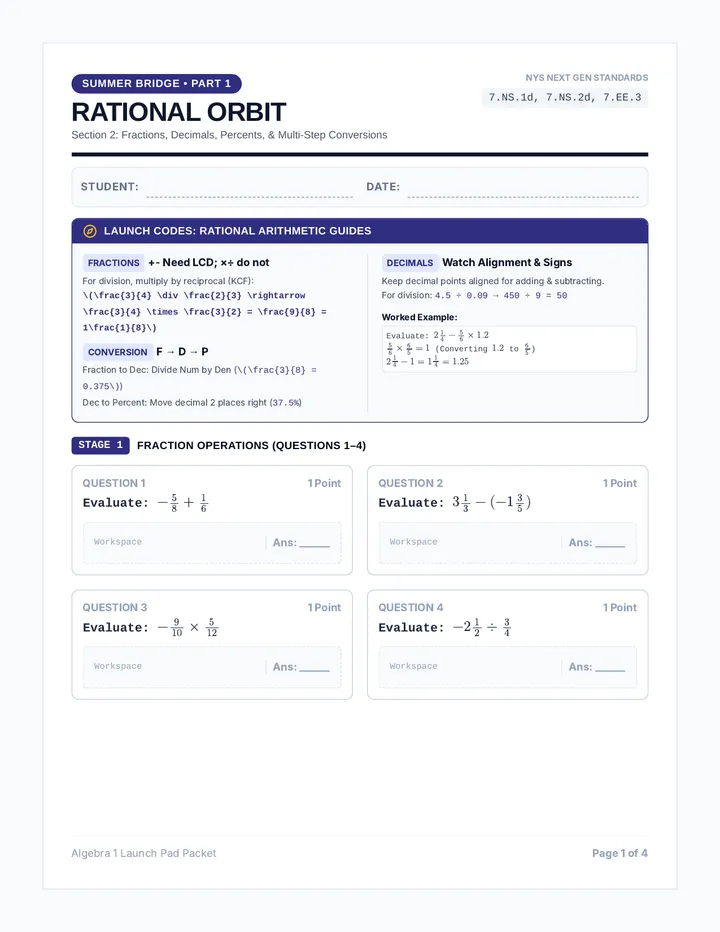
The first part of the Algebra 1 Summer Bridge Packet for rising 8th graders. It covers integer operations, rational numbers, expressions, solving equations, and proportional relationships with worked examples and workspaces.
Comprehensive Teacher Answer Key for sections 6-10 and the Final Escape Challenge of the Summer Bridge Packet. Features step-by-step solutions, final values, and scoring rubrics.
A 4-week math workbook and instructional sequence themed around outer space exploration, specifically designed for middle school students with disabilities (SWDs) working at an early 1st-grade level. Features embedded touch-points, base-ten icons, visual number paths, and age-appropriate space exploration visuals to teach single-digit operations, place value, and patterns.
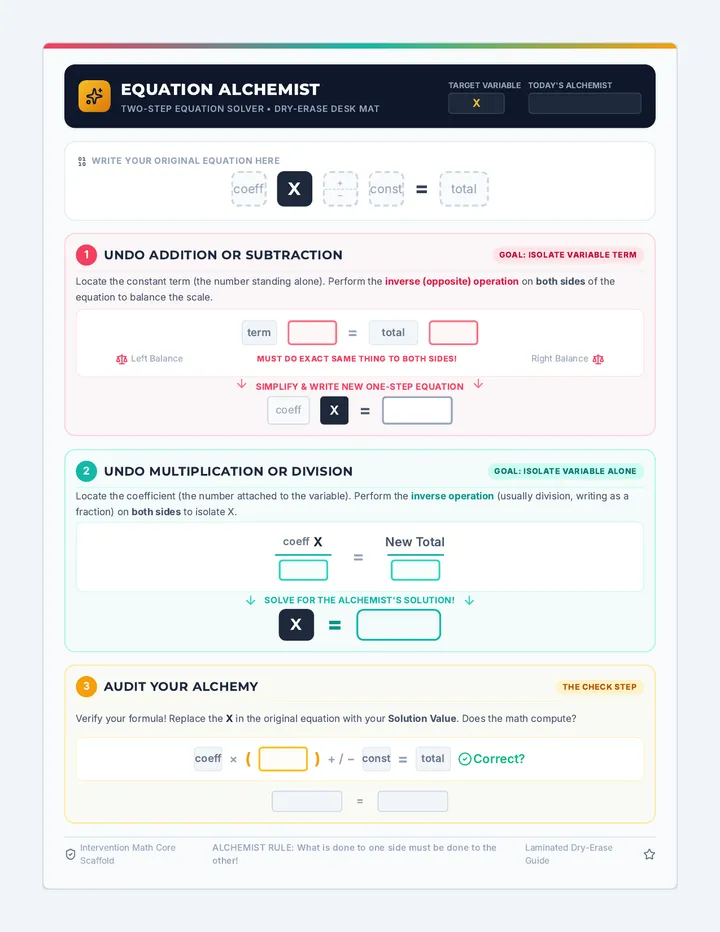
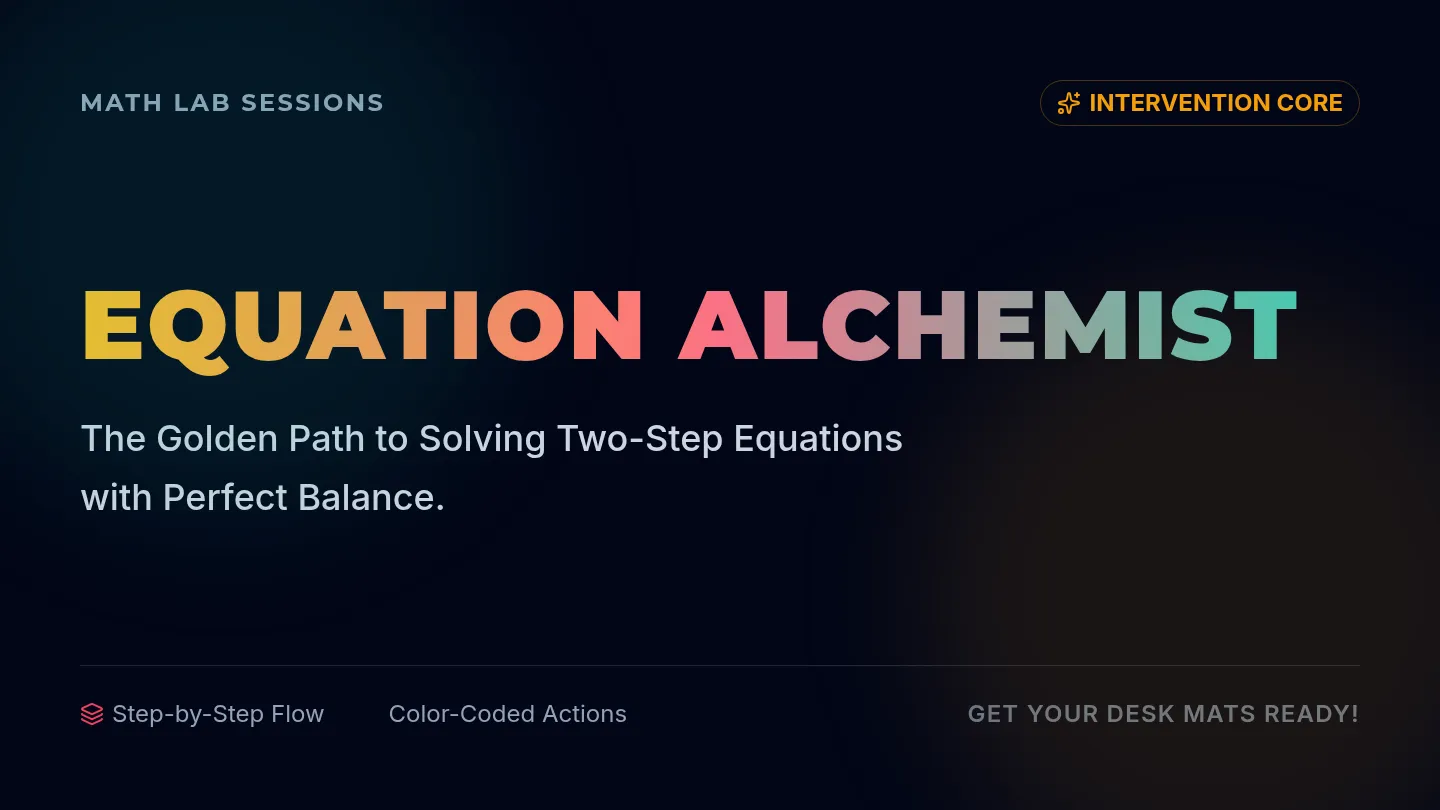
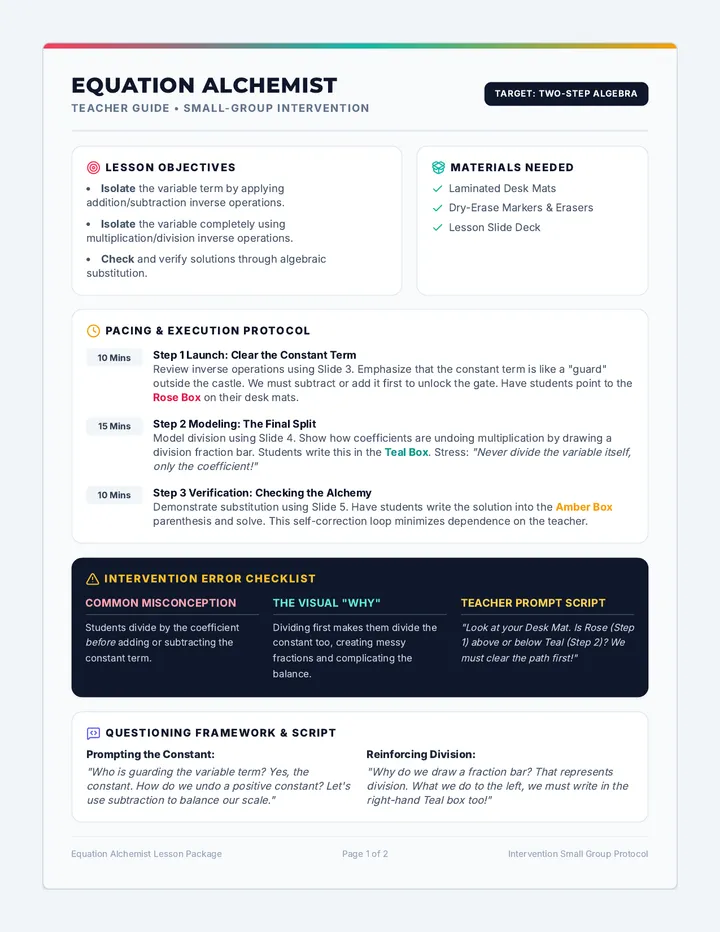
A comprehensive math intervention lesson targeting two-step algebraic equations. Features a color-coded step-by-step visual organizer that guides students through undoing addition/subtraction first, followed by multiplication/division to isolate the variable.
Student workbook for the final Algebra Escape Challenge. Features a space launch themed mission, 10 mixed pre-algebra and algebra preview problems, an input override console, and the official mastery scoring rubric.
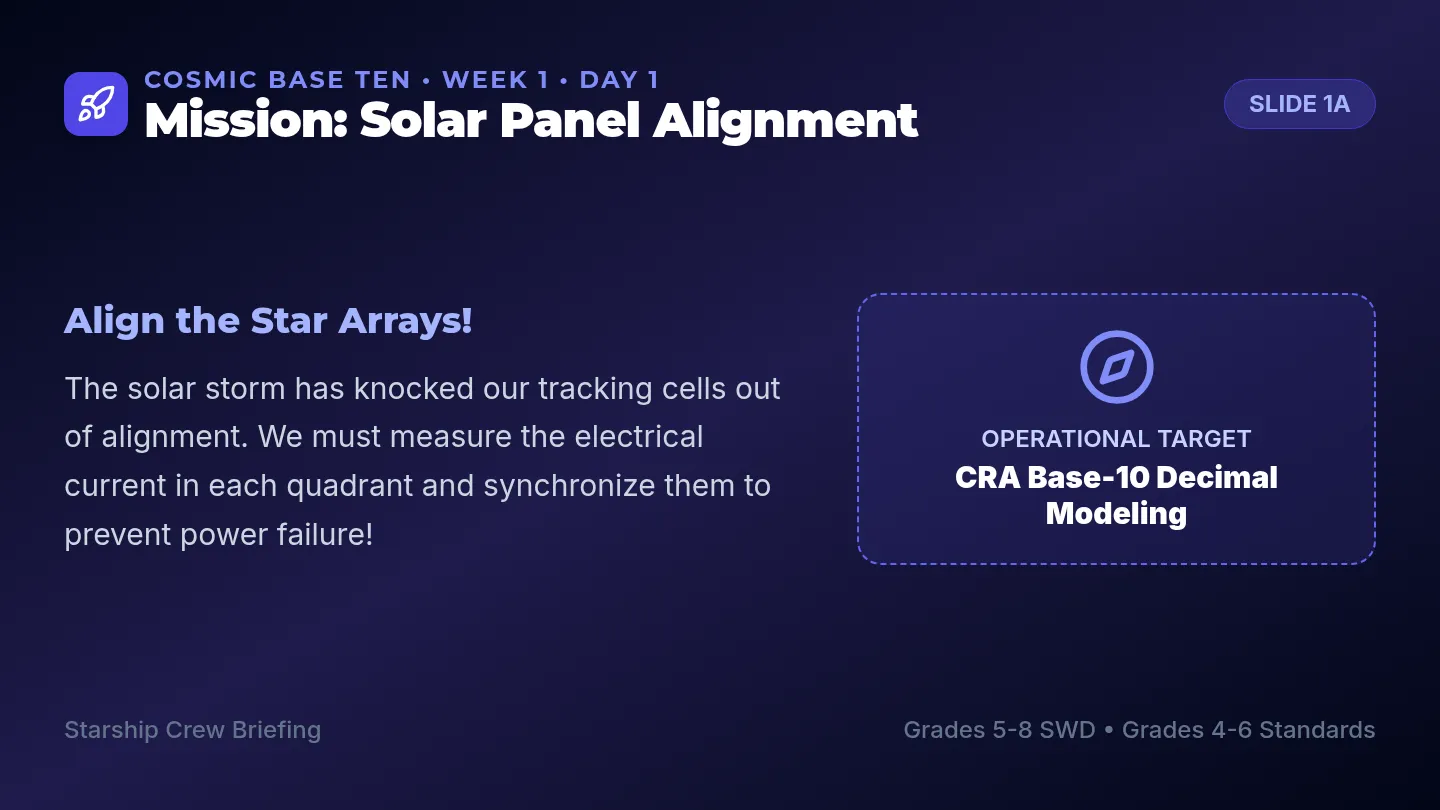
A 4-week intensive math intervention program set in a space exploration universe, designed for multi-grade students with disabilities in Grades 5–8. It covers additive thinking, place value, and decimal regrouping, anchored in Grades 4–6 standards with a Grade 5 core middle ground.
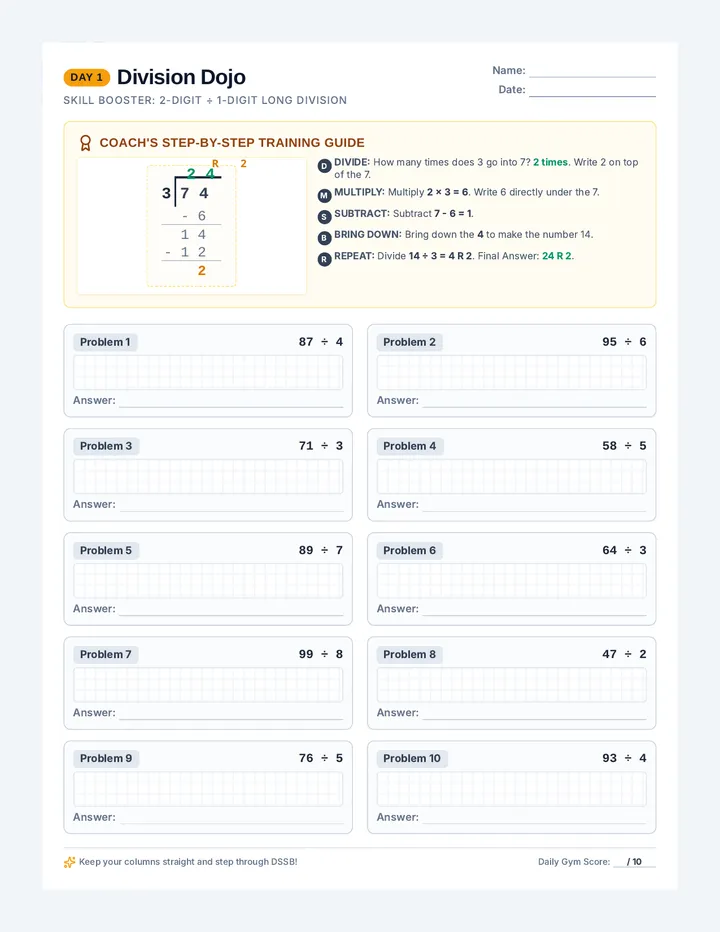
A six-day targeted daily practice series designed to reinforce critical middle school math skills. Each single-page worksheet features a scaffolded, step-by-step solved example followed by 10 targeted practice problems with dedicated workspace.