A hands-on activity where students build bar graphs using tactile cubes or colored pencils based on simple data tables from 'case files.' This helps solidify the connection between numbers and visual height.
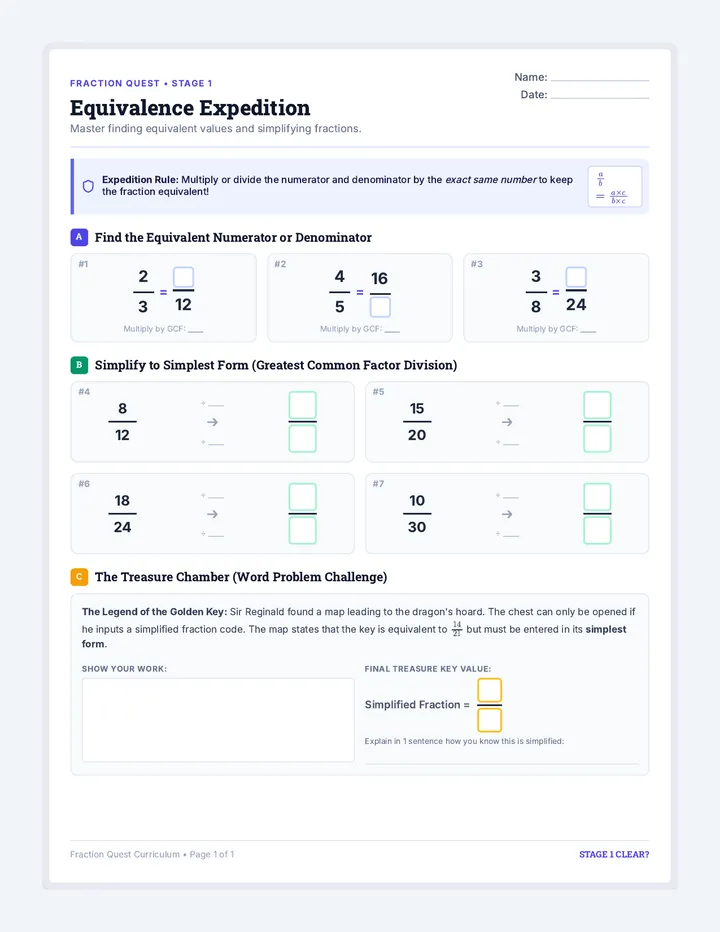
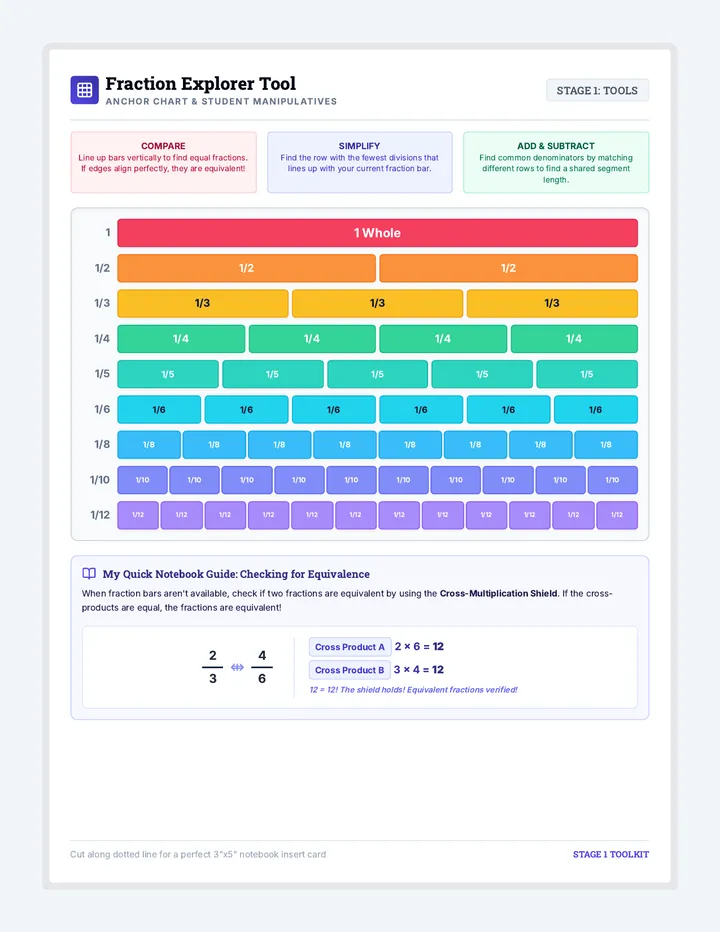
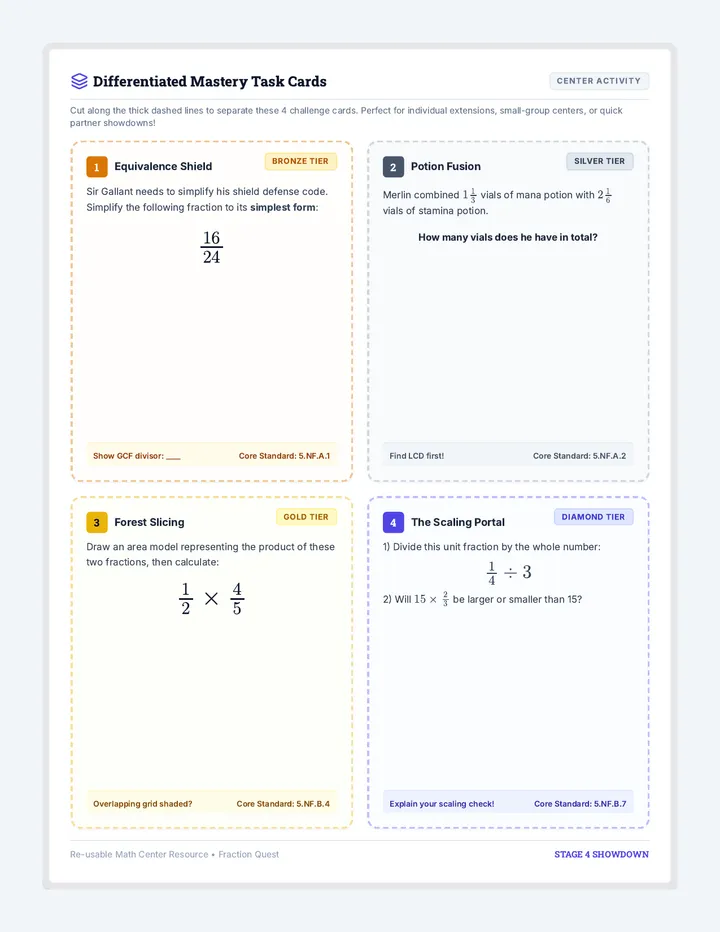
A comprehensive visual math curriculum sequence focusing on fraction equivalence, addition, subtraction, multiplication, division, and comprehensive multi-operation mastery. Includes visual lesson slides, independent practice worksheets, small-group centers, visual tools, and robust assessments.
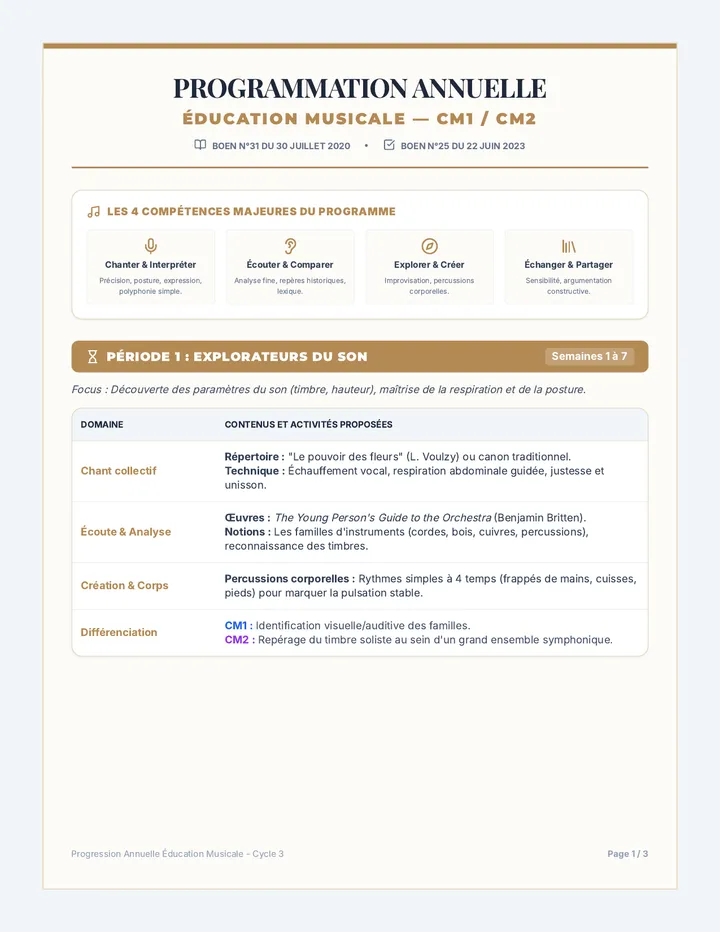
Progression annuelle d'éducation musicale pour le CM1/CM2 structurée en 5 périodes de 7 semaines, conformément aux repères ministériels.
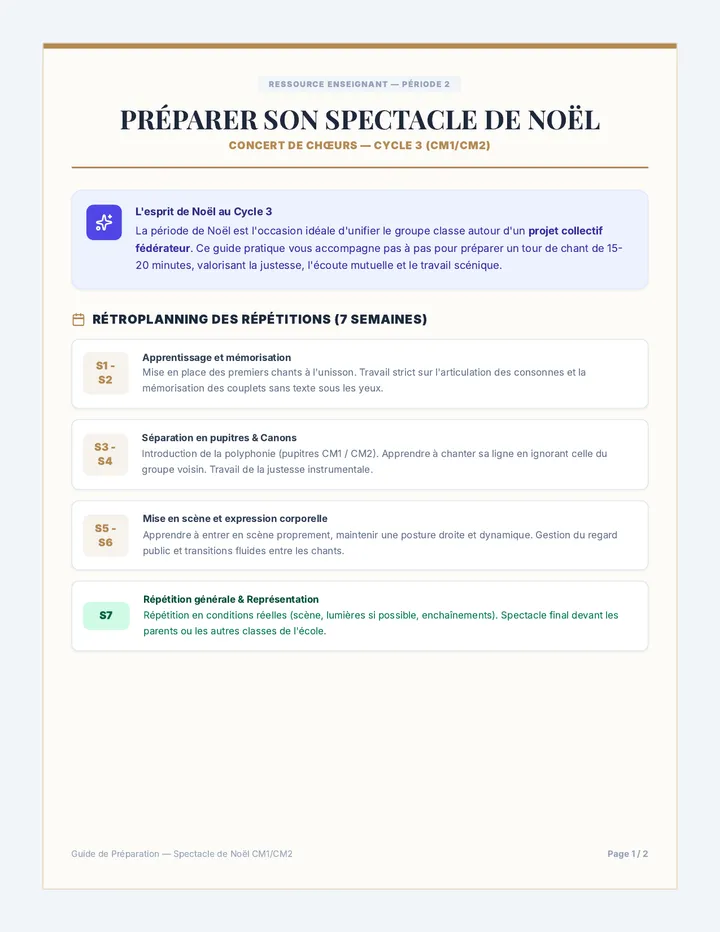
Guide de préparation détaillé pour organiser un spectacle de chants de Noël en classe de CM1/CM2. Comprend un rétroplanning sur 7 semaines, une sélection de répertoire différencié et des conseils d'interprétation scénique.
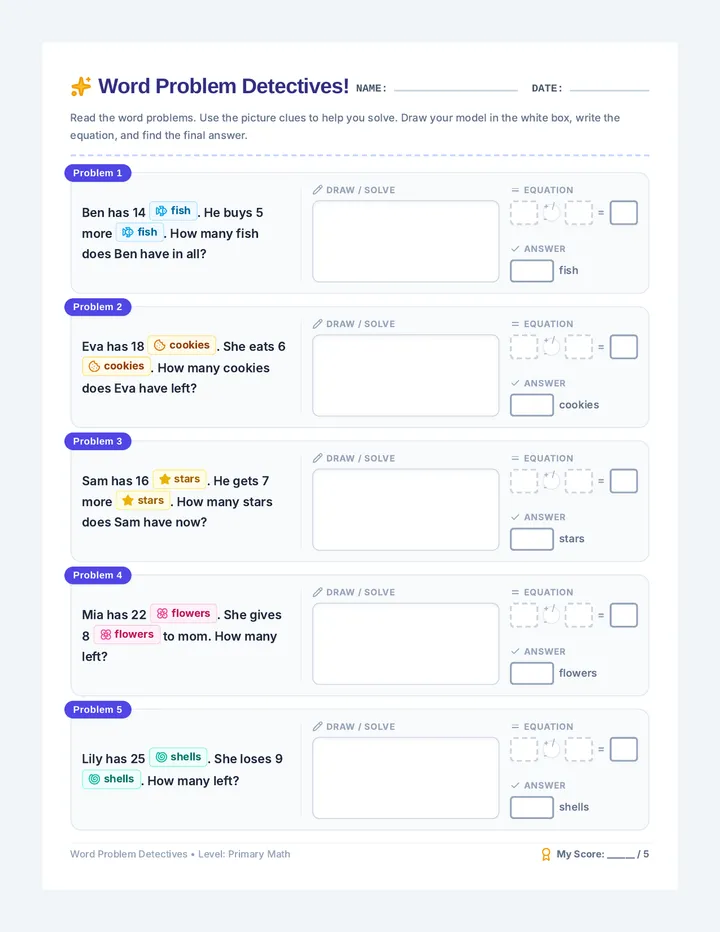
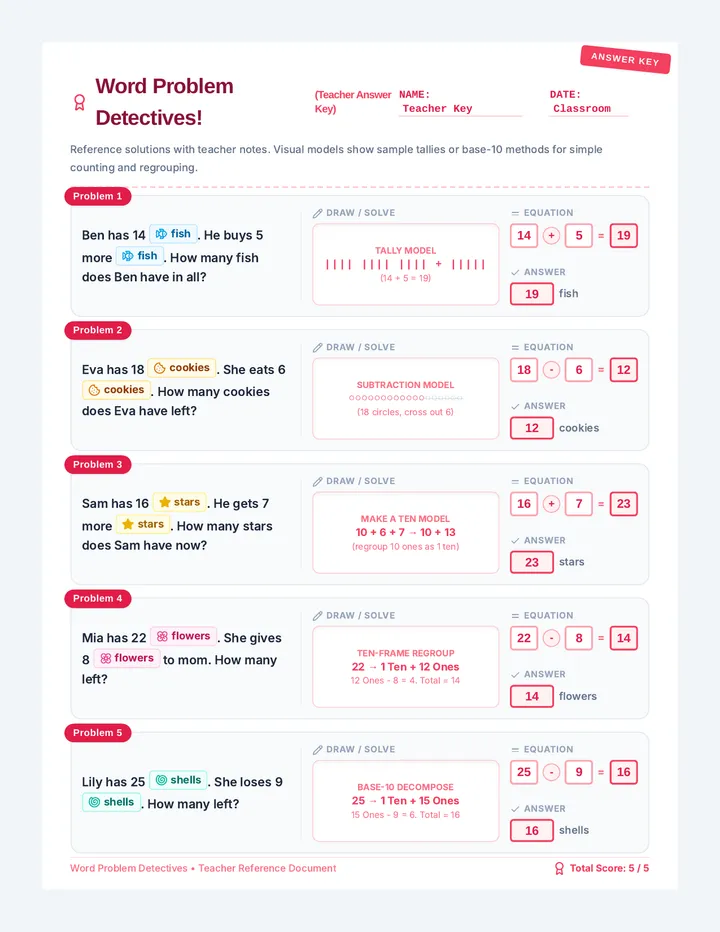
A primary math unit designed to build confidence in solving one-step addition and subtraction word problems. The sequence combines engaging visual cues, scaffolded modeling spaces, and explicit transition strategies between concrete and abstract math representation.
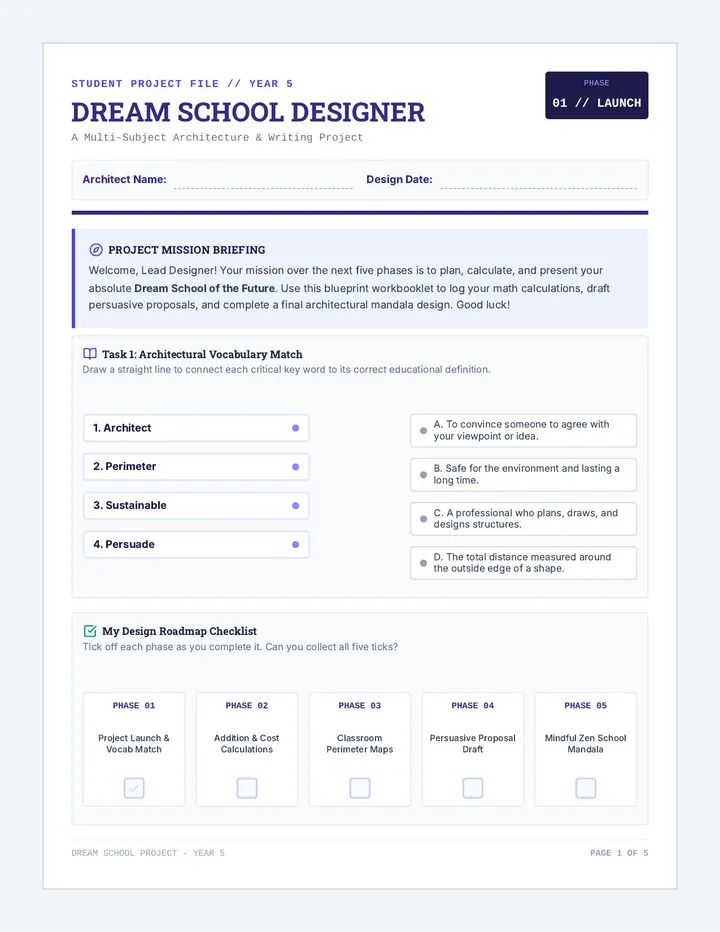
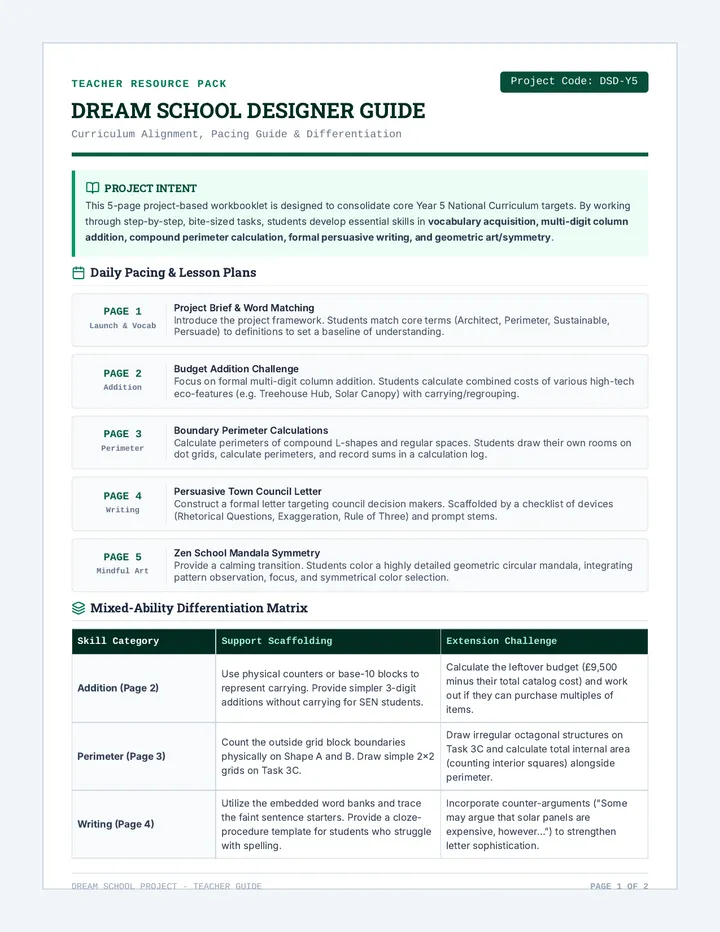
A project-based workbooklet and guide where Year 5 students design their ultimate future school. The project is broken down into structured, bite-sized daily steps integrating English, Maths, Science, Geography, and Art.
Progression annuelle d'éducation musicale en 5 périodes de 7 semaines pour le CM1/CM2 (Cycle 3), conforme aux BOEN 2020 et 2023. Document structuré avec objectifs, chants, écoutes et activités de création. Correction orthographique (rythmes).
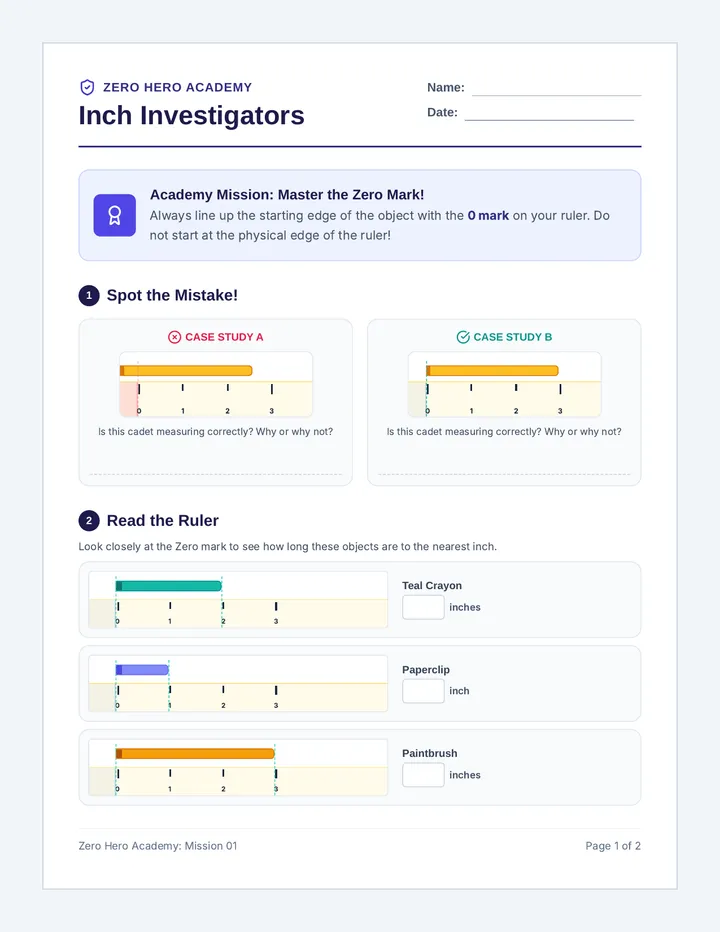
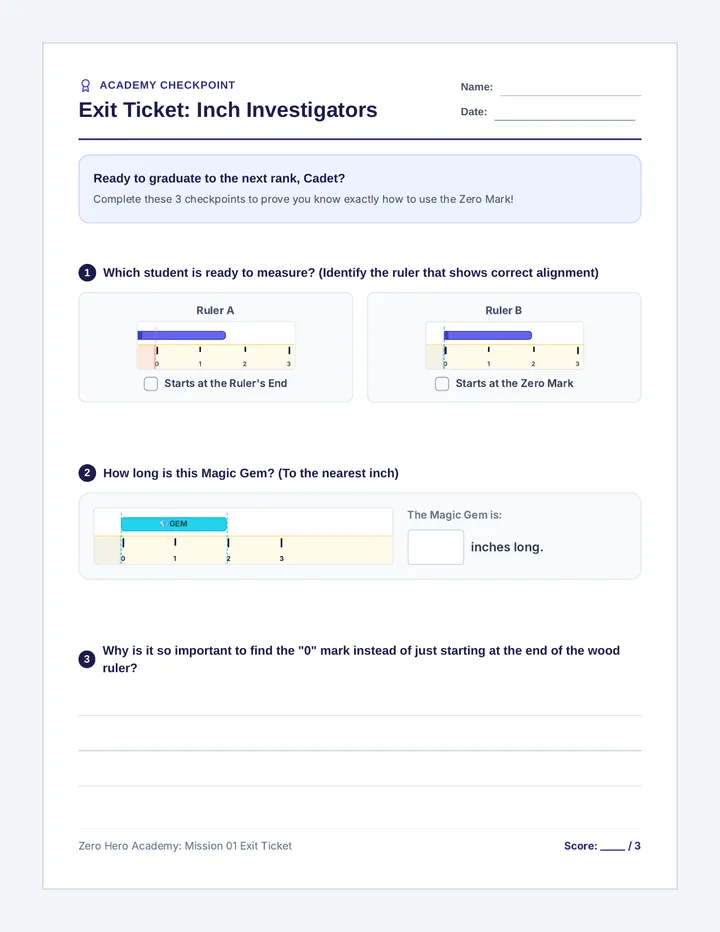
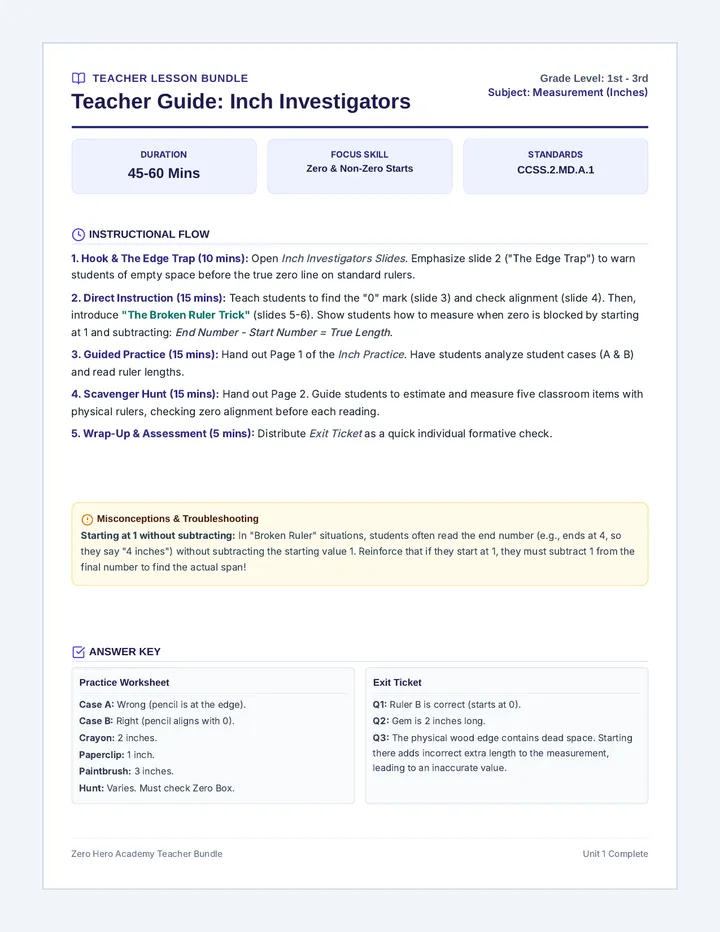
A two-part measuring adventure where students join the Zero Hero Academy to master measuring in inches and centimeters, with a strong focus on aligning the start of objects with the ruler's zero mark.
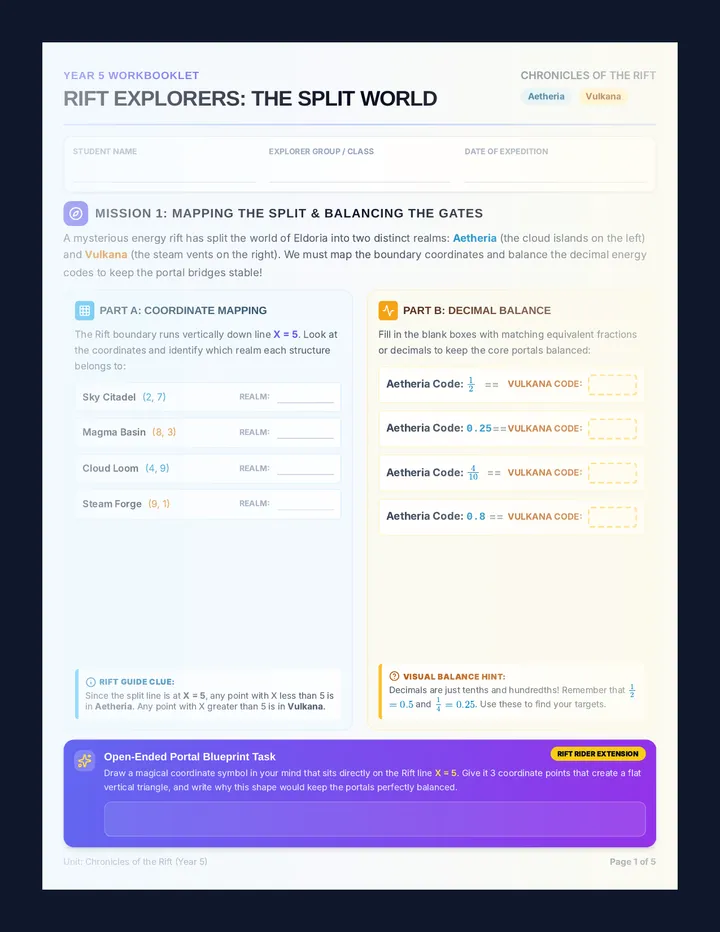
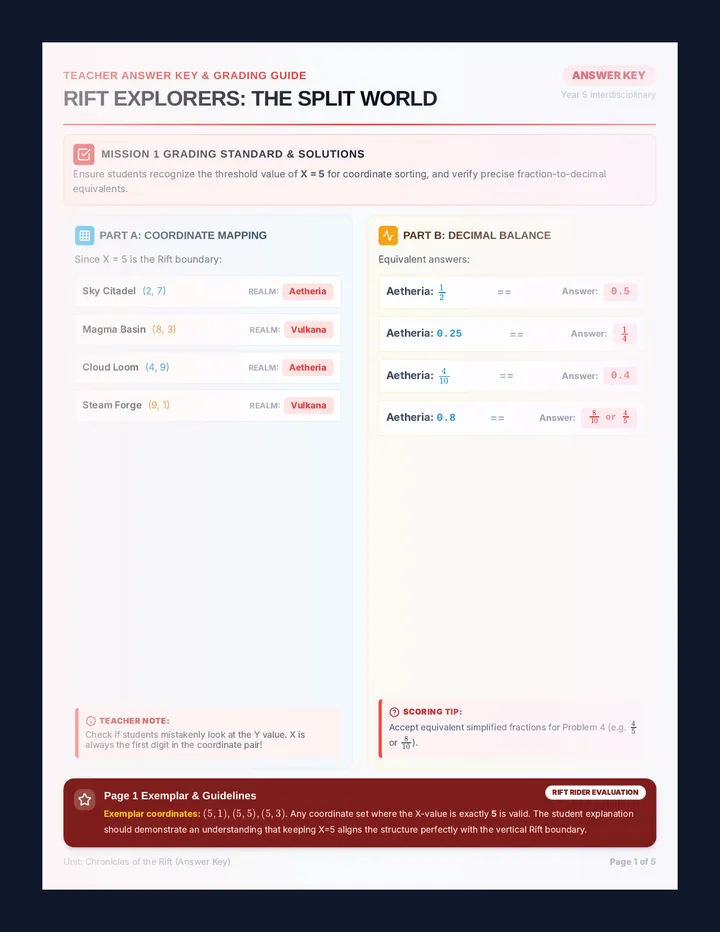
An immersive, five-part interdisciplinary workbook series where Year 5 students explore a world split in two. This booklet integrates mathematics, vocabulary, data handling, and science into a thrilling parallel-world narrative.
A 2-page teacher-facing lesson plan, differentiation matrix, and answer key designed to support educators in delivering the Dream School Designer project to Year 5 mixed-ability classes.
A 4-week math workbook and instructional sequence themed around outer space exploration, specifically designed for middle school students with disabilities (SWDs) working at an early 1st-grade level. Features embedded touch-points, base-ten icons, visual number paths, and age-appropriate space exploration visuals to teach single-digit operations, place value, and patterns.
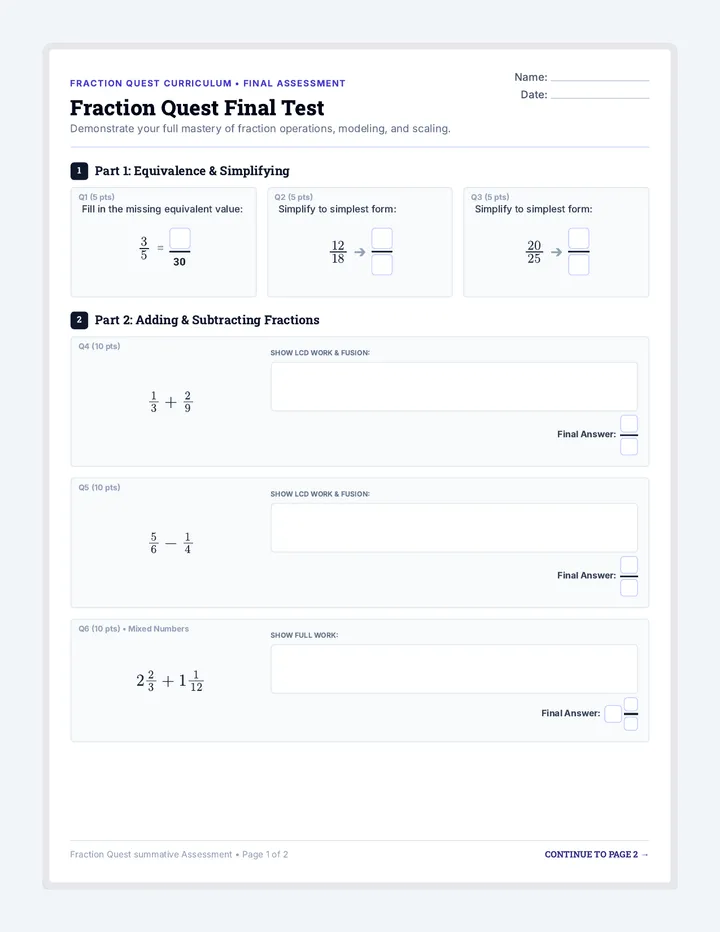
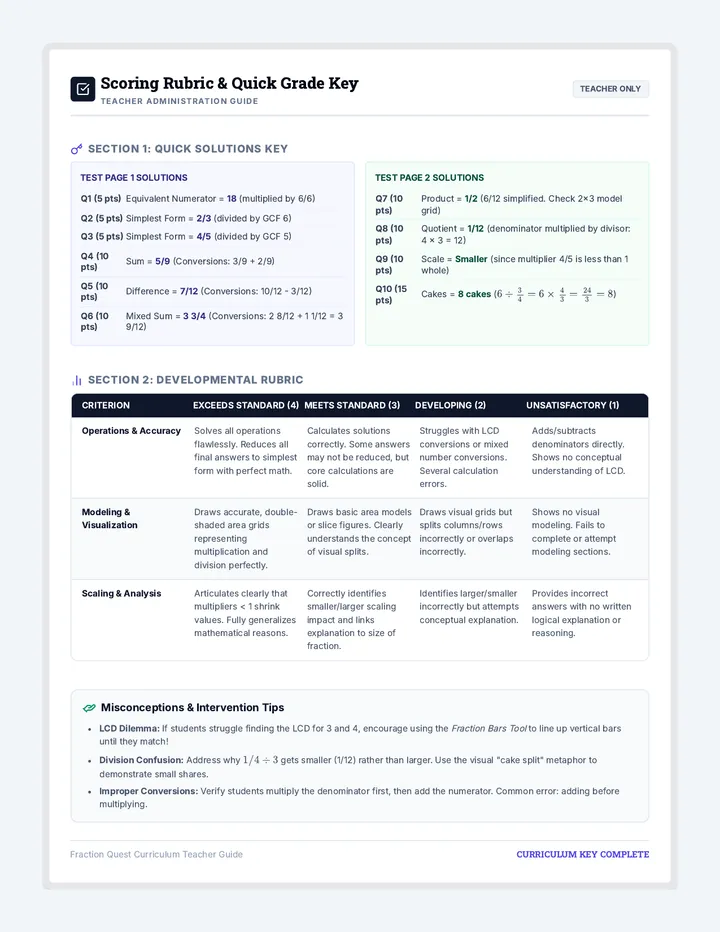
A comprehensive review and assessment of all four fraction operations. Students demonstrate their mastery through an interactive review, final unit assessment, and student reflection.
A redesigned, 5-page student workbooklet featuring a Launch Checklist and Vocab Match, two Maths pages on perimeter and multi-digit addition, a formal Persuasive Writing letter, and a highly detailed SVG mandala for mindful coloring.