Data Detective Assessment
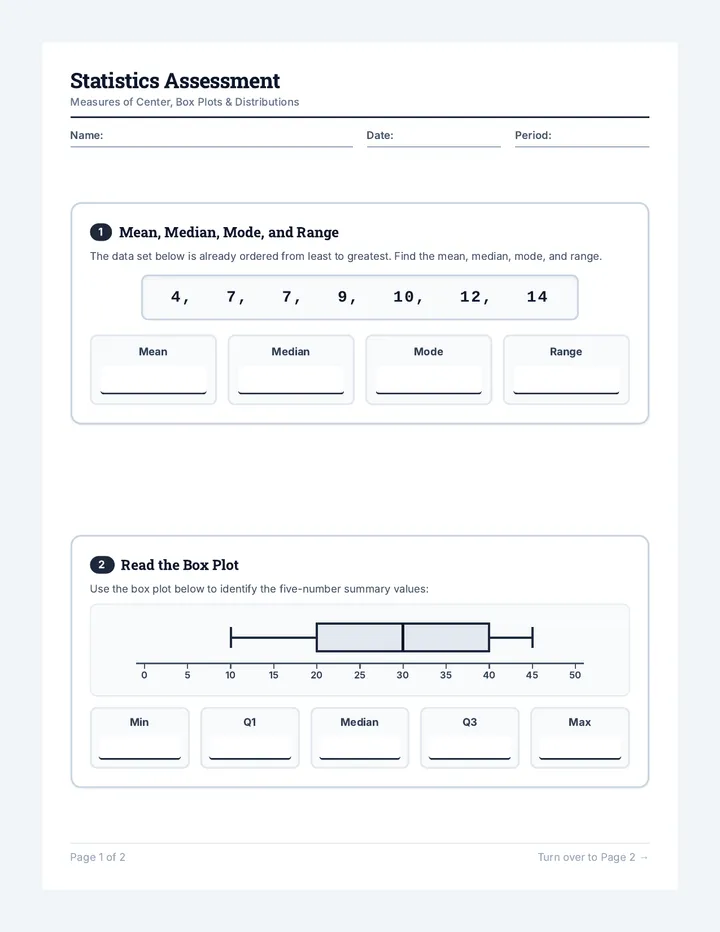
Statistics Assessment
Measures of Center, Box Plots & Distributions
Name:
Date:
Period:
1
Mean, Median, Mode, and Range
The data set below is already ordered from least to greatest. Find the mean, median, mode, and range.
4, 7, 7, 9, 10, 12, 14
Mean
Median
Mode
Range
2
Read the Box Plot
Use the box plot below to identify the five-number summary values:
0 5 10 15 20 25 30 35 40 45 50
Min
Q1
Median
Q3
Max
Page 1 of 2 Turn over to Page 2 →
Statistics Assessment
Page 2: Create Box Plot & Distribution Shapes
Name:
3
Create a Box Plot
Find the five-number summary from the ordered data set below, then draw the box plot on the number line:
2, 4, 7, 8, 10, 12, 14, 15, 18, 19, 22
Min
Q1
Median
Q3
Max
Draw Your Box Plot Here
0 2 4 6 8 10 12 14 16 18 20 22 24
4
Shape of Distribution
Look at each graph. Label each distribution as Symmetrical, Left Aligned, or Right Aligned:
Options: Symmetrical • Left Aligned • Right Aligned
Graph A
Shape:
Graph B
Shape:
Graph C
Shape:
Page 2 of 2 End of Assessment
Data Detective Answer Key
Statistics Assessment
Answer Key
Teacher Reference • Questions 1 & 2
Solutions & Notes Page 1 of 2
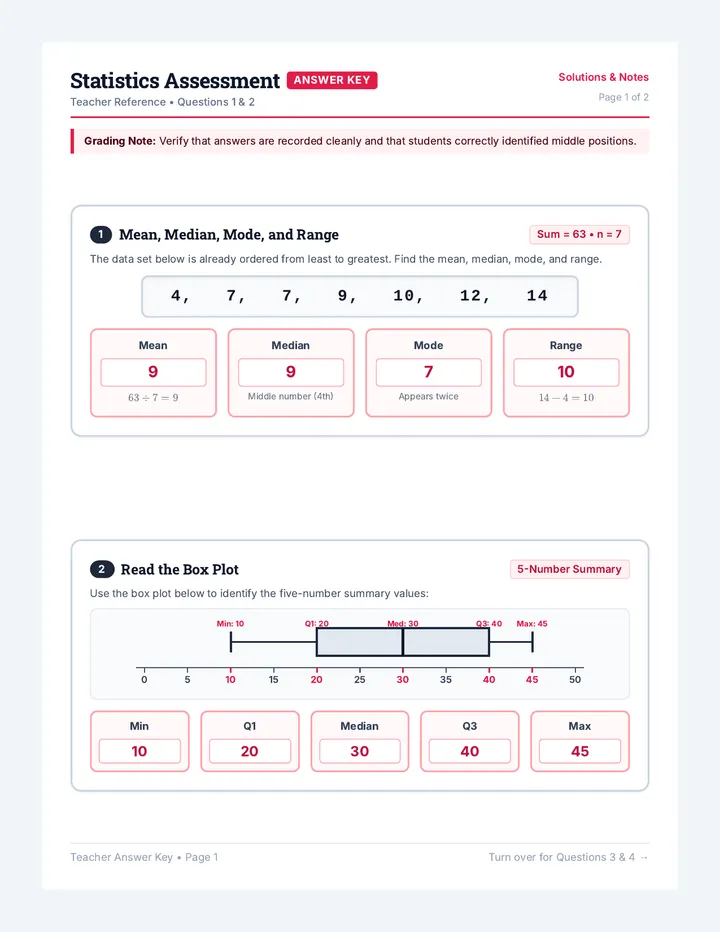
Grading Note: Verify that answers are recorded cleanly and that students correctly identified middle positions.
1
Mean, Median, Mode, and Range
Sum = 63 • n = 7
The data set below is already ordered from least to greatest. Find the mean, median, mode, and range.
4, 7, 7, 9, 10, 12, 14
Mean
9
\(63 \div 7 = 9\)
Median
9
Middle number (4th)
Mode
7
Appears twice
Range
10
\(14 - 4 = 10\)
2
Read the Box Plot
5-Number Summary
Use the box plot below to identify the five-number summary values:
Min: 10 Q1: 20 Med: 30 Q3: 40 Max: 45 0 5 10 15 20 25 30 35 40 45 50
Min
10
Q1
20
Median
30
Q3
40
Max
45
Teacher Answer Key • Page 1 Turn over for Questions 3 & 4 →
Statistics Assessment
Answer Key
Teacher Reference • Page 2
3
Create a Box Plot
11 Data Values
Find the five-number summary from the ordered data set below, then draw the box plot on the number line:
2, 4, 7, 8, 10, 12, 14, 15, 18, 19, 22
Min
2
Q1
7
Median
12
Q3
18
Max
22
2 7 12 18 22
0 2 4 6 8 10 12 14 16 18 20 22 24
4
Shape of Distribution
Alignment / Skew
Look at each graph. Label each distribution as Symmetrical, Left Aligned, or Right Aligned:
Options: Symmetrical • Left Aligned • Right Aligned
Graph A
Answer:
Symmetrical
Graph B
Answer:
Right Aligned
Graph C
Answer:
Left Aligned
Teacher Answer Key • Page 2 End of Answer Key