Sampling Secret Slides Case File #7-SP-A-2
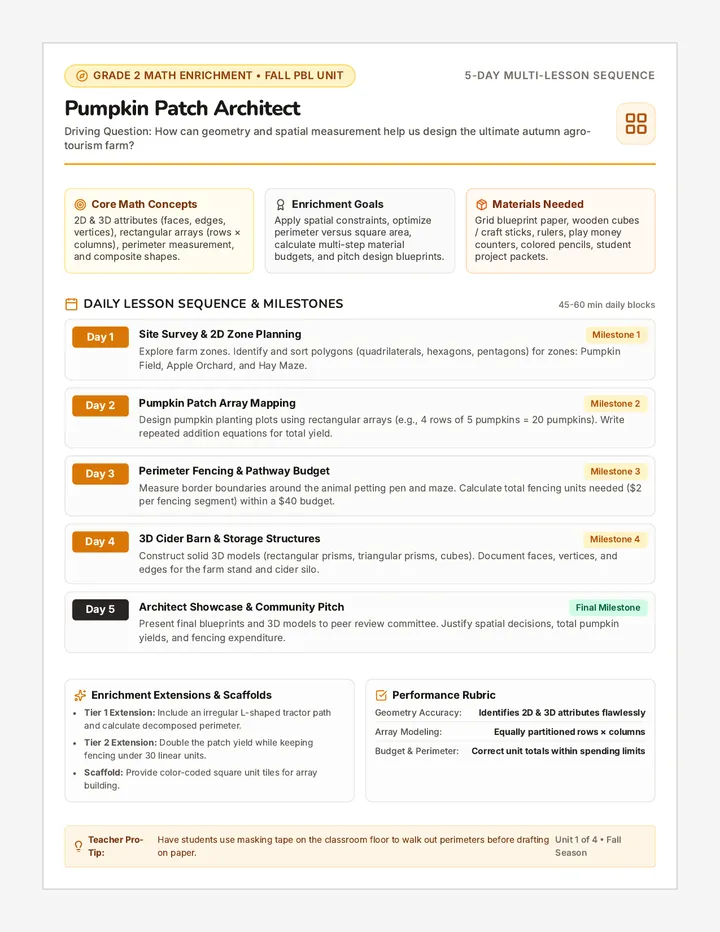
Data Detectives
The Mystery Mix
How can we know what's in the whole jar without counting every single piece?
INVESTIGATION UNIT
The Giant Gumball Challenge
A giant jar contains 1,000 gumballs.
You want to know how many are RED, but you only have 5 minutes.
"Do you really need to count every single one to get a good guess?"
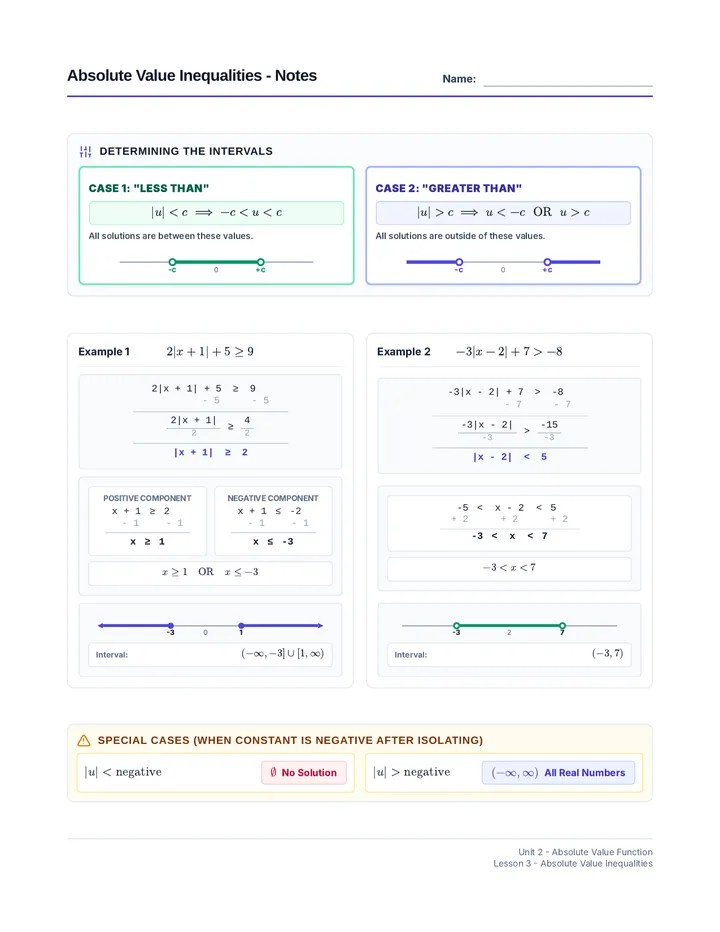
Detective Vocabulary
The Population
The WHOLE group.
"Every single gumball in the giant jar."
The Sample
A SMALL part of the group.
"One scoop of gumballs taken at random."
Detectives use a RANDOM SAMPLE to represent the population.
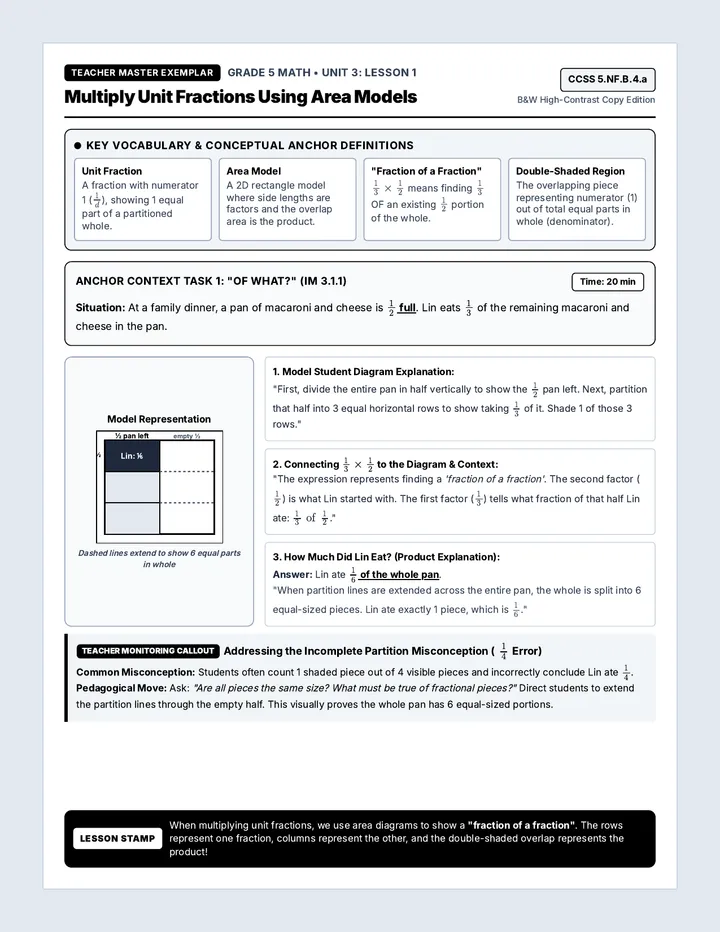
The Digital Scout
Instead of hand-counting, we use Simulations to pull random samples over and over.
SIMULATION STATUS
SAMPLING... COMPLETE
SAMPLE 1
3 / 10
Red Gumballs
SAMPLE 2
5 / 10
Red Gumballs
SAMPLE 3
2 / 10
Red Gumballs
Notice anything strange? Every sample is different! This is Sampling Variability.
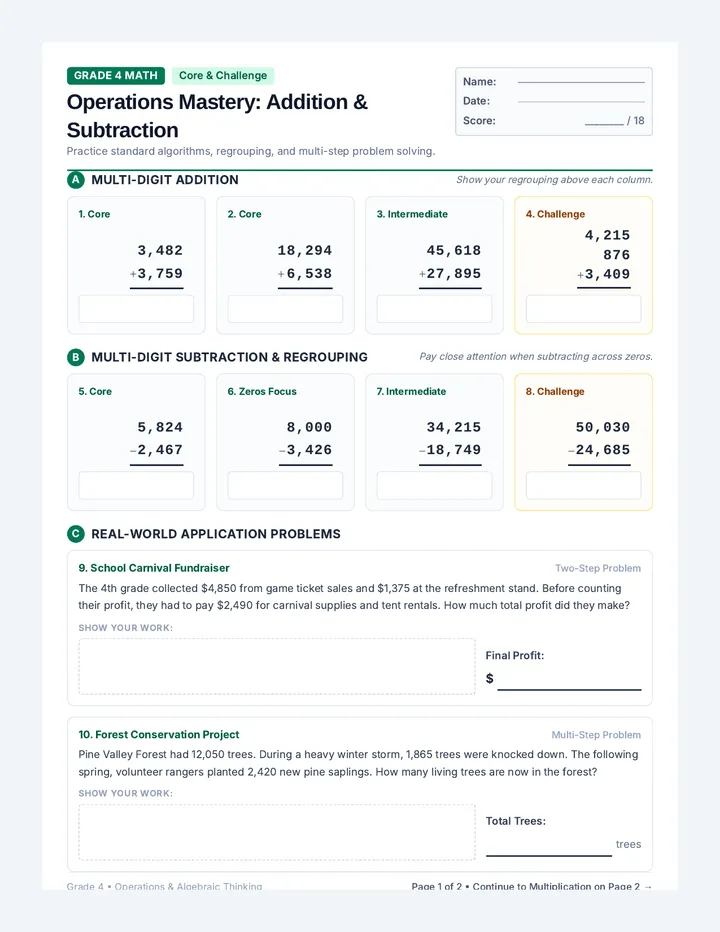
Scaling Up
The Discovery Formula:
Sample Red
Sample Total
Population Red (?)
Pop. Total
1
Find the fraction of your sample that has the trait.
2
Multiply that fraction by the total population number.
Collaborative Case Crack
QUICK DEBATE
If Sample A says 300 reds and Sample B says 450 reds...
Which one is "right"? Or are they both "wrong"?
Think about the range of possibilities.
Mystery Mix Worksheet Mystery Mix Investigation
Task: Drawing Inferences from Random Samples
Detective:
Date:
PART 1
The Detective's Handbook
1. Population
2. Random Sample
A small group chosen where everyone has an equal chance
The entire group being studied
PART 2
The Gumball Simulation Lab
A giant gumball machine has 500 total gumballs. We want to estimate how many are Blue. A computer simulated 3 random scoops (samples) of 20 gumballs each.
Simulated Scoop #1
3 out of 20 are Blue
Simulated Scoop #2
5 out of 20 are Blue
Simulated Scoop #3
2 out of 20 are Blue
3. Looking at the three samples, why do you think the number of blue gumballs is different in each scoop? (Hint: Use the word "random")
4. Based on Simulated Scoop #2 (5 out of 20 are Blue), estimate the total blue gumballs in the population of 500.
5 (Blue)
20 (Total)
x
500 (Total Pop)
=
PART 3
The Variability Verdict
Sample used Sample Proportion Population Prediction (Out of 500) Scoop #1 \( \frac{3}{20} \) Scoop #2 \( \frac{5}{20} \) 125 Blue Gumballs Scoop #3 \( \frac{2}{20} \)
5. Based on your table, what is the RANGE of predictions for blue gumballs (Lowest to Highest)?
Between ____________ and ____________ gumballs.
Detective's Insight
Because different random samples give different results, we should say our prediction is "about" or "approximately" a certain number, or give a range!
Inference Insight Rubric Inference Insight Rubric
TEACHER RESOURCE
Standard: CO 7.SP.A.2 — Progress Monitoring for Small Group Intervention
Instructional Focus
This rubric evaluates a student's ability to move beyond simple counting to proportional reasoning. Focus on whether the student understands that variability is a natural part of sampling, not a "mistake" in their math.
Skill Category Novice (1) Developing (2) Proficient (3) Exceeding (4) Sample vs. Population Confuses the two terms; thinks they are the same group. Identifies the sample is smaller but cannot explain why we use it. Correctly identifies both and explains the efficiency of sampling. Explains how a non-random sample would ruin the data. Scaling for Inference Cannot set up a ratio or use the sample proportion. Sets up ratio correctly but makes significant errors in calculation. Accurately uses sample proportion to predict population trait. Uses multiple methods (unit rate, cross-mult) to verify results. Understanding Variability Thinks different results mean the samples are "wrong." Acknowledges differences but cannot explain why they happen. Explains that random chance causes different samples to vary. Suggests taking more samples to get a more accurate range.
Small Group Observation Log
Student Name
Term.
Scale
Var.
Observations / Next Steps
1 2 3 4
1 2 3 4
1 2 3 4
1 2 3 4
1 2 3 4
1 2 3 4
1 2 3 4
1 2 3 4
1 2 3 4
Scaffolding Prompts for Tier 2
If they are stuck on math:
"If there were 5 blues out of 20, how many would there be in 40? How many 20s fit into the total of 500?"
If they think variability is an error:
"If you and I both reached into a bag of Skittles, would we pull out the exact same colors every time? Why not?"
Sampling Snap Exit Ticket Sampling Snap
Case Resolution #7.SP.A.2
Exit Ticket
Name:
Score:
1
The Survey Scandal
A school has 800 students. A random sample of 50 students were asked their favorite sport. 12 students chose Basketball.
Estimate how many students in the entire school would choose Basketball:
12
50
x
800
=
2
Variability Vision
If you take another random sample of 50 students from the same school, will you get exactly 12 basketball fans again? Explain why or why not.
Reasoning:
Rate your confidence:
Stuck
Getting It
Expert