Graph Detectives Practice Worksheet
DATA ANALYTICS LAB: CAREER & WAGE ANALYSIS
Comparative Data Displays • Independent & Dependent Variables
Student:
Period:
Date:
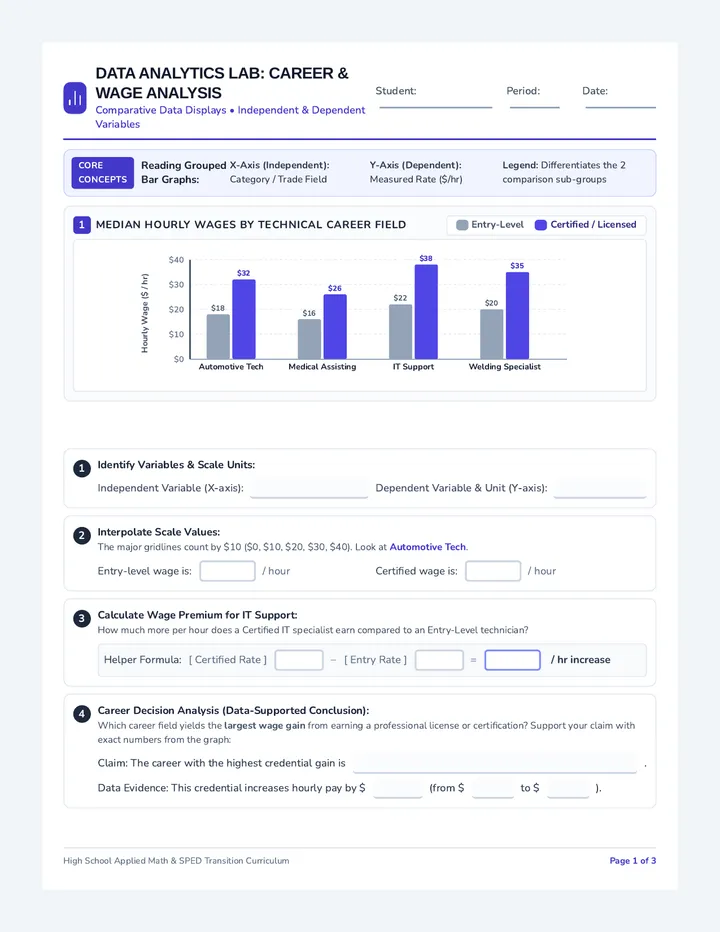
Core Concepts Reading Grouped Bar Graphs:
X-Axis (Independent): Category / Trade Field Y-Axis (Dependent): Measured Rate ($/hr) Legend: Differentiates the 2 comparison sub-groups
1 Median Hourly Wages by Technical Career Field
Entry-Level
Certified / Licensed
Hourly Wage ($ / hr) $0 $10 $20 $30 $40 $18 $32 Automotive Tech $16 $26 Medical Assisting $22 $38 IT Support $20 $35 Welding Specialist
1
Identify Variables & Scale Units:
Independent Variable (X-axis):
Dependent Variable & Unit (Y-axis):
2
Interpolate Scale Values:
The major gridlines count by $10 ($0, $10, $20, $30, $40). Look at Automotive Tech.
Entry-level wage is:
/ hour
Certified wage is:
/ hour
3
Calculate Wage Premium for IT Support:
How much more per hour does a Certified IT specialist earn compared to an Entry-Level technician?
Helper Formula: [ Certified Rate ]
− [ Entry Rate ]
=
/ hr increase
4
Career Decision Analysis (Data-Supported Conclusion):
Which career field yields the largest wage gain from earning a professional license or certification? Support your claim with exact numbers from the graph:
Claim: The career with the highest credential gain is
.
Data Evidence: This credential increases hourly pay by $
(from $
to $
).
High School Applied Math & SPED Transition Curriculum Page 1 of 3
DATA ANALYTICS LAB: PROPORTIONAL LIVING BUDGET
Circle Graphs • Parts of a Whole • Converting Percents to Dollar Amounts
Focus: Financial Literacy & Proportions
Formula Anchor Calculating Dollar Amounts from Circle Graph Percents:
Total Net Budget × (Percent ÷ 100) = Category Dollar Amount
2 Young Adult Independent Monthly Budget
Total Monthly Net Income = $2,400
Rent 35% Food 20% Transit 15% Bills 15% Save 15%
| Expense Category | Percent | Calculation Frame |
|---|
| ● Rent & Housing | 35% | $2,400 × 0.35 |
| ● Food & Groceries | 20% | $2,400 × 0.20 |
| ● Transportation / Gas | 15% | $2,400 × 0.15 |
| ● Utilities & Phone | 15% | $2,400 × 0.15 |
| ● Emergency Savings | 15% | $2,400 × 0.15 |
1
Calculate Housing Expenditure:
Housing is the single largest budget slice at 35% of the total $2,400 budget. Calculate the exact dollar amount allocated to rent:
$2,400 × 0.35 =
dollars spent per month on rent
2
Combine Proportionate Slices:
Transportation (15%) and Utilities (15%) share the same slice size. What percentage and dollar amount do these two categories cost together?
Combined Percentage:
%
Combined Dollars: $
3
Real-World Scenario: Budget Adjustment Under Inflation
Due to rising prices, monthly food costs increase by +$120. If total monthly net income remains fixed at $2,400, which category should be reduced first to keep the budget balanced without missing essential bills?
Category to adjust:
Reasoning based on circle graph priority:
High School Applied Math & SPED Transition Curriculum Page 2 of 3
DATA ANALYTICS LAB: TRENDS & RATE OF CHANGE
Dual-Line Graphs • Break-Even Point • Rate of Change (Slope)
Focus: Modeling & Forecasting
Formula Anchor Rate of Change (Slope) =
(Change in Dollars / Y-axis) ÷ (Change in Months / X-axis)
3 Student Business Venture: Monthly Revenue vs. Operating Expenses
Monthly Revenue
Monthly Expenses
Dollars ($ in Thousands) $0k $1k $2k $3k $4k $5k $6k Month 1 Month 2 Month 3 Month 4 Month 5 Month 6 ★ Break-Even Point
1 Identify Break-Even Month:
At what month did Revenue intersect Expenses? What was the dollar amount where profit equaled $0?
Month:
Amount: $
2 Calculate Revenue Growth Rate:
Between Month 1 ($1,000) and Month 5 ($5,000), what was the average growth rate per month?
($5,000 − $1,000) ÷ 4 mos = $
/mo
Executive Data Report: Claim, Evidence & Forecasting
1. Net Profit Status: In Months 1–3, the business operated at a
(profit / loss) because the expense line was
(above / below) the revenue line.
2. Month 6 Net Profit: In Month 6, Revenue was $
and Expenses were $
, generating a net profit of $
.
3. Projection: If current linear growth holds, forecast Month 7 Revenue: $
High School Data Standards Mastery:
Differentiate X & Y variables Calculate % into dollars Calculate rate of change
High School Applied Math & SPED Transition Curriculum Page 3 of 3
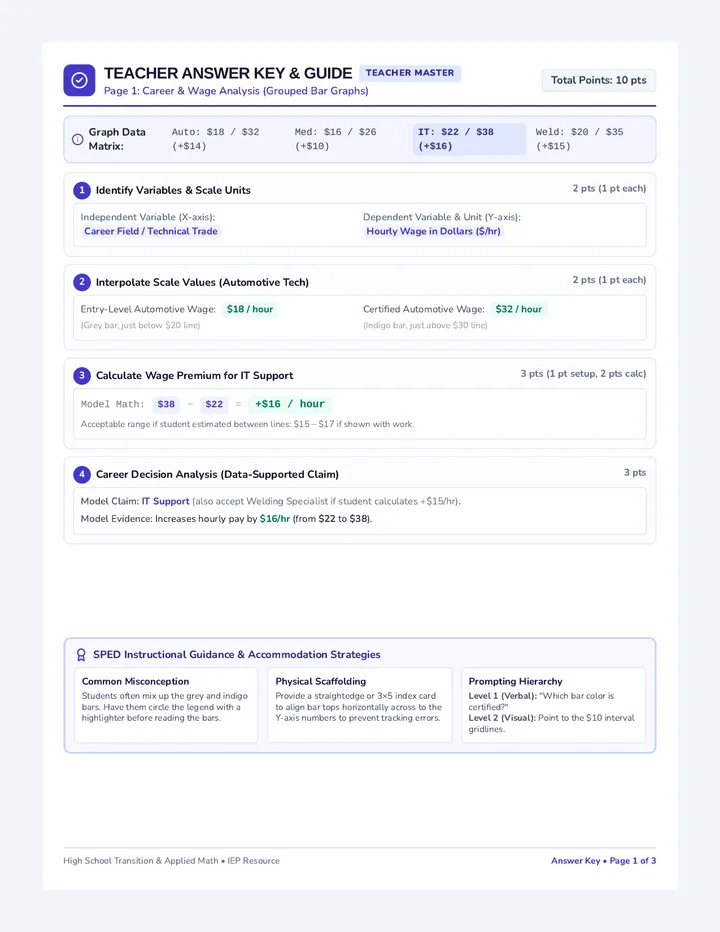
Graph Detectives Answer Key
TEACHER ANSWER KEY & GUIDE
Teacher Master
Page 1: Career & Wage Analysis (Grouped Bar Graphs)
Total Points: 10 pts
Graph Data Matrix:
Auto: $18 / $32 (+$14) Med: $16 / $26 (+$10) IT: $22 / $38 (+$16) Weld: $20 / $35 (+$15)
1 Identify Variables & Scale Units
2 pts (1 pt each)
Independent Variable (X-axis): Career Field / Technical Trade
Dependent Variable & Unit (Y-axis): Hourly Wage in Dollars ($/hr)
2 Interpolate Scale Values (Automotive Tech)
2 pts (1 pt each)
Entry-Level Automotive Wage: $18 / hour
(Grey bar, just below $20 line)
Certified Automotive Wage: $32 / hour
(Indigo bar, just above $30 line)
3 Calculate Wage Premium for IT Support
3 pts (1 pt setup, 2 pts calc)
Model Math: $38 − $22 = +$16 / hour
Acceptable range if student estimated between lines: $15 – $17 if shown with work.
4 Career Decision Analysis (Data-Supported Claim)
3 pts
Model Claim: IT Support (also accept Welding Specialist if student calculates +$15/hr).
Model Evidence: Increases hourly pay by $16/hr (from $22 to $38).
SPED Instructional Guidance & Accommodation Strategies
Common Misconception
Students often mix up the grey and indigo bars. Have them circle the legend with a highlighter before reading the bars.
Physical Scaffolding
Provide a straightedge or 3×5 index card to align bar tops horizontally across to the Y-axis numbers to prevent tracking errors.
Prompting Hierarchy
Level 1 (Verbal): "Which bar color is certified?"
Level 2 (Visual): Point to the $10 interval gridlines.
High School Transition & Applied Math • IEP Resource Answer Key • Page 1 of 3
TEACHER ANSWER KEY & GUIDE
Teacher Master
Page 2: Independent Living Budget (Circle Graphs & Proportions)
Total Points: 10 pts
Full Budget Breakdown ($2,400 Total):
Rent (35%): $840 Food (20%): $480 Transit (15%): $360 Bills (15%): $360 Save (15%): $360
1 Calculate Housing Expenditure (Percent to Dollars)
3 pts
Model Calculation: $2,400 × 0.35 = $840 / month
If students calculate using fractions: (35/100) × 2,400 = 84,000 ÷ 100 = $840 (Full Credit).
2 Combine Proportionate Slices (Transit + Utilities)
3 pts (1.5 pts each)
Combined Percentage: 30%