Data and Sampling Review Worksheet
Grade 7 Math 7.SP.B.3 & 7.SP.B.4
Data & Sampling Review
Name: _______________________________
Date: ______________ Period: _______
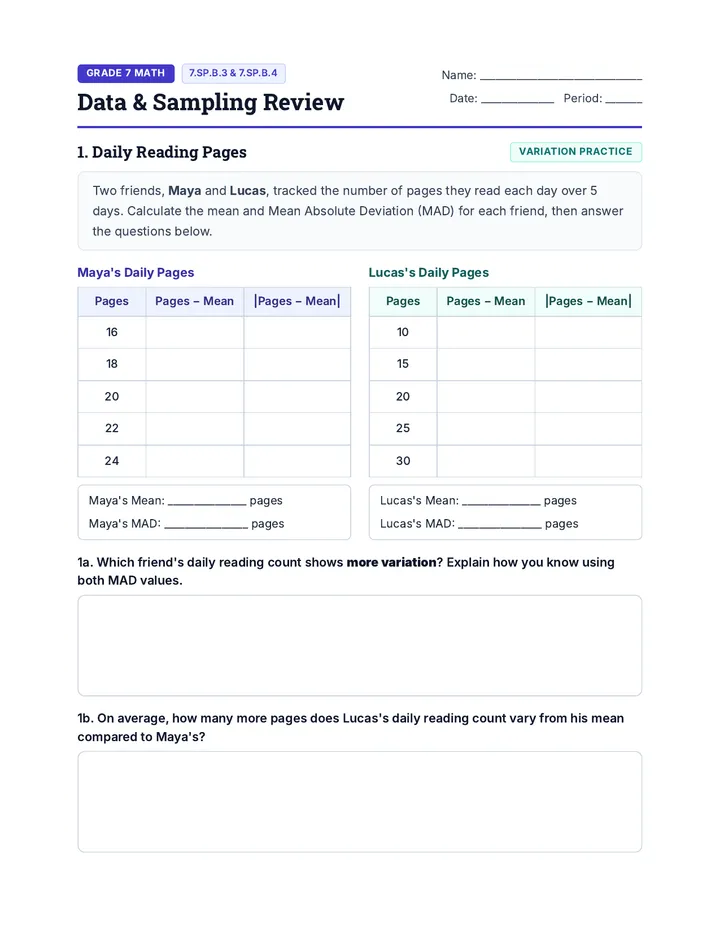
1. Daily Reading Pages
Variation Practice
Two friends, Maya and Lucas, tracked the number of pages they read each day over 5 days. Calculate the mean and Mean Absolute Deviation (MAD) for each friend, then answer the questions below.
Maya's Daily Pages
| Pages | Pages − Mean | |Pages − Mean| |
| --- | --- | --- |
| 16 | | |
| 18 | | |
| 20 | | |
| 22 | | |
| 24 | | |
Maya's Mean: _______________ pages
Maya's MAD: ________________ pages
Lucas's Daily Pages
| Pages | Pages − Mean | |Pages − Mean| |
| --- | --- | --- |
| 10 | | |
| 15 | | |
| 20 | | |
| 25 | | |
| 30 | | |
Lucas's Mean: _______________ pages
Lucas's MAD: ________________ pages
1a. Which friend's daily reading count shows more variation? Explain how you know using both MAD values.
1b. On average, how many more pages does Lucas's daily reading count vary from his mean compared to Maya's?
2. 100-Meter Sprint Trials
Variation Practice
Coach Rivera timed two runners, Jordan and Sofia, in 5 trials of the 100-meter dash (in seconds). Calculate the mean and MAD for each runner, then answer the questions.
Jordan's Times (Seconds)
| Time | Time − Mean | |Time − Mean| |
| --- | --- | --- |
| 13 | | |
| 14 | | |
| 15 | | |
| 16 | | |
| 17 | | |
Jordan's Mean: _______________ sec
Jordan's MAD: ________________ sec
Sofia's Times (Seconds)
| Time | Time − Mean | |Time − Mean| |
| --- | --- | --- |
| 11 | | |
| 13 | | |
| 15 | | |
| 16 | | |
| 20 | | |
Sofia's Mean: _______________ sec
Sofia's MAD: ________________ sec
2a. Which statement accurately compares the variation in Jordan's and Sofia's sprint times?
A. Jordan's times show more variation because his mean time is 15 seconds.
B. Sofia's times show more variation because her MAD is greater than Jordan's MAD.
C. Sofia's times are more consistent because her fastest time was 11 seconds.
D. Jordan's times show more variation because his MAD is 2.4 seconds.
2b. Which runner has more consistent times? Use both runners' MAD values to explain.
3. Monthly Snowfall Comparison
Variation Practice
A weather station recorded monthly snowfall (in inches) for two towns, Pinecrest and Brookside, over 6 winter months. Calculate the mean and MAD for each town, then answer the questions.
Pinecrest Snowfall (Inches)
| Inches | Inches − Mean | |Inches − Mean| |
| --- | --- | --- |
| 4 | | |
| 5 | | |
| 6 | | |
| 6 | | |
| 7 | | |
| 8 | | |
Pinecrest Mean: _______________ in
Pinecrest MAD: ________________ in
Brookside Snowfall (Inches)
| Inches | Inches − Mean | |Inches − Mean| |
| --- | --- | --- |
| 0 | | |
| 3 | | |
| 6 | | |
| 6 | | |
| 9 | | |
| 12 | | |
Brookside Mean: _______________ in
Brookside MAD: ________________ in
3a. Which town's monthly snowfall shows more variation? Explain how you know using both towns' MAD values.
3b. How many times greater is Brookside's MAD than Pinecrest's MAD? What does this tell you about planning winter travel or snow removal in Brookside compared to Pinecrest?
4. Middle School Music Practice
7.SP.A.1 & 7.SP.A.2
Riverbend Middle School has 440 students. The music director wants to know how many hours per week students spend practicing an instrument or singing. She surveys a random sample of 20 students and records the results below.
Sample Data Set (hours/week): 0, 0, 1, 1, 1, 1, 2, 2, 2, 2, 2, 3, 3, 3, 3, 4, 4, 5, 5, 6
Hours Practiced Per Week (Random Sample, \(n = 20\))
0
1
2
3
4
5
6
Number of Practice Hours
a. Identify the population and the sample in this situation.
Population: ______________________________________________________________________
Sample: _________________________________________________________________________
b. Using the dot plot, how many students in the sample practice 3 or more hours per week? Write this as a fraction and a percent of the sample.
Count: ________ students
Fraction: \(\frac{\phantom{00}}{20}\)
Percent: _________%
c. Based on the sample, predict how many of the 440 students at Riverbend Middle School practice 3 or more hours per week. Set up a proportion and solve.
Guided Hint: \(\frac{\text{Sample Part}}{\text{Sample Total}} = \frac{x}{440}\)
d. Why is it important that the director used a random sample instead of only surveying students sitting in the band room after school?
5. School Spirit Day Themes
7.SP.A.1 & 7.SP.A.2
Greenfield Middle School has 600 students. The student council wants to know which theme students would most like for the upcoming Spirit Day. They survey a random sample of 30 students from the school's homeroom list and record the results in the table below.
Spirit Day Theme Survey Results (Random Sample, \(n = 30\))
| Spirit Day Theme |
Number of Students |
| Pajama Day |
12 |
| Sports Jersey Day |
9 |
| Neon & Glow Day |
6 |
| Decade Throwback Day |
3 |
| Total Students Surveyed |
30 |
a. Identify the population and the sample in this survey.
Population: ______________________________________________________________________
Sample: _________________________________________________________________________
b. Using the table, how many students in the sample chose Sports Jersey Day? Write this as a fraction and a percent of the sample.
Count: ________ students
Fraction: \(\frac{\phantom{00}}{30}\)
Percent: _________%
c. Based on the sample, predict how many of the 600 students at Greenfield Middle School would choose Sports Jersey Day. Set up a proportion and solve.
Guided Hint: \(\frac{\text{Sample Part}}{\text{Sample Total}} = \frac{x}{600}\)
d. Suppose the student council had surveyed 30 students waiting in line at Friday night's basketball game instead of using the homeroom list. Would that sample be representative or biased? Explain why.
6. Estimating Population Totals from Tables
7.SP.A.2: Inferences
Inference Strategy: Using Proportions
When a sample is random and representative, set up a proportion to estimate the number of individuals in the whole population with a given trait.
\(\frac{\text{Sample Part}}{\text{Sample Total}} = \frac{\text{Estimated Part}}{\text{Total Population}}\)
6a. A city transit planner surveyed a random sample of 400 commuters to see whether they prefer traveling by bus, train, or bicycle. This table shows the results of the survey.
Commuter Survey Results
| Travel Mode |
Number of Responses |
| bus |
140 |
| train |
180 |
| bicycle |
80 |
Show your work:
There are a total of 6,000 commuters in the city. Based on the results in the table, what is the best estimate of the total number of commuters in the city who prefer traveling by train?
A. 1,200
B. 2,100
C. 2,700
D. 3,600
6b. A school librarian surveyed a random sample of 250 students at Westview High School to find out which book genre they check out most often. The table shows the survey results.
Genre Survey Results
| Book Genre |
Number of Responses |
| mystery |
100 |
| sci-fi |
75 |
| biography |
50 |
| fantasy |
25 |
Show your work:
There are a total of 1,500 students in the school. Based on the results in the table, what is the best estimate of the total number of students in the school who check out sci-fi most often?
A. 300
B. 450
C. 600
D. 750
7. Graphing & Calculating Population Estimates
7.SP.A.2: Visual Inferences
7a. The population of a town is 10,000 people. A researcher wants to estimate how many people in the town have a public library card. The researcher surveys a random sample of 200 people and records these results:
- 130 people have a library card.
- 70 people do not have a library card.
Based on the sample results, estimate the number of people in the town's population that have a library card and the number that do not. Draw and shade each bar on the graph to show your estimates, rounded to the nearest 500.
Library Card Ownership in a Town
Number of People (thousands)
10.09.08.07.06.05.04.03.02.01.00.0
Have Library Card
No Library Card
Show your work:
Have a card estimate: _______________
No card estimate: __________________
7b. A town has 6,000 households. A community group surveys a random sample of 150 households and finds:
- 90 households compost food scraps.
- 60 households do not compost food scraps.
Based on the sample results, estimate how many households in the entire town compost food scraps and how many do not.
Show your work:
Compost food scraps:
Do not compost:
8. Representative Sampling (MCAS Practice)
7.SP.A.1: Sampling
8a. A movie theater wants to survey people at a weekend screening to collect their opinions about a new concession menu. Which of the following sampling methods is most likely to produce a representative sample?
A surveying every teenager who enters the movie theater
B surveying every senior citizen who enters the movie theater
C surveying every eighth person who enters the movie theater
D surveying the first fifteen people who enter the movie theater
8b. A student wants to determine the average cost of a haircut in her county. She will survey hair salons to collect data. Which of the following samples should she survey to collect the best representative data?
A 25 randomly selected hair salons across the county
B 25 randomly selected hair salons closest to the student's home
C 25 randomly selected hair salons from two neighborhoods in the county
D 25 randomly selected hair salons that belong to the same national chain
Data and Sampling Answer Key
Teacher Resource 7.SP.A & 7.SP.B
Data & Sampling Answer Key
Page 1 of 2 • Problems 1–4
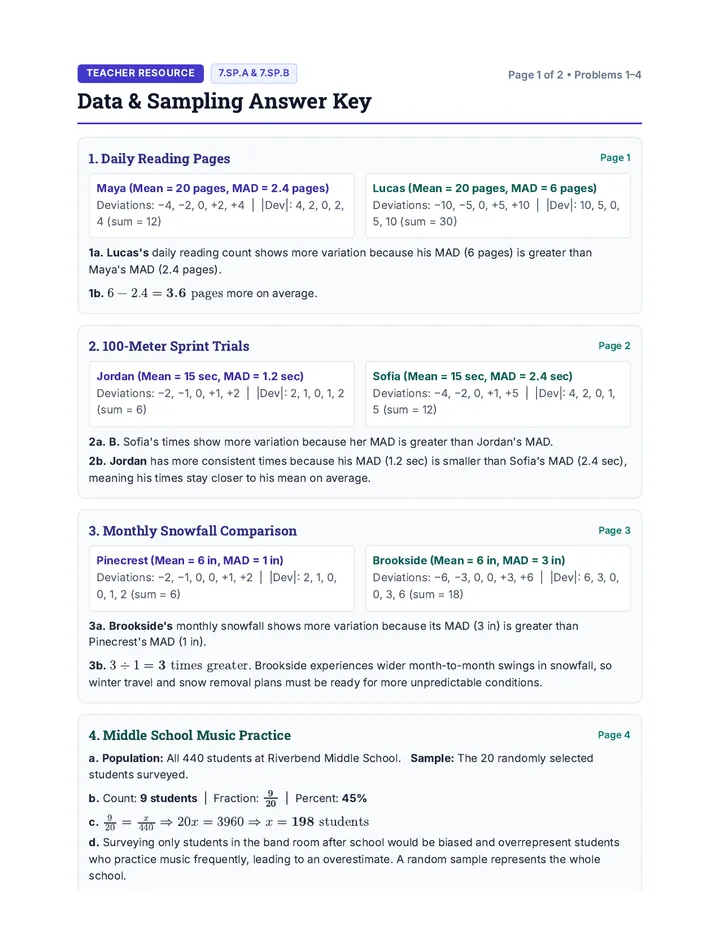
1. Daily Reading Pages
Page 1
Maya (Mean = 20 pages, MAD = 2.4 pages)
Deviations: −4, −2, 0, +2, +4 | |Dev|: 4, 2, 0, 2, 4 (sum = 12)
Lucas (Mean = 20 pages, MAD = 6 pages)
Deviations: −10, −5, 0, +5, +10 | |Dev|: 10, 5, 0, 5, 10 (sum = 30)
1a. Lucas's daily reading count shows more variation because his MAD (6 pages) is greater than Maya's MAD (2.4 pages).
1b. \(6 - 2.4 = \mathbf{3.6\text{ pages}}\) more on average.
2. 100-Meter Sprint Trials
Page 2
Jordan (Mean = 15 sec, MAD = 1.2 sec)
Deviations: −2, −1, 0, +1, +2 | |Dev|: 2, 1, 0, 1, 2 (sum = 6)
Sofia (Mean = 15 sec, MAD = 2.4 sec)
Deviations: −4, −2, 0, +1, +5 | |Dev|: 4, 2, 0, 1, 5 (sum = 12)
2a. B. Sofia's times show more variation because her MAD is greater than Jordan's MAD.
2b. Jordan has more consistent times because his MAD (1.2 sec) is smaller than Sofia's MAD (2.4 sec), meaning his times stay closer to his mean on average.
3. Monthly Snowfall Comparison
Page 3
Pinecrest (Mean = 6 in, MAD = 1 in)
Deviations: −2, −1, 0, 0, +1, +2 | |Dev|: 2, 1, 0, 0, 1, 2 (sum = 6)
Brookside (Mean = 6 in, MAD = 3 in)
Deviations: −6, −3, 0, 0, +3, +6 | |Dev|: 6, 3, 0, 0, 3, 6 (sum = 18)
3a. Brookside's monthly snowfall shows more variation because its MAD (3 in) is greater than Pinecrest's MAD (1 in).
3b. \(3 \div 1 = \mathbf{3\text{ times greater}}\). Brookside experiences wider month-to-month swings in snowfall, so winter travel and snow removal plans must be ready for more unpredictable conditions.
4. Middle School Music Practice
Page 4
a. Population: All 440 students at Riverbend Middle School. Sample: The 20 randomly selected students surveyed.
b. Count: 9 students | Fraction: \(\mathbf{\frac{9}{20}}\) | Percent: 45%
c. \(\frac{9}{20} = \frac{x}{440} \Rightarrow 20x = 3960 \Rightarrow x = \mathbf{198\text{ students}}\)
d. Surveying only students in the band room after school would be biased and overrepresent students who practice music frequently, leading to an overestimate. A random sample represents the whole school.
Data & Sampling Answer Key
Page 2 of 2 • Problems 5–8
5. School Spirit Day Themes
Page 5
a. Population: All 600 students at Greenfield Middle School. Sample: The 30 randomly selected students from the homeroom list.
b. Count: 9 students | Fraction: \(\mathbf{\frac{9}{30}}\) (or \(\frac{3}{10}\)) | Percent: 30%
c. \(\frac{9}{30} = \frac{x}{600} \Rightarrow 30x = 5400 \Rightarrow x = \mathbf{180\text{ students}}\)
d. Biased. Students waiting in line at a basketball game are more likely to be sports fans and favor Sports Jersey Day, so they do not accurately represent the entire student body.
6. Estimating Population Totals from Tables
Page 6
6a. C. 2,700 — \(\frac{180}{400} = \frac{x}{6000} \Rightarrow 0.45 \times 6000 = 2,700\) commuters.
6b. B. 450 — \(\frac{75}{250} = \frac{x}{1500} \Rightarrow 0.30 \times 1500 = 450\) students.
7. Graphing & Calculating Population Estimates
Page 7
7a.
- Have a library card: \(\frac{130}{200} = \frac{x}{10000} \Rightarrow x = \mathbf{6,500\text{ people}}\) (shade bar up to 6.5 thousand).
- Do not have a library card: \(\frac{70}{200} = \frac{x}{10000} \Rightarrow x = \mathbf{3,500\text{ people}}\) (shade bar up to 3.5 thousand).
7b.
- Compost food scraps: \(\frac{90}{150} = \frac{x}{6000} \Rightarrow x = \mathbf{3,600\text{ households}}\).
- Do not compost: \(\frac{60}{150} = \frac{x}{6000} \Rightarrow x = \mathbf{2,400\text{ households}}\).
8. Representative Sampling (MCAS Practice)
Page 8
8a. C. surveying every eighth person who enters the movie theater (systematic random sampling avoids age and arrival-time bias).
8b. A. 25 randomly selected hair salons across the county (covers the full target population without location or brand bias).