City Vision Slides 13-Week Math Design Studio
Skyline Architects
Design, budget, and engineer your own original cityscape using geometry, fractions, decimals, and data.
Geometry & Scale
Fractions & Decimals
Data & Problem-Solving
Week 1 Mission
What Makes a Great City?
Smart Spaces
Homes, schools, shops, and parks arranged on a scaled blueprint grid.
Balanced Budget
Every road, tree, and skyscraper costs money. Decimals keep us on track.
Citizen Data
Real architects survey citizens first so the city fits what people need.
Studio Task 1
Survey & Graph Citizen Priorities
1. Collect Data: Ask 12 classmates which city feature matters most (Parks, Transit, Libraries, Sports Arenas, or Cafes).
2. Build a Bar Graph: Choose an appropriate scale and label both axes clearly.
3. Find the Mode & Range: Identify the most popular feature and the spread of your data.
Studio Task 2
Divide Your City Into Fractional Zones
Your city blueprint has 12 equal blocks.
Use your survey data to assign a fraction of the 12 blocks to each zone:
Housing (Residential)
Shops & Work (Commercial)
Parks & Civic (Green & Public)
Example 12-Block City Grid
H
H
H
H
C
C
C
P
P
P
P
H
\( \frac{5}{12} + \frac{3}{12} + \frac{4}{12} = \frac{12}{12} = 1 \text{ whole city} \)
Our 13-Week Roadmap
From Blueprint to Expo Showcase
Weeks 1–5: Foundations & Geometry
Vision Data, Scale Grids, Street Angles, Polygon Parks, Building Footprints
Weeks 6–8: Fractions & Budgets
Fraction Districts, Municipal Decimal Budget, Facade Proportions
Weeks 9–11: 3D & Optimization
3D Skyline Heights, Traffic Line Plots, Green Energy Challenge
Weeks 12–13: Build & Expo
Final City Assembly, Math Audit, and Cityscape Expo Showcase
City Vision Teacher Guide Skyline Architects • Week 1 of 13 • 50 Minutes
City Vision Teacher Guide
Grades 3–5 Advanced
Data & Fractions
Learning Objectives
Collect categorical data via a structured peer survey and represent results on a scaled bar graph.
Interpret data using mode, range, and comparison statements to justify urban design priorities.
Partition a 12-block city grid into fractional zones summing to 1 whole (\( \frac{12}{12} \)).
Materials & Setup
City Vision Slides projected for kickoff.City Survey Worksheet (1 per student).Colored pencils (blue, amber, green) for zone shading.
Clipboards or folders to start each student's Architect Portfolio.
50-Minute Pacing Guide
Time
Phase
Teacher Moves & Student Actions
0–10 min
Launch & Hook
Present Slides 1–2. Ask: "If you could design a city from scratch, what would citizens need most?" Preview the 13-week roadmap (Slide 5) and establish studio norms.
10–22 min
Citizen Survey
Distribute City Survey Worksheet . Students circulate and tally 12 classmates' top city feature choices. Prompt them to keep tallies neat in groups of 5.
22–34 min
Graph & Analyze
Students build a bar graph from their tallies (choosing scale of 1 or 2). Guide them to compute the mode and range, then write one data-backed design goal.
34–44 min
Fractional Zoning
Show Slide 4. Students shade their 12-block city grid into Housing, Commercial, and Parks/Civic zones and write the fraction equation summing to \( \frac{12}{12} = 1 \).
44–50 min
Studio Debrief
Pair-share: "How did your survey data influence the fraction of blocks you gave to Parks or Commercial spaces?" Collect portfolios.
Differentiation (Grades 3–5)
Grade 3 Support: Use a 1-to-1 scale on the bar graph and express zones only in twelfths (\( \frac{5}{12} \)).
Grade 4–5 Extension: Use a 2-to-1 graph scale, simplify zone fractions to equivalent forms (e.g., \( \frac{4}{12} = \frac{1}{3} \)), and find the median of the category counts.
Key Math Prompts & Check
"If Parks won the survey, should Parks get the largest or smallest fraction of blocks? Why?" "How can you prove your three fractions equal 1 whole city?" Watch for: Students miscounting total tallies (must equal 12) or leaving unshaded blocks.
Portfolio Note: Save the 12-block zone plan—students will reference it in Week 6 (Fraction Districts). Lesson 1
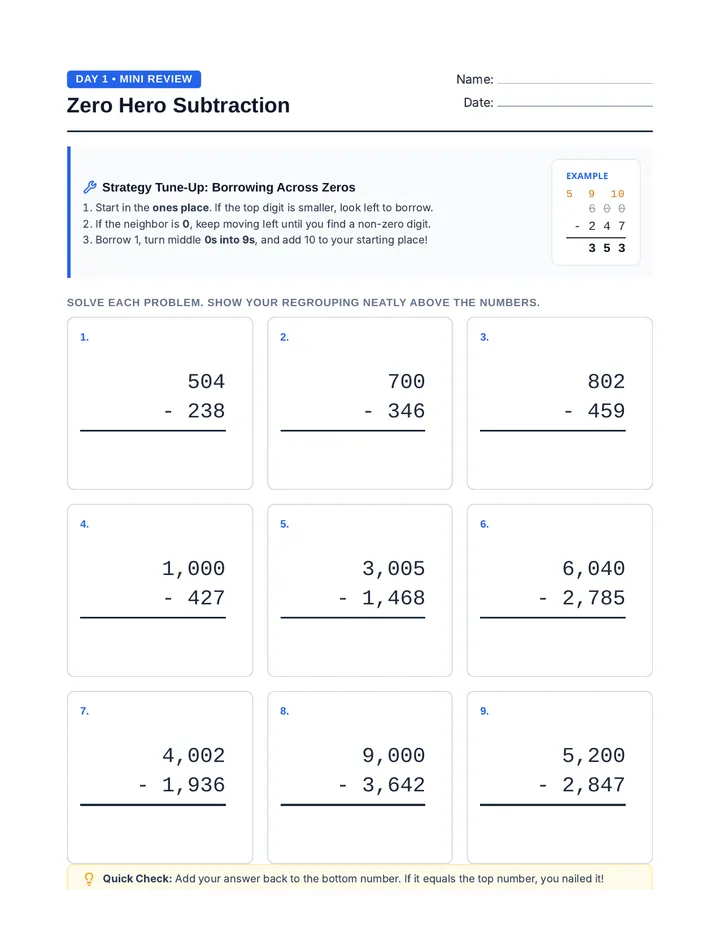
City Survey Worksheet Skyline Architects • Week 1
City Vision & Citizen Survey
Name: ____________________________
Date: ____________________________
1. Citizen Survey (Ask 12 Classmates: "Which feature does our city need most?")
City Feature
Tally Marks
Total Votes
Parks & Playgrounds
Subway / Bike Lanes
Library & Museum
Sports Arena
Shops & Cafes
2. Build Your Bar Graph
ParksTransitLibraryArenaShops
Scale: 1 square = ____ vote(s)
3. Data Analysis
Mode (most votes):
Range (highest − lowest):
Design Goal from Data:
4. Fractional City Zoning (12 Equal Blocks)
Shade each block for Housing (H) , Commercial (C) , or Parks/Civic (P) . Write the fraction for each zone.
Housing (H): ____ / 12
Commercial (C): ____ / 12
Parks/Civic (P): ____ / 12
Sum: ____ / 12 = 1 Whole
Challenge: Can you write any of your zone fractions in simplest form? ____ = ____
Grid Masters Teacher Guide Skyline Architects • Week 2 of 13 • 50 Minutes
Grid Masters Teacher Guide
Grades 3–5 Advanced
Scale & Measurement
Learning Objectives
Use multiplicative reasoning to convert real-world city measurements (feet/meters) to blueprint scale units.
Measure line segments accurately to the nearest half-inch or centimeter using a ruler.
Plot city landmarks on a scaled blueprint grid using ordered pairs or grid coordinates.
Materials & Setup
Scale Blueprint Worksheet (1 per student).Inch/cm rulers (1 per student).
Optional: 11×17" graph paper for students ready to start their master city poster.
50-Minute Pacing Guide
Time
Phase
Teacher Moves & Student Actions
0–8 min
Scale Hook
Hold up a 12-inch ruler. Ask: "Can we draw a 200-foot skyscraper full size on this paper?" Introduce architectural scale: 1 grid unit = 20 feet .
8–18 min
Mini-Lesson
Model converting 80 ft to 4 grid units (divide by 20) and 3.5 units back to 70 ft (multiply by 20). Emphasize starting at 0 on the ruler, not the plastic edge.
18–32 min
Scale Table
Students complete Part 1 (Scale Conversion Table) and Part 2 (Ruler Measurement Check) on the Scale Blueprint Worksheet .
32–44 min
Grid Plotting
Students plot 4 required city landmarks onto the coordinate blueprint grid using their converted dimensions and record corner coordinates.
44–50 min
Partner Audit
Partners swap sheets and verify one building's dimensions using a ruler. Discuss: "What happens if two buildings overlap?"
Differentiation (Grades 3–5)
Grade 3 Support: Use whole-number multiples of 20 ft (20, 40, 60, 80, 100) and count grid squares directly.
Grade 4–5 Extension: Include half-unit conversions (e.g., 50 ft = 2.5 units; 90 ft = 4.5 units) and challenge students to compute real-world distance between two landmarks.
Answer Key (Part 1)
City Hall (80 ft × 60 ft) → 4 × 3 units
Library (100 ft × 40 ft) → 5 × 2 units
Fire Station (60 ft × 50 ft) → 3 × 2.5 units
Central Plaza (120 ft × 80 ft) → 6 × 4 units
Portfolio Note: Keep the Scale Key (1 unit = 20 ft) posted on the board for Weeks 3–5. Lesson 2
Scale Blueprint Worksheet Skyline Architects • Week 2
Scale Blueprint & Grid Mapping
Name: ____________________________
Date: ____________________________
Blueprint Scale Key: 1 grid unit = 20 feet | 1/2 grid unit = 10 feet
1. Convert Real-World Dimensions to Blueprint Grid Units
City Landmark
Real-World Size (ft)
Blueprint Size (grid units)
City Hall
80 ft × 60 ft
Public Library
100 ft × 40 ft
Fire Station
60 ft × 50 ft
Central Plaza
120 ft × 80 ft
2. Ruler Check: Measure Each Road Segment to the Nearest 1/2 Inch
Main Street:
_______ in. = _______ ft
Oak Avenue:
_______ in. = _______ ft
3. Plot All 4 Landmarks on Your Blueprint Grid (No Overlaps!)
Draw and label each building from Part 1 using its exact grid-unit width and height. Leave at least 1 grid unit of space between buildings for roads.
Explain: Why do architects use a scale key instead of drawing full-size buildings? ______________________________
Street Angles Teacher Guide Skyline Architects • Week 3 of 13 • 50 Minutes
Street Angles Teacher Guide
Grades 3–5 Advanced
Geometry & Angles
Learning Objectives
Identify and draw parallel, perpendicular, and intersecting road segments.
Classify angles as acute (< 90°), right (90°), obtuse (> 90°), or straight (180°).
Use a protractor to measure and construct specific road intersection angles.
Materials & Setup
Road Angle Lab Worksheet (1 per student).Clear protractors and straightedges (1 per student).
Masking tape on the floor (optional) for a quick 90° vs. 45° intersection demo.
50-Minute Pacing Guide
Time
Phase
Teacher Moves & Student Actions
0–8 min
Intersection Hook
Show a standard 90° four-way stop vs. a sharp 35° diagonal turn. Ask: "Which intersection is safer for a fire truck? Why?"
8–18 min
Protractor Demo
Review parallel vs. perpendicular lines. Model aligning the protractor's center vertex and zero-line, and choosing the inner vs. outer scale based on acute/obtuse reasoning.
18–32 min
Angle Lab
Students complete Parts 1 & 2 of the Road Angle Lab Worksheet : classifying street pairs and measuring 3 given intersections.
32–44 min
Road Design
In Part 3, students engineer a custom 4-street district meeting exact geometry constraints (1 parallel pair, 1 perpendicular intersection, 1 acute turn, 1 obtuse roundabout exit).
44–50 min
Debrief
Partners check each other's drawn angles with a protractor (±3° tolerance) and discuss supplementary angles on a straight road (180°).
Differentiation (Grades 3–5)
Grade 3 Support: Use a right-angle corner card (index card) to test if angles are less than, equal to, or greater than 90° before using a protractor.
Grade 4–5 Extension: Calculate unknown supplementary angles (e.g., if one side of a straight road is 65°, find the adjacent angle: \( 180^\circ - 65^\circ = 115^\circ \)).
Common Misconceptions
Wrong protractor scale: Reading 130° for an acute angle instead of 50°. Always ask: "Is it smaller or larger than a square corner?" Ray length: Thinking longer roads mean larger angles. Remind students that angle measure is the turn , not the road length.
Portfolio Note: Students will transfer their road network onto their final city blueprint in Week 12. Lesson 3
Road Angle Lab Worksheet Skyline Architects • Week 3
Road Angle Lab
Name: ____________________________
Date: ____________________________
1. Identify Road Relationships (Circle the best match for each pair)
1st Ave & 2nd Ave
A. Parallel
B. Perpendicular
C. Intersecting (not 90°)
Main St & Oak Blvd
A. Parallel
B. Perpendicular
C. Intersecting (not 90°)
Parkway & River Rd
A. Parallel
B. Perpendicular
C. Intersecting (not 90°)
2. Measure Each Intersection Angle with Your Protractor
Measure: ______°
Type: _______________
Measure: ______°
Type: _______________
Measure: ______°
Type: _______________
3. Engineer Your City Road Network
Use a ruler and protractor to draw 4 labeled streets inside the box that include: (a) one pair of parallel streets, (b) one 90° perpendicular intersection, (c) one acute angle (label its degrees), and (d) one obtuse angle (label its degrees).
Bonus: If two streets form a straight line and one side is 65°, what is the other angle? ______°
Polygon Parks Teacher Guide Skyline Architects • Week 4 of 13 • 50 Minutes
Polygon Parks Teacher Guide
Grades 3–5 Advanced
Polygons & Perimeter
Learning Objectives
Classify 2D polygons by number of sides, angle types, and parallel sides (trapezoids, rhombuses, hexagons).
Identify lines of symmetry in park plaza layouts.
Calculate perimeter of regular, irregular, and missing-side composite polygons.
Materials & Setup
Park Perimeter Worksheet (1 per student).Pattern blocks (triangles, trapezoids, hexagons) for tactile modeling.
Rulers and colored pencils.
50-Minute Pacing Guide
Time
Phase
Teacher Moves & Student Actions
0–8 min
Fencing Hook
Ask: "If our city wants to put a walking trail and fence around a park, do we need area or perimeter?" Connect perimeter to boundary length.
8–18 min
Missing Sides
Model finding an unlabeled side on an L-shaped park using opposite parallel sides. Review polygon hierarchy (e.g., why a square is also a rhombus and rectangle).
18–32 min
Park Calculations
Students complete Parts 1 & 2 of the Park Perimeter Worksheet , classifying park shapes, drawing symmetry lines, and computing perimeters.
32–44 min
Custom Park
In Part 3, students design a polygonal park with a target perimeter of exactly 240 meters and at least one line of symmetry.
44–50 min
Gallery Quick-Check
Share 2–3 different shapes that all have a 240 m perimeter. Highlight how different polygons can share the same perimeter.
Differentiation (Grades 3–5)
Grade 3 Support: Provide all side lengths on Part 2 and use a rectangle or regular hexagon for the 240 m park.
Grade 4–5 Extension: Require an irregular concave polygon (like a T- or U-shaped park) with 2 unlabeled sides that peers must deduce.
Answer Key (Part 2)
Trapezoid Meadow: \( 40 + 25 + 60 + 25 = \mathbf{150\text{ m}} \)Hexagon Plaza: \( 6 \times 18 = \mathbf{108\text{ m}} \)L-Shaped Dog Park: Missing sides are 15 m and 20 m. Total: \( 45 + 35 + 25 + 15 + 20 + 20 = \mathbf{160\text{ m}} \)
Portfolio Note: Students will compare park perimeter vs. building area in Week 5. Lesson 4
Park Perimeter Worksheet Skyline Architects • Week 4
Polygon Parks & Perimeter
Name: ____________________________
Date: ____________________________
1. Classify Each Park Shape & Draw All Lines of Symmetry
Name: ________________
Symmetry lines: ____
Name: ________________
Symmetry lines: ____
Name: ________________
Symmetry lines: ____
2. Find the Perimeter (Walking Trail Length) of Each Park
Trapezoid Meadow
40 m 60 m 25 m 25 m
Perimeter = ________ m
Regular Hexagon Plaza
18 m
Perimeter = ________ m
L-Shaped Dog Park
25 m 45 m 35 m 15 m
Perimeter = ________ m
3. Design Your Own 240-Meter Park
Draw a polygon park below with a total perimeter of exactly 240 meters and at least 1 line of symmetry . Label every side length.
Show your addition equation for your 240 m park: __________________________________________ = 240 m
Footprint Area Teacher Guide Skyline Architects • Week 5 of 13 • 50 Minutes
Footprint Area Teacher Guide
Grades 3–5 Advanced
Composite Area
Learning Objectives
Calculate area of rectangles using \( A = l \times w \) in square feet.
Decompose composite L-shaped and T-shaped building footprints into non-overlapping rectangles.
Compare two buildings with the same perimeter but different areas (area vs. perimeter trade-offs).
Materials & Setup
Building Footprint Worksheet (1 per student).Two-color highlighters for showing horizontal vs. vertical decomposition cuts.
Grid paper or square tiles for Grade 3 tactile support.
50-Minute Pacing Guide
Time
Phase
Teacher Moves & Student Actions
0–8 min
Perimeter vs. Area
Compare a 1×11 ft hallway vs. a 6×6 ft room. Both have a 24 ft perimeter! Ask: "Which building gives citizens more floor space?"
8–18 min
Slice & Solve
Model slicing an L-shaped museum two ways (horizontal cut vs. vertical cut) and show both yield the exact same total area.
18–32 min
Footprint Practice
Students complete Parts 1 & 2 on the Building Footprint Worksheet , decomposing composite buildings and finding missing dimensions.
32–44 min
Floor Plan Design
In Part 3, students design a composite Community Center footprint with a total area between 1,200 and 1,600 sq ft .
44–50 min
Debrief
Discuss: "Which shape gives the most floor area for a fixed perimeter—a long skinny rectangle or a square?"
Differentiation (Grades 3–5)
Grade 3 Support: Draw the dotted decomposition line for students and use smaller multiples (e.g., 10s).
Grade 4–5 Extension: Challenge students to solve Part 2 using the "Big Rectangle Minus Cutout" subtraction strategy as a second method.
Answer Key (Parts 1 & 2)
Part 1: \( 80 \times 20 = 1,600\text{ sq ft} \) vs. \( 50 \times 50 = 2,500\text{ sq ft} \) (both 200 ft perimeter; square has +900 sq ft).L-Shaped Museum: \( (30 \times 20) + (50 \times 20) = \mathbf{1,600\text{ sq ft}} \)T-Shaped School: \( (60 \times 20) + (20 \times 30) = \mathbf{1,800\text{ sq ft}} \)
Portfolio Note: Keep building footprints handy for Week 7 (City Budget) pricing! Lesson 5
Building Footprint Worksheet Skyline Architects • Week 5
Building Footprint Area Lab
Name: ____________________________
Date: ____________________________
1. Same Perimeter, Different Area! Compare These Two Building Lots
Lot A: 80 ft × 20 ft (Perimeter = 200 ft)
Area = ____________ sq ft
Lot B: 50 ft × 50 ft (Perimeter = 200 ft)
Area = ____________ sq ft
2. Slice Into Rectangles to Find Each Composite Building Area
L-Shaped Science Museum
30 ft 40 ft 50 ft 20 ft
Total Area = ____________ sq ft
T-Shaped Charter School
60 ft 20 ft 20 ft 30 ft
Total Area = ____________ sq ft
3. Design a Composite Community Center (Target Area: 1,200 – 1,600 sq ft)
Sketch an L-shaped or T-shaped footprint below, label all side lengths, draw a dashed line showing how you sliced it, and show your area calculation.
Why might an architect prefer a square lot over a long skinny lot? __________________________________________
Fraction Districts Teacher Guide Skyline Architects • Week 6 of 13 • 50 Minutes
Fraction Districts Teacher Guide
Grades 3–5 Advanced
Equivalent Fractions
Learning Objectives
Generate and verify equivalent fractions using area models and multiplicative scaling (\( \frac{a}{b} = \frac{a \times n}{b \times n} \)).
Compare and add fractions with unlike denominators by finding common denominators (e.g., twelfths or twenty-fourths).
Partition city blocks to satisfy multi-constraint zoning ordinances.
Materials & Setup
Zoning Fractions Worksheet (1 per student).Fraction strips or Cuisenaire rods for hands-on equivalence checks.
Colored pencils (3–4 colors per student).
50-Minute Pacing Guide
Time
Phase
Teacher Moves & Student Actions
0–8 min
Zoning Dispute
Pose: "Mayor A says \( \frac{1}{3} \) of a 12-lot block is parks. Mayor B says \( \frac{4}{12} \) is parks. Who has more?" Prove they are equal!
8–18 min
Common Denominators
Model converting \( \frac{1}{4} \), \( \frac{1}{3} \), and \( \frac{1}{6} \) into twelfths to check if a block's zones sum to \( \frac{12}{12} = 1 \) whole.
18–32 min
Equivalence Lab
Students complete Parts 1 & 2 on the Zoning Fractions Worksheet , finding equivalent fractions and solving a 12-lot block puzzle.
32–44 min
24-Lot District
In Part 3, students partition a 24-lot Downtown District to meet 4 zoning rules (e.g., at least \( \frac{1}{4} \) green space, exactly \( \frac{1}{3} \) housing).
44–50 min
Debrief
Compare how different students arranged the same fractions on the 24-lot grid. Reinforce that equal fractions don't have to be touching!
Differentiation (Grades 3–5)
Grade 3 Support: Use fraction strips alongside the 12-lot grid and focus on halves, thirds, fourths, and sixths.
Grade 4–5 Extension: Require students to write the 24-lot district equation in both twenty-fourths and simplified lowest terms.
Answer Key (Parts 1 & 2)
Equivalents: \( \frac{1}{2} = \frac{6}{12} = \frac{12}{24} \); \( \frac{2}{3} = \frac{8}{12} = \frac{16}{24} \); \( \frac{3}{4} = \frac{9}{12} = \frac{18}{24} \).Part 2 (12-Lot Block): \( \frac{1}{3} = 4 \) lots (Homes), \( \frac{1}{4} = 3 \) lots (Shops), \( \frac{1}{6} = 2 \) lots (School), remaining \( 3 \) lots = \( \frac{3}{12} = \mathbf{\frac{1}{4}} \) (Parks).
Portfolio Note: Next week (Week 7), students will price out each lot using a decimal municipal budget. Lesson 6
Zoning Fractions Worksheet Skyline Architects • Week 6
Fraction Districts & Zoning
Name: ____________________________
Date: ____________________________
1. Complete the Equivalent Fraction Chains for City Blocks
\( \frac{1}{2} = \frac{\quad\quad}{12} = \frac{\quad\quad}{24} \)
\( \frac{2}{3} = \frac{\quad\quad}{12} = \frac{\quad\quad}{24} \)
\( \frac{3}{4} = \frac{\quad\quad}{12} = \frac{\quad\quad}{24} \)
2. Solve the 12-Lot Neighborhood Block
A 12-lot block must be zoned as follows:
Homes (H): \( \frac{1}{3} \) of the block = ______ lotsShops (S): \( \frac{1}{4} \) of the block = ______ lotsSchool (E): \( \frac{1}{6} \) of the block = ______ lotsParks (P): The rest = ______ lots = \( \frac{\quad\quad}{12} = \frac{\quad\quad}{\quad\quad} \)
3. Design Your 24-Lot Downtown District
Label each of the 24 lots below to follow all 4 city rules: (a) Exactly \( \frac{1}{3} \) Housing (H), (b) At least \( \frac{1}{4} \) Parks (P), (c) Exactly \( \frac{1}{8} \) Transit/Civic (T), and (d) The rest Commercial (C).
H: ____ / 24
P: ____ / 24
T: ____ / 24
C: ____ / 24
Write your 24-lot sum equation: ____/24 + ____/24 + ____/24 + ____/24 = 24/24 = 1
City Budget Teacher Guide Skyline Architects • Week 7 of 13 • 50 Minutes
City Budget Teacher Guide
Grades 3–5 Advanced
Decimals & Budgeting
Learning Objectives
Add and subtract decimal money values to hundredths with place-value alignment.
Multiply decimal unit prices by whole-number quantities (e.g., \( 4 \times \$18.75 \)).
Optimize a \( \$500.00 \) municipal budget while meeting minimum city infrastructure requirements.
Materials & Setup
City Budget Ledger Worksheet (1 per student).Scratch paper for vertical decimal calculations (no calculators during Phase 1–2).
50-Minute Pacing Guide
Time
Phase
Teacher Moves & Student Actions
0–8 min
Budget Hook
Announce: "City Council approved a $500.00 million grant (shown as $500.00). If you overspend by even $0.01, construction stops!"
8–18 min
Decimal Alignment
Model \( 3 \times \$24.50 \) using partial products (\( 3 \times 24 + 3 \times 0.50 \)) and model subtracting from \( \$500.00 \) with regrouping across zeros.
18–38 min
Ledger Planning
Students select quantities from the City Catalog on the City Budget Ledger Worksheet , ensuring they include all 4 required city essentials.
38–45 min
Peer Audit
Partners audit each other's line-item multiplication and running total. Fix any decimal-point placement errors.
45–50 min
Debrief
Ask: "How close did you get to $500.00 without going over? What trade-offs did you make?"
Differentiation (Grades 3–5)
Grade 3 Support: Allow repeated addition for 2–3 quantities and use rounded estimates first to check reasonableness.
Grade 4–5 Extension: Add a 10% emergency reserve rule (must keep at least \( \$50.00 \) unspent) or calculate cost per resident.
Minimum Requirements Check
At least 3 Apartment Towers (\( 3 \times \$42.50 = \$127.50 \))
At least 2 Parks (\( 2 \times \$28.75 = \$57.50 \))
At least 4 Road Sections (\( 4 \times \$15.25 = \$61.00 \))
At least 1 Civic Building (School \( \$68.40 \) or Hospital \( \$84.90 \))
Portfolio Note: Students will audit this same budget against their final city model in Week 12. Lesson 7
City Budget Ledger Worksheet Skyline Architects • Week 7
Municipal City Budget Ledger
Name: ____________________________
Date: ____________________________
Total Grant: $500.00 | Required Minimums:
At least 3 Apartment Towers , 2 Parks , 4 Road Sections , and 1 Civic Building (School or Hospital). Do not exceed $500.00!
1. City Purchase Ledger
City Item
Unit Price
Quantity
Line Total ($)
Apartment Tower
$42.50
Office Skyscraper
$56.75
Neighborhood Park
$28.75
Road Section (1 block)
$15.25
Charter School
$68.40
City Hospital
$84.90
Subway Station
$49.60
Solar Microgrid
$33.80
TOTAL SPENT (Sum of all Line Totals)
REMAINING BALANCE ($500.00 − Total Spent)
2. Decimal Calculation Workspace (Line up your decimal points!)
Auditor Signature (Classmate Check): ______________________ Verified Under $500.00? Yes / No
Decimal Blueprints Teacher Guide Skyline Architects • Week 8 of 13 • 50 Minutes
Decimal Blueprints Teacher Guide
Grades 3–5 Advanced
Fractions ↔ Decimals
Learning Objectives
Convert benchmark fractions (\( \frac{1}{2}, \frac{1}{4}, \frac{3}{4}, \frac{1}{5}, \frac{3}{10} \)) to equivalent tenths and hundredths decimals.
Compare and order decimals and fractions on a 0-to-1 architectural number line.
Use decimal/fraction proportions to design a 100-square skyscraper glass facade.
Materials & Setup
Fraction Decimal Specs Worksheet (1 per student).Base-10 hundredths flats (optional) for concrete modeling.
Colored pencils (sky blue, slate gray, amber) for facade shading.
50-Minute Pacing Guide
Time
Phase
Teacher Moves & Student Actions
0–8 min
Two Languages
Write \( \frac{1}{4} \) and \( 0.25 \) on the board. Ask: "Why does a carpenter say 1/4 inch while a CAD computer says 0.25?" Connect to quarters in a dollar.
8–18 min
Hundredths Grid
Model converting \( \frac{2}{5} = \frac{4}{10} = \frac{40}{100} = 0.40 \) on a 10×10 grid. Show how \( 0.4 = 0.40 \) (4 columns = 40 squares).
18–30 min
Specs & Line
Students complete Parts 1 & 2 of the Fraction Decimal Specs Worksheet (conversion table + number line placement).
30–44 min
Facade Design
In Part 3, students design a 10×10 (100-panel) skyscraper facade with exact decimal/fraction specs for Glass, Brick, and Solar Panels.
44–50 min
Debrief
Check that every student's 3 facade decimals sum to \( 1.00 \). Ask: "Is 0.45 larger or smaller than 1/2? How do you know?"
Differentiation (Grades 3–5)
Grade 3 Support: Focus on tenths (\( 0.1 = \frac{1}{10} \)) and halves/quarters (\( 0.50, 0.25, 0.75 \)) using money analogies.
Grade 4–5 Extension: Include fifths and twentieths (\( \frac{3}{20} = 0.15 \)) and ask students to express their facade in percentages as well.
Answer Key (Part 1)
\( \frac{1}{4} = \frac{25}{100} = \mathbf{0.25} \)
\( \frac{2}{5} = \frac{40}{100} = \mathbf{0.40} \)
\( \frac{3}{4} = \frac{75}{100} = \mathbf{0.75} \)
\( \frac{7}{10} = \frac{70}{100} = \mathbf{0.70} \)
Portfolio Note: Students will use these facade designs when drafting 3D buildings in Week 9. Lesson 8
Fraction Decimal Specs Worksheet Skyline Architects • Week 8
Fraction & Decimal Building Specs
Name: ____________________________
Date: ____________________________
1. Architectural Conversion Table
Blueprint Spec
Fraction
Equivalent Hundredths
Decimal
Lobby Door Width
\( \frac{1}{4} \)
Sidewalk Ramp
\( \frac{2}{5} \)
Window Tint Ratio
\( \frac{3}{4} \)
Roof Overhang
\( \frac{7}{10} \)
2. Plot and Label These Values on the Number Line: \( 0.25,\; \frac{1}{2},\; 0.40,\; \frac{3}{4},\; 0.9 \)
0.00.51.0
3. Design a 100-Panel Skyscraper Facade (10 × 10 Grid = 1.00 Whole)
Shade your building front using: 0.45 Glass Windows , \( \frac{1}{4} \) Brick Panels , and the rest Solar Panels .
Glass Windows:
Panels: ______ | Decimal: 0.45 | Fraction: ____
Brick Panels:
Panels: ______ | Decimal: ____ | Fraction: 1/4
Solar Panels (The Rest):
Panels: ______ | Decimal: ____ | Fraction: ____
Decimal Check: 0.45 + ______ + ______ = 1.00
Skyline Heights Teacher Guide Skyline Architects • Week 9 of 13 • 50 Minutes
Skyline Heights Teacher Guide
Grades 3–5 Advanced
3D Solids & Elevation
Learning Objectives
Identify faces, edges, and vertices of rectangular prisms, triangular prisms, cylinders, and square pyramids.
Calculate total building heights by multiplying stories by decimal story heights (e.g., \( 12 \times 12.5\text{ ft} \)).
Draft a scaled 2D skyline elevation showing varied heights and rooflines.
Materials & Setup
Skyline Elevation Worksheet (1 per student).3D geometric solid manipulatives (or folded paper nets).
Rulers for drafting straight vertical skyline towers.
50-Minute Pacing Guide
Time
Phase
Teacher Moves & Student Actions
0–8 min
3D Architecture
Show a rectangular prism topped with a square pyramid (like an obelisk skyscraper). Count faces, edges, and vertices together.
8–18 min
Story Math
Model finding total height: if 1 story = \( 12.5\text{ ft} \), how tall is an 8-story apartment? (\( 8 \times 12 = 96 \), \( 8 \times 0.5 = 4 \), total \( 100\text{ ft} \)).
18–32 min
3D & Height Lab
Students complete Parts 1 & 2 on the Skyline Elevation Worksheet , recording 3D attributes and computing building heights.
32–44 min
Elevation Sketch
In Part 3, students draw a 5-building skyline elevation at scale (1 grid unit = 25 ft) with at least 2 different 3D roof shapes.
44–50 min
Debrief
Compare skylines: "Why do architects vary building heights instead of making every tower the exact same height?"
Differentiation (Grades 3–5)
Grade 3 Support: Provide physical 3D solids at each table so students can touch and count faces, edges, and vertices.
Grade 4–5 Extension: Calculate the 3D volume (\( V = l \times w \times h \)) of one rectangular prism tower in cubic feet.
Answer Key (Parts 1 & 2)
Rectangular Prism: 6 faces, 12 edges, 8 vertices.Square Pyramid: 5 faces, 8 edges, 5 vertices.Triangular Prism: 5 faces, 9 edges, 6 vertices.Heights: \( 8 \times 12.5 = \mathbf{100\text{ ft}} \); \( 12 \times 12.5 = \mathbf{150\text{ ft}} \); \( 16 \times 12.5 = \mathbf{200\text{ ft}} \).
Portfolio Note: Students will use these heights to build 3D cardstock/paper models in Week 12. Lesson 9
Skyline Elevation Worksheet Skyline Architects • Week 9
3D Solids & Skyline Elevation
Name: ____________________________
Date: ____________________________
1. 3D Building Shape Attributes
3D Solid
Flat Faces
Edges
Vertices
Rectangular Prism (Tower Body)
Square Pyramid (Spire Roof)
Triangular Prism (Gable Roof)
2. Calculate Building Heights (Each Story = 12.5 feet)
8-Story Apartment
Height = ________ ft
12-Story Hotel
Height = ________ ft
16-Story Skyscraper
Height = ________ ft
3. Draft Your 5-Building Skyline Elevation (Scale: 1 row = 25 feet)
Draw 5 buildings side-by-side at their scaled heights. Include at least 2 different roof shapes (flat, pyramid, or gable) and label each height in feet.
What is the height difference between your tallest and shortest building? ________ ft
Traffic Data Teacher Guide Skyline Architects • Week 10 of 13 • 50 Minutes
Traffic Data Teacher Guide
Grades 3–5 Advanced
Fractional Line Plots
Learning Objectives
Organize fractional measurement data (quarters and halves of a mile) onto a line plot.
Interpret line plots by finding total combined distance, mode, and range.
Use data evidence to propose an optimal bus or bike-lane route.
Materials & Setup
Transit Line Plot Worksheet (1 per student).Highlighters to group identical fractions when summing commute totals.
50-Minute Pacing Guide
Time
Phase
Teacher Moves & Student Actions
0–8 min
Gridlock Hook
Ask: "Main Street has a traffic jam! If 12 citizens commute different distances, how can we see which distance is most common?" Introduce line plots.
8–18 min
Line Plot Model
Model partitioning a 0-to-2 mile number line into fourths (\( \frac{1}{4}, \frac{2}{4}=\frac{1}{2}, \frac{3}{4}, 1, 1\frac{1}{4}... \)) and stacking X's evenly.
18–34 min
Plot & Compute
Students plot the 12 commuter distances on the Transit Line Plot Worksheet and answer the fraction addition/subtraction questions.
34–44 min
Transit Redesign
In Part 3, students solve the open-ended challenge: decide where to place 2 new Subway Stops to serve the most commuters.
44–50 min
Debrief
Students defend their Subway Stop placement using numbers from their line plot (e.g., "7 out of 12 riders live between 1 and 1½ miles" ).
Differentiation (Grades 3–5)
Grade 3 Support: Cross off each data value as you place an X, and add like-denominator groups first (e.g., three \( \frac{1}{2} \)s = \( 1\frac{1}{2} \)).
Grade 4–5 Extension: Calculate the mean (average) commute distance by dividing the total miles by 12.
Answer Key (Part 2)
Mode: \( \mathbf{1\frac{1}{4}\text{ miles}} \) (4 commuters).Range: \( 1\frac{3}{4} - \frac{1}{2} = \mathbf{1\frac{1}{4}\text{ miles}} \).Total Combined Distance: \( \frac{1}{2} + \frac{1}{2} + \frac{3}{4} + 1 + 1 + 1\frac{1}{4}(4) + 1\frac{1}{2}(2) + 1\frac{3}{4} = \mathbf{13\frac{1}{2}\text{ miles}} \).
Portfolio Note: Students can add their chosen Subway Stops to their Week 12 city map. Lesson 10
Transit Line Plot Worksheet Skyline Architects • Week 10
Traffic Data & Transit Line Plot
Name: ____________________________
Date: ____________________________
12 Citizen Commute Distances (in miles):
\( \frac{1}{2},\quad 1\frac{1}{4},\quad 1,\quad 1\frac{1}{2},\quad 1\frac{1}{4},\quad \frac{3}{4},\quad 1\frac{3}{4},\quad 1\frac{1}{4},\quad \frac{1}{2},\quad 1,\quad 1\frac{1}{2},\quad 1\frac{1}{4} \)
1. Build a Line Plot of Commuter Distances (Mark an X for each citizen)
0\( \frac{1}{4} \)\( \frac{1}{2} \)\( \frac{3}{4} \)1\( 1\frac{1}{4} \)\( 1\frac{1}{2} \)\( 1\frac{3}{4} \)2
Commute Distance (Miles)
2. Analyze the Line Plot
a) Mode (most common):
b) Range (longest − shortest):
c) Total Combined Miles:
3. Open-Ended Transit Redesign Challenge
Your city can afford 2 new Subway Stops along the 2-mile Main Avenue corridor. Where on the 0-to-2 mile line should you place them to reduce the most car traffic? Use data from your line plot to justify your plan.
How many of the 12 citizens live within 1/4 mile of your new stops? ______ / 12 citizens
Green Energy Teacher Guide Skyline Architects • Week 11 of 13 • 50 Minutes
Green Energy Teacher Guide
Grades 3–5 Advanced
Optimization Problem
Learning Objectives
Solve an open-ended multi-constraint optimization problem combining area, fractions, and decimals.
Calculate solar energy output based on rooftop area (\( \text{sq ft} \)) and compare decimal cost-per-watt.
Defend a sustainability plan with quantitative evidence.
Materials & Setup
Eco City Challenge Worksheet (1 per student).Optional: Calculators for Grade 3 students to check multi-step decimal totals after estimating.
50-Minute Pacing Guide
Time
Phase
Teacher Moves & Student Actions
0–8 min
Eco Mandate
Present the Mayor's Green Mandate: "Power at least 100 Eco-Units, keep costs under $120.00, and cover at least 1/3 of our 12-block district with trees!"
8–16 min
Analyze Options
Compare Solar Panels ($18.50 for 20 Eco-Units) vs. Wind Turbines ($26.25 for 30 Eco-Units). Ask: "Which gives more energy per dollar?"
16–38 min
Optimization Lab
Students test combinations on the Eco City Challenge Worksheet to hit 100+ Eco-Units, \( \ge \frac{1}{3} \) tree canopy, and \( \le \$120.00 \).
38–45 min
Pitch Prep
Students write their 2-sentence Eco Pitch explaining why their combination is the smartest use of space and money.
45–50 min
Debrief
Compare 2–3 valid solutions! Emphasize that open-ended math problems have multiple great answers when constraints are met.
Differentiation (Grades 3–5)
Grade 3 Support: Start with 2 Wind Turbines (60 units, $52.50) and ask them to add Solar Panels and Trees from there.
Grade 4–5 Extension: Challenge students to maximize Eco-Units per dollar or achieve 120+ Eco-Units within the same $120.00 budget.
Sample Valid Solution
2 Wind Turbines: 60 Eco-Units, \( \$52.50 \), 2 blocks.2 Rooftop Solar Arrays: 40 Eco-Units, \( \$37.00 \), 0 ground blocks.4 Tree Canopy Parks: 12 Eco-Units, \( \$25.00 \), 4/12 = 1/3 blocks.Totals: 112 Eco-Units, \( \$114.50 \le \$120.00 \), 1/3 canopy!
Portfolio Note: Next week (Week 12), students assemble their final cityscape and run a full math audit. Lesson 11
Eco City Challenge Worksheet Skyline Architects • Week 11
Eco City Optimization Challenge
Name: ____________________________
Date: ____________________________
Mayor's Green Mandate (All 3 Rules Must Be Met!):
1) Generate at least 100 Eco-Units | 2) Spend $120.00 or less | 3) Cover at least \( \frac{1}{3} \) of your 12-block grid with Tree Canopy Parks.
1. Green Infrastructure Options & Your Selection
Eco Feature
Eco-Units
Cost Each
Blocks Used
Qty
Total Cost
Rooftop Solar Array
20
$18.50
0 (on roof)
Urban Wind Turbine
30
$26.25
1 block
Tree Canopy Park
3
$6.25
1 block
YOUR TOTALS: Eco-Units = ________
Tree Canopy = ____ / 12
Total $:
2. Calculation Workspace (Show Eco-Units, Fraction Check, and Decimal Costs)
3. Architect's Eco Pitch (Why is your plan the smartest design?)
All 3 Rules Met? Eco-Units ≥ 100 ( ) Cost ≤ $120.00 ( ) Canopy ≥ 1/3 ( ) Week 11
City Build Teacher Guide Skyline Architects • Week 12 of 13 • 50 Minutes
City Build Teacher Guide
Grades 3–5 Advanced
Assembly & Math Audit
Learning Objectives
Synthesize 11 weeks of blueprints, road angles, 3D heights, and eco-features into one cohesive cityscape.
Perform a quantitative quality-control audit verifying scale, angles, perimeter/area, fractions, and decimal budget.
Provide constructive mathematical feedback during a peer inspection.
Materials & Setup
Architect Audit Checklist (1 per student).Poster board / foam board base, cardstock nets, scissors, glue sticks, rulers, protractors, and Architect Portfolios.
50-Minute Pacing Guide
Time
Phase
Teacher Moves & Student Actions
0–5 min
Inspection Briefing
Explain that before next week's Expo, every city must pass the City Building Inspector Audit (5 math checkpoints).
5–32 min
Final City Build
Students assemble their 2D master map or 3D cardstock skyline on poster board, adding labeled streets, parks, solar/eco features, and scale key.
32–40 min
Self-Audit
Students complete the left column of the Architect Audit Checklist , recording their city's actual measurements, fractions, and final budget.
40–47 min
Peer Inspector
Partners swap cities with a ruler and protractor to verify at least 2 measurements and sign off on the Inspector column.
47–50 min
Expo Prep
Store completed cityscapes safely and preview Week 13 Expo presentation expectations (2-minute Math Defense).
Differentiation (Grades 3–5)
Grade 3 Support: Allow a 2D bird's-eye poster with pop-up tabs or pre-cut rectangular prism nets.
Grade 4–5 Extension: Require a complete written Legend/Key showing scale, total green-space fraction, and exact cost per square foot.
Teacher Circulating Focus
Spot-check that students' physical models match their Week 7 budget quantities.
Ensure every cityscape has a visible Scale Key and North Compass Rose .
Expo Note: Invite parents, administrators, or another class to Week 13's Cityscape Expo! Lesson 12
Architect Audit Checklist Skyline Architects • Week 12
City Building Inspector Math Audit
Name: ____________________________
Date: ____________________________
Before next week's Expo Showcase, record your cityscape's exact mathematical specs below, then have a classmate act as your City Inspector to verify your work with a ruler and protractor.
Math Standard
Cityscape Requirement
My City's Proof / Value
Inspector Check
1. Scale & Grid
Visible Scale Key (e.g., 1 unit = 20 ft) and no overlapping buildings.
☐ Pass
2. Street Angles
At least 1 parallel pair, 1 perpendicular (90°) corner, and 1 acute or obtuse turn.
☐ Pass
3. Area & Perimeter
Record the perimeter of 1 park and the footprint area of 1 composite building.
☐ Pass
4. Fraction Zones
Housing + Commercial + Parks/Civic fractions sum to 1 whole city.
☐ Pass
5. Decimal Budget
Total spent is $500.00 or less and matches the structures built.
☐ Pass
6. 3D & Eco Specs
Tallest building height labeled in feet; at least 1/3 tree canopy or eco feature included.
☐ Pass
Inspector Feedback & One Thing to Polish Before Expo Day
Inspector Name: ________________________ Inspector Signature: ________________________
Expo Showcase Teacher Guide Skyline Architects • Week 13 of 13 • 50 Minutes
Expo Showcase Teacher Guide
Grades 3–5 Advanced
Exhibition & Rubric
Learning Objectives
Communicate mathematical reasoning clearly using geometry, fraction, decimal, and data vocabulary.
Collect and tally peer cityscape attributes during a structured Gallery Walk.
Reflect on mathematical growth across the 13-week design studio.
Materials & Setup
Gallery Walk Reflection (1 per student).Completed cityscapes displayed at desks/tables with Architect Portfolios open beside them.
50-Minute Expo Pacing
Time
Phase
Teacher Moves & Student Actions
0–5 min
Expo Welcome
Set up displays. Split class into Group A (Presenters first) and Group B (Gallery Walkers first).
5–20 min
Round 1 Showcase
Group A presents their 2-minute Math Defense (Scale, Angles/Area, Fractions/Budget) while Group B visits 4 cities and tallies data on Gallery Walk Reflection .
20–35 min
Round 2 Showcase
Switch roles! Group B presents while Group A completes their Gallery Walk data collection. Teacher scores using the rubric below.
35–45 min
Final Reflection
Students return to seats to complete Part 2 of the reflection sheet, identifying their proudest math breakthrough.
45–50 min
Awards & Close
Celebrate all Skyline Architects! Highlight creative solutions (e.g., most efficient budget, boldest angle design, greenest city).
Summative Cityscape Math Rubric
Domain
4 — Master Architect
3 — Proficient
2 — Developing
Geometry & Scale
Exact scale, accurate angles, composite area & perimeter verified.
Minor measurement slips (≤ 10%); core shapes accurate.
Missing scale key or multiple calculation errors.
Fractions & Decimals
Zones sum to 1; budget ≤ $500.00 with exact decimal math.
Zones accurate; 1 minor decimal arithmetic slip.
Fractions don't sum to 1 or budget exceeds limit.
Data & Math Defense
Justifies design choices using survey, line plot, and eco data.
Explains math clearly when prompted.
Describes art features without math evidence.
Congratulations! You've completed all 13 weeks of Skyline Architects. Lesson 13
Gallery Walk Reflection Skyline Architects • Week 13
Expo Gallery Walk & Reflection
Name: ____________________________
Date: ____________________________
1. Cityscape Expo Gallery Walk (Visit 4 Classmates' Cities & Collect Their Math Data)
Architect Name
Total Budget ($)
Tallest Bldg (ft)
One Clever Math Feature I Noticed
2. Final Architect's Reflection
a) How did you use Geometry & Measurement (scale, angles, area, or 3D solids) to make your city work?
b) How did Fractions & Decimals help you zone your blocks and manage your $500.00 city budget?
c) Which Data & Problem-Solving challenge (Survey, Transit Line Plot, or Green Energy) was your favorite, and why?
13-Week Studio Complete! Official Skyline Architect