Histogram Explorer WorksheetMath Foundations Data Displays & Statistics Histogram Explorer Worksheet Name: Date: Period: Part 1: Key Ideas & Anatomy A histogram is a special graph that groups numerical data into continuous, equal-sized intervals called bins. The height of each bar shows the frequency (how many data values fall into that bin). Bins (Intervals) Equal numeric ranges along the horizontal (x) axis. No overlapping values! Bars Touch Because numerical intervals are continuous, bars touch unless a bin has a frequency of 0. Overall Shape Can be Symmetric (bell-like), Skewed Right (tail right), or Skewed Left (tail left). Part 2: Read & Interpret the Data The histogram below displays the number of pages read in one week by students participating in the school reading marathon. Examine the display carefully to answer the questions. 12 9 6 3 0 Frequency (Students) 4 9 12 7 2 0–49 50–99 100–149 150–199 200–249 Number of Pages Read 1 What is the interval size (bin width) for this histogram? Bin width: 2 Which interval has the greatest frequency, and exactly how many students are in it? Interval: Number of students: 3 How many total students participated in the reading marathon? Show your addition below. 4 How many students read at least 150 pages? (Identify which bins to combine.) Calculation & Total: 5 Describe the distribution shape (Symmetric, Skewed Right, or Skewed Left). What tells you that? Histogram Explorer • Practice Worksheet Page 1 of 2 Hands-On Practice Part 3: Organize Data & Construct a Histogram Page 2 Flight Test: Paper Airplane Distances (in feet) 16 Total Flights A science class tested 16 paper airplane designs and recorded how far each plane flew (rounded to the nearest foot). Here is the raw data set: 12 18 24 7 31 15 22 28 19 36 14 27 21 8 25 33 A Complete the Frequency Table Count the values for each bin and record your tallies and frequencies. Interval (ft) Tally Freq. 0 – 9 10 – 19 20 – 29 30 – 39 Total: — Remember: Make your bars touch each other at the interval borders! Use a ruler or straight edge to draw flat bar tops. B Draw Your Histogram Shade the bar for each interval up to its matching frequency. Paper Airplane Flight Distances 8 7 6 5 4 3 2 1 0 Frequency 0–9 10–19 20–29 30–39 Flight Distance (Feet) C Analyze Your Created Histogram 1. Which flight distance interval had the greatest frequency of paper airplanes? Most frequent interval: 2. How many paper airplanes flew 20 feet or more? What fraction of all 16 planes is this? Number of planes: Fraction of total: 3. Concept Check: Explain why a histogram is the right choice for this data instead of a standard categorical bar graph. Histogram Explorer • Practice Worksheet Page 2 of 2
Histogram Explorer Answer KeyTeacher Reference Answer Key & Scoring Guide Histogram Explorer Answer Key Full Solutions • Page 1 Target: Grades 6–8 Statistics Key Teaching Notes & Common Student Pitfalls 1. Histograms vs. Bar Graphs: Students often leave gaps between bars. Emphasize that numeric data intervals are continuous, so bars must touch. 2. Calculating Totals: To find the total sample size, students must sum the heights (frequencies) of all bars, not count how many bars there are. Part 2: Read & Interpret Solutions Points: 10 Total (2 pts each) 1. Interval size (bin width): 2 Points Prompt: What is the interval size (bin width) for this histogram? Answer: 50 pages (Each bin covers 50 whole numbers: e.g., 0 through 49 inclusive, 50 through 99, etc.) 2. Greatest frequency interval & count: 2 Points Prompt: Which interval has the greatest frequency, and exactly how many students are in it? Answer: Interval: 100–149 pages | Students: 12 students (Tallest bar in the display) 3. Total student count: 2 Points Prompt: How many total students participated in the reading marathon? Show your addition below. Answer & Work: 4 + 9 + 12 + 7 + 2 = 34 students Scoring note: Award 1 point for correct addition expression summing all 5 bars, 1 point for the correct sum of 34. 4. Students who read at least 150 pages: 2 Points Prompt: How many students read at least 150 pages? (Identify which bins to combine.) Answer: Combine intervals 150–199 (7) and 200–249 (2): 7 + 2 = 9 students 5. Distribution shape description: 2 Points Prompt: Describe the distribution shape (Symmetric, Skewed Right, or Skewed Left). What tells you that? Sample Exemplar: The distribution is approximately symmetric (or bell-shaped). The peak is centered in the middle bin (100–149 pages with 12 students), and frequencies decline evenly on both sides (9 and 4 to the left; 7 and 2 to the right). Scoring note: Accept "symmetric" or "bell-shaped" if supported by noting the centered peak and balanced sides. Histogram Explorer • Teacher Answer Key Page 1 of 2 Teacher Reference Part 3: Graph Construction & Reflection Solutions Page 2 Total Points Available (Page 2): 10 Points Frequency Table: 3 pts Drawn Histogram: 4 pts Analysis Questions: 3 pts Completed Table (3 pts) Solution Interval (ft) Tally Freq. 0 – 9 10 – 19 ̶I̶I̶I̶I̶ 20 – 29 ̶I̶I̶I̶I̶ 30 – 39 Total: — 16 Value Breakdown by Bin: • 0–9: 7, 8 (2) • 10–19: 12, 14, 15, 18, 19 (5) • 20–29: 21, 22, 24, 25, 27, 28 (6) • 30–39: 31, 33, 36 (3) Completed Histogram (4 pts) Solution Graphic Paper Airplane Flight Distances 8 7 6 5 4 3 2 1 0 Frequency 2 5 6 3 0–9 10–19 20–29 30–39 Flight Distance (Feet) Check: 1 pt per correct bar height (4 bars total) and touching edges. Analysis & Reflection Solutions (3 pts) 1 pt per question 1. Greatest frequency interval: Answer: 20–29 feet (with a frequency of 6 airplanes). 2. Planes flying 20 feet or more & fraction: Answer: Bins [20–29] + [30–39] = 6 + 3 = 9 airplanes. Fraction of total: 9/16 (or 56.25%). 3. Concept Check: Why a histogram instead of a bar graph? Sample Exemplar: Flight distance is continuous numerical data grouped into ordered numerical intervals (bins). A bar graph displays separate categorical groups (like plane color or model), while a histogram shows the distribution, spread, and shape of numeric measurements where intervals connect. Histogram Explorer • Teacher Answer Key Page 2 of 2
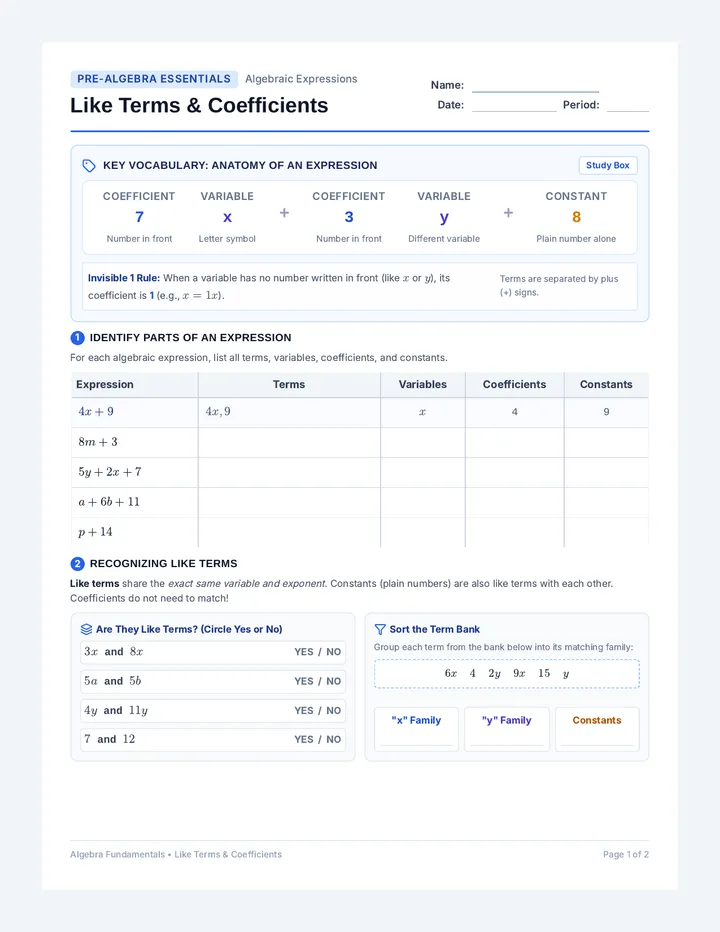
Like Terms WorksheetPre-Algebra Essentials Algebraic Expressions Like Terms & Coefficients Name: Date: Period: Key Vocabulary: Anatomy of an Expression Study Box Coefficient 7 Number in front Variable x Letter symbol Coefficient 3 Number in front Variable y Different variable Constant 8 Plain number alone Invisible 1 Rule: When a variable has no number written in front (like \(x\) or \(y\)), its coefficient is 1 (e.g., \(x = 1x\)). Terms are separated by plus (+) signs. 1 Identify Parts of an Expression For each algebraic expression, list all terms, variables, coefficients, and constants. Expression Terms Variables Coefficients Constants \(4x + 9\) \(4x, 9\) \(x\) 4 9 \(8m + 3\) \(5y + 2x + 7\) \(a + 6b + 11\) \(p + 14\) 2 Recognizing Like Terms Like terms share the exact same variable and exponent. Constants (plain numbers) are also like terms with each other. Coefficients do not need to match! Are They Like Terms? (Circle Yes or No) \(3x\) and \(8x\) YES / NO \(5a\) and \(5b\) YES / NO \(4y\) and \(11y\) YES / NO \(7\) and \(12\) YES / NO Sort the Term Bank Group each term from the bank below into its matching family: \(6x\) \(4\) \(2y\) \(9x\) \(15\) \(y\) "x" Family "y" Family Constants Algebra Fundamentals • Like Terms & Coefficients Page 1 of 2 Skill Practice Part 3: Combining Like Terms Page 2 How to Combine Like Terms in 2 Simple Steps Step 1: Identify & Group Circle or underline matching variable families: \(\underline{5x} + 4 + \underline{3x} + 1\). Step 2: Add Coefficients Add the coefficients and keep the variable the same: \((5 + 3)x + (4 + 1) = \mathbf{8x + 5}\). A Basic Combinations (Two Terms) Simplify each expression by adding like coefficients. \(6x + 3x\) Answer: \(8y + 4y\) Answer: \(9a + a\) Answer: \(3m + 8m\) Answer: \(7w + 5w\) Answer: \(5k + 2k\) Answer: B Multi-Term Expressions Group like terms together, then add to simplify. \(4x + 7 + 5x + 2\) Simplified: \(8y + 3 + 2y + 9\) Simplified: \(6a + 3b + 2a + 4b\) Simplified: \(3m + 10 + 2m + 5\) Simplified: C Think Like a Mathematician Spot the Mistake! Leo simplified \(5x + 3\) and wrote \(8x\). What mistake did Leo make? Geometry Connection A rectangle has length \(3x + 2\) and width \(x + 1\). Write a simplified expression for its perimeter. Perimeter = Algebra Fundamentals • Like Terms & Coefficients Page 2 of 2
Like Terms Answer KeyTeacher Reference Answer Key & Solutions Like Terms Answer Key Solutions • Page 1 Positive Numbers & Addition Key Teaching Tips for Beginners: • The "Invisible 1": Remind students that standalone variables like \(a\) and \(p\) have an understood coefficient of 1, not 0. • Variables Don't Change: Reinforce that adding \(6x + 3x\) gives \(9x\), not \(9x^2\). Only the coefficients add together. Part 1: Parts of an Expression Solutions 1 pt per blank (16 pts total) Expression Terms Variables Coefficients Constants \(4x + 9\) (Ex.) \(4x, 9\) \(x\) 4 9 \(8m + 3\) \(8m, 3\) \(m\) 8 3 \(5y + 2x + 7\) \(5y, 2x, 7\) \(x, y\) 5, 2 7 \(a + 6b + 11\) \(a, 6b, 11\) \(a, b\) 1, 6 11 \(p + 14\) \(p, 14\) \(p\) 1 14 Part 2: Recognizing Like Terms Solutions 7 pts total Are They Like Terms? (4 pts) \(3x\) and \(8x\) YES (same variable \(x\)) \(5a\) and \(5b\) NO (different variables \(a \neq b\)) \(4y\) and \(11y\) YES (same variable \(y\)) \(7\) and \(12\) YES (both are constants) Sorted Term Bank Families (3 pts) Original bank: \(6x, 4, 2y, 9x, 15, y\) "x" Family \(6x, 9x\) "y" Family \(2y, y\) Constants \(4, 15\) Algebra Fundamentals • Like Terms Answer Key Page 1 of 2 Teacher Reference Part 3: Combining Like Terms Solutions Page 2 Page 2 Points Available: 12 Points Total Part A: 6 pts (1 ea) Part B: 4 pts (1 ea) Part C: 2 pts (1 ea) A. Basic Combinations (6 Problems) \(6x + 3x\) \(= 9x\) \(8y + 4y\) \(= 12y\) \(9a + a\) \(= 10a\) (\(a = 1a\)) \(3m + 8m\) \(= 11m\) \(7w + 5w\) \(= 12w\) \(5k + 2k\) \(= 7k\) B. Multi-Term Expressions (4 Problems) \(4x + 7 + 5x + 2\) Grouping: \((4x + 5x) + (7 + 2)\) \(= 9x + 9\) \(8y + 3 + 2y + 9\) Grouping: \((8y + 2y) + (3 + 9)\) \(= 10y + 12\) \(6a + 3b + 2a + 4b\) Grouping: \((6a + 2a) + (3b + 4b)\) \(= 8a + 7b\) \(3m + 10 + 2m + 5\) Grouping: \((3m + 2m) + (10 + 5)\) \(= 5m + 15\) C. Application & Error Analysis Solutions Spot the Mistake (Leo's Work): Exemplar Answer: Leo attempted to add a variable term (\(5x\)) with a plain constant number (\(3\)). Because they do not have the same variable part, they are unlike terms and cannot be combined. The expression is already fully simplified as \(5x + 3\). Geometry Connection (Perimeter): Work & Answer: \(\text{Perimeter} = 2(\text{length}) + 2(\text{width})\) \(= (3x + 2) + (3x + 2) + (x + 1) + (x + 1)\) \(= (3x + 3x + x + x) + (2 + 2 + 1 + 1)\) \(= \mathbf{8x + 6}\) units. Algebra Fundamentals • Like Terms Answer Key Page 2 of 2