A detailed teacher script for the Double-Digit Dash lesson, featuring clear 'mic' prompts for speaking and 'action' boxes for instructional steps.
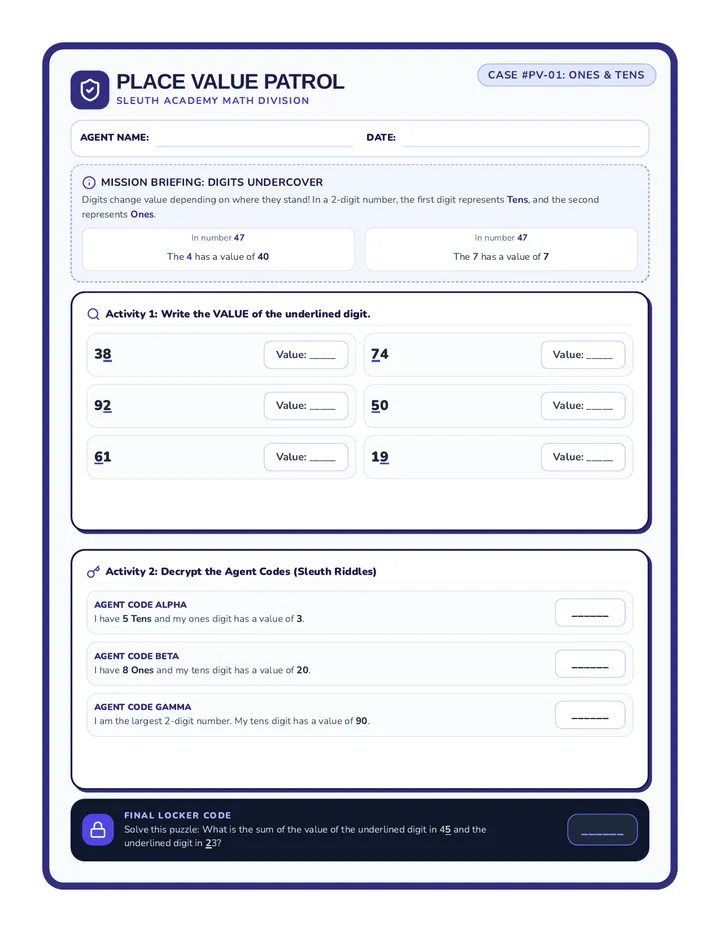
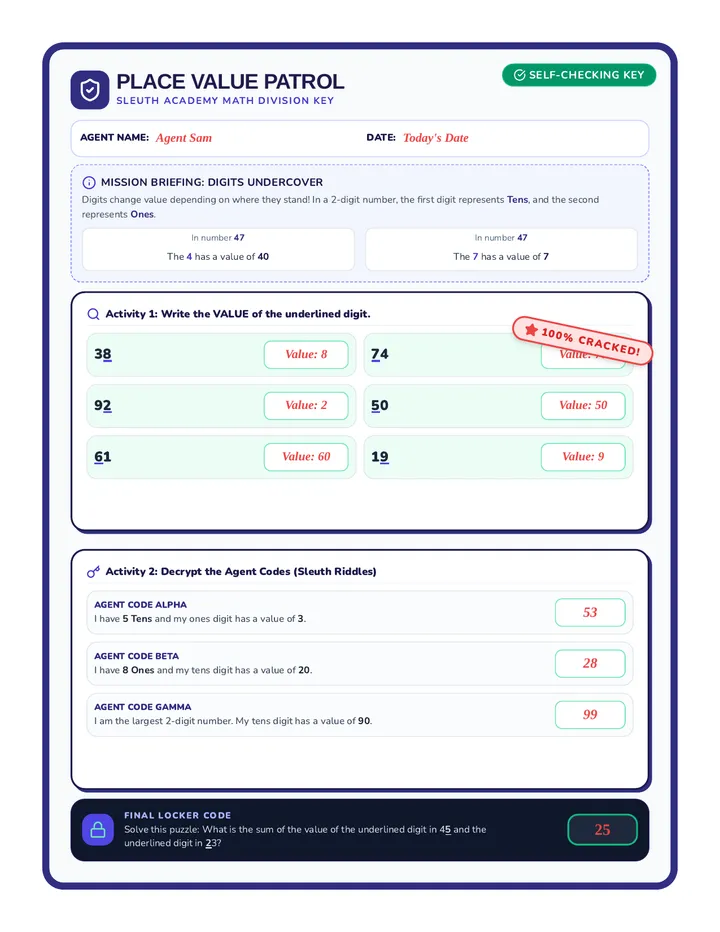
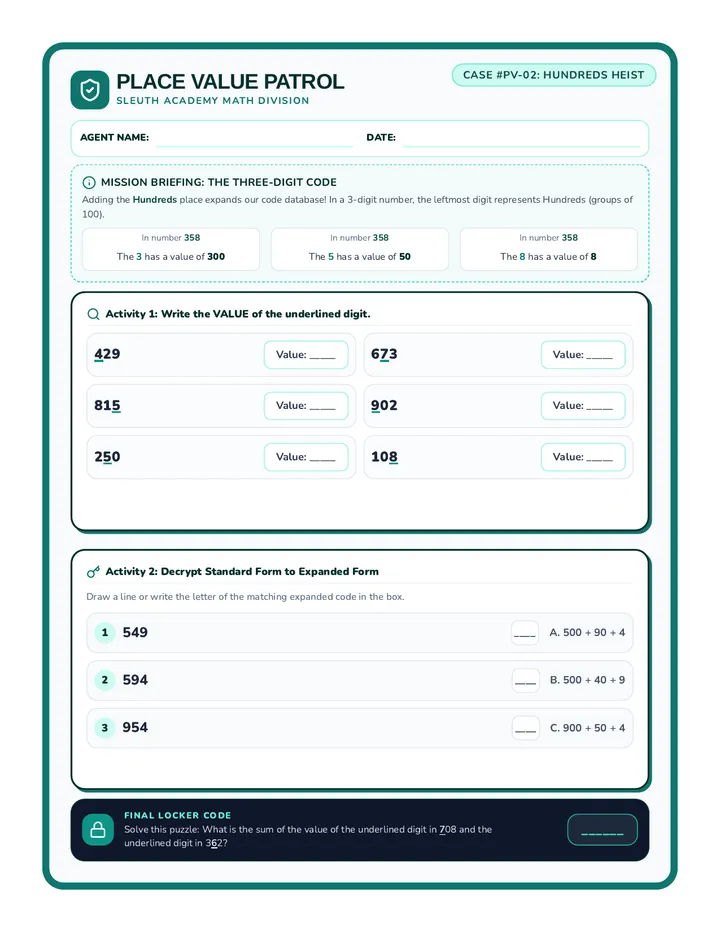
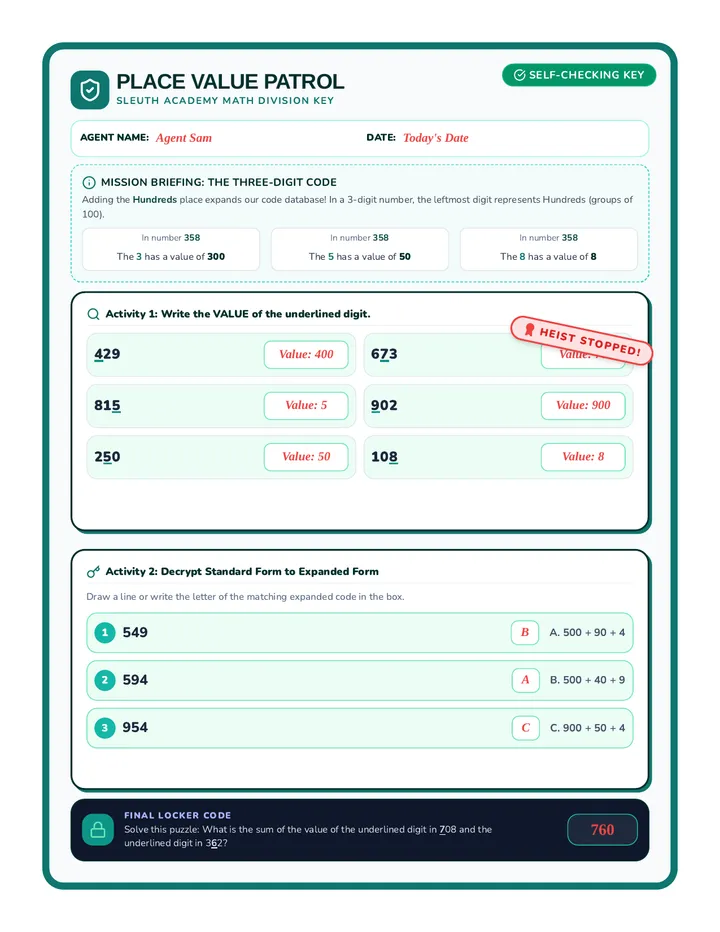
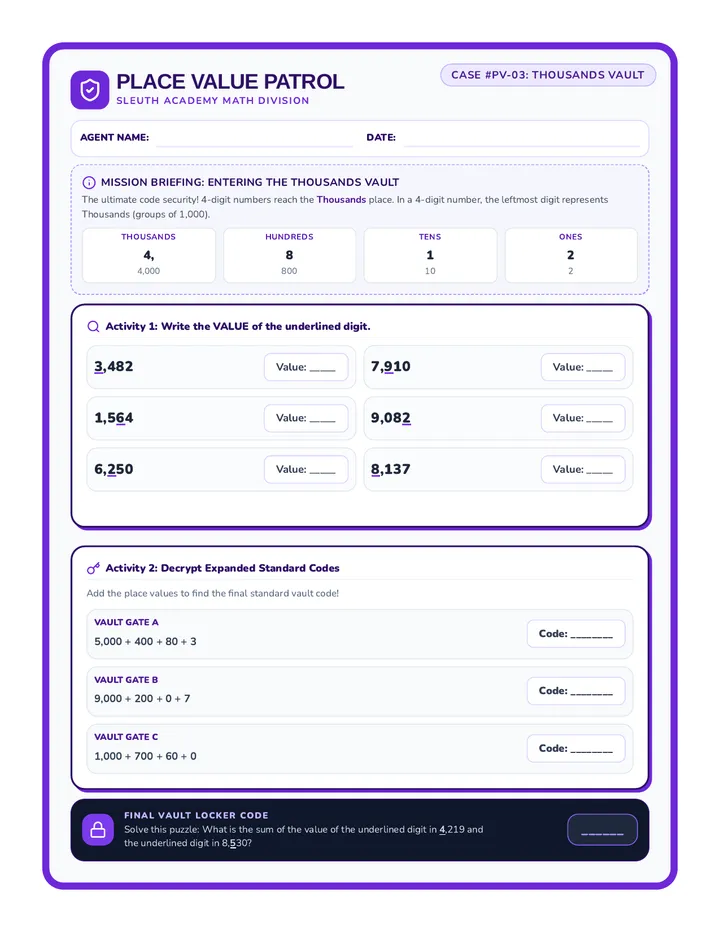
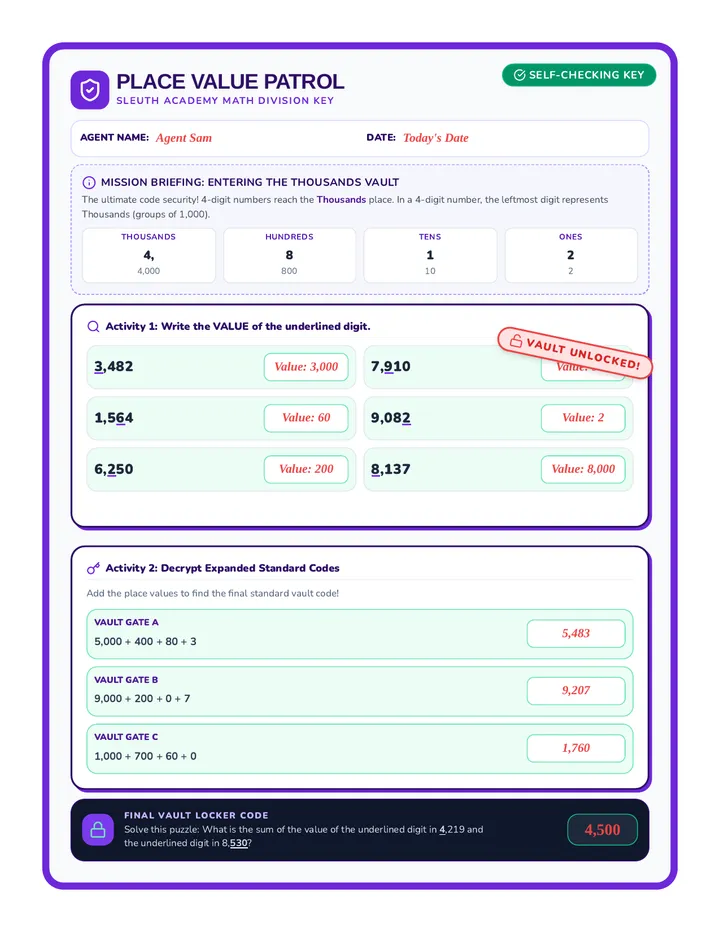
A math place value unit focusing on identifying digit values through the thousands place with interactive detective-themed worksheets and puzzles.
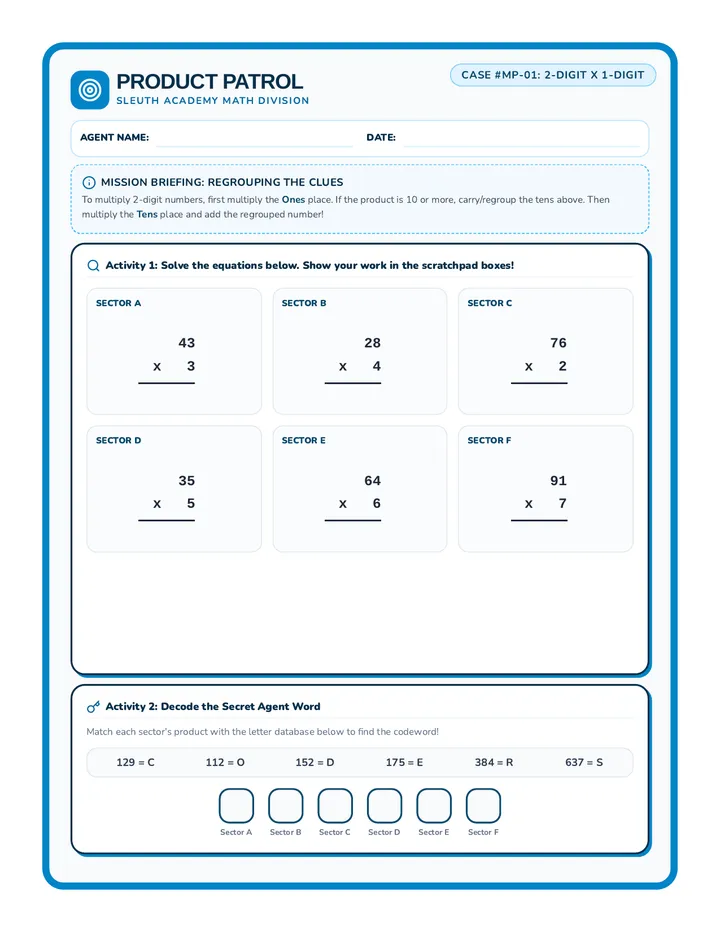
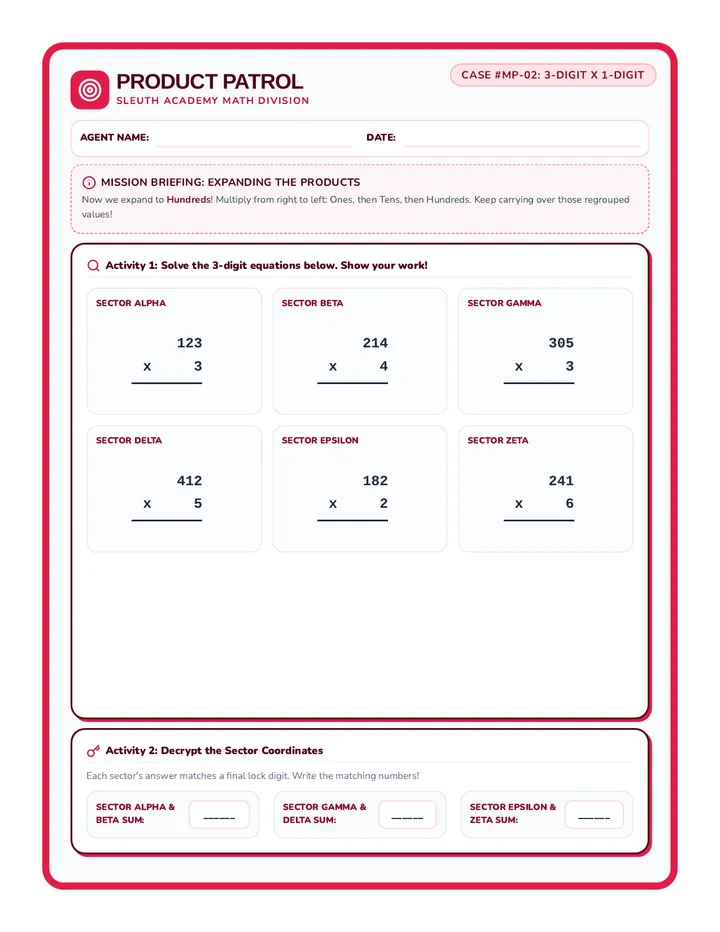
A practical multi-digit multiplication lesson where students solve 2-digit by 1-digit and 3-digit by 1-digit equations using engaging spy-agency themes and mystery puzzles.
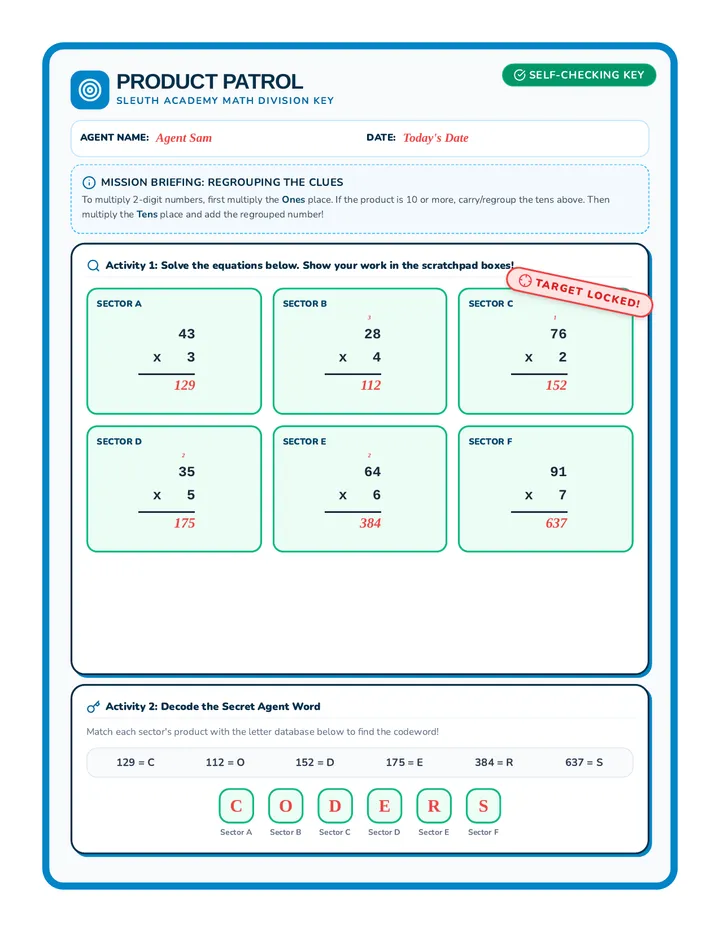
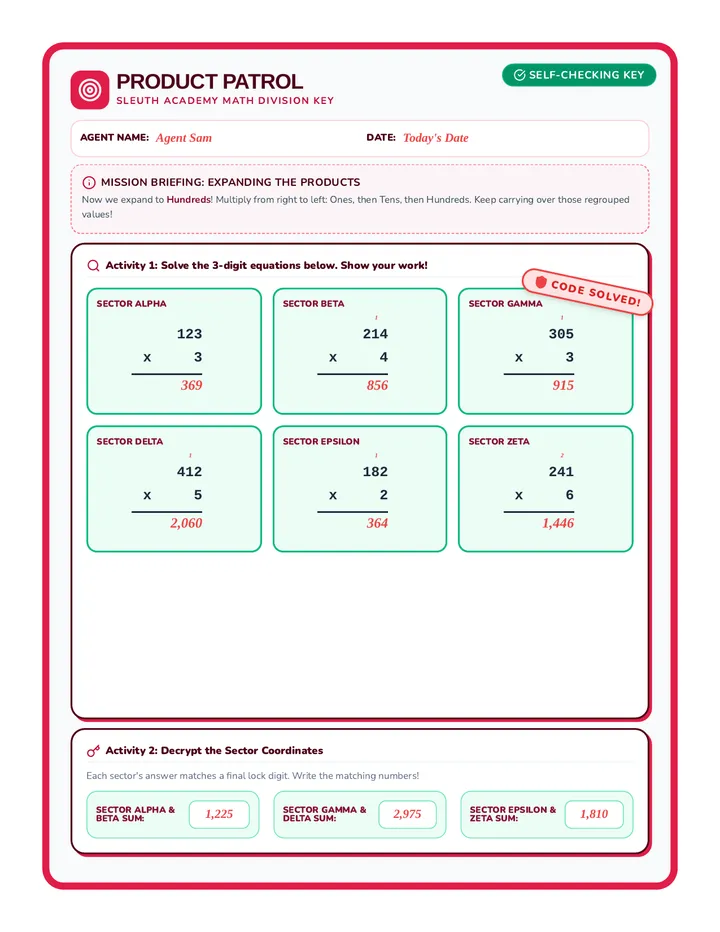
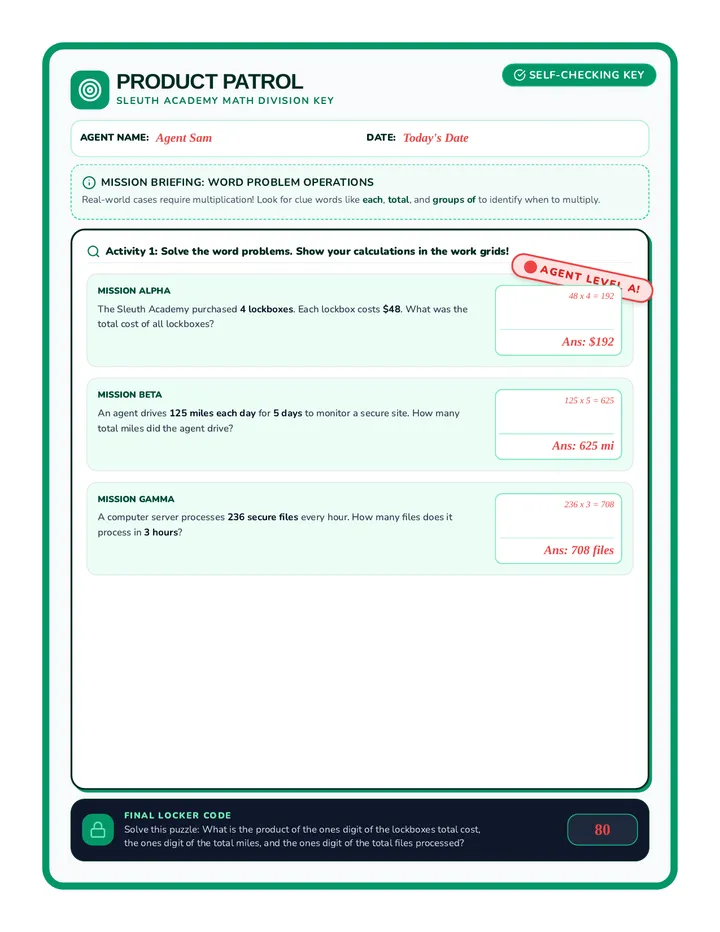
A child-friendly, self-checking answer key for the Multi Digit Worksheet. It displays correct answers in red handwriting style with detective-themed grade stamp.
A high-intensity, 120-minute math simulation. Students act as lead consultants, completing a high-speed skill warmup before selecting a professional sector (Music, Urban Planning, Rocket Science, or Sports Analytics) to solve a series of complex work orders.
A progressive place value lesson where students identify the value of digits in ones, tens, hundreds, and thousands using interactive secret-agent themed math worksheets.
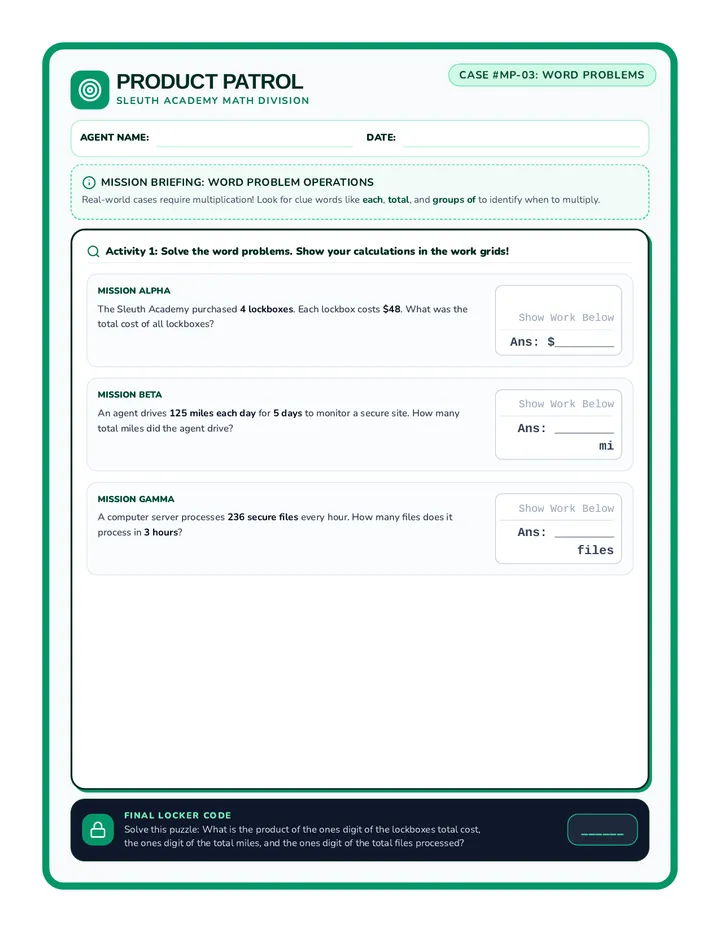
A student-facing math worksheet focusing on word problems for 2-digit and 3-digit by 1-digit multiplication. Includes beautiful, spacious scratchpad boxes for student work.
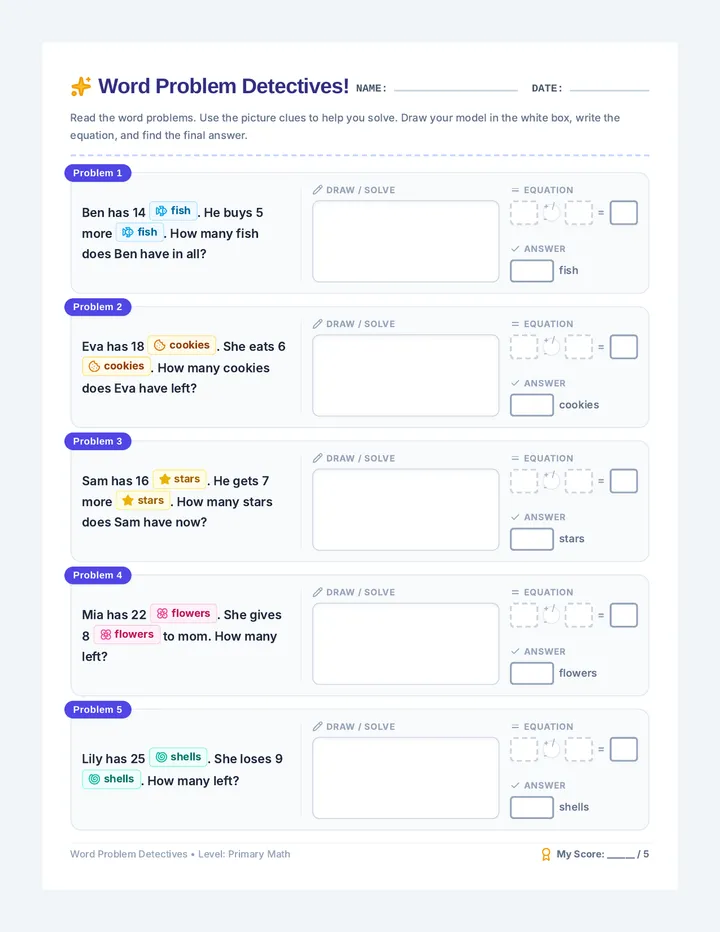
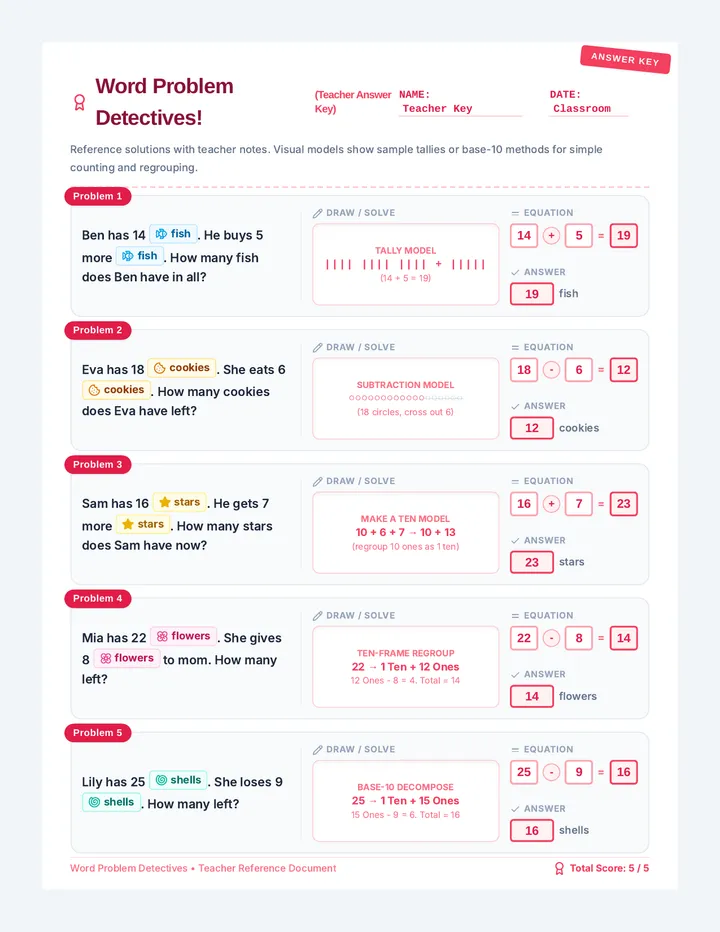
A primary math unit designed to build confidence in solving one-step addition and subtraction word problems. The sequence combines engaging visual cues, scaffolded modeling spaces, and explicit transition strategies between concrete and abstract math representation.
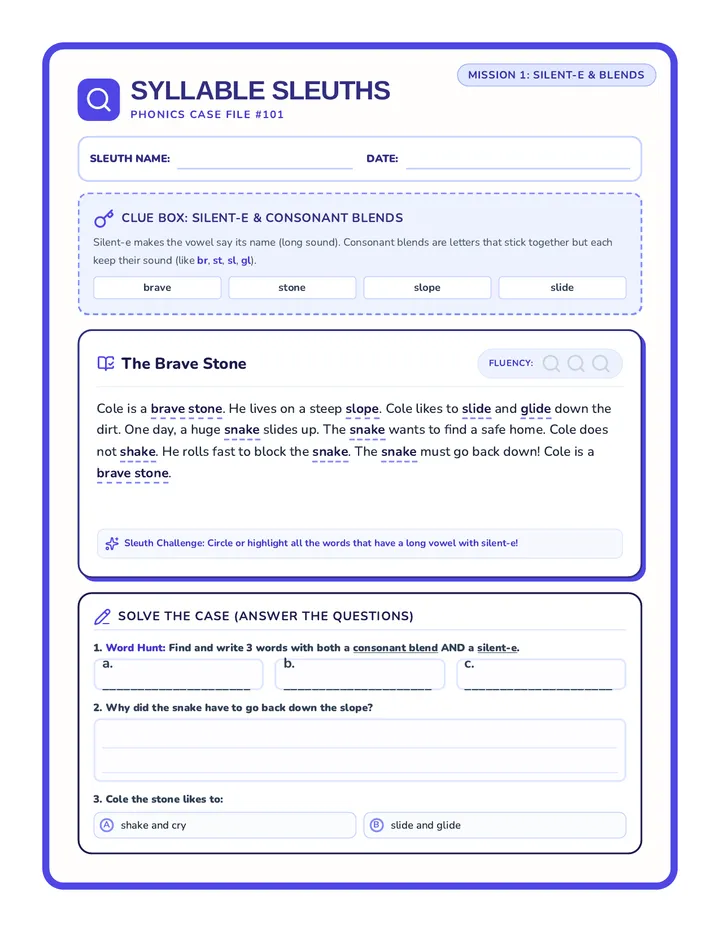
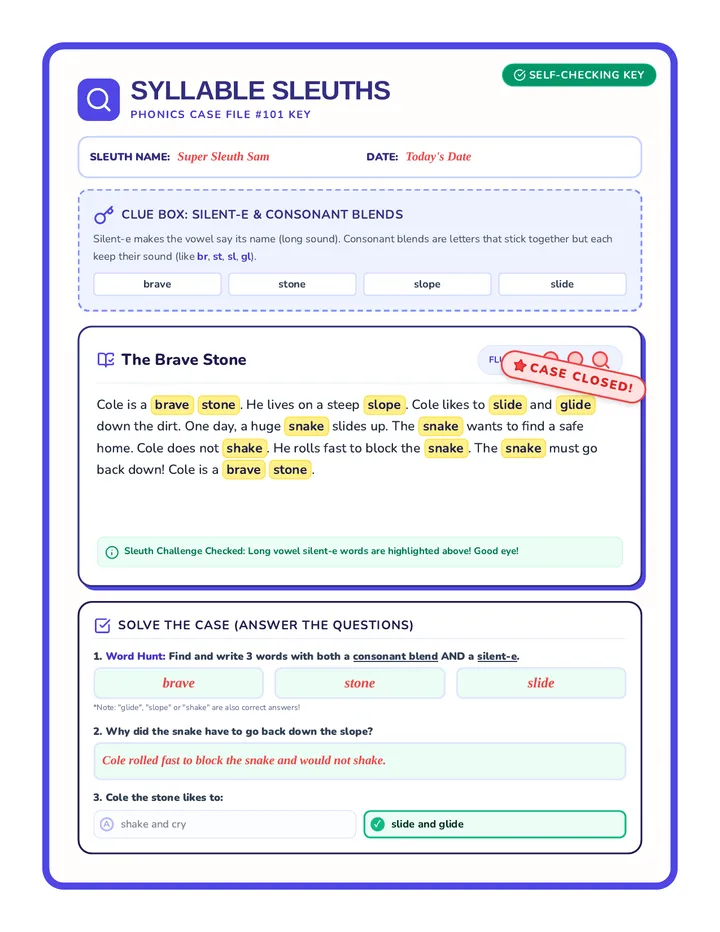
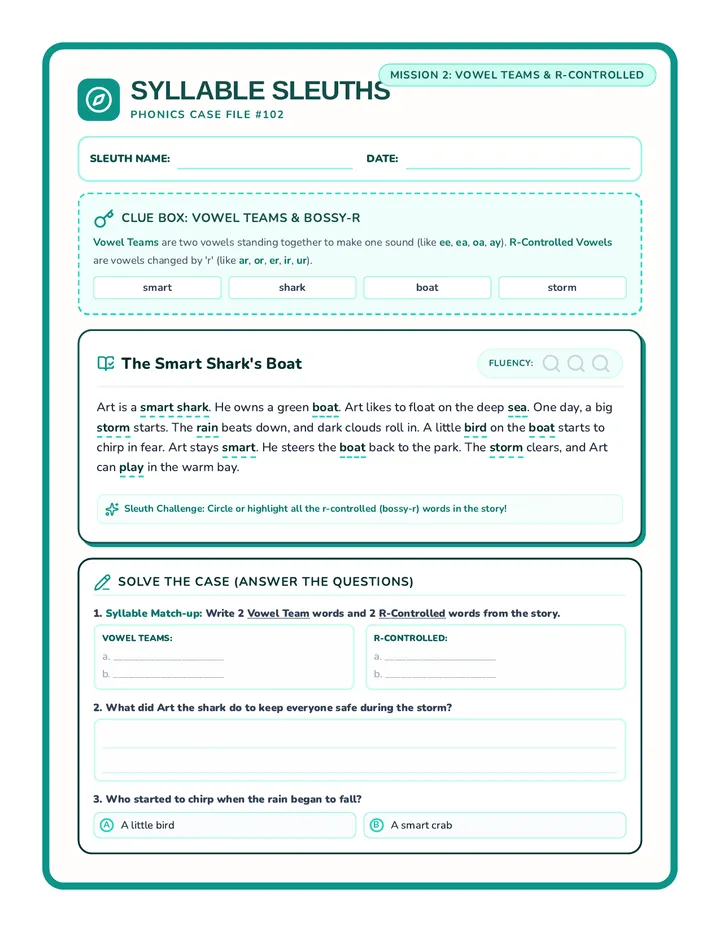
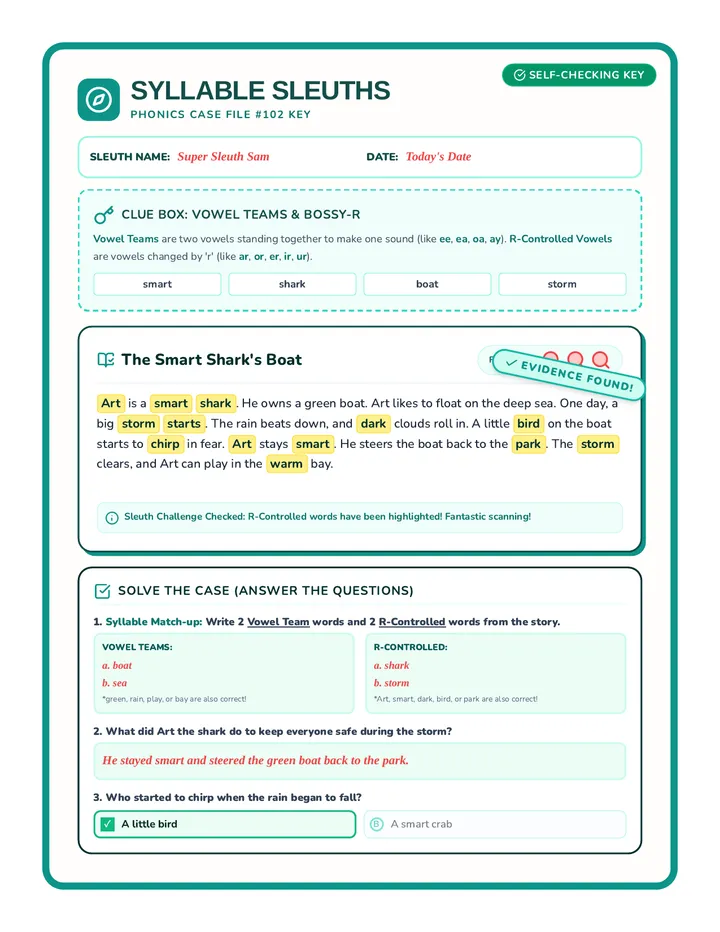
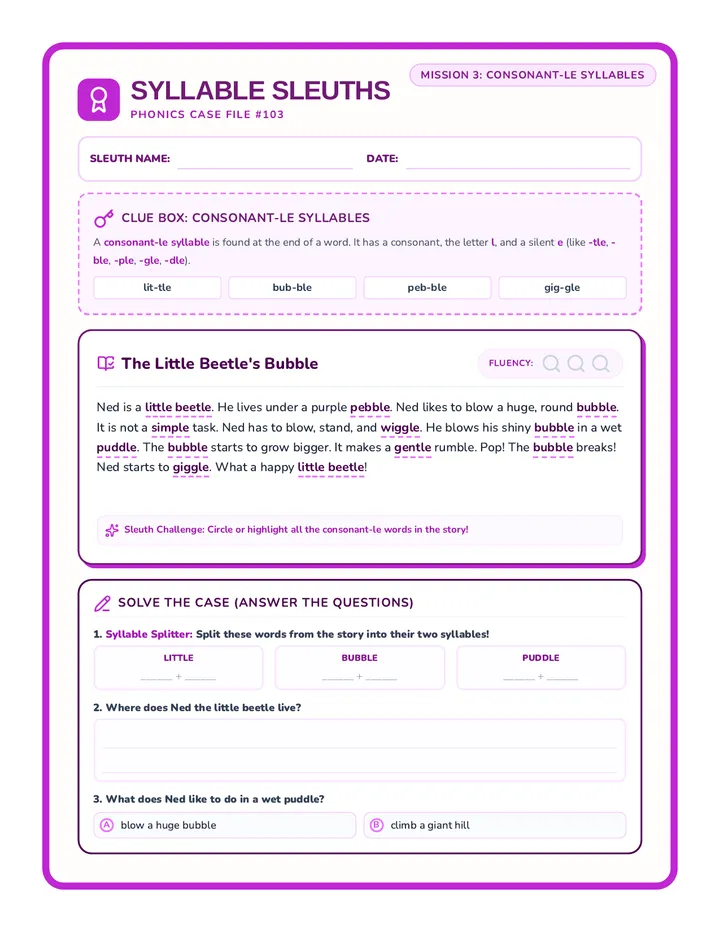
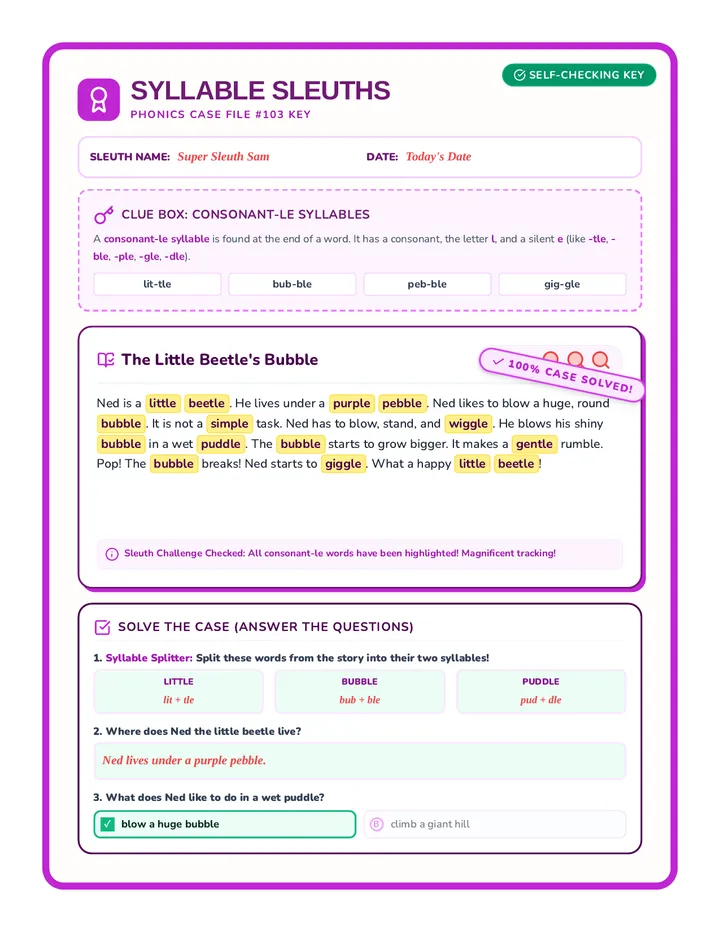
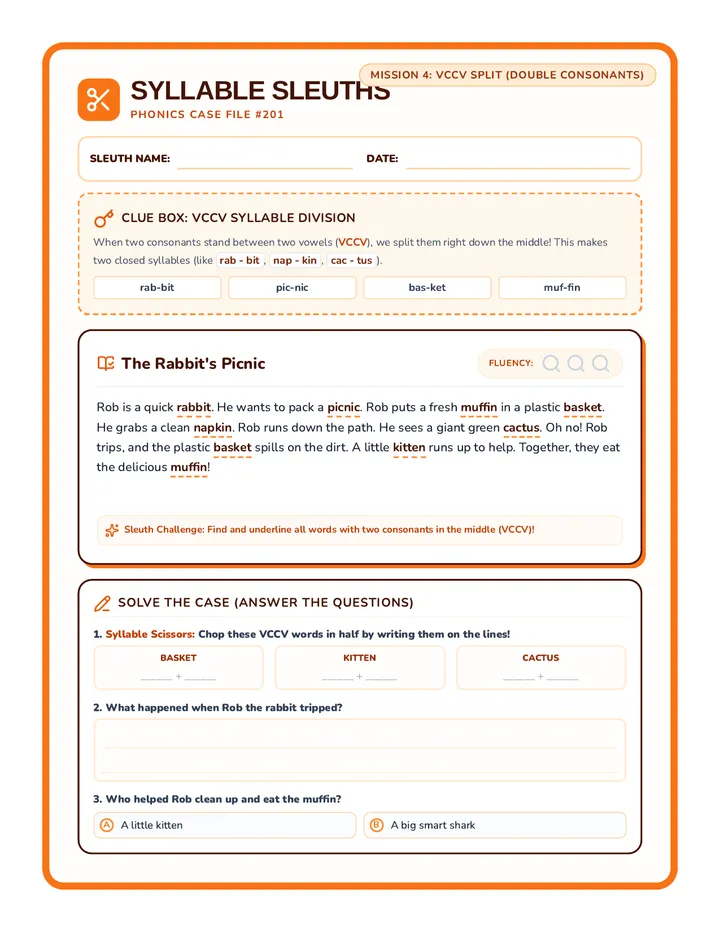
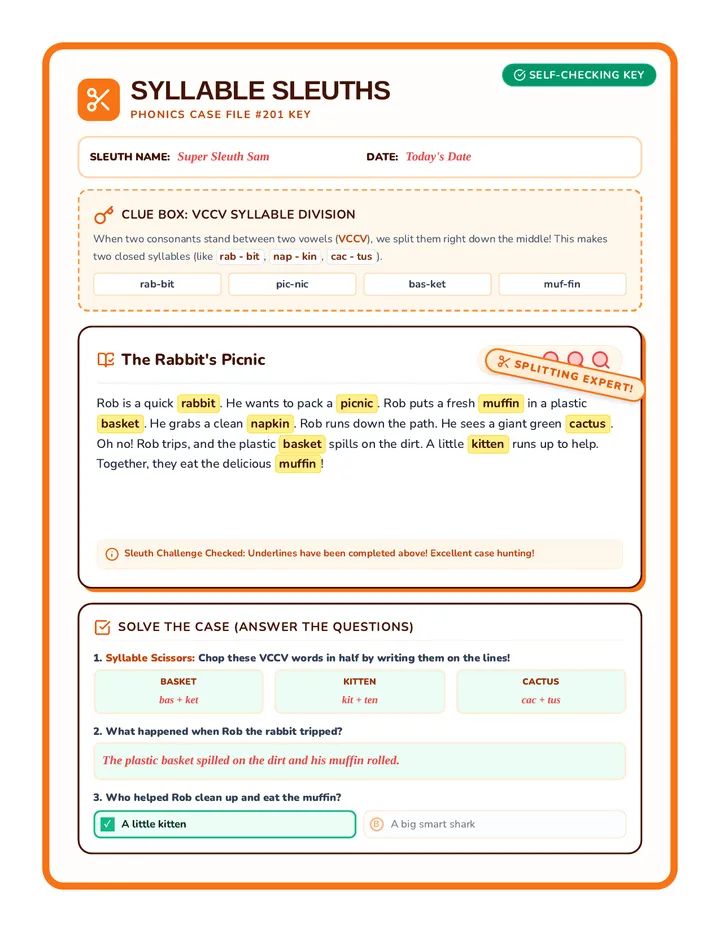
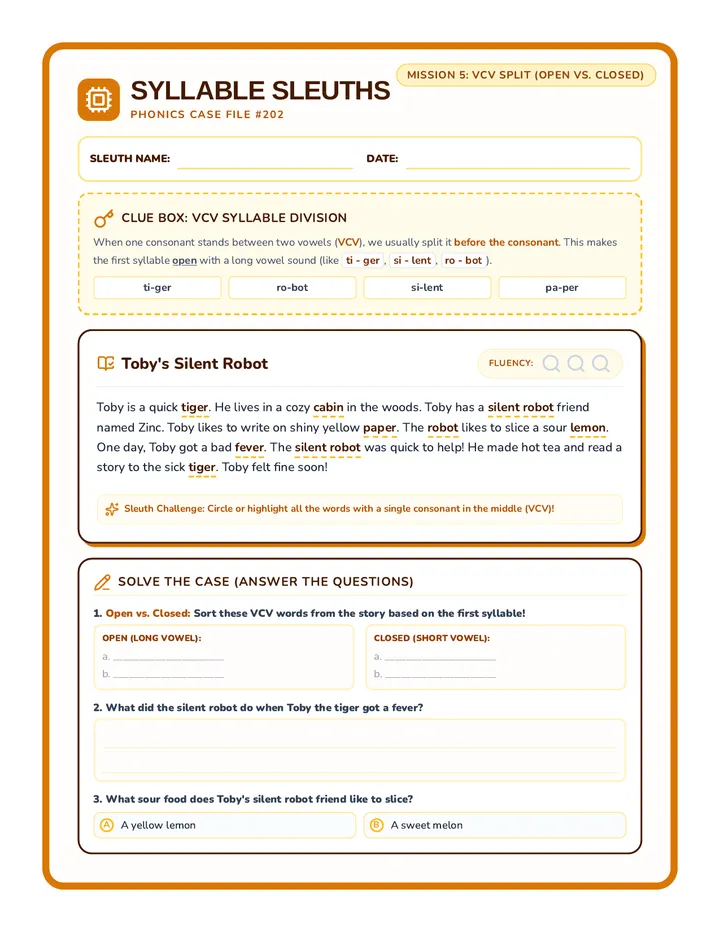
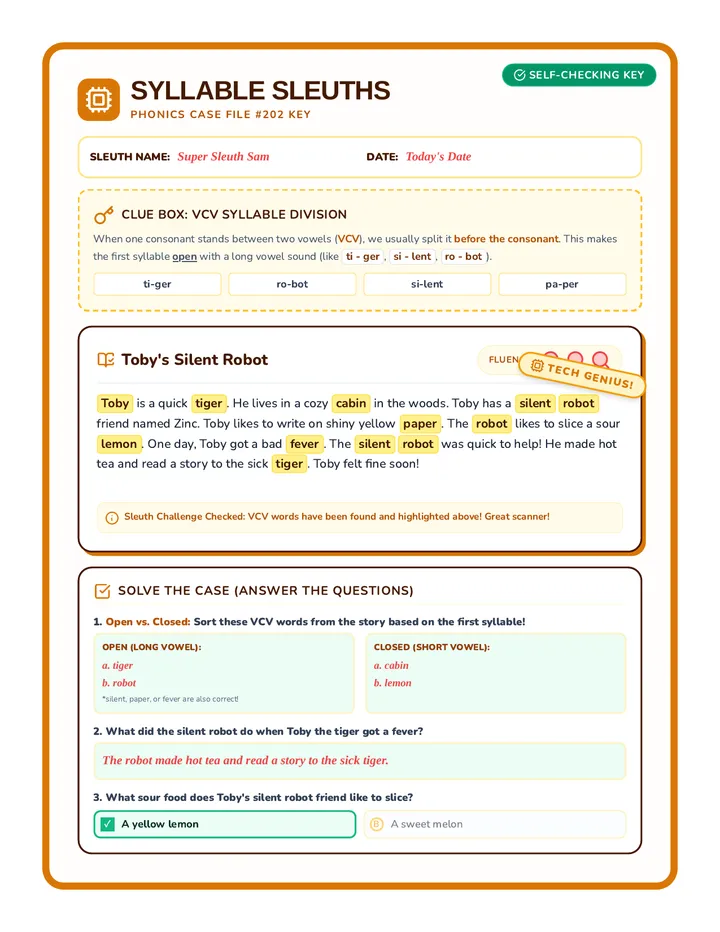
A structured, multi-part phonics intervention lesson focusing on compound words and syllable division rules (VCCV, VCV) for decoding 2-syllable and 3-syllable words.
A child-friendly, self-checking answer key for the Triple Digit Worksheet. It displays correct answers in red handwriting style with detective-themed grade stamp.
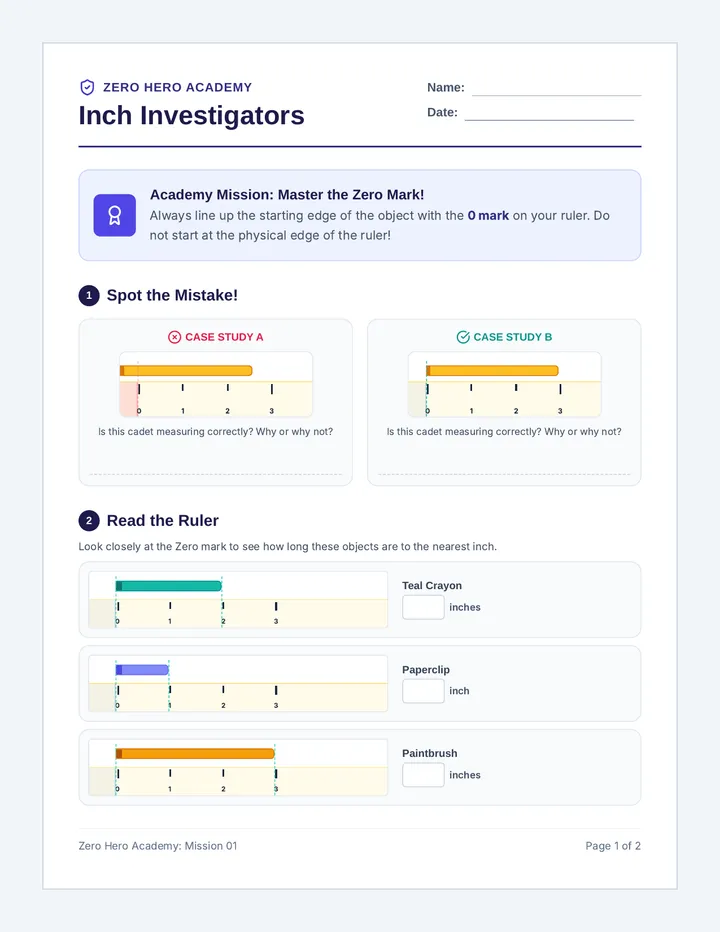
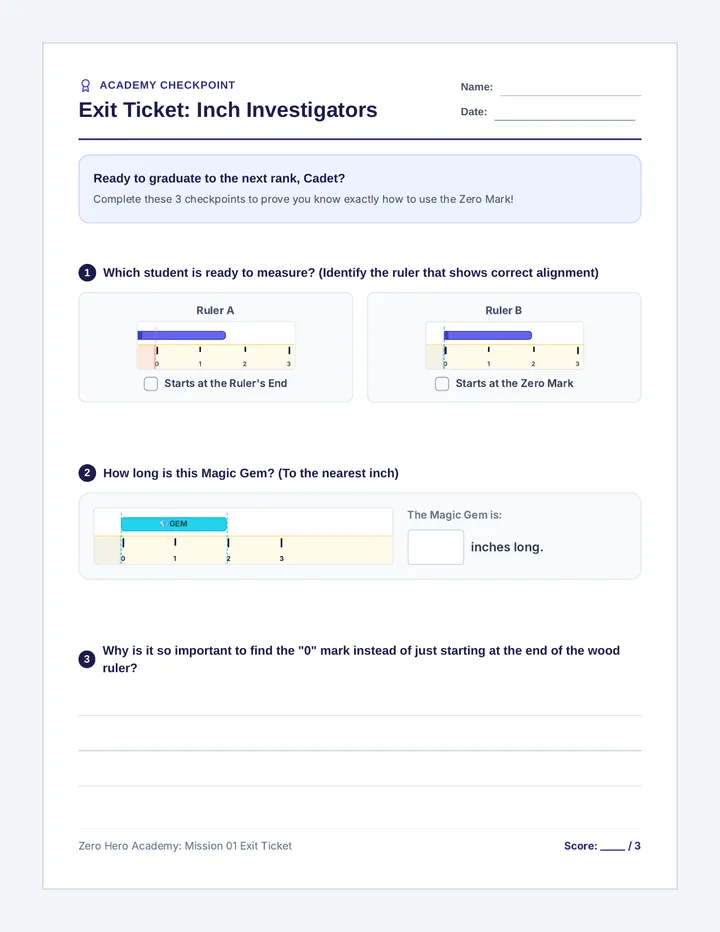
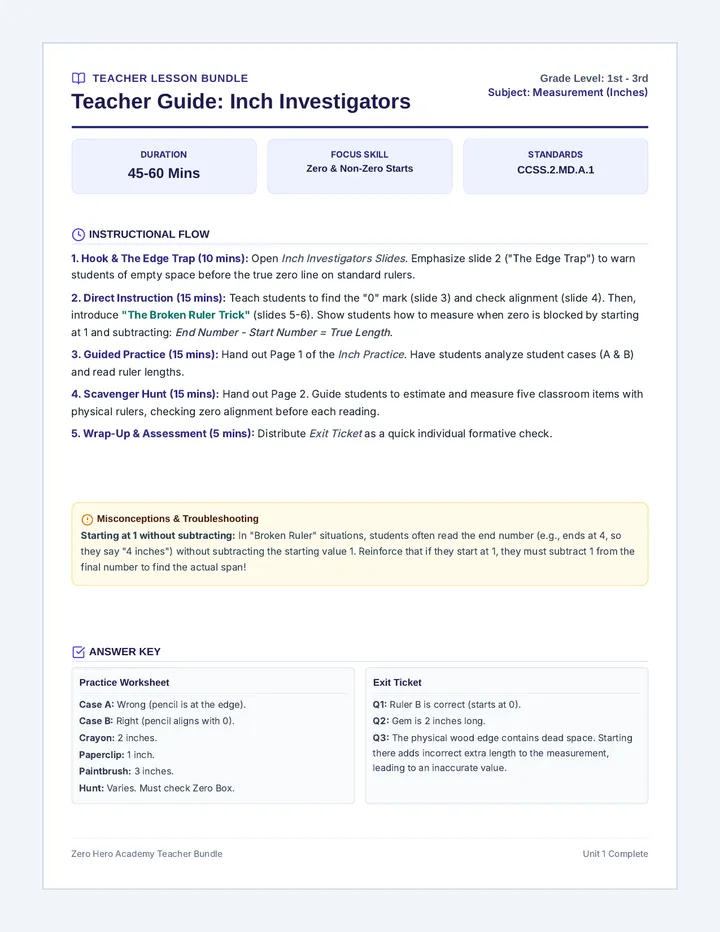
A two-part measuring adventure where students join the Zero Hero Academy to master measuring in inches and centimeters, with a strong focus on aligning the start of objects with the ruler's zero mark.
A 4-week math workbook and instructional sequence themed around outer space exploration, specifically designed for middle school students with disabilities (SWDs) working at an early 1st-grade level. Features embedded touch-points, base-ten icons, visual number paths, and age-appropriate space exploration visuals to teach single-digit operations, place value, and patterns.