Engaging slide presentation for the lesson including video embedding, warm-up reveal, and clear instructions for the Boss Battle activity. Uses a high-contrast dark theme.
A comprehensive summer bridge workbook for rising 8th graders transitioning to Algebra 1. Contains review of prerequisite topics, advanced pre-algebra skills, real-world application, and an Algebra Escape Challenge.
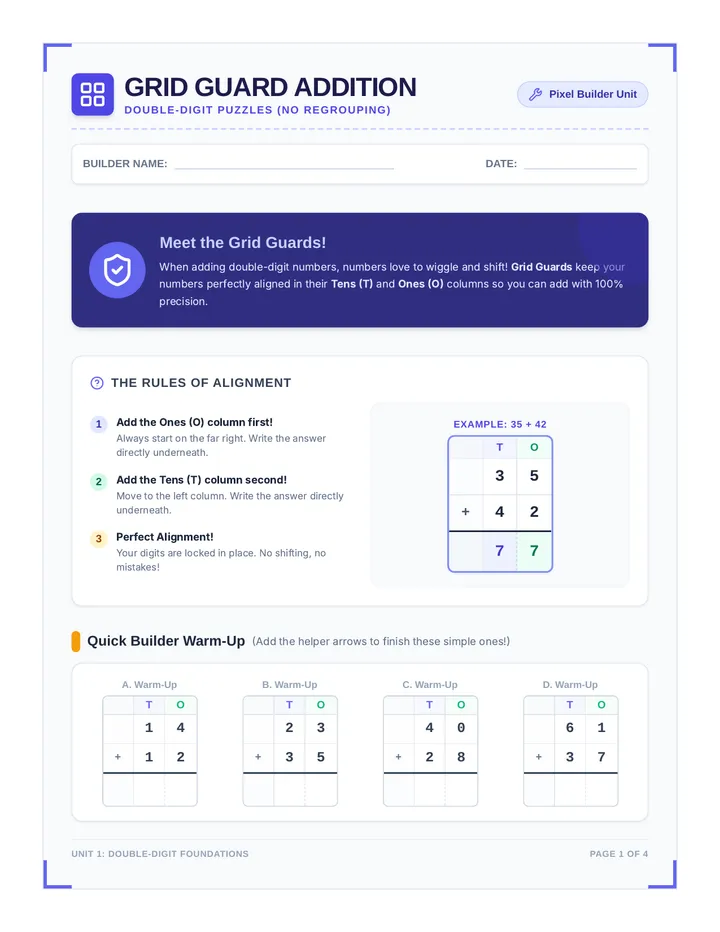
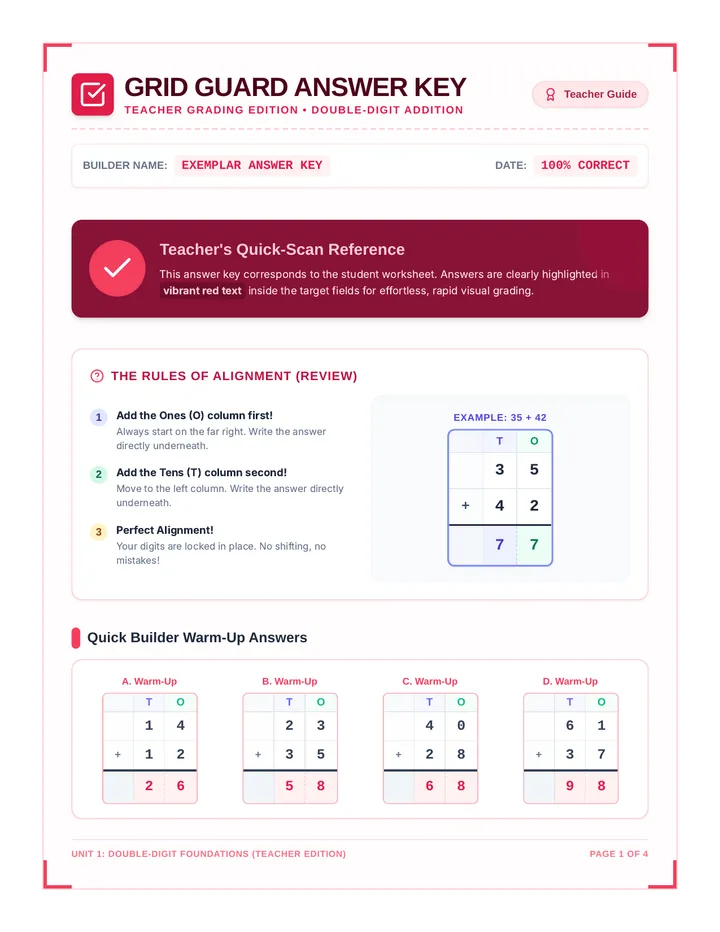
A targeted lesson on 2-digit addition without regrouping, featuring grid lines and structured boxes to prevent number shifting and alignment errors. Includes a comprehensive student worksheet packet and a matching teacher answer key.
A matching 4-page teacher answer key for the Grid Guard Worksheet Packet. Contains the exact same grid layouts and problem sets, with all correct answers and student setups filled in in a clear, contrasting pink-red teacher edition style for rapid grading.
A high-intensity, 120-minute math simulation. Students act as lead consultants, completing a high-speed skill warmup before selecting a professional sector (Music, Urban Planning, Rocket Science, or Sports Analytics) to solve a series of complex work orders.
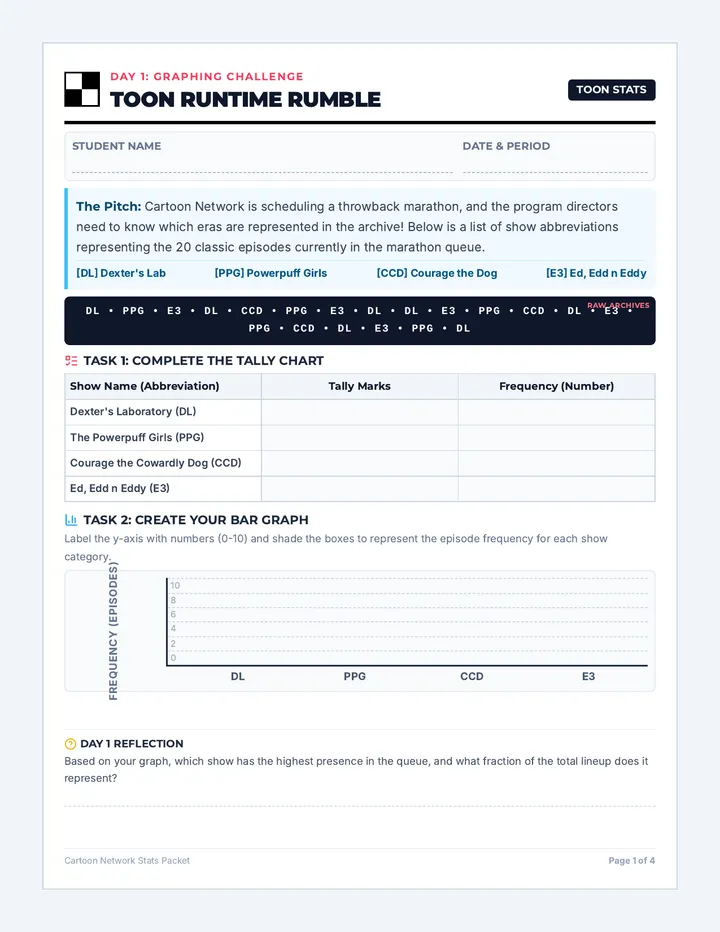
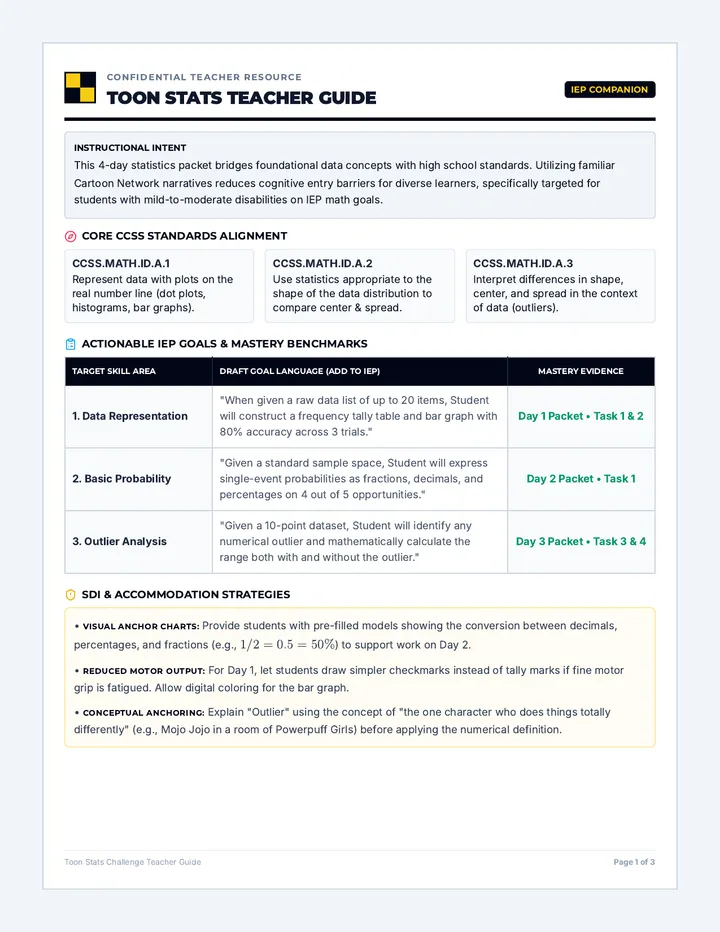
A four-day statistics packet using Cartoon Network shows to teach tallying, graphing, probability, range, and outliers, complete with a comprehensive teacher guide for IEP tracking.
A 4-page highly structured student worksheet packet focusing on 2-digit addition without regrouping. Uses a friendly pixel-builder theme with complete grid alignments, progressive scaffolding, and word problems with custom workspace grids.
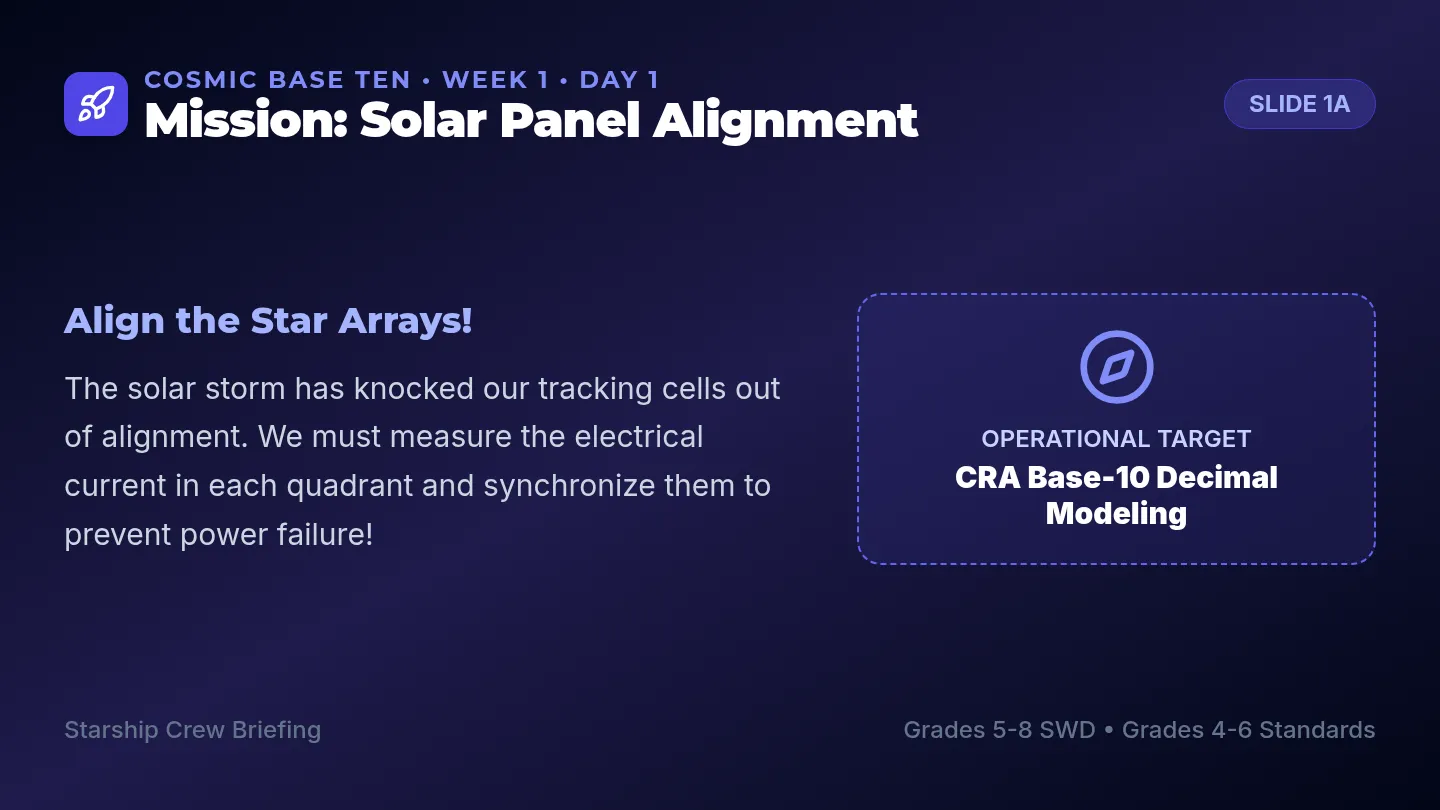
A 4-week math workbook and instructional sequence themed around outer space exploration, specifically designed for middle school students with disabilities (SWDs) working at an early 1st-grade level. Features embedded touch-points, base-ten icons, visual number paths, and age-appropriate space exploration visuals to teach single-digit operations, place value, and patterns.
A practical vocational math lesson where students learn to calculate daily earnings by multiplying hours worked by hourly wages. Designed with real-world job-card contexts and supported by structured visual skip-counting.
A comprehensive three-page teacher guide and answer key for the Toon Stats Challenge. Page 1 details IEP alignment and accommodation trackers; Page 2 provides standard-aligned keys for Day 1 and 2; Page 3 provides keys for Day 3 and 4. This version features larger, clearer text sizes.
A 4-week intensive math intervention program set in a space exploration universe, designed for multi-grade students with disabilities in Grades 5–8. It covers additive thinking, place value, and decimal regrouping, anchored in Grades 4–6 standards with a Grade 5 core middle ground.
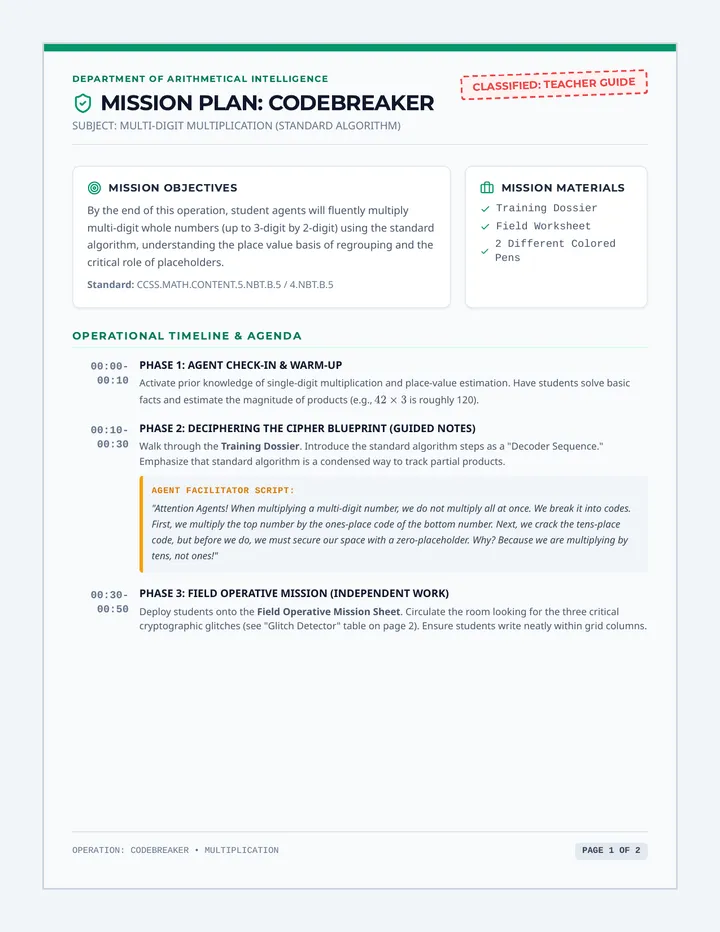
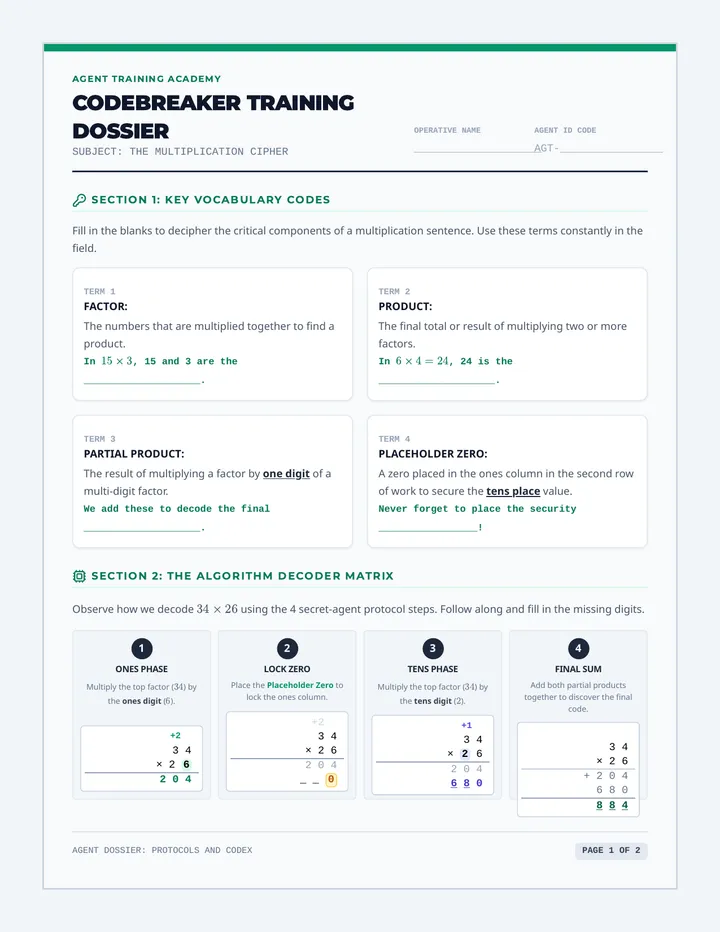
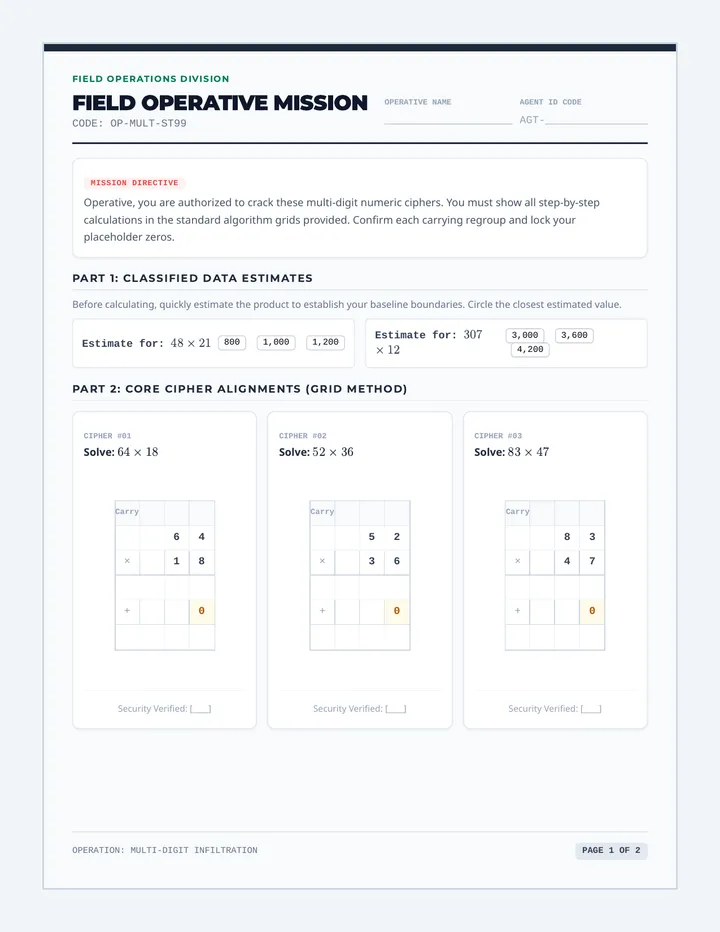
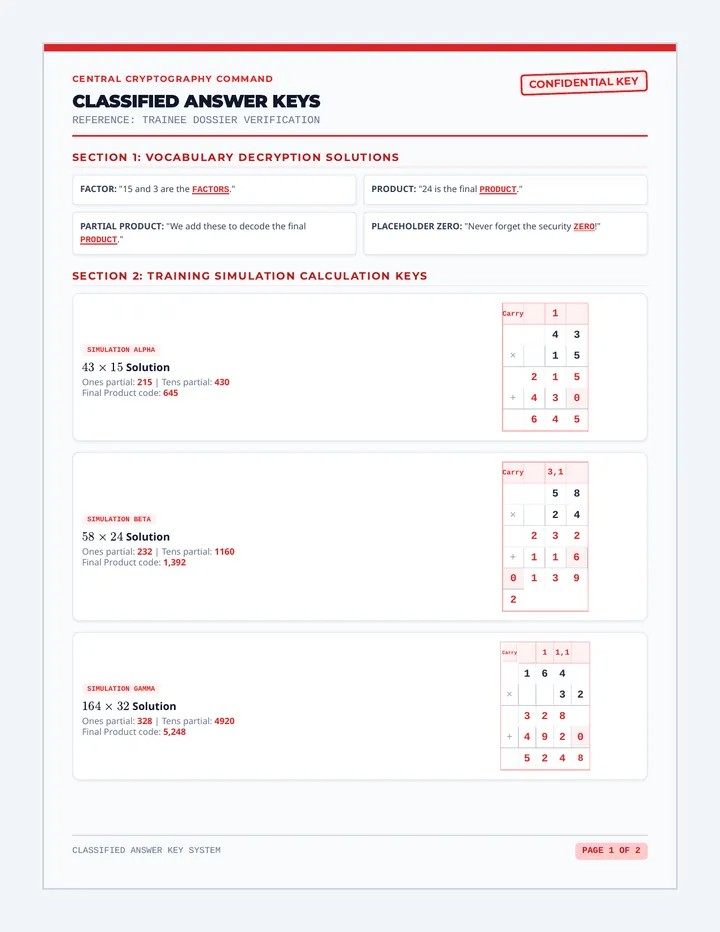
A covert-agent themed math lesson focusing on mastering the multi-digit whole number multiplication standard algorithm. Students step into the shoes of cryptography agents to learn, practice, and apply regrouping procedures.
A four-day printable student worksheet packet themed around Cartoon Network shows. Covers tallying and bar graphs on Day 1, probability and likelihood on Day 2, range and outliers on Day 3, and a cumulative review assessment on Day 4. This version features further increased text sizes (sm and base) for maximum readability and accessibility.