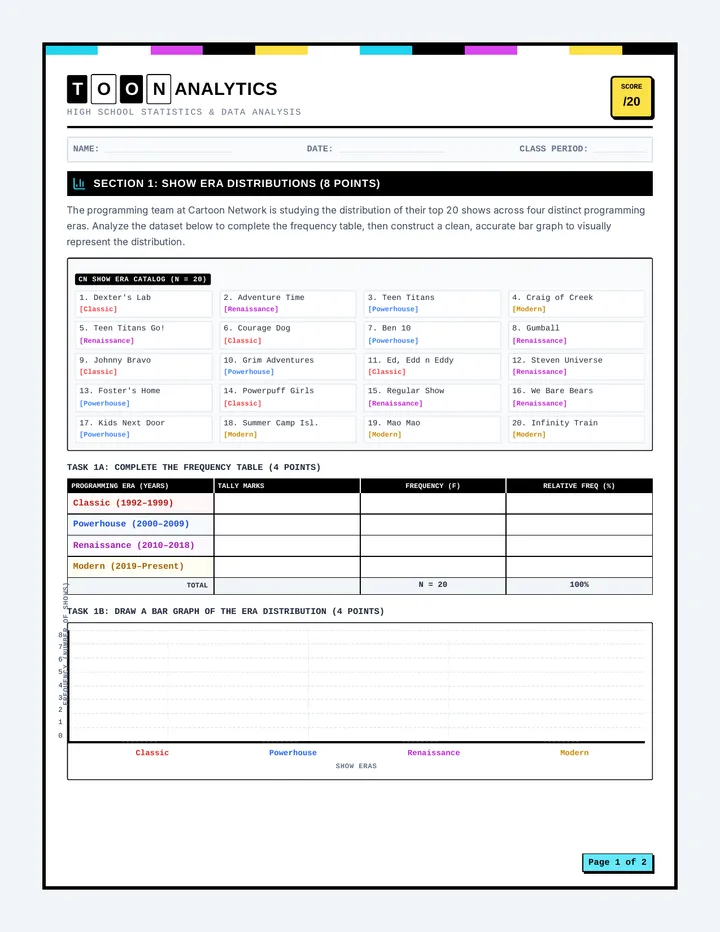
Students use dot plots and box plots to visually assess the overlap and separation between two data distributions, developing the vocabulary to describe population differences.
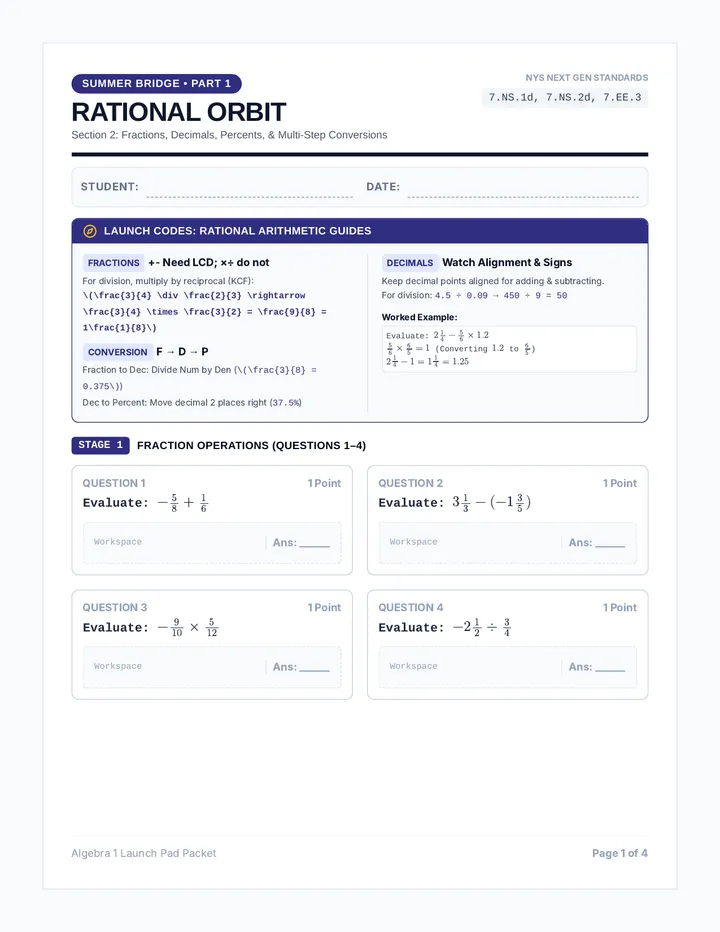
A comprehensive summer bridge workbook for rising 8th graders transitioning to Algebra 1. Contains review of prerequisite topics, advanced pre-algebra skills, real-world application, and an Algebra Escape Challenge.
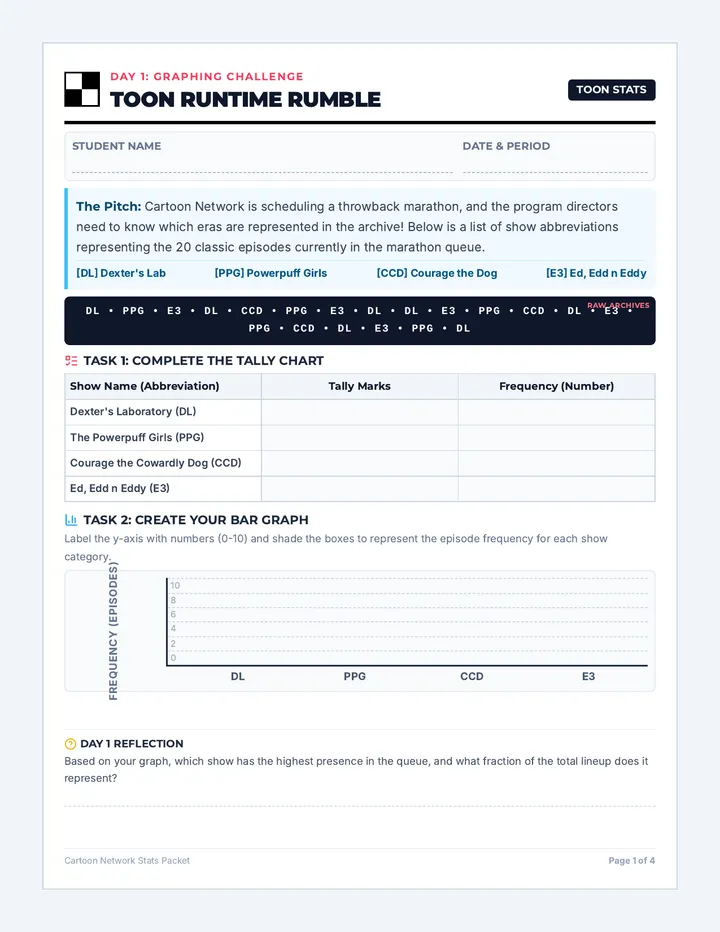
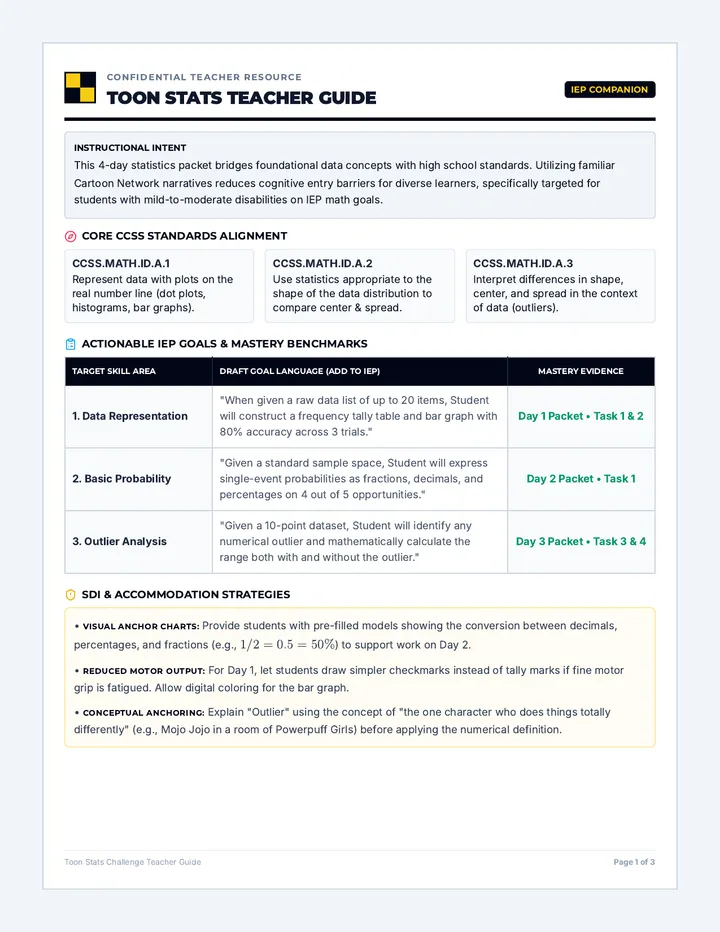
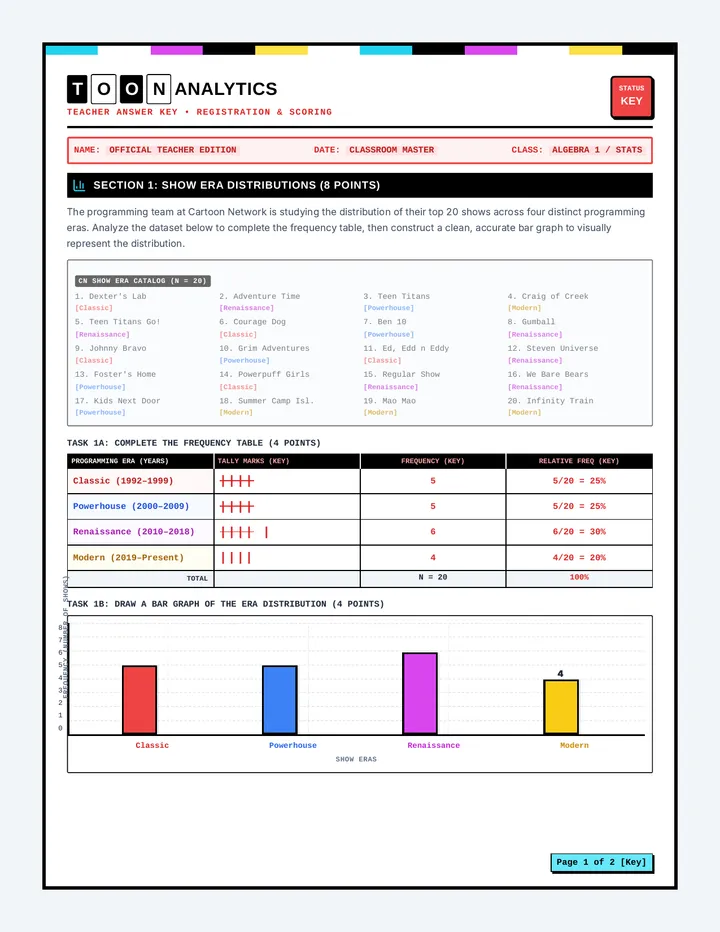
A four-day statistics packet using Cartoon Network shows to teach tallying, graphing, probability, range, and outliers, complete with a comprehensive teacher guide for IEP tracking.
A comprehensive three-page teacher guide and answer key for the Toon Stats Challenge. Page 1 details IEP alignment and accommodation trackers; Page 2 provides standard-aligned keys for Day 1 and 2; Page 3 provides keys for Day 3 and 4. This version features larger, clearer text sizes.
A high-intensity, 120-minute math simulation. Students act as lead consultants, completing a high-speed skill warmup before selecting a professional sector (Music, Urban Planning, Rocket Science, or Sports Analytics) to solve a series of complex work orders.
A practical vocational math lesson where students learn to calculate daily earnings by multiplying hours worked by hourly wages. Designed with real-world job-card contexts and supported by structured visual skip-counting.
A four-day printable student worksheet packet themed around Cartoon Network shows. Covers tallying and bar graphs on Day 1, probability and likelihood on Day 2, range and outliers on Day 3, and a cumulative review assessment on Day 4. This version features further increased text sizes (sm and base) for maximum readability and accessibility.
A high school statistics lesson that applies concepts of data representation, probability, and outlier analysis to Cartoon Network shows across different eras.
A printable set of 8 vocational job-card task cards for student stations. Each card presents a distinct workplace scenario with clear numbers and visual guides to support independent double-digit skip-counting and wage calculations.
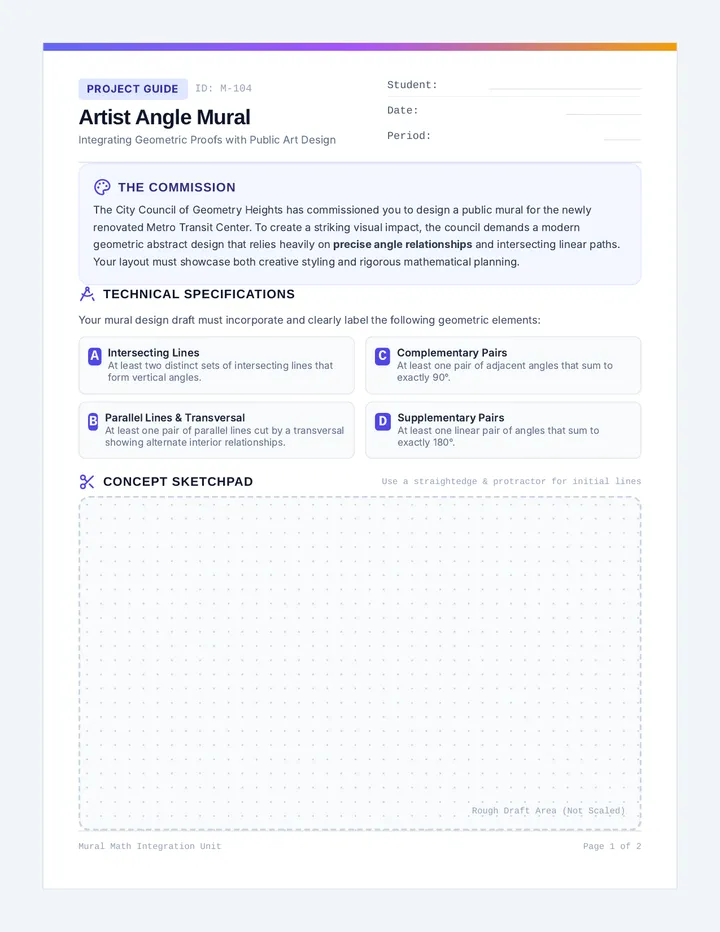
A curriculum sequence combining math, art, and drafting to explore geometric scale, spatial relationships, and coordinate systems in design.
The second part of the Algebra 1 Summer Bridge Packet. It covers functions & patterns, linear relationships, geometric foundations, statistics & probability, and an advanced Algebra 1 preview.
A comprehensive 7-slide presentation that introduces hourly wage calculations using real-world vocational scenarios. Designed with a retro industrial clipboard theme, featuring bold graphics, clear icons, and visual skip-counting tracks. All slide text elements are strictly 24px or larger.