Transformation Quest Slides
A high-energy 16:9 slide deck for reviewing transformations. Includes a title slide, warm-up instructions, an embedded review video with pause-and-solve challenges, and a briefing for the 'Mystery Map' collaborative activity. Updated with improved font sizes and accessibility.
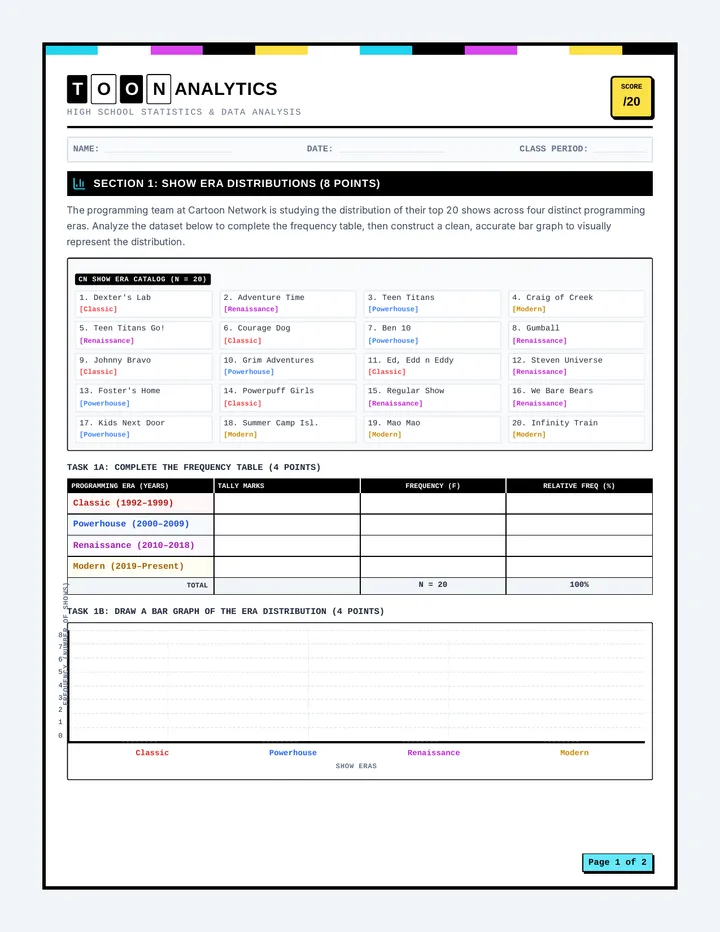
Mystery Map Worksheet
A student-facing coordinate grid worksheet for the Mystery Map activity. Students apply a series of four transformations to find a final 'treasure' coordinate and reflect on algebraic shortcuts.
Transformation Quest Teacher Guide
A teacher-facing facilitation guide for the Transformation Quest lesson. Includes a 'Simon Says' script, specific video pause timestamps for classroom discussion, and common student misconception alerts.
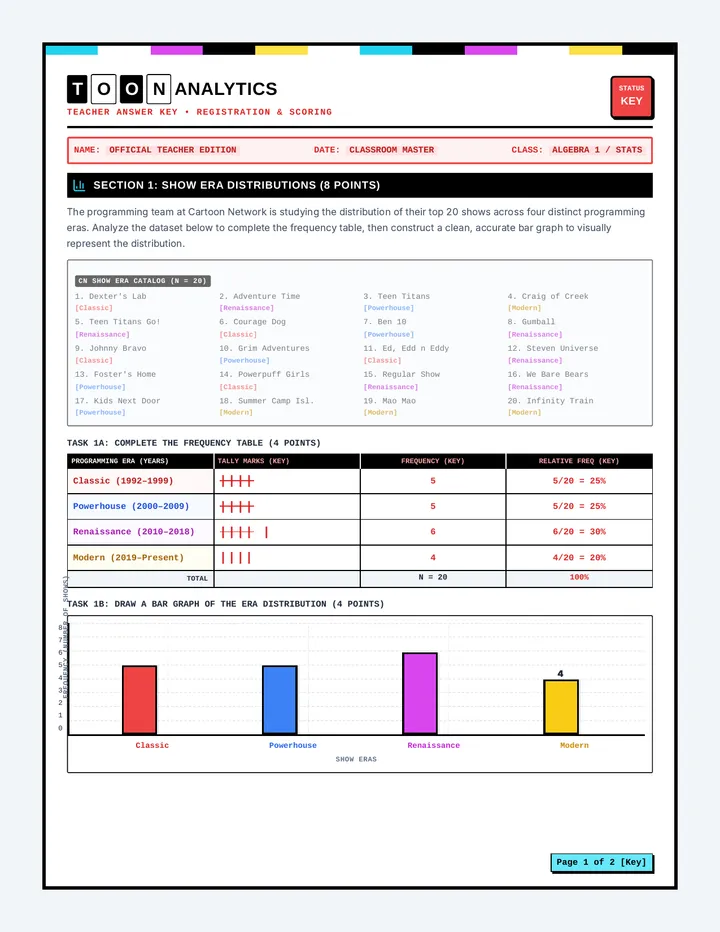
Transformation Quest Answer Key
A teacher-only answer key for the Transformation Quest lesson. Includes the final treasure coordinates for the Mystery Map, step-by-step point tracking, and solutions for the video whiteboard challenges.