The class creates a living bar graph by voting on preferences. They analyze the results to determine which category has more and which has fewer sticky notes.
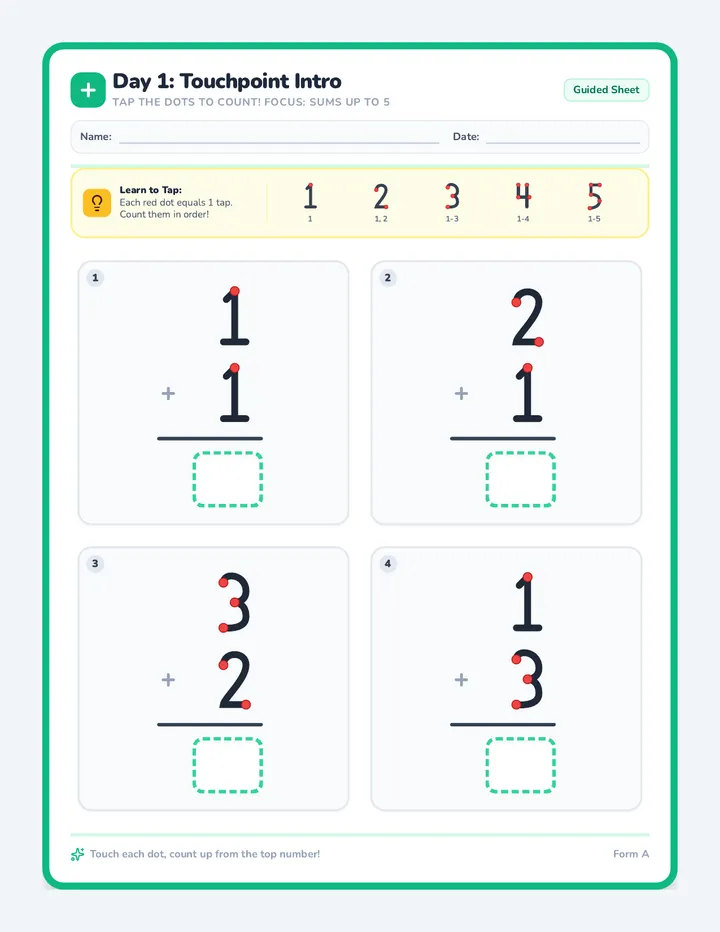
A comprehensive 5-day educational packet designed to master touchpoint addition. Guides students from basic single-digit sums up to 5, through sums up to 10 with double touchpoints, to double-digit addition without regrouping.
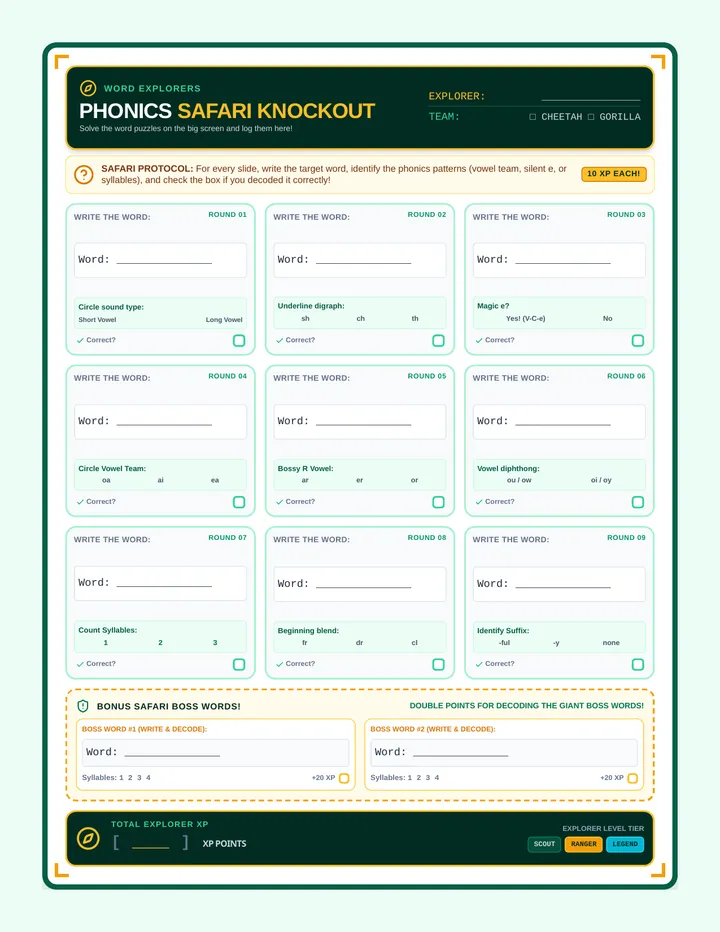
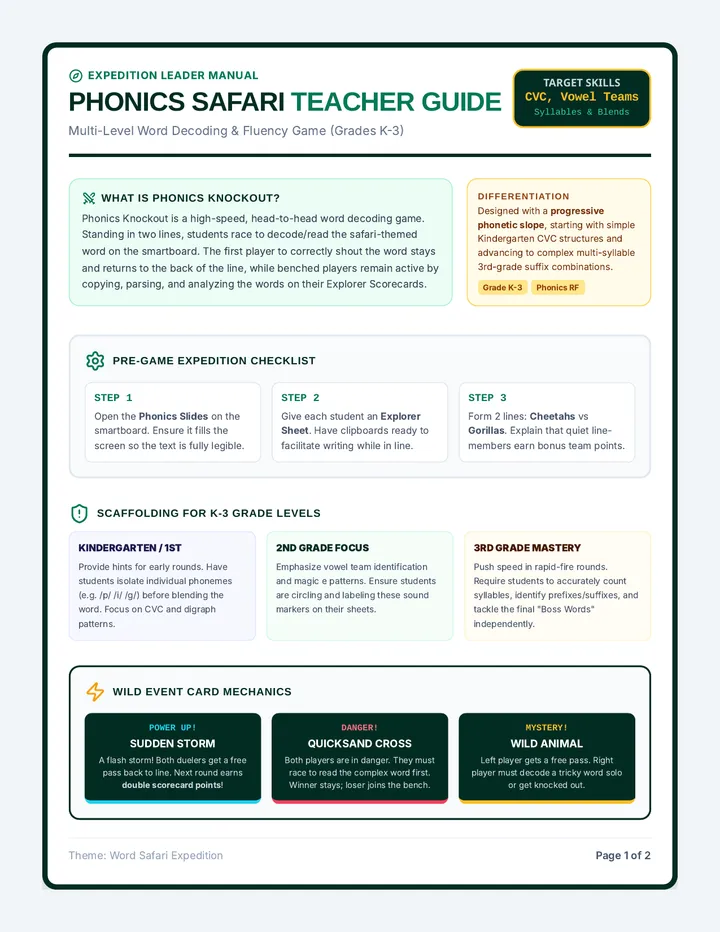
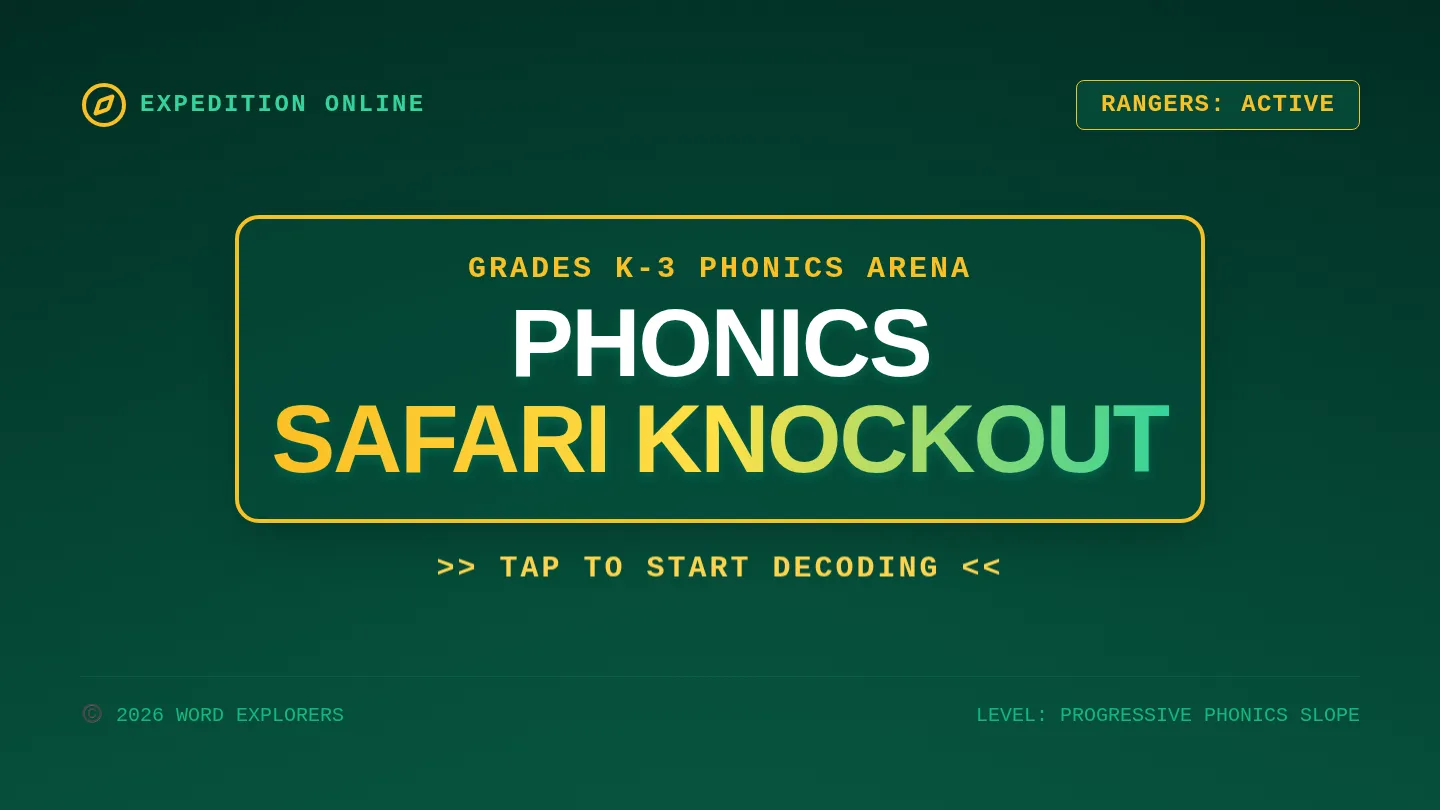
A high-energy, wild safari-themed classroom game for K-3 students focusing on key phonics skills including CVC words, silent 'e', vowel teams, and multi-syllable decoding. This lesson includes a widescreen smartboard presentation, a teacher facilitation guide with word keys, and an active-participation student tracker sheet.
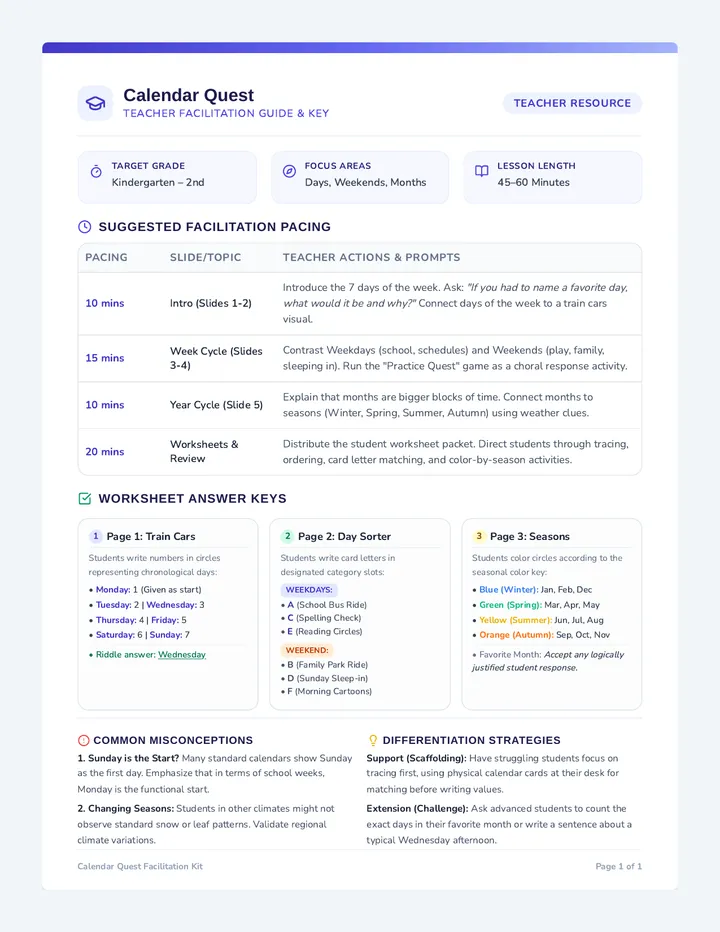
A detailed instructional and answer guide for teachers, providing pacing recommendations, questioning frameworks, and correct key values for the days, sorting, and months worksheets.
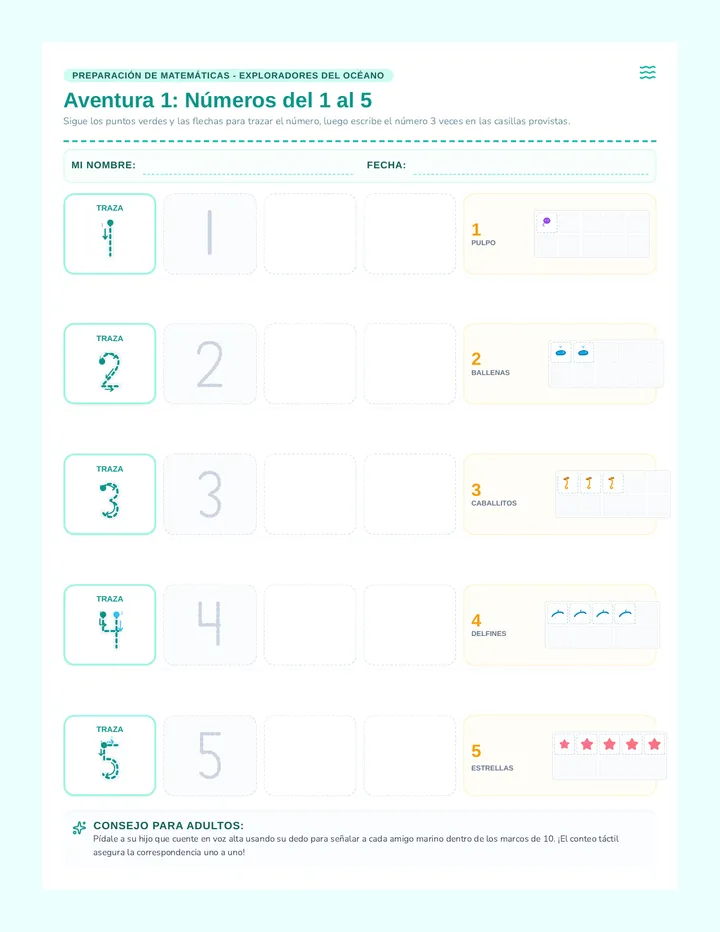
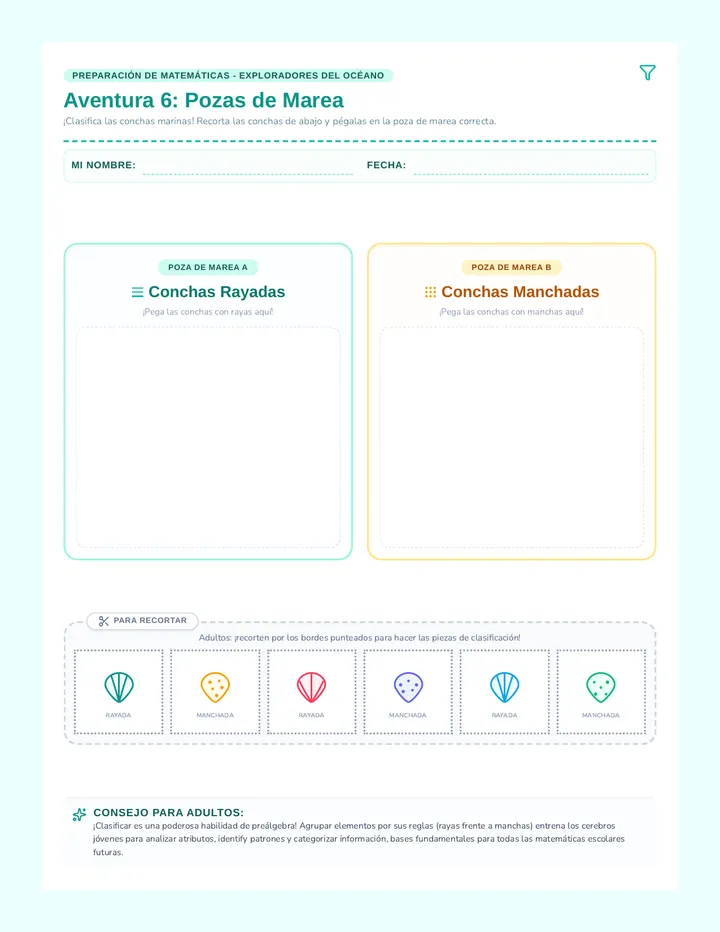
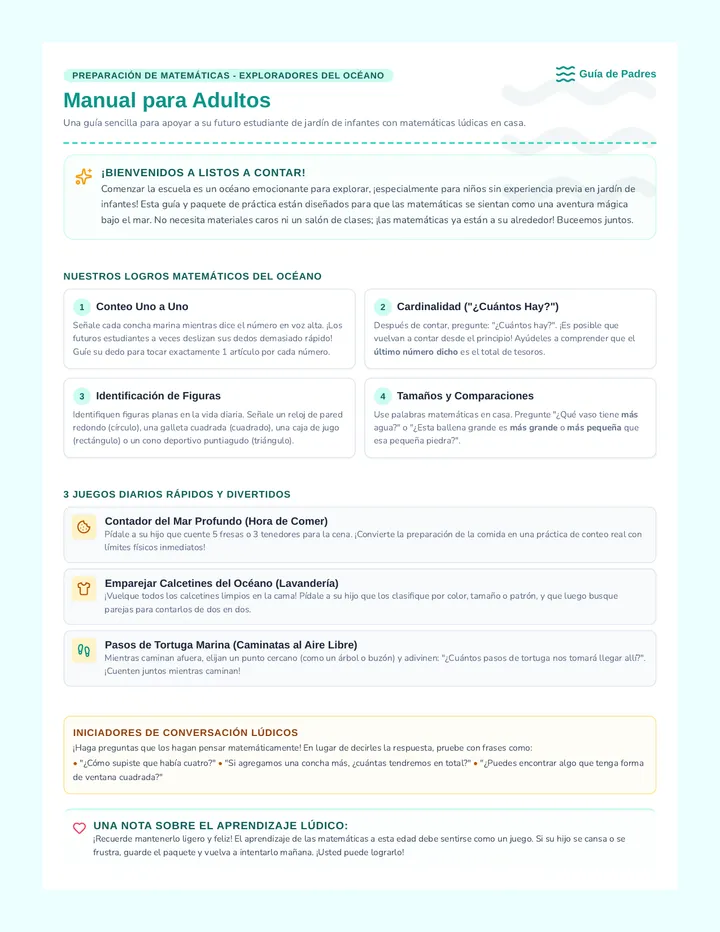
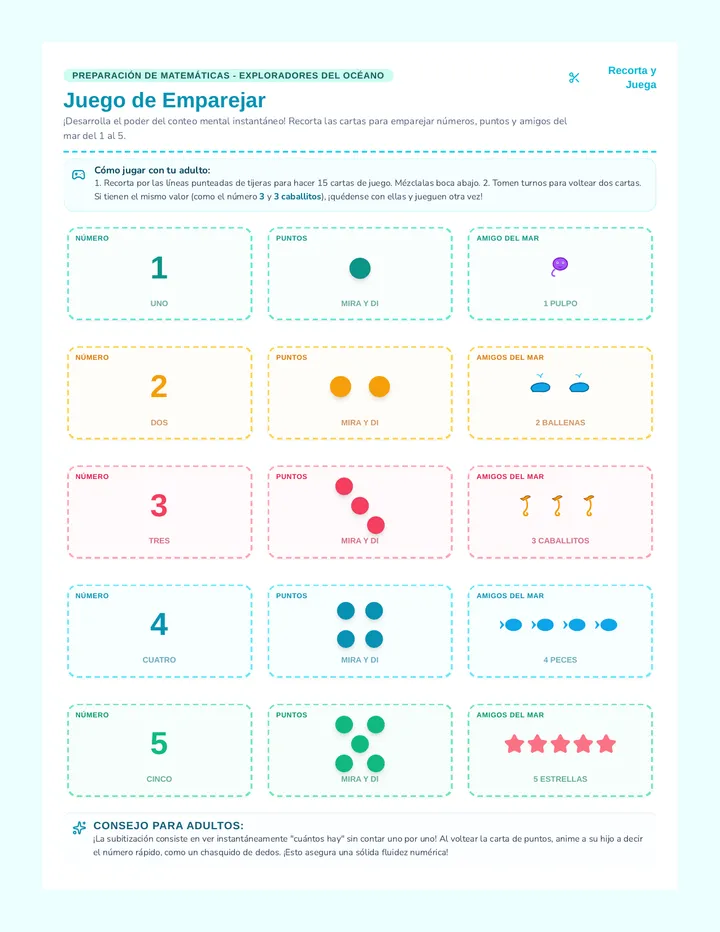
A dual-language summer math preparation sequence for incoming kindergarteners, featuring play-based learning activities in both English and Spanish under a magical ocean theme.
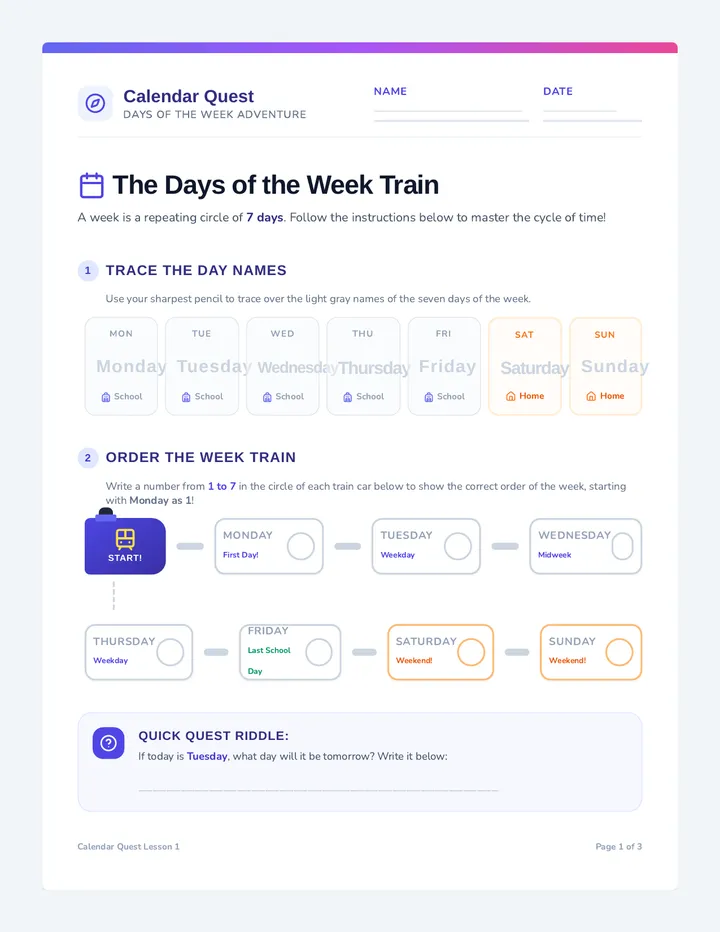
A foundational lesson introducing early elementary students to calendar concepts, including days of the week, weekdays versus weekends, and the twelve months of the year, contextualized with real-world school, home, and seasonal scenarios.
A multi-page student worksheet pack featuring days of the week tracing and ordering, a cut-and-paste weekday vs. weekend sorting activity, and a color-coded months of the year seasonal grid.
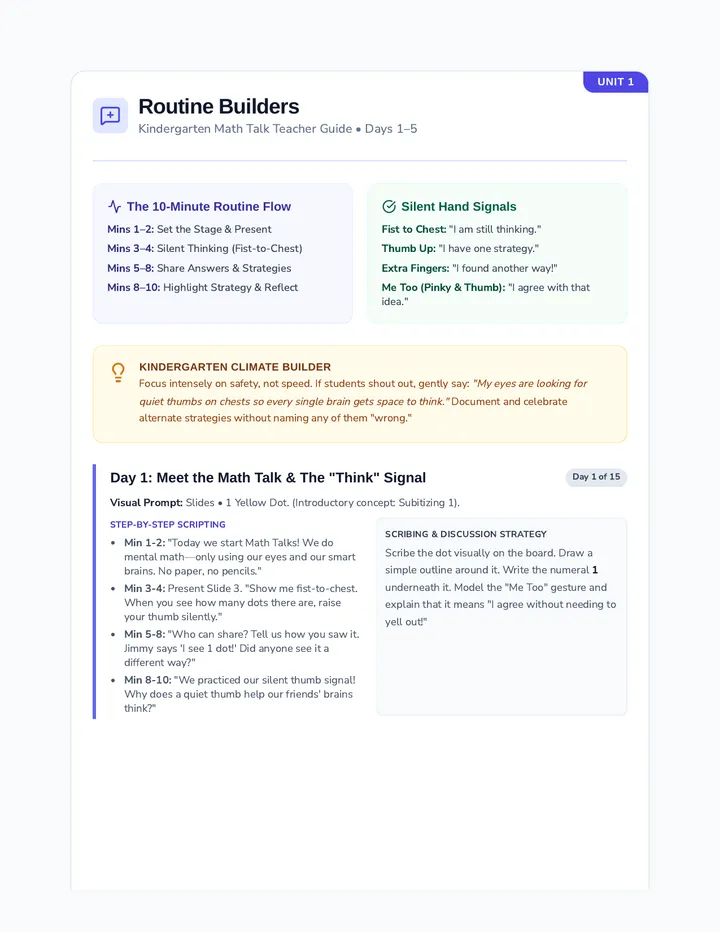
A comprehensive 15-day Kindergarten Math Talk routine sequence designed to build mathematical community, establish silent hand signals, and develop core subitizing skills from 1 to 5 using dot patterns and ten-frames.
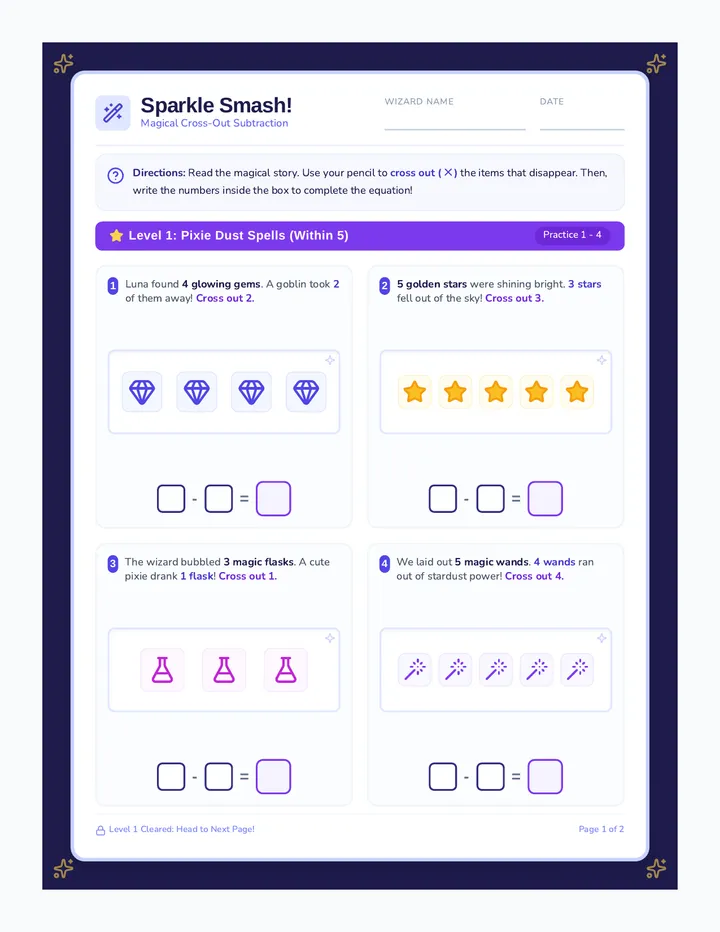
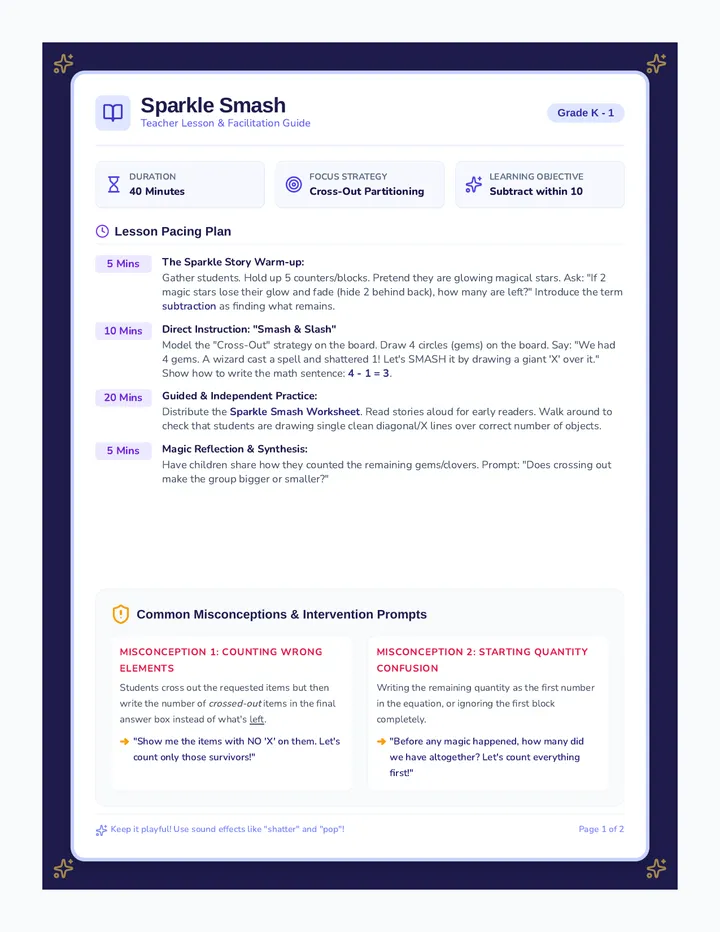
A magical introduction to subtraction within 10 using cross-out strategies with glowing stars, pixie dust, and magical gems.
An engaging, visual slide deck that introduces early elementary students to the calendar concepts of days, weeks, weekdays, weekends, and months through real-world scenarios.
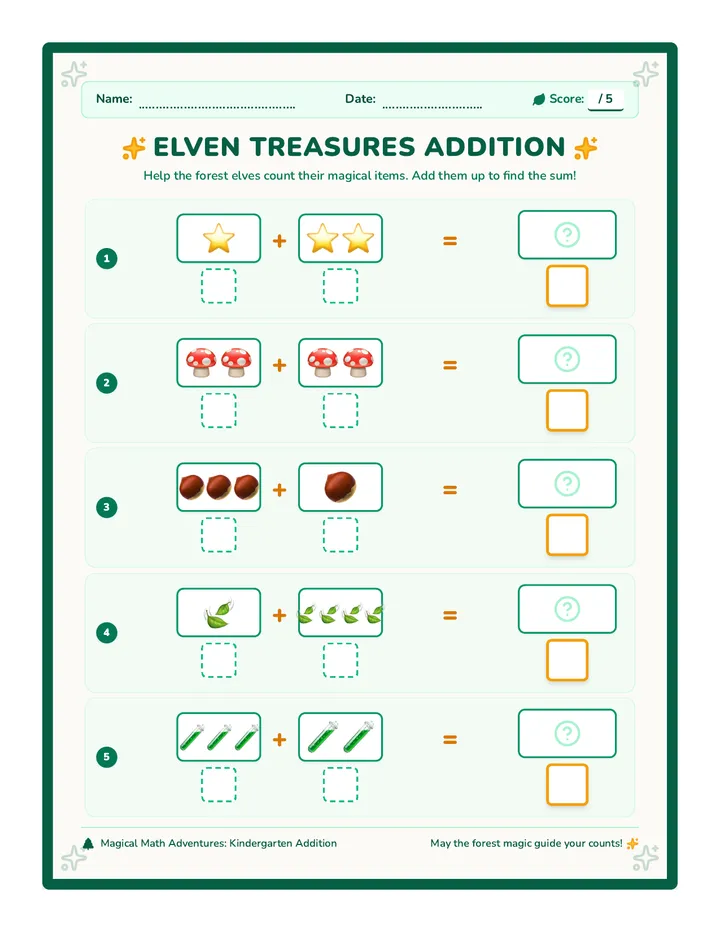
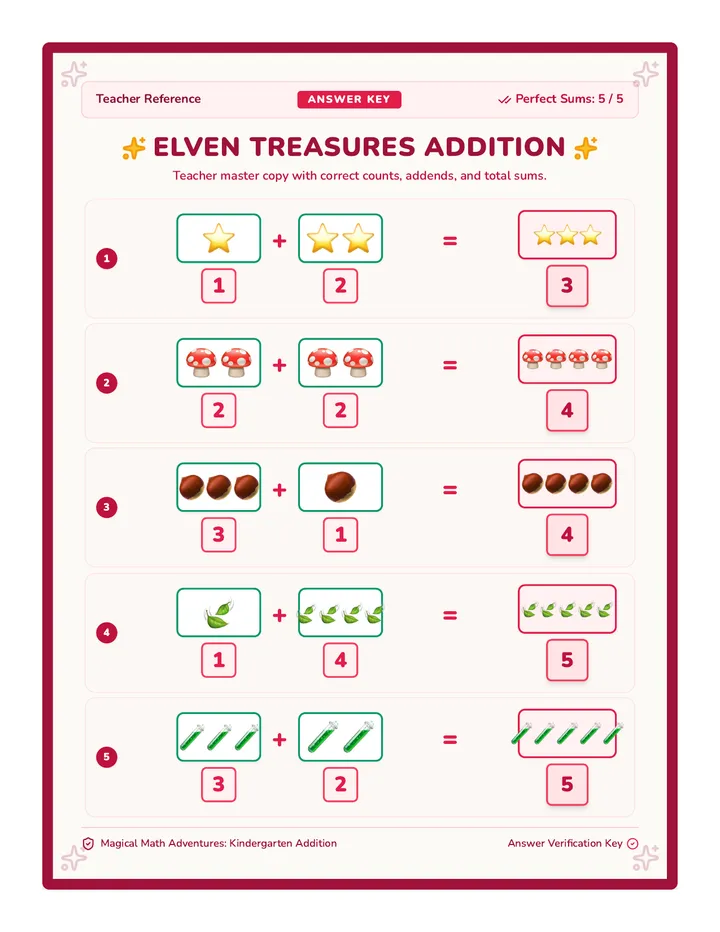
An introductory math lesson focused on picture addition up to 5 using cute elven items and forest treasures, designed to engage early kindergarteners in basic counting and operations.
A 2-page teacher-facing facilitation guide and complete answer key featuring step-by-step scripts, pacing, misconceptions, and visual keys for Sparkle Smash.
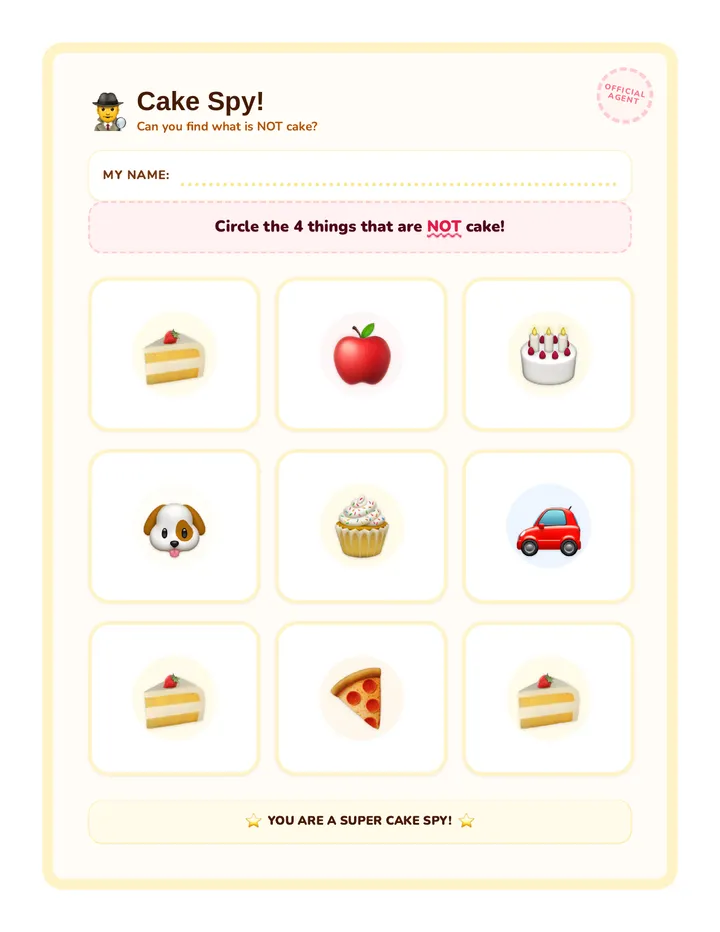
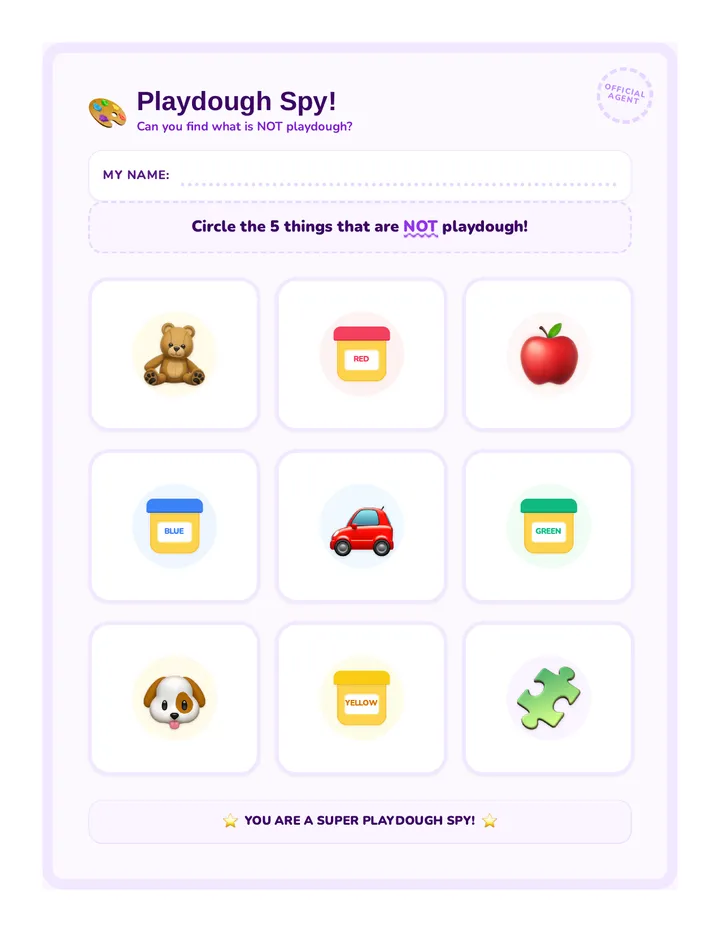
A foundational language and logic lesson for first graders to master the concept of negation ('not') through playful categorization activities.