Focusing on interpretation, this lesson guides students through 'how many more' and 'how many less' problems using pre-made bar graphs. Students write equations to represent visual data gaps.
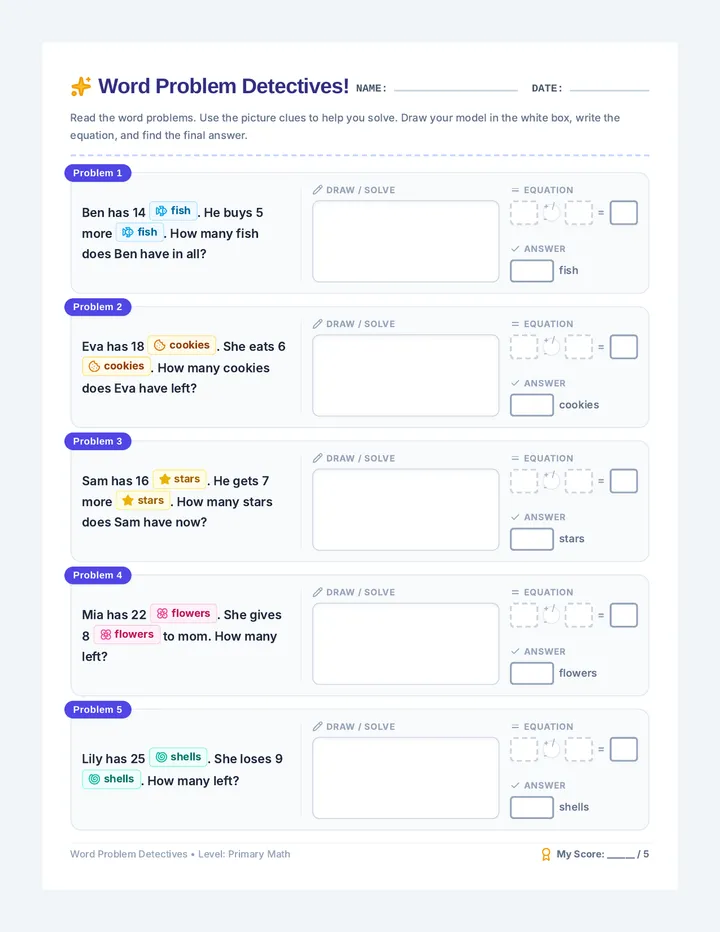
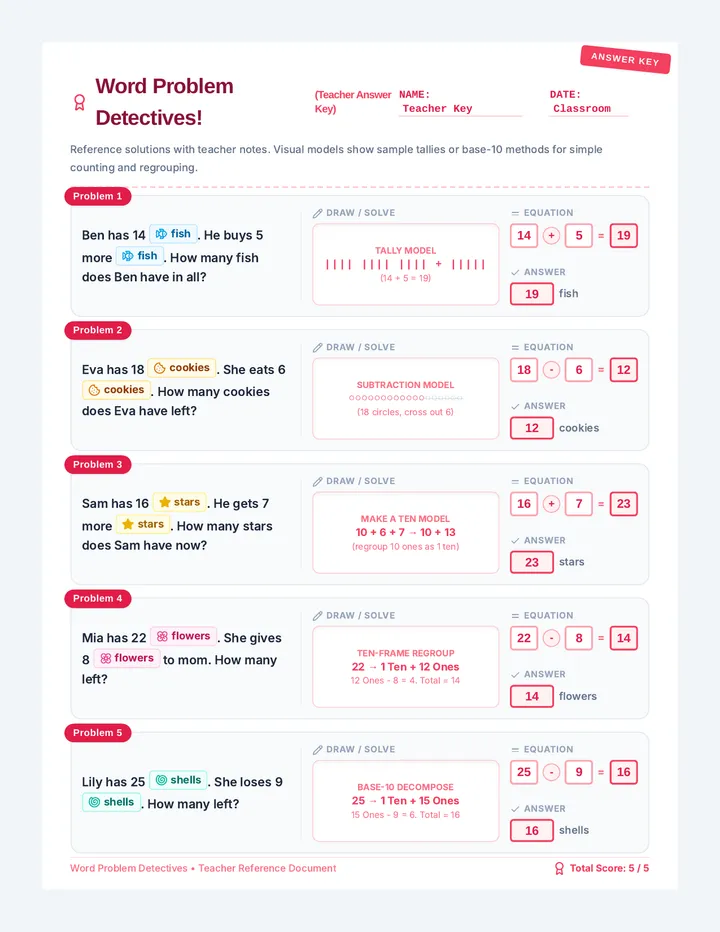
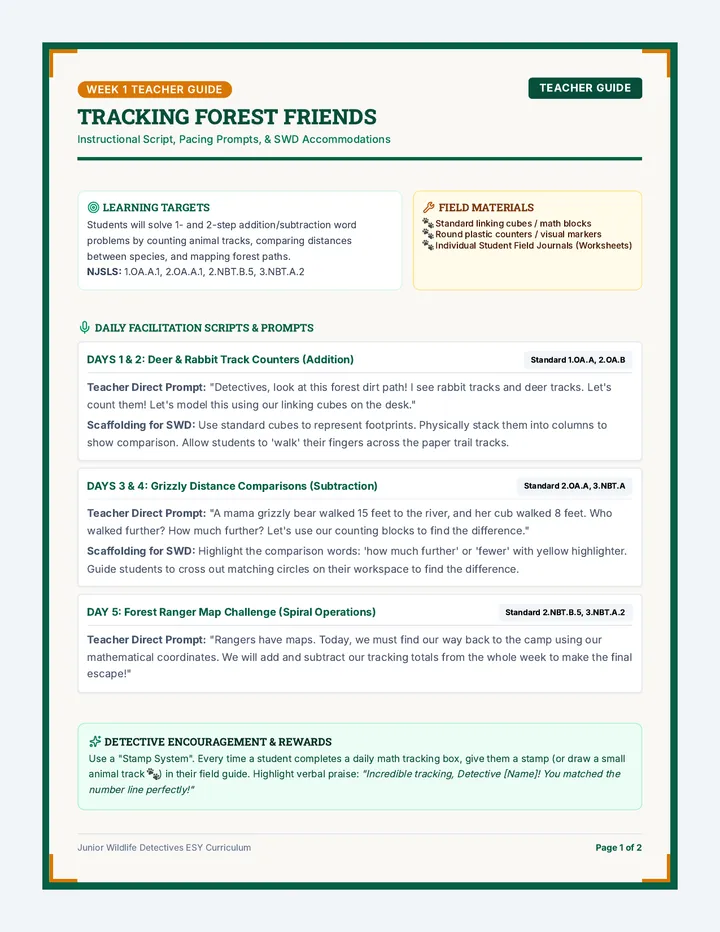
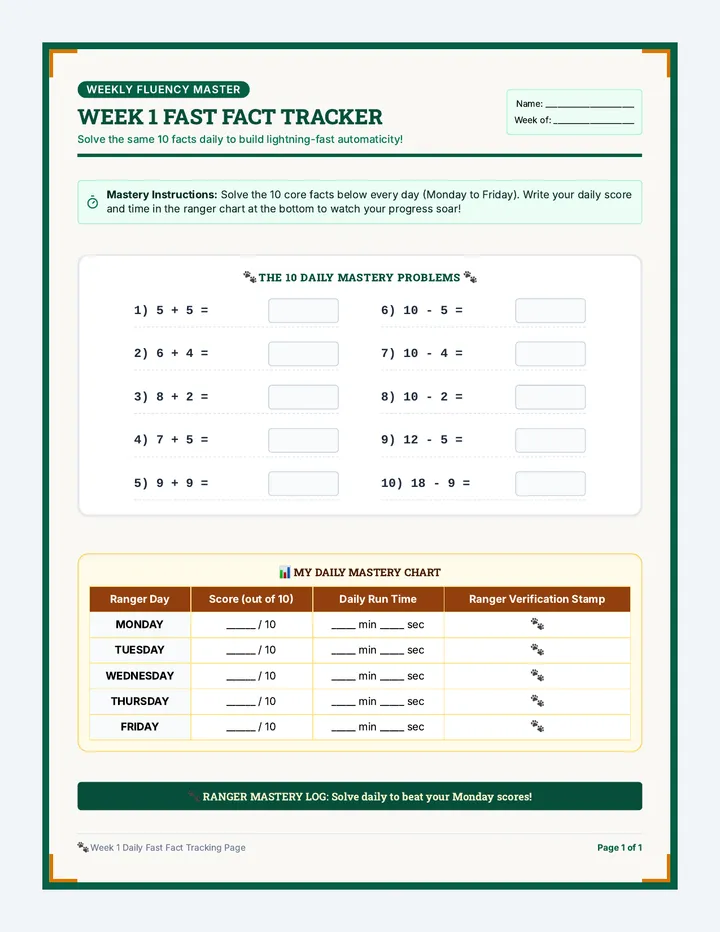
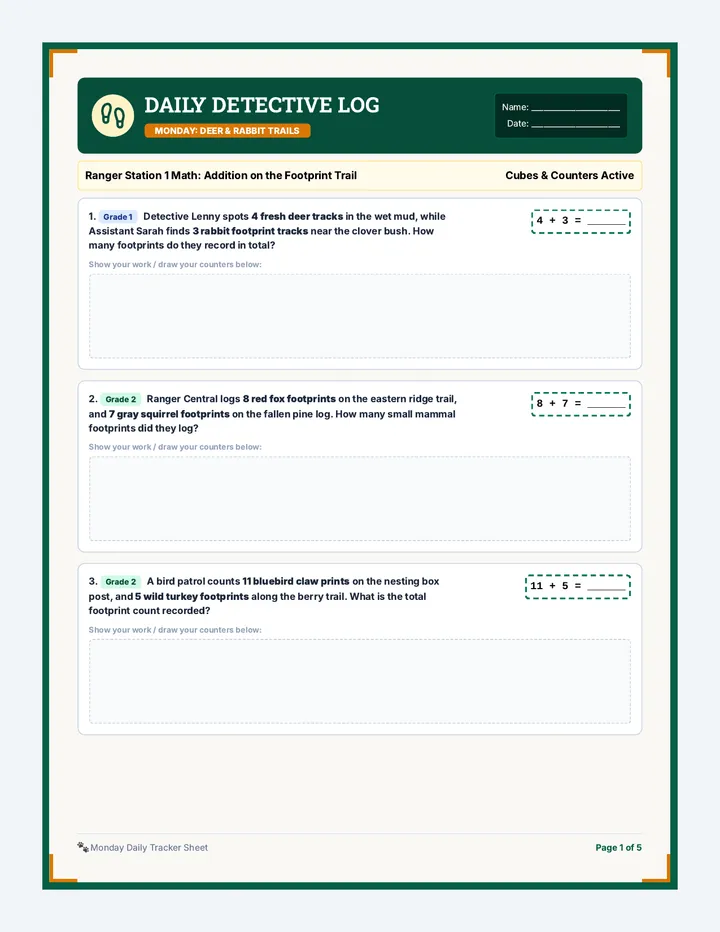
A primary math unit designed to build confidence in solving one-step addition and subtraction word problems. The sequence combines engaging visual cues, scaffolded modeling spaces, and explicit transition strategies between concrete and abstract math representation.
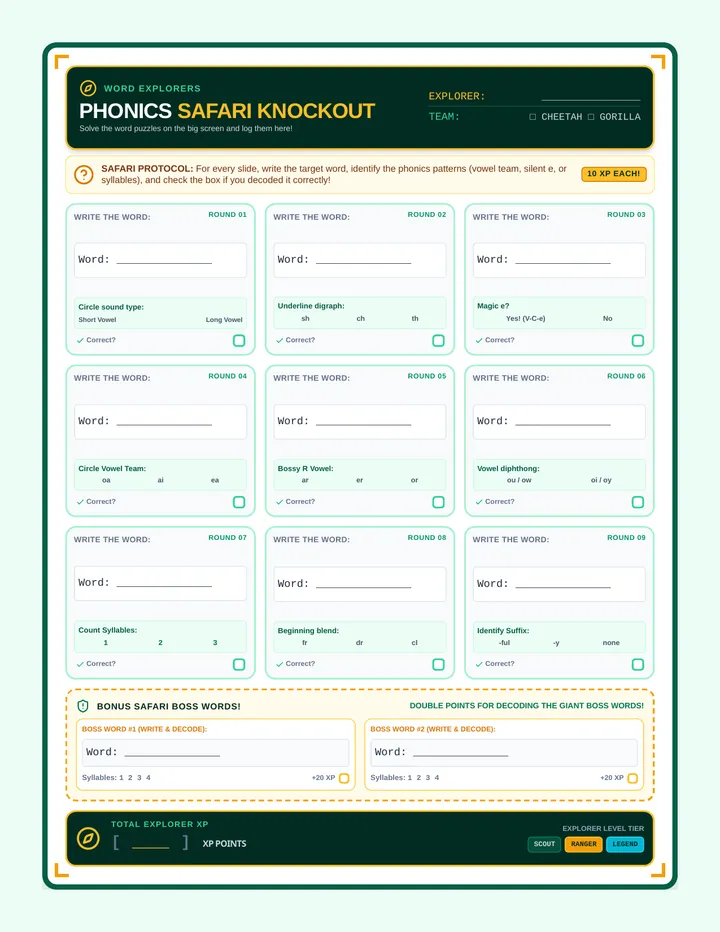
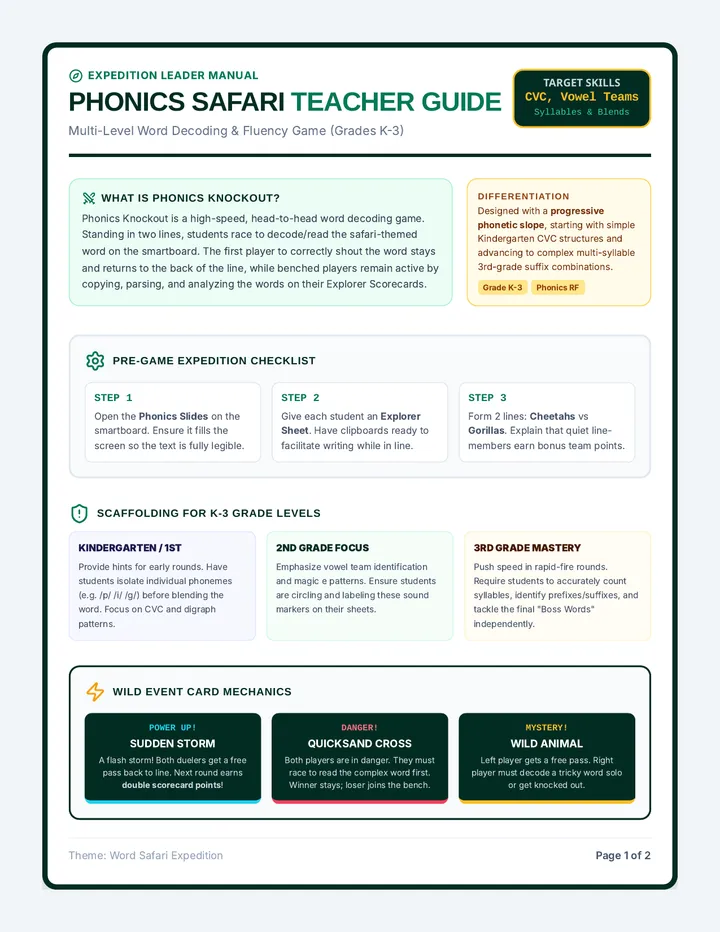
A high-energy, wild safari-themed classroom game for K-3 students focusing on key phonics skills including CVC words, silent 'e', vowel teams, and multi-syllable decoding. This lesson includes a widescreen smartboard presentation, a teacher facilitation guide with word keys, and an active-participation student tracker sheet.
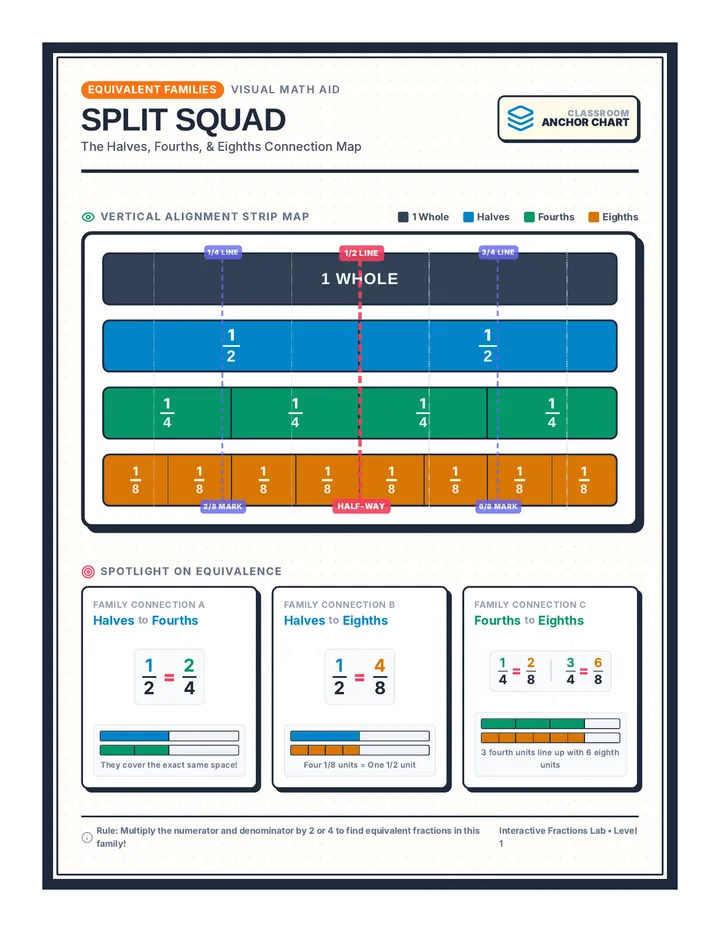
A high-visibility, color-coded fraction strip anchor chart highlighting the equivalent relationships between halves, fourths, and eighths. It features bold alignment lines and a spotlight on equivalent equations.
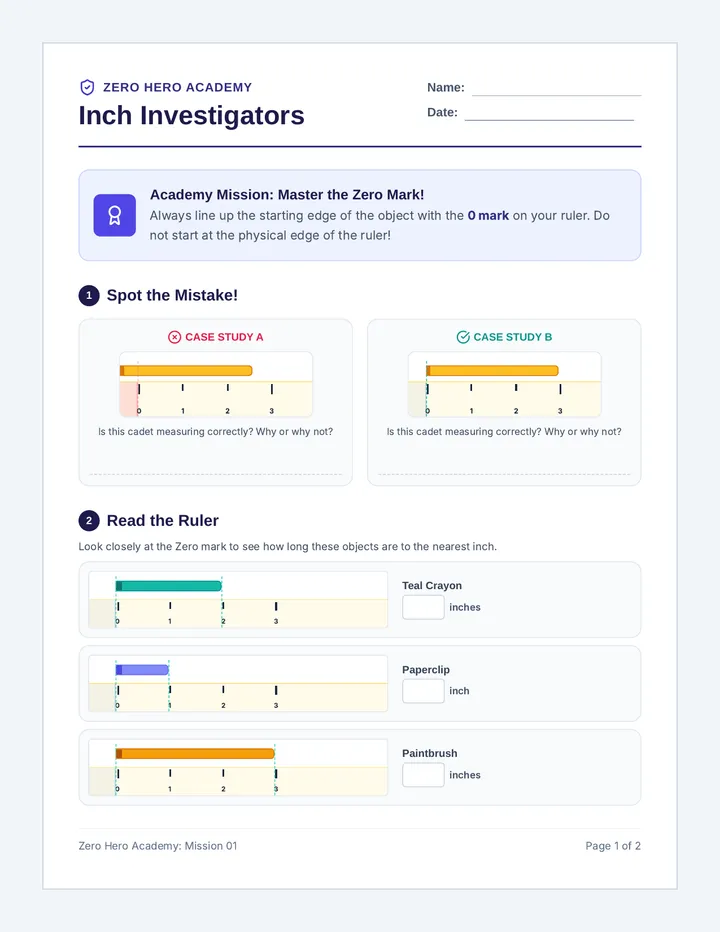
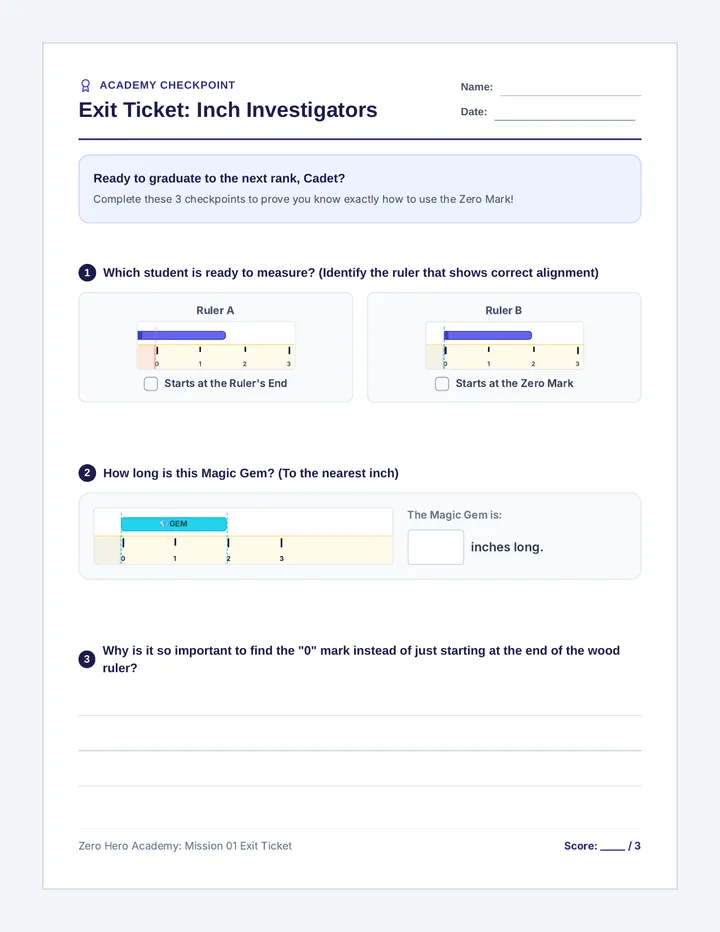
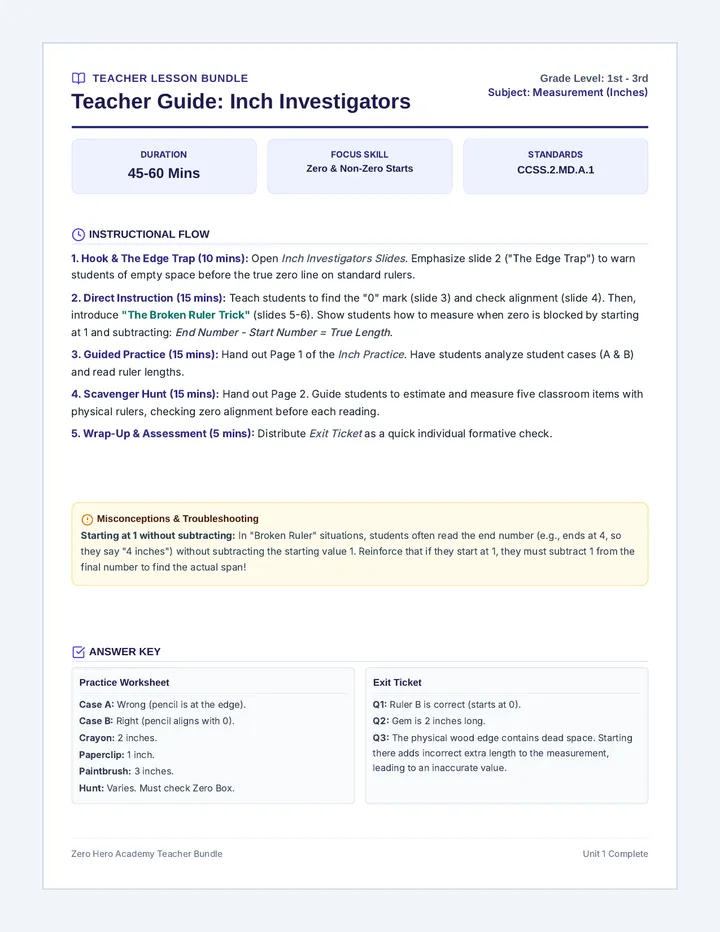
A two-part measuring adventure where students join the Zero Hero Academy to master measuring in inches and centimeters, with a strong focus on aligning the start of objects with the ruler's zero mark.
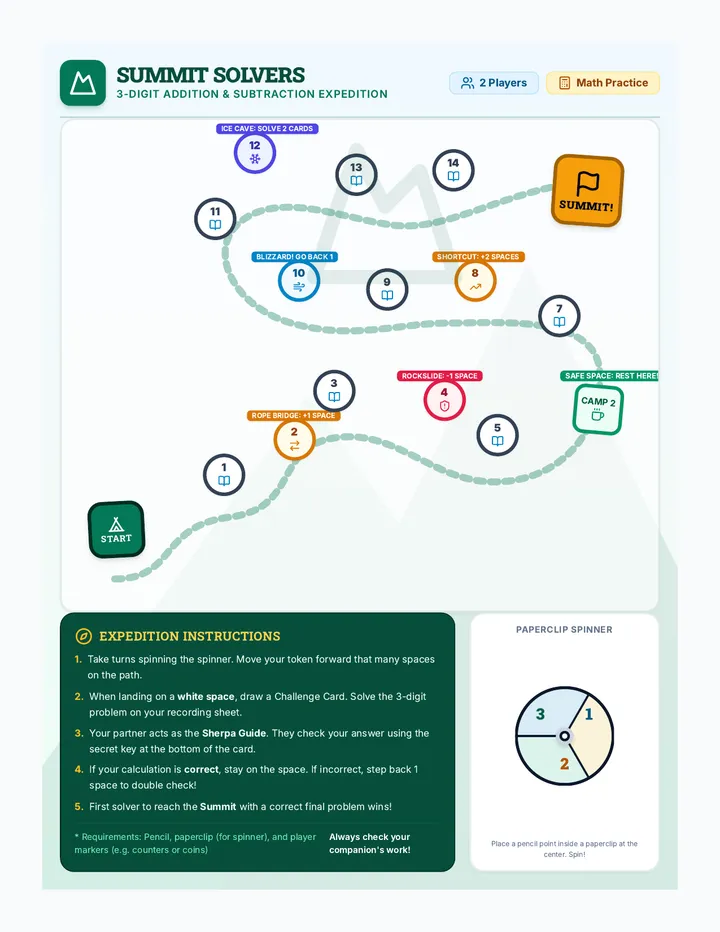
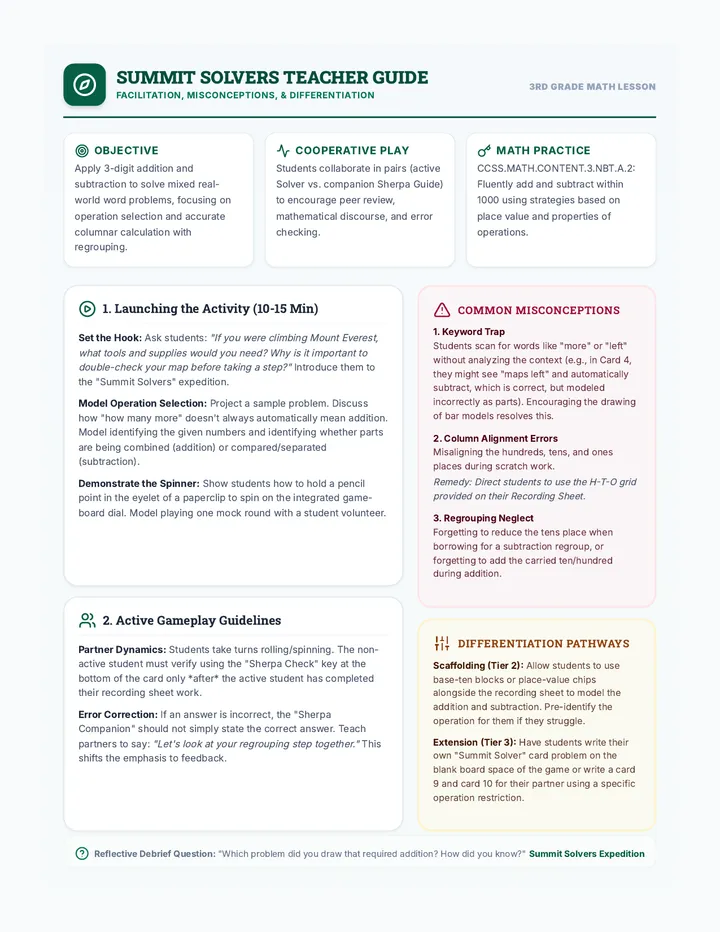
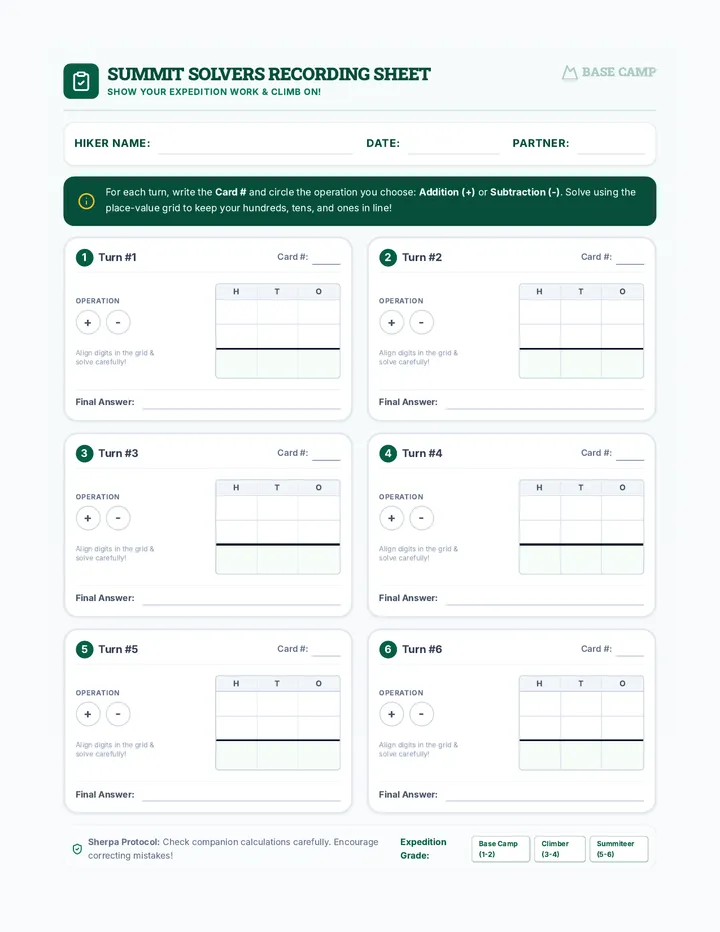
A collaborative third-grade board game focused on solving 3-digit addition and subtraction mixed word problems. Students climb a mountain by selecting correct operations, calculating precisely, and verifying answers with peer-checking challenge cards.
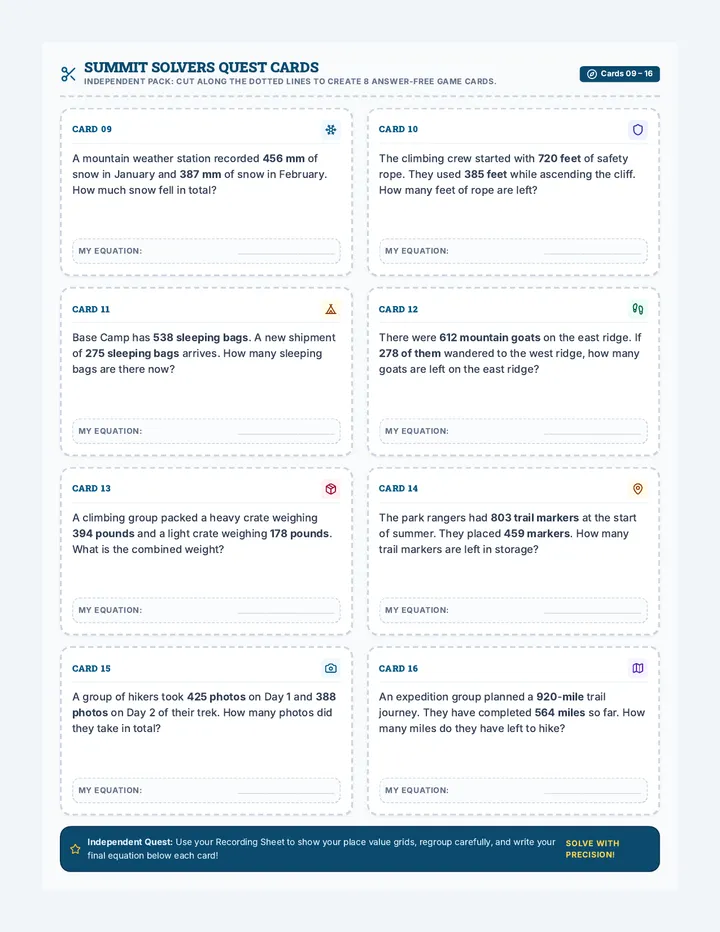
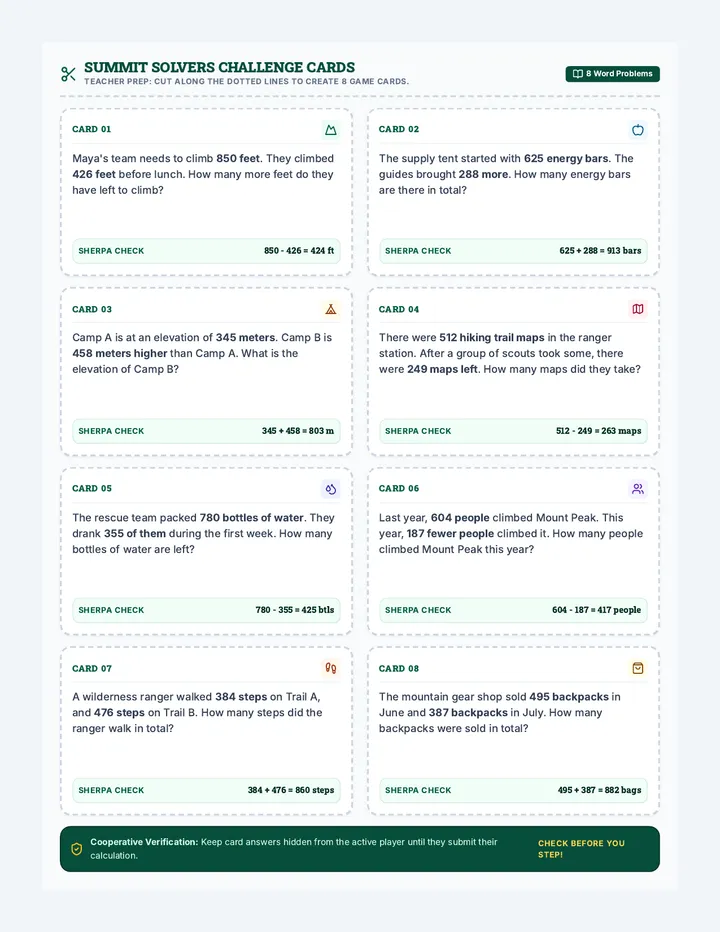
A second printable sheet of 8 mountain-themed 3-digit addition and subtraction task cards without printed answers. Ideal for independent work, assessment, or a high-challenge game variant where students record calculations directly.
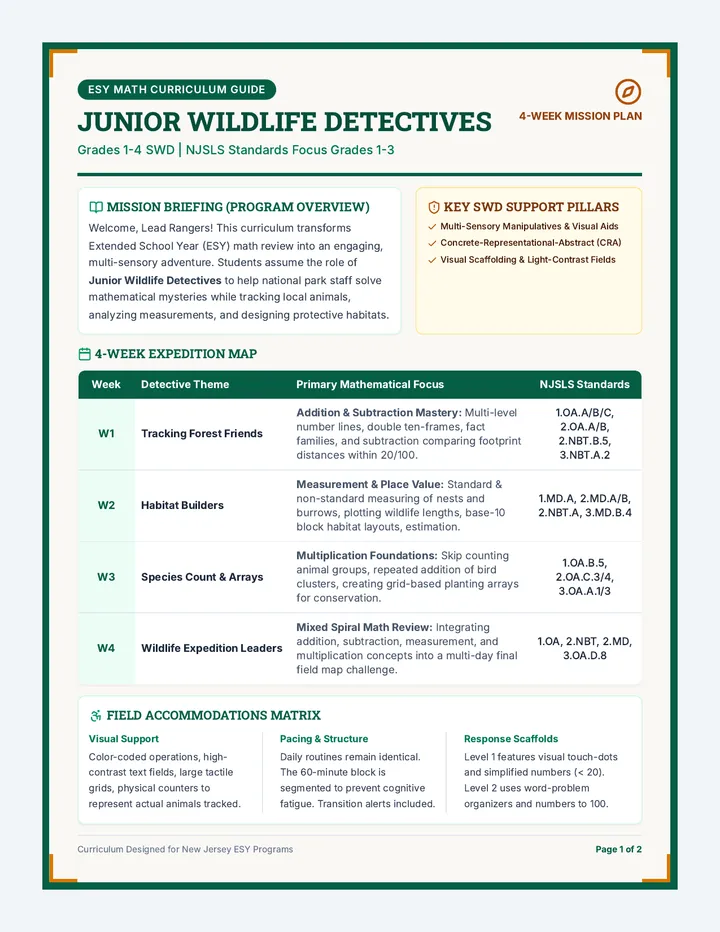
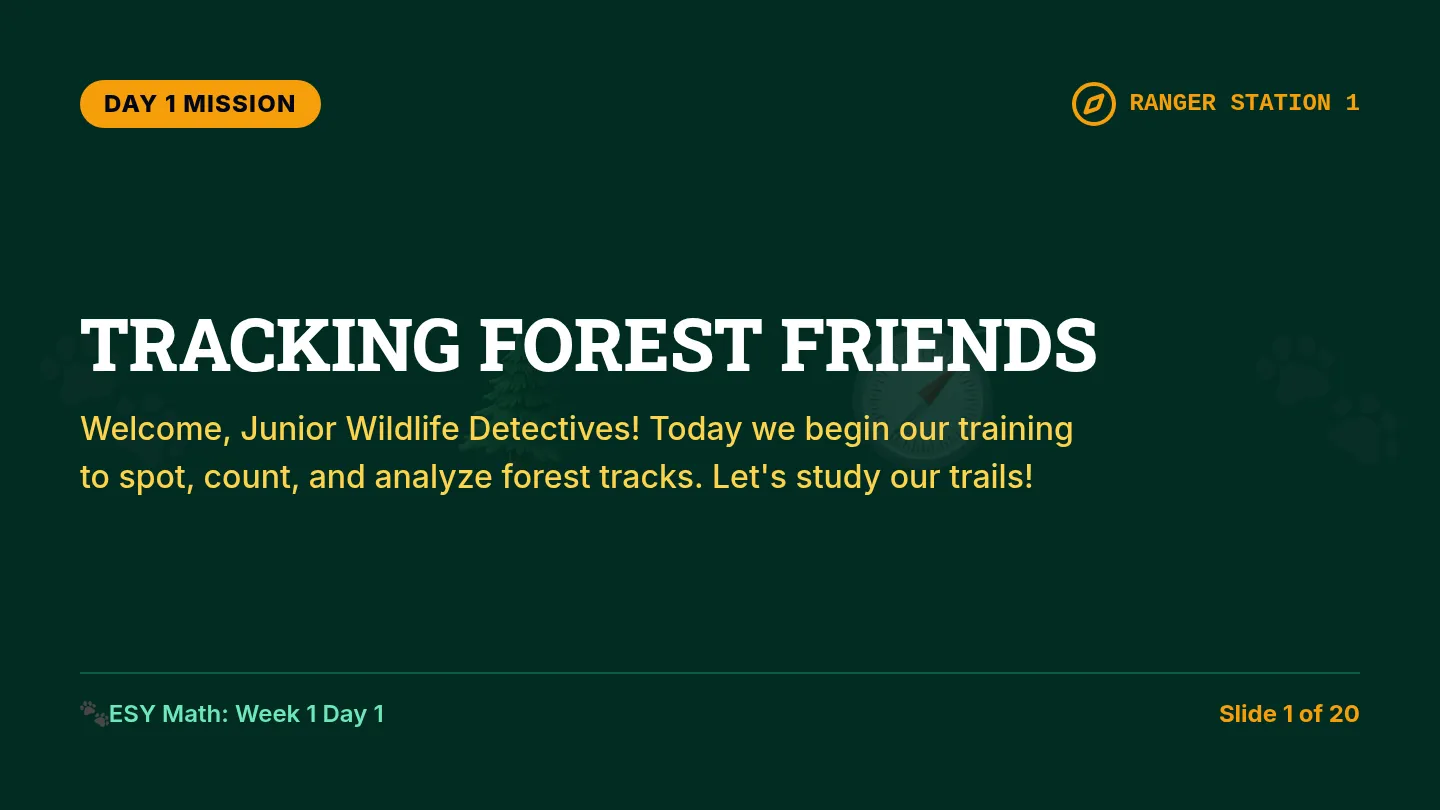
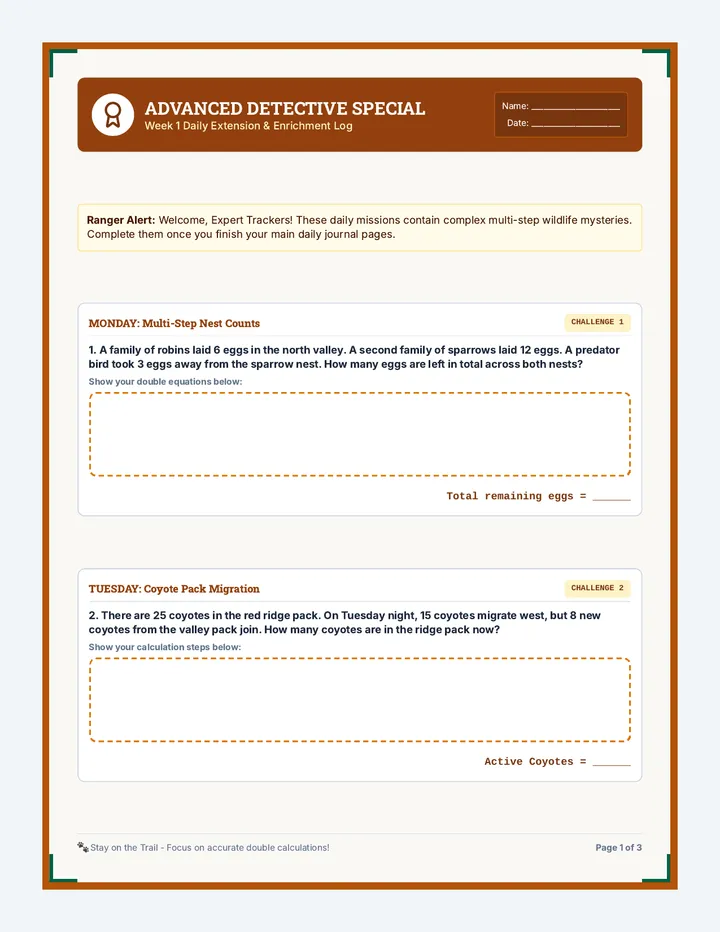
A 4-week Extended School Year (ESY) Math curriculum for Students with Disabilities (SWD) in grades 1-4. Using an engaging 'Junior Wildlife Detectives' theme, students track animals, measure habitats, and categorize species while mastering addition, subtraction, place value, and multiplication foundations aligned with NJ Student Learning Standards (NJSLS) for grades 1-3.
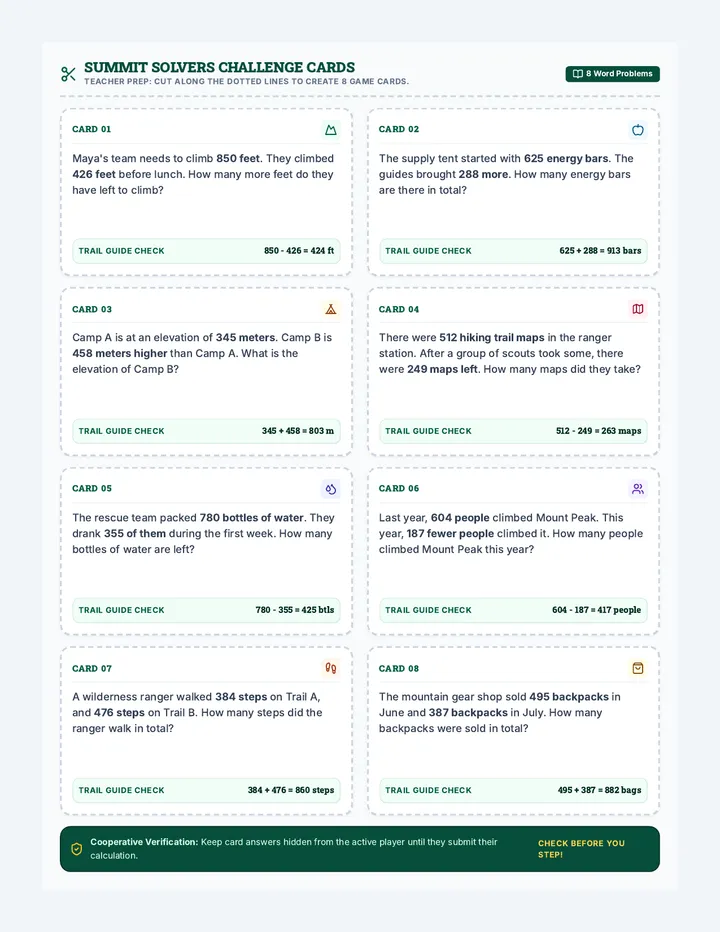
A printable sheet of 8 double-sided style challenge cards for Summit Solvers. Each card features an engaging mountain-themed word problem (covering mixed 3-digit addition and subtraction with regrouping) and a dedicated 'Sherpa Check' answer key at the bottom for partner verification.
A collaborative third-grade board game focused on solving 3-digit addition and subtraction mixed word problems. Students climb a mountain by selecting correct operation, calculating precisely, and verifying answers with peer-checking challenge cards.
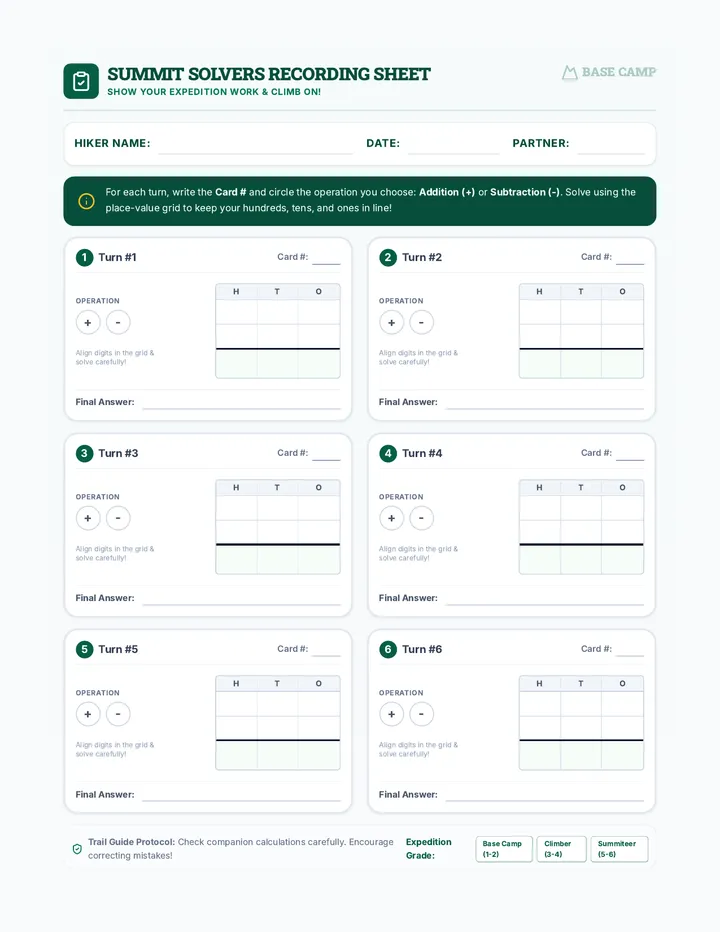
A printable recording sheet for students to document their mathematical work during the Summit Solvers game. Features name and date fields, structured spaces for 6 turns, operation selection prompts (+/-), and built-in Place Value (H, T, O) grids to scaffold 3-digit regrouping.