Students interpret the shape of box plots, identifying whether data is symmetric or skewed based on the length of the 'whiskers' and the position of the median. They relate the visual shape back to the raw data distribution.
A comprehensive summer bridge workbook for rising 8th graders transitioning to Algebra 1. Contains review of prerequisite topics, advanced pre-algebra skills, real-world application, and an Algebra Escape Challenge.
A practical vocational math lesson where students learn to calculate daily earnings by multiplying hours worked by hourly wages. Designed with real-world job-card contexts and supported by structured visual skip-counting.
A printable set of 8 vocational job-card task cards for student stations. Each card presents a distinct workplace scenario with clear numbers and visual guides to support independent double-digit skip-counting and wage calculations.
A high-intensity, 120-minute math simulation. Students act as lead consultants, completing a high-speed skill warmup before selecting a professional sector (Music, Urban Planning, Rocket Science, or Sports Analytics) to solve a series of complex work orders.
The second part of the Algebra 1 Summer Bridge Packet. It covers functions & patterns, linear relationships, geometric foundations, statistics & probability, and an advanced Algebra 1 preview.
A comprehensive 7-slide presentation that introduces hourly wage calculations using real-world vocational scenarios. Designed with a retro industrial clipboard theme, featuring bold graphics, clear icons, and visual skip-counting tracks. All slide text elements are strictly 24px or larger.
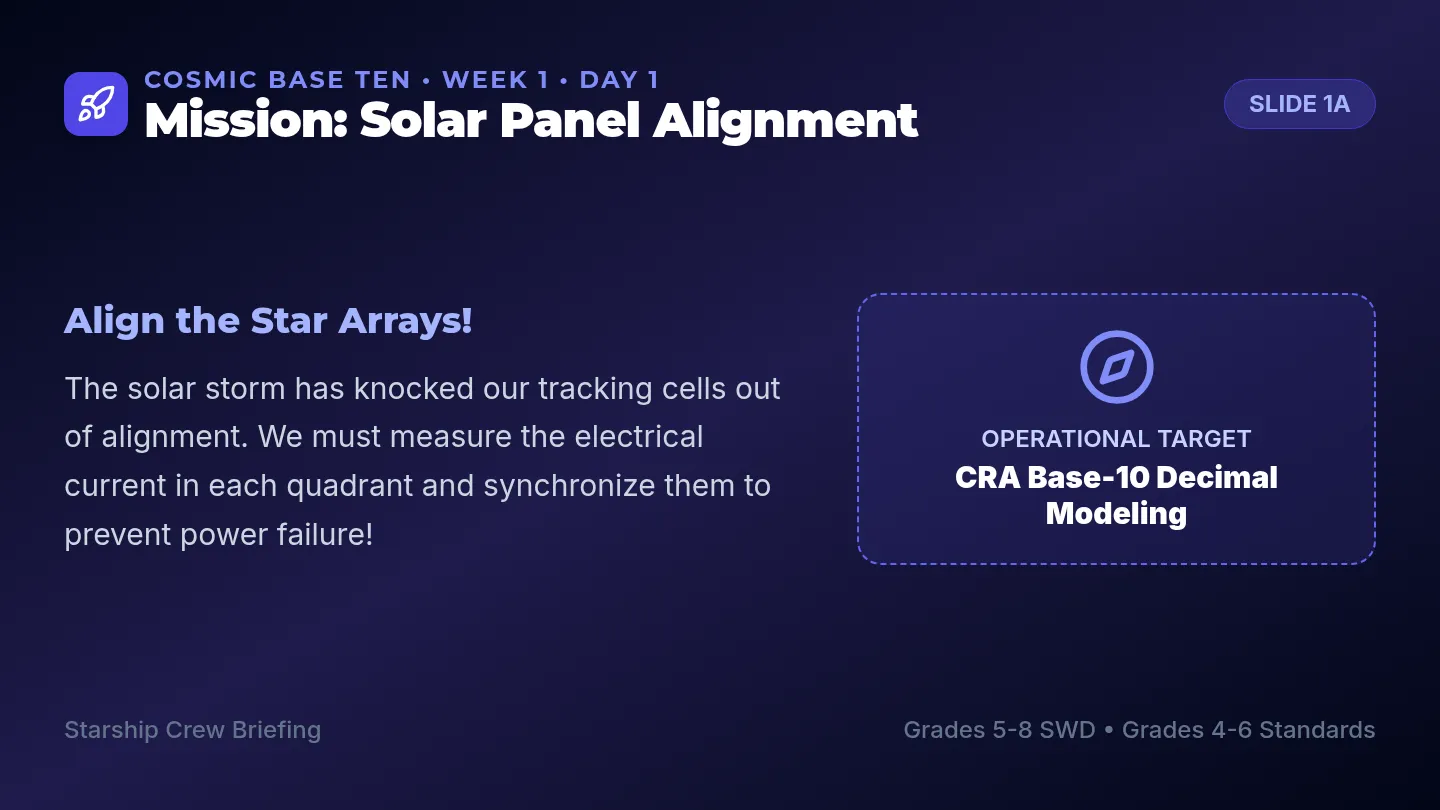
A 4-week math workbook and instructional sequence themed around outer space exploration, specifically designed for middle school students with disabilities (SWDs) working at an early 1st-grade level. Features embedded touch-points, base-ten icons, visual number paths, and age-appropriate space exploration visuals to teach single-digit operations, place value, and patterns.
The first part of the Algebra 1 Summer Bridge Packet for rising 8th graders. It covers integer operations, rational numbers, expressions, solving equations, and proportional relationships with worked examples and workspaces.
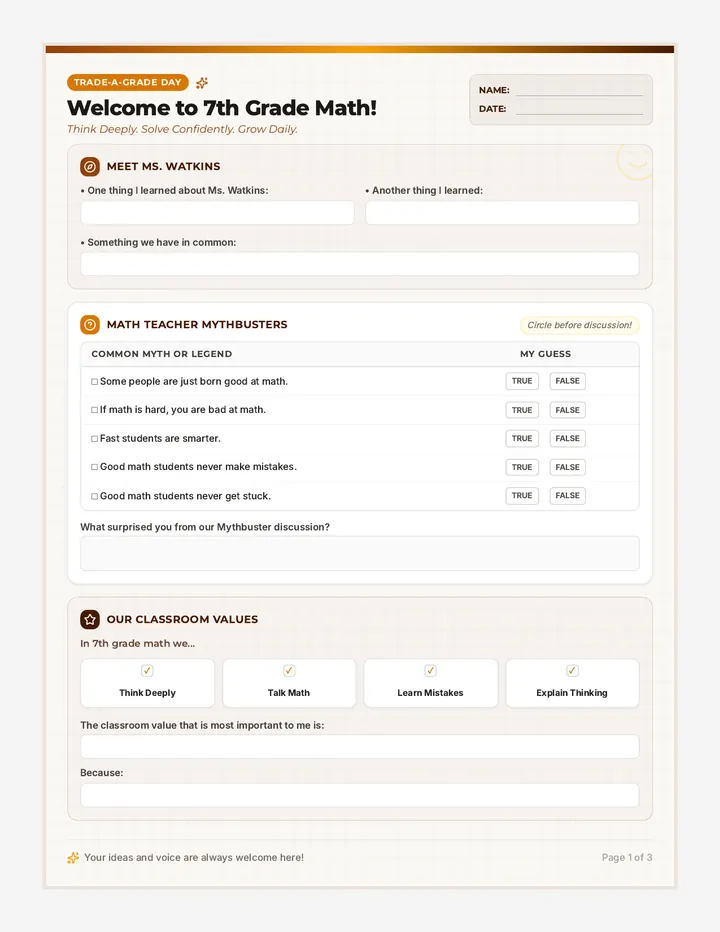
A beautifully themed 3-page transition worksheet for incoming 7th-grade math students visiting Ms. Watkins' classroom on Trade-a-Grade Day. Features a cohesive warm brown, gold, and cream palette with welcoming, interactive elements like mythbusters, classroom values, and introductory thinking prompts. Page 3 provides a customized mathematical sneak-peek on ratios, unit rates, and integers.
A 4-week intensive math intervention program set in a space exploration universe, designed for multi-grade students with disabilities in Grades 5–8. It covers additive thinking, place value, and decimal regrouping, anchored in Grades 4–6 standards with a Grade 5 core middle ground.
A specialized 4-page student-facing support and accommodation packet designed specifically for students with expressive language challenges and focus difficulties. Includes visual schedules, 'First-Then' pacing boards, structured sentence frames, and simplified graphic organizers with rocket-themed visuals.
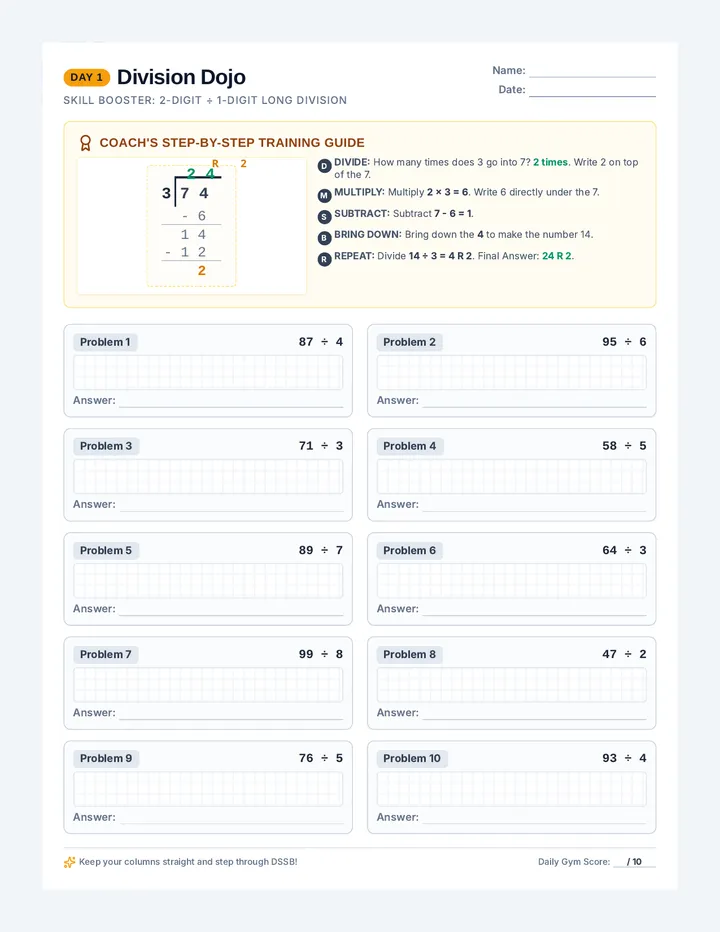
A six-day targeted daily practice series designed to reinforce critical middle school math skills. Each single-page worksheet features a scaffolded, step-by-step solved example followed by 10 targeted practice problems with dedicated workspace.