Rhombus Blueprint Notes Worksheet
A guided notes sheet for students to use while watching the instructional video, including a conditions chart and a partially completed two-column proof for Problem 1.
Rhombus Revelations Slideshow
A comprehensive presentation covering the rhombus warm-up, video lesson with pause points, activity instructions, and the closure prompt.
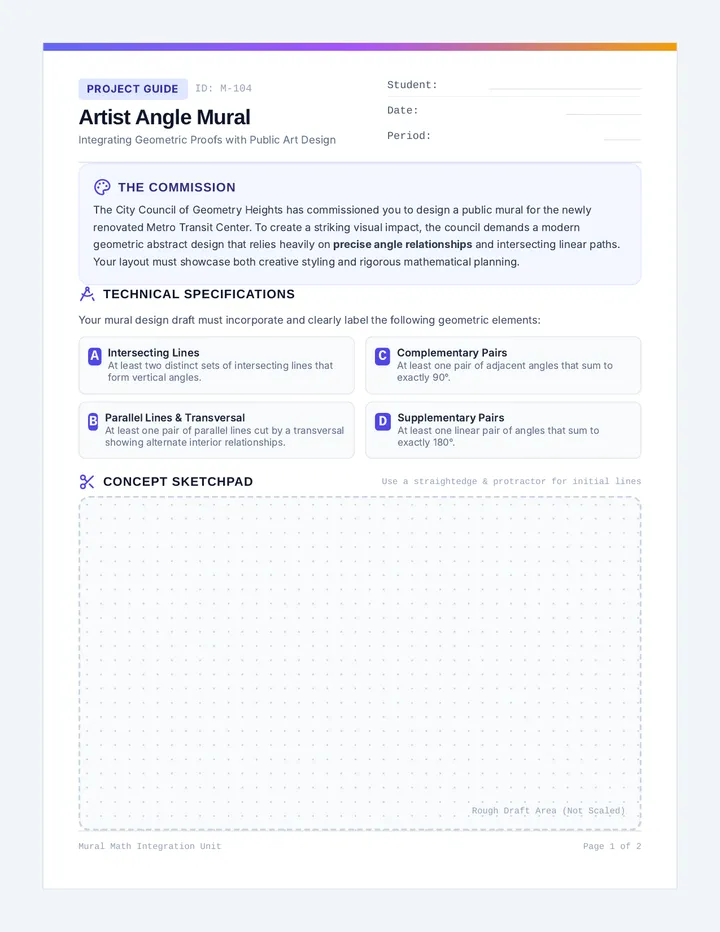
Rhombus Proof Scramble Activity
A student activity sheet for 'Proof Scramble' based on Problem 2 from the video, including a blank proof table and cutting strips for statements and reasons.
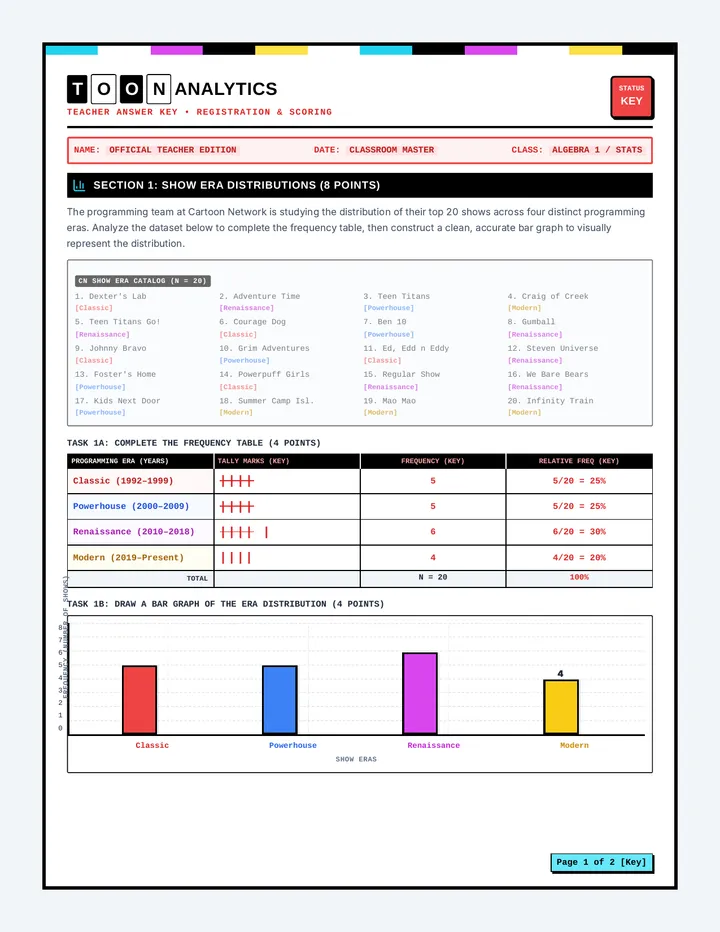
Geometry Guide Teacher Resource Key
A teacher resource providing answer keys for the warm-up, guided notes, and proof scramble activity, along with instructional tips and misconceptions.
Rhombus Revelations Exit Ticket
A clean, single-page exit ticket for students to demonstrate their understanding of rhombus proving conditions and perform a quick self-assessment.