Students will master the geometric properties of a rhombus by constructing precise figures with tools and calculating unknown angles through deductive reasoning, comparing theoretical results with physical measurements.
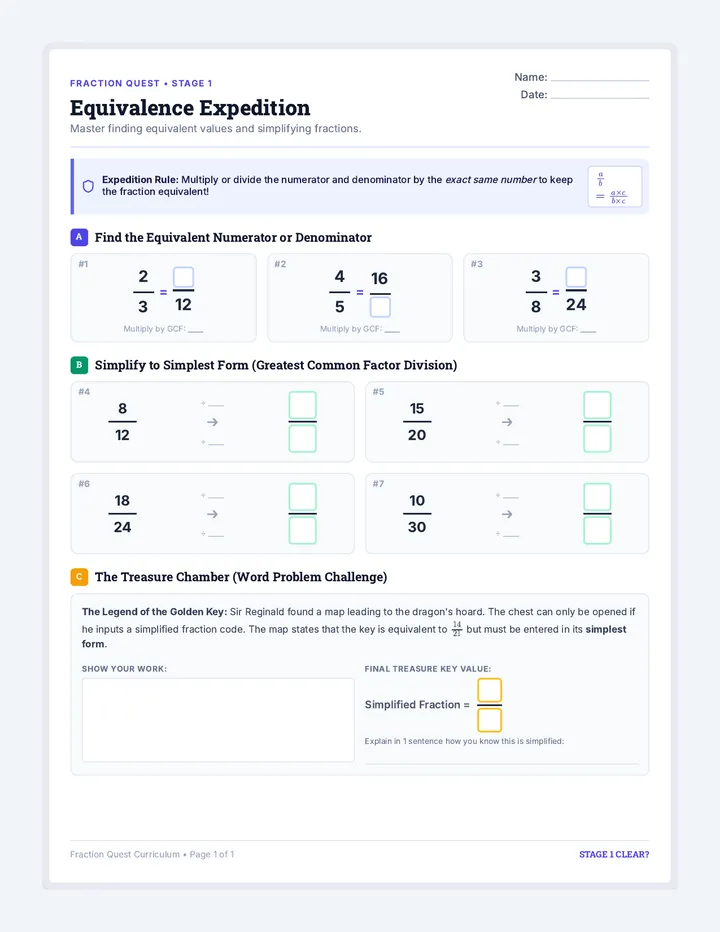
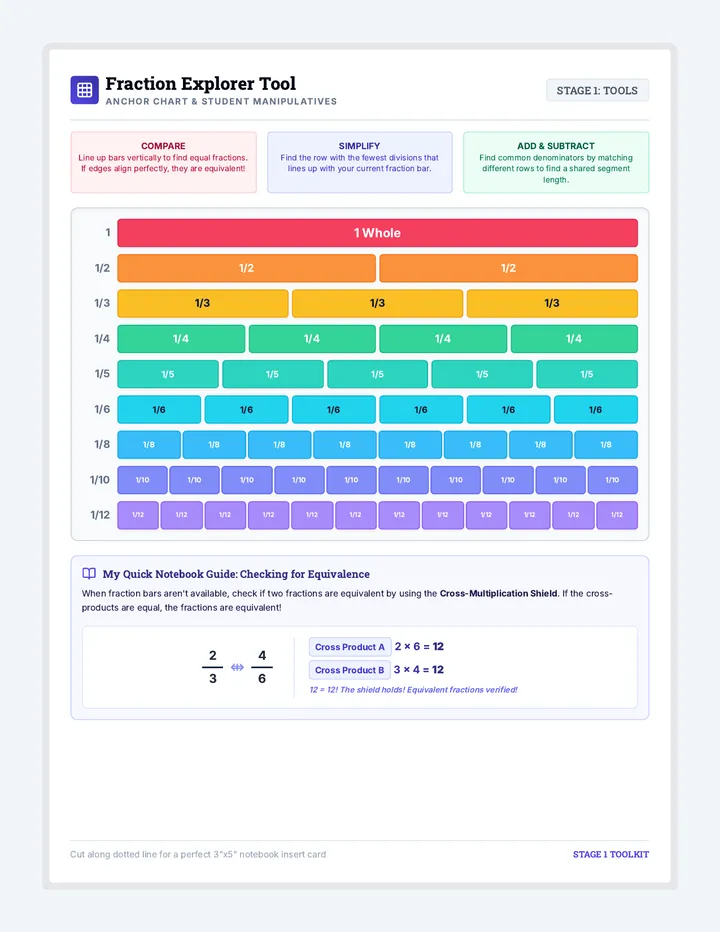
A comprehensive visual math curriculum sequence focusing on fraction equivalence, addition, subtraction, multiplication, division, and comprehensive multi-operation mastery. Includes visual lesson slides, independent practice worksheets, small-group centers, visual tools, and robust assessments.
A practical vocational math lesson where students learn to calculate daily earnings by multiplying hours worked by hourly wages. Designed with real-world job-card contexts and supported by structured visual skip-counting.
A printable set of 8 vocational job-card task cards for student stations. Each card presents a distinct workplace scenario with clear numbers and visual guides to support independent double-digit skip-counting and wage calculations.
A 4-week math workbook and instructional sequence themed around outer space exploration, specifically designed for middle school students with disabilities (SWDs) working at an early 1st-grade level. Features embedded touch-points, base-ten icons, visual number paths, and age-appropriate space exploration visuals to teach single-digit operations, place value, and patterns.
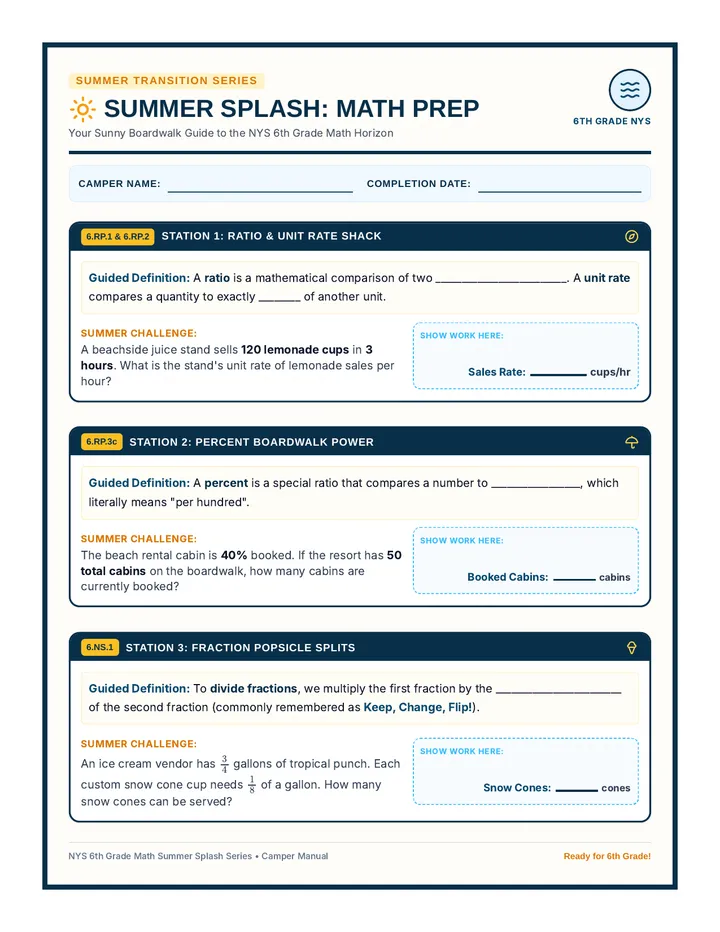
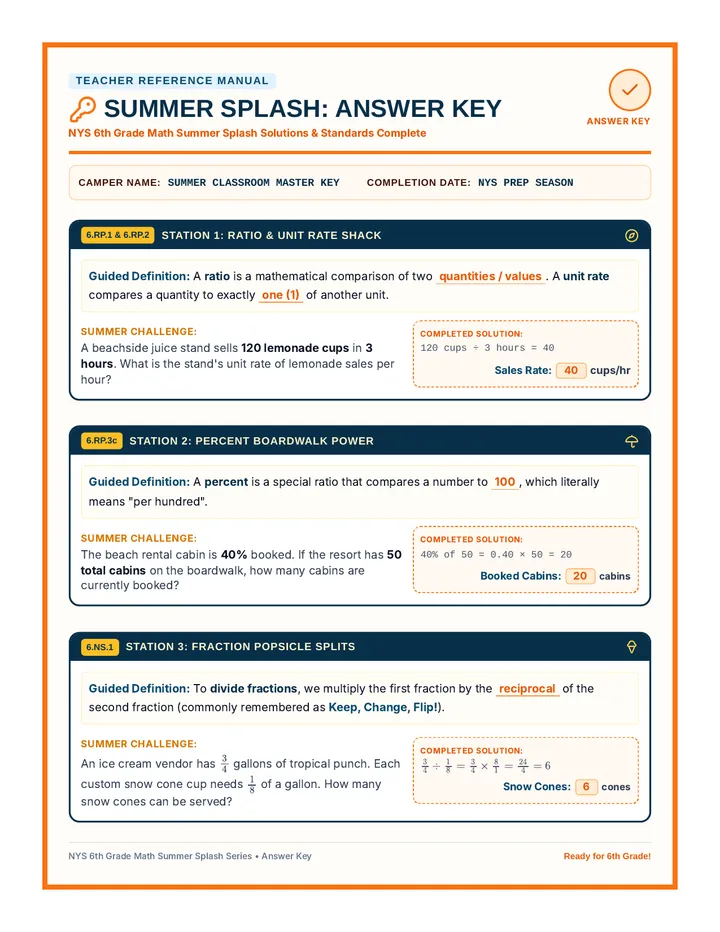
A transitional math prep lesson for rising 6th graders entering the NYS math curriculum. It introduces key concepts across all major domains including Ratios & Proportions, the Number System, Expressions & Equations, Geometry, and Statistics through structured definition spaces and scaffolded example problems.
A comprehensive 7-slide presentation that introduces hourly wage calculations using real-world vocational scenarios. Designed with a retro industrial clipboard theme, featuring bold graphics, clear icons, and visual skip-counting tracks. All slide text elements are strictly 24px or larger.
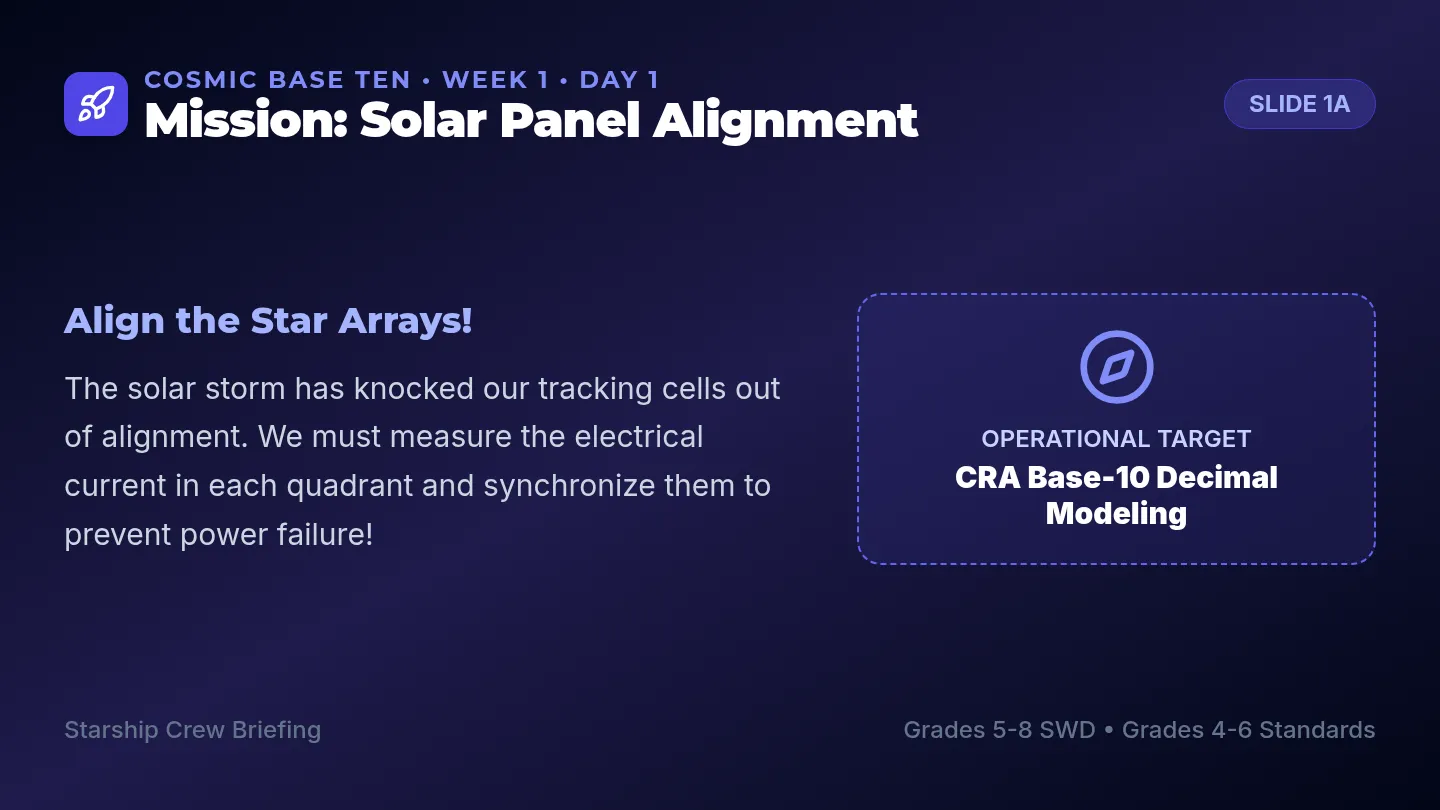
A 4-week intensive math intervention program set in a space exploration universe, designed for multi-grade students with disabilities in Grades 5–8. It covers additive thinking, place value, and decimal regrouping, anchored in Grades 4–6 standards with a Grade 5 core middle ground.
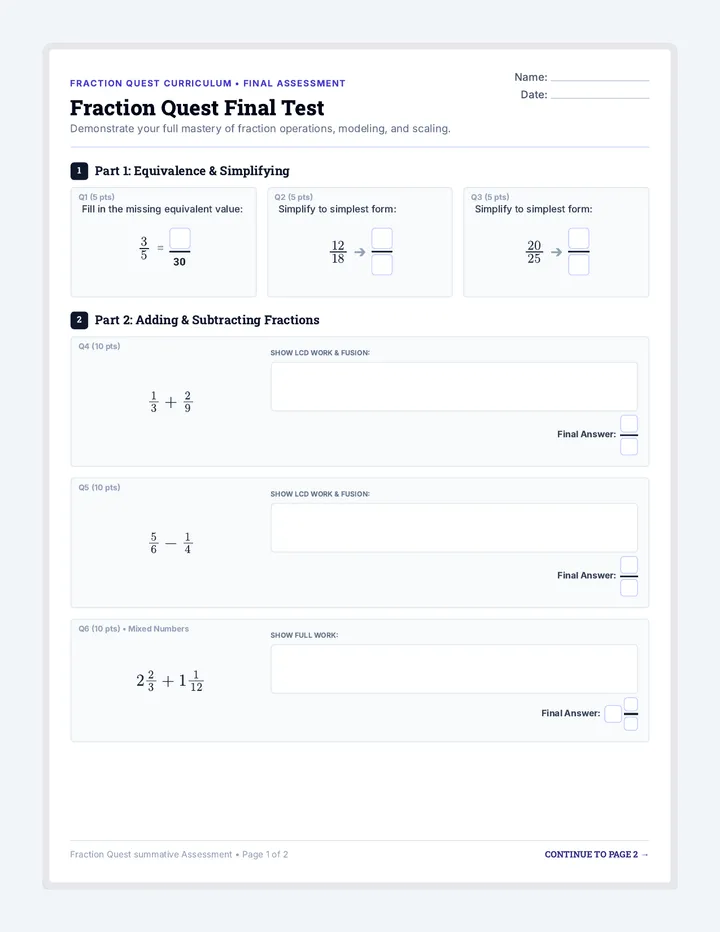
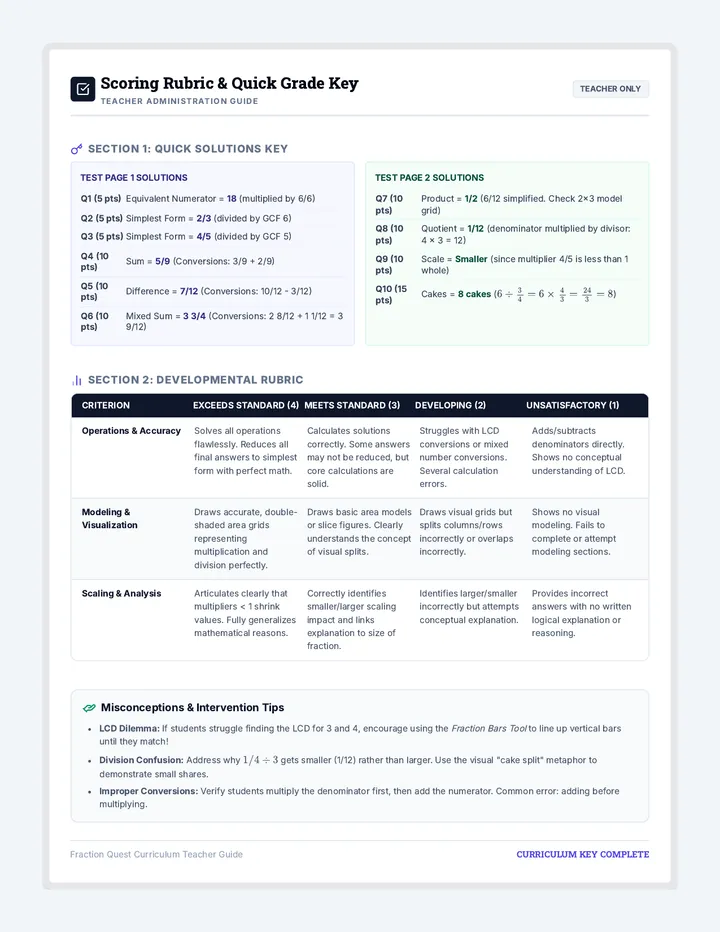
A comprehensive review and assessment of all four fraction operations. Students demonstrate their mastery through an interactive review, final unit assessment, and student reflection.
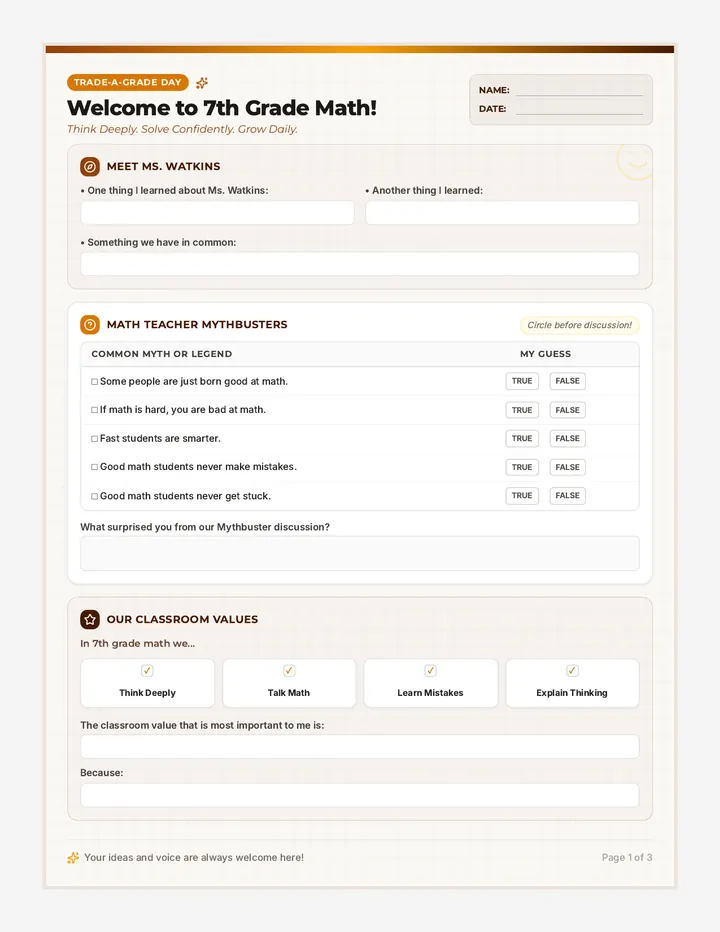
A beautifully themed 3-page transition worksheet for incoming 7th-grade math students visiting Ms. Watkins' classroom on Trade-a-Grade Day. Features a cohesive warm brown, gold, and cream palette with welcoming, interactive elements like mythbusters, classroom values, and introductory thinking prompts. Page 3 provides a customized mathematical sneak-peek on ratios, unit rates, and integers.
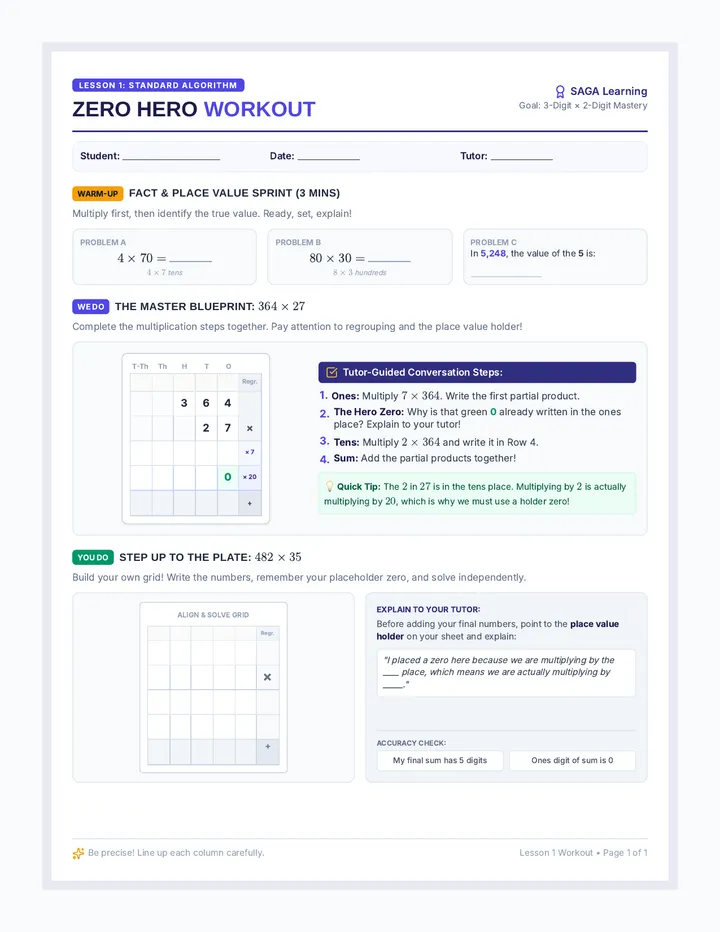
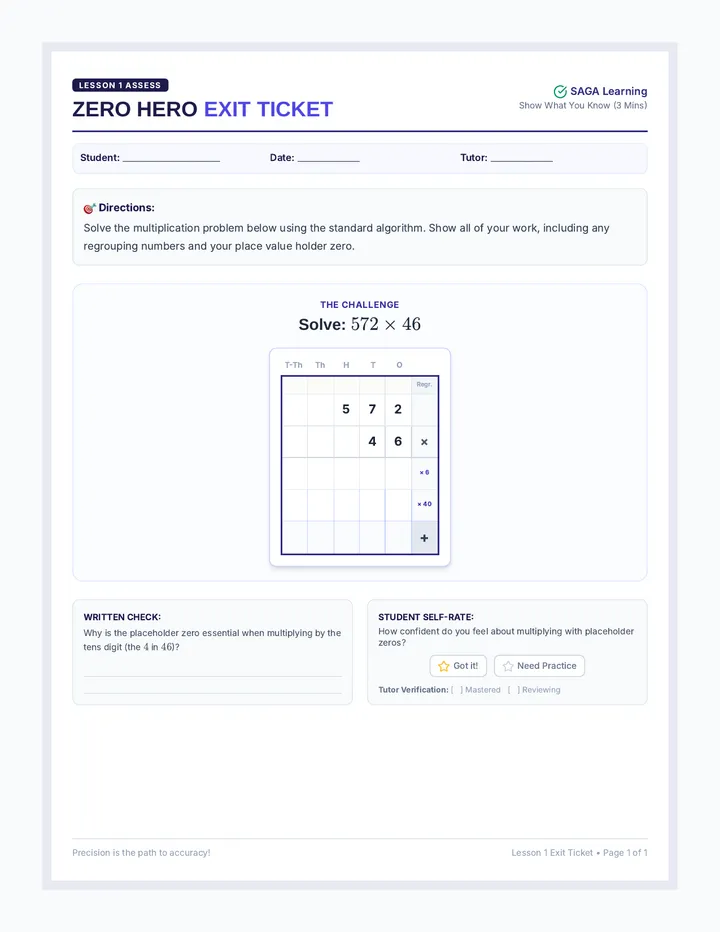
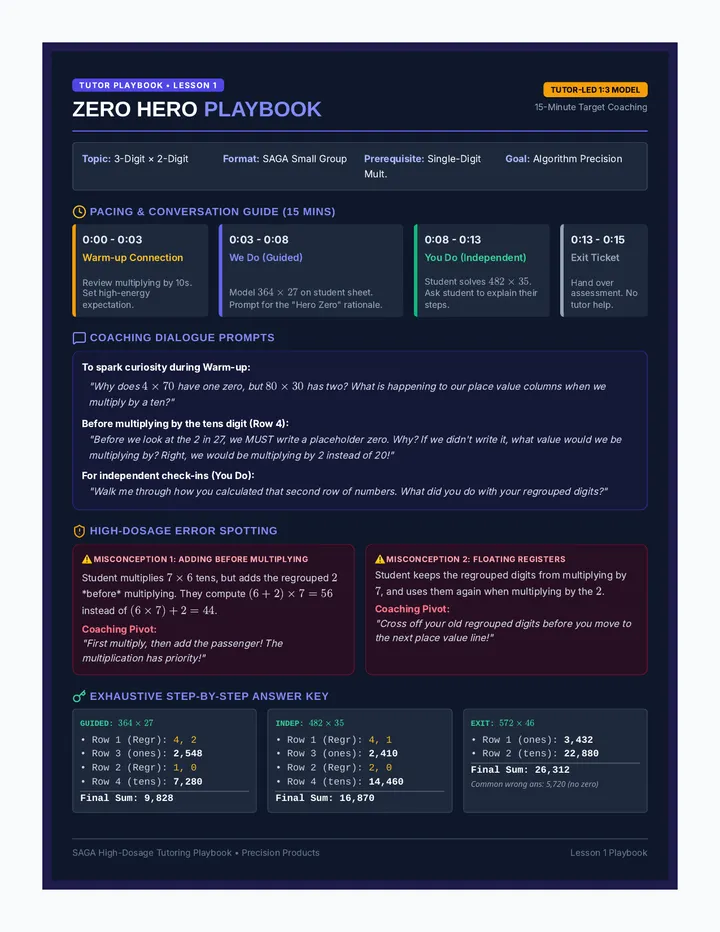
A 6th-grade standard multiplication sequence designed for high-dosage tutoring. Focuses on standard algorithm alignment, regrouping, and place value holder zeros.
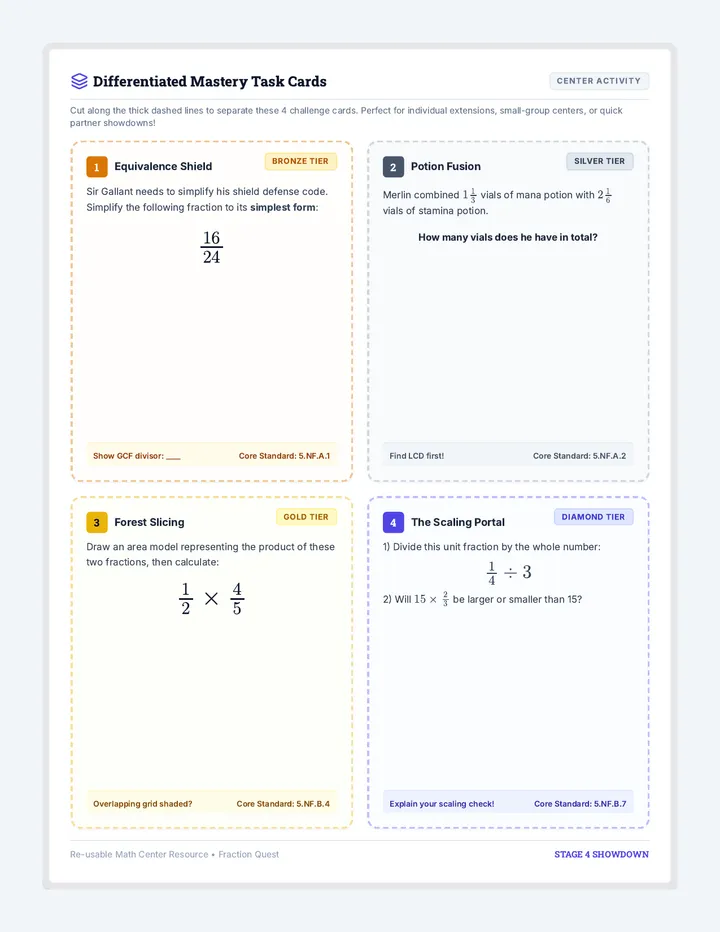
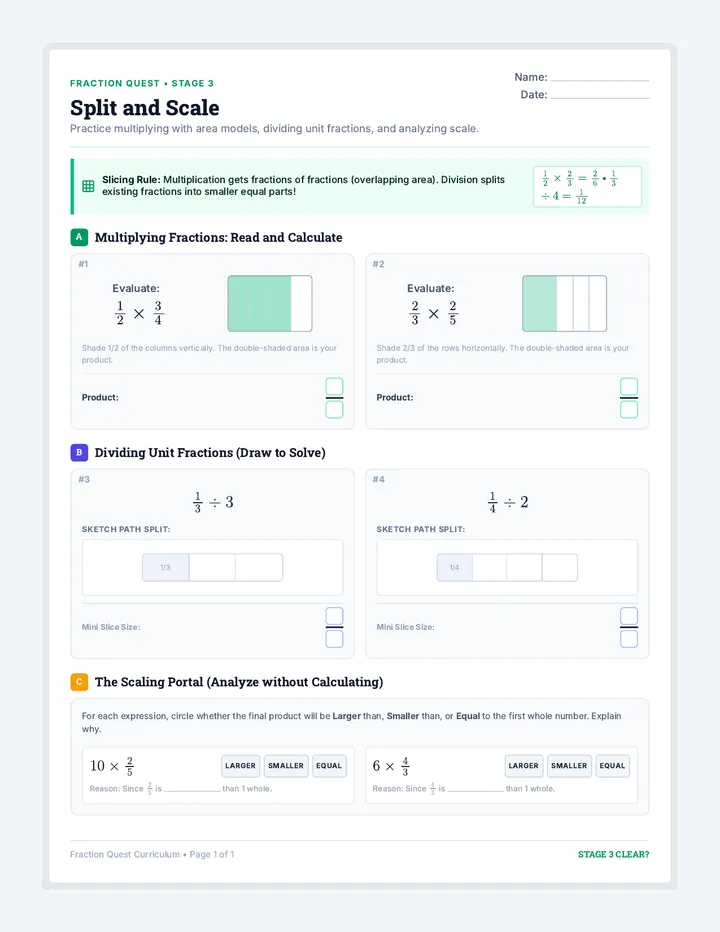
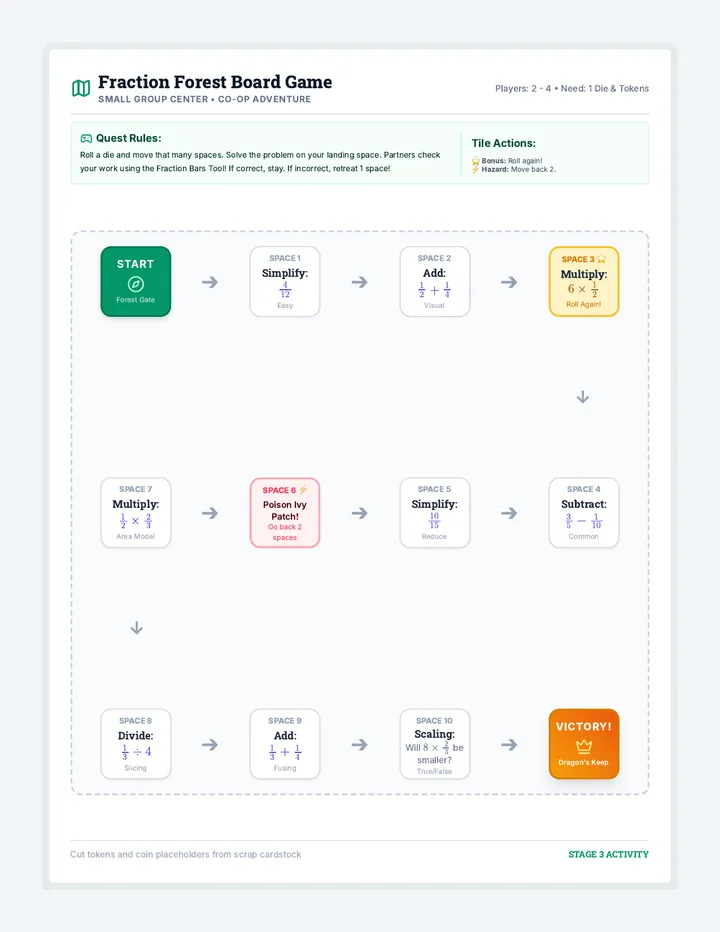
Multiplying and dividing fractions using area models, understanding scaling, and dividing unit fractions by whole numbers. Visual models help conceptualize these concepts.
A 3-page, teacher-facing answer key designed to accompany the Launchpad 6 Student Packet. It features fully completed definitions, step-by-step mathematical work, and circled answers rendered in vibrant orange for effortless scoring and instruction.